A comparison of four fibrosis indexes in chronic HCV: Development of new fibrosis-cirrhosis index...
10
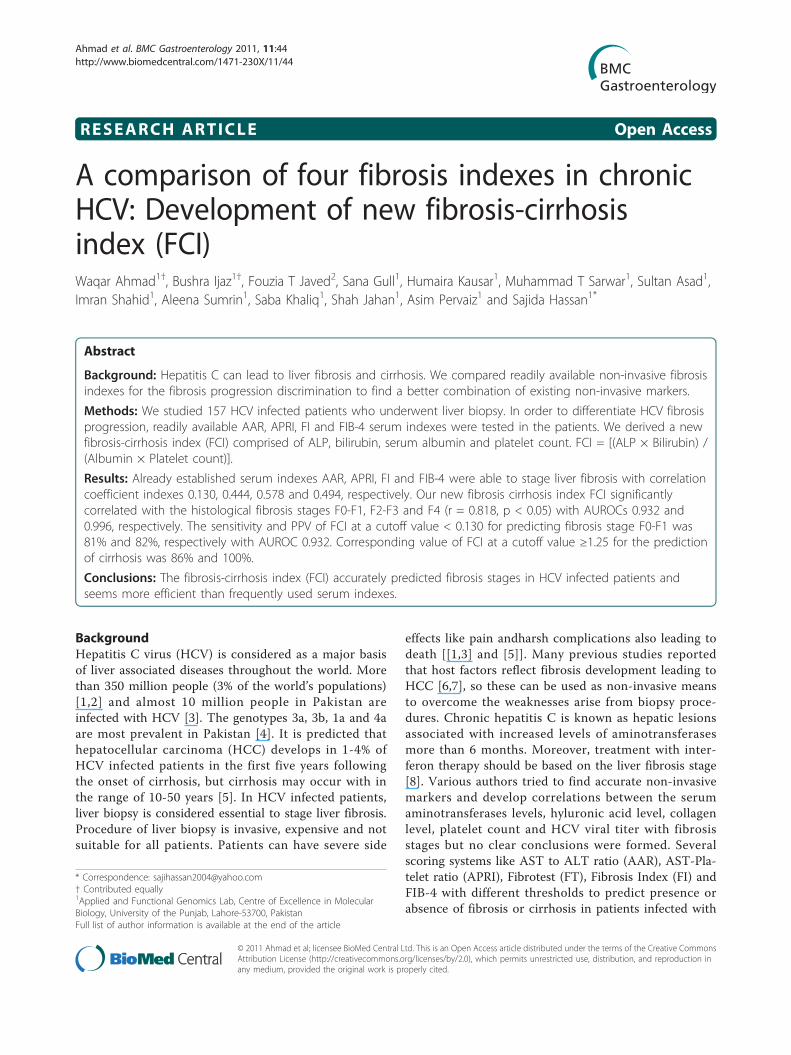
RESEARCH ARTICLE Open Access A comparison of four fibrosis indexes in chronic HCV: Development of new fibrosis-cirrhosis index (FCI) Waqar Ahmad 1† , Bushra Ijaz 1† , Fouzia T Javed 2 , Sana Gull 1 , Humaira Kausar 1 , Muhammad T Sarwar 1 , Sultan Asad 1 , Imran Shahid 1 , Aleena Sumrin 1 , Saba Khaliq 1 , Shah Jahan 1 , Asim Pervaiz 1 and Sajida Hassan 1* Abstract Background: Hepatitis C can lead to liver fibrosis and cirrhosis. We compared readily available non-invasive fibrosis indexes for the fibrosis progression discrimination to find a better combination of existing non-invasive markers. Methods: We studied 157 HCV infected patients who underwent liver biopsy. In order to differentiate HCV fibrosis progression, readily available AAR, APRI, FI and FIB-4 serum indexes were tested in the patients. We derived a new fibrosis-cirrhosis index (FCI) comprised of ALP, bilirubin, serum albumin and platelet count. FCI = [(ALP × Bilirubin) / (Albumin × Platelet count)]. Results: Already established serum indexes AAR, APRI, FI and FIB-4 were able to stage liver fibrosis with correlation coefficient indexes 0.130, 0.444, 0.578 and 0.494, respectively. Our new fibrosis cirrhosis index FCI significantly correlated with the histological fibrosis stages F0-F1, F2-F3 and F4 (r = 0.818, p < 0.05) with AUROCs 0.932 and 0.996, respectively. The sensitivity and PPV of FCI at a cutoff value < 0.130 for predicting fibrosis stage F0-F1 was 81% and 82%, respectively with AUROC 0.932. Corresponding value of FCI at a cutoff value ≥1.25 for the prediction of cirrhosis was 86% and 100%. Conclusions: The fibrosis-cirrhosis index (FCI) accurately predicted fibrosis stages in HCV infected patients and seems more efficient than frequently used serum indexes. Background Hepatitis C virus (HCV) is considered as a major basis of liver associated diseases throughout the world. More than 350 million people (3% of the world’s populations) [1,2] and almost 10 million people in Pakistan are infected with HCV [3]. The genotypes 3a, 3b, 1a and 4a are most prevalent in Pakistan [4]. It is predicted that hepatocellular carcinoma (HCC) develops in 1-4% of HCV infected patients in the first five years following the onset of cirrhosis, but cirrhosis may occur with in the range of 10-50 years [5]. In HCV infected patients, liver biopsy is considered essential to stage liver fibrosis. Procedure of liver biopsy is invasive, expensive and not suitable for all patients. Patients can have severe side effects like pain andharsh complications also leading to death [[1,3] and [5]]. Many previous studies reported that host factors reflect fibrosis development leading to HCC [6,7], so these can be used as non-invasive means to overcome the weaknesses arise from biopsy proce- dures. Chronic hepatitis C is known as hepatic lesions associated with increased levels of aminotransferases more than 6 months. Moreover, treatment with inter- feron therapy should be based on the liver fibrosis stage [8]. Various authors tried to find accurate non-invasive markers and develop correlations between the serum aminotransferases levels, hyluronic acid level, collagen level, platelet count and HCV viral titer with fibrosis stages but no clear conclusions were formed. Several scoring systems like AST to ALT ratio (AAR), AST-Pla- telet ratio (APRI), Fibrotest (FT), Fibrosis Index (FI) and FIB-4 with different thresholds to predict presence or absence of fibrosis or cirrhosis in patients infected with * Correspondence: [email protected] † Contributed equally 1 Applied and Functional Genomics Lab, Centre of Excellence in Molecular Biology, University of the Punjab, Lahore-53700, Pakistan Full list of author information is available at the end of the article Ahmad et al. BMC Gastroenterology 2011, 11:44 http://www.biomedcentral.com/1471-230X/11/44 © 2011 Ahmad et al; licensee BioMed Central Ltd. This is an Open Access article distributed under the terms of the Creative Commons Attribution License (http://creativecommons.org/licenses/by/2.0), which permits unrestricted use, distribution, and reproduction in any medium, provided the original work is properly cited.
-
Upload
independent -
Category
Documents
-
view
1 -
download
0
Transcript of A comparison of four fibrosis indexes in chronic HCV: Development of new fibrosis-cirrhosis index...
RESEARCH ARTICLE Open Access
A comparison of four fibrosis indexes in chronicHCV: Development of new fibrosis-cirrhosisindex (FCI)Waqar Ahmad1†, Bushra Ijaz1†, Fouzia T Javed2, Sana Gull1, Humaira Kausar1, Muhammad T Sarwar1, Sultan Asad1,Imran Shahid1, Aleena Sumrin1, Saba Khaliq1, Shah Jahan1, Asim Pervaiz1 and Sajida Hassan1*
Abstract
Background: Hepatitis C can lead to liver fibrosis and cirrhosis. We compared readily available non-invasive fibrosisindexes for the fibrosis progression discrimination to find a better combination of existing non-invasive markers.
Methods: We studied 157 HCV infected patients who underwent liver biopsy. In order to differentiate HCV fibrosisprogression, readily available AAR, APRI, FI and FIB-4 serum indexes were tested in the patients. We derived a newfibrosis-cirrhosis index (FCI) comprised of ALP, bilirubin, serum albumin and platelet count. FCI = [(ALP × Bilirubin) /(Albumin × Platelet count)].
Results: Already established serum indexes AAR, APRI, FI and FIB-4 were able to stage liver fibrosis with correlationcoefficient indexes 0.130, 0.444, 0.578 and 0.494, respectively. Our new fibrosis cirrhosis index FCI significantlycorrelated with the histological fibrosis stages F0-F1, F2-F3 and F4 (r = 0.818, p < 0.05) with AUROCs 0.932 and0.996, respectively. The sensitivity and PPV of FCI at a cutoff value < 0.130 for predicting fibrosis stage F0-F1 was81% and 82%, respectively with AUROC 0.932. Corresponding value of FCI at a cutoff value ≥1.25 for the predictionof cirrhosis was 86% and 100%.
Conclusions: The fibrosis-cirrhosis index (FCI) accurately predicted fibrosis stages in HCV infected patients andseems more efficient than frequently used serum indexes.
BackgroundHepatitis C virus (HCV) is considered as a major basisof liver associated diseases throughout the world. Morethan 350 million people (3% of the world’s populations)[1,2] and almost 10 million people in Pakistan areinfected with HCV [3]. The genotypes 3a, 3b, 1a and 4aare most prevalent in Pakistan [4]. It is predicted thathepatocellular carcinoma (HCC) develops in 1-4% ofHCV infected patients in the first five years followingthe onset of cirrhosis, but cirrhosis may occur with inthe range of 10-50 years [5]. In HCV infected patients,liver biopsy is considered essential to stage liver fibrosis.Procedure of liver biopsy is invasive, expensive and notsuitable for all patients. Patients can have severe side
effects like pain andharsh complications also leading todeath [[1,3] and [5]]. Many previous studies reportedthat host factors reflect fibrosis development leading toHCC [6,7], so these can be used as non-invasive meansto overcome the weaknesses arise from biopsy proce-dures. Chronic hepatitis C is known as hepatic lesionsassociated with increased levels of aminotransferasesmore than 6 months. Moreover, treatment with inter-feron therapy should be based on the liver fibrosis stage[8]. Various authors tried to find accurate non-invasivemarkers and develop correlations between the serumaminotransferases levels, hyluronic acid level, collagenlevel, platelet count and HCV viral titer with fibrosisstages but no clear conclusions were formed. Severalscoring systems like AST to ALT ratio (AAR), AST-Pla-telet ratio (APRI), Fibrotest (FT), Fibrosis Index (FI) andFIB-4 with different thresholds to predict presence orabsence of fibrosis or cirrhosis in patients infected with
* Correspondence: [email protected]† Contributed equally1Applied and Functional Genomics Lab, Centre of Excellence in MolecularBiology, University of the Punjab, Lahore-53700, PakistanFull list of author information is available at the end of the article
Ahmad et al. BMC Gastroenterology 2011, 11:44http://www.biomedcentral.com/1471-230X/11/44
© 2011 Ahmad et al; licensee BioMed Central Ltd. This is an Open Access article distributed under the terms of the Creative CommonsAttribution License (http://creativecommons.org/licenses/by/2.0), which permits unrestricted use, distribution, and reproduction inany medium, provided the original work is properly cited.

HCV had been proposed. However, mild fibrosis (F0) toend stage cirrhosis cannot be predicted accurately usinga single system [9-18].In this study, we compared and evaluated diagnostic
accuracy of the readily available non-invasive serumindexes including AAR, APRI, FI and FIB-4 to findaccurate and reliable non-invasive markers for evaluat-ing fibrosis progression. We also developed a newnon-invasive serum marker index for this purpose byevaluating several clinic-pathological features. A mar-ker with high predictive values would eliminate theneed of liver biopsy that also reduces the cost andrisks associated to it.
MethodsPatientsThis study was conducted at the Department of Pathol-ogy, Jinnah Hospital, Lahore; Mayo Hospital, Lahoreand Liver Centre, Faisalabad in collaboration withApplied and Functional Genomics Lab, National Centreof Excellence in Molecular Biology (CEMB), Universityof the Punjab, Lahore, Pakistan. HCV RNA-positivepatients were identified among HCV antibody (anti-HCV) positive patients. Later, the study plan was dis-cussed with patients and the biopsy was taken only fromthose patients who were willing for this procedure. Thepurpose of this study was to design a new Index so thatdisease progression can be evaluated non-invasively andfuture need of biopsy can be eliminated. This was a ret-rospective cross-sectional study. This analytical studywas carried out from March 2008 to September 2010.Patients who received a previous course of INF or
immunosuppressive therapy or who had clinical evi-dence of HBV or HIV and any type of liver cancer wereexcluded from the study. Patients who refused to have aliver biopsy or for whom it was contraindicated, i.e.,because of a low platelet count, prolonged prothrombintime or decompensated cirrhosis were also excludedfrom the study. The liver biopsy procedure, its advan-tages and possible adverse effects were explained to thepatients. Informed consent were obtained from patientscontained information about demographic data, possibletransmission route of HCV infection, clinical, virologicaland biochemical data. This study included 157 patients(M/F 114/43; mean age 38.1 ± 10.2, age range 19-58years). The study was approved by Institutional ReviewBoard (IRB, CEMB). The Federal-wide Assurance docu-ment (ID: FWA00001758) was approved by the localoffice for Human Research Protection.
Histological evaluation of biopsy samplesThe histological evaluation of paraffin-embedded liverspecimens was carried out at the Pathology Department,Jinnah Hospital, Lahore, according to METAVIR scoring
system [19]. Liver biopsies were evaluated by two inde-pendent pathologists without prior information topatient’s history. Histological staging based on thedegree of fibrosis have five degrees of fibrosis: as F0 (nofibrosis), F1 (mild fibrosis without septa), F2 (moderatefibrosis with few septa), F3 (severe fibrosis with numer-ous septa without cirrhosis) and F4 (cirrhosis). Wefurther grouped fibrosis stages as F0-F1 (minimal fibro-sis), F2-F3 (advanced fibrosis), F4 (cirrhosis) and F2-F4(significant fibrosis).
HCV RNA detection and quantitative PCRRNA was extracted from 140 μl serum samples usingQIAamp viral RNA extraction kit (Qiagen USA cat #52906) according to the manufacturer’s protocol. cDNAwas synthesized using Moloney murine leukemia virus(MmLV) reverse transcriptase (Invitrogen, USA). Firstround and nested PCRs were carried out with Taq Poly-merase (Fermentas USA) and analyzed on 2% agarosegel. Qiagen HCV quantitative kit was used to performHCV RNA quantification with 10 ul of the extractedRNA on Roche Real Time PCR using fluorescent probesto detect amplification after each replicating cycle.
HCV genotypingHCV genotyping was carried out using Invader HCVgenotyping assay (Third wave technology USA). Briefly,about 100 ng of the HCV RNA was reverse transcribedto cDNA using 200U of MmLV (Invitrogen, USA).From the amplified product, 2 μl was taken and the gen-otyping assay was performed for 12 different HCV types.
Comparison of already available non-invasive serumbiomarkers to evaluate patient’s liver biopsy dataSerum samples and liver specimens collected from eachpatient were stored at -70°C for further biochemicalanalysis. The routine liver function tests (LFTs), Hb,serum albumin and direct bilirubin levels were antici-pated for each patient. All biochemical tests and theirscores were made without knowledge of liver biopsyresults and all patients were evaluated for AAR, APRI,Fibrosis Index (FI) and FIB-4 indexes.The following formulas were used to review the pre-
dicted scores with the particular cut-off values as men-tioned previously.
• AAR [15] = AST (IU/l)/ ALT (IU/l)If AST/ALT ≥ 1, significant cirrhosis
• APRI [16] = [{AST (IU/l)/ ALT_ULN (IU/l)}×100]/ platelet count (109/l)
If APRI < 0.5, no or minimal fibrosis; if APRI >1.5, significant fibrosis
• FI [17] = 8.0 - 0.01 × PLT (109/l) - serum albumin(g/dl)
Ahmad et al. BMC Gastroenterology 2011, 11:44http://www.biomedcentral.com/1471-230X/11/44
Page 2 of 10

If F-Index < 2.1, no or minimal fibrosis; F-index≥ 2.1, significant fibrosis, and if F-Index ≥ 3.3,significant cirrhosis
• FIB-4 [18] = [Age (Years) × AST (IU/l)]/[Plateletcount (× 109/l) × ALT (IU/l)1/2]
If FIB-4 < 1.45, no or minimal fibrosis, If FIB-4 >3.25, significant fibrosis
Statistical analysisThe data was analyzed using statistical package SPSSversion 16 for windows. A p value of 0.05 was consid-ered statistically significant. All data was presented asmean values or no. of patients. Spearman’s rank correla-tion was used to assess the significant associationbetween continuous variables and liver fibrosis stages.The student t-test was used to compare arithmeticmeans and parameters while Chi-square (X2) test wasused to compare categorical data, correlation with Fish-er’s exact test was used when appropriate. Patients weredivided into three main groups as, patients with no orminimal fibrosis (F0-F1), patients with significant fibro-sis (F2-F3) and patients with clinically significant cirrho-sis (F4). The independently distinguished values ofbiochemical markers and AAR, APRI, FIB-4 and FIindexes for the prediction of significant fibrosis and cir-rhosis were evaluated using univariate and multipleregression analysis. Area under the receiver operatingcharacteristic (ROC) curves (AUROCs) was used tocompare and deduce the diagnostic accuracies of theselected bio-markers.
ResultsPatient’s dataThe demographic and clinical outcomes of the 157HCV infected patients are briefly explained in Table 1.The evaluation of chronic HCV activity (inflammatorygrade) showed mild chronic hepatitis in 51 patients,moderate chronic hepatitis in 67 patients and severechronic hepatitis in 39 patients. The determination ofliver fibrosis showed stage F0 in 29, F1 in 39, 34patients in F2 and F3 stage each and 21 patients in F4or advanced fibrosis leading to cirrhosis. Our datashowed the presence of genotype 1a in 22 and 3a in135 patients, 95 patients were < 40 years of age, while62 were > 40 years of age.
Relationship between clinical findings and fibrosisLiver fibrosis stages were statistically significant betweenage groups (p< 0.05). Mild and moderate fibrosis wasdiagnosed mostly in younger patients while moreadvanced stages were observed in patients over 40 yearsold. Patients with F0 fibrosis were too young as com-pared to those who developed moderate or severe
fibrosis leading to cirrhosis (Mean age ± SD, 25.9 ± 2.4years). The distribution of liver fibrosis stages withregard to gender and genotypes of patients illustrated inTable 2 showed no significant differences (for gender:p = 0.247 and for genotypes: p = 0.258). Univariate ana-lysis revealed that serum viral loads, bilirubin, albumin,platelet count, AST and ALP levels were significantlydifferent in various fibrosis stages (Table 2).
Diagnosis of fibrosis using already available AAR, APRI, F-Index, and FIB-4 serum indexesThe relationship between the fibrosis stages and fourserum indexes: AAR, APRI, FI and FIB-4 is illustrated inFigure 1 (see also Table 2). There was a significant rela-tionship between fibrosis stages and serum indexesexcept AAR (p > 0.05). A gradual increase in the levelof APRI, FI and FIB-4 indexes was observed in fibrosisstages.The AUROCs of the serum non-invasive indexes
scores are shown in Table 3. AUROC of FI was higherthan APRI (p< 0.05) for differentiating minimal fibrosisfrom significant fibrosis (Figure 2). To predict cirrhosis,FI showed high AUROC than AAR. Spearman correla-tion between each serum index score and fibrosis stageswas high for F-Index, FIB-4 and APRI, while, AARshowed significantly low ‘r’ index indicated in Table 3.
Table 1 Demographic, clinical, and liver histologicalfeatures of 157 chronic HCV infected patients
Features Mean (± SD) Minimum Maximum
Sex (Male/Female) 114/43 - -
Age (years) 38.1 ± 10.2 19 58
Age groups (< 40/ > 40) 95/62 - -
Genotype (1a/3a) 22/135 - -
Viral load (IU/ml) 5.47 × 10⁷ ± 1.4× 10⁸
1.7 × 10⁴ 1.01 × 10⁹
Hb level (g/dl) 12.7 ± 1.3 10.3 16.7
Bilirubin (mg/dl) 1.03 ± 0.36 0.5 2.1
ALT (IU/l) 134.4 ± 63.1 18 271
ALP (IU/l) 147.7 ± 101.5 20 438
AST (IU/l) 106.7 ± 68.2 20 395
Serum Albumin (g/dl) 4.1 ± 0.31 3.1 4.9
Platelet count (× 109/l) 154.5 ± 41.7 49 229
Liver fibrosis stages, n (%)
F0 (n = 29, 18.5%) - -
F1 (n = 39, 24.8%) - -
F0+F1 (minimal fibrosis) (n = 68, 43.3%) - -
F2 (n = 34, 21.7%) - -
F3 (n = 34, 21.7%) - -
F2+F3 (advanced fibrosis) (n = 68, 43.3%) - -
F4 (Cirrhosis) (n = 21, 13.4%) - -
F2+F3+F4 (significantfibrosis)
(n = 89, 56.7%) - -
Ahmad et al. BMC Gastroenterology 2011, 11:44http://www.biomedcentral.com/1471-230X/11/44
Page 3 of 10

By using published cut-off values for each index, weanalyzed the sensitivity and specificity of each index forsignificant fibrosis and cirrhosis. Patients with minimalfibrosis can be identified from advanced/significant orcirrhotic patients using FIB-4, AAR, APRI and F-Indexwith sensitivity 51%, 67.6%, 19.1% and 100% and specifi-city 85.4%, 42.8%, 97.7% and 58.4%, respectively. At acut-off value > 3.25 for FIB-4, > 1.5 for APRI, > 1 forAAR and > 3.3 for F-Index have 59.2%, 34.8%, 42.8%and 38.1% sensitivity and 82.3%, 67.6%, 67.6% and 100%specificity, respectively, to discriminate advanced fibrosisstages from minimal.
Diagnosis of fibrosis with clinic-pathological featuresincluding viral load, Hb level, bilirubin, ALT, ALP, AST,albumin and platelet countViral load was significant among fibrosis stages. It gra-dually increased in advanced fibrosis, and then suddenlydropped in cirrhosis. ALT and Hb levels were not signif-icant, while AST levels were noteworthy to differentiateliver fibrosis stages. Meanwhile, only 16 (10.1%) and 21(13.3%) patients showed normal ALT and AST levels,respectively, independent of fibrosis stage. The discrimi-native values of the biochemical markers for the predic-tion of different fibrosis stages were determined bylogistic regression analysis. By univariate analysis (p <0.05, Table 2), viral load, bilirubin, ALP, AST, albuminand platelet count were significantly associated with var-ious fibrosis stages. However, in multivariate analysis,bilirubin, ALP, albumin and platelet count were foundto be independently predictive (Table 4). This informa-tion related to these biochemical markers can also behelpful in differentiating liver fibrosis stages. Figure 3shows the box plot of these four markers with liver his-tological stages. It is clear from Figure 3 and Table 2that as the fibrosis increased, bilirubin and serum ALPlevel also increased, while platelet count and albuminlevel gradually reduced in cirrhosis. It was interesting tonote that serum ALP and bilirubin was 2 times and 5times higher in cirrhotic patients, respectively, than nor-mal limits.Based on ROC curve analysis as illustrated in Figure 4,
four significant serum markers ALP, bilirubin, albuminand platelet count showed superior diagnostic powerwith high AUROCs for differentiating various fibroticstages and cirrhosis as given in Table 5. Our datashowed that if these four serum markers ALP, bilirubin,
Table 2 Distribution of each variable according to fibrosis stages
Factor F0 (n = 29) F1(n = 39) F2(n = 34) F3(n = 34) F4(n = 21) P value
Age 25.9 ± 2.4 37.9 ± 9.5 42.8 ± 7.6 37.7 ± 8.5 48.4 ± 7.1 < 0.05
Sex (M/F) 19/10 35/4 26/8 20/14 14/7 0.247
Genotype (1a/3a) 8/21 4/35 3/31 3/31 4/17 0.258
HAI score 3.8 ± 2.1 6.05 ± 2.8 6.8 ± 3.2 6.9 ± 4.02 7.6 ± 2.9 < 0.05
Viral load 6.2 × 10⁵ ± 1.2 × 10⁶ 1.3 ± × 107 ± 1.5 × 10⁷ 2.1 × 10⁸ ± 2.4 × 10⁸ 2.4 × 10⁷ ± 2.5 × 10⁷ 2.9 × 10⁵ ± 2.9 × 10⁵ < 0.05
Hb level 12.8 ± 1.3 12.6 ± 1.2 12.77 ± 1.7 12.9 ± 1.3 12.3 ± 1.2 0.328
Bilirubin 0.7 ± 0.1 0.88 ± 0.2 0.99 ± 0.27 1.2 ± 0.3 1.62 ± 0.31 < 0.05
ALT 120.2 ± 71.9 117.8 ± 55.3 152.1 ± 66.5 139.6 ± 56.6 147.5 ± 61.2 0.091
ALP 72.6 ± 16.8 88.1 ± 47.5 110.7 ± 45.1 208.6 ± 75.9 323.8 ± 80.1 < 0.05
AST 83.1 ± 57.9 107.1 ± 66.5 95.9 ± 51.4 106.9 ± 65.4 155.5 ± 90.6 < 0.05
Albumin 4.5 ± 0.1 4.3 ± 0.16 4.2 ± 0.18 4.08 ± 0.2 3.6 ± 0.33 < 0.05
Platelet count 191.3 ± 18.7 185.1 ± 21.2 162.1 ± 16.6 125.5 ± 18.7 81.6 ± 17.7 < 0.05
AAR 0.8 ± 0.58 1.14 ± 1.21 0.93 ± 1.1 1.02 ± 1.03 1.26 ± 0.95 0.522
APRI 1.04 ± 0.75 1.39 ± 0.87 1.40 ± 0.75 2.09 ± 1.33 4.7 ± 3.1 < 0.05
FI 1.24 ± 0.26 1.51 ± 0.28 1.81 ± 0.27 2.33 ± 0.28 3.2 ± 0.4 < 0.05
FIB-4 1.21 ± 0.95 2.17 ± 1.47 2.31 ± 1.57 3.06 ± 2.1 8.73 ± 6.59 < 0.05
Figure 1 Box plots of the AAR, APRI, FIB-4 and FI for differentfibrosis stages. The horizontal line inside each box represents themedian, while the top and bottom of boxes represent the 25th and75th percentiles, respectively. Vertical lines from the ends of the boxencompass the extreme data points.
Ahmad et al. BMC Gastroenterology 2011, 11:44http://www.biomedcentral.com/1471-230X/11/44
Page 4 of 10

albumin and platelet count are used simultaneously,they have high PPV and NPV for predicting cirrhosisand differentiating no/minimal fibrosis from significantfibrosis.For the detection of significant cirrhosis, platelet count
less than 100 showed 81% sensitivity, 98% specificity,89% PPV and 97% NPV. For the same outcome, ALP >240 IU/l had sensitivity, specificity, PPV and NPV of90%, 92%, 60.7% and 97%, respectively. The bilirubin
and albumin were also quite sensitive for the presenceof cirrhosis. Bilirubin level > 1.5 had a sensitivity 66.6%,specificity 95.5%, PPV 70% and NPV 94%, while albumin< 3.85 g/dl has sensitivity, specificity, PPV and NPV71.4%, 93%, 60% and 95%, respectively.In no/minimal fibrosis, ALP < 120 IU/l showed sensi-
tivity, specificity, PPV and NPV 85%, 70%, 68% and 86%,respectively. At cut-off value > 150, platelet count alsoshowed high sensitivity (98%) and specificity (70%) with71.2% PPV and 98% NPV. Serum bilirubin and albuminalso showed same pattern with high sensitivity, specifi-city, PPV and NPV as shown in Table 5.
Construction of a new Index for the prediction of fibrosisstageBased on the relationship of the regression coefficientsof four-biochemical markers, ALP, bilirubin, albuminand platelet count, we developed a new fibrosis-cirrhosisindex for the prediction of HCV disease progressionfrom initial fibrosis stage to end stage cirrhosis.
Table 3 Validity of serum AAR, APRI, FIB-4 and FI in 157 HCV infected patients
AAR
Cutoff value Spe% Sen% PPV% NPV% F0-F3 (n = 136 ) F4 (n = 21) AUC [95% CI]
< 1 42.8 67.6 88.4 16.9 92/44 12/9 0.468[0.377-0.559]
> 1 67.6 42.8 16.9 88.4 44/92 9/12 0.610[0.483-0.738]
APRI
Cutoff value Spe% Sen% PPV% NPV% F0-F1 (n = 68) F2-F4 (n = 89) AUC [95% CI]
< 0.5 97.7 19.1 86.6 61.2 13/55 2/87 0.715[0.635-0.795]
> 1.5 67.6 34.8 58.4 44.2 22/46 31/58 0.876[0.782-0.971]
FIB-4
Cutoff value Spe% Sen% PPV% NPV% F0-F2 (n = 102) F3-F4 (n = 55 ) AUC [95% CI]
< 1.45 85.4 51 86.6 48.4 52/50 8/47 0.732 [0.655-0.809]
> 3.25 82.3 59.2 64 79.2 18/84 33/22 0.545[0.456-0.635]
FI
Cutoff value Spe% Sen% PPV% NPV% F0-F1 (n = 68) F2-F4 (n = 89) AUC [95% CI]
< 2.1 58.4 100 64.7 100 68/0 37/52 0.939[0.903-0.974]
Cutoff value Spe% Sen% PPV% NPV% F0-F3 (n = 136) F4 (n = 21) AUC [95% CI]
> 3.3 100 38.1 100 91.2 0/136 8/13 0.990[0.979-1.001]
Spearman rank correlation coefficient (R-index) for AAR = 0.130, APRI = 0.444, FIB-4 = 0.494 and FI = 0.578
Figure 2 Receiver operating characteristic curves generated byfour serum markers, AAR, APRI, FIB-4 and FI for differentiationbetween patients in fibrosis stage F0-F1, F2-F3 and F4.
Table 4 Multivariate analysis of ALP, bilirubin, albuminand platelet count for discrimination between F0-F1 andF2-F3, and F2-F3 and F4 patients
Variables F0-F1/F2-F3 F2-F3/F4
OR (95% CI) P value OR (95% CI) P value
ALP 1.5 (105.13-51.34) < 0.05 1.3 (203.25-124.93) < 0.05
Bilirubin 2.1 (0.399- 0.122) < 0.05 1.4 (0.719- 0.403) < 0.05
Albumin 1.1 (0.126- 0.308) < 0.05 1.3 (0.333- 0.598) < 0.05
Platelet count 1.2 (34.71- 53.35) < 0.05 1.2 (48.63- 75.72) < 0.05
Ahmad et al. BMC Gastroenterology 2011, 11:44http://www.biomedcentral.com/1471-230X/11/44
Page 5 of 10

It can be represented as
FCI =[(ALP × Bilirubin) / (Albumin × Platelet count)
]
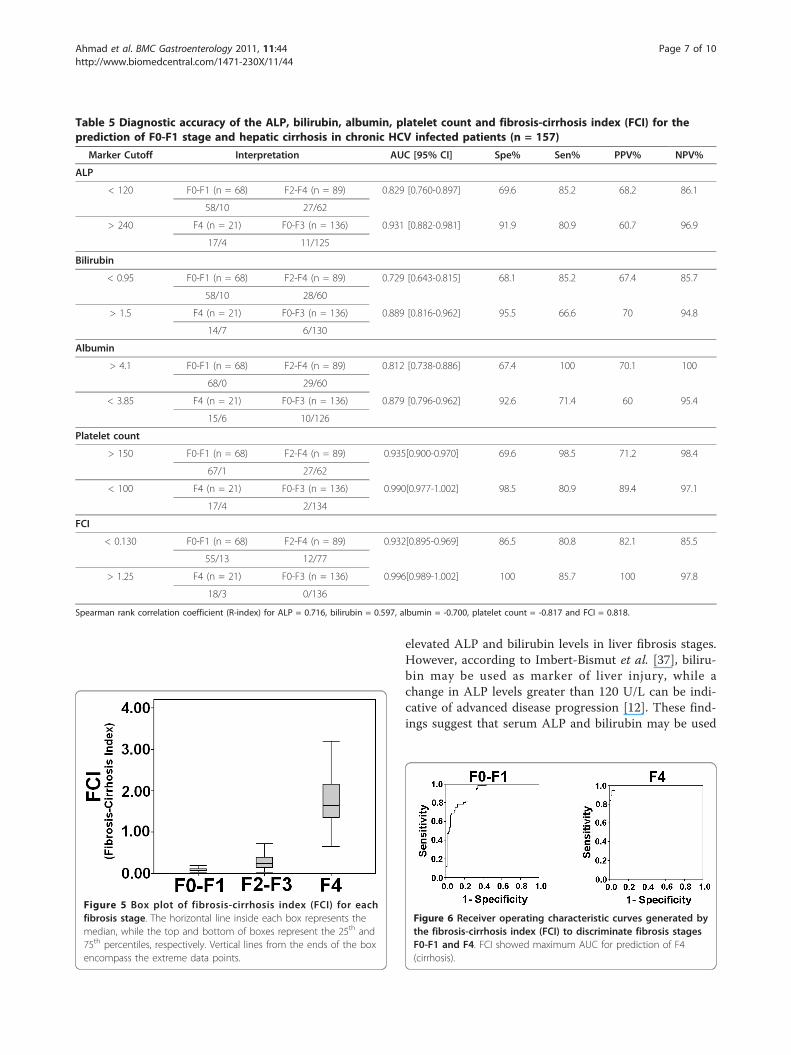
The FCI distribution for the patients in the respectivefibrosis stages is represented in Figure 5. The medianvalues for FCI in F0-F1, F2-F3 and F4 patients were0.085, 0.32 and 1.9, respectively. FCI significantly corre-lated with the liver fibrosis stages (Spearman’s rank cor-relation coefficient, r = 0.818, P< 0.05). The diagnosticvalues of F1 to differentiate F0-F1 and F4 patients wereevaluated using the AUROCs (Figure 6). The AUC forF0-F1 and F4 was 0.932 (CI: 0.895-0.969) and 0.996 (CI:0.989-1.002), respectively. The cutoff values obtainedfrom the respective ROC curves were < 0.130 and >≥1.25 in discriminating F0-F1 and F4 patients, respec-tively. Table 5 illustrates the diagnostic accuracy of FCI.Using a cutoff value of < 0.130, FCI had a sensitivity of81%, PPV of 82% also with a specificity of 87% and NPV
of 82% for the prediction of F0-F1. On the other hand,at a cutoff value of 1.25 or more, FCI had a sensitivityof 86%, specificity and PPV of 100% and 98% NPV forthe prediction of cirrhosis (F4).
DiscussionHepatocellular carcinoma and hepatic cirrhosis are con-sequences of chronic hepatitis C. The mean infectiontime to onset of cirrhosis is approximately 30 years, butcirrhosis may occur within a range of 10-50 years [20].Fibrosis and its extension in hepatic tissue is most com-mon evidence of cirrhosis. Several indexes are availableto predict cirrhosis but no method or score is availableon exclusive basis to diagnose earlier fibrosis stages.Genotype 3a is the most common one followed by 1a
in Pakistan [[3,21], and [22]] and same was alsoobserved in this study. Almost, 86% patients had geno-type 3a while remaining 14% had genotype 1a. A recentstudy also reported high prevalence of genotype 3 inHCC patients in Pakistan [23]. Patients with none orinitial stage (F0-F1) of fibrosis showed a remarkable dif-ference of age with advanced stages (F2 and F3) of fibro-sis and cirrhosis. Most patients with age more than 40years showed severe fibrosis and cirrhosis. These resultsconfirmed the previous studies that patients with mildfibrosis stage were younger than the moderate andsevere disease grade and stage is independent of gender[24-26].Our results showed positive correlation of ALT with
APRI and FI, and negative correlation with AAR andplatelet, however, no correlation was establishedbetween ALT levels with disease severity and fibrosisstages. Our observation is in agreement with previousreports that serum ALT levels do not accurately predictthe presence of hepatic liver damage [27,28]. Severalauthors reported persistently normal ALT levels (< 42IU/l) in patients with chronic HCV. Almost, 30% ofpatients with chronic HCV infection reflect steadily nor-mal serum ALT levels [29-32], however, in our dataonly 10% (n = 16) patients showed normal ALT levels.Our data showed gradual increase in serum ALP and
bilirubin levels (Table 2) in fibrosis stages when com-pared to early infection. Both ALP and bilirubin showedstrapping significant correlation with disease progres-sion. These results lead them to an important predictorof disease severity. An increased ALP is usually asso-ciated with liver metastasis, extraheptic bile obstruction,intraheptic cholestasis, infiltrative liver disease and hepa-titis [33,34]. According to Lee et al, elevated serum ALPlevels were common in liver abscess patients [35]. Highbilirubin levels are associated with liver metastases andliver tumor involvement leading to hepatocellular carci-noma and liver cirrhosis by active or non-active HCV orHBV [36]. Limited literature is available on the role of
Figure 3 Relationship between fibrosis stages and the ALP,bilirubin, serum albumin and fibrosis-cirrhosis index (FCI). Thelines through the middle of the boxes represent the median, whilethe top and bottom of the boxes are the 25th and 75th percentiles.The error bars represent measurement range (maximum andminimum values).
Figure 4 Receiver operating characteristic curves for individualserum markers; ALP, bilirubin, platelet count and serumalbumin for the predication of F0-F1, F2-F3 and F4 fibrosisstages.
Ahmad et al. BMC Gastroenterology 2011, 11:44http://www.biomedcentral.com/1471-230X/11/44
Page 6 of 10
elevated ALP and bilirubin levels in liver fibrosis stages.However, according to Imbert-Bismut et al. [37], biliru-bin may be used as marker of liver injury, while achange in ALP levels greater than 120 U/L can be indi-cative of advanced disease progression [12]. These find-ings suggest that serum ALP and bilirubin may be used
Table 5 Diagnostic accuracy of the ALP, bilirubin, albumin, platelet count and fibrosis-cirrhosis index (FCI) for theprediction of F0-F1 stage and hepatic cirrhosis in chronic HCV infected patients (n = 157)
Marker Cutoff Interpretation AUC [95% CI] Spe% Sen% PPV% NPV%
ALP
< 120 F0-F1 (n = 68) F2-F4 (n = 89) 0.829 [0.760-0.897] 69.6 85.2 68.2 86.1
58/10 27/62
> 240 F4 (n = 21) F0-F3 (n = 136) 0.931 [0.882-0.981] 91.9 80.9 60.7 96.9
17/4 11/125
Bilirubin
< 0.95 F0-F1 (n = 68) F2-F4 (n = 89) 0.729 [0.643-0.815] 68.1 85.2 67.4 85.7
58/10 28/60
> 1.5 F4 (n = 21) F0-F3 (n = 136) 0.889 [0.816-0.962] 95.5 66.6 70 94.8
14/7 6/130
Albumin
> 4.1 F0-F1 (n = 68) F2-F4 (n = 89) 0.812 [0.738-0.886] 67.4 100 70.1 100
68/0 29/60
< 3.85 F4 (n = 21) F0-F3 (n = 136) 0.879 [0.796-0.962] 92.6 71.4 60 95.4
15/6 10/126
Platelet count
> 150 F0-F1 (n = 68) F2-F4 (n = 89) 0.935[0.900-0.970] 69.6 98.5 71.2 98.4
67/1 27/62
< 100 F4 (n = 21) F0-F3 (n = 136) 0.990[0.977-1.002] 98.5 80.9 89.4 97.1
17/4 2/134
FCI
< 0.130 F0-F1 (n = 68) F2-F4 (n = 89) 0.932[0.895-0.969] 86.5 80.8 82.1 85.5
55/13 12/77
> 1.25 F4 (n = 21) F0-F3 (n = 136) 0.996[0.989-1.002] 100 85.7 100 97.8
18/3 0/136
Spearman rank correlation coefficient (R-index) for ALP = 0.716, bilirubin = 0.597, albumin = -0.700, platelet count = -0.817 and FCI = 0.818.
Figure 5 Box plot of fibrosis-cirrhosis index (FCI) for eachfibrosis stage. The horizontal line inside each box represents themedian, while the top and bottom of boxes represent the 25th and75th percentiles, respectively. Vertical lines from the ends of the boxencompass the extreme data points.
Figure 6 Receiver operating characteristic curves generated bythe fibrosis-cirrhosis index (FCI) to discriminate fibrosis stagesF0-F1 and F4. FCI showed maximum AUC for prediction of F4(cirrhosis).
Ahmad et al. BMC Gastroenterology 2011, 11:44http://www.biomedcentral.com/1471-230X/11/44
Page 7 of 10

as serum markers to assess the disease progression andfibrosis stages in chronic HCV patients.Many studies supported that platelet count alone may
be clinically valuable as a non-invasive serum markerfor liver fibrosis and cirrhosis [38,39]. Platelets not onlypredict fibrosis but also correlate with fibrotic stages[40-42]. Lackner et al, [43] showed high AUROC of0.89 for predicting cirrhosis at platelet value < 150 ×109/L and AUROC of 0.71 for non-cirrhotic patients ata cutoff value > 150 × 109/L. Our data is also in accor-dance with these results as platelet count showed highAUROC (≥ 0.900) to differentiate different liver fibrosisstages as given in Table 5 and Figure 4. In our study,platelet count was significantly low in cirrhotic patients.At a cutoff value of platelet, < 100 × 109/L has anAUROC of 0.990 for prediction of cirrhosis with 81%sensitivity and 98% specificity. Ginnani et al, reportedplatelet < 130 × 109/L for prediction of cirrhosis inHCV patients with 91.1% sensitivity, 88.3% specificity,PPV 81.2% and NPV 94.7% [44].We also examined the ability of AAR, APRI, FIB-4
and F-Index for staging liver fibrosis and to differentiatethem from cirrhosis. Giannini et al, reported a highdiagnostic accuracy of AAR > 1.16 with 81.3% sensitivityand 55.3% specificity for the prediction of cirrhosis [44].However, AAR was not able to differentiate among liverfibrosis stages in our sample data. At value of > 1.0,AAR has 43% sensitivity and 70% specificity for differen-tiating fibrosis from cirrhosis (Table 3). This poor per-formance of AAR is similar to that reported by Lackneret al [43].We observed comparatively high APRI (1.24 ± 0.8)
and FIB-4 (1.76 ± 1.35) values in F0-F1 patients. Thegroup F0-F1 contains two subgroups, patients with nofibrosis (F0) and with minimal fibrosis (F1). The meanvalue of APRI and FIB-4 in F0 was 1.04 and 1.21, and inF1 1.39 and 2.17, respectively (Table 2). It is reportedthat APRI < 0.42 predict mild fibrosis and APRI > 1.2,significant fibrosis in HCV patients with 90% NPV forabsence of fibrosis and 91% PPV for fibrosis presence[45-47]. Our results showed that APRI > 1.5 could pre-dict fibrosis with 55% sensitivity, 67% specificity. More-over, by using same cutoff value of APRI > 1.5 in arecent study by Macias et al [48], found that it has 28%sensitivity, 92% specificity, 79% PPV and 55% NPV forpredicting significant fibrosis, and for absence of fibrosisAPRI < 0.5 has 78%, 44%, 59% and 66% sensitivity, spe-cificity, PPV and NPV, respectively.FIB-4 was developed by Sterling et al in 2006 for diag-
nosis of fibrosis and cirrhosis in HIV/HCV co-infectedpatients. We examined this index only for HCV infectedpatients. A cutoff value of < 1.45 FIB-4 has a NPV forthe exclusion of advanced fibrosis of 90%, while a cutoffvalue > 3.25 has a PPV for the diagnosis of extended
fibrosis of 65% [49]. At a cutoff value of < 1.45, Vallet-Pichard observed a high NPV of 94.7% with a sensitivityof 74.3% to exclude severe fibrosis. Where as, for con-firming the presence of advanced fibrosis at cutoff value> 3.25, FIB-4 had a PPV of 82.1% with specificity of98.2% [18]. Our results are not in agreement with Ster-ling or Vallet-Pichard, as we observed a low NPV (70%)for excluding significant fibrosis, however, we detected aPPV of 83% with specificity of 45% for the presence ofadvanced fibrosis at cutoff value > 3.25. Trang et al[50], proposed new cutoff values of FIB-4 ≤ 1.39 for F0-F1 and ≥2.05 for F2-F4 stage in HCV/HIV co infectedpatients. At these cutoffs, we observed sensitivity 52%,specificity 76%, PPV 63% and NPV 68% for no/minimalfibrosis and 60%, 63%, 68% and 55% for advanced fibro-sis, respectively. Although, we observed low statisticalvalues, our results were in accordance to advance stageprediction. The cut off values proposed by Trang et albetter predict fibrosis stages in co infected patients andwe applied on only HCV infected patients.Fibrosis index (FI) showed high sensitivity, specificity,
PPV, NPV and AUROC for discriminating differentfibrosis stages. Ohta developed this simple index in2006. At cutoff value < 2.1 FI showed sensitivity andspecificity for predicting F0-1 stage 66.8% and 78.8% ininitial cohort and 68.5% and 63.6% in validation cohort,respectively [17]. At same cutoff, our data showed 100%sensitivity and 58.4% specificity with AUROC 0.939 forthe prediction of none/minimal fibrosis. While for pre-dicting cirrhosis in HCV patients, FI value > 3.30 hassensitivity and specificity 67.7% and 75% in initialcohort, and 70.8% and 81% in validation cohort, respec-tively. However, at this value we observed 33% sensitiv-ity and 100% specificity for predicting cirrhosis (Table3). We proposed that a new cutoff value of FI > 2.5 canbetter predict cirrhosis with 95.2% sensitivity and 94%specificity.The readily available indexes are associated with
some limitations like population discrepancy, not ableto distinguish all fibrosis stages individually or someprimarily developed for co-infected patients. So thereis a need to develop a new index that can distinguishminimal fibrosis (F0-F1) from significant (F2-F4) andadvanced (F2-F3) from cirrhosis (F4). While consider-ing substantial relationship of routinely applied tests;serum ALP, ALT, AST, Hb level, bilirubin, albuminand platelet count with liver fibrosis stages, we foundthat four serum markers ALP, bilirubin, albumin andplatelet count have high potential to differentiate dif-ferent fibrosis stages and cirrhosis at given cutoffvalues (Table 5 and Figure 4). We also observed thatcombination of these serum markers could better dif-ferentiate among fibrosis stages with high sensitivity,specificity, PPV and NPV.
Ahmad et al. BMC Gastroenterology 2011, 11:44http://www.biomedcentral.com/1471-230X/11/44
Page 8 of 10

Our newly derived index FCI showed better perfor-mance for discriminating between fibrosis stages ascompared to AAR, APRI and FI. In initial cohort, theAUROC for predicting F0-F1 stage for FCI was 0.932when compared to recently used non-invasive serummarkers like AAR (AUROC = 0.570) [15], APRI(AUROC = 0.880) [16], FI (AUROC = 0.741) [17], FIB-4(AUROC = 0.793) [18], Forn’s index (AUROC = 0.860)[51], and Fibrotest (AUROC = 0.870) [52]. Moreover,FCI (AUROC = 0.996) showed better performance forpredicting cirrhosis than above mentioned serumindexes. Although in our study, platelet count showedhigh AUROC to predict fibrosis stages, systematic litera-ture reviews consistently shown that panel of fibrosismarkers are more accurate than single marker. Combi-nation of two or more serum markers in a mathematicalalgorithm provide better chance of predicting phase ofdisease progression instead of individual one [37,53-57].This analysis showed that FCI has tendency to reflectrespective fibrosis stages from no/minimal to cirrhosiswith great accuracy (Table 5, Figure 5 and 6). However,several studies are needed to verify these results. Sec-ondly, because of poverty and fear of biopsy, we are notyet able to get enough patient data for verification ofour FCI results in new cohort.
ConclusionsFor Pakistani population the mostly used markers werefailed to predict fibrosis stages in patients with HCVwith accuracy. This study concluded that a simple index(FCI) containing ALP, bilirubin, albumin and plateletcount may accurately classify different fibrosis stagesfrom none to cirrhosis. Future studies are required toassess the applicability of this fibrosis-cirrhosis indexwithin different populations and in patients with HBVor other fatty liver diseases.
AbbreviationsHCV: hepatitis C.
AcknowledgementsThe authors wish to thank all laboratory staff for their help in gathering data.
Author details1Applied and Functional Genomics Lab, Centre of Excellence in MolecularBiology, University of the Punjab, Lahore-53700, Pakistan. 2Fouzia Tahir Javed,Department of Pathology, Jinnah Hospital, Lahore-54590, Pakistan.
Authors’ contributionsWA and BI contributed equally to this study. WA, BI and SH designed thestudy, analyze the data and wrote paper. JS, KS, PA, SA, SG, MTS and ISperformed all lab work. FTJ and SA collected and arrange data. All work wasperformed under supervision of SH. All authors read and approved the finalmanuscript.
Authors’ informationBushra Ijaz (M Phil Molecular Biology), Waqar Ahmad (M Phil Chemistry), andGull S (MSc Biochemistry) are Research Officer at CEMB. Shah Jahan, Saba
Khaliq and Samrin A (PhD in Molecular biology), Javed FT is pathologist atJinnah hospital Lahore. Sarwar MT, Kausar H, Asad S and Shahid I are PhDscholars; while Sajida Hassan (PhD Molecular Biology) is Principal Investigatorat CEMB, University of the Punjab, Lahore.
Competing interestsThe authors declare that they have no competing interests.
Received: 20 October 2010 Accepted: 21 April 2011Published: 21 April 2011
References1. Giannini C, Brechot C: Hepatitis C virus biology. J Virology 2003, 10:
S27-S38.2. Alter MJ: Epidemiology of hepatitis C. Hepatology 1997, 26:62S-65S.3. Raja NS, Janjua KA: Epidemiology of hepatitis C virus infection in
Pakistan. J Microbiol Immunol Infect 2008, 41:4-8.4. Idrees M, Riazuddin S: Frequency distribution of hepatitis C virus
genotypes in different geographical regions of Pakistan and theirpossible routes of transmission. BMC Infect Dis 2008, 8:69.
5. EL-Serag HB: Hepatocellular carcinoma and hepatitis C in the UnitedStates. Hepatology 2002, 36:S74-S83.
6. Moriya K, Fujie H, Shintani Y, Yotsuyanagi H, Tsutsumi T, Ishibashi K,Matsuura Y, Kimura S, Miyamura T, Kpike K: The Core protein of hepatitis Cvirus induces hepatocellular carcinoma in transgenic mice. Nat Med1998, 4:1065-1077.
7. Adinolfi LE, Gambardella M, Andreana A, Tripodi MF, Utili R, Ruggiero G:Steatosis accelerates the progression of liver damage of chronichepatitis C patients and correlates with specific HCV genotype andvisceral obesity. Hepatology 2001, 33:1358-1364.
8. National Institute of health Consensus Development Conference Statement:Management of Hepatitis C: 2002. Hepatology 2002, 36:973-977.
9. Silva RG Jr, Fakhouri R, Nascimento TV, Santos IM, Barbosa LM: Aspartateaminotransferase-to-Platelet ration index for fibrosis and cirrhosisprediction in chronic hepatitis C patients. Braz J Infect Dis 2008, 12:15-19.
10. Pratt DS, Kaplan MM: Evaluation of abnormal liver-enzyme results inasymptomatic patients. N Eng J Med 2000, 342:1266-1271.
11. Parise ER, Oliveira AC, Figueiredo-Mendes C, Lanzoni V, Martins J, Nader H,Ferraz ML: Noninvasive serum markers in the diagnosis of structural liverdamage in chronic hepatitis C virus infection. Liver Int 2006, 26:1095-1099.
12. Azzari C, Resti M, Moriondo M, Ferrari R, Lionetti P, Vierucci A: Verticaltransmission of HCV is related to maternal peripheral bloodmononucleat cell infection. Blood 2000, 96:2045-2048.
13. Kowala-Piaskowska A, Mozer-Lisewska I, Figlerowicz M, Sluzewski W:Influence of the presence of HCV-RNA in peripheral blood mononuclearcells on the clinical course of chronic hepatitis C in children. Eur JEpidemiol 2007, 22:343-348.
14. Castera L, Pinzani M: Non-invasive assessment of liver fibrosis: are weready. Lancet 2010, 375:1419-1420.
15. Hoofnagle JH, Williams AL: Ratio of serum aspartate to alanineaminotransferase in chronic hepatitis: relationship to cirrhosis.Gastroenterology 1988, 95:734-739.
16. Wai CT, Greenson JK, Fontana RJ, Kalbfleisch JD, Marrero JA,Conjeevaram HS, Lok AS: A simple noninvasive index can predict bothsignificant fibrosis and cirrhosis in patients with chronic hepatitis C.Hepatology 2003, 38:518-526.
17. Ohta T, Sakaguchi K, Fujiwara A, Fujioka S, Iwasaki Y, makino Y, Araki Y,Shiratori Y: Simple surrogate index of the fibrosis stage in chronichepatitis C patients using platelet count and serum albumin level. ActaMed Okayama 2006, 60:77-84.
18. Vallet-Pichard A, Mallet V, Nalpas B, Verkarre V, Nalpas A, Dhalluin-Venier V,Fontaine H, Pol S: FIB-4: an inexpensive and accurate marker of fibrosisin HCV infection. Comparison with liver biopsy and FibroTest. Hepatology2007, 46:32-36.
19. The French METAVIR Cooperative Study Group: Intraobserver andinterobserver variations in liver biopsy interpretation in patients withchronic hepatitis C. Hepatology 1994, 20:15-20.
20. Poynard T, Bedossa P, Opolon P: Natural history of liver history ofliver fibrosis progression in Patients with chronic hepatitis C. TheOBVIRC, METAVIR, CLINIVIR, and DOSVIRC groups. Lancet 1997,349:825-832.
Ahmad et al. BMC Gastroenterology 2011, 11:44http://www.biomedcentral.com/1471-230X/11/44
Page 9 of 10

21. Ahmad W, Ijaz B, Javed FT, Jahan S, Shahid I, Khan FM, Hassan S: HCVgenotype distribution and possible transmission risks in Lahore,Pakistan. World J Gastroenterology 2010, 16:4321-4328.
22. Kobayashi M, Tanaka E, Sodeyama T, Urushihara A, Matsumoto A,Kiyosawa K: The natural course of chronic hepatitis C: a comparisonbetween patients with genotypes 1 and 2 hepatitis C viruses. Hepatology1996, 23:695-699.
23. Idrees M, Rafique S, Irshad-ur-rehman , Akbar H, Yousaf MZ, Butt S, Awan Z,Manzoor S, akram M, Aftab M, Khubaib B, Riazuddin S: Hepatitis Cgenotype 3a infection and hepatocellular carcinoma: Pakistanexperience. World J Gasteroenterol 2009, 15:5080-5085.
24. Mendes SCL, Nita EM, Ono-Nita KS, Mello SE, Silva CL, Alves VA, Carriho FJ:Prognostic factors for progression of liver structural lesions in chronichepatitis C patients. World J Gastroenterol 2008, 14:2522-2528.
25. Tassopoulos NC, Papatheodoridis GV, Katsoulidou A, Delladetsima JK,Sypsa V, Touloumi G, Nikandros M, Hatzakis A: Factors associated withseverity and disease progression in chronic hepatitis C.Hepatogastroenterology 1998, 45:1678-1683.
26. Ramalho F, Costa A, Pires A, Cabrita P, Sereojo F, Correia AP, Fatela N,Cloria H, Lopes J, Pinto HC, Marinho R, Raimundo M, Velosa J, Batista A, deMoura MC: Correlation of genotypes and route of transmission withhistologic activity and disease stage in chronic hepatitis C. Dig Dis Sci2000, 45:182-187.
27. Puoti C, Magrini A, Stati T, Rigato P, Montagnese F, Rossi P, Aldegheri L,Resta S: Clinical, histological, and virological features of hepatitis C viruscarriers with persistently normal or abnormal alanine transaminaselevels. Hepatology 1997, 26:1393-1398.
28. Haber MM, West AB, Haber AD, Reuben A: Relationship ofaminotransferases to liver histological status in chronic hepatitis C. Am JGastroenterol 1995, 90:1250-1257.
29. Bacon BR: Treatment of patients with hepatitis C and normal serumaminotransferase levels. Hepatology 2002, 32:634-643.
30. Moatter T, Hussainy AS, Hamid S, Ahmad Z, Siddiqui S: Comparativeanalysis of viral titers and histologic features of Pakistani patientsinfected with hepatitis C virus type 3. Int J Infect Dis 2002, 6:272-276.
31. Shafique M, Ahmad N, Awan FR, Mustafa T, Ullah M, Qureshi JA:Investigating the concurrent presence of HCV in serum, oral fluid andurine samples from chronic HCV patients in Faisalabad, Pakistan. ArchVirol 2009, 154:1523-1527.
32. Mastoi AA, Devrajani BR, Shah SZA, Rohopoto Q, Memon SA, Baloch M,Qureshi GA, Sami W: Metabolic investigations in patients with hepatitis Band C. World J Gastroenterol 2010, 16:603-607.
33. Viroj W: High serum alkaline phosphatase levels, a study in 181 Thaiadult hospitalized patients. BMC Family Practice 2001, 2:2.
34. Saif MW, Alexander D, Wicox CM: Serum Alkaline Phosphatase Level asPrognostic Tool in Colorectal Cancer: A study of 105 patients. J Appl Res2005, 5:88-95.
35. Lee GH, Benner D, Regidor DL, Kalatar-Zadeh K: Impact of kidney bonedisease and its management on survival of patients on dialysis. J RenNutr 2007, 17:38-44.
36. Raymond E, Boige V, Faivre S, Sanderink G, Rixe O, Vernillet L, Jacques C,Gatineau M, Ducreux M, Armand JP: Dosage adjustment andpharmacokinetic profile of Irinotecan in cancer patients with hepaticdysfunction. J Clin Oncol 2002, 20:4303-4312.
37. Imbert-Bismut F, Ratziu V, Pieroni L, Charlotte F, Benhamou Y, Poynard T:Biochemical markers of liver fibrosis in patients with hepatitis C virusinfection: a prospective study. Lancet 2001, 357:1069-1075.
38. Myres RP, De Torres M, Imbert-Bismut F, Ratziu V, Charlotte F, Poynard T,MULTIVIRC Group: Biochemical markers of fibrosis in patients withchronic hepatitis C: a comparison with prothrombin time, platelet count,and age-platelet index. Dig Dis Sci 2003, 48:271-278.
39. Ghany MG, Lok AS, Everhart JE, Everson GT, Lee WM, Cuto TM, Wright EC,Stoddard AM, Sterling RK, Di Bisceglie AM, Bonkovsky HL, Morishima C,Morgan TR, Dienstag JL, HALT-C Trial Group: Predicting clinical andhistologic outcomes based on standard laboratory tests in advancedchronic hepatitis C. Gasteroenterology 2010, 138:136-146.
40. Murawaki Y, Koda M, Okamoto K, Mimura K, Kawasaki H: Diagnostic valueof serum type IV collagen test in comparison with platelet count forpredicting the fibrotic stage in patients with chronic hepatitis. JGastroentrol Hepatol 2001, 16:777-781.
41. Pohl A, Behling C, Oliver D, Kilani M, Monson P, Hassanein T: Serumaminotransferase levels and platelet counts as predictors of degree offibrosis in chronic hepatitis C virus infection. Am J Gastroenterol 2001,96:3053-3055.
42. Fusegawa H, Shiraishi K, Ogasawara F, Shimizu M, Haruki Y, Miyachi H,Matsuzaki S, Ando Y: Platelet activation in patients with chronic hepatitisC. Tokai J Exp Clin Med 2002, 27:101-106.
43. Lackner C, Struber G, Liegl B, Leibl S, Ofner P, Bankuti C, Bauer B,Stauber RE: Comparison and validation of simple noninvasive tests forprediction of fibrosis in chronic hepatitis C. Hepatology 2005,41:1376-1382.
44. Giannini E, Risso D, Botta F, Chiarbonello B, Fasoli A, Malfatti F,Romagnoli P, testa E, Ceppa P, Testa R: Validity and clinical utility of theaspartate aminotransferase-alanine aminotransferase ration in assessingdisease severity and prognosis in patients with hepatitis C virus relatedchronic liver disease. Arch Intern Med 2003, 163:218-224.
45. Shaikh S, Memon MS, Ghani H, Baloch GH, Jaffery M, Shaikh K: Validation ofThree Non-Invasive Markers in Assessing the Severity of Liver Fibrosis inChronic Hepatitis C. JCPSP 2009, 19:478-482.
46. Khan DA, Fatima-Tuz-Zuhra , Khan FA, Mubarak A: Evaluation of diagnosticaccuracy of apri for prediction of fibrosis in hepatitis c patients. J AyubMed Coll Abbottabad 2008, 20:122-126.
47. Snyder N, Gajula L, Xiao SY, Grady J, Luxon B, Lau DT, Soloway R,Petersen J: APRI: an easy and validated predictor of hepatic fibrosis inchronic hepatitis C. J Clin Gastroenterol 2006, 40:535-542.
48. Macias J, Gonzalez J, Ortega E, Tural C, Cabrero E, Burgos A, Pineda JA,GRAFIHCO Study Team: Use of simple noninvasive biomarkers to predictliver fibrosis in HIV/HCV coinfection in routine clinical practice. HIV Med2010, 11:439-447.
49. Sterling RK, Lissen E, Clumeck N, Sola R, Correa MC, Montaner J,Sulkowski SM, Torriani FJ, Dieterich DT, Thomas DL, Messinger D, Nelson M,APRICOT Clinical Investigators: Development of a simple noninvasiveindex to predict significant fibrosis in patients with HIV/HCV coinfection.Hepatology 2006, 43:1317-1325.
50. Trang T, Petersen JR, Snyder N: Non-invasive markers of hepatic fibrosis inpatients co-infected with HCV and HIV: Comparison of the APRI and FIB-4 index. Clinica Chimica Acta 2008, 397:51-54.
51. Forns X, Ampurdanes S, Liovet JM, Aponte J, Quinto L, Marteniz-Bauer E,Bruguera M, Sanchez-Tapias JM, Rodes J: Identification of chronic hepatitisC patients without hepatic fibrosis by a simple predictive model.Hepatology 2003, 36:986-992.
52. Myers RP, Ratziu V, Imbert-Bismut F, Charlotte F, Poynard T, MULTIVIRICGroup: Biochemical markers of liver fibrosis: a comparison withhistological features in patients with chronic hepatitis C. Am JGasteroenterol 2002, 97:2419-2425.
53. Guha IN, Parkes J, Roderick PR, Harris S, Rosenberg WM: Non-invasivemarkers associated with liver fibrosis in non-alcoholic fatty liver disease2. GUT 2006, 55:1650-1660.
54. Parkes J, Guha IN, Roderick P, Rosenberg W: Performance of serum markerpanels for liver fibrosis in chronic hepatitis C. J Hepatology 2006,44:462-474.
55. Pinzani M: The ELF panel: a new crystal ball in hepatology? Gut 2010,59:1165-1167.
56. Wang M, Long RE, Comunale MA, Junaidi O, Marrero J, Di Bisceglie AM,Block TM, Mehta AS: Novel Fucosylated Biomarkers for the EarlyDetection of Hepatocellular Carcinoma. Cancer Epidemiol Biomarkers Prev2009, 18:1914-1921.
57. Rosenberg WM, Voelker M, Thiel R, Becka M, Burt A, Schuppan D,Hubscher S, Roskams T, Pinzani M, Arthur MJ: European Liver FibrosisGroup: Serum markers detect the presence of liver fibrosis: a cohortstudy. Gastroenterology 2004, 127(6):1704-1713.
Pre-publication historyThe pre-publication history for this paper can be accessed here:http://www.biomedcentral.com/1471-230X/11/44/prepub
doi:10.1186/1471-230X-11-44Cite this article as: Ahmad et al.: A comparison of four fibrosis indexesin chronic HCV: Development of new fibrosis-cirrhosis index (FCI). BMCGastroenterology 2011 11:44.
Ahmad et al. BMC Gastroenterology 2011, 11:44http://www.biomedcentral.com/1471-230X/11/44
Page 10 of 10