Price indexes for pharmaceuticals used by the elderly - CMS
15
Price indexes for pharmaceuticals used by the elderly by Joseph Thomas, III and Stephen Schondelmeyer The analysis presented in this report was undertaken possible with the producer price index (PPI) or the to identify those drug entities that account for a Consumer Price Index (CPI). From 1981 through 1988, significant proportion of the retail expenditures for the average annual rate of increase in manufacturers' prescription drugs used by the elderly. Commercial data prices was 9.1 percent, and retail prices increased at an bases were used to develop fixed weight Laspeyres price average annual rate of 6.6 percent. The indexes indexes based specifically on drugs used in the elderly represent potentially powerful tools in analyzing drug population. The indexes provide the capability to price trends, an important component of drug program analyze price trends for drug groupings that are not expenditure forecasting and management. Introduction could fill this need. This article describes the construction of indexes that include a much broader The elderly population, comprised of persons mix of drug products than are found in the CPI or PPI 65 years of age or over, is growing rapidly in number and can measure price changes for drugs used by a and as a percent of the total U.S. population. As a specific beneficiary group, the elderly. result, the utilization and cost of health care in this population segment has become of increased interest. Study objectives Prescription drugs represent a significant part of health care for the elderly as well as a significant expense item The overall goal was to determine changes in for most elderly persons. In fact, it was estimated that manufacturers' prices and pharmacists' charges for elderly persons incurred average annual prescription outpatient prescription drugs used by the elderly. drug expenditures of $385 in 1987 (Berk, Schur, and Specific objectives established to accomplish this goal Mohr, 1990). included: In the summer of 1988, when Congress passed the • Identifying and ranking, in descending order by Medicare Catastrophic Coverage Act of 1988 (Public expenditures, outpatient prescription drugs that Law 100-360), coverage of catastrophic expenditures account for 80 percent of total expenditures for for outpatient prescriptions was included. Although the prescription drugs used by persons 65 years of age or legislation was repealed by the fall of 1989, efforts to over. develop budget estimates for the prescription benefit • Developing fixed-weight indexes that reflect the and other preparations for its implementation relative change in manufacturers' prices and retail highlighted the need for detailed pharmaceutical price prices from January 1981 through December 1988 for trend data at both the manufacturer and retail levels. prescription drugs used by the elderly in each of the In a report to Congress on manufacturers' prices and following groups: pharmacists' charges, the Consumer Price Index (CPI) All prescription drugs. and the producer price index (PPI) were used to analyze Single-source drugs. trends in manufacturers' prices and retail charges for Multiple-source drugs. prescription pharmaceuticals (Health Care Financing Originator multiple-source drugs. Administration, 1989). However, that analysis was Non-originator multiple-source drugs. limited by the small number of drugs covered in the CPI Pre-1981 multiple-source drugs. and PPI. Additionally, the CPI and PPI are based on a Post-1981 multiple source drugs. market basket of prescription pharmaceuticals used by • Determining the relative change in pharmacies' the U.S. population as a whole and could not be used to margins (average dollar margin per prescription, identify drugs that represent the mix (or market basket) average dollar margin per unit, and average dollar of prescription drugs used by the Nation's elderly. margin as a percent of the average retail prescription Estimation of future prescription expenditures for price) from January 1981 through December 1988. defined beneficiary groups such as the elderly requires trend data for forecasting changes in prices for drugs used in that population as well as forecasting changes in Methods prescription drug utilization rates within the population. Indexes that characterize changes in Data sources manufacturers' prices and retail prices for prescription Data used to accomplish the study objectives were drugs used by special populations such as the elderly obtained from commercial data bases maintained by IMS America, Ltd, and a data base maintained by MediSpan, Inc. IMS utilized special programming Reprint requests: Joseph Thomas, III, Ph.D., School of Pharmacy support to create an extracted file of pertinent data and Pharmacal Sciences, Heine Pharmacy Building, Purdue elements from three of its data bases: (1) the National University, West Lafayette, Indiana 17907-1335. Health Care Financing Review/Fall 1992 /volume 14, Number 1 91
-
Upload
khangminh22 -
Category
Documents
-
view
1 -
download
0
Transcript of Price indexes for pharmaceuticals used by the elderly - CMS

Price indexes for pharmaceuticals used by the elderly by Joseph Thomas, III and Stephen Schondelmeyer
The analysis presented in this report was undertaken possible with the producer price index (PPI) or the to identify those drug entities that account for a Consumer Price Index (CPI). From 1981 through 1988, significant proportion of the retail expenditures for the average annual rate of increase in manufacturers' prescription drugs used by the elderly. Commercial data prices was 9.1 percent, and retail prices increased at an bases were used to develop fixed weight Laspeyres price average annual rate of 6.6 percent. The indexes indexes based specifically on drugs used in the elderly represent potentially powerful tools in analyzing drug population. The indexes provide the capability to price trends, an important component of drug program analyze price trends for drug groupings that are not expenditure forecasting and management.
Introduction could fill this need. This article describes the construction of indexes that include a much broader
The elderly population, comprised of persons mix of drug products than are found in the CPI or PPI 65 years of age or over, is growing rapidly in number and can measure price changes for drugs used by a and as a percent of the total U.S. population. As a specific beneficiary group, the elderly. result, the utilization and cost of health care in this population segment has become of increased interest. Study objectives Prescription drugs represent a significant part of health care for the elderly as well as a significant expense item The overall goal was to determine changes in for most elderly persons. In fact, it was estimated that manufacturers' prices and pharmacists' charges for elderly persons incurred average annual prescription outpatient prescription drugs used by the elderly. drug expenditures of $385 in 1987 (Berk, Schur, and Specific objectives established to accomplish this goal Mohr, 1990). included:
In the summer of 1988, when Congress passed the • Identifying and ranking, in descending order by Medicare Catastrophic Coverage Act of 1988 (Public expenditures, outpatient prescription drugs that Law 100-360), coverage of catastrophic expenditures account for 80 percent of total expenditures for for outpatient prescriptions was included. Although the prescription drugs used by persons 65 years of age or legislation was repealed by the fall of 1989, efforts to over. develop budget estimates for the prescription benefit • Developing fixed-weight indexes that reflect the and other preparations for its implementation relative change in manufacturers' prices and retail highlighted the need for detailed pharmaceutical price prices from January 1981 through December 1988 for trend data at both the manufacturer and retail levels. prescription drugs used by the elderly in each of the
In a report to Congress on manufacturers' prices and following groups: pharmacists' charges, the Consumer Price Index (CPI) All prescription drugs. and the producer price index (PPI) were used to analyze Single-source drugs. trends in manufacturers' prices and retail charges for Multiple-source drugs. prescription pharmaceuticals (Health Care Financing Originator multiple-source drugs. Administration, 1989). However, that analysis was Non-originator multiple-source drugs. limited by the small number of drugs covered in the CPI Pre-1981 multiple-source drugs. and PPI. Additionally, the CPI and PPI are based on a Post-1981 multiple source drugs. market basket of prescription pharmaceuticals used by • Determining the relative change in pharmacies' the U.S. population as a whole and could not be used to margins (average dollar margin per prescription, identify drugs that represent the mix (or market basket) average dollar margin per unit, and average dollar of prescription drugs used by the Nation's elderly. margin as a percent of the average retail prescription Estimation of future prescription expenditures for price) from January 1981 through December 1988. defined beneficiary groups such as the elderly requires trend data for forecasting changes in prices for drugs used in that population as well as forecasting changes in Methods prescription drug utilization rates within the population. Indexes that characterize changes in Data sources manufacturers' prices and retail prices for prescription Data used to accomplish the study objectives were drugs used by special populations such as the elderly obtained from commercial data bases maintained by
IMS America, Ltd, and a data base maintained by MediSpan, Inc. IMS utilized special programming
Reprint requests: Joseph Thomas, III, Ph.D., School of Pharmacy support to create an extracted file of pertinent data and Pharmacal Sciences, Heine Pharmacy Building, Purdue elements from three of its data bases: (1) the National University, West Lafayette, Indiana 17907-1335.
Health Care Financing Review/Fall 1992/volume 14, Number 1 91

Disease and Therapeutic Index (NDTI), (2) the Price-trend analysis U.S. Pharmaceutical Market—Drugstores (USD) and, (3) the National Prescription Audit (NPA). Price indexes
NDTI, begun in 1956, is a continuing compilation of statistical information about the patterns and treatment Several price indexes were developed to allow analysis of diseases encountered by physicians in office-based of trends in drug prices. Because the objective was to practice in the continental United States. The number assess the magnitude of price changes over time apart of patient visits along with the number and types of from changes in the mix of drugs dispensed, Laspeyres drug therapy are recorded in association with a variety price indexes were developed. Laspeyres indexes are of patient and physician characteristics including fixed weight price indexes in which quantities of items patient age. NDTI was used in this project to determine purchased in a chosen base year are employed as the outpatient drug therapies used most frequently by weights. The indexes are based on comparing the cost of the elderly population. purchasing fixed quantities, those identified in the base
year, of a fixed set or (market basket) of items at prices The USD data base is a monthly report on the in different time periods with the cost of purchasing volume, in terms of dollars and units (i.e., tablets, that same market basket in the comparison or base capsules, or milliliters), of both prescription and over-period (Cagan and Moore, 1981). In this case, the the-counter pharmaceutical products purchased for quantities used were the numbers of capsules, tablets, resale by retail outlets in the continental United States. or milliliters of liquids for each product dispensed by These estimates are based on information collected pharmacies in the base year. from drug wholesalers, independent and chain
pharmacies, and discount houses or mass Choice of the base year for product quantities to be merchandisers. The audit's universe of measurement used as weights in the index was influenced by several does not include supermarket, department store, or factors. Use of fixed-weight price indexes meant that mail-order pharmacies. This data base was used to products not marketed in the base year would be measure the purchases of prescription products into excluded from the index. After examining the number retail pharmacies. of products that would have been excluded if each
alternative base year had been selected, 1984 was chosen The NPA data base has been maintained since 1952 to balance exclusion of products not marketed before as a measure of the rate at which drugs move by means the base year and inclusion of products for which very of formal prescriptions out of retail pharmacies to few data points were available. consumers in the continental United States. Data from
the NPA data base included the number of Only drugs included in the list of drug entities prescriptions, the price per prescription, and the accounting for 80 percent of retail prescription number of dosage units per prescription dispensed for expenditures by consumers 65 years of age or over and each drug. those drugs for which 1984 expenditure data existed
were included in the indexes. Manufacturer and retail The Master Drug Data Base (MDDB), a drug price level product costs were estimated at semi-annual data base maintained by MediSpan, Inc., since 1978, intervals from January 1981 through December 1988. was also used in the analysis. This data base was used to Products were required to have valid data for at least verify data values and to identify the multiple-source 11 of 16 possible observation periods for manufacturer status of various drug products. (For additional detail, prices and 11 of 16 possible observation periods for see Thomas and Schondelmeyer, 1990.) retail prices. Each product's contribution, or weight in
Expenditures analysis an index, was based on the total quantity of the item purchased at the retail level from July through
Because NPA data do not record prescription activity December 1984. by consumer age, NDTI data on drug mentions was A composite retail drug price index was developed to used to estimate the proportion of retail expenditures represent the changes in prices of all the relevant drugs. on each drug product that was accounted for by the To calculate the value of the index in a given time elderly. This proportion of prescription mentions period, NPA-based unit retail price for each drug accounted for by individuals 65 years of age or over was product during that time period was multiplied by the multiplied by NPA expenditures for each drug product NPA estimate of the quantity of the product sold at to estimate the retail prescription expenditures retail in the 1984 base year. After multiplying the accounted for by drugs used by the elderly. The total period's prices by the base period quantities for each retail expenditures on drugs used by elderly consumers drug product, the results were summed to yield the cost was estimated by summing the expenditures for the of purchasing the market basket of drugs at that elderly across all products. The drugs were then sorted period's prices. The estimate of the total cost of the by expenditures in the elderly population, and market basket of drugs in the given time period was cumulative totals were calculated to find which drugs divided by the total cost of the 1984 base period accounted for 80 percent of 1988 total drug quantities of each product at 1984 prices to yield the expenditures for drugs used by the elderly. index value for the chosen time period. After
calculation of index values for each period, index values were multiplied by a constant that adjusted the January through June 1981 period to a value of 100 (Technical
92 Health Care Financing Review/Fall 1992/Volume 14, Number l

note). This adjustment was for convenience in measure of pharmacies' charges, or margin, on each comparing the relative magnitude of price changes in drug during each time period. A pharmacy charge, or various price indexes and for ease in presenting margin, was calculated at both the per prescription and graphical trends in the value of the indexes over time. the per unit levels. The composite manufacturers' drug price index was calculated in a similar manner. However, to maximize Results comparability of the manufacturer and retail level indexes, the same weights, i.e. the quantities used in the Expenditures retail price index, were multiplied by manufacturers' unit prices for each item as calculated from USD data. The estimate of total 1988 retail prescription drug
Because of the hypothesized impact on prices of expenditures based on NPA data was $26.5 billion. differences in the level of competition for single-source Expenditures for prescription drugs used by the elderly and multiple-source drugs, separate retail and population were estimated at $9.1 billion, or manufacturer level price indexes were calculated for 34.3 percent of total retail expenditures on prescription single-source and multiple-source drugs. In order to drugs. A total of only 104 drug entities, 41 single source analyze price trends for products that were recently and 63 multiple source, accounted for 80 percent of available from multiple sources with those that had retail drug expenditures by the elderly population. The been multiple source for long periods, price changes 104 entities represented 11.4 percent of the 913 total were analyzed separately for pre-1981 and post-1981 drug entities in the data base. multiple-source drugs. Price changes for originator and The 63 multiple-source drug entities accounted for non-originator products for multiple-source drugs were 44.2 percent of the elderly's total retail prescription also analyzed to detect whether those differences .drug expenditures, and the single-source drugs affected changes in prices (Technical note). accounted for 35.9 percent of such expenditures. The
remaining 809 drug entities that accounted for Pharmacy margin analysis 19.9 percent of the elderly's total retail prescription
drug expenditures were not classified. To evaluate the relative contribution of pharmacists' Drugs accounting for the highest proportion of retail charges to changes in retail prescription prices, the expenditures for drugs used by the elderly were not difference (or margin) between what pharmacists paid necessarily those used most frequently by elderly for pharmaceuticals and the retail prices paid by individuals. For example, ranitidine was ranked consumers was analyzed. This margin does not number one based on proportion of expenditures. represent pharmacies' profit. It represents the fraction However, when the drugs were ranked by percent of of sales revenue left to pay operating costs such as rent, total dosage units used by the elderly, ranitidine was utilities, and employees' wages after product costs have ranked 70 out of the 104 drugs accounting for been subtracted. Pharmacies' profit would consist of 80 percent of expenditures by the elderly. Patients any residual margin left after all other expenses have 65 years of age or over received 35.6 percent of all the been paid. Such a measure allows the analysis to focus units of ranitidine dispensed. This is in contrast with purely on the differential between what pharmacies 89.1 percent of all ergoloid dosage units that were must pay for drug products and the total charge to their dispensed to elderly patients. Similarly, chlorthalidone retail customers. was ranked 104 based on expenditures in the elderly but Two approaches were taken in this analysis. The first was ranked 33 in terms of percentage of units used by
approach focused on analysis of the average dollar the elderly. margin received by pharmacies on each prescription These findings can be explained by differences dispensed. The second approach was based on analysis between the elderly and the general population with of pharmacies' average dollar margin on each unit of respect to use of individual drugs as reflected in the drug product sold. The definition of unit used was the number of total units used. Wide differences in cost per IMS defined "extended unit," which is generally dosage unit across individual drugs also explain equivalent to one capsule or tablet for solid dosage differences in percent of units used and percent of forms or one milliliter for liquid drug products. elderly drug expenditures accounted for by various Analysis of margin per unit removed the effect of drugs. changes in the number of units dispensed per prescription. Pharmaceutical price changes: 1981-88
The estimate of manufacturers' unit price for each drug during each period was multiplied by the total A total 85 of the 104 drug entities accounting for number of units of the drug dispensed at the retail level 80 percent of retail expenditures by the elderly were during the corresponding period. This provided an included in the price indexes after applying the estimate of the total manufacturers' price for the exclusion criteria previously described in the methods number of units dispensed at retail. In other words, this section. Single-source drug entities accounted for represented pharmacies' product acquisition costs for 24 of the 85 drugs included, and the other 61 drug the number of units dispensed in a given period. This entities were classified as multiple-source drugs. A total aggregate product acquisition cost was subtracted from of 1,122 drug products were included in the index when the NPA-based estimate of total revenue received from drug entity, dosage form, dosage strength, and retail prescription sales of each drug. This provided a
Health Care Financing Review/Fall 1992/volume 14, Number 1 93

Figure 1 Manufacturer and retail price indexes: All drugs, single-source drugs,
and multiple-source drugs, 1981-88
NOTE: Data are for Jan.-June and July-Dec. for each of the years 1981-88. SOURCE: Thomas, J., and Schondelmeyer, S.: Purdue University, West Lafayette, Indiana, 1990.
94 Health Care Financing Review/Fall 1992/volume 14, Number 1

Table 1 Annual change and total change in manufacturer and retail drug price indexes: 1982-88
Percent change
December 1981 through Average
December annual percent Category 19881 change 1982 1983 1984 1985 1986 1987 1988
Manufacturer indexes Annual percent change All drugs 83.5 9.1 7.3 9.5 9.6 9.6 8.7 8.7 10.1 All single-source drugs 78.1 8.6 7.6 7.3 9.8 10.2 8.1 7.3 9.9 All multiple-source drugs 85.8 9.3 7.2 10.4 9.5 9.3 9.0 9.4 10.1
Multiple-source originator2 105.0 10.8 8.9 12.9 11.5 10.5 10.4 10.2 10.9 Multiple-source non-originator2 20.0 2.7 2.1 0.7 0.5 3.3 2.1 4.7 6.3
Pre-1981 multiple source 77.2 8.5 6.9 9.1 8.8 8.6 8.8 8.4 9.1 Post-1981 multiple source 103.0 10.6 7.9 13.0 10.7 10.6 9.2 11.2 11.9
Retail indexes All drugs 62.6 7.2 8.7 6.3 6.6 6.8 6.5 6.5 9.0 All single-source drugs 64.4 7.4 10.3 5.9 6.7 7.5 5.9 6.2 9.1 All multiple-source drugs 61.9 7.1 8.1 6.5 6.5 6.5 6.8 6.6 9.0
Multiple-source originator2 76.3 8.4 9.2 8.3 8.1 7.9 7.9 7.5 10.1 Multiple-source non-originator2 20.3 2.7 5.8 1.1 1.6 1.1 3.2 2.2 3.8
Pre-1981 multiple source 55.3 6.5 8.1 5.3 6.0 5.7 6.6 5.5 8.3 Post-1981 multiple source 76.6 8.5 8.1 9.1 7.7 8.1 7.0 8.8 10.5 1The column presents changes in price indexes from June through December 1981 to June through December 1988. 2Four multisource drug entities (nitroglycerin, theophylline, potassium, and quinidine) included in the multisource categories were excluded from the originator and non-originator comparisons because data necessary to identify originators was unavailable or because the existence of different originators across dosage forms prevented calculation of summative data at the entity level. 0SOURCE: Thomas, J., and Schondelmeyer, S.: Purdue University, West Lafayette, Indiana, 1990.
manufacturer were considered. The 85 drug entities The manufacturer price index for multiple-source drugs represented in the index accounted for 66.7 percent of increased 85.8 percent from 1981 through 1988. The all drug expenditures by the elderly. retail price index increased 61.9 percent during that
same period. The average annual increase in All drugs manufacturer and retail price indexes for multiple-
source drugs was 9.3 percent and 7.1 percent, The manufacturer drug price index for all drugs respectively (Table 1).
increased at an average annual rate of 9.1 percent from 1981 through 1988, and the retail prescription price Originators and non-originators index increased at an average annual rate of 7.2 percent (Figure 1). The manufacturer price index for all drugs From 1981 through 1988 the retail and manufacturer experienced a total increase of 83.5 percent, and the price indexes for originator multiple-source drugs retail price index increased 62.6 percent from increased much more than the corresponding indexes 1981 through 1988 (Table 1). In other words, the percent for non-originator multiple-source drugs (Figure 2). increase in the retail prescription price index for all The average annual percent change in the retail price drugs was less than the percent increase in the index for originator drugs was 8.4 percent from manufacturers' price index during the same time period. 1981 through 1988. Non-originator drugs had an
average annual increase in the retail index of 2.7 percent Single-source drugs during the same period.
The total increase in the retail price index for The manufacture price index for single-source drugs multiple-source originator drugs from 1981 through increased at an average annual rate of 8.6 percent from 1988 was 76.3 percent as compared with a 20.3-percent 1981 through 1988 as contrasted with a 7.4-percent increase in the retail price index for non-originator average annual increase in the retail price index for multiple-source drugs during the same period (Table 1). single-source drugs (Figure 1). The July through The total change in the manufacturer price index for December 1988 manufacturer price index for single- originator multiple-source drugs was 105.0 percent as source drugs was 78.1 percent greater than its July compared with a 20.0-percent increase in the through December 1981 value. The retail price index manufacturer price index for non-originator multiple-increased 64.4 percent during the same time period source drugs from 1981 through 1988 (Table 1). (Table 1). The manufacturer price index had a greater Multiple-source drugs cumulative increase than the retail price index for
originator drugs. The manufacturer price index for Trends in the manufacturer and retail drug price originator multiple-source drugs increased
indexes for multiple-source drugs are shown in Figure 1. 105.0 percent between 1981 and 1988 in comparison
Health Care Financing Review/Fall 1992/volume 14, Number 1 95

Figure 2 Manufacturer and retail multiple-source drugs price indexes: Pre- and post-1980, originator
and non-originator, pre-1981 originator and non-originator, post-1981 originator and non-originator, 1981-88
NOTE: Data are for Jan.-June and July-Dec. for each of the years 1981 -88. 0SOURCE: Thomas, J., and Schondelmeyer, S.: Purdue University, West Lafayette, Indiana, 1990.
96 Health Care Financing Review/Fall 1992/volume 14, Number 1

Figure 2 – Continued Manufacturer and retail multiple-source drugs price indexes: Pre- and post-1980, originator
and non-originator, pre-1981 originator and non-originator, post-1981 originator and non-originator, 1981-88
0NOTE: Data are for Jan.-June and July-Dec. for each of the years 1981 -88. 0SOURCE: Thomas, J., and Schondelmeyer, S.: Purdue University, West Lafayette, Indiana, 1990.
Health Care Financing Review/Fall 1992/volume 14, Number 1 97

with the 76.3-percent increase in the corresponding have been the difference in types of prescription retail price index (Figure 2). For non-originator transactions included in these two indexes. The retail multiple-source drugs, there was a 20.0-percent increase prescription price index developed in this study included in the manufacturer price index and a 20.3-percent all types of prescription transactions in retail increase in the retail prescription price index from 1981 pharmacies including cash transactions and third-party through 1988. transactions such as prescriptions covered by private A total of 32 multiple-source drugs had data for insurance or the Medicaid programs. originator and non-originator products included in the CPI for prescription drugs, in contrast, includes only Laspeyres indexes. The average annual change in prices those prescription transactions paid for directly by the for originator products was greater than that of non- end consumer. In other words, the prescriptions originator products for 27 of 32 drugs based on both covered by public and private third-party programs retail and manufacturer prices. Therefore, the tendency were not included in the set of prices evaluated by CPI for originator multiple-source products to have higher for prescription drugs. In 1989, 41.5 percent of all retail increases in prices than non-originator products prescriptions were paid directly by third-party appeared to be a general one, although there were some programs, i.e., Medicaid and private insurance exceptions. (Siegelman, 1990). The price paid by third-party
prescription programs is often less than the price paid Pre-1981 and post-1981 multiple-source drugs by the general public for a specific prescription.
Therefore, inclusion of third-party prescriptions in the Trends in the Laspeyres price indexes for pre-1981 retail index developed may partly explain differences in
and post-1981 multiple-source drugs are shown in its trend over time and trends in CPI for prescription Figure 2. The increase in the retail price index from drugs. 1981 through 1988 for drugs that were available from Although PPI for prescription pharmaceuticals multiple sources prior to 1981 was 55.3 percent as increased 89.6 percent, the weighted manufacturer contrasted with a 76.6-percent increase in the index for index increased a total of 83.5 percent for the 7-year drugs that became available from multiple sources after period. These two manufacturer price indexes differed 1981 (Table 1). The average annual increase in the retail very little during the period 1981-88 in comparison with price index was 6.5 percent for pre-1981 drugs and the difference found in CPIs. The type of manufacturer 8.5 percent for drugs that became available from price transactions considered by this study's multiple sources after 1981. The manufacturer price manufacturer price index and by PPI for prescription index again outstripped the retail index and showed a pharmaceuticals did not differ substantially. change for the 1981-88 period of 77.2 percent for Both the retail and manufacturer weighted indexes, pre-1981 multiple-source drugs and 103.0 percent for based on the prescription drug products accounting for post-1981 multiple-source drugs. 80 percent of the retail prescription expenditures by
persons 65 years of age or over, were found to have a Comparison of price change indexes lower overall percent increase from 1981 through 1988
The CPI and PPI are price change indexes, than either the CPI or PPI for prescription drugs. maintained by the U.S. Bureau of Labor Statistics, that track price changes of a market basket of prescription Pharmacy margins drugs over time. A previous report (Health Care
Margin per prescription Financing Administration, 1989) analyzed and summarized prescription price change trends based on Trends in average retail prescription price, ingredient CPI for prescription drugs and PPI for prescription cost, and margin received by retail pharmacies are drugs. shown in Figure 3. The average retail prescription price
The retail and manufacturer price indexes in this in nominal dollars for the drugs included in the analysis study are similar to CPI and PPI, respectively, but rose from $10.73 in 1981 to $20.78 in 1988. During the include prescription product transactions for drug same period, the average cost to pharmacies for the products that account for 80 percent of the retail drug product dispensed in each prescription increased expenditures by persons 65 years of age or over. One from $6.94 to $15.29. The difference (margin) between should note that CPI and PPI reflect a different set of the average retail prescription price and the cost to drugs than the indexes in this article. pharmacies for the dispensed ingredients increased
The Laspeyres retail prescription price index was from $3.79 in 1981 to $5.48 in 1988. Figure 3 shows the compared with CPI for prescription drugs for the trends for the same variables when adjusted to 1981 1981-88 period. A difference of more than constant dollars using CPI. In 1981 constant dollars, 20 percentage points between the CPI for prescription pharmacies' 1988 dollar margin per prescription drugs and the retail price index from this study was equaled only $4.12 in 1981 dollars, an increase of only found for the period 1981-88. The weighted retail index $0.33 from the $3.79 margin per prescription in 1981. prepared for this analysis increased 62.6 percent from When only single-source drugs were considered, the 1981 through 1988. During this same period, CPI for average prescription price in nominal dollars increased prescription drugs increased 85.5 percent. Although a from $18.64 in 1981 to $33.81 in 1988, an increase of number of factors may have contributed to this 81.4 percent (Figure 4). Average ingredient cost to difference, one major factor explaining this gap may pharmacies for single-source prescriptions increased
98 Health Care Financing Review/Fall 1992/volume 14, Number 1

from $14.13 to $27.60, an increase of 95.3 percent. decreased from 37.8 percent in 1981 to 33.7 percent in Pharmacies' average margin on single-source 1988. Percent margins on prescriptions for single-prescriptions increased from $4.51 to $6.21, a source drugs declined from 24.2 percent in 1981 to 37.7-percent increase. 18.4 percent in 1988 (Figure 6).
The average price of prescriptions for multiple-source drugs increased from $9.78 in 1981 to $15.40 in 1988. Study limitations The average cost to pharmacies for the ingredients in the average prescription for a multiple-source drug As in any research effort, various degrees of increased from $6.08 to $10.21. The pharmacies' measurement error in data and/or practical constraints average margin on multiple-source prescriptions in sampling limit analysis. Several such limitations are increased from $3.70 to $5.19. Overall, the average described later so that they may be taken into retail price for prescriptions for multiple-source drugs consideration when interpreting the results described in increased 57.5 percent, manufacturers' product prices this article. for the ingredients in multiple-source prescriptions NDTI mentions were used to estimate the proportion increased 67.9 percent from 1981 through 1988, and the of expenditures made by the elderly for each drug average pharmacy margin increased 40.3 percent product. The calculation is based on an assumption that (Figure 4). the number of prescriptions written by physicians but
not filled does not vary across age groups. Any Margin per unit differences across age groups in initial default rates
would introduce some bias into the estimates. The dollar margin on each pharmaceutical unit was The price data in the USD data base includes also analyzed. In nominal dollars, the average discounts reflected on invoices for products purchased pharmacy margin per unit for all drugs was $0.06 in by pharmacies. However, any post-invoice discounts or 1981 and grew to $0.10 by the end of 1988. When rebates would not be reflected in the data. However, if adjusted to constant 1981 dollars, however, the margin the percents of any such discounts are constant across was only $0.07 per unit in 1988 (Figure 5). The average the observation periods, the data should well reflect pharmacy margin per unit for multiple-source trends in prices. prescriptions was consistently less than the average The USD data base includes prescriptions paid for by margin per unit for single-source prescriptions. In 1981, third parties because of insurance coverage, whereas for example, the multiple-source products yielded a CPI includes only private pay prescriptions in which the dollar margin per unit of $0.06, and single-source individual purchasing the prescription pays the cost. products yielded a $0.07 per unit margin. These dollar This causes some difficulty in determining the reasons per unit margins had grown, respectively, to $0.09 and for the differences in price trends as reflected in the $0.12 by the end of 1988 (Figure 5). retail price indexes developed and trends in the CPI for
prescription drugs. However, it was not possible to Percent margins separate private pay and third-party prescriptions in the
Pharmacy margins as a percent of the average retail extracted data files used in this study. prescription price were also examined. This percent As noted earlier, the data sources used do not include margin was calculated by dividing the average mail order or supermarkets. However, those two pharmacy dollar margin per prescription by the average segments represented a very small part of the market. retail prescription price. The pharmacy percent margins Also one recent report indicated that there was little from 1981 to 1988 are shown in Figure 6. Pharmacies' difference between the prices paid by consumers for margins as a percent of the average retail prescription prescription drugs when purchased through mail order price decreased from 35.3 percent during the first half versus in community pharmacies (Horgan et al., 1989). of 1981 to 26.4 percent during the remainder of 1988. During this same period, the pharmacies' average dollar Summary and conclusions margin per prescription increased from $3.79 to $5.48, and the average retail prescription price increased from The elderly population is particularly affected by the $10.73 to $20.78 (Figure 3). continuing rapid rise in drug prices noted in this
When expressed as a percent of prescription price, analysis. As this analysis indicates, persons 65 years of pharmacies' average percent margin on prescriptions age or over were estimated to account for for multiple-source drug products tended to be greater approximately 34.3 percent of the $26.5 billion in total than the percent margin on prescriptions for single- 1988 retail expenditures for prescription drugs. source drugs. Despite this finding, pharmacies' average Additionally, a total of 104 drug entities (11.4 percent dollar margin on the multiple-source prescriptions was of all drug entities) accounted for 80 percent of less than their average dollar margin for single-source expenditures for drugs used by the elderly population. prescriptions. This can be explained by the fact that the Among the elderly's prescription expenditures, average price of prescriptions for multiple-source drugs multiple-source drugs accounted for 44.2 percent, was much less than that of single-source drugs. single-source entities accounted for 35.9 percent, and
However, the trend in the pharmacies' margins as a the remaining 19.9 percent were not classified for this percent of prescription sales was down in both cases. analysis. The percent margins on multiple-source prescriptions
Health Care Financing Review/Fall 1992/volume 14, Number 1 99
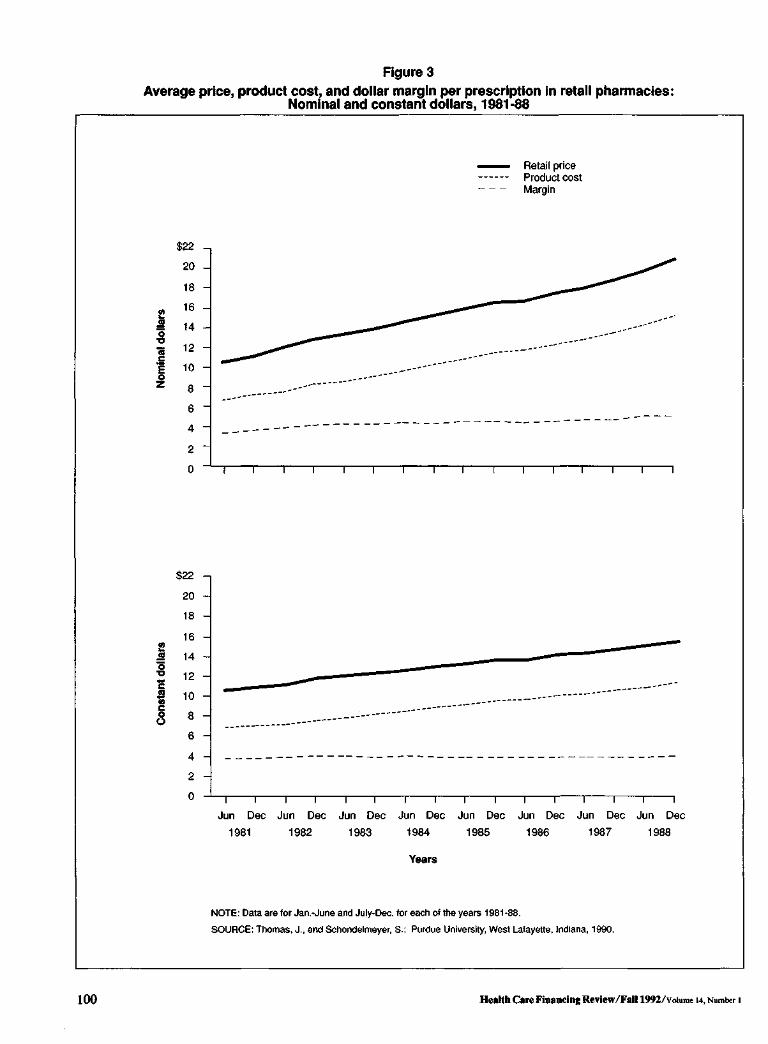
Figure 3 Average price, product cost, and dollar margin per prescription in retail pharmacies:
Nominal and constant dollars, 1981-88
0NOTE: Data are for Jan.-June and July-Dec. for each of the years 1981-88. 0SOURCE: Thomas, J., and Schondelmeyer, S.: Purdue University, West Lafayette, Indiana, 1990.
100 Health Care Financing Review/Fall 1992/volume 14, Number 1

Figure 4 Average price, product cost, and dollar margin per prescription in retail pharmacies:
Single-source and multiple-source drugs, 1981-88
0NOTE: Data are for Jan.-June and July-Dec. for each of the years 1981 -88. 0SOURCE: Thomas, J., and Schondelmeyer, S.: Purdue University, West Lafayette, Indiana, 1990.
Health Care Financing Review/Fall 1992/volume 14, Number 1 101

Figure 5 Average dollar margin per unit in retail pharmacies: All drugs, multiple-source drugs, and
single-source drugs, 1981-88
102 Health Care Financing Review/Fall 1992/volume 14, Number 1

Figure 6 Average percent margin on prescriptions in retail pharmacies: 1981-88
0NOTE: Data are for Jan.-June and July-Dec. for each of the years 1981-88. 0SOURCE: Thomas, J., and Schondelmeyer, S.: Purdue University, West Lafayette, Indiana, 1990.
Laspeyres price indexes were developed for selected increased from $10.73 in 1981 to $20.78 in 1988. During categories of pharmaceuticals. Changes in those indexes the same period, the average cost to pharmacies for the at the manufacturer and retail level were analyzed. At drug product dispensed in a prescription increased from the manufacturer and retail levels, drugs that were $6.94 to $15.29. As a result of these changes, available from multiple sources before 1981 were found pharmacies' margins increased from $3.79 in 1981 to to have lower average change in prices than drugs that $5.48 in 1988. However, the dollar margin in 1988 was became available from multiple sources after 1981. equivalent to only $4.12 in 1981 constant dollars, an There was a substantially greater average annual change increase of only $0.33 (8.7 percent) in real terms over a in prices of originator multiple-source drugs than in 7-year period. This compares with an increase of $4.56 non-originator multiple-source drugs. (65.7 percent) in product costs from the manufacturer
In comparing the changes in prices at the in 1981 constant dollar terms. manufacturer and retail levels, the average annual There was a small increase in pharmacies' dollar change in manufacturers' prices for all drugs combined margin per prescription, the difference between what and for single-source drugs alone were greater than the pharmacies paid for drugs and what they charged retail changes in the corresponding retail price indexes. The customers. However, other data suggest that average annual change in the manufacturer price index pharmacies' profits, the amount remaining after for multiple-source drugs also was greater than the covering all operating expenses, such as rent, wages, average annual change in the retail price index for and utilities, have decreased (National Association of multiple-source drugs. Chain Drug Stores, 1989). This indicates that
The average annual changes in prices at the retail pharmacies have not been able to increase their margins level tended to be lower than those at the manufacturer at a rate equivalent to the increase in their product and level. The one exception was that the average annual operating costs. As a result pharmacies' profits have change in manufacturer and retail prices for been forced down. Pharmacies' dollar margins as a non-originator multiple-source drugs was virtually the percent of prescription price on all the drugs examined same (20.0 versus 20.3 percent). In all other instances, decreased from 35.3 percent in 1981 to 26.4 percent in the average annual change in manufacturer prices was 1988. The average dollar margin per prescription for greater than the change in retail prices. multiple-source drugs was less than that for single-
Analysis of pharmacies' margins was undertaken to source drugs. Yet, because the average price of determine whether increased pharmacy markups were prescriptions for multiple-source drugs was much less responsible for the increases in retail drug prices. The than that of single-source prescriptions, the average average prescription price for all the drugs examined percent margin on prescriptions for multiple-source
Health Care Financing Review/Fall 1992/volume 14, Number 1 103

drugs was higher than that of single-source drugs. comparison to CPI and PPI is warranted. Such Pharmacies' average percent margins on prescriptions exploration could provide powerful tools that would for both single-source drugs and multiple-source drugs produce the detailed pharmaceutical price trend data declined from 1981 through 1988. During this period, necessary for program expenditure forecasting and the percent margin received by pharmacies on managing drug benefit program expenditures. prescriptions for multiple-source drugs decreased from 37.8 percent to 33.7 percent and from 24.2 percent to Acknowledgments 18.4 percent for single-source drugs.
The data and methods used for analysis of drug price The authors wish to acknowledge the technical changes described in this article represent new assistance of Mark Freeland, Larry Reed, and approaches to analysis of drug price changes. The Daniel Waldo in developing the price indexes and methodology has an advantage over CPI and PPI in design of the data analysis. Jim Underhill, Health Care that it allows analysis of price trends at levels that Financing Administration, contract officer for the cannot be achieved with CPI and PPI through the project, served as an insightful and helpful liaison creation of indexes for specific drug groupings based on throughout the conduct of the project. Crystal Miller's defined beneficiary populations or other criteria. systematic approach and talent in programming the Further exploration of drug price trends based on the data analysis were of immeasurable value. Finally, the methods presented in this article and on analysis of the comments of three anonymous reviewers were also current methodology's strengths and weaknesses in helpful.
Technical note This note provides some of the key formulas used to
calculate values for many of the key indicators used in the analysis. Formulas used for calculation of analysis variables
Manufacturer unit price = USD-Tot-Dol-Vol
USD-Tot-Ext-Unit-Vol
Retail unit price _ NPA-Tot-Retail-Dol
NPA-Tot-Ext-Unit-Disp
Pharmacy margin per unit 2 (NPA-Tot-Retail-Dol - (NPA-Tot-Ext-Unit-Disp X manufacturers' unit price)
— all products
2 NPA-Tot-Ext-Unit-Disp all products
Average retail prescription price 2 NPA-Tot-Retail-Dol
_ all products
2 NPA-Tot-Pres-Disp all products
Average retail prescription ingredient cost 2 (NPA-Tot-Ext-Unit-Disp X manufacturers' unit price)
_ all products
2 NPA-Tot-Pres-Disp all products
Pharmacy margin per prescription 2 (NPA-Tot-Retail-Dol - (NPA-Tot-Ext-Disp x manufacturers' unit price)
— all products
2 NPA-Tot-Pres-Disp all products
104 Health Care Financing Review/Fall 1992/volume 14, Number 1

All drugs manufacturer price index 2 manufacturer unit priceit x NPA-Tot-Ext-Unit-Dispi1984
— all products
2 manufacturer unit priceil984 x NPA-Tot-Ext-Unit-DisPii984 all products
Where: patient dollars by independent retail pharmacies. Manufacturer unit priceit is the manufacturer Retail Unit Price—National Prescription Audit based
unit price for the ith estimate of the average charge by pharmacies to product in period t. patients per IMS extended unit of a drug.
Manufacturer unit pricei1984 is the manufacturer USD-Tot-Dol-Vol—U.S. Drugstore estimates of unit price for the ith purchases expressed in thousands of dollars. product in the 1984 USD-Tot-Ext-Unit-Vol—U.S. Drugstore estimates of base period. purchases expressed in thousands of equivalent units
NPA-Tot-Ext-Unit-Dispi1984 is the quantity, i.e., (e.g., number of tablets, number of milliliters). number of extended units of the ith product References dispensed in the 1984 base period. Berk, M.L., Schur, C.L., and Mohr, P.: Using Survey Data
As is general practice, every formula was multiplied by to Estimate Prescription Drug Costs. Health Affairs 100 so that the value of each index in the 1984 base year 9(3): 146-156, Fall 1990. would be 100. Cagan, P., and Moore, G.H.: The Consumer Price After calculation of index values, the values for each Index: Issues and Alternatives. Washington, DC. American index were multiplied by a constant to convert the 1981 Enterprise Institute for Public Policy Research, 1981. index to a value of 100 for ease in showing graphical Horgan, C., Goody, B., Batten, H., et al.: Report to trends from 1981 through 1988. Congress: Study to Evaluate the Use of Mail Service
Pharmacies. NTIS Pub. No. 90-172677/AS. Springfield, VA. Formula component definitions National Technical Information Service, Sept. 1989.
National Association of Chain Drug Stores: NACDS Manufacturer unit price—U.S. drugstore estimate of Resource Guide. Alexandria, VA. NACDS, 1989. the average cost paid by pharmacies per IMS extended
Siegelman, S., and Feireman R.: Annual Pharmacy Business unit of a drug. Survey. American Druggist 201:36-42, May 1990. NPA-Tot-Ext-Unit-Disp—National Prescription Audit
Thomas, J., and Schondelmeyer, S.:based estimate of total quantity of product dispensed in Manufacturers' Prices and Pharmacies Charges For Prescription Drugs Used by The terms of extended units by retail pharmacies. Elderly. NTIS Pub. No. 91-100255 Springfield, VA. NPA-Tot-Pres-Disp—National Prescription Audit National Technical Information Service, June 1990.
based estimate of total prescriptions dispensed by retail Health Care Financing Administration:pharmacies. Report to Congress on Manufacturers' Prices and Pharmacists' Charges for MM-Tot-Retail-Dol—National Prescription Audit Outpatient Drugs Covered by Medicare. Baltimore, MD., based estimate of product dispensed in terms of retail or May 1989.
Health Care Financing Review/Fall 1992/volume 14, Number 1 105