Annual Report 2021 - Emcure Pharmaceuticals
203
Resilience • Innovation • Scale • Execution Annual Report 2021 RISE
-
Upload
khangminh22 -
Category
Documents
-
view
3 -
download
0
Transcript of Annual Report 2021 - Emcure Pharmaceuticals
1
Resilience • Innovation • Scale • Execution
Annual Report 2021
RISE


EMCURE AT A GLANCE
Emcure’s name embodies the company’s purpose and core belief – to make effective medicine accessible to patients, enabling them to lead healthier lives. Since its inception in 1981, Emcure has established a vertically integrated infrastructure for developing and manufacturing a wide range of medicines and marketing them in India and abroad. Emcure is, today, ranked amongst the leading pharmaceutical players in India.
Innovation, one of Emcure’s core values, is ingrained in our culture and reflected in all our operations. Our Business Strategy, driven by the entrepreneurial spirit, has led us to adopt different business models across geographies. Emcure’s operations are focused towards building a robust product portfolio including differentiated platforms such as Novel Drug Delivery Systems, Biologics, Chiral chemistry, Injectables etc. Emcure aims at creating strong brand equity by promoting top class products. We are oriented towards serving our customers, consumers and community globally and thus we have the highest regard for quality. In a fast changing global pharmaceutical industry, it has been our constant endeavour to equip ourselves with required resources that would aid our growth.
EFFECTIVE MEDICINE FOR CURE
SUCCESS THROUGH INNOVATION

Innovation Quality &Patient Focus
Team Work& Respect
ValueDrivenIntegrity
OUR CORE VALUES
To provide quality healthcare solutions globally by leveraging our scientific strengths
OUR VISION

CORPORATE GOVERNANCE FRAMEWORK
Stakeholders(Shareholders, Society, Environment,
Future generations, etc)
Board and BoardCommittees
Chairman
MD& CEO
ExecutiveManagement/Commitee
Employees/Staff
Truste
es
Executing strategy within the policy
framework set by the Board
Owners
ACCO
UN
TABI
LITY
EMPO
WERM
ENT
Governing Body
Board of Directors
Board Committees
Executive Directors Non-Executive/ Independent Directors
Senior management
First LineManagement
Control
Second LineControllingFunctions
Third LineIndependent
Assurance
The corporate governance structure at Emcure is based on the principles of delegation of authority and accountability throughout the governance structure, with appropriate checks and balances in place at each stage.
The Board of Directors serve as an oversight body with supervisory role to represent interest of all stakeholders and provide strategic direction to the management. As a commitment to the strong corporate governance structure, role of Board chairman at Emcure has been held by independent director since 1997.
Our Key Governing Policies
• Vigil mechanism and Whistle-blower policy• Nomination and Remuneration Policy• CSR Policy• POSH Policy• Related Party Transactions Policy• Anti Corruption Policy • Risk Management Policy
The company has a well-established three lines of defense model that governs the effective functioning of the organization. At Emcure,
all three lines of defense operate in a co-ordinated manner with the common objective to support the organization in achievement of its objectives and effective risk management.
• First line (business functions) acts as the primary risk owner and manages the risks as perthedefinedpolicies.
• Second line (monitoring & oversight functions) monitors risks & controls, legal compliance and enterprise risk management.
• Third line (Independent assurance/ internal audit) has an independent reporting to the governing body and acts independently from firstandsecondlineofdefense.Riskbased internal audit plan is developed and approved by the governing body / Audit Committee.
The company has an established internal financialcontrol(IFC)frameworkwithperiodicmonitoring of effectiveness of the controls.
There is a legal compliance framework whereby compliancetasksareidentifiedandmappedtoowners and there is a mechanism to monitor changes in the compliance regulations.

6
BOARD OF DIRECTORS
Mr. Berjis DesaiChairman and Independent Director
Key attributes and skills:Legal, Finance, Corporate Governance
Mr. Shreekant BapatIndependent Director
Key attributes and skills:Human Resource, Law Enforcement, Administration, Governance
Mr. Palamadai JayakumarIndependent Director
Key attributes and skills:Banking, Leadership, Corporate Governance
Mr. Samonnoi BanerjeeNon-Executive Director
Key attributes and skills:Investment banking, Finance
Mr. Vijay GokhaleIndependent Director
Key attributes and skills:Diplomacy, Governance
Dr. Vidya YeravdekarIndependent Director
Key attributes and skills:Education, Administration, Legal
Dr. Shailesh AyyangarNon-Executive Director
Key attributes and skills:Pharma Industry Veteran, Leadership, Strategy
Mr. Satish MehtaExecutive Director
Key attributes and skills:Leadership, Business Development, R&D, Manufacturing, Corporate governance
Dr. Mukund GurjarExecutive Director
Key attributes and skills:Research & Development, Education
Mr. Sunil MehtaExecutive Director
Key attributes and skills:Finance, Administration
Mrs. Namita ThaparExecutive Director
Key attributes and skills:Marketing & Sales, Business Development, Leadership, Human Resources

11Board Size
9.5 YearsAverage Tenure -Independent Directors
61 YearsAverage Age
5Number of Board Meetings
98%Committee Attendance
100%Board Attendance
11Number of CommitteeMeetings
Audit CommitteeIndependence
IndependentDirectors 80%
ExecutiveDirectors 20%
IndependentDirectors 75%
ExecutiveDirectors 25%
Nomination & RemunerationCommittee Independence
IndependentDirectors 46%Executive
Directors 36%
Non-ExecutiveDirectors 18%
Board Independence
Men - 9
Women - 2
Gender Diversity
50 - 593
40 - 492
60 - 694
70+2
Age Diversity
Independent BoardChairman
Separate Role ofChairman and MD
BOARD DEMOGRAPHICS

8
SENIOR MANAGEMENT
Mr. Satish MehtaManaging Director, Chief Executive Officer
Key attributes and skills:Leadership, Business Development, R&D, Manufacturing Corporate Governance
Mrs. Namita ThaparExecutive Director,India Business
Key attributes and skills:Marketing & Sales, Business Development,Leadership, Human Resources
Mr. Samit MehtaPresident, Operations
Key attributes and skills:Manufacturing, Strategy, R&D, Finance
Mr. Vikas ThaparPresident, Corporate Development, Strategy & Finance
Key attributes and skills:Strategy, Business Development, Finance
Mr. Sanjay MehtaPresident, Commercial
Key attributes and skills:Business Development, Operations, Finance
Mr. Sunil MehtaExecutive Director,Projects
Key attributes and skills:Finance, Administration
Dr. Mukund GurjarChief Scientific Officer and Executive Director
Key attributes and skills:Research & Development, Education
Dr. Sanjay SinghChief Executive Officer,Gennova Biopharmaceuticals Ltd.
Key attributes and skills:R&D, Leadership
Mr. Prakash GuhaManaging Director, Zuventus Healthcare Ltd.
Key attributes and skills:Sales & Marketing, Leadership
Mr. Tajuddin ShaikhChief Financial Officer
Key attributes and skills:Finance, Accounting
Dr. Deepak GondaliyaPresident, International Manufacturing
Key attributes and skills:R&D, Manufacturing
9
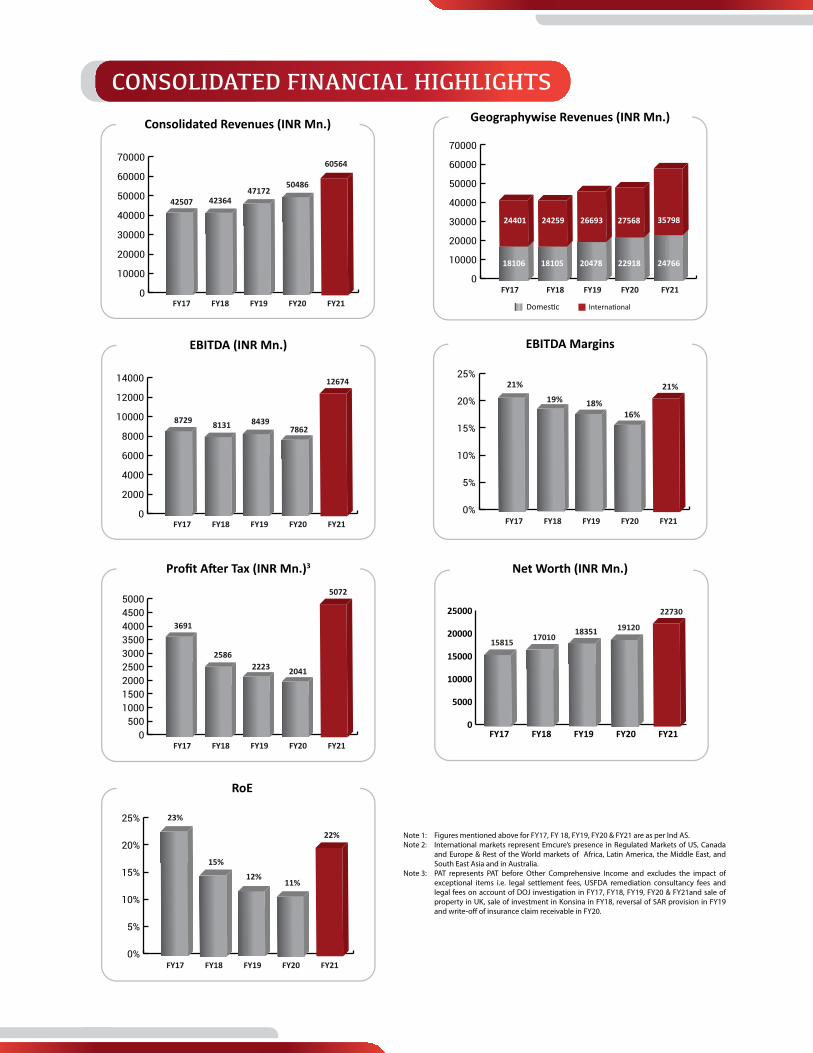
Note 1: Figures mentioned above for FY17, FY 18, FY19, FY20 & FY21 are as per Ind AS.Note 2: International markets represent Emcure’s presence in Regulated Markets of US, Canada and Europe & Rest of the World markets of Africa, Latin America, the Middle East, and South East Asia and in Australia.Note 3: PAT represents PAT before Other Comprehensive Income and excludes the impact of exceptional items i.e. legal settlement fees, USFDA remediation consultancy fees and legal fees on account of DOJ investigation in FY17, FY18, FY19, FY20 & FY21and sale of property in UK, sale of investment in Konsina in FY18, reversal of SAR provision in FY19 and write-o� of insurance claim receivable in FY20.
CONSOLIDATED FINANCIAL HIGHLIGHTS
0
10000
20000
30000
40000
50000
60000
70000
0
2000
4000
6000
8000
10000
12000
14000
0
5000
10000
15000
20000
25000
FY21FY20FY19FY18FY17
0%
5%
10%
15%
20%
25%
0500
100015002000250030003500400045005000
5072
0%
5%
10%
15%
20%
25%
22%
0
10000
20000
30000
40000
50000
60000
70000
FY21FY20FY19FY18FY17
27568 35798
24766
18351

BOARD OF DIRECTORSMr. Humayun DhanrajgirChairman, Independent Director(Resigned w.e.f. April 16, 2021) Mr. Berjis Desai Independent Director - Chairman
Mr. Satish Mehta Managing Director & CEO
Mr. Sunil Mehta Whole-time Director
Dr. Mukund Gurjar Whole-time Director
Mrs. Namita Thapar Whole-time Director
Mr. Shreekant Bapat Independent Director
Mr. P. S. JayakumarIndependent Director
Mr. Vijay GokhaleIndependent Director
Dr. Vidya YeravdekarIndependent Director
Mr. Samonnoi Banerjee Non-Executive, Non-Independent Director (Nominee of BC Investment IV Ltd)
Dr. Shailesh AyyangarNon-Executive, Non-Independent Director
CHIEF FINANCIAL OFFICERMr. Tajuddin Shaikh
COMPANY SECRETARYMr. Jayant Prakash
AUDITORSM/s BSR & Co. LLP, Chartered Accountants
COMPANY INFORMATION
BANKERSAxis Bank LimitedBank of BarodaBank of MaharashtraState Bank of IndiaShinhan BankIndia Exim Bank
REGISTERED OFFICEEmcure House, T-184, M.I.D.C.,Bhosari, Pune - 411 026.Tele: 020-35010000 Fax: 020-30610111Mail us at: [email protected] Website : https://emcure.com
CORPORATE OFFICEPlot P-2, I T - B T Park, M.I.D.C,Hinjawadi, Pune - 411 057.Tel: 020-39821300Fax: 020-39821400

11
COMPANY OVERVIEW
FINANCIAL STATEMENTS
Message from Chairman 01
CEO Speaks 03
Management Discussion and Analysis 05
Research and Development 13
Manufacturing 17
Covid Response 20
Human Resources 22
Corporate Social Responsibility 25
Risks 27
Board's Report 29
Corporate Governance Report 47
Independent Auditor's Report 51
Standalone Financial Statements 56
Independent Auditor's Report-Consolidated 117
Consolidated Financial Statements 121
CONTENTS

1
MESSAGE FROM CHAIRMAN
Dear Stakeholders,
As Chairman of the Board, it is my pleasure to update you on key priorities and activities of the Board during the year carried out as part of our fiduciary responsibilities towards you, our stakeholders.
Your Board met 5 times during the last year with 100% attendance. All Board members actively participated in the Board agenda and deliberations.
Key insights from Board driven activities during the year :
• Strengthening Board size and diversity:
• Appointment of additional Independent Directors
• Appointment of Non-Executive Non-Independent Director having 35 years of pharmaceutical experience
• Demerger of USA business to enhance shareholder value through better capital allocation and focus on high return businesses
• Formal earmarking of key strategic responsibilities to executives
• Support communities through our ongoing CSR activities
Corporate Governance
As global economies continue to grapple with challenges and uncertainties of the Covid-19 pandemic, the rules of good corporate governance hold even more importance than ever before. Effectiveness of corporate governance systems and policies will define how businesses survive the impact of the pandemic and pave the way to ensure financial viability and seamless continuity of operations.
The Board continues to take various measures from time to time to endure and further enhance governance practices. Recently, your company’s Board has laid the foundation to accelerate integration of environmental, social and governance (ESG) factors into decision making in order to address wider societal issues and the need for strong corporate governance. The leadership at Emcure has been proactive in adapting to improved ways of working through limited
2
physical interactions and minimal loss of productivity by embracing technology and digital solutions.
I take this opportunity to highlight to you some of our key governance indicators symbolizing our continued commitment towards better governance:
a. Separation in role of Board Chairman and Managing Director
b. Independent Director as Board Chairman
c. Adequate representation of Independent Directors in the Board
d. Board diversity - gender, age and skillset diversity
e. More than 75% Independent Directors representation in Audit Committee and Nomination & Remuneration Committee
f. Separate annual meeting of Independent Directors
g. Emphasis on governance through voluntary filing of corporate governance reports for holding and subsidiary companies
As Chairman of the Board, I want to emphasize about the Board’s collective commitment towards highest standards of governance, transparency and fairness in dealing with all stakeholders.
We value your feedback and encourage you to share any suggestions you may have during the upcoming annual general meeting.
On behalf of Emcure’s Board of Directors, I take this opportunity to thank you for your continued faith in the company and the Board. We are dedicated to work to represent the interest of all stakeholders.
Sincerely,
Berjis DesaiChairman
MESSAGE FROM CHAIRMAN
ANNUAL REPORT 2020-21 : MESSAGE FROM CHAIRMAN
33
CEO SPEAKS
Dear Stakeholders of Emcure,
I hope everyone is safe and taking the right precautions as we deal with the ongoing pandemic. Last year has been challenging for everyone. We lost some of our dear colleagues and I express my deep sympathies to their families.
Over the last year, Emcure group has been at the forefront of supporting healthcare professionals, patients and our community, in the ongoing pandemic. We have worked on multiple fronts – providing aid to migrant workers, relief work in our community and support to doctors.
Science and Innovation have been Emcure’s key pillars and we have worked tirelessly to ensure we provide much needed medicines for patient care. Our ability to quickly scale up and successfully execute has allowed us to increase output of much needed medicines like Vitamins, LMW-Heparin, Ivermectin, Zinc and Anti-infectives in a short period of time.
In FY21 despite numerous challenges, Emcure achieved multiple milestones. Our resilient nature enabled us to quickly adapt to challenges, innovate, scale-up and successfully execute! In terms of overall performance, our revenue for the year grew at 20% over previous year. In addition to strong topline growth, our focus on profitability led to EBITDA margins improving to 21%. Our Profit after tax increased 149% over the previous year. We have outperformed most of our peers in nearly all our key markets. However, I have been most proud about helping our country in the time of crisis.
The domestic business posted solid growth with revenues up 8% from the previous year, growing 4x of the industry growth, despite the impact of country wide lockdown in early part of the year. According to AIOCD-AWACS, during FY21, Emcure gained 1 rank to become the 12th largest pharma company by sales in India. We continue to focus on data analytics and sales force effectiveness to bring in continued cost and productivity gains year over year.
Our International Business also delivered strong performance and grew by 30% YoY driven by the RoW markets which grew by a stupendous 98%. Canada grew 26% YoY and we are now one of the largest generic companies in Canada. Europe business grew a strong 22% despite the COVID-19 impact on our hospital products.
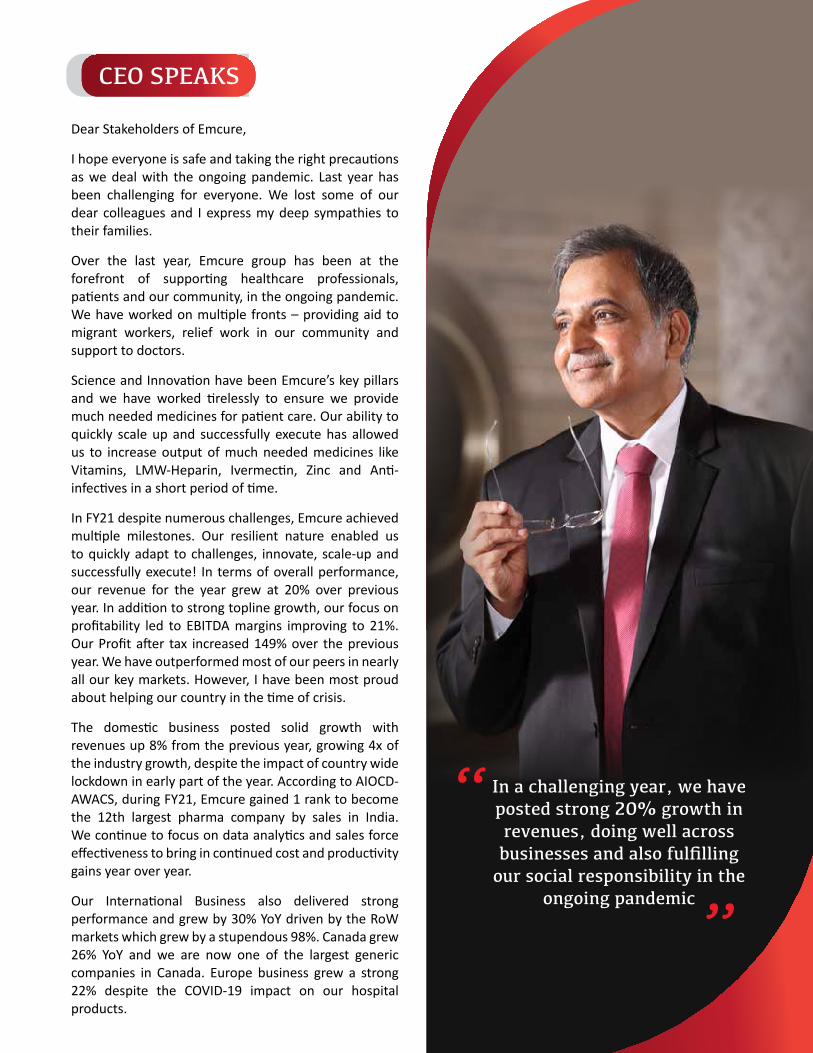
In a challenging year, we have posted strong 20% growth in revenues, doing well across businesses and also fulfilling
our social responsibility in the ongoing pandemic
“
“
4
The key pillar of Emcure’s success is its strong R&D team led by industry stalwarts like Dr. Mukund Gurjar, Dr. Sanjay Singh & Dr. Deepak Gondaliya. The team has worked tirelessly on multiple projects to combat COVID and to ensure timely supply of life-saving medicine. Along with this we continue to work on developing a diversified and differentiated portfolio across our key focus areas to drive our future growth. We successfully synthesized and commercialized Dydrogesterone in the Indian market. We recently got approval and are ramping-up supplies of Liposomal Amphotericin B, used for the treatment of Mucormycosis . In addition, we are developing Aviptadil and have also in-licensed Molnupiravir, a drug that has shown potential to treat moderate COVID-19.
Our standout achievement during the year has been the development of India’s first indigenous mRNA based COVID-19 vaccine. Globally, mRNA based vaccines have shown to be the most efficacious against COVID-19. We are progressing well with the vaccine trials and we hope to bring this vaccine to the patients and aid inoculation efforts around the globe. The vaccine development has been supported by the Department of BioTechnology.
A special mention to our HR team who have ensured uninterrupted production even during lock down while safeguardeding the health and wellbeing of our workers during these challenging times.
Cumulative data and successive waves show that the challenges are still not over. I am extremely satisfied with the in-built strength of our resilient infrastructure and supply chain. Our innovation focused R&D, global scale and strong execution position us well to overcome any future challenges. Emcure has emerged stronger over the past year and I am confident of achieving even bigger milestones over the coming years. We achieved a major milestone in April 2021 by becoming a Top 10 pharma company in India according to AIOC-AWACS.
Most importantly, we will continue to serve our country.
We thank you for your continued support over all these years and for helping us deliver value. Thank you for placing your trust and faith in us.
Sincerely,
Satish MehtaManaging Director & CEO
CEO SPEAKS
ANNUAL REPORT 2020-21 : CEO SPEAKS

5
MANAGEMENT DISCUSSION & ANALYSIS
GLOBAL PHARMA LANDSCAPE
The global medicine market stood at USD 1.26 trillion in 2020 and is expected to grow at 3–6% CAGR over next 5 years reaching about USD 1.6 trillion in total market size in 2025. In addition, spending on COVID-19 vaccines over next 5 years is projected to be USD 157 billion. Medicine spending growth will be driven by multiple factors including patent expiries, launches of new medicines as well as changing volume demand particularly in pharmerging and lower income countries.
US remains the largest market with sales of USD 528bn in 2020 followed by EU and Japan. Growth in the developed markets is expected to be slower going forward at 1.5-4.5% led by patent expiry. Pharmerging markets will continue to see strong growth and are expected to continue growing between 7-10% over the next 5 years. Among the pharmerging, Russia, India and Brazil are expected to be the fastest growing markets.
A range of changes in the use of medicines has been prompted by COVID-19, with demand for new vaccines and therapeutics as well as shifts in demand for existing therapies and changes in patient behaviors.
Generic pharma companies are likely to continue focus on development of specialty medicines or complex generics to augment their portfolio and increase share in world exports. The growth will be led by growth in sales of cardiac medications and anti-diabetes medications, an indicator of the growing burden of chronic lifestyle diseases.
IPM
The Indian Pharmaceuticals Markets is one of the fastest growing industries and ranks 3rd worldwide for pharmaceutical production by volume and 14th by value and is expected to reach USD 130 billion by 2030(IBEF). Although COVID had disrupted the industry initially, the IPM bounced back strongly to grow ~2% in FY21.
ANNUAL REPORT 2020-21 : MANAGEMENT DISCUSSION & ANALYSIS

6
390428
498560
601649
726799
831888
963964 994
1063 10731116
11351205
12501265
20012002
20032004
20052006
20072008
20092010
20112012
20132014
20152016
20172018
20192020
1500
1250
1000
750
500
250
0
Reve
nue
in b
illio
n U
.S. d
olla
rs
Global Pharma Industry Revenue
5-yearCAGRs
Overall6.0%
6.0%11.7%4.8%
5-yearCAGRs
Overall4.6%
3.9%7.4%3.8%
5-yearCAGRs
Overall3.6%
3.6%7.10%2.5%
1800
1600
1400
1200
1000
800
600
400
200
02010 2011 2012 2013 2014 2015 2016 2017 2018 2019 2020 2021 2022 2023 2024 2025
Developed Pharmerging Lower income
Global Medicine Market Size and Growth 2010-2025, Const US$Bn
The Global Medicine Market - Using invoice price levels - is expected to grow at 3-6% CAGR through 2025, to about $1.6 trillion
Forecast
FY21 was impacted in the initial months due to closure of smaller clinics and hospital OPDs, postponement of surgeries which resulted in slower sales of drugs in domestic market. Some support was provided by increase in sales of chronic therapies like Cardiac and anti-diabetes. However majority of restrictions were lifted in the second half of the FY21, which aided the growth of the sector with more frequent visits to clinics and availing of healthcare services.
Growth is expected to pick up as things return to normalcy gradually and FY22 revenue growth will be led by Covid-19 vaccines. Indian domestic formulations market (consumption) grew at a healthy rate at 8.6% CAGR over the last five years from fiscal 2016 to fiscal 2020. Domestic Formulations segment is expected to grow at ~9-11% CAGR over the next five years from fiscal 2020 to fiscal 2026 driven by strong demand in generic segment. The government of India plans to increase its healthcare spending to 2.5-3.0% of GDP by 2025 from 1% currently.
ANNUAL REPORT 2020-21 : MANAGEMENT DISCUSSION & ANALYSIS
MANAGEMENT DISCUSSION & ANALYSIS
(Source: STATISTA)
(Source: IQVIA)
7
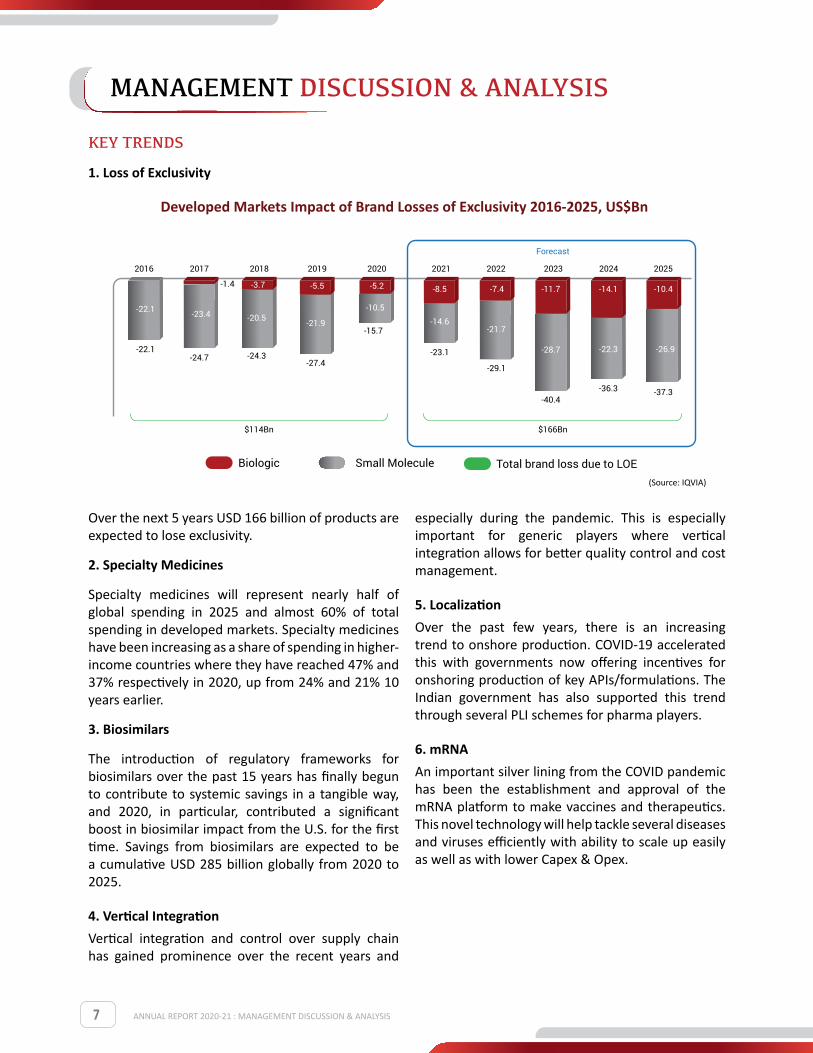
Developed Markets Impact of Brand Losses of Exclusivity 2016-2025, US$Bn
Biologic Small Molecule Total brand loss due to LOE
2016 2017 2018 2019 2020 2021 2022 2023 2024 2025
-22.1
-22.1
-24.7
-23.4
-1.4
-24.3
-20.5
-3.7
-27.4
-21.9
-5.5
-15.7
-10.5
-5.2
-23.1
-14.6
-8.5
-29.1
-21.7
-28.7
-40.4-36.3
-22.3
-14.1
-37.3
-26.9
-10.4-7.4 -11.7
$114Bn $166Bn
Forecast
ANNUAL REPORT 2020-21 : MANAGEMENT DISCUSSION & ANALYSIS
MANAGEMENT DISCUSSION & ANALYSIS
KEY TRENDS
1. Loss of Exclusivity
Over the next 5 years USD 166 billion of products are expected to lose exclusivity.
2. Specialty Medicines
Specialty medicines will represent nearly half of global spending in 2025 and almost 60% of total spending in developed markets. Specialty medicines have been increasing as a share of spending in higher-income countries where they have reached 47% and 37% respectively in 2020, up from 24% and 21% 10 years earlier.
3. Biosimilars
The introduction of regulatory frameworks for biosimilars over the past 15 years has finally begun to contribute to systemic savings in a tangible way, and 2020, in particular, contributed a significant boost in biosimilar impact from the U.S. for the first time. Savings from biosimilars are expected to be a cumulative USD 285 billion globally from 2020 to 2025.
4. Vertical Integration Vertical integration and control over supply chain has gained prominence over the recent years and
especially during the pandemic. This is especially important for generic players where vertical integration allows for better quality control and cost management.
5. Localization Over the past few years, there is an increasing trend to onshore production. COVID-19 accelerated this with governments now offering incentives for onshoring production of key APIs/formulations. The Indian government has also supported this trend through several PLI schemes for pharma players.
6. mRNA An important silver lining from the COVID pandemic has been the establishment and approval of the mRNA platform to make vaccines and therapeutics. This novel technology will help tackle several diseases and viruses efficiently with ability to scale up easily as well as with lower Capex & Opex.
(Source: IQVIA)

8
OVERVIEW
Emcure Pharma
Emcure is an integrated global company, engaged in developing, manufacturing and marketing a broad range of pharmaceutical products across the globe. The Company has a presence in 70+ countries and sells its products in India, Canada, Europe and RoW markets including countries in Latin America, Asia Pacific region and Africa. We have 9,000 + employees with 400+ located outside India.
Emcure’s focus is on developing tech-driven differentiated products. Globally, we derive a majority of our revenues from sales of differentiated pharmaceutical products developed in-house or in-licensed by leveraging our relationships with multi-national pharmaceutical companies. Most of these are commercialized through our own marketing infrastructure across geographies.
To support the in-house product developments, Emcure has adopted principles of responsible business conduct through integration of measures across the manufacturing cycle in the areas of resources conservation, efficient utilization of raw materials and usage of less polluting substitutes along with compliance to statutory requirements.
In India we focus on chronic and sub-chronic therapies which contribute 64.75% of our domestic revenues as per AIOCD-AWACS. Through our portfolio of products, we operate in multiple therapeutic areas primarily gynecology, cardiac, dermatology, anti-infectives, anti- retrovirals, gastrointestinal, respiratory, oncology, cardiovascular, pain and vitamins.
BUSINESS PERFORMANCE
The consolidated revenue of the Company was Rs. 60,564 Mn in FY 21, posting a growth of 20% over previous year, primarily driven by growth in the Domestic and International markets especially RoW and Canada.
Domestic Business
Emcure’s India business continues to be the most important market for the company, constituting 41% of the turnover. Domestic business contributed Rs.24,766 mn to revenues, a growth of 8%. In terms of industry comparison, Emcure was ranked 12th in terms of sales in the domestic market [Source: AIOCD MAT Mar’2021]. As per AIOCD-AWACS against the industry growth of 2.1% Emcure grew at 8.5%, 4x the industry growth.
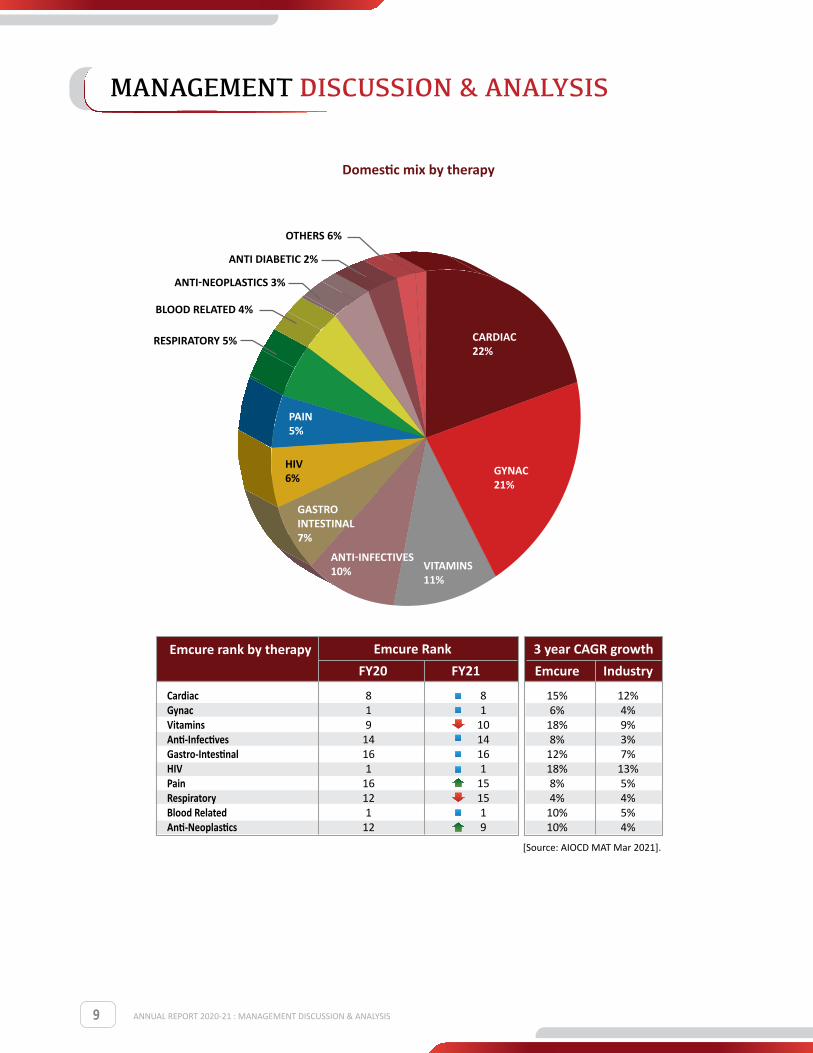
Emcure has a strong field force of 4,600+ professionals that engage with doctors across specialties which has lead Emcure to create its dominance in the Indian market. Emcure has established its presence in all the major therapeutic areas and created a niche position for itself in the domestic market. With our focus on building the width of portfolio, we have become one of the market leaders in many of the therapy areas that we operate in. We are ranked No.1 in HIV, Gynecology and Blood related, 8th in Cardiac, 10th in Vitamins/ Minerals/ Nutrients and 9th in Oncology. [Source: AIOCD MAT Mar 2021].
• During the year, Emcure has consolidated its presence by launching 13 new products and 6 Line Extensions primarily under the Cardiac, Gynecology, Diabetology & Anti- infectives, therapies.
• We launched Exafib (Rivaroxaban) used for a variety of Cardio indications including reducing risk of stroke and systematic embolism. It is now ranked 3rd amongst all Rivaroxaban brands
• We also launched Dydrofem (Dydrogesterone), a complex molecule developed in-house, further strengthening our Gynecology portfolio.
ANNUAL REPORT 2020-21 : MANAGEMENT DISCUSSION & ANALYSIS
MANAGEMENT DISCUSSION & ANALYSIS
9
Domestic mix by therapy
Emcure rank by therapyFY20 FY21
3 year CAGR growthEmcure Industry
CardiacGynacVitaminsAnti-InfectivesGastro-IntestinalHIVPainRespiratoryBlood RelatedAnti-Neoplastics
819141611612112
811014161151519
15%6%18%8%12%18%8%4%10%10%
12%4%9%3%7%13%5%4%5%4%
Emcure Rank
GYNAC21%
CARDIAC22%
VITAMINS11%
ANTI-INFECTIVES10%
GASTROINTESTINAL7%
RESPIRATORY 5%
PAIN5%
ANTI-NEOPLASTICS 3%
HIV6%
BLOOD RELATED 4%
OTHERS 6%
ANTI DIABETIC 2%
ANNUAL REPORT 2020-21 : MANAGEMENT DISCUSSION & ANALYSIS
MANAGEMENT DISCUSSION & ANALYSIS
[Source: AIOCD MAT Mar 2021].

10
BRAND BUILDING IN DOMESTIC MARKETS
Key brands
Pain and Analgesics
Neurology
IVF
Blood Related
Respiratory
Osteoporosis
Gynaecology
Oncology
Diabetology
HIV
Anti-Infectives
Vitamins, Mineral and NutrientsCardiology
Gastrointestinal
For FY21, Emcure had 7 brands in top 300 according to AIOCD. We continue to build our brands and make them leaders in their respective therapies.
ANNUAL REPORT 2020-21 : MANAGEMENT DISCUSSION & ANALYSIS
BRAND BUILDING IN DOMESTIC MARKETS

11
BRAND BUILDING IN DOMESTIC MARKETS
New brands
Cardiac
Gynaecological
Nephrology
Diabetology
HIV
Vitamins, Mineral and Nutrients
Oncology
Respiratory
Pain / Analgesics
Anti-Infectives
Emcure has launched several key molecules across therapy areas, making its portfolio more comprehensive and patient-centric.
BRAND BUILDING IN DOMESTIC MARKETS
ANNUAL REPORT 2020-21 : MANAGEMENT DISCUSSION & ANALYSIS
12
INTERNATIONAL
Europe
The Company’s business in Europe posted revenues of Rs. 7,383 Mn constituting 12% of global revenues. The business witnessed impressive 22% growth over previous year. This was despite the drop in volumes for our hospital related products due to COVID. The growth was driven by growth in the base business, new launches and increased penetration in new geographies. We also saw some benefit from increased sales of COVID-19 related products.
We continue to proliferate our product presence across European markets through new product registrations and extending existing product dossiers across Europe through MRP/DCP process. During FY21, 3 EU ASMF, 2 EU CEPs applications were filed across key EU markets.
Canada
The Canadian business posted a 26% growth over previous year with a revenue of Rs. 6,219 mn driven by increase in market penetration, consolidation of base business and new product launches. The business is poised for growth with a robust pipeline of Emcure and 3rd party products – we have filed 140 ANDS in Canada of which 110 are approved and 85 launched. During FY21, 1 DMF was filed in Canada.
US
Revenue from the US business was INR 10,904 mn representing 18% of global sales. Revenue remained stable as compared to previous year primarily due to 1) COVID-19 impact for our key hospital products which saw decline due to lower patient footfall, 2) continuing pricing pressures in our portfolio and increased competition in key brands and 3) Delay in certain key launches.
Our R&D team continued to file new product and API applications - 2 ANDA products applications (1 injectable and 1 solid oral product) and 2 US DMF applications were made during FY21
Rest of the World (RoW):
RoW markets saw spectacular growth for Emcure growing 98% over the previous year. Revenue from RoW markets was Rs. 11,292 Mn in FY21 representing 19% of global revenues. The key factors were our differentiated product portfolio and strong supply chain. These allowed us to maintain our supplies, launch new products and gain market share in the last year. We also were able to cater to increase demand for key medicine and address COVID related drug shortages in certain markets. Our key markets in the RoW markets are Russia, Peru Brazil and Mexico.
MANAGEMENT DISCUSSION & ANALYSIS
ANNUAL REPORT 2020-21 : MANAGEMENT DISCUSSION & ANALYSIS

13
RESEARCH & DEVELOPMENT
Emcure’s strongest asset has been its Research & Development department which has consistently and expeditiously delivered innovative solutions. This was reinforced over the past year when our highly qualified scientists developed multiple COVID care and post-COVID care products including Amphotericin B, Zinc and Vitamins. The key highlight was the development of India’s first indigenous mRNA vaccine which is now under clinical trials.
Our R&D efforts are focused towards (i) complex molecules, including highly complex APIs that require multi-step transformation, (ii) differentiated pharmaceutical formulations, in multiple dosage forms and novel drug delivery systems, which are capable of greater efficacy and better patient compliance, (iii) continuous product and process improvements to achieve better quality and productivity, (iv) niche biosimilar formulations, and (v) our mRNA platform.
We continue to make substantial investments in tech-driven projects to build a differentiated portfolio in high-growth therapeutic areas such as neurology,
oncology, cardiology, pain management and analgesics, gynecology, blood related, respiratory and HIV. We are also working on niche areas with high entry barriers such as complex iron supplements, cytotoxic and sustained release preparations and complex injectables like lyophilized, nano-particles, liposomal form, in-situ suspension, depot formulation, micro-sponges and lipid formulation. . Our new R&D focus areas include flow chemistry, antibody drug conjugate and photon chemistry.Our R&D team has been working on incorporating less-polluting alternatives in our manufacturing processes with the goal of avoiding the use of chlorinated solvents to the extent possible. We have undertaken projects to explore the possibilities where maximum outputs can be achieved with minimal solvent quantity by implementing technologies which are at the forefront of engineering such as evaluating process feasibility under flow-chemistry conditions. This enables a quantum reduction in solvent usage when compared to batch processes. In addition, the solvents used are recycled and we have achieved a recovery rate equivalent to 80% of the actual quantities used. We have upgraded our R&D processes to minimize waste
ANNUAL REPORT 2020-21 : RESEARCH AND DEVELOPMENT
14
generation through science-driven efforts.
The Research and Development team at Emcure comprises of nearly 500 highly qualified scientists, including 9 post doctorates, 44 PhD’s and 384 postgraduates. Emcure’s R&D activities are spread across its 5 dedicated facilities, located in Pune and Ahmedabad. Of the 5 R&D centers, one is focused towards API research, three towards Formulations research and one towards Biotechnology research.
Emcure’s in-house regulatory affairs unit has significant expertise in filing product dossiers with regulators in the United States, the European Union, WHO-PQ and other jurisdictions and is capable of submitting DMFs, ANDAs and Marketing Authorizations in common technical document (“CTD”) format.
SOME OF THE KEY PRODUCT DEVELOPMENTS IN FY21 WERE
• Liposomal Amphotericin B : Emcure successfully developed and has recently received approval to manufacture Liposomal Amphotericin B which is used to treat Mucormycosis (Black Fungus) – a post COVID complication.
• Molnupiravir : Emcure has in-licensed Molnupiravir to manufacture & sell in 104 countries including India to treat COVID-19. Molnupiravir is under CT as a treatment for moderate COVID-19.
• Aviptadil : Emcure has developed and manufactured the API and the drug product of Aviptadil for India market. The clinical trials are in progress to evaluate efficacy of Aviptadil in severe COVID-19 patients with respiratory failure.
• Dydrogesterone : Emcure has developed expertise to deliver Dydrogesterone via photochemical transformations. Manufacturing of Dydrogesterone needed customized reactor design with intricate photochemical reactor design. The technology has been mastered at multi Kilogram scale with improved efficiency, productivity and reduced cost of raw materials.
• Exafib : Exafib: Exafib (Rivaroxaban) is a novel
oral anticoagulant (NOAC), which is being used for variety of cardio indications; to reduce risk of stroke and systemic embolism in nonvalvular atrial fibrillation, treatment of pulmonary embolism, deep vein thrombosis and coronary artery disease. At Emcure, Exafib is developed in house and is bio-equivalent at par with the innovator.
PATENTS AND ANDA FILING UPDATES
Emcure made 2 ANDA product applications (including 1 injectable and 1 solid oral products) in FY21, taking the total number of ANDA filing as on March 31st, 2021 to 299 (including 28 Para-IV’s). Of these, 185 products have been approved, and 3 approvals were received in FY21. Among them, 06 products are tentatively approved as on 31st March 2021. Total of 5 First to File products have been filed till date.
2 US DMF applications were made in FY21, taking the total number of DMF filings to 117 (98 DMFs Active). Apart from this Emcure has filed 03 EU ASMFs, 02 CEPs, 01 DMF in Canada, 01 DMF in Australia, 01 DMF in New Zealand, 02 Serbia, 04 Swiss, 01 DMF in Brazil, 01 Japan & 02 China (totally 20).
As on 31st March 2021, we own 157 patents and have 101 pending patent applications
API RESEARCH
API research at Emcure focuses on synthesizing molecules that match the innovator product in the most robust and cost-effective manner. The pillars that form the base for API research in Emcure are:
• Chiral Chemistry : Emcure is recognized as the pioneer in chiral chemistry. it has developed and marketed 11 chiral molecules which have demonstrated greater efficacy, safety and require lesser dosage than their non-chiral counterparts For e.g. S(-)Amlodipine Besilate, S (-)Metoprolol Succinate, Dexrabeprazole Sodium, S(-) Etodolac, Dexketoprofen Trometamol.
• Polymer Based Chemistry : Emcure has commercialized in India, APIs like Sevelamer Hydrochloride and Sevelamer Carbonate that are based on Polymer based chemistry.
ANNUAL REPORT 2020-21 : RESEARCH AND DEVELOPMENT
RESEARCH & DEVELOPMENT
15
• Peptide Chemistry : Our focus of research in this area involves both solid phase and solution phase peptide synthesis chemistry. The most critical segment of peptide research is the high end separation of peptides in order to ensure their structure, purity and potency. Emcure has perfected the science of separation of peptides at manufacturing scale by implementing state-of art technology along with the development of high-end skill set. The peptide chemistry has been demonstrated in Atosiban Acetate. It is used intravenously to halt premature labor.
• Complex Generic APIs : These products, owing to their complex structural parameters, require unique process maneuvering. Also, the characterization and bioequivalence studies, as per the USFDA guidelines, require sophisticated spectroscopic and biochemical analysis. All these requirements are built in- house to ensure safety and efficacy of complex generic APIs like Trabectedin, Molnupiravir, Aviptadil, Ferumoxytol & Cabotegravir. We have already developed and commercialized some of these products, such as iron preparations and low molecular weight heparin, in the Domestic Market. A novel process for Treprostinil containing 5 chiral centers has been commercialized. The novelty resides in asymmetric Pauson-khand reaction.
• Onco products : Emcure has always been a market leader in onco-products for both domestic market as well as regulated market. Keeping that commitment to the customers we have been able to develop extremely complex APIs entailing multi-step transformation and concomitant generation of chiral centers. The onco product Eribulin involving 45 steps synthesis has been successful commercial in Indian market. Incidentally ‘EMBREMMA’ is 1st generic developed by Emcure in the world.
• Photo-Chemistry : Emcure has developed expertise to deliver complex generics via photochemical transformations. Delivery of these products needs customized reactor design which with intricate photochemical reactor design. These products can only be
delivered with mellifluous integration of state-of-art engineering and complex chemistry which Emcure has mastered. Our R&D team has successfully synthesized Dydrogesterone which has been commercialized in Indian market.
FORMULATIONS RESEARCH
Emcure’s formulation research is centered towards developing multiple dosage forms and novel drug delivery systems, capable of greater efficacy and better patient compliance. Ongoing product research is focused on dosage forms including:
• Conventional solid dosage forms such as immediate release tablets/capsules, effervescent tablets, orally disintegrating tablets/flash tablets;
• Modified release dosage forms like delayed release tablets/capsules, MUPS, tablet in tablet, Pulsatile drug delivery system, osmotic drug delivery system, Extended/Controlled Release dosage forms, Time release dosage forms;
• Conventional Parental preparation including sterile solutions and suspension; oncology and non-oncology products;
• Lyophilized oncology and non-oncology products;
• Novel injectable products (Nano-suspension and nano-emulsion injectables, liposomal drug delivery system, in-situ suspension, depot formulation, micro-sponges, lipid formulation and Long acting (Microspheres) injection);
• Oral liquids (solutions, suspensions);
• Transdermal Drug delivery system (Adhesive matrix, Hydrogels, Reservoir Drug delivery system);
• Respiratory products (inhalers).
BIOTECH RESEARCH
Emcure’s state of art Biotech R&D subsidiary
ANNUAL REPORT 2020-21 : RESEARCH AND DEVELOPMENT
RESEARCH & DEVELOPMENT

16
Gennova is involved in the area of biologics and vaccines. Gennova’s R&D unit is constantly engaged in building next-gen platform to produce latest biotech products which have the potential to reach globally. A summary of the key highlights of the past year is described below.
Vaccines :
• Gennova has made a novel mRNA-based vaccine candidate, HGCO19 using its in-house developed platform becoming the first company in India to develop an mRNA vaccine. HGCO19 has already demonstrated safety, immunogenicity, neutralization antibody activity in the rodent and non-human primate models. Gennova has initiated the process to enroll healthy volunteers for the Phase I clinical trials. Emcure plans to continue with the clinical trials & hopefully launch the product in the near future.
Therapeutic Proteins :
• Gennova has started working on the development of recombinant asparaginase and its pegylated version for the treatment of acute lymphoblastic leukemia (ALL), a rare form of cancer in children. This development would address supply chain issues and quality issues surrounding native asparaginase. In FY-21, the process development to produce recombinant asparaginase and recombinant pegaspargase had been accomplished. Preclinical toxicity studies have been initiated for both the products, and the clinical studies are expected to begin in FY-22.
• Gennova has successfully developed an efficient process for Bevacizumab and has completed the preclinical studies, submitted the results to the RCGM, and got approval. Gennova plans to initiate CT in FY-22
New areas of focus :
• Flow chemistry : The flow chemistry process enhances the rate of reaction by 1,000 times, giving rise to better yields, selectivity and continuous flow. The time in which reaction occurs in seconds or minutes, and the impurity formation is much lesser than the conventional batch process. Our R&D team is working on this technology to provide better quality drugs, with better yields and at affordable costs.
• Antibody drug conjugate : An antibody drug conjugate involves coupling an anticancer drug to an antibody, where the latter specifically targets cancer cells. The science involves the understanding of both chemistry and biology at high levels, in which we have expertise.
ANNUAL REPORT 2020-21 : RESEARCH AND DEVELOPMENT
RESEARCH & DEVELOPMENT

17
MANUFACTURING
Emcure’s manufacturing operations are spread across 14 manufacturing facilities across India. We continue to develop and build on our expertise in developing complex active ingredients, product development skills, keen understanding of regulations and intellectual property rights, as well as our integrated supply chain, improving our productivity and working towards cost optimization.
Our growth strategy is scripted on Leadership in defined spaces, Operational excellence and Patient- centric product innovation in line with our motto of “Success through Innovation”. In FY21, we were able to see the strength of our Manufacturing capabilities as we were able to scale up the production of essential medicines and also deal with the Supply chain Disruptions during the lockdown.
We also added seasoned industry professionals to drive quality control and assurance globally. Our Sales and Operations Planning process which had been implemented previously continues to pay dividend improving key performance indicators across the enterprise including customer service,
inventory management, manufacturing efficiency and new product time to market. Some of the key highlights were.
• Formation of designated ‘Investigation management’ teams within all sites to better identify, evaluate and address manufacturing batch processing failures
• Site specific compliance teams under leadership of corporate quality to ensure day to day compliance and controls on the process and procedure
• Improvement of site leadership organizations by eliminating layers of hierarchy across sites and increasing shop floor supervision and leadership engagement at the appropriate levels.
We remain committed and steadfast in our focus to maintain high quality standards and to streamline manufacturing procedures to ensure compliance with increasing regulatory requirements. An independent Corporate Quality, Regulatory and
ANNUAL REPORT 2020-21 : MANUFACTURING

18
Compliance team, monitors and regulates all activities related to quality, compliance, health and safety at our manufacturing facilities, through timely reviews and audits. We continue to invest in improvement of manufacturing facilities:
• Undertaken implementation of measures such as installation of rainwater harvesting and Effluent Treatment systems in all Plants along with integration of concept of Zero Liquid Discharge (ZLD) to conserve water and ensure efficient utilization.
• Initiated energy conservation thorough initiatives such as replacement of conventional lightening fixtures with LEDs and installation of alternative sources of energy such as Solar.
• To ensure resource conservation, measures such as solvent recovery along with recycling and repurposing were also undertaken.
• Process robustness programs were implemented for a wide range of products with the objective to increase in-process capability for consistent quality, maintenance of uninterrupted supply and reduction of costs
• The Hinjewadi Oral Solid Dose facility completed a robust inspection preparation program designed to assure the facility is ‘inspection ready’
During the year, our facilities were audited by several regulatory authorities through distant assessment and desktop audits.
• Hinjewadi site has been Inspected by Russian MOH and HALMED through desktop audit and approval received.
• Sanand (Injectables plant) was approved by Health Canada during the year and was able to get approvals for injectable products for Canada and commercial supply has been established.
• Follow up Desktop Audit for Sanand site through document request conducted by USFDA.
MANUFACTURING CAPABILITIES:
1. Solid Orals:
• To augment our footprint in PEPFAR and RoW markets, two manufacturing sites have been added in the state of Gujarat. These sites are being upgraded to meet global regulatory norms. New products for PEPFAR and RoW markets will be submitted from these two sites.
• We have taken various steps to enhance and improve our production capabilities:
o We have enhanced our capacity for Immunosuppressants by process optimization and synchronization of steps.
o Equipment utilization efficiencies improved significantly to maximize output.
2. Liquid Orals and Dry Syrup/Suspension
• We have dedicated liquid manufacturing line at two sites
• Our production capabilities include a dedicated manufacturing block for beta lactam with capacity for dry syrup
• We also have a Cephalosporin block for Dry syrup at Jammu which has helped us to create significant space in this segment with continuous growth.
3. Injectables:
• Hinjewadi facility, robotic PFS line with isolator barrier operates at high through put helps us to supply significant quantities in India and other countries to meet increased demand in current pandemic situation.
• Sanand facility is equipped with state of art fully integrated manufacturing skid with high throughput for emulsion injectables
• Cephalosporin powder for injection at Jammu is continuously supporting our market presence.
ANNUAL REPORT 2020-21 : MANUFACTURING
MANUFACTURING
19
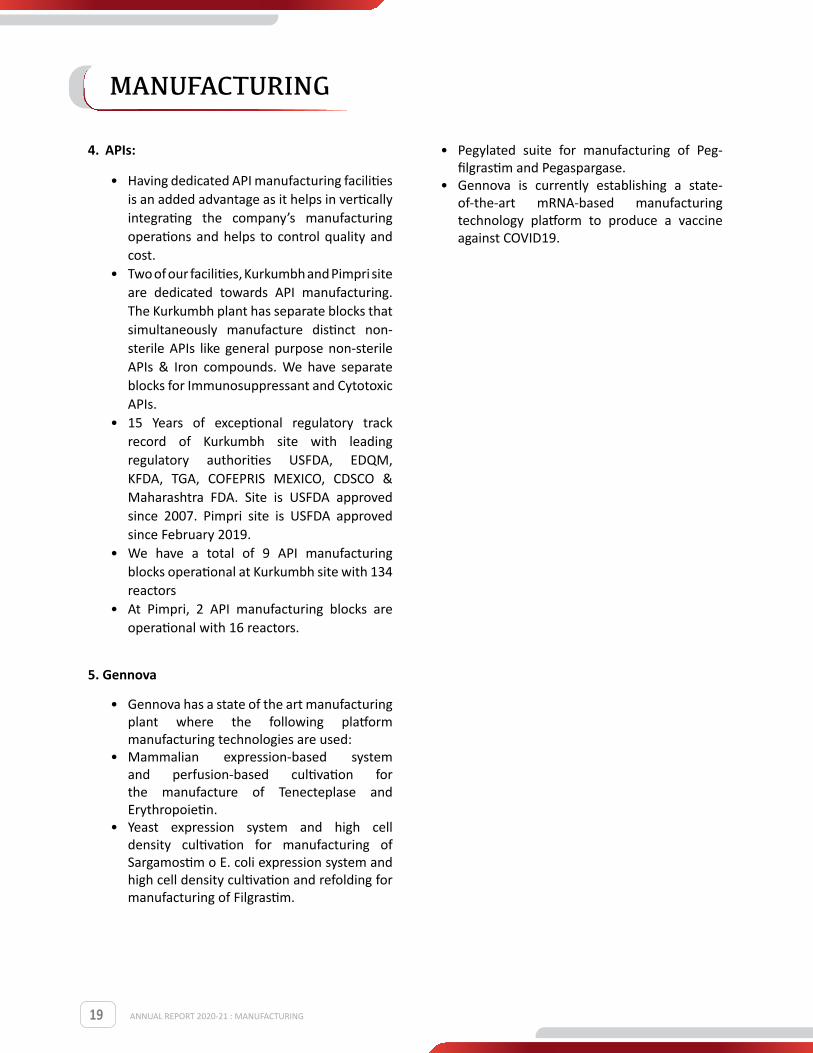
4. APIs:
• Having dedicated API manufacturing facilities is an added advantage as it helps in vertically integrating the company’s manufacturing operations and helps to control quality and cost.
• Two of our facilities, Kurkumbh and Pimpri site are dedicated towards API manufacturing. The Kurkumbh plant has separate blocks that simultaneously manufacture distinct non-sterile APIs like general purpose non-sterile APIs & Iron compounds. We have separate blocks for Immunosuppressant and Cytotoxic APIs.
• 15 Years of exceptional regulatory track record of Kurkumbh site with leading regulatory authorities USFDA, EDQM, KFDA, TGA, COFEPRIS MEXICO, CDSCO & Maharashtra FDA. Site is USFDA approved since 2007. Pimpri site is USFDA approved since February 2019.
• We have a total of 9 API manufacturing blocks operational at Kurkumbh site with 134 reactors
• At Pimpri, 2 API manufacturing blocks are operational with 16 reactors.
5. Gennova
• Gennova has a state of the art manufacturing plant where the following platform manufacturing technologies are used:
• Mammalian expression-based system and perfusion-based cultivation for the manufacture of Tenecteplase and Erythropoietin.
• Yeast expression system and high cell density cultivation for manufacturing of Sargamostim o E. coli expression system and high cell density cultivation and refolding for manufacturing of Filgrastim.
• Pegylated suite for manufacturing of Peg- filgrastim and Pegaspargase.
• Gennova is currently establishing a state- of-the-art mRNA-based manufacturing technology platform to produce a vaccine against COVID19.
ANNUAL REPORT 2020-21 : MANUFACTURING
MANUFACTURING

20
COVID RESPONSE
ANNUAL REPORT 2020-21 : COVID RESPONSE
COVID-19 crisis has posted multiple challenges especially for the pharma sector. At Emcure, we are committed to ensure dedicated support in the fight against COVID-19 and have responded to the challenges with nimbleness.
Emcure has been committed to not only make essential medications available, but also help the society in every step of the way without compromising the safety of our employees. Our focus has been to ensure smooth operation of supply chain, manufacturing, and distribution, to deliver life-saving medicines in a reduced turnaround time.
We rested our business response on this 5-fold strategy:
• Pro-active and preventative measures to curb spread
• Ensure adaptability & flexibility based on supply chain disruption
• Ensure ramp-up of productions of essential medicines
• Ensure timely distribution of medicine• Timely Development of new medication
These solution- driven action points have yielded many successful results in our journey of serving people:
• Our product portfolio which consists of numerous vitamins and anti-infectives are crucial to fight the virus and help develop immunity. Hence, we have been helping in patientcare by ramping up production of varied product offerings including Vitamins, Ivermectin, Anti-infectives and LMW-Heparin
• Emcure’s biotech subsidiary, Gennova Biopharmaceuticals has worked to develop India’s first mRNA vaccine against COVID-19. Vaccine HGC019, is currently under clinical trials.

21
We continue to introduce more products that assist in prevention and treatment against the COVID- 19 virus. We recently in-licensed Molnupiravir from Merck which is an experimental drug that is under clinical trial for treatment of COVID-19. We also launched Amphotericin B which is being used for treatment of Mucormycosis (Black Fungus), a post-COVID complication
Emcure has over the years been working on digitalization and this aided during the COVID-19 lockdown. We initiated digital marketing to prescribers. Digital marketing aided in increasing our reach to prescribers.
CARING FOR EMPLOYEE HEALTH & SAFETY
As one of the leading global healthcare company, Emcure Pharmaceuticals was focused on ensuring smooth and efficient functioning of all operations, amidst confirming to the lockdown directives by the government and challenges posed by the reduced workforce.
• Teams with non-manufacturing and non-R&D roles were encouraged to work-from-home. A smooth transition process was enabled by making all necessary equipment and software available to the employees at their home to ensure uninterrupted services
• For the workforce in manufacturing and research & development who continued their essential work in the pandemic, strict SOPs were implemented to safeguard them and their families from the virus.
• Advice and support not just related to COVID awareness but also mental well- being & financial management concerns, has been provided to all employees during these unprecedented times.
• Treatment support was provided to COVID-19 Patients. Further support has also been provided by increasing the insurance cover of our employees and their families.
While the world battles this pandemic and follows social distancing, the Emcure family is united to fight this together.
SERVING THE SOCIETY
Staying true to our purpose of being ‘dedicated to making Effective Medicine to Cure patients and enable healthier living’, Emcure has always ensured all its actions positively impact the society. Through the spread of the COVID- 19 pandemic, we have taken mindful steps to further strengthen this commitment.
• Increased education and awareness around COVID- 19 was extended to the larger public through informed trainings and expert sessions
• We worked to serve the migrant community during the difficult times of lockdown by providing them meals and transportation
• In an attempt to support our zealous and courageous frontline workers, Emcure has contributed essentials such as PPE kits, face masks and sanitizers to the doctors, healthcare workers, COVID- care centres and law enforcement officers
• While continuing our endeavour of delivering innovative pharmaceutical products, we have also contributed over 2.8 Million Hydroxychloroquine Tablets
We truly believe in the power of one and are motivated by the vision of we’re stronger together.
COVID RESPONSE
ANNUAL REPORT 2020-21 : COVID RESPONSE

22
HUMAN RESOURCE
With the changing circumstances, HR is no longer a support function rather it has become a strategic function. The true potential of HR was discovered last year as the COVID-19 pandemic impacted all of us and the business which called for agility from the management and well thought out action plans from HR. The health of our employees was our greatest priority but at the same time we had to ensure business continuity. We focused on building a safe and healthy environment for all our employees as per government advisory and guidance while keeping with the trend of forward-looking technology driven HR processes.
EMPLOYEE ENGAGEMENT
Employee welfare initiatives like Rangoli Competition, Engineering Day, Pharmacist Day, Traditional Day & Solids premiere League (Sports Activities Competition) were organized which received great participation from the employees.
On the occasion of ‘World Health Day’, we launched ‘Uncondition Yourself’ – an initiative dedicated towards women’s well-being. It seeks to identify and address the prevalent notions and misconceptions about women’s health and well-being from the cultural and social context in India. In the first phase, the campaign is aiming to put forth the challenges and connect with relevant influencers to initiate a step towards building a supportive ecosystem for women in the workforce. The campaign involves on-ground engagement and online activities at a national level. The campaign is an outcome of an online talk show ‘Uncondition yourself with Namita’ featuring candid heart to heart conversations on women’s health issues, giving accurate information and dispelling various myths.
EmZindagi is another employee engagement initiative, driven from the executive director’s office, that was started during the pandemic in 2020 when employees were working from home. It
ANNUAL REPORT 2020-21 : HUMAN RESOURCE

23
organized activities like dance competition, singing competition, video-making competition, quizzes, article writing competition etc. Many employees across Emcure participated enthusiastically and won some exciting prizes, it captured a large audience from all over the globe from Emcure.
TECH TRANSFORMATION
Our Digital Human Resource platform, Darwinbox had end to end employee lifecycle management incorporated increasing the features and benefits available to employees. This year we focused on the launch of EmVIEW consisting of various HR dashboards that helped business HR to draw insights and assist the Business Heads in better decision making.
Talent Profile of each employee available via EmVIEW was used extensively to gain insights during talent review discussions and to provide critical feedback to employees
During the pandemic when the country was in a lockdown, we helped employees create a virtual setup to work from home which increased the connectivity between Emcure employees across the globe. It ensured that the business continued without any hurdles.
LEARNING & DEVELOPMENT
In congruence to our Emcure’s Vision, Corporate Learning & Development (L&D) team at Emcure continues making focused attempt to enhance and sustain employees’ current & future performance by continuously developing both functional and behavioral competencies across businesses.
We continue to strive for Emcureans capability, skills and knowledge enhancement training initiatives in the area of business projects, technical, managerial, leadership & behavioural competency. In spite of last year’s COVID lockdown, HR – L&D team, kept going towards designing and delivering these trainings interventions covering employees across all grades, functions and locations of Emcure, Gennova, Tillomed, Marcan and Zuventus to enhance productivity and sustain employees’ professional development.
LEARNING INTERVENTIONS/PROGRAMS:
Our Learning programs cater to not only the job training but also aid in overall development and mental well-being. Highlights of some our key Learning Interventions/Programs are
a) Leadership : Leadership Transformation Program “Follow Me Through SOCH – Situations, Opportunities, Challenges & Horizon”, covering 170+ leaders of AGM and above grades across Emcure & Gennova for Manufacturing, R&D – PAN India
b) Work From Home : During lockdown, employees working from home pattern, we extended self-paced specific e-learning modules were provided to approx.650 employees for India & Overseas
c) Emerging Market : Two high impact interventions for showcasing leadership and effectiveness viz. iLEAD: Business Excellence Through Agile Leadership & Future First Leaders, covering around 65 Leaders/Managers in the Emerging Market team.
d) Manufacturing Team Training : For capability enhancement of Shift Supervisors / Managers / Incharges for holistic development of supervisors, an integrated intervention named iLEAP – i Learn, Engage, Act & Progress have been initiated, covering around 130 supervisors from both Hinjwadi & API Kurkumbh manufacturing locations. “Vikasachi Navi Dalne: Unnati Ani Pragati / Saksham Karyapadhatee” was conducted for permanent operators at all manufacturing plant of Pune covering more than 220+ employees.
e) Webinars : To keep the up thrust and momentum going during pandemic COVID lockdown all across, have launched two series viz. “Leader’s Mantra” series, covering around 870 employees as webinar series by eminent faculties/speakers from different industry verticals
f) Online Training : Online self-paced Post Development Centre (DC) Talent Engagement & Development initiative named as iDEV, covering around 200 employees from manufacturing and sales
ANNUAL REPORT 2020-21 : HUMAN RESOURCE
HUMAN RESOURCES
24ANNUAL REPORT 2020-21 : HUMAN RESOURCE
HUMAN RESOURCES
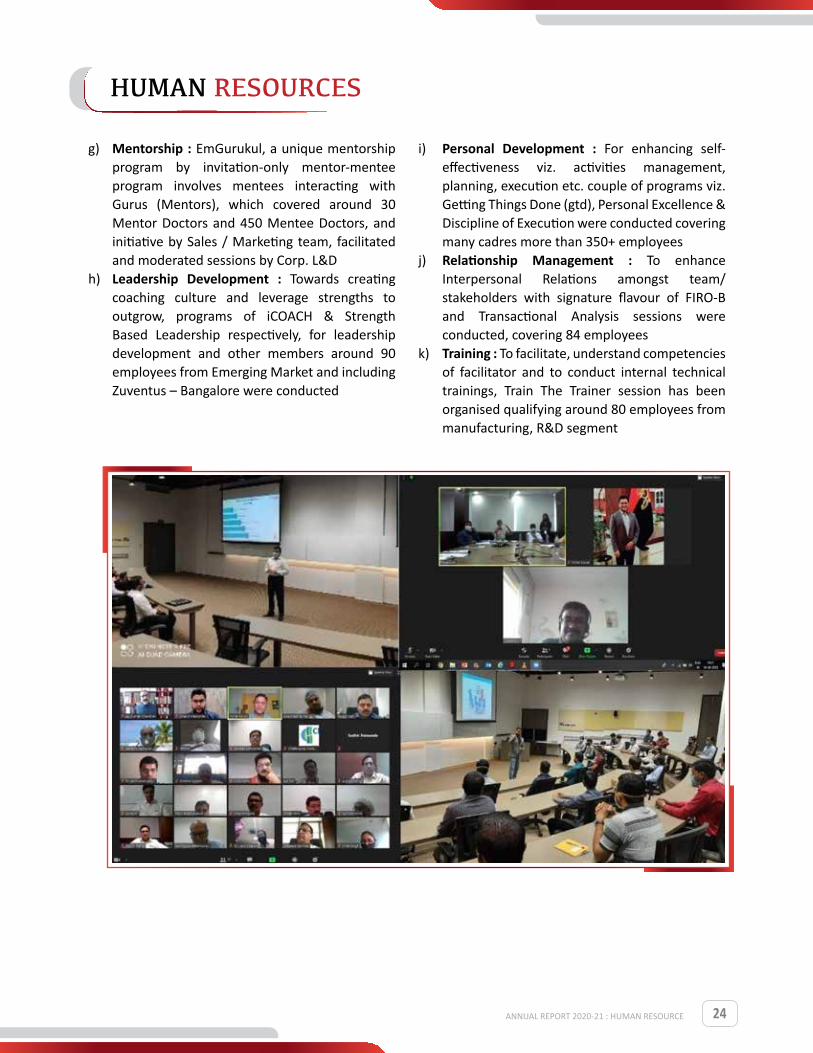
g) Mentorship : EmGurukul, a unique mentorship program by invitation-only mentor-mentee program involves mentees interacting with Gurus (Mentors), which covered around 30 Mentor Doctors and 450 Mentee Doctors, and initiative by Sales / Marketing team, facilitated and moderated sessions by Corp. L&D
h) Leadership Development : Towards creating coaching culture and leverage strengths to outgrow, programs of iCOACH & Strength Based Leadership respectively, for leadership development and other members around 90 employees from Emerging Market and including Zuventus – Bangalore were conducted
i) Personal Development : For enhancing self-effectiveness viz. activities management, planning, execution etc. couple of programs viz. Getting Things Done (gtd), Personal Excellence & Discipline of Execution were conducted covering many cadres more than 350+ employees
j) Relationship Management : To enhance Interpersonal Relations amongst team/stakeholders with signature flavour of FIRO-B and Transactional Analysis sessions were conducted, covering 84 employees
k) Training : To facilitate, understand competencies of facilitator and to conduct internal technical trainings, Train The Trainer session has been organised qualifying around 80 employees from manufacturing, R&D segment

25
CORPORATE SOCIAL RESPONSIBILITY
ANNUAL REPORT 2020-21 : CSR
Emcure believes that our success is defined by our society. Therefore, Emcure’s yearly goals remain incomplete till it has done its bit to contribute towards the social sector. We have been increasing our efforts consistently to contribute in the most meaningful way while empowering people with education, suitable living conditions and better health. In the year 20-21, we recognised the need of the hour and increased our contributions to help our society fight Covid-19. Some key contributions are:
a) PPE Kits, fly Mask and N-95 Mask donated to PCMC Commissioner, Sassoon Hospital and Pune District Aundh Hospital
b) Participating in “My family, My Responsibility” Government of Maharashtra initiative to fight COVID-19
c) Donation of Android based Education Electronic Devise (Tablet) to Students of Schools run by Khadki Cantonment Board.
d) Donation to OPD of COVID CARE CENTRE, Pune
e) PPE Kits, Mask, Sanitizer, Hand Gloves and Face Shilled Donated to COVID CARE CENTRE, Pune.
f) Blankets distributed to Safai Karmachari of Khadki Cantonment Board at Khadki Station Headquarters.
g) Rose Day Celebrated with Cancer Patient Aids Association for Cancer Patient at Indrayani Hospital and Sassoon Hospital.
h) Health Monitoring & Tracking Smart Watches Donated to Hinjawadi & Bhosari Police Station Pimpri Chinchwad.
i) Emcure in association with Tahsildar Office daund distributed Dry Ration packet to 500 migrant Labour. and Waste pickers in PCMC & Navksitij NGO Maruji.
j) Emcure in association with Hinjawadi police station, Pimpri-Chinchwad distributed Lunch packet and water bottle to 800 migrant labour travelling to Utter Pradesh by train from Pune railway station.

26ANNUAL REPORT 2020-21 : CSR
CORPORATE SOCIAL RESPONSIBILITY
k) Emcure Donated Laptop & Printer to Gurukulam Orphanage.
l) Post Graduate students of Modern College, Pune are the proud recipients of the Emcure Scholarship.
m) In its quest end Inequality in Education, Emcure Proudly Sponsored Two Fellows in the Teach for India Programme in Pune.
n) Navnirman Kach Patra Kastakari Sangh & Emcure CSR Initiatives Nirmalya collection event for keep the river Clean During Ganesh Visarjan.
o) HCQ Tablets Donated to District Collector, Pimpri Chinchwad Police, SRPF Daund & Hospital in Pune.
p) Pandharewadi Grampanchayat Kurkumbh, Z.P.School Class Room construction under CSR initiative
q) School bag kits distributed to kids of waste pickers, Chinchwad.
COVID-19 SITUATION
All the norms regarding sanitization and social distancing were implemented at all the places in factory premises and offices as per the government guidelines. We made sure that the employees and workers received the help and support they needed to keep the business going without compromising on their health and safety.
During lockdown of 2020, the virtual setup served as a bridge for the employees to connect with their colleagues from across the globe and work together to ensure the smooth functioning of the business.

27
RISK
PRINCIPAL RISK FACTORS AND UNCERTAINTIES
Company’s business operations are subject to certain risks that may affect its operations and ability to achieve its objectives. The principal risks and uncertainties are identified below. The risks have not been listed in order of their importance. There may be other risks and uncertainties that are currently not known to the Company, or which are deemed to be immaterial.
RISK RELATED TO ECONOMIC & POLITICAL ENVIRONMENT ACROSS THE WORLD
The Company’s operations span across the globe. Changes in the economic or political conditions in different countries may have an unfavorable impact on the Company’s business performance. The extent of the Company’s product portfolio and geographic presence assists in mitigating the exposure to any specific localized risk to a certain extent. The
Company considers such external uncertainties while doing periodical reviews of its operations and business strategy in order to mitigate against such changes.
RISK OF COMPETITION, PRICE PRESSURE AND GOVERNMENT CONTROLS ON PRICES
Rising healthcare expenses is a key area of concern across the world with policy makers working hard to contain both private and government expenditure on healthcare. This increased focus creates constant pressure on prices of pharmaceutical products. In India, Emcure’s single largest market, the government exercises control of price of specified pharmaceutical products through its Drugs (Prices Control) Order, (DPCO) and is contemplating inclusion of additional essential drugs. In some markets, major purchasers of pharmaceutical products have the economic power to exert substantial pressure on the prices or the terms of access to the products. In addition, competition amongst the global generic
ANNUAL REPORT 2020-21 : RISKS

28
pharmaceutical industry is intensifying. Increased pricing regulation and competition will have impact on company’s revenues and profits. The Company makes conscious efforts to launch new value added products with some differentiation which can fetch better pricing.
REGULATORY AND COMPLIANCE
With increased focus by the regulatory authorities on patient health and safety, the pharmaceutical industry is witnessing more stringent regulatory and compliance requirements being enforced. Stricter regulatory controls heighten the risk of changes in product profile or withdrawal by regulators on the basis of post –approval concerns over product safety. There is also greater regulatory scrutiny, on advertisement and promotion in particular on direct-to- consumer marketing. Any deviation from the prescribed regulations can lead to strict actions from regulatory authorities and/or litigation from customers. The Company strives constantly to adhere to the quality standards and has so far maintained a credible track record while facing periodic audits from several global regulatory agencies. In its effort to comply with the increasing regulatory requirements, the Company may incur higher costs. In addition, the Company has taken ‘Product Liability’ insurance as a safeguard against such action / litigations.
RESEARCH AND DEVELOPMENT RISK
The Company constantly spends a significant portion of its revenues in research and development activities required to develop new commercially viable products as well as the development of additional uses for existing products in order to have a robust product pipeline. Development of new pharmaceuticals products is investment intensive, having a longer gestation period with uncertain outcome. The failure of the product after significant investment of Company’s economic and human resources, may adversely impact the Company’s performance. The Company also faces litigation risk from competitors holding either product or process patents, in case the Company’s products or processes are claimed to infringe such intellectual property
rights. The selection of products for development are done after exhaustive screening and research. The Company undertakes a continuous evaluation, both scientific and financial during the development stage.
FOREIGN EXCHANGE FLUCTUATIONS
The Company operates in several international markets and derives roughly half of its total revenues from sales of products outside India in several currencies. It also utilizes foreign currency debt for its operations outside India. These activities expose the company’s profitability to currency movement. The Company though enjoys a natural hedge, it actively monitors the movement in currencies and make all efforts to minimize the currency risk exposure. It does not engage in trading of financial assets for speculative purposes nor does it write options.
ENVIRONMENT, HEALTH, SAFETY AND SUSTAINABILITY (EHSS)
The environmental laws of the various jurisdictions in which the Company operates imposes various obligations on the Company. Failure to manage the environmental risks could lead to significant harm to people, the environment and communities in which the Company operates thereby leading to falling short of stakeholders expectations and regulatory requirements. The Company thrives to effectively manage EHSS risk and seeks to eliminate hazards where practicable. The Company’s efforts to improve environmental sustainability have led to reduction in hazardous waste and consumption of resources.
INTERNAL CONTROL SYSTEMS
The Company has an established process to identify various risks and accordingly formulate and implement mitigation strategies through an independent and robust internal audit system. The internal auditor’s reports and recommendations are reviewed and endorsed by the Audit Committee of the Company. The overall policy and framework for managing risk is reviewed periodically by top management to ensure that requisite internal control mechanisms are in place.
ANNUAL REPORT 2020-21 : RISKS
RISK

29
To,
The Members,
Emcure Pharmaceuticals Limited
Your Directors hereby present the 40th Board’s Report on the business, operations and state of affairs of the Company together with the audited financial statement for the year ended March 31, 2021.
FINANCIAL RESULTSThe standalone and consolidated financial statements for the financial year 2020-21 have been prepared and presented in accordance with Indian Accounting Standards (Ind AS).
Rs. in million
DIVIDEND
Your Directors have recommended a final dividend of Rs. 1/- per Equity Share on the face value of Rs. 10/- each for the Financial Year ended March 31, 2021. The payment of final dividend is subject to declaration by the members at the ensuing Annual General Meeting.
EMPLOYEE STOCK OPTION SCHEME
During the year under review, the Company had granted 2,20,000 stock options to the employees under the Employee Stock Option Scheme 2013 (Emcure ESOS 2013), and 22,65,000 stock options were cancelled. As on March 31, 2021, 15,95,000 Stock options were outstanding.
The disclosures in compliance with Section 62 of the Companies Act, 2013 read with Rule 12 of Companies (Share Capital and Debentures) Rules, 2014 in relation to Employee Stock Option Scheme are set out in “Annexure - A” to this Report.
SUBSIDIARIES AND ASSOCIATES
During the year under review, the following companies were incorporated as wholly owned subsidiaries of the Company:
• Avet Lifesciences Limited • Emcure Pharma Chile SpA, Chile • Lazor Pharmaceuticals Limited, Kenya
The salient features of the financial statements of each of the Subsidiaries and the Associate Companies as required under the Companies Act, 2013 is provided in “Annexure - B”
(Form AOC - 1).
During the year under review, the Company had filed a Composite Scheme of Arrangement between Emcure Pharmaceuticals Limited (“Demerged Company” / the “Company”) and Avet Lifesciences Limited (“Resulting Company”) and their respective shareholders (‘Scheme’) with National Company Law Tribunal (“NCLT”), Mumbai, on November 30, 2020, for demerger of the Company’s US (United States of America) market business and vesting the same with the Resulting Company,
under Sections 230 to 232 read with Section 52, section 66 and other applicable provisions of the Companies Act, 2013. The Joint Petition was filed with NCLT on February 04, 2021 and the final hearing of NCLT is awaited.
LOANS, GUARANTEES AND INVESTMENTS
Particulars of loans given, guarantees given, investments made and securities provided, if any, are reported in the financial statements.
RELATED PARTY TRANSACTIONS
All the related party transactions that were entered during the financial year 2020-21 were on an arm’s length basis and in the ordinary course of business. Particulars of contracts or arrangements with related parties as referred to in sub-section (1) of Section 188 of the Companies Act, 2013 is provided in “Annexure - C” (Form AOC-2).
DIRECTORS AND KEY MANAGERIAL PERSONNEL
i) Independent Directors
Mr. P. S. Jayakumar (DIN: 01173236) was appointed as an Independent Director of the Company at the Annual General Meeting (AGM) held on August 21, 2020, to hold the office for a period of 3 years.
The Board of Directors, on the recommendation of Nomination and Remuneration Committee and in accordance with provisions of the Companies Act, 2013 appointed Mr. Vijay Gokhale (DIN: 09134089) and Mrs. Vidya Yeravdekar (DIN: 02183179) as Additional Directors on the Board w.e.f. April 16, 2021. They shall hold office as Additional Directors upto the date of the ensuing AGM.
Further, Mr. Vijay Gokhale (DIN: 09134089) and Mrs. Vidya Yeravdekar (DIN: 02183179) were appointed as Independent Directors w.e.f. April 16, 2021 for a period of 5 years, subject to the approval by the Members at the ensuing AGM.
In accordance with the provisions of Section 149 of the Companies Act, 2013, the Independent Directors have given a declaration that they meet the criteria of independence as provided in the said Section.
ParticularsConsolidated Standalone
2020-21 2019-20 2020-21 2019-20Revenue from Operations 60,564.15 50,485.54 31,536.64 23,757.09Other Income 353.91 823.06 1,119.07 1,376.15Total Revenue 60,918.06 51,308.60 32,655.71 25,133.24Less: Total Expenses 48,244.43 43,446.15 24,102.59 19,522.88Profit before Interest, Taxation, Depreciation, and Amortization (EBITDA) 12,673.63 7,862.45 8,553.12 5,610.36Less: Finance Costs 1,981.32 2,565.97 1,233.41 1,372.21Less: Depreciation and amortization expense 3,233.10 3,208.34 1,562.35 1,549.74Profit before Exceptional Item and Taxation 7,459.21 2,088.14 5,757.36 2,688.41Less: Exceptional Item 885.94 1,034.79 182.88 441.59Less: Taxation 2,387.33 47.25 1,369.73 494.77Profit 4,185.94 1,006.10 4,204.75 1,752.05Total comprehensive income 4,185.78 1,344.49 4,205.85 1,731.71
ANNUAL REPORT 2020-21 : BOARDS REPORT
BOARDS REPORT

30
Mr. Humayun Dhanrajgir (DIN: 00004006) resigned as an Independent Director and Chairman of the Company w.e.f. April 16, 2021 due to his other commitments. The Board placed on record its appreciation for the valuable contribution and the services rendered by him during his tenure on the Board as Chairman and Non-Executive Director.
ii) Other Directors
The Board of Directors, on the recommendation of Nomination and Remuneration Committee and in accordance with provisions of the Companies Act, 2013 appointed Mr. Shailesh Ayyangar (DIN: 00268076) as an Additional Director (Non-Executive, Non-Independent) on the Board w.e.f. April 16, 2021. He shall hold office as Additional Director upto the date of the ensuing AGM.
Dr. Mukund Gurjar (DIN: 00026843), retires by rotation at the ensuing AGM and being eligible, offers himself for re-appointment.
iii) Key Managerial Personnel
There was no change in the Key Managerial Personnel (KMPs) during the year under review.
Subsequent to the end of the financial year, Mrs. Namita Thapar resigned as Chief Financial Officer of the Company w.e.f. April 16, 2021. The Board placed on record its sincere appreciation for the valuable contribution made by Mrs. Namita Thapar to the Company during her tenure as Chief Financial Officer.
The Board of Directors, on the recommendation of Nomination and Remuneration Committee and in accordance with the provisions of the Companies Act, 2013 appointed Mr. Tajuddin Shaikh as the Chief Financial Officer of the Company w.e.f. April 16, 2021.
NUMBER OF BOARD MEETINGS HELD
During the year ended March 31, 2021, the Board met 5 times.
REMUNERATION POLICY
The Company has formulated a Remuneration Policy pursuant to Section 178 of the Companies Act, 2013. The policy is available on the website at link: www.emcure.com.
BOARD EVALUATION
During the year under review, a meeting of the Independent Directors was held on July 22, 2020. The Independent Directors evaluated the performance of the Non-Independent Directors, performance of the Board as a whole, the committees thereof and also that of the Chairman in terms of the provisions of the Companies Act, 2013. Performance evaluation of independent directors was carried out by the entire Board of Directors, excluding the director evaluated.
INTERNAL FINANCIAL CONTROLS AND RISK MANAGEMENT
The Company has in place adequate internal financial controls with reference to the financial statements. During the year, such controls were tested and no reportable material weakness in the design or operation were observed. The Company has also formulated a risk management policy.
AUDIT COMMITTEE
The Audit Committee presently comprises of:
Mr. Shreekant Bapat (Chairman) Independent
Mr. Berjis Desai DirectorsMr. P.S Jayakumar Mrs. Namita Thapar Whole-time Director
Subsequent to the end of the financial year, Mr. Humayun Dhanrajgir resigned from the Board of the Company and consequently as a member of the Audit Committee, w.e.f. April 16, 2021.
VIGIL MECHANISAM
The Company has adopted a Vigil Mechanism Policy (the Policy) for the employees to report genuine concerns/grievances. The Policy is available on the website of the Company at the link: www.emcure.com.
The Policy provides for adequate safeguards against the victimisation of the employees who use the vigil mechanism. The vigil mechanism is overseen by the Audit Committee.
PREVENTION OF SEXUAL HARASSMENT OF WOMEN AT WORKPLACE
The Company has a Policy on Prevention of Sexual Harassment of Women at Workplace. No cases were reported during the year under review. There were no complaints pending as on March 31, 2021. The Company has complied with the provisions relating to the constitution of Internal Complaints Committee under the Sexual Harassment of Women at Workplace (Prevention, Prohibition & Redressal) Act, 2013.
CORPORATE SOCIAL RESPONSIBILITY COMMITTEE
The Board of Directors has constituted a Corporate Social Responsibility (CSR) Committee in accordance with the provisions of the Companies Act, 2013. The CSR Committee presently comprises of:
Mr. Shreekant Bapat Independent Director(Chairman) Mrs. Namita Thapar Whole-time DirectorsMr. Sunil Mehta
As part of CSR initiatives, the Company has undertaken projects in the areas of Education, Healthcare, Environment Sustainability etc.
CSR REPORT
The CSR Report on the activities undertaken during the year is provided as “Annexure - D” to this Report. The CSR Policy is available on the website of the Company at the link: www.emcure.com.
DISCLOSURE UNDER SECTION 197 OF THE COMPANIES ACT, 2013
The information as required under Section 197 of the Companies Act, 2013 read with the Companies (Appointment and Remuneration of Managerial Personnel) Rules, 2014, as amended, is provided as “Annexure - E” to this Report.
ANNUAL REPORT 2020-21 : BOARDS REPORT
BOARDS REPORT
}
}

31
CONSERVATION OF ENERGY, TECHNOLOGY ABSORPTION AND FOREIGN EXCHANGE EARNINGS/OUTGO
The information on conservation of energy, technology absorption and foreign exchange earnings/outgo as stipulated under Section 134(3)(m) of the Act, read with Rule 8 of the Companies (Accounts) Rules, 2014, is provided as “Annexure - F” to this Report.
AUDITORS
M/s. BSR & Co. LLP, Chartered Accountants (FRN 101248-W/W-100022) are the Auditors of the Company. Their term of appointment is up to the conclusion of 41st Annual General Meeting to be held in the year 2022. The Auditors’ Report annexed to the financial statements for the year under review does not contain any qualification, reservation, adverse remark or disclaimer.
SECRETARIAL AUDIT REPORT
Pursuant to Section 204 of the Companies Act, 2013 and the Companies (Appointment and Remuneration of Managerial Personnel) Rules, 2014, M/s. SVD & Associates, Company Secretaries, were appointed as the Secretarial Auditors, to conduct the Secretarial Audit for the financial year ended March 31, 2021. The Report of the Secretarial Auditor is provided as “Annexure - G” to this Report. The Secretarial Auditors’ Report for the year under review does not contain any qualification, reservation, adverse remark or disclaimer.
COST AUDIT
As per Section 148 of the Companies Act, 2013, read with the Companies (Cost Records and Audit) Rules, 2014, the Company is required to maintain cost records and accordingly, such accounts and records are maintained. M/s. B. M. Sharma & Co. (Registration no. 000219), Cost Accountants were appointed as Cost Auditors for conducting the audit of Cost Records of the Company for financial year ended March 31, 2021.
OTHERS
No disclosure is required in respect of the details relating to the deposits covered under Chapter V of the Companies Act, 2013, as the Company has not accepted any deposit. There was no significant or material order passed by any regulator or court or tribunal which would impact the status of the Company as a going concern and the operations in future. The Company has complied with the Secretarial Standards issued by the Institute of Company Secretaries of India.
ANNUAL RETURN
Pursuant to Section 92(3) read with section 134(3)(a) of the Companies Act, 2013, copy of the Annual Return of the Company is placed on the website of the Company and is accessible at the web-link: www.emcure.com.
DIRECTORS’ RESPONSIBILITY STATEMENT
Pursuant to Section 134 of the Companies Act, 2013, the Directors confirm that –
i. in the preparation of the annual accounts, the applicable accounting standards had been followed,
ii. appropriate accounting policies have been selected and applied them consistently and had made judgments and estimates that are reasonable and prudent so as to give a true and fair view of the state of affairs as at March 31, 2021 and of the profit of the Company for the financial year ended on that date;
iii. proper and sufficient care had been taken for the maintenance of adequate accounting records in accordance with the provisions of the Companies Act, 2013 for safeguarding the assets of the Company and for preventing and detecting fraud and other irregularities;
iv. the annual accounts have been prepared on a going concern basis;
v. internal financial controls have been laid down and the same are adequate and operating effectively; and
vi. proper systems had been devised to ensure compliance with the provisions of all applicable laws and such systems were adequate and operating effectively.
INDUSTRIAL RELATIONS
Industrial Relations for the period under review continued to be cordial.
ACKNOWLEDGEMENTS
The Board of Directors acknowledge the valuable guidance and continued support extended by the Company’s customers, business partners, distributors, suppliers, medical professionals, other government authorities, Banks and other stakeholders. Your Directors would also like to take this opportunity to express their appreciation for the dedicated efforts of the employees of the Company.
FOR AND ON BEHALF OF THE BOARD OF DIRECTORSEMCURE PHARMACEUTICALS LIMITED
Place: Pune BERJIS DESAI SATISH MEHTA Date: May 28, 2021 CHAIRMAN MANAGING DIRECTOR & CEO DIN: 00153675 DIN: 00118691
ANNUAL REPORT 2020-21 : BOARDS REPORT
BOARDS REPORT
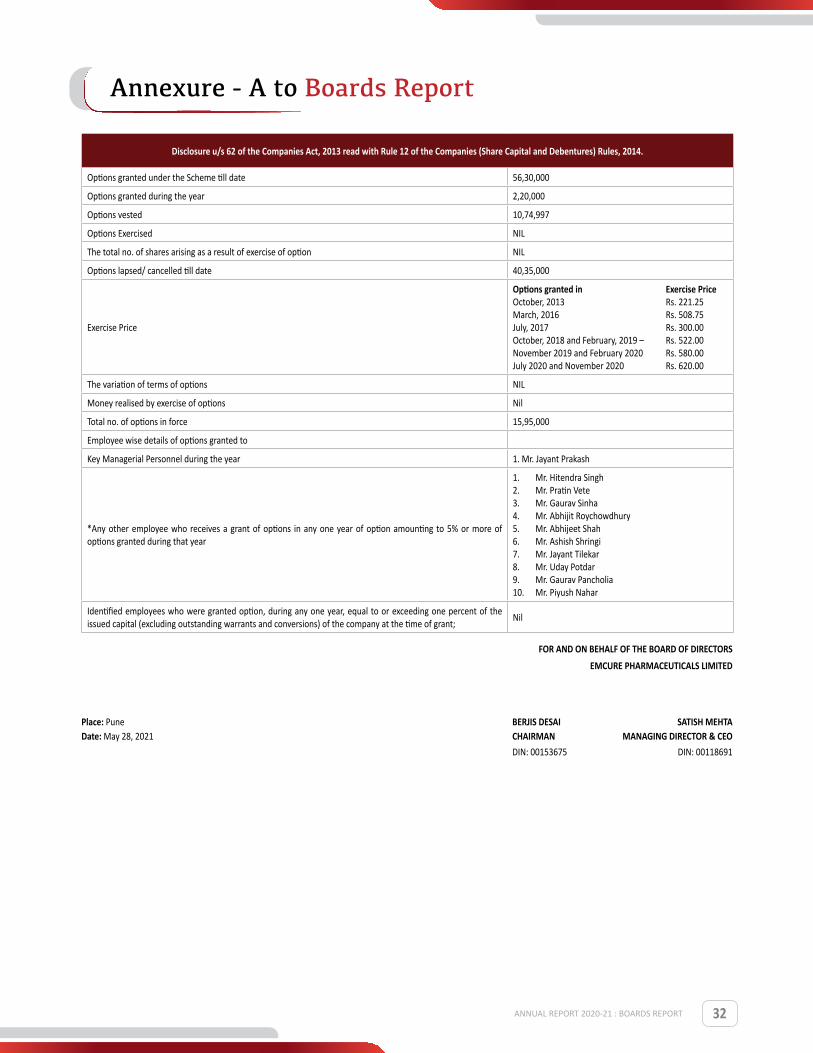
32
Disclosure u/s 62 of the Companies Act, 2013 read with Rule 12 of the Companies (Share Capital and Debentures) Rules, 2014.
Options granted under the Scheme till date 56,30,000
Options granted during the year 2,20,000
Options vested 10,74,997
Options Exercised NIL
The total no. of shares arising as a result of exercise of option NIL
Options lapsed/ cancelled till date 40,35,000
Exercise Price
Options granted in Exercise PriceOctober, 2013 Rs. 221.25March, 2016 Rs. 508.75July, 2017 Rs. 300.00October, 2018 and February, 2019 – Rs. 522.00November 2019 and February 2020 Rs. 580.00July 2020 and November 2020 Rs. 620.00
The variation of terms of options NIL
Money realised by exercise of options Nil
Total no. of options in force 15,95,000
Employee wise details of options granted to
Key Managerial Personnel during the year 1. Mr. Jayant Prakash
*Any other employee who receives a grant of options in any one year of option amounting to 5% or more of options granted during that year
1. Mr. Hitendra Singh2. Mr. Pratin Vete3. Mr. Gaurav Sinha4. Mr. Abhijit Roychowdhury5. Mr. Abhijeet Shah6. Mr. Ashish Shringi7. Mr. Jayant Tilekar8. Mr. Uday Potdar9. Mr. Gaurav Pancholia10. Mr. Piyush Nahar
Identified employees who were granted option, during any one year, equal to or exceeding one percent of the issued capital (excluding outstanding warrants and conversions) of the company at the time of grant;
Nil
FOR AND ON BEHALF OF THE BOARD OF DIRECTORSEMCURE PHARMACEUTICALS LIMITED
Place: Pune BERJIS DESAI SATISH MEHTA Date: May 28, 2021 CHAIRMAN MANAGING DIRECTOR & CEO DIN: 00153675 DIN: 00118691
ANNUAL REPORT 2020-21 : BOARDS REPORT
Annexure - A to Boards Report
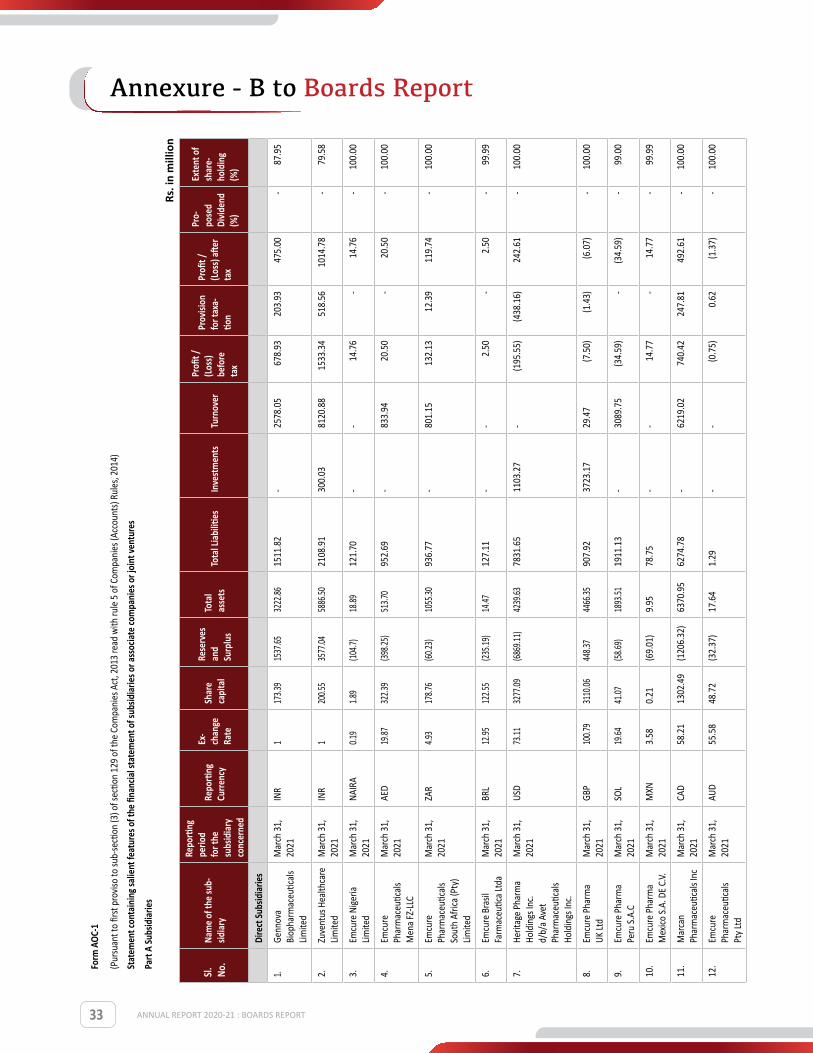
33
Form
AOC
-1
(Pur
suan
t to
first
pro
viso
to su
b-se
ction
(3) o
f sec
tion
129
of th
e Co
mpa
nies
Act
, 201
3 re
ad w
ith ru
le 5
of C
ompa
nies
(Acc
ount
s) R
ules
, 201
4)
Stat
emen
t con
tain
ing s
alien
t fea
ture
s of t
he fi
nanc
ial st
atem
ent o
f sub
sidiar
ies o
r ass
ociat
e com
pani
es o
r joi
nt ve
ntur
es
Part
A Su
bsid
iarie
s
Rs. i
n m
illio
n
Sl.
No.
Nam
e of t
he su
b-sid
iary
Repo
rting
pe
riod
for t
he
subs
idiar
y co
ncer
ned
Repo
rting
Cu
rrenc
y
Ex-
chan
ge
Rate
Shar
e ca
pita
l
Rese
rves
an
d Su
rplu
s
Tota
l as
sets
Tota
l Liab
ilities
Inve
stmen
tsTu
rnov
er
Profi
t /
(Loss
) be
fore
ta
x
Prov
ision
fo
r tax
a-tio
n
Profi
t /
(Loss
) afte
r ta
x
Pro-
pose
d Di
viden
d (%
)
Exte
nt o
f sh
are-
hold
ing
(%)
Dire
ct Su
bsid
iarie
s
1.Ge
nnov
a Bi
opha
rmac
eutic
als
Limite
d
Mar
ch 3
1,
2021
INR
117
3.39
1537
.6532
22.86
1511
.82
-25
78.0
567
8.93
203.
9347
5.00
-87
.95
2.Zu
vent
us H
ealth
care
Lim
ited
Mar
ch 3
1,
2021
INR
120
0.55
3577
.0458
86.50
2108
.91
300.
0381
20.8
815
33.3
451
8.56
1014
.78
-79
.58
3.Em
cure
Nig
eria
Lim
ited
Mar
ch 3
1,
2021
NAIR
A0.1
91.8
9(1
04.7)
18.89
121.
70-
-14
.76
-14
.76
-10
0.00
4.Em
cure
Ph
arm
aceu
tical
s M
ena
FZ-L
LC
Mar
ch 3
1,
2021
AED
19.87
322.3
9(3
98.25
)51
3.70
952.
69-
833.
9420
.50
-20
.50
-10
0.00
5.Em
cure
Ph
arm
aceu
tical
s So
uth
Afric
a (P
ty)
Limite
d
Mar
ch 3
1,
2021
ZAR
4.93
178.7
6(6
0.23)
1055
.3093
6.77
-80
1.15
132.
1312
.39
119.
74-
100.
00
6.Em
cure
Bra
sil
Farm
aceu
tica
Ltda
M
arch
31,
20
21BR
L12
.9512
2.55
(235
.19)
14.47
127.
11-
-2.
50-
2.50
-99
.99
7.He
ritag
e Ph
arm
a Ho
ldin
gs In
c.
d/b/
a Av
et
Phar
mac
eutic
als
Hold
ings
Inc.
Mar
ch 3
1,
2021
USD
73.11
3277
.09(6
869.1
1)42
39.63
7831
.65
1103
.27
-(1
95.5
5)(4
38.1
6)24
2.61
-10
0.00
8.Em
cure
Pha
rma
UK Lt
dM
arch
31,
20
21GB
P10
0.79
3110
.0644
8.37
4466
.3590
7.92
3723
.17
29.4
7(7
.50)
(1.4
3)(6
.07)
-10
0.00
9.Em
cure
Pha
rma
Peru
S.A
.CM
arch
31,
20
21SO
L19
.6441
.07(5
8.69)
1893
.5119
11.1
3-
3089
.75
(34.
59)
-(3
4.59
)-
99.0
0
10.
Emcu
re P
harm
a M
exico
S.A
. DE
C.V.
Mar
ch 3
1,
2021
MXN
3.58
0.21
(69.
01)
9.95
78.7
5-
-14
.77
-14
.77
-99
.99
11.
Mar
can
Phar
mac
eutic
als I
ncM
arch
31,
20
21CA
D58
.21
1302
.49
(120
6.32
)63
70.9
562
74.7
8-
6219
.02
740.
4224
7.81
492.
61-
100.
00
12.
Emcu
re
Phar
mac
eutic
als
Pty
Ltd
Mar
ch 3
1,
2021
AUD
55.5
848
.72
(32.
37)
17.6
41.
29-
-(0
.75)
0.62
(1.3
7)-
100.
00
ANNUAL REPORT 2020-21 : BOARDS REPORT
Annexure - B to Boards Report

34
Sl.
No.
Nam
e of t
he su
b-sid
iary
Repo
rting
pe
riod
for t
he
subs
idiar
y co
ncer
ned
Repo
rting
Cu
rrenc
y
Ex-
chan
ge
Rate
Shar
e ca
pita
l
Rese
rves
an
d Su
rplu
s
Tota
l as
sets
Tota
l Liab
ilities
Inve
stmen
tsTu
rnov
er
Profi
t /
(Loss
) be
fore
ta
x
Prov
ision
fo
r tax
a -tio
n
Profi
t /
(Loss
) afte
r ta
x
Pro -
pose
d Di
viden
d (%
)
Exte
nt o
f sh
are -
hold
ing
(%)
13.
Avet
Life
scie
nces
Lt
d.M
arch
31,
20
21IN
R1.
000.
10(0
.83)
0.70
1.43
--
(0.8
3)-
(0.8
3)-
100.
00
14.
Emcu
re P
harm
a Ch
ile S
pAM
arch
31,
20
21Ch
ilean
Pe
so0.
103.
66(0
.67)
4.82
1.83
--
(0.7
2)-
(0.7
2)-
100.
00
15.
Lazo
r Ph
arm
aceu
tical
s Lt
d.
Mar
ch 3
1,
2021
Keny
an
Shill
ing
--
--
--
--
--
-10
0.00
16.
Herit
age
Phar
ma
Labs
Inc.
d/b
/a A
vet
Phar
mac
eutic
als
Labs
Inc.
Mar
ch 3
1,
2021
USD
73.1
170
.86
(321
3.90
)45
84.8
277
27.8
6-
3479
.85
(116
3.56
)19
7.19
(197
.19)
-10
0.00
17.
Herit
age
Phar
mac
eutic
als
Inc.
d/b
/a A
vet
Phar
mac
eutic
als I
nc.
Mar
ch 3
1,
2021
USD
73.1
1-
9189
.82
1308
8.02
3898
.20
-10
572.
84(9
96.4
2)18
4.91
(184
.91)
-10
0.00
18.
Tillo
med
Pha
rma
GmbH
M
arch
31,
20
21EU
RO85
.78
532.
52(1
23.7
9)83
1.37
422.
64-
682.
06(7
5.21
)(9
.09)
(66.
12)
-10
0.00
19.
Tillo
med
La
bora
torie
s Ltd
Mar
ch 3
1,
2021
GBP
100.
7920
01.3
910
42.9
052
52.5
422
08.2
5-
5913
.44
374.
5371
.47
303.
06-
100.
00
20.
Emcu
re N
Z Lim
ited
Mar
ch 3
1,
2021
NZD
45.1
26.
39(4
.67)
2.02
0.30
--
0.18
-0.
18-
100.
00
21.
Labo
rato
rios
Tillo
med
Spa
in S
LUM
arch
31,
20
21EU
RO85
.78
40.7
18.
6263
1.64
582.
31-
752.
27(0
.05)
-(0
.05)
-10
0.00
22.
Tillo
med
Ital
ia S
RLM
arch
31,
20
21EU
RO85
.78
262.
01(2
13.2
4)81
2.06
763.
29-
932.
74(6
1.75
)(1
1.46
)(5
0.29
)-
100.
00
23.
Tillo
med
Fra
nce
SAS
Mar
ch 3
1,
2021
EURO
85.7
818
.61
25.3
118
9.20
145.
28-
485.
1116
.95
5.13
11.8
2-
100.
00
24.
Hacc
o Ph
arm
a In
cM
arch
31,
20
21US
D73
.11
0.01
6.28
48.5
342
.24
-44
.53
6.39
-6.
39-
100.
00
25.
Tillo
med
La
bora
torie
s B.V.
Mar
ch 3
1,
2021
EURO
85.7
8-
--
--
--
--
-10
0.00
Rs. i
n m
illio
n
ANNUAL REPORT 2020-21 : BOARDS REPORT
Annexure - B to Boards Report

35
Part
B : A
ssoc
iates
and
Join
t Ven
ture
s
Rs
. in m
illion
Stat
emen
t pur
suan
t to
Secti
on 12
9 (3)
of t
he C
ompa
nies
Act
, 201
3 rel
ated
to A
ssoc
iate C
ompa
nies
and
Join
t Ven
ture
s
Nam
e of A
ssoc
iates
or J
oint
Ven
ture
s
NIL
1.La
test
audi
ted
Balan
ce Sh
eet D
ate
2.Da
te o
n w
hich
the A
ssoc
iate o
r Joi
nt V
entu
re w
as as
socia
ted
or ac
quire
d3.
Shar
es o
f Ass
ociat
e or J
oint
Ven
ture
s hel
d by
the c
ompa
ny o
n th
e yea
r end
No
. of s
hare
s
Am
ount
of I
nves
tmen
t in
Asso
ciate
s or J
oint
Ven
ture
Ex
tent
of H
oldi
ng (i
n pe
rcen
tage
)
4.De
scrip
tion
of h
ow th
ere i
s sign
ifica
nt in
fluen
ce5.
Reas
on w
hy th
e ass
ociat
e/jo
int v
entu
re is
not
cons
olid
ated
6.Ne
twor
th att
ribut
able
to sh
areh
oldi
ng as
per
late
st au
dite
d Ba
lance
Shee
t7.
Profi
t or L
oss f
or th
e yea
r
i. C
onsid
ered
in C
onso
lidati
on
ii.
Not
Con
sider
ed in
Con
solid
ation
FOR
AND
ON B
EHAL
F OF T
HE B
OARD
OF D
IREC
TORS
OF
EMCU
RE P
HARM
ACEU
TICA
LS LI
MIT
ED
BERJ
IS DE
SAI
CHAI
RMAN
DI
N: 0
0153
675
Plac
e: Pu
neDa
te: M
ay 2
8, 2
021
SATI
SH M
EHTA
MAN
AGIN
G DI
RECT
OR &
CEO
DIN:
001
1869
1
TAJU
DDIN
SHAI
KHCH
IEF F
INAN
CIAL
OFF
ICER
DIN:
053
1889
9
JAYA
NT P
RAKA
SHCO
MPA
NY SE
CRET
ARY
MEM
BERS
HIP
NO.:
F674
2
ANNUAL REPORT 2020-21 : BOARDS REPORT
Annexure - B to Boards Report
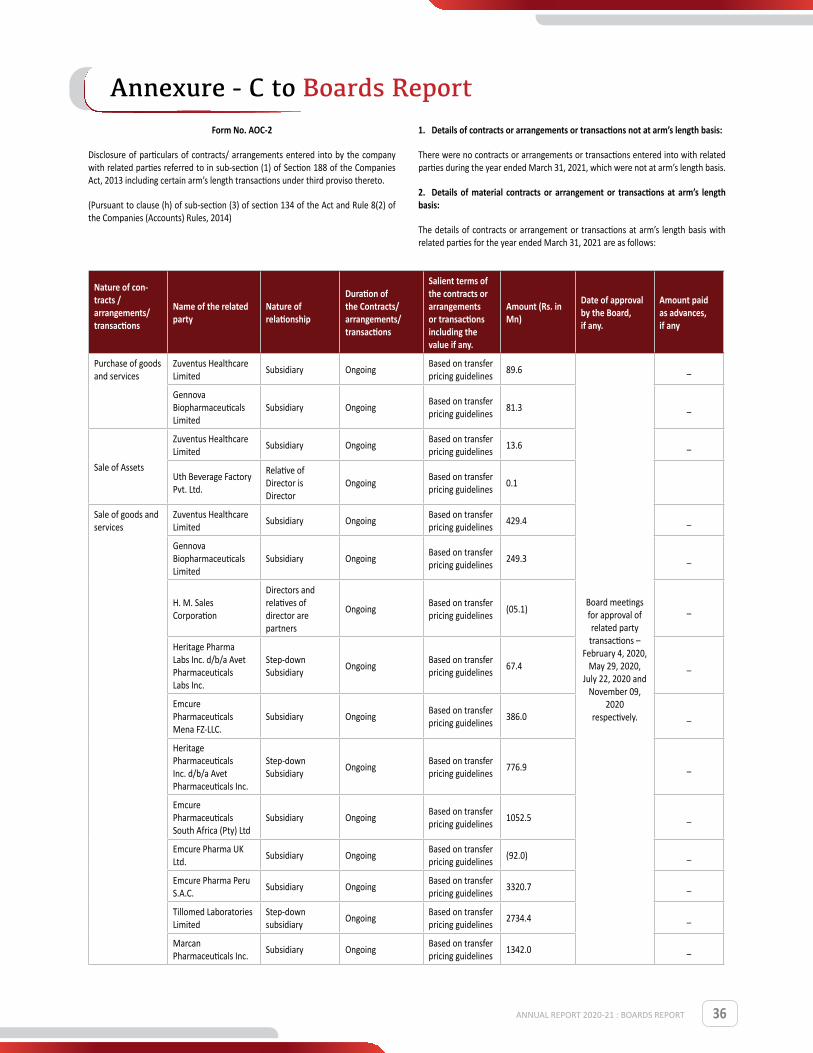
36
Form No. AOC-2
Disclosure of particulars of contracts/ arrangements entered into by the company with related parties referred to in sub-section (1) of Section 188 of the Companies Act, 2013 including certain arm’s length transactions under third proviso thereto.
(Pursuant to clause (h) of sub-section (3) of section 134 of the Act and Rule 8(2) of the Companies (Accounts) Rules, 2014)
1. Details of contracts or arrangements or transactions not at arm’s length basis:
There were no contracts or arrangements or transactions entered into with related parties during the year ended March 31, 2021, which were not at arm’s length basis.
2. Details of material contracts or arrangement or transactions at arm’s length basis:
The details of contracts or arrangement or transactions at arm’s length basis with related parties for the year ended March 31, 2021 are as follows:
Nature of con-tracts /arrangements/ transactions
Name of the related party
Nature of relationship
Duration of the Contracts/ arrangements/ transactions
Salient terms of the contracts or arrangements or transactions including the value if any.
Amount (Rs. in Mn)
Date of approval by the Board, if any.
Amount paid as advances, if any
Purchase of goods and services
Zuventus Healthcare Limited
Subsidiary OngoingBased on transfer pricing guidelines
89.6
Board meetings for approval of related party transactions –
February 4, 2020, May 29, 2020,
July 22, 2020 and November 09,
2020respectively.
_
Gennova Biopharmaceuticals Limited
Subsidiary OngoingBased on transfer pricing guidelines
81.3 _
Sale of Assets
Zuventus Healthcare Limited
Subsidiary OngoingBased on transfer pricing guidelines
13.6 _
Uth Beverage Factory Pvt. Ltd.
Relative of Director is Director
OngoingBased on transfer pricing guidelines
0.1
Sale of goods and services
Zuventus Healthcare Limited
Subsidiary OngoingBased on transfer pricing guidelines
429.4 _
Gennova Biopharmaceuticals Limited
Subsidiary OngoingBased on transfer pricing guidelines
249.3 _
H. M. Sales Corporation
Directors and relatives of director are partners
OngoingBased on transfer pricing guidelines
(05.1) _
Heritage Pharma Labs Inc. d/b/a Avet Pharmaceuticals Labs Inc.
Step-down Subsidiary
OngoingBased on transfer pricing guidelines
67.4 _
Emcure Pharmaceuticals Mena FZ-LLC.
Subsidiary OngoingBased on transfer pricing guidelines
386.0 _
Heritage Pharmaceuticals Inc. d/b/a Avet Pharmaceuticals Inc.
Step-down Subsidiary
OngoingBased on transfer pricing guidelines
776.9 _
Emcure Pharmaceuticals South Africa (Pty) Ltd
Subsidiary OngoingBased on transfer pricing guidelines
1052.5 _
Emcure Pharma UK Ltd.
Subsidiary OngoingBased on transfer pricing guidelines
(92.0) _
Emcure Pharma Peru S.A.C.
Subsidiary OngoingBased on transfer pricing guidelines
3320.7 _
Tillomed Laboratories Limited
Step-down subsidiary
OngoingBased on transfer pricing guidelines
2734.4 _
Marcan Pharmaceuticals Inc.
Subsidiary OngoingBased on transfer pricing guidelines
1342.0 _
ANNUAL REPORT 2020-21 : BOARDS REPORT
Annexure - C to Boards Report

37
Tillomed Italia S.R.L. Subsidiary OngoingBased on transfer pricing guidelines
14.5
Hacco Pharma Inc. Subsidiary OngoingBased on transfer pricing guidelines
256.7
Marketing Support Fees
Emcure Brasil Farmaceutica Ltda.
Subsidiary OngoingBased on transfer pricing guidelines
17.3
Board meetings for approval of related party transactions – February 4, 2020, May 29, 2020, July 22, 2020 and November 09, 2020respectively.
_
Emcure Nigeria Limited
Subsidiary OngoingBased on transfer pricing guidelines
4.9
Emcure Pharma Mexico S.A. DE C.V.
Subsidiary OngoingBased on transfer pricing guidelines
20.4
Emcure Pharmaceuticals Pty Ltd.
Subsidiary OngoingBased on transfer pricing guidelines
14.2
Emcure Pharmaceuticals Mena FZ-LLC
Subsidiary OngoingBased on transfer pricing guidelines
24.8
Emcure NZ Limited Subsidiary OngoingBased on transfer pricing guidelines
3.1
Emcure Pharma Chile S.p.A
Subsidiary OngoingBased on transfer pricing guidelines
2.4
Royalty ExpensesH.M. Sales Corporation
Directors and relatives of director are partners
OngoingBased on transfer pricing guidelines
25.82
Commission expenses
H.M. Sales Corporation
Directors and relatives of director are partners
OngoingBased on transfer pricing guidelines
29.3 _
Rent incomeZuventus Healthcare Limited
Subsidiary OngoingBased on transfer pricing guidelines
9.3 _
Gennova Biopharmaceuticals Limited
Subsidiary OngoingBased on transfer pricing guidelines
33.3 _
Remuneration paid
Mr. Samit MehtaRelative of Director and KMP
OngoingBased on transfer pricing guidelines
29.03 _
Mr. Vikas ThaparRelative of Director and KMP
OngoingBased on transfer pricing guidelines
30.37
Mr. Sanjay MehtaRelative of Director
OngoingBased on transfer pricing guidelines
23.37
Rent expense Mr. Sunil Mehta Director OngoingBased on transfer pricing guidelines
0.33 _
Mr. Sanjay MehtaRelative of director
OngoingBased on transfer pricing guidelines
0.33 _
Mrs. Bhavna MehtaRelative of director
OngoingBased on transfer pricing guidelines
0.24 _
FOR AND ON BEHALF OF THE BOARD OF DIRECTORSEMCURE PHARMACEUTICALS LIMITED
Place: Pune BERJIS DESAI SATISH MEHTA Date: May 28, 2021 MANAGING DIRECTOR MANAGING DIRECTOR & CEO DIN: 00153675 DIN: 00118691
ANNUAL REPORT 2020-21 : BOARDS REPORT
Annexure - C to Boards Report

38
Annual Report on Corporate Social Responsibility (CSR) Activities for the financial year 2020-21
1. Brief outline on Corporate Social Responsibility (CSR) Policy of the Company: Pursuant to Section 135 read with Schedule VII of the Companies Act, 2013 (‘the Act’), the Corporate Social Responsibility Committee of the Board had approved a CSR Policy with primary focus on Promoting Education, Promoting Preventive Healthcare, Women empowerment.
2. Composition of CSR Committee:Rs. in million
Sr. No.
Name of Director Designation /Nature of Directorship
Number of meetings ofCSR Committee held during the year
Number of meetings of CSR Com-mittee attended during the year
1 Mr. Shreekant Bapat Independent Director - Chairman 3 3
2 Mr. Sunil Mehta Whole-time Director 3 3
3 Mrs. Namita Thapar Whole-time Director 3 3
3. Provide the web-link where Composition of CSR committee, CSR Policy and CSR projects approved by the Board are disclosed on the website of the Company: www.emcure.com4. Provide the details of Impact assessment of CSR projects carried out in pursuance of sub-rule (3) of rule 8 of the Companies (Corporate Social responsibility Policy) Rules, 2014, if applicable: Not applicable
5. Details of the amount available for set off in pursuance of sub-rule (3) of rule 7 of the Companies (Corporate Social responsibility Policy) Rules, 2014 and amount required for set off for the Financial Year, if any: Not applicable
6. Average Net Profit of the Company as per Section 135(5) of the Act: Rs. 3,008.91 Million
7. a) Two percent of average net profit of the Company as per Section 135(5) of the Act for the Financial Year 2020-21: Rs. 60.20 Million b) Surplus arising out of the CSR projects or programmes or activities of the previous financial years: NIL c) Amount required to be set off for the Financial Year, if any: NIL d) Total CSR obligation for the Financial Year (7a+7b-7c): Rs. 60.20 Million
8. a) CSR Amount spent or unspent for the Financial Year: Rs. in million
Total Amount Spent for the Financial Year(Rs. in Million)Mr. Shreekant Bapat
Amount Unspent (Rs. in Million)
Total Amount transferred to Unspent CSR Account as per section 135(6)
Amount transferred to any fund specified under Schedule VII as per second proviso to section 135(5)
Amount Date of transfer Name of the Fund Amount Date of transfer
64.7 - - - - -
b) Details of CSR amount spent against ongoing projects for the financial year: Not Applicable c) Details of CSR amount spent against other than ongoing projects for the financial year: Rs. 64.7 Million d) Amount spent in Administrative Overheads: NIL e) Amount spent on Impact Assessment, if applicable: Not applicable f) Total amount spent for the Financial Year (8b+8c+8d+8e): Rs. 64.7 Million g) Excess amount for set off, if any
Rs. in million
Sl. No. Particular Amount (Rs. in million)
i. Two percent of average net profit of the company as per section 135(5) 60.20
ii. Total amount spent for the Financial Year 64.70
iii. Excess amount spent for the financial year [(ii)-(i)] 4.50
iv. Surplus arising out of the CSR projects or programmes or activities of the previous financial years, if any -
v. Amount available for set off in succeeding financial years [(iii)-(iv)] 4.50
ANNUAL REPORT 2020-21 : BOARDS REPORT
Annexure - D to Boards Report
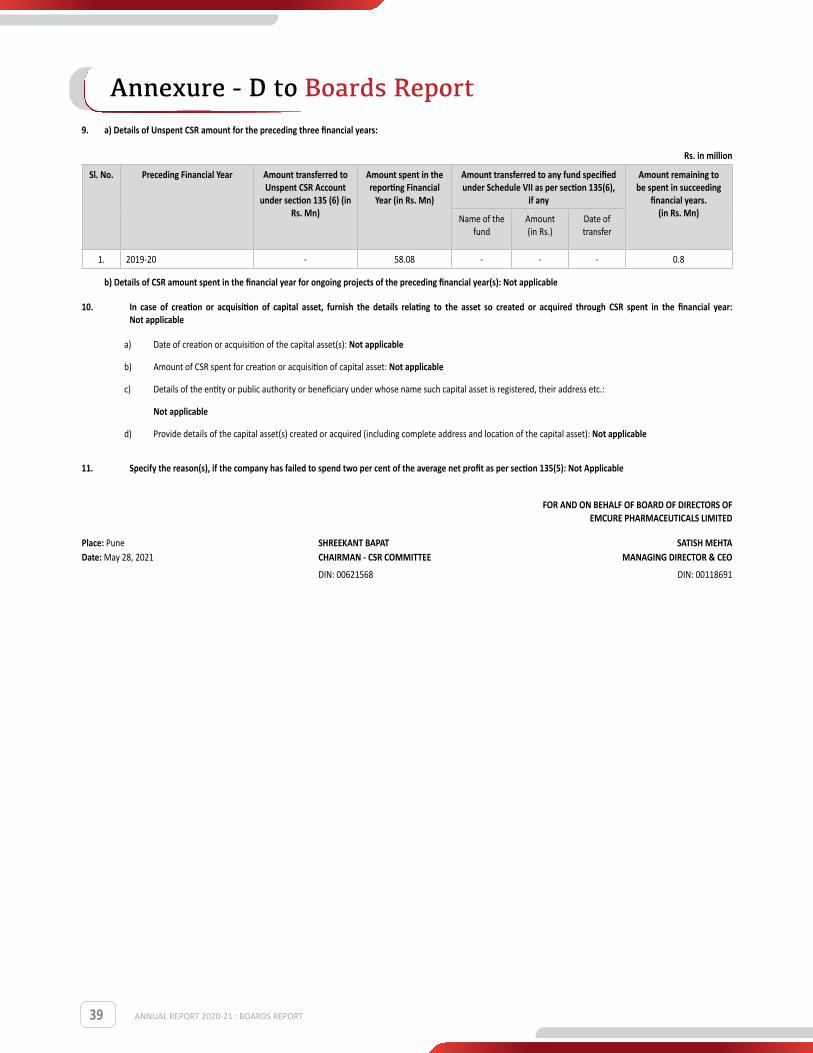
39 ANNUAL REPORT 2020-21 : BOARDS REPORT
Annexure - D to Boards Report9. a) Details of Unspent CSR amount for the preceding three financial years:
Rs. in million
Sl. No. Preceding Financial Year Amount transferred to Unspent CSR Account
under section 135 (6) (in Rs. Mn)
Amount spent in the reporting Financial
Year (in Rs. Mn)
Amount transferred to any fund specified under Schedule VII as per section 135(6),
if any
Amount remaining to be spent in succeeding
financial years. (in Rs. Mn)Name of the
fundAmount (in Rs.)
Date of transfer
1. 2019-20 - 58.08 - - - 0.8
b) Details of CSR amount spent in the financial year for ongoing projects of the preceding financial year(s): Not applicable
10. In case of creation or acquisition of capital asset, furnish the details relating to the asset so created or acquired through CSR spent in the financial year: Not applicable
a) Date of creation or acquisition of the capital asset(s): Not applicable
b) Amount of CSR spent for creation or acquisition of capital asset: Not applicable
c) Details of the entity or public authority or beneficiary under whose name such capital asset is registered, their address etc.:
Not applicable
d) Provide details of the capital asset(s) created or acquired (including complete address and location of the capital asset): Not applicable
11. Specify the reason(s), if the company has failed to spend two per cent of the average net profit as per section 135(5): Not Applicable
FOR AND ON BEHALF OF BOARD OF DIRECTORS OF EMCURE PHARMACEUTICALS LIMITED
Place: Pune SHREEKANT BAPAT SATISH MEHTA Date: May 28, 2021 CHAIRMAN - CSR COMMITTEE MANAGING DIRECTOR & CEO
DIN: 00621568 DIN: 00118691
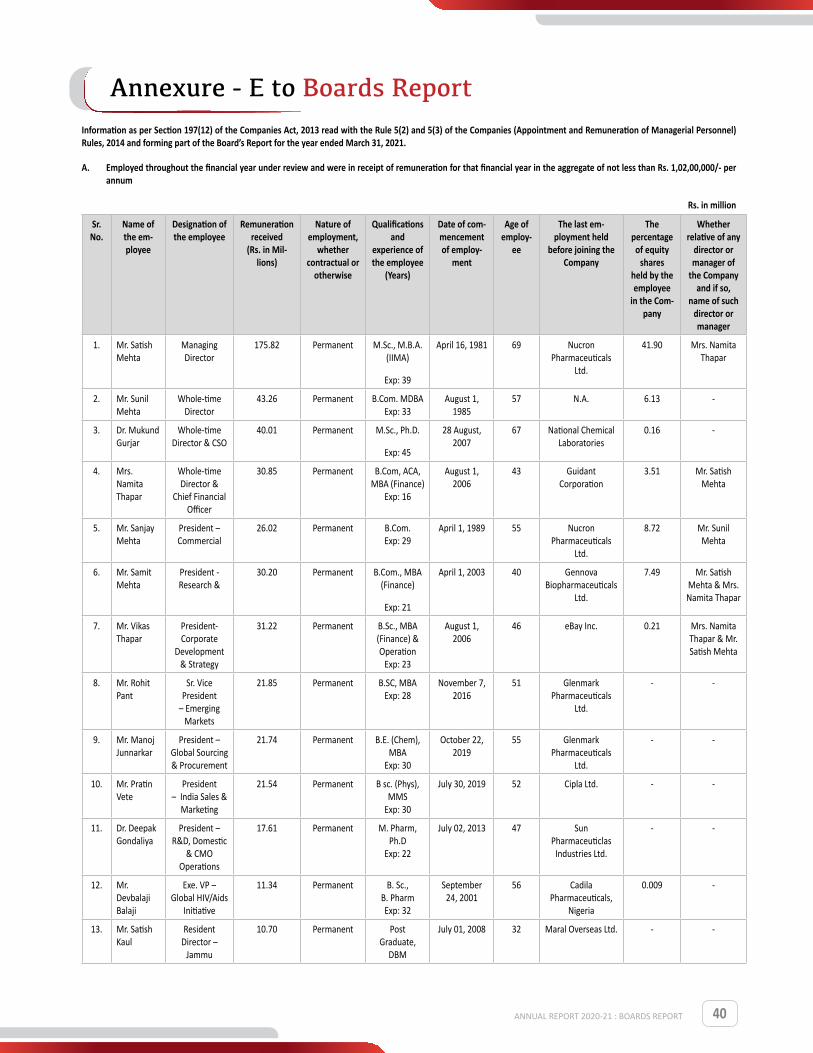
40
Information as per Section 197(12) of the Companies Act, 2013 read with the Rule 5(2) and 5(3) of the Companies (Appointment and Remuneration of Managerial Personnel) Rules, 2014 and forming part of the Board’s Report for the year ended March 31, 2021.
A. Employed throughout the financial year under review and were in receipt of remuneration for that financial year in the aggregate of not less than Rs. 1,02,00,000/- per annum
Rs. in million
Sr. No.
Name of the em-ployee
Designation of the employee
Remuneration received
(Rs. in Mil-lions)
Nature of employment,
whether contractual or
otherwise
Qualifications and
experience of the employee
(Years)
Date of com-mencement of employ-
ment
Age of employ-
ee
The last em-ployment held
before joining the Company
The percentage
of equity shares
held by the employee
in the Com-pany
Whether relative of any
director or manager of
the Company and if so,
name of such director or manager
1. Mr. Satish Mehta
Managing Director
175.82 Permanent M.Sc., M.B.A. (IIMA)
Exp: 39
April 16, 1981 69 Nucron Pharmaceuticals
Ltd.
41.90 Mrs. Namita Thapar
2. Mr. Sunil Mehta
Whole-time Director
43.26 Permanent B.Com. MDBA Exp: 33
August 1, 1985
57 N.A. 6.13 -
3. Dr. Mukund Gurjar
Whole-time Director & CSO
40.01 Permanent M.Sc., Ph.D.
Exp: 45
28 August, 2007
67 National Chemical Laboratories
0.16 -
4. Mrs. Namita Thapar
Whole-time Director &
Chief Financial Officer
30.85 Permanent B.Com, ACA, MBA (Finance)
Exp: 16
August 1, 2006
43 Guidant Corporation
3.51 Mr. Satish Mehta
5. Mr. Sanjay Mehta
President – Commercial
26.02 Permanent B.Com. Exp: 29
April 1, 1989 55 Nucron Pharmaceuticals
Ltd.
8.72 Mr. Sunil Mehta
6. Mr. Samit Mehta
President - Research &
30.20 Permanent B.Com., MBA (Finance)
Exp: 21
April 1, 2003 40 Gennova Biopharmaceuticals
Ltd.
7.49 Mr. Satish Mehta & Mrs. Namita Thapar
7. Mr. Vikas Thapar
President-Corporate
Development & Strategy
31.22 Permanent B.Sc., MBA (Finance) & Operation
Exp: 23
August 1, 2006
46 eBay Inc. 0.21 Mrs. Namita Thapar & Mr. Satish Mehta
8. Mr. Rohit Pant
Sr. Vice President
– Emerging Markets
21.85 Permanent B.SC, MBA Exp: 28
November 7, 2016
51 Glenmark Pharmaceuticals
Ltd.
- -
9. Mr. Manoj Junnarkar
President – Global Sourcing & Procurement
21.74 Permanent B.E. (Chem), MBA
Exp: 30
October 22, 2019
55 Glenmark Pharmaceuticals
Ltd.
- -
10. Mr. Pratin Vete
President – India Sales &
Marketing
21.54 Permanent B sc. (Phys), MMS
Exp: 30
July 30, 2019 52 Cipla Ltd. - -
11. Dr. Deepak Gondaliya
President – R&D, Domestic
& CMO Operations
17.61 Permanent M. Pharm, Ph.D
Exp: 22
July 02, 2013 47 Sun Pharmaceuticlas
Industries Ltd.
- -
12. Mr. Devbalaji Balaji
Exe. VP – Global HIV/Aids
Initiative
11.34 Permanent B. Sc., B. Pharm Exp: 32
September 24, 2001
56 Cadila Pharmaceuticals,
Nigeria
0.009 -
13. Mr. Satish Kaul
Resident Director –
Jammu
10.70 Permanent Post Graduate,
DBM
July 01, 2008 32 Maral Overseas Ltd. - -
ANNUAL REPORT 2020-21 : BOARDS REPORT
Annexure - E to Boards Report
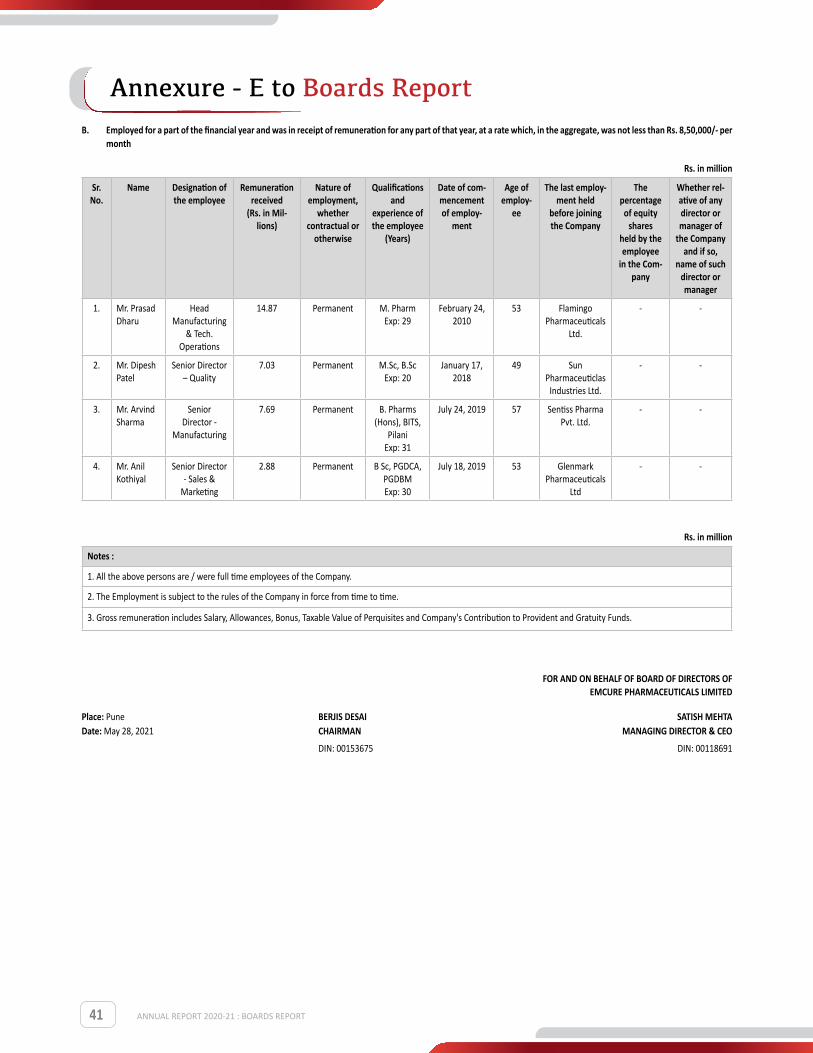
41
B. Employed for a part of the financial year and was in receipt of remuneration for any part of that year, at a rate which, in the aggregate, was not less than Rs. 8,50,000/- per month
Rs. in million
Sr. No.
Name Designation of the employee
Remuneration received
(Rs. in Mil-lions)
Nature of employment,
whether contractual or
otherwise
Qualifications and
experience of the employee
(Years)
Date of com-mencement of employ-
ment
Age of employ-
ee
The last employ-ment held
before joining the Company
The percentage
of equity shares
held by the employee
in the Com-pany
Whether rel-ative of any director or manager of
the Company and if so,
name of such director or manager
1. Mr. Prasad Dharu
Head Manufacturing
& Tech. Operations
14.87 Permanent M. Pharm Exp: 29
February 24, 2010
53 Flamingo Pharmaceuticals
Ltd.
- -
2. Mr. Dipesh Patel
Senior Director – Quality
7.03 Permanent M.Sc, B.Sc Exp: 20
January 17, 2018
49 Sun Pharmaceuticlas
Industries Ltd.
- -
3. Mr. Arvind Sharma
Senior Director -
Manufacturing
7.69 Permanent B. Pharms (Hons), BITS,
Pilani Exp: 31
July 24, 2019 57 Sentiss Pharma Pvt. Ltd.
- -
4. Mr. Anil Kothiyal
Senior Director - Sales &
Marketing
2.88 Permanent B Sc, PGDCA, PGDBM Exp: 30
July 18, 2019 53 Glenmark Pharmaceuticals
Ltd
- -
Rs. in million
Notes :
1. All the above persons are / were full time employees of the Company.
2. The Employment is subject to the rules of the Company in force from time to time.
3. Gross remuneration includes Salary, Allowances, Bonus, Taxable Value of Perquisites and Company's Contribution to Provident and Gratuity Funds.
FOR AND ON BEHALF OF BOARD OF DIRECTORS OF EMCURE PHARMACEUTICALS LIMITED
Place: Pune BERJIS DESAI SATISH MEHTA Date: May 28, 2021 CHAIRMAN MANAGING DIRECTOR & CEO
DIN: 00153675 DIN: 00118691
ANNUAL REPORT 2020-21 : BOARDS REPORT
Annexure - E to Boards Report

42
Annexure – F to Board’s Report
Information pertaining to the conservation of energy, technology absorption and foreign exchange earnings and outgo pursuant to Section 134(3)(m) of the Companies Act, 2013 read with Rule 8 (3) of the Companies (Accounts) Rules, 2014.
A. Conservation of Resources
a) Steps taken or impact on conservation of resources
Energy conservation continues to receive top priority in the Company. Consumption monitored; maintenance systems improved and distribution losses are reduced.
Specific Energy conservation measures undertaken by the Company are as follows:
1. By controlling valve and water balancing Operate Only One chiller instead of two chillers (Plant-III Hinjewadi).
2. Installed Auto condenser cleaning system for 400 TR chiller (Plant-III Hinjewadi).
3. Boiler wall repairing to increase boiler efficiency. 2-3% rise in efficiency (KK Plant).
4. ATS implementation on Chiller evaporator to achieve approach. Expenditure (KK plants).
5. Cleaning of hot-well cold well tank for cooling tower and chiller to maintain efficiency (KK Plant).
6. Switched over to LED light fixtures at most of the locations (KK plant)
7. Reactor 4 no’s DOL feeder converted on VFD feeder installed at API-1 Plant (KK plant)
8. VFD installed for Jockey Pump smooth operation at Pump House to avoid frequent damage of seals (KK plant)
9. In plant IIA service floor existing 2 inch size, 4 and 9 micron filter housing replace with new one 4 inch size. Due to which compressed air discharge pressure set point change from 7.6 to 7.0 (OSD plant Hinjewadi).
10. VFD installation for axial flow fan(Exhaust) of Plant-I service floor (OSD plant Hinjewadi).
11. For plant I purified water storage and distribution system, hot water sanitization frequency change from daily to twice in week (OSD plant Hinjewadi).
12. For coating machine(VEHT/AC/002) Plant II exhaust blower of 15 HP removed from existing operation. (OSD plant Hinjewadi).
13. For cooling tower fan(qty-02) variable frequency drive installed with temp sensor feedback (OSD plant Hinjewadi).
14. Use of EC motors in AHUs, wherever possible (OSD Plant Hinjwadi).
15. VFD installation for pump of AHU hot water system (OSD Plant Hinjwadi).
16. Water recirculation system installed in all steam sterilizer (04 nos) for DRO water saving (Sanand Plant).
17. Water preheater installation in Both boiler (3.0 TPH & 5.0 TPH) for fuel saving (Sanand Plant).
18. Timer base operation in FCUs of canteen and corridor/office/change
room of QC area (Sanand Plant).
19. Earlier we were using used CFL rods which were send received from Pune plane. After consuming that old CFL rods stocks now we started switching over to LED light fixtures at most of the locations. (Jammu Plant).
20. RO Reject water used in cooling tower. EPL – 765 KL (Jammu Plant).
21. ACF Backwash water to soak pit – 4388 KL water to soak pit (Jammu Plant).
22. Condensate from traps to soak pit – 2749 KL condensate to soak pit (Jammu Plant).
23. Effluent Treatment Plant (ETP) installed in all sites to recycle the wastewater.
24. Treated water from ETPs used for house keeping activities and gardening purposes.
25. Concept of Zero Liquid Discharge (ZLD) is being explored for feasibility and to understand associated challenges so as to identify mitigation measures for replication across business.
b) The steps taken by the company for utilising alternate sources of energy
The Company continues to evaluate alternate sources of energy and at present, we have installed solar power generation systems for three facilities viz. EPL, Hinjawadi, Urse Warehouse and ZHL, Sikkim. In addition to this, we are exploring feasibility of similar projects for other sites as well to reduce dependency on conventional energy sources.
c) The capital investment on energy conservation equipment’s
Capital investment of Rs. 7.58 Mn was made on energy conservation equipment’s.
Particulars of technology absorption required under the Companies (Accounts) Rules, 2014
B. Technology Absorption:
1. Efforts, in brief, made towards technology absorption:
Research & Development (‘R&D’) as it’s core strength, has indulged into research of newer ways to deliver molecules for effective actions. In effort, new products and formulations for newer applications were developed through comparative bio-availability and bioequivalence studies at R & D activity.
R&D is working vigorously for development of novel drug delivery system like liposomal delivery, nanoparticles, lipid complex and micro-emulsion. Some of the products like liposomal delivery are advancing towards commercialization. Emcure has extended its arms in Transdermal Drug delivery system and achieved success. Moreover, we have broadened our research field and entered into depot injection (long acting microspheres). Novel research is ongoing in safety & efficacy enhancement for cytotoxic drug product.
The research team has developed and commercialized extended release dosage forms, multi particulate systems, pulsatile drug delivery system, osmotic drug delivery system, powder for suspension, etc. The vast experience of the research team in anti-retroviral products has led to commercialization of many first to market fixed dose combination products. The research team has shown remarkable capability in development and commercialization of immunosuppressant and hormonal products.
ANNUAL REPORT 2020-21 : BOARDS REPORT
Annexure - F to Boards Report
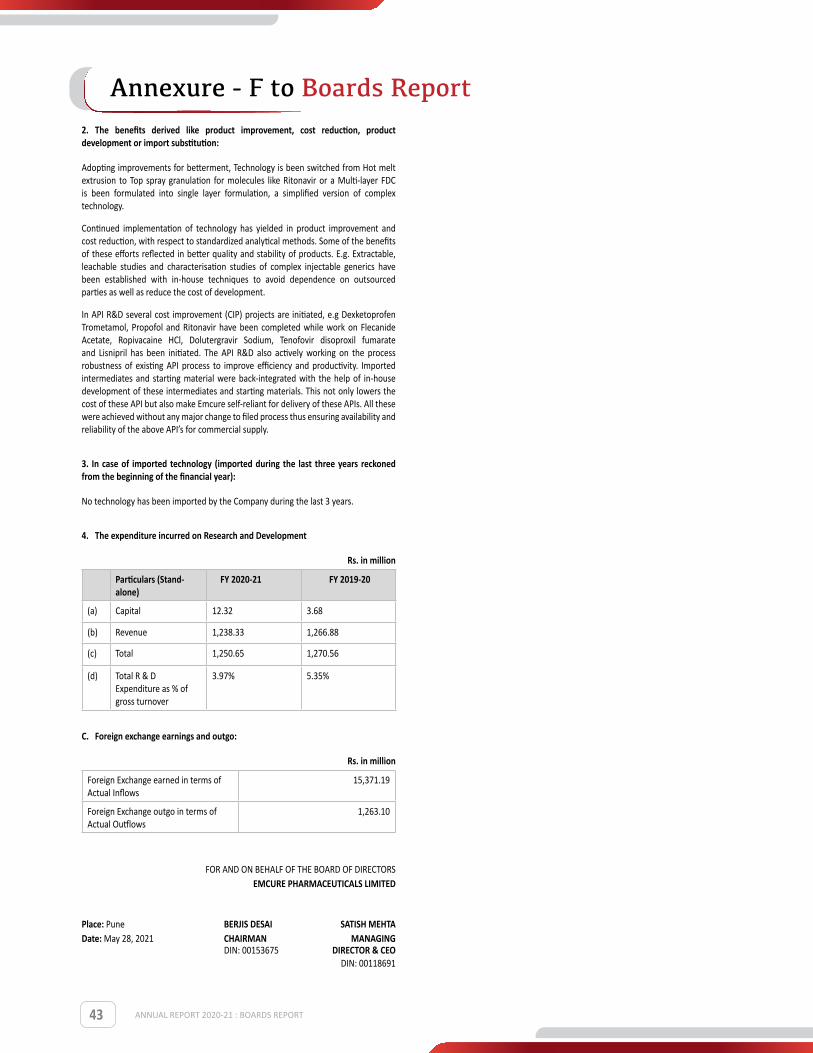
43
2. The benefits derived like product improvement, cost reduction, product development or import substitution:
Adopting improvements for betterment, Technology is been switched from Hot melt extrusion to Top spray granulation for molecules like Ritonavir or a Multi-layer FDC is been formulated into single layer formulation, a simplified version of complex technology.
Continued implementation of technology has yielded in product improvement and cost reduction, with respect to standardized analytical methods. Some of the benefits of these efforts reflected in better quality and stability of products. E.g. Extractable, leachable studies and characterisation studies of complex injectable generics have been established with in-house techniques to avoid dependence on outsourced parties as well as reduce the cost of development.
In API R&D several cost improvement (CIP) projects are initiated, e.g Dexketoprofen Trometamol, Propofol and Ritonavir have been completed while work on Flecanide Acetate, Ropivacaine HCl, Dolutergravir Sodium, Tenofovir disoproxil fumarate and Lisnipril has been initiated. The API R&D also actively working on the process robustness of existing API process to improve efficiency and productivity. Imported intermediates and starting material were back-integrated with the help of in-house development of these intermediates and starting materials. This not only lowers the cost of these API but also make Emcure self-reliant for delivery of these APIs. All these were achieved without any major change to filed process thus ensuring availability and reliability of the above API’s for commercial supply.
3. In case of imported technology (imported during the last three years reckoned from the beginning of the financial year):
No technology has been imported by the Company during the last 3 years.
4. The expenditure incurred on Research and Development
Rs. in million
Particulars (Stand-alone)
FY 2020-21 FY 2019-20
(a) Capital 12.32 3.68
(b) Revenue 1,238.33 1,266.88
(c) Total 1,250.65 1,270.56
(d) Total R & D Expenditure as % of gross turnover
3.97% 5.35%
C. Foreign exchange earnings and outgo:
Rs. in million
Foreign Exchange earned in terms of Actual Inflows
15,371.19
Foreign Exchange outgo in terms of Actual Outflows
1,263.10
FOR AND ON BEHALF OF THE BOARD OF DIRECTORSEMCURE PHARMACEUTICALS LIMITED
Place: Pune BERJIS DESAI SATISH MEHTA Date: May 28, 2021 CHAIRMAN MANAGING DIN: 00153675 DIRECTOR & CEO DIN: 00118691
ANNUAL REPORT 2020-21 : BOARDS REPORT
Annexure - F to Boards Report
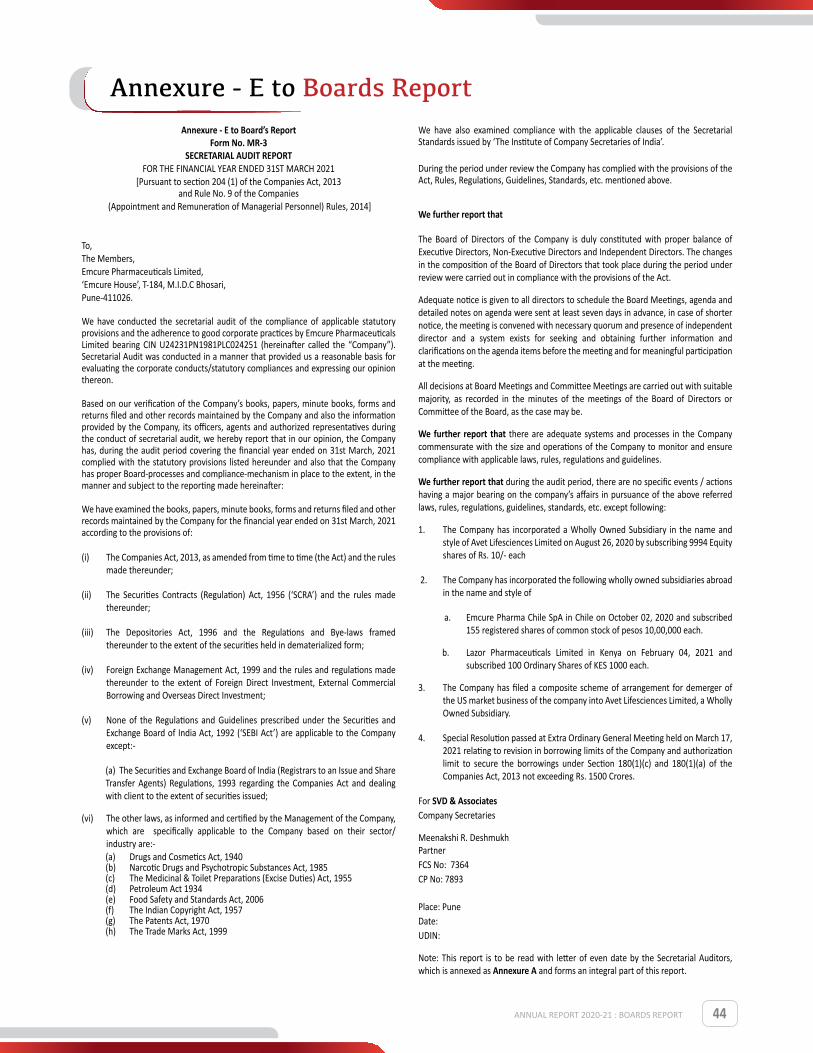
44ANNUAL REPORT 2020-21 : BOARDS REPORT
Annexure - E to Boards ReportAnnexure - E to Board’s Report
Form No. MR-3 SECRETARIAL AUDIT REPORT
FOR THE FINANCIAL YEAR ENDED 31ST MARCH 2021[Pursuant to section 204 (1) of the Companies Act, 2013
and Rule No. 9 of the Companies (Appointment and Remuneration of Managerial Personnel) Rules, 2014]
To,The Members,Emcure Pharmaceuticals Limited,‘Emcure House’, T-184, M.I.D.C Bhosari,Pune-411026.
We have conducted the secretarial audit of the compliance of applicable statutory provisions and the adherence to good corporate practices by Emcure Pharmaceuticals Limited bearing CIN U24231PN1981PLC024251 (hereinafter called the “Company”). Secretarial Audit was conducted in a manner that provided us a reasonable basis for evaluating the corporate conducts/statutory compliances and expressing our opinion thereon.
Based on our verification of the Company’s books, papers, minute books, forms and returns filed and other records maintained by the Company and also the information provided by the Company, its officers, agents and authorized representatives during the conduct of secretarial audit, we hereby report that in our opinion, the Company has, during the audit period covering the financial year ended on 31st March, 2021 complied with the statutory provisions listed hereunder and also that the Company has proper Board-processes and compliance-mechanism in place to the extent, in the manner and subject to the reporting made hereinafter:
We have examined the books, papers, minute books, forms and returns filed and other records maintained by the Company for the financial year ended on 31st March, 2021 according to the provisions of:
(i) The Companies Act, 2013, as amended from time to time (the Act) and the rules made thereunder;
(ii) The Securities Contracts (Regulation) Act, 1956 (‘SCRA’) and the rules made thereunder;
(iii) The Depositories Act, 1996 and the Regulations and Bye-laws framed thereunder to the extent of the securities held in dematerialized form;
(iv) Foreign Exchange Management Act, 1999 and the rules and regulations made thereunder to the extent of Foreign Direct Investment, External Commercial Borrowing and Overseas Direct Investment;
(v) None of the Regulations and Guidelines prescribed under the Securities and Exchange Board of India Act, 1992 (‘SEBI Act’) are applicable to the Company except:-
(a) The Securities and Exchange Board of India (Registrars to an Issue and Share Transfer Agents) Regulations, 1993 regarding the Companies Act and dealing with client to the extent of securities issued;
(vi) The other laws, as informed and certified by the Management of the Company, which are specifically applicable to the Company based on their sector/ industry are:-(a) Drugs and Cosmetics Act, 1940(b) Narcotic Drugs and Psychotropic Substances Act, 1985(c) The Medicinal & Toilet Preparations (Excise Duties) Act, 1955(d) Petroleum Act 1934(e) Food Safety and Standards Act, 2006(f) The Indian Copyright Act, 1957(g) The Patents Act, 1970(h) The Trade Marks Act, 1999
We have also examined compliance with the applicable clauses of the Secretarial Standards issued by ‘The Institute of Company Secretaries of India’.
During the period under review the Company has complied with the provisions of the Act, Rules, Regulations, Guidelines, Standards, etc. mentioned above.
We further report that
The Board of Directors of the Company is duly constituted with proper balance of Executive Directors, Non-Executive Directors and Independent Directors. The changes in the composition of the Board of Directors that took place during the period under review were carried out in compliance with the provisions of the Act.
Adequate notice is given to all directors to schedule the Board Meetings, agenda and detailed notes on agenda were sent at least seven days in advance, in case of shorter notice, the meeting is convened with necessary quorum and presence of independent director and a system exists for seeking and obtaining further information and clarifications on the agenda items before the meeting and for meaningful participation at the meeting.
All decisions at Board Meetings and Committee Meetings are carried out with suitable majority, as recorded in the minutes of the meetings of the Board of Directors or Committee of the Board, as the case may be.
We further report that there are adequate systems and processes in the Company commensurate with the size and operations of the Company to monitor and ensure compliance with applicable laws, rules, regulations and guidelines.
We further report that during the audit period, there are no specific events / actions having a major bearing on the company’s affairs in pursuance of the above referred laws, rules, regulations, guidelines, standards, etc. except following:
1. The Company has incorporated a Wholly Owned Subsidiary in the name and style of Avet Lifesciences Limited on August 26, 2020 by subscribing 9994 Equity shares of Rs. 10/- each
2. The Company has incorporated the following wholly owned subsidiaries abroad in the name and style of
a. Emcure Pharma Chile SpA in Chile on October 02, 2020 and subscribed 155 registered shares of common stock of pesos 10,00,000 each.
b. Lazor Pharmaceuticals Limited in Kenya on February 04, 2021 and subscribed 100 Ordinary Shares of KES 1000 each.
3. The Company has filed a composite scheme of arrangement for demerger of the US market business of the company into Avet Lifesciences Limited, a Wholly Owned Subsidiary.
4. Special Resolution passed at Extra Ordinary General Meeting held on March 17, 2021 relating to revision in borrowing limits of the Company and authorization limit to secure the borrowings under Section 180(1)(c) and 180(1)(a) of the Companies Act, 2013 not exceeding Rs. 1500 Crores.
For SVD & AssociatesCompany Secretaries
Meenakshi R. Deshmukh Partner FCS No: 7364CP No: 7893
Place: Pune Date: UDIN:
Note: This report is to be read with letter of even date by the Secretarial Auditors, which is annexed as Annexure A and forms an integral part of this report.
45 ANNUAL REPORT 2020-21 : BOARDS REPORT
Annexure - E to Boards Report‘ANNEXURE A’
To,Members, Emcure Pharmaceuticals Limited,‘Emcure House’, T-184, M.I.D.C Bhosari,Pune-411026.
Our Secretarial Audit Report of even date is to be read along with this letter.
Management’s Responsibility
1. It is the responsibility of the management of the Company to maintain secretarial records, devise proper systems to ensure compliance with the provisions of all applicable laws and regulations and to ensure that the systems are adequate and operate effectively.
Auditor’s Responsibility
2. Our responsibility is to express an opinion on these secretarial records, standards and procedures followed by the Company with respect to secretarial compliances.
3. We believe that audit evidence and information obtained from the Company’s management is adequate and appropriate for us to provide a basis for our opinion.
4. We have physically verified the documents and evidences and also relied on data provided on electronic mode to us, in view of the prevailing Pandemic situation of COVID-19.
5. Wherever required, we have obtained the management’s representation about the compliance of laws, rules and regulations and happening of events, etc.
Disclaimer
6. The Secretarial Audit Report is neither an assurance as to the future viability of the Company nor of the efficacy or effectiveness with which the management has conducted the affairs of the Company.
7. We have not verified the correctness and appropriateness of financial records and books of accounts of the Company
For SVD & AssociatesCompany Secretaries
Meenakshi R. Deshmukh
Partner FCS No: 7364CP No: 7893
Place: Pune Date: May 28, 2021UDIN:

46
THE COMPANY’S PHILOSOPHY ON CODE OF GOVERNANCE :The Company has always been committed to the practice of good Corporate Governance. Being a global Company, the Company has identified accountability, integrity and transparency in its affairs as the quintessential elements of attaining its goals. The Company aims at improving its shareholders’ wealth by focusing on best ethical practices of good Corporate Governance. The Company seeks to protect the interest of its shareholders, employees and other stakeholders by following such good Corporate Governance practices. Although not mandatory, this approach will help the Company become compliant as and when the code becomes applicable to the Company in the future.
I. BOARD OF DIRECTORS :Composition :The Company has an optimum combination of Board comprising of Eleven Directors, of whom, four are Whole-time Directors including the Managing Director, five Non-Executive and Independent Directors including the Chairman and two Non-Executive and Non-Independent Directors. All the Non-Executive Directors possess varied and rich experience in their respective fields and provide independent judgement on issues connected with strategic planning, business development and standards of conduct. All Directors, except Mr. Satish Mehta, Mr. Samonnoi Banerjee and Independent Directors appointed under the provisions of the Companies Act, 2013, are liable to retire by rotation.
* Number of Directorships exclude Directorships in Companies incorporated outside India.** For the purpose of computing the number of committees, membership/ chairmanship of the Audit Committee and Investor Grievance/stakeholder relationship Committee have been considered.*** Dr. Shailesh Ayyangar, Mr. Vijay Gokhale and Dr. Vidya Yeravdekar were appointed as Additional Directors of the Company with effect from April 16, 2021.
a) Details of the Board of Directors:
Name of the Director
Relationship with other Directors Category
No. of Board Meetings at-
tended
No. of other Directorships
held*
Committees of which**
Member Chairman
Mr. Berjis Desai -Independent &Non-Executive Director
5 11 5 3
Mr. Humayun Dhanrajgir
-Independent & Non-Executive Director (Chairman)
5 6 2 1
Dr. Mukund Gurjar - Whole-time Director 5 Nil Nil Nil
Mrs. Namita ThaparDaughter of Mr. Satish Mehta, Managing Director & CEO
Whole-time Director &Chief Financial Officer
5 4 Nil 1
Mr. Samonnoi Banerjee - Non-Executive Director 5 Nil Nil Nil
Mr. Satish MehtaFather of Mrs. Namita Thapar, Whole-time Director
Promoter &Managing Director
5 3 2 Nil
Mr. Shreekant Bapat -Independent & Non-Executive Director
5 3 Nil 3
Mr. Sunil Mehta -Promoter & Whole-time Director
5 2 1 Nil
Mr. Palamadai Jayakumar
-Independent &Non-Executive Director
3 11 6 4
***Dr. Shailesh Ayyangar
- Additional Director NA 2 1 Nil
***Mr. Vijay Gokhale - Additional Director NA Nil Nil Nil
***Dr. Vidya Yeravdekar Additional Director NA 4 Nil Nil
ANNUAL REPORT 2020-21 : CORPORATE GOVERNANCE REPORT
Corporate Governance Report

47
b) Details of Board Meetings and Attendance :The Board meets at least once in each quarter and the gap between any two Board meetings was not more than 120 days. During the financial year ended March 31, 2021, five Board Meetings were held on the following dates –
Sr. No. Date of Meeting Board Strength No. of Directors
present
1 May 29, 2020 8 8
2 July 22, 2020 8 8
3 September 28, 2020 9 9
4 November 9, 2020 9 9
5 February 04, 2021 9 9
A. None of the Non-Executive Directors of the Company, has any pecuniary relationship or transactions with the Company other than sitting fees paid for attending Board Meetings/ committee meetings and commission, if any payable.
B. Mr. Satish Mehta, Mrs. Namita Thapar, Dr. Mukund Gurjar and Mr. Sunil Mehta attended the last Annual General Meeting of the Company held on August 21, 2020.
c) Meeting of Independent Directors:A meeting of the Independent Directors was held on July 22, 2020 wherein, the Independent Directors evaluated the performance of the Non-Independent Directors, performance of the Board as a whole and also that of the Chairman in terms of the provisions of the Companies Act, 2013.
Brief Resume, Other Directorships and Committee Memberships of Director seeking Re-appointment at the forthcoming Annual General Meeting :
Director liable to retire by rotation seeking re-appointment
Dr. Mukund Gurjar Dr. Mukund Gurjar is a Whole-time Director and Chief Scientific Officer (Research and Development) of our Company. He is a graduate, a post graduate and Ph.D. in Chemistry from the Nagpur University. He also holds a second Ph. D. degree in Chemistry from the London University, United Kingdom as well as a post-doctoral fellowship from Toronto, Canada. Prior to joining our Company, he was the deputy director of the National Chemical Laboratory, Pune where he spent 28 years spearheading innovative and advance research in Organic Chemistry. He has over 40 years of experience in pharmaceutical sciences and is a fellow at various national and international academies. He has been associated with our Company since 2001 and also became a member of the Board in the same year.
List of other Directorships (excluding Bodies Corporate)
Chairmanship/Membership of the Com-mittees of the Board of Directors of other companies on which he is a Director (only Audit committee and Investor Grievance committee)
NIL NIL
II. BOARD COMMITTEES:
As mandated under the Companies Act, 2013, the Board has constituted the following Committees viz. Audit Committee, Nomination and Remuneration Committee, Investor Grievance & Share Transfer Committee and Corporate Social Responsibility Committee. The terms of reference of the Board Committees are determined by the Board from time to time. The Board is responsible for constituting, assigning and co-opting the members of the Committees.
1. Audit Committee:• The Primary objective of the Committee is to monitor and provide
effective supervision of the management’s financial reporting process to ensure accurate and timely disclosures with the highest levels of transparency, integrity and quality of financial reporting.
Terms of Reference:
a) To review and monitor the auditor’s independence and performance and effectiveness of audit process;
b) To approve transactions of the Company with related parties of the Company and/or any subsequent modification thereof;
c) To review and scrutinize inter-corporate loans and investments on periodical basis;
d) To undertake valuation of undertakings or assets of the Company, wherever it is necessary;
e) To evaluate internal financial controls and risk management systems;
f) To consider appointment of Registered Valuers;
g) Recommendation for appointment, remuneration and terms of appointment of the auditors.
h) To review the reports/ certificates placed before it, as mandated by Companies Act, 2013;
i) To monitor the effectiveness of the Company’s governance practices and making changes as needed;
j) To ascertain and ensure that the Company has an adequate and functional vigil mechanism and ensuring that the interest of a person, who uses such a mechanism, is not prejudicially affected on account of such use, as and when applicable;
k) To report concerns about unethical behaviour, actual or suspected fraud or violation of the Company’s Code of Conduct or Ethics Policy;
l) The Audit Committee may call for the comments of the auditors about internal control systems, the scope of audit, including the observations of the auditors and review of financial statement before their submission to the Board and may also discuss any related issues with the internal and statutory auditors and the management of the Company;
m) The Audit Committee shall have authority to investigate into any matter in relation to the items specified in sub-section (4) of Section 177 of the Companies Act 2013 or referred to it by the Board and for this purpose shall have power to obtain professional advice from external sources and have full access to information contained in the records of the Company;
n) Any other matters / authorities / responsibilities / powers assigned as per Companies Act, 2013 and Rules made thereunder, as amended from time to time.
• Details of the composition and attendance of Members of the Audit Committee during the Financial Year 2020-21 are as follows:
During the year under review, the Audit Committee was reconstituted in the Board meeting held on July 22, 2020, which comprises five members viz. Mr. Shreekant Bapat, as Chairman of the Committee, Mr. Humayun Dhanrajgir, Mr. Berjis Desai, Mrs. Namita Thapar and Mr. Palamadai Jayakumar as Members of the Committee. Mr. Satish Mehta, Managing Director & CEO, is permanent Invitee to the Audit Committee Meetings. The representatives of Statutory Auditors and the Internal Auditors attend the Audit Committee meetings by invitation. The Company Secretary acts as a Secretary to the Committee.
ANNUAL REPORT 2020-21 : CORPORATE GOVERNANCE REPORT
Corporate Governance Report

48
Name of the MemberNo. of meetings
Category of DirectorshipHeld Attended
Mr. Shreekant Bapat 5 5 Independent Director
Mr. Humayun Dhanrajgir*
5 5 Independent Director
Mr. Berjis Desai 5 5 Independent Director
Mrs. Namita Thapar 5 5 Whole-time Director
Mr. Palamadai Jayakumar**
5 2 Independent Director
* Mr. Humayun Dhanrajgir has resigned as Chairman and Non-Executive Director of the Company and also as member of Audit Committee w.e.f. April 16, 2021.** Mr. Palamadai Jayakumar was inducted as member of the Audit Committee w.e.f. July 22, 2020.
2. Nomination and Remuneration Committee:
• The Committee has been formed in compliance with the provisions of Section 178 of the Companies Act, 2013. The purpose of this committee of the Board of Directors (‘the Board’) shall be to discharge the Board’s responsibilities related to nomination and remuneration of the Company’s Managing Director/Whole-time directors/non-executive directors. The committee has the overall responsibility of approving and evaluating the nomination and remuneration plans, policies and programs for Whole-time directors/non-executive directors, Key Managerial Personnel and other employees.
• Terms of Reference:
a) Reviewing the structure, size and composition of the Board and making recommendations to the Board with regard to changes, if any.
b) Identifying persons who are qualified to become directors and who may be appointed to senior management and recommending to the Board their appointment and removal and shall carry out evaluation of every director’s performance.
c) Formulating the criteria for determining qualifications, positive attributes and independence of a director.
d) Devising a policy on Board diversity.
e) Recommending to the Board a policy relating to the remuneration for the Directors, Key Managerial Personnel and other employees.
f) Overseeing the Company’s Stock option schemes and long term incentive plans which include determination of the eligibility for benefits and approval of total annual payments.
g) Policy on evaluation of the Board.
• Details of the composition and attendance of Members of the Nomination and Remuneration Committee during the financial year 2020-21:
The Nomination and Remuneration Committee comprises of Mr. Shreekant Bapat, as Chairman of the Committee, Mr. Humayun Dhanrajgir, Mr. Berjis Desai and Mr. Samonnoi Banerjee as Members of the Committee.
Three Nomination and Remuneration Committee meetings were held on the following dates – July 22, 2020, November 9, 2020 and February 04, 2021.
Name of the MemberNo. of meetings
Category of DirectorshipHeld Attended
Mr. Shreekant Bapat 3 3 Independent Director
Mr. Humayun Dhanrajgir
3 3 Independent Director
Mr. Berjis Desai 3 3 Independent Director
Mr. Samonnoi Banerjee
3 3 Non-Executive Director
• Compensation Policy:
The Company follows a market linked remuneration policy, which is aimed at enabling the Company to attract and retain the best talent. Compensation is also linked to individual and team performance as they support the achievement of Corporate Goal.
• Board Performance Evaluation:
The Company has devised a performance Evaluation Framework and policy, which sets out a mechanism for the evaluation of the Board and the Directors.
Performance evaluation of the Board and the Directors was carried out through an evaluation mechanism in terms of the aforesaid Performance Evaluation Framework and Policy.
3. Investor Grievance & Share Transfer Committee:
• The Investor Grievance & Share Transfer (IGST) Committee was constituted to deal with transfer/ transmission of shares and all other incidental and allied matters in respect of the shares of the Company and to look into the issues relating to Investors Grievances.
• Details of the composition and attendance of Members of the IGST Committee during the Financial Year 2020-21.
The Committee comprises of Mr. Shreekant Bapat, as Chairman of the Committee, Mr. Satish Mehta and Mr. Berjis Desai as Members of the Committee.
During the year, the Company and/or its Registrar and Share Transfer agent did not receive any complaints from the shareholders of the Company. No complaints were outstanding at the beginning of the current financial year.
III. REMUNERATION OF DIRECTORS:
A. Particulars of Commission and sitting fees paid to Non-Executive Directors during the financial year ended March 31, 2021:
(Rs. In Million)
Sr. No. Names of Directors Commission
Fee for attending
Board/ Committee Meetings
1. Mr. Humayun Dhanrajgir
2.00 0.28
2. Mr. Berjis Desai 3.50 0.28
3. Mr. Shreekant Bapat
2.50 0.34
4. Mr. Samonnoi Banerjee
Nil 0.16
5. Mr. Palamadai Jayakumar
2.40 0.10
TOTAL 10.40 1.16
The Non-Executive Directors are paid sitting fees of Rs. 20,000/- for each meeting of the Board and/or Committee attended by them.
The Shareholding of the Non-Executive/Independent Directors in the Company as on March 31, 2021:
Name of the Director No. of Equity shares held
Mr. Humayun Dhanrajgir 154,284
Mr. Berjis Desai 192,856
Mr. Shreekant Bapat 175,084
Mr. Samonnoi Banerjee Nil
Mr. Palamadai Jayakumar Nil
ANNUAL REPORT 2020-21 : CORPORATE GOVERNANCE REPORT
Corporate Governance Report

49
The Company enters into an agreement with all above mentioned Directors. Either party to an agreement is entitled to terminate the agreement by giving not less than 6 months’ notice in writing to the other party.
IV. GENERAL BODY MEETINGS:
The last three Annual General Meetings of the Company were held at the venue and time as under:
Sr. No. Year Venue Date & TimeSpecial
Resolution Passed
1. 2017-18 Plot No. P2, IT-BT Park, Phase II, M.I.D.C., Hinjawadi, Pune–411 057.
August 28, 201811.00 A.M.
Yes
2. 2018-19 Plot No. P2, IT-BT Park, Phase II, M.I.D.C., Hinjawadi, Pune–411 057.
August 19, 201910.00 A.M.
Yes
3. 2019-20 Plot No. P2, IT-BT Park, Phase II, M.I.D.C., Hinjawadi, Pune–411 057.
August 21,202012.00 P.M.
Yes
V. EXTRA-ORDINARY GENERAL MEETING:
During the year under review, one Extra-Ordinary General meeting was held on March 17, 2021 to transact the following businesses:
1. Revision in borrowing limits of the company and authorization limit to secure the borrowings under section 180(1) (c) and 180(1) (a) of the Companies Act, 2013.
VI. DISCLOSURES BY MANAGEMENT:
a) No material, financial and commercial transactions were reported by the management to the Board, in which the management had personal interest having a potential conflict with the interest of the Company at large.
b) The financial statement (both standalone and consolidated) have been prepared in accordance with the applicable accounting standards - the Indian Accounting Standards (Ind-AS).
c) The Company has a Vigil Mechanism/Whistle Blower Policy for employees to report concerns about unethical behaviour, actual or suspected fraud or violation of our code of conduct and confirms that no personnel have been denied access to the Audit Committee.
d) Disclosures in relation to the Sexual Harassment of Women at Workplace (Prevention, Prohibition and Redressal) Act, 2013:
a. Number of complaints filed during the Financial Year: Nil
b. Number of complaints disposed of during the Financial Year: Nil
c. Number of complaints pending as on end of the Financial Year: Nil
e) There are no transactions with the Director or management, their associates or their relatives etc. that may have potential conflict with the interest of the Company at large.
None of the transactions with any of related parties were in conflict with the Company’s interest. All related party transactions are negotiated on arm’s length basis and are intended to further the Company’s interests.
VII. GENERAL SHAREHOLDER INFORMATION:
(i) Annual General Meeting:Day & Date : July 30, 2021 Time : 11.00 a.mVenue : Plot No. P2, IT-BT Park, Phase II, M.I.D.C, Hinjawadi, Pune - 411057
(ii) Financial Year: April 01, 2020 to March 31, 2021
(iii) Date of Declaration of dividend: July 30, 2021
(iv) Website: https://emcure.com/
(v) Share transfer system: The IGST committee approves the transfers, transmissions, issue of duplicate share certificates etc.
For lodgement of transfer deeds and other documents, any grievances/ complaints, shareholders may contact the Company Secretary at the details mentioned under the address for correspondence.
(vi) Shareholding Pattern as on March 31, 2021:
Sr. No. Category No. of Shares % of Shareholding
1. Promoter and Promoter Group
14,77,47,252 81.70
2. Foreign Body Corporate
2,36,73,544 13.09
3. Others 94,31,320 5.21
Total 18,08,52,116 100
(vii) Dematerialisation of Shares:
All the Equity Shares of the Company representing 100% holding of the issued and paid-up share capital of the Company were held in dematerialised form.
ANNUAL REPORT 2020-21 : CORPORATE GOVERNANCE REPORT
Corporate Governance Report
B. Particulars of remuneration paid to the Managing Director/Whole-time Directors of the Company during the Financial Year 2020-21:
(Rs. In Million)
Name of the Director Period of Appointment Salary (p.a.)
Perquisites & Allowances (p.a.) Commission Retirement Benefits
(p.a.) Total
Mr. Satish Mehta Five years (from 1/4/2017 to 31/03/2022) 66.78 76.02 59.00 8.01 209.81
Mrs. Namita Thapar Five years (from 28/07/2019 to 27/07/2024)
12.47 16.09 - 2.16 30.72
Dr. Mukund Gurjar Five Years (from 28/08/2017 to 27/08/2022)
15.49 25.58 - 1.86 42.93
Mr. Sunil Mehta Five Years (from 05/06/2018 to 04/06/2023)
9.53 12.15 - 19.43 41.11

50
(viii) Outstanding GDRs/ADRs/Warrants or any convertible instruments, conversion date and likely impact on equity:
The Company has not issued GDRs/ADRs/Warrants or any other instrument convertible into equity.
(ix) Plant / R & D Locations:
• Plot 12/2, F-II Block, M.I.D.C, Pimpri, Pune- 411 018.
• Plot No. P-1 & P-2, M.I.D.C., Hinjawadi, Pune – 411 057.
• Plot No. D-24 and D-24/1, M.I.D.C., Kurkumbh, Taluka - Daund, District: Pune 413 802.
• SIDCO Industrial Estate, Lane No. 3, Phase II, Bari Brahmana, Jammu -181130.
• Plot No. C -10 (12), MIDC Bhosari, Pune 411 026.
• Plot No: SM-14, 15, 16-1 Sanand II, Charal Industrial Estate, GIDC, Tal: Sanand, Dist: Ahmedabad
• Survey No. 661, 671, Uvarsad Cross Road, Sarkhej – Gandhinagar Highway, Adalaj, Gandhinagar – 382 421 Gujarat.
• New Survey No. 485 (Old Survey 160 Paiki 1) at Kadu Taluka, Lakhtar, Surendranagar, Gujarat - 382775. (w.e.f. July 2020).
(x) Address for correspondenceCompany Secretary
“Emcure House” T-184, M.I.D.C
Bhosari, Pune -411026.
FOR AND ON BEHALF OF THE BOARD OF DIRECTORS EMCURE PHARMACEUTICALS LIMITED
Place: Pune BERJIS DESAI SATISH MEHTA Date: May 28 , 2021 CHAIRMAN MANAGING
DIN: 00153675 DIRECTOR & CEO DIN: 00118691
ANNUAL REPORT 2020-21 : CORPORATE GOVERNANCE REPORT
Corporate Governance Report

51
To the Members of Emcure Pharmaceuticals LimitedReport on the Audit of the Standalone Financial Statements
Opinion
We have audited the standalone financial statements of Emcure Pharmaceuticals Limited (“the Company”), which comprise the standalone balance sheet as at 31 March 2021, and the standalone statement of profit and loss (including other comprehensive income), standalone statement of changes in equity and standalone statement of cash flows for the year then ended, and notes to the standalone financial statements, including a summary of the significant accounting policies and other explanatory information.
In our opinion and to the best of our information and according to the explanations given to us, the aforesaid standalone financial statements give the information required by the Companies Act, 2013 (“Act”) in the manner so required and give a true and fair view in conformity with the accounting principles generally accepted in India, of the state of affairs of the Company as at 31 March 2021, and profit and other comprehensive income, changes in equity and its cash flows for the year ended on that date.
Basis for Opinion
We conducted our audit in accordance with the Standards on Auditing (SAs) specified under section 143(10) of the Act. Our responsibilities under those SAs are further described in the Auditor’s Responsibilities for the Audit of the Standalone Financial Statements section of our report. We are independent of the Company in accordance with the Code of Ethics issued by the Institute of Chartered Accountants of India together with the ethical requirements that are relevant to our audit of the standalone financial statements under the provisions of the Act and the Rules thereunder, and we have fulfilled our other ethical responsibilities in accordance with these requirements and the Code of Ethics. We believe that the audit evidence we have obtained is sufficient and appropriate to provide a basis for our opinion on the Standalone financial statements.
Emphasis of matter
We draw attention to Note 40 to the financial statements which describes the uncertainty related to the ultimate outcome of the Search and Seizure operation conducted by the Income Tax Department. The Company has not received any demand notices in relation to the Search and Seizure as at this date. Management is confident that no taxes will devolve on the Company and hence no provision has been recognised in these financial statements as at 31 March 2021. Though the Company has not received any demand notice till date, the uncertainty in the matter remains till the proceedings are concluded.
Our opinion is not qualified in respect of this matter.
Emphasis of matter
Other Information
The Company’s management and Board of Directors are responsible for the other information. The other information comprises the information included in the Company’s annual report, but does not include the financial statements and our auditors’ report thereon.
Our opinion on the standalone financial statements does not cover the other information and we do not express any form of assurance conclusion thereon.
In connection with our audit of the standalone financial statements, our responsibility is to read the other information and, in doing so, consider whether the other information is materially inconsistent with the standalone financial statements or our knowledge obtained in the audit or otherwise appears to be materially misstated. If, based on the work we have performed, we conclude that there is a material misstatement of this
other information, we are required to report that fact. We have nothing to report in this regard.
Management’s and Board of Directors’ Responsibility for the Standalone Financial Statements
The Company’s Management and Board of Directors are responsible for the matters stated in section 134(5) of the Act with respect to the preparation of these standalone financial statements that give a true and fair view of the state of affairs, profit and other comprehensive income, changes in equity and cash flows of the Company in accordance with the accounting principles generally accepted in India, including the Indian Accounting Standards (Ind AS) specified under section 133 of the Act. This responsibility also includes maintenance of adequate accounting records in accordance with the provisions of the Act for safeguarding of the assets of the Company and for preventing and detecting frauds and other irregularities; selection and application of appropriate accounting policies; making judgments and estimates that are reasonable and prudent; and design, implementation and maintenance of adequate internal financial controls that were operating effectively for ensuring accuracy and completeness of the accounting records, relevant to the preparation and presentation of the standalone financial statements that give a true and fair view and are free from material misstatement, whether due to fraud or error.
In preparing the standalone financial statements, the Management and Board of Directors are responsible for assessing the Company’s ability to continue as a going concern, disclosing, as applicable, matters related to going concern and using the going concern basis of accounting unless the Board of Directors either intends to liquidate the Company or to cease operations, or has no realistic alternative but to do so.
The Board of Directors is also responsible for overseeing the Company’s financial reporting process.
Auditor’s Responsibilities for the Audit of the Standalone Financial Statements
Our objectives are to obtain reasonable assurance about whether the standalone financial statements as a whole are free from material misstatement, whether due to fraud or error, and to issue an auditor’s report that includes our opinion.
Reasonable assurance is a high level of assurance, but is not a guarantee that an audit conducted in accordance with SAs will always detect a material misstatement when it exists. Misstatements can arise from fraud or error and are considered material if, individually or in the aggregate, they could reasonably be expected to influence the economic decisions of users taken on the basis of these standalone financial statements.
As part of an audit in accordance with SAs, we exercise professional judgment and maintain professional skepticism throughout the audit. We also:
• Identify and assess the risks of material misstatement of the standalone financial statements, whether due to fraud or error, design and perform audit procedures responsive to those risks, and obtain audit evidence that is sufficient and appropriate to provide a basis for our opinion. The risk of not detecting a material misstatement resulting from fraud is higher than for one resulting from error, as fraud may involve collusion, forgery, intentional omissions, misrepresentations, or the override of internal control.
• Obtain an understanding of internal control relevant to the audit in order to design audit procedures that are appropriate in the circumstances. Under section 143(3)(i) of the Act, we are also responsible for expressing our opinion on whether the company has adequate internal financial controls with reference to financial statements in place and the operating effectiveness of such controls.
• Evaluate the appropriateness of accounting policies used and the reasonableness of accounting estimates and related disclosures in the standalone financial statements made by the Management and Board of Directors.
• Conclude on the appropriateness of the Management and Board of Directors use of the going concern basis of accounting and, based on the audit evidence
ANNUAL REPORT 2020-21 : INDEPENDENT AUDITOR’S REPORT
Independent Auditor’s Report

52
obtained, whether a material uncertainty exists related to events or conditions that may cast significant doubt on the Company’s ability to continue as a going concern. If we conclude that a material uncertainty exists, we are required to draw attention in our auditor’s report to the related disclosures in the standalone financial statements or, if such disclosures are inadequate, to modify our opinion. Our conclusions are based on the audit evidence obtained up to the date of our auditor’s report. However, future events or conditions may cause the Company to cease to continue as a going concern.
• Evaluate the overall presentation, structure and content of the standalone financial statements, including the disclosures, and whether the standalone financial statements represent the underlying transactions and events in a manner that achieves fair presentation.
We communicate with those charged with governance regarding, among other matters, the planned scope and timing of the audit and significant audit findings, including any significant deficiencies in internal control that we identify during our audit.
We also provide those charged with governance with a statement that we have complied with relevant ethical requirements regarding independence, and to communicate with them all relationships and other matters that may reasonably be thought to bear on our independence, and where applicable, related safeguards.
Report on Other Legal and Regulatory Requirements
1. As required by the Companies (Auditors’ Report) Order, 2016 (“the Order”) issued by the Central Government in terms of section 143 (11) of the Act, we give in the “Annexure A” a statement on the matters specified in paragraphs 3 and 4 of the Order, to the extent applicable.
2. (A) As required by Section 143(3) of the Act, we report that:
a) We have sought and obtained all the information and explanations which to the best of our knowledge and belief were necessary for the purposes of our audit.
b) In our opinion, proper books of account as required by law have been kept by the Company so far as it appears from our examination of those books.
c) The standalone balance sheet, the standalone statement of profit and loss (including other comprehensive income), the standalone statement of changes in equity and the standalone statement of cash flows dealt with by this Report are in agreement with the books of account.
d) In our opinion, the aforesaid standalone financial statements comply with the Ind AS specified under section 133 of the Act.
e) On the basis of the written representations received from the directors as on 31 March 2021 taken on record by the Board of Directors, none of the directors is disqualified as on 31 March 2021 from being appointed as a director in terms of Section 164(2) of the Act.
f) With respect to the adequacy of the internal financial controls with reference to financial statements of the Company and the operating effectiveness of such controls, refer to our separate Report in “Annexure B”.
(B) With respect to the other matters to be included in the Auditors’ Report in accordance with Rule 11 of the Companies (Audit and Auditors) Rules, 2014, in our opinion and to the best of our information and according to the explanations given to us:
i. The Company has disclosed the impact of pending litigations as at 31 March 2021 on its financial position in its standalone financial statements - Refer Note 40 to the standalone financial statements;
ii. The Company did not have any long-term contracts including derivative
contracts for which there were any material foreseeable losses.
iii. There were no amounts which were required to be transferred to the Investor Education and Protection Fund by the Company.
iv. The disclosures in the standalone financial statements regarding holdings as well as dealings in specified bank notes during the period from 8 November 2016 to 30 December 2016 have not been made in these financial statements since they do not pertain to the financial year ended 31 March 2021.
(C) With respect to the matter to be included in the Auditors’ Report under section 197(16):
In our opinion and according to the information and explanations given to us, the remuneration paid by the company to its directors during the current year is in accordance with the provisions of Section 197 of the Act. The remuneration paid to any director is not in excess of the limit laid down under Section 197 of the Act. The Ministry of Corporate Affairs has not prescribed other details under Section 197(16) which are required to be commented upon by us.
For BSR & Co. LLPChartered Accountants
Firm Registration No: 101248W/ W-100022
Place: PuneDate: 28 May 2021
Abhishek Partner Membership No: 062343
UDIN: 21062343AAAABL6683
Annexure A to the Independent Auditors’ Report on Standalone financial statement – 31 March 2021With reference to the Annexure referred to in paragraph 1 in Report on Other Legal and Regulatory Requirements of the Independent Auditors’ Report to the members of the Company on the Standalone financial statements for the year ended 31 March 2021, we report that:
(i) (a) The Company has maintained proper records showing full particulars, including quantitative details and situation of fixed assets.
(b) The Company has a program of physical verification of its fixed assets by which all its fixed assets are verified in a phased manner over a period of three years, which, in our opinion, is reasonable having regard to the size of the Company and the nature of its fixed assets. Pursuant to the programme, a portion of the fixed assets has been physically verified by the Management during the year and no material discrepancies have been noticed on such verification.
(c) The title deeds of the immovable properties are held in the name of the Company. In respect of immovable properties of land and building that have been taken on lease, the lease agreements are in the name of the Company, where the Company is the lessee in the agreement.
(ii) The inventory, except goods in transit, has been physically verified by the management during the year as well as subsequent to year end in accordance with the programme of physical verification. The discrepancies noticed on verification between the physical stock and the book records were not material and have been properly dealt with in the books of account. In our opinion, the frequency of such verification is reasonable and adequate in relation to the size of the Company and the nature of its business. In respect of significant stocks lying with third parties at the year end, written confirmation from major parties have been obtained.
ANNUAL REPORT 2020-21 : INDEPENDENT AUDITOR’S REPORT
Independent Auditor’s Report
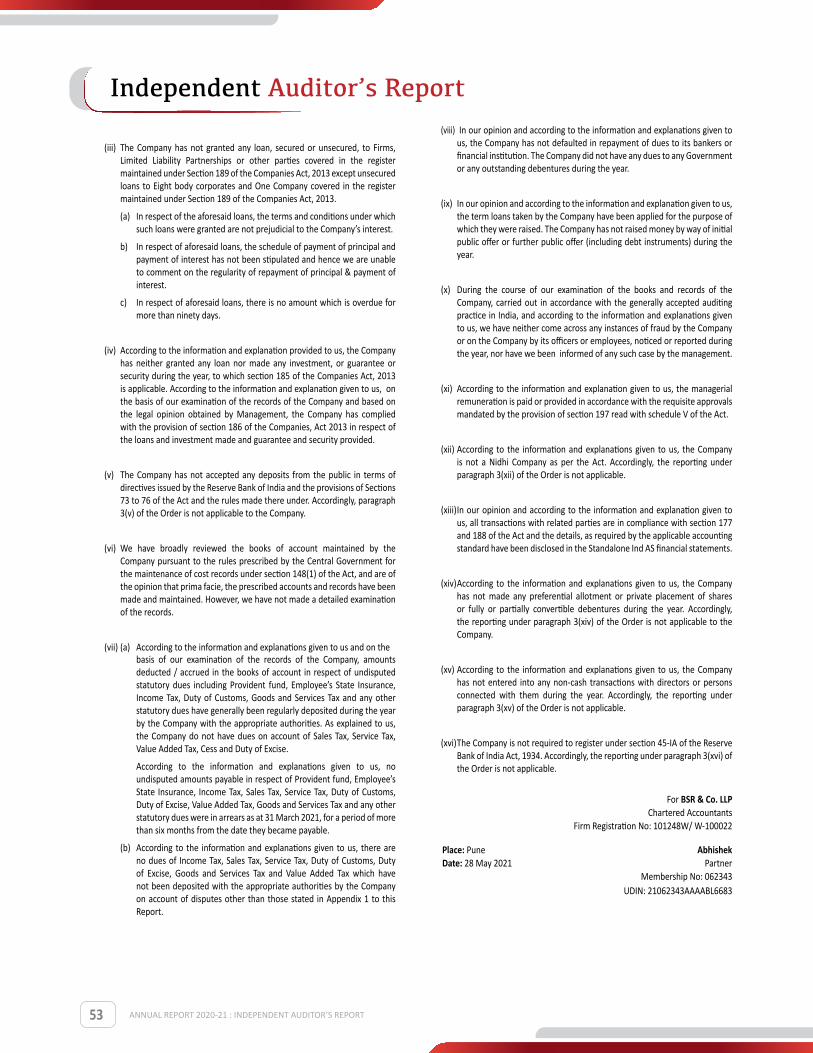
53
(iii) The Company has not granted any loan, secured or unsecured, to Firms, Limited Liability Partnerships or other parties covered in the register maintained under Section 189 of the Companies Act, 2013 except unsecured loans to Eight body corporates and One Company covered in the register maintained under Section 189 of the Companies Act, 2013.
(a) In respect of the aforesaid loans, the terms and conditions under which such loans were granted are not prejudicial to the Company’s interest.
b) In respect of aforesaid loans, the schedule of payment of principal and payment of interest has not been stipulated and hence we are unable to comment on the regularity of repayment of principal & payment of interest.
c) In respect of aforesaid loans, there is no amount which is overdue for more than ninety days.
(iv) According to the information and explanation provided to us, the Company has neither granted any loan nor made any investment, or guarantee or security during the year, to which section 185 of the Companies Act, 2013 is applicable. According to the information and explanation given to us, on the basis of our examination of the records of the Company and based on the legal opinion obtained by Management, the Company has complied with the provision of section 186 of the Companies, Act 2013 in respect of the loans and investment made and guarantee and security provided.
(v) The Company has not accepted any deposits from the public in terms of directives issued by the Reserve Bank of India and the provisions of Sections 73 to 76 of the Act and the rules made there under. Accordingly, paragraph 3(v) of the Order is not applicable to the Company.
(vi) We have broadly reviewed the books of account maintained by the Company pursuant to the rules prescribed by the Central Government for the maintenance of cost records under section 148(1) of the Act, and are of the opinion that prima facie, the prescribed accounts and records have been made and maintained. However, we have not made a detailed examination of the records.
(vii) (a) According to the information and explanations given to us and on the basis of our examination of the records of the Company, amounts
deducted / accrued in the books of account in respect of undisputed statutory dues including Provident fund, Employee’s State Insurance, Income Tax, Duty of Customs, Goods and Services Tax and any other statutory dues have generally been regularly deposited during the year by the Company with the appropriate authorities. As explained to us, the Company do not have dues on account of Sales Tax, Service Tax, Value Added Tax, Cess and Duty of Excise.
According to the information and explanations given to us, no undisputed amounts payable in respect of Provident fund, Employee’s State Insurance, Income Tax, Sales Tax, Service Tax, Duty of Customs, Duty of Excise, Value Added Tax, Goods and Services Tax and any other statutory dues were in arrears as at 31 March 2021, for a period of more than six months from the date they became payable.
(b) According to the information and explanations given to us, there are no dues of Income Tax, Sales Tax, Service Tax, Duty of Customs, Duty of Excise, Goods and Services Tax and Value Added Tax which have not been deposited with the appropriate authorities by the Company on account of disputes other than those stated in Appendix 1 to this Report.
(viii) In our opinion and according to the information and explanations given to us, the Company has not defaulted in repayment of dues to its bankers or financial institution. The Company did not have any dues to any Government or any outstanding debentures during the year.
(ix) In our opinion and according to the information and explanation given to us, the term loans taken by the Company have been applied for the purpose of which they were raised. The Company has not raised money by way of initial public offer or further public offer (including debt instruments) during the year.
(x) During the course of our examination of the books and records of the Company, carried out in accordance with the generally accepted auditing practice in India, and according to the information and explanations given to us, we have neither come across any instances of fraud by the Company or on the Company by its officers or employees, noticed or reported during the year, nor have we been informed of any such case by the management.
(xi) According to the information and explanation given to us, the managerial remuneration is paid or provided in accordance with the requisite approvals mandated by the provision of section 197 read with schedule V of the Act.
(xii) According to the information and explanations given to us, the Company is not a Nidhi Company as per the Act. Accordingly, the reporting under paragraph 3(xii) of the Order is not applicable.
(xiii) In our opinion and according to the information and explanation given to us, all transactions with related parties are in compliance with section 177 and 188 of the Act and the details, as required by the applicable accounting standard have been disclosed in the Standalone Ind AS financial statements.
(xiv) According to the information and explanations given to us, the Company has not made any preferential allotment or private placement of shares or fully or partially convertible debentures during the year. Accordingly, the reporting under paragraph 3(xiv) of the Order is not applicable to the Company.
(xv) According to the information and explanations given to us, the Company has not entered into any non-cash transactions with directors or persons connected with them during the year. Accordingly, the reporting under paragraph 3(xv) of the Order is not applicable.
(xvi) The Company is not required to register under section 45-IA of the Reserve Bank of India Act, 1934. Accordingly, the reporting under paragraph 3(xvi) of the Order is not applicable.
For BSR & Co. LLPChartered Accountants
Firm Registration No: 101248W/ W-100022
Place: Pune AbhishekDate: 28 May 2021 Partner
Membership No: 062343 UDIN: 21062343AAAABL6683
ANNUAL REPORT 2020-21 : INDEPENDENT AUDITOR’S REPORT
Independent Auditor’s Report

54
Appendix -1 Details of amount unpaid on account of disputes:
Name of statute Nature of the dues Period to which the amount relates* Amount (Rs. In million) Amounts paid under
protest (Rs. In million)Forum where dispute is
pending
The Income Tax Act, 1961 Income Tax AY 2014-15 *** 10.11 -Income Tax Appellate Tribunal, Pune
The Income Tax Act, 1961 Income Tax AY 2015-16*** 7.54 -Income Tax Appellate Tribunal, Pune
The Central Excise Act, 1944
Excise Duty June 2012 to January 2014 1.17 - Commissioner Appeals CGST
Orissa Entry Tax Act, 1999 Entry Tax 2005-06 and 2006-07 1.15 0.34 Cuttack Sales Tax Tribunal
The Telangana Value Added Tax Act, 2005
Value added tax June 2014 to March 2016 0.20 0.11 Telangana Appellate Tribunal
The Tamil Nadu Value Added Tax, Act 2006
Value added tax FY 2014-15 28.65 3.10 Tamil Nadu Sales Tax Appellate Tribunal
The Tamil Nadu Value Added Tax, Act 2006
Value added tax FY 2015-16 48.46 6.00 Tamil Nadu Sales Tax Appellate Tribunal
The Gujarat Value Added Tax Act, 2003
Value added tax FY 2017-18 0.09 0.02Deputy Commissioner (Appeals)
Central Sales Tax Act, 1956 Central Sales Tax FY 2017-18 0.38 0.08Deputy Commissioner (Appeals)
Maharashtra Value added Tax Act, 2002
Value added tax FY 2016-17 19.65 19.65Joint Commissioner of State Tax
Central Sales Tax Act, 1956 Central Sales Tax FY 2016-17 1.97 1.97Joint Commissioner of State Tax
Maharashtra Value added Tax Act, 2002
Value added tax FY 2017-18 8.03 -Deputy Commissioner of Sales Tax
Central Sales Tax Act, 1956 Central Sales Tax FY 2017-18 0.36 -Deputy Commissioner of Sales Tax
* AY stands for Assessment Year and FY stands for Financial Year*** Income tax department has gone into appeal against the favourable order of Commissioner of Income Tax (Appeals).
ANNUAL REPORT 2020-21 : INDEPENDENT AUDITOR’S REPORT
Independent Auditor’s Report
55
Annexure B to the Independent Auditors’ report on the Standalone finan-cial statements of Emcure Pharmaceuticals Limited for the year ended 31 March 2021.
Report on the internal financial controls with reference to the aforesaid Standalone financial statements under Clause (i) of Sub-section 3 of Section 143 of the
Companies Act, 2013
(Referred to in paragraph ‘2(A)(f)’ under ‘Report on Other Legal and Regulatory Requirements’ section of our report of even date)
Opinion
We have audited the internal financial controls with reference to financial statements of Emcure Pharmaceuticals Limited (“the Company”) as of 31 March 2021 in conjunction with our audit of the Standalone financial statements of the Company for the year ended on that date.
In our opinion, the Company has, in all material respects, adequate internal financial controls with reference to financial statements and such internal financial controls were operating effectively as at 31 March 2021, based on the internal financial controls with reference to financial statements criteria established by the Company considering the essential components of internal control stated in the Guidance Note on Audit of Internal Financial Controls Over Financial Reporting issued by the Institute of Chartered Accountants of India (the “Guidance Note”).
Management’s Responsibility for Internal Financial Controls
The Company’s management and the Board of Directors are responsible for establishing and maintaining internal financial controls based on the internal financial controls with reference to financial statements criteria established by the Company considering the essential components of internal control stated in the Guidance Note. These responsibilities include the design, implementation and maintenance of adequate internal financial controls that were operating effectively for ensuring the orderly and efficient conduct of its business, including adherence to company’s policies, the safeguarding of its assets, the prevention and detection of frauds and errors, the accuracy and completeness of the accounting records, and the timely preparation of reliable financial information, as required under the Companies Act, 2013 (hereinafter referred to as “the Act”).
Auditors’ Responsibility
Our responsibility is to express an opinion on the Company’s internal financial controls with reference to financial statements based on our audit. We conducted our audit in accordance with the Guidance Note and the Standards on Auditing, prescribed under section 143(10) of the Act, to the extent applicable to an audit of internal financial controls with reference to financial statements. Those Standards and the Guidance Note require that we comply with ethical requirements and plan and perform the audit to obtain reasonable assurance about whether adequate internal financial controls with reference to financial statements were established and maintained and whether such controls operated effectively in all material respects.
Our audit involves performing procedures to obtain audit evidence about the adequacy of the internal financial controls with reference to financial statements and their operating effectiveness. Our audit of internal financial controls with reference to financial statements included obtaining an understanding of such internal financial controls, assessing the risk that a material weakness exists, and testing and evaluating the design and operating effectiveness of internal control based on the assessed risk. The procedures selected depend on the auditor’s judgement, including the assessment of the risks of material misstatement of the Standalone financial statements, whether due to fraud or error.
We believe that the audit evidence we have obtained is sufficient and appropriate to provide a basis for our audit opinion on the Company’s internal financial controls with reference to financial statements.
Meaning of Internal Financial controls with Reference to Financial Statements
A company’s internal financial controls with reference to financial statements is a process designed to provide reasonable assurance regarding the reliability of financial reporting and the preparation of financial statements for external purposes in accordance with generally accepted accounting principles. A company’s internal financial controls with reference to financial statements include those policies and procedures that (1) pertain to the maintenance of records that, in reasonable detail, accurately and fairly reflect the transactions and dispositions of the assets of the company; (2) provide reasonable assurance that transactions are recorded as necessary to permit preparation of financial statements in accordance with generally accepted accounting principles, and that receipts and expenditures of the company are being made only in accordance with authorisations of management and directors of the company; and (3) provide reasonable assurance regarding prevention or timely detection of unauthorised acquisition, use, or disposition of the company’s assets that could have a material effect on the financial statements.
Inherent Limitations of Internal Financial controls with Reference to Financial Statements
Because of the inherent limitations of internal financial controls with reference to financial statements, including the possibility of collusion or improper management override of controls, material misstatements due to error or fraud may occur and not be detected. Also, projections of any evaluation of the internal financial controls with reference to Standalone financial statements to future periods are subject to the risk that the internal financial controls with reference to Standalone financial statements may become inadequate because of changes in conditions, or that the degree of compliance with the policies or procedures may deteriorate.
For BSR & Co. LLPChartered Accountants
Firm Registration No: 01248W/W-100022
Place: PuneDate: 28 May 2021
Abhishek Partner Membership No: 062343
UDIN: 21062343AAAABL6683
ANNUAL REPORT 2020-21 : INDEPENDENT AUDITOR’S REPORT
Independent Auditor’s Report

56
Rs. in million
Particulars Note March 31, 2021 March 31, 2020AssetsNon-current assets
Property, plant and equipment 2A 10,859.95 9,701.54 Capital work-in-progress 2B 1,920.94 3,260.59 Right-of-use assets 4 1,306.56 1,256.44 Intangible assets 3 612.49 702.60 Financial assets
i) Investments 5 8,637.31 4,077.09 ii) Loans 6 2,780.52 732.51 iii) Other financial assets 7 143.59 253.57
Income tax assets (net) 36 46.34 333.88 Other non-current assets 8 169.67 318.16
Total non- current assets 26,477.37 20,636.38
Current assets Inventories 9 6,217.74 4,436.62 Financial assets
i) Trade receivables 10 9,994.25 11,382.93 ii) Cash and cash equivalents 11A 2,455.58 296.22 iii) Bank balances other than (ii) above 11B 151.67 95.93 iv) Other financial assets 12 2,080.49 587.94
Other current assets 13 1,127.06 1,276.02 Assets classified as held for sale 19 127.80 -
Total current assets 22,154.59 18,075.66 Total assets 48,631.96 38,712.04
Equity and liabilitiesEquity
Equity share capital 14 1,808.52 1,808.52 Other equity 15 21,209.20 17,336.98
Total equity 23,017.72 19,145.50
LiabilitiesNon-current liabilities
Financial liabilities i) Borrowings 16 6,459.74 4,538.73 ii) Lease Liabilities 4 531.14 469.66 iii) Other financial liabilities 17 118.53 135.34
Provisions 18 332.94 303.71 Deferred tax liabilities (net) 35 280.09 321.26
Total non-current liabilities 7,722.44 5,768.70
Current liabilitiesFinancial liabilities
i) Borrowings 20 6,595.94 5,609.29 ii) Lease Liabilities 4 80.19 56.21 iii) Trade payables 21 Total outstanding dues of Micro and Small Enterprises - 0.62 Total outstanding dues to others 5,742.86 4,385.62 iv) Other financial liabilities 22 4,276.80 2,911.15
Provisions 23 439.07 382.55 Income tax liabilities (net) 36 341.58 308.34 Other current liabilities 24 415.36 144.06
Total current liabilities 17,891.80 13,797.84 Total liabilities 25,614.24 19,566.54 Total equity and liabilities 48,631.96 38,712.04
The notes referred to above form an integral part of the financial statements.As per our report of even date attached.
For B S R & Co. LLP For and on behalf of the Board of DirectorsFirm Registration: 101248W/W-100022 Emcure Pharmaceuticals LimitedChartered Accountants CIN -U24231PN1981PLC024251 Abhishek Berjis Desai Satish MehtaPartner Director and Chairman Managing DirectorMembership No. 062343 DIN: 00153675 DIN -00118691 Jayant Prakash Tajuddin Shaikh Company Secretary Chief Financial Officer Membership No. F6742 PAN: AKQPS1951G
Place: Pune Place: PuneDate : May 28, 2021 Date : May 28, 2021
ANNUAL REPORT 2020-21 : BALANCE SHEET AS AT MARCH 31, 2021
Balance Sheet as at March 31, 2021

57
Rs. in million
Particulars Note March 31, 2021 March 31, 2020Revenue:
Revenue from operations 25 31,536.64 23,757.09 Other income 26 1,119.07 1,376.15
Total income 32,655.71 25,133.24
Expenses:Cost of materials consumed 27 10,473.21 5,598.49 Purchases of stock-in-trade 3,070.39 1,916.07 Changes in inventories of finished goods, work-in-progress and stock in trade 28 (1,079.63) 597.03 Employee benefit expenses 29 5,509.60 5,453.50 Depreciation and amortisation expense 31 1,562.35 1,549.74 Finance cost 32 1,233.41 1,372.21 Other expenses 30 6,129.02 5,957.79
Total expenses 26,898.35 22,444.83
Profit before exceptional items and tax 5,757.36 2,688.41
Exceptional items 33 182.88 441.59
Profit before tax 5,574.48 2,246.82
Tax expense 34Current tax 1,411.27 728.14 Deferred tax (41.54) (233.37)
Total tax expenses 1,369.73 494.77 Profit for the year 4,204.75 1,752.05
Other comprehensive incomeItems that will not be reclassified to profit or loss
Remeasurements of post-employment benefit obligations 44 1.47 (31.27) Income tax relating to these items 34 0.37 10.93
Net other comprehensive income not to be reclassified to profit or loss 1.10 (20.34) Other comprehensive income for the year 1.10 (20.34) Total comprehensive income for the year 4,205.85 1,731.71
Earnings per share:Basic 42 23.25 9.69 Diluted 23.25 9.69 [Face value per share: Rs.10 (Previous year: Rs.10)]
The notes referred to above form an integral part of the financial statement.
As per our report of even date attached.
For B S R & Co. LLP For and on behalf of the Board of DirectorsFirm Registration: 101248W/W-100022 Emcure Pharmaceuticals Limited Chartered Accountants CIN -U24231PN1981PLC024251 Berjis Desai Satish Mehta Abhishek Director and Chairman Managing DirectorPartner DIN: 00153675 DIN -00118691 Membership No. 062343 Jayant Prakash Tajuddin Shaikh Company Secretary Chief Financial Officer Membership No. F6742 PAN: AKQPS1951G Place: Pune Place: PuneDate : May 28, 2021 Date : May 28, 2021
ANNUAL REPORT 2020-21 : STATEMENT OF PROFIT AND LOSS
Statement of Profit and Loss for the year ended March 31, 2021
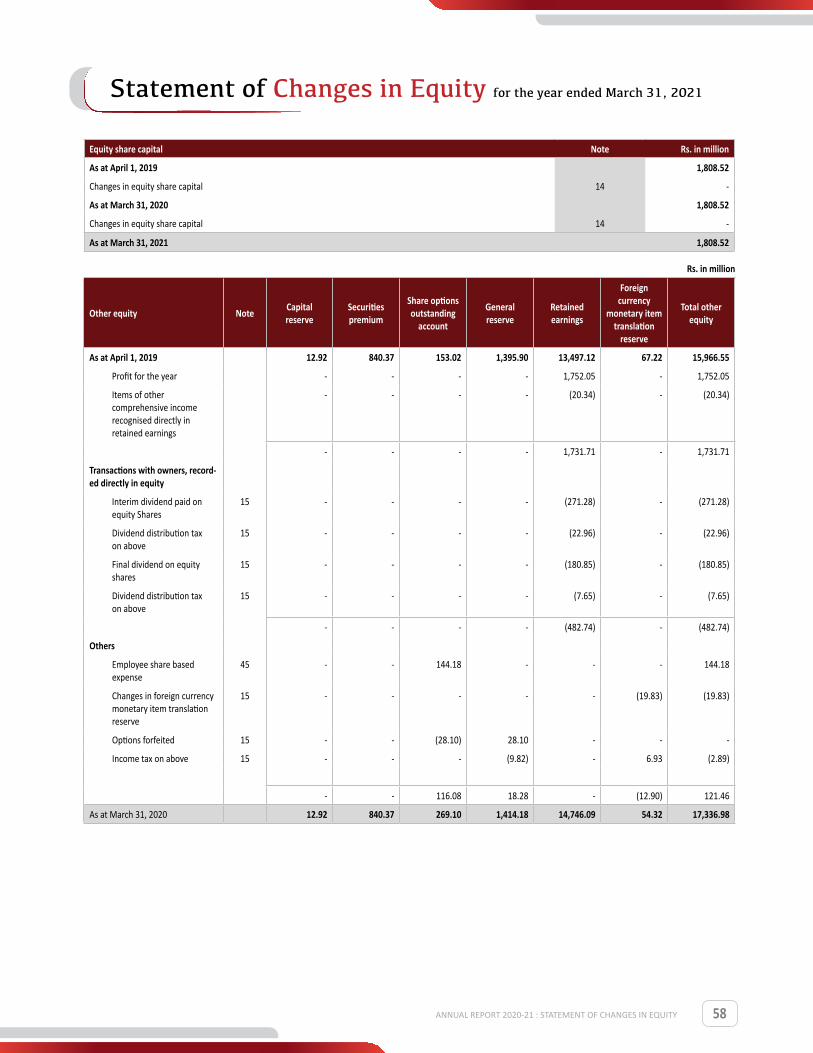
58
Equity share capital Note Rs. in million
As at April 1, 2019 1,808.52
Changes in equity share capital 14 -
As at March 31, 2020 1,808.52
Changes in equity share capital 14 -
As at March 31, 2021 1,808.52
Rs. in million
Other equity Note Capital reserve
Securities premium
Share options outstanding
account
General reserve
Retained earnings
Foreign currency
monetary item translation
reserve
Total other equity
As at April 1, 2019 12.92 840.37 153.02 1,395.90 13,497.12 67.22 15,966.55
Profit for the year - - - - 1,752.05 - 1,752.05
Items of other comprehensive income recognised directly in retained earnings
- - - - (20.34) - (20.34)
- - - - 1,731.71 - 1,731.71
Transactions with owners, record-ed directly in equity
Interim dividend paid on equity Shares
15 - - - - (271.28) - (271.28)
Dividend distribution tax on above
15 - - - - (22.96) - (22.96)
Final dividend on equity shares
15 - - - - (180.85) - (180.85)
Dividend distribution tax on above
15 - - - - (7.65) - (7.65)
- - - - (482.74) - (482.74)
Others
Employee share based expense
45 - - 144.18 - - - 144.18
Changes in foreign currency monetary item translation reserve
15 - - - - - (19.83) (19.83)
Options forfeited 15 - - (28.10) 28.10 - - -
Income tax on above 15 - - - (9.82) - 6.93 (2.89)
- - 116.08 18.28 - (12.90) 121.46
As at March 31, 2020 12.92 840.37 269.10 1,414.18 14,746.09 54.32 17,336.98
ANNUAL REPORT 2020-21 : STATEMENT OF CHANGES IN EQUITY
Statement of Changes in Equity for the year ended March 31, 2021
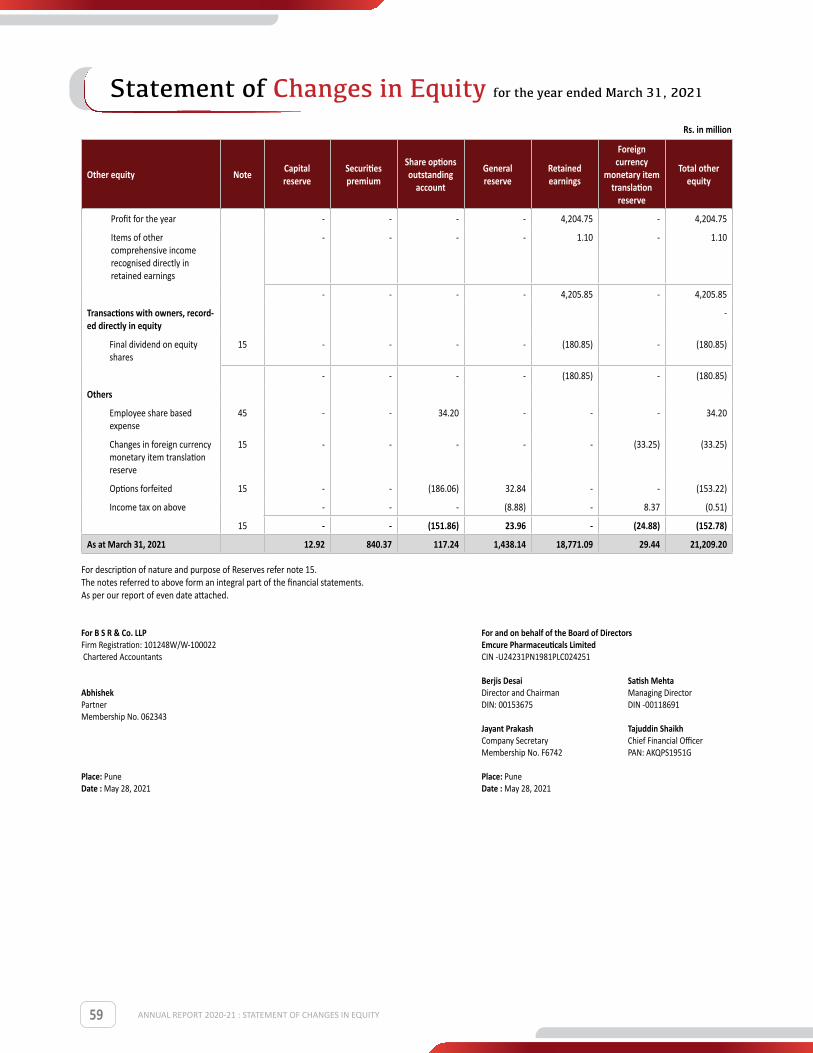
59
Other equity Note Capital reserve
Securities premium
Share options outstanding
account
General reserve
Retained earnings
Foreign currency
monetary item translation
reserve
Total other equity
Profit for the year - - - - 4,204.75 - 4,204.75
Items of other comprehensive income recognised directly in retained earnings
- - - - 1.10 - 1.10
- - - - 4,205.85 - 4,205.85
Transactions with owners, record-ed directly in equity
-
Final dividend on equity shares
15 - - - - (180.85) - (180.85)
- - - - (180.85) - (180.85)
Others
Employee share based expense
45 - - 34.20 - - - 34.20
Changes in foreign currency monetary item translation reserve
15 - - - - - (33.25) (33.25)
Options forfeited 15 - - (186.06) 32.84 - - (153.22)
Income tax on above - - - (8.88) - 8.37 (0.51)
15 - - (151.86) 23.96 - (24.88) (152.78)
As at March 31, 2021 12.92 840.37 117.24 1,438.14 18,771.09 29.44 21,209.20
For description of nature and purpose of Reserves refer note 15.The notes referred to above form an integral part of the financial statements.As per our report of even date attached.
For B S R & Co. LLP For and on behalf of the Board of DirectorsFirm Registration: 101248W/W-100022 Emcure Pharmaceuticals Limited Chartered Accountants CIN -U24231PN1981PLC024251 Berjis Desai Satish Mehta Abhishek Director and Chairman Managing DirectorPartner DIN: 00153675 DIN -00118691 Membership No. 062343 Jayant Prakash Tajuddin Shaikh Company Secretary Chief Financial Officer Membership No. F6742 PAN: AKQPS1951G Place: Pune Place: PuneDate : May 28, 2021 Date : May 28, 2021
Rs. in million
ANNUAL REPORT 2020-21 : STATEMENT OF CHANGES IN EQUITY
Statement of Changes in Equity for the year ended March 31, 2021
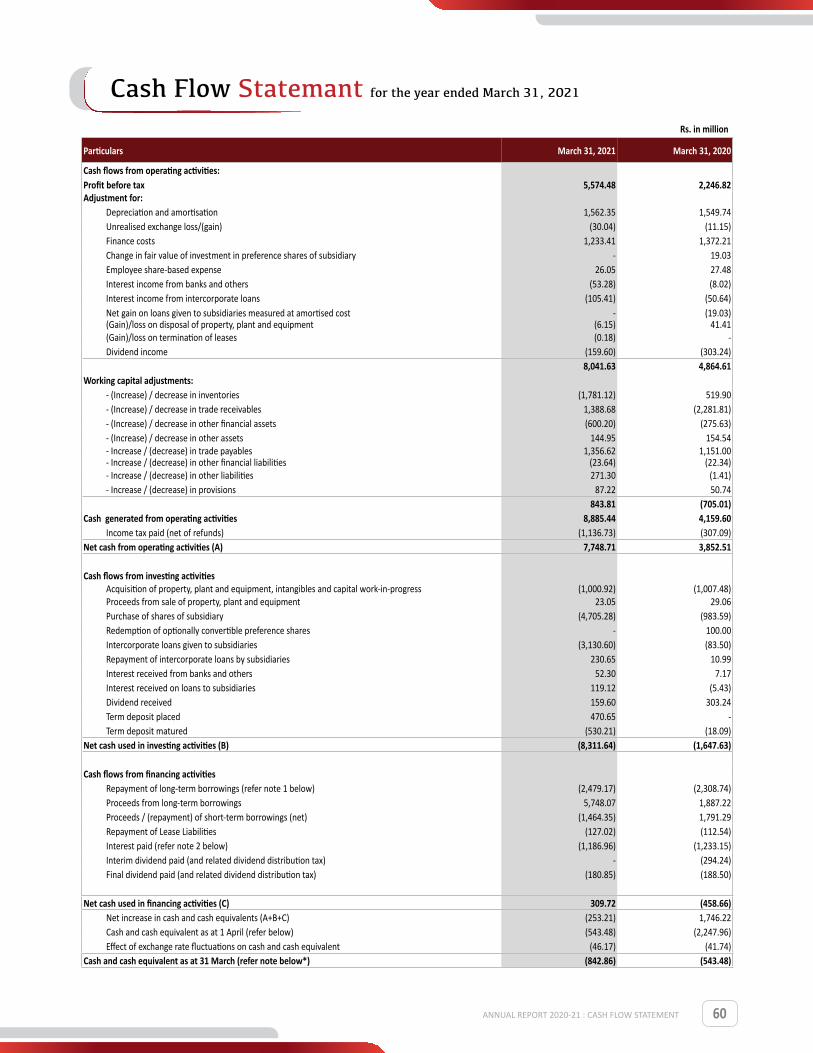
60
Particulars March 31, 2021 March 31, 2020
Cash flows from operating activities:Profit before tax 5,574.48 2,246.82 Adjustment for:
Depreciation and amortisation 1,562.35 1,549.74 Unrealised exchange loss/(gain) (30.04) (11.15)Finance costs 1,233.41 1,372.21 Change in fair value of investment in preference shares of subsidiary - 19.03 Employee share-based expense 26.05 27.48 Interest income from banks and others (53.28) (8.02)Interest income from intercorporate loans (105.41) (50.64)Net gain on loans given to subsidiaries measured at amortised cost - (19.03)(Gain)/loss on disposal of property, plant and equipment (6.15) 41.41 (Gain)/loss on termination of leases (0.18) - Dividend income (159.60) (303.24)
8,041.63 4,864.61 Working capital adjustments:
- (Increase) / decrease in inventories (1,781.12) 519.90 - (Increase) / decrease in trade receivables 1,388.68 (2,281.81)- (Increase) / decrease in other financial assets (600.20) (275.63)- (Increase) / decrease in other assets 144.95 154.54 - Increase / (decrease) in trade payables 1,356.62 1,151.00 - Increase / (decrease) in other financial liabilities (23.64) (22.34)- Increase / (decrease) in other liabilities 271.30 (1.41)- Increase / (decrease) in provisions 87.22 50.74
843.81 (705.01)Cash generated from operating activities 8,885.44 4,159.60
Income tax paid (net of refunds) (1,136.73) (307.09)Net cash from operating activities (A) 7,748.71 3,852.51
Cash flows from investing activitiesAcquisition of property, plant and equipment, intangibles and capital work-in-progress (1,000.92) (1,007.48)Proceeds from sale of property, plant and equipment 23.05 29.06 Purchase of shares of subsidiary (4,705.28) (983.59)Redemption of optionally convertible preference shares - 100.00 Intercorporate loans given to subsidiaries (3,130.60) (83.50)Repayment of intercorporate loans by subsidiaries 230.65 10.99 Interest received from banks and others 52.30 7.17 Interest received on loans to subsidiaries 119.12 (5.43)Dividend received 159.60 303.24 Term deposit placed 470.65 - Term deposit matured (530.21) (18.09)
Net cash used in investing activities (B) (8,311.64) (1,647.63)
Cash flows from financing activitiesRepayment of long-term borrowings (refer note 1 below) (2,479.17) (2,308.74)Proceeds from long-term borrowings 5,748.07 1,887.22 Proceeds / (repayment) of short-term borrowings (net) (1,464.35) 1,791.29 Repayment of Lease Liabilities (127.02) (112.54)Interest paid (refer note 2 below) (1,186.96) (1,233.15)Interim dividend paid (and related dividend distribution tax) - (294.24)Final dividend paid (and related dividend distribution tax) (180.85) (188.50)
Net cash used in financing activities (C) 309.72 (458.66)Net increase in cash and cash equivalents (A+B+C) (253.21) 1,746.22 Cash and cash equivalent as at 1 April (refer below) (543.48) (2,247.96)Effect of exchange rate fluctuations on cash and cash equivalent (46.17) (41.74)
Cash and cash equivalent as at 31 March (refer note below*) (842.86) (543.48)
Rs. in million
ANNUAL REPORT 2020-21 : CASH FLOW STATEMENT
Cash Flow Statemant for the year ended March 31, 2021
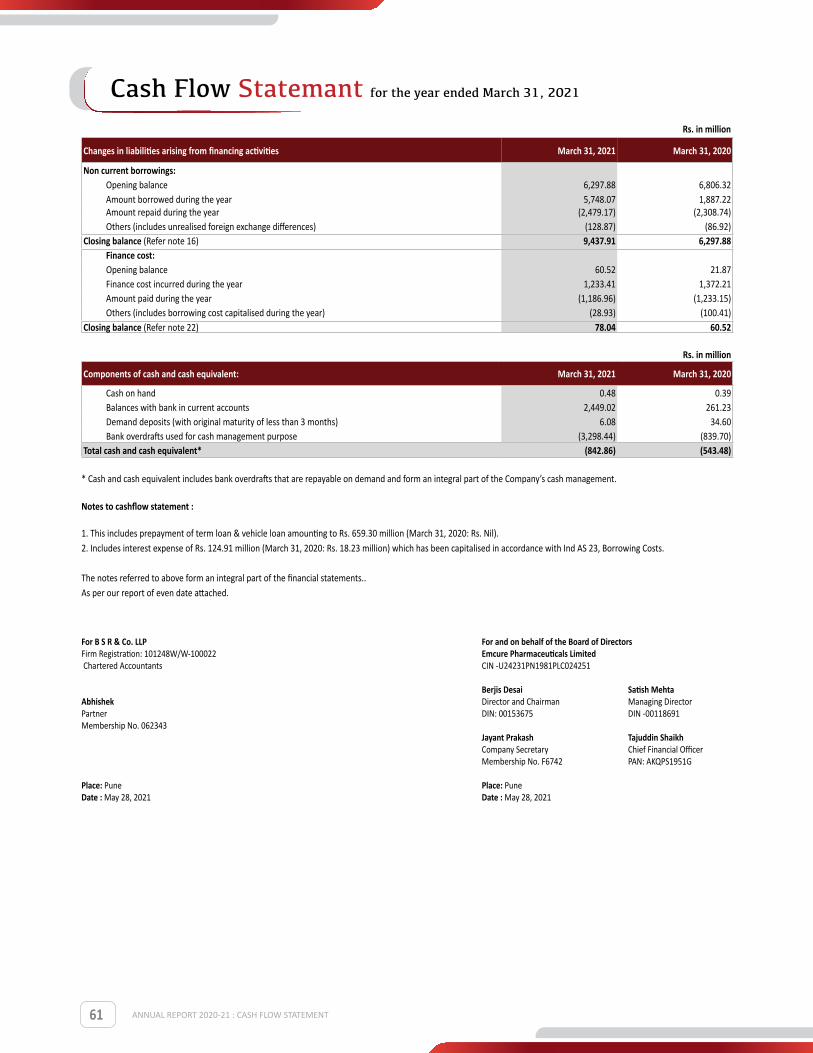
61
Changes in liabilities arising from financing activities March 31, 2021 March 31, 2020
Non current borrowings:Opening balance 6,297.88 6,806.32 Amount borrowed during the year 5,748.07 1,887.22 Amount repaid during the year (2,479.17) (2,308.74)Others (includes unrealised foreign exchange differences) (128.87) (86.92)
Closing balance (Refer note 16) 9,437.91 6,297.88 Finance cost:Opening balance 60.52 21.87 Finance cost incurred during the year 1,233.41 1,372.21 Amount paid during the year (1,186.96) (1,233.15)Others (includes borrowing cost capitalised during the year) (28.93) (100.41)
Closing balance (Refer note 22) 78.04 60.52
Rs. in million
Components of cash and cash equivalent: March 31, 2021 March 31, 2020
Cash on hand 0.48 0.39 Balances with bank in current accounts 2,449.02 261.23 Demand deposits (with original maturity of less than 3 months) 6.08 34.60 Bank overdrafts used for cash management purpose (3,298.44) (839.70)
Total cash and cash equivalent* (842.86) (543.48)
* Cash and cash equivalent includes bank overdrafts that are repayable on demand and form an integral part of the Company’s cash management. Notes to cashflow statement :
1. This includes prepayment of term loan & vehicle loan amounting to Rs. 659.30 million (March 31, 2020: Rs. Nil). 2. Includes interest expense of Rs. 124.91 million (March 31, 2020: Rs. 18.23 million) which has been capitalised in accordance with Ind AS 23, Borrowing Costs. The notes referred to above form an integral part of the financial statements..As per our report of even date attached.
For B S R & Co. LLP For and on behalf of the Board of DirectorsFirm Registration: 101248W/W-100022 Emcure Pharmaceuticals Limited Chartered Accountants CIN -U24231PN1981PLC024251 Berjis Desai Satish Mehta Abhishek Director and Chairman Managing DirectorPartner DIN: 00153675 DIN -00118691 Membership No. 062343 Jayant Prakash Tajuddin Shaikh Company Secretary Chief Financial Officer Membership No. F6742 PAN: AKQPS1951G Place: Pune Place: PuneDate : May 28, 2021 Date : May 28, 2021
Rs. in million
ANNUAL REPORT 2020-21 : CASH FLOW STATEMENT
Cash Flow Statemant for the year ended March 31, 2021

62
1A. General information:
Emcure Pharmaceuticals Limited (hereinafter referred to as “Company”) is a Company limited by shares, incorporated and domiciled in India. The Company is engaged in developing, manufacturing and marketing a broad range of pharmaceutical products globally. The Company’s core strength lies in developing and manufacturing differentiated pharmaceutical products in-house, which are commercialised through Company’s marketing infrastructure across geographies and business relationships with multi-national pharmaceutical companies.
1B. Basis of preparation
a) Basis of preparation
i. Statement of compliance
These financial statements have been prepared in accordance with Indian Accounting Standards (Ind AS) as per the Companies (Indian Accounting Standards) Rules, 2015 notified under Section 133 of Companies Act, 2013, (the ‘Act’) and other relevant provisions of the Act. The financial statements were authorised for issue by the Company’s Board of Directors on May 28, 2021. Details of the Company’s accounting policies are included in Note 1C. b) Functional and presentation currency
The financial statements are presented in Indian Rupees (INR), which is also the Company’s functional currency. All the amounts disclosed in the financial statements and notes have been rounded off to the nearest million, unless otherwise indicated.
c) Basis of Measurement
The financial statements are prepared under the historical cost convention except for the following items:
Items Measurement Basis
Certain Financial assets and liabilities Fair value
Equity settled share based payment arrangements
Fair value
Net defined benefit (asset) / liability Fair value of plan assets less present value of defined benefit obligations
d) Use of estimates and judgements
In preparing these financial statements, management has made judgements, estimates and assumptions that affect the application of accounting policies and the reported amounts of assets, liabilities, income and expenses. Actual results may differ from these estimates.
Estimates and underlying assumptions are reviewed on an ongoing basis. Revisions to accounting estimates are recognised prospectively.
Assumptions and estimation uncertainties
Information about assumptions and estimations uncertainties that have a significant risk resulting in a material adjustment in the year ending 31 March 2021 is included in following notes:
Note 1C. c) Useful lives of property, plant, equipment and intangibles;Note 5 - Impairment of investments in subsidiaries Note 9 - Valuation of inventories
Note 23 - recognition and measurement of provisions and contingencies : key assumptions about the likelihood and magnitude of an outflow of resources; Note 35 - recognition of deferred tax assets: availability of future taxable profit against which tax credit can be used; Note 38 - Impairment of financial instruments Note 39 - measurement of fair value of optionally convertible and redeemable preference shares; key assumptions for earning growth rate and discount rate Note 39 - measurement of loans to related parties at amortised cost and interest accrued on these loans; key assumptions for discount rate Note 44 - measurement of defined benefit obligations: key actuarial assumptions; Note 4 - measurement of discount rate for initial recognition of ROU and Lease Liability as per IND AS 116
e) Measurement of fair values
A number of the Company’s accounting policies and disclosures require the measurement of fair values, for both financial and non-financial assets and liabilities. The Company has an established control framework with respect to the measurement of fair values. This includes a team that has overall responsibility for overseeing all significant fair value measurements, including Level 3 fair values, and reports directly to the Head of Treasury . The team regularly reviews significant unobservable inputs and valuation adjustments. If third party information, such as broker quotes or pricing services, is used to measure fair values, then the team assesses the evidence obtained from the third parties to support the conclusion that these valuations meet the requirements of Ind AS, including the level in the fair value hierarchy in which the valuations should be classified.
Fair values are categorised into different levels in a fair value hierarchy based on the inputs used in the valuation techniques as follows. - Level 1: quoted prices (unadjusted) in active markets for identical assets or liabilities. - Level 2: inputs other than quoted prices included in Level 1 that are observable for the asset or liability, either directly (i.e. as prices) or indirectly (i.e. derived from prices). - Level 3: inputs for the asset or liability that are not based on observable market data (unobservable inputs). When measuring the fair value of an asset or a liability, the Company uses observable market data as far as possible. If the inputs used to measure the fair value of an asset or a liability fall into different levels of the fair value hierarchy, then the fair value measurement is categorised in its entirety in the same level of the fair value hierarchy as the lowest level input that is significant to the entire measurement. The Company recognises transfers between levels of the fair value hierarchy at the end of the reporting period during which the change has occurred. Further information about the assumptions made in measuring fair values is included in the following notes: - Note 39 – financial instruments; - Note 45 – share-based payment arrangements; and
f) Current versus non current classification All assets and liabilities are classified into current and non-current.
Assets
An asset is classified as current when it satisfies any of the following criteria: - it is expected to be realized in, or is intended for sale or consumption in, the Company’s normal operating cycle; - it is held for the purpose of being traded; - it is expected to be realized within 12 months after the reporting date; or
ANNUAL REPORT 2020-21 : NOTES TO THE FINANCIAL STATEMENTS
Notes to the Financial statements for the year ended March 31, 2021

63
- it is cash or cash equivalent unless it is restricted from being exchanged or used to settle a liability for at least 12 months after the reporting date. Current assets include the current portion of non-current assets / non-current financial assets. All other assets are classified as non-current.
Liabilities
A liability is classified as current when it satisfies any of the following criteria: - it is expected to be settled in the Company’s normal operating cycle; - it is held primarily for the purpose of being traded; - it is expected to be settled within 12 months after the reporting date; or - the Company does not have any unconditional right to defer settlement of the liability for at least 12 months after the reporting date. Current liabilities include the current portion of non-current liabilities / non-current financial liabilities. All other liabilities are classified as non-current. Deferred tax assets and liabilities are classified as non-current assets and liabilities. Operating cycle
Operating cycle is the time between the acquisition of assets for processing and their realization in cash or cash equivalent. The operating cycle of the Company is less than 12 months.
1C. Significant accounting policies
a) Foreign Currency Translation Transaction in foreign currencies are translated into the respective functional currencies of the Company at the exchange rates at the dates of transactions or an average rate if the average rate approximates the actual rate at the date of the transaction. Monetary assets and liabilities denominated in foreign currencies are translated into the functional currency at the exchange rate at the reporting date. Non-monetary assets and liabilities that are measured based on historical cost in a foreign currency are translated at the exchange rate at the date of transaction. Exchange difference are recognised in statement of profit and loss, except exchange differences arising from the translation of the following item which are recognised directly in other equity: i. Translation of long term foreign currency monetary items pertaining to period prior to transition to Ind AS and which are not related to purchase of property, plant and equipment and intangible assets (refer note 15).
b) Financial instruments i. Recognition and initial measurement Trade receivables are initially recognised when they are originated. All other financial assets and financial liabilities are initially recognised when the Company becomes a party to the contractual provisions of the instrument. A financial asset or financial liability is initially measured at fair value plus, for an item not at fair value through profit and loss (FVTPL), transaction costs that are directly attributable to its acquisition or issue.
ii. Classification and subsequent measurement
Financial assets
On initial recognition, a financial asset is classified as measured at - amortised cost; or - Fair value through profit and loss (FVTPL) Financial assets are not reclassified subsequent to their initial recognition, except if and in the period the Company changes its business model for managing financial assets.
A financial asset is measured at amortised cost if it meets both of the following conditions and is not designated as at FVTPL:- The asset is held within a business model whose objective is to hold assets to collect contractual cash flows; and - The contractual terms of the financial asset give rise on specified dates to cash flows that are solely payments of principal and interest on the principal amount outstanding. On initial recognition of an equity investment that is not held for trading, the Company may irrevocably elect to present subsequent changes in the investment’s fair value in OCI (designated as FVOCI – equity investment). This election is made on an investment-by-investment basis. All financial assets not classified as measured at amortised cost as described above are measured at FVTPL. On initial recognition, the Company may irrevocably designate a financial asset that otherwise meets the requirements to be measured at amortised cost as at FVTPL if doing so eliminates or significantly reduces an accounting mismatch that would otherwise arise.
Financial assets: Business model assessment The Company makes an assessment of the objective of the business model in which a financial asset is held at a portfolio level because this best reflects the way the business is managed and information is provided to management. The information considered includes: - The stated policy and objectives for the portfolio and the operation of those policies in practice.These include whether management’s strategy focuses on earning contractual interest income, maintaining a particular interest rate profile, matching the duration of the financial asset to the duration of any related liabilities or expected cash outflows or realising cash flows through the sale of asset; - How the performance of portfolio is evaluated and reported to the Company’s management; - The risk that affect the performance of the business model (and the financial assets held within that business model) and how those risks are managed; - How managers of business are compensated – e.g. whether compensation is based on the fair value of the assets managed or the contractual cash flows collected; and - The frequency, volume and timing of sales of financial assets in prior periods, the reasons for such sales and expectations about future sales activity. Transfers of financial assets to third parties in transactions that do not qualify for derecognition are not considered sales for this purpose, consistent with the Company’s continuing recognition of the assets. Financial assets that are held for trading or are managed and whose performance is evaluated on a fair value basis are measured at FVTPL. Financial assets: Assessment whether contractual cash flows are solely payments of principal and interest
For the purpose of this assessment, ‘principal’ is defines as the fair value of financial asset on initial recognition. ‘Interest’ is defined as consideration for time value of money and for credit risk associated with the principal amount outstanding during a particular period of time and other basic leading risks and costs (e.g. liquidity risk and administrative costs), as well as profit margin.
In assessing whether the contractual cash flows are solely payments of principal and interest, the Company considers contractual terms of the instrument. This includes assessing whether the financial asset contains a contractual term that could change the timing or amount of contractual cash flows such that it would not meet this condition. In making this assessment, the Company considers;
ANNUAL REPORT 2020-21 : NOTES TO THE FINANCIAL STATEMENTS
Notes to the Financial statements for the year ended March 31, 2021 (Continued)

64
- contingent events that would change the amount and timing of cash flows; - term that would adjust the contractual rate, including variable interest rate features; - prepayment and extension features; and - term that limits the Company’s claim to cash flows for specified assets (e.g. non- recourse features). A prepayment feature is consistent with the solely payments of principal and interest criterion if the prepayment amount substantially represents unpaid amount of principal and interest on principal amount outstanding, which may include reasonable additional compensation for early termination of contract. Additionally, for a financial asset acquired on a significant premium or discount to its contractual par amount, a feature that permits or require prepayment at an amount that substantially represents the contractual par amount plus accrued (but unpaid) contractual interest (which may also include reasonable additional compensation for early termination) is treated as consistent with this criterion if the fair value of the prepayment feature is significant at initial recognition.
Financial assets: Subsequent measurement and gains and losses Financial assets at FVTPL: These assets are subsequently measured at fair value. Net gains and losses, including any interest or dividend income, are recognised in profit or loss.
Financial assets at amortized cost: These assets are subsequently measured at amortized cost using the effective interest method. The amortised cost is reduced by impairment losses. Interest income, foreign exchange gains and losses and impairment are recognised in profit or loss. Any gain or loss on derecognition is recognised in profit or loss.
Financial liabilities: Classification, subsequent measurement and gains and loss-es Financial liabilities are classified as measured at amortised cost or FVTPL. A financial liability is classified as at FVTPL if it is classified as held for trading, or it is a derivative or it is designated as such on initial recognition. Financial liabilities at FVTPL are measured at fair value and net gains and losses, including any interest expense, are recognised in profit or loss. Other financial liabilities are subsequently measured at amortised cost using the effective interest method. Interest expense and foreign exchange gains and losses are recognised in profit or loss. Any gain or loss on derecognition is also recognised in profit or loss.
iii. Derecognition Financial assets The Company derecognises a financial asset when the contractual rights to the cash flows from the financial asset expire, or it transfers the rights to receive the contractual cash flows in a transaction in which substantially all of the risks and rewards of ownership of the financial asset are transferred or in which the Company neither transfers nor retains substantially all of the risks and rewards of ownership and does not retain control of the financial asset.
If the Company enters into transactions whereby it transfers assets recognised on its balance sheet, but retains either all or substantially all of the risks and rewards of the transferred assets, the transferred assets are not derecognised.
Financial liabilities
The Company derecognises a financial liability when its contractual obligations are discharged or cancelled, or expire.
The Company also derecognises a financial liability when its terms are modified and the cash flows under the modified terms are substantially different. In this case, a new financial liability based on the modified terms is recognised at fair value. The difference between the carrying amount of the financial liability extinguished and the new financial liability with modified terms is recognised in profit or loss.
iv. Offsetting Financial assets and financial liabilities are offset and the net amount presented in the balance sheet when, and only when, the Company currently has a legally enforceable right to set off the amounts and it intends either to settle them on a net basis or to realise the asset and settle the liability simultaneously.
c) Property, plant and equipment i. Recognition and measurement Items of property, plant and equipment are measured at cost, which includes capi-talised borrowing costs, less accumulated depreciation and accumulated impairment losses, if any.
Cost of an item of property, plant and equipment comprises its purchase price, including import duties and non-refundable purchase taxes, after deducting trade discounts and rebates, any directly attributable cost of bringing the item to its working condition for its intended use and estimate costs of dismantling and removing the item and restoring the site on which it is located.
If significant parts of an item of property, plant and equipment have different useful lives, then they are accounted for as separated items (major components) of property, plant and equipment.
Any gain or loss on disposal of an item of property, plant and equipment is recognised in the statement of profit and loss.
ii. Subsequent expenditure Subsequent expenditure is capitalised only if it is probable that the future economic benefit associated with the expenditure will flow to the Company.
iii. DepreciationDepreciation is calculated on cost of items of property, plant and equipment less their estimated residual values over their estimated useful lives using the straight line method, and is generally recognised in the statement of profit and loss. Assets acquired under finance leases are depreciated over the shorter of the lease term and their useful lives unless it is reasonably certain that the Company will obtain ownership by the end of the lease term. Freehold land is not depreciated.
Depreciation is provided on pro-rata basis using the straight-line method over the estimated useful lives of the assets prescribed under Schedule II to the Companies Act 2013 except in case of:
- Furniture and fixtures at leasehold premises that are depreciated over the lease period. - Vehicles are depreciated over 5 years, as per technical evaluation.
Depreciation method, useful lives and residual values are reviewed at each financial year-end and adjusted if appropriate. Based on technical evaluation and consequent advice, the management believes that its estimates of useful lives represents the period over which the management expects to use these assets.
Depreciation on additions (disposals) during the year is provided on a pro-rata basis i.e. from (upto) the date on which asset is ready for use (disposed of).
d) Intangible assets
i. Initial recognition: Intangible assets are initially measured at cost. Such intangible assets are subsequently measured at cost less accumulated amortisation and any accumulated impairment loses.
ii. Subsequent expenditure Subsequent expenditure is capitalised only if it is probable that the future economic benefit associated with the expenditure will flow to Company.
iii. AmortisationAmortisation is calculated to write off the cost of intangible assets less their estimated residual value over their estimated useful lives using straight line method, as is included in depreciation and amortisation in statement of profit and loss.
ANNUAL REPORT 2020-21 : NOTES TO THE FINANCIAL STATEMENTS
Notes to the Financial statements for the year ended March 31, 2021 (Continued)
65
The estimated useful lives are as follows:
Intangible AssetManagement estimated
useful life
Brands acquired 5 to 10 years
Software, license rights 2 to 10 years
Amortisation method, useful lives and residual values are reviewed at the end of each financial year and adjusted if appropriate.
iv. Intangible Assets under DevelopmentIntangible assets under development are initially recognized at cost. Such intangible assets are subsequently capitalized only if it is probable that the future economic benefit associated with the expenditure will flow to the Company. v. ImpairmentThe Company irrespective of whether there is any indication of impairment, tests an intangible asset not yet available for use for impairment annually by comparing its carrying amount with its recoverable amount. The recoverable amount is the higher of its value in use and its fair value less costs of disposal. Value in use is based on the estimated future cash flows, discounted to their present value using a pre-tax discount rate that reflects current market assessments of the time value of money and the risks specific to the asset. An impairment loss is recognised if the carrying amount of the intangible asset not yet available for use exceeds its estimated recoverable amount. Impairment losses are recognised in the statement of profit and loss.
e) Inventories Inventories are measured at the lower of cost and net realisable value. The cost on inventories is based on weighted average formula, and includes expenditure incurred in acquiring the inventories, production or conversion cost and other cost incurred in bringing them to their present location and condition. In case of manufactured inventory and work-in-progress, cost includes an appropriate share of fixed production overheads based on normal operating capacity.
Net realisable value is the estimated selling price in the ordinary course of business, less the estimated costs of completion and selling expense.
The net realisable value of work-in- progress is determined with reference to the selling price of related finished products.
Raw materials, components and other supplies held for use in production of finished products are not written down below cost except in cases where material price have declined and it is estimated that the cost of finished products will exceed their net realizable value.
The comparison of cost and net realizable value is made on an item-by-item basis.
The Company considers various factors like shelf life, ageing of inventory, product discontinuation, price changes and any other factor which impact the Company’s business in determining the allowance for obsolete, non-saleable and slow moving inventories. The Company considers the above factors and adjusts the inventory provision to reflect its actual experience on a periodic basis.
f) Impairment
i. Impairment of financial instruments The Company recognises loss allowances for expected credit losses on financial assets measured at amortised cost. At each reporting date, the Company assesses whether financial assets carried at amortised cost are credit - impaired. A financial asset is ‘credit impaired’ when one or more events that have a detrimental impact on estimated future cash flows of financial assets have occurred.
Evidence that a financial asset is credit impaired includes the following observed data: - significant financial difficulty of the borrower or issuer;- a breach of contract such as a default or being overdue for a period of more than 12 months from the credit term offered to the customer;- the restructuring of loan or advance by the Company on the terms that the Company would not consider otherwise; - it is probable that borrower will enter bankruptcy or the financial reorganization;- the disappearance of active market for a security because of financial difficulties.
In accordance with Ind-AS 109, the Company applies expected credit loss (“ECL”) model for measurement and recognition of impairment loss. The Company follows ‘simplified approach’ for recognition of impairment loss allowance on trade receivables. The application of simplified approach does not require the Company to track changes in credit risk. Rather, it recognises impairment loss allowance based on lifetime ECLs at each reporting date, right from its initial recognition.
For recognition of impairment loss on other financial assets the Company recognises 12 month expected credit losses for all originated or acquired financial assets if at the reporting date, the credit risk has not increased significantly since its original recognition. However, if credit risk has increased significantly, lifetime ECL is used.ECL impairment loss allowance (or reversal) is recognized in the statement of profit and loss.
When determining whether the credit risk of financial asset has increased significantly since initial recognition and when estimating expected credit losses, the Company considers reasonable and supportable information that is relevant and available without undue cost of effort. This includes both quantitate and qualitative information and analysis based on Company’s historical experience and informed credit assessment and including forward - looking information.
The Company assumes that the credit risk on financial assets has increased significantly if it is more than 90 days past due.
The Company considers financial asset to be in default when:a. The borrower is unlikely to pay its credit obligation to the Company in full, without recourse by the Company to action such as realising security (if any is held); or b. The financial asset is 360 days or more past due.
Measurement of expected credit loss Expected credit loss are probability weighted estimate of credit losses. Credit losses are measured as the present value of all cash shortfalls (i.e. the difference between the cash flows due to the Company in accordance with the contract and the cash flow that the Company expects to receive).
Presentation of allowance of expected credit losses in the balance sheet Loss allowance for financial assets measured at amortised cost are deducted from the gross carrying amount of the assets.
Write – offThe Gross carrying amount of financial asset is written off (either partially of full) to the extent that there is no realistic prospect of recovery. This is generally the case when Company determines that the debtor does not have asset or source of income that could generate sufficient cash flows to repay the amount subject to write-off. However, financial assets that are written-off could still be subject to enforcement activities in order to comply with Company’s procedures for recovery of amounts due.
ii. Impairment of non-financial asset The Company’s non-financial assets other than inventories and deferred tax assets, are reviewed at each reporting date to determine whether there is any indication of impairment. If any such indication exists, then the asset’s recoverable amount is estimated.
ANNUAL REPORT 2020-21 : NOTES TO THE FINANCIAL STATEMENTS
Notes to the Financial statements for the year ended March 31, 2021 (Continued)

66
For impairment testing, assets that do not generate independent cash inflows are grouped together into cash-generating units (CGUs). Each CGU represents the smallest group of assets that generates cash inflows that are largely independent of the cash inflows of other assets or CGUs. The recoverable amount of a CGU (or an individual asset) is the higher of its value in use and its fair value less cost of disposal. Value in use is based on the estimated future cash flows, discounted to their present value using a pre-tax discount rate that reflects current market assessments of the time value of money and the risks specific to the CGU (or the asset). The Company’s corporate assets (e.g. central office building for providing support to various CGUs) do not generate independent cash inflows. To determine impairment of corporate asset, recoverable amount is determined for the CGUs to which the corporate asset belongs. An impairment loss is recognised if the carrying amount of an asset or CGU exceeds its estimated recoverable amount. Impairment losses are recognised in the statement of profit and loss. Impairment loss recognised in respect of a CGU is allocated first to reduce the carrying amount of any goodwill allocated to the CGU, and then to reduce the carrying amounts of the other assets of the CGU (or group of CGUs) on a pro rata basis. An impairment loss in respect of assets for which impairment loss has been recognised in prior periods, the Company reviews at each reporting date whether there is any indication that the loss has decreased or no longer exists. An impairment loss is reversed if there has been a change in the estimates used to determine the recoverable amount. Such a reversal is made only to the extent that the asset’s carrying amount does not exceed the carrying amount that would have been determined, net of depreciation or amortisation, if no impairment loss had been recognised. An impairment loss on goodwill is not subsequently reversed. g) Employee benefits
i. Short term employee benefitsShort term employee benefit obligations are measured on an undiscounted basis and are expensed as the related service is provided. A liability is recognised for the amount expected to be paid, if the Company has a present legal or constructive obligation to pay this amount as a result of past service provided by the employee, and the amount of obligation can be estimated reliably.
ii. Share-based payment transactions Share-based payment are provided to employees of the Group via the Company’s Employees Stock Option Plan (“Emcure ESOS 2013”)
The company accounts for the share-based payment transactions as equity settled.
The grant date fair value of equity settled share-based payment awards granted to employees of the Company is recognised as an employee expense, with a corresponding increase in equity, over the period that the employees unconditionally become entitled to the awards. The amount recognised as expense is based on the estimate of the number of awards for which the related service and non-market vesting conditions are expected to be met, such that the amount ultimately recognised as an expense is based on the number of awards that do meet the related service and non-market vesting conditions at the vesting date. The Company also grants the options to the employees of it’s subsidiaries for which subsidiary does not have an obligation to settle the share based payment transaction. Total expense for such options issued to employees of subsidiary is recognised as investment in the nature of employee stock options issued to employees of subsidiary and corresponding increase in share options outstanding account. iii. Defined contribution plan A defined contribution plan is a post-employment benefit plan under which an entity pays fixed contributions into a separate entity and will have no legal or constructive obligation to pay further amounts. The Company makes specified monthly
contributions towards Government administered provident fund scheme. Obligations for contributions to defined contribution plans are recognised as an employee benefit expense in profit or loss in the periods during which the related services are rendered by employees. Prepaid contributions are recognised as an asset to the extent that a cash refund or a reduction in future payments is available.
iv. Defined benefit planA defined benefit plan is a post-employment benefit plan other than a defined contribution plan. The Company’s net obligation in respect of defined benefit plans is calculated separately for each plan by estimating the amount of future benefit that employees have earned in the current and prior periods, discounting that amount and deducting the fair value of any plan assets. The calculation of defined benefit obligation is performed annually by a qualified actuary using the projected unit credit method. When the calculation result is a potential asset for the Company, the recognised asset is limited to the present value of economic benefit available in the form of any future refunds from the plan or reductions in future contributions to the plan (‘the asset ceiling’). In order to calculate the present value of economic benefits, consideration is given to any minimum funding requirements. Remeasurement of the net defined benefit liability, which comprise actuarial gains and losses, the return on plan assets (excluding interest) and the effect of the asset ceiling (if any, excluding interest), are recognised in OCI. The Company determines the net interest expense (income) on the net defined benefit liability (asset) for the period by applying the discount rate used to measure the defined benefit obligation at the beginning of the annual period to the then-net defined benefit liability (asset), taking into account any changes in the net defined benefit liability (asset) during the period as a result of contributions and benefit payments. Net interest expense and other expenses related to defined benefit plans are recognised in statement of profit and loss. When the benefits of the plan are changed or when plan is curtailed, the resulting change in benefit that relates to past service (‘past service cost’ or ‘past service gain’) or the gain or loss on curtailment is recognised immediately in profit or loss. The Company recognises gain and losses on the settlement of a defined benefit plan when the settlement occurs.
v. Other long term employee benefit The Company’s liability in respect of other long-term employee benefits (compensated absences) is the amount of future benefit that employees have earned in return for their service in the current and prior periods, that benefit is discounted to determine its present value, and the fair value of any related assets is deducted. The obligation is measured on the basis of an annual independent actuarial valuation using the Projected Unit Credit method. Remeasurement gains or losses are recognised in profit or loss in the period in which they arise. h) Provisions (other than for employee benefits), Contingent liabilities and contin-gent assets A provision is recognised if, as a result of a past event, the Company has a present legal or constructive obligation that can be estimated reliably, and it is probable that an outflow of economic benefits will be required to settle the obligation. Provisions are determined by discounting the expected future cash flows (representing the best estimate of the expenditure required to settle the present obligation at the balance sheet date) at a pre-tax-rate that reflects current market assessments of the time value of money and the risks specific to the liability. The unwinding of the discount is recognised as finance cost. Expected future operating losses are not provided for.
i. Sales returns and breakage expiry When a customer has a right to return the product within a given period, the Company has recognised a provision for returns. The provision is measured equal to the value of the sales expected to return in the future
ANNUAL REPORT 2020-21 : NOTES TO THE FINANCIAL STATEMENTS
Notes to the Financial statements for the year ended March 31, 2021 (Continued)

67
period. Revenue is adjusted for the expected value of the returns and cost of sales are adjusted for the value of the corresponding goods to be returned. The Company has an obligation to replace the goods which will expire. The Company has recognised a provision for the returns due to expiry. The provision is measured on the basis of historical trend of expiry against the sales occurred in the current and earlier period. Management considers the sales value for the periods which are equivalent to average general shelf life of products. Revenue is adjusted for the expected value of the returns. ii. Contingencies Provision in respect of loss contingencies relating to claims, litigations, assessments, fines, penalties, etc. are recognized when it is probable that a liability has been incurred, and the amount can be estimated reliably. iii. Contingent liabilities and contingent assets A contingent liability exists when there is a possible but not probable obligation, or a present obligation that may, but probably will not, require an outflow of resources, or a present obligation whose amount cannot be estimated reliably. Contingent liabilities do not warrant provisions, but are disclosed unless the possibility of outflow of resources is remote. A contingent asset is a possible asset that arises from past events and whose existence will be confirmed only by the occurrence or non-occurrence of one or more uncertain future events not wholly within the control of the entity. Contingent assets are not recognized in the financial statements. However, contingent assets are assessed continually and if it is virtually certain that an inflow of economic benefit will arise, the asset and related income are recognized in the period in which the change occurs. A contingent asset is disclosed, where an inflow of economic benefits is probable. i) Revenue from sale of goods
Revenue is measured based on the consideration specified in a contract with a customer. Consideration is allocated to each performance obligation specified in the contract. The Company recognises revenue pertaining to each performance obligation when it transfers control over a product to a customer, which is adjusted for expected refunds, which are estimated based on the historical data, adjusted as necessary. The transaction price is also adjusted for the effect of time value of money if the contract includes significant financing component.
The consideration can be fixed or variable. Where the consideration promised in a contract includes a variable amount, the Company estimates the amount of consideration to which the Company will be entitled in exchange for transferring the promised goods or services to a customer. Variable consideration is only recognised when it is highly probable that a significant reversal will not occur.
The Company recognises refund liability where the Company receives consideration from a customer and expects to refund some or all of that consideration to the customer. The refund liability is measured at the amount of consideration received (or receivable) for which the entity does not expect to be entitled (i.e. amounts not included in the transaction price).
Rendering of services - sale of technology / know-how, rights, licenses and other intangibles Income from sale of technology / know-how, rights, licenses and other intangibles is recognised in accordance with the terms of the contract with customers when the related performance obligation is completed, or when risks and rewards of ownership are transferred, as applicable.
Profit share revenuesFrom time to time the Company enters into marketing arrangements with business partners for the sale of its products in certain markets. Under such arrangements, the Company sells its products to the business partners at a price agreed upon in the arrangement and is also entitled to a profit share which is over and above the
agreed price. The profit share is dependent on the business partner’s ultimate net sale proceeds or net profit, subject to any reductions or adjustments that are required by the terms of the arrangement. Such arrangements typically require the business partner to provide confirmation of units sold and net sales or net profit computations for the products covered under the arrangement. Revenue amount equal to the base purchase price is recognized in these transactions upon delivery of products to the business partners. An additional amount representing the profit share component is recognized as revenue only to the extent that it is highly probable that a significant reversal will not occur. At the end of each reporting period, the Company updates the estimated transaction price (including updating its assessment of whether an estimate of variable consideration is constrained) to represent faithfully the circumstances present at the end of the reporting period and the changes in circumstances during the reporting period. Profit share revenue is measured as per the percentage of profit share and computation method, specified in the agreement with business partner.
Rental income Rental income is recognised in profit or loss on a straight-line basis over the term of the lease except where the rentals are structured to increase in line with expected general inflation.
j) Government grantsGovernment grants are recognised initially as deferred income at fair value when there is reasonable assurance that they will be received and the Company will comply with the conditions associated with the grant; they are then recognised in profit or loss as other operating revenue on a systematic basis.
Grants that compensate the Company for expenses incurred are recognised in profit or loss as other operating revenue on a systematic basis in the periods in which such expenses are recognised.
k) Leasesi. The Company as a lesseeThe Company evaluates if an arrangement qualifies to be a lease as per the requirements of Ind AS 116. Identification of a lease requires significant judgment. The Company uses significant judgement in assessing the lease term (including anticipated renewals) and the applicable discount rate. The Company determines the lease term as the non-cancellable period of a lease, together with both periods covered by an option to extend the lease if the Company is reasonably certain to exercise that option; and periods covered by an option to terminate the lease if the Company is reasonably certain not to exercise that option. In assessing whether the Company is reasonably certain to exercise an option to extend a lease, or not to exercise an option to terminate a lease, it considers all relevant facts and circumstances that create an economic incentive for the Company to exercise the option to extend the lease, or not to exercise the option to terminate the lease. The Company revises the lease term if there is a change in the non-cancellable period of a lease. The discount rate is generally based on the incremental borrowing rate specific to the lease being evaluated or for a portfolio of leases with similar characteristics.
The Company measures the lease liability at the present value of the lease payments that are not paid at the commencement date of the lease. The lease payments are discounted using the interest rate implicit in the lease, if that rate can be readily determined. If that rate cannot be readily determined, the Company uses incremental borrowing rate. For leases with reasonably similar characteristics, the Company, on a lease by lease basis, may adopt either the incremental borrowing rate specific to the lease or the incremental borrowing rate for the portfolio as a whole. The lease payments shall include fixed payments, residual value guarantees, exercise price of a purchase option where the Company is reasonably certain to exercise that option and payments of penalties for terminating the lease,if the lease term reflects the lessee exercising an option to terminate the lease.
The lease liability is subsequently remeasured by increasing the carrying amount to
ANNUAL REPORT 2020-21 : NOTES TO THE FINANCIAL STATEMENTS
Notes to the Financial statements for the year ended March 31, 2021 (Continued)

68
reflect interest on the lease liability, reducing the carrying amount to reflect the lease payments made and remeasuring the carrying amount to reflect any reassessment or lease modifications or to reflect revised in-substance fixed lease payments. The Company recognises right-of-use asset representing its right to use the underlying asset for the lease term at the lease commencement date. The cost of the right-of-use asset measured at inception shall comprise of the amount of the initial measurement of the lease liability adjusted for any lease payments made at or before the commencement date less any lease incentives received, plus any initial direct costs incurred and an estimate of costs to be incurred by the lessee in dismantling and removing the underlying asset or restoring the underlying asset or site on which it is located. The right-of-use assets is subsequently measured at cost less any accumulated depreciation, accumulated impairment losses, if any and adjusted for any remeasurement of the lease liability. The right-of-use assets is depreciated using the straight-line method from the commencement date over the shorter of lease term or useful life of right-of-use asset. The estimated useful lives of right-of-use assets are determined on the same basis as those of property, plant and equipment.Right-of-use assets are tested for impairment whenever there is any indication that their carrying amounts may not be recoverable. Impairment loss, if any, is recognised in the statement of profit and loss.
The Company has elected not to apply the requirements of Ind AS 116 Leases to short-term leases of all assets that have a lease term of 12 months or less and leases for which the underlying asset is of low value. The lease payments associated with these leases are recognized as an expense on a straight-line basis over the lease term.
For these short-term and low value leases, the Company recognizes the lease payments as an operating expense on a straight-line basis over the term of the lease. ii. The Company as a lessor
Leases for which the Company is a lessor is classified as a finance or operating lease. Whenever the terms of the lease transfer substantially all the risks and rewards of ownership to the lessee, the contract is classified as a finance lease. All other leases are classified as operating leases. When the Company is an intermediate lessor, it accounts for its interests in the head lease and the sublease separately. The sublease is classified as a finance or operating lease by reference to the right-of-use asset arising from the head lease. For operating leases, rental income is recognized on a straight line basis over the term of the relevant lease.
l) Recognition of dividend income, interest income or expensesDividend income is recognised in profit or loss on the date on which the Company’s right to receive payment is established. Interest income is recognised using effective interest method.
The ‘effective interest rate’ is the rate that exactly discounts estimated future cash payments or receipts through the expected life of financial instrument to: - The gross carrying amount of the financial assets; or- The amortised cost of the financial liability. In calculating interest income and expense, the effective interest rate is applied to the gross carrying amount of the asset (when the asset is not credit-impaired) or to the amortised cost of the liability. However, for financial assets that have become credit-impaired subsequent to initial recognition, interest income is calculated by applying the effective interest rate to the amortised cost of the financial asset. If the asset is no longer credit-impaired, then the calculation of interest income reverts to the gross basis. m) Income tax Income tax expense comprises of current and deferred tax. It is recognised in profit or loss except to the extent that it relates to an item recognised directly in equity or in other comprehensive income.
i. Current taxCurrent tax comprises the expected tax payable or receivable on the taxable income or loss of the year and any adjustment to the tax payable or receivable in respect of previous years. The amount of current tax reflects the best estimate of the tax amount expected to be paid or received after considering the uncertainty, if any, related to income taxes. It is measured using tax rates (and tax laws) enacted or substantively enacted by the reporting date. Significant judgments are involved in determining the provision for income taxes including judgment on whether tax positions are probable of being sustained in tax assessments. A tax assessment can involve complex issues, which can only be resolved over extended time periods. Current tax assets and current tax liabilities are offset only if there is a legally enforceable right to set off the recognised amounts, and it is intended to realise the asset and settle the liability on a net basis or simultaneously.
ii. Deferred taxDeferred tax is recognised in respect of temporary differences between the carrying amounts of assets and liabilities for financial reporting purposes and the corresponding amounts used for taxation purposes. Deferred tax is also recognised in respect of carried forward tax losses and tax credits. Deferred tax assets are recognised to the extent that it is probable that future taxable profits will be available against which they can be used. The existence of unused tax losses is strong evidence that future taxable profit may not be available. Therefore, in case of a history of recent losses, the Company recognises a deferred tax asset only to the extent that it has sufficient taxable temporary differences or there is convincing other evidence that sufficient taxable profit will be available against which such deferred tax asset can be realised. Deferred tax assets – unrecognised or recognised, are reviewed at each reporting date and are recognised/ reduced to the extent that it is probable/ no longer probable respectively that the related tax benefit will be realised. Deferred tax is measured at the tax rates that are expected to apply to the period when the asset is realised or the liability is settled, based on the laws that have been enacted or substantively enacted by the reporting date. The measurement of deferred tax reflects the tax consequences that would follow from the manner in which the Company expects, at the reporting date, to recover or settle the carrying amount of its assets and liabilities. Deferred tax assets and liabilities are offset if there is a legally enforceable right to offset current tax liabilities and assets, and they relate to income taxes levied by the same tax authority on the same taxable entity, or on different tax entities, but they intend to settle current tax liabilities and assets on a net basis or their tax assets and liabilities will be realised simultaneously.
n) Borrowing costBorrowing costs are interest and other costs (including exchange differences relating to foreign currency borrowings to the extent that they are regarded as an adjustment to interest costs) incurred in connection with the borrowing of funds. Borrowing costs directly attributable to acquisition or construction of an asset which necessarily take a substantial period of time to get ready for their intended use are capitalised as part of the cost of that asset. Other borrowing costs are recognised as an expense in the period in which they are incurred. o) Financial guarantee contractsFinancial guarantee contracts are recognised as a financial liability at the time the guarantee is issued. The liability is initially measured at fair value and subsequently at the higher of the amount determined in accordance with Ind AS 37 and the amount initially recognised less cumulative amortisation, where appropriate. The fair value of financial guarantees is determined as the present value of the difference in net cash flows between the contractual payments under the debt instrument and the payments that would be required without the guarantee, or the estimated amount that would be payable to a third party for assuming the obligations.
ANNUAL REPORT 2020-21 : NOTES TO THE FINANCIAL STATEMENTS
Notes to the Financial statements for the year ended March 31, 2021 (Continued)
69
Where guarantees in relation to loans or other payables of subsidiaries are provided for no compensation, the Company has made accounting policy choice of recognising fair value of such financial guarantee as finance cost. P) Cash and cash equivalentsCash and cash equivalents in the balance sheet comprises cash at bank and on hand and short-term deposits with an original maturity of three months or less, which are subject to an insignificant risk of changes in value. q) Segment Reporting Operating segments are reported in a manner consistent with the internal reporting provided to the chief operating decision maker.The board of directors of the Company are identified as Chief operating decision maker. Refer note 49 for segment information. r) Earnings per share The basic earnings per share is computed by dividing the net profit / (loss) after tax attributable to the equity shareholders for the period by the weighted average number of equity shares outstanding during the reporting period. Diluted earnings per share is computed by dividing the net profit / (loss) after tax attributable to the equity shareholders for the period by the weighted average number of equity and equivalent dilutive equity shares outstanding during the reporting period, except where the results would be anti-dilutive. s) Earnings before Interest, Tax, Depreciation and Amortisation (‘EBITDA’) presen-tationThe Company presents EBITDA as a separate line item on the face of the statement of profit and loss. EBITDA is calculated as the profit for the year before interest, tax, depreciation and amortisation and is presented consistently over the periods. t) Exceptional item In certain instances, the size, type or incidence of an item of income or expense, per-taining to the ordinary activities of the Company is such that its disclosure improves the understanding of the performance of the Company, such income or expenses is classified as an exceptional item and accordingly, disclosed in the notes accompany-ing to the financials statements.
u) Cash flow statementCash flow are reported using the indirect method, whereby profit before tax is adjusted for the effects of transactions of a non-cash nature, any deferrals or accruals of past or future operating cash receipts or payments and item of income or expenses associated with investing or financing cash flows. The cash flows from operating, investing and financing activities of the Company are segregated. For the purpose of cash flow statement bank overdraft that are repayable on demand are considered as cash and cash equivalent as it form an integral part of the company’s cash management.
v) Research and developmentRevenue expenditure on research and development activities is recognized as ex-pense in the period in which it is incurred.
Note 1D. Recent accounting pronouncementsOn March 24, 2021, the Ministry of Corporate Affairs (“MCA”) through a notification, amended Schedule III of the Companies Act, 2013. The amendments revise Division I, II and III of Schedule III and are applicable from April 1, 2021. Key amendments relat-ing to Division II which relate to companies whose financial statements are required to comply with Companies (Indian Accounting Standards) Rules 2015 are:
Balance Sheet: • Lease liabilities should be separately disclosed under the head ‘financial
liabilities’, duly distinguished as current or non-current.
• Certain additional disclosures in the statement of changes in equity such as changes in equity share capital due to prior period errors and restated balances at the beginning of the current reporting period.
• Specified format for disclosure of shareholding of promoters.
• Specified format for ageing schedule of trade receivables, trade payables, capital work-in-progress and intangible asset under development.
• If a company has not used funds for the specific purpose for which it was borrowed from banks and financial institutions, then disclosure of details of where it has been used.
• Specific disclosure under ‘additional regulatory requirement’ such as compliance with approved schemes of arrangements, compliance with number of layers of companies, title deeds of immovable property not held in name of company, loans and advances to promoters, directors, key managerial personnel (KMP) and related parties, details of benami property held etc.
Statement of profit and loss: • Additional disclosures relating to Corporate Social Responsibility (CSR),
undisclosed income and crypto or virtual currency specified under the head ‘additional information’ in the notes forming part of the standalone financial statements.
The amendments are extensive and the Company will evaluate the same to give effect to them as required by law.
ANNUAL REPORT 2020-21 : NOTES TO THE FINANCIAL STATEMENTS
Notes to the Financial statements for the year ended March 31, 2021 (Continued)
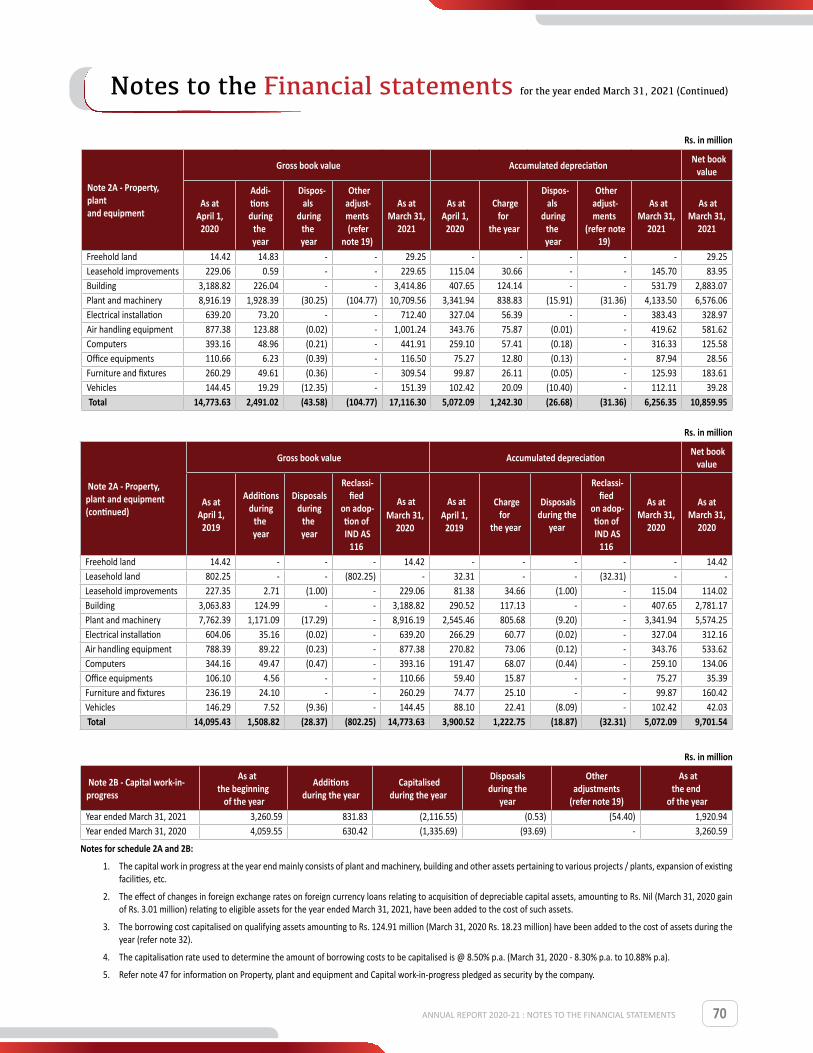
70
Rs. in million
Note 2A - Property, plant and equipment
Gross book value Accumulated depreciation Net book value
As at April 1,
2020
Addi-tions
during the
year
Dispos-als
during the
year
Other adjust-ments (refer
note 19)
As at March 31,
2021
As at April 1,
2020
Charge for
the year
Dispos-als
during the
year
Other adjust-ments
(refer note 19)
As at March 31,
2021
As at March 31,
2021
Freehold land 14.42 14.83 - - 29.25 - - - - - 29.25 Leasehold improvements 229.06 0.59 - - 229.65 115.04 30.66 - - 145.70 83.95 Building 3,188.82 226.04 - - 3,414.86 407.65 124.14 - - 531.79 2,883.07 Plant and machinery 8,916.19 1,928.39 (30.25) (104.77) 10,709.56 3,341.94 838.83 (15.91) (31.36) 4,133.50 6,576.06 Electrical installation 639.20 73.20 - - 712.40 327.04 56.39 - - 383.43 328.97 Air handling equipment 877.38 123.88 (0.02) - 1,001.24 343.76 75.87 (0.01) - 419.62 581.62 Computers 393.16 48.96 (0.21) - 441.91 259.10 57.41 (0.18) - 316.33 125.58 Office equipments 110.66 6.23 (0.39) - 116.50 75.27 12.80 (0.13) - 87.94 28.56 Furniture and fixtures 260.29 49.61 (0.36) - 309.54 99.87 26.11 (0.05) - 125.93 183.61 Vehicles 144.45 19.29 (12.35) - 151.39 102.42 20.09 (10.40) - 112.11 39.28 Total 14,773.63 2,491.02 (43.58) (104.77) 17,116.30 5,072.09 1,242.30 (26.68) (31.36) 6,256.35 10,859.95
Rs. in million
Note 2A - Property, plant and equipment (continued)
Gross book value Accumulated depreciation Net book value
As at April 1,
2019
Additions during
the year
Disposals during
the year
Reclassi-fied
on adop-tion of IND AS
116
As at March 31,
2020
As at April 1,
2019
Charge for
the year
Disposals during the
year
Reclassi-fied
on adop-tion of IND AS
116
As at March 31,
2020
As at March 31,
2020
Freehold land 14.42 - - - 14.42 - - - - - 14.42 Leasehold land 802.25 - - (802.25) - 32.31 - - (32.31) - - Leasehold improvements 227.35 2.71 (1.00) - 229.06 81.38 34.66 (1.00) - 115.04 114.02 Building 3,063.83 124.99 - - 3,188.82 290.52 117.13 - - 407.65 2,781.17 Plant and machinery 7,762.39 1,171.09 (17.29) - 8,916.19 2,545.46 805.68 (9.20) - 3,341.94 5,574.25 Electrical installation 604.06 35.16 (0.02) - 639.20 266.29 60.77 (0.02) - 327.04 312.16 Air handling equipment 788.39 89.22 (0.23) - 877.38 270.82 73.06 (0.12) - 343.76 533.62 Computers 344.16 49.47 (0.47) - 393.16 191.47 68.07 (0.44) - 259.10 134.06 Office equipments 106.10 4.56 - - 110.66 59.40 15.87 - - 75.27 35.39 Furniture and fixtures 236.19 24.10 - - 260.29 74.77 25.10 - - 99.87 160.42 Vehicles 146.29 7.52 (9.36) - 144.45 88.10 22.41 (8.09) - 102.42 42.03 Total 14,095.43 1,508.82 (28.37) (802.25) 14,773.63 3,900.52 1,222.75 (18.87) (32.31) 5,072.09 9,701.54
Rs. in million
Note 2B - Capital work-in-progress
As at the beginning
of the year
Additions during the year
Capitalised during the year
Disposals during the
year
Other adjustments
(refer note 19)
As at the end
of the year Year ended March 31, 2021 3,260.59 831.83 (2,116.55) (0.53) (54.40) 1,920.94 Year ended March 31, 2020 4,059.55 630.42 (1,335.69) (93.69) - 3,260.59
Notes for schedule 2A and 2B:
1. The capital work in progress at the year end mainly consists of plant and machinery, building and other assets pertaining to various projects / plants, expansion of existing facilities, etc.
2. The effect of changes in foreign exchange rates on foreign currency loans relating to acquisition of depreciable capital assets, amounting to Rs. Nil (March 31, 2020 gain of Rs. 3.01 million) relating to eligible assets for the year ended March 31, 2021, have been added to the cost of such assets.
3. The borrowing cost capitalised on qualifying assets amounting to Rs. 124.91 million (March 31, 2020 Rs. 18.23 million) have been added to the cost of assets during the year (refer note 32).
4. The capitalisation rate used to determine the amount of borrowing costs to be capitalised is @ 8.50% p.a. (March 31, 2020 - 8.30% p.a. to 10.88% p.a).
5. Refer note 47 for information on Property, plant and equipment and Capital work-in-progress pledged as security by the company.
ANNUAL REPORT 2020-21 : NOTES TO THE FINANCIAL STATEMENTS
Notes to the Financial statements for the year ended March 31, 2021 (Continued)
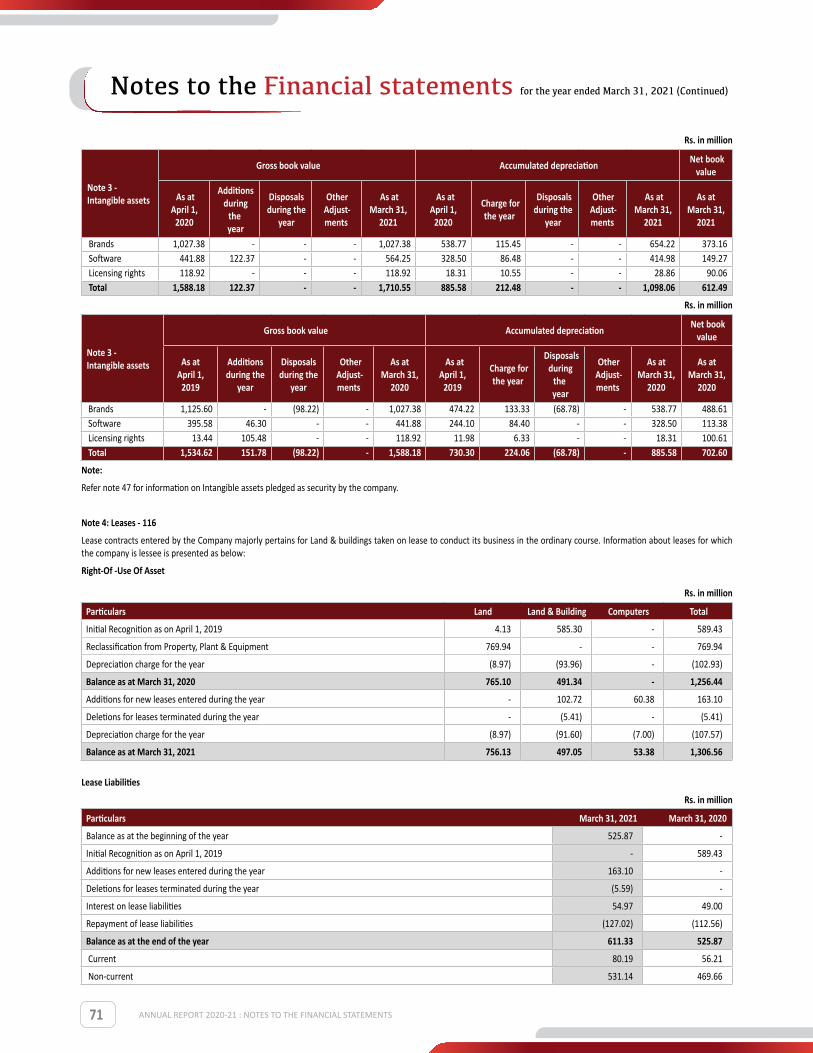
71
Rs. in million
Note 3 - Intangible assets
Gross book value Accumulated depreciation Net book value
As at April 1,
2020
Additions during
the year
Disposals during the
year
Other Adjust-ments
As at March 31,
2021
As at April 1,
2020
Charge for the year
Disposals during the
year
Other Adjust-ments
As at March 31,
2021
As at March 31,
2021
Brands 1,027.38 - - - 1,027.38 538.77 115.45 - - 654.22 373.16 Software 441.88 122.37 - - 564.25 328.50 86.48 - - 414.98 149.27 Licensing rights 118.92 - - - 118.92 18.31 10.55 - - 28.86 90.06 Total 1,588.18 122.37 - - 1,710.55 885.58 212.48 - - 1,098.06 612.49
Rs. in million
Note 3 - Intangible assets
Gross book value Accumulated depreciation Net book value
As at April 1,
2019
Additions during the
year
Disposals during the
year
Other Adjust-ments
As at March 31,
2020
As at April 1,
2019
Charge for the year
Disposals during
the year
Other Adjust-ments
As at March 31,
2020
As at March 31,
2020
Brands 1,125.60 - (98.22) - 1,027.38 474.22 133.33 (68.78) - 538.77 488.61 Software 395.58 46.30 - - 441.88 244.10 84.40 - - 328.50 113.38 Licensing rights 13.44 105.48 - - 118.92 11.98 6.33 - - 18.31 100.61 Total 1,534.62 151.78 (98.22) - 1,588.18 730.30 224.06 (68.78) - 885.58 702.60
Note:
Refer note 47 for information on Intangible assets pledged as security by the company.
Note 4: Leases - 116
Lease contracts entered by the Company majorly pertains for Land & buildings taken on lease to conduct its business in the ordinary course. Information about leases for which the company is lessee is presented as below:
Right-Of -Use Of Asset
Rs. in million
Particulars Land Land & Building Computers Total
Initial Recognition as on April 1, 2019 4.13 585.30 - 589.43
Reclassification from Property, Plant & Equipment 769.94 - - 769.94
Depreciation charge for the year (8.97) (93.96) - (102.93)
Balance as at March 31, 2020 765.10 491.34 - 1,256.44
Additions for new leases entered during the year - 102.72 60.38 163.10
Deletions for leases terminated during the year - (5.41) - (5.41)
Depreciation charge for the year (8.97) (91.60) (7.00) (107.57)
Balance as at March 31, 2021 756.13 497.05 53.38 1,306.56
Lease Liabilities
Rs. in million
Particulars March 31, 2021 March 31, 2020
Balance as at the beginning of the year 525.87 -
Initial Recognition as on April 1, 2019 - 589.43
Additions for new leases entered during the year 163.10 -
Deletions for leases terminated during the year (5.59) -
Interest on lease liabilities 54.97 49.00
Repayment of lease liabilities (127.02) (112.56)
Balance as at the end of the year 611.33 525.87
Current 80.19 56.21
Non-current 531.14 469.66
ANNUAL REPORT 2020-21 : NOTES TO THE FINANCIAL STATEMENTS
Notes to the Financial statements for the year ended March 31, 2021 (Continued)
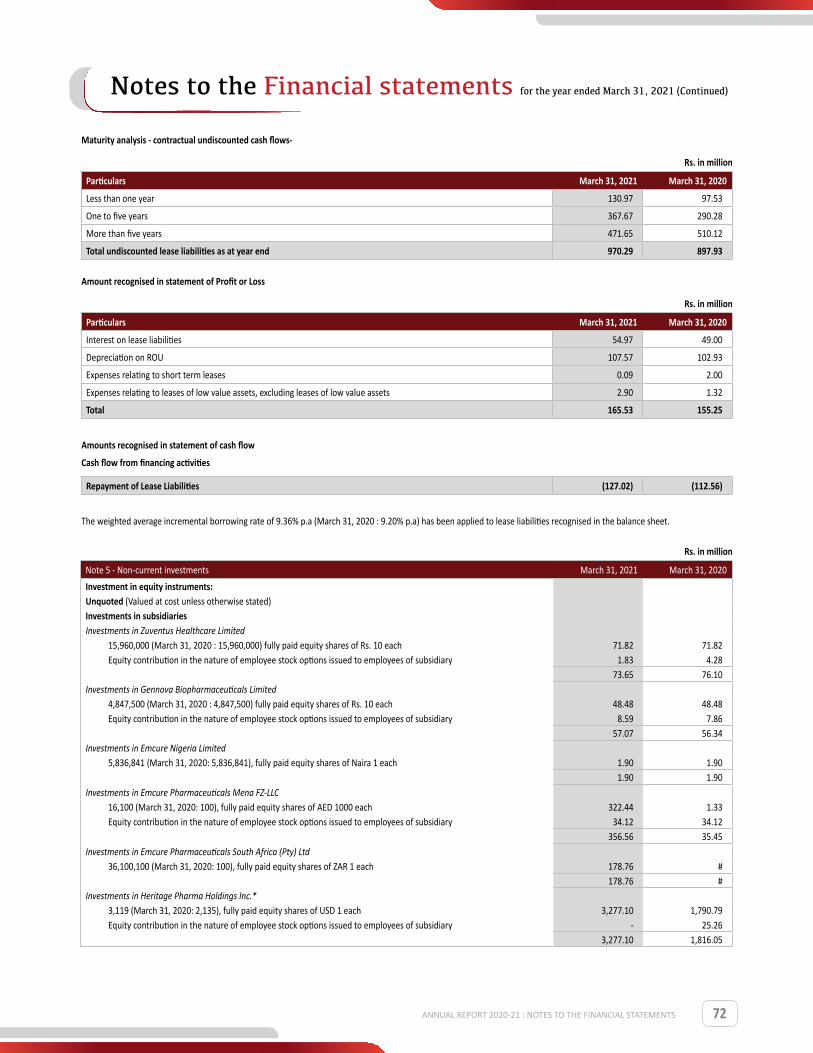
72
Maturity analysis - contractual undiscounted cash flows-
Rs. in million
Particulars March 31, 2021 March 31, 2020
Less than one year 130.97 97.53
One to five years 367.67 290.28
More than five years 471.65 510.12
Total undiscounted lease liabilities as at year end 970.29 897.93
Amount recognised in statement of Profit or Loss
Rs. in million
Particulars March 31, 2021 March 31, 2020
Interest on lease liabilities 54.97 49.00
Depreciation on ROU 107.57 102.93
Expenses relating to short term leases 0.09 2.00
Expenses relating to leases of low value assets, excluding leases of low value assets 2.90 1.32
Total 165.53 155.25
Amounts recognised in statement of cash flow
Cash flow from financing activities
Repayment of Lease Liabilities (127.02) (112.56)
The weighted average incremental borrowing rate of 9.36% p.a (March 31, 2020 : 9.20% p.a) has been applied to lease liabilities recognised in the balance sheet.
Rs. in million
Note 5 - Non-current investments March 31, 2021 March 31, 2020
Investment in equity instruments: Unquoted (Valued at cost unless otherwise stated)Investments in subsidiariesInvestments in Zuventus Healthcare Limited
15,960,000 (March 31, 2020 : 15,960,000) fully paid equity shares of Rs. 10 each 71.82 71.82 Equity contribution in the nature of employee stock options issued to employees of subsidiary 1.83 4.28
73.65 76.10 Investments in Gennova Biopharmaceuticals Limited
4,847,500 (March 31, 2020 : 4,847,500) fully paid equity shares of Rs. 10 each 48.48 48.48 Equity contribution in the nature of employee stock options issued to employees of subsidiary 8.59 7.86
57.07 56.34 Investments in Emcure Nigeria Limited
5,836,841 (March 31, 2020: 5,836,841), fully paid equity shares of Naira 1 each 1.90 1.90 1.90 1.90
Investments in Emcure Pharmaceuticals Mena FZ-LLC16,100 (March 31, 2020: 100), fully paid equity shares of AED 1000 each 322.44 1.33 Equity contribution in the nature of employee stock options issued to employees of subsidiary 34.12 34.12
356.56 35.45 Investments in Emcure Pharmaceuticals South Africa (Pty) Ltd
36,100,100 (March 31, 2020: 100), fully paid equity shares of ZAR 1 each 178.76 # 178.76 #
Investments in Heritage Pharma Holdings Inc.*3,119 (March 31, 2020: 2,135), fully paid equity shares of USD 1 each 3,277.10 1,790.79 Equity contribution in the nature of employee stock options issued to employees of subsidiary - 25.26
3,277.10 1,816.05
ANNUAL REPORT 2020-21 : NOTES TO THE FINANCIAL STATEMENTS
Notes to the Financial statements for the year ended March 31, 2021 (Continued)
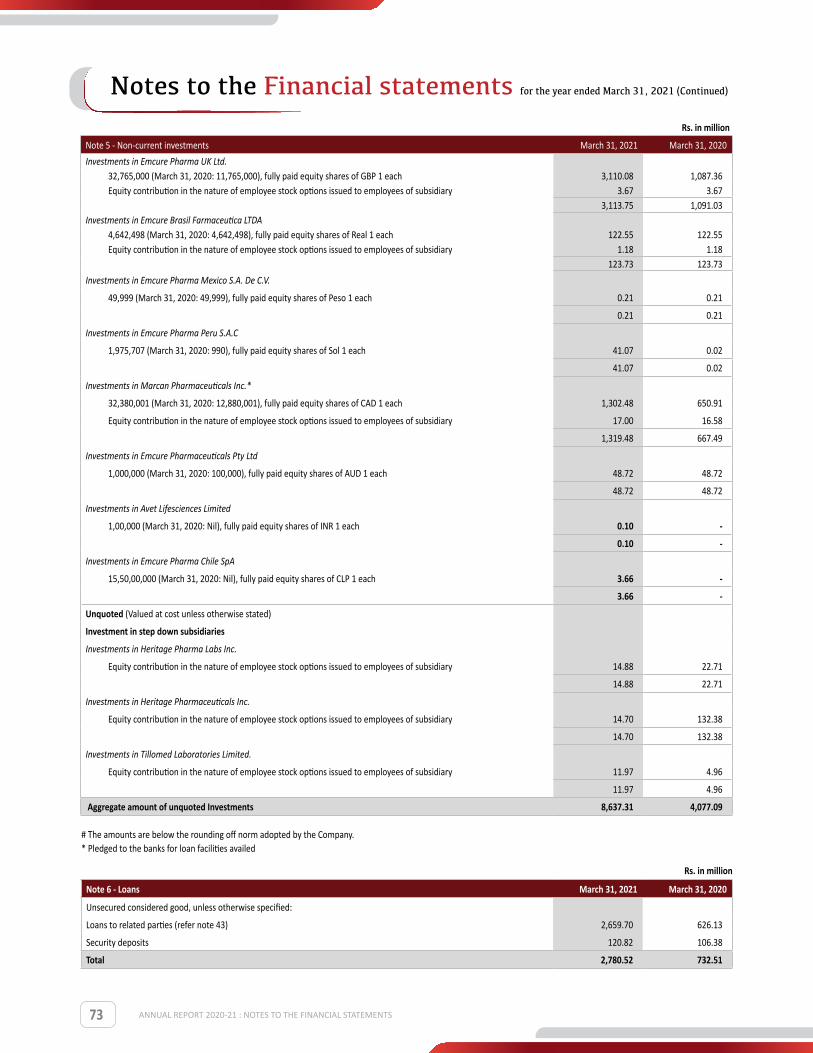
73
Note 5 - Non-current investments March 31, 2021 March 31, 2020
Investments in Emcure Pharma UK Ltd.32,765,000 (March 31, 2020: 11,765,000), fully paid equity shares of GBP 1 each 3,110.08 1,087.36 Equity contribution in the nature of employee stock options issued to employees of subsidiary 3.67 3.67
3,113.75 1,091.03 Investments in Emcure Brasil Farmaceutica LTDA
4,642,498 (March 31, 2020: 4,642,498), fully paid equity shares of Real 1 each 122.55 122.55 Equity contribution in the nature of employee stock options issued to employees of subsidiary 1.18 1.18
123.73 123.73
Investments in Emcure Pharma Mexico S.A. De C.V.
49,999 (March 31, 2020: 49,999), fully paid equity shares of Peso 1 each 0.21 0.21
0.21 0.21
Investments in Emcure Pharma Peru S.A.C
1,975,707 (March 31, 2020: 990), fully paid equity shares of Sol 1 each 41.07 0.02
41.07 0.02
Investments in Marcan Pharmaceuticals Inc.*
32,380,001 (March 31, 2020: 12,880,001), fully paid equity shares of CAD 1 each 1,302.48 650.91
Equity contribution in the nature of employee stock options issued to employees of subsidiary 17.00 16.58
1,319.48 667.49
Investments in Emcure Pharmaceuticals Pty Ltd
1,000,000 (March 31, 2020: 100,000), fully paid equity shares of AUD 1 each 48.72 48.72
48.72 48.72
Investments in Avet Lifesciences Limited
1,00,000 (March 31, 2020: Nil), fully paid equity shares of INR 1 each 0.10 -
0.10 -
Investments in Emcure Pharma Chile SpA
15,50,00,000 (March 31, 2020: Nil), fully paid equity shares of CLP 1 each 3.66 -
3.66 -
Unquoted (Valued at cost unless otherwise stated)
Investment in step down subsidiaries
Investments in Heritage Pharma Labs Inc.
Equity contribution in the nature of employee stock options issued to employees of subsidiary 14.88 22.71
14.88 22.71
Investments in Heritage Pharmaceuticals Inc.
Equity contribution in the nature of employee stock options issued to employees of subsidiary 14.70 132.38
14.70 132.38
Investments in Tillomed Laboratories Limited.
Equity contribution in the nature of employee stock options issued to employees of subsidiary 11.97 4.96
11.97 4.96
Aggregate amount of unquoted Investments 8,637.31 4,077.09
# The amounts are below the rounding off norm adopted by the Company.* Pledged to the banks for loan facilities availed
Rs. in million
Note 6 - Loans March 31, 2021 March 31, 2020
Unsecured considered good, unless otherwise specified:
Loans to related parties (refer note 43) 2,659.70 626.13
Security deposits 120.82 106.38
Total 2,780.52 732.51
ANNUAL REPORT 2020-21 : NOTES TO THE FINANCIAL STATEMENTS
Notes to the Financial statements for the year ended March 31, 2021 (Continued)
Rs. in million
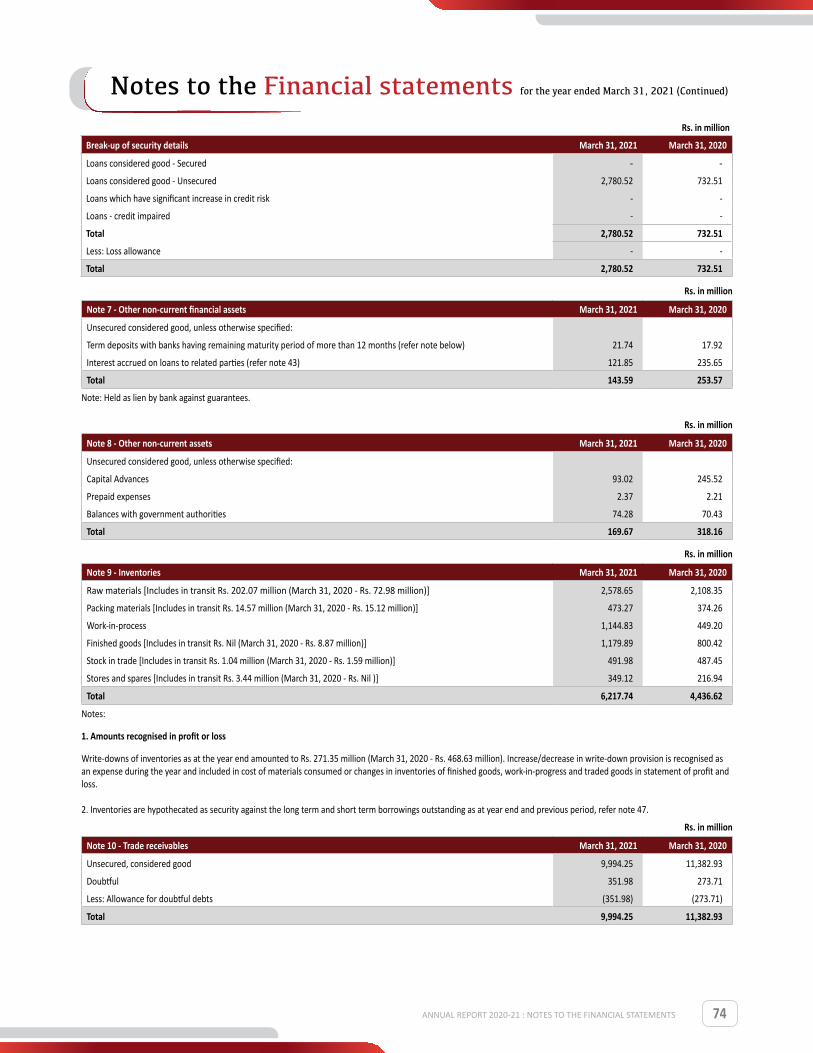
74
Break-up of security details March 31, 2021 March 31, 2020
Loans considered good - Secured - -
Loans considered good - Unsecured 2,780.52 732.51
Loans which have significant increase in credit risk - -
Loans - credit impaired - -
Total 2,780.52 732.51
Less: Loss allowance - -
Total 2,780.52 732.51
Rs. in million
Note 7 - Other non-current financial assets March 31, 2021 March 31, 2020
Unsecured considered good, unless otherwise specified:
Term deposits with banks having remaining maturity period of more than 12 months (refer note below) 21.74 17.92
Interest accrued on loans to related parties (refer note 43) 121.85 235.65
Total 143.59 253.57
Note: Held as lien by bank against guarantees.
Rs. in million
Note 8 - Other non-current assets March 31, 2021 March 31, 2020
Unsecured considered good, unless otherwise specified:
Capital Advances 93.02 245.52
Prepaid expenses 2.37 2.21
Balances with government authorities 74.28 70.43
Total 169.67 318.16
Rs. in million
Note 9 - Inventories March 31, 2021 March 31, 2020
Raw materials [Includes in transit Rs. 202.07 million (March 31, 2020 - Rs. 72.98 million)] 2,578.65 2,108.35
Packing materials [Includes in transit Rs. 14.57 million (March 31, 2020 - Rs. 15.12 million)] 473.27 374.26
Work-in-process 1,144.83 449.20
Finished goods [Includes in transit Rs. Nil (March 31, 2020 - Rs. 8.87 million)] 1,179.89 800.42
Stock in trade [Includes in transit Rs. 1.04 million (March 31, 2020 - Rs. 1.59 million)] 491.98 487.45
Stores and spares [Includes in transit Rs. 3.44 million (March 31, 2020 - Rs. Nil )] 349.12 216.94
Total 6,217.74 4,436.62
Notes:
1. Amounts recognised in profit or loss
Write-downs of inventories as at the year end amounted to Rs. 271.35 million (March 31, 2020 - Rs. 468.63 million). Increase/decrease in write-down provision is recognised as an expense during the year and included in cost of materials consumed or changes in inventories of finished goods, work-in-progress and traded goods in statement of profit and loss.
2. Inventories are hypothecated as security against the long term and short term borrowings outstanding as at year end and previous period, refer note 47.
Rs. in million
Note 10 - Trade receivables March 31, 2021 March 31, 2020
Unsecured, considered good 9,994.25 11,382.93
Doubtful 351.98 273.71
Less: Allowance for doubtful debts (351.98) (273.71)
Total 9,994.25 11,382.93
ANNUAL REPORT 2020-21 : NOTES TO THE FINANCIAL STATEMENTS
Notes to the Financial statements for the year ended March 31, 2021 (Continued)
Rs. in million
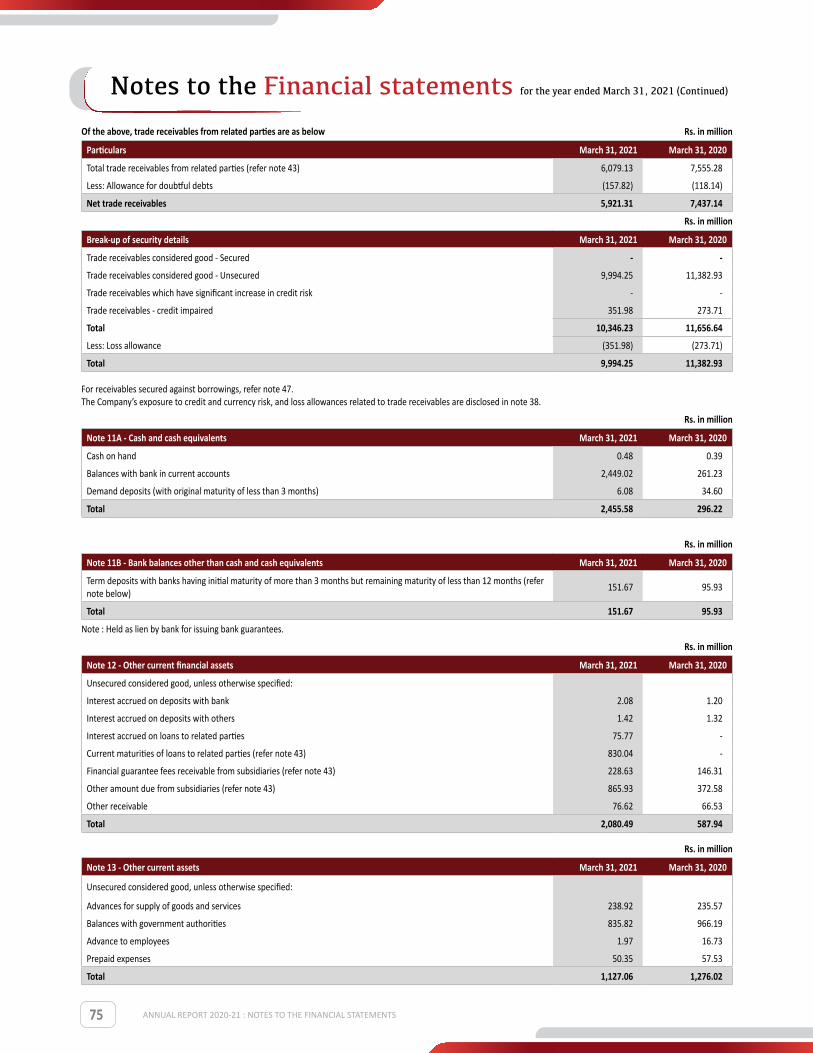
75
Of the above, trade receivables from related parties are as below Rs. in million
Particulars March 31, 2021 March 31, 2020
Total trade receivables from related parties (refer note 43) 6,079.13 7,555.28
Less: Allowance for doubtful debts (157.82) (118.14)
Net trade receivables 5,921.31 7,437.14
Rs. in million
Break-up of security details March 31, 2021 March 31, 2020
Trade receivables considered good - Secured - -
Trade receivables considered good - Unsecured 9,994.25 11,382.93
Trade receivables which have significant increase in credit risk - -
Trade receivables - credit impaired 351.98 273.71
Total 10,346.23 11,656.64
Less: Loss allowance (351.98) (273.71)
Total 9,994.25 11,382.93
For receivables secured against borrowings, refer note 47.The Company’s exposure to credit and currency risk, and loss allowances related to trade receivables are disclosed in note 38.
Rs. in million
Note 11A - Cash and cash equivalents March 31, 2021 March 31, 2020
Cash on hand 0.48 0.39
Balances with bank in current accounts 2,449.02 261.23
Demand deposits (with original maturity of less than 3 months) 6.08 34.60
Total 2,455.58 296.22
Rs. in million
Note 11B - Bank balances other than cash and cash equivalents March 31, 2021 March 31, 2020
Term deposits with banks having initial maturity of more than 3 months but remaining maturity of less than 12 months (refer note below)
151.67 95.93
Total 151.67 95.93
Note : Held as lien by bank for issuing bank guarantees.
Rs. in million
Note 12 - Other current financial assets March 31, 2021 March 31, 2020
Unsecured considered good, unless otherwise specified:
Interest accrued on deposits with bank 2.08 1.20
Interest accrued on deposits with others 1.42 1.32
Interest accrued on loans to related parties 75.77 -
Current maturities of loans to related parties (refer note 43) 830.04 -
Financial guarantee fees receivable from subsidiaries (refer note 43) 228.63 146.31
Other amount due from subsidiaries (refer note 43) 865.93 372.58
Other receivable 76.62 66.53
Total 2,080.49 587.94
Rs. in million
Note 13 - Other current assets March 31, 2021 March 31, 2020
Unsecured considered good, unless otherwise specified:
Advances for supply of goods and services 238.92 235.57
Balances with government authorities 835.82 966.19
Advance to employees 1.97 16.73
Prepaid expenses 50.35 57.53
Total 1,127.06 1,276.02
ANNUAL REPORT 2020-21 : NOTES TO THE FINANCIAL STATEMENTS
Notes to the Financial statements for the year ended March 31, 2021 (Continued)

76
Rs. in million
Note 14 - Equity share capitalMarch 31, 2021 March 31, 2020
Number of shares Value Number of shares Value
a. Authorised share capital
Equity Shares of Rs. 10 each 20,00,00,000 2,000.00 20,00,00,000 2,000.00
b. Issued, subscribed and paid up capital*
Equity Shares of Rs. 10 each 18,08,52,116 1,808.52 18,08,52,116 1,808.52
* All issued shares are fully paid up.
c. Reconciliation of the number of the shares outstanding at the beginning and at the end of the yearRs. in million
ParticularsMarch 31, 2021 March 31, 2020
Number of shares Value Number of shares Value
Equity Shares outstanding at the beginning and at the end of the year 18,08,52,116 1,808.52 18,08,52,116 1,808.52
The Company has also issued share options to its employees and employees of the subsidiaries, refer note 45.
d. Rights, preferences and restrictions attached to equity shares The Company has one class of equity shares having a par value of Rs.10 per share. Each shareholder is eligible for one vote per share held. The dividend proposed by the Board of Directors is subject to the approval of the shareholders in the ensuing Annual General Meeting, except in case of interim dividend. In the event of liquidation, the equity shareholders are eligible to receive the remaining assets of the Company after distribution of all preferential amounts, in proportion to their shareholding. e. Employee stock optionsTerms attached to stock options granted to employees of the Company and subsidiaries are described in note 45 regarding share-based payments.
f. No shares were issued for consideration other than cash during the period of five years immediately preceding the year ended March 31, 2021.
g. Details of equity shareholders holding shares more than 5%
ParticularsMarch 31, 2021 March 31, 2020
No. of Shares held % of Shareholding No. of Shares held % of Shareholding
Satish Mehta 7,57,78,176 41.90% 7,57,49,248 41.88%
BC Investments IV Limited 2,36,73,544 13.09% 2,36,73,544 13.09%
Sanjay Mehta 1,57,64,028 8.72% 1,57,64,028 8.72%
Samit Mehta 1,35,47,632 7.49% 1,35,47,632 7.49%
Sunil Mehta 1,10,85,012 6.13% 1,10,85,012 6.13%
Bhavana Mehta 93,88,288 5.19% 93,88,288 5.19%
Total 14,92,36,680 82.52% 14,92,07,752 82.50%
h. Shares reserved for issue under options:Rs. in million
ParticularsMarch 31, 2021 March 31, 2020
Number of shares Value Number of shares Value
Equity shares with face value of Rs. 10 each (refer note 45)
a. Under ESOS, 2013; at an exercise price of Rs. 221.25 per share 9,00,000 9.00 12,10,000 12.10
b. Under ESOS, 2013; at an exercise price of Rs. 508.75 per share 60,000 0.60 60,000 0.60
c. Under ESOS, 2013; at an exercise price of Rs. 522 per share 1,60,000 1.60 18,45,000 18.45
d. Under ESOS, 2013; at an exercise price of Rs. 580 per share 2,55,000 2.55 5,25,000 5.25
e. Under ESOS, 2013; at an exercise price of Rs. 620 per share 2,20,000 2.20 - -
Total 15,95,000 15.95 36,40,000 36.40
ANNUAL REPORT 2020-21 : NOTES TO THE FINANCIAL STATEMENTS
Notes to the Financial statements for the year ended March 31, 2021 (Continued)
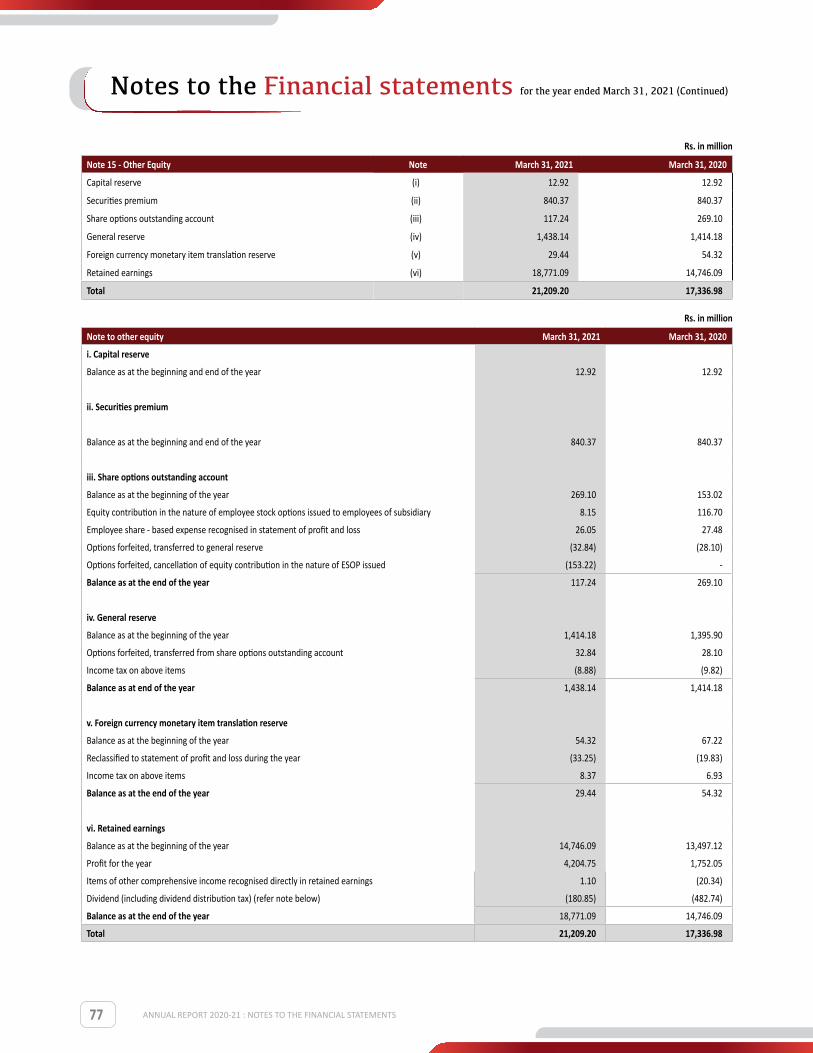
77
Rs. in million
Note 15 - Other Equity Note March 31, 2021 March 31, 2020
Capital reserve (i) 12.92 12.92
Securities premium (ii) 840.37 840.37
Share options outstanding account (iii) 117.24 269.10
General reserve (iv) 1,438.14 1,414.18
Foreign currency monetary item translation reserve (v) 29.44 54.32
Retained earnings (vi) 18,771.09 14,746.09
Total 21,209.20 17,336.98
Rs. in million
Note to other equity March 31, 2021 March 31, 2020
i. Capital reserve
Balance as at the beginning and end of the year 12.92 12.92
ii. Securities premium
Balance as at the beginning and end of the year 840.37 840.37
iii. Share options outstanding account
Balance as at the beginning of the year 269.10 153.02
Equity contribution in the nature of employee stock options issued to employees of subsidiary 8.15 116.70
Employee share - based expense recognised in statement of profit and loss 26.05 27.48
Options forfeited, transferred to general reserve (32.84) (28.10)
Options forfeited, cancellation of equity contribution in the nature of ESOP issued (153.22) -
Balance as at the end of the year 117.24 269.10
iv. General reserve
Balance as at the beginning of the year 1,414.18 1,395.90
Options forfeited, transferred from share options outstanding account 32.84 28.10
Income tax on above items (8.88) (9.82)
Balance as at end of the year 1,438.14 1,414.18
v. Foreign currency monetary item translation reserve
Balance as at the beginning of the year 54.32 67.22
Reclassified to statement of profit and loss during the year (33.25) (19.83)
Income tax on above items 8.37 6.93
Balance as at the end of the year 29.44 54.32
vi. Retained earnings
Balance as at the beginning of the year 14,746.09 13,497.12
Profit for the year 4,204.75 1,752.05
Items of other comprehensive income recognised directly in retained earnings 1.10 (20.34)
Dividend (including dividend distribution tax) (refer note below) (180.85) (482.74)
Balance as at the end of the year 18,771.09 14,746.09
Total 21,209.20 17,336.98
ANNUAL REPORT 2020-21 : NOTES TO THE FINANCIAL STATEMENTS
Notes to the Financial statements for the year ended March 31, 2021 (Continued)

78
Nature and purpose of other reserves
Capital reserve Capital reserve was created on account of amalgamation of companies prior to 2001.
Securities premium Securities premium is used to record the premium on issue of shares. The same is utilised in accordance with the provisions of the Act.
Share options outstanding account The Company has established equity-settled share-based payment plans for certain categories of employees of the group. Refer note 45 for further details of these plans. General Reserve The General Reserve is used from time to time to transfer profits from retained earnings for appropriation purposes.
Foreign currency monetary item translation reserve (‘FCMITR’) FCMITR is created on transfer of exchange differences related to long term monetary items which were not related to purchase of property, plant and equipment and intangible assets. This reserve is amortised over the remaining life of the long term monetary item and is transferred to the statement of profit and loss.
Rs. in million
Note 16 - Non-current borrowings March 31, 2021 March 31, 2020
Secured
Term loans:
Indian currency loans from banks 2,407.78 3,204.22
Indian currency loans from others 3,573.96 1,854.28
Foreign currency loans from banks 3,595.61 1,285.55
Vehicle loans 35.78 42.91
9,613.13 6,386.96
Less: Current maturities of term loans (refer note 22) (2,963.47) (1,743.59)
Less: Current maturities of vehicle loans (refer note 22) (14.70) (15.56)
Less: Transaction cost attributable to the borrowings (175.22) (89.08)
Total 6,459.74 4,538.73
ANNUAL REPORT 2020-21 : NOTES TO THE FINANCIAL STATEMENTS
The following dividends were declared and paid by the Company during the year:
Rs. in million
Particulars March 31, 2021 March 31, 2020
Interim dividend on equity shares - (271.28)
Dividend distribution tax on above - (22.96)
Final dividend on equity shares* (180.85) (180.85)
Dividend distribution tax on above - (7.65)
Total (180.85) (482.74)
* Final dividend paid during the period ended March 31, 2021 is related to dividend proposed for the year ended March 31, 2020.After the reporting dates the following dividend were proposed by the directors subject to approval at the annual general meeting; the dividends have not been recognised as liabilities.
Rs. in million
Particulars March 31, 2021 March 31, 2020
Rs. 1 per equity share (March 31, 2020 : Rs. 1 per equity share) 180.85 180.85
Notes to the Financial statements for the year ended March 31, 2021 (Continued)
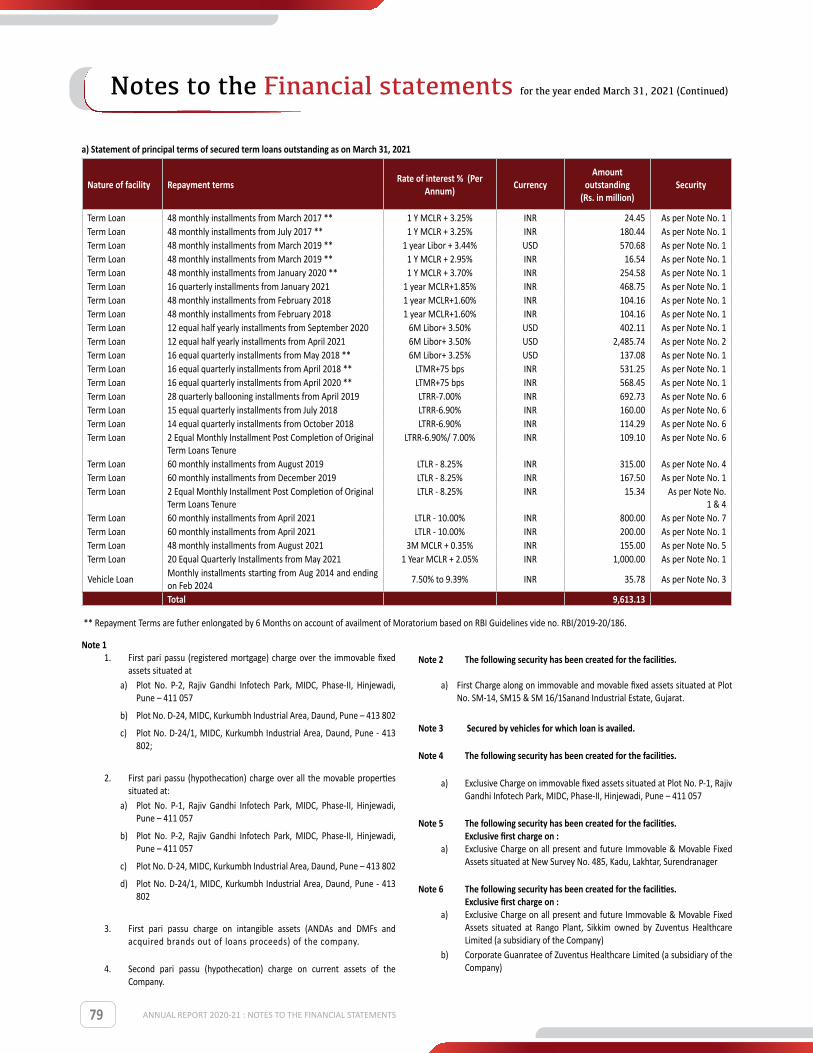
79
Note 1 1. First pari passu (registered mortgage) charge over the immovable fixed assets situated at
a) Plot No. P-2, Rajiv Gandhi Infotech Park, MIDC, Phase-II, Hinjewadi, Pune – 411 057
b) Plot No. D-24, MIDC, Kurkumbh Industrial Area, Daund, Pune – 413 802
c) Plot No. D-24/1, MIDC, Kurkumbh Industrial Area, Daund, Pune - 413 802;
2. First pari passu (hypothecation) charge over all the movable properties situated at:
a) Plot No. P-1, Rajiv Gandhi Infotech Park, MIDC, Phase-II, Hinjewadi, Pune – 411 057
b) Plot No. P-2, Rajiv Gandhi Infotech Park, MIDC, Phase-II, Hinjewadi, Pune – 411 057
c) Plot No. D-24, MIDC, Kurkumbh Industrial Area, Daund, Pune – 413 802
d) Plot No. D-24/1, MIDC, Kurkumbh Industrial Area, Daund, Pune - 413 802
3. First pari passu charge on intangible assets (ANDAs and DMFs and acquired brands out of loans proceeds) of the company. 4. Second pari passu (hypothecation) charge on current assets of the Company.
Note 2 The following security has been created for the facilities.
a) First Charge along on immovable and movable fixed assets situated at Plot No. SM-14, SM15 & SM 16/1Sanand Industrial Estate, Gujarat.
Note 3 Secured by vehicles for which loan is availed.
Note 4 The following security has been created for the facilities.
a) Exclusive Charge on immovable fixed assets situated at Plot No. P-1, Rajiv Gandhi Infotech Park, MIDC, Phase-II, Hinjewadi, Pune – 411 057
Note 5 The following security has been created for the facilities. Exclusive first charge on :
a) Exclusive Charge on all present and future Immovable & Movable Fixed Assets situated at New Survey No. 485, Kadu, Lakhtar, Surendranager
Note 6 The following security has been created for the facilities. Exclusive first charge on :
a) Exclusive Charge on all present and future Immovable & Movable Fixed Assets situated at Rango Plant, Sikkim owned by Zuventus Healthcare Limited (a subsidiary of the Company)b) Corporate Guanratee of Zuventus Healthcare Limited (a subsidiary of the Company)
a) Statement of principal terms of secured term loans outstanding as on March 31, 2021
Nature of facility Repayment terms Rate of interest % (Per Annum) Currency
Amount outstanding
(Rs. in million) Security
Term Loan 48 monthly installments from March 2017 ** 1 Y MCLR + 3.25% INR 24.45 As per Note No. 1Term Loan 48 monthly installments from July 2017 ** 1 Y MCLR + 3.25% INR 180.44 As per Note No. 1Term Loan 48 monthly installments from March 2019 ** 1 year Libor + 3.44% USD 570.68 As per Note No. 1Term Loan 48 monthly installments from March 2019 ** 1 Y MCLR + 2.95% INR 16.54 As per Note No. 1Term Loan 48 monthly installments from January 2020 ** 1 Y MCLR + 3.70% INR 254.58 As per Note No. 1Term Loan 16 quarterly installments from January 2021 1 year MCLR+1.85% INR 468.75 As per Note No. 1Term Loan 48 monthly installments from February 2018 1 year MCLR+1.60% INR 104.16 As per Note No. 1Term Loan 48 monthly installments from February 2018 1 year MCLR+1.60% INR 104.16 As per Note No. 1Term Loan 12 equal half yearly installments from September 2020 6M Libor+ 3.50% USD 402.11 As per Note No. 1Term Loan 12 equal half yearly installments from April 2021 6M Libor+ 3.50% USD 2,485.74 As per Note No. 2Term Loan 16 equal quarterly installments from May 2018 ** 6M Libor+ 3.25% USD 137.08 As per Note No. 1Term Loan 16 equal quarterly installments from April 2018 ** LTMR+75 bps INR 531.25 As per Note No. 1Term Loan 16 equal quarterly installments from April 2020 ** LTMR+75 bps INR 568.45 As per Note No. 1Term Loan 28 quarterly ballooning installments from April 2019 LTRR-7.00% INR 692.73 As per Note No. 6Term Loan 15 equal quarterly installments from July 2018 LTRR-6.90% INR 160.00 As per Note No. 6Term Loan 14 equal quarterly installments from October 2018 LTRR-6.90% INR 114.29 As per Note No. 6Term Loan 2 Equal Monthly Installment Post Completion of Original
Term Loans TenureLTRR-6.90%/ 7.00% INR 109.10 As per Note No. 6
Term Loan 60 monthly installments from August 2019 LTLR - 8.25% INR 315.00 As per Note No. 4Term Loan 60 monthly installments from December 2019 LTLR - 8.25% INR 167.50 As per Note No. 1Term Loan 2 Equal Monthly Installment Post Completion of Original
Term Loans TenureLTLR - 8.25% INR 15.34 As per Note No.
1 & 4Term Loan 60 monthly installments from April 2021 LTLR - 10.00% INR 800.00 As per Note No. 7Term Loan 60 monthly installments from April 2021 LTLR - 10.00% INR 200.00 As per Note No. 1Term Loan 48 monthly installments from August 2021 3M MCLR + 0.35% INR 155.00 As per Note No. 5Term Loan 20 Equal Quarterly Installments from May 2021 1 Year MCLR + 2.05% INR 1,000.00 As per Note No. 1
Vehicle LoanMonthly installments starting from Aug 2014 and ending on Feb 2024
7.50% to 9.39% INR 35.78 As per Note No. 3
Total 9,613.13
** Repayment Terms are futher enlongated by 6 Months on account of availment of Moratorium based on RBI Guidelines vide no. RBI/2019-20/186.
ANNUAL REPORT 2020-21 : NOTES TO THE FINANCIAL STATEMENTS
Notes to the Financial statements for the year ended March 31, 2021 (Continued)
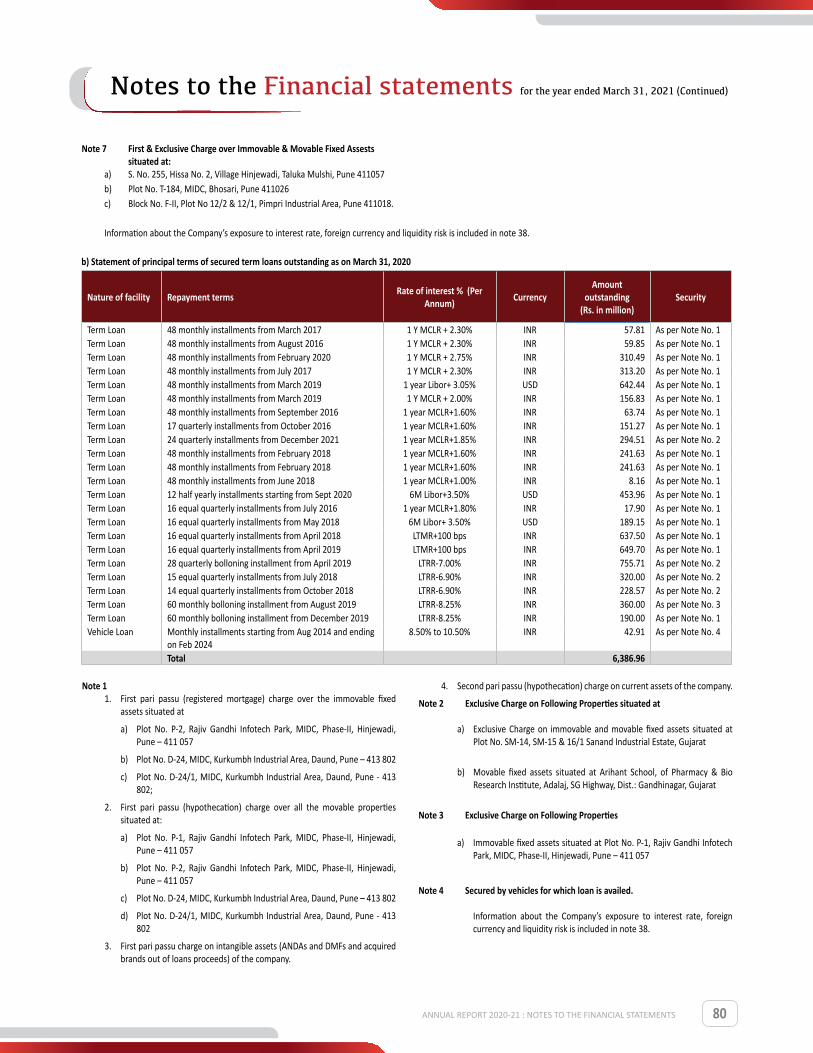
80
b) Statement of principal terms of secured term loans outstanding as on March 31, 2020
Nature of facility Repayment terms Rate of interest % (Per Annum) Currency
Amount outstanding
(Rs. in million)Security
Term Loan 48 monthly installments from March 2017 1 Y MCLR + 2.30% INR 57.81 As per Note No. 1Term Loan 48 monthly installments from August 2016 1 Y MCLR + 2.30% INR 59.85 As per Note No. 1Term Loan 48 monthly installments from February 2020 1 Y MCLR + 2.75% INR 310.49 As per Note No. 1Term Loan 48 monthly installments from July 2017 1 Y MCLR + 2.30% INR 313.20 As per Note No. 1Term Loan 48 monthly installments from March 2019 1 year Libor+ 3.05% USD 642.44 As per Note No. 1Term Loan 48 monthly installments from March 2019 1 Y MCLR + 2.00% INR 156.83 As per Note No. 1Term Loan 48 monthly installments from September 2016 1 year MCLR+1.60% INR 63.74 As per Note No. 1Term Loan 17 quarterly installments from October 2016 1 year MCLR+1.60% INR 151.27 As per Note No. 1Term Loan 24 quarterly installments from December 2021 1 year MCLR+1.85% INR 294.51 As per Note No. 2Term Loan 48 monthly installments from February 2018 1 year MCLR+1.60% INR 241.63 As per Note No. 1Term Loan 48 monthly installments from February 2018 1 year MCLR+1.60% INR 241.63 As per Note No. 1Term Loan 48 monthly installments from June 2018 1 year MCLR+1.00% INR 8.16 As per Note No. 1Term Loan 12 half yearly installments starting from Sept 2020 6M Libor+3.50% USD 453.96 As per Note No. 1Term Loan 16 equal quarterly installments from July 2016 1 year MCLR+1.80% INR 17.90 As per Note No. 1Term Loan 16 equal quarterly installments from May 2018 6M Libor+ 3.50% USD 189.15 As per Note No. 1Term Loan 16 equal quarterly installments from April 2018 LTMR+100 bps INR 637.50 As per Note No. 1Term Loan 16 equal quarterly installments from April 2019 LTMR+100 bps INR 649.70 As per Note No. 1Term Loan 28 quarterly bolloning installment from April 2019 LTRR-7.00% INR 755.71 As per Note No. 2Term Loan 15 equal quarterly installments from July 2018 LTRR-6.90% INR 320.00 As per Note No. 2Term Loan 14 equal quarterly installments from October 2018 LTRR-6.90% INR 228.57 As per Note No. 2Term Loan 60 monthly bolloning installment from August 2019 LTRR-8.25% INR 360.00 As per Note No. 3Term Loan 60 monthly bolloning installment from December 2019 LTRR-8.25% INR 190.00 As per Note No. 1Vehicle Loan Monthly installments starting from Aug 2014 and ending
on Feb 20248.50% to 10.50% INR 42.91 As per Note No. 4
Total 6,386.96
Note 1 1. First pari passu (registered mortgage) charge over the immovable fixed
assets situated at
a) Plot No. P-2, Rajiv Gandhi Infotech Park, MIDC, Phase-II, Hinjewadi, Pune – 411 057
b) Plot No. D-24, MIDC, Kurkumbh Industrial Area, Daund, Pune – 413 802
c) Plot No. D-24/1, MIDC, Kurkumbh Industrial Area, Daund, Pune - 413 802;
2. First pari passu (hypothecation) charge over all the movable properties situated at:
a) Plot No. P-1, Rajiv Gandhi Infotech Park, MIDC, Phase-II, Hinjewadi, Pune – 411 057
b) Plot No. P-2, Rajiv Gandhi Infotech Park, MIDC, Phase-II, Hinjewadi, Pune – 411 057
c) Plot No. D-24, MIDC, Kurkumbh Industrial Area, Daund, Pune – 413 802
d) Plot No. D-24/1, MIDC, Kurkumbh Industrial Area, Daund, Pune - 413 802
3. First pari passu charge on intangible assets (ANDAs and DMFs and acquired brands out of loans proceeds) of the company.
4. Second pari passu (hypothecation) charge on current assets of the company.
Note 2 Exclusive Charge on Following Properties situated at
a) Exclusive Charge on immovable and movable fixed assets situated at Plot No. SM-14, SM-15 & 16/1 Sanand Industrial Estate, Gujarat
b) Movable fixed assets situated at Arihant School, of Pharmacy & Bio Research Institute, Adalaj, SG Highway, Dist.: Gandhinagar, Gujarat
Note 3 Exclusive Charge on Following Properties
a) Immovable fixed assets situated at Plot No. P-1, Rajiv Gandhi Infotech Park, MIDC, Phase-II, Hinjewadi, Pune – 411 057
Note 4 Secured by vehicles for which loan is availed.
Information about the Company’s exposure to interest rate, foreign currency and liquidity risk is included in note 38.
ANNUAL REPORT 2020-21 : NOTES TO THE FINANCIAL STATEMENTS
Note 7 First & Exclusive Charge over Immovable & Movable Fixed Assests situated at:
a) S. No. 255, Hissa No. 2, Village Hinjewadi, Taluka Mulshi, Pune 411057b) Plot No. T-184, MIDC, Bhosari, Pune 411026c) Block No. F-II, Plot No 12/2 & 12/1, Pimpri Industrial Area, Pune 411018.
Information about the Company’s exposure to interest rate, foreign currency and liquidity risk is included in note 38.
Notes to the Financial statements for the year ended March 31, 2021 (Continued)

81
Rs. in million
Note 17 - Other non-current financial liabilities March 31, 2021 March 31, 2020
Trade deposits (refer note below) 91.72 89.85
Financial guarantee obligations (refer note 43) 11.82 32.07
Other deposits (refer note 43) 14.99 13.42
Total 118.53 135.34
Note: Includes deposit from firm in which directors of the Company are interested - Rs. 10.00 million (March 31, 2020 - Rs. 10.00 million). Rs. in million
Note 18 - Non-current provisions March 31, 2021 March 31, 2020
Provision for employee benefits
Provision for compensated absences 178.03 157.56
Other provisions
Provision for sales returns and breakage expiry (refer note 23) 154.91 146.15
Total 332.94 303.71
Rs. in million
Note 19 - Assets classified as held for sale March 31, 2021 March 31, 2020
Plant and machinery 127.80 -
Total 127.80 - Notes:
Plant and machinery classified as held for sale during the reporting period was measured at the lower of its carrying amount and fair value less costs to sell at the time of the reclassification. Resultant gain/(loss) on reclassification was Rs. Nil. The fair value of the assets was determined based on firm commitment orders received from interested party. This is a level 2 measurement as per the fair value hierarchy set out in fair value measurement disclosures.
Rs. in million
Note 20 - Current borrowings March 31, 2021 March 31, 2020
Secured
Cash credit facilities / bank overdraft repayable on demand from banks 3,298.44 839.70
Working capital loans from banks 3,252.35 4,772.20
Less: Transaction cost attributable to the borrowings (15.31) (2.61)
Unsecured
Other cash credit facilities from banks 60.46 -
Total 6,595.94 5,609.29
Notes:
1. Borrowings from banks are secured by hypothecation of inventories, book debts and receivables (refer note 47).
2. The Cash credit facilities / bank overdraft facilities are repayable on demand and working capital loans are repayable within a year, with a range of interest for foreign currency loans of LIBOR+150 bps to LIBOR 250 bps and for Rupee loans 7.75% p.a. to 9.40% p.a. (March 31, 2020: foreign currency loans of LIBOR+250 bps and for Rupee loans 8.30% p.a. to 9.70% p.a.)
Rs. in million
Note 21 - Trade payables March 31, 2021 March 31, 2020
Trade payables to related parties (refer note 43) 276.99 353.92
Other trade payables
Total outstanding dues of micro and small enterprises (refer note 52) - 0.62
Total outstanding dues of creditors other than micro and small enterprises 5,465.87 4,031.70
Total 5,742.86 4,386.24
All trade payables are current.The Company’s exposure to currency and liquidity risks related to trade payables is disclosed in note 38.
ANNUAL REPORT 2020-21 : NOTES TO THE FINANCIAL STATEMENTS
Notes to the Financial statements for the year ended March 31, 2021 (Continued)
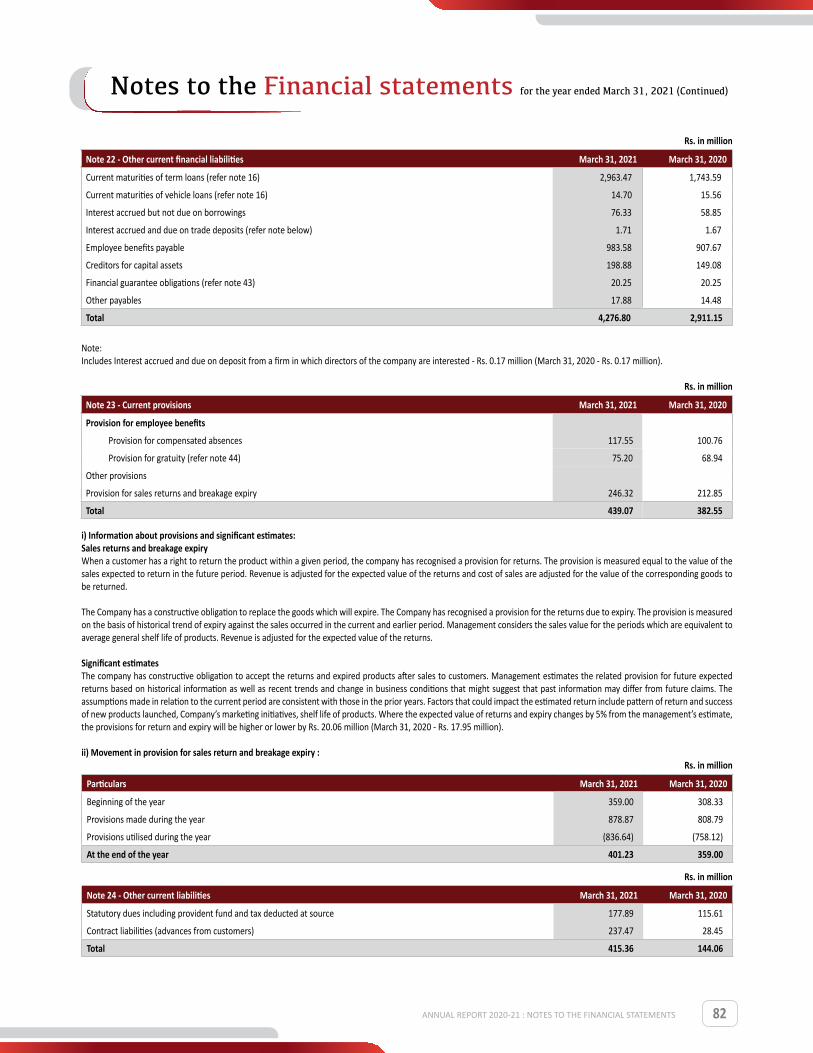
82
Rs. in million
Note 22 - Other current financial liabilities March 31, 2021 March 31, 2020
Current maturities of term loans (refer note 16) 2,963.47 1,743.59
Current maturities of vehicle loans (refer note 16) 14.70 15.56
Interest accrued but not due on borrowings 76.33 58.85
Interest accrued and due on trade deposits (refer note below) 1.71 1.67
Employee benefits payable 983.58 907.67
Creditors for capital assets 198.88 149.08
Financial guarantee obligations (refer note 43) 20.25 20.25
Other payables 17.88 14.48
Total 4,276.80 2,911.15
Note: Includes Interest accrued and due on deposit from a firm in which directors of the company are interested - Rs. 0.17 million (March 31, 2020 - Rs. 0.17 million).
Rs. in million
Note 23 - Current provisions March 31, 2021 March 31, 2020
Provision for employee benefits
Provision for compensated absences 117.55 100.76
Provision for gratuity (refer note 44) 75.20 68.94
Other provisions
Provision for sales returns and breakage expiry 246.32 212.85
Total 439.07 382.55
i) Information about provisions and significant estimates: Sales returns and breakage expiry When a customer has a right to return the product within a given period, the company has recognised a provision for returns. The provision is measured equal to the value of the sales expected to return in the future period. Revenue is adjusted for the expected value of the returns and cost of sales are adjusted for the value of the corresponding goods to be returned.
The Company has a constructive obligation to replace the goods which will expire. The Company has recognised a provision for the returns due to expiry. The provision is measured on the basis of historical trend of expiry against the sales occurred in the current and earlier period. Management considers the sales value for the periods which are equivalent to average general shelf life of products. Revenue is adjusted for the expected value of the returns. Significant estimates The company has constructive obligation to accept the returns and expired products after sales to customers. Management estimates the related provision for future expected returns based on historical information as well as recent trends and change in business conditions that might suggest that past information may differ from future claims. The assumptions made in relation to the current period are consistent with those in the prior years. Factors that could impact the estimated return include pattern of return and success of new products launched, Company’s marketing initiatives, shelf life of products. Where the expected value of returns and expiry changes by 5% from the management’s estimate, the provisions for return and expiry will be higher or lower by Rs. 20.06 million (March 31, 2020 - Rs. 17.95 million). ii) Movement in provision for sales return and breakage expiry :
Rs. in million
Particulars March 31, 2021 March 31, 2020
Beginning of the year 359.00 308.33
Provisions made during the year 878.87 808.79
Provisions utilised during the year (836.64) (758.12)
At the end of the year 401.23 359.00
Rs. in million
Note 24 - Other current liabilities March 31, 2021 March 31, 2020
Statutory dues including provident fund and tax deducted at source 177.89 115.61
Contract liabilities (advances from customers) 237.47 28.45
Total 415.36 144.06
ANNUAL REPORT 2020-21 : NOTES TO THE FINANCIAL STATEMENTS
Notes to the Financial statements for the year ended March 31, 2021 (Continued)

83
Rs. in million
Note 25 - Revenue from operations* March 31, 2021 March 31, 2020
Sale of products 30,957.65 23,326.38
Sale of services 314.39 30.40
Other operating revenue
Income arising from government grant - 5.26
Export incentives 209.36 337.20
Scrap sales 47.15 33.81
Indirect tax refund received (refer note 53) 8.09 24.04
Total 31,536.64 23,757.09
*Refer note 46 for details of revenue from contract with customers.Rs. in million
Note 26 - Other income March 31, 2021 March 31, 2020
Interest income under the effective interest method from:
Banks and others 53.28 8.02
Intercorporate loans 105.41 50.64
Dividend received from subsidiary 159.60 303.24
Profit on sale of property, plant and equipment 6.15 -
Gains on foreign exchange fluctuation (net) 385.61 669.04
Income on amortisation of financial guarantee liability (refer note 43) 20.25 20.31
Miscellaneous income 388.77 324.90
Total 1,119.07 1,376.15
Rs. in million
Note 27 - Cost of material consumed March 31, 2021 March 31, 2020
A: Raw material consumed
Opening inventory 2,108.35 1,982.65
Add : Purchases (net) 9,793.32 4,965.11
11,901.67 6,947.76
Less: Closing inventory 2,578.65 2,108.35
Cost of raw materials consumed during the year 9,323.02 4,839.41
B: Packing material consumed
Opening inventory 374.26 443.04
Add : Purchases (net) 1,249.20 690.30
1,623.46 1,133.34
Less: Closing inventory 473.27 374.26
Cost of packing materials consumed during the year 1,150.19 759.08
Total (A+B) 10,473.21 5,598.49
ANNUAL REPORT 2020-21 : NOTES TO THE FINANCIAL STATEMENTS
Notes to the Financial statements for the year ended March 31, 2021 (Continued)

84
Rs. in million
Note 28 - Changes in inventories of finished goods, work-in-progress and stock in trade March 31, 2021 March 31, 2020
Opening inventory
Work-in-process 449.20 882.29
Finished goods 800.42 723.84
Stock in trade 487.45 727.97
1,737.07 2,334.10
Less: Closing inventory
Work-in-process 1,144.83 449.20
Finished goods 1,179.89 800.42
Stock in trade 491.98 487.45
2,816.70 1,737.07
Changes in inventories of finished goods, work-in-progress and stock in trade (1,079.63) 597.03
Rs. in million
Note 29 - Employee benefit expenses March 31, 2021 March 31, 2020
Salaries, wages and bonus 4,886.29 4,861.80
Contribution to provident and other funds (refer note 44) 269.90 267.53
Gratuity (refer note 44) 101.89 79.54
Employee share-based payment (refer note 45) 26.05 27.48
Staff welfare expenses 225.47 217.15
Total 5,509.60 5,453.50
Rs. in million
Note 30 - Other expenses March 31, 2021 March 31, 2020
Processing charges 288.93 186.90
Factory consumables 800.56 810.59
Power and fuel 739.21 672.89
Insurance 106.92 62.62
Repairs and maintenance 332.55 276.77
Rent 2.99 3.32
Rates and taxes 68.10 85.14
Freight 616.00 188.15
Advertisement and promotional materials 805.50 1,216.68
Travelling and conveyance 401.75 766.69
Commission on sales 204.10 232.46
Printing and stationery 59.66 62.37
Legal and professional fees 824.02 539.07
Contractual services 305.27 247.44
Payment to auditors (refer note below) 8.98 8.76
Commission to non executive directors 10.40 6.90
Directors sitting fees 1.16 0.84
Provision for doubtful debts 23.42 32.64
Loss on sale of property, plant and equipment - 41.41
Bad debts written off 24.32 14.74
Expenditure towards corporate social responsibility (refer note 54) 64.77 58.08
Miscellaneous expenses 440.41 443.33
Total 6,129.02 5,957.79
ANNUAL REPORT 2020-21 : NOTES TO THE FINANCIAL STATEMENTS
Notes to the Financial statements for the year ended March 31, 2021 (Continued)
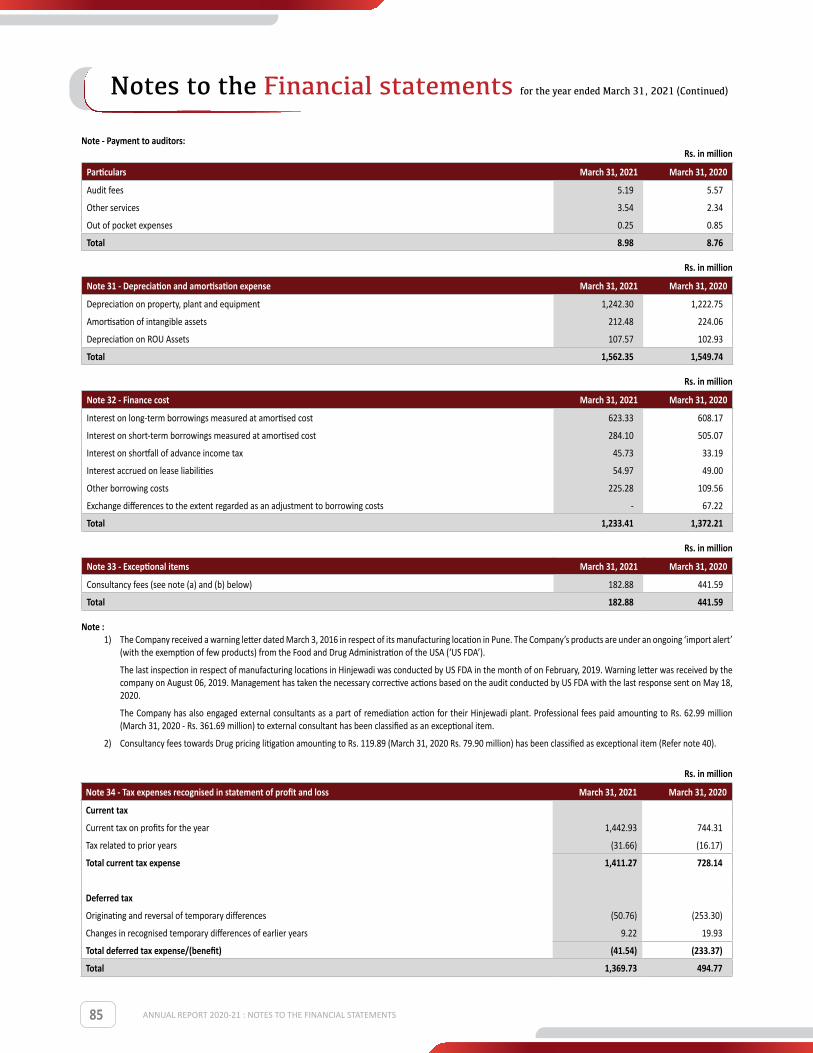
85
Note - Payment to auditors:Rs. in million
Particulars March 31, 2021 March 31, 2020
Audit fees 5.19 5.57
Other services 3.54 2.34
Out of pocket expenses 0.25 0.85
Total 8.98 8.76
Rs. in million
Note 31 - Depreciation and amortisation expense March 31, 2021 March 31, 2020
Depreciation on property, plant and equipment 1,242.30 1,222.75
Amortisation of intangible assets 212.48 224.06
Depreciation on ROU Assets 107.57 102.93
Total 1,562.35 1,549.74
Rs. in million
Note 32 - Finance cost March 31, 2021 March 31, 2020
Interest on long-term borrowings measured at amortised cost 623.33 608.17
Interest on short-term borrowings measured at amortised cost 284.10 505.07
Interest on shortfall of advance income tax 45.73 33.19
Interest accrued on lease liabilities 54.97 49.00
Other borrowing costs 225.28 109.56
Exchange differences to the extent regarded as an adjustment to borrowing costs - 67.22
Total 1,233.41 1,372.21
Rs. in million
Note 33 - Exceptional items March 31, 2021 March 31, 2020
Consultancy fees (see note (a) and (b) below) 182.88 441.59
Total 182.88 441.59
Note :1) The Company received a warning letter dated March 3, 2016 in respect of its manufacturing location in Pune. The Company’s products are under an ongoing ‘import alert’
(with the exemption of few products) from the Food and Drug Administration of the USA (‘US FDA’).
The last inspection in respect of manufacturing locations in Hinjewadi was conducted by US FDA in the month of on February, 2019. Warning letter was received by the company on August 06, 2019. Management has taken the necessary corrective actions based on the audit conducted by US FDA with the last response sent on May 18, 2020.
The Company has also engaged external consultants as a part of remediation action for their Hinjewadi plant. Professional fees paid amounting to Rs. 62.99 million (March 31, 2020 - Rs. 361.69 million) to external consultant has been classified as an exceptional item.
2) Consultancy fees towards Drug pricing litigation amounting to Rs. 119.89 (March 31, 2020 Rs. 79.90 million) has been classified as exceptional item (Refer note 40).
Rs. in million
Note 34 - Tax expenses recognised in statement of profit and loss March 31, 2021 March 31, 2020
Current tax
Current tax on profits for the year 1,442.93 744.31
Tax related to prior years (31.66) (16.17)
Total current tax expense 1,411.27 728.14
Deferred tax
Originating and reversal of temporary differences (50.76) (253.30)
Changes in recognised temporary differences of earlier years 9.22 19.93
Total deferred tax expense/(benefit) (41.54) (233.37)
Total 1,369.73 494.77
ANNUAL REPORT 2020-21 : NOTES TO THE FINANCIAL STATEMENTS
Notes to the Financial statements for the year ended March 31, 2021 (Continued)

86
Rs. in million
Tax (expenses)/income recognised in other comprehensive income March 31, 2021 March 31, 2020
Remeasurements of post-employment benefit obligations (0.37) 10.93
Total (0.37) 10.93
Rs. in million
Tax expense recognised in other equity March 31, 2021 March 31, 2020
Foreign currency monetary item translation reserve 8.37 6.93
General Reserve (8.88) (9.82)
Total (0.51) (2.89)
Rs. in million
Reconciliation of tax expense and the accounting profit multiplied by India’s tax rate: March 31, 2021 March 31, 2020
Profit before tax expense 5,574.48 2,246.82
Tax using the Company's domestic tax rate of 25.17% (March 31, 2020 — 34.94%) 25.17% 1,402.99 34.94% 785.13
Tax effect of amounts which are not (deductible) / taxable in calculating taxable income:Weighted deduction on research and development expenditure 0.00% - -6.02% (135.31)Non taxable income -0.72% (40.17) -4.72% (105.96)Non deductible expenses 0.53% 29.39 1.59% 35.75 Tax related to prior years -0.57% (31.66) -0.72% (16.17)Change in tax rate 0.00% - -5.46% (122.66)Changes in recognised temporary differences of earlier years 0.17% 9.22 0.89% 19.93 Other items 0.00% (0.04) 1.52% 34.06
Effective tax rate 24.57% 1,369.73 22.02% 494.77
# The Company has elected to exercise the option with regards to the tax rate mentioned under section 115BAA of the Income-tax Act, 1961 as introduced by the Taxation Laws (Amendment) Ordinance, 2019. Accordingly, the Company has recognized Provision for Income Tax for the year ended 31 March 2021 basis the rate prescribed in the said section. The impact of this change has been recognized in the statement of Profit & Loss for the year ended 31 March 2021.
Rs. in million
Note 35 - Deferred tax assets/(liabilities) - net March 31, 2021 March 31, 2020
Deferred tax assets on:
Income statement
Allowance for doubtful debts - trade receivables 88.59 68.89
Provision - employee benefit 107.54 97.46
Financial guarantee liability 8.06 13.15
Loans to subsidiaries 15.21 5.62
Lease Liability 153.86 132.35
Total deferred tax assets 373.26 317.47
Deferred tax liabilities on:
Property, plant and equipment 425.73 425.30
Intangible assets 88.09 88.75
Right to use asset 139.53 124.68
Total deferred tax liabilities 653.35 638.73
Deferred tax asset/(liability) - net (280.09) (321.26)
ANNUAL REPORT 2020-21 : NOTES TO THE FINANCIAL STATEMENTS
Notes to the Financial statements for the year ended March 31, 2021 (Continued)

87
Rs. in million
Movement of Deferred tax assets / liabilities
Net deferred tax assets/(liabilities) as at April 1, 2020
Transferred to statement of profit and loss
Transferred to Other comprehensive MAT credit utilised
Net deferred tax assets/(lia-bilities) as atMarch 31, 2021
Allowance for doubtful debts - trade receivables
68.89 19.70 - - 88.59
Provision - Employee benefit 97.46 10.45 (0.37) - 107.54 Financial guarantee liability 13.15 (5.09) - - 8.06 Lease Liability 132.35 21.51 - - 153.86 Loans to subsidiaries 5.62 9.59 - - 15.21 Property, plant and equipment (425.30) (0.43) - - (425.73)Intangible assets (88.75) 0.66 - - (88.09)Right to use asset (124.68) (14.85) - - (139.53)Total (321.26) 41.54 (0.37) - (280.09)
Rs. in million
Movement of Deferred tax assets / liabilities
Net deferred tax assets/(liabilities) as atApril 1, 2019
Transferred to statement of profit and loss
Transferred to Other comprehensive MAT credit utilised
Net deferred tax assets/(lia-bilities) as atMarch 31, 2020
Allowance for doubtful debts - trade receivables
59.45 9.44 - - 68.89
Provision - Employee benefit 116.24 (29.71) 10.93 - 97.46 Financial guarantee liability 25.37 (12.22) - - 13.15 Deferred government grant 1.84 (1.84) - - - Lease Liability - 132.35 - - 132.35 Minimum alternate tax credit entitlement 141.59 - - (141.59) - Loans to subsidiaries 14.45 (8.83) - - 5.62 Investment in preference shares of subsidiary
(4.45) 4.45 - - -
Property, plant and equipment (625.34) 200.04 - - (425.30)Intangible assets (153.12) 64.37 - - (88.75)Right to use asset - (124.68) - - (124.68)Total (423.97) 233.37 10.93 (141.59) (321.26)
Rs. in million
Note 36 - Current tax assets/(liabilities) (net) March 31, 2021 March 31, 2020
Tax assets (net of provision) 46.34 333.88
Current tax liability (net of advance tax) (341.58) (308.34)
Current Tax assets/(liabilities) (net) (295.24) 25.54
ANNUAL REPORT 2020-21 : NOTES TO THE FINANCIAL STATEMENTS
Notes to the Financial statements for the year ended March 31, 2021 (Continued)
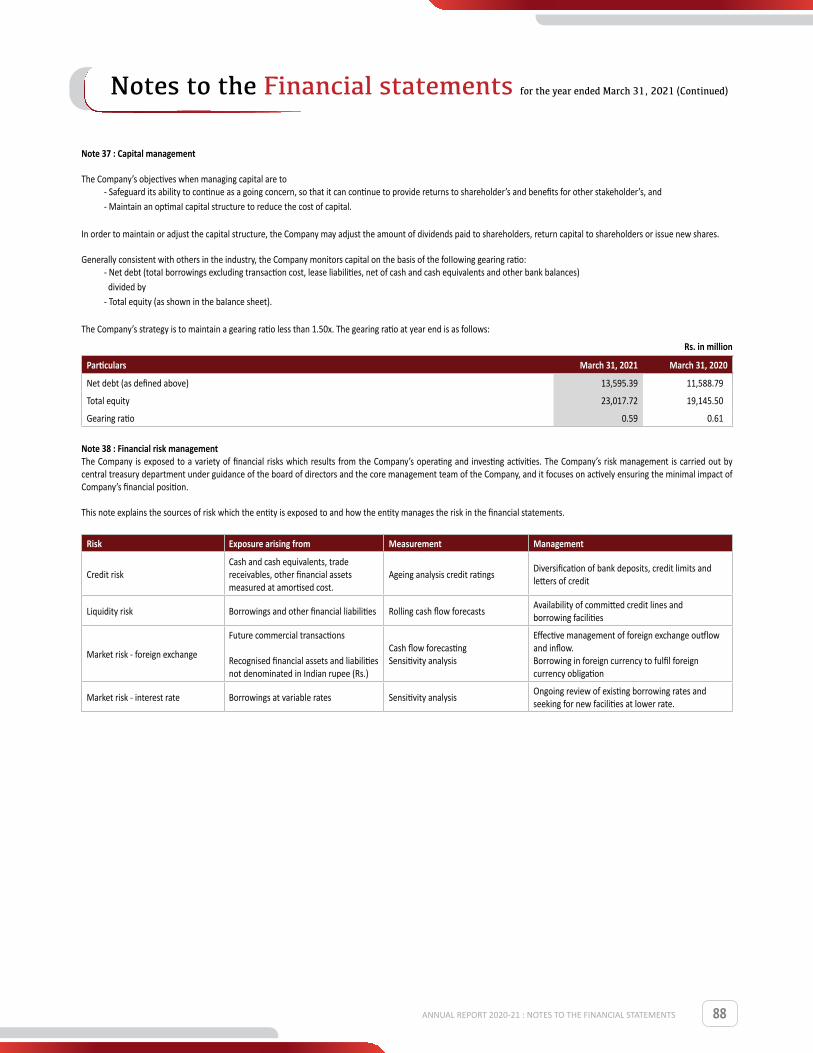
88
Note 37 : Capital management The Company’s objectives when managing capital are to
- Safeguard its ability to continue as a going concern, so that it can continue to provide returns to shareholder’s and benefits for other stakeholder’s, and- Maintain an optimaI capital structure to reduce the cost of capital.
In order to maintain or adjust the capital structure, the Company may adjust the amount of dividends paid to shareholders, return capital to shareholders or issue new shares. Generally consistent with others in the industry, the Company monitors capital on the basis of the foIIowing gearing ratio:
- Net debt (totaI borrowings excluding transaction cost, lease liabilities, net of cash and cash equivalents and other bank balances) divided by- Total equity (as shown in the baIance sheet).
The Company’s strategy is to maintain a gearing ratio less than 1.50x. The gearing ratio at year end is as follows:
Rs. in million
Particulars March 31, 2021 March 31, 2020
Net debt (as defined above) 13,595.39 11,588.79
Total equity 23,017.72 19,145.50
Gearing ratio 0.59 0.61
Note 38 : Financial risk managementThe Company is exposed to a variety of financial risks which results from the Company’s operating and investing activities. The Company’s risk management is carried out by central treasury department under guidance of the board of directors and the core management team of the Company, and it focuses on actively ensuring the minimal impact of Company’s financial position.
This note explains the sources of risk which the entity is exposed to and how the entity manages the risk in the financial statements.
Risk Exposure arising from Measurement Management
Credit riskCash and cash equivalents, trade receivables, other financial assets measured at amortised cost.
Ageing analysis credit ratingsDiversification of bank deposits, credit limits and letters of credit
Liquidity risk Borrowings and other financial liabilities Rolling cash flow forecastsAvailability of committed credit lines and borrowing facilities
Market risk - foreign exchange
Future commercial transactions Recognised financial assets and liabilities not denominated in Indian rupee (Rs.)
Cash flow forecasting Sensitivity analysis
Effective management of foreign exchange outflow and inflow. Borrowing in foreign currency to fulfil foreign currency obligation
Market risk - interest rate Borrowings at variable rates Sensitivity analysisOngoing review of existing borrowing rates and seeking for new facilities at lower rate.
ANNUAL REPORT 2020-21 : NOTES TO THE FINANCIAL STATEMENTS
Notes to the Financial statements for the year ended March 31, 2021 (Continued)

89
Credit riskCredit risk is the risk of financial loss to the Company if a customer or counterparty to a financial instrument fails to meet its contractual obligations, and arises principally from the Company’s receivables from customers and other financial assets. Credit risk is managed through credit approvals, establishing credit limits and continuously monitoring the creditworthiness of customers to which the Company grants credit terms in the normal course of business. The Company establishes an allowance for doubtful debts and impairment that represents its estimate of expected losses in respect of trade and other receivables. Other financial assets that are potentially subject to credit risk consists of cash equivalents, inter corporate loans and deposits. Further, the Company also recognises loss allowance by using a provision matrix based on historical credit loss experience wherein fixed provision rates are defined for each financial asset which is past due / not due. The Company depending on the diversity of its asset base, uses appropriate groupings if the historical credit loss experience shows significant different loss patterns for different customer segments / financial assets. Also, the Company limits its exposure to credit risk from receivables by establishing a maximum payment period for customers. The Company considers the recoverability from financial assets on regular intervals so that such financial assets are received within the due dates. The Company has exposure to credit risk which is limited to carrying amount of financial assets recognised at the date of Balance sheet. Trade receivables
Trade receivables are usually due within 7-180 days. Generally, and by practice significant domestic customers enjoy a credit period of approximately 7-45 days and for export customers, the credit period ranges from 30 to 180 days. The receivables are not interest bearing, which is the normal industry practice. All trade receivables are subject to credit risk exposure except for receivables from related parties. However, the Company does not identify specific concentration of credit risk with regard to trade receivables, as the amounts recognized represent a large number of receivables from various customers. Further, majority of the receivables pertains to receivables from Subsidiaries, wherein the concentration of credit risk is considered to be low. Certain receivables are also backed by letter of credit from the banks, resulting into negligible credit risk in recovery of such receivables. The Company uses a provision matrix (simplified approach) to measure the expected credit loss of trade receivables and other financial assets measured at amortised cost.
Year ended March 31, 2021: Expected credit loss for trade receivables under simplified approach
Rs in Million
Ageing Not Due 0-90 days past due
91-180 days past due
181-270 days past due
271-360 days past due
More than 360 days past due Total
Gross carrying amount 4,001.71 3,051.25 1,334.87 977.90 469.93 510.57 10,346.23
Expected loss rate (includes interest as well as credit loss)
-1.91% -2.16% -2.99% -3.38% -3.13% -23.87% -3.40%
Expected credit losses (loss allowance provision)
(76.52) (65.85) (39.96) (33.08) (14.71) (121.86) (351.98)
Carrying amount of trade receivables (net of loss allowance) 3,925.19 2,985.40 1,294.91 944.82 455.22 388.71 9,994.25
Year ended March 31, 2020:Expected credit loss for trade receivables under simplified approach
Rs in Million
Ageing Not Due 0-90 days past due
91-180 days past due
181-270 days past due
271-360 days past due
More than 360 days past due Total
Gross carrying amount 3,618.19 2,453.93 880.06 393.15 1,213.26 3,098.05 11,656.64
Expected loss rate (includes interest as well as credit loss)
-1.24% -1.75% -1.97% -2.66% -2.39% -4.17% -2.35%
Expected credit losses (loss allowance provision)
(44.97) (42.87) (17.30) (10.44) (29.00) (129.13) (273.71)
Carrying amount of trade receivables (net of loss allowance) 3,573.22 2,411.06 862.76 382.71 1,184.26 2,968.92 11,382.93
During the period, the Company has made write-offs of trade receivables amount to Rs. 24.32 million (March 31, 2020 — Rs. 14.74 million). There are no financial assets which have been written off during the year which are subject to enforcement activity.
ANNUAL REPORT 2020-21 : NOTES TO THE FINANCIAL STATEMENTS
Notes to the Financial statements for the year ended March 31, 2021 (Continued)
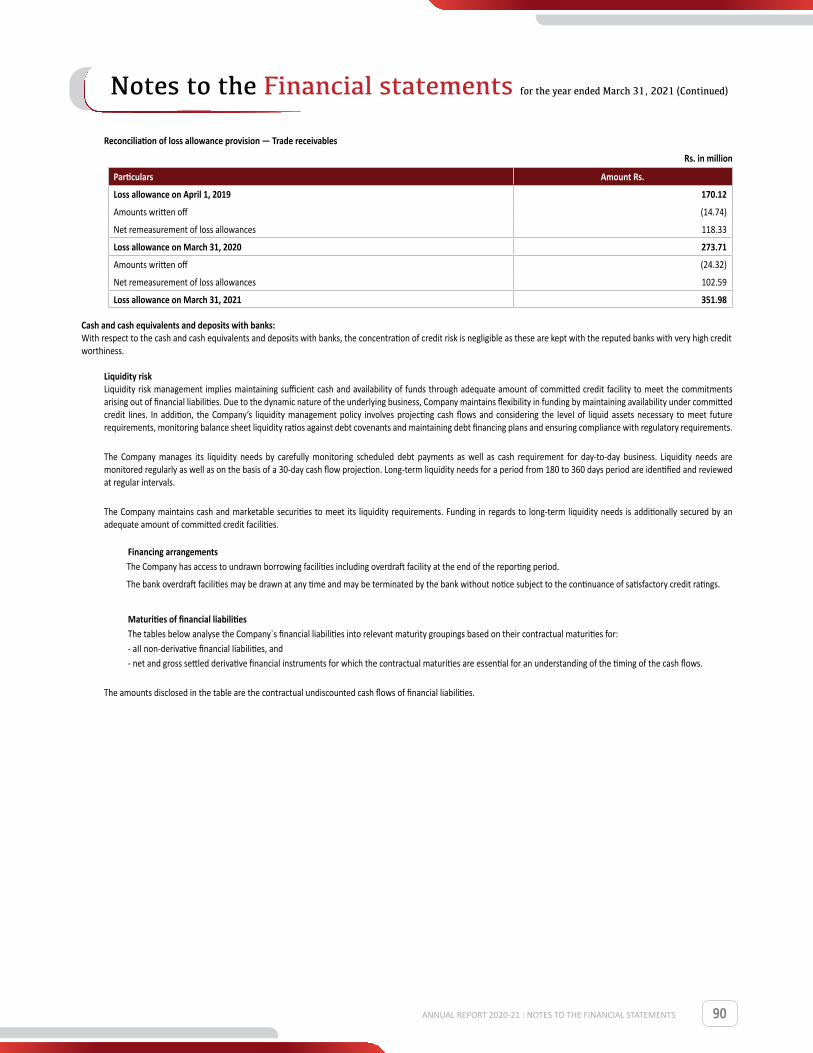
90
Reconciliation of loss allowance provision — Trade receivables
Rs. in million
Particulars Amount Rs.
Loss allowance on April 1, 2019 170.12
Amounts written off (14.74)
Net remeasurement of loss allowances 118.33
Loss allowance on March 31, 2020 273.71
Amounts written off (24.32)
Net remeasurement of loss allowances 102.59
Loss allowance on March 31, 2021 351.98
Cash and cash equivalents and deposits with banks: With respect to the cash and cash equivalents and deposits with banks, the concentration of credit risk is negligible as these are kept with the reputed banks with very high credit worthiness.
Liquidity risk Liquidity risk management implies maintaining sufficient cash and availability of funds through adequate amount of committed credit facility to meet the commitments arising out of financial liabilities. Due to the dynamic nature of the underlying business, Company maintains flexibility in funding by maintaining availability under committed credit Iines. In addition, the Company’s liquidity management policy involves projecting cash flows and considering the IeveI of liquid assets necessary to meet future requirements, monitoring balance sheet liquidity ratios against debt covenants and maintaining debt financing plans and ensuring compliance with regulatory requirements.
The Company manages its liquidity needs by carefully monitoring scheduled debt payments as well as cash requirement for day-to-day business. Liquidity needs are monitored regularly as well as on the basis of a 30-day cash flow projection. Long-term liquidity needs for a period from 180 to 360 days period are identified and reviewed at regular intervals.
The Company maintains cash and marketable securities to meet its liquidity requirements. Funding in regards to long-term liquidity needs is additionally secured by an adequate amount of committed credit facilities.
Financing arrangements The Company has access to undrawn borrowing facilities including overdraft facility at the end of the reporting period.
The bank overdraft facilities may be drawn at any time and may be terminated by the bank without notice subject to the continuance of satisfactory credit ratings.
Maturities of financial liabilities The tables below analyse the Company`s financial liabilities into relevant maturity groupings based on their contractual maturities for: - aII non-derivative financial IiabiIities, and - net and gross settled derivative financial instruments for which the contractual maturities are essential for an understanding of the timing of the cash flows.
The amounts disclosed in the table are the contractual undiscounted cash flows of financial liabilities.
ANNUAL REPORT 2020-21 : NOTES TO THE FINANCIAL STATEMENTS
Notes to the Financial statements for the year ended March 31, 2021 (Continued)
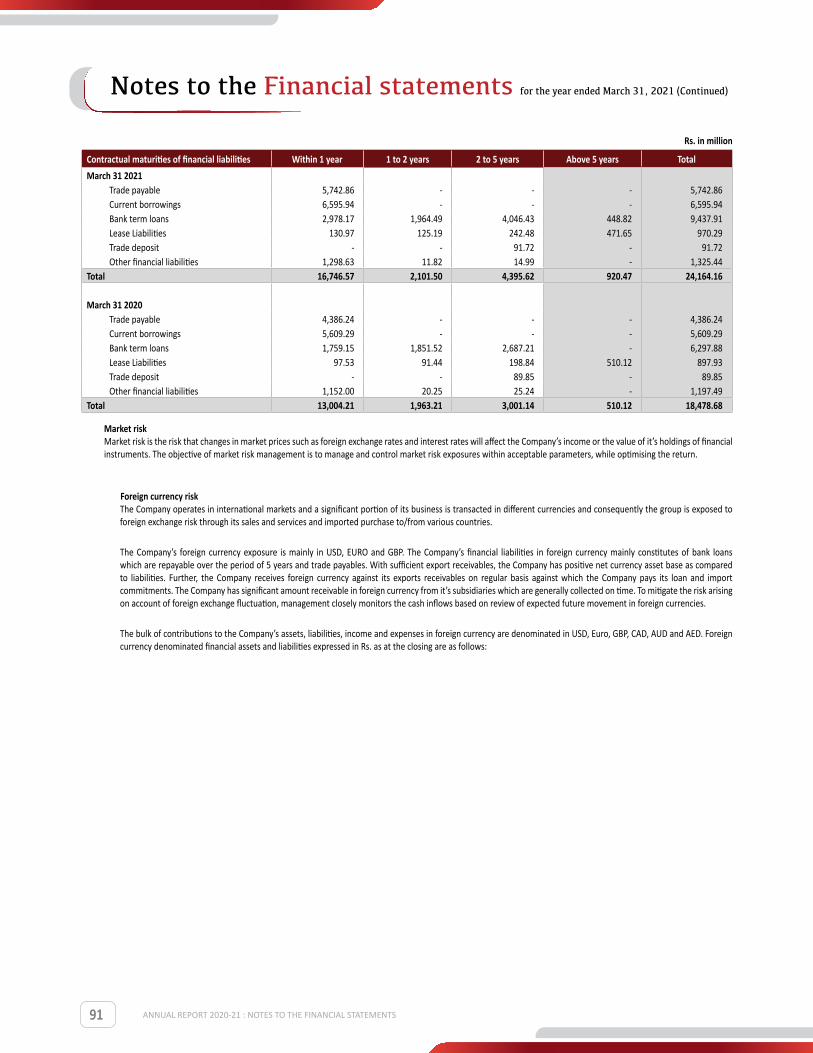
91
Rs. in million
Contractual maturities of financial liabilities Within 1 year 1 to 2 years 2 to 5 years Above 5 years TotalMarch 31 2021
Trade payable 5,742.86 - - - 5,742.86 Current borrowings 6,595.94 - - - 6,595.94 Bank term loans 2,978.17 1,964.49 4,046.43 448.82 9,437.91 Lease Liabilities 130.97 125.19 242.48 471.65 970.29 Trade deposit - - 91.72 - 91.72 Other financial liabilities 1,298.63 11.82 14.99 - 1,325.44
Total 16,746.57 2,101.50 4,395.62 920.47 24,164.16
March 31 2020Trade payable 4,386.24 - - - 4,386.24 Current borrowings 5,609.29 - - - 5,609.29 Bank term loans 1,759.15 1,851.52 2,687.21 - 6,297.88 Lease Liabilities 97.53 91.44 198.84 510.12 897.93 Trade deposit - - 89.85 - 89.85 Other financial liabilities 1,152.00 20.25 25.24 - 1,197.49
Total 13,004.21 1,963.21 3,001.14 510.12 18,478.68
Market risk Market risk is the risk that changes in market prices such as foreign exchange rates and interest rates will affect the Company’s income or the value of it’s holdings of financial instruments. The objective of market risk management is to manage and control market risk exposures within acceptable parameters, while optimising the return. Foreign currency risk The Company operates in international markets and a significant portion of its business is transacted in different currencies and consequently the group is exposed to
foreign exchange risk through its sales and services and imported purchase to/from various countries.
The Company’s foreign currency exposure is mainly in USD, EURO and GBP. The Company’s financial liabilities in foreign currency mainly constitutes of bank loans which are repayable over the period of 5 years and trade payables. With sufficient export receivables, the Company has positive net currency asset base as compared to liabilities. Further, the Company receives foreign currency against its exports receivables on regular basis against which the Company pays its loan and import commitments. The Company has significant amount receivable in foreign currency from it’s subsidiaries which are generally collected on time. To mitigate the risk arising on account of foreign exchange fluctuation, management closely monitors the cash inflows based on review of expected future movement in foreign currencies.
The bulk of contributions to the Company’s assets, liabilities, income and expenses in foreign currency are denominated in USD, Euro, GBP, CAD, AUD and AED. Foreign currency denominated financial assets and liabilities expressed in Rs. as at the closing are as follows:
ANNUAL REPORT 2020-21 : NOTES TO THE FINANCIAL STATEMENTS
Notes to the Financial statements for the year ended March 31, 2021 (Continued)

92
Foreign currency risk exposure:
Rs. in million
Particulars Currency Rs. in million Foreign CurrencyMarch 31, 2021 March 31, 2020 March 31, 2021 March 31, 2020
Financial assetsReceivables (including other receivables) Euro 357.29 2,836.37 4.17 34.06
USD 6,478.94 5,912.15 88.60 78.14 GBP 304.26 658.24 3.02 7.01 AED 11.98 8.01 0.60 0.39 AUD 20.32 28.82 0.37 0.62 CAD 1,428.75 776.12 24.39 14.50
Loans to subsidiaries USD 2,832.23 436.27 38.74 5.77 AED 111.90 214.84 5.63 10.50 GBP 604.77 - 6.00 -
Interest receivable on loans to subsidiaries USD 161.83 123.75 2.21 1.64 AED 15.05 109.04 0.76 5.33 GBP 18.97 - 0.19 - AUD - 0.17 - -
Cash and cash equivalents USD 160.27 138.11 2.19 1.83 EURO 0.08 0.06 - -
Others* 0.06 0.05 0.13 0.06 Total 12,506.70 11,242.00 Financial liabilities
Payables (including other payables) Euro 33.98 81.44 0.40 0.98 USD 918.28 781.83 12.56 10.33 GBP 6.64 5.85 0.07 0.06 AUD 12.31 9.49 0.22 0.20 CAD 13.95 0.34 0.24 0.01 JPY - 0.79 - 1.13
NZD 1.00 0.55 0.02 0.01
Interest Payable on loan USD 55.69 2.29 0.77 0.03 GBP - 1.41 - 0.02
Loans payable USD 4,838.48 1,285.55 66.18 16.99 GBP - 563.64 - 6.00
Total 5,880.33 2,733.18
* Foreign currency of insignificant amount
ANNUAL REPORT 2020-21 : NOTES TO THE FINANCIAL STATEMENTS
Notes to the Financial statements for the year ended March 31, 2021 (Continued)
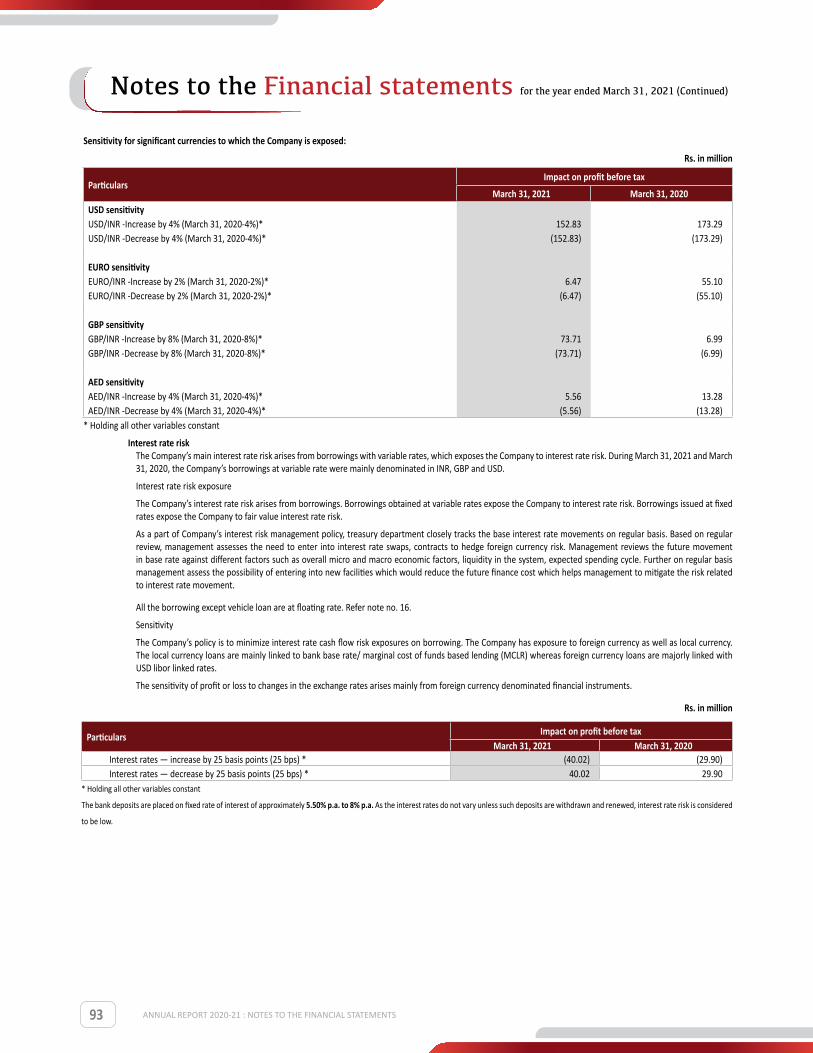
93
Sensitivity for significant currencies to which the Company is exposed:
Rs. in million
ParticularsImpact on profit before tax
March 31, 2021 March 31, 2020USD sensitivityUSD/INR -Increase by 4% (March 31, 2020-4%)* 152.83 173.29 USD/INR -Decrease by 4% (March 31, 2020-4%)* (152.83) (173.29)
EURO sensitivityEURO/INR -Increase by 2% (March 31, 2020-2%)* 6.47 55.10 EURO/INR -Decrease by 2% (March 31, 2020-2%)* (6.47) (55.10)
GBP sensitivityGBP/INR -Increase by 8% (March 31, 2020-8%)* 73.71 6.99 GBP/INR -Decrease by 8% (March 31, 2020-8%)* (73.71) (6.99)
AED sensitivityAED/INR -Increase by 4% (March 31, 2020-4%)* 5.56 13.28 AED/INR -Decrease by 4% (March 31, 2020-4%)* (5.56) (13.28)
* Holding all other variables constant
Interest rate risk The Company’s main interest rate risk arises from borrowings with variable rates, which exposes the Company to interest rate risk. During March 31, 2021 and March
31, 2020, the Company’s borrowings at variable rate were mainly denominated in INR, GBP and USD.
Interest rate risk exposure
The Company’s interest rate risk arises from borrowings. Borrowings obtained at variable rates expose the Company to interest rate risk. Borrowings issued at fixed rates expose the Company to fair value interest rate risk.
As a part of Company’s interest risk management policy, treasury department closely tracks the base interest rate movements on regular basis. Based on regular review, management assesses the need to enter into interest rate swaps, contracts to hedge foreign currency risk. Management reviews the future movement in base rate against different factors such as overall micro and macro economic factors, liquidity in the system, expected spending cycle. Further on regular basis management assess the possibility of entering into new facilities which would reduce the future finance cost which helps management to mitigate the risk related to interest rate movement.
All the borrowing except vehicle loan are at floating rate. Refer note no. 16.
Sensitivity
The Company’s policy is to minimize interest rate cash flow risk exposures on borrowing. The Company has exposure to foreign currency as well as local currency. The local currency loans are mainly linked to bank base rate/ marginal cost of funds based lending (MCLR) whereas foreign currency loans are majorly linked with USD libor linked rates.
The sensitivity of profit or loss to changes in the exchange rates arises mainly from foreign currency denominated financial instruments.
Rs. in million
Particulars Impact on profit before taxMarch 31, 2021 March 31, 2020
Interest rates — increase by 25 basis points (25 bps) * (40.02) (29.90)Interest rates — decrease by 25 basis points (25 bps) * 40.02 29.90
* Holding all other variables constant
The bank deposits are placed on fixed rate of interest of approximately 5.50% p.a. to 8% p.a. As the interest rates do not vary unless such deposits are withdrawn and renewed, interest rate risk is considered
to be low.
ANNUAL REPORT 2020-21 : NOTES TO THE FINANCIAL STATEMENTS
Notes to the Financial statements for the year ended March 31, 2021 (Continued)

94
Note 39 : Fair value measurements
The following table shows the carrying amounts and fair values of financial assets and financial liabilities, including their level in the fair value hierarchy.
March 31, 2021Rs. in million
Particulars Carrying amounts valued atFVTPL Amortised Cost Cost Total
Financial assets not measured at fair value*Investments in Subsidiaries / others - - 8,637.31 8,637.31 Loans to related parties - 2,659.70 - 2,659.70 Security deposits - 120.82 - 120.82 Trade receivables - 9,994.25 - 9,994.25 Interest accrued on loans to related parties - 121.85 - 121.85 Cash and cash equivalents - 2,455.58 - 2,455.58 Term deposits with banks - 173.41 - 173.41 Other financial assets - 2,080.49 - 2,080.49
Total Financial assets - 17,606.10 8,637.31 26,243.41 Financial liabilities not measured at fair value*Long term borrowings (including current maturities) - 9,437.91 - 9,437.91 Short term borrowings - 6,595.94 - 6,595.94 Trade deposits - 91.72 - 91.72 Financial guarantee liabilities - 32.07 - 32.07 Other deposits - 14.99 - 14.99 Lease Liabilities - 611.33 - 611.33 Trade payables - 5,742.86 - 5,742.86 Creditors for capital assets - 198.88 - 198.88 Other Financial liability - 1,079.50 - 1,079.50 Total financial liabilities - 23,805.20 - 23,805.20
* The Company has not disclosed the fair value for financial instruments such as trade receivables, cash and cash equivalents, term deposits with banks, other financial assets
and financial liabilities because their carrying amounts are a reasonable approximation of fair value, due to their short-term nature.
ANNUAL REPORT 2020-21 : NOTES TO THE FINANCIAL STATEMENTS
Notes to the Financial statements for the year ended March 31, 2021 (Continued)
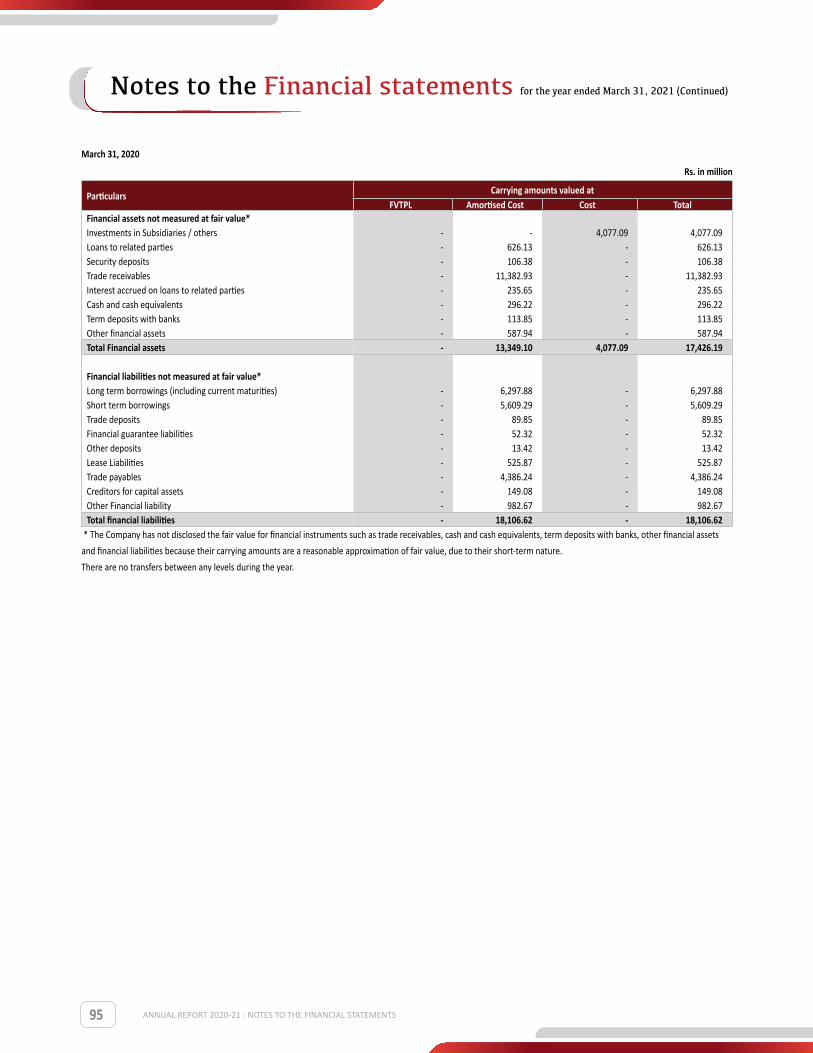
95
March 31, 2020
Rs. in million
Particulars Carrying amounts valued atFVTPL Amortised Cost Cost Total
Financial assets not measured at fair value*Investments in Subsidiaries / others - - 4,077.09 4,077.09 Loans to related parties - 626.13 - 626.13 Security deposits - 106.38 - 106.38 Trade receivables - 11,382.93 - 11,382.93 Interest accrued on loans to related parties - 235.65 - 235.65 Cash and cash equivalents - 296.22 - 296.22 Term deposits with banks - 113.85 - 113.85 Other financial assets - 587.94 - 587.94 Total Financial assets - 13,349.10 4,077.09 17,426.19
Financial liabilities not measured at fair value*Long term borrowings (including current maturities) - 6,297.88 - 6,297.88 Short term borrowings - 5,609.29 - 5,609.29 Trade deposits - 89.85 - 89.85 Financial guarantee liabilities - 52.32 - 52.32 Other deposits - 13.42 - 13.42 Lease Liabilities - 525.87 - 525.87 Trade payables - 4,386.24 - 4,386.24 Creditors for capital assets - 149.08 - 149.08 Other Financial liability - 982.67 - 982.67 Total financial liabilities - 18,106.62 - 18,106.62
* The Company has not disclosed the fair value for financial instruments such as trade receivables, cash and cash equivalents, term deposits with banks, other financial assets
and financial liabilities because their carrying amounts are a reasonable approximation of fair value, due to their short-term nature.
There are no transfers between any levels during the year.
ANNUAL REPORT 2020-21 : NOTES TO THE FINANCIAL STATEMENTS
Notes to the Financial statements for the year ended March 31, 2021 (Continued)

96
Note 40 : Contingent liabilities (to the extent not provided for)
A. Claims against the Company not acknowledged as debts as at year end
Rs in Million
Sr. No. Particulars March 31, 2021 March 31, 2020a) Sales tax 29.57 16.98 b) Excise and Service Tax matters 21.06 0.40 c) Other matters - 36.62
Total 50.63 54.00
Notes:
1) Pending resolution of the respective proceedings, it is not practicable for the Company to estimate the timing of cash outflows, if any, in respect of the above as it is determinable only on receipt of judgment/decisions pending with various forums/authorities.
2) The Company is also contesting other civil claims against the Company not acknowledged as debts and the management believes that its position will likely be upheld in the appellate process.
3) There are numerous interpretative issues relating to the Supreme Court (SC) judgment dated 28th February, 2019, relating to components/allowances paid that need to be taken into account while computing an employer’s contribution of provident fund under the Employees’ Provident Funds and Miscellaneous Provident Act, 1952. The Company has also obtained a legal opinion on the matter and basis the same there is no material impact on the financial statements as at 31 March 2021. The Company would record any further effect on its financial statements, on receiving additional clarity on the subject.
4) Further, the Company has reviewed all its pending litigations and proceedings and has adequately provided for where provisions are required and disclosed as contingent liabilities where applicable, in the financial statements. The management believes that the ultimate outcome of above proceeding will not have a material adverse effect on the Company’s financial position and results of operations.
5) A Search and Seizure Operation (‘the Operation’) was conducted by the Income Tax Department during the month of December 2020 under section 132 of the Income-tax Act, 1961. The Company has till date not received any intimation or notice to file returns or any demand for taxes further to the Search and Seizure. Based on the enquiries made by the Income tax department and the Company’s submissions thereto, Management is of the view that the matters involved are normal tax matters in respect of certain tax deductions and allowances, and accordingly the Operation will not have any significant impact on the Company’s financial position and performance as at and for the year ended 31 March 2021.
B. Other legal matters
a. Eli Lilly Co. v. Emcure Pharmaceuticals USA, Inc. and Emcure Pharmaceuticals Ltd., et al. (Pemetrexed Injection)
In August 2015, Eli Lilly Company filed suit against the Company and its subsidiary Heritage Pharma Labs Inc. (erstwhile Emcure Pharmaceuticals USA, Inc.)(collectively “Emcure”) alleging infringement of United States Patent No. 7,772,209 (the “‘209 patent”) in connection with its pemetrexed for injection, 500 mg/vial, product sold under the trade name ALIMTA®. In July 2016, the litigation was dismissed in favor of a consolidated inter parties review (“IPR”) filed by Sandoz with multiple generics as co-defendants before the United States Patent and Trademark Office (“US PTO”). In October 2017, the US PTO issued a ruling on the ‘209 patent that was unfavorable to the generics. Sandoz filed an appeal of the US PTO’s ruling in the IPR to the Federal Circuit.
Because Emcure declined to participate in Sandoz’s appeal of the US PTO’s ruling, in February 2018, the parties agreed to enter into an administrative closure of the litigation against Emcure in exchange for Emcure’s agreement to be bound by a Stipulated Preliminary Injunction entered against Sandoz pending the appeal to the Federal Circuit that will prevent the launch of a generic pemetrexed for injection product prior to the expiration of the ‘209 patent.
On June 4, 2019, the Federal Circuit issued a ruling on the IPR appeal that was unfavorable to the generics. The Company now expects the branded product to be protected from competition from ANDA filers until May 2022, the day after the pediatric exclusivity associated with the ‘209 patent expires. This case is settled now as the Company will not launch the product in United States before May 2022 (i.e. the expiry of ‘209 patent).
b. Celgene Corporation v. Emcure Pharmaceuticals Ltd. and Heritage Pharmaceuticals Inc. (Apremilast Tablet)
In June 2018, November 2018 and April 2019, Celgene Corporation (“Celgene”) filed suit against the Company and its subsidiary Heritage Pharmaceuticals Inc. (“Heritage”) alleging infringement of four U.S. patents: 7,427,638, 7,893,101, 9,872,854, and 10,092,541. Celgene based its infringement allegations on Emcure’s filing of an ANDA seeking approval by the FDA to sell a generic version of an apremilast product sold under the trade name OTEZLA® prior to the expiration of each of these four asserted patents. In August 2019, Amgen Inc. (Amgen) announced the purchase of OTEZLA® from Celgene and Amgen continued litigating this case against the Company and Heritage as a substituted plaintiff.
In May 2020, the case was settled and the litigation was dismissed in its entirely with no liability established against the Company. Under the confidential terms of the settlement, the Company received a license from Amgen to begin selling its generic apremilast product on a date prior to the expiration of the asserted patents.
ANNUAL REPORT 2020-21 : NOTES TO THE FINANCIAL STATEMENTS
Notes to the Financial statements for the year ended March 31, 2021 (Continued)

97
c. Novartis Pharmaceutical Corp v. Emcure Pharmaceuticals Ltd. & Heritage Pharmaceuticals Inc. (Fingolimod Tablet)
In July 2018, Novartis Pharmaceuticals Corporation (“Novartis”) filed two separate suits against a number of defendants including the Company and its subsidiary Heritage Pharmaceuticals Inc. (together “Emcure”) alleging infringement of two U.S. patents: 9,187,405 and 10,543,179. Novartis based its infringement allegations on Emcure’s filing of an ANDA seeking approval by the FDA to sell a generic version of a tableted fingolimod product and sold under the trade name GILENYA® prior to the expiration of these two asserted patents.
In May 2020, the case was settled and the litigation was dismissed in its entirely with no liability established against the Company. Under the confidential terms of the settlement, the Company received a license from Novartis to begin selling its generic fingolimod product on a date prior to the expiration of the asserted patents.
d. AstraZeneca Vs Emcure CS (COMM)-407/2020 (Dapagliflozin Tablet)
On Sep 29, 2020, Emcure received an e-mail communication from AstraZeneca’s lawyer informing about the filing of a patent infringement suit for asserting two patents related to Dapagliflozin. The asserted patents were IN205147 and IN235625. However, during the injunction trial, Emcure informed the Court that “Emcure will not be manufacturing and/or launching its product as it has lost commercial interest in Dapagliflozin”. The matter is under appeal and is pending before Delhi High Court to decide the validity and/or infringement of the aforesaid patents.
C. Drug Pricing Matters
Department of Justice On December 2, 2015, the Company’s subsidiary Heritage Pharmaceuticals Inc (Heritage) learned that the United States Department of Justice, Antitrust Division (“DOJ”) initiated an investigation into Heritage and its employees regarding alleged violations of U.S. antitrust laws, which prohibit contracting or conspiring to restrain trade or commerce. In support of that investigation, the DOJ executed relevant search warrants at the Heritage’s premises and at the residence of one of the Heritage’s national accounts managers. In addition, the DOJ served grand jury subpoenas on the Heritage, and several current and former employees, which sought a variety of materials and data relevant to the Heritage’s generic drug business. The Heritage is fully cooperated with the DOJ and responded to its subpoenas.
On May 7, 2018, Heritage received a civil investigative demand from the United States Department of Justice, Civil Division (“DOJ Civil”) seeking documents and information in connection with a simultaneous investigation under the False Claims Act.
On May 31, 2019, Heritage announced that it entered into a deferred prosecution agreement (“DPA”) with the DOJ relating to a one-count Information for a conspiracy involving glyburide. In conjunction with the DPA, Heritage agreed to pay a USD 225,000 fine. In addition, Heritage also announced that it separately agreed to a settlement with DOJ Civil to resolve potential civil liability under the False Claims Act in connection with the same antitrust conduct. Under the terms of the settlement with DOJ Civil, Heritage agreed to pay USD 7.1 million. These resolutions fully resolve Heritage’s potential exposure in connection with the DOJ’s ongoing investigation into the generics pharmaceutical industry.
In addition to the above, on May 31, 2019, the Company also entered into a cooperation and non-prosecution agreement (“NPA”) with DOJ under which the Company, and its current officers, directors, and employees received non-prosecution protection in exchange for its agreement to provide cooperation into the DOJ’s investigation. This resolution fully resolves the Company and its current officers, directors, and employees from potential exposure in connection with the DOJ’s ongoing investigation into the generics pharmaceutical industry.
D. Attorneys General Litigation
On December 21, 2015, the Company’s subsidiary Heritage Pharmaceuticals Inc (“Heritage”) received a subpoena and interrogatories from the Connecticut Office of the Attorney General seeking information relating to the marketing, pricing and sale of certain of Heritage’s generic products (including generic doxycycline) and communications with competitors about such products. On December 14, 2016, attorneys general of twenty states filed a complaint in the United States District Court for the District of Connecticut against several generic pharmaceutical drug manufacturers and individuals, including Heritage, alleging anticompetitive conduct with respect to, among other things, doxycycline hyclate DR. On June 18, 2018, attorneys general of forty-five states, the District of Columbia and the Commonwealth of Puerto Rico filed an amended consolidated complaint against various drug manufacturers, including Heritage, Emcure and Emcure’s Chief Executive Officer, Satish Mehta based on the same alleged conduct. The consolidated complaint (the “State AG Complaint”) was subsequently amended to add certain attorneys general alleging violations of federal and state antitrust laws, as well as violations of various states’ consumer protection laws.
The consolidated State AG Complaint alleges that Heritage engaged in anticompetitive conduct with respect to fifteen different drugs: acetazolamide; doxycycline monohydrate, doxycycline hyclate DR, fosinopril HCTZ, glipizide metformin, glyburide, glyburide metformin, leflunomide, meprobamate, nimodipine, nystatin, paromomycin, theophylline, verapamil, and zoledronic acid. The consolidated State AG Complaint also includes claims asserted by attorneys general of thirty-seven states and the Commonwealth of Puerto Rico against Heritage, Emcure, and certain individuals, including Emcure’s Chief Executive Officer, Satish Mehta, with respect to doxycycline hyclate DR. The allegations in the State AG Complaint are similar to those in the previously filed civil complaints (discussed below).
The consolidated State AG Complaint was transferred and consolidated into the ongoing multidistrict litigation captioned In re Generic Pharmaceuticals Pricing Antitrust Litigation, Case No. 16 MD 2724, which is currently pending in the United States District Court, Eastern District of Pennsylvania (the “Antitrust MDL”).
The parties are engaged in initial factual discovery in the Antitrust MDL, and therefore, at this stage in the proceedings, it is not possible to estimate the likelihood or extent of the liability, if any.
ANNUAL REPORT 2020-21 : NOTES TO THE FINANCIAL STATEMENTS
Notes to the Financial statements for the year ended March 31, 2021 (Continued)

98
E. Civil Litigation:
Beginning in 2016, Heritage, along with other manufacturers, has been named as a defendant in lawsuits generally alleging anticompetitive conduct with respect to generic drugs. The lawsuits have been filed by putative classes of direct and indirect purchasers, indirect resellers, as well as individual direct and indirect purchasers. They allege harm under federal and state antitrust laws, state consumer protection laws and unjust enrichment claims. Some of the lawsuits also name Heritage and company’s Chief Executive Officer, Satish Mehta, as defendants and include allegations against them with respect to doxycycline hyclate DR. The lawsuits have been consolidated in the Antitrust MDL (referenced above).
A number of other lawsuits have been separately filed against Heritage, and various other manufacturers, by individual plaintiffs who have elected to opt-out of the putative classes. These complaints also generally allege anticompetitive conduct with respect to generic drugs which allegedly caused harm under federal and state antitrust laws, state consumer protection laws and unjust enrichment claims. These lawsuits have also been consolidated in the pending Antitrust MDL.
The parties are engaged in initial factual discovery in the Antitrust MDL, and therefore, at this stage in the proceedings, it is not possible to estimate the likelihood or extent potential liability, if any.
F. Other Litigation Matters Filed Against Heritage
Ranitidine Litigation In June 2020, the Company’s subsidiary Heritage Pharmaceuticals Inc (Heritage) received notice that three Master Consolidated Complaints – the Master Personal Injury
Complaint (“MPIC”), the Consolidated Consumer Class Action Complaint (“CCCAC”), and the Consolidated Third Party Payor Class Complaint (“CTPPCC”) – and five individually-filed purported class actions have been filed against a number of defendants, including Heritage, Heritage Labs, and Emcure, alleging personal injuries in connection with alleged elevated levels of NDMA contained in a ranitidine product that may have been manufactured by a third-party manufacturer and allegedly sold by Heritage. Each case has been consolidated into the ongoing multidistrict litigation captioned In re: Zantac (Ranitidine) Products Liability Litigation, MDL No. 2924, Case No. 20 MD 294, in the United States District Court, Southern District of Florida. Heritage Labs and Emcure have been dismissed by the Court from this litigation without prejudice, leaving Heritage as the single remaining defendant.
In late 2020, the generic manufacturer defendants (including Heritage) filed several motions to dismiss each Master Consolidated Complaint on a number of legal theories, including federal preemption and on the basis that the Complaints were improperly pled as shotgun pleadings. In January 2021, the District Court issued a number of decisions that were favorable to the generic manufacturer defendants (including Heritage), including a dismissal with prejudice of all claims against the generic manufacturer defendants under each of the three Master Consolidated Complaints as preempted under federal law. In February 2021, Plaintiffs appealed the District Court’s decision to the Circuit Court and that appeal remains pending.
In addition, the District Court further found that the MPIC, CCCAC, and CTPPCC were each improperly pled as shotgun pleadings, and each Master Consolidated Complaint was dismissed without prejudice. In February 2021, Plaintiffs appealed the decision to dismiss the MPIC as an improperly pled shotgun pleading and that appeal remains pending before the Circuit Court. Also in February 2021, Plaintiffs filed an amended CCCAC, and an amended CTPPCC, however, Heritage is no longer a named defendant in either of those complaints.
Heritage denies any liability and fully intends to defend these claims. In addition, Heritage asserted a claim for indemnification, and tendered its defense, in each of the ranitidine lawsuits to the third-party manufacturer. The third-party manufacturer accepted the indemnity and defense tender under a reservation of rights, and in March 2021, the third-party manufacturer assigned legal counsel to defend Heritage against these claims. At this stage in the proceedings, it is not possible to estimate the likelihood or extent of potential liability, if any.
G. General
From time to time, the Company is subject to various disputes, governmental and/or regulatory inquiries or investigations, and litigations, some of which result in losses, damages, fines and charges against the Company. While the Company intends to vigorously defend its position in the claims asserted against it, the ultimate resolution of a matter is often complex, time consuming, and difficult to predict. Therefore, except as described below, the Company does not currently have a reasonable basis to estimate the loss, or range of loss, that is reasonably possible with respect to matters disclosed in this note.
The Company records a provision in its financial statements to the extent that it concludes that a contingent liability is probable and the amount is estimable and has noted those contingencies below. The Company’s assessments involve complex judgments about future events and often rely heavily on estimates and assumptions. The Company also incurs significant legal fees and related expenses in the course of defending its positions even if the facts and circumstances of a particular litigation do not give rise to a provision in the financial statements.
ANNUAL REPORT 2020-21 : NOTES TO THE FINANCIAL STATEMENTS
Notes to the Financial statements for the year ended March 31, 2021 (Continued)

99
Note 41 : Capital and other commitments (to the extent not provided for)A) Capital commitment
Estimated amount of contracts remaining to be executed on capital account and not provided for (net of advances) Rs. 404.56 million (March 31, 2020: Rs. Rs. 469.46 million).
B) Other commitments The Company has a 100 per cent Export Oriented Unit (EOU) set up under the permission granted by the Office of the Development Commissioner of SEEPZ Special Economic Zone of the Government of India. The authorities have, inter alia, laid down the following conditions, failing which the Company may be liable for penal action:
i. The entire (100%) production shall be exported against hard currency except the sales in domestic tariff area admissible as per entitlement.
ii. The Export Oriented Unit of the Company shall be a positive net foreign exchange earner over a period of six years from the date of commencement of production.
As at the year end, the Company is in compliance with the condition laid down by the authorities and does not expect any non-compliance in future.
C) Financial guarantees given
The Company has given corporate guarantees to the following:
Rs in Million
Particulars CurrencyMarch 31, 2021 March 31, 2020
FC. In million Rs. In million FC. In million Rs. In millionBankers for Gennova Biopharmaceuticals Ltd. In respect of loans INR - 140.00 - 198.94 Bankers for Heritage Pharma Holdings Inc. in respect of loans USD 75.00 5,482.87 100.44 7,599.10 Bankers for Marcan Pharmaceuticals Inc. in respect of loans CAD 30.05 1,749.51 38.74 2,073.42 Erstwhile Shareholders of Marcan Pharmaceuticals Inc. CAD 48.00 2,794.17 68.80 3,681.90 Bankers in respect of loan sanctioned to Emcure Pharma UK Ltd. GBP - - 6.00 563.84 Bankers for Emcure Pharmaceuticals Mena FZ LLC. in respect of loans AED 8.00 158.94 8.00 163.69 Bankers for Tillomed Laboratories Limited. in respect of loans GBP 6.60 665.24 - -
All the above financial guarantees have been accounted as per the provisions of Ind AS 109 - financial instruments.
ANNUAL REPORT 2020-21 : NOTES TO THE FINANCIAL STATEMENTS
Notes to the Financial statements for the year ended March 31, 2021 (Continued)

100
Note 42 : Earnings per share Rs. in million
Particulars March 31, 2021 March 31, 2020Basic earnings per share
A. Profit after tax attributable to equity shareholders (Rs. million) 4,204.75 1,752.05 B. Weighted average number of equity shares for the year 18,08,52,116 18,08,52,116
Basic earnings per share (Rs.) (A/B) 23.25 9.69 Diluted earnings per share
C. Adjusted net profit for the year (Rs. million) (refer note below) 4,204.75 1,752.05 Weighted average number of equity shares for the year 18,08,52,116 18,08,52,116 Add: Effect of employee stock options* - -
D. Weighted average number of equity share (diluted) for the year 18,08,52,116 18,08,52,116 Diluted earning per share (Rs.) (C/D) 23.25 9.69 Face value per share (Rs.) 10.00 10.00
Note: Reconciliations of earnings used for calculating diluted earnings per shareRs. in million
Particulars March 31, 2021 March 31, 2020
Basic earnings per share
Profit attributable to the equity holders of the company used in calculating basic earnings per share: 4,204.75 1,752.05
Add: Employee share-based payment (net of tax)* - -
Profit attributable to the equity holders of the company used for calculating diluted earnings per share 4,204.75 1,752.05
* The effect of conversion of potential equity share for the year ended March 31, 2021 is excluded, since the impact on earnings per share is anti dilutive.
ANNUAL REPORT 2020-21 : NOTES TO THE FINANCIAL STATEMENTS
Notes to the Financial statements for the year ended March 31, 2021 (Continued)

101
Note 43 : Related party disclosure
Related parties with whom there were transactions during the year and nature of relationship
Subsidiaries: Zuventus Healthcare Limited Gennova Biopharmaceuticals Limited Emcure Brasil Farmaceutica Ltda. Emcure Nigeria Limited Emcure Pharmaceuticals Mena FZ-LLC. Emcure Pharmaceuticals South Africa (Pty) Ltd Heritage Pharma Holdings Inc. (doing business as Avet Pharmaceuticals Holdings Inc.) Emcure Pharma UK Ltd. Emcure Pharma Mexico S.A. DE C.V. Emcure Pharma Peru S.A.C. Marcan Pharmaceuticals Inc. Emcure Pharmaceuticals Pty Ltd. Avet Lifesciences Limited (From August 26, 2020) Emcure Pharma Chile SpA (From October 2, 2020) Lazor Pharmaceuticals Limited (From February 4, 2021) Step-down subsidiaries: Heritage Pharmaceuticals Inc. (doing business as Avet Pharmaceuticals Inc.) (Subsidiary of Heritage Pharma Holdings Inc.) Heritage Pharma Labs Inc. (doing business as Avet Pharmaceuticals Labs Inc.) (Subsidiary of Heritage Pharma Holdings Inc.) Tillomed Holdings Limited (Subsidiary of Emcure Pharma UK Ltd) (Dissolved w. e. f. April 16, 2019) Hacco Pharma Inc. (Subsidiary of Heritage Pharma Holdings Inc.)(From March 6, 2019) Tillomed Laboratories Limited (Subsidiary of Tillomed Holdings Limited) Tillomed Pharma GmbH, Germany (Subsidiary of Emcure Pharma UK Ltd.) Laboratorios Tillomed Spain S.L.U. (Subsidiary of Emcure Pharma UK Ltd.) Tillomed France SAS (Subsidiary of Emcure Pharma UK Ltd.) Tillomed Italia S.R.L, Italy (Subsidiary of Emcure Pharma UK Ltd.) Emcure NZ Limited (Subsidiary of Emcure Pharmaceuticals Pty Ltd.) Tillomed Laboratories BV (Subsidiary of Emcure Pharma UK Ltd.) (From April 24, 2019) Key Management Personnel: Whole Time Directors Mr. Satish Mehta (Managing Director) Dr. Mukund Gurjar (Executive Director) Mr. Sunil Mehta (Executive Director) Mrs. Namita Thapar (Executive Director) (Chief Finance Officer upto April 15, 2021) Key Management Personnel: Other than Whole Time DirectorsMr. S.K. Bapat (Independent Director) Mr. Humayun Dhanrajgir (Chairman and Independent Director upto April 15, 2021) Mr. Berjis Desai (Chairman and Independent Director) (Appointed as Chairman w.e.f. April 16, 2021) Mr. Samonnoi Banerjee (Nominee of BC Investment IV Ltd) (Director) Mr. P. S. Jayakumar (Independent Director w.e.f. July 22, 2020) Mr. Tajuddin Shaikh (Chief Finance Officer w.e.f. April 16, 2021) Dr. Vidya Rajiv Yeravdekar (Independent Director w.e.f. April 16, 2021) Dr. Shailesh Kripalu Ayyangar (Non Executive Director w.e.f. April 16, 2021) Mr. Vijay Keshav Gokhale (Independent Director w.e.f. April 16, 2021)
Key Management Personnel: Relatives Mr. Sanjay Mehta Mr. Vikas Thapar Mr. Samit Mehta Mr. Rutav Mehta Mrs. Bhavana Mehta Enterprise over which Key Management Personnel have control: H.M. Sales Corporation Uth Beverages Factory Pvt. Ltd.
ANNUAL REPORT 2020-21 : NOTES TO THE FINANCIAL STATEMENTS
Notes to the Financial statements for the year ended March 31, 2021 (Continued)

102
Rs. in million
Sr. No. Description of the nature of transaction / balance
Transaction value Balance outstanding as at
Year ended March 31,
2021
Year ended March 31,
2020
March 31, 2021 March 31, 2020 Receivable / Advance
from customer
Payable / Advance to
supplier
Receivable / Advance
from customer
Payable / Advance to
supplier
1) Purchase of goods & servicesZuventus Healthcare Limited 89.62 46.54 - 1.15 - - Gennova Biopharmaceuticals Limited 81.29 97.19 - 15.16 - 8.87
170.91 143.73 - 16.31 - 8.87
2) Sale of assetsZuventus Healthcare Limited 13.59 - - - - - Gennova Biopharmaceuticals Limited - 0.11 (152.14) - - - Uth Beverages Factory Pvt. Ltd. 0.11 - 0.13 - - -
13.70 0.11 (152.01) - - -
3) Purchase of assetsGennova Biopharmaceuticals Limited 0.04 0.01 - - - - Tillomed Laboratories Limited - - - - - 4.93
0.04 0.01 - - - 4.93
4) Sale /(Return) of goods and servicesZuventus Healthcare Limited 429.39 182.47 6.56 - 15.63 - Gennova Biopharmaceuticals Limited 230.62 242.62 2.85 - - - Heritage Pharma Labs Inc. 67.37 164.74 110.11 - 208.93 - Emcure Pharmaceuticals Mena FZ-LLC. 386.00 263.71 99.80 - 215.31 - Heritage Pharmaceuticals Inc. 776.90 2,162.66 1,629.68 - 2,890.50 - Emcure Pharmaceuticals South Africa (Pty) Ltd 1,052.47 208.15 818.16 - 100.97 - Emcure Pharma UK Ltd. (92.02) (29.58) 230.23 - 1,869.56 - Emcure Pharma Peru S.A.C. 3,320.68 25.76 1,708.27 - 111.13 - Tillomed Laboratories Limited 2,734.36 1,894.98 - - 1,329.35 - Tillomed Pharma GmbH - - - - 105.42 - Tillomed Italia S.R.L 14.53 - 14.65 - 16.59 - Marcan Pharmaceuticals Inc. 1,342.05 925.94 1,366.15 - 680.70 - H.M. Sales Corporation (5.07) 8.91 3.97 - 10.02 - Hacco Pharma Inc. 256.74 - 88.70 - - -
10,514.02 6,050.36 6,079.13 - 7,554.11 -
5) Advance received for goods and servicesTillomed Laboratories Limited - - (6.01) - - - Marcan Pharmaceuticals Inc. - - (27.96) - - -
- - (33.97) - - -
6) Purchase of shares of subsidiary Marcan Pharmaceuticals Inc. 651.57 - - - - - Heritage Pharma Holdings Inc. 1,486.31 375.42 - - - - Emcure Pharma UK Ltd. 2,022.72 598.37 - - - - Emcure Pharma Peru S.A.C. 41.05 - - - - - Avet Lifesciences Limited 0.10 - - - - - Emcure Pharma Chile SpA 3.66 - - - - - Emcure Pharmaceuticals South Africa (Pty) Ltd 178.76 - - - - - Emcure Pharmaceuticals Mena FZ-LLC. 321.11 - - - - -
4,705.28 973.79 - - - -
ANNUAL REPORT 2020-21 : NOTES TO THE FINANCIAL STATEMENTS
Notes to the Financial statements for the year ended March 31, 2021 (Continued)

103
Sr. No. Description of the nature of transaction / balance
Transaction value Balance outstanding as at
Year ended March 31,
2021
Year ended March 31,
2020
March 31, 2021 March 31, 2020 Receivable / Advance
from customer
Payable / Advance to
supplier
Receivable / Advance
from customer
Payable / Advance to
supplier
7) Equity contribution in the nature of employee stock options issued to em-ployees of subsidiary / (cancellation of employee stock options issued)Heritage Pharma Holdings Inc. (25.26) 25.27 - - - - Zuventus Healthcare Limited (2.45) - - - - - Gennova Biopharmaceuticals Limited 0.73 2.35 - - - - Marcan Pharmaceuticals Inc. 0.42 0.93 - - - - Heritage Pharma Labs Inc. (7.83) 1.44 - - - - Heritage Pharmaceuticals Inc. (117.68) 82.93 - - - - Tillomed Laboratories Limited 7.01 3.78 - - - -
(145.06) 116.70 - - - -
8) Loans and advances given / (repaid) # Emcure Nigeria Limited - - 33.81 - 57.93 - Emcure Pharmaceuticals South Africa (Pty) Ltd (133.90) - - - 131.44 - Emcure Pharmaceuticals Mena FZ-LLC. (96.75) - 119.85 - 214.84 - Emcure Brasil Farmaceutica Ltda. - - 81.15 - 104.76 - Emcure Pharmaceuticals Pty Ltd. - (10.99) - - - - Emcure Pharma Mexico S.A. DE C.V. - - 57.70 - 68.59 - Emcure Pharma Peru S.A.C. 60.06 3.17 105.42 - 48.57 - Heritage Pharma Holdings Inc. 2,509.05 - 2,485.74 - - - Emcure Pharma UK Ltd. 560.19 - 604.77 - - - Avet Lifesciences Limited 1.30 - 1.30 - - -
2,899.95 (7.82) 3,489.74 - 626.13 -
9) Interest income Emcure Nigeria Limited 3.81 3.74 32.02 - 28.89 - Emcure Pharmaceuticals South Africa (Pty) Ltd 3.11 8.11 28.56 - 42.12 - Emcure Pharmaceuticals Mena FZ-LLC. 18.93 19.56 15.05 - 109.15 - Emcure Brasil Farmaceutica Ltda. 8.00 7.86 43.09 - 36.58 - Emcure Pharmaceuticals Pty Ltd. - 0.59 - - 0.11 - Emcure Pharma Peru S.A.C. 6.35 4.05 13.19 - 7.44 - Emcure Pharma Mexico S.A. DE C.V. 6.82 6.72 16.04 - 11.36 - Emcure Pharma UK Ltd. 22.10 - 18.97 - - - Heritage Pharma Holdings Inc. 36.27 - 30.68 - - - Avet Lifesciences Limited 0.02 - 0.02 - - -
105.41 50.63 197.62 - 235.65 -
10) Net gain/(loss) on loans given to subsidiaries measured at amortised costEmcure Brasil Farmaceutica Ltda. (21.22) 5.19 - - - - Emcure Nigeria Limited (22.17) 1.99 - - - - Emcure Pharma Mexico S.A. DE C.V. (9.22) 8.49 - - - - Emcure Pharma Peru S.A.C. - 0.65 - - - - Emcure Pharmaceuticals Mena FZ-LLC. 7.85 (2.82) - - - - Emcure Pharmaceuticals South Africa (Pty) Ltd 6.63 4.76 - - - - Emcure Pharmaceuticals Pty Ltd. - 0.77 - - - -
(38.13) 19.03 - - - -
Rs. in million
ANNUAL REPORT 2020-21 : NOTES TO THE FINANCIAL STATEMENTS
Notes to the Financial statements for the year ended March 31, 2021 (Continued)
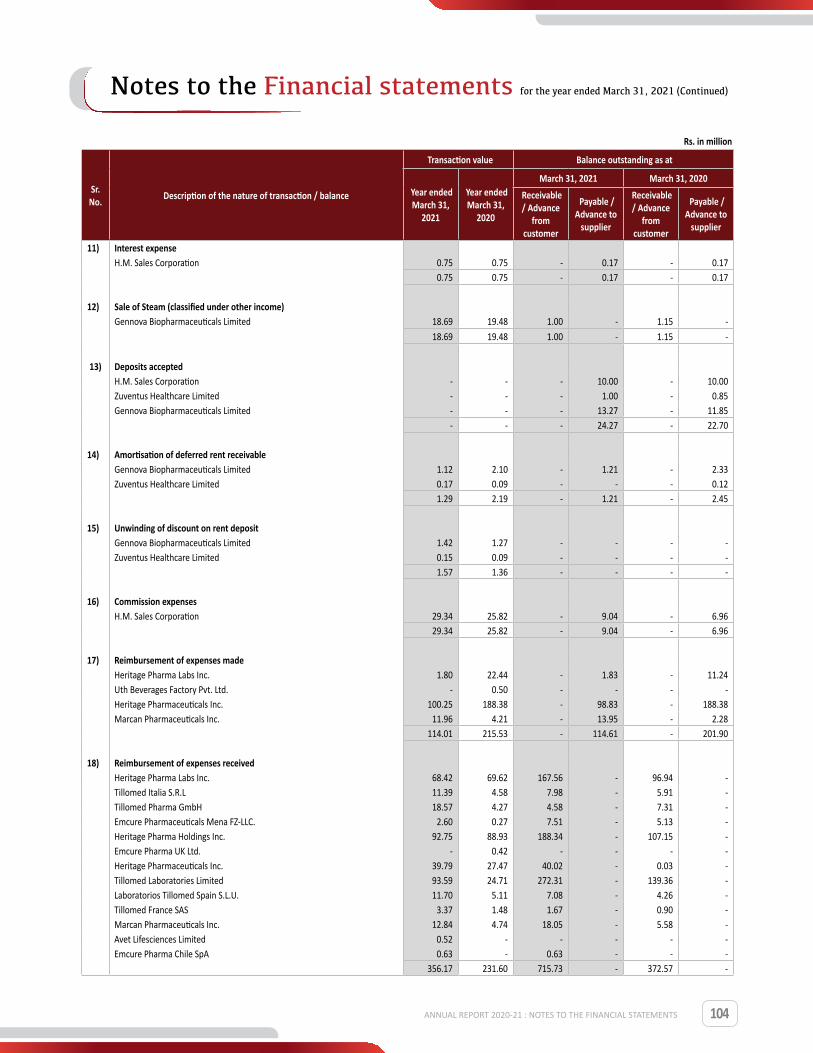
104
Sr. No. Description of the nature of transaction / balance
Transaction value Balance outstanding as at
Year ended March 31,
2021
Year ended March 31,
2020
March 31, 2021 March 31, 2020 Receivable / Advance
from customer
Payable / Advance to
supplier
Receivable / Advance
from customer
Payable / Advance to
supplier
11) Interest expenseH.M. Sales Corporation 0.75 0.75 - 0.17 - 0.17
0.75 0.75 - 0.17 - 0.17
12) Sale of Steam (classified under other income)Gennova Biopharmaceuticals Limited 18.69 19.48 1.00 - 1.15 -
18.69 19.48 1.00 - 1.15 -
13) Deposits accepted H.M. Sales Corporation - - - 10.00 - 10.00 Zuventus Healthcare Limited - - - 1.00 - 0.85 Gennova Biopharmaceuticals Limited - - - 13.27 - 11.85
- - - 24.27 - 22.70
14) Amortisation of deferred rent receivableGennova Biopharmaceuticals Limited 1.12 2.10 - 1.21 - 2.33 Zuventus Healthcare Limited 0.17 0.09 - - - 0.12
1.29 2.19 - 1.21 - 2.45
15) Unwinding of discount on rent depositGennova Biopharmaceuticals Limited 1.42 1.27 - - - - Zuventus Healthcare Limited 0.15 0.09 - - - -
1.57 1.36 - - - -
16) Commission expensesH.M. Sales Corporation 29.34 25.82 - 9.04 - 6.96
29.34 25.82 - 9.04 - 6.96
17) Reimbursement of expenses madeHeritage Pharma Labs Inc. 1.80 22.44 - 1.83 - 11.24 Uth Beverages Factory Pvt. Ltd. - 0.50 - - - - Heritage Pharmaceuticals Inc. 100.25 188.38 - 98.83 - 188.38 Marcan Pharmaceuticals Inc. 11.96 4.21 - 13.95 - 2.28
114.01 215.53 - 114.61 - 201.90
18) Reimbursement of expenses received Heritage Pharma Labs Inc. 68.42 69.62 167.56 - 96.94 - Tillomed Italia S.R.L 11.39 4.58 7.98 - 5.91 - Tillomed Pharma GmbH 18.57 4.27 4.58 - 7.31 - Emcure Pharmaceuticals Mena FZ-LLC. 2.60 0.27 7.51 - 5.13 - Heritage Pharma Holdings Inc. 92.75 88.93 188.34 - 107.15 - Emcure Pharma UK Ltd. - 0.42 - - - - Heritage Pharmaceuticals Inc. 39.79 27.47 40.02 - 0.03 - Tillomed Laboratories Limited 93.59 24.71 272.31 - 139.36 - Laboratorios Tillomed Spain S.L.U. 11.70 5.11 7.08 - 4.26 - Tillomed France SAS 3.37 1.48 1.67 - 0.90 - Marcan Pharmaceuticals Inc. 12.84 4.74 18.05 - 5.58 - Avet Lifesciences Limited 0.52 - - - - - Emcure Pharma Chile SpA 0.63 - 0.63 - - -
356.17 231.60 715.73 - 372.57 -
Rs. in million
ANNUAL REPORT 2020-21 : NOTES TO THE FINANCIAL STATEMENTS
Notes to the Financial statements for the year ended March 31, 2021 (Continued)

105
Sr. No. Description of the nature of transaction / balance
Transaction value Balance outstanding as at
Year ended March 31,
2021
Year ended March 31,
2020
March 31, 2021 March 31, 2020 Receivable / Advance
from customer
Payable / Advance to
supplier
Receivable / Advance
from customer
Payable / Advance to
supplier
19) Dividend received Zuventus Healthcare Limited 159.60 303.24 - - - -
159.60 303.24 - - - -
20) Rent incomeZuventus Healthcare Limited 9.35 8.99 - - - - Gennova Biopharmaceuticals Limited 33.26 32.41 - - - -
42.61 41.40 - - - -
21) Remuneration paid Key Management Personnel: Whole Time DirectorsMr. Satish Mehta 209.82 160.05 - 62.54 - 29.66 Dr. Mukund Gurjar 42.93 40.79 - 9.51 - 9.39 Mr. Sunil Mehta 22.85 21.01 - 2.81 - 6.93 Mrs. Namita Thapar 30.06 23.70 - 3.55 - 5.10
305.66 245.55 - 78.41 - 51.08
22) Remuneration paid Key Management Personnel: RelativesMr. Samit Mehta 29.03 22.04 - 3.58 - 5.43 Mr. Vikas Thapar 30.37 24.95 - 3.53 - 5.18 Mr. Rutav Mehta - 1.50 - - - 0.15 Mr. Sanjay Mehta 23.37 20.97 - 2.87 - 7.25
82.77 69.46 - 9.98 - 18.01
23) Post-employment obligationsKey Management Personnel: Whole Time DirectorsMr. Sunil Mehta 7.90 1.34 - - - 10.36 Mrs. Namita Thapar 4.11 1.25 - 10.07 - 5.96
12.01 2.59 - 10.07 - 16.32
24) Post-employment obligationsKey Management Personnel: RelativesMr. Samit Mehta 5.96 1.33 - 12.41 - 6.45 Mr. Vikas Thapar 3.60 0.80 - 10.01 - 6.41 Mr. Rutav Mehta - 0.05 - - - 0.15 Mr. Sanjay Mehta 6.49 1.58 - 16.08 - 9.59
16.05 3.76 - 38.50 - 22.60
25) Compensated absencesKey Management Personnel: Whole Time DirectorsMr. Satish Mehta 1.12 1.77 - 16.98 - 15.86 Dr. Mukund Gurjar 0.36 0.02 - 3.96 - 3.61 Mr. Sunil Mehta 1.18 0.08 - 2.64 - 1.46 Mrs. Namita Thapar 1.51 0.37 - 4.09 - 2.58
4.17 2.24 - 27.67 - 23.51
Rs. in million
ANNUAL REPORT 2020-21 : NOTES TO THE FINANCIAL STATEMENTS
Notes to the Financial statements for the year ended March 31, 2021 (Continued)
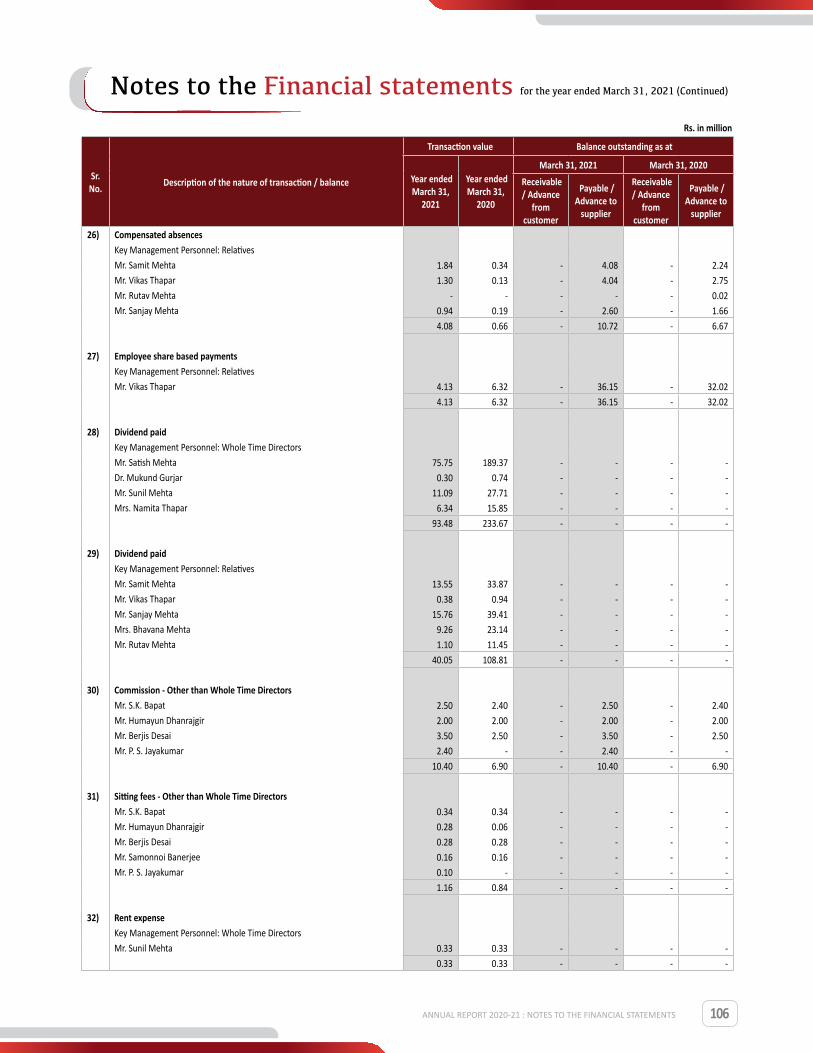
106
Sr. No. Description of the nature of transaction / balance
Transaction value Balance outstanding as at
Year ended March 31,
2021
Year ended March 31,
2020
March 31, 2021 March 31, 2020 Receivable / Advance
from customer
Payable / Advance to
supplier
Receivable / Advance
from customer
Payable / Advance to
supplier
26) Compensated absencesKey Management Personnel: RelativesMr. Samit Mehta 1.84 0.34 - 4.08 - 2.24 Mr. Vikas Thapar 1.30 0.13 - 4.04 - 2.75 Mr. Rutav Mehta - - - - - 0.02 Mr. Sanjay Mehta 0.94 0.19 - 2.60 - 1.66
4.08 0.66 - 10.72 - 6.67
27) Employee share based paymentsKey Management Personnel: RelativesMr. Vikas Thapar 4.13 6.32 - 36.15 - 32.02
4.13 6.32 - 36.15 - 32.02
28) Dividend paid Key Management Personnel: Whole Time DirectorsMr. Satish Mehta 75.75 189.37 - - - - Dr. Mukund Gurjar 0.30 0.74 - - - - Mr. Sunil Mehta 11.09 27.71 - - - - Mrs. Namita Thapar 6.34 15.85 - - - -
93.48 233.67 - - - -
29) Dividend paid Key Management Personnel: RelativesMr. Samit Mehta 13.55 33.87 - - - - Mr. Vikas Thapar 0.38 0.94 - - - - Mr. Sanjay Mehta 15.76 39.41 - - - - Mrs. Bhavana Mehta 9.26 23.14 - - - - Mr. Rutav Mehta 1.10 11.45 - - - -
40.05 108.81 - - - -
30) Commission - Other than Whole Time DirectorsMr. S.K. Bapat 2.50 2.40 - 2.50 - 2.40 Mr. Humayun Dhanrajgir 2.00 2.00 - 2.00 - 2.00 Mr. Berjis Desai 3.50 2.50 - 3.50 - 2.50 Mr. P. S. Jayakumar 2.40 - - 2.40 - -
10.40 6.90 - 10.40 - 6.90
31) Sitting fees - Other than Whole Time DirectorsMr. S.K. Bapat 0.34 0.34 - - - - Mr. Humayun Dhanrajgir 0.28 0.06 - - - - Mr. Berjis Desai 0.28 0.28 - - - - Mr. Samonnoi Banerjee 0.16 0.16 - - - - Mr. P. S. Jayakumar 0.10 - - - - -
1.16 0.84 - - - -
32) Rent expenseKey Management Personnel: Whole Time DirectorsMr. Sunil Mehta 0.33 0.33 - - - -
0.33 0.33 - - - -
Rs. in million
ANNUAL REPORT 2020-21 : NOTES TO THE FINANCIAL STATEMENTS
Notes to the Financial statements for the year ended March 31, 2021 (Continued)

107
Sr. No. Description of the nature of transaction / balance
Transaction value Balance outstanding as at
Year ended March 31,
2021
Year ended March 31,
2020
March 31, 2021 March 31, 2020 Receivable / Advance
from customer
Payable / Advance to
supplier
Receivable / Advance
from customer
Payable / Advance to
supplier
33) Rent expenseKey Management Personnel: RelativesMr. Sanjay Mehta 0.33 0.33 - - - - Mrs. Bhavana Mehta 0.24 0.24 - - - -
0.57 0.57 - - - -
34) Amortisation of financial guarantee liabilityMarcan Pharmaceuticals Inc. 20.25 20.31 - 32.07 - 52.25
20.25 20.31 - 32.07 - 52.25
35) Financial guarantee fees chargedGennova Biopharmaceuticals Limited 1.70 2.25 - - - - Heritage Pharma Holdings Inc. 69.07 75.05 201.35 - 132.28 - Emcure Pharma UK Ltd. 0.94 5.64 7.06 - 5.64 - Marcan Pharmaceuticals Inc. 4.48 3.57 9.12 - 4.08 - Emcure Pharmaceuticals Mena FZ-LLC. 1.58 1.64 6.11 - 4.32 - Tillomed Laboratories Limited 4.84 - 4.99 - - -
82.61 88.15 228.63 - 146.32 -
36) Redemption of Preference SharesGennova Biopharmaceuticals Limited - 100.00 - - - -
- 100.00 - - - -
37) Net changes in fair value of preference sharesGennova Biopharmaceuticals Limited - 19.09 - - - -
- 19.09 - - - -
38) Royalty expenseUth Beverages Factory Pvt. Ltd. 1.15 1.71 - 0.27 - 0.73
1.15 1.71 - 0.27 - 0.73
39) Marketing Support Fees (classified under Advertisement & Promotional Material)Emcure Pharmaceuticals Mena FZ-LLC. 24.80 11.59 - 9.62 - 59.05 Emcure Nigeria Limited 4.94 3.66 - 3.46 - 3.79 Emcure Pharma Peru S.A.C. - 38.19 - - - 35.09 Emcure Pharma Mexico S.A. DE C.V. 20.42 16.71 - 7.27 - 7.64 Emcure Brasil Farmaceutica Ltda. 17.30 43.27 - 13.80 - 14.14 Emcure Pharmaceuticals Pty Ltd. 14.21 32.18 - 12.31 - 15.25 Heritage Pharmaceuticals Inc. - - - - - - Emcure NZ Limited 3.13 62.85 - 1.00 - 0.50 Emcure Pharma Chile SpA 2.42 - - 2.47 - -
87.22 208.45 - 49.93 - 135.46
40) Corporate Overhead Cross Charge (Income) (classified under other income)Heritage Pharmaceuticals Inc. 73.52 - 71.54 - - - Marcan Pharmaceuticals Inc. 37.47 - 35.42 - - -
Tillomed Laboratories Limited 61.28 - 42.24 - - - 172.27 - 149.20 - - -
Rs. in million
ANNUAL REPORT 2020-21 : NOTES TO THE FINANCIAL STATEMENTS
Notes to the Financial statements for the year ended March 31, 2021 (Continued)

108
Sr. No. Description of the nature of transaction / balance
Transaction value Balance outstanding as at
Year ended March 31,
2021
Year ended March 31,
2020
March 31, 2021 March 31, 2020 Receivable / Advance
from customer
Payable / Advance to
supplier
Receivable / Advance
from customer
Payable / Advance to
supplier
41) Corporate Overhead Cross Charge (Expense)Heritage Pharmaceuticals Inc. 73.59 - - 17.63 - - Hacco Pharma Inc. 69.20 - - 69.20 - -
142.79 - - 86.83 - -
42) Financial guarantee fees paid (classified under other borrowing costs)Zuventus Healthcare Limited 4.06 - - - - -
4.06 - - - - -
43) Accrued interest balance written-off (classified under other borrowing costs)Emcure Pharmaceuticals South Africa (Pty) Ltd 16.68 - - - - -
16.68 - - - - -
* The amounts are below the rounding off norm adopted by the Company. # Loans and Guarantees are given for the general business purposes of related parties. The loans given to subsidiaries and interest thereon are measured at amortised cost. The difference between the carrying amount and actual amount is accounted as net gain / loss under other income / finance cost, as the case may be. Below are the details of actual amount of loan and interest receivable from subsidiaries:
Rs. in million
ParticularsTenure of loan and
interest / Repayment date
Rate of Interest p.a.Loans Interest accrued on loans
March 31, 2021 March 31, 2020 March 31, 2021 March 31, 2020
Emcure Nigeria Limited 45 months 6% - 8.3% 57.04 59.03 32.02 28.86 Emcure Pharmaceuticals South Africa (Pty) Ltd
45 months 3.4% - 9.5% - 138.23 28.56 41.89
Emcure Pharmaceuticals Mena FZ-LLC. 48 months 8.3% - 9.5% 111.90 214.84 15.05 123.79 Emcure Brasil Farmaceutica Ltda. 45 months 5.4% - 9.22% 107.84 111.60 43.09 35.21 Emcure Pharma Mexico S.A. DE C.V. 45 months 8.3% - 9.22% 76.18 78.84 16.04 10.37 Emcure Pharma Peru S.A.C. 60 months 5.11% - 9.5% 105.42 48.57 13.19 7.44 Emcure Pharmaceuticals Pty Ltd. 60 months 8.46% - - - 0.17 Heritage Pharma Holdings Inc. 36 months 4.37% - 5.03% 2,485.74 - 30.68 - Avet Lifesciences Limited 60 months 8.50% 1.30 - 0.02 - Emcure Pharma UK Ltd. 24 months 4.31% 604.77 - 18.97 - Total 3,550.19 651.11 197.62 247.73
Also refer note no. 47 for the details of the collateral security and note no. 41(c) for the details of financial guarantee given by the Company against the loans obtained by the subsidiaries. All transactions with the related parties are priced on an arm’s length basis.
Notes to the Financial statements for the year ended March 31, 2021 (Continued)
ANNUAL REPORT 2020-21 : NOTES TO THE FINANCIAL STATEMENTS
Rs. in million
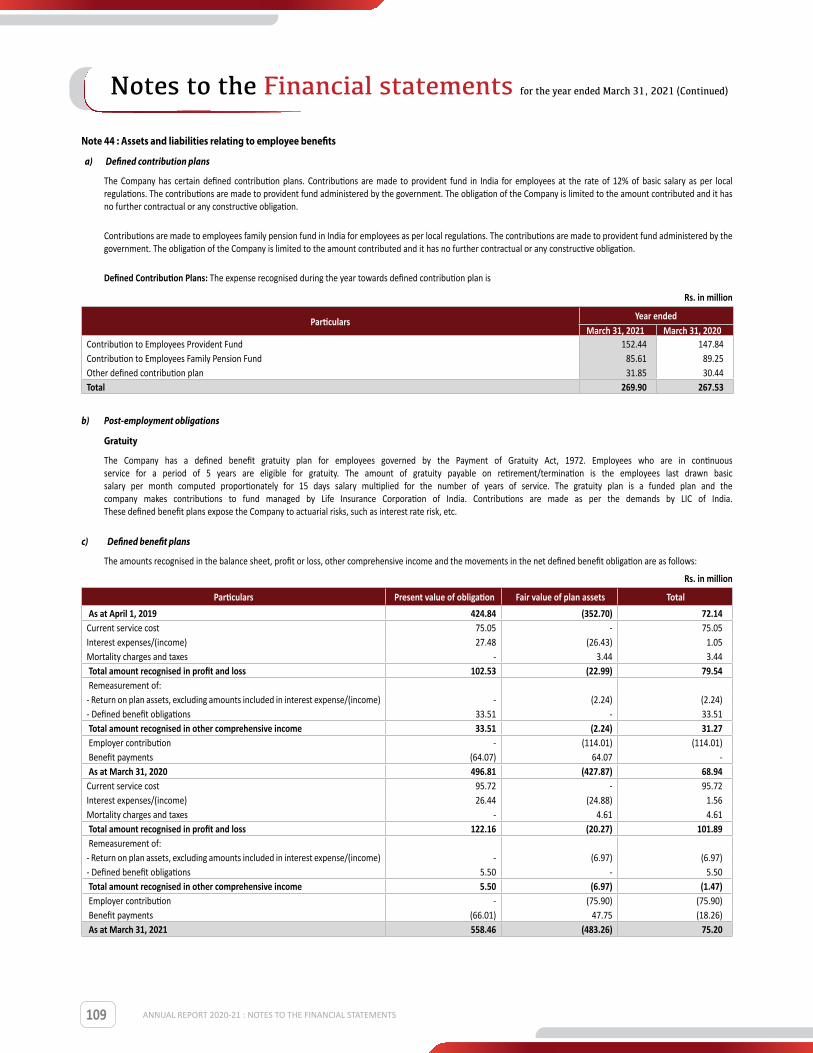
109
Note 44 : Assets and liabilities relating to employee benefits
a) Defined contribution plans
The Company has certain defined contribution plans. Contributions are made to provident fund in India for employees at the rate of 12% of basic salary as per local regulations. The contributions are made to provident fund administered by the government. The obligation of the Company is limited to the amount contributed and it has no further contractual or any constructive obligation.
Contributions are made to employees family pension fund in India for employees as per local regulations. The contributions are made to provident fund administered by the government. The obligation of the Company is limited to the amount contributed and it has no further contractual or any constructive obligation.
Defined Contribution Plans: The expense recognised during the year towards defined contribution plan is
Rs. in million
Particulars Year endedMarch 31, 2021 March 31, 2020
Contribution to Employees Provident Fund 152.44 147.84 Contribution to Employees Family Pension Fund 85.61 89.25 Other defined contribution plan 31.85 30.44 Total 269.90 267.53
b) Post-employment obligations
Gratuity
The Company has a defined benefit gratuity plan for employees governed by the Payment of Gratuity Act, 1972. Employees who are in continuous service for a period of 5 years are eligible for gratuity. The amount of gratuity payable on retirement/termination is the employees last drawn basic salary per month computed proportionately for 15 days salary multiplied for the number of years of service. The gratuity plan is a funded plan and the company makes contributions to fund managed by Life Insurance Corporation of India. Contributions are made as per the demands by LIC of India. These defined benefit plans expose the Company to actuarial risks, such as interest rate risk, etc.
c) Defined benefit plans
The amounts recognised in the balance sheet, profit or loss, other comprehensive income and the movements in the net defined benefit obligation are as follows:
Rs. in million
Particulars Present value of obligation Fair value of plan assets Total As at April 1, 2019 424.84 (352.70) 72.14 Current service cost 75.05 - 75.05 Interest expenses/(income) 27.48 (26.43) 1.05 Mortality charges and taxes - 3.44 3.44 Total amount recognised in profit and loss 102.53 (22.99) 79.54 Remeasurement of: - Return on plan assets, excluding amounts included in interest expense/(income) - (2.24) (2.24)- Defined benefit obligations 33.51 - 33.51 Total amount recognised in other comprehensive income 33.51 (2.24) 31.27 Employer contribution - (114.01) (114.01) Benefit payments (64.07) 64.07 - As at March 31, 2020 496.81 (427.87) 68.94 Current service cost 95.72 - 95.72 Interest expenses/(income) 26.44 (24.88) 1.56 Mortality charges and taxes - 4.61 4.61 Total amount recognised in profit and loss 122.16 (20.27) 101.89 Remeasurement of: - Return on plan assets, excluding amounts included in interest expense/(income) - (6.97) (6.97)- Defined benefit obligations 5.50 - 5.50 Total amount recognised in other comprehensive income 5.50 (6.97) (1.47) Employer contribution - (75.90) (75.90) Benefit payments (66.01) 47.75 (18.26) As at March 31, 2021 558.46 (483.26) 75.20
ANNUAL REPORT 2020-21 : NOTES TO THE FINANCIAL STATEMENTS
Notes to the Financial statements for the year ended March 31, 2021 (Continued)
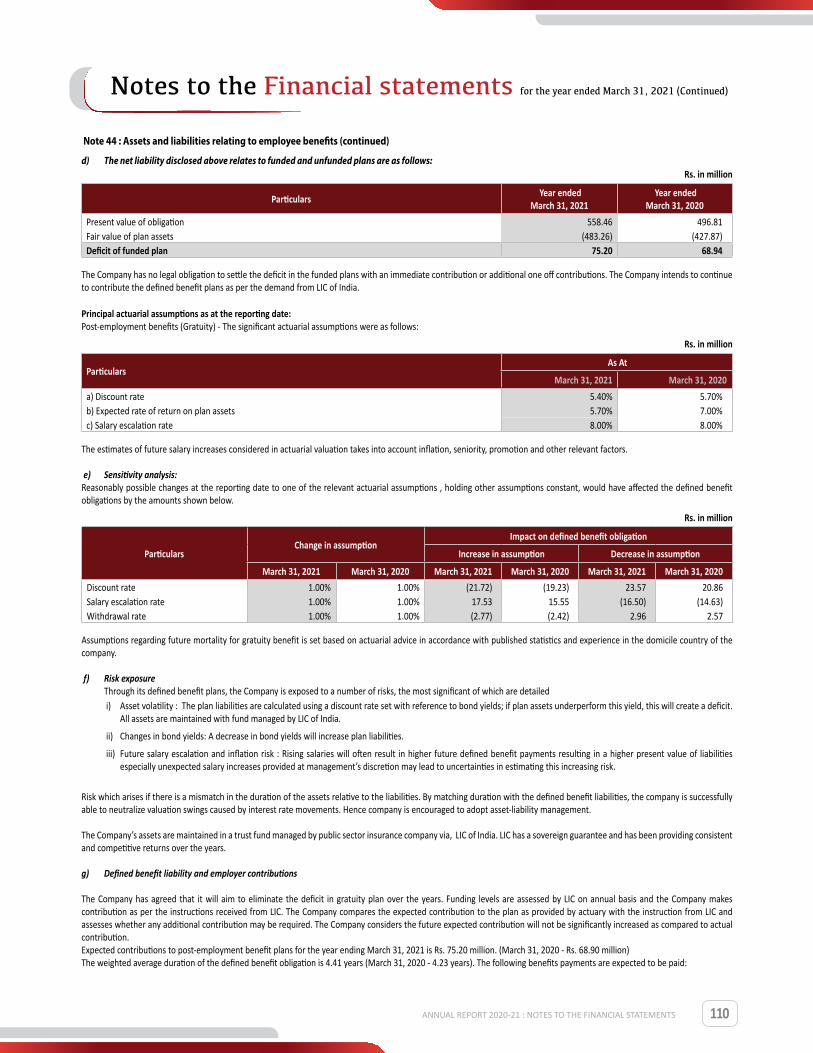
110
Note 44 : Assets and liabilities relating to employee benefits (continued)
d) The net liability disclosed above relates to funded and unfunded plans are as follows:Rs. in million
Particulars Year ended March 31, 2021
Year ended March 31, 2020
Present value of obligation 558.46 496.81 Fair value of plan assets (483.26) (427.87)Deficit of funded plan 75.20 68.94
The Company has no legal obligation to settle the deficit in the funded plans with an immediate contribution or additional one off contributions. The Company intends to continue to contribute the defined benefit plans as per the demand from LIC of India.
Principal actuarial assumptions as at the reporting date:Post-employment benefits (Gratuity) - The significant actuarial assumptions were as follows:
Rs. in million
Particulars As At
March 31, 2021 March 31, 2020a) Discount rate 5.40% 5.70%b) Expected rate of return on plan assets 5.70% 7.00%c) Salary escalation rate 8.00% 8.00%
The estimates of future salary increases considered in actuarial valuation takes into account inflation, seniority, promotion and other relevant factors.
e) Sensitivity analysis: Reasonably possible changes at the reporting date to one of the relevant actuarial assumptions , holding other assumptions constant, would have affected the defined benefit obligations by the amounts shown below.
Rs. in million
ParticularsChange in assumption
Impact on defined benefit obligation
Increase in assumption Decrease in assumption
March 31, 2021 March 31, 2020 March 31, 2021 March 31, 2020 March 31, 2021 March 31, 2020Discount rate 1.00% 1.00% (21.72) (19.23) 23.57 20.86 Salary escalation rate 1.00% 1.00% 17.53 15.55 (16.50) (14.63)Withdrawal rate 1.00% 1.00% (2.77) (2.42) 2.96 2.57
Assumptions regarding future mortality for gratuity benefit is set based on actuarial advice in accordance with published statistics and experience in the domicile country of the company. f) Risk exposure
Through its defined benefit plans, the Company is exposed to a number of risks, the most significant of which are detailed i) Asset volatility : The plan liabilities are calculated using a discount rate set with reference to bond yields; if plan assets underperform this yield, this will create a deficit.
All assets are maintained with fund managed by LIC of India.
ii) Changes in bond yields: A decrease in bond yields will increase plan liabilities.
iii) Future salary escalation and inflation risk : Rising salaries will often result in higher future defined benefit payments resulting in a higher present value of liabilities especially unexpected salary increases provided at management’s discretion may lead to uncertainties in estimating this increasing risk.
Risk which arises if there is a mismatch in the duration of the assets relative to the liabilities. By matching duration with the defined benefit liabilities, the company is successfully able to neutralize valuation swings caused by interest rate movements. Hence company is encouraged to adopt asset-liability management. The Company’s assets are maintained in a trust fund managed by public sector insurance company via, LIC of India. LIC has a sovereign guarantee and has been providing consistent and competitive returns over the years. g) Defined benefit liability and employer contributions
The Company has agreed that it will aim to eliminate the deficit in gratuity plan over the years. Funding levels are assessed by LIC on annual basis and the Company makes contribution as per the instructions received from LIC. The Company compares the expected contribution to the plan as provided by actuary with the instruction from LIC and assesses whether any additional contribution may be required. The Company considers the future expected contribution will not be significantly increased as compared to actual contribution. Expected contributions to post-employment benefit plans for the year ending March 31, 2021 is Rs. 75.20 million. (March 31, 2020 - Rs. 68.90 million)The weighted average duration of the defined benefit obligation is 4.41 years (March 31, 2020 - 4.23 years). The following benefits payments are expected to be paid:
ANNUAL REPORT 2020-21 : NOTES TO THE FINANCIAL STATEMENTS
Notes to the Financial statements for the year ended March 31, 2021 (Continued)

111
Rs. in million
Particulars Less than 1 year between 1-2 years
between 2-5 years over 5 years Total
March 31, 2021Defined benefit obligation - gratuity 124.21 115.28 278.12 316.29 833.90 March 31, 2020Defined benefit obligation - gratuity 115.57 90.36 255.76 313.96 775.65
h) Major plan assets
Rs. in million
ParticularsMarch 31, 2021 March 31, 2020
Unquoted UnquotedInvestment funds
- Insurance Funds (LIC Pension and Group Schemes fund) 483.26 427.87 Total 483.26 427.87
The category wise details of the plan assets is not available as it’s maintained by LIC.
Note 45 : Employees stock option plan As at 31 March 2021, the Company has the following share-based payment arrangement:
Share option plans (equity settled)Emcure ESOS 2013”: The Board vide its resolution granted employee stock options as under to the eligible employees under “Emcure ESOS 2013” in compliance with the provisions of the applicable law and rules framed thereunder.
Rs. in million
Resolution date Tranche No Grant Date Exercise Price Total Options Granted10-Oct-13 Tranche - 01 01-Oct-13 221.25* 22,70,000 14-Mar-16 Tranche - 02 14-Mar-16 508.75 5,80,000 07-Jul-17 Tranche - 03 07-Jul-17 300.00 1,00,000 01-Nov-18 Tranche - 04 01-Nov-18 522.00 8,40,000 01-Dec-18 Tranche - 05 01-Dec-18 522.00 2,40,000 01-Feb-19 Tranche - 06 01-Feb-19 522.00 2,30,000 06-Jun-19 Tranche - 07 06-Jun-19 522.00 6,25,000 08-Nov-19 Tranche - 08 08-Nov-19 580.00 4,55,000 04-Feb-20 Tranche - 09 04-Feb-20 580.00 70,000 22-Jul-20 Tranche - 10 22-Jul-20 620.00 1,80,000 09-Nov-20 Tranche - 11 09-Nov-20 620.00 40,000
**During the year ended March 31, 2016, the company had issued bonus shares to its shareholders in the ratio of 3:1. Correspondingly, proportionate adjustment has been made by increasing the number of options granted and reducing exercise price per option. Board of directors vide resolution dated January 29, 2016 have approved the adjustments to options granted.
The eligible employees, including directors, are determined by the Remuneration Committee from time to time. These options will vest over period of 3 to 5 years from the grant date and are subject to the condition of continued service of the employees.
Once vested the option can be exercised within 5 years from date of Initial Public Offer (IPO). The exercise price of the options is equal to fair market value of the shares as determined by an independent valuer as at grant dates. If IPO does not take place or shares are not listed within 2 years from the date of grant, Remuneration committee at its sole discretion, subject to prior approval of the Company’s shareholders’ can settle the vested options in cash or allow exercise of option before listing at a price arrived at by an independent valuer. However no options have been settled in cash or allowed to be exercised till March 31, 2021.
Options granted under this scheme carry no dividend or voting rights. When exercised, one option is convertible into one equity share.
ANNUAL REPORT 2020-21 : NOTES TO THE FINANCIAL STATEMENTS
Notes to the Financial statements for the year ended March 31, 2021 (Continued)
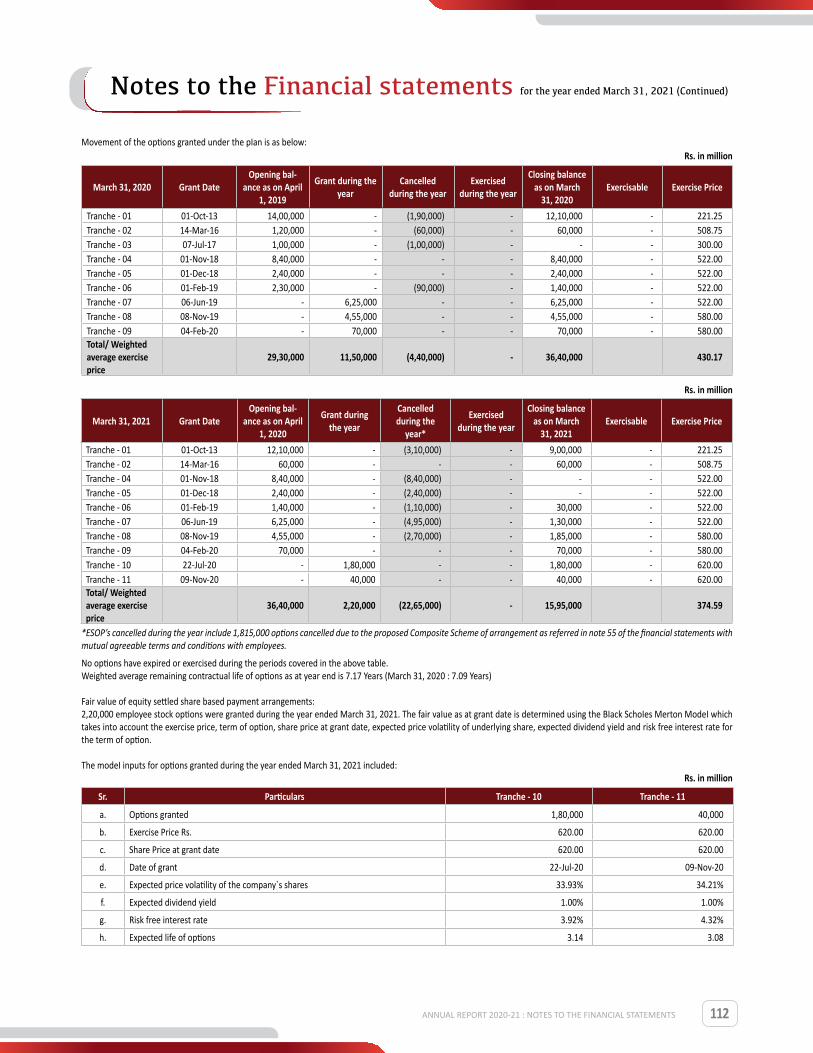
112
Movement of the options granted under the pIan is as below:Rs. in million
March 31, 2020 Grant DateOpening bal-
ance as on April 1, 2019
Grant during the year
Cancelled during the year
Exercised during the year
Closing balance as on March
31, 2020Exercisable Exercise Price
Tranche - 01 01-Oct-13 14,00,000 - (1,90,000) - 12,10,000 - 221.25 Tranche - 02 14-Mar-16 1,20,000 - (60,000) - 60,000 - 508.75 Tranche - 03 07-Jul-17 1,00,000 - (1,00,000) - - - 300.00 Tranche - 04 01-Nov-18 8,40,000 - - - 8,40,000 - 522.00 Tranche - 05 01-Dec-18 2,40,000 - - - 2,40,000 - 522.00 Tranche - 06 01-Feb-19 2,30,000 - (90,000) - 1,40,000 - 522.00 Tranche - 07 06-Jun-19 - 6,25,000 - - 6,25,000 - 522.00 Tranche - 08 08-Nov-19 - 4,55,000 - - 4,55,000 - 580.00 Tranche - 09 04-Feb-20 - 70,000 - - 70,000 - 580.00 Total/ Weighted average exercise price
29,30,000 11,50,000 (4,40,000) - 36,40,000 430.17
Rs. in million
March 31, 2021 Grant DateOpening bal-
ance as on April 1, 2020
Grant during the year
Cancelled during the
year*
Exercised during the year
Closing balance as on March
31, 2021Exercisable Exercise Price
Tranche - 01 01-Oct-13 12,10,000 - (3,10,000) - 9,00,000 - 221.25 Tranche - 02 14-Mar-16 60,000 - - - 60,000 - 508.75 Tranche - 04 01-Nov-18 8,40,000 - (8,40,000) - - - 522.00 Tranche - 05 01-Dec-18 2,40,000 - (2,40,000) - - - 522.00 Tranche - 06 01-Feb-19 1,40,000 - (1,10,000) - 30,000 - 522.00 Tranche - 07 06-Jun-19 6,25,000 - (4,95,000) - 1,30,000 - 522.00 Tranche - 08 08-Nov-19 4,55,000 - (2,70,000) - 1,85,000 - 580.00 Tranche - 09 04-Feb-20 70,000 - - - 70,000 - 580.00 Tranche - 10 22-Jul-20 - 1,80,000 - - 1,80,000 - 620.00 Tranche - 11 09-Nov-20 - 40,000 - - 40,000 - 620.00 Total/ Weighted average exercise price
36,40,000 2,20,000 (22,65,000) - 15,95,000 374.59
*ESOP’s cancelled during the year include 1,815,000 options cancelled due to the proposed Composite Scheme of arrangement as referred in note 55 of the financial statements with mutual agreeable terms and conditions with employees.
No options have expired or exercised during the periods covered in the above table.Weighted average remaining contractual life of options as at year end is 7.17 Years (March 31, 2020 : 7.09 Years)
Fair value of equity settled share based payment arrangements: 2,20,000 employee stock options were granted during the year ended March 31, 2021. The fair vaIue as at grant date is determined using the BIack SchoIes Merton ModeI which takes into account the exercise price, term of option, share price at grant date, expected price volatility of underlying share, expected dividend yield and risk free interest rate for the term of option.
The modeI inputs for options granted during the year ended March 31, 2021 included:Rs. in million
Sr. Particulars Tranche - 10 Tranche - 11
a. Options granted 1,80,000 40,000
b. Exercise Price Rs. 620.00 620.00
c. Share Price at grant date 620.00 620.00
d. Date of grant 22-Jul-20 09-Nov-20
e. Expected price volatility of the company`s shares 33.93% 34.21%
f. Expected dividend yield 1.00% 1.00%
g. Risk free interest rate 3.92% 4.32%
h. Expected life of options 3.14 3.08
ANNUAL REPORT 2020-21 : NOTES TO THE FINANCIAL STATEMENTS
Notes to the Financial statements for the year ended March 31, 2021 (Continued)

113
Volatility is a measure of the movement in the prices of the underlying assets. Since the Company is an unlisted Company, volatility of similar listed entities has been considered. Expected volatility has been based on an evaluation of the historical volatility of the similar listed entities (peers) share price, particularly over the historical period commensurate with the expected term. The expected term of the instrument has been based on historical experience and general option holder behaviour. Expenses recognised in statement of profit and loss:
in Million
Particulars 31-Mar-21 31-Mar-20
Employee share-based payment 26.05 27.48
Note 46 : Revenue from contract with customer
Rs. in million
Particulars Year ended March 31, 2021
Year ended March 31, 2020
Revenue recognised from contracts with customers 31,272.04 23,356.78
Other operating revenue 264.60 400.31
Disaggregation of revenue
Based on markets
Within India 15,168.37 13,338.14
Outside India -
a. Europe 2,725.52 1,956.91
b. North America 2,477.97 3,363.76
c. Other continents 11,164.78 5,098.28
Total 31,536.64 23,757.09
Revenue recognised in the reporting period that was included in the contract liability balance at the beginning of the period
28.45 45.78
The Company satisfies its performance obligations pertaining to the sale of goods at point in time when the control of goods is actually transferred to the customers. No significant judgment is involved in evaluating when a customer obtains control of promised goods. The contract with customers are generally fixed price contract (except for contracts with subsidiaries, wherein there is variable consideration) subject to refund due to returns and do not contain any financing component. The payment is generally due within 7-180 days. The Company is obliged for returns/refunds due to expiry & saleable returns. There are no other significant obligations attached in the contract with customer.
There is no significant judgement involved in ascertaining the timing of satisfaction of performance obligation and in evaluating when a customer obtains control of promised goods. Transaction price ascertained for the performance obligation of the Company is agreed in the contract with the customer. Further, the variable consideration is an estimate amount arrived by using expected value method.
Reconciliation of contract price with revenue recognised in statement of profit and loss:
Rs. in million
Particulars March 31, 2021 March 31, 2020
Contract price 32,205.77 24,236.52
Less:
Sales return and breakage expiry (878.87) (808.79)
Allowance for interest loss (54.86) (70.95)
Revenue recognised in statement of profit and loss 31,272.04 23,356.78
Major customerRevenue from Emcure Pharma Peru S.A.C. which caters ‘other continents’ segment is Rs. 3,320.68 millions (March 31, 2020 : Rs. 25.76 millions) which is more than 10% of the Company’s total revenue.
ANNUAL REPORT 2020-21 : NOTES TO THE FINANCIAL STATEMENTS
Notes to the Financial statements for the year ended March 31, 2021 (Continued)
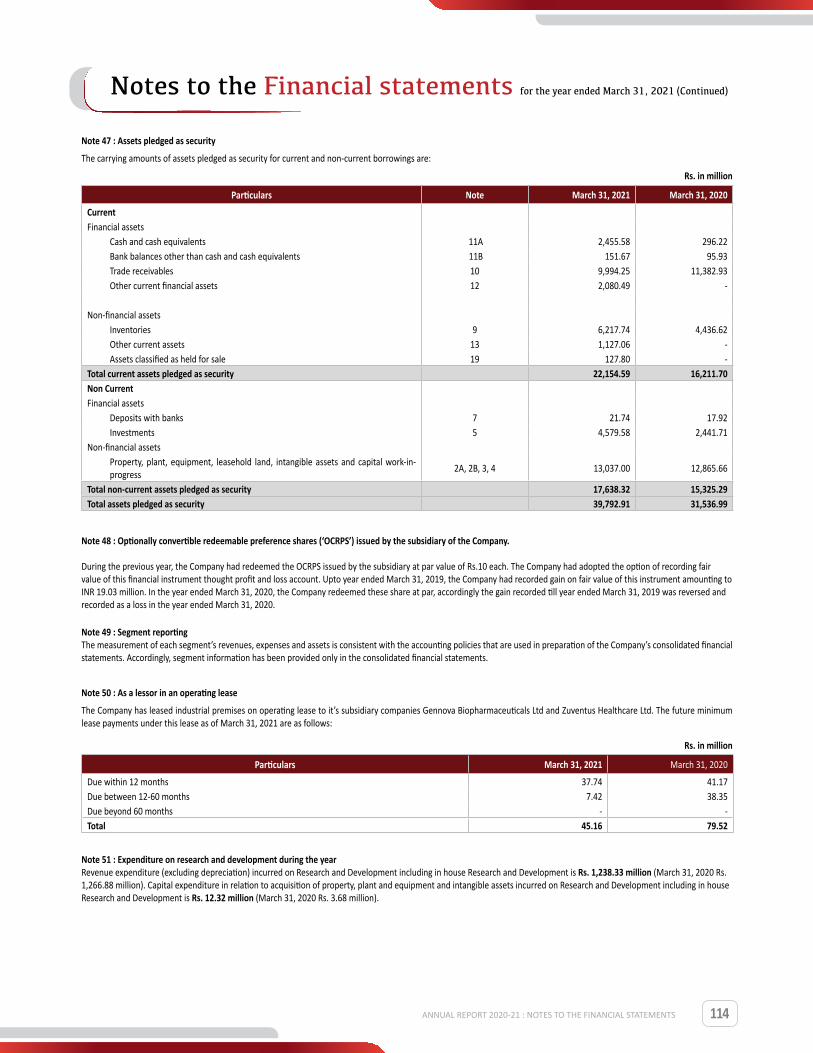
114
Note 47 : Assets pledged as security
The carrying amounts of assets pledged as security for current and non-current borrowings are:
Rs. in million
Particulars Note March 31, 2021 March 31, 2020
CurrentFinancial assets
Cash and cash equivalents 11A 2,455.58 296.22 Bank balances other than cash and cash equivalents 11B 151.67 95.93 Trade receivables 10 9,994.25 11,382.93 Other current financial assets 12 2,080.49 -
Non-financial assetsInventories 9 6,217.74 4,436.62 Other current assets 13 1,127.06 - Assets classified as held for sale 19 127.80 -
Total current assets pledged as security 22,154.59 16,211.70 Non CurrentFinancial assets
Deposits with banks 7 21.74 17.92 Investments 5 4,579.58 2,441.71
Non-financial assetsProperty, plant, equipment, leasehold land, intangible assets and capital work-in-progress
2A, 2B, 3, 4 13,037.00 12,865.66
Total non-current assets pledged as security 17,638.32 15,325.29 Total assets pledged as security 39,792.91 31,536.99
Note 48 : Optionally convertible redeemable preference shares (‘OCRPS’) issued by the subsidiary of the Company.
During the previous year, the Company had redeemed the OCRPS issued by the subsidiary at par value of Rs.10 each. The Company had adopted the option of recording fair value of this financial instrument thought profit and loss account. Upto year ended March 31, 2019, the Company had recorded gain on fair value of this instrument amounting to INR 19.03 million. In the year ended March 31, 2020, the Company redeemed these share at par, accordingly the gain recorded till year ended March 31, 2019 was reversed and recorded as a loss in the year ended March 31, 2020.
Note 49 : Segment reporting The measurement of each segment’s revenues, expenses and assets is consistent with the accounting policies that are used in preparation of the Company’s consolidated financial statements. Accordingly, segment information has been provided only in the consolidated financial statements.
Note 50 : As a lessor in an operating lease
The Company has leased industrial premises on operating lease to it’s subsidiary companies Gennova Biopharmaceuticals Ltd and Zuventus Healthcare Ltd. The future minimum lease payments under this lease as of March 31, 2021 are as follows:
Rs. in million
Particulars March 31, 2021 March 31, 2020
Due within 12 months 37.74 41.17 Due between 12-60 months 7.42 38.35 Due beyond 60 months - - Total 45.16 79.52
Note 51 : Expenditure on research and development during the yearRevenue expenditure (excluding depreciation) incurred on Research and Development including in house Research and Development is Rs. 1,238.33 million (March 31, 2020 Rs. 1,266.88 million). Capital expenditure in relation to acquisition of property, plant and equipment and intangible assets incurred on Research and Development including in house Research and Development is Rs. 12.32 million (March 31, 2020 Rs. 3.68 million).
ANNUAL REPORT 2020-21 : NOTES TO THE FINANCIAL STATEMENTS
Notes to the Financial statements for the year ended March 31, 2021 (Continued)

115
Note 52 : Information regarding Micro, Small and Medium EnterprisesThe information regarding Micro Enterprises and Small Enterprises has been determined to the extent such parties have been identified on the basis of information available with the Company.
Rs. in million
Particulars March 31, 2021 March 31, 2020
i) The principal amount and the interest due thereon remaining unpaid to any supplier at the end of each accounting year
- 0.62
ii) The amount of interest paid by the buyer in terms of Section 16 of the Micro, Small and Medium Enterprise Development
- 0.06
Act, 2006 along with the amount of the payment made to the supplier beyond the appointed day during each accounting year.
iii) The amount of interest due and payable for the period of delay in making payment but without adding the interest specified under the Micro, Small and Medium Enterprise Development Act, 2006.
- 0.06
iv) The amount of interest accrued and remaining unpaid at the end of each accounting year. 0.14 0.21 v) The amount of further interest remaining due and payable even in the succeeding years, until such date when
the interest dues above are actually paid to the small enterprise, for the purpose of disallowance of a deductible expenditure under Section 23 of the Micro, Small and Medium Enterprise Development Act, 2006.
- 0.21
Note 53 : Indirect tax refund received
Under Notification dated 05 October 2017 and Circular No. 1060/9/2017-CX dated 27th November, 2017 issued by the Department of Industrial Policy and Promotion (DIPP), the Company is entitled to subsidy in the form of proportionate refund of GST paid in cash (i.e. other than utilising input credit) by its unit at Jammu for a period not exceeding ten years from the date of start of commercial production at Jammu unit. The subsidy is available upto March 01, 2026. There are no unfulfilled conditions or other contingencies attached to this grant. Note 54 : Corporate social responsibility As per Section 135 of the Companies Act, 2013, a corporate social responsibility (CSR) committee has been formed by the Company. The areas for CSR activities are promoting education, healthcare and ensuring environmental sustainability. Amount spent during the year on activities which are specified in Schedule VII of the Companies Act 2013 are as mentioned below :
a) Gross amount of Rs. 60.18 million (March 31, 2020 Rs. 58.92 million) required to be spent by the Company during the year. b) Amount spent during the year on:
Rs. in million
Particulars Paid Yet to be
paid Total Paid Yet to be paid Total
Year ended March 31, 2021 Year ended March 31, 2020(i) Construction/acquisition of any asset - - - - - - (ii) On purposes other than (i) above 64.77 - 64.77 58.08 - 58.08
Note 55 : Composite Scheme of arrangement
The Board of Directors of the Company, at their meeting held on November 09, 2020, had approved Composite Scheme of Arrangement between Emcure Pharmaceuticals Limited (“Demerged Company”) and Avet Lifesciences Limited (“Resulting Company”) and their respective shareholders (‘Scheme’) which was filed with National Company Law Tribunal (“NCLT”), Mumbai, on November 30, 2020, for demerger of the Company’s US (United States of America) market business and vesting the same into the Resulting Com-pany, under Sections 230 to 232 read with Section 52, section 66 and other applicable provisions of the Companies Act, 2013. The Joint Petition was filed with NCLT on February 04, 2021 and the final hearing of NCLT is awaited. Pending the NCLT approval, the standalone financial statements do not have any impact of the scheme.
Note 56 : Specified bank notes (SBNs)The disclosures regarding details of specified bank notes held and transacted during November 8, 2016 to December 30 2016 has not been made in these financial statements, since the requirement does not pertain to financial year ended 31 March 2021.
Note 57 : Other NoteIn March 2020, the World Health Organisation declared COVID-19 to be a pandemic. The Company has adopted measures to curb the spread of infection in order to protect the health of its employees and ensure business continuity with minimal disruption. The Company has considered internal and external information while finalizing various estimates in relation to its financial statement captions upto the date of approval of the Statements by the Board of Directors. The actual impact of the global health pandemic may be different from that which has been estimated, as the COVID -19 situation evolves in India and globally. The Company will continue to closely monitor any material changes to future economic conditions. Note 58 : Events occurring after the reporting period On May 07, 2021, Emcure Pharma Philippines Inc., a direct subsidiary of the Company was incorporated with equity share capital of Pesos 9.68 million (equivalent to Rs. 15.11 million)
ANNUAL REPORT 2020-21 : NOTES TO THE FINANCIAL STATEMENTS
Notes to the Financial statements for the year ended March 31, 2021 (Continued)

116
Note 59 : Code of Social SecurityThe Indian Parliament has approved the Code on Social Security, 2020 which would impact the contributions by the Company towards Provident Fund and Gratuity. The Ministry of Labour and Employment has released draft rules for the Code on Social Security, 2020 on November 13, 2020, and has invited suggestions from stake holders which are under active consideration by the Ministry. The Company will assess the impact and its evaluation once the subject rules are notified and will give appropriate impact in its financial statements in the period in which, the Code becomes effective and the related rules to determine the financial impact are published. The notes referred to above form an integral part of the financial statements. As per our report of even date attached.
For B S R & Co. LLP For and on behalf of the Board of DirectorsFirm Registration: 101248W/W-100022 Emcure Pharmaceuticals Limited Chartered Accountants CIN -U24231PN1981PLC024251 Berjis Desai Satish Mehta Abhishek Director and Chairman Managing DirectorPartner DIN: 00153675 DIN -00118691 Membership No. 062343 Jayant Prakash Tajuddin Shaikh Company Secretary Chief Financial Officer Membership No. F6742 PAN: AKQPS1951G Place: Pune Place: PuneDate : May 28, 2021 Date : May 28, 2021
ANNUAL REPORT 2020-21 : NOTES TO THE FINANCIAL STATEMENTS
Notes to the Financial statements for the year ended March 31, 2021 (Continued)
117
To the Members of Emcure Pharmaceuticals Limited
Report on the Audit of Consolidated Financial Statements
Opinion
We have audited the consolidated financial statements of Emcure Pharmaceuticals Limited (hereinafter referred to as the ‘Holding Company”) and its subsidiaries (Holding Company and its subsidiaries together referred to as “the Group”), which comprise the consolidated balance sheet as at 31 March 2021, and the consolidated statement of profit and loss (including other comprehensive income), consolidated statement of changes in equity and consolidated statement of cash flows for the year then ended, and notes to the consolidated financial statements, including a summary of significant accounting policies and other explanatory information (hereinafter referred to as “the consolidated financial statements”).
In our opinion and to the best of our information and according to the explanations given to us, and based on the consideration of reports of other auditors on separate financial statements of such subsidiaries, as were audited by the other auditors, the aforesaid consolidated financial statements give the information required by the Companies Act, 2013 (“Act”) in the manner so required and give a true and fair view in conformity with the accounting principles generally accepted in India, of the consolidated state of affairs of the Group as at 31 March 2021, of its consolidated profit and other comprehensive income, consolidated changes in equity and consolidated cash flows for the year then ended.
Basis for Opinion
We conducted our audit in accordance with the Standards on Auditing (SAs) specified under section 143(10) of the Act. Our responsibilities under those SAs are further described in the Auditor’s Responsibilities for the Audit of the Consolidated Financial Statements section of our report. We are independent of the Group in accordance with the ethical requirements that are relevant to our audit of the consolidated financial statements in terms of the Code of Ethics issued by the Institute of Chartered Accountants of India and the relevant provisions of the Act, and we have fulfilled our other ethical responsibilities in accordance with these requirements. We believe that the audit evidence obtained by us along with the consideration of audit reports of the other auditors referred to in sub paragraph (a) of the “Other Matters” paragraph below, is sufficient and appropriate to provide a basis for our opinion on the consolidated financial statements.
Emphasis of matter
We draw attention to Note 43 to the financial statements which describes the uncertainty related to the ultimate outcome of the Search and Seizure operation conducted by the Income Tax Department. The Group has not received any demand notices in relation to the Search and Seizure as at this date. Management is confident that no taxes will devolve on the Group and hence no provision has been recognised in these financial statements as at 31 March 2021. Though the Group has not received any demand notice till date, the uncertainty in the matter remains till the proceedings are concluded.
Our opinion is not qualified in respect of this matter.
Other Information
The Holding Company’s management and Board of Directors are responsible for the other information. The other information comprises the information included in the holding Company’s annual report, but does not include the financial statements and our auditors’ report thereon.
Our opinion on the consolidated financial statements does not cover the other information and we do not express any form of assurance conclusion thereon.
In connection with our audit of the consolidated financial statements, our responsibility is to read the other information and, in doing so, consider whether the other information is materially inconsistent with the consolidated financial statements or our knowledge obtained in the audit or otherwise appears to be materially misstated. If, based on the work we have performed and based on the work done/ audit report of other auditors, we conclude that there is a material misstatement of this other information, we are required to report that fact. We have nothing to report in this regard.
Management’s and Board of Directors’ Responsibilities for the Consolidated Financial Statements
The Holding Company’s Management and Board of Directors are responsible for the preparation and presentation of these consolidated financial statements in term of the requirements of the Act that give a true and fair view of the consolidated state of affairs, consolidated profit / loss and other comprehensive income, consolidated statement of changes in equity and consolidated cash flows of the Group in accordance with the accounting principles generally accepted in India, including the Indian Accounting Standards (Ind AS) specified under section 133 of the Act. The respective Management and Board of Directors of the companies included in the Group are responsible for maintenance of adequate accounting records in accordance with the provisions of the Act for safeguarding the assets of each company and for preventing and detecting frauds and other irregularities; the selection and application of appropriate accounting policies; making judgments and estimates that are reasonable and prudent; and the design, implementation and maintenance of adequate internal financial controls, that were operating effectively for ensuring accuracy and completeness of the accounting records, relevant to the preparation and presentation of the consolidated financial statements that give a true and fair view and are free from material misstatement, whether due to fraud or error, which have been used for the purpose of preparation of the consolidated financial statements by the Management and Directors of the Holding Company, as aforesaid.
In preparing the consolidated financial statements, the respective Management and Board of Directors of the companies included in the Group are responsible for assessing the ability of each company to continue as a going concern, disclosing, as applicable, matters related to going concern and using the going concern basis of accounting unless the respective Board of Directors either intends to liquidate the Company or to cease operations, or has no realistic alternative but to do so.
The respective Board of Directors of the companies included in the Group is responsible for overseeing the financial reporting process of each company.
Auditor’s Responsibilities for the Audit of the Consolidated Financial Statements
Our objectives are to obtain reasonable assurance about whether the consolidated financial statements as a whole are free from material misstatement, whether due to fraud or error, and to issue an auditor’s report that includes our opinion. Reasonable assurance is a high level of assurance, but is not a guarantee that an audit conducted in accordance with SAs will always detect a material misstatement when it exists. Misstatements can arise from fraud or error and are considered material if, individually or in the aggregate, they could reasonably be expected to influence the economic decisions of users taken on the basis of these consolidated financial statements.
As part of an audit in accordance with SAs, we exercise professional judgment and maintain professional skepticism throughout the audit. We also:
• Identify and assess the risks of material misstatement of the consolidated financial statements, whether due to fraud or error, design and perform audit procedures responsive to those risks, and obtain audit evidence that is sufficient and appropriate to provide a basis for our opinion. The risk of not detecting a material misstatement resulting from fraud is higher than for one resulting from error, as fraud may involve collusion, forgery, intentional omissions, misrepresentations, or the override of internal control.
• Obtain an understanding of internal control relevant to the audit in order to design audit procedures that are appropriate in the circumstances. Under section 143(3)(i) of the Act, we are also responsible for expressing our opinion on the internal financial controls with reference to the consolidated financial statements and the operating effectiveness of such controls based on our audit.
• Evaluate the appropriateness of accounting policies used and the reasonableness of accounting estimates and related disclosures made by the Management and Board of Directors.
• Conclude on the appropriateness of Management and Board of Directors use of the going concern basis of accounting in preparation of consolidated financial statements and, based on the audit evidence obtained, whether a material uncertainty exists related to events or conditions that may cast significant doubt on the appropriateness of
ANNUAL REPORT 2020-21 : INDEPENDENT AUDITOR’S REPORT
Independent Auditors’ Report

118
this assumption. If we conclude that a material uncertainty exists, we are required to draw attention in our auditor’s report to the related disclosures in the consolidated financial statements or, if such disclosures are inadequate, to modify our opinion. Our conclusions are based on the audit evidence obtained up to the date of our auditor’s report. However, future events or conditions may cause the Group to cease to continue as a going concern.
• Evaluate the overall presentation, structure and content of the consolidated financial statements, including the disclosures, and whether the consolidated financial statements represent the underlying transactions and events in a manner that achieves fair presentation.
• Obtain sufficient appropriate audit evidence regarding the financial information of such entities or business activities within the Group to express an opinion on the consolidated financial statements. We are responsible for the direction, supervision and performance of the audit of financial information of such entities included in the consolidated financial statements of which we are the independent auditors. For the other entities included in the consolidated financial statements, which have been audited by other auditors, such other auditors remain responsible for the direction, supervision and performance of the audits carried out by them. We remain solely responsible for our audit opinion. Our responsibilities in this regard are further described in para (a) of the section titled ‘Other Matters’ in this audit report.
We believe that the audit evidence obtained by us along with the consideration of audit reports of the other auditors referred to in sub-paragraph (a) of the Other Matters paragraph below, is sufficient and appropriate to provide a basis for our audit opinion on the consolidated financial statements.
We communicate with those charged with governance of the Holding Company and such other entities included in the consolidated financial statements of which we are the independent auditors regarding, among other matters, the planned scope and timing of the audit and significant audit findings, including any significant deficiencies in internal control that we identify during our audit.
We also provide those charged with governance with a statement that we have complied with relevant ethical requirements regarding independence, and to communicate with them all relationships and other matters that may reasonably be thought to bear on our independence, and where applicable, related safeguards.
Other Matters
(a) We did not audit the financial statements / financial information of seventeen subsidiaries whose financial statements/financial information reflect total assets of Rs.41,581.85 Million as at 31 March 2021, total revenues of Rs.30,983.99 and net cash flows amounting to Rs. 1,638.14 Million for the year ended on that date, as considered in the consolidated financial statements. These financial statements/financial information have been audited by other auditors whose reports have been furnished to us by the Management and our opinion on the consolidated financial statements, in so far as it relates to the amounts and disclosures included in respect of these subsidiaries, joint ventures, joint operations and associates, and our report in terms of sub-section (3) of Section 143 of the Act, in so far as it relates to the aforesaid subsidiaries is based solely on the audit reports of the other auditors.
Certain of these subsidiaries are located outside India whose financial statements and other financial information have been prepared in accordance with accounting principles generally accepted in their respective countries and which have been audited by other auditors under generally accepted auditing standards applicable in their respective countries. The Company’s management has converted the financial statements of such subsidiaries located outside India from accounting principles generally accepted in their respective countries to accounting principles generally accepted in India. We have audited these conversion adjustments made by the Company’s management. Our opinion in so far as it relates to the balances and affairs of such subsidiaries located outside India is based on the report of other auditors and the conversion adjustments prepared by the management of the Company and audited by us.
(b) The financial statements/financial information of five subsidiaries whose financial statements/financial information reflect total assets of Rs.2,464.28 Million as at 31 March 2021, total revenues of Rs.2,852.18 Million and net cash flows amounting to Rs. 36.41 Million for the year ended on that date, as considered in the consolidated financial statements, have not been audited either by us or by other auditors. These unaudited financial statements/financial information have been furnished to us by the Management and our opinion on the consolidated financial statements, in so far as it relates to the amounts and disclosures included in respect of these subsidiaries and our report in terms of sub-sections (3) of Section 143 of the Act in so far as it relates to the aforesaid subsidiaries is based solely on such unaudited financial statements / financial information. In our opinion and according to the information and explanations given to us by the Management, these financial statements/financial information are not material to the Group.
Our opinion on the consolidated financial statements, and our report on Other Legal and Regulatory Requirements below, is not modified in respect of the above matters with respect to our reliance on the work done and the reports of the other auditors and the financial statements/financial information certified by the Management.
Report on Other Legal and Regulatory Requirements
A. As required by Section 143(3) of the Act, based on our audit and on the consideration of reports of the other auditors on separate financial statements of such subsidiaries as were audited by other auditors, as noted in the ‘Other Matters’ paragraph, we report, to the extent applicable, that:
a) We have sought and obtained all the information and explanations which to the best of our knowledge and belief were necessary for the purposes of our audit of the aforesaid consolidated financial statements.
b) In our opinion, proper books of account as required by law relating to preparation of the aforesaid consolidated financial statements have been kept so far as it appears from our examination of those books and the reports of the other auditors.
c) The consolidated balance sheet, the consolidated statement of profit and loss (including other comprehensive income), the consolidated statement of changes in equity and the consolidated statement of cash flows dealt with by this Report are in agreement with the relevant books of account maintained for the purpose of preparation of the consolidated financial statements.
d) In our opinion, the aforesaid consolidated financial statements comply with the Ind AS specified under section 133 of the Act.
e) On the basis of the written representations received from the directors of the Holding Company as on 31 March 2021 taken on record by the Board of Directors of the Holding Company and the reports of the statutory auditors of its subsidiary companies incorporated in India, none of the directors of the Group companies incorporated in India is disqualified as on 31 March 2021 from being appointed as a director in terms of Section 164(2) of the Act.
f) With respect to the adequacy of the internal financial controls with reference to financial statements of the Holding Company, its subsidiary companies incorporated in India and the operating effectiveness of such controls, refer to our separate Report in “Annexure A”.
B. With respect to the other matters to be included in the Auditor’s Report in accordance with Rule 11 of the Companies (Audit and Auditor’s) Rules, 2014, in our opinion and to the best of our information and according to the explanations given to us and based on the consideration of the reports of the other auditors on separate financial statements of the subsidiaries as noted in the ‘Other Matters’ paragraph:
i. The consolidated financial statements disclose the impact of pending litigations as at 31 March 2021 on the consolidated financial position of the Group. Refer Note 43 to the consolidated financial statements.
ANNUAL REPORT 2020-21 : INDEPENDENT AUDITOR’S REPORT
Independent Auditors’ Report

119
ii. The Group did not have any material foreseeable losses on long-term contracts including derivative contracts during the year ended 31 March 2021.
iii. There are no amounts which are required to be transferred to the Investor Education and Protection Fund by the Holding Company or its subsidiary companies, associate companies and joint ventures and joint operations incorporated in India during the year ended 31 March 2021.
iv. The disclosures in the consolidated financial statements regarding holdings as well as dealings in specified bank notes during the period from 8 November 2016 to 30 December 2016 have not been made in the financial statements since they do not pertain to the financial year ended 31 March 2021.
C. With respect to the matter to be included in the Auditor’s report under section 197(16):
In our opinion and according to the information and explanations given to us and based on the reports of the statutory auditors of such subsidiary companies, associate companies and joint ventures and joint operations incorporated in India which were not audited by us, the remuneration paid during the current year by the Holding Company, its subsidiary companies, associate companies and joint ventures and joint operations to its directors is in accordance with the provisions of Section 197 of the Act. The remuneration paid to any director by the Holding Company, its subsidiary companies, associate companies and joint ventures and joint operations is not in excess of the limit laid down under Section 197 of the Act. The Ministry of Corporate Affairs has not prescribed other details under Section 197(16) which are required to be commented upon by us.
For B S R & Co. LLP Chartered Accountants Firm’s Registration No. 101248W/W-100022 Abhishek PartnerPlace: Pune Membership No. 062343Date: 28 May 2021 UDIN: 21062343AAAABM1506
Annexure A to the Independent Auditors’ report on the consolidated financial statements of Emcure Pharmaceuticals Limited for the period ended 31 March 2021
Report on the internal financial controls with reference to the aforesaid consoli-dated financial statements under Clause (i) of Sub-section 3 of Section 143 of the Companies Act, 2013
(Referred to in paragraph (A) (f) under ‘Report on Other Legal and Regulatory Requirements’ section of our report of even date)
Opinion
In conjunction with our audit of the consolidated financial statements of the Company as of and for the year ended 31 March 2021, we have audited the internal financial controls with reference to consolidated financial statements of Emcure Pharmaceuticals Limited (hereinafter referred to as “the Holding Company”) and such companies incorporated in India under the Companies Act, 2013 which are its subsidiary companies to which such reporting requirement is applicable, as of that date.
In our opinion, the Holding Company and such companies incorporated in India which are its subsidiary companies to which such reporting requirement is applicable,
have, in all material respects, adequate internal financial controls with reference to consolidated financial statements and such internal financial controls were operating effectively as at 31 March 2021, based on the internal financial controls with reference to consolidated financial statements criteria established by such companies considering the essential components of such internal controls stated in the Guidance Note on Audit of Internal Financial Controls Over Financial Reporting issued by the Institute of Chartered Accountants of India (the “Guidance Note”).
Management’s Responsibility for Internal Financial Controls
The respective Company’s management and the Board of Directors are responsible for establishing and maintaining internal financial controls with reference to consolidated financial statements based on the criteria established by the respective Company considering the essential components of internal control stated in the Guidance Note. These responsibilities include the design, implementation and maintenance of adequate internal financial controls that were operating effectively for ensuring the orderly and efficient conduct of its business, including adherence to the respective company’s policies, the safeguarding of its assets, the prevention and detection of frauds and errors, the accuracy and completeness of the accounting records, and the timely preparation of reliable financial information, as required under the Companies Act, 2013 (hereinafter referred to as “the Act”).
Auditors’ Responsibility
Our responsibility is to express an opinion on the internal financial controls with reference to consolidated financial statements based on our audit. We conducted our audit in accordance with the Guidance Note and the Standards on Auditing, prescribed under section 143(10) of the Act, to the extent applicable to an audit of internal financial controls with reference to consolidated financial statements. Those Standards and the Guidance Note require that we comply with ethical requirements and plan and perform the audit to obtain reasonable assurance about whether adequate internal financial controls with reference to consolidated financial statements were established and maintained and if such controls operated effectively in all material respects.
Our audit involves performing procedures to obtain audit evidence about the adequacy of the internal financial controls with reference to consolidated financial statements and their operating effectiveness. Our audit of internal financial controls with reference to consolidated financial statements included obtaining an understanding of internal financial controls with reference to consolidated financial statements, assessing the risk that a material weakness exists, and testing and evaluating the design and operating effectiveness of the internal controls based on the assessed risk. The procedures selected depend on the auditor’s judgement, including the assessment of the risks of material misstatement of the consolidated financial statements, whether due to fraud or error.
We believe that the audit evidence we have obtained with regards to the Holding Company and Subsidiary companies which are incorporated in India to which such reporting requirement is applicable, is sufficient and appropriate to provide a basis for our audit opinion on internal financial controls with reference to consolidated financial statements.
Meaning of Internal Financial controls with Reference to Consolidated Financial Statements
A company’s internal financial controls with reference to consolidated financial statements is a process designed to provide reasonable assurance regarding the reliability of financial reporting and the preparation of financial statements for external purposes in accordance with generally accepted accounting principles. A company’s internal financial controls with reference to consolidated financial statements includes those policies and procedures that (1) pertain to the maintenance of records that, in reasonable detail, accurately and fairly reflect the transactions and dispositions of the assets of the company; (2) provide reasonable assurance that transactions are recorded as necessary to permit preparation of financial statements in accordance with generally accepted accounting principles, and that receipts and expenditures of the company are being made only in accordance with authorisations of management and directors of the company; and (3) provide reasonable assurance regarding prevention or timely detection of unauthorised acquisition, use, or disposition of the company’s assets that could have a material effect on the financial statements.
ANNUAL REPORT 2020-21 : INDEPENDENT AUDITOR’S REPORT
Independent Auditors’ Report

120
Inherent Limitations of Internal Financial controls with Reference to consolidated Financial Statements
Because of the inherent limitations of internal financial controls with reference to consolidated financial statements, including the possibility of collusion or improper management override of controls, material misstatements due to error or fraud may occur and not be detected. Also, projections of any evaluation of the internal financial controls with reference to consolidated financial statements to future periods are subject to the risk that the internal financial controls with reference to consolidated financial statements may become inadequate because of changes in conditions, or that the degree of compliance with the policies or procedures may deteriorate.
For B S R & Co. LLP Chartered Accountants Firm’s Registration No. 101248W/W-100022 Abhishek PartnerPlace: Pune Membership No. 062343Date: 28 May 2021 UDIN: 21062343AAAABM1506
ANNUAL REPORT 2020-21 : INDEPENDENT AUDITOR’S REPORT
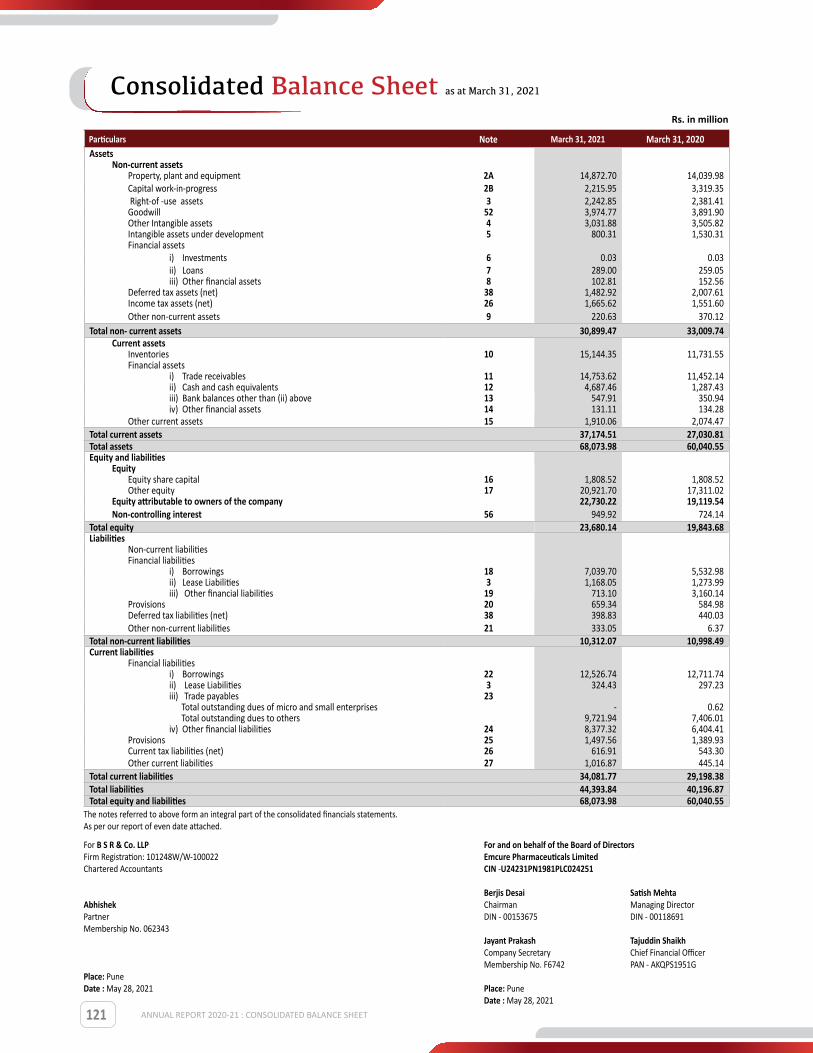
121
Particulars Note March 31, 2021 March 31, 2020Assets
Non-current assetsProperty, plant and equipment 2A 14,872.70 14,039.98 Capital work-in-progress 2B 2,215.95 3,319.35 Right-of -use assets 3 2,242.85 2,381.41 Goodwill 52 3,974.77 3,891.90 Other Intangible assets 4 3,031.88 3,505.82 Intangible assets under development 5 800.31 1,530.31 Financial assets
i) Investments 6 0.03 0.03 ii) Loans 7 289.00 259.05 iii) Other financial assets 8 102.81 152.56
Deferred tax assets (net) 38 1,482.92 2,007.61 Income tax assets (net) 26 1,665.62 1,551.60 Other non-current assets 9 220.63 370.12
Total non- current assets 30,899.47 33,009.74 Current assets
Inventories 10 15,144.35 11,731.55 Financial assets
i) Trade receivables 11 14,753.62 11,452.14 ii) Cash and cash equivalents 12 4,687.46 1,287.43 iii) Bank balances other than (ii) above 13 547.91 350.94 iv) Other financial assets 14 131.11 134.28
Other current assets 15 1,910.06 2,074.47 Total current assets 37,174.51 27,030.81 Total assets 68,073.98 60,040.55 Equity and liabilities
EquityEquity share capital 16 1,808.52 1,808.52 Other equity 17 20,921.70 17,311.02
Equity attributable to owners of the company 22,730.22 19,119.54 Non-controlling interest 56 949.92 724.14
Total equity 23,680.14 19,843.68 Liabilities
Non-current liabilitiesFinancial liabilities
i) Borrowings 18 7,039.70 5,532.98 ii) Lease Liabilities 3 1,168.05 1,273.99 iii) Other financial liabilities 19 713.10 3,160.14
Provisions 20 659.34 584.98 Deferred tax liabilities (net) 38 398.83 440.03 Other non-current liabilities 21 333.05 6.37
Total non-current liabilities 10,312.07 10,998.49 Current liabilities
Financial liabilitiesi) Borrowings 22 12,526.74 12,711.74 ii) Lease Liabilities 3 324.43 297.23 iii) Trade payables 23 Total outstanding dues of micro and small enterprises - 0.62 Total outstanding dues to others 9,721.94 7,406.01 iv) Other financial liabilities 24 8,377.32 6,404.41
Provisions 25 1,497.56 1,389.93 Current tax liabilities (net) 26 616.91 543.30 Other current liabilities 27 1,016.87 445.14
Total current liabilities 34,081.77 29,198.38 Total liabilities 44,393.84 40,196.87 Total equity and liabilities 68,073.98 60,040.55
The notes referred to above form an integral part of the consolidated financials statements.As per our report of even date attached.
For B S R & Co. LLP For and on behalf of the Board of DirectorsFirm Registration: 101248W/W-100022 Emcure Pharmaceuticals LimitedChartered Accountants CIN -U24231PN1981PLC024251 Berjis Desai Satish Mehta Abhishek Chairman Managing DirectorPartner DIN - 00153675 DIN - 00118691 Membership No. 062343 Jayant Prakash Tajuddin Shaikh Company Secretary Chief Financial Officer Membership No. F6742 PAN - AKQPS1951GPlace: Pune Date : May 28, 2021 Place: Pune Date : May 28, 2021
Rs. in million
ANNUAL REPORT 2020-21 : CONSOLIDATED BALANCE SHEET
Consolidated Balance Sheet as at March 31, 2021

122
Rs. in million
Particulars Note March 31, 2021 March 31, 2020Revenue:
Revenue from operations 28 60,564.15 50,485.54 Other income 29 353.91 823.06
Total income 60,918.06 51,308.60 Expenses:
Cost of materials consumed 30 14,366.31 9,002.22 Purchases of stock-in-trade 13,375.88 11,273.59 Changes in inventories of finished goods, work-in-progress and stock-in-trade 31 (2,526.26) 19.10 Employee benefit expenses 32 11,021.25 11,056.20 Depreciation and amortisation expense 34 3,233.10 3,208.34 Finance cost 35 1,981.32 2,565.97 Other expenses 33 12,007.25 12,095.04
Total expenses 53,458.85 49,220.46 Profit before exceptional items and tax 7,459.21 2,088.14
Exceptional items 36 885.94 1,034.79 Profit before tax 6,573.27 1,053.35 Tax expenses
Current tax 37 2,008.92 316.55 Deferred tax 37 378.41 (269.30)
Profit for the year 4,185.94 1,006.10 Other comprehensive income
Items that will not be reclassified to profit or lossRemeasurement of post-employment benefit obligations 49 18.00 (70.37)Tax on post-employment benefit obligations 37 (6.23) 24.28 Items that will be reclassified subsequently to profit or lossExchange differences in translating financials statement of foreign operations 17 (11.93) 384.48
(0.16) 338.39 Total comprehensive income for the year 4,185.78 1,344.49 Profit attributable to:
Owners of the company 3,921.47 836.07 Non-controlling interests (refer note under statement of changes in equity) 56 264.47 170.03
Other comprehensive income attributable to:Owners of the company (2.42) 343.32 Non-controlling interests 56 2.26 (4.93)
Total comprehensive income attributable to:Owners of the company 3,919.05 1,179.39 Non-controlling interests 56 266.73 165.10
Earnings per share:Basic 46 21.68 4.62 Diluted 21.68 4.62 [Face value per share: Rs.10 (Previous year: Rs.10)]
The notes referred to above form an integral part of the consolidated financials statements.As per our report of even date attached.
For B S R & Co. LLP For and on behalf of the Board of DirectorsFirm Registration: 101248W/W-100022 Emcure Pharmaceuticals LimitedChartered Accountants CIN -U24231PN1981PLC024251 Berjis Desai Satish Mehta Abhishek Chairman Managing DirectorPartner DIN - 00153675 DIN - 00118691 Membership No. 062343 Jayant Prakash Tajuddin Shaikh Company Secretary Chief Financial Officer Membership No. F6742 PAN - AKQPS1951GPlace: Pune Date : May 28, 2021 Place: Pune Date : May 28, 2021
ANNUAL REPORT 2020-21 : CONSOLIDATED STATEMENT OF PROFIT AND LOSS
Consolidated Statement of Profit & Loss for the year ended March 31, 2021

123
Equity share capital Note Rs. in million
As at April 1, 2019 1,808.52
Changes in equity share capital 16 -
As at March 31, 2020 1,808.52
Changes in equity share capital 16 -
As at March 31, 2021 1,808.52
Rs. in million
Other equity Note
Other equity attributable to the owners of the company
Non controlling
interestTotalCapital
reserveSecurities premium
Share options
outstand-ing account
General reserve
Retained earning
Foreign currency
translation reserve
Total
As at April 1, 2019 12.92 840.37 152.61 1,709.11 13,439.69 387.62 16,542.32 652.85 17,195.17
Total comprehensive income for the year ended 31 March 2020
Profit for the year - - - - 836.07 - 836.07 170.03 1,006.10
Items of other com-prehensive income recognised directly in retained earnings attributable to the owners
17 - - - - (41.16) - (41.16) (4.93) (46.09)
Exchange differences in translating finan-cials statement of foreign operations
17 - - - - - 384.48 384.48 - 384.48
- - - - 794.91 384.48 1,179.39 165.10 1,344.49
Transactions with owners, recorded directly in equity
Interim dividend on equity Shares
17 - - - - (287.24) - (287.24) (40.95) (328.19)
Dividend distribution tax on above
17 - - - - (55.76) - (55.76) (8.42) (64.18)
Final dividend on equity shares
17 - - - - (164.89) - (164.89) (36.86) (201.75)
Dividend distribution tax on above
17 - - - - (37.17) - (37.17) (7.58) (44.75)
- - - - (545.06) - (545.06) (93.81) (638.87)
Others
Employee share based expense
50 - - 144.19 - - - 144.19 - 144.19
Options forfeited 17 - - (28.10) 28.10 - - - - -
Income tax on above 17 - - - (9.82) - - (9.82) - (9.82)
- - 116.09 18.28 - - 134.37 - 134.37
As at March 31, 2020 12.92 840.37 268.70 1,727.39 13,689.54 772.10 17,311.02 724.14 18,035.16
ANNUAL REPORT 2020-21 : CONSOLIDATED STATEMENT OF CHANGES IN EQUITY
Consolidated Statement of Changes in Equityfor the year ended March 31, 2021

124
Other equity Note
Other equity attributable to the owners of the company
Non controlling
interestTotalCapital
reserveSecurities premium
Share options
outstand-ing account
General reserve
Retained earning
Foreign currency
translation reserve
Total
Total comprehensive income for the year ended 31 March 2021
Profit for the year - - - - 3,921.47 - 3,921.47 264.47 4,185.94
Items of other com-prehensive income recognised directly in retained earnings attributable to the owners
17 - - - - 9.51 - 9.51 2.26 11.77
Exchange differences in translating finan-cials statement of foreign operations
17 - - - - - (11.93) (11.93) - (11.93)
- - - - 3,930.98 (11.93) 3,919.05 266.73 4,185.78
Transactions with owners, recorded directly in equity
Final dividend on equity Shares
17 - - - - (180.85) - (180.85) (40.95) (221.80)
- - - - (180.85) - (180.85) (40.95) (221.80)
Others
Employee share based expense
50 - - 63.48 - - - 63.48 - 63.48
Options settled in cash during the year
- - (182.12) - - - (182.12) - (182.12)
Options forfeited 17 - - (32.84) 32.84 - - - - -
Income tax on above 17 - - - (8.88) - - (8.88) - (8.88)
- - (151.48) 23.96 - - (127.52) - (127.52)
As at March 31, 2021 12.92 840.37 117.22 1,751.35 17,439.67 760.17 20,921.70 949.92 21,871.62
Note :1. The notes referred to above form an integral part of the consolidated financials statements. 2. For description of nature and purpose of Reserves refer note 17.
As per our report of even date attached.
For B S R & Co. LLP For and on behalf of the Board of DirectorsFirm Registration: 101248W/W-100022 Emcure Pharmaceuticals LimitedChartered Accountants CIN -U24231PN1981PLC024251 Berjis Desai Satish Mehta Abhishek Chairman Managing DirectorPartner DIN - 00153675 DIN - 00118691 Membership No. 062343 Jayant Prakash Tajuddin Shaikh Company Secretary Chief Financial Officer Membership No. F6742 PAN - AKQPS1951GPlace: Pune Date : May 28, 2021 Place: Pune Date : May 28, 2021
ANNUAL REPORT 2020-21 : CONSOLIDATED STATEMENT OF CHANGES IN EQUITY
Consolidated Statement of Changes in Equityfor the year ended March 31, 2021
Rs. in million
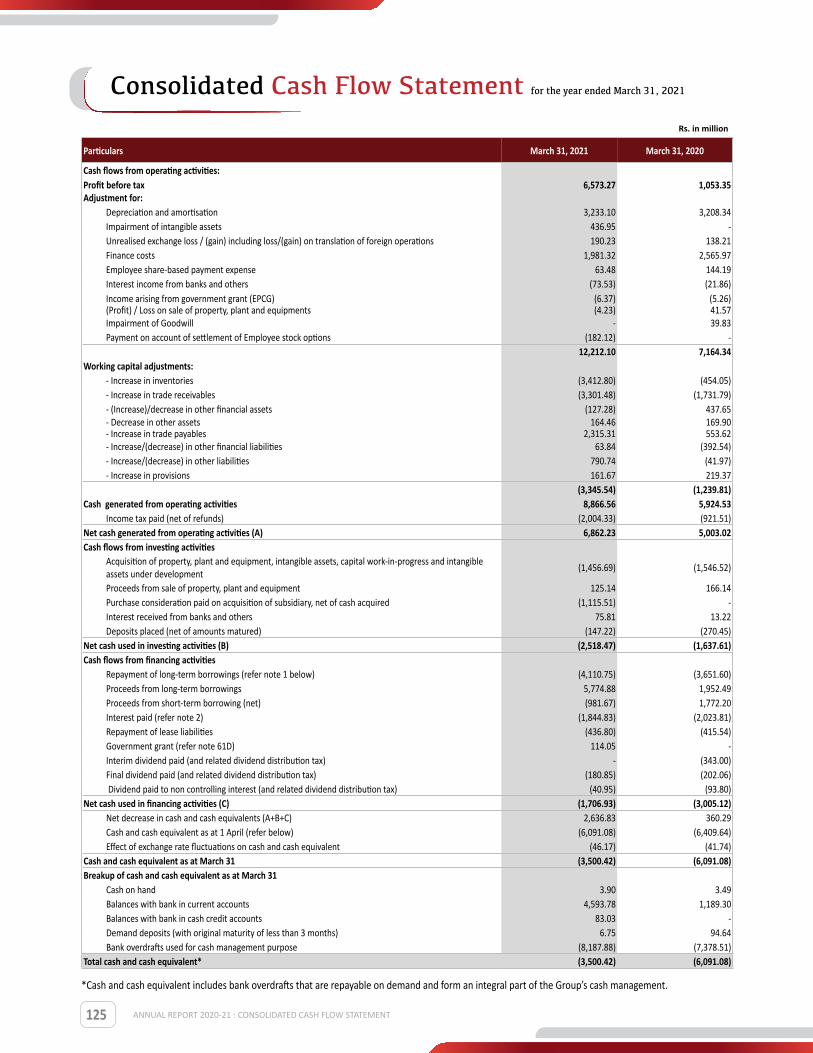
125
Particulars March 31, 2021 March 31, 2020
Cash flows from operating activities:Profit before tax 6,573.27 1,053.35 Adjustment for:
Depreciation and amortisation 3,233.10 3,208.34 Impairment of intangible assets 436.95 - Unrealised exchange loss / (gain) including loss/(gain) on translation of foreign operations 190.23 138.21 Finance costs 1,981.32 2,565.97 Employee share-based payment expense 63.48 144.19 Interest income from banks and others (73.53) (21.86)Income arising from government grant (EPCG) (6.37) (5.26)(Profit) / Loss on sale of property, plant and equipments (4.23) 41.57 Impairment of Goodwill - 39.83 Payment on account of settlement of Employee stock options (182.12) -
12,212.10 7,164.34 Working capital adjustments:
- Increase in inventories (3,412.80) (454.05)- Increase in trade receivables (3,301.48) (1,731.79)- (Increase)/decrease in other financial assets (127.28) 437.65 - Decrease in other assets 164.46 169.90 - Increase in trade payables 2,315.31 553.62 - Increase/(decrease) in other financial liabilities 63.84 (392.54)- Increase/(decrease) in other liabilities 790.74 (41.97)- Increase in provisions 161.67 219.37
(3,345.54) (1,239.81)Cash generated from operating activities 8,866.56 5,924.53
Income tax paid (net of refunds) (2,004.33) (921.51)Net cash generated from operating activities (A) 6,862.23 5,003.02 Cash flows from investing activities
Acquisition of property, plant and equipment, intangible assets, capital work-in-progress and intangible assets under development
(1,456.69) (1,546.52)
Proceeds from sale of property, plant and equipment 125.14 166.14 Purchase consideration paid on acquisition of subsidiary, net of cash acquired (1,115.51) - Interest received from banks and others 75.81 13.22 Deposits placed (net of amounts matured) (147.22) (270.45)
Net cash used in investing activities (B) (2,518.47) (1,637.61)Cash flows from financing activities
Repayment of long-term borrowings (refer note 1 below) (4,110.75) (3,651.60)Proceeds from long-term borrowings 5,774.88 1,952.49 Proceeds from short-term borrowing (net) (981.67) 1,772.20 Interest paid (refer note 2) (1,844.83) (2,023.81)Repayment of lease liabilities (436.80) (415.54)Government grant (refer note 61D) 114.05 - Interim dividend paid (and related dividend distribution tax) - (343.00)Final dividend paid (and related dividend distribution tax) (180.85) (202.06) Dividend paid to non controlling interest (and related dividend distribution tax) (40.95) (93.80)
Net cash used in financing activities (C) (1,706.93) (3,005.12)Net decrease in cash and cash equivalents (A+B+C) 2,636.83 360.29 Cash and cash equivalent as at 1 April (refer below) (6,091.08) (6,409.64)Effect of exchange rate fluctuations on cash and cash equivalent (46.17) (41.74)
Cash and cash equivalent as at March 31 (3,500.42) (6,091.08)Breakup of cash and cash equivalent as at March 31
Cash on hand 3.90 3.49 Balances with bank in current accounts 4,593.78 1,189.30 Balances with bank in cash credit accounts 83.03 - Demand deposits (with original maturity of less than 3 months) 6.75 94.64 Bank overdrafts used for cash management purpose (8,187.88) (7,378.51)
Total cash and cash equivalent* (3,500.42) (6,091.08)
*Cash and cash equivalent includes bank overdrafts that are repayable on demand and form an integral part of the Group’s cash management.
Rs. in million
ANNUAL REPORT 2020-21 : CONSOLIDATED CASH FLOW STATEMENT
Consolidated Cash Flow Statement for the year ended March 31, 2021

126
Rs. in million
Changes in liabilities arising from financing activities March 31, 2021 March 31, 2020
Long term borrowings:
Opening balance 9,107.18 10,607.04
Amount borrowed during the year 5,774.88 1,952.49
Amount repaid during the year (4,110.75) (3,651.60)
Others (includes foreign exchange differences on translation of subsidiaries, transaction cost, etc.) 15.34 199.25
Closing balance (refer note 18) 10,786.64 9,107.18
Finance cost:
Opening balance 113.37 44.70
Finance cost incurred during the year 1,981.32 2,565.97
Amount paid during the year (1,844.83) (2,023.81)
Interest accrued on lease liability (119.27) (122.12)
Others (includes foreign exchange differences on translation of subsidiaries, transaction cost, etc.) (25.31) (351.37)
Closing balance (refer note 24) 105.28 113.37
Notes to the cash flow statement:
1. This includes prepayment of term loan & vehicle loan amounting to Rs. 1,711.23 million (March 31, 2020: Rs. 405.95 million).
2. Includes interest expense of Rs. 124.91 million (March 31, 2020 Rs. 18.23 million) which have been capitalised in accordance with Ind AS 23, Borrowing Costs.
The notes referred to above form an integral part of the consolidated financials statements.
As per our report of even date attached.
For B S R & Co. LLP For and on behalf of the Board of DirectorsFirm Registration: 101248W/W-100022 Emcure Pharmaceuticals LimitedChartered Accountants CIN -U24231PN1981PLC024251 Berjis Desai Satish Mehta Abhishek Chairman Managing DirectorPartner DIN - 00153675 DIN - 00118691 Membership No. 062343 Jayant Prakash Tajuddin Shaikh Company Secretary Chief Financial Officer Membership No. F6742 PAN - AKQPS1951GPlace: Pune Date : May 28, 2021 Place: Pune Date : May 28, 2021
ANNUAL REPORT 2020-21 : CONSOLIDATED CASH FLOW STATEMENT
Consolidated Cash Flow Statement for the year ended March 31, 2021

127
* Avet Lifesciences Ltd. was incorporated on August 26,2020 .
** Emcure Pharma Chile SpA was incorporated on October 2, 2020.
*** Lazor Pharmaceuticals Limited was incorporated on February 4, 2021.
**** Effective holding % of the Company through its subsidiaries.
***** The Group has invested in Tillomed Laboratories BV., A direct subsidiary of Emcure UK., on April 24,2019
# Tillomed Holdings Ltd UK has been dissolved on April 16, 2019.
1B. Basis of preparation
a) Basis of preparation
i. Statement of compliance
The consolidated financial statements have been prepared in accordance with Indian Accounting Standards (Ind AS) as per the Companies (Indian Accounting Standards) Rules, 2015 notified under Section 133 of Companies Act, 2013, (the ‘Act’) and other relevant provisions of the Act.
The consolidated financial statements are authorised for issue by the Holding company’s Board of Directors on May 28, 2021.
Details of the Group’s accounting policies are included in Note 1C.
b) Functional and presentation currency
The consolidated financial statements are presented in Indian Rupees
1A. General information:
Emcure Pharmaceuticals Limited, the parent company (“the Holding company”) is a public limited company incorporated and domiciled in India. The Holding company is engaged in developing, manufacturing and marketing a broad range of pharmaceutical products globally. The Holding company’s core strength lies in developing and manufacturing differentiated pharmaceutical products in-house, which are commercialised through its marketing infrastructure across geographies and business relationships with multi-national pharmaceutical companies.
The consolidated financial statements comprise the financial statements of the Holding Company and the following subsidiaries/ step down subsidiaries (together referred to as “Group”).
Name of subsidiaries Percentage of Holding (%) Country of incorporation
Direct subsidiaries
Gennova Biopharmaceuticals Limited 87.95% India
Zuventus Healthcare Limited 79.58% India
Emcure Nigeria Limited 100% Nigeria
Emcure Pharmaceuticals Mena FZ LLC. 100% UAE
Emcure Pharmaceuticals South Africa (Pty) Limited 100% South Africa
Emcure Brasil Farmaceutica Ltda 100% Brazil
Heritage Pharma Holdings Inc. (doing business as Avet Pharmaceuticals Holdings Inc.) 100% USA
Emcure Pharma UK Ltd 100% United Kingdom
Emcure Pharma Peru S.A.C. 100% Peru
Emcure Pharma Mexico S.A. DE C.V. 100% Mexico
Emcure Pharmaceuticals Pty Ltd 100% Australia
Marcan Pharmaceuticals Inc. 100% Canada
Avet Lifesciences Limited * 100% India
Emcure Pharma Chile SpA ** 100% Chile
Lazor Pharmaceuticals Limited *** 100% Kenya
Step down subsidiaries ****
Heritage Pharma Labs Inc.(doing business as Avet Pharmaceuticals Labs Inc ) 100% USA
Heritage Pharmaceuticals Inc.(doing business as Avet Pharmaceuticals Inc.) 100% USA
Tillomed Laboratories Ltd 100% United Kingdom
Tillomed Holdings Limited # 100% United Kingdom
Tillomed Pharma GmbH 100% Germany
Laboratories Tillomed Spain S.L.U. 100% Spain
Tillomed Italia S.R.L. 100% Italy
Emcure NZ Limited 100% New Zealand
Tillomed France SAS 100% France
Hacco Pharma Inc. 100% USA
Tillomed Laboratories BV ***** 100% Netherlands
ANNUAL REPORT 2020-21 : NOTES TO THE CONSOLIDATED FINANCIAL STATEMENTS
Notes to the Consolidated Financial Statementfor the year ended March 31, 2021

128
(Rs.), which is also the Holding company’s functional currency. All the amounts disclosed in the consolidated financial statements and notes have been rounded off to the nearest million, unless otherwise indicated.
c) Basis of Measurement
The consolidated financial statements are prepared under the historical cost convention except for the following items:
Items Measurement Basis
Certain Financial assets and liabilities Fair value
Liabilities for equity settled share based payment arrangements
Fair value
Contingent consideration in business combination
Fair value
Net defined benefit (asset) / liability Fair value of plan assets less present value of defined benefit obligations
d) Use of estimates and judgements
In preparing these consolidated financial statements, management has made judgements, estimates and assumptions that affect the application of accounting policies and the reported amounts of assets, liabilities, income and expenses. Actual results may differ from these estimates.
Estimates and underlying assumptions are reviewed on an ongoing basis. Revisions to accounting estimates are recognised prospectively.
Assumptions and estimation uncertainties
Information about assumptions and estimations uncertainties that have a significant risk resulting in a material adjustment in the year ending 31 March 2021 is included in following notes:
Note 1C. d) Useful lives of property, plant, equipment and intangibles;
Note 1C. d) Useful lives of intangible assets;
Note 1C. a) Valuation of assets acquired as a part of business combination and contingent consideration;
Note 25(i) - recognition and measurement of provisions and contingencies : key assumptions about the likelihood and magnitude of an outflow of resources;
Note 52- Impairment assessment for goodwill
Note 10. Valuation of inventories
Note 38 - recognition of deferred tax assets: availability of future taxable profit against which tax credit can be used;
Note 1C (i) - Sales return, rebates and chargebacks;
Note 49 - measurement of defined benefit obligations: key actuarial assumptions.
Note 3 - measurement of discount rate for initial recognition of ROU and Lease Liability as per IND AS 116
e) Measurement of fair values
A number of the Group’s accounting policies and disclosures require the measurement of fair values, for both financial and non-financial assets and liabilities.
The Group has an established control framework with respect to the measurement of fair values. This includes a team that has overall responsibility for overseeing all significant fair value measurements, including Level 3 fair values, and reports directly to the Head of Treasury.
The team regularly reviews significant unobservable inputs and valuation adjustments. If third party information, such as broker quotes or pricing services, is used to measure fair values, then the team assesses the evidence obtained from the third parties to support the conclusion that these valuations meet the requirements of Ind AS, including the level in
the fair value hierarchy in which the valuations should be classified. Fair values are categorised into different levels in a fair value hierarchy based on the inputs used in the valuation techniques as follows.
- Level 1: quoted prices (unadjusted) in active markets for identical assets or liabilities.
- Level 2: inputs other than quoted prices included in Level 1 that are observable for the asset or liability, either directly (i.e. as prices) or indirectly (i.e. derived from prices).
- Level 3: inputs for the asset or liability that are not based on observable market data (unobservable inputs).
When measuring the fair value of an asset or a liability, the Group uses observable market data as far as possible. If the inputs used to measure the fair value of an asset or a liability fall into different levels of the fair value hierarchy, then the fair value measurement is categorised in its entirety in the same level of the fair value hierarchy as the lowest level input that is significant to the entire measurement.
The Group recognises transfers between levels of the fair value hierarchy at the end of the reporting period during which the change has occurred.
Further information about the assumptions made in measuring fair values is included in the following notes:
- Note 42 – fair value measurement;
- Note 50 – employee stock options plan.
f) Current versus non current classification:
All assets and liabilities have been classified as current or non-current as per the Group’s normal operating cycle and other criteria set out in the Schedule III to the Companies Act, 2013. Based on the nature of products and the time between the acquisition of assets for processing and their realisation in cash and cash equivalents, the Group has ascertained its operating cycle as 12 months for the purpose of current – non current classification of assets and liabilities.
All assets and liabilities are classified into current and non-current.
Assets
An asset is classified as current when it satisfies any of the following criteria:
- it is expected to be realized in, or is intended for sale or consumption in, the Group’s normal operating cycle;
- it is held for the purpose of being traded;
- it is expected to be realized within 12 months after the reporting date; or
- it is cash or cash equivalent unless it is restricted from being exchanged or used to settle a liability for at least 12 months after the reporting date.
Current assets include the current portion of non-current assets / non-current financial assets. All other assets are classified as non-current.
Liabilities
A liability is classified as current when it satisfies any of the following criteria:
- it is expected to be settled in the Group’s normal operating cycle;
- it is held primarily for the purpose of being traded;
- it is expected to be settled within 12 months after the reporting date; or
- the Group does not have any unconditional right to defer settlement of the liability for at least 12 months after the reporting date.
ANNUAL REPORT 2020-21 : NOTES TO THE CONSOLIDATED FINANCIAL STATEMENTS
Notes to the Consolidated Financial Statementfor the year ended March 31, 2021
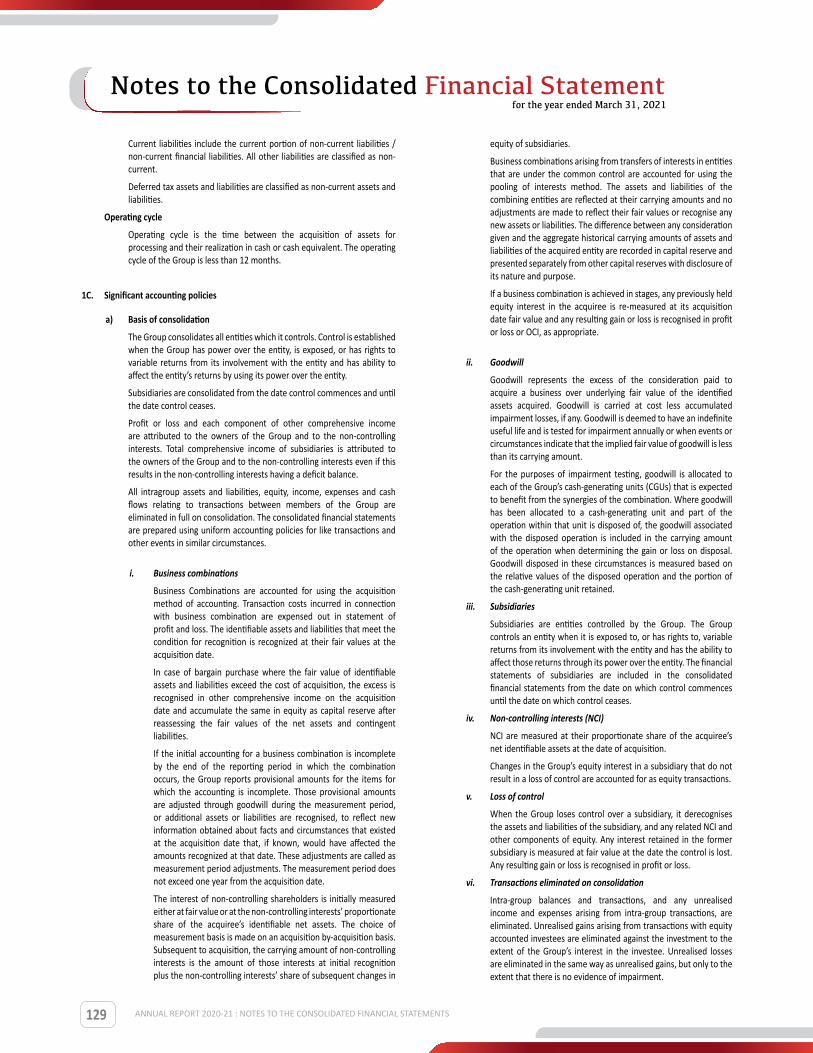
129
Current liabilities include the current portion of non-current liabilities / non-current financial liabilities. All other liabilities are classified as non-current.
Deferred tax assets and liabilities are classified as non-current assets and liabilities.
Operating cycle
Operating cycle is the time between the acquisition of assets for processing and their realization in cash or cash equivalent. The operating cycle of the Group is less than 12 months.
1C. Significant accounting policies
a) Basis of consolidation
The Group consolidates all entities which it controls. Control is established when the Group has power over the entity, is exposed, or has rights to variable returns from its involvement with the entity and has ability to affect the entity’s returns by using its power over the entity.
Subsidiaries are consolidated from the date control commences and until the date control ceases.
Profit or loss and each component of other comprehensive income are attributed to the owners of the Group and to the non-controlling interests. Total comprehensive income of subsidiaries is attributed to the owners of the Group and to the non-controlling interests even if this results in the non-controlling interests having a deficit balance.
All intragroup assets and liabilities, equity, income, expenses and cash flows relating to transactions between members of the Group are eliminated in full on consolidation. The consolidated financial statements are prepared using uniform accounting policies for like transactions and other events in similar circumstances.
i. Business combinations
Business Combinations are accounted for using the acquisition method of accounting. Transaction costs incurred in connection with business combination are expensed out in statement of profit and loss. The identifiable assets and liabilities that meet the condition for recognition is recognized at their fair values at the acquisition date.
In case of bargain purchase where the fair value of identifiable assets and liabilities exceed the cost of acquisition, the excess is recognised in other comprehensive income on the acquisition date and accumulate the same in equity as capital reserve after reassessing the fair values of the net assets and contingent liabilities.
If the initial accounting for a business combination is incomplete by the end of the reporting period in which the combination occurs, the Group reports provisional amounts for the items for which the accounting is incomplete. Those provisional amounts are adjusted through goodwill during the measurement period, or additional assets or liabilities are recognised, to reflect new information obtained about facts and circumstances that existed at the acquisition date that, if known, would have affected the amounts recognized at that date. These adjustments are called as measurement period adjustments. The measurement period does not exceed one year from the acquisition date.
The interest of non-controlling shareholders is initially measured either at fair value or at the non-controlling interests’ proportionate share of the acquiree’s identifiable net assets. The choice of measurement basis is made on an acquisition by-acquisition basis. Subsequent to acquisition, the carrying amount of non-controlling interests is the amount of those interests at initial recognition plus the non-controlling interests’ share of subsequent changes in
equity of subsidiaries.
Business combinations arising from transfers of interests in entities that are under the common control are accounted for using the pooling of interests method. The assets and liabilities of the combining entities are reflected at their carrying amounts and no adjustments are made to reflect their fair values or recognise any new assets or liabilities. The difference between any consideration given and the aggregate historical carrying amounts of assets and liabilities of the acquired entity are recorded in capital reserve and presented separately from other capital reserves with disclosure of its nature and purpose.
If a business combination is achieved in stages, any previously held equity interest in the acquiree is re-measured at its acquisition date fair value and any resulting gain or loss is recognised in profit or loss or OCI, as appropriate.
ii. Goodwill
Goodwill represents the excess of the consideration paid to acquire a business over underlying fair value of the identified assets acquired. Goodwill is carried at cost less accumulated impairment losses, if any. Goodwill is deemed to have an indefinite useful life and is tested for impairment annually or when events or circumstances indicate that the implied fair value of goodwill is less than its carrying amount.
For the purposes of impairment testing, goodwill is allocated to each of the Group’s cash-generating units (CGUs) that is expected to benefit from the synergies of the combination. Where goodwill has been allocated to a cash-generating unit and part of the operation within that unit is disposed of, the goodwill associated with the disposed operation is included in the carrying amount of the operation when determining the gain or loss on disposal. Goodwill disposed in these circumstances is measured based on the relative values of the disposed operation and the portion of the cash-generating unit retained.
iii. Subsidiaries
Subsidiaries are entities controlled by the Group. The Group controls an entity when it is exposed to, or has rights to, variable returns from its involvement with the entity and has the ability to affect those returns through its power over the entity. The financial statements of subsidiaries are included in the consolidated financial statements from the date on which control commences until the date on which control ceases.
iv. Non-controlling interests (NCI)
NCI are measured at their proportionate share of the acquiree’s net identifiable assets at the date of acquisition.
Changes in the Group’s equity interest in a subsidiary that do not result in a loss of control are accounted for as equity transactions.
v. Loss of control
When the Group loses control over a subsidiary, it derecognises the assets and liabilities of the subsidiary, and any related NCI and other components of equity. Any interest retained in the former subsidiary is measured at fair value at the date the control is lost. Any resulting gain or loss is recognised in profit or loss.
vi. Transactions eliminated on consolidation
Intra-group balances and transactions, and any unrealised income and expenses arising from intra-group transactions, are eliminated. Unrealised gains arising from transactions with equity accounted investees are eliminated against the investment to the extent of the Group’s interest in the investee. Unrealised losses are eliminated in the same way as unrealised gains, but only to the extent that there is no evidence of impairment.
ANNUAL REPORT 2020-21 : NOTES TO THE CONSOLIDATED FINANCIAL STATEMENTS
Notes to the Consolidated Financial Statementfor the year ended March 31, 2021
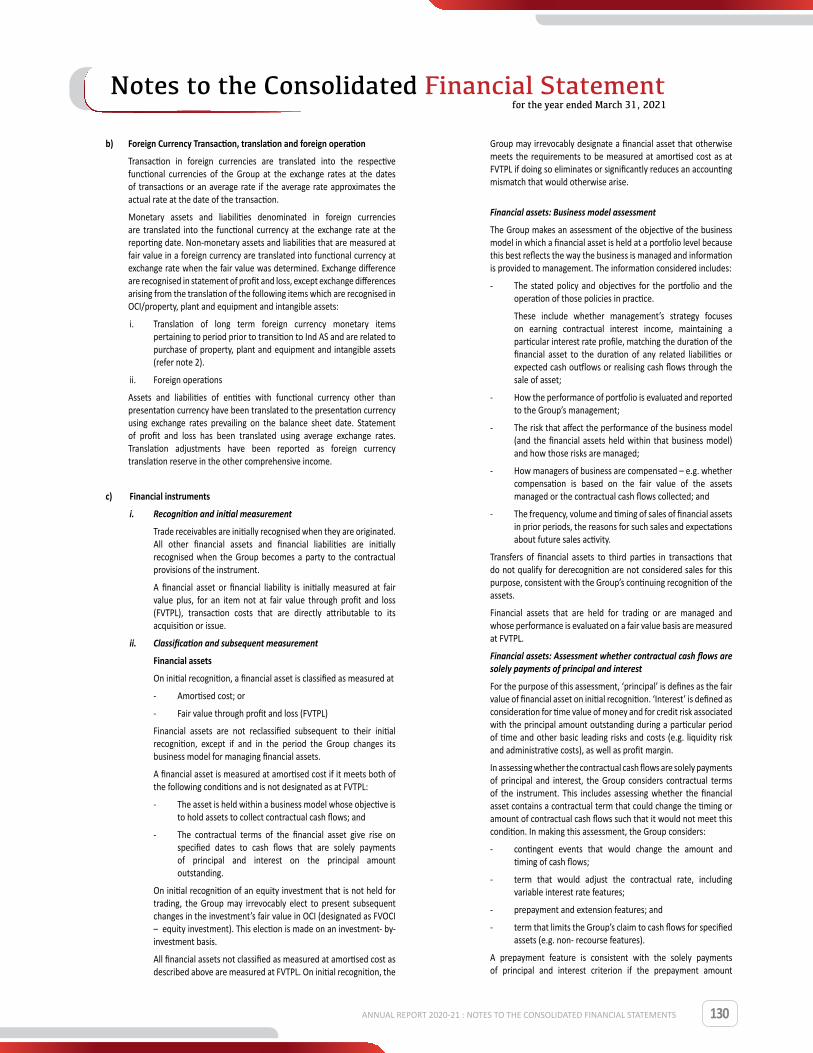
130
b) Foreign Currency Transaction, translation and foreign operation
Transaction in foreign currencies are translated into the respective functional currencies of the Group at the exchange rates at the dates of transactions or an average rate if the average rate approximates the actual rate at the date of the transaction.
Monetary assets and liabilities denominated in foreign currencies are translated into the functional currency at the exchange rate at the reporting date. Non-monetary assets and liabilities that are measured at fair value in a foreign currency are translated into functional currency at exchange rate when the fair value was determined. Exchange difference are recognised in statement of profit and loss, except exchange differences arising from the translation of the following items which are recognised in OCI/property, plant and equipment and intangible assets:
i. Translation of long term foreign currency monetary items pertaining to period prior to transition to Ind AS and are related to purchase of property, plant and equipment and intangible assets (refer note 2).
ii. Foreign operations
Assets and liabilities of entities with functional currency other than presentation currency have been translated to the presentation currency using exchange rates prevailing on the balance sheet date. Statement of profit and loss has been translated using average exchange rates. Translation adjustments have been reported as foreign currency translation reserve in the other comprehensive income.
c) Financial instruments
i. Recognition and initial measurement
Trade receivables are initially recognised when they are originated. All other financial assets and financial liabilities are initially recognised when the Group becomes a party to the contractual provisions of the instrument.
A financial asset or financial liability is initially measured at fair value plus, for an item not at fair value through profit and loss (FVTPL), transaction costs that are directly attributable to its acquisition or issue.
ii. Classification and subsequent measurement
Financial assets
On initial recognition, a financial asset is classified as measured at
- Amortised cost; or
- Fair value through profit and loss (FVTPL)
Financial assets are not reclassified subsequent to their initial recognition, except if and in the period the Group changes its business model for managing financial assets.
A financial asset is measured at amortised cost if it meets both of the following conditions and is not designated as at FVTPL:
- The asset is held within a business model whose objective is to hold assets to collect contractual cash flows; and
- The contractual terms of the financial asset give rise on specified dates to cash flows that are solely payments of principal and interest on the principal amount outstanding.
On initial recognition of an equity investment that is not held for trading, the Group may irrevocably elect to present subsequent changes in the investment’s fair value in OCI (designated as FVOCI – equity investment). This election is made on an investment- by- investment basis.
All financial assets not classified as measured at amortised cost as described above are measured at FVTPL. On initial recognition, the
Group may irrevocably designate a financial asset that otherwise meets the requirements to be measured at amortised cost as at FVTPL if doing so eliminates or significantly reduces an accounting mismatch that would otherwise arise.
Financial assets: Business model assessment
The Group makes an assessment of the objective of the business model in which a financial asset is held at a portfolio level because this best reflects the way the business is managed and information is provided to management. The information considered includes:
- The stated policy and objectives for the portfolio and the operation of those policies in practice.
These include whether management’s strategy focuses on earning contractual interest income, maintaining a particular interest rate profile, matching the duration of the financial asset to the duration of any related liabilities or expected cash outflows or realising cash flows through the sale of asset;
- How the performance of portfolio is evaluated and reported to the Group’s management;
- The risk that affect the performance of the business model (and the financial assets held within that business model) and how those risks are managed;
- How managers of business are compensated – e.g. whether compensation is based on the fair value of the assets managed or the contractual cash flows collected; and
- The frequency, volume and timing of sales of financial assets in prior periods, the reasons for such sales and expectations about future sales activity.
Transfers of financial assets to third parties in transactions that do not qualify for derecognition are not considered sales for this purpose, consistent with the Group’s continuing recognition of the assets.
Financial assets that are held for trading or are managed and whose performance is evaluated on a fair value basis are measured at FVTPL.
Financial assets: Assessment whether contractual cash flows are solely payments of principal and interest
For the purpose of this assessment, ‘principal’ is defines as the fair value of financial asset on initial recognition. ‘Interest’ is defined as consideration for time value of money and for credit risk associated with the principal amount outstanding during a particular period of time and other basic leading risks and costs (e.g. liquidity risk and administrative costs), as well as profit margin.
In assessing whether the contractual cash flows are solely payments of principal and interest, the Group considers contractual terms of the instrument. This includes assessing whether the financial asset contains a contractual term that could change the timing or amount of contractual cash flows such that it would not meet this condition. In making this assessment, the Group considers:
- contingent events that would change the amount and timing of cash flows;
- term that would adjust the contractual rate, including variable interest rate features;
- prepayment and extension features; and
- term that limits the Group’s claim to cash flows for specified assets (e.g. non- recourse features).
A prepayment feature is consistent with the solely payments of principal and interest criterion if the prepayment amount
ANNUAL REPORT 2020-21 : NOTES TO THE CONSOLIDATED FINANCIAL STATEMENTS
Notes to the Consolidated Financial Statementfor the year ended March 31, 2021

131
substantially represents unpaid amount of principal and interest on principal amount outstanding, which may include reasonable additional compensation for early termination of contract. Additionally, for a financial asset acquired on a significant premium or discount to its contractual par amount, a feature that permits or require prepayment at an amount that substantially represents the contractual par amount plus accrued (but unpaid) contractual interest (which may also include reasonable additional compensation for early termination) is treated as consistent with this criterion if the fair value of the prepayment feature is significant at initial recognition.
Financial assets: Subsequent measurement and gains and losses
Financial assets at FVTPL
These assets are subsequently measured at fair value. Net gains and losses, including any interest or dividend income, are recognised in profit or loss.
Financial assets at amortized cost
These assets are subsequently measured at amortized cost using the effective interest method. The amortised cost is reduced by impairment losses. Interest income, foreign exchange gains and losses and impairment are recognised in profit or loss. Any gain or loss on derecognition is recognised in profit or loss.
Financial liabilities: Classification, subsequent measurement and
gains and losses
Financial liabilities are classified as measured at amortised cost or FVTPL. A financial liability is classified as at FVTPL if it is classified as held for trading, or it is a derivative or it is designated as such on initial recognition. Financial liabilities at FVTPL are measured at fair value and net gains and losses, including any interest expense, are recognised in profit or loss. Other financial liabilities are subsequently measured at amortised cost using the effective interest method. Interest expense and foreign exchange gains and losses are recognised in profit or loss. Any gain or loss on derecognition is also recognised in profit or loss.
iii. Derecognition
Financial assets
The Group derecognises a financial asset when the contractual rights to the cash flows from the financial asset expire, or it transfers the rights to receive the contractual cash flows in a transaction in which substantially all of the risks and rewards of ownership of the financial asset are transferred or in which the Group neither transfers nor retains substantially all of the risks and rewards of ownership and does not retain control of the financial asset.
If the Group enters into transactions whereby it transfers assets recognised on its balance sheet, but retains either all or substantially all of the risks and rewards of the transferred assets, the transferred assets are not derecognised.
Financial liabilities
The Group derecognises a financial liability when its contractual obligations are discharged or cancelled, or expire.
The Group also derecognises a financial liability when its terms are modified and the cash flows under the modified terms are substantially different. In this case, a new financial liability based on the modified terms is recognised at fair value. The difference between the carrying amount of the financial liability extinguished and the new financial liability with modified terms is recognised in profit or loss.
iv. Offsetting
Financial assets and financial liabilities are offset and the net amount presented in the balance sheet when, and only when, the Group currently has a legally enforceable right to set off the amounts and it intends either to settle them on a net basis or to realise the asset and settle the liability simultaneously.
d) Property, plant and equipment
i. Recognition and measurement
Items of property, plant and equipment are measured at cost, which includes capitalised borrowing costs, less accumulated depreciation and accumulated impairment losses, if any.
Cost of an item of property, plant and equipment comprises its purchase price, including import duties and non-refundable purchase taxes, after deducting trade discounts and rebates, any directly attributable cost of bringing the item to its working condition for its intended use and estimate costs of dismantling and removing the item and restoring the site on which it is located.
If significant parts of an item of property, plant and equipment have different useful lives, then they are accounted for as separated items (major components) of property, plant and equipment.
Any gain or loss on disposal of an item of property, plant and equipment is recognised in statement of profit and loss.
ii. Subsequent expenditure
Subsequent expenditure is capitalised only if it is probable that the future economic benefit associated with the expenditure will flow to Group.
iii. Depreciation
Depreciation is calculated on cost of items of property, plant and equipment less their estimated residual values over their estimated useful lives using the straight line method, and is generally recognised in the statement of profit and loss. Freehold land is not depreciated.
Depreciation is provided on pro-rata basis using the straight-line method over the estimated useful lives of the assets prescribed under Schedule II to the Companies Act 2013 except for the following:
- Furniture and fixtures at leasehold premises are depreciated over the lease period.
- Vehicles are depreciated over 5 years, as per technical evaluation.
Depreciation method, useful lives and residual values are reviewed at each financial year-end and adjusted if appropriate. Based on technical evaluation and consequent advice, the management believes that its estimates of useful lives represents the period over which the management expects to use these assets.
Depreciation on additions (disposals) during the year is provided on a pro-rata basis i.e. from (upto) the date on which asset is ready for use (disposed of).
e) Intangible assets
- Intangible assets
i. Initial recognition:
Intangible assets acquired separately are measured at cost of acquisition. Intangible assets acquired under business combination are measured at fair value as of the date of business combination. Following initial recognition, intangible assets are carried at cost less accumulated amortization and impairment losses, if any.
ANNUAL REPORT 2020-21 : NOTES TO THE CONSOLIDATED FINANCIAL STATEMENTS
Notes to the Consolidated Financial Statementfor the year ended March 31, 2021

132
ii. Subsequent expenditure
Subsequent expenditure is capitalised only if it is probable that the future economic benefit associated with the expenditure will flow to Group.
Intangible assets are amortized over their respective estimated useful life using straight-line method. The estimated useful life of amortizable intangibles is reviewed at the end of each reporting period and change in estimates if any are accounted for on a prospective basis.
The estimated useful lives are as follows:
Intangible Asset Management estimated useful life
Product Development, Abbreviated New Drug Applications (ANDAs)
5 to 10 years
Customer relationships 5 years
Brands acquired 5 to 10 years
Software, License rights 2 to 10 years
Amortisation method, useful lives and residual values are reviewed at the end of each financial year and adjusted if appropriate.
- Intangible Assets under Development
Intangible assets under development are initially recognized at cost. Such intangible assets are subsequently capitalized only if it is probable that the future economic benefit associated with the expenditure will flow to the Group.
The Group irrespective of whether there is any indication of impairment, test an intangible asset not yet available for use for impairment annually by comparing its carrying amount with its recoverable amount. The recoverable amount is the higher of its value in use and its fair value less costs of disposal. Value in use is based on the estimated future cash flows, discounted to their present value using a pre-tax discount rate that reflects current market assessments of the time value of money and the risks specific to the asset. An impairment loss is recognised if the carrying amount of the intangible asset not yet available for use exceeds its estimated recoverable amount. Impairment losses are recognised in the statement of profit and loss.
f) Inventories
Inventories are measured at the lower of cost and net realisable value. The cost of inventories is based on weighted average formula, and includes expenditure incurred in acquiring the inventories, production or conversion cost and other cost incurred in bringing them to their present location and condition. In case of manufactured inventory and work-in-progress, cost includes an appropriate share of fixed production overheads based on normal operating capacity.
Net realisable value is the estimated selling price in the ordinary course of business, less the estimated costs of completion and selling expense.
The net realisable value of work-in- progress is determined with reference to the selling price of related finished products.
Raw materials, components and other supplies held for use in production of finished products are not written down below cost except in cases where material price have declined and it is estimated that the cost of finished products will exceed their net realizable value. The comparison of cost and net realizable value is made on an item-by-item basis.
The Group considers various factors like shelf life, ageing of inventory, product discontinuation, price changes and any other factor which impact
the Group’s business in determining the allowance for obsolete, non-saleable and slow moving inventories. The Group considers the above factors and adjusts the inventory provision to reflect its actual experience on a periodic basis.
g) Impairment
i. Impairment of financial instruments
The Group recognises loss allowances for expected credit losses on financial assets measured at amortised cost.
At each reporting date, the Group assesses whether financial assets carried at amortised cost are credit - impaired. A financial asset is ‘credit impaired’ when one or more events that have a detrimental impact on estimated future cash flows of financial assets have occurred.
Evidence that a financial asset is credit impaired includes the following observed data:
- significant financial difficulty of the borrower or issuer;
- a breach of contract such as a default or being overdue for a period of more than 12 months from the credit term offered to the customer;
- the restructuring of loan or advance by the Company on the terms that the Company would not consider otherwise;
- it is probable that borrower will enter bankruptcy or the financial reorganization;
- the disappearance of active market for a security because of financial difficulties.
In accordance with Ind-AS 109, the Group applies expected credit loss (“ECL”) model for measurement and recognition of impairment loss. The Group follows ‘simplified approach’ for recognition of impairment loss allowance on trade receivables. The application of simplified approach does not require the Group to track changes in credit risk. Rather, it recognises impairment loss allowance based on lifetime ECLs at each reporting date, right from its initial recognition.
For recognition of impairment loss on other financial assets the Group recognises 12 month expected credit losses for all originated or acquired financial assets if at the reporting date, the credit risk has not increased significantly since its original recognition. However, if credit risk has increased significantly, lifetime ECL is used.
ECL impairment loss allowance (or reversal) recognized in the statement of profit and loss.
When determining whether the credit risk of financial asset has increased significantly since initial recognition and when estimating expected credit losses, the Group considers reasonable and supportable information that is relevant and available without undue cost of effort. This includes both quantitate and qualitative information and analysis based on Group’s historical experience and informed credit assessment and including forward - looking information.
The Group considers financial asset to be in default when:
a. The borrower is unlikely to pay its credit obligation to the Group in full, without recourse by the Group to action such as realising security (if any is held); or
b. The financial asset is 360 days or more past due.
Measurement of expected credit loss
Expected credit loss are probability weighted estimate of credit losses. Credit losses are measured as the present value of all cash shortfalls (i.e. the difference between the cash flows due to the
ANNUAL REPORT 2020-21 : NOTES TO THE CONSOLIDATED FINANCIAL STATEMENTS
Notes to the Consolidated Financial Statementfor the year ended March 31, 2021

133
Group in accordance with the contract and the cash flow that the Group expects to receive).
Presentation of allowance of expected credit losses in the balance sheet
Loss allowance for financial assets measured at amortised cost are deducted from the gross carrying amount of the assets.
Write – off
The Gross carrying amount of financial asset is written off (either partially of full) to the extent that there is no realistic prospect of recovery. This is generally the case when Group determines that the debtor does not have asset or source of income that could generate sufficient cash flows to repay the amount subject to write-off. However, financial assets that are written-off could still be subject to enforcement activities in order to comply with Group’s procedures for recovery of amounts due.
ii. Impairment of non-financial asset
The Group’s non-financial assets other than inventories and deferred tax assets, are reviewed at each reporting date to determine whether there is any indication of impairment. If any such indication exists, then the asset’s recoverable amount is estimated.
For impairment testing, assets that do not generate independent cash inflows are grouped together into cash-generating units (CGUs). Each CGU represents the smallest group of assets that generates cash inflows that are largely independent of the cash inflows of other assets or CGUs.
The recoverable amount of a CGU (or an individual asset) is the higher of its value in use and its fair value less costs of disposal. Value in use is based on the estimated future cash flows, discounted to their present value using a pre-tax discount rate that reflects current market assessments of the time value of money and the risks specific to the CGU (or the asset).
The Group’s corporate assets (e.g. central office building for providing support to various CGUs) do not generate independent cash inflows. To determine impairment of corporate asset, recoverable amount is determined for the CGUs to which the corporate asset belongs.
An impairment loss is recognised if the carrying amount of an asset or CGU exceeds its estimated recoverable amount. Impairment losses are recognised in the statement of profit and loss. Impairment loss recognised in respect of a CGU is allocated first to reduce the carrying amount of any goodwill allocated to the CGU, and then to reduce the carrying amounts of the other assets of the CGU (or group of CGUs) on a pro rata basis.
An impairment loss in respect of assets for which impairment loss has been recognised in prior periods, the Group reviews at each reporting date whether there is any indication that the loss has decreased or no longer exists. An impairment loss is reversed if there has been a change in the estimates used to determine the recoverable amount. Such a reversal is made only to the extent that the asset’s carrying amount does not exceed the carrying amount that would have been determined, net of depreciation or amortisation, if no impairment loss had been recognised.
Goodwill
CGUs to which goodwill has been allocated are tested for impairment annually or more frequently when there is indication for impairment. If the recoverable amount of a CGU is less than its carrying amount, the impairment loss is allocated first to reduce the carrying amount of any goodwill allocated to the unit and then to the other assets of the unit pro-rata on the basis of the carrying amount of each asset in the unit.
Determination of recoverable amount of CGU requires the management to estimate the future cash flows expected to arise and a suitable discount rate in order to calculate the present value. An impairment loss recognised for goodwill is not reversed in subsequent periods.
h) Employee benefits
i. Short term employee benefits Short term employee benefit obligations are measured on an undiscounted basis and are expensed as the related service is provided. A liability is recognised for the amount expected to be paid, if the Group has a present legal or constructive obligation to pay this amount as a result of past service provided by the employee, and the amount of obligation can be estimated reliably.
ii. Share-based payment transactions
Share-based payment are provided to employees via the Group’s Employees Stock Option Plan (“Emcure ESOS 2013”).
The Group accounts for the share based payment transactions as equity settled.
The grant date fair value of equity settled share-based payment awards granted to employees of the Group is recognised as an employee expense, with a corresponding increase in equity, over the period that the employees unconditionally become entitled to the awards. The amount recognised as expense is based on the estimate of the number of awards for which the related service and non-market vesting conditions are expected to be met, such that the amount ultimately recognised as an expense is based on the number of awards that do meet the related service and non-market vesting conditions at the vesting date.
The Group also grants the options to the employees of its subsidiaries for which subsidiary does not have an obligation to settle the share based payment transaction. Total expense for such options issued to employees of subsidiary is recognised as an expense and corresponding increase in share options outstanding account.
If options granted cancelled or settled during the vesting period/ after vesting period (other than a grant cancelled by forfeiture when the vesting conditions are not satisfied) then group immediately recognises the remainng amount of goods & services that have not been recorded in Profit & loss statement so far. Any payment made to the employee on the cancellation or settlement of the grant shall be accounted for as the repurchase of an equity interest, i.e. as a deduction from equity, except to the extent that the payment exceeds the fair value of the equity instruments granted, measured at the repurchase date. Any such excess shall be recognised as an expense.
iii. Defined contribution plan
A defined contribution plan is a post-employment benefit plan under which an entity pays fixed contributions into a separate entity and will have no legal or constructive obligation to pay further amounts. The Group makes specified monthly contributions towards Government administered provident fund scheme. Obligations for contributions to defined contribution plans are recognised as an employee benefit expense in statement of profit or loss in the periods during which the related services are rendered by employees.
Prepaid contributions are recognised as an asset to the extent that a cash refund or a reduction in future payments is available.
iv. Defined benefit plan
A defined benefit plan is a post-employment benefit plan other than a defined contribution plan. The Group’s net obligation in
ANNUAL REPORT 2020-21 : NOTES TO THE CONSOLIDATED FINANCIAL STATEMENTS
Notes to the Consolidated Financial Statementfor the year ended March 31, 2021

134
respect of defined benefit plans is calculated separately for each plan by estimating the amount of future benefit that employees have earned in the current and prior periods, discounting that amount and deducting the fair value of any plan assets.
The calculation of defined benefit obligation is performed annually by a qualified actuary using the projected unit credit method. When the calculation results is a potential asset for the Group, the recognised asset is limited to the present value of economic benefit available in the form of any future refunds from the plan or reductions in future contributions to the plan (‘the asset ceiling’). In order to calculate the present value of economic benefits, consideration is given to any minimum funding requirements.
Remeasurement of the net defined benefit liability, which comprise actuarial gains and losses, the return on plan assets (excluding interest) and the effect of the asset ceiling (if any, excluding interest), are recognised in OCI. The Group determines the net interest expense (income) on the net defined benefit liability (asset) for the period by applying the discount rate used to measure the defined benefit obligation at the beginning of the annual period to the then-net defined benefit liability (asset), taking into account any changes in the net defined benefit liability (asset) during the period as a result of contributions and benefit payments. Net interest expense and other expenses related to defined benefit plans are recognised in profit or loss.
When the benefits of the plan are changed or when plan is curtailed, the resulting change in benefit that relates to past service (‘past service cost’ or ‘past service gain’) or the gain or loss on curtailment is recognised immediately in profit or loss. The Group recognises gain and losses on the settlement of a defined benefit plan when the settlement occurs.
v. Stock Appreciation Rights (SAR’s)
Stock Appreciation Rights (SAR’s) are provided to certain senior executives level employees of the Group. Payout related to these SAR’s is dependent on the achievement of the defined EBITDA level by the wholly own subsidiary of the Parent. As the final payout is not based on the subsidiary’s share price these SAR’s are not within the scope of Ind AS 102 and hence the payment is an employee benefit expense which is accounted for under Ind AS 19 ‘Employee Benefits’. The benefits are discounted using the market yields at the end of the reporting period that have terms approximating to the terms of the related obligation.
The Group’s liability in respect of other long-term employee benefits (compensated absences) is the amount of future benefit that employees have earned in return for their service in the current and prior periods, that benefit is discounted to determine its present value, and the fair value of any related assets is deducted. The obligation is measured on the basis of an annual independent actuarial valuation using the Projected Unit Credit method. Remeasurement gains or losses are recognised in profit or loss in the period in which they arise.
vi. Other long term employee benefit
The Group’s liability in respect of other long-term employee benefits (compensated absences) is the amount of future benefit that employees have earned in return for their service in the current and prior periods, that benefit is discounted to determine its present value, and the fair value of any related assets is deducted. The obligation is measured on the basis of an annual independent actuarial valuation using the Projected Unit Credit method. Remeasurement gains or losses are recognised in profit or loss in the period in which they arise.
i) Provisions (other than for employee benefits), Contingent liabilities and contingent assets
A provision is recognised if, as a result of a past event, the Group has a present legal or constructive obligation that can be estimated reliably, and it is probable that an outflow of economic benefits will be required to settle the obligation. Provisions are determined by discounting the expected future cash flows (representing the best estimate of the expenditure required to settle the present obligation at the balance sheet date) at a pre-tax-rate that reflects current market assessments of the time value of money and the risks specific to the liability. The unwinding of the discount is recognised as finance cost. Expected future operating losses are not provided for.
i. Sales returns and breakage expiry
When a customer has a right to return the product within a given period, the Group has recognised a provision for returns. The provision is measured equal to the value of the sales expected to return in the future period. Revenue is adjusted for the expected value of the returns and cost of sales are adjusted for the value of the corresponding goods to be returned.
The Group has an obligation to replace the goods which will expire. The Group has recognised a provision for the returns due to expiry. The provision is measured on the basis of historical trend of expiry against the sales occurred in the current and earlier period. Management considers the sales value for the periods which are equivalent to average general shelf life of products. Revenue is adjusted for the expected value of the returns.
ii. Contingencies
Provision in respect of loss contingencies relating to claims, litigations, assessments, fines, penalties, etc. are recognized when it is probable that a liability has been incurred, and the amount can be estimated reliably.
iii. Contingent liabilities and contingent assets
A contingent liability exists when there is a possible but not probable obligation, or a present obligation that may, but probably will not, require an outflow of resources, or a present obligation whose amount cannot be estimated reliably. Contingent liabilities do not warrant provisions, but are disclosed unless the possibility of outflow of resources is remote.
A contingent asset is a possible asset that arises from past events and whose existence will be confirmed only by the occurrence or non-occurrence of one or more uncertain future events not wholly within the control of the entity. Contingent assets are not recognized in the financial statements. However, contingent assets are assessed continually and if it is virtually certain that an inflow of economic benefit will arise, the asset and related income are recognized in the period in which the change occurs. A contingent asset is disclosed, where an inflow of economic benefits is probable.
j) Revenue (Refer note 53)
Revenue is measured based on the consideration specified in a contract with a customer. Consideration is allocated to each performance obligation specified in the contract. The Group recognises revenue pertaining to each performance obligation when it transfers control over a product to a customer, which is adjusted for expected refunds, which are estimated based on the historical data, adjusted as necessary. The transaction price is also adjusted for the effect of time value of money if the contract includes significant financing component.
The consideration can be fixed or variable. Where the consideration promised in a contract includes a variable amount, the Group estimates the amount of consideration to which the Group will be entitled in exchange for transferring the promised goods or services to a customer. Variable consideration is only recognised when it is highly probable that a
ANNUAL REPORT 2020-21 : NOTES TO THE CONSOLIDATED FINANCIAL STATEMENTS
Notes to the Consolidated Financial Statementfor the year ended March 31, 2021
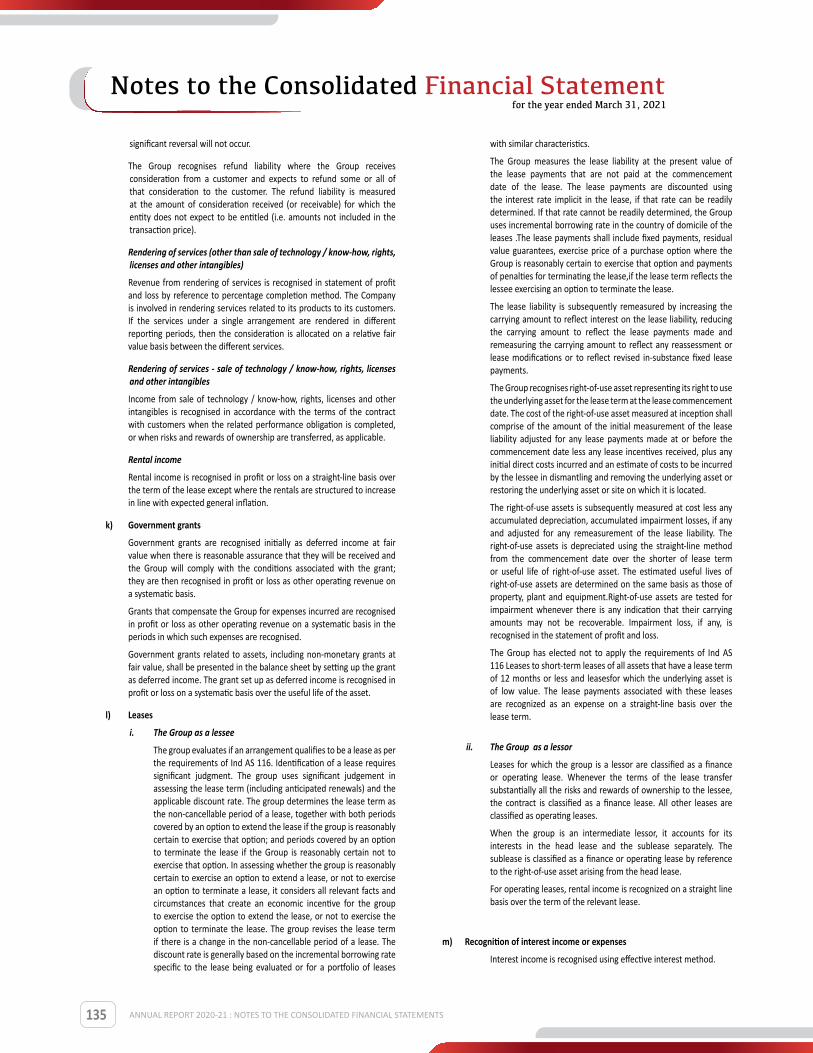
135
significant reversal will not occur.
The Group recognises refund liability where the Group receives consideration from a customer and expects to refund some or all of that consideration to the customer. The refund liability is measured at the amount of consideration received (or receivable) for which the entity does not expect to be entitled (i.e. amounts not included in the transaction price).
Rendering of services (other than sale of technology / know-how, rights, licenses and other intangibles)
Revenue from rendering of services is recognised in statement of profit and loss by reference to percentage completion method. The Company is involved in rendering services related to its products to its customers. If the services under a single arrangement are rendered in different reporting periods, then the consideration is allocated on a relative fair value basis between the different services.
Rendering of services - sale of technology / know-how, rights, licenses and other intangibles
Income from sale of technology / know-how, rights, licenses and other intangibles is recognised in accordance with the terms of the contract with customers when the related performance obligation is completed, or when risks and rewards of ownership are transferred, as applicable.
Rental income
Rental income is recognised in profit or loss on a straight-line basis over the term of the lease except where the rentals are structured to increase in line with expected general inflation.
k) Government grants
Government grants are recognised initially as deferred income at fair value when there is reasonable assurance that they will be received and the Group will comply with the conditions associated with the grant; they are then recognised in profit or loss as other operating revenue on a systematic basis.
Grants that compensate the Group for expenses incurred are recognised in profit or loss as other operating revenue on a systematic basis in the periods in which such expenses are recognised.
Government grants related to assets, including non-monetary grants at fair value, shall be presented in the balance sheet by setting up the grant as deferred income. The grant set up as deferred income is recognised in profit or loss on a systematic basis over the useful life of the asset.
l) Leases
i. The Group as a lessee
The group evaluates if an arrangement qualifies to be a lease as per the requirements of Ind AS 116. Identification of a lease requires significant judgment. The group uses significant judgement in assessing the lease term (including anticipated renewals) and the applicable discount rate. The group determines the lease term as the non-cancellable period of a lease, together with both periods covered by an option to extend the lease if the group is reasonably certain to exercise that option; and periods covered by an option to terminate the lease if the Group is reasonably certain not to exercise that option. In assessing whether the group is reasonably certain to exercise an option to extend a lease, or not to exercise an option to terminate a lease, it considers all relevant facts and circumstances that create an economic incentive for the group to exercise the option to extend the lease, or not to exercise the option to terminate the lease. The group revises the lease term if there is a change in the non-cancellable period of a lease. The discount rate is generally based on the incremental borrowing rate specific to the lease being evaluated or for a portfolio of leases
with similar characteristics.
The Group measures the lease liability at the present value of the lease payments that are not paid at the commencement date of the lease. The lease payments are discounted using the interest rate implicit in the lease, if that rate can be readily determined. If that rate cannot be readily determined, the Group uses incremental borrowing rate in the country of domicile of the leases .The lease payments shall include fixed payments, residual value guarantees, exercise price of a purchase option where the Group is reasonably certain to exercise that option and payments of penalties for terminating the lease,if the lease term reflects the lessee exercising an option to terminate the lease.
The lease liability is subsequently remeasured by increasing the carrying amount to reflect interest on the lease liability, reducing the carrying amount to reflect the lease payments made and remeasuring the carrying amount to reflect any reassessment or lease modifications or to reflect revised in-substance fixed lease payments.
The Group recognises right-of-use asset representing its right to use the underlying asset for the lease term at the lease commencement date. The cost of the right-of-use asset measured at inception shall comprise of the amount of the initial measurement of the lease liability adjusted for any lease payments made at or before the commencement date less any lease incentives received, plus any initial direct costs incurred and an estimate of costs to be incurred by the lessee in dismantling and removing the underlying asset or restoring the underlying asset or site on which it is located.
The right-of-use assets is subsequently measured at cost less any accumulated depreciation, accumulated impairment losses, if any and adjusted for any remeasurement of the lease liability. The right-of-use assets is depreciated using the straight-line method from the commencement date over the shorter of lease term or useful life of right-of-use asset. The estimated useful lives of right-of-use assets are determined on the same basis as those of property, plant and equipment.Right-of-use assets are tested for impairment whenever there is any indication that their carrying amounts may not be recoverable. Impairment loss, if any, is recognised in the statement of profit and loss.
The Group has elected not to apply the requirements of Ind AS 116 Leases to short-term leases of all assets that have a lease term of 12 months or less and leasesfor which the underlying asset is of low value. The lease payments associated with these leases are recognized as an expense on a straight-line basis over the lease term.
ii. The Group as a lessor
Leases for which the group is a lessor are classified as a finance or operating lease. Whenever the terms of the lease transfer substantially all the risks and rewards of ownership to the lessee, the contract is classified as a finance lease. All other leases are classified as operating leases.
When the group is an intermediate lessor, it accounts for its interests in the head lease and the sublease separately. The sublease is classified as a finance or operating lease by reference to the right-of-use asset arising from the head lease.
For operating leases, rental income is recognized on a straight line basis over the term of the relevant lease.
m) Recognition of interest income or expenses
Interest income is recognised using effective interest method.
ANNUAL REPORT 2020-21 : NOTES TO THE CONSOLIDATED FINANCIAL STATEMENTS
Notes to the Consolidated Financial Statementfor the year ended March 31, 2021

136
The ‘effective interest rate’ is the rate that exactly discounts estimated future cash payments or receipts through the expected life of financial instrument to:
- The gross carrying amount of the financial assets; or
- The amortised cost of the financial liability.
In calculating interest income and expense, the effective interest rate is applied to the gross carrying amount of the asset (when the asset is not credit-impaired) or to the amortised cost of the liability. However, for financial assets that have become credit-impaired subsequent to initial recognition, interest income is calculated by applying the effective interest rate to the amortised cost of the financial asset. If the asset is no longer credit-impaired, then the calculation of interest income reverts to the gross basis.
n) Income tax
Income tax expense comprises of current and deferred tax. It is recognised in profit or loss except to the extent that it relates to an item recognised directly in equity or in other comprehensive income.
i. Current tax
Current tax comprises the expected tax payable or receivable on the taxable income or loss of the year and any adjustment to the tax payable or receivable in respect of previous years. The amount of current tax reflects the best estimate of the tax amount expected to be paid or received after considering the uncertainty, if any, related to income taxes. It is measured using tax rates (and tax laws) enacted or substantively enacted by the reporting date.
Significant judgments are involved in determining the provision for income taxes including judgment on whether tax positions are probable of being sustained in tax assessments. A tax assessment can involve complex issues, which can only be resolved over extended time periods.
Current tax assets and current tax liabilities are offset only if there is a legally enforceable right to set off the recognised amounts, and it is intended to realise the asset and settle the liability on a net basis or simultaneously.
ii. Deferred tax
Deferred tax is recognised in respect of temporary differences between the carrying amounts of assets and liabilities for financial reporting purposes and the corresponding amounts used for taxation purposes. Deferred tax is also recognised in respect of carried forward tax losses and tax credits.
Deferred tax assets are recognised to the extent that it is probable that future taxable profits will be available against which they can be used. The existence of unused tax losses is strong evidence that future taxable profit may not be available. Therefore, in case of a history of recent losses, the Group recognises a deferred tax asset only to the extent that it has sufficient taxable temporary differences or there is convincing other evidence that sufficient taxable profit will be available against which such deferred tax asset can be realised. Deferred tax assets – unrecognised or recognised, are reviewed at each reporting date and are recognised/ reduced to the extent that it is probable/ no longer probable respectively that the related tax benefit will be realised.
Deferred tax is measured at the tax rates that are expected to apply to the period when the asset is realised or the liability is settled, based on the laws that have been enacted or substantively enacted by the reporting date.
The measurement of deferred tax reflects the tax consequences that would follow from the manner in which the Group expects, at the reporting date, to recover or settle the carrying amount of its assets and liabilities.
Deferred tax assets and liabilities are offset if there is a legally enforceable right to offset current tax liabilities and assets, and they relate to income taxes levied by the same tax authority on the same taxable entity, or on different tax entities, but they intend to settle current tax liabilities and assets on a net basis or their tax assets and liabilities will be realised simultaneously.
o) Borrowing cost
Borrowing costs are interest and other costs (including exchange differences relating to foreign currency borrowings to the extent that they are regarded as an adjustment to interest costs) incurred in connection with the borrowing of funds. Borrowing costs directly attributable to acquisition or construction of an asset which necessarily take a substantial period of time to get ready for their intended use are capitalised as part of the cost of that asset. Other borrowing costs are recognised as an expense in the period in which they are incurred.
p) Cash and cash equivalents
Cash and cash equivalents in the balance sheet comprises cash at bank and on hand and short-term deposits with an original maturity of three months or less, which are subject to an insignificant risk of changes in value.
q) Segment Reporting
Operating segments are reported in a manner consistent with the internal reporting provided to the chief operating decision maker.
The board of directors of the Group are identified as Chief operating decision maker. Refer note 47 for segment information.
r) Earnings per share
The basic earnings per share is computed by dividing the net profit / (loss) after tax attributable to the equity shareholders for the period by the weighted average number of equity shares outstanding during the reporting period.
Diluted earnings per share is computed by dividing the net profit / (loss) after tax attributable to the equity shareholders for the period by the weighted average number of equity and equivalent dilutive equity shares outstanding during the reporting period, except where the results would be anti-dilutive.
s) Exceptional item
In certain instances, the size, type or incidence of an item of income or expense, pertaining to the ordinary activities of the Group is such that its disclosure improves the understanding of the performance of the Group, such income or expenses is classified as an exceptional item and accordingly, disclosed in the notes accompanying to the consolidated financials statements.
t) Cash flow statement
Cash flow are reported using the indirect method, whereby profit before tax is adjusted for the effects of transactions of a non-cash nature, any deferrals or accruals of past or future operating cash receipts or payments and item of income or expenses associated with investing or financing cash flows. The cash flows from operating, investing and financing activities of the Group are segregated. For the purpose of cash flow statement bank overdraft that are repayable on demand are considered as cash and cash equivalent as it form an integral part of the Group’s cash management.
u) Rounding of amounts
All amounts disclosed in the financial statements and notes have been rounded off to the nearest million as per the requirement of Schedule III, unless otherwise stated.
ANNUAL REPORT 2020-21 : NOTES TO THE CONSOLIDATED FINANCIAL STATEMENTS
Notes to the Consolidated Financial Statementfor the year ended March 31, 2021

137
v) Research and development
Revenue expenditure on research and development activities is recognized as expense in the period in which it is incurred.
Note 1D. Recent accounting pronouncements
On March 24, 2021, the Ministry of Corporate Affairs (“MCA”) through a notification, amended Schedule III of the Companies Act, 2013. The amendments revise Division I, II and III of Schedule III and are applicable from April 1, 2021. Key amendments relating to Division II which relate to companies whose financial statements are required to comply with Companies (Indian Accounting Standards) Rules 2015 are:
Balance Sheet:
• Lease liabilities should be separately disclosed under the head ‘financial liabilities’, duly distinguished as current or non-current.
• Certain additional disclosures in the statement of changes in equity such as changes in equity share capital due to prior period errors and restated balances at the beginning of the current reporting period.
• Specified format for disclosure of shareholding of promoters.
• Specified format for ageing schedule of trade receivables, trade payables, capital work-in-progress and intangible asset under development.
• If a company has not used funds for the specific purpose for which it was borrowed from banks and financial institutions, then disclosure of details of where it has been used.
• Specific disclosure under ‘additional regulatory requirement’ such as compliance with approved schemes of arrangements, compliance with number of layers of companies, title deeds of immovable property not held in name of company, loans and advances to promoters, directors, key managerial personnel (KMP) and related parties, details of benami property held etc.
Statement of profit and loss:
• Additional disclosures relating to Corporate Social Responsibility (CSR), undisclosed income and crypto or virtual currency specified under the head ‘additional information’ in the notes forming part of the standalone financial statements.
The amendments are extensive and the group will evaluate the same to give effect to them as required by law.
ANNUAL REPORT 2020-21 : NOTES TO THE CONSOLIDATED FINANCIAL STATEMENTS
Notes to the Consolidated Financial Statementfor the year ended March 31, 2021

138
Rs. in million
Note 2A - Property, plant and equipment
Gross book value Accumulated depreciation Net book value
April 1, 2020
Addi-tions
during the
year
Dele-tion
during the
year
Exchange difference on translation of
foreign operations
March 31, 2021
April 1, 2020
Charge for
the year
Deletion during
the year
Exchange difference on translation of foreign oper-
ations
March 31, 2021
March 31, 2021
Freehold land 27.45 14.83 - - 42.28 - - - - - 42.28 Leasehold improvements 1,847.54 2.70 - (52.03) 1,798.21 627.04 223.33 - (18.70) 831.67 966.54
Building 4,383.02 226.12 - - 4,609.14 544.08 164.24 - - 708.32 3,900.82
Plant and machinery 11,967.15 2,178.45 (54.28) (30.98) 14,060.34 4,671.17 1,143.18 (34.20) (15.48) 5,764.67 8,295.67 Electrical installation 781.17 74.75 - - 855.92 324.78 77.66 - - 402.44 453.48 Air handling equipment 993.20 128.60 - - 1,121.80 351.20 87.03 (0.13) - 438.10 683.70 Computers 555.91 70.82 (0.21) (2.74) 623.78 362.84 84.40 (0.18) (1.34) 445.72 178.06 Office equipment 192.77 10.41 (0.57) 1.46 204.07 125.24 24.62 (0.26) 0.88 150.48 53.59 Furniture and fixtures 390.73 51.30 (0.87) 1.27 442.43 157.83 39.52 (0.48) 0.10 196.97 245.46 Vehicles 214.82 20.12 (16.77) (0.16) 218.01 149.60 28.91 (14.76) 1.16 164.91 53.10
Total 21,353.76 2,778.10 (72.70) (83.18) 23,975.98 7,313.78 1,872.89 (50.01) (33.38) 9,103.28 14,872.70
Rs. in million
Note 2A - Property, plant and equipment
Gross book value Accumulated depreciation Net book value
April 1, 2019
Addi-tions
during the
year
Dele-tion
during the
year
Reclassi-fied on adop-tion of Ind AS
116
Ex-change differ-
ence on transla-tion of foreign opera-tions
March 31, 2020
April 1, 2019
Charge for
the year
Dele-tion
during the
year
Reclas-sified
on adop-tion of Ind AS
116
Ex-change differ-
ence on transla-tion of foreign opera-tions
March 31, 2020
March 31, 2020
Freehold land 27.45 - - - - 27.45 - - - - - - 27.45 Leasehold land 933.45 - - (933.45) - - 31.19 - - (31.19) - - - Leasehold improvements
1,744.83 28.65 (36.27) - 110.33 1,847.54 375.46 228.93 (10.08) - 32.73 627.04 1,220.50
Building 4,216.76 166.26 - - - 4,383.02 387.95 156.13 - - - 544.08 3,838.94 Plant and machinery
10,607.24 1,323.67 (21.57) - 57.81 11,967.15 3,553.11 1,101.27 (11.74) - 28.53 4,671.17 7,295.98
Electrical installation
677.89 103.97 (0.69) - - 781.17 249.51 75.42 (0.15) - - 324.78 456.39
Air handling equipment
902.03 91.70 (0.53) - - 993.20 267.40 83.98 (0.18) - - 351.20 642.00
Computers 478.29 72.48 (0.47) - 5.61 555.91 261.92 98.06 (0.44) - 3.30 362.84 193.07 Office equipment
178.63 12.29 (0.24) - 2.09 192.77 95.53 28.26 (0.18) - 1.63 125.24 67.53
Furniture and fixtures
358.16 30.97 (0.26) - 1.86 390.73 116.97 39.01 (0.12) - 1.97 157.83 232.90
Vehicles 214.43 10.81 (10.46) - 0.04 214.82 123.61 34.25 (8.09) - (0.17) 149.60 65.22 Total 20,339.16 1,840.80 (70.49) (933.45) 177.74 21,353.76 5,462.65 1,845.31 (30.98) (31.19) 67.99 7,313.78 14,039.98
Notes to the Consolidated Financial Statementfor the year ended March 31, 2021
ANNUAL REPORT 2020-21 : NOTES TO THE CONSOLIDATED FINANCIAL STATEMENTS
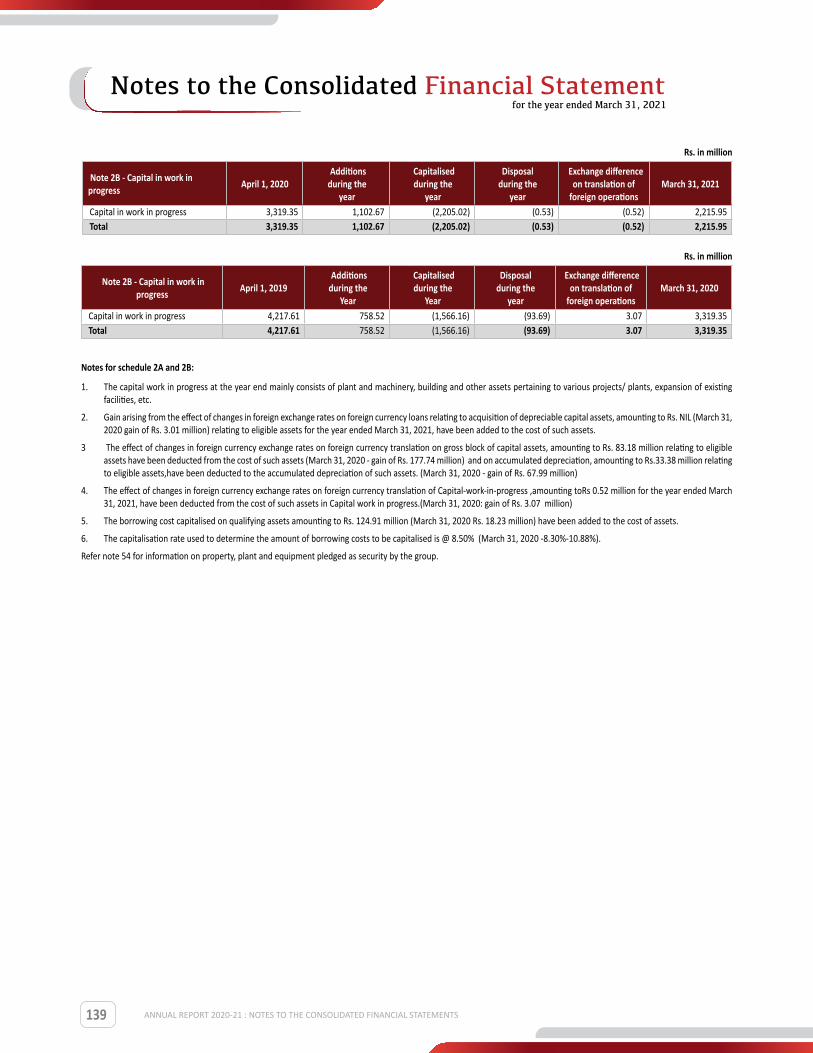
139
Rs. in million
Note 2B - Capital in work in progress April 1, 2020
Additions during the
year
Capitalised during the
year
Disposal during the
year
Exchange difference on translation of
foreign operations March 31, 2021
Capital in work in progress 3,319.35 1,102.67 (2,205.02) (0.53) (0.52) 2,215.95 Total 3,319.35 1,102.67 (2,205.02) (0.53) (0.52) 2,215.95
Rs. in million
Note 2B - Capital in work in progress April 1, 2019
Additions during the
Year
Capitalised during the
Year
Disposal during the
year
Exchange difference on translation of
foreign operations March 31, 2020
Capital in work in progress 4,217.61 758.52 (1,566.16) (93.69) 3.07 3,319.35 Total 4,217.61 758.52 (1,566.16) (93.69) 3.07 3,319.35
Notes for schedule 2A and 2B:
1. The capital work in progress at the year end mainly consists of plant and machinery, building and other assets pertaining to various projects/ plants, expansion of existing facilities, etc.
2. Gain arising from the effect of changes in foreign exchange rates on foreign currency loans relating to acquisition of depreciable capital assets, amounting to Rs. NIL (March 31, 2020 gain of Rs. 3.01 million) relating to eligible assets for the year ended March 31, 2021, have been added to the cost of such assets.
3 The effect of changes in foreign currency exchange rates on foreign currency translation on gross block of capital assets, amounting to Rs. 83.18 million relating to eligible assets have been deducted from the cost of such assets (March 31, 2020 - gain of Rs. 177.74 million) and on accumulated depreciation, amounting to Rs.33.38 million relating to eligible assets,have been deducted to the accumulated depreciation of such assets. (March 31, 2020 - gain of Rs. 67.99 million)
4. The effect of changes in foreign currency exchange rates on foreign currency translation of Capital-work-in-progress ,amounting toRs 0.52 million for the year ended March 31, 2021, have been deducted from the cost of such assets in Capital work in progress.(March 31, 2020: gain of Rs. 3.07 million)
5. The borrowing cost capitalised on qualifying assets amounting to Rs. 124.91 million (March 31, 2020 Rs. 18.23 million) have been added to the cost of assets.
6. The capitalisation rate used to determine the amount of borrowing costs to be capitalised is @ 8.50% (March 31, 2020 -8.30%-10.88%).
Refer note 54 for information on property, plant and equipment pledged as security by the group.
ANNUAL REPORT 2020-21 : NOTES TO THE CONSOLIDATED FINANCIAL STATEMENTS
Notes to the Consolidated Financial Statementfor the year ended March 31, 2021

140
Note 3 : Leases
Lease contracts entered by the Group majorly pertains for land & buildings taken on lease to conduct its business in the ordinary course. Information about leases for which the Group is lesee is presented as below:
Right-Of -Use Of AssetRs. in million
Particulars Land Land & Building Computers Total Intial recognition as on 1st April,2019 6.73 1,840.07 - 1,846.80 Reclassification from property, plant & equipment 902.26 - - 902.26 Reclassification from prepaid expenses with respect to fair valuation of security deposit given on assets taken on lease
- 10.60 - 10.60
Depreciation charge for the year (10.28) (358.90) - (369.18)Translation exchange differences - (9.07) - (9.07)Balance As On 31st March 2020 898.71 1,482.70 - 2,381.41 Additions for new leases entered during the year - 203.99 60.38 264.37 Deletions for leases terminated during the year - (10.44) - (10.44)Depreciation charge for the year (10.19) (363.53) (7.00) (380.72)Translation exchange differences - (11.77) - (11.77)Balance As On 31st March 2021 888.52 1300.95 53.38 2,242.95
Lease LiabilitiesRs. in million
Particulars March 31, 2021 March 31, 2020Balance as at the beginning of the year 1,571.22 - Initial Recognition as on April 1, 2019 - 1,862.72 Additions for new leases entered during the year 264.73 - Deletions for leases terminated during the year (11.37) - Interest on lease liabilities 119.27 122.12 Repayment of lease liabilities (436.80) (415.54)Translation exchange differences (14.57) 1.92 Balance as at the end of the year 1,492.48 1,571.22 Current 324.43 297.23Non-current 1168.05 1273.99
Maturity analysis - contractual undiscounted cash flows -Rs. in million
Particulars March 31, 2021 March 31, 2020Less than one year 422.46 395.23 One to five years 1,048.66 1,154.31 More than five years 540.50 666.21 Total undiscounted lease liabilities as on 31st March, 2021 2,011.62 2,215.75
Amount recognised in statement of Profit or LossRs. in million
Particulars March 31, 2021 March 31, 2020Interest on lease liabilities (119.27) (122.12)Depreciation on ROU (380.72) (369.18)Expenses relating to short term leases (7.07) (20.48)Expenses relating to leases of low value assets (16.25) (11.76)Expenses relating to variable lease payments (10.17) (4.88)Total (533.48) (528.42)
Amounts recognised in statement of cash flowRs. in million
Particulars March 31, 2021 March 31, 2020 Cash flow from financing acitivities - Repayment of lease liabilities (436.80) (415.54)
The weighted average incremental borrowing rate in range of 2.5% - 10.13% (March 31, 2020 : 2.5% - 10.20%) has been applied to lease liabilities recognised in the balance sheet.
Notes to the Consolidated Financial Statementfor the year ended March 31, 2021
ANNUAL REPORT 2020-21 : NOTES TO THE CONSOLIDATED FINANCIAL STATEMENTS
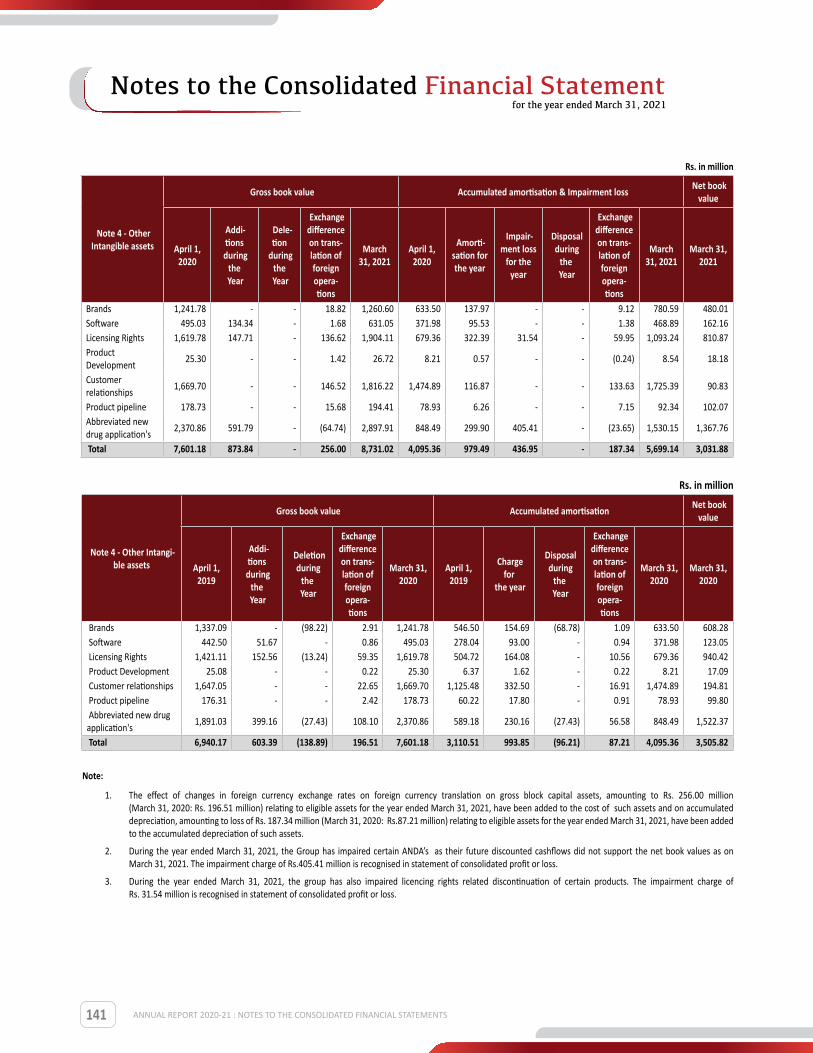
141
Rs. in million
Note 4 - Other Intangible assets
Gross book value Accumulated amortisation & Impairment loss Net book value
April 1, 2020
Addi-tions
during the
Year
Dele-tion
during the
Year
Exchange difference on trans-lation of foreign opera-tions
March 31, 2021
April 1, 2020
Amorti-sation for the year
Impair-ment loss
for the year
Disposal during
the Year
Exchange difference on trans-lation of foreign opera-tions
March 31, 2021
March 31, 2021
Brands 1,241.78 - - 18.82 1,260.60 633.50 137.97 - - 9.12 780.59 480.01 Software 495.03 134.34 - 1.68 631.05 371.98 95.53 - - 1.38 468.89 162.16 Licensing Rights 1,619.78 147.71 - 136.62 1,904.11 679.36 322.39 31.54 - 59.95 1,093.24 810.87 Product Development
25.30 - - 1.42 26.72 8.21 0.57 - - (0.24) 8.54 18.18
Customer relationships
1,669.70 - - 146.52 1,816.22 1,474.89 116.87 - - 133.63 1,725.39 90.83
Product pipeline 178.73 - - 15.68 194.41 78.93 6.26 - - 7.15 92.34 102.07 Abbreviated new drug application's
2,370.86 591.79 - (64.74) 2,897.91 848.49 299.90 405.41 - (23.65) 1,530.15 1,367.76
Total 7,601.18 873.84 - 256.00 8,731.02 4,095.36 979.49 436.95 - 187.34 5,699.14 3,031.88
Rs. in million
Note 4 - Other Intangi-ble assets
Gross book value Accumulated amortisation Net book value
April 1, 2019
Addi-tions
during the
Year
Deletion during
the Year
Exchange difference on trans-lation of foreign opera-tions
March 31, 2020
April 1, 2019
Charge for
the year
Disposal during
the Year
Exchange difference on trans-lation of foreign opera-tions
March 31, 2020
March 31, 2020
Brands 1,337.09 - (98.22) 2.91 1,241.78 546.50 154.69 (68.78) 1.09 633.50 608.28 Software 442.50 51.67 - 0.86 495.03 278.04 93.00 - 0.94 371.98 123.05 Licensing Rights 1,421.11 152.56 (13.24) 59.35 1,619.78 504.72 164.08 - 10.56 679.36 940.42 Product Development 25.08 - - 0.22 25.30 6.37 1.62 - 0.22 8.21 17.09 Customer relationships 1,647.05 - - 22.65 1,669.70 1,125.48 332.50 - 16.91 1,474.89 194.81 Product pipeline 176.31 - - 2.42 178.73 60.22 17.80 - 0.91 78.93 99.80 Abbreviated new drug application's
1,891.03 399.16 (27.43) 108.10 2,370.86 589.18 230.16 (27.43) 56.58 848.49 1,522.37
Total 6,940.17 603.39 (138.89) 196.51 7,601.18 3,110.51 993.85 (96.21) 87.21 4,095.36 3,505.82
Note:
1. The effect of changes in foreign currency exchange rates on foreign currency translation on gross block capital assets, amounting to Rs. 256.00 million (March 31, 2020: Rs. 196.51 million) relating to eligible assets for the year ended March 31, 2021, have been added to the cost of such assets and on accumulated depreciation, amounting to loss of Rs. 187.34 million (March 31, 2020: Rs.87.21 million) relating to eligible assets for the year ended March 31, 2021, have been added to the accumulated depreciation of such assets.
2. During the year ended March 31, 2021, the Group has impaired certain ANDA’s as their future discounted cashflows did not support the net book values as on March 31, 2021. The impairment charge of Rs.405.41 million is recognised in statement of consolidated profit or loss.
3. During the year ended March 31, 2021, the group has also impaired licencing rights related discontinuation of certain products. The impairment charge of Rs. 31.54 million is recognised in statement of consolidated profit or loss.
ANNUAL REPORT 2020-21 : NOTES TO THE CONSOLIDATED FINANCIAL STATEMENTS
Notes to the Consolidated Financial Statementfor the year ended March 31, 2021

142
Rs. in million
Note 5 - Intangible assets under devel-opment April 1, 2020 Additions
during the Year
Capitalised during the
Year
Exchange difference on translation of foreign
operations March 31, 2021
Intangible assets under development 1,530.31 16.83 (708.46) (38.37) 800.31 Total 1,530.31 16.83 (708.46) (38.37) 800.31
Rs. in million
Note 5 - Intangible assets under devel-opment April 1, 2019 Additions
during the Year
Capitalised during the
Year
Exchange difference on translation of foreign
operations March 31, 2020
Intangible assets under development 1,590.94 252.82 (424.42) 110.97 1,530.31 Total 1,590.94 252.82 (424.42) 110.97 1,530.31
Notes :1. The effect of changes in foreign currency exchange rates on foreign currency translation on Intangible under development, amount to Rs.38.37 million in relation to
eligible assets for the year ended March 31, 2021 has been deducted from cost of such asset in intangible asset under development (March 31, 2020: gain of Rs. 110.97 million).
2. Intangible assets under development at the year end mainly consist of abbreviated new drug application and other intangible assets under development.
Rs. in million
Note 6 - Non-current investments March 31, 2021 March 31, 2020Investment in government securitiesUnquoted- valued at amortised costNational Savings Certificates 0.03 0.03 Aggregate value of unquoted Investments 0.03 0.03
Rs. in million
Note 7 Loans March 31, 2021 March 31, 2020Unsecured considered good (unless otherwise stated)Security deposits 289.00 259.05 Total 289.00 259.05
Rs. in million
Break-up of security details March 31, 2021 March 31, 2020Loans considered good - Secured - - Loans considered good - Unsecured 289.00 259.05 Loans which have significant increase in credit risk - - Loans - credit impaired - - Total 289.00 259.05Less: Loss allowance - - Total 289.00 259.05
Rs. in million
Note 8 Other non-current financial assets March 31, 2021 March 31, 2020Unsecured considered good (unless otherwise stated)Term deposits with banks having remaining maturity period of more than 12 months (refer note below) 82.81 132.56 Deposit with Provident Fund authority 20.00 20.00 Total 102.81 152.56
Note: Out of above certain fixed deposits are held as lien by bank for performance bank guarantees & others.
Rs. in million
Note 9 Other non-current assets March 31, 2021 March 31, 2020Unsecured considered good (unless otherwise stated)Capital advances 109.60 258.71 Prepaid expenses 2.53 2.62 Balances with government authorities 108.50 108.79 Total 220.63 370.12
ANNUAL REPORT 2020-21 : NOTES TO THE CONSOLIDATED FINANCIAL STATEMENTS
Notes to the Consolidated Financial Statementfor the year ended March 31, 2021

143
Rs. in million
Note 10 Inventories March 31, 2021 March 31, 2020Raw materials [includes in transit Rs. 338.59 million (March 31, 2020 - Rs. 95.22 million) 4,022.91 3,370.56 Packing materials [includes in transit Rs.15.06 million (March 31, 2020 - Rs. 15.82 million)] 647.83 531.56 Work-in-progress 1,541.04 692.78 Finished goods 2,041.93 1,479.48 Stock-in-trade [includes in transit Rs 828.36 million (March 31, 2020 - Rs. 679.48 million)] 6,508.60 5,393.05 Stores and spares [Includes in transit Rs. 3.44 million (March 31, 2020 - Rs. Nil )] 382.04 264.12 Total 15,144.35 11,731.55
Notes : 1. Amounts recognised in statement of profit or loss
Write-downs of inventories as at the year end amounted to Rs. 897.44 million (March 31, 2020 - Rs. 790.99 million). Increase/decrease in write-down provision is recognised as an expense during the year and included in cost of materials consumed or changes in inventories of finished goods, work-in-progress and traded goods in statement of profit and loss.
2. Refer note 54 for information on Inventories pledged as security by the group.
Rs. in million
Note 11 Trade receivables March 31, 2021 March 31, 2020Unsecured, considered good 14,753.62 11,452.14 Doubtful 494.65 225.51 Less: Allowance for doubtful debts (494.65) (225.51)Total 14,753.62 11,452.14
Rs. in million
Break-up of security details March 31, 2021 March 31, 2020
Trade receivables considered good - Secured - - Trade receivables considered good - Unsecured 14,753.62 11,452.14
Trade receivables which have significant increase in credit risk - -
Trade receivables - credit impaired 494.65 225.51
Total 15,248.27 11,677.65
Less: Loss allowance (494.65) (225.51)
Total 14,753.62 11,452.14
Refer note 54 for information on trade receivables pledged as security by the group. The Group’s exposure to credit and currency risk, and loss allowances related to trade receivables are disclosed in note 41.
Rs. in million
Note 12 Cash and cash equivalents March 31, 2021 March 31, 2020
Cash on hand 3.90 3.49
Balances with bank in current accounts 4,593.78 1,189.30
Balances with bank in cash credit accounts 83.03 -
Demand deposits (with original maturity of less than 3 months) 6.75 94.64
Total 4,687.46 1,287.43
Rs. in million
Note 13 Bank balances other than cash and cash equivalents March 31, 2021 March 31, 2020
Term deposits with banks having initial maturity of more than 3 months but remaining maturity of less than 12 months (refer note below)
547.91 350.94
Total 547.91 350.94
Note: Out of above certain fixed deposits are held as lien by bank for performance bank guarantees, bid bonds & others.
ANNUAL REPORT 2020-21 : NOTES TO THE CONSOLIDATED FINANCIAL STATEMENTS
Notes to the Consolidated Financial Statementfor the year ended March 31, 2021
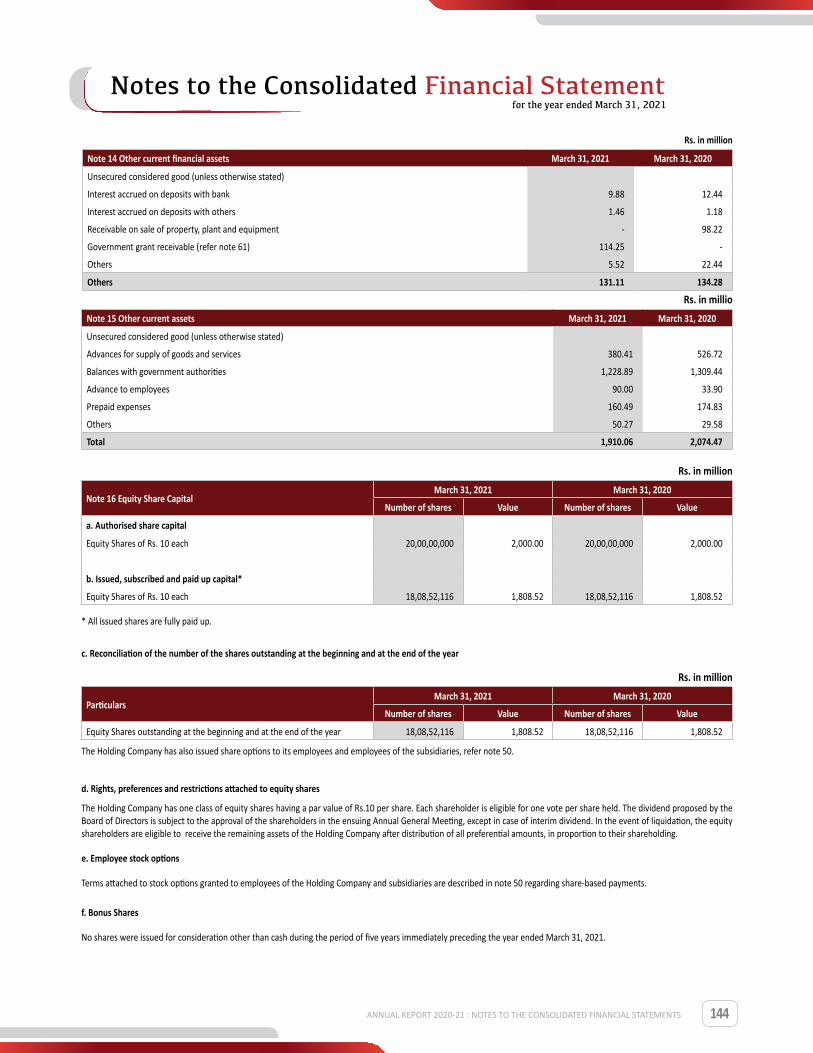
144
Rs. in million
Note 14 Other current financial assets March 31, 2021 March 31, 2020
Unsecured considered good (unless otherwise stated)
Interest accrued on deposits with bank 9.88 12.44
Interest accrued on deposits with others 1.46 1.18
Receivable on sale of property, plant and equipment - 98.22
Government grant receivable (refer note 61) 114.25 -
Others 5.52 22.44
Others 131.11 134.28
Rs. in millioNote 15 Other current assets March 31, 2021 March 31, 2020
Unsecured considered good (unless otherwise stated)
Advances for supply of goods and services 380.41 526.72
Balances with government authorities 1,228.89 1,309.44
Advance to employees 90.00 33.90
Prepaid expenses 160.49 174.83
Others 50.27 29.58
Total 1,910.06 2,074.47
Rs. in million
Note 16 Equity Share CapitalMarch 31, 2021 March 31, 2020
Number of shares Value Number of shares Value
a. Authorised share capital
Equity Shares of Rs. 10 each 20,00,00,000 2,000.00 20,00,00,000 2,000.00
b. Issued, subscribed and paid up capital*
Equity Shares of Rs. 10 each 18,08,52,116 1,808.52 18,08,52,116 1,808.52
* All issued shares are fully paid up.
c. Reconciliation of the number of the shares outstanding at the beginning and at the end of the year
Rs. in million
ParticularsMarch 31, 2021 March 31, 2020
Number of shares Value Number of shares Value
Equity Shares outstanding at the beginning and at the end of the year 18,08,52,116 1,808.52 18,08,52,116 1,808.52
The Holding Company has also issued share options to its employees and employees of the subsidiaries, refer note 50.
d. Rights, preferences and restrictions attached to equity shares
The Holding Company has one class of equity shares having a par value of Rs.10 per share. Each shareholder is eligible for one vote per share held. The dividend proposed by the Board of Directors is subject to the approval of the shareholders in the ensuing Annual General Meeting, except in case of interim dividend. In the event of liquidation, the equity shareholders are eligible to receive the remaining assets of the Holding Company after distribution of all preferential amounts, in proportion to their shareholding.
e. Employee stock options
Terms attached to stock options granted to employees of the Holding Company and subsidiaries are described in note 50 regarding share-based payments.
f. Bonus Shares
No shares were issued for consideration other than cash during the period of five years immediately preceding the year ended March 31, 2021.
ANNUAL REPORT 2020-21 : NOTES TO THE CONSOLIDATED FINANCIAL STATEMENTS
Notes to the Consolidated Financial Statementfor the year ended March 31, 2021
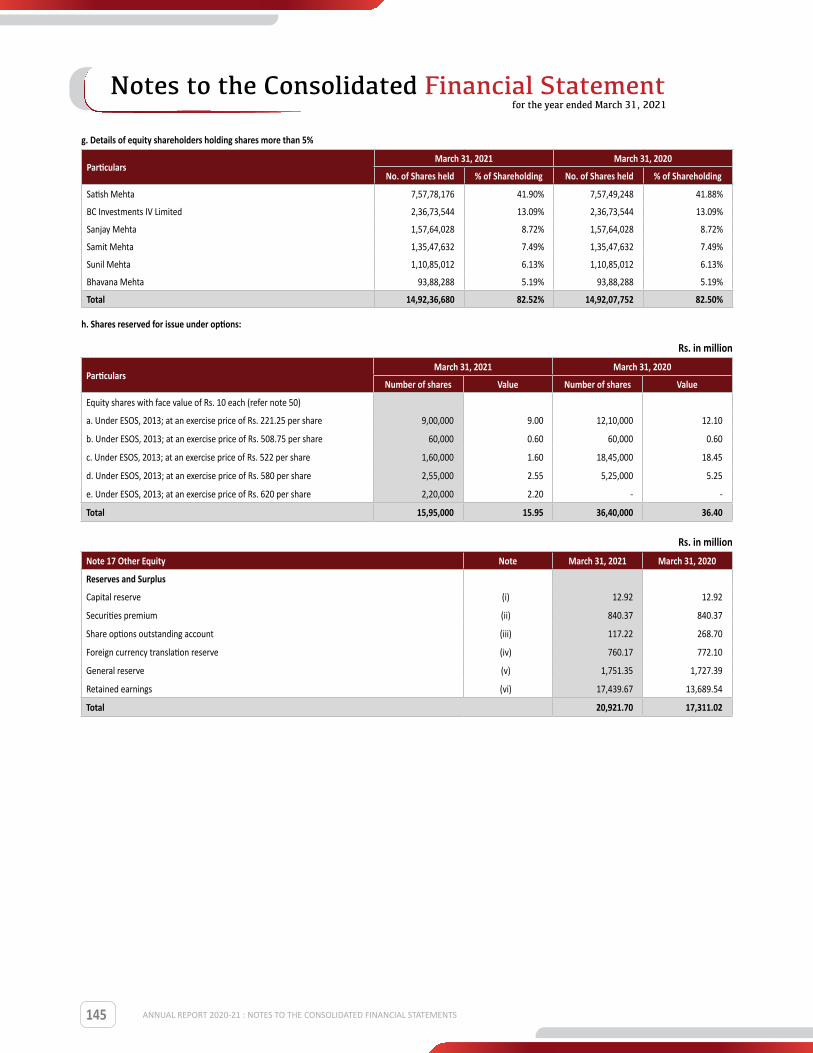
145
g. Details of equity shareholders holding shares more than 5%
ParticularsMarch 31, 2021 March 31, 2020
No. of Shares held % of Shareholding No. of Shares held % of Shareholding
Satish Mehta 7,57,78,176 41.90% 7,57,49,248 41.88%
BC Investments IV Limited 2,36,73,544 13.09% 2,36,73,544 13.09%
Sanjay Mehta 1,57,64,028 8.72% 1,57,64,028 8.72%
Samit Mehta 1,35,47,632 7.49% 1,35,47,632 7.49%
Sunil Mehta 1,10,85,012 6.13% 1,10,85,012 6.13%
Bhavana Mehta 93,88,288 5.19% 93,88,288 5.19%
Total 14,92,36,680 82.52% 14,92,07,752 82.50%
h. Shares reserved for issue under options:
Rs. in million
ParticularsMarch 31, 2021 March 31, 2020
Number of shares Value Number of shares Value
Equity shares with face value of Rs. 10 each (refer note 50)
a. Under ESOS, 2013; at an exercise price of Rs. 221.25 per share 9,00,000 9.00 12,10,000 12.10
b. Under ESOS, 2013; at an exercise price of Rs. 508.75 per share 60,000 0.60 60,000 0.60
c. Under ESOS, 2013; at an exercise price of Rs. 522 per share 1,60,000 1.60 18,45,000 18.45
d. Under ESOS, 2013; at an exercise price of Rs. 580 per share 2,55,000 2.55 5,25,000 5.25
e. Under ESOS, 2013; at an exercise price of Rs. 620 per share 2,20,000 2.20 - -
Total 15,95,000 15.95 36,40,000 36.40
Rs. in millionNote 17 Other Equity Note March 31, 2021 March 31, 2020
Reserves and Surplus
Capital reserve (i) 12.92 12.92
Securities premium (ii) 840.37 840.37
Share options outstanding account (iii) 117.22 268.70
Foreign currency translation reserve (iv) 760.17 772.10
General reserve (v) 1,751.35 1,727.39
Retained earnings (vi) 17,439.67 13,689.54
Total 20,921.70 17,311.02
ANNUAL REPORT 2020-21 : NOTES TO THE CONSOLIDATED FINANCIAL STATEMENTS
Notes to the Consolidated Financial Statementfor the year ended March 31, 2021
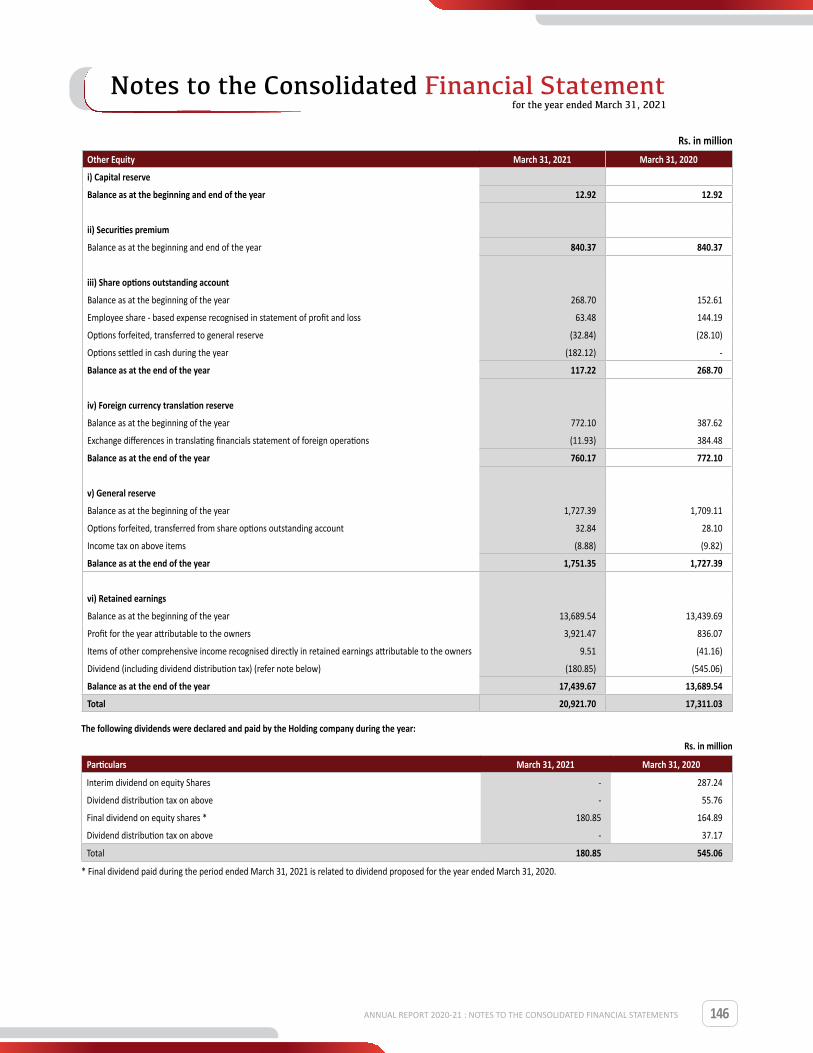
146
Rs. in million Other Equity March 31, 2021 March 31, 2020
i) Capital reserve
Balance as at the beginning and end of the year 12.92 12.92
ii) Securities premium
Balance as at the beginning and end of the year 840.37 840.37
iii) Share options outstanding account
Balance as at the beginning of the year 268.70 152.61
Employee share - based expense recognised in statement of profit and loss 63.48 144.19
Options forfeited, transferred to general reserve (32.84) (28.10)
Options settled in cash during the year (182.12) -
Balance as at the end of the year 117.22 268.70
iv) Foreign currency translation reserve
Balance as at the beginning of the year 772.10 387.62
Exchange differences in translating financials statement of foreign operations (11.93) 384.48
Balance as at the end of the year 760.17 772.10
v) General reserve
Balance as at the beginning of the year 1,727.39 1,709.11
Options forfeited, transferred from share options outstanding account 32.84 28.10
Income tax on above items (8.88) (9.82)
Balance as at the end of the year 1,751.35 1,727.39
vi) Retained earnings
Balance as at the beginning of the year 13,689.54 13,439.69
Profit for the year attributable to the owners 3,921.47 836.07
Items of other comprehensive income recognised directly in retained earnings attributable to the owners 9.51 (41.16)
Dividend (including dividend distribution tax) (refer note below) (180.85) (545.06)
Balance as at the end of the year 17,439.67 13,689.54
Total 20,921.70 17,311.03
The following dividends were declared and paid by the Holding company during the year:
Rs. in million
Particulars March 31, 2021 March 31, 2020
Interim dividend on equity Shares - 287.24
Dividend distribution tax on above - 55.76
Final dividend on equity shares * 180.85 164.89
Dividend distribution tax on above - 37.17
Total 180.85 545.06
* Final dividend paid during the period ended March 31, 2021 is related to dividend proposed for the year ended March 31, 2020.
ANNUAL REPORT 2020-21 : NOTES TO THE CONSOLIDATED FINANCIAL STATEMENTS
Notes to the Consolidated Financial Statementfor the year ended March 31, 2021
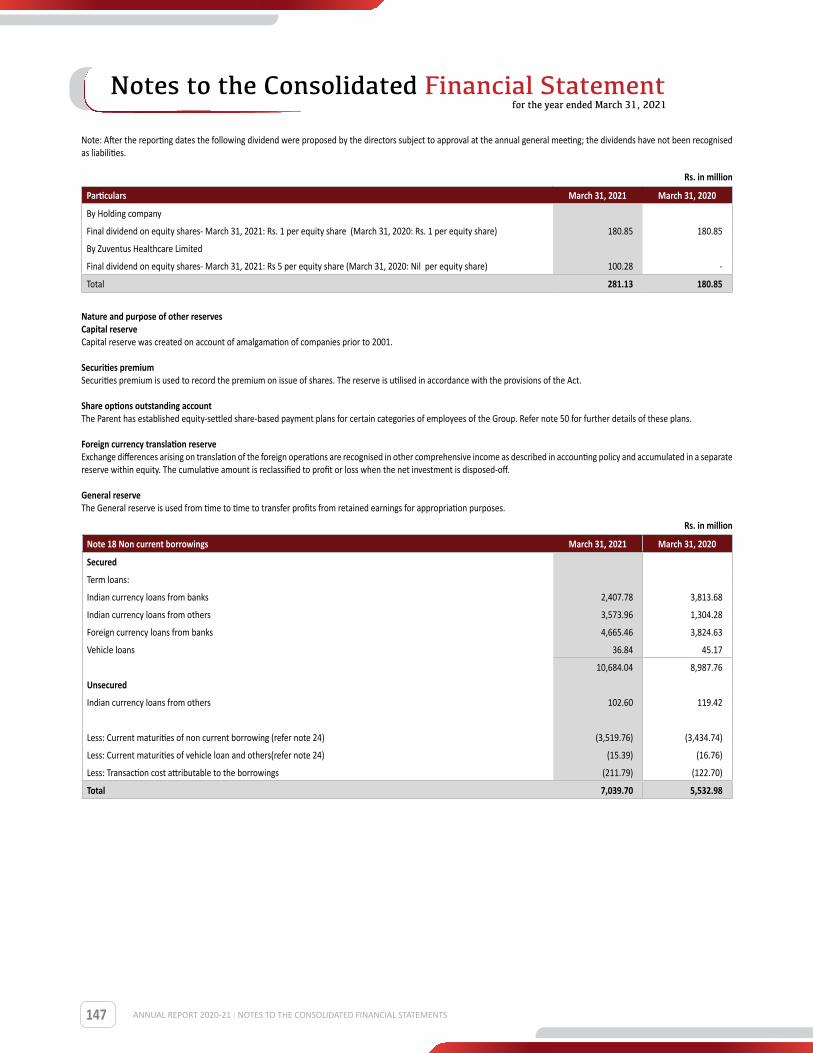
147
Note: After the reporting dates the following dividend were proposed by the directors subject to approval at the annual general meeting; the dividends have not been recognised as liabilities.
Rs. in million
Particulars March 31, 2021 March 31, 2020
By Holding company
Final dividend on equity shares- March 31, 2021: Rs. 1 per equity share (March 31, 2020: Rs. 1 per equity share) 180.85 180.85
By Zuventus Healthcare Limited
Final dividend on equity shares- March 31, 2021: Rs 5 per equity share (March 31, 2020: Nil per equity share) 100.28 -
Total 281.13 180.85
Nature and purpose of other reserves Capital reserveCapital reserve was created on account of amalgamation of companies prior to 2001. Securities premium Securities premium is used to record the premium on issue of shares. The reserve is utilised in accordance with the provisions of the Act. Share options outstanding account The Parent has established equity-settled share-based payment plans for certain categories of employees of the Group. Refer note 50 for further details of these plans. Foreign currency translation reserve Exchange differences arising on translation of the foreign operations are recognised in other comprehensive income as described in accounting policy and accumulated in a separate reserve within equity. The cumulative amount is reclassified to profit or loss when the net investment is disposed-off.
General reserve The General reserve is used from time to time to transfer profits from retained earnings for appropriation purposes.
Rs. in million
Note 18 Non current borrowings March 31, 2021 March 31, 2020
Secured
Term loans:
Indian currency loans from banks 2,407.78 3,813.68
Indian currency loans from others 3,573.96 1,304.28
Foreign currency loans from banks 4,665.46 3,824.63
Vehicle loans 36.84 45.17
10,684.04 8,987.76
Unsecured
Indian currency loans from others 102.60 119.42
Less: Current maturities of non current borrowing (refer note 24) (3,519.76) (3,434.74)
Less: Current maturities of vehicle loan and others(refer note 24) (15.39) (16.76)
Less: Transaction cost attributable to the borrowings (211.79) (122.70)
Total 7,039.70 5,532.98
ANNUAL REPORT 2020-21 : NOTES TO THE CONSOLIDATED FINANCIAL STATEMENTS
Notes to the Consolidated Financial Statementfor the year ended March 31, 2021

148
Note: Information about the Group’s exposure to interest rate, foreign currency and liquidity risks is included in Note 41.
a) Statement of principal terms of secured term loans outstanding as on March 31, 2021
Nature of facility Repayment terms Rate of interest % (per annum) Currency
Amount outstanding
(Rs. in million)Security
Term Loan 48 monthly installments from March 2017. ** 1 Y MCLR + 3.25% INR 24.45 As per Note No. 1Term Loan 48 monthly installments from July 2017. ** 1 Y MCLR + 3.25% INR 180.44 As per Note No. 1Term Loan 48 monthly installments from March 2019. ** 1 year Libor + 3.44% USD 570.68 As per Note No. 1Term Loan 48 monthly installments from March 2019. ** 1 Y MCLR + 2.95% INR 16.54 As per Note No. 1Term Loan 48 monthly installments from January 2020 ** 1 Y MCLR + 3.70% INR 254.58 As per Note No. 1Term Loan 16 quarterly installments from January 2021 1 year MCLR+1.85% INR 468.75 As per Note No. 1Term Loan 48 monthly installments from February 2018 1 year MCLR+1.60% INR 104.16 As per Note No. 1Term Loan 48 monthly installments from February 2018 1 year MCLR+1.60% INR 104.16 As per Note No. 1Term Loan 12 equal half yearly installments from September 2020 6M Libor+ 3.50% USD 402.11 As per Note No. 1Term Loan 12 equal half yearly installments from April 2021 6M Libor+ 3.50% USD 2,485.74 As per Note No. 2Term Loan 16 equal quarterly installments from May 2018 ** 6M Libor+ 3.25% USD 137.08 As per Note No. 1Term Loan 16 equal quarterly installments from April 2018 ** LTMR+75 bps INR 531.25 As per Note No. 1Term Loan 16 equal quarterly installments from April 2020 ** LTMR+75 bps INR 568.45 As per Note No. 1Term Loan 28 quarterly ballooning installments from April 2019 LTRR-7.00% INR 692.73 As per Note No. 6Term Loan 15 equal quarterly installments from July 2018 LTRR-6.90% INR 160.00 As per Note No. 6Term Loan 14 equal quarterly installments from October 2018 LTRR-6.90% INR 114.29 As per Note No. 6Term Loan 2 Equal Monthly Installment Post Completion of Original
Term Loans TenureLTRR-6.90%/ 7.00% INR 109.10 As per Note No. 6
Term Loan 60 monthly installments from August 2019. LTLR - 8.25% INR 315.00 As per Note No. 4Term Loan 60 monthly installments from December 2019. LTLR - 8.25% INR 167.50 As per Note No. 1Term Loan 2 Equal Monthly Installment Post Completion of Original
Term Loans TenureLTLR - 8.25% INR 15.34 As per Note No.
1 & 4Term Loan 60 monthly installments from April 2021. LTLR - 10.00% INR 800.00 As per Note No. 7Term Loan 60 monthly installments from April 2021. LTLR - 10.00% INR 200.00 As per Note No. 1Term Loan 48 monthly installments from August 2021 3M MCLR + 0.35% INR 155.00 As per Note No. 5Term Loan 20 Equal Quarterly Installments from May 2021 1 Year MCLR + 2.05% INR 1,000.00 As per Note No. 1Term Loan "2 quarterly installment of C$ 840 thousand from May
2017 to August 2017. 4 quarterly installment of C$ 1050 thousand from November 2017 to August 2018 4 quarterly installment of C$ 1570 thousand from Novermber 2018 to August 2019 4 quarterly installment of C$ 2100 thousand from Novermber 2019 to November 2020** 7 quarterly installment of C$ 2378 thousand from February 2021 to November 2022 1 quarterly installmetn of C$ 2100 payable in February 2023. 1 quarterly installmetn of C$ 2710 payable in May 2023."
CDOR+310 bps CAD 1,069.85 As per Note No. 8
Vehicle Loan Monthly installments starting from Aug 2014 and ending on Feb 2024
7.50% to 9.39% INR 35.78 As per Note No. 3
Vehicle Loan Monthly installments starting from Aug 2014 and ending on Feb 2024
7.87% to 8.36% INR 1.06 As per Note No. 3
10,684.04
** Repayment Terms are futher enlongated by 6 Months on account of availment of Moratorium based on RBI Guidelines vide no. RBI/2019-20/186. b) Statement of principal terms of unsecured term loan outstanding as on March 31, 2021
Nature of facility Repayment terms Rate of interest % (per annum) Currency
Amount outstanding
(Rs. in million)Security
Loan under New Millennium Indian Technology Leadership Initiative
10 Yearly installments starting from August 1, 2017
3% INR 102.60 Unsecured
102.60
ANNUAL REPORT 2020-21 : NOTES TO THE CONSOLIDATED FINANCIAL STATEMENTS
Notes to the Consolidated Financial Statementfor the year ended March 31, 2021

149
Note No. 1: The following security has been created for the above mentioned facilities:
1. First pari passu (registered mortgage) charge over the immovable fixed assets situated at
a) Plot No. P-2, Rajiv Gandhi Infotech Park, MIDC, Phase-II, Hinjewadi, Pune – 411 057
b) Plot No. D-24, MIDC, Kurkumbh Industrial Area, Daund, Pune – 413 802
c) Plot No. D-24/1, MIDC, Kurkumbh Industrial Area, Daund, Pune - 413 802
2. First pari passu (hypothecation) charge over the all movable fixed assets situated at:
a) Plot No. P-1, Rajiv Gandhi Infotech Park, MIDC, Phase-II, Hinjewadi, Pune – 411 057
b) Plot No. P-2, Rajiv Gandhi Infotech Park, MIDC, Phase-II, Hinjewadi, Pune – 411 057
c) Plot No. D-24, MIDC, Kurkumbh Industrial Area, Daund, Pune – 413 802
d) Plot No. D-24/1, MIDC, Kurkumbh Industrial Area, Daund, Pune - 413 802
3. First pari passu charge on intangible assets (ANDAs and DMFs and acquired brands out of loans proceeds) of the holding company.
4. Second pari passu (hypothecation) charge on current assets of the holding company.
Note No. 2: The following security has been created for the above mentioned facility: Exclusive first charge on:
a) Immovable and movable fixed assets situated at Plot No. SM-14, Sanand Industrial Estate, Gujarat
b) Immovable and movable fixed assets situated at Plot No. SM-15 & 16/1, Sanand Industrial Estate, Gujarat
Note No. 3: The following security has been created for the above mentioned facility:
Secured by Vehicle for which loan is availed.
Note No. 4: The following security has been created for the above mentioned facility
Exclusive first charge on:Immovable fixed assets situated at Plot No. P-1, Rajiv Gandhi Infotech Park, MIDC, Phase-II, Hinjewadi, Pune – 411 057
Note No. 5: The following security has been created for the above mentioned facility:
1. Exclusive Charge on all present and future Immovable & Movable Fixed Assets situated at New Survey No. 485, Kadu, Lakhtar, Surendranager
Note No. 6: The following security has been created for the above mentioned facility:
1. Exclusive Charge on all present and future Immovable & Movable Fixed Assets situated at Rango Plant, Sikkim owned by Zuventus Healthcare Limited
2. Corporate Guanratee of Zuventus Healthcare Limited
Note No. 7: The following security has been created for the above mentioned facility:
1. S. No. 255, Hissa No. 2, Village Hinjewadi, Taluka Mulshi, Pune 411057
2. Plot No. T-184, MIDC, Bhosari, Pune 411026
3. Block No. F-II, Plot No 12/2 & 12/1, Pimpri Industrial Area, Pune 411018.
Note No. 7: The following security has been created for the above mentioned facility:
Secured by Vehicle for which loan is availed.
Note No. 8: The following security has been created for the above mentioned facility:
1. All fixed assets, current assets and intangibles assets of Marcan Pharmaceuticals Inc.,
2. Pledge of Entire Equity Shares of Marcan Pharmaceuticals Inc. held by Emcure Pharmaceuticals Limited (holding company)
3. Corporate Guarantee of Emcure Pharmaceuticals Limited (holding company).
ANNUAL REPORT 2020-21 : NOTES TO THE CONSOLIDATED FINANCIAL STATEMENTS
Notes to the Consolidated Financial Statementfor the year ended March 31, 2021
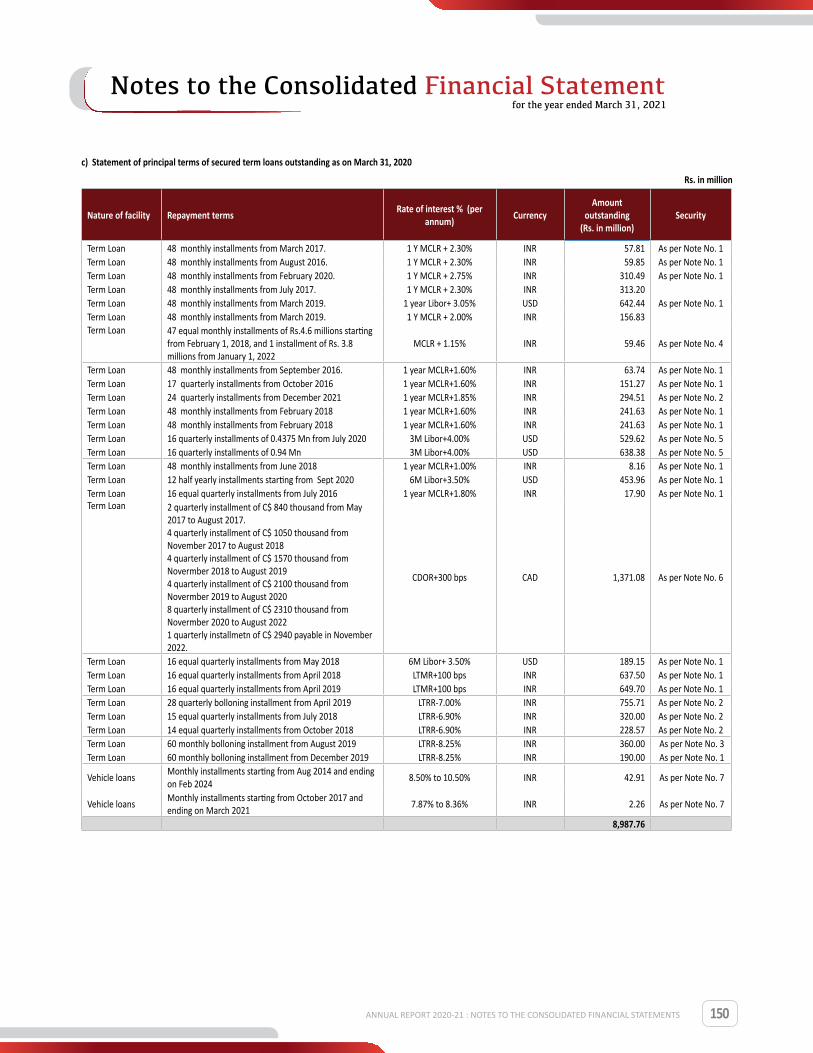
150
c) Statement of principal terms of secured term loans outstanding as on March 31, 2020
Rs. in million
Nature of facility Repayment terms Rate of interest % (per annum) Currency
Amount outstanding
(Rs. in million)Security
Term Loan 48 monthly installments from March 2017. 1 Y MCLR + 2.30% INR 57.81 As per Note No. 1Term Loan 48 monthly installments from August 2016. 1 Y MCLR + 2.30% INR 59.85 As per Note No. 1Term Loan 48 monthly installments from February 2020. 1 Y MCLR + 2.75% INR 310.49 As per Note No. 1Term Loan 48 monthly installments from July 2017. 1 Y MCLR + 2.30% INR 313.20 Term Loan 48 monthly installments from March 2019. 1 year Libor+ 3.05% USD 642.44 As per Note No. 1Term Loan 48 monthly installments from March 2019. 1 Y MCLR + 2.00% INR 156.83 Term Loan 47 equal monthly installments of Rs.4.6 millions starting
from February 1, 2018, and 1 installment of Rs. 3.8 millions from January 1, 2022
MCLR + 1.15% INR 59.46 As per Note No. 4
Term Loan 48 monthly installments from September 2016. 1 year MCLR+1.60% INR 63.74 As per Note No. 1Term Loan 17 quarterly installments from October 2016 1 year MCLR+1.60% INR 151.27 As per Note No. 1Term Loan 24 quarterly installments from December 2021 1 year MCLR+1.85% INR 294.51 As per Note No. 2Term Loan 48 monthly installments from February 2018 1 year MCLR+1.60% INR 241.63 As per Note No. 1Term Loan 48 monthly installments from February 2018 1 year MCLR+1.60% INR 241.63 As per Note No. 1Term Loan 16 quarterly installments of 0.4375 Mn from July 2020 3M Libor+4.00% USD 529.62 As per Note No. 5Term Loan 16 quarterly installments of 0.94 Mn 3M Libor+4.00% USD 638.38 As per Note No. 5Term Loan 48 monthly installments from June 2018 1 year MCLR+1.00% INR 8.16 As per Note No. 1Term Loan 12 half yearly installments starting from Sept 2020 6M Libor+3.50% USD 453.96 As per Note No. 1Term Loan 16 equal quarterly installments from July 2016 1 year MCLR+1.80% INR 17.90 As per Note No. 1Term Loan 2 quarterly installment of C$ 840 thousand from May
2017 to August 2017. 4 quarterly installment of C$ 1050 thousand from November 2017 to August 2018 4 quarterly installment of C$ 1570 thousand from Novermber 2018 to August 2019 4 quarterly installment of C$ 2100 thousand from Novermber 2019 to August 2020 8 quarterly installment of C$ 2310 thousand from Novermber 2020 to August 2022 1 quarterly installmetn of C$ 2940 payable in November 2022.
CDOR+300 bps CAD 1,371.08 As per Note No. 6
Term Loan 16 equal quarterly installments from May 2018 6M Libor+ 3.50% USD 189.15 As per Note No. 1Term Loan 16 equal quarterly installments from April 2018 LTMR+100 bps INR 637.50 As per Note No. 1Term Loan 16 equal quarterly installments from April 2019 LTMR+100 bps INR 649.70 As per Note No. 1Term Loan 28 quarterly bolloning installment from April 2019 LTRR-7.00% INR 755.71 As per Note No. 2Term Loan 15 equal quarterly installments from July 2018 LTRR-6.90% INR 320.00 As per Note No. 2Term Loan 14 equal quarterly installments from October 2018 LTRR-6.90% INR 228.57 As per Note No. 2Term Loan 60 monthly bolloning installment from August 2019 LTRR-8.25% INR 360.00 As per Note No. 3 Term Loan 60 monthly bolloning installment from December 2019 LTRR-8.25% INR 190.00 As per Note No. 1
Vehicle loansMonthly installments starting from Aug 2014 and ending on Feb 2024
8.50% to 10.50% INR 42.91 As per Note No. 7
Vehicle loansMonthly installments starting from October 2017 and ending on March 2021
7.87% to 8.36% INR 2.26 As per Note No. 7
8,987.76
ANNUAL REPORT 2020-21 : NOTES TO THE CONSOLIDATED FINANCIAL STATEMENTS
Notes to the Consolidated Financial Statementfor the year ended March 31, 2021
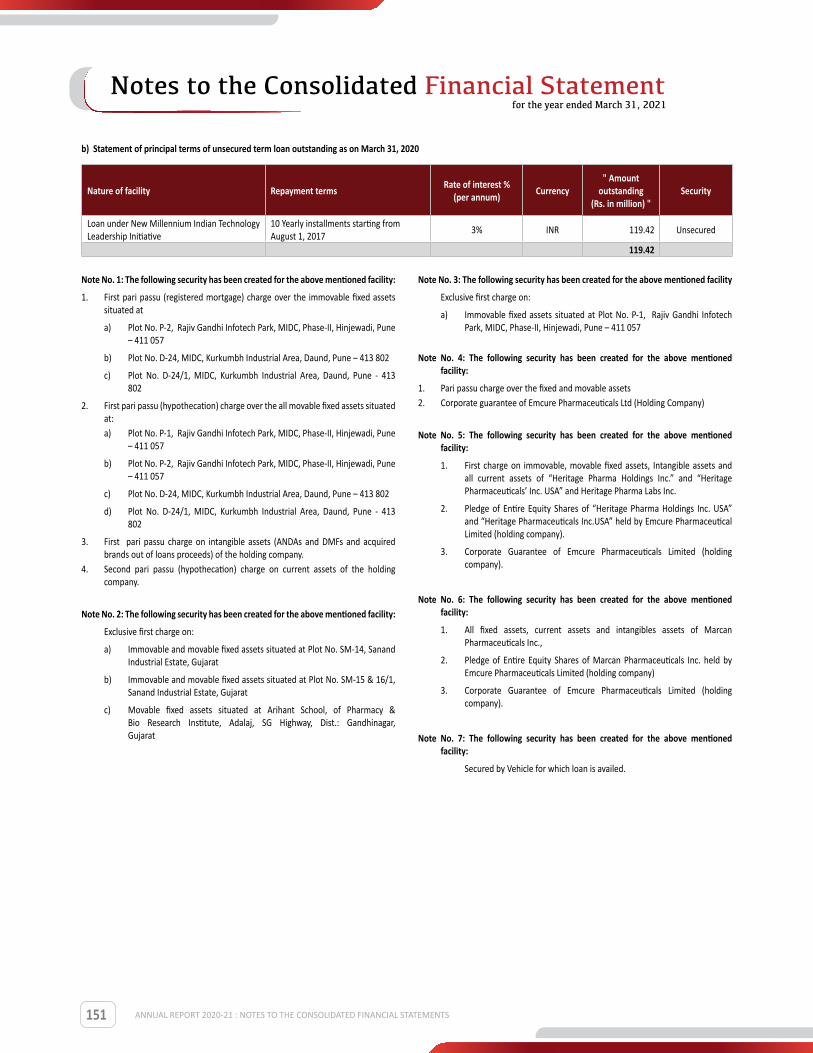
151
b) Statement of principal terms of unsecured term loan outstanding as on March 31, 2020
Nature of facility Repayment terms Rate of interest % (per annum) Currency
" Amount outstanding
(Rs. in million) "Security
Loan under New Millennium Indian Technology Leadership Initiative
10 Yearly installments starting from August 1, 2017
3% INR 119.42 Unsecured
119.42
ANNUAL REPORT 2020-21 : NOTES TO THE CONSOLIDATED FINANCIAL STATEMENTS
Note No. 1: The following security has been created for the above mentioned facility:
1. First pari passu (registered mortgage) charge over the immovable fixed assets situated at
a) Plot No. P-2, Rajiv Gandhi Infotech Park, MIDC, Phase-II, Hinjewadi, Pune – 411 057
b) Plot No. D-24, MIDC, Kurkumbh Industrial Area, Daund, Pune – 413 802
c) Plot No. D-24/1, MIDC, Kurkumbh Industrial Area, Daund, Pune - 413 802
2. First pari passu (hypothecation) charge over the all movable fixed assets situated at: a) Plot No. P-1, Rajiv Gandhi Infotech Park, MIDC, Phase-II, Hinjewadi, Pune
– 411 057
b) Plot No. P-2, Rajiv Gandhi Infotech Park, MIDC, Phase-II, Hinjewadi, Pune – 411 057
c) Plot No. D-24, MIDC, Kurkumbh Industrial Area, Daund, Pune – 413 802
d) Plot No. D-24/1, MIDC, Kurkumbh Industrial Area, Daund, Pune - 413 802
3. First pari passu charge on intangible assets (ANDAs and DMFs and acquired brands out of loans proceeds) of the holding company.
4. Second pari passu (hypothecation) charge on current assets of the holding company.
Note No. 2: The following security has been created for the above mentioned facility:
Exclusive first charge on:
a) Immovable and movable fixed assets situated at Plot No. SM-14, Sanand Industrial Estate, Gujarat
b) Immovable and movable fixed assets situated at Plot No. SM-15 & 16/1, Sanand Industrial Estate, Gujarat
c) Movable fixed assets situated at Arihant School, of Pharmacy & Bio Research Institute, Adalaj, SG Highway, Dist.: Gandhinagar, Gujarat
Note No. 3: The following security has been created for the above mentioned facility
Exclusive first charge on:
a) Immovable fixed assets situated at Plot No. P-1, Rajiv Gandhi Infotech Park, MIDC, Phase-II, Hinjewadi, Pune – 411 057
Note No. 4: The following security has been created for the above mentioned facility:
1. Pari passu charge over the fixed and movable assets2. Corporate guarantee of Emcure Pharmaceuticals Ltd (Holding Company)
Note No. 5: The following security has been created for the above mentioned facility:
1. First charge on immovable, movable fixed assets, Intangible assets and all current assets of “Heritage Pharma Holdings Inc.” and “Heritage Pharmaceuticals’ Inc. USA” and Heritage Pharma Labs Inc.
2. Pledge of Entire Equity Shares of “Heritage Pharma Holdings Inc. USA” and “Heritage Pharmaceuticals Inc.USA” held by Emcure Pharmaceutical Limited (holding company).
3. Corporate Guarantee of Emcure Pharmaceuticals Limited (holding company).
Note No. 6: The following security has been created for the above mentioned facility:
1. All fixed assets, current assets and intangibles assets of Marcan Pharmaceuticals Inc.,
2. Pledge of Entire Equity Shares of Marcan Pharmaceuticals Inc. held by Emcure Pharmaceuticals Limited (holding company)
3. Corporate Guarantee of Emcure Pharmaceuticals Limited (holding company).
Note No. 7: The following security has been created for the above mentioned facility:
Secured by Vehicle for which loan is availed.
Notes to the Consolidated Financial Statementfor the year ended March 31, 2021
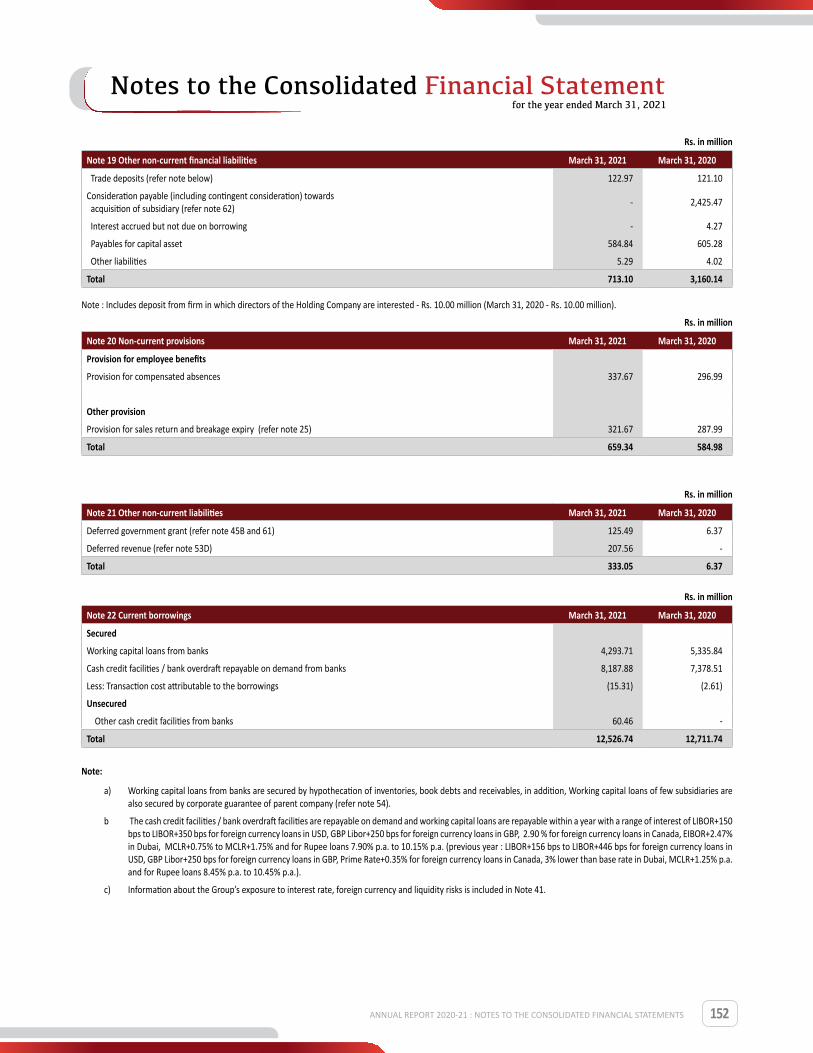
152ANNUAL REPORT 2020-21 : NOTES TO THE CONSOLIDATED FINANCIAL STATEMENTS
Rs. in million
Note 19 Other non-current financial liabilities March 31, 2021 March 31, 2020
Trade deposits (refer note below) 122.97 121.10
Consideration payable (including contingent consideration) towards acquisition of subsidiary (refer note 62)
- 2,425.47
Interest accrued but not due on borrowing - 4.27
Payables for capital asset 584.84 605.28
Other liabilities 5.29 4.02
Total 713.10 3,160.14
Note : Includes deposit from firm in which directors of the Holding Company are interested - Rs. 10.00 million (March 31, 2020 - Rs. 10.00 million).
Rs. in million
Note 20 Non-current provisions March 31, 2021 March 31, 2020
Provision for employee benefits
Provision for compensated absences 337.67 296.99
Other provision
Provision for sales return and breakage expiry (refer note 25) 321.67 287.99
Total 659.34 584.98
Rs. in million
Note 21 Other non-current liabilities March 31, 2021 March 31, 2020
Deferred government grant (refer note 45B and 61) 125.49 6.37
Deferred revenue (refer note 53D) 207.56 -
Total 333.05 6.37
Rs. in million
Note 22 Current borrowings March 31, 2021 March 31, 2020
Secured
Working capital loans from banks 4,293.71 5,335.84
Cash credit facilities / bank overdraft repayable on demand from banks 8,187.88 7,378.51
Less: Transaction cost attributable to the borrowings (15.31) (2.61)
Unsecured
Other cash credit facilities from banks 60.46 -
Total 12,526.74 12,711.74
Note:
a) Working capital loans from banks are secured by hypothecation of inventories, book debts and receivables, in addition, Working capital loans of few subsidiaries are also secured by corporate guarantee of parent company (refer note 54).
b The cash credit facilities / bank overdraft facilities are repayable on demand and working capital loans are repayable within a year with a range of interest of LIBOR+150 bps to LIBOR+350 bps for foreign currency loans in USD, GBP Libor+250 bps for foreign currency loans in GBP, 2.90 % for foreign currency loans in Canada, EIBOR+2.47% in Dubai, MCLR+0.75% to MCLR+1.75% and for Rupee loans 7.90% p.a. to 10.15% p.a. (previous year : LIBOR+156 bps to LIBOR+446 bps for foreign currency loans in USD, GBP Libor+250 bps for foreign currency loans in GBP, Prime Rate+0.35% for foreign currency loans in Canada, 3% lower than base rate in Dubai, MCLR+1.25% p.a. and for Rupee loans 8.45% p.a. to 10.45% p.a.).
c) Information about the Group’s exposure to interest rate, foreign currency and liquidity risks is included in Note 41.
Notes to the Consolidated Financial Statementfor the year ended March 31, 2021

153
Rs. in million
Note 23 Trade payables March 31, 2021 March 31, 2020
Total outstanding dues of micro and small enterprises (refer note 59) - 0.62
Total outstanding dues of creditors other than micro and small enterprises 9,721.94 7,406.01
Total 9,721.94 7,406.63
Note:
1. The Group’s exposure to currency and liquidity risks related to trade payables is disclosed in Note 41.
2. All trade payables are current.
Rs. in million
Note 24 Other financial liabilities March 31, 2021 March 31, 2020
Current maturities of non current borrowing (refer note 18) 3,535.15 3,451.50
Interest accrued but not due on borrowings 103.57 75.19
Interest accrued and due on borrowings - 32.24
Interest accrued and due on trade deposits (refer note (b) below) 1.71 1.67
Consideration payable (including contingent consideration) towards acquisition of 2,750.78 1,065.49
subsidiary (refer note 62)
Employee benefits payable 1,627.96 1,573.45
Other payables 23.88 17.69
Payables for capital asset 334.27 187.18
Total 8,377.32 6,404.41
Note:
a) The Group’s exposure to currency and liquidity risks related to the above financial liabilities is disclosed in note 41.
b) Includes Interest accrued and due on deposit from a firm in which directors of the Holding Company are interested : Rs. 0.17 million (March 31, 2020: Rs.0.17 million)
Rs. in million
Note 25 Current provisions March 31, 2021 March 31, 2020
Provision for employee benefits
Provision for compensated absences 174.95 161.22
Provision for gratuity (refer note 49) 148.02 151.52
Provision for stock appreciation rights (refer note 51) 91.23 106.52
Provision for sales returns and breakage expiry (refer note below) 1,072.76 946.73
Other provisions 10.60 23.94
Total 1,497.56 1,389.93
i) Information about individual provisions and significant estimates
Sales returns and breakage expiry
When a customer has a right to return the product within a given period, the Group recognises a provision for returns. The provision is measured equal to the value of the sales expected to return in the future period. Revenue is adjusted for the expected value of the returns and cost of sales are adjusted for the value of the corresponding goods to be returned.
The Group has a constructive obligation to replace the goods which will expire. The Group has recognised a provision for the returns due to expiry. The provision is measured on the basis of historical trend of expiry against the sales occurred in the current and earlier period. Management considers the sales value for the periods which are equivalent to average general shelf life of products. Revenue is adjusted for the expected value of the returns.
Significant estimates
The Group has constructive obligation to accept the returns and expired products after sales to customers. Management estimates the related provision for future expected returns based on historical information as well as recent trends and change in business conditions that might suggest that past information may differ from future claims. The assumptions made in relation to the current period are consistent with those in the prior years. Factors that could impact the estimated return include pattern of return and success of new products launched, Group’s marketing initiatives, shelf life of products. Where expected value of returns and expiry changes by 5% from management’s estimates, the return provisions would be an estimated Rs 69.72 million higher or lower (March 31, 2020 : Rs 61.74 million higher or lower).
ANNUAL REPORT 2020-21 : NOTES TO THE CONSOLIDATED FINANCIAL STATEMENTS
Notes to the Consolidated Financial Statementfor the year ended March 31, 2021

154
ii) Movements in provisions for sales return and breakage expiry
Rs. in million
Particulars March 31, 2021 March 31, 2020
Beginning of the year 1,234.72 984.67
Provisions made during the year 1,938.40 1,678.03
Effect for unwinding of discounts 38.32 26.59
Provisions utilised during the year (1,811.96) (1,470.37)
Change due to translation of provision of foreign operation (5.05) 15.80
At the end of the year 1,394.43 1,234.72
Rs. in million
Note 26 Income tax assets / liabilities (net) March 31, 2021 March 31, 2020
Income tax assets (net of provisions) 1,665.62 1,551.60
Income tax liabilities (net of advance tax) 616.91 543.30
Net (1,048.71) (1,008.30)
Rs. in million
Note 27 Other current liabilities March 31, 2021 March 31, 2020
Statutory dues including provident fund and withholding taxes 559.62 211.31
Contract liabilities (advances from customers) 121.31 50.36
Deferred government grant (refer note 61) 245.76 -
Other liabilities 90.18 183.47
Total 1,016.87 445.14
Rs. in million
Note 28 Revenue from operations March 31, 2021 March 31, 2020
Sale of products 59,418.37 49,721.55
Sale of services 648.82 326.79
Other operating revenues
Export incentives 216.02 342.17
Scrap sales 48.32 35.03
GST refund received (refer note 65) 33.00 48.74
Income arising from government grant (refer note 61) 199.62 11.26
Total 60,564.15 50,485.54
Rs. in million
Note 29 Other income March 31, 2021 March 31, 2020
Interest income under the effective interest method from banks and others 73.53 21.86
Profit on sale of property, plant & equipment 4.23 -
Gains on foreign exchange fluctuation (net) 147.92 464.30
Miscellaneous income 128.23 336.90
Total 353.91 823.06
ANNUAL REPORT 2020-21 : NOTES TO THE CONSOLIDATED FINANCIAL STATEMENTS
Notes to the Consolidated Financial Statementfor the year ended March 31, 2021
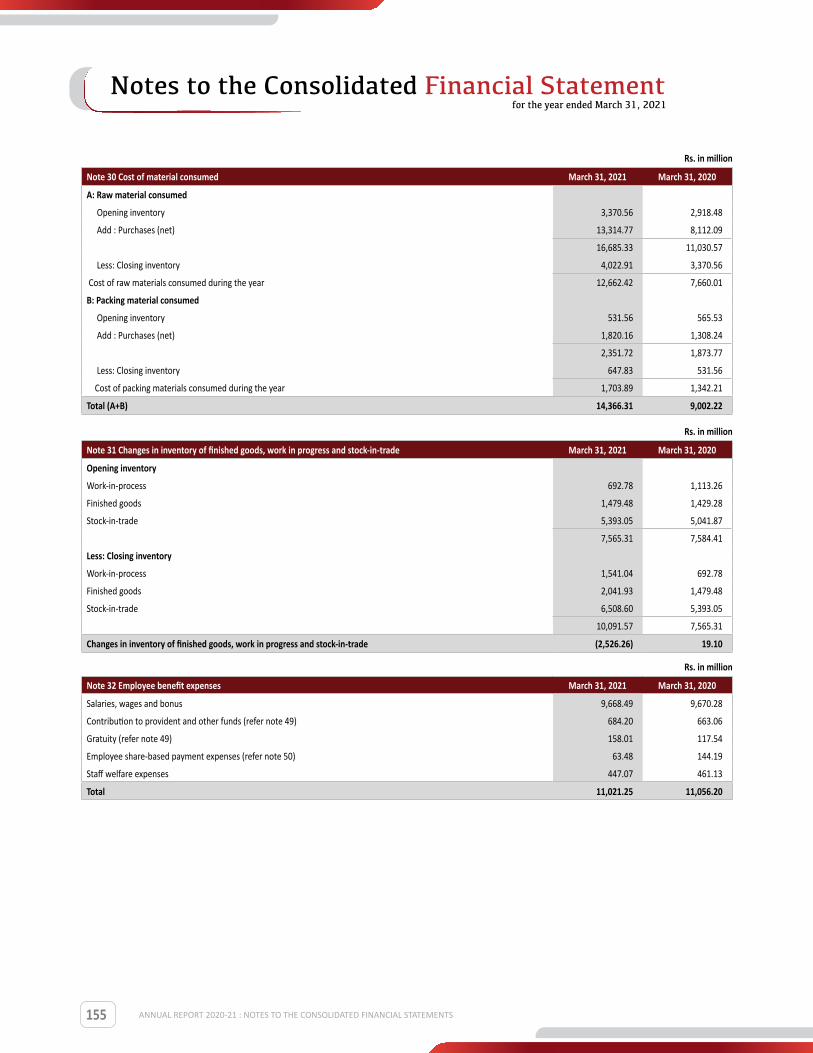
155
Rs. in million
Note 30 Cost of material consumed March 31, 2021 March 31, 2020
A: Raw material consumed
Opening inventory 3,370.56 2,918.48
Add : Purchases (net) 13,314.77 8,112.09
16,685.33 11,030.57
Less: Closing inventory 4,022.91 3,370.56
Cost of raw materials consumed during the year 12,662.42 7,660.01
B: Packing material consumed
Opening inventory 531.56 565.53
Add : Purchases (net) 1,820.16 1,308.24
2,351.72 1,873.77
Less: Closing inventory 647.83 531.56
Cost of packing materials consumed during the year 1,703.89 1,342.21
Total (A+B) 14,366.31 9,002.22
Rs. in million
Note 31 Changes in inventory of finished goods, work in progress and stock-in-trade March 31, 2021 March 31, 2020
Opening inventory
Work-in-process 692.78 1,113.26
Finished goods 1,479.48 1,429.28
Stock-in-trade 5,393.05 5,041.87
7,565.31 7,584.41
Less: Closing inventory
Work-in-process 1,541.04 692.78
Finished goods 2,041.93 1,479.48
Stock-in-trade 6,508.60 5,393.05
10,091.57 7,565.31
Changes in inventory of finished goods, work in progress and stock-in-trade (2,526.26) 19.10
Rs. in million
Note 32 Employee benefit expenses March 31, 2021 March 31, 2020
Salaries, wages and bonus 9,668.49 9,670.28
Contribution to provident and other funds (refer note 49) 684.20 663.06
Gratuity (refer note 49) 158.01 117.54
Employee share-based payment expenses (refer note 50) 63.48 144.19
Staff welfare expenses 447.07 461.13
Total 11,021.25 11,056.20
ANNUAL REPORT 2020-21 : NOTES TO THE CONSOLIDATED FINANCIAL STATEMENTS
Notes to the Consolidated Financial Statementfor the year ended March 31, 2021

156
Rs. in millionNote 33 Other expenses March 31, 2021 March 31, 2020
Processing charges 576.71 358.63
Factory consumables 1,340.68 1,216.80
Contractual Services 456.98 390.30
Power and fuel 1,052.70 1,008.06
Insurance 209.34 429.78
Repair and maintenance 537.58 453.56
Rent 33.49 37.12
Rates and taxes 203.59 179.28
Freight 1,022.92 587.49
Advertisement and promotional materials 1,182.62 1,847.65
Travelling and conveyance 745.80 1,603.26
Commission on sales 546.81 556.16
Printing and stationery 127.34 229.63
Legal and professional fees 1,792.56 1,405.05
Payment to auditors (refer note below) 11.44 11.40
Inventory handling charges 818.44 795.02
Commission to non-whole time directors 16.40 12.30
Directors sitting fees 14.47 11.38
Provision for doubtful debts 259.79 25.82
Loss on sale of property, plant and equipment - 41.57
Bad debts written off 25.28 54.33
Expenditure towards corporate social responsibility (refer note 58) 84.90 69.72
Impairment of Goodwill (refer note 52) - 39.83
Miscellaneous expenses 947.41 730.90
Total 12,007.25 12,095.04
Rs. in million
Note : Payment to auditors March 31, 2021 March 31, 2020
As auditor:
Audit fees excluding taxes 7.46 7.90
Other services 3.65 2.51
Out of pocket expenses 0.33 0.99
Total 11.44 11.40
Rs. in million
Note 34 Depreciation and amortisation expenses March 31, 2021 March 31, 2020
Depreciation on property, plant and equipment 1,872.89 1,845.31
Depreciation on ROU 380.72 369.18
Amortisation of intangible assets 979.49 993.85
Total 3,233.10 3,208.34
ANNUAL REPORT 2020-21 : NOTES TO THE CONSOLIDATED FINANCIAL STATEMENTS
Notes to the Consolidated Financial Statementfor the year ended March 31, 2021

157
Rs. in million
Note 35 Finance cost March 31, 2021 March 31, 2020
Interest on long-term borrowings measured at amortised cost (refer note 2A & 2B) 966.09 1,114.95
Interest on short-term borrowings measured at amortised cost (refer note 2A & 2B) 426.89 773.59
Unwinding of discount on deferred consideration 50.02 74.02
Unwinding of discount on contingent consideration (refer note 62) 108.57 219.55
Interest on shortfall of advance tax 53.51 35.57
Interest accrued On lease liability 119.27 122.12
Other borrowing costs 256.97 158.95
Exchange differences to the extent regarded as an adjustment to borrowing costs - 67.22
Total 1,981.32 2,565.97
Rs. in million
Note 36 Exceptional items March 31, 2021 March 31, 2020
Consultancy fees (see note(i) & (ii) below) 448.99 753.14
Insurance claim receivable written off (see note (iii) below) - 281.65
Impairment of intangible assets (refer note 4) 436.95 -
Total 885.94 1,034.79
Notes :
(i) The Holding company received a warning letter dated March 3, 2016 in respect of its manufacturing location in Pune. The Company’s products are under an ongoing ‘import alert’ from the Food and Drug Administration of the USA (‘US FDA’). Management has taken the necessary corrective actions based on the audit conducted by US FDA with the last response sent on 18th May 2020.
The Company has also engaged external consultants as a part of remediation action for its Hinjewadi plant. Professional fees paid amounting to Rs. 62.99 million (March 31, 2020 - Rs. 361.69 million) to external consultant has been classified as an exceptional item.
(ii) Consultancy fees towards Drug pricing litigation amounting to Rs. 386.00 million (March 31, 2020 Rs. 391.45 million) has been classified as exceptional item.
(iii) During the year ended 31 March 2020, the group without prejudice to its rights and remedies available under law has written off insurance claim receivable amounting to Rs. 281.65 Million on account of significant delays in receipt of the claim from the insurer in relation to the reimbursement of expenditure incurred in the matter pertaining to various litigations in USA.
Rs. in million
Note 37 Tax expenses recognised in statement of profit and loss March 31, 2021 March 31, 2020
Current tax
Current Period 2,046.32 330.21
Tax related to prior years (37.40) (13.66)
Total current tax expense 2,008.92 316.55
Deferred tax
Originating and reversal of temporary differences 179.03 (25.20)
Change in tax rate - (124.00)
Changes in temporary differences of earlier years 199.38 (120.10)
Total deferred tax 378.41 (269.30)
Total 2,387.33 47.25
Rs. in million
Tax income recognised in OCI March 31, 2021 March 31, 2020
Remeasurements of post-employment benefit obligations (6.23) 24.28
Total (6.23) 24.28
ANNUAL REPORT 2020-21 : NOTES TO THE CONSOLIDATED FINANCIAL STATEMENTS
Notes to the Consolidated Financial Statementfor the year ended March 31, 2021

158
Rs. in million
Tax expense recognised in other equity March 31, 2021 March 31, 2020
General reserve (8.88) (9.82)
Total (8.88) (9.82)
Rs. in million
Note 38 Deferred tax assets March 31, 2021 March 31, 2020
Deferred tax assets :
Intangible assets 548.26 434.73
Allowance for doubtful debts - trade receivables 3.75 4.14
Provision - employee benefit 11.88 11.19
Property, plant and equipment - 0.49
Carry forward of tax losses 370.12 316.85
Government grant 71.56 -
Minimum alternate tax credit entitlement 156.95 287.00
Stock appreciation rights 20.86 24.19
Insurance receivable 66.43 68.27
Sales return 128.03 162.00
Inventories 763.14 732.80
Others 569.86 526.83
Lease Liability 41.65 47.99
Total 2,752.49 2,616.48
Deferred tax liabilities :
Property, plant and equipment 136.64 217.30
Intangible assets 0.88 0.26
Others 1,090.27 346.31
Right-of -use assets 41.78 45.00
Total 1,269.57 608.87
Deferred tax assets - net 1,482.92 2,007.61
Rs. in million
Note 38 Deferred tax liabilities March 31, 2021 March 31, 2020
Deferred tax liabilities :
Intangible assets 89.90 166.51
Property, plant and equipment 565.93 569.59
Others 34.84 20.42
Right-of -use assets 214.68 205.80
Total 905.35 962.32
Deferred tax assets :
Carry forward of tax losses - 72.18
Allowance for doubtful debts - trade receivables 66.61 50.69
Provision - Employee benefit 199.47 183.76
Lease Liability 240.44 215.66
Total 506.52 522.29
Deferred tax labilities - net 398.83 440.03
Note: Balances of deferred tax assets and deferred tax liability above, as on the reporting date includes the effects of changes in foreign exchange rates of foreign operations whose functional currency is different than the Group’s functional currency, are considered in foreign currency translation reserve and is shown as others in deferred tax movement note 39.
ANNUAL REPORT 2020-21 : NOTES TO THE CONSOLIDATED FINANCIAL STATEMENTS
Notes to the Consolidated Financial Statementfor the year ended March 31, 2021

159
Significant estimates
In assessing the realisability of the deferred tax asset balance with respect to Minimum alternate tax (MAT) credit entitlements and carry forward tax losses, management has considered whether partial or all of the MAT credit entitlement and carry forward tax losses will not be realised. The ultimate realisation of benefit related to MAT credit and carry forward tax losses is dependent upon the generation of future taxable income greater than book profit as per provisions of Income Tax Act, 1961, before expiry of credit and carry forward period. Management considers the scheduled reversals of deferred tax liabilities, projected future taxable income and tax planning strategy in making this assessment. Based on the level of historical taxable income and projections of future taxable income over the periods in which the MAT credit are deductible as well carry forward losses will be utilised, management believes that the Group will realise the benefit. The amount of deferred tax asset on account of MAT credit and carry forward losses is considered to be realisable, however, could be reduced in the near term if estimates of future taxable income undergo any change as compared to the estimates made by the management as at reporting date. Management has performed the sensitivity analysis on the future expected taxable profits and do not expect any loss of benefit related to these items.
Rs. in million
Reconciliation of tax expense and the accounting profit multiplied by India's tax rate:
March 31, 2021 March 31, 2020
% Amount % Amount
Profit before tax expense 6,573.27 1,053.35
6,573.27 1,053.35
Tax using the Holding Company tax rate of 25.17% (March 31, 2020 — 34.94%) *
25.17% 1,654.49 34.94% 368.08
Tax effect of amounts which are not (deductible) / taxable in calculat-ing taxable income:
Weighted deduction on research and development expenditure 0.00% - -15.88% (167.32)
Non taxable income 0.11% 7.34 0.00% -
Non deductible expenses 0.77% 50.34 13.10% 138.00
Change in tax rate 0.00% - -11.77% (124.00)
Additional allowance for tax purpose -1.11% (73.07) -1.05% (11.04)
One time tax impact due to change in law ** -4.00% (263.02) -25.38% (267.29)
Difference in tax rates in foreign jurisdictions 1.25% 82.05 30.43% 320.50
Difference in tax rates of Indian Subsidiairies 2.86% 188.07 -2.41% (25.40)
Creation/(reversal) of deferred tax liability on undistributed profits 0.00% - -9.63% (101.41)
Tax related to prior years -0.57% (37.40) -1.30% (13.66)
Unrecognised deferred tax assets *** 8.46% 556.39 4.77% 50.23
Changes in temporary differences of earlier years 3.03% 199.32 -11.40% (120.10)
Other items 0.35% 22.82 0.06% 0.66
Effective tax rate 36.31% 2,387.33 4.48% 47.25
* The Holding Company has elected to exercise the option with regards to the tax rate mentioned under section 115BAA of the Income-tax Act, 1961 as introduced by the Taxation Laws (Amendment) Ordinance, 2019. Accordingly, the Holding Company has recognized Provision for Income Tax for the year ended 31 March 2021 basis the rate prescribed in the said section. The impact of this change has been recognized in the statement of Profit & Loss for the year ended 31 March 2021.
** The US Government enacted Coronavirus Aids, Relief and Economic Security Act (CARES Act) on 27-Mar-2020 in response to COVID-19 pandemic.Heritage Pharma Holdings Inc. and its subsidiaries elected to carry back Net Operating Losses (NOLs) of current and preceding financial years to set off against taxable profits of earlier years.
*** The group evaluates its deferred tax assets for realizability based on all positive and negative evidences. Accordingly group has provided for entire valuation allowance amounting to Rs. 555.48 million against deferred tax asset recognised in Heritage Pharma Holding Inc & its subsidiaries, which can not be carried back pursuant to Coronavirus Aids, Relief and Economic Security Act (CARES Act).
ANNUAL REPORT 2020-21 : NOTES TO THE CONSOLIDATED FINANCIAL STATEMENTS
Notes to the Consolidated Financial Statementfor the year ended March 31, 2021
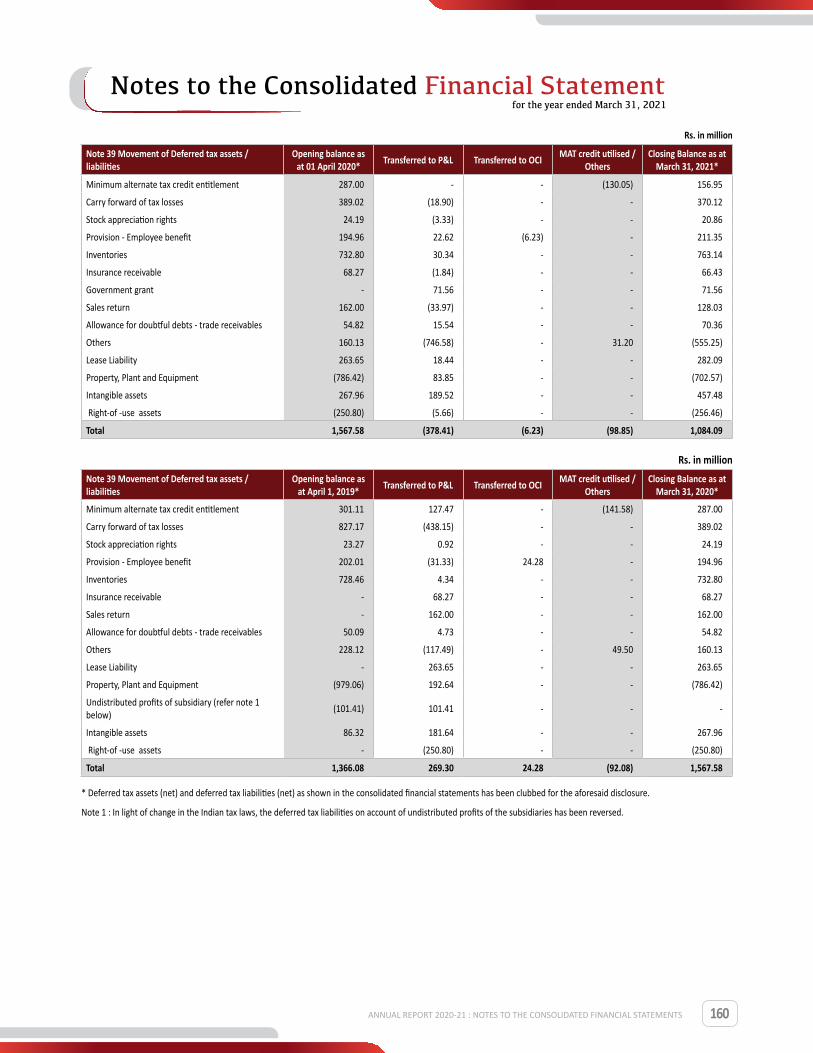
160
Rs. in million
Note 39 Movement of Deferred tax assets / liabilities
Opening balance as at 01 April 2020* Transferred to P&L Transferred to OCI MAT credit utilised /
OthersClosing Balance as at
March 31, 2021*
Minimum alternate tax credit entitlement 287.00 - - (130.05) 156.95
Carry forward of tax losses 389.02 (18.90) - - 370.12
Stock appreciation rights 24.19 (3.33) - - 20.86
Provision - Employee benefit 194.96 22.62 (6.23) - 211.35
Inventories 732.80 30.34 - - 763.14
Insurance receivable 68.27 (1.84) - - 66.43
Government grant - 71.56 - - 71.56
Sales return 162.00 (33.97) - - 128.03
Allowance for doubtful debts - trade receivables 54.82 15.54 - - 70.36
Others 160.13 (746.58) - 31.20 (555.25)
Lease Liability 263.65 18.44 - - 282.09
Property, Plant and Equipment (786.42) 83.85 - - (702.57)
Intangible assets 267.96 189.52 - - 457.48
Right-of -use assets (250.80) (5.66) - - (256.46)
Total 1,567.58 (378.41) (6.23) (98.85) 1,084.09
Rs. in millionNote 39 Movement of Deferred tax assets / liabilities
Opening balance as at April 1, 2019* Transferred to P&L Transferred to OCI MAT credit utilised /
OthersClosing Balance as at
March 31, 2020*
Minimum alternate tax credit entitlement 301.11 127.47 - (141.58) 287.00
Carry forward of tax losses 827.17 (438.15) - - 389.02
Stock appreciation rights 23.27 0.92 - - 24.19
Provision - Employee benefit 202.01 (31.33) 24.28 - 194.96
Inventories 728.46 4.34 - - 732.80
Insurance receivable - 68.27 - - 68.27
Sales return - 162.00 - - 162.00
Allowance for doubtful debts - trade receivables 50.09 4.73 - - 54.82
Others 228.12 (117.49) - 49.50 160.13
Lease Liability - 263.65 - - 263.65
Property, Plant and Equipment (979.06) 192.64 - - (786.42)
Undistributed profits of subsidiary (refer note 1 below)
(101.41) 101.41 - - -
Intangible assets 86.32 181.64 - - 267.96
Right-of -use assets - (250.80) - - (250.80)
Total 1,366.08 269.30 24.28 (92.08) 1,567.58
* Deferred tax assets (net) and deferred tax liabilities (net) as shown in the consolidated financial statements has been clubbed for the aforesaid disclosure.
Note 1 : In light of change in the Indian tax laws, the deferred tax liabilities on account of undistributed profits of the subsidiaries has been reversed.
ANNUAL REPORT 2020-21 : NOTES TO THE CONSOLIDATED FINANCIAL STATEMENTS
Notes to the Consolidated Financial Statementfor the year ended March 31, 2021
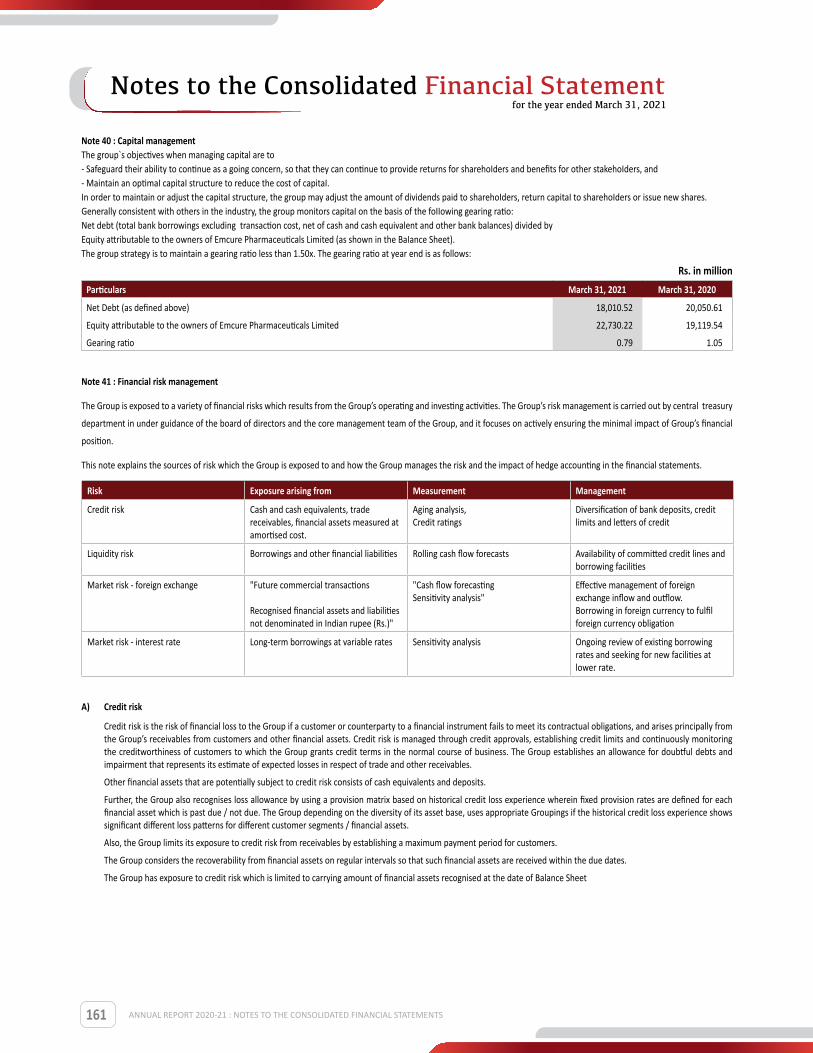
161
Note 40 : Capital management The group`s objectives when managing capital are to - Safeguard their ability to continue as a going concern, so that they can continue to provide returns for sharehoIders and benefits for other stakehoIders, and- Maintain an optimaI capitaI structure to reduce the cost of capitaI.In order to maintain or adjust the capitaI structure, the group may adjust the amount of dividends paid to sharehoIders, return capitaI to sharehoIders or issue new shares.Generally consistent with others in the industry, the group monitors capitaI on the basis of the foIIowing gearing ratio:Net debt (totaI bank borrowings excluding transaction cost, net of cash and cash equivalent and other bank balances) divided byEquity attributable to the owners of Emcure Pharmaceuticals Limited (as shown in the BaIance Sheet).The group strategy is to maintain a gearing ratio less than 1.50x. The gearing ratio at year end is as follows:
Rs. in millionParticulars March 31, 2021 March 31, 2020
Net Debt (as defined above) 18,010.52 20,050.61
Equity attributable to the owners of Emcure Pharmaceuticals Limited 22,730.22 19,119.54
Gearing ratio 0.79 1.05
Note 41 : Financial risk management
The Group is exposed to a variety of financial risks which results from the Group’s operating and investing activities. The Group’s risk management is carried out by central treasury
department in under guidance of the board of directors and the core management team of the Group, and it focuses on actively ensuring the minimal impact of Group’s financial
position.
This note explains the sources of risk which the Group is exposed to and how the Group manages the risk and the impact of hedge accounting in the financial statements.
Risk Exposure arising from Measurement Management
Credit risk Cash and cash equivalents, trade receivables, financial assets measured at amortised cost.
Aging analysis, Credit ratings
Diversification of bank deposits, credit limits and letters of credit
Liquidity risk Borrowings and other financial liabilities Rolling cash flow forecasts Availability of committed credit lines and borrowing facilities
Market risk - foreign exchange "Future commercial transactions Recognised financial assets and liabilities not denominated in Indian rupee (Rs.)"
"Cash flow forecasting Sensitivity analysis"
Effective management of foreign exchange inflow and outflow. Borrowing in foreign currency to fulfil foreign currency obligation
Market risk - interest rate Long-term borrowings at variable rates Sensitivity analysis Ongoing review of existing borrowing rates and seeking for new facilities at lower rate.
A) Credit risk
Credit risk is the risk of financial loss to the Group if a customer or counterparty to a financial instrument fails to meet its contractual obligations, and arises principally from the Group’s receivables from customers and other financial assets. Credit risk is managed through credit approvals, establishing credit limits and continuously monitoring the creditworthiness of customers to which the Group grants credit terms in the normal course of business. The Group establishes an allowance for doubtful debts and impairment that represents its estimate of expected losses in respect of trade and other receivables.
Other financial assets that are potentially subject to credit risk consists of cash equivalents and deposits.
Further, the Group also recognises loss allowance by using a provision matrix based on historical credit loss experience wherein fixed provision rates are defined for each financial asset which is past due / not due. The Group depending on the diversity of its asset base, uses appropriate Groupings if the historical credit loss experience shows significant different loss patterns for different customer segments / financial assets.
Also, the Group limits its exposure to credit risk from receivables by establishing a maximum payment period for customers.
The Group considers the recoverability from financial assets on regular intervals so that such financial assets are received within the due dates.
The Group has exposure to credit risk which is limited to carrying amount of financial assets recognised at the date of Balance Sheet
ANNUAL REPORT 2020-21 : NOTES TO THE CONSOLIDATED FINANCIAL STATEMENTS
Notes to the Consolidated Financial Statementfor the year ended March 31, 2021
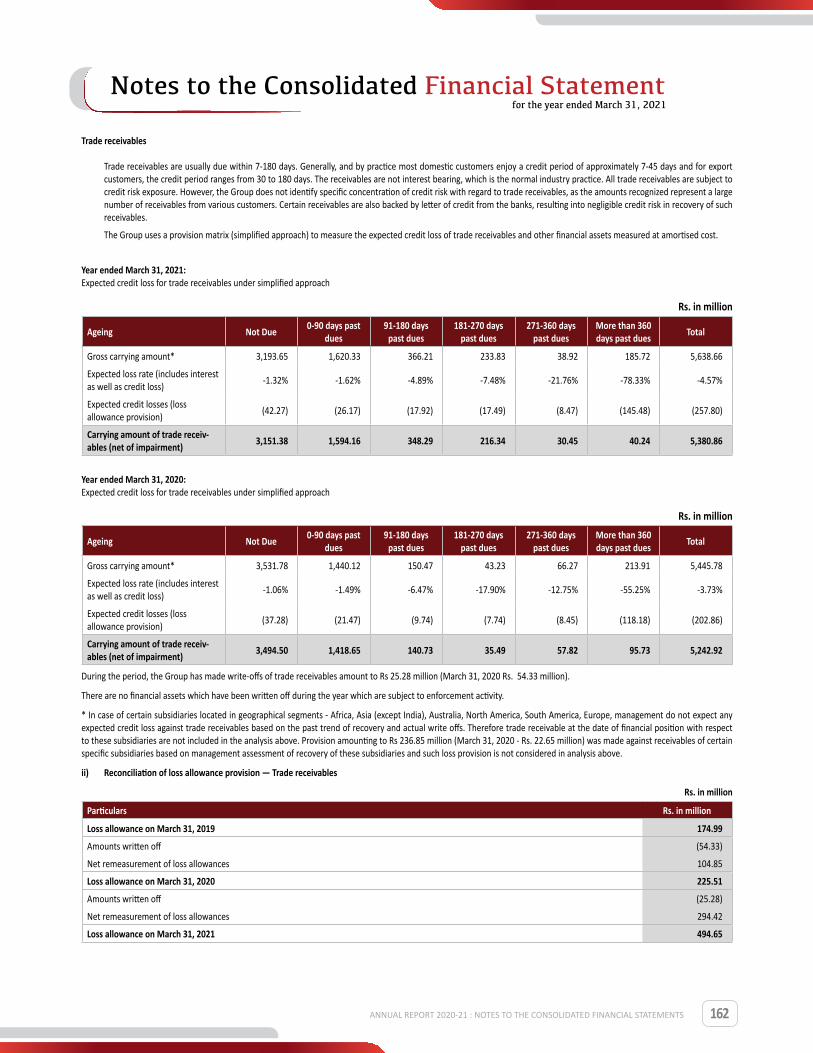
162
Trade receivables
Trade receivables are usually due within 7-180 days. Generally, and by practice most domestic customers enjoy a credit period of approximately 7-45 days and for export customers, the credit period ranges from 30 to 180 days. The receivables are not interest bearing, which is the normal industry practice. All trade receivables are subject to credit risk exposure. However, the Group does not identify specific concentration of credit risk with regard to trade receivables, as the amounts recognized represent a large number of receivables from various customers. Certain receivables are also backed by letter of credit from the banks, resulting into negligible credit risk in recovery of such receivables.
The Group uses a provision matrix (simplified approach) to measure the expected credit loss of trade receivables and other financial assets measured at amortised cost.
Year ended March 31, 2021: Expected credit loss for trade receivables under simplified approach
Rs. in million
Ageing Not Due 0-90 days past dues
91-180 days past dues
181-270 days past dues
271-360 days past dues
More than 360 days past dues Total
Gross carrying amount* 3,193.65 1,620.33 366.21 233.83 38.92 185.72 5,638.66
Expected loss rate (includes interest as well as credit loss)
-1.32% -1.62% -4.89% -7.48% -21.76% -78.33% -4.57%
Expected credit losses (loss allowance provision)
(42.27) (26.17) (17.92) (17.49) (8.47) (145.48) (257.80)
Carrying amount of trade receiv-ables (net of impairment) 3,151.38 1,594.16 348.29 216.34 30.45 40.24 5,380.86
Year ended March 31, 2020: Expected credit loss for trade receivables under simplified approach
Rs. in million
Ageing Not Due 0-90 days past dues
91-180 days past dues
181-270 days past dues
271-360 days past dues
More than 360 days past dues Total
Gross carrying amount* 3,531.78 1,440.12 150.47 43.23 66.27 213.91 5,445.78
Expected loss rate (includes interest as well as credit loss)
-1.06% -1.49% -6.47% -17.90% -12.75% -55.25% -3.73%
Expected credit losses (loss allowance provision)
(37.28) (21.47) (9.74) (7.74) (8.45) (118.18) (202.86)
Carrying amount of trade receiv-ables (net of impairment) 3,494.50 1,418.65 140.73 35.49 57.82 95.73 5,242.92
During the period, the Group has made write-offs of trade receivables amount to Rs 25.28 million (March 31, 2020 Rs. 54.33 million).
There are no financial assets which have been written off during the year which are subject to enforcement activity.
* In case of certain subsidiaries located in geographical segments - Africa, Asia (except India), Australia, North America, South America, Europe, management do not expect any expected credit loss against trade receivables based on the past trend of recovery and actual write offs. Therefore trade receivable at the date of financial position with respect to these subsidiaries are not included in the analysis above. Provision amounting to Rs 236.85 million (March 31, 2020 - Rs. 22.65 million) was made against receivables of certain specific subsidiaries based on management assessment of recovery of these subsidiaries and such loss provision is not considered in analysis above.
ii) Reconciliation of loss allowance provision — Trade receivables
Rs. in million
Particulars Rs. in million
Loss allowance on March 31, 2019 174.99
Amounts written off (54.33)
Net remeasurement of loss allowances 104.85
Loss allowance on March 31, 2020 225.51
Amounts written off (25.28)
Net remeasurement of loss allowances 294.42
Loss allowance on March 31, 2021 494.65
ANNUAL REPORT 2020-21 : NOTES TO THE CONSOLIDATED FINANCIAL STATEMENTS
Notes to the Consolidated Financial Statementfor the year ended March 31, 2021

163
Cash and Cash Equivalents and Deposits with Banks:
With respect to the cash and cash equivalents and deposits with banks, the concentration of credit risk is negligible as these are kept with the reputed banks with very high credit worthiness.
B) Liquidity risk
Liquidity risk management implies maintaining sufficient cash and avaiIabiIity of funds through adequate amount of committed credit facility to meet the commitments arising out of financial liabilities. Due to the dynamic nature of the underlying business, the Group maintains fIexibiIity in funding by maintaining avaiIabiIity under committed credit Iines. In addition, the Group’s liquidity management policy involves projecting cash flows and considering the IeveI of liquid assets necessary to meet future requirements, monitoring balance sheet liquidity ratios against debt covenants and maintaining debt financing plans and ensuring compliance with regulatory requirements.
The Group manages its liquidity needs by carefully monitoring scheduled debt payments as well as cash requirement for day-to-day business. Liquidity needs are monitored regularly as well as on the basis of a 30-day cash flow projection. Long-term liquidity needs for a period from 180 to 360 days period are identified and reviewed at regular intervals.
The Group maintains cash and marketable securities to meet its liquidity requirements. Funding in regards to long-term liquidity needs is additionally secured by an adequate amount of committed credit facilities. The Group is confident of being able to roll forward its short term borrowings.
i) Financing arrangements
The Group has access to undrawn borrowing facilities including overdraft facility at the end of the reporting period.
The bank overdraft facilities may be drawn at any time and may be terminated by the bank without notice subject to the continuance of satisfactory credit ratings.
ii) Maturities of financial liabilities
The tables below analyse the Group`s financial liabilities into relevant maturity Groupings based on their contractual maturities for:
- aII non-derivative financial IiabiIities, and
- net and gross settIed derivative financial instruments for which the contractual maturities are essential for an understanding of the timing of the cash fIows.
The amounts disclosed in the tabIe are the contractual undiscounted cash fIows. BaIances due within 12 months equaI their carrying baIances as the impact of discounting is not significant.
Rs. in millionContractual maturities of financial liabilities within 1 year 1 to 2 years 2 to 5 years More than 5 years Total
March 31 2021
Trade Payable 9,721.94 - - - 9,721.94
Short term borrowing 12,526.74 - - - 12,526.74
Long term borrowing 3,535.15 2,478.68 4,112.20 448.82 10,574.85
Consideration (including contingent consideration) payable towards acquisition of subsidiary
2,750.78 - - - 2,750.78
Trade deposits - - 122.97 - 122.97
Lease Liabilities 422.46 374.68 673.98 540.50 2,011.62
Other financial liabilities 2,091.39 5.29 584.84 - 2,681.52
Total 31,048.46 2,858.65 5,493.99 989.32 40,390.42
March 31 2020
Trade Payable 7,406.63 - - - 7,406.63
Short term borrowing 12,711.74 - - - 12,711.74
Long term borrowing 3,451.50 2,368.02 3,164.96 - 8,984.48
Consideration (including contingent consideration) payable towards acquisition of subsidiary
1,065.49 2,425.47 - - 3,490.96
Trade deposits - - 121.10 - 121.10
Lease Liabilities 395.24 361.08 793.23 666.21 2,215.76
Other financial liabilities 1,887.42 8.29 605.28 2,500.99
Total 26,918.02 5,162.86 4,684.57 666.21 37,431.66
ANNUAL REPORT 2020-21 : NOTES TO THE CONSOLIDATED FINANCIAL STATEMENTS
Notes to the Consolidated Financial Statementfor the year ended March 31, 2021

164
C) Market risk
Market risk is the risk that changes in market prices – such as foreign exchange rates and interest rates – will affect the Group’s income or the value of its holdings of financial instruments. The objective of market risk management is to manage and control market risk exposures within acceptable parameters, while optimising the return.
i) Foreign currency risk
The Group operates in international market and a major portion of its business is transacted in different currencies and consequently the Group is exposed to foreign exchange risk through its sales and services and imported purchase to / from various countries.
The Group’s foreign currency exposure is mainly in USD, EURO and GBP. The Group’s financial liabilities mainly constitutes bank loans and trade payable. Further, the Group receives foreign currency against its exports receivables on regular basis against which the Group pays its loan and import commitments. To mitigate the risk arising on account of foreign exchange fluctuation management closely monitors the cash inflows based on review of expected future movement.
The bulk of contributions to the Group’s assets, liabilities, income and expenses in foreign currency are denominated in USD, Euro and GBP. Foreign currency denominated financial assets and liabilities expressed in Rs. as at the closing are as follows:
Foreign currency risk exposure:
Foreign currency in million Rs. in millionParticulars Currency March 31, 2021 March 31, 2020 March 31, 2021 March 31, 2020
Financial assets
Receivables (including other receivables) EURO 3.86 3.10 331.15 258.18
USD 25.75 33.45 1,882.35 2,530.95
Others* 0.85 0.62 48.51 28.82
Cash and cash equivalents USD 2.62 2.43 191.77 183.60
EURO 1.29 1.57 110.58 130.04
Others* 0.13 0.05 0.13 0.05
Total 2,564.49 3,131.64
Financial liabilities
Trade Payable EURO 3.09 2.07 264.73 172.32
USD 12.09 9.54 883.52 721.74
GBP 0.07 0.09 7.26 8.30
Others - 1.14 0.10 0.89
Other Financial Liabilities USD 0.77 0.03 56.29 2.29
GBP - 0.02 - 1.41
Loans Payable USD 66.18 16.99 4,838.09 1,285.55
GBP - 6.00 - 563.64
Total 6,049.99 2,756.14
** Foreign currencies of insignificant value
Sensitivity
Rs. in million
ParticularsImpact on profit before tax
March 31, 2021 March 31, 2020
USD sensitivity
USD/INR -Increase by 4% (March 31, 2020-4%)* (148.15) 28.20
USD/INR -Decrease by -4% (March 31, 2020-4%)* 148.15 (28.20)
EURO sensitivity
EURO/INR -Increase by 2% (March 31, 2020-2%)* 3.54 4.32
EURO/INR -Decrease by -2% (March 31, 2020-2%)* (3.54) (4.32)
GBP sensitivity
GBP/INR -Increase by 8% (March 31, 2020-8%)* (0.58) (45.87)
GBP/INR -Decrease by -8% (March 31, 2020-8%)* 0.57 45.87
* * Holding all other variables constant
ANNUAL REPORT 2020-21 : NOTES TO THE CONSOLIDATED FINANCIAL STATEMENTS
Notes to the Consolidated Financial Statementfor the year ended March 31, 2021
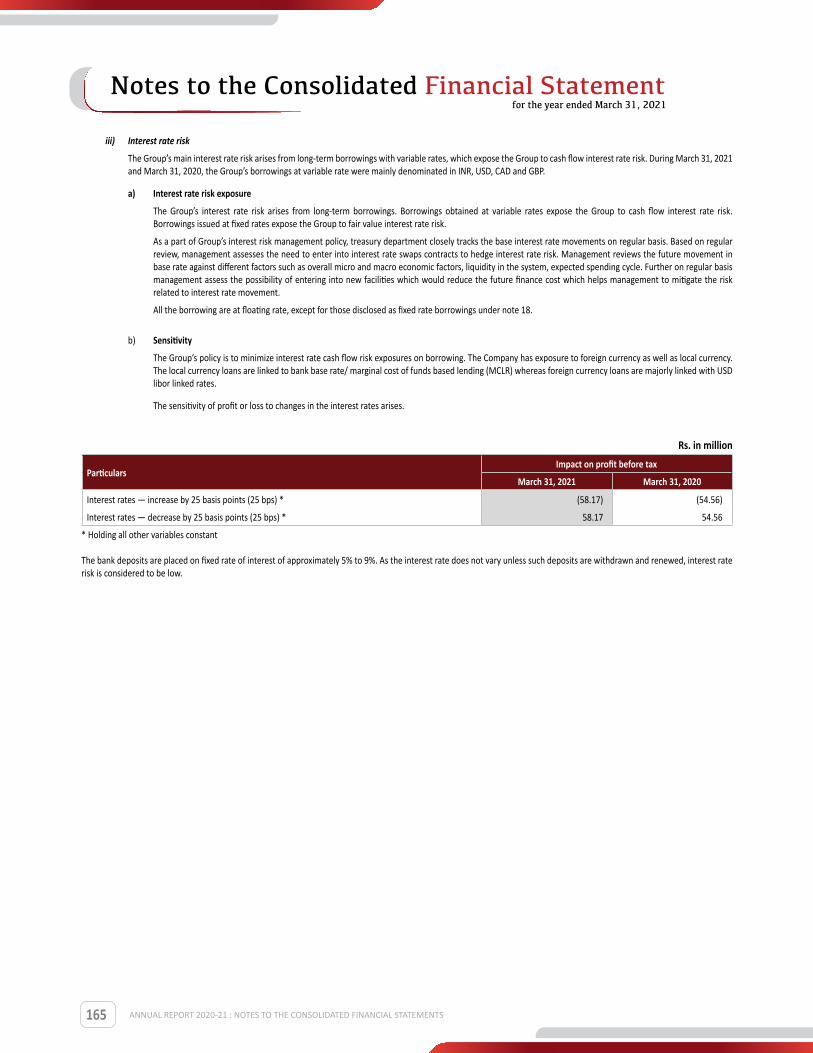
165
iii) Interest rate risk
The Group’s main interest rate risk arises from long-term borrowings with variable rates, which expose the Group to cash flow interest rate risk. During March 31, 2021 and March 31, 2020, the Group’s borrowings at variable rate were mainly denominated in INR, USD, CAD and GBP.
a) Interest rate risk exposure
The Group’s interest rate risk arises from long-term borrowings. Borrowings obtained at variable rates expose the Group to cash flow interest rate risk. Borrowings issued at fixed rates expose the Group to fair value interest rate risk.
As a part of Group’s interest risk management policy, treasury department closely tracks the base interest rate movements on regular basis. Based on regular review, management assesses the need to enter into interest rate swaps contracts to hedge interest rate risk. Management reviews the future movement in base rate against different factors such as overall micro and macro economic factors, liquidity in the system, expected spending cycle. Further on regular basis management assess the possibility of entering into new facilities which would reduce the future finance cost which helps management to mitigate the risk related to interest rate movement.
All the borrowing are at floating rate, except for those disclosed as fixed rate borrowings under note 18.
b) Sensitivity
The Group’s policy is to minimize interest rate cash flow risk exposures on borrowing. The Company has exposure to foreign currency as well as local currency. The local currency loans are linked to bank base rate/ marginal cost of funds based lending (MCLR) whereas foreign currency loans are majorly linked with USD libor linked rates.
The sensitivity of profit or loss to changes in the interest rates arises.
Rs. in million
ParticularsImpact on profit before tax
March 31, 2021 March 31, 2020
Interest rates — increase by 25 basis points (25 bps) * (58.17) (54.56)
Interest rates — decrease by 25 basis points (25 bps) * 58.17 54.56
* Holding all other variables constant
The bank deposits are placed on fixed rate of interest of approximately 5% to 9%. As the interest rate does not vary unless such deposits are withdrawn and renewed, interest rate risk is considered to be low.
ANNUAL REPORT 2020-21 : NOTES TO THE CONSOLIDATED FINANCIAL STATEMENTS
Notes to the Consolidated Financial Statementfor the year ended March 31, 2021

166
Note 42 : Fair value measurements
A. Accounting classifications and fair value
The following table shows the carrying amounts and fair values of financial assets and financial liabilities, including their level in the fair value hierarchy.
Rs. in million
March 31, 2021 Carrying amounts and fair values of financial assets and financial liabilities
Carrying amounts valued at Fair value
FVTPL Amortised Cost Cost Total Level 1 Level 2 Level 3 Total
Financial assets not measured at fair value*
Investment - 0.03 - 0.03 - - - -
Security deposits - 289.00 - 289.00 - - - -
Trade receivables - 14,753.62 - 14,753.62 - - - -
Cash and cash equivalents - 4,687.46 - 4,687.46 - - - -
Term deposits with banks - 630.72 - 630.72 - - - -
Other financial assets - 151.11 - 151.11 - - - -
Total financial assets - 20,511.94 - 20,511.94 - - - -
Financial liabilities not measured at fair value*
Long term borrowings (including current maturities) - 10,574.85 - 10,574.85 - - - -
Short term borrowings - 12,526.74 - 12,526.74 - - - -
Lease Liabilities 1,492.48 1,492.48 - - - -
Trade deposits - 122.97 - 122.97 - - - -
Trade payables - 9,721.94 - 9,721.94 - - - -
Creditors for capital assets - 919.11 - 919.11 - - - -
Other financial liabilities - 1,762.41 - 1,762.41 - - - -
Financial liabilities measured at fair value
Consideration (including contingent consideration) payable towards acquisition of subsidiary
2,750.78 - - 2,750.78 - - 2,750.78 2,750.78
Total financial liabilities 2,750.78 37,120.50 - 39,871.28 - - 2,750.78 2,750.78
ANNUAL REPORT 2020-21 : NOTES TO THE CONSOLIDATED FINANCIAL STATEMENTS
Notes to the Consolidated Financial Statementfor the year ended March 31, 2021
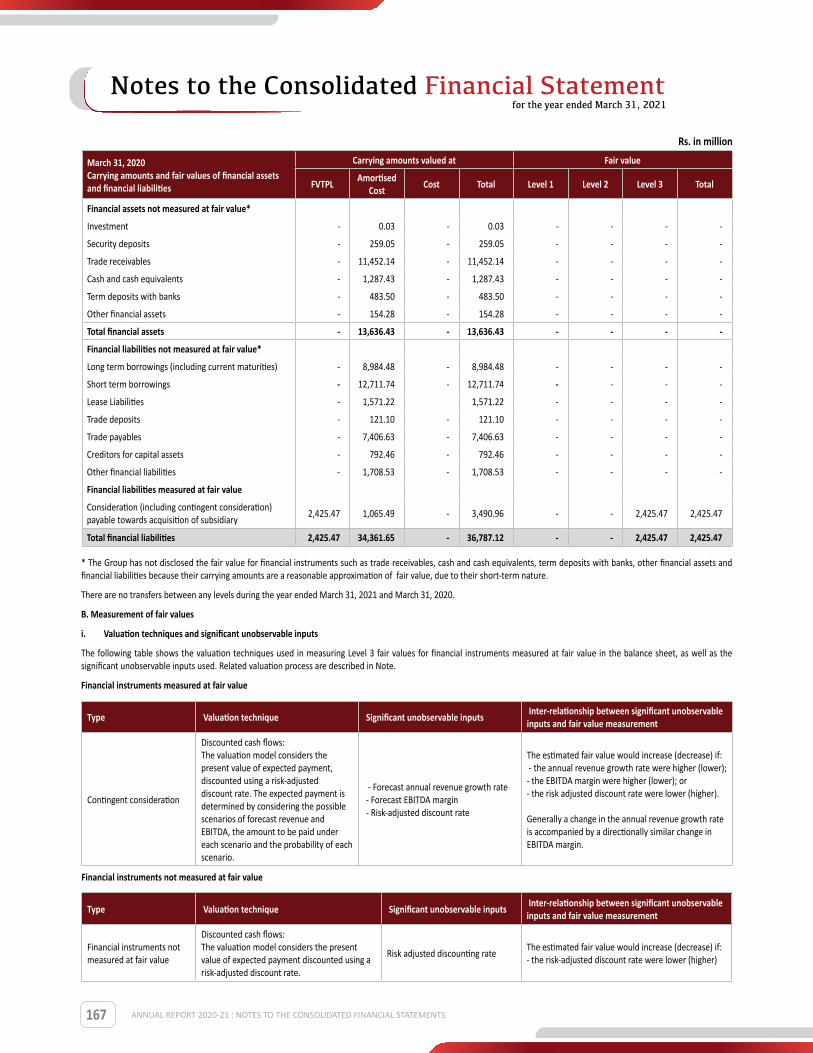
167
Rs. in million
March 31, 2020 Carrying amounts and fair values of financial assets and financial liabilities
Carrying amounts valued at Fair value
FVTPL Amortised Cost Cost Total Level 1 Level 2 Level 3 Total
Financial assets not measured at fair value*
Investment - 0.03 - 0.03 - - - -
Security deposits - 259.05 - 259.05 - - - -
Trade receivables - 11,452.14 - 11,452.14 - - - -
Cash and cash equivalents - 1,287.43 - 1,287.43 - - - -
Term deposits with banks - 483.50 - 483.50 - - - -
Other financial assets - 154.28 - 154.28 - - - -
Total financial assets - 13,636.43 - 13,636.43 - - - -
Financial liabilities not measured at fair value*
Long term borrowings (including current maturities) - 8,984.48 - 8,984.48 - - - -
Short term borrowings - 12,711.74 - 12,711.74 - - - -
Lease Liabilities - 1,571.22 1,571.22 - - - -
Trade deposits - 121.10 - 121.10 - - - -
Trade payables - 7,406.63 - 7,406.63 - - - -
Creditors for capital assets - 792.46 - 792.46 - - - -
Other financial liabilities - 1,708.53 - 1,708.53 - - - -
Financial liabilities measured at fair value
Consideration (including contingent consideration) payable towards acquisition of subsidiary
2,425.47 1,065.49 - 3,490.96 - - 2,425.47 2,425.47
Total financial liabilities 2,425.47 34,361.65 - 36,787.12 - - 2,425.47 2,425.47
* The Group has not disclosed the fair value for financial instruments such as trade receivables, cash and cash equivalents, term deposits with banks, other financial assets and financial liabilities because their carrying amounts are a reasonable approximation of fair value, due to their short-term nature.
There are no transfers between any levels during the year ended March 31, 2021 and March 31, 2020.
B. Measurement of fair values
i. Valuation techniques and significant unobservable inputs
The following table shows the valuation techniques used in measuring Level 3 fair values for financial instruments measured at fair value in the balance sheet, as well as the significant unobservable inputs used. Related valuation process are described in Note.
Financial instruments measured at fair value
Type Valuation technique Significant unobservable inputs Inter-relationship between significant unobservable inputs and fair value measurement
Contingent consideration
Discounted cash flows: The valuation model considers the present value of expected payment, discounted using a risk-adjusted discount rate. The expected payment is determined by considering the possible scenarios of forecast revenue and EBITDA, the amount to be paid under each scenario and the probability of each scenario.
- Forecast annual revenue growth rate - Forecast EBITDA margin - Risk-adjusted discount rate
The estimated fair value would increase (decrease) if: - the annual revenue growth rate were higher (lower); - the EBITDA margin were higher (lower); or - the risk adjusted discount rate were lower (higher). Generally a change in the annual revenue growth rate is accompanied by a directionally similar change in EBITDA margin.
Financial instruments not measured at fair value
Type Valuation technique Significant unobservable inputs Inter-relationship between significant unobservable inputs and fair value measurement
Financial instruments not measured at fair value
Discounted cash flows: The valuation model considers the present value of expected payment discounted using a risk-adjusted discount rate.
Risk adjusted discounting rateThe estimated fair value would increase (decrease) if: - the risk-adjusted discount rate were lower (higher)
ANNUAL REPORT 2020-21 : NOTES TO THE CONSOLIDATED FINANCIAL STATEMENTS
Notes to the Consolidated Financial Statementfor the year ended March 31, 2021
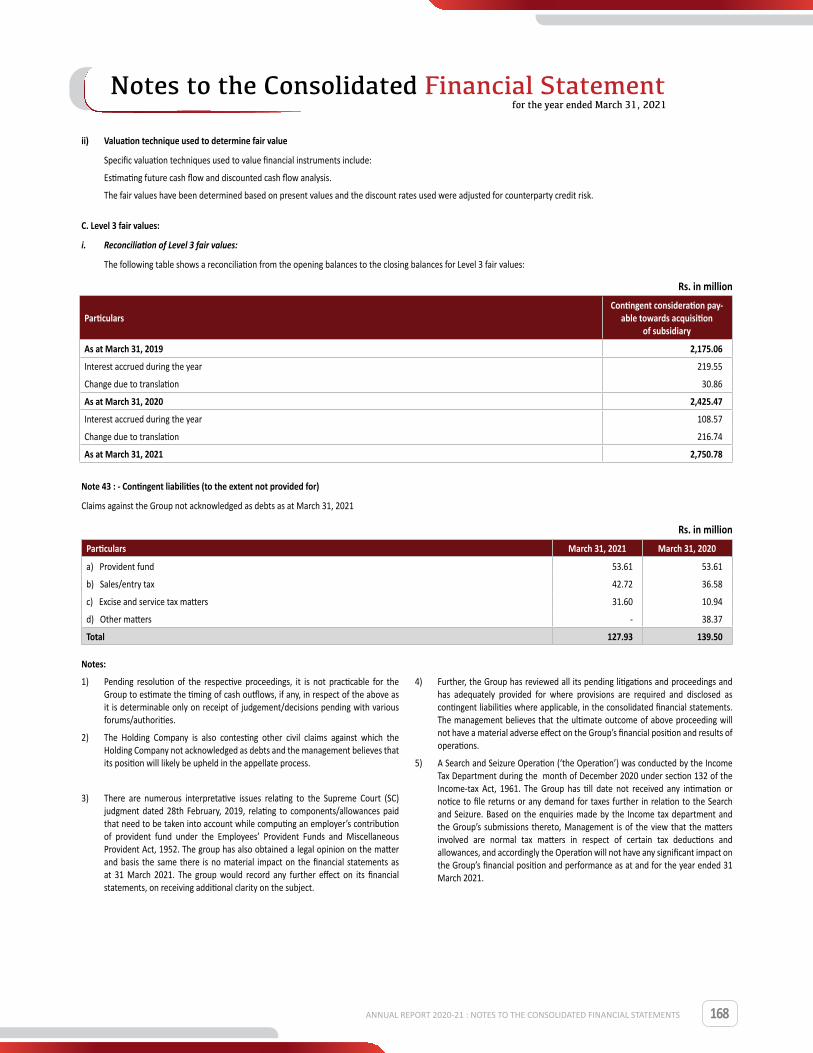
168
ii) Valuation technique used to determine fair value
Specific valuation techniques used to value financial instruments include:
Estimating future cash flow and discounted cash flow analysis.
The fair values have been determined based on present values and the discount rates used were adjusted for counterparty credit risk.
C. Level 3 fair values:
i. Reconciliation of Level 3 fair values:
The following table shows a reconciliation from the opening balances to the closing balances for Level 3 fair values:
Rs. in million
ParticularsContingent consideration pay-
able towards acquisition of subsidiary
As at March 31, 2019 2,175.06
Interest accrued during the year 219.55
Change due to translation 30.86
As at March 31, 2020 2,425.47
Interest accrued during the year 108.57
Change due to translation 216.74
As at March 31, 2021 2,750.78
Note 43 : - Contingent liabilities (to the extent not provided for)
Claims against the Group not acknowledged as debts as at March 31, 2021
Rs. in millionParticulars March 31, 2021 March 31, 2020
a) Provident fund 53.61 53.61
b) Sales/entry tax 42.72 36.58
c) Excise and service tax matters 31.60 10.94
d) Other matters - 38.37
Total 127.93 139.50
ANNUAL REPORT 2020-21 : NOTES TO THE CONSOLIDATED FINANCIAL STATEMENTS
Notes to the Consolidated Financial Statementfor the year ended March 31, 2021
Notes:
1) Pending resolution of the respective proceedings, it is not practicable for the Group to estimate the timing of cash outflows, if any, in respect of the above as it is determinable only on receipt of judgement/decisions pending with various forums/authorities.
2) The Holding Company is also contesting other civil claims against which the Holding Company not acknowledged as debts and the management believes that its position will likely be upheld in the appellate process.
3) There are numerous interpretative issues relating to the Supreme Court (SC) judgment dated 28th February, 2019, relating to components/allowances paid that need to be taken into account while computing an employer’s contribution of provident fund under the Employees’ Provident Funds and Miscellaneous Provident Act, 1952. The group has also obtained a legal opinion on the matter and basis the same there is no material impact on the financial statements as at 31 March 2021. The group would record any further effect on its financial statements, on receiving additional clarity on the subject.
4) Further, the Group has reviewed all its pending litigations and proceedings and has adequately provided for where provisions are required and disclosed as contingent liabilities where applicable, in the consolidated financial statements. The management believes that the ultimate outcome of above proceeding will not have a material adverse effect on the Group’s financial position and results of operations.
5) A Search and Seizure Operation (‘the Operation’) was conducted by the Income Tax Department during the month of December 2020 under section 132 of the Income-tax Act, 1961. The Group has till date not received any intimation or notice to file returns or any demand for taxes further in relation to the Search and Seizure. Based on the enquiries made by the Income tax department and the Group’s submissions thereto, Management is of the view that the matters involved are normal tax matters in respect of certain tax deductions and allowances, and accordingly the Operation will not have any significant impact on the Group’s financial position and performance as at and for the year ended 31 March 2021.

169
Note 44 : - Other legal matters
a. Eli Lilly Co. v. Emcure Pharmaceuticals USA, Inc. and Emcure Pharmaceuticals Ltd., et al. (Pemetrexed Injection)
In August 2015, Eli Lilly Company filed suit against the Holding Company and its subsidiary Heritage Pharma Labs Inc. (erstwhile Emcure Pharmaceuticals USA, Inc.)(collectively “Emcure”) alleging infringement of United States Patent No. 7,772,209 (the “‘209 patent”) in connection with its pemetrexed for injection, 500 mg/vial, product sold under the trade name ALIMTA®. In July 2016, the litigation was dismissed in favor of a consolidated inter partes review (“IPR”) filed by Sandoz with multiple generics as co-defendants before the United States Patent and Trademark Office (“US PTO”). In October 2017, the US PTO issued a ruling on the ‘209 patent that was unfavorable to the generics. Sandoz filed an appeal of the US PTO’s ruling in the IPR to the Federal Circuit.
Because Emcure declined to participate in Sandoz’s appeal of the US PTO’s ruling, in February 2018, the parties agreed to enter into an administrative closure of the litigation against Emcure in exchange for Emcure’s agreement to be bound by a Stipulated Preliminary Injunction entered against Sandoz pending the appeal to the Federal Circuit that will prevent the launch of a generic pemetrexed for injection product prior to the expiration of the ‘209 patent.
On June 4, 2019, the Federal Circuit issued a ruling on the IPR appeal that was unfavorable to the generics. The Group now expects the branded product to be protected from competition from ANDA filers until May 2022, the day after the paediatric exclusivity associated with the ‘209 patent expires.
b. Celgene Corporation v. Emcure Pharmaceuticals Ltd. and Heritage Pharmaceuticals Inc. (Apremilast Tablet)
In June 2018,November 2018 and April 2019, Celgene Corporation (“Celgene”) filed suit against the Holding Company and its subsidiary Heritage Pharmaceuticals Inc. (“Heritage”) (together “Emcure”) alleging infringement of four U.S. patents: 7,427,638, 7,893,101, 9,872,854, and 10,092,541. Celgene based its infringement allegations on Emcure’s filing of an ANDA seeking approval by the FDA to sell a generic version of an apremilast product sold under the trade name OTEZLA® prior to the expiration of each of these four asserted patentsIn August 2019, Amgen Inc. (Amgen) announced the purchase of OTEZLA® from Celgene and Amgen continued litigating this case against the Holding Company and Heritage as a substituted plaintiff.
In May 2020, the case was settled and the litigation was dismissed in its entirely with no liability established against Emcure. Under the confidential terms of the settlement, Emcure received a license from Amgen to begin selling its generic apremilast product on a date prior to the expiration of the asserted patents.
c. Novartis Pharmaceutical Corp v. Emcure Pharmaceuticals Ltd. & Heritage Pharmaceuticals Inc. (Fingolimod Tablet)
In July 2018, Novartis Pharmaceuticals Corporation (“Novartis”) filed two separa te suits against a number of defendants including the Holding Company and its subsidiary Heritage Pharmaceuticals Inc. (together “Emcure”) alleging infringement of two U.S. patents: 9,187,405 and 10,543,179. Novartis based its infringement allegations on Emcure’s filing of an ANDA seeking approval by the FDA to sell a generic version of a tableted fingolimod product and sold under the trade name GILENYA® prior to the expiration of these two asserted patents.
In May 2020, the case was settled and the litigation was dismissed in its entirely with no liability established against the Emcure. Under the confidential terms of the settlement, Heritage received a license from Novartis to begin selling its generic fingolimod product on a date prior to the expiration of the asserted patents.
d. AstraZeneca Vs Emcure CS (COMM)-407/2020 (Dapagliflozin Tablet)
On Sep 29, 2020, Emcure received an e-mail communication from AstraZeneca’s lawyer informing about the filing of a patent infringement suit for asserting two patents related to Dapagliflozin. The asserted patents were IN205147 and IN235625. However, during the injunction trial, Emcure informed the Court that “Emcure will not be manufacturing and/or launching its product as it has lost commercial interest in Dapagliflozin”. The matter is under appeal and is pending before Delhi High Court to decide the validity and/or infringement of the aforesaid patents.
Drug Pricing Matters:
Department of Justice (DOJ)
On December 2, 2015,Heritage Pharmaceuticals Inc (Heritage) learned that the United States Department of Justice, Antitrust Division (“DOJ”) initiated an investigation into Heritage and its employees regarding alleged violations of U.S. antitrust laws, which prohibit contracting or conspiring to restrain trade or commerce. In support of that investigation, the DOJ executed relevant search warrants at the Heritage’s premises and at the residence of one of the Heritage’s national accounts managers. In addition, the DOJ served grand jury subpoenas on the Heritage, and several current and former employees, which sought a variety of materials and data relevant to Heritage’s generic drug business. The Heritage fully cooperated with the DOJ and responded to its subpoenas.
On May 7, 2018, Heritage received a civil investigative demand from the United States Department of Justice, Civil Division (“DOJ Civil”) seeking documents and information in connection with a simultaneous investigation under the False Claims Act.
On May 31, 2019, Heritage announced that it entered into a deferred prosecution agreement (“DPA”) with the DOJ relating to a one-count Information for a conspiracy involving glyburide. In conjunction with the DPA, Heritage agreed to pay a USD 225,000 fine. In addition, Heritage also announced that it separately agreed to a settlement with DOJ Civil to resolve potential civil liability under the False Claims Act in connection with the same antitrust conduct. Under the terms of the settlement with DOJ Civil, Heritage agreed to pay USD 7.1 million. These resolutions fully resolve Heritage’s potential exposure in connection with the DOJ’s ongoing investigation into the generics pharmaceutical industry and have been provided for in the financial statements for year ended March 31, 2019.
In addition to the above, on May 31, 2019, Emcure Pharmaceuticals Limited (Holding company) also entered into a cooperation and non-prosecution agreement (“NPA”) with DOJ under which the holding company, and its current officers, directors, and employees received non-prosecution protection in exchange for its agreement to provide cooperation into the DOJ’s investigation. These resolutions fully resolve Heritage’s potential exposure in connection with the DOJ’s ongoing investigation into the generics pharmaceutical industry.
Attorneys General Litigation
On December 21, 2015,Heritage Pharmaceuticals Inc (“”Heritage””) received a subpoena and interrogatories from the Connecticut Office of the Attorney General seeking information relating to the marketing, pricing and sale of certain of Heritage’s generic products (including generic doxycycline) and communications with competitors about such products. On December 14, 2016, attorneys general of twenty states filed a complaint in the United States District Court for the District of Connecticut against several generic pharmaceutical drug manufacturers and individuals, including Heritage, alleging anticompetitive conduct with respect to, among other things, doxycycline hyclate DR.. On June 18, 2018, attorneys general of forty-five states, the District of Columbia and the Commonwealth of Puerto Rico filed an amended consolidated complaint against various drug manufacturers, including Heritage based on the same alleged conduct. The consolidated complaint (the “”State AG Complaint””) was subsequently amended to add certain attorneys general alleging violations of federal and state antitrust laws, as well as violations of various states’ consumer protection laws.
The consolidated State AG Complaint alleges that Heritage engaged in anticompetitive conduct with respect to fifteen different drugs: acetazolamide; doxycycline monohydrate, doxycycline hyclate DR, fosinopril HCTZ, glipizide metformin, glyburide, glyburide metformin, leflunomide, meprobamate, nimodipine, nystatin, paromomycin, theophylline, verapamil, and zoledronic acid. The consolidated State AG Complaint also includes claims asserted by attorneys general of thirty-seven states and the Commonwealth of Puerto Rico against Heritage, Emcure, and certain individuals, including Emcure’s Chief Executive Officer, Satish Mehta, with respect to doxycycline hyclate DR. The allegations in the State AG Complaint are similar to those in the previously filed civil complaints (discussed below).
The consolidated State AG Complaint was transferred and consolidated into the ongoing multidistrict litigation captioned In re Generic Pharmaceuticals
ANNUAL REPORT 2020-21 : NOTES TO THE CONSOLIDATED FINANCIAL STATEMENTS
Notes to the Consolidated Financial Statementfor the year ended March 31, 2021
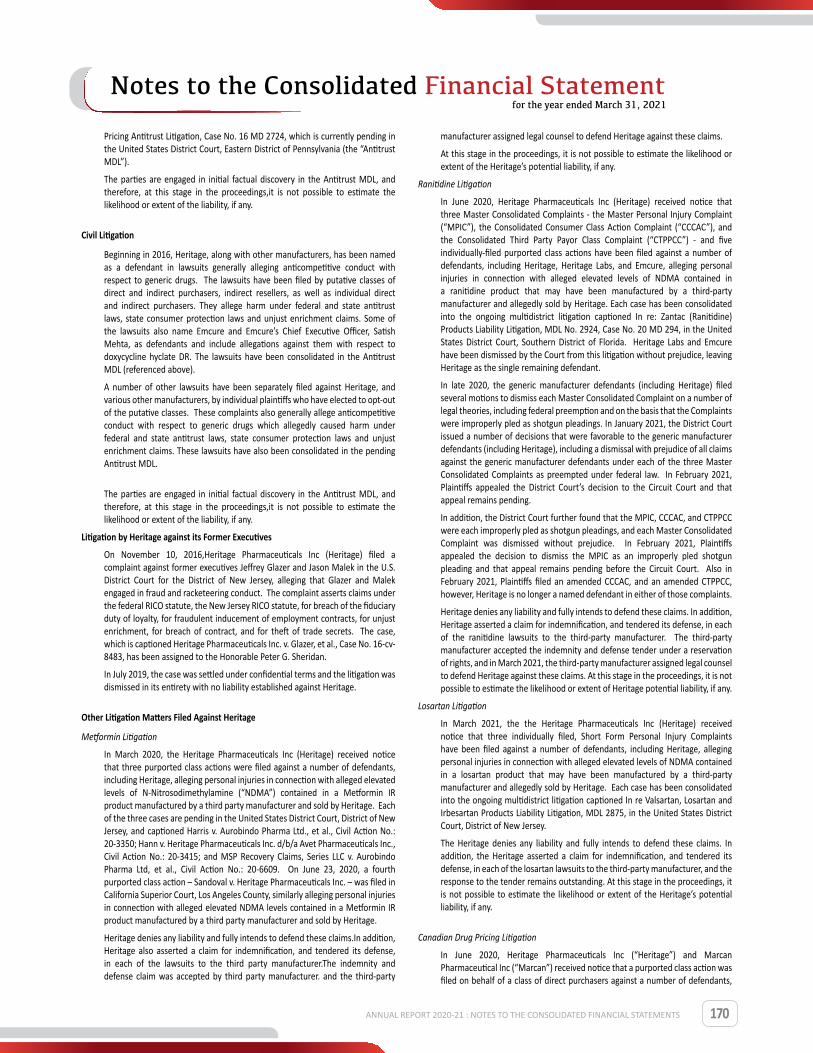
170
Pricing Antitrust Litigation, Case No. 16 MD 2724, which is currently pending in the United States District Court, Eastern District of Pennsylvania (the “Antitrust MDL”).
The parties are engaged in initial factual discovery in the Antitrust MDL, and therefore, at this stage in the proceedings,it is not possible to estimate the likelihood or extent of the liability, if any.
Civil Litigation
Beginning in 2016, Heritage, along with other manufacturers, has been named as a defendant in lawsuits generally alleging anticompetitive conduct with respect to generic drugs. The lawsuits have been filed by putative classes of direct and indirect purchasers, indirect resellers, as well as individual direct and indirect purchasers. They allege harm under federal and state antitrust laws, state consumer protection laws and unjust enrichment claims. Some of the lawsuits also name Emcure and Emcure’s Chief Executive Officer, Satish Mehta, as defendants and include allegations against them with respect to doxycycline hyclate DR. The lawsuits have been consolidated in the Antitrust MDL (referenced above).
A number of other lawsuits have been separately filed against Heritage, and various other manufacturers, by individual plaintiffs who have elected to opt-out of the putative classes. These complaints also generally allege anticompetitive conduct with respect to generic drugs which allegedly caused harm under federal and state antitrust laws, state consumer protection laws and unjust enrichment claims. These lawsuits have also been consolidated in the pending Antitrust MDL.
The parties are engaged in initial factual discovery in the Antitrust MDL, and therefore, at this stage in the proceedings,it is not possible to estimate the likelihood or extent of the liability, if any.
Litigation by Heritage against its Former Executives
On November 10, 2016,Heritage Pharmaceuticals Inc (Heritage) filed a complaint against former executives Jeffrey Glazer and Jason Malek in the U.S. District Court for the District of New Jersey, alleging that Glazer and Malek engaged in fraud and racketeering conduct. The complaint asserts claims under the federal RICO statute, the New Jersey RICO statute, for breach of the fiduciary duty of loyalty, for fraudulent inducement of employment contracts, for unjust enrichment, for breach of contract, and for theft of trade secrets. The case, which is captioned Heritage Pharmaceuticals Inc. v. Glazer, et al., Case No. 16-cv-8483, has been assigned to the Honorable Peter G. Sheridan.
In July 2019, the case was settled under confidential terms and the litigation was dismissed in its entirety with no liability established against Heritage.
Other Litigation Matters Filed Against Heritage
Metformin Litigation
In March 2020, the Heritage Pharmaceuticals Inc (Heritage) received notice that three purported class actions were filed against a number of defendants, including Heritage, alleging personal injuries in connection with alleged elevated levels of N-Nitrosodimethylamine (“NDMA”) contained in a Metformin IR product manufactured by a third party manufacturer and sold by Heritage. Each of the three cases are pending in the United States District Court, District of New Jersey, and captioned Harris v. Aurobindo Pharma Ltd., et al., Civil Action No.: 20-3350; Hann v. Heritage Pharmaceuticals Inc. d/b/a Avet Pharmaceuticals Inc., Civil Action No.: 20-3415; and MSP Recovery Claims, Series LLC v. Aurobindo Pharma Ltd, et al., Civil Action No.: 20-6609. On June 23, 2020, a fourth purported class action – Sandoval v. Heritage Pharmaceuticals Inc. – was filed in California Superior Court, Los Angeles County, similarly alleging personal injuries in connection with alleged elevated NDMA levels contained in a Metformin IR product manufactured by a third party manufacturer and sold by Heritage.
Heritage denies any liability and fully intends to defend these claims.In addition, Heritage also asserted a claim for indemnification, and tendered its defense, in each of the lawsuits to the third party manufacturer.The indemnity and defense claim was accepted by third party manufacturer. and the third-party
manufacturer assigned legal counsel to defend Heritage against these claims.
At this stage in the proceedings, it is not possible to estimate the likelihood or extent of the Heritage’s potential liability, if any.
Ranitidine Litigation
In June 2020, Heritage Pharmaceuticals Inc (Heritage) received notice that three Master Consolidated Complaints - the Master Personal Injury Complaint (“MPIC”), the Consolidated Consumer Class Action Complaint (“CCCAC”), and the Consolidated Third Party Payor Class Complaint (“CTPPCC”) - and five individually-filed purported class actions have been filed against a number of defendants, including Heritage, Heritage Labs, and Emcure, alleging personal injuries in connection with alleged elevated levels of NDMA contained in a ranitidine product that may have been manufactured by a third-party manufacturer and allegedly sold by Heritage. Each case has been consolidated into the ongoing multidistrict litigation captioned In re: Zantac (Ranitidine) Products Liability Litigation, MDL No. 2924, Case No. 20 MD 294, in the United States District Court, Southern District of Florida. Heritage Labs and Emcure have been dismissed by the Court from this litigation without prejudice, leaving Heritage as the single remaining defendant.
In late 2020, the generic manufacturer defendants (including Heritage) filed several motions to dismiss each Master Consolidated Complaint on a number of legal theories, including federal preemption and on the basis that the Complaints were improperly pled as shotgun pleadings. In January 2021, the District Court issued a number of decisions that were favorable to the generic manufacturer defendants (including Heritage), including a dismissal with prejudice of all claims against the generic manufacturer defendants under each of the three Master Consolidated Complaints as preempted under federal law. In February 2021, Plaintiffs appealed the District Court’s decision to the Circuit Court and that appeal remains pending.
In addition, the District Court further found that the MPIC, CCCAC, and CTPPCC were each improperly pled as shotgun pleadings, and each Master Consolidated Complaint was dismissed without prejudice. In February 2021, Plaintiffs appealed the decision to dismiss the MPIC as an improperly pled shotgun pleading and that appeal remains pending before the Circuit Court. Also in February 2021, Plaintiffs filed an amended CCCAC, and an amended CTPPCC, however, Heritage is no longer a named defendant in either of those complaints.
Heritage denies any liability and fully intends to defend these claims. In addition, Heritage asserted a claim for indemnification, and tendered its defense, in each of the ranitidine lawsuits to the third-party manufacturer. The third-party manufacturer accepted the indemnity and defense tender under a reservation of rights, and in March 2021, the third-party manufacturer assigned legal counsel to defend Heritage against these claims. At this stage in the proceedings, it is not possible to estimate the likelihood or extent of Heritage potential liability, if any.
Losartan Litigation
In March 2021, the the Heritage Pharmaceuticals Inc (Heritage) received notice that three individually filed, Short Form Personal Injury Complaints have been filed against a number of defendants, including Heritage, alleging personal injuries in connection with alleged elevated levels of NDMA contained in a losartan product that may have been manufactured by a third-party manufacturer and allegedly sold by Heritage. Each case has been consolidated into the ongoing multidistrict litigation captioned In re Valsartan, Losartan and Irbesartan Products Liability Litigation, MDL 2875, in the United States District Court, District of New Jersey.
The Heritage denies any liability and fully intends to defend these claims. In addition, the Heritage asserted a claim for indemnification, and tendered its defense, in each of the losartan lawsuits to the third-party manufacturer, and the response to the tender remains outstanding. At this stage in the proceedings, it is not possible to estimate the likelihood or extent of the Heritage’s potential liability, if any.
Canadian Drug Pricing Litigation
In June 2020, Heritage Pharmaceuticals Inc (“Heritage”) and Marcan Pharmaceutical Inc (“Marcan”) received notice that a purported class action was filed on behalf of a class of direct purchasers against a number of defendants,
ANNUAL REPORT 2020-21 : NOTES TO THE CONSOLIDATED FINANCIAL STATEMENTS
Notes to the Consolidated Financial Statementfor the year ended March 31, 2021

171
including Heritage and Marcan, generally alleging anticompetitive conduct under Canadian law with respect to the sale of generic drugs. The claims and allegations in this complaint are nearly identical to the claims and allegations asserted by the Civil Plaintiffs, and the State Attorneys General, in the drug pricing complaints filed in the United States (discussed above), except that these plaintiffs allege that the same conduct occurred in Canada in violation of Canadian law. The case is pending in Canadian Federal Court, Toronto, Ontario and captioned Eaton v. Teva Canada Ltd., et al., Court File No.: T-607-20.
The Group denies any liability and fully intends to defend these claims. The parties are engaged in initial factual discovery in this case, and therefore, at this stage in the proceedings, it is not possible to estimate the likelihood or extent of the Group potential liability, if any.
General
From time to time, the Group is subject to various disputes, governmental and/or regulatory inquiries or investigations, and litigations, some of which result in losses, damages, fines and charges against the Company. While the Group intends to vigorously defend its position in the claims asserted against it, the ultimate resolution of a matter is often complex, time consuming, and difficult to predict. Therefore, except as described below, the Group does not currently have a reasonable basis to estimate the loss, or range of loss, that is reasonably possible with respect to matters disclosed in this note.The Group records a provision in its financial statements to the extent that it concludes that a contingent liability is probable and the amount is estimable and has noted those contingencies below. The Group assessments involve complex judgments about future events and often rely heavily on estimates and assumptions. The Group also incurs significant legal fees and related expenses in the course of defending its positions even if the facts and circumstances of a particular litigation do not give rise to a provision in the financial statements.
Note 45 : - Capital and other commitments (to the extent not provided for)A) Capital commitment
Estimated amount of contracts remaining to be executed on capital account and not provided for (net of advances) Rs. 587.87 million
(March 31, 2020: Rs. 530.52 million).
B) Other commitments
a) The Group has a 100 per cent Export Oriented Unit (EOU) set up under the permission granted by the Office of the Development Commissioner of SEEPZ Special Economic Zone of the Government of India. The authorities have, inter alia, laid down the following conditions, failing which the Group may be liable for penal action:
i. The entire (100%) production shall be exported against hard currency except the sales in domestic tariff area admissible as per entitlement.
ii. The Export Oriented Unit of the Group shall be a positive net foreign exchange earner over a period of six years from the date of commencement of production.
As at the year end, the Group is in compliance with the condition laid down by the authorities and does not expect any non-compliance in future.
b) The group has imported certain machinery under the Export Promotion Capital Goods (EPCG) Scheme and accordingly has an export obligation of Rs. 68.67 millions (March 31, 2020 : Rs. 38.20 millions ). In this respect the group has given bank guarantees of Rs. 3.87 millions (March 31, 2020 : Rs. 6.56 millions) to the Director General of Foreign Trade (DGFT) and Bond of Rs. 59.00 millions (March 31, 2020 : Rs. 43.63 millions) to the Commissioner of Customs. The Export obligation has been fulfilled by making payment of customs duty during the year, the benefit of which was claimed under EPCG Scheme.
ANNUAL REPORT 2020-21 : NOTES TO THE CONSOLIDATED FINANCIAL STATEMENTS
Notes to the Consolidated Financial Statementfor the year ended March 31, 2021
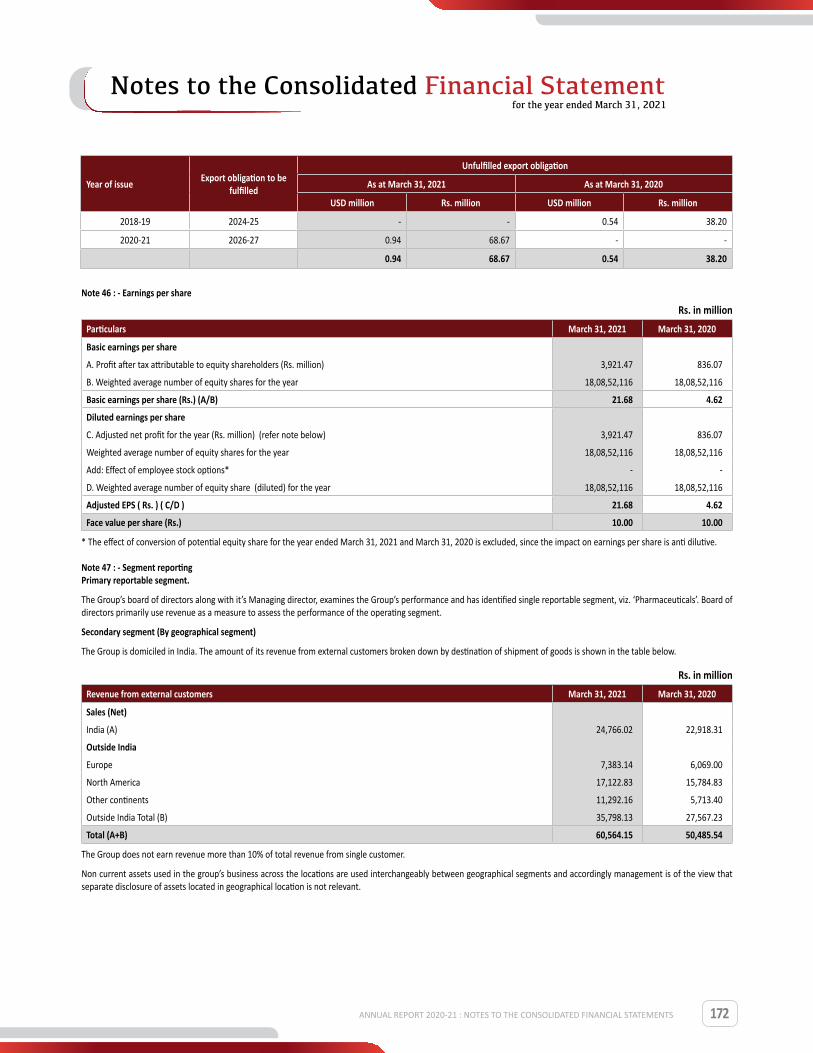
172
Year of issue Export obligation to be fulfilled
Unfulfilled export obligation
As at March 31, 2021 As at March 31, 2020
USD million Rs. million USD million Rs. million
2018-19 2024-25 - - 0.54 38.20
2020-21 2026-27 0.94 68.67 - -
0.94 68.67 0.54 38.20
Note 46 : - Earnings per share
Rs. in millionParticulars March 31, 2021 March 31, 2020
Basic earnings per share
A. Profit after tax attributable to equity shareholders (Rs. million) 3,921.47 836.07
B. Weighted average number of equity shares for the year 18,08,52,116 18,08,52,116
Basic earnings per share (Rs.) (A/B) 21.68 4.62
Diluted earnings per share
C. Adjusted net profit for the year (Rs. million) (refer note below) 3,921.47 836.07
Weighted average number of equity shares for the year 18,08,52,116 18,08,52,116
Add: Effect of employee stock options* - -
D. Weighted average number of equity share (diluted) for the year 18,08,52,116 18,08,52,116
Adjusted EPS ( Rs. ) ( C/D ) 21.68 4.62
Face value per share (Rs.) 10.00 10.00
* The effect of conversion of potential equity share for the year ended March 31, 2021 and March 31, 2020 is excluded, since the impact on earnings per share is anti dilutive.
Note 47 : - Segment reporting Primary reportable segment.
The Group’s board of directors along with it’s Managing director, examines the Group’s performance and has identified single reportable segment, viz. ‘Pharmaceuticals’. Board of directors primarily use revenue as a measure to assess the performance of the operating segment.
Secondary segment (By geographical segment)
The Group is domiciled in India. The amount of its revenue from external customers broken down by destination of shipment of goods is shown in the table below.
Rs. in millionRevenue from external customers March 31, 2021 March 31, 2020
Sales (Net)
India (A) 24,766.02 22,918.31
Outside India
Europe 7,383.14 6,069.00
North America 17,122.83 15,784.83
Other continents 11,292.16 5,713.40
Outside India Total (B) 35,798.13 27,567.23
Total (A+B) 60,564.15 50,485.54
The Group does not earn revenue more than 10% of total revenue from single customer.
Non current assets used in the group’s business across the locations are used interchangeably between geographical segments and accordingly management is of the view that separate disclosure of assets located in geographical location is not relevant.
ANNUAL REPORT 2020-21 : NOTES TO THE CONSOLIDATED FINANCIAL STATEMENTS
Notes to the Consolidated Financial Statementfor the year ended March 31, 2021

173
Note 48 : - Related party disclosure
Related parties with whom there were transactions during the year and nature of relationship
Key Management Personnel: Whole Time Directors
Mr. Satish Mehta (Managing Director)
Mr. Mukund Gurjar (Executive Director)
Mr. Sunil Mehta (Executive Director)
Mrs. Namita Thapar (Executive Director) (Chief Finance Officer upto April 15, 2021)
Key Management Personnel: Other than Whole Time Directors
Mr. S.K. Bapat (Independent Director)
Mr. Humayun Dhanrajgir (Chairman and Independent Director upto April 15,2021)
Mr. Berjis Desai (Chairman and Independent Director) (Appointed as Chairman w.e.f. April 16, 2021)
Mr. Samonnoi Banerjee (Nominee of BC capital Investment IV Ltd) (Director)
Mr. P. S. Jaykumar (Independent Director w.e.f. July 22, 2020)
Mr. Tajuddin Shaikh (Chief Finance Officer w.e.f. April 16, 2021)
Dr. Vidya Rajiv Yeravdekar (Independent Director w.e.f. April 16, 2021)
Dr. Shailesh Kripalu Ayyangar (Non Executive Director w.e.f. April 16, 2021)
Mr. Vijay Keshav Gokhale (Independent Director w.e.f. April 16, 2021)
Key Management Personnel: Relatives
Mr. Sanjay Mehta
Mr. Vikas Thapar
Mr. Samit Mehta
Mr. Rutav Mehta
Mrs. Bhavna Mehta
Enterprise over which Key Management Personnel have control:
H.M. Sales Corporation
ANNUAL REPORT 2020-21 : NOTES TO THE CONSOLIDATED FINANCIAL STATEMENTS
Notes to the Consolidated Financial Statementfor the year ended March 31, 2021

174
Uth Beverages Factory Pvt. Ltd.
Rs. in million
Sr. No. Description of the nature of the transaction
Volume of transactions during Amount outstanding as at
2020-21 2019-20 March 31, 2021 March 31, 2020
Payable Receivable Payable 1) Sale of assets
Uth Beverage Factory Pvt. Ltd. 0.11 - 0.13 - - -
2) Sale /(Return) of goods and servicesH.M. Sales Corporation (5.03) 8.96 3.97 - 10.07 -
3) Interest paidH.M. Sales Corporation 0.75 0.75 - 0.17 - 0.17
4) Deposits accepted H.M. Sales Corporation - - - 10.00 - 10.00
5) Commission paid H.M. Sales Corporation 40.54 37.19 - 12.14 - 9.95
6) Reimbursement of expenses madeUth Beverage Factory Pvt. Ltd. - 0.50 - - - - H.M. Sales Corporation 3.44 4.82 - 1.01 - 0.78
7) Royalty expenseUth Beverage Factory Pvt. Ltd. 1.15 1.71 - 0.27 - 0.73
8) Remuneration paid Key management personnel: whole time directorsMr. Satish Mehta 209.82 160.05 - 62.54 - 29.66 Mr. Mukund Gurjar 42.93 40.79 - 9.51 - 9.39 Mr. Sunil Mehta 22.85 21.01 - 2.81 - 6.93 Mrs. Namita Thapar 30.06 23.70 - 3.55 - 5.10 Key management personnel: relativesMr. Samit Mehta 29.43 22.04 - 3.58 - 5.43 Mr. Vikas Thapar 30.37 24.95 - 3.53 - 5.18 Mr. Sanjay Mehta 23.37 20.97 - 2.87 - 7.25 Mr. Rutav Mehta - 1.50 - - - 0.15
9) Post-employment obligations and other long term employee benefitsKey management personnel: whole time directorsMr. Sunil Mehta 7.90 1.34 - - - 10.36 Mrs. Namita Thapar 4.11 1.25 - 10.07 - 5.96 Key management personnel: relativesMr. Samit Mehta 5.96 1.33 - 12.41 - 6.45 Mr. Vikas Thapar 3.60 0.80 - 10.01 - 6.41 Mr. Sanjay Mehta 6.49 1.58 - 16.08 - 9.59 Mr. Rutav Mehta - 0.05 - - - 0.15
ANNUAL REPORT 2020-21 : NOTES TO THE CONSOLIDATED FINANCIAL STATEMENTS
Notes to the Consolidated Financial Statementfor the year ended March 31, 2021
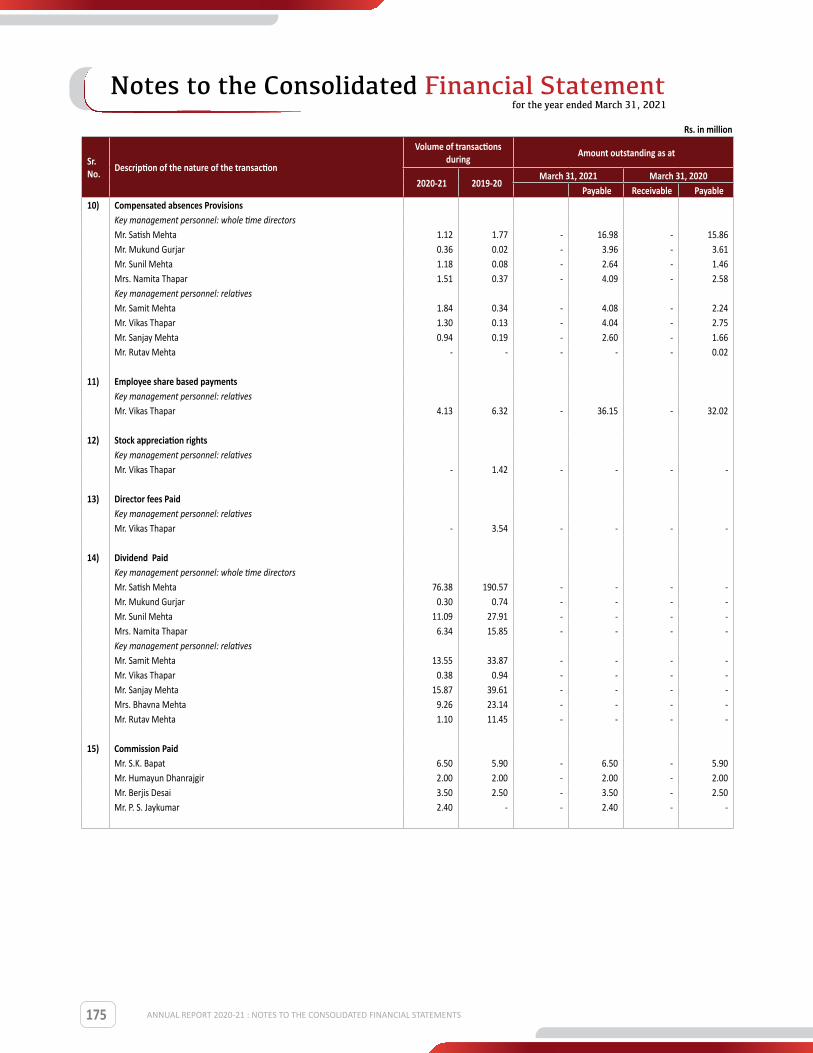
175
Sr. No. Description of the nature of the transaction
Volume of transactions during Amount outstanding as at
2020-21 2019-20 March 31, 2021 March 31, 2020
Payable Receivable Payable 10) Compensated absences Provisions
Key management personnel: whole time directorsMr. Satish Mehta 1.12 1.77 - 16.98 - 15.86 Mr. Mukund Gurjar 0.36 0.02 - 3.96 - 3.61 Mr. Sunil Mehta 1.18 0.08 - 2.64 - 1.46 Mrs. Namita Thapar 1.51 0.37 - 4.09 - 2.58 Key management personnel: relativesMr. Samit Mehta 1.84 0.34 - 4.08 - 2.24 Mr. Vikas Thapar 1.30 0.13 - 4.04 - 2.75 Mr. Sanjay Mehta 0.94 0.19 - 2.60 - 1.66 Mr. Rutav Mehta - - - - - 0.02
11) Employee share based paymentsKey management personnel: relativesMr. Vikas Thapar 4.13 6.32 - 36.15 - 32.02
12) Stock appreciation rightsKey management personnel: relativesMr. Vikas Thapar - 1.42 - - - -
13) Director fees PaidKey management personnel: relativesMr. Vikas Thapar - 3.54 - - - -
14) Dividend Paid Key management personnel: whole time directorsMr. Satish Mehta 76.38 190.57 - - - - Mr. Mukund Gurjar 0.30 0.74 - - - - Mr. Sunil Mehta 11.09 27.91 - - - - Mrs. Namita Thapar 6.34 15.85 - - - - Key management personnel: relativesMr. Samit Mehta 13.55 33.87 - - - - Mr. Vikas Thapar 0.38 0.94 - - - - Mr. Sanjay Mehta 15.87 39.61 - - - - Mrs. Bhavna Mehta 9.26 23.14 - - - - Mr. Rutav Mehta 1.10 11.45 - - - -
15) Commission PaidMr. S.K. Bapat 6.50 5.90 - 6.50 - 5.90 Mr. Humayun Dhanrajgir 2.00 2.00 - 2.00 - 2.00 Mr. Berjis Desai 3.50 2.50 - 3.50 - 2.50 Mr. P. S. Jaykumar 2.40 - - 2.40 - -
Rs. in million
ANNUAL REPORT 2020-21 : NOTES TO THE CONSOLIDATED FINANCIAL STATEMENTS
Notes to the Consolidated Financial Statementfor the year ended March 31, 2021

176
Sr. No. Description of the nature of the transaction
Volume of transactions during Amount outstanding as at
2020-21 2019-20 March 31, 2021 March 31, 2020
Payable Receivable Payable 16) Sitting fees Paid
Key management personnel: whole time directorsMr. Satish Mehta 3.71 3.54 - 0.93 - - Key management personnel: relativesMr. Vikas Thapar 3.71 3.54 - 0.93 - - Key management personnel: other than whole time directorsMr. S.K. Bapat 0.68 0.67 - - - - Mr. Humayun Dhanrajgir 0.28 0.06 - - - - Mr. Berjis Desai 0.28 0.28 - - - - Mr. Samonnoi Banerjee 0.16 0.16 - - - - Mr. P. S. Jaykumar 0.10 - - - - -
17) Rent Paid Key management personnel: whole time directorsMr. Sunil Mehta 0.33 0.33 - - - - Key management personnel: relativesMr. Sanjay Mehta 0.33 0.33 - - - - Mrs. Bhavna Mehta 0.24 0.24
Note 49 : Post-Employment Benefits: a) Defined contribution plans
The Group has certain defined contribution plans. Contributions are made as per local regulations. The contributions are made to registered provident/other fund administered by the government. The obligation of the holding company and two of its Indian subsidiaries are limited to the amount contributed and it has no further contractual nor any constructive obligation.
Contributions are made to employees family pension fund in India for employees as per local regulations. The contributions are made to provident fund administered by the government. The obligation of the holding company and two of its indian subsidiaries are limited to the amount contributed and it has no further contractual nor any constructive obligation. The expense recognised during the period towards defined contribution plan is Rs. 129.15 million (March 31, 2020 Rs. 131.69 million).
Defined contribution plans: The group has recognised the following amount in the Statement of Profit and Loss for the year
Rs. in millionParticulars March 31, 2021 March 31, 2020
i) Contribution to employees provident fund 229.82 221.81
ii) Contribution to employees family pension fund 129.15 131.69
iii) Contribution to Canada pension plan 5.57 5.27
iv) Contribution to defined contribution plan (401K) 48.85 44.15
v) Contribution to national insurance contributions 30.51 19.63
vi) Other defined Contribution plans 240.30 240.51
Total 684.20 663.06 b) Post-employment obligations
Gratuity
The Group provides for gratuity for employees in India as per the Payment of Gratuity Act, 1972. Employees who are in continuous service for a period of 5 years are eligible for gratuity. The amount of gratuity payable on retirement/termination is the employees last drawn basic salary per month computed proportionately for 15 days salary multiplied for the number of years of service. The gratuity plan is a funded plan and the Group makes contributions to recognised funds in India. The Group does not fully fund the liability and maintains a target level of funding to be maintained over a period of time based on estimations of expected gratuity payments.
ANNUAL REPORT 2020-21 : NOTES TO THE CONSOLIDATED FINANCIAL STATEMENTS
Notes to the Consolidated Financial Statementfor the year ended March 31, 2021

177
c) Defined benefit plans
The amounts recognised in the balance sheet and the movements in the net defined benefit obligation over the year are as follows:
Rs. in million
Particulars Present Value of Obligation
Fair Value of Plan assets Total
As at April 1, 2019 674.31 (542.06) 132.25
Current service cost 109.75 - 109.75
Interest expenses/(income) 43.95 (41.50) 2.45
Mortality charges and taxes - 5.60 5.60
Transfer In/(Out) 0.54 (0.80) (0.26)
Total amount recognised in statement of profit and loss 154.24 (36.70) 117.54
Remeasurements
- Return on plan assets, excluding amounts included in interest expense /(income) 4.57 (2.30) 2.27
- Defined benefit obligations 69.49 (1.39) 68.10
Total amount recognised in other comprehensive income 74.06 (3.69) 70.37
Employer contribution - (168.64) (168.64)
Benefit payments (90.16) 90.16 -
As at March 31, 2020 812.45 (660.93) 151.52
Current service cost 146.77 - 146.77
Interest expenses/(income) 43.86 (39.34) 4.52
Mortality charges and taxes (3.06) 9.39 6.33
Transfer In/(Out) 2.93 (2.54) 0.39
Total amount recognised in statement of profit and loss 190.50 (32.49) 158.01
Remeasurements
- Return on plan assets, excluding amounts included in interest expense/(income) (0.82) (7.95) (8.77)
- Defined benefit obligations (6.53) (2.70) (9.23)
Total amount recognised in other comprehensive income (7.35) (10.65) (18.00)
Employer contribution - (125.22) (125.22)
Benefit payments (81.38) 63.09 (18.29)
As at March 31, 2021 914.22 (766.20) 148.02
d) The net liability disclosed above relates to funded and unfunded plans are as follows:
Rs. in millionParticulars March 31, 2021 March 31, 2020
Present value of obligation 914.22 812.45
Fair value of plan assets (766.20) (660.93)
Deficit of funded plan 148.02 151.52
The Group has no legal obligation to settle the deficit in the funded plans with an immediate contribution or additional one off contributions. The Group intends to continue to contribute the defined benefit plans as per the demand from Life Insurance Corporation (LIC) of India.
Significant estimates: actuarial assumptions and sensitivity
Post-employment benefits (gratuity) - The significant actuarial assumptions were as follows:
Particulars March 31, 2021 March 31, 2020
a) Discount rate 5.4% - 6.6% 5.5% - 6.4%
b) Expected rate of return on plan assets 5.5% - 8.0% 6.8% - 7.7%
c) Salary escalation rate 7.0% - 8.0% 8% - 10%
The estimates of future salary increases considered in actuarial valuation takes into account inflation, seniority, promotion and other relevant factors.
ANNUAL REPORT 2020-21 : NOTES TO THE CONSOLIDATED FINANCIAL STATEMENTS
Notes to the Consolidated Financial Statementfor the year ended March 31, 2021
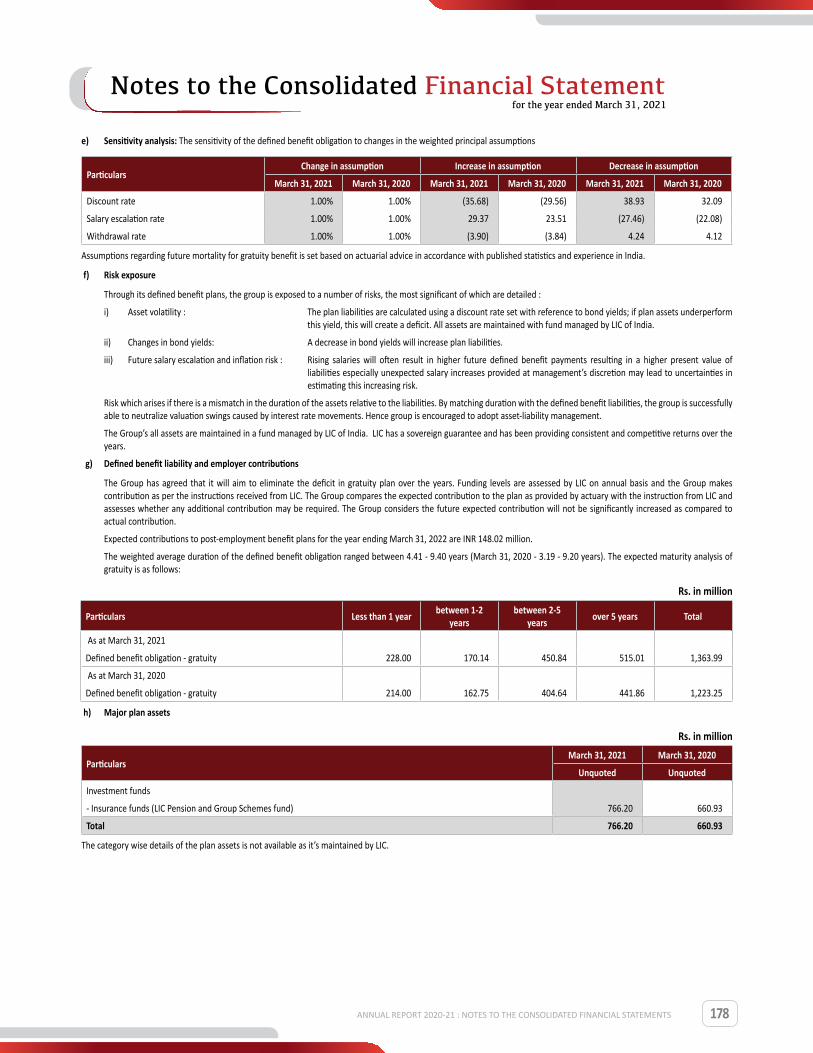
178
e) Sensitivity analysis: The sensitivity of the defined benefit obligation to changes in the weighted principal assumptions
ParticularsChange in assumption Increase in assumption Decrease in assumption
March 31, 2021 March 31, 2020 March 31, 2021 March 31, 2020 March 31, 2021 March 31, 2020
Discount rate 1.00% 1.00% (35.68) (29.56) 38.93 32.09
Salary escalation rate 1.00% 1.00% 29.37 23.51 (27.46) (22.08)
Withdrawal rate 1.00% 1.00% (3.90) (3.84) 4.24 4.12
Assumptions regarding future mortality for gratuity benefit is set based on actuarial advice in accordance with published statistics and experience in India.
f) Risk exposure
Through its defined benefit plans, the group is exposed to a number of risks, the most significant of which are detailed :
i) Asset volatility : The plan liabilities are calculated using a discount rate set with reference to bond yields; if plan assets underperform this yield, this will create a deficit. All assets are maintained with fund managed by LIC of India.
ii) Changes in bond yields: A decrease in bond yields will increase plan liabilities.
iii) Future salary escalation and inflation risk : Rising salaries will often result in higher future defined benefit payments resulting in a higher present value of liabilities especially unexpected salary increases provided at management’s discretion may lead to uncertainties in estimating this increasing risk.
Risk which arises if there is a mismatch in the duration of the assets relative to the liabilities. By matching duration with the defined benefit liabilities, the group is successfully able to neutralize valuation swings caused by interest rate movements. Hence group is encouraged to adopt asset-liability management.
The Group’s all assets are maintained in a fund managed by LIC of India. LIC has a sovereign guarantee and has been providing consistent and competitive returns over the years.
g) Defined benefit liability and employer contributions
The Group has agreed that it will aim to eliminate the deficit in gratuity plan over the years. Funding levels are assessed by LIC on annual basis and the Group makes contribution as per the instructions received from LIC. The Group compares the expected contribution to the plan as provided by actuary with the instruction from LIC and assesses whether any additional contribution may be required. The Group considers the future expected contribution will not be significantly increased as compared to actual contribution.
Expected contributions to post-employment benefit plans for the year ending March 31, 2022 are INR 148.02 million.
The weighted average duration of the defined benefit obligation ranged between 4.41 - 9.40 years (March 31, 2020 - 3.19 - 9.20 years). The expected maturity analysis of gratuity is as follows:
Rs. in million
Particulars Less than 1 year between 1-2 years
between 2-5 years over 5 years Total
As at March 31, 2021
Defined benefit obligation - gratuity 228.00 170.14 450.84 515.01 1,363.99
As at March 31, 2020
Defined benefit obligation - gratuity 214.00 162.75 404.64 441.86 1,223.25
h) Major plan assets
Rs. in million
ParticularsMarch 31, 2021 March 31, 2020
Unquoted Unquoted
Investment funds
- Insurance funds (LIC Pension and Group Schemes fund) 766.20 660.93
Total 766.20 660.93
The category wise details of the plan assets is not available as it’s maintained by LIC.
ANNUAL REPORT 2020-21 : NOTES TO THE CONSOLIDATED FINANCIAL STATEMENTS
Notes to the Consolidated Financial Statementfor the year ended March 31, 2021

179
Note 50: Employees stock option plan
As at 31 March 2021, the Company has the following share-based payment arrangement:
i. Share option plans (equity settled)
“Emcure ESOS 2013”: The Board of directors of the holding company (‘Board’) vide its resolution granted employee stock options as under to the eligible employees under “Emcure ESOS 2013” in compliance with the provisions of the applicable law and rules framed thereunder.
Rs. in millionResolution date Tranche No Grant Date Exercise Price Total Options Granted
10-Oct-13 Tranche - 01 01-Oct-13 221.25* 22,70,000
14-Mar-16 Tranche - 02 14-Mar-16 508.75 5,80,000
07-Jul-17 Tranche - 03 07-Jul-17 300.00 1,00,000
01-Nov-18 Tranche - 04 01-Nov-18 522.00 8,40,000
01-Dec-18 Tranche - 05 01-Dec-18 522.00 2,40,000
01-Feb-19 Tranche - 06 01-Feb-19 522.00 2,30,000
06-Jun-19 Tranche - 07 06-Jun-19 522.00 6,25,000
08-Nov-19 Tranche - 08 08-Nov-19 580.00 4,55,000
04-Feb-20 Tranche - 09 04-Feb-20 580.00 70,000
22-Jul-20 Tranche - 10 22-Jul-20 620.00 1,80,000
09-Nov-20 Tranche - 11 09-Nov-20 620.00 40,000
*During the year ended March 31, 2016, the holding company had issued bonus shares to its shareholders in the ratio of 3:1. Correspondingly, proportionate adjustment has been made by increasing the number of options granted and reducing exercise price per option. Board of directors vide resolution dated January 29, 2016 have approved the adjustments to options granted.
The eligible employees, including directors, are determined by the Remuneration Committee of the holding Company (‘Remuneration Committee’) from time to time. These options will vest over period of 3 to 5 years from the grant date and are subject to the condition of continued service of the employees.
Once vested the option can be exercised within 5 years from date of Initial Public Offer (IPO). The exercise price of the options is equal to fair market value of the shares as determined by an independent valuer as at grant dates. If IPO does not take place or shares are not listed within 2 years from the date of grant, Remuneration committee at its sole discretion, subject to prior approval of the holding Company’s shareholders’ can settle the vested options in cash or allow exercise of option before listing at a price arrived at by an independent valuer. However, no options have been allowed to be excercised till March 31, 2021.
Options granted under this scheme carry no dividend or voting rights. When exercised, one option is convertible into one equity share.
Movement of the options granted under the pIan is as below:
March 31, 2020 Grant DateOpening
balance as on April 1, 2019
Grant during the year
Cancelled during the
year
Exercised during the
year
Closing balance as
on March 31, 2020
Exercisable Excise Price
Tranche - 01 01-Oct-13 14,00,000 - (1,90,000) - 12,10,000 - 221.25
Tranche - 02 14-Mar-16 1,20,000 - (60,000) - 60,000 - 508.75
Tranche - 03 07-Jul-17 1,00,000 - (1,00,000) - - - 300.00
Tranche - 04 01-Nov-18 8,40,000 - - - 8,40,000 - 522.00
Tranche - 05 01-Dec-18 2,40,000 - - - 2,40,000 - 522.00
Tranche - 06 01-Feb-19 2,30,000 - (90,000) - 1,40,000 - 522.00
Tranche - 07 06-Jun-19 - 6,25,000 - - 6,25,000 - 522.00
Tranche - 08 08-Nov-19 - 4,55,000 - - 4,55,000 - 580.00
Tranche - 09 04-Feb-20 - 70,000 - - 70,000 - 580.00
Total/ Weighted average exercise price
29,30,000 11,50,000 (4,40,000) - 36,40,000 430.17
ANNUAL REPORT 2020-21 : NOTES TO THE CONSOLIDATED FINANCIAL STATEMENTS
Notes to the Consolidated Financial Statementfor the year ended March 31, 2021

180
March 31, 2021 Grant DateOpening
balance as on April 1, 2020
Grant during the year
Cancelled during the
year
Exercised during the
year
Closing balance as
on March 31, 2021
Exercisable Excise Price
Tranche - 01 01-Oct-13 12,10,000 - (3,10,000) - 9,00,000 - 221.25
Tranche - 02 14-Mar-16 60,000 - - - 60,000 - 508.75
Tranche - 04 01-Nov-18 8,40,000 - (8,40,000) - - - 522.00
Tranche - 05 01-Dec-18 2,40,000 - (2,40,000) - - - 522.00
Tranche - 06 01-Feb-19 1,40,000 - (1,10,000) - 30,000 - 522.00
Tranche - 07 06-Jun-19 6,25,000 - (4,95,000) - 1,30,000 - 522.00
Tranche - 08 08-Nov-19 4,55,000 - (2,70,000) - 1,85,000 - 580.00
Tranche - 09 04-Feb-20 70,000 - - - 70,000 - 580.00
Tranche - 10 22-Jul-20 - 1,80,000 - - 1,80,000 - 620.00
Tranche - 11 09-Nov-20 - 40,000 - - 40,000 - 620.00
Total/ Weighted average exercise price
36,40,000 2,20,000 (22,65,000) - 15,95,000 374.59
*ESOP’s cancelled during the year include 1,815,000 options cancelled due to the proposed Composite Scheme of arrangement as referred in note 60 of the financial statements with mutual agreeable terms and conditions with employees.
No options have expired or exercised during the periods covered in the above table.
Weighted average remaining contractual life of options as at year end is 7.17 Years (March 31, 2020 : 7.09 Years)
Fair value of equity settled share based payment arrangements:
2,20,000 employee stock options were granted during the year ended March 31, 2021. The fair vaIue as at grant date is determined using the BIack SchoIes Merton ModeI which takes into account the exercise price, term of option, share price at grant date, expected price volatility of underlying share, expected dividend yield and risk free interest rate for the term of option.
The modeI inputs for options granted during the year ended March 31, 2021 included:
Sr. Grant Date Tranche - 10 Tranche - 11
a. Options granted 1,80,000 40,000
b. Exercise Price Rs. 620.00 620.00
c. Share Price at grant date 620.00 620.00
d. Date of grant 22-Jul-20 09-Nov-20
e. Expected price volatility of the company`s shares 33.93% 34.21%
f. Expected dividend yield 1.00% 1.00%
g. Risk free interest rate 3.92% 4.32%
h. Expected life of options 3.14 3.08
Volatility is a measure of the movement in the prices of the underlying assets. Since the Company is an unlisted Company, volatility of similar listed entities has been considered. Expected volatility has been based on an evaluation of the historical volatility of the similar listed entities (peers) share price, particularly over the historical period commensurate with the expected term. The expected term of the instrument has been based on historical experience and general option holder behaviour.
Expenses recognised in statement of profit and loss:
Particulars 31-Mar-21 31-Mar-20
Employee share-based payment 63.48 144.19
ANNUAL REPORT 2020-21 : NOTES TO THE CONSOLIDATED FINANCIAL STATEMENTS
Notes to the Consolidated Financial Statementfor the year ended March 31, 2021

181
Note 51 : - Stock appreciation rights
The Group through its step down subsidiary, Heritage Pharmaceuticals Inc (“Heritage”) had entered into Stock Appreciation Rights Agreement (the “Plan”) with certain employees to grant stock appreciation rights (SARs) under a stock incentive plan.
The stock appreciation rights have been considered as cash settled options and classified as a liability.
Heritage, vide board resolution passed on April 26, 2019 has decided to cease issuing new SAR awards under the SAR plan and to settle, resolve, discharge any vested awards that were previously issued under the SAR plan to current or former employees, advisors or consultants that remain open and unpaid as of the date thereof. It has also been resolved that on settlement and discharge of all open SAR awards, Heritage will terminate and wind up the SAR plan.
As on March 31, 2021, Heritage is carrying SAR provision of US$1.25 Million (Rs. 91.23 Million) (towards erstwhile employee who has left the organisation) which was freezed as on the date the employee left the organisation.
As on March 31, 2020, The liability for SARs granted to current employees is estimated at US$ 0.16 Million (Rs. 12.11 Million). In addition to this, Heritage is carrying SAR provision of US$1.25 Million (Rs. 94.41 Million) (towards erstwhile employee who has left the organisation) which was freezed as on the date the employee left the organisation.
Note no. 52 - Impairment assessment for goodwill
Goodwill is tested for impairment on an annual basis. For the purpose of impairment testing, goodwill acquired in a business combination is allocated to a the Group’s Cash Generating Unit (CGU) or groups of CGUs expected to benefit from the synergies arising from the business combinations. A CGU is the smallest identifiable group of assets that generates cash inflows that are largely independent of the cash inflows from other assets or group of assets.
Particulars March 31, 2021 March 31, 2020
Opening balance 3,891.90 3,760.41
Impact of foreign currency translation 82.87 171.32
Impairment during the year - (39.83)
Closing balance 3,974.77 3,891.90
Impairment occurs when the carrying amount of a CGU, including the goodwill, exceeds the estimated recoverable amount of the CGU. The recoverable amount of CGU is higher of its fair value less cost to sell and its value-in-use. Value-in-use is the present value of the future cash flows expected to be derived from the CGU.
The carrying amount was computed by allocating the net assets to the CGU for the purpose of impairment testing.
Value-in-use is calculated using after tax assumptions. The use of after tax assumptions does not result in a value-in-use that is materially different from the value-in-use that would result if the calculation was performed using before tax assumptions.
The average range of key assumptions used for the calculations are as follows:
Particulars March 31, 2021 March 31, 2020
Long term growth rate 6% -25.3% 9%-17.5%
After tax discount rate 12.67%-13.028% 6.96%-11.00%
Terminal growth rate 1% 1%
Based on the above, no impairment was identified as of March 31, 2021and March 31, 2020 as the recoverable value of the CGUs exceeded the carrying value except for the impairment loss recognised on the goodwill pertaining to subsidiary in New Zealand aggregating to INR 39.83 million for year ended 31 March 2020. An analysis of the calculation’s sensitivity to a change in the key parameters (revenue growth, operating margin, discount rate and long-term growth rate) based on reasonably probable assumptions, did not identify any probable scenarios where the recoverable amount of the CGU would fall below the respective carrying amounts of non financials assets.
ANNUAL REPORT 2020-21 : NOTES TO THE CONSOLIDATED FINANCIAL STATEMENTS
Notes to the Consolidated Financial Statementfor the year ended March 31, 2021
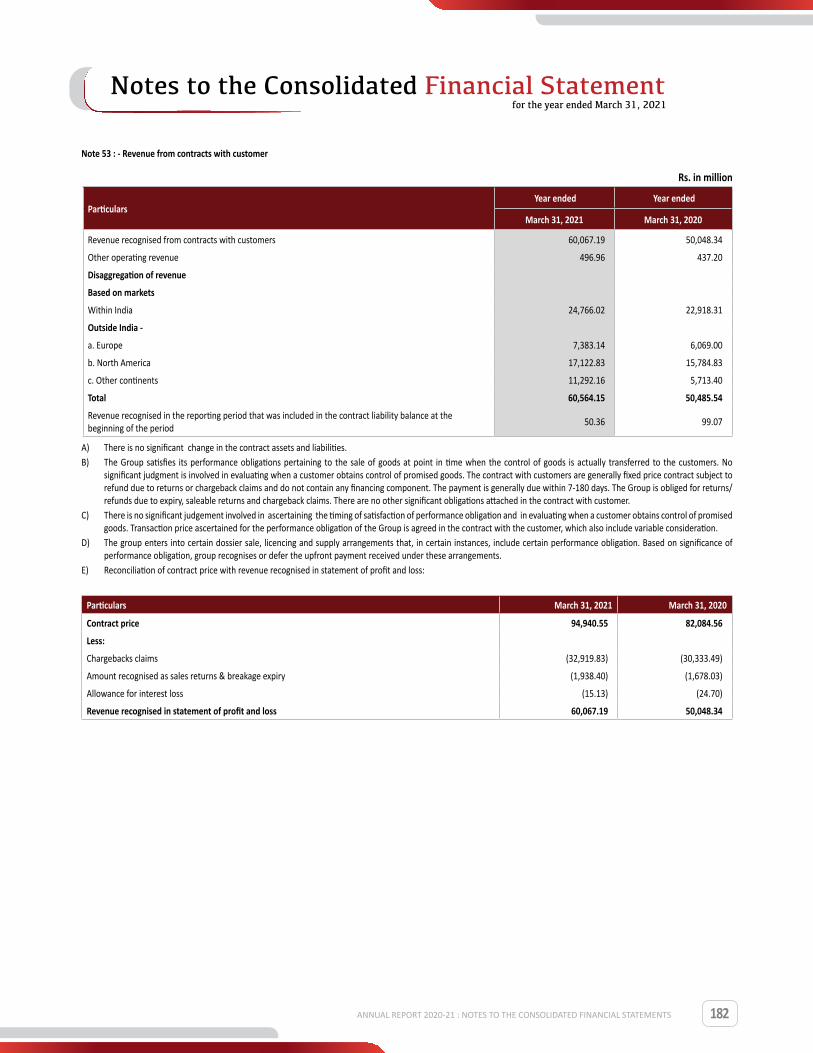
182
Note 53 : - Revenue from contracts with customer
Rs. in million
Particulars Year ended Year ended
March 31, 2021 March 31, 2020
Revenue recognised from contracts with customers 60,067.19 50,048.34
Other operating revenue 496.96 437.20
Disaggregation of revenue
Based on markets
Within India 24,766.02 22,918.31
Outside India -
a. Europe 7,383.14 6,069.00
b. North America 17,122.83 15,784.83
c. Other continents 11,292.16 5,713.40
Total 60,564.15 50,485.54
Revenue recognised in the reporting period that was included in the contract liability balance at the beginning of the period
50.36 99.07
A) There is no significant change in the contract assets and liabilities.B) The Group satisfies its performance obligations pertaining to the sale of goods at point in time when the control of goods is actually transferred to the customers. No
significant judgment is involved in evaluating when a customer obtains control of promised goods. The contract with customers are generally fixed price contract subject to refund due to returns or chargeback claims and do not contain any financing component. The payment is generally due within 7-180 days. The Group is obliged for returns/refunds due to expiry, saleable returns and chargeback claims. There are no other significant obligations attached in the contract with customer.
C) There is no significant judgement involved in ascertaining the timing of satisfaction of performance obligation and in evaluating when a customer obtains control of promised goods. Transaction price ascertained for the performance obligation of the Group is agreed in the contract with the customer, which also include variable consideration.
D) The group enters into certain dossier sale, licencing and supply arrangements that, in certain instances, include certain performance obligation. Based on significance of performance obligation, group recognises or defer the upfront payment received under these arrangements.
E) Reconciliation of contract price with revenue recognised in statement of profit and loss:
Particulars March 31, 2021 March 31, 2020
Contract price 94,940.55 82,084.56
Less:
Chargebacks claims (32,919.83) (30,333.49)
Amount recognised as sales returns & breakage expiry (1,938.40) (1,678.03)
Allowance for interest loss (15.13) (24.70)
Revenue recognised in statement of profit and loss 60,067.19 50,048.34
ANNUAL REPORT 2020-21 : NOTES TO THE CONSOLIDATED FINANCIAL STATEMENTS
Notes to the Consolidated Financial Statementfor the year ended March 31, 2021
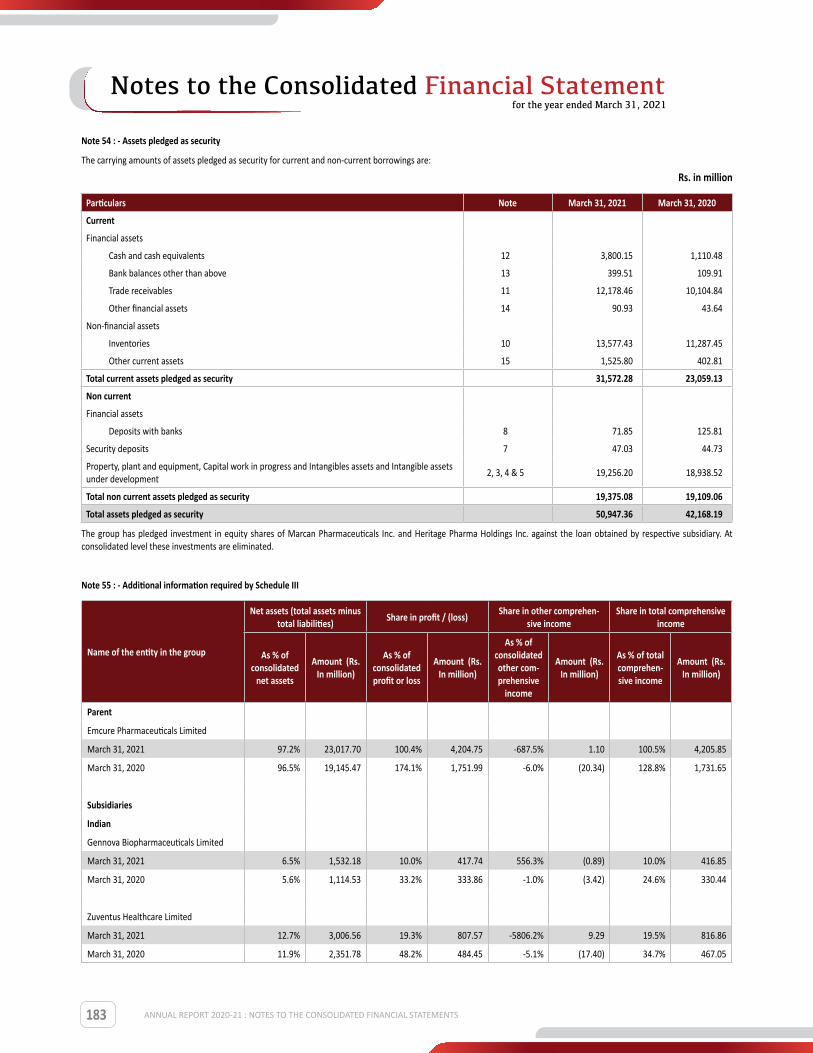
183
Note 54 : - Assets pledged as security
The carrying amounts of assets pledged as security for current and non-current borrowings are:
Rs. in million
Particulars Note March 31, 2021 March 31, 2020
Current
Financial assets
Cash and cash equivalents 12 3,800.15 1,110.48
Bank balances other than above 13 399.51 109.91
Trade receivables 11 12,178.46 10,104.84
Other financial assets 14 90.93 43.64
Non-financial assets
Inventories 10 13,577.43 11,287.45
Other current assets 15 1,525.80 402.81
Total current assets pledged as security 31,572.28 23,059.13
Non current
Financial assets
Deposits with banks 8 71.85 125.81
Security deposits 7 47.03 44.73
Property, plant and equipment, Capital work in progress and Intangibles assets and Intangible assets under development
2, 3, 4 & 5 19,256.20 18,938.52
Total non current assets pledged as security 19,375.08 19,109.06
Total assets pledged as security 50,947.36 42,168.19
The group has pledged investment in equity shares of Marcan Pharmaceuticals Inc. and Heritage Pharma Holdings Inc. against the loan obtained by respective subsidiary. At consolidated level these investments are eliminated.
Note 55 : - Additional information required by Schedule III
Name of the entity in the group
Net assets (total assets minus total liabilities) Share in profit / (loss) Share in other comprehen-
sive incomeShare in total comprehensive
income
As % of consolidated
net assets
Amount (Rs. In million)
As % of consolidated profit or loss
Amount (Rs. In million)
As % of consolidated other com-prehensive
income
Amount (Rs. In million)
As % of total comprehen-sive income
Amount (Rs. In million)
Parent
Emcure Pharmaceuticals Limited
March 31, 2021 97.2% 23,017.70 100.4% 4,204.75 -687.5% 1.10 100.5% 4,205.85
March 31, 2020 96.5% 19,145.47 174.1% 1,751.99 -6.0% (20.34) 128.8% 1,731.65
Subsidiaries
Indian
Gennova Biopharmaceuticals Limited
March 31, 2021 6.5% 1,532.18 10.0% 417.74 556.3% (0.89) 10.0% 416.85
March 31, 2020 5.6% 1,114.53 33.2% 333.86 -1.0% (3.42) 24.6% 330.44
Zuventus Healthcare Limited
March 31, 2021 12.7% 3,006.56 19.3% 807.57 -5806.2% 9.29 19.5% 816.86
March 31, 2020 11.9% 2,351.78 48.2% 484.45 -5.1% (17.40) 34.7% 467.05
ANNUAL REPORT 2020-21 : NOTES TO THE CONSOLIDATED FINANCIAL STATEMENTS
Notes to the Consolidated Financial Statementfor the year ended March 31, 2021

184
Name of the entity in the group
Net assets (total assets minus total liabilities) Share in profit / (loss) Share in other comprehen-
sive incomeShare in total comprehensive
income
As % of consolidated
net assets
Amount (Rs. In million)
As % of consolidated profit or loss
Amount (Rs. In million)
As % of consolidated other com-prehensive
income
Amount (Rs. In million)
As % of total comprehen-sive income
Amount (Rs. In million)
Avet Lifesciences Limited *
March 31, 2021 0.0% (0.73) 0.0% (0.83) 0.0% - 0.0% (0.83)
March 31, 2020 0.0% - 0.0% - 0.0% - 0.0% -
Foreign
Heritage Pharma Labs Inc.
March 31, 2021 -13.3% (3,143.05) -32.5% (1,360.75) 0 - -32.5% (1,360.75)
March 31, 2020 -9.4% (1,857.71) -60.6% (609.95) 0.0% - -45.4% (609.95)
Emcure Nigeria Limited
March 31, 2021 -0.4% (102.79) 0.4% 14.76 0.0% - 0.4% 14.76
March 31, 2020 -0.6% (126.52) -1.8% (17.64) 0.0% - -1.3% (17.64)
Emcure Pharmaceuticals Mena FZ LLC.
March 31, 2021 -0.3% (75.85) 0.5% 20.50 0.0% - 0.5% 20.50
March 31, 2020 -2.1% (426.16) 0.6% 6.22 0.0% - 0.5% 6.22
Emcure Pharmaceuticals South Africa (Pty) Limited
March 31, 2021 0.5% 118.51 2.9% 119.74 0.0% - 2.9% 119.74
March 31, 2020 -0.8% (154.36) -9.0% (90.88) 0.0% - -6.8% (90.88)
Emcure Brasil Farmaceutica Ltda
March 31, 2021 -0.5% (112.65) 0.1% 2.50 0.0% - 0.1% 2.50
March 31, 2020 -0.7% (130.75) -7.9% (79.04) 0.0% - -5.9% (79.04)
Heritage Pharma Holdings Inc.
March 31, 2021 -15.2% (3,592.02) 5.8% 242.61 0.0% - 5.8% 242.61
March 31, 2020 -27.8% (5,515.00) 88.0% 885.85 0.0% - 65.9% 885.85
Heritage Pharmaceuticals Inc
March 31, 2021 38.8% 9,189.80 -28.2% (1,181.34) 0.0% - -28.2% (1,181.34)
March 31, 2020 54.7% 10,858.32 -151.3% (1,522.45) 0.0% - -113.2% (1,522.45)
Emcure Pharma UK Ltd
March 31, 2021 15.0% 3,558.21 -0.1% (6.07) 0.0% - -0.1% (6.07)
March 31, 2020 7.8% 1,545.13 1.1% 11.23 0.0% - 0.8% 11.23
ANNUAL REPORT 2020-21 : NOTES TO THE CONSOLIDATED FINANCIAL STATEMENTS
Notes to the Consolidated Financial Statementfor the year ended March 31, 2021

185
Name of the entity in the group
Net assets (total assets minus total liabilities) Share in profit / (loss) Share in other comprehen-
sive incomeShare in total comprehensive
income
As % of consolidated
net assets
Amount (Rs. In million)
As % of consolidated profit or loss
Amount (Rs. In million)
As % of consolidated other com-prehensive
income
Amount (Rs. In million)
As % of total comprehen-sive income
Amount (Rs. In million)
Tillomed Pharma GmbH
March 31, 2021 1.7% 408.77 -1.6% (66.12) 0.0% - -1.6% (66.12)
March 31, 2020 1.5% 293.88 -8.3% (83.11) 0.0% - -6.2% (83.11)
Tillomed Laboratories Ltd
March 31, 2021 12.9% 3,044.31 7.2% 303.06 0.0% - 7.2% 303.06
March 31, 2020 2.9% 583.50 2.1% 21.32 0.0% - 1.6% 21.32
Emcure Pharma Peru S.A.C.
March 31, 2021 -0.1% (17.61) -0.8% (34.59) 0.0% - -0.8% (34.59)
March 31, 2020 -0.1% (27.35) -0.4% (3.56) 0.0% - -0.3% (3.56)
Emcure Pharma Mexico S.A. DE C.V.
March 31, 2021 -0.3% (68.79) 0.4% 14.77 0.0% - 0.4% 14.77
March 31, 2020 -0.4% (73.99) -3.9% (39.18) 0.0% - -2.9% (39.18)
Marcan Pharmaceuticals Inc.
March 31, 2021 0.4% 96.10 11.8% 492.61 0.0% - 11.8% 492.61
March 31, 2020 -5.0% (993.16) -6.4% (64.60) 0.0% - -4.8% (64.60)
Emcure Pharmaceuticals Pty Ltd
March 31, 2021 0.1% 16.35 0.0% (1.37) 0.0% - 0.0% (1.37)
March 31, 2020 0.1% 14.81 -3.0% (30.64) 0.0% - -2.3% (30.64)
Laboratories Tillomed Spain S.L.U.
March 31, 2021 0.2% 49.34 0.0% (0.05) 0.0% - 0.0% (0.05)
March 31, 2020 0.2% 47.94 0.9% 9.14 0.0% - 0.7% 9.14
Tillomed Italia S.R.L.
March 31, 2021 0.2% 48.77 -1.2% (50.29) 0.0% - -1.2% (50.29)
March 31, 2020 0.3% 53.31 -4.9% (49.64) 0.0% - -3.7% (49.64)
Emcure NZ Limited
March 31, 2021 0.0% 1.72 0.0% 0.18 0.0% - 0.0% 0.18
March 31, 2020 0.0% (4.32) 0.5% 4.64 0.0% - 0.3% 4.64
Tillomed France SAS
March 31, 2021 0.2% 43.94 0.3% 11.82 0.0% - 0.3% 11.82
March 31, 2020 0.2% 31.29 1.3% 13.08 0.0% - 1.0% 13.08
ANNUAL REPORT 2020-21 : NOTES TO THE CONSOLIDATED FINANCIAL STATEMENTS
Notes to the Consolidated Financial Statementfor the year ended March 31, 2021
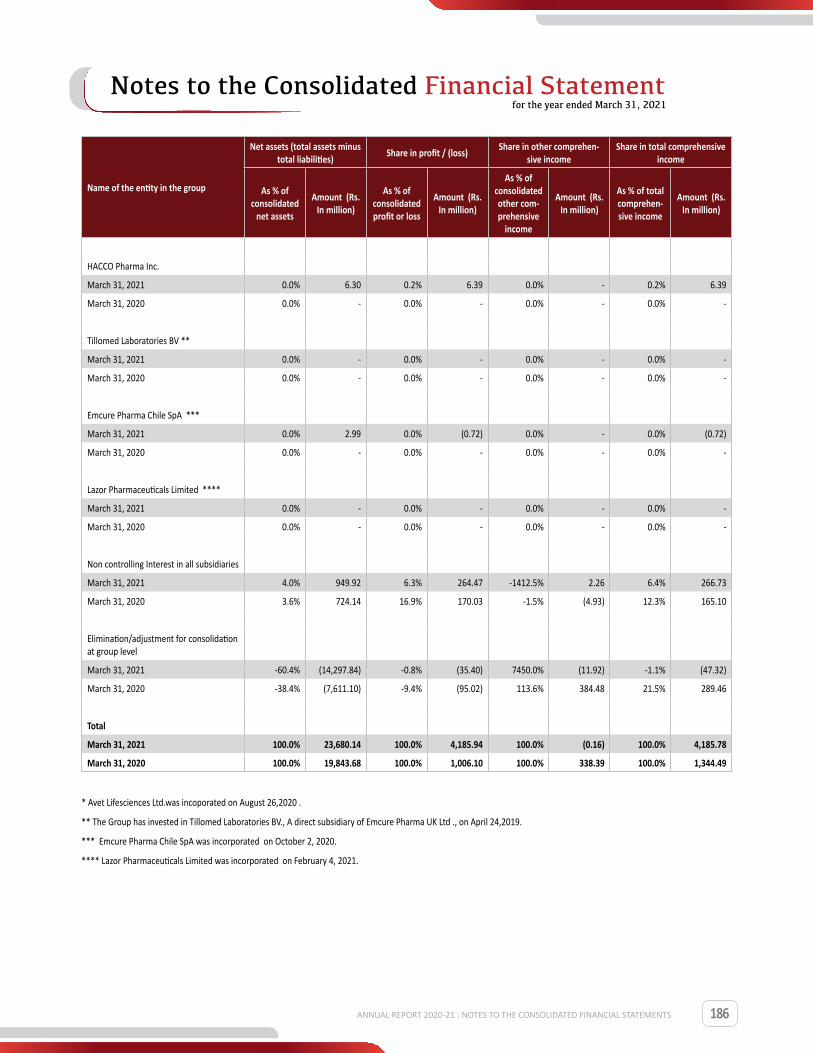
186
Name of the entity in the group
Net assets (total assets minus total liabilities) Share in profit / (loss) Share in other comprehen-
sive incomeShare in total comprehensive
income
As % of consolidated
net assets
Amount (Rs. In million)
As % of consolidated profit or loss
Amount (Rs. In million)
As % of consolidated other com-prehensive
income
Amount (Rs. In million)
As % of total comprehen-sive income
Amount (Rs. In million)
HACCO Pharma Inc.
March 31, 2021 0.0% 6.30 0.2% 6.39 0.0% - 0.2% 6.39
March 31, 2020 0.0% - 0.0% - 0.0% - 0.0% -
Tillomed Laboratories BV **
March 31, 2021 0.0% - 0.0% - 0.0% - 0.0% -
March 31, 2020 0.0% - 0.0% - 0.0% - 0.0% -
Emcure Pharma Chile SpA ***
March 31, 2021 0.0% 2.99 0.0% (0.72) 0.0% - 0.0% (0.72)
March 31, 2020 0.0% - 0.0% - 0.0% - 0.0% -
Lazor Pharmaceuticals Limited ****
March 31, 2021 0.0% - 0.0% - 0.0% - 0.0% -
March 31, 2020 0.0% - 0.0% - 0.0% - 0.0% -
Non controlling Interest in all subsidiaries
March 31, 2021 4.0% 949.92 6.3% 264.47 -1412.5% 2.26 6.4% 266.73
March 31, 2020 3.6% 724.14 16.9% 170.03 -1.5% (4.93) 12.3% 165.10
Elimination/adjustment for consolidation at group level
March 31, 2021 -60.4% (14,297.84) -0.8% (35.40) 7450.0% (11.92) -1.1% (47.32)
March 31, 2020 -38.4% (7,611.10) -9.4% (95.02) 113.6% 384.48 21.5% 289.46
Total
March 31, 2021 100.0% 23,680.14 100.0% 4,185.94 100.0% (0.16) 100.0% 4,185.78
March 31, 2020 100.0% 19,843.68 100.0% 1,006.10 100.0% 338.39 100.0% 1,344.49
* Avet Lifesciences Ltd.was incoporated on August 26,2020 .
** The Group has invested in Tillomed Laboratories BV., A direct subsidiary of Emcure Pharma UK Ltd ., on April 24,2019.
*** Emcure Pharma Chile SpA was incorporated on October 2, 2020.
**** Lazor Pharmaceuticals Limited was incorporated on February 4, 2021.
ANNUAL REPORT 2020-21 : NOTES TO THE CONSOLIDATED FINANCIAL STATEMENTS
Notes to the Consolidated Financial Statementfor the year ended March 31, 2021
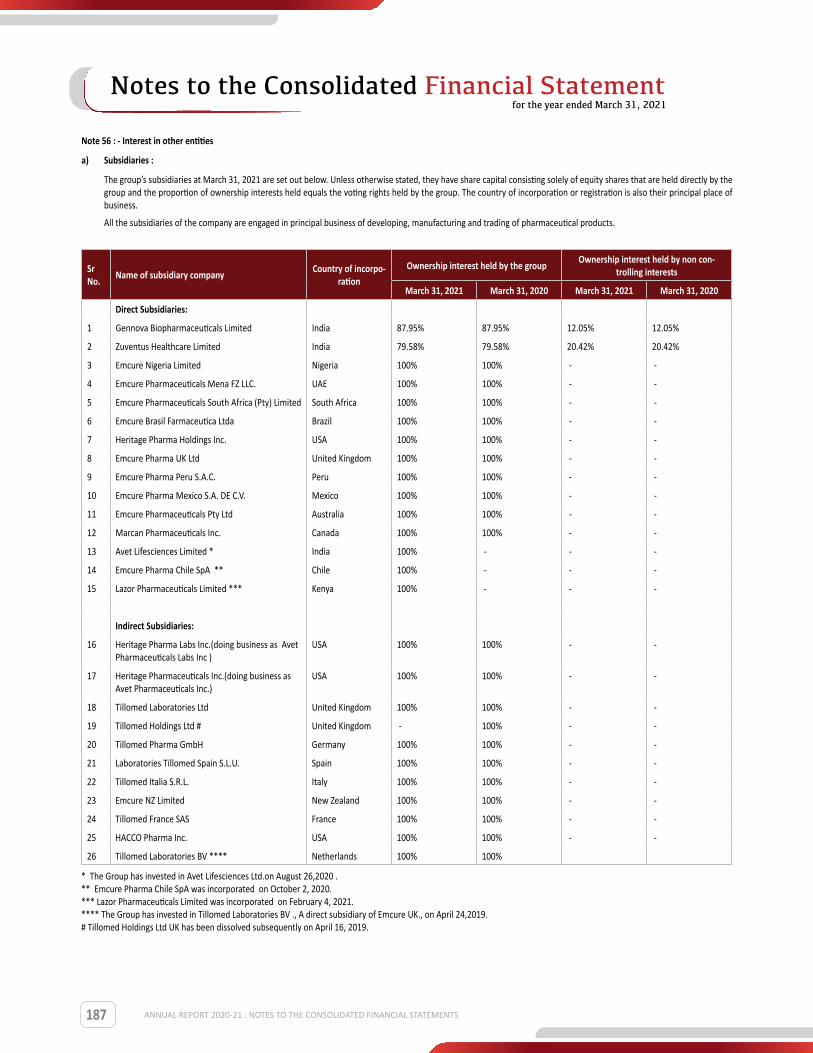
187
Note 56 : - Interest in other entities
a) Subsidiaries :
The group’s subsidiaries at March 31, 2021 are set out below. Unless otherwise stated, they have share capital consisting solely of equity shares that are held directly by the group and the proportion of ownership interests held equals the voting rights held by the group. The country of incorporation or registration is also their principal place of business.
All the subsidiaries of the company are engaged in principal business of developing, manufacturing and trading of pharmaceutical products.
Sr No. Name of subsidiary company Country of incorpo-
rationOwnership interest held by the group Ownership interest held by non con-
trolling interests
March 31, 2021 March 31, 2020 March 31, 2021 March 31, 2020
Direct Subsidiaries:
1 Gennova Biopharmaceuticals Limited India 87.95% 87.95% 12.05% 12.05%
2 Zuventus Healthcare Limited India 79.58% 79.58% 20.42% 20.42%
3 Emcure Nigeria Limited Nigeria 100% 100% - -
4 Emcure Pharmaceuticals Mena FZ LLC. UAE 100% 100% - -
5 Emcure Pharmaceuticals South Africa (Pty) Limited South Africa 100% 100% - -
6 Emcure Brasil Farmaceutica Ltda Brazil 100% 100% - -
7 Heritage Pharma Holdings Inc. USA 100% 100% - -
8 Emcure Pharma UK Ltd United Kingdom 100% 100% - -
9 Emcure Pharma Peru S.A.C. Peru 100% 100% - -
10 Emcure Pharma Mexico S.A. DE C.V. Mexico 100% 100% - -
11 Emcure Pharmaceuticals Pty Ltd Australia 100% 100% - -
12 Marcan Pharmaceuticals Inc. Canada 100% 100% - -
13 Avet Lifesciences Limited * India 100% - - -
14 Emcure Pharma Chile SpA ** Chile 100% - - -
15 Lazor Pharmaceuticals Limited *** Kenya 100% - - -
Indirect Subsidiaries:
16 Heritage Pharma Labs Inc.(doing business as Avet Pharmaceuticals Labs Inc )
USA 100% 100% - -
17 Heritage Pharmaceuticals Inc.(doing business as Avet Pharmaceuticals Inc.)
USA 100% 100% - -
18 Tillomed Laboratories Ltd United Kingdom 100% 100% - -
19 Tillomed Holdings Ltd # United Kingdom - 100% - -
20 Tillomed Pharma GmbH Germany 100% 100% - -
21 Laboratories Tillomed Spain S.L.U. Spain 100% 100% - -
22 Tillomed Italia S.R.L. Italy 100% 100% - -
23 Emcure NZ Limited New Zealand 100% 100% - -
24 Tillomed France SAS France 100% 100% - -
25 HACCO Pharma Inc. USA 100% 100% - -
26 Tillomed Laboratories BV **** Netherlands 100% 100%
* The Group has invested in Avet Lifesciences Ltd.on August 26,2020 .** Emcure Pharma Chile SpA was incorporated on October 2, 2020.*** Lazor Pharmaceuticals Limited was incorporated on February 4, 2021.**** The Group has invested in Tillomed Laboratories BV ., A direct subsidiary of Emcure UK., on April 24,2019.# Tillomed Holdings Ltd UK has been dissolved subsequently on April 16, 2019.
ANNUAL REPORT 2020-21 : NOTES TO THE CONSOLIDATED FINANCIAL STATEMENTS
Notes to the Consolidated Financial Statementfor the year ended March 31, 2021
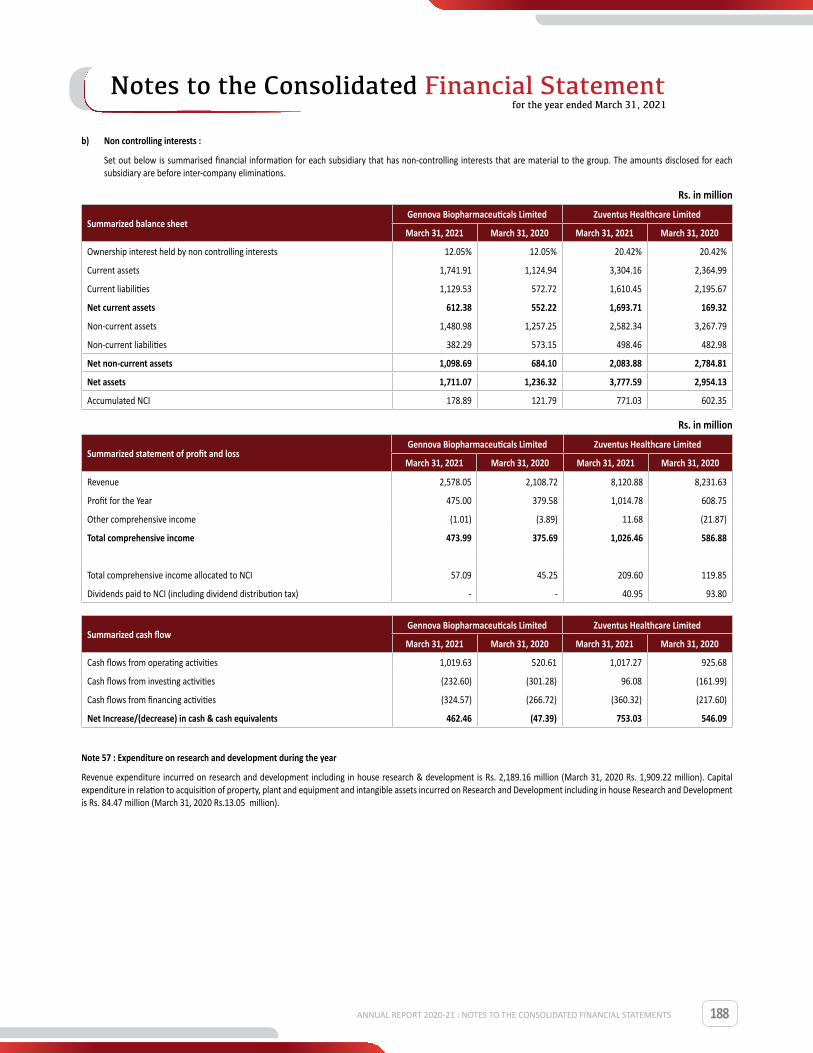
188
b) Non controlling interests :
Set out below is summarised financial information for each subsidiary that has non-controlling interests that are material to the group. The amounts disclosed for each subsidiary are before inter-company eliminations.
Rs. in million
Summarized balance sheetGennova Biopharmaceuticals Limited Zuventus Healthcare Limited
March 31, 2021 March 31, 2020 March 31, 2021 March 31, 2020
Ownership interest held by non controlling interests 12.05% 12.05% 20.42% 20.42%
Current assets 1,741.91 1,124.94 3,304.16 2,364.99
Current liabilities 1,129.53 572.72 1,610.45 2,195.67
Net current assets 612.38 552.22 1,693.71 169.32
Non-current assets 1,480.98 1,257.25 2,582.34 3,267.79
Non-current liabilities 382.29 573.15 498.46 482.98
Net non-current assets 1,098.69 684.10 2,083.88 2,784.81
Net assets 1,711.07 1,236.32 3,777.59 2,954.13
Accumulated NCI 178.89 121.79 771.03 602.35
Rs. in million
Summarized statement of profit and lossGennova Biopharmaceuticals Limited Zuventus Healthcare Limited
March 31, 2021 March 31, 2020 March 31, 2021 March 31, 2020
Revenue 2,578.05 2,108.72 8,120.88 8,231.63
Profit for the Year 475.00 379.58 1,014.78 608.75
Other comprehensive income (1.01) (3.89) 11.68 (21.87)
Total comprehensive income 473.99 375.69 1,026.46 586.88
Total comprehensive income allocated to NCI 57.09 45.25 209.60 119.85
Dividends paid to NCI (including dividend distribution tax) - - 40.95 93.80
Summarized cash flowGennova Biopharmaceuticals Limited Zuventus Healthcare Limited
March 31, 2021 March 31, 2020 March 31, 2021 March 31, 2020
Cash flows from operating activities 1,019.63 520.61 1,017.27 925.68
Cash flows from investing activities (232.60) (301.28) 96.08 (161.99)
Cash flows from financing activities (324.57) (266.72) (360.32) (217.60)
Net Increase/(decrease) in cash & cash equivalents 462.46 (47.39) 753.03 546.09
Note 57 : Expenditure on research and development during the year
Revenue expenditure incurred on research and development including in house research & development is Rs. 2,189.16 million (March 31, 2020 Rs. 1,909.22 million). Capital expenditure in relation to acquisition of property, plant and equipment and intangible assets incurred on Research and Development including in house Research and Development is Rs. 84.47 million (March 31, 2020 Rs.13.05 million).
ANNUAL REPORT 2020-21 : NOTES TO THE CONSOLIDATED FINANCIAL STATEMENTS
Notes to the Consolidated Financial Statementfor the year ended March 31, 2021

189
Note 58 : Corporate social responsibility
As per Section 135 of the Companies Act, 2013, a corporate social responsibility (CSR) committee has been formed by the holding company and its Indian subsidiaries. The areas for CSR activities are promoting education, healthcare and ensuring environmental sustainability. Amount spent during the year on activities which are specified in Schedule VII of the Companies Act 2013 are as mentioned below :
a) Gross amount of Rs. 80.20 million (March 31, 2020 Rs. 74.77 million) required to be spent during the year by the company and its Indian subsidiaries.b) Amount spent during the year on
Rs. in million
Particulars Paid Yet to be paid Total Paid Yet to be paid Total
March 31, 2021 March 31, 2020
(i) Construction/acquisition of any asset - - - - - -
(ii) On purposes as mentioned above 80.91 3.99 84.90 69.72 - 69.72
Note 59 : The information regarding Micro Enterprises and Small Enterprises has been determined to the extent such parties have been identified on the basis of information available with the Company.
Rs. in millionParticulars March 31, 2021 March 31, 2020
i) The principal amount and the interest due thereon remaining unpaid to any supplier at the end of each accounting year - 0.62
ii) The amount of interest paid by the buyer in terms of Section 16 of the Micro, Small and Medium Enterprise Development Act, 2006 along with the amount of the payment made to the supplier beyond the appointed day during each accounting year. - 0.07
iii) The amount of interest due and payable for the period of delay in making payment but without adding the interest specified under the Micro, Small and Medium Enterprise Development Act, 2006.
- 0.06
iv) The amount of interest accrued and remaining unpaid at the end of each accounting year. 0.15 0.22
v) The amount of further interest remaining due and payable even in the succeeding years, until such date when the interest dues above are actually paid to the small enterprise, for the purpose of disallowance of a deductible expenditure under Section 23 of the Micro, Small and Medium Enterprise Development Act, 2006.
- 0.22
Note 60 : Composite Scheme of Arrangement
The Board of Directors of the Holding company, in its meeting held on November 09, 2020, had approved Composite Scheme of Arrangement between Emcure Pharmaceuticals Limited (“Demerged Company”) and Avet Lifesciences Limited (“Resulting Company”) and their respective shareholders (‘Scheme’) which was filed before the National Company Law Tribunal (“NCLT”), Mumbai, on November 30, 2020, for demerger of the Holding company’s Unites States of America (‘US’) market business and vesting the same into the Resulting Company, under Sections 230 to 232 read with Section 52, section 66 and other applicable provisions of the Companies Act, 2013.The Joint Petition was filed with NCLT on February 04, 2021. Final hearing of NCLT is awaited. Pending the NCLT approval, the consolidated financial statements do not have any impact of the scheme. Note 61 : Government Grant
A) Government grants are related to exemption of basic customs duty on purchase of imported machineries to be used for the manufacturing of products. Gennova Biopharmaceuticals Limited subsidiary of the company is required to fulfil the export obligation against duty benefit received. Refer note 45B for the details of unfulfilled obligations. Based on past experience, management is confident that it will fulfil conditions attached to the grant received.
B) During the year Gennova Biopharmaceuticals Limited has received a sanction for various Government grants towards research and development expenses for life saving drugs and vaccines. During the year, grant amounting to Rs. 193.25 million (March 31, 2020 : Rs. 6.00 million) has been recognised as an other operating income in Profit & Loss account for the eligible expenses incurred towards respective projects, out of which Rs. 114.25 million has been accrued as Government Grant receivable under ‘other current financial assets’
C) Gennova Biopharmaceuticals Limited has also received grants amounting to Rs. 245.76 millions for which eligible expenses will be incurred in the next year, accordingly it has been disclosed as Deferred Revenue grants under other current liabilities.
D) Government Grants amounting to Rs. 114.05 million disclosed under other non-current liabilities relates to the amount received to incur capital expenditure for building manufacturing facility. Grant will get offset at the time of incurring capital expenditures for the eligible manufacturing facility.
Note 62 : Consideration payable towards acquisition of subsidiary
The Group acquired 100% equity shares in Marcan Pharmaceuticals Inc., International Pharmaceuticals Generics Ltd. and IPG (2015) vide Asset and Share Purchase Agreement (the “”agreement””) dated November 8, 2015 (the “”acquisition Date””) through a special purpose vehicle viz. Emcure Pharmaceuticals Canada Limited.
Immediately following this agreement, on November 9, 2015, all entities above were amalgamated and new entity called Marcan Pharmaceuticals Inc. (“”Marcan””) was formed, the current operating company.The acquisition was for a total consideration of Rs. 4,619.12 million* (CAD 93 million*). As per the Share Purchase Agreement, there is consideration payable to the selling shareholders of Marcan Pharmaceuticals Inc. in the form of preference shares, based on achievement of specific EBITDA levels of Marcan for the year ended March 31, 2021, or at the option of selling shareholders for the year ended March 31, 2022, limited to a maximum of Rs. 2,384.06 million (CAD 48 Million).
In December 2020, the holders notified their intent not to exercise their option to extend the redemption term by a year and redeem the preferred shares. The shares will be redeemed on July 30, 2021 at the current value of Rs. 2,750.78 (CAD 47.25 Million) (Refer note 24)
*Considering 1 CAD = 49.67 Rupees, the rate as on the date of acquisition”
ANNUAL REPORT 2020-21 : NOTES TO THE CONSOLIDATED FINANCIAL STATEMENTS
Notes to the Consolidated Financial Statementfor the year ended March 31, 2021

190
Note 63 : Events occurring after the reporting period
On May 07, 2021,Emcure Pharma Philippines Inc., a direct subsidiary of the Company was incorporated with equity share capital of Pesos 9.68 million (equivalent to Rs. 15.11 million).
Note 64 : Specified bank notes (SBNs)
The disclosures regarding details of specified bank notes held and transacted during November 8, 2016 to December 30 2016 has not been made in these financial statements, since the requirement does not pertain to financial year ended 31 March 2021.
Note 65 : GST refund received
The Holding Company and its subsidiary Zuventus Healthcare Limited (ZHL) are entitled to receive subsidy in the form of proportionate refund of GST paid in cash (i.e. other than utilising input credit) by its unit at Jammu for a period not exceeding ten years from the date of start of commercial production at Jammu unit. The subsidy is available upto March 01, 2026. There are no unfulfilled conditions or other contingencies attached to this grant. There are no unfulfilled conditions or other contingencies attached to this grant.
Note 66 : Impact of COVID-19 pandemicIn March 2020, the World Health Organisation declared COVID-19 to be a pandemic. The group has adopted measures to curb the spread of infection in order to protect the health of its employees and ensure business continuity with minimal disruption. The group has considered internal and external information while finalizing various estimates in relation to its financial statement captions upto the date of approval of the Statements by the Board of Directors. The actual impact of the global health pandemic may be different from that which has been estimated, as the COVID -19 situation evolves in India and globally. The group will continue to closely monitor any material changes to future economic conditions.
Note 67 : Code of Social SecurityThe Indian Parliament has approved the Code on Social Security, 2020 which would impact the contributions by the Indian companies in the group towards Provident Fund and Gratuity. The Ministry of Labour and Employment has released draft rules for the Code on Social Security, 2020 on November 13, 2020, and has invited suggestions from stake holders which are under active consideration by the Ministry. The Holding Company and its Indian subsidiaries will assess the impact and complete the evaluation once the subject rules are notified and will give appropriate impact in its financial statements in the period in which, the Code becomes effective and the related rules to determine the financial impact are published.
For B S R & Co. LLP For and on behalf of the Board of DirectorsFirm Registration: 101248W/W-100022 Emcure Pharmaceuticals LimitedChartered Accountants CIN -U24231PN1981PLC024251 Berjis Desai Satish Mehta Abhishek Chairman Managing DirectorPartner DIN - 00153675 DIN - 00118691 Membership No. 062343 Jayant Prakash Tajuddin Shaikh Company Secretary Chief Financial Officer Membership No. F6742 PAN - AKQPS1951GPlace: Pune Date : May 28, 2021 Place: Pune Date : May 28, 2021
ANNUAL REPORT 2020-21 : NOTES TO THE CONSOLIDATED FINANCIAL STATEMENTS
Notes to the Consolidated Financial Statementfor the year ended March 31, 2021

191

192
Emcure Pharmaceuticals Ltd.Plot No. P-2, I.T.-B.T. Park, Phase - II, M.I.D.C., Hinjawadi, Pune - 411 057, INDIA
/emcurepharma /emcurepharmawww.emcure.com /emcurepharmao�cial