Appendix F: Indexes of Output, Employment, Manhours ...
75
This PDF is a selection from an out-of-print volume from the National Bureau of Economic Research Volume Title: Employment in Manufacturing, 1899-1939: An Analysis of Its Relation to the Volume of Production Volume Author/Editor: Solomon Fabricant Volume Publisher: NBER Volume ISBN: 0-87014-040-X Volume URL: http://www.nber.org/books/fabr42-1 Publication Date: 1942 Chapter Title: Appendix F: Indexes of Output, Employment, Manhours, Employment per Unit of Product, and Manhours per Unit of Product in Manufacturing Industries Chapter Author: Solomon Fabricant Chapter URL: http://www.nber.org/chapters/c4884 Chapter pages in book: (p. 259 - 332)
-
Upload
khangminh22 -
Category
Documents
-
view
0 -
download
0
Transcript of Appendix F: Indexes of Output, Employment, Manhours ...

This PDF is a selection from an out-of-print volume from the NationalBureau of Economic Research
Volume Title: Employment in Manufacturing, 1899-1939: An Analysisof Its Relation to the Volume of Production
Volume Author/Editor: Solomon Fabricant
Volume Publisher: NBER
Volume ISBN: 0-87014-040-X
Volume URL: http://www.nber.org/books/fabr42-1
Publication Date: 1942
Chapter Title: Appendix F: Indexes of Output, Employment, Manhours,Employment per Unit of Product, and Manhours per Unit of Productin Manufacturing Industries
Chapter Author: Solomon Fabricant
Chapter URL: http://www.nber.org/chapters/c4884
Chapter pages in book: (p. 259 - 332)

Appendix F
Indexes of Output, Employment, Manhours,Employment per Unit of Product, andManhours per Unit of Product inManufacturing Industries
S

..

Appendix F
Indexes of Output, Employment, Manhours,Employment per Unit of Product, andManhours per Unit of Product inManufacturing Industries
INTRODUCTORY NOTE
THE various indexes of labor input, output, and labor per unit,given only in summary or chart form in the text of this report,are presented in Table F..l in full. They are supplied for everymanufacturing industry or group of industries for every year forwhich we have data on both output and employment. Occasion-ally data on physical output, and almost always data on employ-ment, are available for industries and years not covered here, but(except for the groups) these are generally omitted because theydo not cover both series for the same year.
The indexes of physical output (described briefly in AppendixD, above) are reproduced from The Output of ManufacturingIndustries, for the period covered by that volume,with a few additions or corrections mentioned in footnotes to thepresent tables. Output indexes for the period prior to 1899 andfor 1937—39 were computed along lines similar to those laid downin the volume cited, and utilizing the same sort of data, mostlyfrom the Census of Manufactures.
The indexes of wage-earner employment are based on theCensus of Manufactures data given in Table B-i above, exceptthose for the period preceding 1899 which are not reproducedin the present report.2 In the computation of the indexes ofwage-earner employment due account was taken of all the dis-continuities shown in Table B-i, whenever overlaps were pro-vided by the Census, or whenever reasonable estimates of suchoverlaps could be prepared. In a few cases, when the discontinui-
1 National Bureau of Economic Research, 1940.2 The indexes of wage-earner employment were extrapolated beyond 1899
via total employment, rather than wage earners alone, since there are severalrather definite indications in the early Census reports and schedules that thefigures on employment covered all workers and not wage earners exclusively.
261
262 APPENDIX F
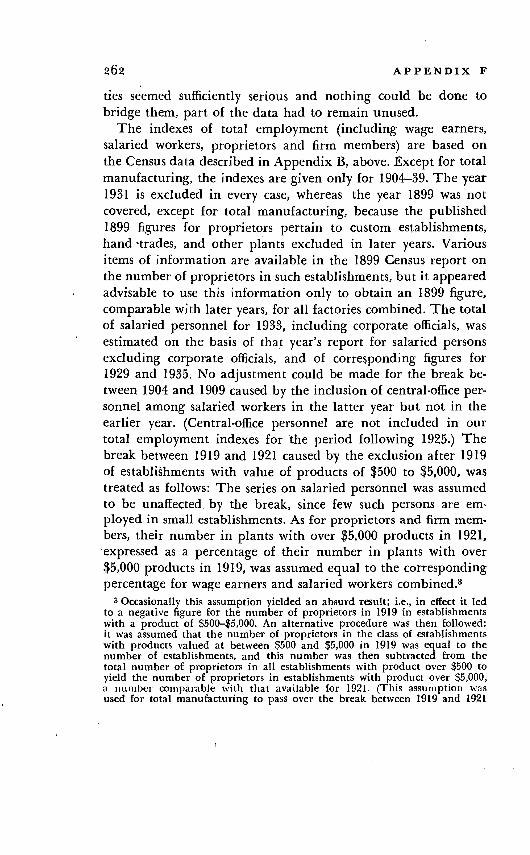
ties seemed sufficiently serious and nothing could be done tobridge them, part' of the data had to remain unused.
The indexes of total employment (including wage earners,salaried workers, proprietors and firm members) are based onthe Census data described in Appendix B, above. Except for totalmanufacturing, the indexes are given only for 1904—39. The year1931 is excluded in every case, whereas the year 1899 was notcovered, except for total manufacturing, because the published1899 figures for proprietors pertain to custom establishments,hand 'trades, and other plants excluded in later years. Variousitems of information are available in the 1899 Census report onthe number of proprietors in such establishments, but it appearedadvisable to use this information only to obtain an 1899 figure,comparable with later years, for all factories combined. The totalof salaried personnel for 1933, including corporate officials, wasestimated on the basis of that year's report for salaried personsexcluding corporate officials, and of corresponding figures for1929 and 1935. No adjustment could be made for the break be-tween 1904 and 1909 caused by the inclusion of central-office per-sonnel among salaried workers in the latter year but not in theearlier year. (Central-office personnel are not included in ourtotal employment indexes for 'the period following 1925.) Thebreak between 1919 and 1921 caused by the exclusion after 1919of establishments with value of products of $500 to $5,000, wastreated as follows: The series on salaried personnel was assumedto be unaffected, by the break, since few such persons are em-ployed in small establishments. As for proprietors and firm mem-bers, their number in plants with over $5,000 products in 1921,'expressed as a percentage of their number in plants with over$5,000 products in 1919, was assumed equal to the correspondingpercentage for wage earners and salaried workers combined.3
8 Occasionally this assumption yielded' an absurd result; i.e., in effect it ledto a negative figure for the number of proprietors in 1919 in establishmentswith a product of $500—$5,000. An alternative procedure was then followed:it was assumed that the number of proprietors in the class of establishmentswith products valued at between $500 and $5,000 in 1919 was equal to thenumber of establishments, and this number was then subtracted from thetotal number of proprietors in all establishments with product over $500 toyield the number of proprietors in establishments with product over $5,000,a riun'iber comparable with that available for 1921, (Th.is assumption wasused for total manufacturing to pass over the break between 1919 and 1921
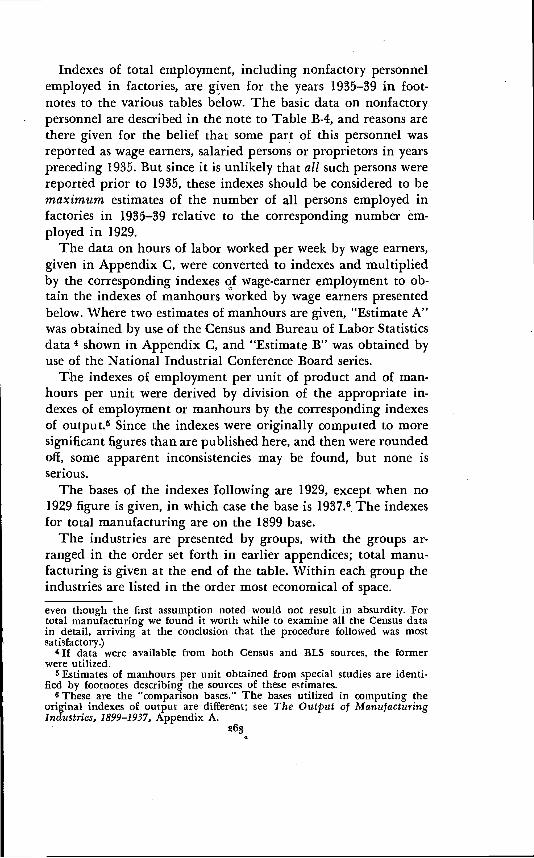
Indexes of total employment, including nonfactory personnelemployed in factories, are g(ven for the years 1935—39 in foot-notes to the various tables below. The basic data on nonfactorypersonnel are described in the note to Table B-4, and reasons arethere given for the belief that some part of this personnel wasreported as wage earners, salaried persons or proprietors in yearspreceding 1935. But since it is unlikely that all such persons werereported prior to 1935, these indexes should be considered to bemaximum estimates of the number of all persons employed infactories in 1935—39 relative to the corresponding number em-ployed in 1929.
The data on hours of labor worked per week by wage earners,given in Appendix C, were converted to indexes and multipliedby the corresponding indexes of wage-earner employment to ob-tain the indexes of manhours worked by wage earners presentedbelow. Where two estimates of manhours are given, "Estimate A"was obtained by use of the Census and Bureau of Labor Statisticsdata4 shown in Appendix C, and "Estimate B" was obtained byuse of the National Industrial Conference Board series.
The indexes of employment per unit of product and of man-hours per unit were derived by division of the appropriate in-dexes of employment or manhours by the corresponding indexesof output.5 Since the indexes were originally computed to moresignificant figures than are published here, and then were roundedoff, some apparent inconsistencies may be found, but none isserious.
The bases of the indexes following are 1929, except when no1929 figure is given, in which case the base is 1937.6. The indexesfor total manufacturing are on the 1899 base.
The industries are presented by groups, with the groups ar-ranged in the order set forth in earlier appendices; total manu-facturing is given at the end of the table. Within each group theindustries are listed in the order most economical of space.
even though the first assumption noted would not result in absurdity. Fortotal manufacturing we found it worth while to examine all the Census datain detail, arriving at the conclusion that the procedure followed was mostsatisfactory.)
4 If data were available from both Census and BLS sources, the formerwere utilized.
5 Estimates of manhours per unit obtained from special studies are identi.fled by footnotes describing the sources of these estimates.
6 These are the "comparison bases." The bases utilized in computing theoriginal indexes of output are different; see The Out put of ManufacturingIndustries, 1899—193 7, Appendix A.
263

264 APPENDIX F
TABLE F—iI
Indexes of Output, Employment, Manhours, Employmentper Unit of Product, and Manhours per Unit ofProduct in Manufacturing Industries
FOODS
all personnel:Baking powder Employment
Employment per unitShortenings Employment
Employment per unit
The following indexes1935 1937 1939
103 84 110142 133 159
168 167 170
125 113 115
* Excludes nonfactory personnel, 1935—39. The following
all personnel: 1935 1937 1939Employment 117
Employment per unit 133
a Combination of bread and cake and biscuits and crackers. Data on hours are not availablefor these separately.
BAKING POWDER SHORTENINGS
Employment per
Tear Output
EmploymentWage
Earners Total*
UnitWage
Earners Total*
1927 88 101 110 114 1241929 100 100 100 100 1001931 96 96 .. 991933 74 89 91 122 1231935 73 89 92 122 1261937 63 79 80 125 1261939 69 78 78 112 112
Employment
Output
EmploymentWage
Earners Total*
perWage
Earners
Unit
Total*
99 89 85 90 86100 100 100 100 100100 123 •. 124 ••98 122 119 125 121
134 162 156 120 116148 164 162 111 110148 156 150 106 102
* Excludes nonfactory personnel, 1935—39. (1929:100) cover
BAKERY PRODUCTSa
Tear Output
EmploymentWage
Earners Total*
Employment perUnit
WageEarners Total*
Manhourshours per UnitWage Earners(ESTIMATE A)
1923 77 81 83 106 108 ..1925 80 80 81 100 102 .. .. .
1927 90 86 86 95 96 ..1929 100 100 100 100 100 ..1931 91 91 .. 101 .. ..1933 74 91 89 122 119 ..1935 88 109 103 124 116 87 96
1937 97 119 115 122 118 100 100
1939 102 115 110 113 108 94 91
indexes (1929:100) cover
120
123
124
122

r
BASIC INDEXES 265
Employment
Output
EmploymentWage
Earners Total*
perWage
Earners
Unit
Total*
75 76 79 102 10578 77 78 98 10190 83 85 93 94
100 100 100 100 10092 93 .. 101 ..74 93 91 126 12386 113 106 131 123
96 126 121 132 127
99 121 115 122 116
personnel, 1935—39. The following indexes (1929:100) cover1935 1937 1939
93 93Employment per unit 98 .. 83Employment 122Employment per unit 141 .. 131
For indexes of manhours and manhours per unit see the combination bakery products.
CANE-SUGAR REFININGa
Tear Output
• EmploymentWage
Earners Total*
Employment perUnit
WageEarners Total*
Man- Manhourshours per UnitWage Earners(ESTIMATE A)
1909 55 68 65 123 118 107 1731914 66 81 79 123 120 ..1919 79 131 131 165 166 ..1921 74 111 112 150 151 ..1923 87 110 110 127 127 ..1925
1927
106
100
104
101
104
101
98 99
100 100....
1929 100 100 100 100 100 ..1931 87 85 .. 98 .. ..1933 • 77 83 82 107 106 92 10619351937
8389
99101
97100
120 118113 113
95 103100 100
1939 83 102 101 123 122 95 102
BISCUITS and CRACKERSa BREAD and CAKEa
per
Tear Output
EmploymentWageEarners Total*
UnitWageEarners Total*
1923 81 104 103 127 1261925 86 96 95 112 1111927 91 97 97 107 1061929 100 100 100 100 1001931 86 84 .. 981933 78 80 77 103 99 .
1935 96 86 83 90 871937 106 85 83 80 781939 113 86 82 76 73
*Excludes nonfactoryall personnel:Biscuits and crackers Employment
Bread and cake 130
all personnel:* Excludes nonfactory personnel, 1935—39. The
Employment
following1935 1937
98 104
Employment per unit 119 117
a For indexes back to 1899 see the combination cane sugar, total.
(1929:100) coverindexes1939107130
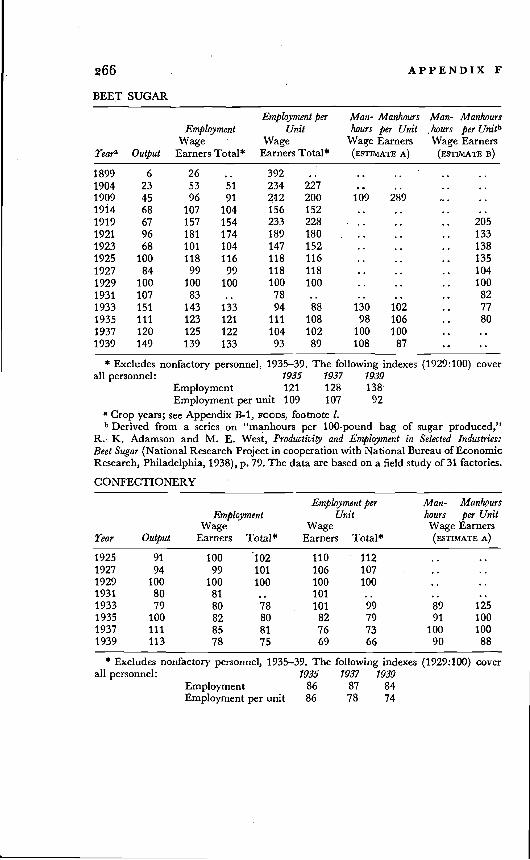
266 APPENDIX F
BEET SUGAR
Employment per Man- Manhours Man- ManhoursEmployment Unit hours per Unit ,hours per Unitb
Wage Wage Wage Earners Wage Earnersrears Output Earners Total* Earners Total* (EsTIMAm A) (ESTIMATE B)
1899 6 26 .. 392 .. .. .. ..1904 23 53 51 234 227 .. ..1909 45 96 91 212 200 109 2891914 68 107 104 156 152 .. .. ..1919 67 157 154 233 228 .. .. .. 2051921 96 181 174 189 180 .. .. .. 1331923 68 101 104 147 152 .. .. .. 1381925 100 118 116 118 116 .. .. .. 1351927 84 99 99 118 118 .. .. .. 1041929 100 100 100 100 100 .. .. 1001931 107 83 .. 78 .. .. .. .. 821933 151 143 133 94 88 130 102 .. 771935 111 123 121 111 108 98 106 .. 801937 120 125 122 104 102 100 100 ..1939 149 139 133 93 89 108 87 ..
* Excludes nonfactory personnel, 1935—39. The following indexes (1929:100) coverall personnel: 1935 1937 1939
Employment 121 128 138Employment per unit 109 107 92
a Crop years; see Appendix B-i, FOODS, footnote 1.b Derived from a series on "manhours per 100-pound bag of sugar produced,"
R.• K. Adamson and M. E. West, Productivity and Employment in Selected Industries:Beet Sugar (National Research Project in cooperation with National Bureau of EconomicResearch, Philadelphia, 1938), p.79. The data are based on a field study of 31 factories.
CONFECTIONERY
Employment per Man- ManhoursEmployment Unit hours per Unit
Wage Wage Wage Earners
Tear Output Earners Total* Earners Total* (ESTIMATE A)
1925 91 100 102 110 112 ..1927 94 99 101 106 107 ..1929 100 100 100 100 100 ..1931 80 81 .. 101 .. ..1933 79 80 78 101 99 89 125
1935 100 82 80 82 79 91 100
1937 111 85 81 76 73 100 100
1939 113 78 75 69 66 90 88
* Excludes nonfactory personnel, 1935—39. The following indexes (1929:100) coverall personnel: 1935 1937 1939
Employment 86 87 84Employment per unit 86 78 74
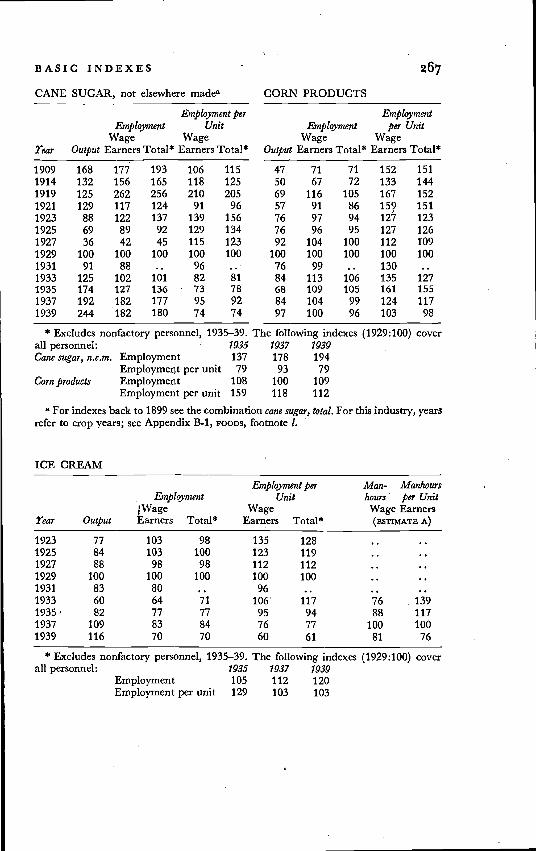
BASIC INDEXES - 267
Employment perEmployment Unit
Wage WageTear Output Earners Total* Earners Total*
1909 168 177 193 106 1151914 132 156 165 118 1251919 125 262 256 210 2051921 129 117 124 91 961923 88 122 137 139 1561925 69 89 92 129 1341927 36 42 45 115 1231929 100 100 100 100 100
1931 91 88 .. 96
1933 125 102 101 82 81
1935 174 127 136 73 78
1937 192 182 177 95 92
1939 244 182 180 74 74
* Excludes nonfactory personnel, 1935—39. The following indexes1935 1937 1939
Cane sugar, n.e.m. Employment 137 178 194
Employment per unit 79 93 79Corn products Employment 108
Employment per unit 159 118
a For indexes back to 1899 see the combination cane sugar,refer to crop years; see Appendix B-I, FOODS, footnote 1.
CANE SUGAR, not elsewhere madea CORN PRODUCTS
Employment
Output
EmploymentWage
Earners Total*
per UnitWage
Earners Total*
47 71 71 152 15150 67 72 133 14469 116 105 167 15257 91 86 159 15176 97 94 12376 96 95 127 12692 104 100 112 109
100 100 100 100 100
76 99 .. 130
84 113 106 135 12768 109 105 161 155
84 104 99 124 117
97 100 96 103 98
all personnel:(1929:100) cover
100
ICE CREAM
109112
total. For this industry, years
Employment per Man- ManhoursEmployment Unit hours per Unit
jWage Wage Wage EarnersTear Output Earners Total* Earners Total* (ESTIMATE A)
1923 77 103 98 135 128 ..1925 84 103 100 123 119 ..1927 88 98 98 112 112 ..1929 100 100 100 100 100 ..1931 83 80 .. 96 .. ..1933 60 64 71 106 117 76 139
1935' 82 77 77 95 94 88 1171937 109 83 84 76 77 100 1001939 116 70 70 60 61 81 76
* Excludes nonfactory personnel, 1935—39. The following indexesall personnel: 1935 1937 1939
Employment 105 112 120Employment per unit 129 103 103
(1929:100) cover

268 APPENDIX F
BUTTER, CHEESEMILKb
* Excludes nonfactory personnel, 1937—39. The following indexes (1929: 100) coverall personnel:Cane sugar, total
Butter, cheese and canned milk
Employment 115Employment per unit 119
Employment 133Employment per unit 117
120129
a Combination of two industries, cane sugar, n.e.m. and cane-sugar refining. Data for1899 are not available for these separately.
b Combination of three industries. Data for 1899 are not available for these separately.
BUTTERa
Tear Output
EmploymentWage
Earners Total*
Employment perUnit
WageEarners Total*
Man- Manhourshours per UnitWage Earners(ESTIMATE A)
1904 33 50 56 153 172 ..1909 40 60 68 152 170 ..1914 50 74 75 147 150 ..1919 60 92 92 154 153 ..1921 72 97 94 135 132 ..1923 84 106 104 126 124 ..1925 92 93 92 102 101 ..1927 97 105 104 108 107 ..1929 100 100 100 100 100 ..1931 102 82 .. 80 .. ..1933 110 86 81 79 74 ..1935
1937
104
105
97
102
93
98
92 89
97 94
..100 100
1939 115 94 94 82 82 90 82
* Excludes nonfactory personnel, 1935—39. The following indexes1935 1937 1939
Employment 119
Employmentperunit 114 121 98a For indexes back to 1899 see the combination butter, cheese and canned milk.
CANE SUGAR, TOTALSand CANNED
Employment per
Tear Output
EmploymentWage
Earners Total*
UnitWage
Earners Total*
1899 52 87 .. 168
1909 67 83 84 124 125
1919 84 150 150 179 179
1929 100 100 100 100 100
1937 96 112 112 117 116
1939 93 113 113 121 121
EmploymentEmployment per Unit
Wage WageOutput Earners Total* Earners
20 43 .. 213
33 62 70 190 213
70 119 110 171 158
100 100 100 100 100
114 111 107 98 94126 110 108 87 86
1937 1939
12498
all personnel:127
(1929:100) cover
113

BASIC INDEXES
CEREALS
The1935 1937
107 138107
122 146114
269
1
CHEESEa MILK,
Employment per
Tear Output
EmploymentWage
Earners Total*
UnitWage
Earners Total*
1904 56 77 92 138 1641909 55 79 108 143 1951914 66 85 85 128 1291919 86 116 105 135 1221921 77 103 95 133 1231923 101 126 115 125 1141925 100 100. 96 100 961927 97 103 97 107 1001929 100 100 100 100 1001931 92 87 .. 951933b 95 92 76 98 801935 126 128 92 101 731937 129 132 118 102 921939 147 147 140 . 100 95
Employment
Output
EmploymentWage
Earners Total*
per UnitWage
Earners Total*
11 48 37 438 33518 59 49 329 27336 85 75 237 21084 194 163 .230 19369 134 121 194 17673 117 112 161 15476 101 98 132 12988 105 103 120 117
100 100 100 100 100100 87 .. 87
98 90 87 91 89115 120 116 104 101128 127 127 99 99144 137 134 95 92
all personnel:Cheese
* Excludes nonfactory personnel, 1935—39.
EmploymentEmployment per unit 84
Milk, canned EmploymentEmployment per unit 106
following indexes (1929:100) cover1939147100146101
a For indexes back to 1899 see the combination butter, cheese and canned milk.b The 1933 Census of the cheese industry is considered by the Bureau of the Census
to be somewhat incomplete.
Employment per Man- Manhours. Employment Unit hours per Unit
Wage Wage . Wage EarnersTear Output Earners Total* Earners Total* (ESTIMATE A)
1925 70 95 91 136 130 ..1927 80 93 88 116 110 ..1929 100 100 100 100 100 ..131 100 108 .. 108 ..1933 79 110 101 139 128 83 811935 70 122 113 175 162. 88 981937 77 125 114 162 148 100 1001939 74 120 109 163 147 91 95
* Excludes nortfactory personnel, 193 5—39. The following indexesall personnel: 1935 1937 1939
Employment 118 115 115Employment per unit 170 149 156
(1929:100) cover

270 APPENDIX F
FRUITS and VEGETABLES, CANNEDB
Employment per
rear Output
EmploymentWage
Earners Totalt
UnitWage
Earners Totalt
1899 17 44 .. 2621904b 24 48 49 205 2061909 29 50 52 174 1841914 42 63 65 150 156
1919 55 77 81 141 148
1921 38 52 55 139 146
1923 67 73 75 110 112
1925 82 87 87 105 105
1927 82 82 83 100 101
1929 100 100 100 100 100
1931 91 81 .. 89
1933 88 85 84 97 96
1935 127 118 116 92 91
1937 151 139 135 92 90
1939 159 118 116 74 73
ICE
Employment 0
Output
Employment"Wage
Earners Totalt
perWage
Earners
Unit
Totalt
9.8 21 .. 217 ..17 31 32 187 19330 49 51 167 17244 71 72 162 16660 93 94 155 15767 75 78 111 11577 83 86 108 11288 77 80 88 9188 69 74 78 84
100 100 100 100 10096 78 .. 82 ..74 66 72 89 9872 59 68 82 9475 58 64 77 8575 49 56 66 74
* Excludes nonfactory personnel, 1935—39. The following indexes (1929:100) cover
Employment per unit 94 92 7690 76 95
Employment per unit 124 100 127a For indexes of manhours and manhours per unit see the combination fiih,fruits and
vegetables, canned.b Packing and shipping houses that handled dried fruits completely processed on
fruit farms• were included in canned fruits and vegetables in 1904 only.o Incomparabilities mar the series for ice because of the erroneous inclusion, in varying
degree, of some wage earners employed in delivery service.
FEEDS
The following indexes1935. 1937 1939127 143 172
all personnel:Fruits and vegetables, canned Employment
Ice
7935 1937119 139
Employment
1939
121
Tear Output
EmploymentWage
Earners Total"
Employment perUnit
WageEarners Totalt
Man- Manhourshours per Unit
Wage Earners(ESTIMATE A)
1927 74 75 78 100 106 ..1929 100 100 100 100 100 ..1931 76 83 .. 109 .. ..1933 70 86 83 123 119 57 911935 90 114 108 126 120 73 901937 111 141 135 127 122 100 1001939 130 151 135 116 104 102 88
all personnel:* Excludes nonfactory personnel, 1935—39.
EmploymentEmployment per unit 141 128 133
(1929:100) cover
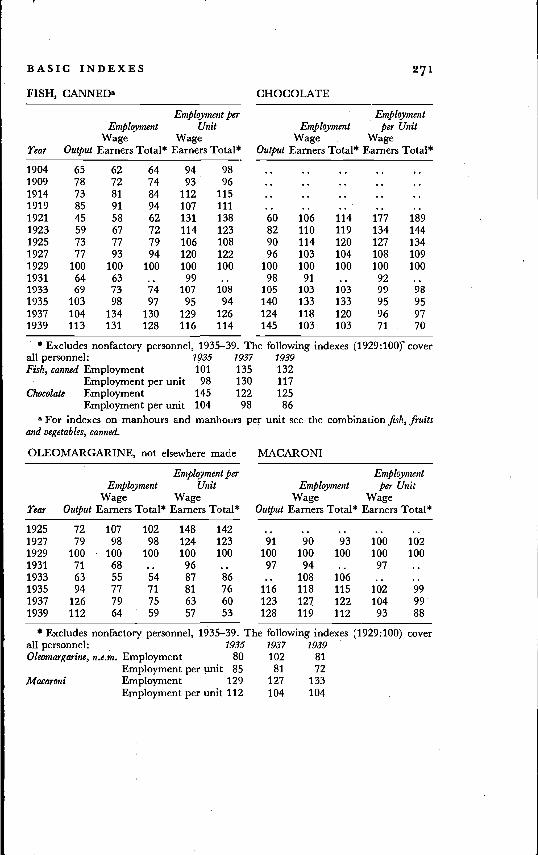
BASIC INDEXES 271
FISH, CANNEDa CHOCOLATE
Tear Output
0
EmploymentWage
Earners Total*
Employment perUnit
WageEarners Total*
1904 65 62 64 94 981909 78 72 74 93 961914 73 81 84 112 1151919 85 91 94 107 1111921 45 58 62 131 1381923 59 67 72 114 1231925 73 77 79 106 1081927 77 93 94 120 1221929 100 100 100 100 1001931 64 63 991933 69 73 74 107 1081935 103 98 97 95 941937 104 134 130 129 1261939 113 131 128 116 114
Output
EmploymentWage
Earners Total*
Employmentper Unit
WageEarners Total*
60 106 114 177 18982 110 119 134 14490 114 120 127 13496 103 104 108 109
100 100 100 100 10098 91 -. 92 ..
105 103 103 99 98140 133 133 95 95124 118 120 96 97145 103 103 71 70
* Excludes nonfactory personnel, 1935—39. The following indexes (1929 coverall personnel: 1935 1937 1939
Fish, canned Employment 101Employment per unit 98
Chocolate Employment 145Employment per unit 104
135 132130 117122 12598 86
a For indexes on manhours and manhours per unit see the combination fish, fruitsand vegetables, canned.
1935 1937
80 102Employment per unit 85Employment 129
81127
OLEOMARGARINE, not elsewhere made MACARONI
Employment per
Tear
EmploymentWage
Output Earners Total*
UnitWage
Earners Total*
1925 72 107 102 148 1421927 79 98 98 124 1231929 100 100 100 100 1001931 71 68 .. 961933 63 55 54 87 861935 94 77 71 81 761937 126 79 75 63 601939 112 64 59 57 53
Output
EmploymentWage
Earners Total*
Employmentper Unit
WageEarners Total*
91 90 93 100 102100 100 100 100 100
97 94 .. 97.
116108118
106115
..102 99
123 127 122 104 99128 119 112 93 88
all personnel:Oleomargarine, n.e.m. Employment
Macaroni
* Excludes nonfactory personnel, 1935—39. The following indexes (1929:100) cover1939
81
72133
Employment per unit 112 104 104

272 APPENDIX F
FLOUR
Employment per Man- Manhours Man- ManhoursEmployment Uzit hours per Unit hours per Unit's
Wage Wage Wage Earners Wage EarnersTear Output Earners Total* Earners Total* (ESTIMATE A) (ESTIMATE B)
1869 41 76 .. 185 .. .. ..1879 60 76 .. 125 .. .. .. ..1889 70 82 .. 117 .. .. .. ..1899 94 119 .. 127 .. .. .. ..1904 98 144 143 148 147 .. .. ..1909 102 145 158 142 155 190 159 .. 1441914 108 146 157 136 146 .. .. .. 1561919 114 168 182 148 160 .. .. .. 1291921 94 131 137 139 146 .. .. .. 1161923 106 130 134 123 126 .. .. .. 1101925 102 118 119 116 117 .. .. 1051927 100 111 112 111 112 .. .. 1051929 100 100 100 100 100 .. .. .. 1001931 91 84 .. 93 .. .. .. 911933 80 86 80 107 100 87 93. .. 891935 82 98 91 119 110 90 94 .. 931937 86 98 89 114 104 100 100 ..1939 92 92 82 99 89 90 83 ..
* Excludes nonfactory personnel, 1935—39. The following indexes (1929:100) coverall personnel: 1935 1937 1939
Employment 101 92 97Employment per unit 123 108 105
a Derived from indexes in an unpublished report on "Productivity and Employmentin Selected Industries: Wheat Flour" (National Research Project, in cooperation withthe National Bureau of Economic Research, Philadelphia, 1938). The series is a chainof link ratios of comparable aggregates based on a sample of 5 to 34 mills (1909—29),and the usual ratio for a constant sample of 41 mills (1929—35).
FISH, FRUITS and VEGETABLES, CANNEDa
Employment per Man- ManiwursEmployment Unit hours per Unit
Wage Wage Wage EarnersTear Output Earners Total Earners Total (ESTIMATE A)
1909 22 38 .. 170 .. 56 2491935 86 83 .. 97 .. 79 921937 100 100 .. 100 .. 100 1001939 106 87 .. 82. .. 84 80
a Combination of fish, canned, and fruits and vegetables, canned. Data on hours are notavailable for these separately.

BASIC INDEXES.. 273
MEAT PACKING
Employment per Man- Manhours Man- ManhoursEmployment Unit hours per Unit hours per Unit
Wage Wage Wage Earners Wage Earnersrear Output Earners Total* Earners Total* (ESTIMATE A) (ESTIMATE B)
1879 26 18 .. 70 .. ..1889 47 32 68 ..1899 56 56 .. 100 .. .. . a
1904 64 61 57 96 90 .. .. ..1909 72 72 70 100 96 73 101
1914 71 81 79 114 112 .. .. 89 125
1919 93 131 129 141 138 ..
1921 77 96 98 123 127 .. .. 88 114
1923 97 108 109 112 112 105 109 106 110
1925 92 98 99 106 108 98 106 96 104
1927 95 97 98 102 103 98 103 96 101
1929 100 100 100 100 100 100 100 100 100
1931 94 87. 92 .. 85 .90 84 89
1933 95 92 92 97 96 75 78 82 86
1935 85 95 95 112 112 71 83 76 90
1937 94 104 104 111 111 78 84 82 87
1939 104 98 95 95 91 73 70 78 75
* Excludes nonfactory personnel, 1935—39. The following indexes (1929:100) coverall personnel: 1935 1937 1939
Employment 103 110 116Employment per unit 121 117 112
SAUSAGE, not elsewhere made
Employment Employment per UnitTear Output Wage Earners Total* Wage Earners Total*
1929 100 100 100 100 1001931 108 106 .. 981933 .. 132 1281935 154 155 146 101 95
1937 182 173 161 95 88
1939 203 170 158 84 78
* Excludes nonfactory personnel, 1935—39. The following indexes (1929:100) coverall personnel: 1935 1937 1939
Employment 172 171 200Employment per unit 112 94 99
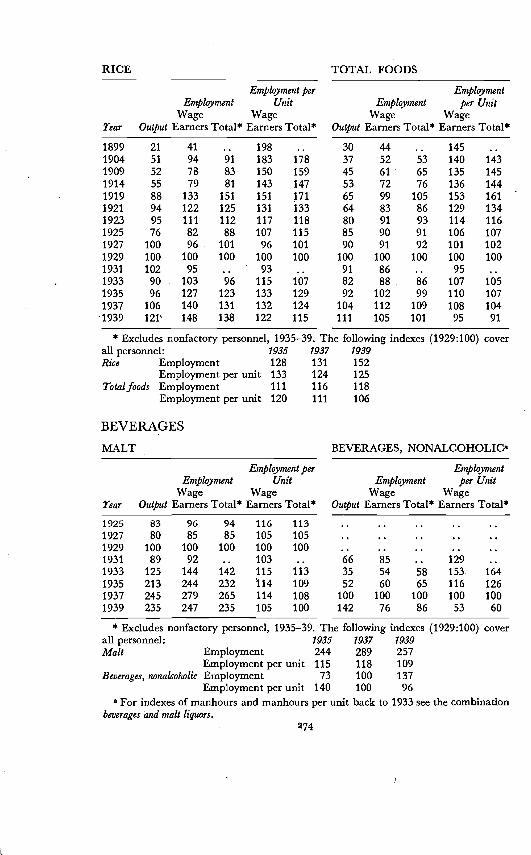
RICE TOTAL FOODS
all personnel:Rice Employment
MALT
1935 1937 1939
128 131 152133 124 125
Employment per
Tear Output
EmploymentWage
Earners Totalt
UnitWage
Earners Totalt
1925 83 96 94 116 1131927 80 85 85 105 1051929 100 100 100 100 1001931 89 92 .. 1031933 125 144 142 115 1131935 213 244 232 114 1091937 245 279 265 114 1081939 235 247 235 105 100
111 106
BEVERAGES, NONALCOHOLICa
Employment
Output
EmploymentWage
Earners Totalt
perWage
Earners
Unit
Totalt
66 85 .. 129 ..35 54 58 153. 16452 60 65 116 126
100 100 100 100 100142 76 86 53 60
* Excludes nonfactory personnel, 1935—39. The following indexes (1929:100) cover
a For indexes of manhours and manhours per unit back to 1933 see the combinationbeverages and malt liquors.
Tear Output
EmploymentWage
Earners Totalt
Employment perUnit
WageEarners Total*
1899 21 41 .. 1981904 51 94 91 183 17819091914
5255
78 8379 81
150 159143 147
19191921
8894
133 151122 125
151 171131 133
1923 95 111 112 117 1181925 76 82 88 107 1151927 100 96 . 101 96 1011929 100 100 100 100 1001931 102 95 .. 931933 90 . 103 96 115 1071935 96 127 123 133 1291937 106 140 131 132 1241939 1.48 138 122 115
Employment
Output
EmploymentWage
Earners Totalt
perWage
Earners
Unit
Totalt
30 44 .. 145 ..37 52 53 140 14345 61 65 135 14553 72 76 136 14465 99 105 153 16164 83 86 129 13480 91 93 114 11685 90 91 106 10790 91 92 101 102
100 100 100 100 10091 86 .. 95 ..82 88 86 107 10592 102 99 110 107
104 112 109 108 104111 105 101 95 91
* Excludes nonfactory personnel, 1935—39. The following indexes (1929:100) cover
Employment per unitTotal foods Employment 111 116 118
Employment per unit 120
BEVERAGES
all personnel:Malt
1935 1937 1939Employment 244 289 257Employment per unit 115 118
Beverages, nonalcoholic Employment 73 100Employment per unit 140 100
10913796
274

LIQUORS, MALTS
Employment per Man- ManhoursEmployment Unit hours per Unit
Wage Wage Wage Earnersrear OutputF Earners Total* Earners Total* (ESTIMATE A)
1899 62 84 .. 134 .. ..1904 82 102 101 125 123
1909 96 116 116 121 121
1914 112 132 131 117 117
1919 47 73 74 155 158
1921 16 .. 40 .. 256 ..
1923 9.0 .. .. .. •.1925 8.7 .. •.1927 7 . 4 . . . . . . . .
1929 6.6 . . . . . . . . .
1931 5.3 .. .. ..1933 19 50 53 266 2821935 77 83 83 108 108
1937 100 100 100 100 100 100 1001939 95 77 73 80 76 78 82
* Excludes nonfactory personnel, 1935—39. The following indexes (1937:100) cover
all personnel; S 1935 1937 1939Employment 91 100 104
Employment per unit 118 lOG 109a For indexes of manhours and manhours per unit back to 1933 see the combination
beverages and malt liquors.b The output series for 1899—1937 are based on data compiled by the Bureau of In-
ternal Revenue and cover fiscal years ending June 30.
LIQUORS, DISTILLED
Employment per Man- ManhoursEmployment Unit hours per Unit
Wage Wage Wage Earnersrear Outputs Earners Total* Earners Total* (ESTIMATE A)
1899 2,574 251 .. 9.71904 2,892 361 390 12 13
1909 3,356 433 449 13 13 94 3011914 4,257 424 449 10 11
1919 108 93 94 86 87
1921 117 77 77 66 66
1923 92 72 81 78 89
1925 55 94 94 171 171.
1927 48 80 80 167 168
1929 100 100 100 100 100
1931' 94 67 .. 71 -.
1933b 322 169 173 53 54
1935 6,986 831 769 12 11
1937 10,696 634 600 5.9 5.6 100 100
1939 6,803 417 409 6.1 6.0 64 101
* Excludes nonfactory personnel, 1935—39. The following indexes (1929:100) coverall personnel: 1935 1937 1939
Employment 796 761 460Employment per unit 11 7. 1 6.8
a The output series for 1899—1937 are based on data compiled by the Bureau ofInternal Revenue and cover fiscal years ending June 30.
b The 1933 Census of this industry is considered by the Bureau of the Census to besomewhat incomplete.
275
276 APPENDIX F
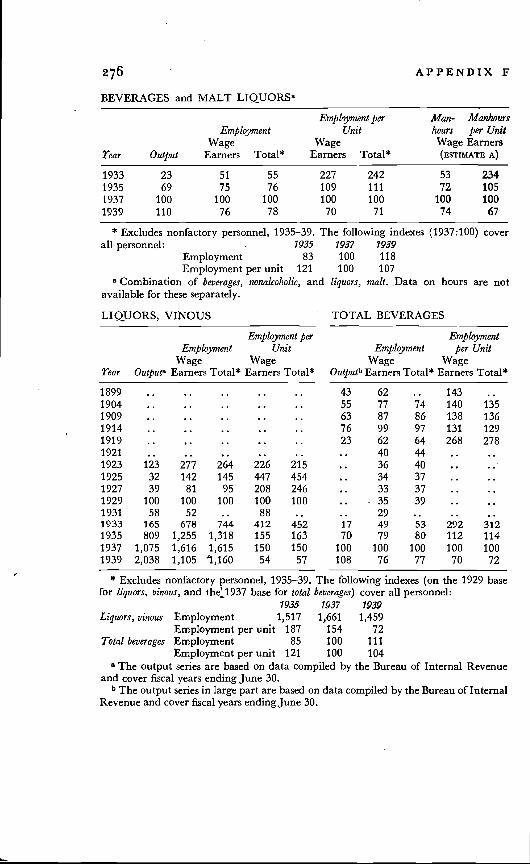
BEVERAGES and MALT LIQUORSa
Employment per Man- ManhoursEmployment Unit hours per Unit
Wage Wage Wage Earnersrear Output Earners Total* Earners Total* (ESTIMATE A)
1933 23 51 55 227 242 53 2341935 69 75 76 109 111 72 1051937 100 100 100 100 100 100 1001939 110 76 78 70 71 74 67
* Excludes nonfactory personnel, 1935—39. The following indexes (1937:100) coverall personnel: 1935 1937 1939
Employment 83 100Employment per unit 121 100
a Combination of beverages, nonalcoholic, and liquors, malt. Data on hoursavailable for these separately.
LIQUORS, VINOUS
Employment per
Tear Outpuga
EmploymentWage
Earners Total*
UnitWage
Earners Total*
1899 .. .. .. ..1904 .. .. .. ..1909 .. .. .. ..1914 .. .. .. ..1919 . . . . . . .
1921 .. .. .. ..1923 123 277 264 226 2151925 32 142 145 447 4541927 39 81 95 208 2461929 100 100 100 100 1001931 58 52 .. 881933 165 678 744 412 4521935 809 1,255 1,318 155 1631937 1,075 1,616 1,615 150 1501939 2,038 1,105 '1,160 54 57
* Excludes norfactory personnel, 1935—39.for liquors, vinous, and base for total
TOTAL BEVERAGES
EmploymentEmployment
WageOutputb Earners Total*
per UnitWage
Earners Total*
43 62 .. 14355 77 74 140 13563 87 86 138 13676 99 97 131 12923 62 64 268 278
40 44 .... 36 40 ..
34 37 ..33 37 ..35 39 ..29 .. ..
17 49 53 292 31270 79 80 112 114
100 100 100 100 100108 76 77 70 72
The following indexes (on the 1929 basebeverages) cover all personnel:
1935 1937 1939
Employment per unit 187 154Total beverages Employment
Employment per unit 121a The output series are based on data compiled by the Bureau of Internal Revenue
and cover fiscal years ending June 30.b The output series in large part are based on data compiled by the Bureau of Internal
Revenue and cover fiscal years ending June 30.
118107
are not
Liquors, vinous Employment 1,517 1,661 1,459
85 10072
111104100
TOBACCO PRODUCTS
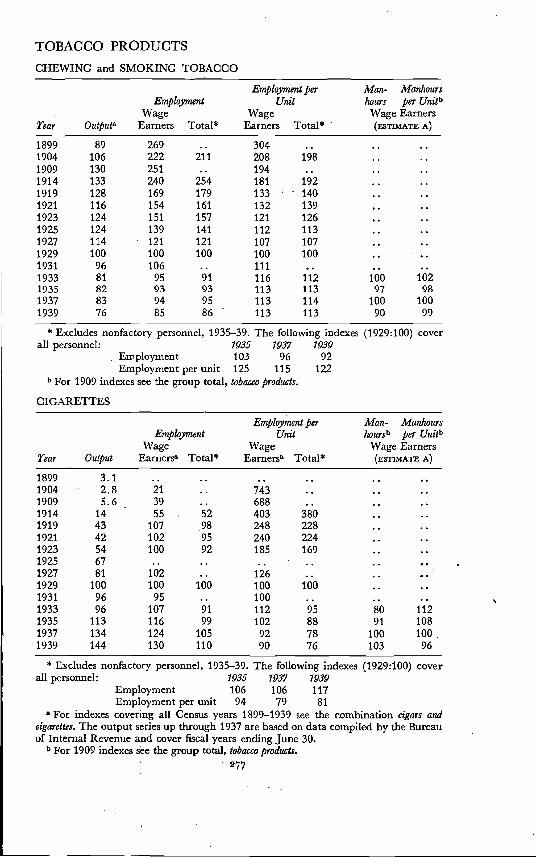
CHEWING and SMOKING TOBACCO
Employment perEmployment Unit
Wage WageTear Outputa Earners Total* Earners Total*
Man-. Manhourshours per UnitbWage Earners(ESTIMATE A)
1899 89 269 .. 304 .. ..1904 106 222 211 208 1981909 130 251 .. 194 ..
..
..1914 133 240 254 181 192 ..1919 128 169 179 133 140 ..1921 116 154 161 132 139 ..1923 124 151 157 121 126 ..1925 124 139 141 112 113 ..1927 114 121 121 107 107 ..1929 100 100 100 100 100 ..1931 96 106 .. 111 .. ..1933 81 95 91 116 112 100 1021935 82 93 93 113 113 97 98
1937 83 94 95 113 114 100 100
1939 76 85 86 113 113 90 99
* Excludes nonfactory personnel, 1935—39. The following indexes
all personnel: 1935 1937 1939Employment 103 96 92Employment per unit 125 115 122
b For 1909 indexes see the group total, tobacco products.
(1929:100) cover
CIGARETTES
Employment perEmployment Unit
Wage WageTear Output Earnersa Total* Earnersa Total*
Man- Manhourshoursb per Unitb
Wage Earners(ESTIMATE A)
1899 3.1 .. .. .. .. ..1904 2.8 21 .. 743 .. •.1909 5.6 39 .. 688 ..
1914 14 55 52 403 380....
1919 43 107 .98 248 228 ..1921 42 102 95 240 224 ..1923 54 100 92 185 169 ..1925 67 .. .. .. .. ..1927 81 102 .. 126 .. ..1929 100 100 100 100 100 ..1931 96 95 .. 100 .. ..1933 96 107 91 112 95 80 112
1935 113 116 99 102 88
1937 134 124 105 92 78
91 108
100 100
1939 144 130 110 90 76 103 96
* Excludes nonfactory personnel, 1935—39. The following indexes (1929:100) coverall personnel: 1935 1937 1939
Employment 106 106 117
Employment per unit 94 79 81a For indexes covering all Census years 1899—1939 see the combination cigars and
cigarettes. The output series up through 1937 are based on data compiled by the Bureauof Internal Revenue and cover fiscal years ending June 30.
b For 1909 indexes see the group total, tobacco products.277

Tear
.
EmploymentWage
Output Earners Total*
Employment perUnit
WageEarners Total*
Man- Manhourshoursb per Unite'Wage Earners
(ESTIMATE A)
1869 15 24 .. 155 .. ..1879 32 49 .. 154 .. ..1889 58 90 .. 156, .. ..1899 80 117° .. 147 .. ..1904 106 153 .. 144 .. ..1909 111 154 .. 138 .. ..1914 119 165 169 138 142 ..1919 112 136 138 121 123 ..1921 107 133 135 124 126 ..1923 108 129 132 120 123 ..1925 100 .. .. .. ..1927 100 112 .. 112 .. ..1929 100 100 100 100 100 100 1001931 82 81 .. 99 ..1933 66 80 77 121 118 58 881935 70 67 66 95 94 45 641937 80 66 66 83 83 48 601939 78 60 60 78 77 41 53
CIGARS and CIGARETTESa .
Tear
EmploymentWage
Output Earners Total*
Employment perUnit
WageEarners Total*
Man- Manhourshoursb per Unitb
Wage Earners(ESTIMATE A)
1899 22 97 .. 438 .. ..19041909
28 127 12932 131 ..
447 456408 ..
..
..1914 41 143 143 345 345 ..1919 61 130 129 • 212 211 ..1921 59 127 126 214 212 ..1923 68 123 123 183 182 ..1925 75 111 110 148 147 ..1927 86 110 111 128 129 ..19291931
100 100 10092 84 ..
100 10091 ..
..
..1933 89 85 80 96 91 108 1491935 104 76 73 74 71 93 1101937 122 78 75 64 61 100 1001939 128 74 71 58 56 92 88
* Excludes nonfactory personnel, 1935—39. The following indexes (1929:100) coverall personnel; 1935 1937 1939Cigars Employment 67 67 61
Employment per unit 96 84 78Cigars and cigarettes Employment 76 75 74
Employment per unit 73 62 58a Cigars and cigarettes is a combination of two industries; separate data for these are
not available for all years. The output series up through 1937 are based on Bureau ofInternal Revenue data and cover fiscal years ending June 30.
b For 1909 indexes see the group total, tobacco products.o The 1899 figure for cigar employment is based on the corresponding figure for
cigars and cigarettes combined. Cigarettes were of very slight importance in that year.278
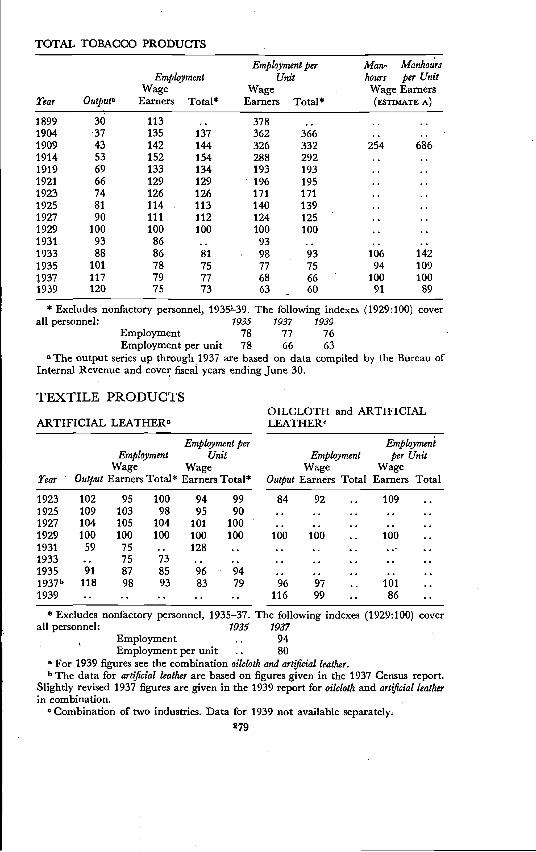
TOTAL TOBACCO PRODUCTS
Tear Outputa
.
EmploymentWage
Earners Total*
Employment perUnit
WageEarners Total*
Man- Manhourshours per UnitWage Earners(ESTIMATE A)
1899 30 113 .. 378 .. ..1904 37 135 137 362 366 ..1909 43 142 144 326 332 254 686
1914 53 152 154 288 292 ..1919 69 133 134 193 193 ..1921 66 129 129 196 195 ..1923 74 126 126 171 171 ..1925 81 114 113 140 139 ..1927
1929
90
100
111
100
112
100
124 125
100 100
..
..1931 93 86 .. 93 ..1933
1935
88
. 10186
78
81
75
• 98 93
77 75
106 142
94 109
1937
1939
117
12079
7577
73
68 66
63 60
• 100 100
91 89
* Excludes nonfactory personnel, The following indexes (1929:100) cover
EmploymentEmployment per unit
1935 1937 1939
78 77 76
78 66 63
all personnel:
a The output series up through 1937 are based on data compiled by the Bureau ofInternal Revenue and cover fiscal years ending June 30
Tear Output
EmploymentWage
Earners Total*
Employment perUnit.
WageEarners Total*
1923 102 95 100 94 99
1925 109 103 98 95 901927 104 105 104 101 1001929 100 100 100 100 1001931 59 75 .. 1281933 .. 75 73 ..1935 91 87 85 96 941937b 118 98 93 83 791939 . . . . . . .
Employment.
Output
EmploymentWage
Earners Total
perWage
Earners
Unit
Total
84 92 .. 109 ..
:: ::
96 97 :: 101 ::116 99 .. 86 ..
* Excludes nonfactory personnel, 1935—37. The following indexes (1929:100) coverall personnel: 1935 1937
Employment 94Employment per unit 80
a For 1939 figures see the combination oilcloth and art jfIcial leather.b The data for art jficial leather are based on figures given in the 1937 Census report.
Slightly revised 1937 figures are given in the 1939 report for oilcloth and artificial leatherin combination.
° Combination of two industries. Data for 1939 not available279
TEXTILE PRODUCTSOILCLOTH and ARTIFICIAL
ARTIFICIAL LEATHERa LEATHERO
280 APPENDIX F
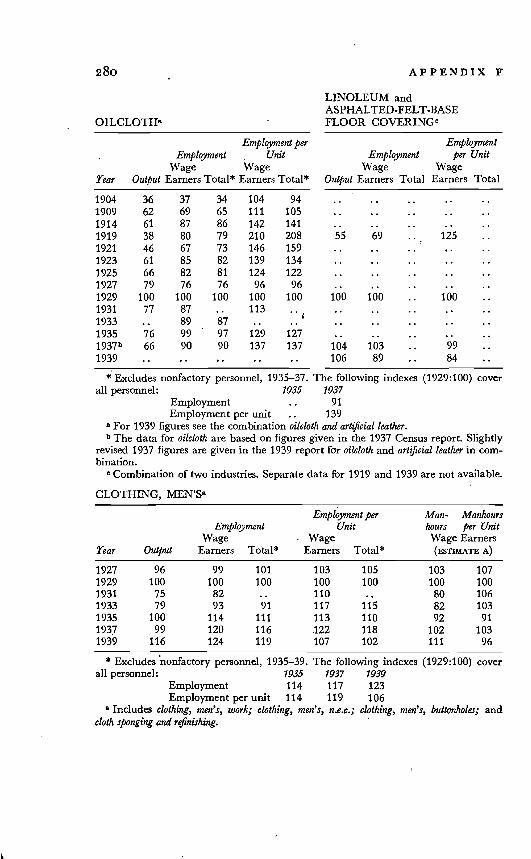
OILCLOTHa
Employment per, Employment
WageUnit
WageTear Output Earners Total* Earners Total*
1904 36 37 34 104 941909 62 69 65 111 105
1914 61 87 86 142 141
1919 38 80 79 210 208
1921 46 67 73 146 159
1923 61 85 82 139 134
1925 66 82 81 124 122
1927 79 76 76 96 96
1929 100 100 100 100 100
1931
1933
77
..
87 ..
89 87
113
..
1935 76 99 97 129 127
1937b 66 90 90 137 137
1939 .. .. .. ..
LINOLEUM andASPHALTED-FELT-BASEFLOOR
Employment
Output
EmploymentWage
Earners Total
perWage
Earners
Unit
Total
55 69 .. 125 ..
:: ::
104 103 ::106 89 .. 84 ..
* Excludes nonfactory personnel, 1935—37. The following indexes (1929:100) coverall personnel: 1935 1937
bination.
Employment 91Employment per unit .. 139
Combination of two industries. Separate data for 1919 and 1939 are not available.
CLOTHING, MEN'Sa
Employment per Man- ManhoursEmployment Unit hours per Unit
Wage • Wage Wage Earners
Tear Output Earners Total* Earners Total* (ESTIMATE A)
1927 96 99 101 103 105 103 107
1929 100 100 100 100 100 100 1001931 75 82 .. 110 .. 80 106
1933 79 93 91 117 115 82 103
1935 100 114 111 113 110 92 91
1937 99 120 116 .122 118 102 103
1939 116 124 119 107 102 111 96
The following indexes1935 1937 1939
Includes clothing, men's, work; clothing, men's, n.e.c.; clothing, men's, buttonholes; andcloth sponging and refinishing.
a For 1939 figures seeb The data for oilcloth
revised 1937 figures are
the combination oilcloth and artificial leather.are based on figures given in the 1937 Census report. Slightlygiven in the 1939 report for oilcloth and leather in corn-
* Excludes nonfactory personnel, 1935—39.all personnel:
Employment 114 117Employment per unit 114 119
(1929:100) cover
123
106
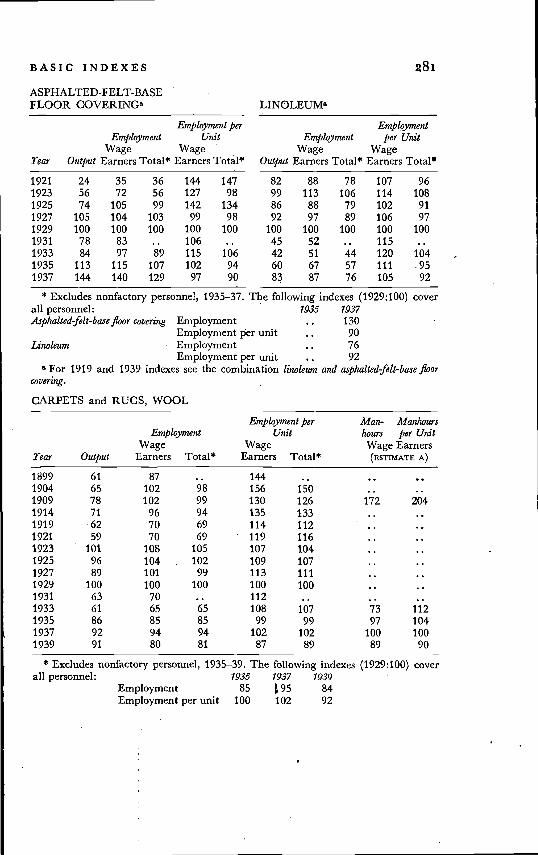
BASIC 281
Employment per
Tear
.
Output
EmploymentWage
Earners Total*
UnitWage
Earners Total*
1921 24 35 36 144 1471923 56 72 56 127 981925 74 105 99 142 1341927 105 104 103 99 981929 100 100 100 100 1001931 78 83 .. 1061933 84 97 89 115 1061935 113 115 107 102 941937 144 140 129 97 90
Employment per unita For 1919 and 1939 indexes see the combination linoleum
coverzng.
Tear OutputWage
Earners Total*
Employment perUnit
WageEarners Total*
Man- Manhourshours per UnitWage Earners(ESTIMATE A)
1899 61 87 .. 144 .. ..1904 65 102 98 156 150 ..1909 78 102 99 130 126 172 2041914 71 96 94 135 133 ..1919 62 70 69 114 112 ..19211923 •
59101
70lOB
69105
• 119 116107 104
..
..1925 96 104 102 109 107 ..1927 89 101 99 113 111 ..1929 100 100 100 100 100 ..1931 63 70 .. 112 .. ..1933 61 65 65 108 107 73 1121935 86 85 85 99 99 97 1041937 92 94 94 102 102 100 1001939 91 80 81 87 89 89 90
ASPHALTED-FELT-BASEFLOOR COVERINGR
Employment
Output
EmploymentWage
Earners Total*
per UnitWage
Earners Total*
82 88 78 107 9699 113 106 114 10886 88 79 102 9192 97 89 106 97
100 100 100 100 10045 52 .. 11542 51 44 120 10460 67 57 111 -9583 87 76 105 92
all personnel:Asphalted-felt-base floor covering Employment
Linoleum
* Excludes nonfactory personnel, 1935—37. The following indexes (1929:100) cover
Employment per unitEmployment
1935 1937
130
CARPETS and RUGS, WOOL
907692
and asphalted-felt-base floor
all personnel:* Excludes nonfactory personnel, 1935—39. The following indexes
1935 1937 193984
102 92Employment 85Employment per unit 100
(1929:100) cover
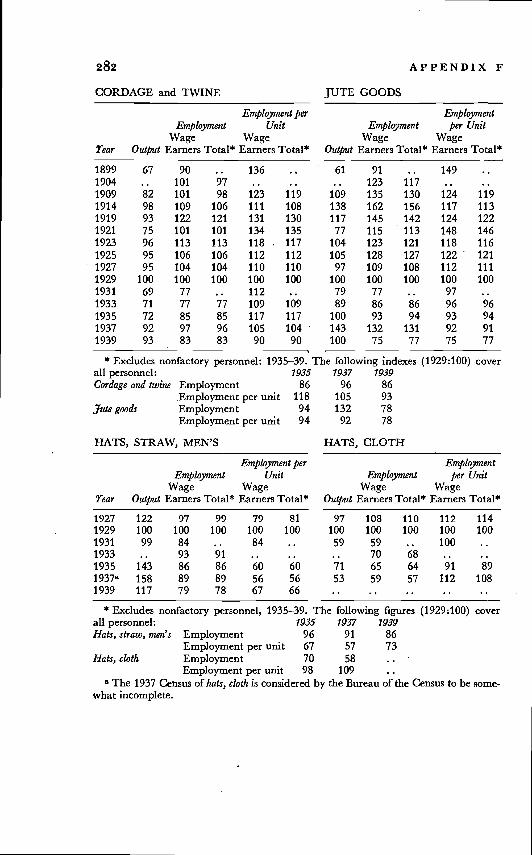
282 APPENDIX F
The following indexes1937 1939
96 86
* Excludes nonfactory personnel, 1935—39. The following figures (1929:100) coverall personnel: 1935 1937 1939Hats, straw, men's Employment 96 91 86
Employment per unit 67 57 73
Hats, cloth EmploymentEmployment per unit 98 109
a The 1937 Census of hats, cloth is considered by the Bureau of the Census to be some-what incomplete.
CORDAGE and TWINE JUTE GOODS
Employment per
Tear Output
EmploymentWage
Earners Total*
UnitWage
Earners Total*
1899 67 90 .. 1361904 .. 101 97 ..1909 82 101 98 123 1191914 98 109 106 111 1081919 93 122 121 131 1301921 75 101 101 134 1351923 96 113 113 118 1171925 95 106 106 112 1121927 95 104 104 110 1101929 100 100 100 100 1001931 69 77 1121933 71 77 77 109 1091935 72 85 85 117 1171937 92 97 96 105 1041939 93 83 83 90 90
Employment
Output
EmploymentWage
Earners Total*
per UnitWage
Earners Total*
61 91 .. 149.. 123 117 ..
109 135 130 124 119138 162 156 117 113117 145 142 124 122
77 115 113 148 146104 123 121 118 116105 128 127 122 121
97 109 108 112 111100 100 100 100 10079 77 97
89 86 86 96 96100 93 94 93 94143 132 131 92 91100 75 77 75 77
(1929:100) cover
105132
92
93
78
78
* Excludes nonfactory personnel: 1935—39.all personnel: 1935Cordage and twine Employment 86
Employment per unit 118'ute goods Employment 94
Employment per unit 94
HATS, STRAW, MEN'S
Employment perEmployment Unit
Wage WageTear Output Earners Total* Earners Total*
1927 122 97 99 79 811929 100 100 100 100 100
1931 99 84 .. 841933 .. 93 911935 143 86 86 60 601937a 158 89 89 56 56
1939 117 79 78 67 66
HATS, CLOTH
Employment
Output
EmploymentWage
Earners Total*
perWage
Earners
Unit
Total*
97 108 110 112 114
100 100 100 100 100
59 59 .. 100 .... 70 68 .. ..71 65 64 91 89
53 59 57 112 108
70 58

BASIC INDEXES 283
HATS, FUR-FELT
Tear Output
EmploymentWage
Earners Total*
Employment perUnit
WageEarners Total*
Man- Manhourshours per UnitWage Earners(ESTIMATE A)
18991904
79106
114133
...129
144 ..126 122
..
..1909 126 151 148 120 118 239 1901914 91 129 125 142 138 ..1919 94 112 111 118 118 ..1921 81 84 84 104 104 ..1923 93 101 102 108 109 ..1925 86 92 92 106 106 ..1927 104 96 96 92 92 ..19291931
10078
10085
100..
100 100110 ..
..
. -
1933 .. 76 74 .. .. ..1935 94 89 87 94 93 89 941937 100 96 93 96 93 100 1001939 108 .89 88 82 81 90 83
* Excludes nonfactory personnel, 1935—39. The following indexes (1929:100) cover
EmploymentEmployment per unit
1935 1937 1939
91 93 91
96 93 84
all personnel;
GLOVES, TEXTILE, not elsewhere made
Employment per
Tear Output
EmploymentWageEarners Total*
UnitWageEarners Total*
1927 104 111 109 107 1051929 100 100 100 100 1001931 67 77 .. 1151933 .. 93 91 ..1935a 61 87 85 142 1401937 97 137 132 141 136139 96 133 131 138 136
HANDKERCHIEFS
Employment
Output
EmploymentWage
Earners Total*
per UnitWage
Earners Total*
99 111 112 111 113100 100 100 100 10075 79 .. 105.. 78 78 ..78 81 81 104 10486 83 82 97 9690 80 79 89 88
* Excludes nonfactory personnel, 1935—39. The, following indexes (1929:100) coverall personnel:Gloves, textile, n.e.m.
Handkerchiefs
Employment
Employment
1935 1937 1939
87 133 134137 140
85 83 8496 '3.
a The 1935 figures for handkerchiefs are considered by the Bureau of the Census to beroughly but not exactly comparable with those for other years because some leadingmanufacturers reported unsatisfactorily the detailed breakdown of their 1935 output.
Employment per unit 143
Employment per unit 109

284 APPENDIX F
HATS, WOOL-FELT
Employment per.
Tear Output
EmploymentWage
Earners Total*
UnitWage
Earners Total*
1879 236 201 .. 851889 165 132 .. 801899 135 104 .. 771904 68 74 71 109 1061909 101 98 95 97 941914 64 61 61 95 961919 79 71 74 90 931921 50 70 71 142 1421923 72 96 99 133 1381925 73 91 93 126 127
1927 87 104 101 120 116
1929 100 100 100 100 100
1931 84 76 .. 91
1933 .. 80 77 ..1935 185 148 142 80 77
1937 256 199 194 78 76
1939 308 218 214 71 69
WOOL SHODDY
Employment
Output
EmployWage
Earners
ment
Total
per UnitWage
Earners Total -
52 99 .. 19155 103 .. 188
75 111 108 149 144
68 109 105 160 15582 121 116 147 140
98 145 143 148 14646 66 70 143 151
100 121 118 121 119
110 126 123 114 112
71 95 95 134 133100 100 100 100 100
59 61 .. 10387 87 84 100 97
* Excludes nonfactory personnel, 1935—39. The following indexes (1929:100) coverall personnel:
EmploymentEmployment per unit
1935 1937 1939142 195 216
77 76 70
CLOTHING, WOMEN'S, not elsewhere classified
. Employment per Man- ManhoursEmployment Unit hours per Unit
Wage Wage Wage Earnersrear Output Earners Total* Earners Total* (ESTIMATE A)
1927 84 82 84 98 100 ..1929 100 100 100 100 100 ..1931 103 93 .. 90 .. ..1933a 91 85 82 94 90 ..1935 109 118 111 108 102 91 1051937a 125 130 121 104 97 100 1001939 142 150 138 106 97 123 108
* Excludes nonfactory personnel, 1935—39. The following indexes (1929:100) coverall personnel:
a The 1933
EmploymentEmployment per
and 1937 Censuses
unit
of this
1935 1937117 122108 98
industry are
1939146103
reported by the Bureau of theCensus to be somewhat incomplete.

r -
BASIC INDEXES ' 285
COTTON GOODS
Employment per Man- ManhoursEmployment Unit hours per Unit
Wage Wage Wage Earnersrear Output Earners Total* Earners Total* (ESTIMATE A)
1869 12 29 .. 233 .. ..1879 22 38 .. 173 .. ..1889 32 48 147 ..1899 49 70 .. 143 .. ..1904 54 73 72 137 1351909 68 87 86 129 128 102 1521914 73 89 88 123 1211919 78 101 101 130 1301921 70 97 97 140 1391923 93 111 110 119 118 113 1211925 93 105 104 113 112 101 1091927 104 110 110 106 105 117 1121929 100 100 100 100 100 100 1001931 78 78 .. 100 .. 75 961933 87 89 89 102 102 79 901935a 78 87 87 111 111 64 821937 99 99 99 100 100 77 78
1939 106 91 91 86 86 72 68
* Excludes nonfactory personnel, 1935—39. The following indexes (1929:100) coverall personnel: 1935 1937 1939 -
Employment 88 99 92Employment per unit 112 100 87
a The 1935 figures are considered by the Bureau of the Census to be roughly but notexactly comparable with those for earlier years. See Appendix B-I, TEXTILE PRODUCTS,footnote c.
OUTERWEAR, KNITa
Employment per Man- ManhoursEmployment Unit hours per Unit
Wage Wage Wage EarnersTear Output Earners Total* Earners Total* (ESTIMATE A)
1923 119 143 144 120 1211925 85 97 98' 114 1161927 84 85 86 102 1031929 100 100 100 100 1001931 108 90 .. 831933 119 93 93 78 781935 142 122 120 86 85 124 1031937 117 101 100 86 85 100 1001939 122 93 90 76 74 94 90
* Excludes nonfactory personnel, 1935—39. The following indexes (1929:100) coverall personnel: 1935 1937 1939
Employment 126 100 95Employment per unit 89 85 78
a For indexes covering other years see knit goods, total.

286 APPENDIX F
The following indexes1935 1937 1939
117 117 10982 76 72
Employment per Man- Manhours.
Tear Output
EmploymentWage
Earners Total*
UnitWage
Earners Total*
hours per UnitWage Earners(ESTIMATE A)
1923 57 75 76 131 132 ..1925 68 80 81 118 119 ..1927 78 87 87 111 111 ..1929 100 100 100 100 100 ..1931 88 87 98 .. ..1933 92 91 90 99 98 87 1081935 102 107 106 104 103 89 1001937 115 116 115 101 100 100 1001939 137 123 122 89 89 108 90
* Excludes nonfactory personnel, 1935—39. The following indexes (1929:100) coverall personnel: 1935 1937 1939
LACE GOODS CLOTH, KNITa
Employment per
rear Output
EmploymentWage
Earners Total*
UnitWage
Earners Total*
1914 74 109 106 147 1431919 87 95 94 109 1071921 67 93 91 139 1361923 101 107 104 106 1031925 90 102 101 114 1131927 96 95 94 99 981929 100 100 100 100 1001931 80 88 .. 1101933 .. 86 85 ..1935 143 115 115. 80 801937 154 118 117 77 761939 151 106 105 70 70
Employment
Output
EmploymentWage
Earners Total
per UnitWage
Earners Total
58 85 86 148 15064 76 77 119 12174 77 78 105 105
100 100 100 100 100148 89 .. 60
all personnel:Excludes nonfactory personnel, 1935—39.
EmploymentEmployment per unit
(1929:100) cover
For indexes covering other years see knit goods, total.
HOSIERY, KNIT8
Employment 107 115Employment per unit 105 101
a For indexes covering other years see knit goods, total.
12490

BASIC INDEXES 287
UNDERWEAR, KNITa
Employment per Man- ManhoursEmployment Unit hours per Unit
Wage Wage Wage EarnersYear Output Earners Total* Earners Total* (EsTIMATE A)
1923 103. 117 117 114 114 ..1925 107 116 116 109 108 ..1927 102 111 111 109 110 ..1929 100 100 100 100 100 .. .. ,
1931 78 77 .. 98 •. . ••1933 98 87 86 88 88
1935 99 84 85 85 85
98 102
84 86
1937 102 96 96 94 94 100 tOO
1939 109 90 90 82 82 96 90
* Excludes nonfactory personnel, 1935—39. The following indexes (1929:100) coverall personneL: . 1935 1937 1939
Employment 87 96 93 .
Employment per unit. 88 94 85For indexes covering other years see knit goods, total. .
KNIT GOODS, TOTALa
Employment per Man- Manhours Man- ManhoursEmployment Unit hours per Unit hours per Unit
Wage Wage Wage Earners Wage EarnersYear Output Earners Total* Earners Total* (ESTIMATE A) (EsTIMAm B)
1869 1.9 6.0 .. 306 .. .. .. ..1879 3.6 12 .. 328 .. .. .. ..1889 9.1 25 .. 270 .. .. .. ..1899 19 40 .. 210 .. .. .. ..1904 24 50 49 209 204 .. .. ..1909 33 62 61 187 183 86 301 ..1914 45 7.2 71 160 158 .. .. 77 1701919 55 83 83 149 150 .. .. .. .. .
1921 59 78 78 131 132 .. .. 76 129
1923 75 93 94 125 126 .. .. 91 121
1925 77 90 90 116 117 .. .. 85 110
1927 83 91 91 110 110 .. .. 90 109
1929 100 100 100 100 100 .. .. 100 100
1931 92 85 .. 92 .. .. .. 76 82
1933 100 91 91 91 91 90 105 75 .
1935 111 105 105 95 94 93 .97 76 69
1937 116 111 110 96 95 100 100 85 741939 132 112 111 85 84 104 91 86 65
* Excludes nonfactory personnel, 1935—39. The following indexes (1929:100) coverall personnel:
. 1935 1937 1939Employment 107 110 114Employment per unit 97 95 86
a Combination of four knit goods industries, hosiery, underwear, outerwear, and cloth.Data are not available for these separately for all years.
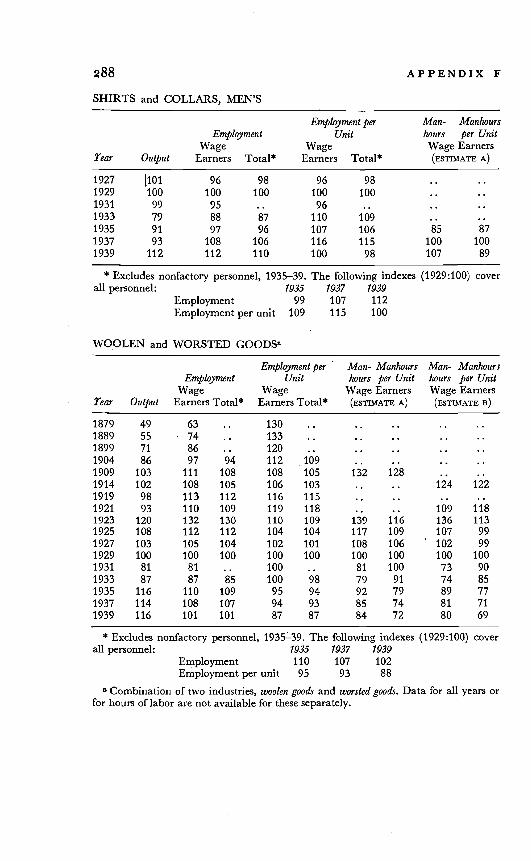
288 APPENDIX F
SHIRTS and COLLARS, MEN'S
Employment per Man- ManhoursEmployment Unit hours per Unit
Wage Wage Wage EarnersTear Output Earners Total* Earners Total* (ESTIMATE A)
1927 (101 96 98 96 98 ..1929 100 100 100 100 100 ..1931 99 95 .. 96 .. ..1933 79 88 87 110 109 ..1935 91 97 96 107 106 85 871937 93 108 106 116 115 100 1001939 112 112 110 100 98 107 89
* Excludes nonfactory personnel, 1935—39. The following indexes (1929:100) coverall personnel: 1935 1937 1939
Employment 99 107 112Employment per unit 109 115 100
WOOLEN and WORSTED GOODSa
Employment per Man- Manhours Man- ManhoursEmpiqyment Unit hours per Unit hours per Unit
Wage Wage Wage Earners Wage EarnersTear Output Earners Total* Earners Total* A) (ESTIMATE B)
1879 49 63 .. 130 .. .. .. ..1889 55 74 .. 133 .. .. .. ..1899 71 86 .. 120 .. .. .. ..1904 86 97 94 112 109 .. ..1909 103 111 108 108 105 132 128
..
..1914 102 108 105 106 103 •. .. 124 1221919 98 113 112 116 115 .. .. ..1921 93 110 109 119 118 .. .. 109 1181923 120 132 130 110 109 139 116 136 1131925 108 112 112 104 104 117 109 107 991927 103 105 104 102 101 108 106 102 991929 100 100 100 100 100 100 100 100 1001931 81 81 .. 100 .. 81 100 73 901933 87 87 85 100 98 79 91 74 851935 116 110 109 95 94 92 79 89 771937 114 108 107 94 93 85 74 81 711939 116 101 101 87 87 84 72 80 69
* Excludes nonfactory personnel, 1935—39. The following indexes (1929:100) coverall personnel: 1935 1937 1939
Employment 110 107 102Employment per unit 95 93 88
a Combination of two industries, woolen goods and worsted goods. Data for all years orfor hours of labor are not available for these separately.

BASIC INDEXES 289
a For indexes covering otherunit see the combination woolen
SILK and RAYON GOODS
Employment per Man- Manhours Man- ManhoursEmployment Unit hours per Unit hours per Unit
Wage Wage Wage Earners Wage Earnersrear Output Earners Total* Earners Total* (ESTIMATE A) (ESTIMATE s)
1879 5.0 21 .. 425 .. .. ..1889 14 35 .. 246 .. .. .. ..1899 22 50 .. 227 .. .. .. ..1904 30 61 60 204 201 ... ..1909 40 76 75 192 .189 128 438 ..1914 49 83 82 171 170 .. .. 88 1811919 64 97 97 152 153 .. ..1921 58 93 94 159 160 .. .. 87 1491923 73 96 98 132 134 .. .. 93 1281925 86 102 102 118 118 .. .. 100 1151927 92 98 99 107 108 .. .. 94 1031929 100 100 100 100 100 .. .. 100 1001931 92 84 .. 91 .. .. 78 841933 84 85 84 101 99 102 164 66 791935a 133 96 95 73 72 106 108 65 491937 135 90 88 66 65 100 100 66 491939 175 91 90 52 51 106 82 67 38
1935—39. The following indexes1935 1937 1939
96 89 9152
of textileBureau of the Census believes that the 1935 figures are not comparable with those forearlier years (see Appendix B-i, TEXTILE PRODUCTS, footnote h). The index of outputis less affected than the indexes of employment and employment per unit (see TheOutput of Manufacturing Industries, 1899—1937, p. 452, footnote d), but even the latter donot appear to be so seriously affected as to be worthless.
WOOLEN GOODSa WORSTED GOODSa
Employment per
rear Output
EmploymentWage
Earners Total
UnitWage
Earners Total
1909 78 89 87 114 1121914 83 84 82 102 991919 92 108 107 117 1161921 80 96 96 121 1201923 115 124 122 108 1061925 112 115 113 102 1011927 105 105 105 101 1001929 100 100 100 100 1001931 70 73 .. 104
. EmploymentEmployment per Unit
Wage WageOutput Earners Total Earners Total
123 125 122 102 99118 124 120 105 102104 117 116 113 112105 120 119 114 114130 138 136 106 105106 111 lii 104 104103 104 104 102 101100 100 100 100 100
.. 9988 87
years and for indexes of manhours and manhours perand worsted goods.
* Excludes nonfactory personnel,all personnel:
Employment
a Owing toEmployment per unit 73 66
shifts in the classification of certain types
(1929:100) cover
manufacture the
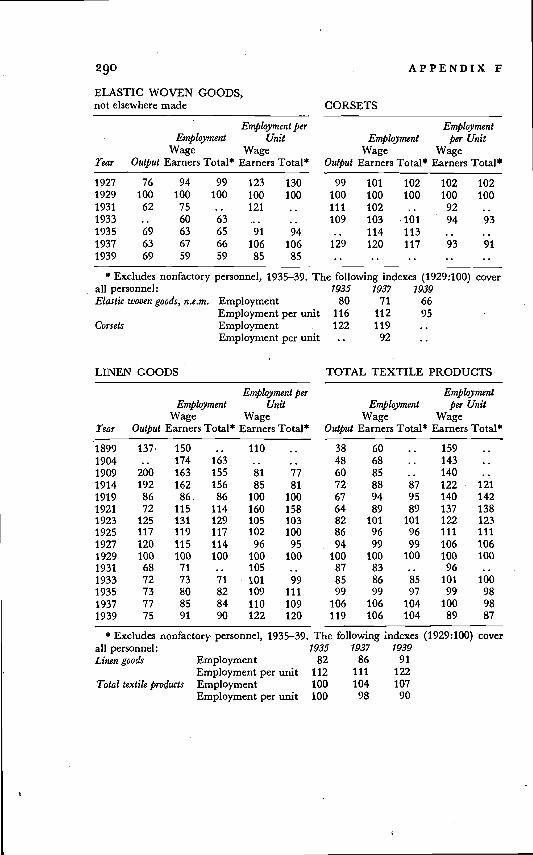
290 APPENDIX F
ELASTIC WOVEN GOODS.not elsewhere made
.
Tear Output
EmploymentWage
Earners Total4
Employment perUnit
WageEarners Total4
1927 76 94 99 123 1301929 100 100 100 100 1001931 62 75 .. 1211933 .. 60 63 ...1935 69 63 65 91 941937 63 67 66 106 1061939 69 59 59 85 85
CORSETS
Employment
Output
EmployWage
Earners
ment
Total4
per UnitWage
Earners Total4
99 101 102 102 102100 100 100 100 100111 102 .. 92109 103 •101 94 93.. 114 113 ..129 120 117 93 91
* Excludes nonfactory personnel, 1935—39. The following indexes (1929:100) coverall personnel:Elastic woven goods, n.e.m.
Corsets
EmploymentEmployment per unitEmploymentEmployment per unit
1935 1937 1939
80 71 66112 95
119
92
all personnel:
Linen goods
116122
LINEN GOODS TOTAL TEXTILE PRODUCTS
per
Tear•
Output
EmploymentWage
Earners Total4
UnitWageEarners Total4
1899 137 150 .. 1101904 .. 174 163 ..1909 200 163 155 81 77
1914 192 162 156 85 81
1919 86 86. 86 100 100
1921 72 115 114 160 1581923 125 131 129 105 103
1925 117 119 117 102 100
1927 120 115 114 96 95
1929 100 100 100 100 1001931 68 71 .. 105
1933 72 73 71 101 991935 73 80 82 109 1111937 77 85 84 110 109
1939 75 91 90 122 120
Employment
Output
EmploymentWageEarners Total4
per UnitWageEarners Total4
38 60 .. 15948 68 .. 143
60 85 .. 140
72 88 87 122 121
67 94 95 140 142
64 89 89 137 138
82 101 101 122 123
86 96 96 111 111
94 99 99 106 106100 100 100 100 100
87 83 .. 9685 86 85 101 100
99 99 97 99 98
106 106 104 100 98
119 106 104 89 87
* Excludes nonfactory personnel, 1935—39.
EmploymentEmployment per unit
The following indexes1935 1937 1939
82 86 91
Total textile products EmploymentEmployment per unit
(1929:100) cover
112 111 122100 104 107100 98 90

BASIC INDEXES 291
LEATHER
LEATHER
PRODUCTS
industry.
1935—39. The following1935 1937 1939103 101 95
99 90 86
Tear Output Wage Earners Total*per
Wage EarnersUnitTotal*
1927 80 83 86 104 1081929 100 100 100 100 1001931 46 63 .. 137 .. .
1933 48 65 68 136 1441935 76 91 89 119 1161937 86 109 101 126 1171939 76 90 83 119 1IQ
Employment 101 103 92Employment per unit 132 119 121
Man- Man- Man-. Employment per Man- hours Man- hours Man- hours
Employment Unit hours per Unit hours per Unit hours per UnitWage Wage Wage Earners Wage Earners Wage Earners
Tear Output Earners Total* Earners Total* (ESTIMATE A) (ESTIMATE B) (ESTIMATE C)a
1889 65 80 -. 123 .. .. .. .. .. ..1899 70 104 .. 150 .. .. .. .. .. ..1904 82 115 113 140 137 .. .. .. .. ..1909 89 125 123 140 138 175 219 .. .. ..1914 84 112 111 133 132 .. .. 118 140 ..1919 104 145 145 139 139 .. .. .. ..1921 88 98 99, 111 112 .. .. 96 109 ..1923 120 120 120 99 100 .. .. 120 99 .. 1081925 101 105 105 103 104 •. .. 104 103 .. 1041927 106 106 106 100 100 .. .. 102 96 .. 1011929 100 100 100 100 100 .. .. 100 100 .. 1001931 81 84 .. 104 .. .. .. 80 99 .. 931933 85 88 88 104 103 93 122 78 91 .. 911935 104 102 101 98 98 101 109 82 79 .. 861937 112 102 100 90 90 100 100 82 73 ..1939 110 95 94 86 85 93 95 77 70 ..
* Excludes nonfactory personnel,personnel:
EmploymentEmployment per unit
indexes (1929:100) cover all
a J• R Arnold, "Labor Productivity in the Leather Industry," Monthly Labor Review, July1937, Table 3. The data relate to a sample of companies in four major branches of the leather
BELTING, LEATHER
* Excludes nonfactory personnel, 1935—39. The following indexes (1929:100) coverall personnel: 1935 1937 1939
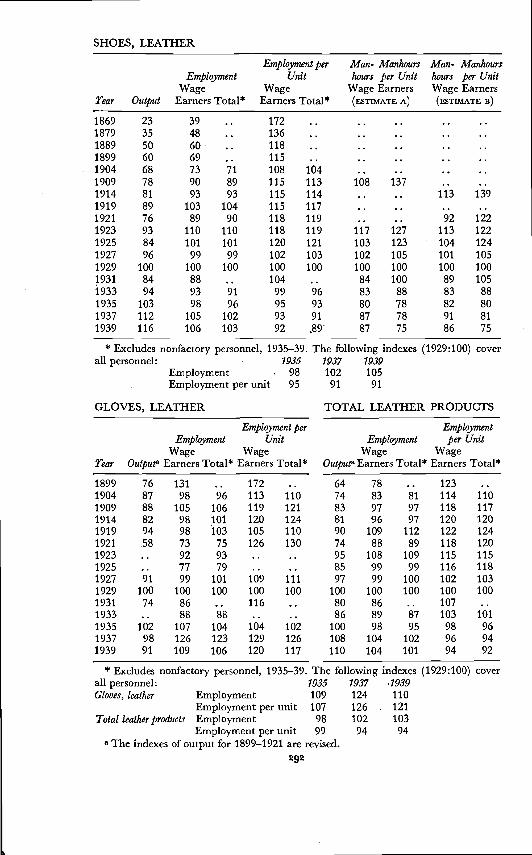
SHOES, LEATHER
Tear Output
EmploymentWage
Earners Total*
Employment perUnit
WageEarners Total*
Man- Manhourshours per Unit
Wage Earners(ESTIMATE A)
Man- Manhourshours per UnitWage Earners(ESTIMATE B)
1869 23 39 .. 172 .. .. .. ..1879 35 48 .. 136 .. .. .. ..1889 50 60 .. 118 .. .. .. ..1899 60 69 .. 115 .. .. .. ..1904 68 73 71 108 104 .. .. ..1909 78 90 89 115 113 108 137 ..1914 81 93 93 115 114 .. .. 113 1391919 89 103 104 115 117 .. .. ..1921 76 89 90 118 119 .. .. 92 1221923 93 110 110 118 119 117 127 113 1221925 84 101 101 120 121 103 123 104 1241927 96 99 99 102 103 102 105 101 1051929 100 100 100 100 100 100 100 100 10019311933
8494
8893
..91
104 ..99 96
84 10083 88
89 10583 88
1935 103 98 96 95 93 80 78 82 801937 112 105 102 93 91 87 78 91 81
1939 116 106 103 92 87 75 86 75
* Excludes nonfactory personnel, 1935—39. The following indexes (1929:100) cover
The following1935 1937
a The indexes of output for 1899—1921 are revised.292
all personnel:EmploymentEmployment per unit
GLOVES, LEATHER
1935 1937 1939
98 102 10595 91 91
TOTAL LEATHER PRODUCTS
Tear Outputs
Employment perEmployment Unit
Wage WageEarners Total* Earners Total*
1899 76 131 .. 172 .. •
1904 87 98 96 113 1101909 88 105 106 119 12119141919
8294
98 101 120 12498 103 105 110
1921 .58 73 75 126 1301923 .. 92 93 ..1925 .. 77 791927 91 99 101 109 1111929 100 100 100 100 1001931 74 86 .. 1161933 .. 88 881935 102 107 104 104 1021937 98 126 123 129 1261939 91 109 106 120 117
EmploymentEmployment
WageOutputa Earners Total*
per UnitWage
Earners Total*
64 78 .. 12374 83 81 114 11083 97 97 118 11781 96 97 120 12090 109 112 122 12474 88 89 118 12095 108 109 115 11585 99 99 116 11897 99 100 102 103
100 100 100 100 10080 86 .. 10786 89 87 103 101
100 98 95 98 96108 104 102 96 94110 104 101 94 92
* Excludes nonfactory personnel, 1935—39.all personnel:Gloves, leather
Total leather products
EmploymentEmployment per unit 107Employment
109 124126
98 102
indexes (1929:100) cover.1939110121103
Employment per unit 99 94 94

RUBBER PRODUCTSSHOES, RTJBBERR
Employment per Man- ManhoursEmployment Unit hours per Unit
Wage Wage Wage EarnersTear Output Earners Total* Earners Total* (ESTIMATE A)
1899 60b 56 .. 94 .. ••1904 .. 74 .. .. .. ..1909 .. 69 .. .. .. ..1914 69 73 69 106 100 ..1919 115 128 128 111 112 ..1921 91 93 93 102 102 ..1923 111 115 112 103 101 ..1925 91 97 97 107 106 ..1927 120 105 103 87 86 ..1929 100 100 100 100 100 ..1931 58 62 .. 106 ..1933 71 71 69 99 97 ..1935 83 67 66 81 80 96 110
1937 95 72 71 75 74 100 100
1939 81 58 58 72 72 79 93
* Excludes nonfactory personnel, 1935—39. The following indexes (1929:100) coverall personnel: 1935 1937 1939
Employment 67 71 .62Employment per unit 82 75 76
a For indexes of manhours and manhours per unit back to 1921 see the group total,rubber products.
b The index for 1899 has been computed since publication of The Output of Manufac-turing Industries, 1899—1937 (National Bureau of Economic Research, 1940). The basicdata are from the Census of Manufactures.
TIRES and TUBES, mci. OTHER RUBBER GOODSa
Tear OutputEmpi
Wage Earners
oymentTotal* . W
Employment perage Earners
UnitTotal*
1919 48 102 118 212 244
1921 37 65 68 174 1841923 67 88 89 • 133 1341925 83 95 96 114 115 .
1927 88 93 97 106 1101929 100 100 100 100 1001931 71 68 .. 95 ..1933 69 71 71 103 1031935 79 79 79 100 1001937 90 90 . 91 100 1011939 98 86 86 87 87
* Excludes nonfactory personnel, 1935—39. The following indexes (1929:100) coverall personnel: 1935 1937 1939
- Employment 82 92 92Employment per unit 104 102 94
Combination of two industries. Data back to 1919 are not available for theseseparately. For indexes of manhours and manhours per unit back to 1921 see the grouptotal, rubber products.
293

294 APPENDIX F
TIRES and TUBESa
Tear Output
EmploymentWage
Earners Total*
Employment perUnit
WageEarners
Man- Manhourshours per Unit
Wage Earners(ESTIMATE A)
Man- Manhourshours per UnitWage Earners(ESTIMATE n) b
1914 .. .. .. .. .. .. .. .. 4291919 .. .. .. .. .. .. ..19211923
3969
67 7189 90
171 183129 131
.. ..
.. ...... 138
1925 88 98 100 112 114 .. .. .. 1351927 91 94 99 103 109 .. .. .. 1091929 100 100 100 100 100 .. .. .. 1001931 67 59 .. 88 .. .. .. .. 7819331935
6572
64 6469 68
98 9895 95
82 10391 102
....
19371939
8183
76 7765 66
94 9578 79
100 10094 92
..
..
* Excludes nonfactory personnel, 1935—39. The following indexes (1929:100) coverall personnel:
EmploymentEmployment per unit 100
1935 1937 1939
72 78 7096 84
a For indexes of output, employment and employment per unit back to 1919 see thecombination tires and tubes mci. other rubber goods. For indexes of manhours and man-hours per unit back to 1921 see the group total, rubber products.
b B. Stern, Labor Productivity in the Automobile Tire Industry, Bulletin No. 585 (Bureauof Labor Statistics, July 1933), p. 9. The data cover 6 large plants.
RUBBER GOODS, OTHER6
Employment per Man- ManhoursEmployment Unit hours per Unit
Wage Wage Wage EarnersTear Output Earners Total* Earners Total* (ESTIMATE A)
1927 80 92 92 115 116 ..1929 100 100 100 100 100 ..1931 83 85 .. 103 .. ..1933 80 88 87 109 108 72 1001935 96 1.00 100 105 105 81 951937 112 120 118 107 106 100 1001939 136 129 128 95 94 109 90
* Excludes nonfactory personnel, 1935—39. The following indexes (1929:100) coverall personnel: 1935 1937 1939
EmploymentEmployment per unit 108 109
For indexes of output, employment and employment per unit back to 1919 see thecombination tires and tubes mci. other rubber goods. For indexes of manhours and man-hours per unit back to 1921 see the group total, rubber products.
103 121 139102

BASIC INDEXES 295
TOTAL RUBBER PRODUCTS
Employment per Man- Manhours Man- ManhoursEmployment Unit hours per Unit hours per Unit
Wage Wage Wage Earners Wage Earnersrear Output Total* Earners Total* (ESTIMATE A) (ESTIMATE B)
1899 .. 25 .. .. .. .. . .. ..1904 .. 30 28 .. .. .. .. ..1909 33 32 .. .. .. .. ..1914 .. 50 52 .. .. .. .. 55
1919 54 107 120 199 223 -. .. ..1921. 43 70 72 163 170 •. .. 68 1601923 72 93 93 129 129 .. 93 1291925 84 95 96 113 114 .. .. 94 1121927 92 95 98 104 107 •. •. 96 1051929 100 100 100 100 100 .. 100 1001931 70 67 .. 96 .. .. 57 81
1933 69 71 71 103 102 .. .. 52 75
1935 79 77 76 97 97 88 100 57 72
1937 91 87 87 96 96 100 100 65 711939 97 81 81 84 84 98 91 64 66
* Excludes nonfactory personnel, 1935—39. The following indexes (1929:100) coverall personnel: 1935 1937 1939
Employment 80 89 87Employment per unit 100 98 90
PAPER PRODUCTS . .
PAPER8
Employment per Man- ManhoursEmployment Unit
Wage Wage Wage Earners
Tear Output Earners Total* Earners Total* (ESTIMATE A)
1927 88 95 95 109 108 ..1929 100 100 100 100 100 ..1931 85 85 .. 99 .. ..1933 83 84 84 102 102 78 108
1935 96 100 100 105 105 88 106
1937 115 107 106 93 92 100 100
1939 123 107 107 87 86 99 92
* Excludes rLonfactory personnel, 1935—39. The following indexes (1929:100) coverall personnel: 1935 1937 1939
Employment 101 107 112
Employment per unit 106 93 91
For indexes back to 1879 see the combination paper and pulp.

296 APPENDIX F
PAPER and PULPS
Employment per Man- Manhours Man- ManhoursEmployment Unit hours per Unit hours per Unit
Wage Wage Wage Earners Wage EarnersTear Output Earners Total* Earners Total* (EsTIMA'rE A) (ESTIMATE B)
1879 4.1 18 .. 434 .. ..1889 8.4 22 .. 266 .. ..1899 19 39 .. 200 .. ..1904 28 52 49 187 177 ..1909 36 59 57 162 155 78 2551914 44 69 66 155 149 .. .. 72 1611919 53 89 87 168 165 ..1921 44 82 80 185 181 .. .. 78 1741923 66 94 93 143 141 .. .. 94 1421925 75 97 96 128 127 .. .. 95 1261927 88 96 96 110 110 .. .. 95 1091929 100 100 100 100 100 .. .. 100 1001931 86 84 .. 98 .. .. .. 71 831933 84 84 84 100 100 77 110 66 791935 98 99 99 102 102 87 107 75 771937 120 107 107 90 89 100 100 87 721939 128 107 107 84 84 98 92 84 66
* Excludes nonfactory personnel, 1935—39. The following indexes (1929:100) coverall personnel: 1935 1937 1939
Employment 101 108 113Employment per unit 103 90 88
a Combination of two industries. Data prior to 1927 are not available for theseseparately.
PULPB
Employment per Man- ManhoursEmployment Unit hours per Unit
Wage Wage Wage EarnersTear Output Earners Total* Earners Total* (ESTIMATE A)
1927 86 100 101 116 1171929 100 100 100 100 1001931 88 82 .. 93 ..1933 89 81 . 82 91 92 74 1171935 107 96 97 90 90 82 1091937 141 109 109. 77 78 100 1001939 147 109 110 74 75 96 92
* Excludes nonfactory personnel, 1935—39. The following indexes (1929:100) coverall personnel: 1935 1937 1939
97 110 11591 78 78
a For indexes back to 1879 see the combination paper and pulp.
a
EmploymentEmployment per unit

Tear Output
EmploymentWage
Earners Total*
Employment perUnit
WageEarners Total*
1899 .. .. .. ..1904 .. .. .. ..1909 .. .. ..1914 .. .. .. ..1919 .. .. .. ..1921 .. .. .. ..1923 .. .. .. ..1925 .. .. .. ..1927 .. .. . . ..1929 100 100 100 100 1001931 81 79 .. 981933 77 69 70 89 9019351937
93110
91 9097 95
98 9788 87
1939 100 86 84 86 84
* Excludes nonfactory personnel, 1935—39.all personnel:Wall paper Employment
Employment per unit 100Total paper products Employment
Employment per unit
PRINTING PUBLISHING
TOTAL PRINTING and PUBLISHING
Employment
Output
EmploymentWage
Earners Total*
perWage
Earners
Unit
Total*
18 40 .. 218 ..26 51 49 197 18737 62 60 168 16246 71 70 154 15053 90 89 170 16850 80 •79 159 15770 95 94 135 13477 95 95 124 12389 95 95 107 107
100 100 100 100 10086 83 .. 96 ..84 82 83 97 98
102 97 96 95 95122 109 107 89 88131 108 106 82 81
The following1935 1937 1939
93 96 9087 90
109 11398 89 86
Employment per Man- Manhours Man- ManhoursEmployment Unit hours per Unit hours per Unit
Wage Wage Wage Earners Wage EarnersTear Output Earners Total* Earners Total* (ESTIMATE A) (ESTIMATE B)
1899 17 56 .. 326 .. .. .. ..1904 26 63 55 239 210 .. ..
77 218..
1909 36 74 68 208 191 ..1914 47 78 73 165 155 .. .. 79 1671919 54 82 79 152 147 ... .. ..1921 52 79 151 148 .. .. 76 1461923 73 86 85 117 116 87 119 85 1161925 82 88 88 107 W7 91 111 88 1071927 90 92 93 101 102 97 108 92 1021929 100 100 100 100 100 100 100 100 1001931 84 89 .. 106 .. 84 100 82 981933 72 74 74 102 102 62 86 62 861935 87 86 84 98 97 71 81 70 801937 102 99 99 98 97 84 83 85 831939 97 91 84 95 87 76 79 76 79
* Excludes nonfactory personnel, 1935—39. The following indexes (1929:100) coverall personnel: 1935 1937 1939
Employment .. 101Employment per unit .. 100
297
WALL PAPER TOTAL PAPER PRODUCTS
indexes (1929:100) cover
100
99102
298 APPENDIX F
CHEMICAL PRODU CTS
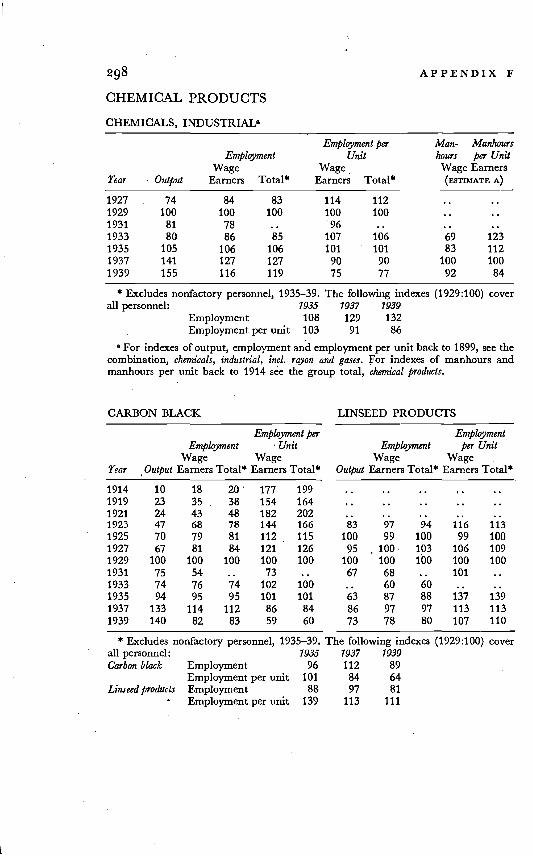
CHEMICALS, INDUSTRIAL6
Tear Output
EmploymentWage
Earners Total*
Employment perUnit
WageEarners Total*
Man- Manhourshours per UnitWage Earners(ESTIMATE A)
1927 74 84 83 114 112 ..1929 100 100 100 100 100 ..1931 81 78 .. '96 .. ..1933 80 86 85 107 106 69 1231935 105 106 106 101 101 83 112
1937 141 127 127 90 90 100 1001939 155 116 119 75 77 92 84
* Excludes nonfactory personnel, 1935—39. The following indexes (1929:100) coverall personnel:
.
1935Employment 108Employment per unit 103
1937129
91
1939132
86
a For indexes of output, employment and employment per unit back to 1899, see thecombination, chemicals, industrial, mci. rayon andmanhours per unit back to 1914 see the group
CARBON BLACK
gases. For indexes of manhours andtotal, chemical products.
LINSEED PRODUCTS
Employment perEmployment 'Unit
Wage WageTear Output Earners Total* Earners Total*
1914 10 18 20' 177 1991919 23 35 38 154 1641921 24 43 48 182 2021923 47 68 78 144 1661925 70 79 81 112 115
1927 67 81 84 121 126
1929 100 100 100 100 100
1931 75 54 .. 731933 74 76 74 102 100
1935 94 95 95 101 1011937 133 114 112 86 841939 140 82 83 59 60
Employment
Output
EmploymentWage
Earners Total*
perWage
Earners
Unit
Total*
83 97 94 116 113100 99 100 99 100
95 . 100 103 106 109100 100 EbO 100 100
67 68 .. 101 .... 60 60 .. ..63 87 88 137 13986 97 97 113 11373 78 80 107 110
* Excludes nonfactory personnel, 1935—39.all personnel:Carbon black
Linseed products
EmploymentEmployment per unitEmployment
The following indexes
1935 1937 193996 112
10188
(1929:100) cover
Employment per unit 139
8497
113
896481
111

BASIC INDEXES 299
CHEMICALS, INDUSTRIAL, incL RAYON and GASESa
. Employment per Man- ManhoursEmployment Unit hours per Unit
Wage Wage Wage EarnersTear Output Earners Total* Earners Tátal* (ESTIMATE A)
1899 6.6 17 .. 253 .. ..1904 8.3 . 21 20 257 242 ..1909 12 25 24 198 191 27 3761914 20 34 33 167 161 ..1919 36 73 75 202 206 ..1921 27 47 49 174 180 ..1923 55 74 74 135 135 ..1925 56 74 73 132 131 ..1927 70 78 78 111 111 .
1929 100 100 100 100 100 ..1931 92 86 .. 94 ••1933 102 96 93 94 92 ..1935 130 115 114 88 87 ..1937 172 132 132 77 77
63 64100 100
1939 188 119 120 89 82
* Excludes nonfactory personnel, 1935—39. The following indexes (1929:100) coverall personnel: 1935 1937 1939
Employment 115 134 131Employment per unit 88 78 70
a Combination of three industries. Data back to 1899 are not available for theseseparately. For indexes of manhours and manhours per unit back to 1914 see the grouptotal, chemical products.
RAYONa
. Employment per Man- ManhoursEmployment Unit hours per Unit
Wage Wage Wage EarnersTear Output Earners Total* Earners Total* (ESTIMATE A)
1923 28 37 •. 130 .. ..1925 40 49 49 121 121 ..1927 60 67 67 111 111 ..1929 100 100 100 100 100 ..1931 138 99 .. 72 .. ..1933 201 113 113 56 56 86 1331935 253 129 131 51 52 • 92 1121937 310 141 146 45 47 100 1001939 346 124 130 36 37 87 78
* Excludes nonfactory personnel, 1935—39. The following indexes (1929:100) coverall personnel: 1935 1937 1939
Employment 131 148 134Employment per unit 52 48 39
a For indexes of output, employment and employment per unit back to 1899 see thecombination chemicals, industrial, mci. rayon and gases. For indexes of manhours andmanhours per unit back to 1914 see the group total, chemical products.

300 APPENDIX F
following1935 1937 1939
84 96 98104 100
Employment per
rear Output
EmploymentWage
Earners Total*
UnitWage
Earners Total*
1927 96 108 106 112 1111929 100 100 100 100 1001931 85 85 .. 1001933 .. 67 71 ..1935 110 109 110 99 1001937 139 118 118 85 851939 123 102 103 83 84
Employment
Output
EmploymentWage
Earners Total*
per UnitWage
Earners Total*
68 95 89 139 131100 100 100 100 100
82 84 .. 10371 82 66 115 9395 112 88 118 93
138 137 96 99 69138 117 74 84 53
* Excludes nonfactory personnel, 1935—39. The following indexes (1929:100) coverall personnel: 1935 1937 1939Glue and gelatin Employment 116
Employment per unit 105Gases, compressed Employment 95 97 100
Employment per unit 100 70 72a For indexes of output,. employment and employment per unit back to 1899 see the
combination chemicals, industrial, mci. rayon and gases. For indexes of manhours and man-hours per unit back to 1914 see the group total, chemical products.
EXPLOSIVES
. Employment per Man- ManhoursEmployment Unit hours per Unit
Wage Wage Wage EarnersTear Output Earners Total* (ESTIMATE A)
1889 11 39 .. 354 .. ..1899 25 80 .. 317 .. ..1904 45 103 85 231 189 ..1909 62 112 84 182 136 161 2421914 70 112 100 .16Q 143 ..1919 94 165 184 176 196 • ..1921 61 80 83 132 136 ..1923 94 114 102 121 108 ..1925 92 101 102 110 110 ..1927 96 103 104 108 109 ..1929 100 100 100 100 100 ..1931 67 84 .. 126 .. ..1933 58 74 73 129 127 68 1101935 68 81 82 120 121 77 1041937 93 96 96 104 104 100 100
1939 98 96 95 98 97 98 93
all personnel:* Excludes nonfactory personnel, 1935—39. The
EmploymentEmployment per unit 123
indexes (1929:100) cover
GLUE and GELATIN GASES, COMPRESSEDa
130
94
113
92
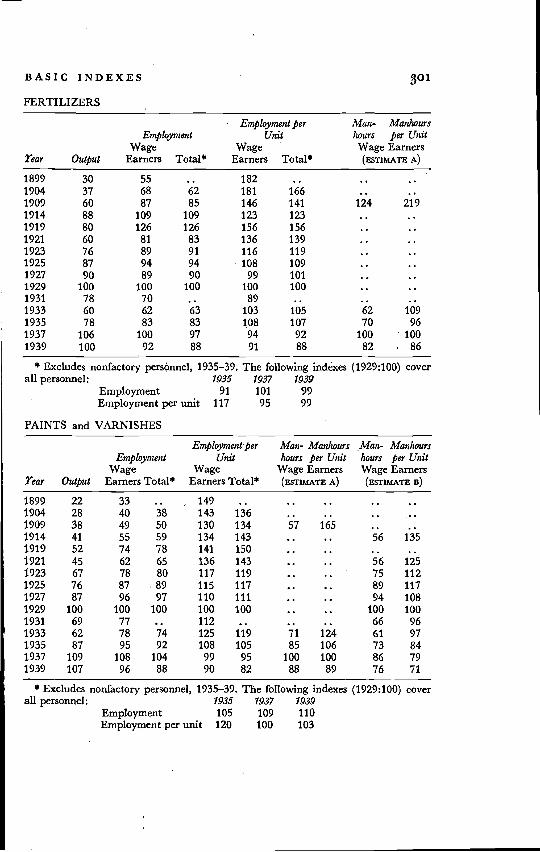
BASIC INDEXES 301
FERTILIZERS
Employment perEmptoyment Unit
Wage Wagerear Output Earners Total* Earners Total*
Man- Manhourshours per UnitWage Earners
(ESTIMATE A)
1899 30 55 .. 182 ••1904 37 68 62 181 166 ..1909 60 87 85 146 141 124 2191914 88 109 109 123 123 ..1919 80 126 126 156 156 ..1921 60 81 83 136 139 ..1923 76 89 91 116 119 ..1925 87 94 94 108 109 ..1927 90 89 90 99 101
1929 100 100 100 100 100....
1931 78 70 .. 89 .. ..1933 60 62 63 103 105 62 109
1935 78 83 83 108 107 70 96
1937 106 100 97 94 92 100 100
1939 100 92 88 91 88 82 86
* Excludes nonfactory personnel, 1935—39. The following indexesall personnel: 1935 1937 1939
Employment 91 101 99• Employment per unit 117 95 99
(1929:100) cover
PAINTS and VARNISHES
Employment per Man- ManhoursEmployment Unit hours per Unit
Wage Wage Wage Earners
Tear Output Earners Total* Earners Total* (ESTIMATE A)
Man- Manhourshours per UnitWage Earners
(ESTIMATE B)
1899 22 33 .. , 149 .. .. ..1904 28 40 38 143 136 ..
....
1909 38 49 50 130 134 57 165 ..1914 41 55 59 134 143 .. .. 56 135
1919 52 74 78 141 150 .. .. ..1921 45 62 65 136 143 .. 56 125
1923 67 78 80 117 119 .. .. 75 112
1925 76 87 89 115 117 .. .. 89 117
1927 87 96 97 110 111 .. .. 94 1081929 100 100 100 100 100 .. .. 100 1001931 69 77 112 .. .. .. 66 96
1933 62 78 74 125 119 71 124 61 97
1935 87 95 92 108 105 85 106 73 84
1937 109 108 104 99 95 100 100 86 79
1939 107 96 88 90 82 88 89 76 71
* Excludes nonfactory personnel, 1935—39. The following indexes (1929:100) coverall personnel: 1935 1937 1939
Employment 105 109 110Employment .per unit 120 100 103
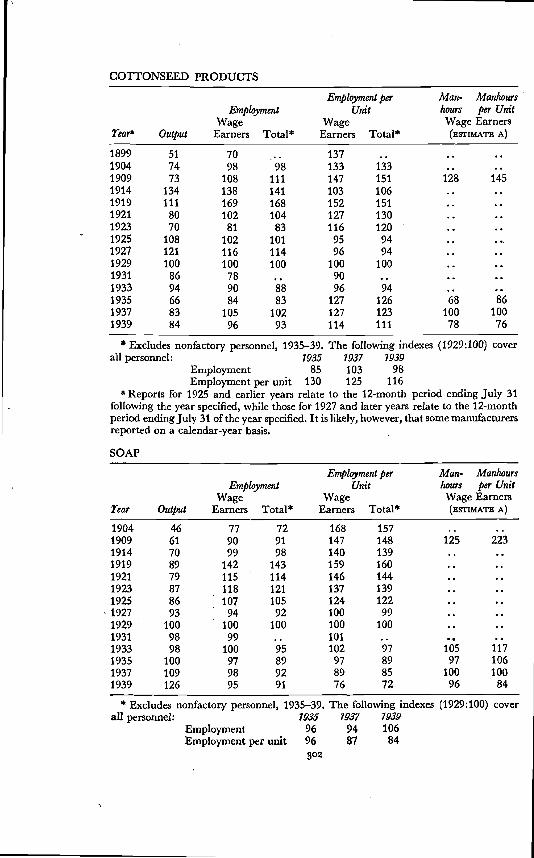
COTTONSEED PRODUCTS
Employment per Man- ManhoursEmployment Unit hours per Unit
Wage Wage Wage EarnersTeara Output Earners Total* Earners Total* (ESTIMATE A)
1899 51 70 •..98
137 .. ..1904 74 98 133 133 ..1909 73 108 iii 147 151 . 128 1451914 134 138 141 103 106 ..1919 111 169 168 152 151 ..1921 80 102 104 127 130 ..1923 70 81 83 116 120 ..1925 108 102 101 95 94 .•1927 121 116 114 96 94 ..1929 100 100 100 100 100 ..1931 86 78 .. 90 .. •.1933 94 90 88 96 94 ••1935 66 84 83 127 126 68 86
1937 83 105 102 127 123 100 100
1939 84 96 93 114 111 78 76
* Excludes nonfactory personnel, 1935—39. The following indexes (1929:100) coverall personnel: 1935 1937 1939
Employment 85 103 98Employment per unit 130 125 116
a Reports for 1925 and ear]ier years relate to the 12-month period ending July 31following the year specified, while those for 1927 and later years relate to the 12-monthperiod ending July 31 of the year specified. It is likely, however, that some manufacturersreported on a calendar-year basis.
SOAP
Employment per Man- ManhoursEmployment Unit hours per Unit
Wage Wage Wage EarnersTear Output Earners Total* Earners Total* A)
1904 46 77 72 168 157 ..1909 61 90 91 147 148 125 223
1914 70 99 98 140 139 ..1919 89 142 143 159 160 ..1921 79 115 114 146 144 ..1923 87 118 121 137 139 ..1925 86 107 105 124 122 ..1927 93 94 92 100 99 ..1929 100 100 100 100 100 ..1931 98 99 .. 101 .. ..1933 98 100 95 102 97 105 117
1935 100 97 89 97 89 97 106
1937 109 98 92 89 85 100 1001939 126 95 91 76 72 96 84
* Excludes nonfactory personnel, 1935—39. The following indexes (1929:100) coverall personnel: 1935 193? 1939
Employment 96 94 106Employment per unit 96 87 84
302
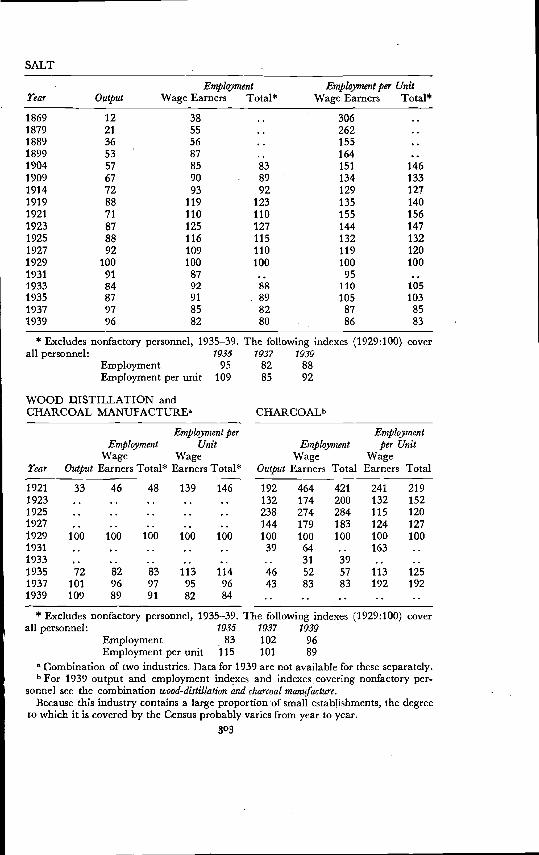
rear Output Wage Earners Total*per
Wage EarnersUnit
1869 12 38 ..• 306 ..
1879 21 55 .. 262 ..1889 36 56 .. 155 ..1899 53 87 .. 164 ..1904 57 85 83 151 146
1909 67 90 - 89 134 1331914 72 93 92 129 127
1919 88 119 123 135 140
1921 71 110 110 155 156
1923 87 125 127 144 147
1925 88 116 115 132 132
1927 92 109 110 119 120
1929 100 100 100 100 100
1931 91 87 .. 95 ..1933 84 92 88 110 1051935 87 91 89 105 103
1937 97 85 82 87 85
1939 96 82 80 86 83
* Excludes nonfactory personnel, 1935—39. The following indexes (1929:100)1935 1937 1939
95 82 88Employment per unit 109 85 92
WOOD DISTILLATION and
The following indexes
1935 1937 1039
83 102 96101 89
a Combination of two industries. Data for 1939 are not available for these separately.b For 1939 output and employment indexes and indexes covering nonfactory per-
sonnel see the combination wood-distillation and charcoal manufacture.Because this industry contains a large proportion -of small establishments, the degree
to which it is covered by the Census probably varies from year to year.303
SALT
all personnel:Employment
CHARCOAL MANUFACTURES
cover
CHARCOALb
Employment per
Tear Output
EmploymentWageEarners Total*
UnitWage
Earners Total*
1921 33 46 48 139 1461923 .. .. .. ..1925 .. .. .. ..1927 .. .. .. ..1929 100 100 100 100 1001931 .. .. ..1933 .. .. .. ..1935 72 82- 83 113 1141937 101 96 97 95 961939 109 89 91 82 84
Employment
Output
EmploymentWage
Earners Total
per UnitWage
Earners Total
192 464 421 241 219
132 174 200 132 152
238 274 284 115 120
144 179 183 124 127100 100 100 100 100
39 64 .. 163
.. 31 39 ..46 52 57 113 12543 83 83 192 192
* Excludes nonfactory personnel, 1935—39.all personnel:
EmploymentEmployment per unit 115
(1929:100) cover
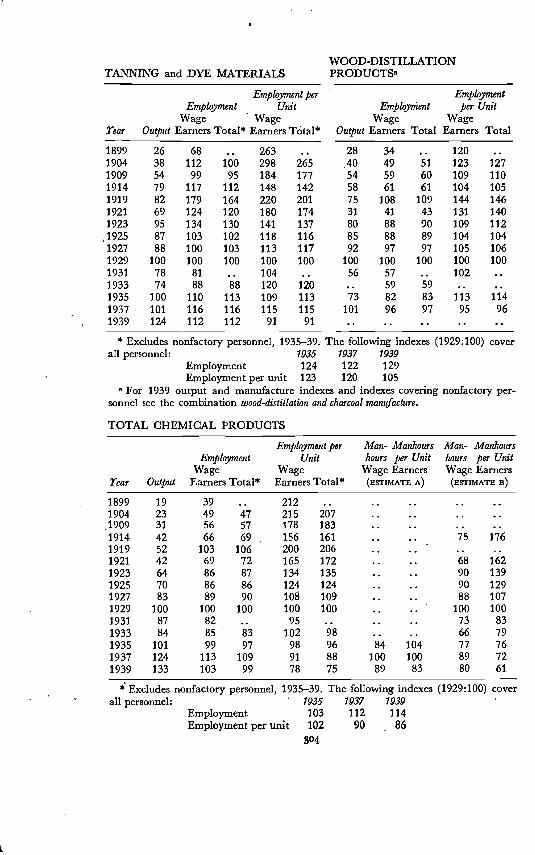
WOOD-DISTILLATIONTANNING and DYE MATERIALS
Employment per
Tear Output
Employment UnitWage Wage
Earners Total* Earners Tótal*
1899 26 68 .. 2631904 38 112 100 298 2651909 54 99 95 184 1771914 79 117 112 148 1421919 82 179 164 220 2011921 69 124 120 180 1741923 95 134 130 141 137
87 103 102 118 1161927 88 100 103 113 1171929 100 100 100 100 1001931 78 81 .. 1041933 74 88 88 120 1201935 100 110 113 109 1131937 101 116 116 115 1151939 124 112 112 91 91
PROD UCTSa
Employment
Output
EmployWage
Earners
ment
Total
per UnitWage
Earners Total
28 34 .. 12040 49 51 123 12754 59 60 109 11058 61 61 104 10575 108 109 144 14631 41 43 131 14080 88 90 109 11285 88 89 104 10492 97 97 105 106
100 100 100 100 10056 57 .. 102.. 59 59 ..73 82 83 113 114
101 96 97 95 96
* Excludes nonfactory personnel, 1935—39. The following indexes (1929:100) cover1935 1937 1939
124 122 129Employment per unit 123 120 105
a For 1939 output and manufacture indexes and indexes covering nonfactory per-sonnel see the combination wood-distillation and charcoal manufacture.
TOTAL CHEMICAL PRODUCTS
1935—39. The following• 1935 1937 1939
112 11490 86
all personnel:Employment
Employment per Man- Manhours Man- ManhoursEmployment Unit hours per Unit hours per Unit
Wage Wage Wage Earners Wage EarnersTear Output Earners Earners Total* (ESTIMATE A) (ESTIMATE B)
1899 19 39 .. 212 .. .. .. ..1904 23 49 47 215 207 .. .. ...1909 31 56 57 178 183 .. .. ..1914 42 66 69 156 161 .. .. 75 1761919 52 103 106 200 206 .. .. . ..1921 42 69 72 165 172 .. .. 68 1621923 64 86 87 134 135 .. .. 90 1391925 70 86 86 124 124 .. .. 90 1291927 83 89 90 108 109 .. .. 88 1071929 100 100 100 100 100 .. .. 100 1001931 87 82 .. 95 .. .. .. 73 831933 84 85 83 102 98 .. .. 66 791935 101 99 97 98 96 84 104 77 761937 124 113 109 91 88 100 100 89 721939 133 103 99 78 75 89 83 80 61
Excludes nonfactory personnel,all personnel:
EmploymentEmployment per unit
indexes (1929:100) cover
103102
304

PETROLEUM AND COAL PRODUCTS
PETROLEUM REFINING
Employment per Man. ManhoursEmployment Unit hours per Unit
Wage Wage Wage EarnersTear Output Earners Total* Earners Total* A)
1879 1.7 11 .. 618 .. ..1889 3.9 13 .. 3381899 5.9 15 256 ... ..1904 7.2 21 19 289 261
1909 11 17 17 157 152 18
1914 17 31 31 185 184
1919 34 73 74 215 217
1921 40 78 75 194 185
1923 56 83 83 149 149
1925 73 81 81 111 111
1927 81 88 88 109 109
1929 100 100 100 100 100 100 100
1931 91 85 .. 94 .. ' 77 851933 86 86 84 99 97 65 75
1935 99 96 98 97 98 66 67
1937 119 103 104 87 88. 72 61
1939 128 90 93 71 73 64 50
* Excludes nonfactory personnel, 1935—39. The following indexes (1929:100) coverall personnel: 1935 1937 1939
EmplOyment 99 109 107 -
Employment per unit 100 91 84
COKE-OVEN PRODUCTS
Employment Employment per UnitTear Output Wage Earners Total* Wage Earners Total*
1879 2.5 12 .. 4731889 9.0 34 .. 3791899 18 83 .. 4541904 23 92 84 405 3711909 38 142 129 372 3371914 38 103 97 272 257 •
1919 61 143 136 232 2211921 43 78 79 181 1831923 89 138 131 154 1461925 81 113 111 139 1371927 84 103 101 123 121
1929 100 100 100 100 1001931 55 70 . .. 1271933 43 64 62 148 1431935 58 81 78 140 1351937 87 100 97
. 115 1111939 87 106 101 121 117
* Excludes nonfactory personnel, 1935—39. The following indexes (1929:100) cover
all personnel: 1935 1937 1939Employment 82 98 106Employment per unit 141 113 122
305

306 APPENDIX F
149109
94 90
Employment per
Tear Output
EmploymentWage
Earners Total*
UnitWage
Earners Total*
1927 100 134 132 134 1321929 100 100 100 100 1001931 65 79 .. 1221933 .. 59 59 ..1935 64 101 97 158 1531937 112 146 138 130 1241939 140 164 157 117 112
* Excludes nonfactory personnel, 1935—39.all personnel:Wall plaster and board Employment
Employment per unitAsbestos products. Employment
Employment
Output
EmploymentWageEarners Total*
per UnitWage
Earners Total*
73 78 77 108 106100 100 100 100 100
68 74 .. 10956 75 76 134 13678 119 119 153 153
126 161 156 128 124
The following indexes (1929:100) cover1935 1937 1939
101 140 167159 125 119
FUEL BRIQUETTESTOTAL PETROLEUM andCOAL PRODUCTS
Employment per
Tear Output
EmploymentWage
Earners Total*
UnitWage
Earners Total*
1899 .. .. .. ..1904 .. .. .. ..1909 7,9 21 22 262 2751914 16 33 34 214 2181919 21 40 44 191 2111921 29 87 90 302 3131923 54 85 84 157 1541925 59 58 58 98 991927 72 64 64 89 891929 100 100 100 100 1001931 50 71 1411933 37 '69 71 188 1931935 64 80 81 125 1271937 79 107 102 136 1301939 66 96 96 146 145
Employment
Output
EmploymentWage
Earners Total*
per UnitWage
Earners Total*
8.7 29 .. 33710 35 32 347 31416 43 40 266 24621 47 46 218 21339 90 89 230 22941 79 77 194 18864 95 94 150 14875 88 88 117 11783 92 91 110 110
100 100 100 100 10084 82 .. 9878 81 79 104 10192 93 94 101 102
114 103 103 91 91121 95 96 79 79
all personnel:Fuel briquettes
* Excludes norifactory personnel, 1935—39.
Employment
The following193590
Employment per unit 141Total petroleum and coal products Employment
Employment per unit 105
indexes1937102
130
STONE,
cover(1929:100)193998
96 107
CLAY AND GLASS PRODUCTS
WALL PLASTER and BOARD ASBESTOS PRODUCTS
Employment per unit 159 127124 160

LIME
Employment per Man- ManhoursEmployment Unit hours per Unit
Wage Wage Wage Earnersrear Output Earners Total* Earners Total* (ESTIMATE A)
1904 81 129 127 160 158 ..1909 91 160 161 177 177 192 215
19.14 95 . 144 144 151 152 ..1919 77 132 132 172 172 ..1921 58 121 120 208 207 ..1923 93 144 144 155 156 ..1925 102 141 142 139 139 ..1927 101 127 128 126 126 ..1929 100 100 100 100 100 .
1931 78 78 .. 101 .. ..1933 .. 70 70 .. .. ..1935 67 88 88 130 131 ..1937 102 114 112 112 110 100 100
1939 118 111 111 94 94 93 80
— * Excludes nonfactory personnel, 1935—39. The following indexes (1929:100) coverall personnel: 1935 1937 1939
Employment 90 115 117Employment per unit 134 113 99
CEMENT
Employment per Man- Manhours Man- ManhoursEmployment Unit hours per Unit hours per Unit.a
Wage Wage Wage Earners Wage Earnersrear Output Earners Total* Earners Total* (ESTIMATE A) (ESTLMATE B)
1904 19 52 48 279 255 .. .. ..1909 43 80 75 185 173 162 256 ..1914 61 84 81 137 133 .. ..1919 57 76 77 134 135 .. ..
..
..1921 60 79 78 131 131 .. . .. .. 1591923 77 105 103 136 133 .. .. .. 1411925 94 115 116 122 123 .. .. .. 1291927 100 109 111 108 110 .. .. .. 1101929 100 100 100 100 100 .. .. .. 1001931 75 73 .. 98 .. .. .. .. 971933 36 47 46 131 128 54 102 .. 991935 44 62 60 140 136 70 108 .. 1041937 68 79 75 116 110 100 100 ..1939 72 71 69 .9 95 89 84 .
* Excludes nonfactory personnel, 1935—39. The following indexes (1929:100) coverall personnel: 1935 1937 1939
Employment 62 77 73Employment per unit 140 113 101
a G. Perazich, S. T. Woal, and H. Schinimel, in the Cement Industry,(National Research Project in cooperation with the National Bureau of EconomicResearch, Philadelphia, 1939), p. 89. The basic data were collected in a field studycovering 16 to 61 percent of the industry.
307

308
CONCRETE PRODUCTSa ROOFING
APPENDIX F
Employment
Output
EmploymentWage
Earners Total*
per UnitWage
Earners Total*
100 100 100 100 10062 68 .. 111.. 73 69 ...83 107 99 130 120
110 123 115 112 104127 234 123 205 97
* Excludes nonfactory personnel, 1935—39. The following indexes (1929:100) cover
a Because this industry contains a large proportion of small establishments, the degreeto which it is covered by the Census probably varies from year to year.
Employment per Man- Manhours Man- ManhoursEmployment Unit hours per Unit hours per Unit
Wage Wage Wage Earners Wage Earnersrear Outputa Earners Total* Earners Total* (ESTIMATE A) (ESTIMATE B) b
1914 84 107 107 127 127 .. .. ..1919 64 82 84 129 131 .. .. .. 1141921 57 74 75 130 132 .. .. .. 1091923 99 110 110 111 110 .. .. .. 1021925 106 110 110 104 104 .. .. .. 1001927 . 107 108 108 101 101 .. .. .. 1001929 100 100 100 100 100 .. .. .. 1001931 48 55 .. 113 .. .. .. .. 1311933 28 34 35 122 125 40 94 .. 1281935 40 48 48 119 121 62 102 .. 121
1937 66 70 69 106 105. 100 100 ..1939 64 66 66 103 102 91 94 ..
* Excludes nonfactory personnel, 1935—39. The following indexes (1929:100) coverall personnel: 1935 1937 1939
Employment 50 70 68Employment per unit 124
a The index for 1914—23 is slightly revised.b M. E. West, Productivity and Employment in Selected Industries: Brick and Tile (National
Research Project, in cooperation with National Bureau of Economic Research, Phila-delphia, 1939), p. 115. For 1919—29 the index is based on a sample of 12 to 56 plants,and is a chain of median link relatives; for 1929—35, it is a weighted mean index for 37identical plants.
Employment per
Tear Output
EmploymentWage
Earners Total*
UnitWage
Earners Total*
1925 75 89 86 118 1141927 94 108 106 115 1131929 100 100 100 100 1001931 61 56 .. 931933 25 27 29 108 1171935 57 51 52 89 .. 901937 92 78 74 85 811939 153 105 99 69 65
Concrete productsall personnel: 1935 1937 1939
Employment 55 76 110Employment per unit 97 83 72
Roofing Employment 108Employment per unit 130
117106
138108
CLAY PRODUCTS, not elsewhere classified
106 106

following indexes1935 1937 1939101 119 108
86 73 74
TOTAL STONE, CLAYGLASS PRODUCTS
39 68
Employment per unit 146 103
Employment per unit 110
GLASS
Employment per Man- ManhoursEmployment Unit hours per Unit
Wage Wage Wage EarnersTear Outputa Earners, Total* Earners Total* (ESnMATE A)
1899 25 78 .. 314 .. ..1904 33 95 90 285 273 ..1909 45 102 98 227 218 125 4521914 64 110 106 173 167 ..1919 64 115 113 178 175 ..1921 .. 81 81 .. .. ..1923 .. 109 107 .. .. ..1925 84 103 102 122 122 ..1927 92 97 97 106 106 ..1929 100 100 100 100 100 ..1931 81 74 .. 91 ..1933 78 74 74 95 96 64 1331935 118 99 100 84 84 84 1161937 163 117 119 72 73 100 1001939 147 103 105 70 72 86 96
all personnel* Excludes nonfactory personnel, 1935—39. The
EmploymentEmployment per unit
(1929:100) cover
SAND-LIME BRICK
a The index for 1899—1919 has been cpmputed since publication of The Output ojManufacturing Industries, 1899—1937. The basic data are from the Census of Manufactures.
and
Employment per
Tear Output
EmploymentWage
Earners Total*
UnitWage
Earners Total*
1899 .. .. .. ..1904 .. .. .. ..1909 .. .. .. ..1914 59 98 93 167 158
1919 52 89 85 171 163
1921 34 66 62 195 183
1923 76 103 99 136 131
1925 114 142 134 124 117
1927 115 140 133 121 116
1929 100 100 100 100 100
1931 54 57 .. 1061933 8.7 15 17 170 195
1935 26 40 38 151 143
1937 66 73 68 110 103
1939 67 61 56 91 84
Employment
Output
EmploymentWage
Earners Total*
per UnitWage
Earners
.. 69 .. ..
.. 85 81 ..
.. 100 98 ..
.. 99 97 ..
.. 92 92 ..
.. 78 78 ..
.. 106 105 ..91 107 107 117 117
100 106 106 106 106
100 100 100 100 100
67 68 .. 100
47 54 114 116
69 73 73 107 107
100 94 93 94 93
98 89 88 91 90
all personnelSand-lime brick
* Excludes nonfactory personnel, 1935—39. The following indexes (1929:100) cover
Employment
Total stone, clay and glass prodzwts Employment
1935 1937 193962
92
509
76 94 93
94 95
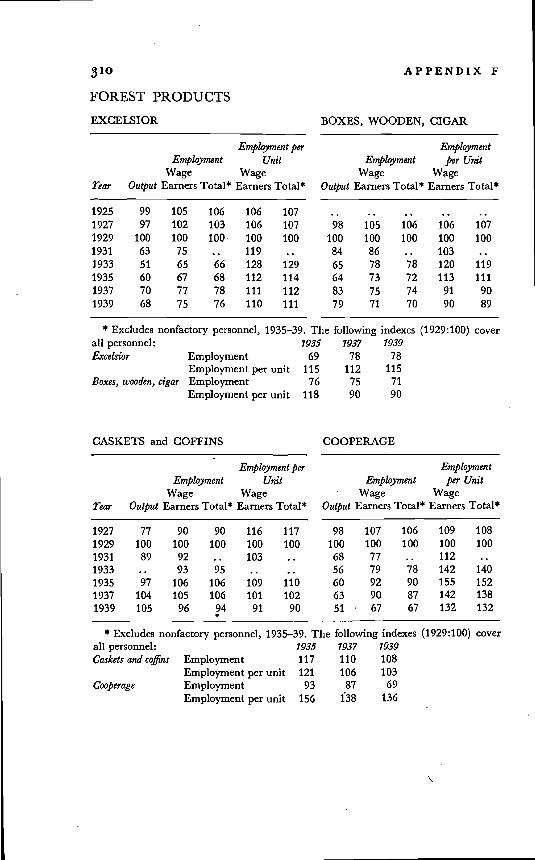
310 APPENDIX F
FOREST PRODUCTS
following1935 1937
69 78
115 11276 75
Employment per unit 118 90
indexes1939
7811571
90
Employment per
Tear Output
EmploymentWage
Earners Total*
UnitWage
Earners Total*
1927 77 90 90 116 1171929 100 100 100 100 100
1931 89 92 .. 103
1933 .. 93 95 ..1935 97 106 106 109 1101937 104 105 106 101 1021939 105 96 94. 91 90
all personnel:Caskets and coffins Employment
Employment per unit 121Cooperage Employment
Employment per unit 156
following indexes1935 1937 1939
117 110 108
106 103
93 87 69
138 136
EXCELSIOR BOXES, WOODEN, CIGAR
Employment per
rear Output
EmploymentWage
Earners Total*
UnitWage
Earners Total*
1925 99 105 106 106 107
1927 97 102 103 106 107
1929 100 100 100 100 100
1931 63 75 .. 119
1933 51 65 66 128 129
1935 60 67 68 112 114
1937 70 77 78 111 112
1939 68 75 76 110 111
Employment
Output
EmploymentWage
Earners Total*
per UnitWage
Earners Totals
98 105 106 106 107100 100 100 100 100
84 86 .. 103
65 78 78 120 11964 73 72 113 111
83 75 74 91 9079 71 70 90 89
* Excludes nonfactory personnel, 1935—39. Theall personnel:Excelsior
Boxes, wooden, cigar
EmploymentEmployment per unitEmployment
(1929:100) cover
CASKETS and COFFINS COOPERAGE
Employment
Output
EmploymentWage
Earners Total*
per UnitWage
Earners Total*
98 107 106 109 108
100 100 100 100 100
68 77 .. 112
56 79 78 142 140
60 92 90 155 152
63 90 87 142 138
51 67 67 132 132
* Excludes nonfactory personnel, 1935—39. The (1929:100) cover

BASIC. INDEXES 311
LUMBER-MILL and PLANING-MILL
Employment per Man- Manhours Man- ManhoursEmployment Unit hours per Unit hours per Unit
Wage Wage Wage Earners Wage EarnersYear Output Earners Total* Earners Total* (ESTIMATE A) (ESTIMATE s)
1925 109 114 112 104 103 .. .. 123 1131927 97 100 99 103 102 .. .. 105 1081929 100 100 100 100 100 .. .. 100 1001931 52 49 .. 95 ..
114 114.. .. 44 84
1933 38 44 44 .. .. 34 891935 53 60 59 113 112 68 90 52 981937 70 77 75 109 107 100 100 68 96
1939 74 72 71 97 96 84 80 63 84
* Excludes nonfactory personnel, 1935—39. The following indexes (1929:100) coverall personnel: 1935 1937 1939
Employment 60 76 74Employment per unit 114 109 99
a Combination of two industries, lumber-mill products and planing-mill products. Indexesof manhours and manhours per unit for 1925—33 are not available for planing-millproducts separately.
LUMBER-MILL PRODUCTS, not elsewhere classifie&
Employment per Man- ManhoursEmployment Unit hours per Unit
Wage Wage Wage Earners
Year Output Earners Total* Earners Total* (ESTIMATE A)
1899 107 96 .. 90 .. ..1904 96 94 93 98 97 ..1909 105 127 128 122 122 157 150
1914 96 112 112 117 117 ..1919 97 112 112 116 116 ..1921 80 87 88 108 109 ..1923 99 118 117 120 119 116 117
1925 106 111 110 106 104 112 106
1927 97 99 97 102 100 100 102
1929 100 100 100 100 100 100 100
1931 51 47 .. 93 .. 44 881933 40 45 45 112 111 37 92
1935 55 61 60 111 110 50 911937 72 77 76 107 106 74 1021939 72 71 71 98 98 60 83
* Excludes nonfactory personnel, 1935—39. The following indexes (1929:100) cover
all personnel: 1935 1937 1939Employment 61 77 72Employment per unit 112 107 101
alternative indexes of manhours and manhours per unit for 1925—33 see thecombination lumber-mill and planing-mill products.

APPENDIX F
PLANING-MILL PRODUCTS, not elsewhere madea
rear Output
EmploymentWage
Earners Total*
Employment perUnit
WageEarners Total*
Man- Manhourshours per UnitWage Earners(ESTIMATE A)
1925 119 124 121 104 101 ..1927 97 107 105 110 108 ..1929 100 100 100 100 100 ..1931 55 60 .. 110 .. ..1933 32 39 40 122 124 ..193519371939
466483
537478
537174
117 117115 110
94 89
68 96100 100
102 80
* Excludes nonfactory personnel, 1935—39. The following indexes (1929:100) coverall personnel;
EmploymentEmployment per unit 123
1935 1937 1939
56 74 80115 96
a For indexes of manhours and manhours per unit for 1925—33 see the combinationlumber-mill and planing-mill products,
78 83103
68 82108
78116
80100
TURPENTINE and ROSIN TOTAL FOREST PRODUCTS
Employment per
Tear Output
EmploymentWageEarners Total*
UnitWage
Earners Total*
1899 119 104 .. 871904 97 83 87 86 901909 90 98 103 108 1131914 82 86 88 105 1081919 76 69 72 92 951921 74 68 71 93 961923 88 85 86 97 971925 91 73 74 80 811927 107 94 95 88 881929 100 100 100 100 1001931k 78 70 .. 911933 82 77 77 94 951935 78 78 78 100 1001937 81 81 83 100 1031939 67 52 77 78 114
Employment
Output
EmploymentWage
Earners Total*
per UnitWage
Earners Total*
82 81 .. 9876 87 .. 11383 108 .. 13082 98 98 119 11979 9, 98 124 12583 80 81 96 9891 107 106 118 116
103 105 104 102 10199 99 98 99 98
100 100 100 100 10063 58 .. 9246 52 52 113 11359 66 66 112 11176 82 81 108 10680 77 76 96 96
* Excludes nonfactory personnel, 1935—39.all personnel:Turpentine and rosin Employment
Employment per unit 100Total forest products Employment
Employment per unit 115
The following indexes (1929:100)1935 1937 1939
cover
a The 1931 Census of this industry is reported by the Bureau of the Census to besomewhat incomplete because some establishments failed to report.

BASIC INDEXES 313
IRON AND STEEL PRODUCTS
CAST-IRON PIPE
Employment per Man- Manhours
rear•
Output
EmploymentWage
Earners Total*
UnitWage
Earners Total*
hours per UnitWage Earners(ESTIMATE A)
1914 62 64 63 103 102 ..1919 44 64 65 147 149 ..1921
1923
48
93
63 63
109 107
'133 133
117 115
..
..1925 113 117 115 104 102 ..1927 114 116 115 102 101 ..1929 100 100 100 100 100 ..1931 69 81 .. 118 ..1933 31 48 49 155 157 42 94
1935 46 69 69 148 149 63 93
1937 68 89 89 130 130 100 100
1939 74 84 84 114 114 95 88
all personnel: 193572
FILES
Employment
Output
EmploymentWage
Earners Total*
per UnitWage
Earners
100 100 100 100 10063 76 .. 12165 66 67 102 10372 73 75 102 104
106 93 94 89 8980 81 83 101 104
The following indexes (1929:100) cover1937 1939
96 7899 90 8177 95 87
Firearms EmploymentEmployment per unit
Files Employment
* Excludes nonfactory personnel, 1935—39. Theall personnel:
FIREARMS
following indexes1935 1937 1939
Employment 70 90 86Employment per unit 150 131 117
(1929:100) cover
. Employment perEmployment Unit
Wage Wagerear Output Earners Total* Earners Total*
1921 52 69 69 134 1341923 77 91 90 118 1171925 70 65 66 93 941927 93 90 89 97 961929 100 100 100 100 100
1931 56 62 .. 1121933 56 49 51 89 921935 72 71 71 99 98
1937 107 100 96 94 90
1939 97 73 75 76 77
* Excludes nonfactory personnel, 1935—39.
Employment per unit 108 90 108

314 APPENDIX F
BLAST-FURNACE PRODUCTS8
Tear Output
EmploymentWage
Earners Total*
Employment perUnit
WageEarners Total*
Man- Manhourshours per UnitWage Earners
(ESTIMATE A)
Man- Manhourshours per UnitWage Earners(ESTIMATE B)b
1889 20 117 .. 589 .. .. ..1899 32 157 .. 485 .. .. ..1904 38 141 130 372 344 .. .. ..1909 58 154 150 265 258 176 303 ..1914 53 118 116 222 218 .. .. ..1919 70 173 170 249 244 .. .. 2081921 39 75 80 193 206 .. .. .. 1691923 93 147 144 158 155 .. .. .. 1411925 84 117 116 138 137 .. .. 1051927 84 112 111 133 132 .. .. .. 1001929 100 100 100 100 100 100 100 ..1931 44 54 .. 124 -. ..1933 32 48 48 153 152 32 101 ..1935 51 61 61 120 121 42 83 ..1937 88 92 91 105 104 68 77 ..1939 76 78 78 103 103 51 68 ..
* Excludes nonfactory personnel, 1935—39. The following indexes (1929:100) coverall personnel: 1937 1939
Employment 61 94 80Employment per unit 121 107 106
a For fuller indexes on manhours and manhours per unit see combination blast-furnace and steel-mill products.
b Bureau of Labor Statistics, Productivity of Labor in Merchant Blast Furnances, BulletinNo. 474 (Dcc. 1938), P. 5. The data relate to 21 to 60 merchant plants. The figure for1927 covers the first 6 months only.
WROUGHT PIPE, not elsewhere made
Employment per Man- ManhoursEmployment Unit hours per Unit
Wage Wage Wage EarnersTear Output Earners Total* Earners Total* (ESTIMATE A)
1925 77 95 94 124 122 ..1927 68 97 95 142 139 ..1929 100 100 100 100 100 ..
..1931 63 70 .. 112 ..1933 31 57 57 183 182 ..1935 56 94 92 168 165 ..1937 91 124 119 136 131 100 1001939 54 73 73 135 134 62 103
* Excludes nonfactory personnel, 1935—39. The following indexes (1929:100) coverall personnel: 1935 1937 1939
Employment 93 119 75Employment per unit 167 131 139

BASIC INDEXES 315
STEEL-MILL PRODUCTSa
Employment per Man- ManhoursEmployment Unit hours per Unit
Wage Wage Wage Earnersrear Output Earners Total* Earners Total* (ESTIMATE A)
1869 1.9 10 .. 544 .. ..1879 4.4 21 .. 470 .. ..1889 10 29 .. • 279 .. ..1899 24 46 .. 197 .. ..1904 29 53 50 181 173 ..1909 43 61 59 140 136 74 1661914 44 63 62 144 142 ..1919 63 95 96 150 151 ..1921 38 60 61 157 161 ..1923 81 98 97 122 120 ..1925 82 94 94 115 115 ..1927 81 92 92 113 114 ..1929 100 100 100 100 100 ..1931 47 67 .. 142 .. ..1933 43 70 70 163 162 52 1181935 64 91 90 144 142 71 1081937 97 121 120 125 124 100 1001939 86 101 101 117 118 78 87
* Excludes nonfactory personnel, 1935—39. The following indexes (1929:100) coverall personnel: 1935 1937 1939
Employment 91 122 104Employment per unit 143 125 121
a For fuller indexes on manhours and manhours per unit see the combination blast-furnace and steel-mill poducts.
TIN CANS and TINWARE, not elsewhere classified
Employment per Man- ManhoursEmployment Unit hours per Unit
Wage Wage Wage EarnersTear Output Earners Total* Earners Total* (ESTIMATE A)
1927 87 94 94 108 108 ..1929 100 100 100 100 100 ..1931 92 80 .. 88 .. .
1933 94 74 4 78 78 ..1935 119 87 90 73 75 81 1091937 160 105 109 66 68 100 1001939 165 101 104 61 63 93 90
* Excludes nonfactory personnel, 1935—39. The following indexes (1929:100) coverall personnel: 1935 1937 1939
Employment 91 111 108Employment per unit 76 69 65

BLAST-FURNACE and STEEL-MILL
Employment per Man- Manhours Man- ManhoursEmployment Unit hours per Unit hours per Unit
Wage Wage Wage Earners Wage EarnersTear Output Earners Total* Earners Total* (ESTIMATE A) (EsrIMAm B) -
1899 25 53 .. 215 .. .. .. ..1904 30 58 55 193 184 .. ..1909 45 66 65 147 144 84 187
1914 45 66 65 148 146 .. .. 69 153
1919 64 100 100 156 157 ..
1921 38 61 62 159 164 .. 60 157
1923 82 101 100 123 122 107 130 106 130
1925 82 95 96 116 116 95 116 93 113
1927 81 93 93 114 114 92 113 90 110
1929 100 100 100, 100 100 100 100 100 100
1931 47 66 .. 141 .. 51 108 52 112
1933 42 69 68 164 163 49 117 43 101
1935 62 89 88 144 142 66 107 56 89
1937 96 120 119 125 124 94 98 80 83
1939 85 100 100 117 118 73 85 63 74
* Excludes nonfactory personnel, 1935—39. The following indexes (1929:100) coverall personnel: 1935 1937 1939
Employment 89 120 103Employment per unit 143 125 120
a Combination of two industries, blast-furnace products and steel-mill products. Full dataon hours of labor are not available for these separately.
WIRE, not elsewhere made
Employment per Man- ManhoursEmployment Unit hours per Unit
Wage Wage Wage EarnersTear Output Earners Total* Earners Total* (ESTIMATE A)
1909 66 80 79 121 118 109 146
1914 64 78 78 122 1221919 69 88 88 127 127
1921 51 66 67 130 132
1923 97 95 93 98 96
1925 92 83 84 90 91
1927 98 88 89 90 901929a 100 100 100 100 100
1931 50 64 .. 1301933 46 65 67 140 144
1935 67 96 97 143 144
1937 90 109 111 122 124 100 100
1939 91 98 100 108 110 91 90
* Excludes nonfactory personnel, 1935—39. The following indexes (1929:100) coverall personnel: 1935 1937 1939
Employment 100 112 104Employment per unit 148 125 115
a Between 1927 and 1929 certain large establishments engaged primarily in rollingnonferrous metal and manufacturing nonferrous wire were transferred from wire,n.e.m., to products, n.e.c. In addition, a somewhat different method ofhandling data on the custom drawing of nonferrous wire was adopted in that year.
316

TOTAL IRON and STEEL PRODUCTS
Employment Employment per UnitTear Output Wage Earners Total* Wage Earners
1899 21 47 .. 2251904 29 55 .. 1901909 44 67 .. 1531914 48 70 69 144 142
1919 59 96 97 164 164
1921 46 64 66 141 144
1923 84 100 99 119 117
1925 87 96 96 110 110
1927 87 94 94 108 108
1929 100 100 100 100 100
1931 54 68 125
1933 45 63 63 140 140
1935 61 82 82 134 133
1937 89 109 108 122 121
1939 82 93 92 113 112
* Excludes nonfactory personnel, 1935—39. The following indexes (1929:100) coverall personnel: 1935 1937 1939
Employment 83 109 96Employment per unit 136 122 117
NONFERROUS-METAL PRODUCTS
PRIMARY NONFERROUS
Employment per Man- ManhoursEmployment Unit hours per Unit
Wage Wage Wage EarnersTear Output Earners Total* Earners Total* (ESTIMATE A)
1899 25 79 .. 3181904 22 87 81 396 3681909 49 96 91 196 1861914 57 112 107 197 1891919 64 121 118 189 1841921 39 60 60 154 1541923 75 113 111 151 1481925 85 106 104 125 1221927 89 98 97 111 1101929 100 100 100 100 1001931 53 60 .. 1121933 37 47 47 127 1281935 52 73 72 140 140 71 1071937 78 96 96 124 123 100 1001939 72 81 81 113 113 79 85
* Excludes nonfactory personnel, 1935—39. The following indexes (1929:100) cover
all personnel: 1935 1937 1939Employment 72 96 85Employment per unit 140 123 119
a Combination of three industries, copper, lead, and zin€. Data for 1939 are not avail-able for these separately.
317

)318
COPPERB
APPENDIX F
Tear Output
EmploymentWage
Earners Total*
Employment perUnit
WageEarners Total*
Man- Manhourshours per UnitWage Earners(ESTIMATh A)
1899 22 78 .. 361 .. ..1904 31 88 82 282 264 ..1909 47 107 102 230 218 131 226
1914 52 122 118 235 229 ..1919 60 119 119 199 198 ..1921 34 57 59 167 173 ..1923 69 115 117 168 171 ..1925 78 107 104 137 134 ..1927 82 96 95 116 115 ..1929 100 100 100 100 100 ..1931 54 59 .. 110 .. ..1933 30 38 40 129 133 ..1935 48 72 72 149 149 ..1937 80 100 99 124 124 100 100
* Excludes nonfactory personnel, 1935—37. The following indexes (1929:100) coverall personnel: 1935
72EmploymentEmployment per unit 149 124
a For 1939 indexes see the combination primary nonferrous metals.
SECONDARY METALS,COLLAPSIBLE TUBES
Employment per
rear Output
EmploymentWage
Earners Total*
UnitWage
Earners
1925 94 107 .. 1141927 103 109 110 106 107
1929 100 100 100 100 1001931 102 95 .. 931933 108 96 97 89 901935 110 108 109 98 991937 124 109 110 88 891939 126 106 108 85 86
NONPRECIOUS
Employment.
Output
EmploymentWageEarners Total*
per UnitWage
Earners Total*
78 71 74 91 9584 67 70 80 84
100 100 100 100 10058 64 .. 11067 71 74 105 11087 91 94 105 109
124 120 122 97 98100 87 88 87 88
* Excludes nonfactory personnel, 1935—39. The following indexes (1929:100) coverall personnel:
Collapsible tubes Employment 109Employment per unit
1935 1937 1939
Employment per unit 111 99 96
193799
Secondary metals, nonprecious Employment10097
11089123
1128996
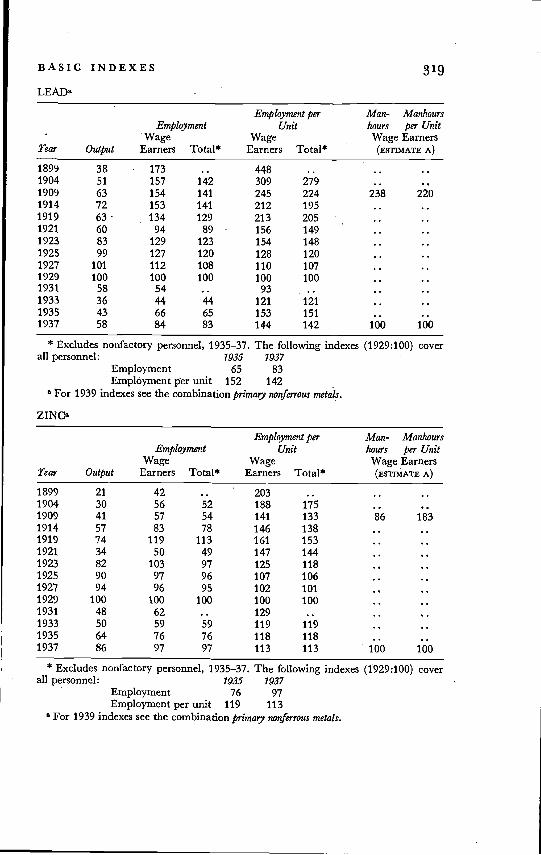
BASIC INDEXES 319
LEADa
Employment per Man- ManhoursEmployment Unit hours per Unit
Wage Wage Wage Earnersrear Output Earners Total* Earners Total* (ESTIMATE A)
1899 38 173 .. 448 .. ..1904 51 157 142 309 279 ..1909 63 154 141 245 224 238 2201914 72 153 141 212 195 ..1919 63 - 134 129 213 205 ..1921 60 94 89 - 156 149 ..1923 83 129 123 154 148 ..1925 99 127 120 128 120 ..1927 101 112 108 110 107 ..1929 100 100 100 100 100 ..1931 58 54 .. 93 S ..1933 36 44 44 121 121 ..1935 43 66 65 153 151 ..1937 58 84 83 144 142 100 100
* Excludes nonfactory personnel, 1935—37. The following indexes (1929:100) coverall personnel: 1935 1937 .
Employment 65 83Employment per unit 152 142
For 1939 indexes see the combination primary nonferrous metals.
ZINCa
Employment per Man- ManhoursEmployment Unit hours per Unit
Wage Wage Wage EarnersTear Output Earners Total* Earners Total* (ESTIMATE A)
1899 21 42 .. 203 .. ..1904 30 56 52 188 175 ..1909 41 57 54 141 133 86 1831914 57 83 78 146 138 ..1919 74 119 113 161 153 ..1921 34 50 49 147 144 ..1923 82 103 97 125 118 ..1925 90 97 96 107 106 ..1927 94 96 95 102 101 ..1929 100 100 100 100 100 ..1931 48 62 .. 129 .. ..1933 50 59 59 119 119 ..1935 64 76 76 118 118 ..1937 86 97 97 113 113 100 100
* Excludes nonfactory personnel, 1935—37. The following indexes (1929:100) coverall personnel: 1935 1937
Employment 76 97
Employment per unit 119 113a For 1939 indexes see the combination primary nonferrous metals.

320 APPENDIX F
CLQCKS, WATCHES and MATERIALS
Employment perEmployment Unit
Wage WageTear Output Earners Total* Earners Total*
Man- Manhourshours per UnitWage Earners
(ESTIMATE A)
1927 113 105 103 92 91 ..1929 100 100 100 100 1001931 64 76 .. 119
..
..1933 48 60 60 124 124 52 1481935 78 84 85 108 109 76 1371937 139 108 108 78 77
1939 114 83 82 73 72
100 100
72 88
* Excludes nonfactory personnel, 1935—39. The following indexes (1929:100) coverall personnel: 1935 1937 1939
Employment 86 109 89Employment per unit 111 78 78
NONFERROUS-METAL PRODUCTS, not elsewhere classified
Employment perEmployment Unit
Wage WageYear Output Earners Total* Earners Total*
Man- Manhourshours per UnitWage Earners
(ESTIMATE A)
1925 70 82 81 117 116 ..1927 72 83 83 116 116 ..1929a 100 100 100 100 100 ..1931 59, 62 .. 105 .. ..1933 43 60 61 140 141 52 106
1935 62 79 80 129 130 75 108
1937 88 105 104 118 117 100 100
1939 90 93 92 103 103 90 89
* Excludes nonfactory personnel, 1935—39. The following indexes (1929:100) coverall personnel: 1935 1937 1939
Employment 82 104 98Employment per unit 132 117 109
a Between 1927 and 1929 certain large establishments engaged primarily in rollingnonferrous metal and manufacturing nonferrous wire were transferred from wire,n.e.m., to nonferrous-metal products, n.e.c. In addition, a somewhat different method ofhandling data on the custom drawing of nonferrous wire was adopted in that year.
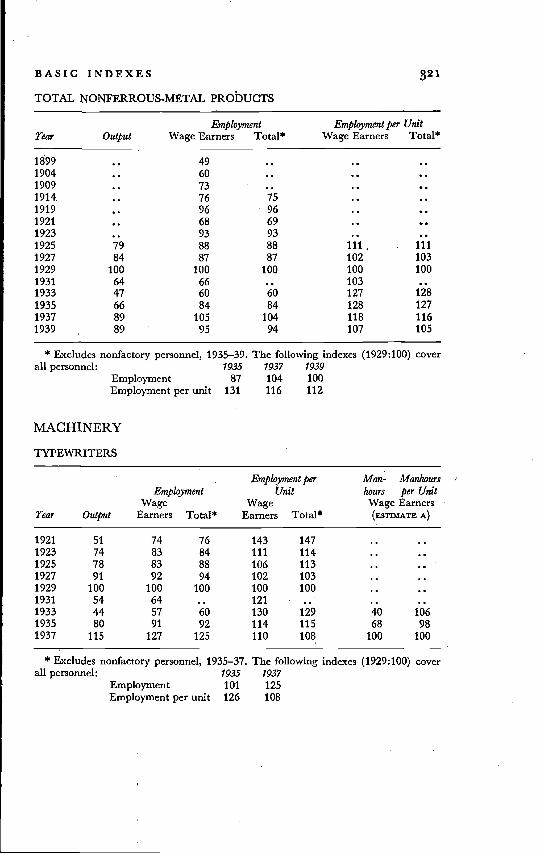
BASIC INDEXES 321
TOTAL NONFERROUS-METAL PRODUCTS
EmploymTear Output Wage Earners
ent Employment per UnitTotal* Wage Earners Total*
1899 . . 49 . . . . .
1904 . . 60 . . . . .
1909 . . 73 . . . . .1914, .. 76 75 ..1919 .. 96 961921 .. 68 691923 .. 93 93 ..1925 79 88 88 111, 1111927 84 87 87 102 1031929 100 100 100 100 1001931 64 66 1031933 47 60 60 127 1281935 66 84 84 128 1271937 89 105 104 118 1161939 89 95 94 107 105
* Excludes nonfactory personnel, 1935—39. The following indexes (1929:100) coverall 1935 1937 1939
Employment 87 104 100Employment per unit 131 116 112
MACHINERY
TYPEWRITERS S
Employment per Man- ManhoursEmployment Unit hours per Unit
Wage Wage Wage EarnersTear Output Earners Total* Earners Total* (ESTIMATE A)
1921 51 .74 76 143 147 .. ..1923 74 83 84 111 114 .. ..1925 78 83 88 106 113 .. .. .
1927 91 92 94 102 103 .. ..1929 100 100 100 100 100 .. ..1931 54 64 .. 121 • .. .. ..1933 44 57 60 130 129 40 1061935 80 91 92 114 115 68 981937 115 127 125 110 108 100 100
* Excludes nonfactory personnel, 1935—37. The following indexes (1929:100) coverall personnel: 1935 1937
Employment 101 125Employment per unit 126 108

322 APPENDIX F
AGRICULTURAL
Employment per Man- ManhoursEmployment Unit hours per Unit
Wage Wage Wage Earnersrear Output Earners Total Earners Total (ESTIMATE A)
1921 68 73 80 107 116 61 89
1923 64 74 77 117 121 74 1171925 61 69 72 113 117 69 113
1927 73 80 81 110 112 79 109
1929 100 100 100 100 100 100 100
1931 30 42 .. 138 .. 30 99
a Owing to a serious change in the definition of the industry between 1931 and 1933no indexes are given for 1933—37.
PHONOGRAPHS
Employment Employment per Unitrear Output Wage Earners Total Wage Earners Total
1899 8.3 8.8 .. 1061904 .. 24 241909 29 36 35 123 121
1914 38 65 68 172 180
1919 182 199 202 110 112
1921 80 124 130 154 162
1923 105 142 138 136 132
1925 80 78 79 97 98
1927 114 99 98 87 86
1929 100 100 100 100 100
SCALES and BALANCES
Employment Employment per UnitTear Output Wage Earners Total* Wage Earners Total*
1927 83 95 96 115 116
1929 100 100 100 100 100
1931 60 68 .. 1131933 35 53 57 153 164
1935 62 60 63 97 1021937 87 80 80 92 92
* Excludes nonfactory personnel, 1935—37. The following indexes (1929:100) coverall personnel: 1935 1937
Employment 71 82Employment per unit 115 94
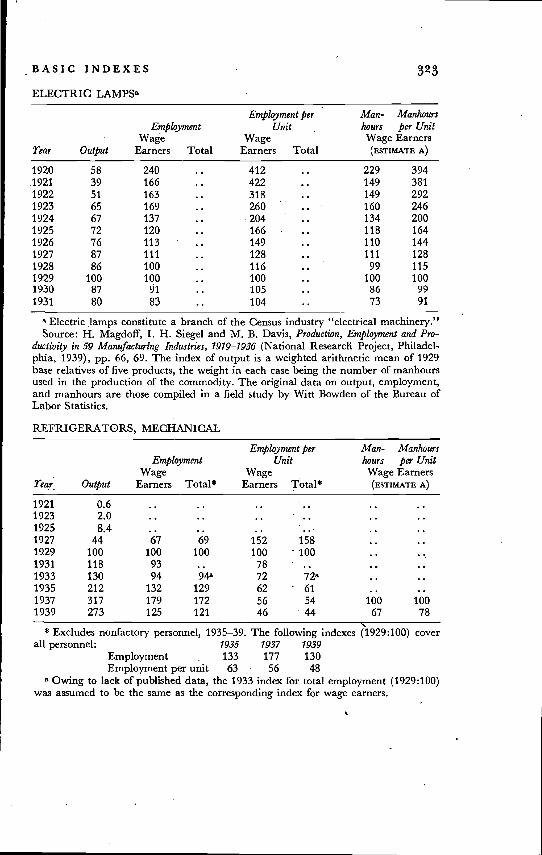
BASIC INDEXES
ELECTRIC
323
Employment per Man- ManhoursEmployment Unit hours per Unit
Wage Wage Wage EarnersTea, Output Earners Total Earners Total (ESTIMATE A)
1920 58 240 .. 412 .. 229 394.1921 39 166 .. 422 .. 149 381
1922 51 163 .. 318 .. 149 292
1923 65 169 .. 260 .. 160 246
1924 67 137 .. • 204 .. 134 200
1925 72 120 .. 166 .. 118 164
1926 76 113 .. 149 .. 110 144
1927 87 111 .. 128 .. 111 128
1928 86 100 .. 116 .. 99 1151929 100 100 .. 100 .. 100 1001930 87 91 .. 105 .. 86 99
1931 80 83 .. 104 .. 73 91
Electric lamps constitute a branch of the Census industry "electrical machinery. ,,
Source: H. Magdoff, I. H. Siegel and M. B. Davis, Production, Employment and Pro-ductivity in 59 Manufacturing Industries, 1919—7936 (National Research Project, Philadel-phia, 1939), pp. 66, 69. The index of output is a weighted arithmetic mean of 1929base relatives of five products, the weight in each case being the number of manhoursused in the production of the commodity. The original data on output, employment,and manhours are those compiled in a field study by Witt Bowden of the Bureau ofLabor Statistics.
REFRIGERATORS, MECHANICAL
Employment per Man- Manhours. Employment Unit hours per Unit
Wage Wage Wage EarnersTear Output Earners Total* Earners Total* (ESTIMATE A) •
1921 0.6 .. .. .. .... ..1923 2.0 .. .. .. .. ..1925 8.4 .. .. .. . . ..1927 44 67 69 152 158 ..19.29 100 100 100 100 100 ..1931 118 93 .. 78 .. ..1933 130 94 94a 72 72a
1935 212 132 129 62 61 ..1937 317 179 172 56 54 100 1001939 273 125 121 46 44 67 78
"* Excludes nonfactory personnel, 1935—39. The following indexes (1929:100) cover
all personnel: 1935 1937 1939Employment . 133Employment per unit 63 56 48
a Owing to lack of published data, the 1933 index for total employment (1929:100)was assumed to be the same as the corresponding index for wage earners.
177 130
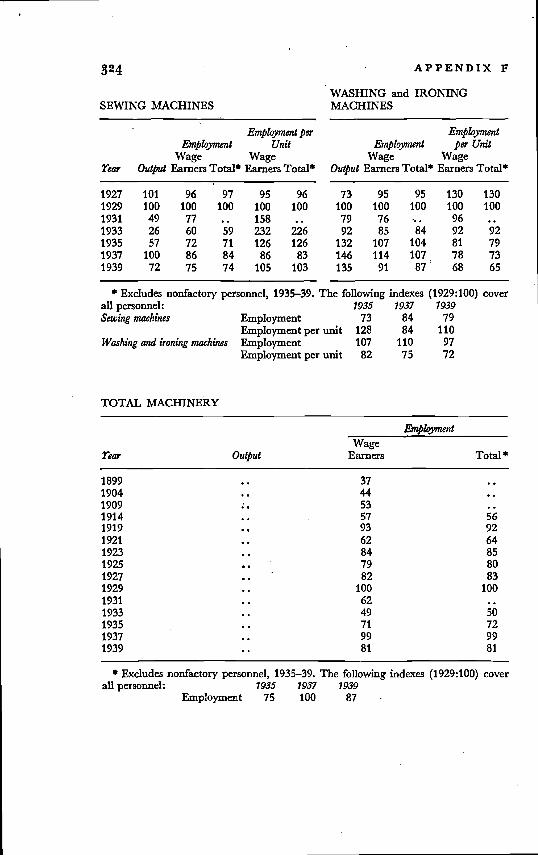
TOTAL MACHINERY
EmploymentEmployment per unitEmploymentEmployment per unit
APPENDIX F
WASHING and IRONING
The following1935 1937 1939
75 100 87
SEWING MACHINES MACHINES
.
Employment perEmployment Unit
Wage WageTear Output Earners Total Earners Total*
1927 101 96 97 95 961929 100 100 100 100 1001931 49 77 .. 1581933 26 60 59 232 2261935 57 72 71 126 1261937 100 86 84 86 831939 72 75 74 105 103
Employment
Output
EmploymentWage
Earners Total*
per UnitWage
Earners Total*
73 95 95 130 130100 100 100 100 10079 76 •.. 9692 85 84 92 92
132 107 104 81 79146 114 107 78 73135 91 87 68 65
* Excludes nonfactory personnel, 1935—39. The followLngall personnel:Sewing machines
Woshing and ironing machines
indexes1935 1937
73 84
cover(1929:100)1939
79128 84 110107 110 97
82 75 72
Tear Output
Employment
- WageEarners Total *
1899 .. 37 ..1904 .. 44 ..1909 .. 53 ..1914 .. 57 561919 .. 93 921921 .. 62 641923 .. 84 851925 .. 79 801927 .. 82 .831929 .. 100 1001931 .. 62 ..1933 .. 49 5019351937
..
..7199
7299
1939 .. 81 81
all personnel:* Excludes nonfactory personnel, 1935—39.
Employment
indexes (1929:100) cover

BASIC INDEXES 325
TRANSPORTATION EQUIPMENT
AUTOMOBILES, mci. BODIES and PARTS
Employment per Man- Manhours Man- ManhoursEmployment Unit hours per Unit hours per Unit
Wage Wage Wage Earners Wage EarnersTear Outputa Earners Total* Earners Total* A) (ESTIMATE B)
1899 0.05 0.50 .. 1,000 .. .. ..1904 0.25 2.7 2.7 1,080 1,070 .. .. ..1909 1.8 17 17 939 956 21 1,160 ..1914 8.5 28 29 334 346 .. .. 31 367
1919 28 77 80 272 283 .. .. ..1921 25 48 50 194 204 .. .. 46 185
1923 63 90 91 144 145 100 158 92 1.46
1925 72 95 96 132 133 101 141 96 134
1927 63 83 84 131 133 84 134 82 130
1929 100 100 100 100 100 100 100 100 100
1931 44 64 .. 145 .. 53 120 50 114
1933 35 54 55 154 157 45 127 42 119
1935 74 87 86 117 116 78 106 69 94
1937 90 107 107 119 119 90 100 81 90
1939 67 84 85 124 126 70 104 62 93
* Excludes nonfactory personnel, 1935—39. The following indexes (1929:100) coverall personnel: . 1935 1937 1939
Employment 87 108 87Employment per unit 118 120 130
a In the computation of this index only finished automobiles and chassis were con-sidered. Bodies and parts were not included because no separate data for replacementbodies and parts are available; replacement bodies and parts are combined with apercentage, unknown and varying, of the bodies and parts used in the manufactureof new automobiles. The omission from the index of replacement bodies and partsprobably results in an understatement of the long-term growth of the industry, andan exaggeration of the cyclical fluctuations of the index of output.
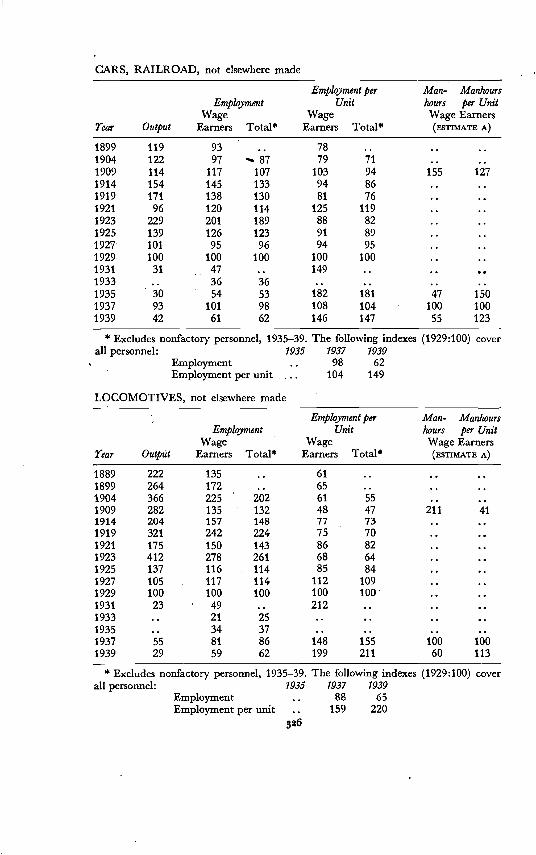
CARS, RAILROAD, not elsewhere made
Employment per Man- ManhoursEmployment Unit hours per Unit
Wage Wage Wage EarnersTear Output Earners Total* Earners Total* A)
1899 119 93 .. 78 .. ..1904 122 97 87 79 71 ..1909 114 117 107 103 94 155 1271914 154 145 133 94 86 ..1919 171 138 130 81 76 ..1921 96 120 114 125 119 ..1923 229 201 189 88 82 ..1925 139 126 123 91 89 ..1927 101 95 96 94 95 ..1929 100 100 100 100 100 ..1931 31 47 .. 149 .. ..1933 .. 36 36 .. .. ..1935 30 54 53 182 181 47 1501937 93 101 98 108 104 100 1001939 42 61 62 146 147 55 123
* Excludes nonfactory personnel, 1935—39. The following indexes (1929:100) coverall personnel: 1935 1937 1939
Employment .. 98 62• Employment per unit ... 104 149
LOCOMOTIVES, not elsewhere made
• Employment per Man- ManhoursEmployment Unit hours per Unit
Wage Wage Wage EarnersTear Output Earners Total* Earners Total* (ESTIMATE A)
1889 222 135 .. 61 .. ..1899 264 172 65 .. ..1904 366 225 202 61 55 ..1909 282 135 132 48 47 211 411914 204 157 148 77 73 ..1919 321 242 224 75 70 ..1921 175 150 143 86 82 ..1923 412 278 261 68 64 ..1925 137 116 •. 114 85 84 ..1927 105 117 114 112 109 ..1929 100 100 100 100 100 ..1931 23 49 .. 212 .. .. ..1933 .. 21 25 .. .. ..1935 .. 34 37 .. .. ..1937 55 81 86 148 155 100 1001939 29 59 62 199 211 60 113
* Excludes nonfactory personnel, 1935—39. The following indexes (1929:100) coverall personnel: 1935 1937 1939
Employment .. 88 65Employment per unit .. 159 220
326
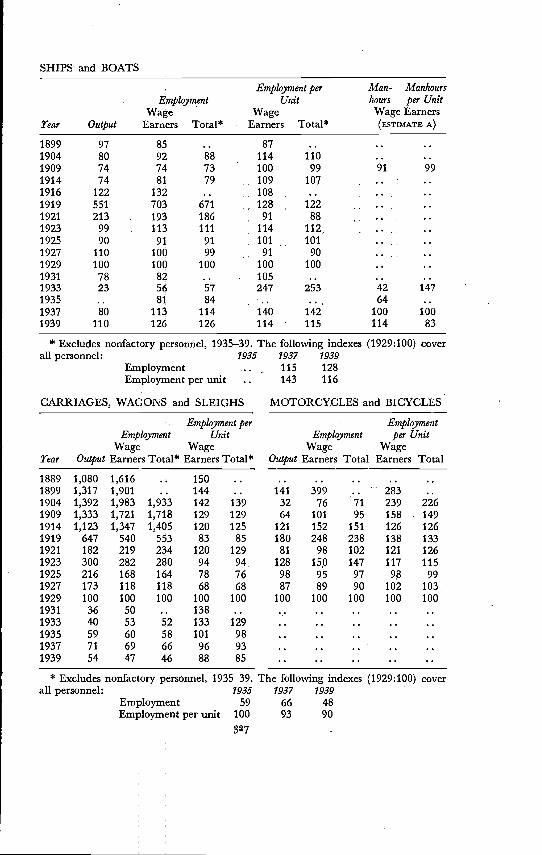
SHIPS and BOATS
EmploymentEmployment per unit
Employment perEmployment Unit
Wage WageTear Output Earners Total* Earners Total*
1889 1,080 1,616 .. 1501899 1,317 1,901 .. 144
1904 1,392 1,983 1,933 142 139
1909 1,333 1,721 1,718 129 1291914 1,123 1,347 1,405 120 125
1919 647 540 553 83 85
1921 182 219 234 120 129
1923 300 282 280 94 94.
1925 216 168 164 78 76.
1927 173 118 118 68 68
1929 100 100 100 100 100
1931 36 50 .. 138
1933 40 53 52 133 129
1935 59 60 58 101 98
1937 71 69 66 96 93
1939 54 47 46 88 85
. Employment. Employment per Unit
Wage WageOutput Earners Total Earners Total
141 399 .. 28332 76 71 239 226
64 101 95 158 149121 152 151 126 126
180 248 238 138 133
81 98 102 121 126128 150 147 117 115
98 95 97 98 9987 89 90 102 103,
100 100 100 100 100
Employment per Man-. Manhours. Employment
WageUnit
Wagehours per UnitWage Earners
Tear Output Earners Total*. Earners Total* (ESTIMATE A)
1899 97 85 .. 87 .. ..1904 80 92 88 114 110 ..1909 74 74 73 100 99 91 991914 74 81 79 109 107, • ..1916 122 132 .. . 108 .. ..1919 551 703 671 128 . 122 •. .. .
1921 213 . 193 186 91 88 ,. ..1923 99 113 111 114 , .
1925 90 91 91 101 ., 101. ..1927 110 100 99 91 90 ..1929 100 100 100 100 100 ..1931 78 82 . 105 .. ..1933 23 56 57 247 253 42 147
1935 .. 81 84 64
1937 80 113 114 140 142 100 100
1939 110 126 126 114 115 114 83
* Excludes nonfactory personnel, 1935—39all personnel:
CARRIAGES, WAGONS and SLEIGHS
The following indexes (1929:100) cover1935 1937 1939
115 128
143 116
MOTORCYCLES and BICYCLES
* Excludes nonfactory personnel, 1935—39. The following indexesall personnel: 1935 1937 1939
Employment 59 66 48Employment per unit 100 93 90
827
(1929:100) cover

328 S APPENDIX F
TOTAL TRANSPORTATION
indexes193773
103 8283 109
116 120
(1929:100)
1939
637195
127
Employment
Output
EmploymentWageEarners Total*
per UnitWageEarners Total*
100 100 100 100 100
83 86 .. 103
.t 67 71 ..144 82 85 57 59
221 94 96 43 44
225 74 73 33 32
The following indexes (1929:100) cover1935 1937 1939
79 78 78
59 61 6691 97 91
Employment per unit 63 44 40
CARRIAGES and SLEDS, CHILDREN'S EQUIPMENT
Employment per
Tear Output
EmploymentWage
Earners Total*
UnitWage
Earners Total*
1899 .. .. .. ..1904 . . . . . . . . .
1909 . . . . * . . .1914 . . . . - . .
1919 .. .. .. ..1921 .. .. .. ..1923 .. .. ..1925 92 98 98 106 106
1927 90 99 99 110 110
1929 100 100 100 100 100
1931 71 59 .. 82
1933 59 56 55 95 941935 70 69 69 98 98
1937 89 74 73 83 82
1939 89 61 60 69 68
Employment
•
Output
EmploymentWageEarners Total*
per UnitWageEarners Total*
7.3 34 .. 4667.5 36 35 481 472
ii 44 44 411 41320 53 54 262 26661 147 145 241 23838 69 70 183 18676 104 103 138 13776 96 96 126 12768 85 86 126 127
100 100 100 100 10046 64 .. 14033 53 53 158 16072 82 82 115 11491 108 108 119 11974 91 92 122 124
* Excludes nonfactory personnel, 1935—39. The followingall personnel: 1935Carriages and sleds, children's Employment 72
Employment per unitTotal transportation equipment Employment
Employment per unit
MISCELLANEOUS PRODUCTS
PENCILS
cover
PENS and POINTS
Employment per
Tear Output
EmploymentWageEarners Total*
UnitWage
Earners Total*
1929 100 100 100 100 1001931 74. 61 .. 821933 .. 61 57 ..1935 134 78 73 58 541937 130 87 78 67 601939 118 74 68 63 57
* Excludes nonfactory personnel, 1935—39.all personnel:Pencils Employment
Employment per unitPens and points Employment
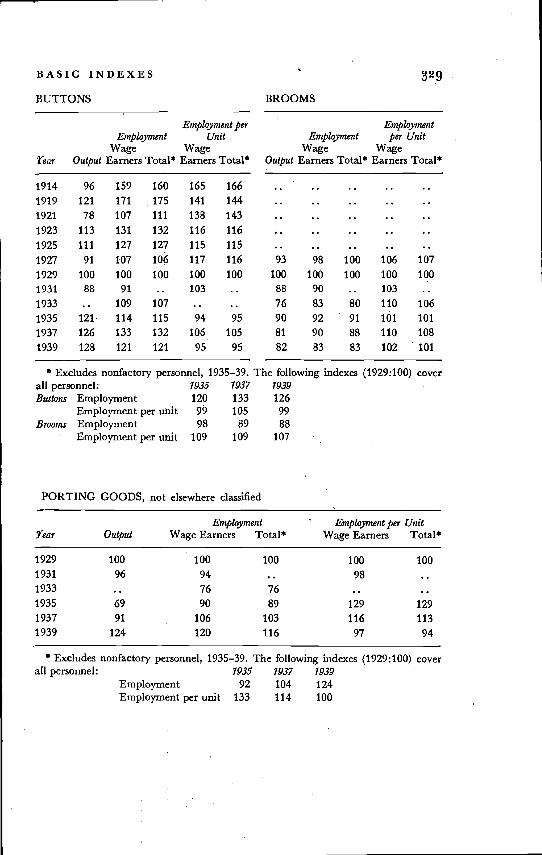
INDEXES 329
BUTTONS
Employment per
rear Output
EmploymentWage
Earners Totalt
UnitWage
Earners Totalt
1914 96 159 160 165 166
1919 121 171 175 141 144
1921 78 107 111. 138 143
1923 113 131 132 116 116
1925 111 127 127 115 115
1927 91 107 106 117 116
1929 100 100 100 100 100
1931 88 91 .. 103
1933 .. 109 107 ..1935 121 114 115 94 95
1937 126 133 132 106 105
1939 128 121 121 95 95
BROOMS
Employment
Output
EmploymentWage
Earners Totalt
per UnitWage
Earners Totalt
.. .. ..
93 98 100 106 107
100 100 100 100 1DO
88 90 .. 103
76 83 80 110 106
90 92 91 101 101
81 90 88 110 108
82 83 83 102 101
* Excludes nonfactory personnel, 1935—39. The following indexes (1929:100) coverall personnel :Buttons Employment
Employment per unitBrooms Employment
Employment per unit
1935 1937 1939
120 133 12699 105 •99
98 89 88109 109 107
PORTING GOODS, not elsewhere classified
Tear OutputEmployment
Wage Earners TotaltEmployment per
Wage EarnersUnitTotalt
1929 100 100 100 100 1001931 96 94 .. 98 ..1933 .. 76 76 .. ..1935 69 90 89 129 1291937 91 106 103 116 1131939 124 120 116 97 94
* Excludes nonfactory personnel, 1935—39. The following indexes (1929:100) coverall personnel: 1935 1937 1939
Employment 92 104 124Employment per unit 133 114 100

330 APPENDIX F
33
10742 58 54
87 83
TOTAL MISCELLANEOUS PRODUCTS
Employment
Wagerear Output Earners Total *
1899 .. 46 ..1904 .. 60 ..1909 .. 79 . ..1914 .. 92 901919 .. 112 1121921 .. 86 87
1923 .. 109 ' 108
1925.
.. 104 103
1927 .. 105 105
1929 .. . 100 100
1931 .. 72 ..1933 .: 64 641935 .. 79 80
1937 . .. 96 951939 .. 96 93
* Excludes nonfactory personnel, 1935—39. The following indexes (1929;100) coverall personnel: 1935 1937 1939
Employment 84 97 102
ORGANS PIANOS
Employment per
rear Output
EmploymentWage
Earners Total*
UnitWage
Earners Total*
1904 168 151 145 90 861909 124 100 99 80 791914 130 128 126 9.8 971919 92 81 82 88 891921 125 98 98 78 781923 96 78 80 81 841925 104 103 102 99 981927 125 116 114 93 911929 100 100 100 100 1001931 54 61 .. 1131933 .. 24 27 ..1935 31 26 28 83 901937 .. .. .. ..1939 .. .. .. ..
. Employment
Output
EmploymentWage
Earners Total*
per UnitWage
Earners
114 211 208 185 183156 256 255 164 163156 239 241 153 154189 230 231 122 122128 159 160 124 125210 223 216 106 103198 201 197 102 100151 166 165 110 110100 100 100 100 10043 48 .. 110.. 27 27 ..40 41 41 104 10566 57 56 87 8665 53 52 82 80
* Excludes nonfactory personnel, 1935—39,all personnel:Organs Employment
Employment per unitPianos Employment
1935 1937 1939
The following indexes (1929:100) cover
Employment per unit 106
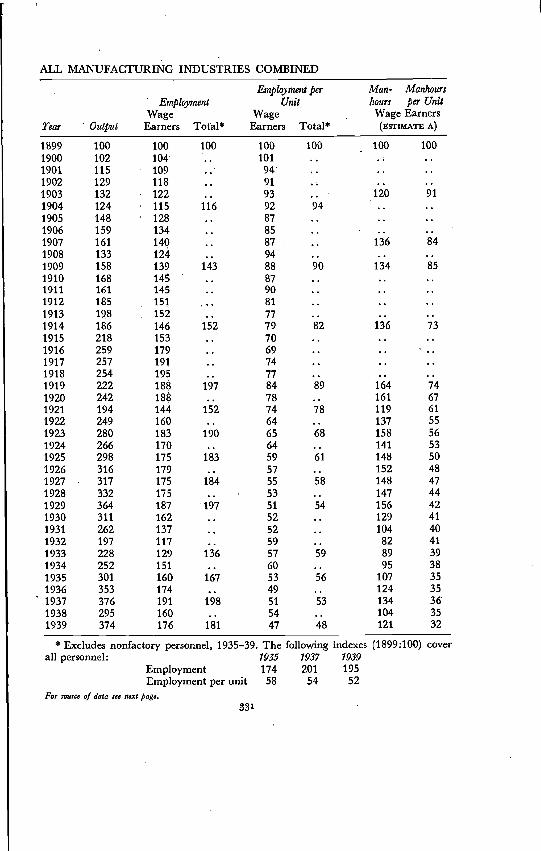
ALL MANUFACTURING INDUSTRIES COMBINED
•
Year Output
EmploymentWage
Earners Totàl*
Employment perUnit
WageEarners Total*
Man- Manhourshours per UnitWage Earners
(ESTIMATE A)
1899 100 100 100 100 100 100 100
1900 102 104 101
1901 115 109 94
1902 129 118 91
1903 132 122 93 120 91
1904 124 115 116 92 94
1905 148 128 87
1906 159 134 85
1907 161 140 87 136 84
1908 133 124 .. 941909 158 139 143 88 90 134 85
1910 168 145 87
1911 161 145 90
1912 185 151 81
1913 1.8 152 .. 771914 186 146 152 79 82 136 73
1915 218 153 70
1916 259 179 69
1917 257 191 74
1918 254 195 77
1919 222 188 197 84 89 164 74
1920 242 188 .. 78 161 67
1921 194 144 152 74 78 119 6!
1922 249 160 64 137 55
1923 280 183 190 65 68 158 56
1924 266 170 .. 64 .. 141 53
1925 298 175 183 59 61 148 50
1926 316 179 57 152 48
1927 317 175 184 55 58 148 47
1928 332 175 53 147 44
1929 364 187 197 51 54 156 42
1930 311 162 52 129 41
1931 262 137 52 104 40
1932 197 117 59 82 41
1933 228 129 136 57 59 89 39
1934 252 151 .. 60 95 38
1935 301 160 167 53 56 107 35
1936 353 174 49 124 35
1937 376 191 198 51 53 13436
1938 295 160 54 .. 104 35
1939 374 176 181 47 48 121 32
* Excludes nonfactory personnel, 1935—39. The following indexes (1899:100) coverall personnel: 1935 1937 1939
Employment 174 201 195Employment per unit 58 54 52
For source of data see next pare.33'

S32 APPENDIX F
Source of data: See Explanatory Note (p. 261) for the sources of data for Census years.The intercensal indexes of output are based on various sources (see The Output ojManufacturing Industries, 1899—1937, p. 44); the index for 1938 is based on the FederalReserve index (see current issues of the Federal Reserve Bulletin). The intercensal indexesof employment are based on samples collected by several states and by the U. S.Bureau of Labor Statistics—for 1899—1919, see P. H. Douglas, Real Wages in the UnitedStates, 1890—1925; and for 19 19—39, see the summary prepared by theBureau of Labor Statistics. The index of hours used in computing the index of man-hours is based on the B.L.S. series on actual hours for 1909—39; estimates for earlieryears have been computed by extrapolating this series by the series on full-time hoursderived from the Department of Commerce and Labor—B.L.S. data by P. H. Douglas(see Appendix C).