
Retracing the contours of the early angiosperm environmental ...

Neuropsychologia 40 (2002) 479–491
Electrophysiological indexes of illusory contours perception inhumans
Alice Mado Proverbio a,*, Alberto Zani b
a Department of Psychology, Laboratory of Cogniti�e Electrophysiology, Uni�ersity of Trieste, Via S. Anastasio 12, 34134 Trieste, Italyb Electro-Functional Brain Imaging Unit, Institute of Neuroscience and Bioimaging, Consiglio Nazionale delle Ricerche, Via Fratelli Cer�i 93,
20090 Segrate, Milan, Italy
Received 18 December 2000; accepted 19 June 2001
Abstract
The present study investigated brain mechanisms underlying the perception of illusory contours, using recordings ofevent-related potentials of the brain (ERPs) in right-handed individuals. Forty different stimuli were presented randomly 1600times in foveal vision; twenty of them produced the perception of illusory contours of a Kanizsa square, the remaining wereobtained rotating outwards the inducers and they did not produce any illusory percept. Half of them had white inducers on ablack background and vice versa; half of them were symmetrical and the other half asymmetrical. In lateral occipital areas illusorypercepts produced larger evoked responses starting as early as 145 ms post-stimulus with the N1 peak. ERP data did not provideevidence of right-sided lateralisation of the processes underlying illusory contours formation at sensory level, as suggested by someneuroimaging and neuropsychological studies. The two cerebral hemispheres were differently activated while the subjectivepatterns formation progressed through neural processing stages. Indeed, brain response to illusory contours was more pronouncedin the left occipital area at N2 component level (about 250 ms post-stimulus) and at right parietal sites at the latency of P300component. Both background luminance and stimulus symmetry interacted with illusory boundaries formation. Present resultsconfirm the hypothesis that the integration of contours arises at early stages of visual processing and highlight the primary roleof edges continuity and boundary alignment in illusory contours perception. © 2001 Elsevier Science Ltd. All rights reserved.
Keywords: Event-related potentials (ERPs); Vision; Perception; Subjective figures; Kanizsa square; Hemispheric asymmetry
www.elsevier.com/locate/neuropsychologia
1. Introduction
Illusory contours are described as perceived edgesthat exist in the absence of local borders and thatdetermine the perception of illusory or subjectivefigures, as the Kanizsa square (see [20,27] for a review).Subjective figures are often perceived as brighter (ordarker, depending on background colour) than thesurrounding surface [15,16,33] and brightness seems tovary as a function of contour clarity or sharpness ofillusory edges [21]. Other studies showed that the ap-parent increase in brightness of subjective figures andboundary contours completion are different phenom-
ena, depending on several factors [7,24,29]. Regionsbounded by illusory contours are often perceived asnearer to the observer than the inducers, thereforemechanisms giving rise to depth perception are al-legedly linked to illusory contours perception [5,6,10].
A serious debate takes place in the literature aboutthe possible involvement of primary visual area (area17) in illusory contours perception and about the factthat the perception of illusory and real contours mayactivate overlapping visual regions. A recent fMRIstudy compared brain activation during vision of illu-sory and real contours, and highlighted the activationof lateral occipital areas V3A, V4v, V7 and V8 for bothtypes of stimuli [23]. Furthermore, the Larsson et al.[19] PET study showed that the perception of real andillusory contours activated the same visual areas, withthe exception of the right fusiform gyrus, which wasspecifically activated by perception of illusory contours.
* Corresponding author. Tel.: +39-040-676-2730; fax: +39-040-452-8022.
E-mail addresses: [email protected] (A.M. Proverbio),[email protected] (A. Zani).
0028-3932/01/$ - see front matter © 2001 Elsevier Science Ltd. All rights reserved.PII: S 0 0 2 8 -3932 (01 )00135 -X
A.M. Pro�erbio, A. Zani / Neuropsychologia 40 (2002) 479–491480
Ffytche and Zeki [8] showed in their study on re-gional cerebral blood flow (rCBF) that the perceptionof subjective contours in humans is associated withsignificant activity confined in early visual areas, par-ticularly in area V2.
Single unit recording studies showed that cells ofarea 18 and not 17 respond to illusory contours inalert Macaca Mulatta monkeys [34]. More recently,cortical cells have been found in the extra-striate oc-cipital areas signalling the presence of illusory definedboundaries in cats and monkeys [22]. According tothe same study, cells with this property, althoughrare, were not totally absent in V1. Moreover, the useof stimuli which were different from those used inprevious studies, allowed Grosof et al. [11] to findillusory contours responses in V1 neurons of macaquemonkeys.
Hence there is evidence that illusory contour for-mation occurs within earlier centres of visual process-ing system [13,20], not necessarily involving higherorder cortical areas, as it was originally suggested [9].Yet many aspects of illusory defined boundary com-pletion are still unclear because of inconsistency inthe literature.
Another issue currently discussed concerns the exis-tence of hemispheric lateralisation in the perceptionof illusory contours, distinguished from any brainasymmetry related to perceptual grouping and objectsegregation. Besides the right-sided activation of thefusiform gyrus recorded in the Larsson et al. [19]PET study, there seems to be further evidence ofhemispheric asymmetry. For instance Hirsch et al.[14] in the fMRI study showed the predominance ofbrain activity related to illusory contours perceptionin the right extra-striate area. According to Hirsch etal. brain activation could involve striate cortex (area17), too. Right hemispheric superiority was recordedin the behavioural task in which observers analysedthe presence of subjective figures (Kanizsa squares).On the basis of the obtained results the authors con-cluded that the right hemisphere might have a specialrole in perceptual grouping and features conjunction[2]. Similarly, a neuropsychological study comparingright and left unilateral brain damaged patientsdemonstrated a right hemisphere involvement in theperception of subjective contour illusions [35].
A recent behavioural investigation carried out ontwo split-brain patients [4] did not provide evidenceof right hemispheric lateralisation for illusory con-tours perception. The authors observed that while thetwo cerebral disconnected hemispheres were able toperceive illusory contours of a Kanizsa rectangle, theleft hemisphere performed poorly in a condition inwhich pacmen were modified so that the perceptionof the illusory figure depended on amodal completion.
On the basis of these results they concluded that theright hemisphere is involved in perceptual groupingand not in illusory contours perception.
The above mentioned data highlight the inconsis-tency of hemispheric lateralisation when illusoryboundaries formation is concerned. Recordings ofbrain electrical activity may be useful tools to investi-gate the presence of hemispheric asymmetries in cere-bral responses during visual processing of illusoryboundaries. Unfortunately, in the literature only afew electrophysiological studies provide data on brainmechanisms underlying illusory contour perception.Furthermore, in these studies the reduced number ofelectrodes used to collect VEP data does not guaran-tee reliable experimental proof of hemispheric asym-metry. Sugawara and Morotomi [31] recorded visualevoked potentials (from CZ, OL and OR sites) topassively viewed illusory and control stimuli on awhite or black background. Results showed an en-hancement of N2 occipital deflection for subjectivefigures, with no effect of background on VEP ampli-tudes. The authors concluded that illusory contoursformation takes place at higher levels in the visualsystem; the brightness contrast induced by the pat-terns is not sufficient to explain the N2 enhancement,since it occurred with figures both on a black and ona white background.
Korshunova [17] also recorded VEPs to Kanizsasquares and control configurations in a passive view-ing task and discovered a difference in N180/P230peak-to-peak amplitude and N300 latency at occipitalO1 and O2 sites and the left posterior temporal site(T5) associated with subjective contours perception.Although interesting, currently available electrophysi-ological data did not allow any definitive conclusionabout the discussed issue. In particular, the questionof time course and of neurofunctional mechanismsunderlying illusory contours perception remains stillunsolved.
The present study is aimed at determining the timecourse of sensory and perceptual processing in theboundary completion process, analysing the timing ofERP responses. Secondly it aims at investigating therole of induced brightness in the perception of illu-sory contours comparing the evoked responses to pat-terns on a black background with responses topatterns on a white background. Thirdly the studyaims at analysing the neuro-anatomical distribution ofbrain activity, computing ERP topographical maps.Last but not least, it is aimed at proving the existenceof hemispheric lateralisation in brain response duringillusory contours perception. Observers were asked todecide whether or not they had perceived an illusorysquare, pressing a button choosing between two alter-natives.
A.M. Pro�erbio, A. Zani / Neuropsychologia 40 (2002) 479–491 481
2.1. Participants
Eight college students (four females and four males)from the age of 18 to 24 took part to this study as paidvolunteers. All students were right handed with righteye dominance and had normal or corrected-to-normalvision. None of them was familiar with the objective ofthe study.
2.2. Stimuli
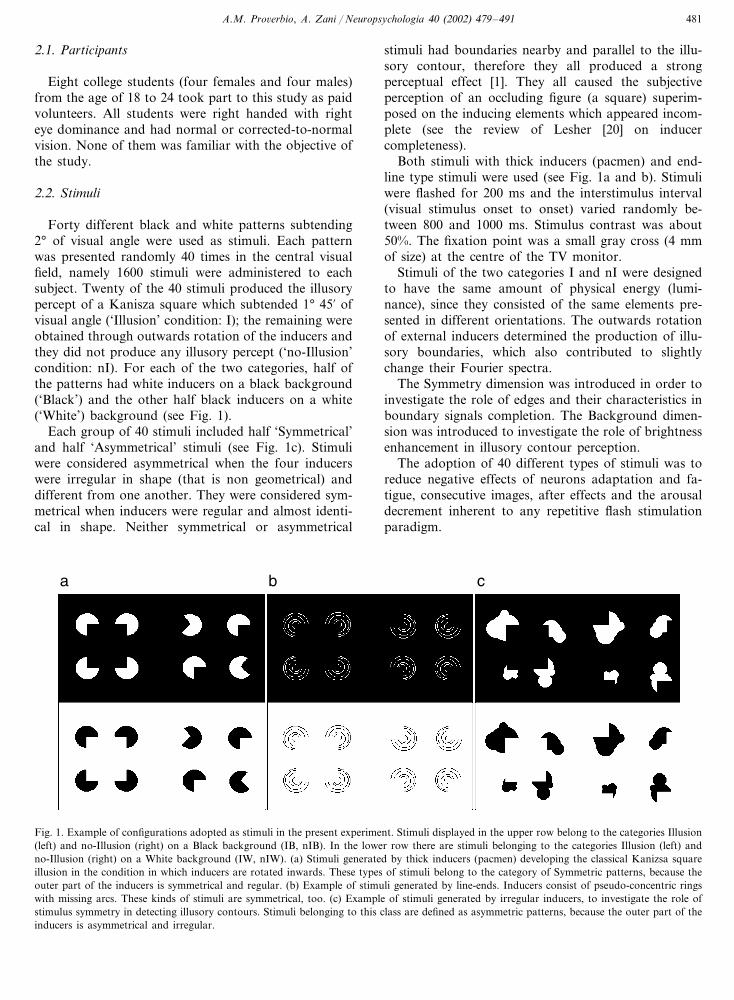
Forty different black and white patterns subtending2° of visual angle were used as stimuli. Each patternwas presented randomly 40 times in the central visualfield, namely 1600 stimuli were administered to eachsubject. Twenty of the 40 stimuli produced the illusorypercept of a Kanisza square which subtended 1° 45� ofvisual angle (‘Illusion’ condition: I); the remaining wereobtained through outwards rotation of the inducers andthey did not produce any illusory percept (‘no-Illusion’condition: nI). For each of the two categories, half ofthe patterns had white inducers on a black background(‘Black’) and the other half black inducers on a white(‘White’) background (see Fig. 1).
Each group of 40 stimuli included half ‘Symmetrical’and half ‘Asymmetrical’ stimuli (see Fig. 1c). Stimuliwere considered asymmetrical when the four inducerswere irregular in shape (that is non geometrical) anddifferent from one another. They were considered sym-metrical when inducers were regular and almost identi-cal in shape. Neither symmetrical or asymmetrical
stimuli had boundaries nearby and parallel to the illu-sory contour, therefore they all produced a strongperceptual effect [1]. They all caused the subjectiveperception of an occluding figure (a square) superim-posed on the inducing elements which appeared incom-plete (see the review of Lesher [20] on inducercompleteness).
Both stimuli with thick inducers (pacmen) and end-line type stimuli were used (see Fig. 1a and b). Stimuliwere flashed for 200 ms and the interstimulus interval(visual stimulus onset to onset) varied randomly be-tween 800 and 1000 ms. Stimulus contrast was about50%. The fixation point was a small gray cross (4 mmof size) at the centre of the TV monitor.
Stimuli of the two categories I and nI were designedto have the same amount of physical energy (lumi-nance), since they consisted of the same elements pre-sented in different orientations. The outwards rotationof external inducers determined the production of illu-sory boundaries, which also contributed to slightlychange their Fourier spectra.
The Symmetry dimension was introduced in order toinvestigate the role of edges and their characteristics inboundary signals completion. The Background dimen-sion was introduced to investigate the role of brightnessenhancement in illusory contour perception.
The adoption of 40 different types of stimuli was toreduce negative effects of neurons adaptation and fa-tigue, consecutive images, after effects and the arousaldecrement inherent to any repetitive flash stimulationparadigm.
Fig. 1. Example of configurations adopted as stimuli in the present experiment. Stimuli displayed in the upper row belong to the categories Illusion(left) and no-Illusion (right) on a Black background (IB, nIB). In the lower row there are stimuli belonging to the categories Illusion (left) andno-Illusion (right) on a White background (IW, nIW). (a) Stimuli generated by thick inducers (pacmen) developing the classical Kanizsa squareillusion in the condition in which inducers are rotated inwards. These types of stimuli belong to the category of Symmetric patterns, because theouter part of the inducers is symmetrical and regular. (b) Example of stimuli generated by line-ends. Inducers consist of pseudo-concentric ringswith missing arcs. These kinds of stimuli are symmetrical, too. (c) Example of stimuli generated by irregular inducers, to investigate the role ofstimulus symmetry in detecting illusory contours. Stimuli belonging to this class are defined as asymmetric patterns, because the outer part of theinducers is asymmetrical and irregular.

A.M. Pro�erbio, A. Zani / Neuropsychologia 40 (2002) 479–491482
2.3. Procedure
Participants were seated comfortably in a darkened,acoustically and electrically shielded box. A high reso-lution VGA computer screen was positioned at a dis-tance of 114 cm from their eyes outside the box. Theywere asked to fix the centre of the screen and to avoidany eye or body movement during the recording ses-sion. The task consisted in responding as accuratelyand as fast as possible to all stimuli judging whetherthey had subjectively perceived an illusory square. Par-ticipants responded pressing a button with the indexfinger to I stimuli and with the middle finger to nIstimuli. Left and right hands were used alternativelyduring all sessions. The aim of the behavioural task wasto make the observer draw their attention to perceivedimages, since stimuli were flashed at a relatively fastrate.
Each session consisted of 16 blocks of trials. In halfof them only patterns on a white background werepresented and vice-versa in the other half. Each blockconsisted of 103 trials of stimuli and lasted about 3minutes. The first three visual stimuli were warningsignals (SET, READY, GO!) inviting viewers to con-centrate and to stare the fixation cross. After each run,a pause of several minutes followed. Several practicetrials were carried out to let the participants get used tothe different configurations. The order of stimuli pre-sentation, response hand and background colour werecounterbalanced among subjects.
2.4. EEG recording
The electroencephalogram (EEG) was continuouslyrecorded from 28 scalp sites using tin electrodesmounted in an elastic cap (Electro-cap). Electrodeswere positioned at frontal (Fp1, Fp2, FZ, F3, F4),central (CZ, C3, C4), temporal (T3, T4), posterior-tem-poral (T5, T6), parietal (PZ, P3, P4), and occipital scalpsites (O1, O2) of the International 10–20 System. Addi-tional electrodes were placed at half the distance be-tween homologous posterior-temporal and occipitalsites (OL, OR), half the distance between O1 and O2sites (OZ), 10% of nasion-inion distance below OZ(INZ), 10% of nasion-inion distance above OZ (POZ),10% to the left and the right of POZ site (PO1, PO2),10 and 20% respectively to the left and right of INZ site(IN1, IN2, IN3, IN4).
Horizontal and vertical oculograms (EOG) wererecorded to guarantee fixation maintenance. Blinks andvertical eye movements were monitored through twoelectrodes placed below and above the right eye; hori-zontal movements were recorded through electrodesplaced at the outer canthi of the eyes. Linked earlobeswere used as reference lead. The EOG and the EEGwere amplified with a half-amplitude band pass of
0.1–70 Hz and 0.01–70 HZ, respectively. Electrodeimpedance was kept below 5 K�. Continuous EEG andEOG were digitised at a rate of 512 samples/s.
All trials contaminated with eye or body movementswere rejected. ERPs were averaged offline from 100 msbefore probe presentation to 1000 ms after probe pre-sentation. ERP trials associated with an incorrect be-havioural response were also excluded from furtheranalysis. For each subject, distinct ERP averages wereobtained as a function of stimulus category. The majorERP components were identified and measured auto-matically by a computer program with reference to thebaseline voltage averages over the interval from −100to 0 ms. ERP deflections were labelled according to apolarity-latency convention and quantified measuringpeak latency and baseline-to-peak amplitude valueswithin a specific latency range, centred approximatelyon the peak latency of the deflection seen in the grandaverage waveforms.
The occipital P1, peaking at about 86 ms, wasdefined as the most positive deflection, between 70 and120 ms post-stimulus at homologous P3, P4, T5, T6,O1, O2, OL, OR, PO1, PO2, IN3, IN4 recording sites.The occipital N1, peaking at about 146 ms, was definedas the most negative deflection, between 125 and 175ms at the same electrode sites. The posterior N2, peak-ing at about 250 ms, was defined as the most negativedeflection, between 200 and 300 ms at the same elec-trode sites.
Anterior and posterior P300 peaks were identifiedbecause of the different response patterns defined asfunctions of background luminance. P300 measuresrecorded at anterior and posterior sites underwent twodifferent ANOVAs because of the high number ofelectrode sites.
Posterior P300, peaking at about 390 ms was definedas the most positive deflection, between 300 and 500 msat homologous P3, P4, T5, T6, PO1, PO2 recordingsites. Anterior P300 peaking at about 405 ms wasdefined as the most positive deflection, between 300 and500 ms at anterior F3, F4, C3, C4, T3, T4 recordingsites.
ERP components were also measured at midline sitesand data were submitted to separate analyses of vari-ance. P1, N1 and N2 deflections were measured at Pz,POz, Oz and INz sites. P3 was measured at Fz, Cz, Pz,Oz and INz electrode sites.
2.5. Data analysis
A computerised artifact rejection and baseline correc-tion procedure was performed before averaging.Grand-average ERPs were separately computedfor each stimulus type as a function of the followingfactors: ‘illusion’ (illusion=I, no-illusion=nI),‘background’ (white=W; black=B), ‘symmetry’

A.M. Pro�erbio, A. Zani / Neuropsychologia 40 (2002) 479–491 483
(symmetric=S; asymmetric=aS). For each of theeight subjects and 28 scalp recording channels, eightdifferent ERP waveforms were obtained by averagingabout 160 trials. They were labelled IWS, IWaS, IBS,IbaS, nIWS, nIWaS, nIBS and nIbaS.
ERP amplitude and latency measures were analysedwith repeated-measure five ways ANOVAs, separatelyfor each ERP component of interest. Factors were‘illusion’, ‘background’, ‘symmetry’, ‘electrode site’ (de-pending on the ERP component considered) and ‘cere-bral hemisphere’ (left and right). Additional ANOVAswere carried out on ERP measures recorded at midlinesites. The same factors were used, with the exception offactor ‘hemisphere’, which was omitted.
Topographical voltage maps of ERP componentswere obtained by plotting colour-coded iso-potentialsderived from interpolation of voltage values betweenscalp electrodes at specific latencies.
Percentages were transformed in arcsine values andsubmitted to a four way ANOVA for each subject errorand miss. Reaction times to target stimuli not exceeding2 S.D. above or below the mean were also submitted toa four way ANOVA. For each of the above mentionedbehavioural measures, the following ANOVA factorswere adopted ‘illusion’, ‘background’, ‘symmetry’, and‘response hand’ (left and right).
Greenhouse–Geisser corrections were employed forboth behavioural and electrophysiological analyses toreduce positive bias resulting from repeated factors withmore than two levels. Post-hoc Tukey tests were carriedout for multiple means comparisons.
3. Results
3.1. Beha�ioural data
Correct answers reached 95.16%, which means thatstimuli produced a reliable illusion effect.
Reaction times to illusory patterns (450 ms) werefaster than to non illusory patterns (489 ms), as thesignificance of Illusion factor (F(1,7)=11.55; P�0.01;�=1) demonstrates. It may be assumed that the viewerwas more certain when deciding on the presence ratherthan the absence of the illusory square. When inducerswere asymmetrical (see Fig. 1c as an example of thesestimuli), it was easier to exclude than to ascertain thepresence of the illusory square, i.e. to respond Norather than Yes, which is confirmed by the results ofANOVA performed on arcsine-transformed error per-centages, which yielded a significant triple interaction ofBackground×Symmetry×Illusion (F(1,7)=5.9; P�0.05; �=1). Post-hoc comparisons for illusory asym-metrical patterns showed higher percentages of wrongcategorisations than for non illusory asymmetrical pat-terns. Table 1 shows that the overall error rate for
Table 1Mean percentage of errors made by observers in task performance, asa function of stimulus type and background luminance
AsymmetricalSymmetricalSymmetry illusion
nII I nI
3.814.06 5.37White 4.810.7 0.60.9S.D. 0.8
Black 3.12 3.68 4.37 3.250.7S.D. 0.80.70.8
stimuli on a white background was higher than forstimuli on a black background, although post-hoc com-parisons were significant only at t test level (P�0.05).
3.2. Electrophysiological data
3.2.1. P1 deflection
3.2.1.1. Posterior P1. This positive response was largerat lateral occipital sites as shown in post-hoc compari-sons (P�0.01) performed for the main factor Electrode(F(5,35)=3.85; P�0.007; �=0.41, correct. F(2,14);P�0.05). The significant interaction of Electrode×Hemisphere (F(5,35)=2.89; P�0.03; �=0.41, correct.F(2,14); P�0.05) showed that P1 was larger at rightlateral occipital sites, as it often results in visual percep-tion paradigms. The triple interaction of Symmetry×Electrode×Hemisphere was significant (F(5,35)=3.43;P�0.01; �=0.41, correct. F(2,14); P�0.05), too. Post-hoc comparisons showed that P1 to symmetricalconfigurations was larger than P1 to asymmetricalconfigurations at the right lateral-occipital site (P�0.01), where this component reached its maximum am-plitude (see Fig. 2).
Fig. 2. Grand-average ERPs recorded at the right lateral occipital sitein response to symmetrical or asymmetrical patterns independent ofother factors. Stimulus symmetry produced larger P1, N1, N2 and P3evoked responses: these effects are clearly observable in the rightupper corner, where the difference wave obtained subtracting ERPsto asymmetrical from ERPs to symmetrical patterns is shown.

A.M. Pro�erbio, A. Zani / Neuropsychologia 40 (2002) 479–491484
Fig. 3. Effect of background. Grand-average ERPs recorded atposterior midline sites in response to patterns with black or whitebackground. The amplitude of evoked sensory responses was greaterwhen patterns were presented on a white background.
electrode sites (P�0.01). This result suggests that thelateral occipital area responded bilaterally to illusorydefined subjective figures as early as 145 ms post-stimu-lus (see Fig. 4). The lack of any significant interactionbetween Hemisphere and Illusion factors does notconfirm the existence of a lateralisation of sensoryprocesses underling illusory contour perception.
Analysis of ERP topographical distribution (seemaps of Fig. 5a), as a function of time course, showedthat boundary completion processes activated the lat-eral occipital areas (probably corresponding to extra-striate cortex) as early as 80 ms at P1 level, althoughthis effect was not statistically significant. The laterincrease in amplitude of N1 response was also observ-able over the same brain regions, with bilateralactivation.
3.2.2.2. Midline N1. The ANOVA performed for mid-line posterior electrodes, confirmed the early effect ofboundary completion at N1 level. The Illusion×Elec-trode interaction (F(3,21)=3.2; P�0.05; �=0.84, cor-rect. F(3,18); P�0.05) showed that N1 to I stimuli waslarger than to nI stimuli at Oz and INz electrode sites(P�0.01). Table 2 shows mean amplitudes of N1deflection for this statistical comparison. The ANOVAalso yielded a main effect of Electrode (F(3,21)=9.54;P�0.0005; �=0.52, correct. F(2,11); P�0.005) withN1 being larger at POz and Oz sites (P�0.01). An-other interesting result is the effect of stimulus Symme-try or regularity (independent of illusion formation)interacting with the Electrode factor (F(3,21)=8.2;P�0.001; �=0.62, correct. F(2,13); P�0.01). Indeed,N1 response to symmetrical configurations was largerthan to asymmetrical configurations at the inion elec-trode sites (P�0.05). Fig. 6 shows grand-average ERPsrecorded at midline sites POz and Inz, and displays theeffect of stimulus symmetry on N1 amplitude in theinion area, absent in the parietal-occipital area.
3.2.1.2. Midline P1. The ANOVA performed on P1measures recorded at midline sites (PZ, POz, Oz, Inz)resulted in the interaction of Background×Electrode(F(3,21)=3.29; P�0.05; �=0.84, correct. F(3,18);P�0.05) with P1 to figures with white background(P�0.01) at POZ and Pz electrode sites (see Fig. 3)being larger. This result might depend on the fact thatpatterns on a white background were brighter thanthose on a black background, basically reflecting thestrength of photoceptors stimulation. We believe thatthis was due to the fact that stimuli were presented ona computer screen in a dimly lit room and not on paperin daylight. Moreover observers did not subjectivelyperceive figures on a black background as darker thanthe surrounding surface. Indeed, it has been shown thatthe apparent change in brightness (brightness or dark-ness enhancements) of subjective figures decreases ac-cording to decreasing levels of illumination and may beabsent at low luminance level [30].
Hence in this latency range (between 70 and 120 mspost-stimulus) brain responses were affected by stimu-lus symmetry and background luminance and not byillusory contours.
3.2.2. N1 deflection
3.2.2.1. Posterior N1. The ANOVA performed on N1amplitude showed as in the case of occipital P1 that thiscomponent (peaking at about 146 ms) was larger atlateral occipital sites, as confirmed by post-hoc tests(P�0.01) performed for the significant factor Elec-trode (F(5,35)=9.28; P�0.0000; �=0.33, correct.F(2,12); P�0.005). The significant interaction of Elec-trode×Hemisphere (F(5,35)=3.34; P�0.01; �=0.51,correct. F(3,18); P�0.05) also indicated a right hemi-spheric lateralisation of N1 response which was largerat right lateral occipital site (P�0.01). The interactionbetween Illusion and Electrode was significant, too(F(5,35)=2.62; P�0.05; �=0.75, correct. F(4,25);P�0.05). Post-hoc comparisons showed that N1 topatterns eliciting an illusory percept (I vs. nI) was largerat lateral, posterior occipital and posterior temporal
Fig. 4. Effect of illusory contours. Grand-average ERPs recorded atleft and right lateral occipital sites (OL and OR) in response tostimuli which induced (I) or did not induce (nI) the perception ofillusory contours. The data indicate that illusory contours formationwas associated with bilateral activation of lateral occipital cortexfollowed by significant left-sided activation.

A.M
.P
ro�erbio,A
.Z
ani/N
europsychologia40
(2002)479
–491
485
Fig. 5. Effect of illusory contours. (A) Time series mapping of brain activation between 80 and 180 ms post-stimulus associated with illusory contours perception, obtained by substracting ERPsto nI configuration from ERPs to I configuration. Each map presents a 5 ms brain activity period. Although P1 and N1 components were strongly lateralised over the right occipital area, theeffect of illusory contours was symmetrical and involved both cerebral hemispheres. It is significant that in the later phase of the N1 component the response is larger over the right hemisphere,perhaps reflecting a P2 activity preceding the larger P300 amplitude modulation. (B) Isocontour voltage difference-map (I–nI) computed for the 255/265 ms time window, corresponding to thepeak of the effect at N2 level.

A.M. Pro�erbio, A. Zani / Neuropsychologia 40 (2002) 479–491486
Table 2N1 mean amplitude (�V) recorded at posterior midline sites as a function of illusion condition
PzElectrode illusion Poz Oz Inz
nI I nII I nI I nI
−3.1 −5.68 −5.25N1 ampl. −6.91−3 −5.97 −5.55 −4.83S.D. 1.7 1.1 0.9 1.9 2.3 1.8 2.1 1.6
0.43 0.94 0.72I–nI difference −0.1
3.2.3. N2 deflection
3.2.3.1. Posterior N2. The second negative componentof interest, namely N2 peaking at about 250 ms, waslarger at inion area (IN2, IN2, IN3, IN4; P�0.01) asshown by post-hoc analyses for the significant Elec-trode factor F(5,35)=8.0; P�0.001; �=0.48, correct.F(2,17); P�0.005). As for P1 deflection, N2 to stimulion a white background was larger than N2 to stimulion a black background (F(1,7)=8.61; P�0.02; �=1),perhaps because of the greater average luminance levelof patterns with black inducers on a white TV screen.As for P1, this effect did not interact with boundarycompletion mechanisms, since both BI and WI elicitedlarger N2 than BnI and WnI stimuli, respectively. Atthis latency level the interaction of Illusion× Hemi-sphere (F(1,7)=19.72; P�0.003; �=1) is significant,since N2 to patterns producing subjective figures waslarger at left hemisphere sites (P�0.05).
Fig. 5b clearly shows this left-sided activation associ-ated with illusory contours perception: interested elec-trode sites are IN1, IN3, O1, OL and T5 over the lefthemisphere and IN4 over the right hemisphere.
3.2.3.2. Midline N2. ANOVAs performed on N2 valuesrecorded at midline electrode sites confirmed the resultsdescribed above. N2 was larger at INz (P�0.01) elec-trode site (F(3,21)=3.49; P�0.034; �=0.84, correct.F(3,18); P�0.05), and to patterns on a white back-ground (F(1,7)=13.61; P�0.01; �=1).
3.2.4. P3 deflection
3.2.4.1. Posterior P300. Later ERP components showedsignificant effects, too. P300 recorded at posterior sites,peaking at about 390 ms, was larger at parietal sites(P�0.01) as significance of Electrode factor F(2,14)=22.02; P�0.0000; �=0.80, correct. F(2,11); P�0.0005) shows. It was particularly sensitive tobackground colour since it was larger to black (8.55uV) background than to white (7.81 uV) background(F(1,7)=8.1; P�0.03; �=1). This effect may be due tothe fact that the previous negative deflection N2 wasmuch larger to patterns on a white background, asmentioned above. Stimulus symmetry affected also
P300 amplitude (F(1,7)=5.86; P�0.05; �=1), whichwas larger to symmetrical (8.71 uV) than to asymmetri-cal (7.65 uV) patterns. Moreover, there was a signifi-cant interaction between Illusion×Symmetry(F(1,7)=15.13; P�0.006; �=1). Post-hoc compari-sons showed that P300 response to illusory configura-tions was larger than to non illusory configurationsonly when the stimuli were symmetrical (P�0.01; seeTable 3 for means of posterior P300 amplitude.
The effect of stimulus symmetry is evident from thecomparison of Fig. 7a with Fig. 7b, which show ERPsrecorded at both posterior and anterior sites in re-sponse to patterns with either regular or irregular in-ducers, respectively.
This result suggests that inducer regularity may fosterthe process of boundary formation, perhaps reducingthe amount of incoming unrelated visual information.The illusion/not-illusion difference was more pro-nounced at right hemispheric sites, as the significance ofIllusion×Hemisphere (F(1,7)=9.15; P�0.02; �=1)and relative post-hoc comparisons (P�0.01) show. Theeffect of hemispheric lateralisation for illusory contoursperception at this late latency level can be observed inERP waveforms displayed in Fig. 7a.
Fig. 6. Effect of stimulus symmetry. Grand-average ERPs recorded atposterior midline sites (POz and INz) in response to stimuli withasymmetrical or symmetrical inducers. Symmetric stimuli elicitedERP components of greater amplitude, as can be clearly appreciatedon the right in the lower part of the figure, showing the differencewaves obtained subtracting ERPs to asymmetrical stimuli from ERPsto symmetrical stimuli.

A.M. Pro�erbio, A. Zani / Neuropsychologia 40 (2002) 479–491 487
Table 3P300 mean amplitude (�V) recorded at posterior and midline sites as a function of stimulus symmetry and illusion condition
PosteriorSymmetry illusion Midline
Asymmetrical SymmetricalSymmetrical Asymmetrical
I nI I nI I nI I nI
7.2 7.5 7.83P300 ampl. 10.8810.2 8.93 8.46 8.79S.D. 4.3 4.4 4.1 4.5 2.7 1.8 3.0 2.2
−0.33I–nI difference 1.953.0 −0.33
In our view, P300 data do not necessarily imply thatboundary contours formation is a right-lateralised pro-cess per se, otherwise it should have been appeared inasymmetric brain activation at earlier processing stages.As mentioned above, a left-sided lateralisation wasobserved at earlier levels of processing, for instance atN2 level.
3.2.4.2. Midline P300. ANOVA performed on P300values recorded at midline electrodes (Fz, Cz, Pz, Oz,Inz) showed that this positivity was larger at central-parietal sites (P�0.01) as confirmed by statisticalsignificance of Electrode factor (F(5,35)=19.54; P�0.001; �=0.27, correct. F(1,9); P�0.005). Mean valuesare reported in Table 4.
As for posterior P300, the Symmetry×Illusion inter-action was significant (F(1,7)=27.30; P�0.001; �=1).Post-hoc comparisons showed that P300 to illusoryconfigurations was larger than to non illusory configu-rations (P�0.01) only when inducers were symmetrical(see Table 3 for mean values).
3.2.4.3. Anterior P300. P3 response recorded at anteriorsites, peaking at about 405 ms, proved to be larger atcentral sites (F(2,14)=25; P�0.0000; �=0.80, correct.F(2,11); P�0.0005). This late positive response wassensitive to background luminance (F(1,7)=10.37; P�0.01; �=1), being larger to stimuli on a white back-ground than to stimuli on a black background (asshown in Fig. 8). Overall, the anterior P300 showed asignificant effect of hemispheric lateralisation (F(1,7)=6.3; P�0.04; �=1), being larger at right than leftelectrode sites.
P300 was affected by stimulus Symmetry (F(1,7)=8.56; P�0.02; �=1), since the response to symmetricalstimuli was larger than to asymmetrical stimuli. Thesignificant Illusion×Symmetry interaction (F(1,7)=6.11; P�0.04; �=1) also showed that anterior P3 inillusory contours for symmetrical configurations waslarger than for asymmetrical configurations, hence sym-metrical inducers may facilitate the detection of illusorysquares.
The significance of Illusion×Electrode interaction(F(2,14)=5.0; P�0.02; �=0.70, correct. F(1,10); P�
0.05) showed that P300 in illusory configurations waslarger than in non illusory configurations at centralsites (P�0.05), where it reached its maximum ampli-tude. The interaction of Background×Symmetry×Electrode was significant, too (F(2,14)=4.7; P�0.03;�=0.68, correct. F(1,10); P�0.05). Post-hoc compari-sons showed that P300 to symmetrical patterns on awhite background (WS) was larger than P300 to whiteasymmetrical patterns (WaS) at central (P�0.01) andfrontal (P�0.05) sites. No significant symmetry effectwas found for stimuli on a black background. Table 5shows P300 amplitude values for these statisticalcomparisons.
These data suggest that stimulus symmetry had amore significant effect when there were black contourson white backgrounds or when there was greater lumi-nance, independently of illusory contours perception.
Fig. 7. Symmetry×Illusion. Grand-average ERPs recorded at ho-mologous left and right frontal, central and parietal sites in responseto symmetrical (A) or asymmetrical (B) patterns inducing (I) or not(nI) the perception of illusory contours. (A) right-sided asymmetry ofthe processes involved in the perception of illusory figures can be seenat parietal sites. (B) It is significant that under this condition illusorycontours have little impact on P300 amplitude.

A.M. Pro�erbio, A. Zani / Neuropsychologia 40 (2002) 479–491488
Table 4P300 mean amplitude (�V) recorded at midline sites independent oftask factors
CzElectrode PzFz Poz Oz Inz
14.66 13.62P300 ampl. 10.088.28 5.83 3.125.6 4.1S.D. 4.03.8 3.9 2.5
absence of illusory Kanizsa square. The first goal wasto investigate whether there was right hemispheric later-alisation in brain activation, as suggested by severalstudies [14]. Secondly the study aimed at understandingif illusory contour formation occurred at early stages ofvisual processing pathways or if it involved associativehigher level cortical regions.
ERP results showed that the occurrence of illusorycontours was associated with a strong bilateral activa-tion of lateral occipital areas at about 145 ms post-stim-ulus as indexed by the N1 deflection. This resultindicates an earlier activation of visual cortex if com-pared to previous electrophysiological studies (i.e. 180–300 ms post-stimulus) [17,31,32] and it is consistentwith neuroimaging data as far as neurotopographicallocalisation and perhaps timing of activation are con-cerned. Several fMRI, PET, rCBF and neurophysiolog-ical studies demonstrated an activation of extra-striatecortex (mainly V2, but also V3a, V4v, V7, V8) associ-ated with illusory contours perception, both in humansand animals. A recent MEG study recorded an earlyevoked gamma activity to targets between 100 and 200ms, examining event-related fields and gamma activityduring an active task in which observers responded toKanizsa squares (targets) among Kanizsa triangles andnon-Kanizsa figures. This finding is consistent with thetiming of our earliest response to illusory contours,indexed by the amplitude modulation of N1 deflection.
Our data do not seem to support the hypothesis of astriate cortex (V1) involvement in illusory contour per-ception (as suggested by Grosof et al. [11], Hirsch et al.[14] and Leventhal et al. [22]). However, neurons sig-nalling illusory boundaries are less numerous in V1than in V2 [22], which might explain why a change inthe activation pattern of V1 neurons is not easilydetectable through scalp recordings of ERPs in hu-mans. Our ERP data showed a significant trend,though not statistically significant, namely early sensoryP1 response was affected by the presence of subjectivecontours (as suggested in the maps of Fig. 5a), althoughthis effect was mostly distributed at lateral occipitalsites.
Our findings for N145 component confirm that theperception of illusory boundaries takes place in thevisual cortex and it is not constructed at followingcognitive stages. According to classical cognitive theo-ries illusory contours are cognitively created or ‘postu-lated’ to account for perceptual gaps [9], or evenunconsciously inferred to solve a perceptual problem[28], whereas Gestalt psychologists describe these phe-nomena as ‘modal completion’ operations occurring atphenomenic level [3]. Recently, it has been hypothesisedthat the integration of contours arises at very earlystages of visual processing and that it is based oncomplex combinations of feedforward, feedback andlateral connections, which would produce an ‘associa-
Yet greater luminance did not favour the boundarycompletion process. Behavioural data showed thaterror percentage was lower with dark background. Thisfinding was consistent with P300 results. The signifi-cant Background×Illusion×Electrode interaction(F(2,14)=4.08; P�0.04; �=0.76, correct. F(2,11);P�0.05) demonstrated that P300 response to illusorypatterns was more significant when there were brightinducers on a dark background. Post-hoc comparisonsfor this interaction indicated that at central sites P300to illusory configurations was larger than to non-illu-sory configurations on a black (P�0.01) and not on awhite background (see Table 6 for mean values). Fig. 9shows brain activity related to illusory contour percep-tion for stimuli with different type of backgrounds. Theactivation focus was larger, earlier and posterior forpatterns with white inducers on a black background.
4. Discussion
The aim of the present study is to investigate the timecourse and the topographical distribution of brain acti-vation, through ERP recording, during perception ofpatterns producing illusory contours formation vs. con-trol patterns with a similar spatial organisation, whichdid not involve visual illusion. To make sure thatobservers paid attention to all stimuli briefly presentedon the TV monitor, they were asked to press one of thetwo buttons at their disposal to signal the presence or
Fig. 8. Effect of Background. Grand-average ERPs recorded athomologous left and right frontal and central sites to patterns on awhite or black background. Brighter backgrounds elicited larger P300amplitude values.

A.M. Pro�erbio, A. Zani / Neuropsychologia 40 (2002) 479–491 489
Table 5P300 mean amplitude (�V) recorded at frontal and central sites as a function of background luminance and stimulus symmetry
FrontalElectrode background symmetry Central
Black WhiteWhite Black
S aS S aS S aS S aS
8.85 8.99 8.11P300 ampl. 13.7410.43 12.19 11.04 11.33S.D. 4.1 3.8 4.1 4.0 4.4 4.3 4.2 4.1
0.88S–aS difference 1.551.58 −0.29
tive field’ integrated by long-range lateral connections[13]. Our electrophysiological data confirm this hypoth-esis and outline the role of edge continuity andboundary alignment in integrating visual contours.
Furthermore, our data do not provide evidence ofright-lateralised neural processes underlying illusorycontours perception. They show that the two cerebralhemispheres are differently activated during sensory-perceptual analysis, attentional selection and cognitiveevaluation processes subserving the formation of illu-sory contours percept. Indeed, the illusion/not-illusiondifference was more significant at left occipital area atN2 latency level (about 250 ms post-stimulus) and atright parietal sites at P300 level. Regarding the N2component, which is related to attention selectionmechanisms, several studies describe left hemisphericlateralisation or dominance for non-spatial feature se-lection at occipital scalp sites [37,38]. This negativeresponse, recorded from lateral occipital OL and ORelectrode sites in the VEP study by Sugawara andMorotomi [31], did not show hemispheric asymmetry.The task consisted in a passive viewing paradigm; at-tention was focused on a central fixation point and noton the (possible) subjective figure, as in the presentstudy. In another VEP study adopting a passive viewingtask, Korshunova [17] recorded a peak-to-peak N180-P230 increase in amplitude at mesial occipital areas (O1and O2 electrode sites) associated with illusory contourperception, along with asymmetric activation of theposterior temporal site (T5), probably near the extra-striate area (area 19).
The right-sided P300 hemispheric asymmetry,emerged in the present experiment, might be a surfacereflection of higher order processes lateralisation suchas perceptual grouping at global level or unified shapeformation, as suggested by recent neuropsychologicalstudies [2,4]. Evidence of hemispheric lateralisation inthe processing of visual information at global/local level[18,25,26] consistent with this observation has beenprovided both in unilaterally brain damaged patientsand neurologically intact volunteers. Hence the righthemisphere is dominant in processing the global formof objects, whereas the left hemisphere is responsiblefor high frequency analysis and local selection of nonspatial features.
Right hemisphere asymmetry was also recorded inTallon-Baudry et al. [32], who investigated visual mech-anisms of features binding analysing EEG high fre-quency oscillations during perception of real or illusoryKanizsa triangles and controls (no-triangles). The au-thors observed a non-phase locked 30–40 Hz compo-nent between 300 and 400 ms post-stimulus, which wasstronger to the illusory triangle than to the no-triangle.At the same latency, evoked potentials showed a morepositive response to the real triangle than to the illusoryor the no-triangle stimulus, at right parietal sites. Arelationship between P300 data and features bindingprocesses as indexed by EEG gamma responses may bepossible. According to this hypothesis, neurones re-sponding to a shape (real or illusory) would dischargein synchrony at about 35–40 Hz and this oscillatoryevent might be a mechanism of feature binding, basedon a high frequency discharge synchronisation [12,32].The recorded activity reflects a deep and significant orwidely distributed neuronal activity, deriving from vi-sual system and perhaps from hippocampus or cingu-late cortex. The same brain loci may be involved in thegeneration of P300, too. One of our referees advancedthe intriguing hypothesis that the late right hemisphericactivity found in our study might reflect the awarenessof viewing an illusory object. Which is certainly veryinteresting and consistent with the above-mentionedEEG oscillation literature.
In our study, the finding of a larger P300 amplitudeto patterns eliciting subjective figures was consistentwith behavioural data indicating faster reaction timesto this type of stimuli. The greater response to illusorythan to non illusory configurations, might reflect a
Table 6P300 mean amplitude (�V) recorded at central sites as a function ofbackground color and illusion condition
Background illusion BlackWhite
I nI I nI
11.99P300 ampl. 10.3713.29 12.654.5 4.6S.D. 4.24.2
1.620.64I–nI difference

A.M. Pro�erbio, A. Zani / Neuropsychologia 40 (2002) 479–491490
Fig. 9. Effect of illusory contours. Isocontour voltage difference-maps computed by subtracting ERPs to nI configurations from ERPs to Iconfigurations. For black patterns the peak of the effect was reached between 370 and 390 ms (left), whereas for white patterns between 380 and400 ms.
repetition effect. Indeed, the Kanizsa square, as a con-sistent percept, has been repeated more often than thevarious non-illusory stimuli, therefore becoming morefamiliar. The present study is not sufficient to disentan-gle this factor from illusory contours perception, hencefurther investigation is required to draw a conclusion.
As far as the illusion effect is concerned a correlationbetween error percentages in behavioural performanceand electrophysiological data (amplitude of P300) wasrecorded. In particular P300 at anterior central siteswas significantly sensitive to the subjective square onlywhen inducers were bright on dark background and onthis condition depended the lowest percentages of errorin task performance.
Background luminance affected ERPs amplitude sig-nificantly and interacted with boundary completionprocesses. Indeed, P1, N2 and P3 (at anterior sites) toblack-on-white patterns were larger than to white-on-black patterns, probably because of the higher lumi-nance level of photic stimulation. Yet the illusion effecton the amplitude of these evoked responses was similaror even larger in the latter condition; which depends onthe fact that the white-on-black condition provided abetter stimulation for neurones signalling boundaries,since inducing elements were bright (ON response) on adark background, whereas in the opposite conditioninducers were dark (OFF response) and the less mean-ingful background was luminous.
A further issue is to be discussed, namely the lack ofdarkening effect for black illusory squares recorded byobservers in our study. Psychophysical studies reported
that illusory figures seem darker than the surroundingsurface when inducers are white on a dark or graybackground. Several authors assume that the change inluminance of subjective figures is strictly related to theformation of illusory contours of a figure [36]. A signifi-cant aspect of our study concerns the weak effect ofenhanced darkening of subjective figures on a blackbackground, due probably to our average low lumi-nance level [30], which did not interact with boundaryformation, illusion strength or clarity. As mentionedabove, the illusion effect on P300 evoked responseamplitude was larger in white-on-black conditions,which also led to a smaller percentage of errors. Thepresent finding is consistent with the assumption thatthe illusory contours formation and occurrence of dark-ness (or brightness) enhancement in the centre of thedisplay are not mutually dependent phenomena [7]. Ourdata indicate that the formation of illusory boundariesis affected by stimulus irregularity or asymmetry. Thefact that P300 response to illusory configurations waslarger than response to non illusory configurations,especially when inducers were symmetrical, indicatesthat inducer regularity might facilitate the process ofboundaries formation. Irregular inducers may producea certain amount of signal noise in the boundary com-pletion process, interfering with visual neuralcomputing.
These data suggest the primary role of inducercollinearity and edges alignment in the completion ofillusory boundaries [21] at relatively early stages ofvisual processing.
A.M. Pro�erbio, A. Zani / Neuropsychologia 40 (2002) 479–491 491
Acknowledgements
The authors wish to express their gratitude to WalterGerbino for the helpful discussion on the experimentaldesign and to Ilaria Monticone for her technical assis-tance and help in data collection. They also gratefullyacknowledge the helpful comments of two anonymousreviewers. This research was supported by a grant fromthe University of Trieste to A.M. Proverbio.
References
[1] Albert MK. Parallelism and the perception of illusory contours.Perception 1993;22(5):589–95.
[2] Atchley RA, Atchley P. Hemispheric specialisation in the detectionof subjective objects. Neuropsychologia 1998;36:1373–86.
[3] Bruno N, Gerbino W. Amodal completion and illusory contours.In: Petry S, Meyer G, editors. The Perception of Illusory Contours.New York: Springer, 1987:220–3.
[4] Corballis PM, Fendrich R, Shapley RM, Gazzaniga MS. Illusorycontour perception and amodal boundary completion: evidence ofa dissociation following callosotomy. Journal of Cognitive Neuro-science 1999;11:459–66.
[5] Coren S. Subjective contours and apparent depth. PsychologicalReview 1972;79:359–67.
[6] Dresp B, Grossberg S. Spatial facilitation by colour and luminanceedges: boundary, surface, and attentional factors. Vision Research1999;39:3431–43.
[7] Dresp B, Lorenceau J, Bonnet C. Apparent brightness enhance-ment in the Kanizsa square with and without illusory contourformation. Perception 1990;19:483–9.
[8] Ffytche DH, Zeki S. Brain activity related to the perception ofillusory contours. Neuroimage 1996;3:104–8.
[9] Gregory RL. Cognitive contours. Nature 1972;238:51–2.[10] Gregory RL, Harris JP. Illusory contours and stereo depth.
Perception and Psychophysics 1974;15:411–6.[11] Grosof DH, Shapley RM, Hawken MJ. Macaque V1 neurons can
signal ‘illusory’ contours. Nature 1993;365:550–2.[12] Herrmann CS, Mecklinger A, Pfeifer E. Gamma responses and
ERPs in a visual classification task. Clinical Neurophysiology1999;110:636–42.
[13] Hess R, Field D. Integration of contours: new insights. Trends inCognitive Sciences 1999;3:480–6.
[14] Hirsch J, DeLaPaz R, Relkin RN, Victor J, Kim K, Li T, BordenP, Rubin N, Shapley R. Illusory contours activate specific regionsin human visual cortex: evidence from functional magnetic reso-nance imaging. Proceedings of National Academy of SciencesUSA 1995;92:6469–73.
[15] Kanizsa G. Subjective contour. Scientific American 1976;234:48–52.
[16] Kanizsa G. Organisation in Vision. New York: Praeger, 1979.[17] Korshunova SG. Visual evoked potentials induced by illusory
outlines (Kanizsa square). Neuroscience and Behavioural Physiol-ogy 1999;29:695–701.
[18] Lamb MR, Robertson LC, Knight RT. Component mechanismsunderlying the processing of hierarchically organised patterns:inferences from patients with unilateral cortical lesions. Journal of
Experimental Psychology: Learning, Memory and Cognition1989;16:471–83.
[19] Larsson J, Amuntus K, Gulys B, Malikovic A, Zilles K, RolandPE. Neuronal correlates of real and illusory contour perception:functional anatomy with PET. European Journal of Neuroscience1999;11:4024–36.
[20] Lesher GW. Illusory contours: toward a neurally based perceptualtheory. Psychonomic Bullettin & Review 1995;2:279–321.
[21] Lesher GW, Mingolla E. The role of edges and line-ends in illusorycontour formation. Neuropsychologia 1993;33:2253–70.
[22] Leventhal AG, Wang Y, Schmolesky MT, Zhou Y. Neuralcorrelates of boundary perception. Visual Neuroscience1998;15:1107–18.
[23] Mendola JD, Dale AM, Fischl B, Liu AK, Tootell RB. Therepresentation of illusory and real contours in human corticalvisual areas revealed by functional magnetic resonance imaging.Journal of Neuroscience 1999;19:8560–72.
[24] Parks TE. Subjective figures: some unusual concomitant bright-ness effects. Perception 1980;9:239–41.
[25] Proverbio AM, Minniti A, Zani A. Electrophysiological evidenceof a perceptual precedence of global vs. local visual information.Cognitive Brain Research 1998;6:321–34.
[26] Rafal R, Robertson L. The neurology of visual attention. In:Gazzaniga M, editor. The Cognitive Neurosciences. Cambridge,MA: The MIT Press, 1995:625–48.
[27] Ringach DL, Shapley R. Spatial and temporal properties ofillusory contours and amodal boundary completion. Vision Re-search 1996;36:3037–50.
[28] Rock I. A problem-solving approach to illusory contours. In: PetryS, Meyer G, editors. The Perception of Illusory Contours. NewYork: Springer, 1987:62–70.
[29] Siegel S, Petry S. Evidence for independent processing of subjectivecontour brightness and sharpness. Perception 1991;20:233–41.
[30] Spillman L, Fuld K, Neumeyer C. Brightness matching, brightnesscancellation, and increment threshold in the Ehrestein illusion.Perception 1984;13:513–20.
[31] Sugawara M, Morotomi T. Visual evoked potentials elicited bysubjective contour figures. Scandinavian Journal of Psychology1991;32:352–7.
[32] Tallon-Baudry C, Bertrand C, Delpuech C, Pernier J. Stimulusspecificity of phase-locked and non-phase-locked 40 Hz visualresponses in human. The Journal of Neuroscience 1996;16:4240–9.
[33] Varin D. Fenomeni di contrasto e diffusione cromatica nell’orga-nizzazione spaziale del campo recettivo. Rivista di Psicologia1971;65:101–28.
[34] Von der Heydt R, Petherhans E, Baumgartner G. Illusorycontours and cortical neurone responses. Science 1984;224:1260–2.
[35] Wasserstein J, Zapulla R, Rosen J, Gerstman L, Rock D. In searchof closure: subjective contour illusions, gestalt completion tests,and implications. Brain and Cognition 1987;6:1–14.
[36] Watanabe T, Oyama T. Are illusory contours a cause or aconsequence of apparent differences in brightness and depth in theKanizsa square? Perception 1988;17:513–21.
[37] Zani A, Proverbio AM. ERP signs of early selective attentioneffects to check size. Electroencephalography and Clinical Neuro-physiology 1995;95:277–92.
[38] Zani A, Proverbio AM. Attention modulation of short latencyERPs by selective attention to conjunction of spatial frequencyand location. Journal of Psychophysiology 1997;11:21–32.
Copyright © 2022 FDOKUMEN