
Masking of the target is sufficient to cause the attentional blink
Upload
independentCategory
view
1download
0
Illusory conjunctions reflect the time courseof the attentional blink
Juan Botella & Jesús Privado &
Beatriz Gil-Gómez de Liaño & Manuel Suero
Published online: 9 March 2011# Psychonomic Society, Inc. 2011
Abstract Illusory conjunctions in the time domain are bindingerrors for features from stimuli presented sequentially but in thesame spatial position. A similar experimental paradigm isemployed for the attentional blink (AB), an impairment ofperformance for the second of two targets when it is presented200–500 msec after the first target. The analysis of errors alongthe time course of the AB allows the testing of models of illusoryconjunctions. In an experiment, observers identified one (controlcondition) or two (experimental condition) letters in a specifiedcolor, so that illusory conjunctions in each response could belinked to specific positions in the series. Two items in the targetcolors (red and white, embedded in distractors of differentcolors) were employed in four conditions defined according towhether both targets were in the same or different colors. Besidesthe U-shaped function for hits, the errors were analyzed bycalculating several response parameters reflecting characteristicssuch as the average position of the responses or the attentionalsuppression during the blink. The several error parameterscluster in two time courses, as would be expected fromprevailing models of the AB. Furthermore, the results matchthe predictions from Botella, Barriopedro, and Suero’s (Journalof Experimental Psychology: Human Perception and Perfor-mance, 27, 1452–1467, 2001) model for illusory conjunctions.
Keywords Illusory conjunctions . Attentional blink .
RSVP. Binding errors
Illusory conjunctions in the time domain are binding errorsproduced as migrations of features between stimuli pre-sented sequentially, in the same spatial position, by meansof the so-called rapid serial visual presentation (RSVP; see,e.g., Botella, Barriopedro, & Suero, 2001). RSVP has alsobeen the tool for studying the attentional blink (AB), animpairment of performance for the second of two targets(T2) when presented within 200–500 msec from the firsttarget (T1). Explanatory models for both effects, illusoryconjunctions and the AB, must be compatible; we willshow in this article that, in fact, they are compatible.
Several models have been proposed to account for AB. Thecore ideas of those models include inhibition (Raymond,Shapiro, & Arnell, 1992), interference (Shapiro, Raymond, &Arnell, 1994), bottlenecks (Chun, 1997b; Chun & Potter,1995; Dux & Harris, 2007a, 2007b; Jolicœur, 1998;Jolicœur, Dell’Acqua, & Crebolder, 2001), temporary lossof control (Di Lollo, Kawahara, Ghorashi, & Enns, 2005),attentional boost and temporary suppression (bounce) ofitems by way of an input filter (Olivers & Meeter, 2008), andimpaired ability for individuating tokens from simultaneousprocessing of types (Bowman & Wyble, 2007; Wyble,Bowman, & Nieuwenstein, 2009), among others (see Dux& Marois, 2009, for a review).
Since the term attentional blink was first used byRaymond et al. (1992), the theoretical models have evolvedto accommodate the increasing database of results fromhundreds of experiments intended to elucidate the necessaryand sufficient conditions for producing an AB. Specialattention has been paid to the role of the T1 + 1 stimulus(Olivers & Meeter, 2008) or the awareness of T1(Nieuwenstein, Van der Burg, Theeuwes, Wyble, & Potter,
J. Botella :B. Gil-Gómez de Liaño :M. SueroAutónoma University of Madrid,Madrid, Spain
J. PrivadoComplutense University,Madrid, Spain
J. Botella (*)Facultad de Psicología, Universidad Autónoma de Madrid,Ciudad Universitaria de Cantoblanco, Campus de Cantoblanco,c/ Ivan Pavlov, 6,28049 Madrid, Spaine-mail: [email protected]
Atten Percept Psychophys (2011) 73:1361–1373DOI 10.3758/s13414-011-0112-z
2009). The size of the blink has been found to be linked tofactors such as the discriminability between the targets andthe distractors or the degree of heterogeneity of thedistractors.
Considerable efforts have been also made to grasp thevery nature of the impairment produced—in the termsintroduced above, the differences between the cognitivescenarios when T2 arrives during the blink or in the controlconditions. Among others, the proposals include impairedperceptual coding, serial consolidation of items in short-term memory, limited capacity of working memory or ofthe ability to individuate tokens from types, and eveninvoluntary oscillations in the attentional enhancement ofthe items (Dux & Marois, 2009).
Despite those differences, the view generally accepted forthe AB includes at least the following ideas: (1) The AB is anattentional (not a perceptual) effect; (2) the detection of T1 (orperhaps the couple T1 + Filler 1) triggers some processesdirected to yield a response to it, and if T2 arrives before thoseprocesses have finished, the processing of T2 is different(poorer performance), as compared with what happens in thecontrol conditions; (3) the impairing effect of those processesvanishes gradually and disappears with long T1–T2 lags, sothat with long enough lags, the performance in the two-targetcondition is indistinguishable from performance in the controlconditions (without any T1).
The AB has been usually analyzed by means of the hit ratefor the T2, with two targets embedded within an RSVP.Specifically, it is characterized by the shape of the functionthat relates the percentage of hits for T2 (conditionalized to ahit for T1) and the T1–T2 lag. Less attention has been paid tothe nature of the errors and how they change along the timecourse of the AB. The analysis of errors should reachconclusions converging with those from the standard analysisof the performance with T2, given a hit with T1. At least, theyshould be compatible with the view described above.
However, the few experiments in which the nature of theerrors along the time course of the AB has been studied haveyielded results that have sometimes been at odd amongthemselves and with the dominant view for the AB. Our mainpurpose in this research was to show how the view of the ABthat errors yield can be accommodated by the dominant viewof the AB. In the next section, we review the experiments inwhich the illusory conjunctions during the AB have beenstudied. Then we will highlight the discrepancies betweenthose results and the dominant view of the AB and how theycan be experimentally addressed.
Illusory conjunctions during the attentional blink
In many AB experiments, the task for T2 has beendetecting a specific stimulus (e.g., an X from a stream of
letters), so that each response could be categorized only ascorrect or incorrect and there was no room for any analysisof the type of errors. When the task has been one ofidentifying T2, most times the responses have beenregistered just as correct or incorrect; again, the recordedresponses cannot be analyzed for errors, beyond theanalysis of how frequent they are (and this is thecomplement of the hit rate).
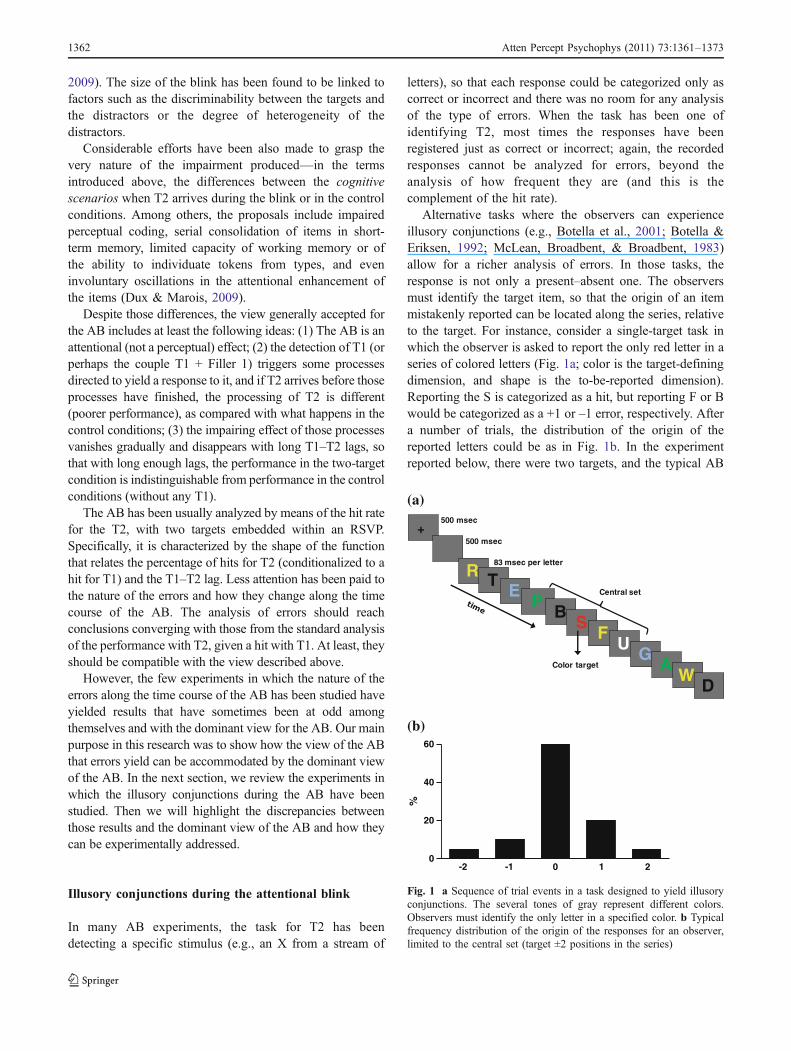
Alternative tasks where the observers can experienceillusory conjunctions (e.g., Botella et al., 2001; Botella &Eriksen, 1992; McLean, Broadbent, & Broadbent, 1983)allow for a richer analysis of errors. In those tasks, theresponse is not only a present–absent one. The observersmust identify the target item, so that the origin of an itemmistakenly reported can be located along the series, relativeto the target. For instance, consider a single-target task inwhich the observer is asked to report the only red letter in aseries of colored letters (Fig. 1a; color is the target-definingdimension, and shape is the to-be-reported dimension).Reporting the S is categorized as a hit, but reporting F or Bwould be categorized as a +1 or –1 error, respectively. Aftera number of trials, the distribution of the origin of thereported letters could be as in Fig. 1b. In the experimentreported below, there were two targets, and the typical AB
(a)
+
R TE
PB
SF
UG
AW
D
500 msec
500 msec
Central set
Color target
83 msec per letter
%
(b)60
40
20
0-2 -1 0 1 2
Fig. 1 a Sequence of trial events in a task designed to yield illusoryconjunctions. The several tones of gray represent different colors.Observers must identify the only letter in a specified color. b Typicalfrequency distribution of the origin of the responses for an observer,limited to the central set (target ±2 positions in the series)
1362 Atten Percept Psychophys (2011) 73:1361–1373

was observed. However, we studied not only the hit rate forT2, but also other types of responses. Thus, we studied thedistribution of the responses for T2 and how it changed as afunction of the lag. Among other goals, we attempted todemonstrate the impact the AB has on the amount and typeof binding error. Studying how distributions such as that inFig. 1b change as a function of the lag between the targetscan help us to understand the AB.
A few experiments have employed several variations ofsuch a procedure. In the first one, Chun (1997a) presented aseries of 17 letters within white frames; the frames of thetwo target letters were red and green, respectively. Theresults showed that besides the well-known U-shapedfunction for the hit rate, the origin of the errors alsochanged along the range of lags where typically the AB isproduced. Popple and Levi (2007) presented as the twotargets two red (or gray) letters embedded within a series ofgray (or red) letters. Again, the results showed both thetypical AB and shifts of the origin of the reported lettersalong the AB. Vul, Hanus, and Kanwisher (2008; see alsoVul, Nieuwenstein, & Kanwisher, 2008) presented a serieswith the 26 English letters, but the two designated targetswere presented surrounded by a white ring. Once again,besides the expected AB found for the hit rate on T2, theorigin of the reports systematically changed along the timecourse of the AB.
Although, in all of these experiments, important effectsof the T1–T2 lag over the distribution of the origin of theresponses have been reported, there are a number ofconflicting results and inconsistencies between them thatdeserve further attention. Moreover, some results are notcompatible with the general view for the AB depictedabove.
Some conflicting results
Even though the conclusion that the origin of the responses(in terms of their positions with regard to T2) changessystematically along the AB is firmly established, there area number of issues that deserve yet a closer look.
Since some of the inconsistencies in the results we aregoing to discuss could be due to important differences inthe tasks used, we first highlight those methodologicaldifferences. For example, the variants of the task morefrequently employed do not produce what we consider to be“genuine” illusory conjunctions of percepts. When a frameor a ring is presented around one letter and the observermust identify it, the task can be considered to be one relatedmore to the psychophysics of temporal order. The observersmust first detect the ring and then identify and retain T1;then the second ring must be detected, and finally, theidentity of T2 must be processed and retained. Attentionmust shift 3 times between four different pieces of
information. Of course, errors are a kind of illusoryconjunction in temporal order judgments, but the taskinvolves too many different elements, and inferences aboutthe source of any observed empirical effect are uncertain.
The most outstanding feature of the illusory conjunctionsof single percepts is that the two relevant dimensionsincorrectly joined are integral dimensions of the stimulus(Treisman & Gelade, 1980; see also Quinlan, 2003). It isdifficult to perceive the shape without processing the coloror vice versa. The two features are extracted from the samestimulus, but surprisingly, they migrate between items thatare close in the series; this is the reason why we considerthem as “genuine” illusory conjunctions.
In the experiments described above, both Chun (1997a)and Vul and colleagues (Vul et al., 2008a, 2008b) employedtasks of synchronicity categorization between composedstimuli. Only Popple and Levi (2007) employed integraldimensions of the stimuli as the two relevant features.Unfortunately, all filler letters were in the same color (grayor red), whereas the targets were in a different color (red orgray). The processing of targets embedded within homoge-neous distractors can benefit from a pop-out effect. Theconclusions from the only experiment with integral stimuli(Popple & Levi, 2007) are different from those from theexperiments based on synchrony categorizations of separableelements of composed stimuli. Our first goal in this researchwas to address a more complete analysis of the results,employing a task more suitable for producing what we havecalled “genuine” illusory conjunctions. Specifically, weemployed the shape and the color as integral dimensions.Furthermore, distractors of heterogeneous colors were usedin order to avoid any pop-out effect. This task has beenshown to be reliable for producing frequent and predictableillusory conjunctions (Botella & Eriksen, 1991; Botella,García, & Barriopedro, 1992).
With respect to inconsistent results, whereas, after amuch more complete analysis, Vul et al. (2008b)concluded that the responses are suppressed, delayed,and diffused (three parameters of the distribution of theresponses; see Fig. 1), Popple and Levi (2007) concludedthat the AB effect can be understood simply as aredistribution of the origin of the responses around thetarget. That is, according to Popple and Levi (2007), theidentities of the letters presented during the AB are equallyavailable, but the order information is lost. In fact, theyanalyzed the responses including, progressively, the hits,the hits plus ±1 responses, ±2 responses, and ±3 responses.In the last analysis (responses from positions between –3and +3), the AB almost vanished. This conclusion contradictsthat of Vul et al. (2008b), who concluded that during the AB,not only is the temporal order information lost, but also theidentification of the items around the target is suppressed tosome degree.
Atten Percept Psychophys (2011) 73:1361–1373 1363

The way in which the suppression has been analyzedmight be improved. It has been analyzed by computing thefrequency of responses from positions far from T2; it hasbeen assumed that those responses reveal a difficulty inidentifying the letters during the AB episode. In the presentexperiment, we included two new features, as comparedwith previous experiments. The first one was that theobservers could choose don’t know as a response, instead offorcing them to make a guess or rerunning the trial at theend of the block. The second one was that we generated aseries of 24 letters but the observers could choose any 1from 26 letters for the response. In that way, we couldassess the quality of the perceptual categorization, since alow quality would produce misidentifications and some-times yield a report of a nonpresented letter (e.g., Popple &Levi, 2008, have shown that the amblyopic eyes generatemore confusions of this type than do normal eyes). Inexperiments in which the complete set of letters isemployed in all the series, errors cannot be disaggregatedinto order position errors and misidentification errors. In theexperiment below, the rate of reports of nonpresented itemswas analyzed as a function of the T1–T2 lag. Theattentional nature of the AB effect must be reflected in thefact that the rate of reporting of nonpresented items doesnot change as a function of the lag.
The results from the experiments above raise someadditional intriguing questions. Thus, in Vul et al.’s (2008b)experiment, the delay of the responses to T2 did not recoverthe values shown by the responses to T1, even when the lagbetween them was as long as 10 positions (more than800 msec). On the contrary, in the experiment by Chun(1997a), the delay reached that level, whereas the data fromPopple and Levi (2007) were not conclusive about thisspecific point. Another of our goals was to check in ourexperiment whether the delay at long lags was similar tothat for T1; if not, the discrepancy could be taken as aneffect of the type of task employed (“genuine” illusoryconjunctions vs. synchronicity tasks).
Another intriguing result has to do with the several timecourses found within each experiment. In Chun’s (1997a)experiment, the results were quite conclusive as to the factthat the AB and the average delay of the reported itemsfollowed different time courses (the peak was at lag 2 forthe first one but was between lags 3 and 4 for the secondone). Popple and Levi (2007) did not make such compar-isons. However, Vul et al. (2008b) made much richeranalyses and found cues of processes that were influencedby the AB that followed three different time courses (wellrepresented by the three statistics of the distribution of theresponses reflected in the delay, the suppression, and thediffusion). That was surprising, because what would beexpected from virtually all theoretical models of the AB isthat it must be possible to group the processes involved in
two different time courses. If the delay at long lags actuallyreaches the level shown by the responses to T1, theprocesses could be grouped around only two time courses,as would be expected from the theoretical models.
The two-stage model of the formation of illusoryconjunctions (Botella et al., 2001) allows making specificpredictions about the time course of the response parame-ters. According to that model, when the target-definingfeature is detected, an attempt to focus attention on thetarget is made. With the typical stimulus onset asynchroniesemployed in these tasks, this attempt succeeds on somepercentage of the trials, and then the target is completelyand accurately identified (a hit is recorded). However, onthe other percentage of trials, the system does not finishquickly enough the process of focalization, and a secondattempt to generate a response takes place. This secondattempt is based on partial, degraded information; essen-tially, it is based on isolated floating features. The systemmakes a sophisticated guess related to the strength of theactivation of each feature at the critical moment (see Botellaet al., 2001). In terms of this model, the AB reduces theprobability of a successful focalization of attention on T2and makes it more probable that the response is based in thesecond attempt. Furthermore, the critical moment thatdetermines the degree of activation on which the guessingprocess is based is delayed. Since the hit rate and theaverage delay of the intrusions are the primary indices ofthose attempts, the prediction is that the lag at which thedelay peaks will be longer than the lag at which the hit ratepeaks (the AB itself).
The following experiment was intended to clarify thepuzzling results described above. We present some newresults based on the combinations of the patterns of bothhits and errors, and their time courses, in a task thatproduces “genuine” illusory conjunctions. We expected thatwhen the results were analyzed within the framework ofBotella et al.’s (2001) model, they would be compatiblewith the general view of the AB, reached with the standardanalyses based on the hit rates.
Experiment
According to the discussion above, the main goal of theexperiment was to show how the evidence found when theerrors are analyzed is compatible with the general view ofthe AB, on the basis of the analysis of the hit rate.Specifically, our predictions were that (1) the average delayof the errors would peak later than the hits; (2) otherresponse parameters would cluster with those two, so thatonly two time courses would be identified; (3) the responseparameters would recover the “baseline” (control conditionlevel) with the long lags; and (4) a proper analysis of the
1364 Atten Percept Psychophys (2011) 73:1361–1373

reports of nonpresented items would reflect the attentionalnature of the effect.
In the pilots for the experiment, we tried several colorsfor the targets and found that performance with the red andwhite targets was statistically different: White targetsproduced reliably worse performance. We thought that thiswas an opportunity for additional comparisons, definingfour experimental conditions: T1 red and T2 white, T1white and T2 red, both targets red, and both targets white.The rationale was that if the AB was produced because,when T2 arrived, the cognitive system was still under theinfluence of the episode triggered by T1 (or T1 + Filler 1),the observed effects in the several response parameterswould reflect how loading and lasting the episode associ-ated to T1 was. As a consequence, if white targets weremore difficult to process, when T1 was a white target, theresponse parameters for T2 should reflect poorer perfor-mance and a longer effect, as compared with when T1 wasred. In the same vein, for the same T1 color, the level ofperformance with a white T2 should be worse than thatwith a red T2. The differences between the four experi-mental conditions should be reflected not only in the hitrate, but also in the other response parameters based onerrors. In short, we expected that the predictions formulatedabove would show in different degrees in the fourexperimental conditions, according to their differentialdifficulty.
Method
Participants Forty-four observers participated in the exper-iment, distributed in four groups. These were undergraduatestudents of the Autonomous University of Madrid, whoreceived €15 for participating in two sessions of about45 min. All the observers reported normal or corrected-to-normal visual acuity and normal color vision. They werenot aware of the purpose of the experiment. Informedconsent was obtained from all of them.
Materials and design Each trial consisted of a series of 24different letters randomly taken from the pool of 26 letters.As is explained below, the other 2 letters were employed toestimate the probability of reporting a nonpresented letter.The letters were presented in four different colors—green(RGB: 173,255,47), black (RGB: 0,0,0), yellow (RGB:255,255,0), or blue (RGB: 0,0,255),—also taken at random,with the only restriction that two consecutive letters nevershared the same color. The letter designated as T1 wasequiprobably that in position 8, 9, or 10. The letterdesignated as T2 was that in positions T1 + 1 to T1 + 9.The colors of the designated targets were changed to red(RGB: 255,0,0) and/or white (RGB: 255,255,255), dependingof the experimental condition. The experimental conditions
(RR, WW, RW, WR) were defined according to the colors ofthe targets (both red, both white, T1 red and T2 white, or T1white and T2 red). The background remained gray throughoutthe experiment.
Procedure Each observer participated in two sessions. Inthe first one, they were instructed to report only the lettercorresponding to T2 (control condition), whereas in thesecond session, they were instructed to report both T1 andT2 (experimental condition). The control condition for theRW and WR groups consisted of reporting the white (RW)or the red (WR) letter, but the series were identical to thoseused in their experimental condition. However, in the RRand WW conditions, it was not possible to employ the samematerials as in the corresponding experimental condition.The reason is that the participants would be asked to reportthe second of two letters in the target color, and that wouldnot be a real one-target control condition. That is why wealso employed the series of the WR and RW groups in thecontrol conditions for the RR and WW groups.
Each trial began with a cross for fixation, appearing for500 ms at the center of the screen. One second after thefixation went off, the stream of letters appeared successively,without interstimulus blanks, at the same location for 83 mseach. After the last letter disappeared, the observers had tomake one (control condition) or two (experimental condition)responses, pressing the letter(s) identified as the target(s), inthe order in which they were perceived. They could also makea don’t know response, pressing the space bar on thekeyboard. No feedback was given for accuracy. Theexperimental trials were preceded by a practice block of 20trials. The control condition was always administered in thefirst session, and the experimental condition in the secondone. The experimental condition consisted of 60 trials witheach of the nine T1–T2 lags, totaling 540 experimental trials,and 20 practice trials (randomly from the several lags). Thecontrol condition consisted of the same series, although theobservers had only to report T2.
Apparatus The program for running the experiment waswritten by the authors in VisualBasic. The experiment wasrun in individual cabins equipped with PC-compatiblecomputers and monitors with a resolution of 1,280 × 600pixels; the participants sat at a 40-cm viewing distance fromthe screen, from which the letters of the series had a visualangle of 0.46° in height and 0.29° in width.
Results
This section is organized into four parts. In the first one, thedifferential performance for the two target colors ishighlighted, since that difference becomes a tool forsubsequent analyses. Then the performance with T1 and
Atten Percept Psychophys (2011) 73:1361–1373 1365

its relationship with task switching between the targets areanalyzed. In the third part, the AB itself is analyzed in thetraditional way; a mathematic model is also fitted in orderto makemore accurate comparisons between the experimentalconditions. In the last part, the several types of errors areanalyzed as a function of the experimental condition and theT1–T2 lag. When indicated, the Bonferroni post hoccomparison procedure has been applied.
Differential performance for red and white targets
Differential performance for different target colors has beenpreviously reported (e.g., Popple & Levi, 2007, with thereport better performance for red than for gray targets). Aswas expected from the pilots, in the present experiment, theperformance was better with red targets than with whitetargets. This conclusion can be statistically supported byanalyzing the results of the control conditions. A 4 × 9(group × lag) ANOVA on the hits rates in the controlcondition revealed a main effect of group, F(3, 37) = 24.608,MSE = 2.241, p < .001, but not of lag, F(8, 296) = 1.191,MSE = 0.005, p = .304], and no interaction, F(24, 296) =0.907, MSE = 0.004, p = .593. Post hoc comparisonsconfirmed that performance in the control conditions wasbetter with the red target letters (WR and RR groups) thanwith the white target letters (RW and WW groups) (83.0%vs. 56.4%, on average; see Fig. 2).
This effect was probably due to a higher contrastbetween the specific red used and the other colorsemployed for the distractors than between the white andthose same filler colors. As was anticipated above, thisdifferential difficulty is useful for later analyses, since itbecomes predictive for ordering the conditions according toseveral response parameters.
Performance for T1
A main issue related to performance for T1 deserves beinghighlighted: Performance with T1 is impaired if there is atask switch between the targets. For both red and white T1s,performance with T1 is better when T2 is in the same colorrather than in a different color, even for the longest lags (seeFig. 2). This is not a typical task-switch effect (see Kiesel etal., 2010; Koch, Gade, Schuch, & Philipp, 2010; Monsell,2003), since it does not decrease as the T1–T2 delayincreases. The switch in the target colors between T1 andT2 has an influence on T1 because the response to T1 is notmade until the end of the trial. Our interpretation of thiseffect is that in the WR and RW conditions, the observermust perform an additional operation after detecting T1 thatis not necessary in the WW and RR conditions: a change inthe cognitive set when waiting for a target with a colordifferent from that of T1. The cost of such an operation is
that the identity of T1 is sometimes lost, and this isreflected in an extra impairment of performance with T1.However, the lag between the targets does not matter, sinceit has an influence on the probability of losing T1 fromshort-term memory and the switch in the cognitive set isdone as soon as T1 is detected, no matter how long thearrival of T2 takes. On the contrary, that operation is notdone in the nonswitch conditions WW and RR (and ofcourse, in the control conditions), so this source of loss isabsent.
The drop of performance for lag1 in the WW and RRconditions (see Fig. 2) is due to a higher rate of permutationerrors—that is, trials on which the identities of T1 and T2are correctly reported, but in the wrong order (Juola,Botella, & Palacios, 2004).
Attentional blink
The four groups showed the typical U-shaped AB. Fig. 3shows the hit rates for T2, conditionalized to a hit on T1,graphed jointly with the hit rate in the control condition foreach group. In all of them, the AB shows first the so-calledlag 1 sparing, then the deepest zone of the effect in position2 (conditions RW, RR, and WR) or positions 2 and 3(condition WW), and finally performance growth, gradually,until it reaches the level of the control condition in a temporalwindow between lags 5 and 6. A 4 × 9 (group × lag) ANOVAon the hit rates for T2, conditionalized to a hit on T1, revealsmain effects of group, F(3, 37) = 17.308, MSE = 1.804, p <.001, and lag, F(8, 296) = 136.2,MSE = 1.749, p < .001, but,more important, also of the interaction, F(24, 296) = 4.431,MSE = 0.057, p < .001. The significant main effect of lag,jointly with the shape of the averages shown in the figure,are by themselves the AB effect. The interaction is due to thefact that the time course of the AB varies between theconditions. When the conditions that share the same T2 colortarget are compared post hoc, the conditions with the moredifficult color target in T1 (white) show lower performancein the recovery segment of the functions. Specifically, theperformance in the WW condition is significantly worse thanthat in the RW condition for lags 4 and 5 (p < .01; nosignificant differences for the other lags). In the same vein,performance in the WR condition is significantly worse thanthat in the RR condition for lags 4, 5, 6, and 7 (p < .01; nosignificant differences for the other lags). It must behighlighted that there are no significant differences betweenthe experimental conditions in the lag 2 condition. Thiscould be due to a floor effect, although it is clear that thedeepest effect is observed at lag 2 for all the experimentalconditions.
In order to better characterize the AB functions andmake more accurate comparisons, we empirically adjusted aset of mathematical models, inspired by some previous
1366 Atten Percept Psychophys (2011) 73:1361–1373

models (e.g., Olivers & Meeter, 2008). In the model thatfits the data better (see the Appendix), the probability of acorrect report of T2, given a correct response for T1, isdefined as
f ðlagÞ ¼ d � ð1� ða � ðlag � bÞ2Þ � e�c�lagÞ: ð1ÞIn this model, the parameter d is estimated as the averageperformance in the one-target condition. As lag increases,performance approaches the asymptotic value set by thisparameter. The model allows one to characterize thefunctions according to several special values. Table A1 inthe Appendix includes the parameters and several main
values for the four two-target conditions, together with theR2 fit index. The functions are plotted in Fig. 4.
The main results are as follows. First, the lag at whichthe minimum is reached (lagmin) is shorter for an easy (red)T1 than for a difficult (white) T1, when the conditions withthe same T2 color are compared. Furthermore, comparingthe conditions that share the same T1 color, the minimum isagain reached earlier for an easy (red) T2 than for a difficult(white) T2.
Second, the AB itself is deeper [smaller f (lagmin)] for adifficult (white) T2 than for an easy (red) T2. As above,comparing the conditions that share the same T2 color, the
Lag
%
RW
RR
T2R
WR
WW
T2W
100
80
60
40
20
00 1 2 3 4 5 6 7 8 9
Fig. 2 Identification perfor-mance for the first target (T1)in the four two-target experi-mental conditions and the twocontrol one-target conditions,plotted across the T1–T2 lags.The data points for the controlconditions are averaged for thetwo groups that shared thesame control condition(T2R and T2W)
(a)RW
LAG
%%
%%
WW
LAG
WR
LAG
RR
LAG
(b)
LAG
%
RW
WW
WR
RR
100806040200
100806040200
100
80
60
40
20
0
100806040200
0 1 2 3 4 5 6 7 8 9 0 1 2 3 4 5 6 7 8 9
0 1 2 3 4 5 6 7 8 9
100806040200
0 1 2 3 4 5 6 7 8 9
0 1 2 3 4 5 6 7 8 9
Fig. 3 a Identification perfor-mance for the first and secondtargets (T1 and T2) for thefour groups, plotted across theT1–T2 lags. The results for T2performance are based on trialson which T1 was correctlyidentified, T2/T1. b Combinedfigure for the T2/T1 results ofthe four experimental conditions
Atten Percept Psychophys (2011) 73:1361–1373 1367

minimum is again deeper with a difficult (white) T1 thanwith an easy (red) T1.
Third, the lag at which performance recovers a criterionlevel of 95% of the performance in the control condition(column lag95 in Table A1) is shorter for an easy (red) T1than for a difficult (white) T1. Furthermore, comparing theconditions that share the same T1 color, the criterion isagain reached earlier for an easy (red) T2 than for a difficult(white) T2.
In short, the ABs produced with easy and difficult targets(for both T1 and T2) shows predictable differences in theirtime courses. As compared with easy targets, the difficulttargets show a deeper AB that reaches the minimumperformance later and recovers the performance of the controlcondition later. In the next section, we check whether severalindexes based on the errors also reflect this consistent effect ofthe differential difficulty of the target-defining colors.
Analysis of errors in T2, given a hit in T1
Errors in T2 were analyzed by calculating a set of responseparameters that reflect several facets of informationprocessing during the task. But a caution must be notedbefore the analysis of errors. Suppose that the totalfrequency of responses coming from positions neighboringT2 (e.g., from positions between ±2) is calculated for eachT1–T2 lag. If this value is calculated conditionalized to ahit for T1, there is a bias for lags +1 and +2. For lag 2 theitem from position –2 has been already reported correctlyfor T1, and the same happens for the item from position –1in the lag 1 condition. Then, the probability of reporting anitem from positions ±2 is reduced in those two conditions,since it can come only from four positions, instead of five.If this is not taken into account, the comparison betweenthe lag conditions will be biased against lag 1 and lag 2conditions. Nevertheless, in the analysis of most of theresponse parameters, we do not need to include the
conditions of lags +1 and +2 to reach a conclusion. Inthose cases, the statistical analyses will be restricted to lag 3or longer.
Delay We calculated for each observer the average position ofthe letters reported as T2, conditionalized to a hit on T1, as afunction of lag. Taking only lag 3 and higher lags, a 4 × 7(group × lag) ANOVA on the average of the positions of theresponses to T2 (within T2 ± 2), conditionalized to a hit on T1,reveals main effects of group,F(3, 37) = 9.804,MSE = 1.039,p < .001, and of lag, F(6, 222) = 9.718, MSE = 0.392, p <.001, and also of the interaction, F(18, 222) = 1.673, MSE =0.067, p < .05. The shape of the functions in Fig. 5 mirrorsthat of the AB, although shifted to the right. In fact, thehighest delay is observed at lag 4 in the four experimentalconditions; as was expected, the peaks of the delay areproduced later than the peaks of the AB (lag 2 for threeconditions [RR, RW, and WR] and between lag 2 and lag 3for one condition [WW]1). Furthermore, the delay of theresponses is generally higher for the condition with a largerAB (WW group) and lower for the condition with a smallerAB (RR group). In short, the temporal course of the delay isdifferent from that of the AB, although they are closelyrelated (the delay is larger as the AB deepens).
The values for the largest lag (lag 9) are close to thosefor their corresponding control conditions. This result isdifferent from the conclusion of Vul et al. (2008a; althoughthey did not compare the results with a control condition,since they did not include such a condition; instead, thecomparison was made against the performance with T1).
Suppression Suppression was operationalized in two ways.First, we calculated for each observer the percentage ofresponses to T2 that were letters from the central set (T2 ± 2),conditionalized to a hit on T1, as a function of lag. Again, wetook only lag 3 and later positions, for the same reason as thatexplained above. A 4 × 7 (group × lag) ANOVA on thepercentage of T2 ± 2 responses to T2, conditionalized to a hiton T1, reveals main effects of group, F(3, 37) = 14.274,
0
20
40
60
80
100
0 1 2 3 4 5 6 7 8 9 10
T2/
T1
LAG
RWWWRRWR
Fig. 4 Functions fitted for the four experimental conditions accordingto Equation 1. They relate the performance in identifying T2, given ahit in identifying T1, as a function of the T1–T2 lag
Lag
AP
R
RW
WW
WR
RR
0,7
0,5
0,3
0,1
-0,1
-0,30 1 2 3 4 5 6 7 8 9 C
Fig. 5 Delay of the responses to T2, plotted across the T1–T2 lags,for the four experimental conditions. It is based on trials on which T1was correctly identified. The delay is calculated as the averageposition of the responses (APR) within T2 ± 2. Given that there aremany correct responses (delay = 0), the typical average delay usuallyis between –0.5 and +1 (see Botella et al., 2001; Botella & Eriksen,1991; Botella et al., 1992). The values for C are the averages in thecontrol conditions
1368 Atten Percept Psychophys (2011) 73:1361–1373

MSE = 0.562, p < .001, of lag, F(6, 222) = 104.08, MSE =0.907, p < .001, and the interaction, F(18, 222) = 4.158,MSE = 0.036, p < .001. The shape of the functions in Fig. 6amirrors that of the AB. The higher suppression is producedaround lag 2, that of the maximum AB; furthermore,suppression is higher for the condition with a larger AB(WW) and lower for the condition with a smaller AB (RR).The time course of the suppression is the same as that of theAB, although different from the time course of the delay.
As was explained above, we also took the percentage ofdon’t know responses as a second index of suppression. Wecalculated for each observer the percentage of suchresponses to T2, conditionalized to a hit on T1, as afunction of lag. A 4 × 9 (group × lag) ANOVA on thosepercentages reveals main effects of group, F(3, 37) = 6.086,MSE = 0.551, p < .01, of lag, F(8, 296) = 33.944, MSE =0.444, p < .001, and of the interaction, F(24, 296) = 2.951,MSE = 0.039, p < .01. The shape of the functions in Fig. 6bmirrors again that of the AB. The higher suppression isproduced for lag 2, which is the lag with the maximum ABfor three conditions (RR, RW, and WR), and is the same forlag 2 and lag 3 for one condition (WW). Furthermore,suppression is higher for the condition with a larger AB(WW) and lower for the condition with a smaller AB (RR).The time course of the suppression is the same as that of theAB, although different from the time course of the delay.
Diffusion Following Vul et al. (2008a), we calculated foreach observer the variance of the positions of the lettersreported for T2, conditionalized to a hit on T1, as a function
of lag. As above, we took only lag 3 and later positions. A4 × 7 (group × lag) ANOVA on the variances of T2 ± 2responses to T2, conditionalized to a hit on T1, reveals maineffects of group, F(3, 36) = 3.792, MSE = 0.456, p < .02, oflag, F(6, 216) = 26.344, MSE = 2.021, p < .001, and of theinteraction, F(18, 216) = 2.411, MSE = 0.185, p < .01. As isshown in Fig. 7a, the data are uncertain as to when themaximum diffusion is produced, but it is around lag 2.However, what seems clear is that the maximum diffusion isnot produced in lag 4, as in the delay. What seems moreplausible is that the time course of this parameter is the sameas that of the AB and the suppression parameters.
Confusions Confusions were measured as the percentage ofresponses reporting a letter not presented in the series,conditionalized to a hit on T1, as a function of lag. A 4 × 9(groups × lags) ANOVA on those percentages reveals nosignificant main effects of group, F(3, 37) = 0.310, MSE =0.001, p = .818, or of lag, F(8, 296) = 1.487, MSE = 0.001,p = .161, and no interaction, F(24, 296) = 1.468, MSE =0.001, p = .076. Apparently, confusions are not significantlyinvolved in the AB effect (Fig. 7b).
Discussion
Taken as a whole, the results of the present experimentconverge with the general view of the AB when the
(a)
%
RW
WW
WR
RR
(b)
%
RW
WW
WR
RR
100
80
60
40
20
00 1 2 3 4 5 6 7 8 9
0 1 2 3 4 5 6 7 8 9
100
80
60
40
20
0
Lag
Lag
Fig. 6 Suppression of the responses to T2, plotted across the T1–T2lags, for the four experimental conditions. It is based on trials onwhich T1 was correctly identified. The suppression is assessed in twoways: a as the total percentage of the responses originated within theT2 ± 2 interval and b as the percentage of don’t know responses
RW
WW
WR
RR
% C
on
fus. RW
WW
WR
RR
1,5
1
0,5
00 1 2 3 4 5 6 7 8 9
0 1 2 3 4 5 6 7 8 9
10
5
0
Lag
Lag
Var
(b)
(a)
Fig. 7 Diffusion and confusions in the responses to T2, plotted acrossthe T1–T2 lags, for the four experimental conditions. They are basedon trials on which T1 was correctly identified. a Diffusion iscalculated as the variance of the positions of the responses withinT2 ± 2. b Confusions are calculated as the percentage of reports ofitems not presented in the series
Atten Percept Psychophys (2011) 73:1361–1373 1369

frequencies of illusory conjunctions and its distribution areanalyzed, taking the model of Botella et al. (2001) as aframework.
The hit rates show the typical U-shaped function of theAB in the conditions created from the combinations of twotargets with an easy (red) and/or a difficult (white) color.Furthermore, the depth and the time course of the ABfunctions are predictable from those levels of difficulty.
More important for our goals, the set of responseparameters employed to analyze the responses producedduring the AB (including hits, several types of errors, andmisses) show that they can be characterized by twodifferent time courses. The first one has its peak at aboutlag 2 and includes the AB (T2/T1) per se, the twoparameters of suppression (the don’t know responses andthe availability of the items presented during the blink),and, probably, the diffusion (variability of the positions ofthe items reported). The second group includes only thedelay (average position of the items reported). Theconfusions parameter does not show any effect at all.
Roughly speaking, the first group of response param-eters and its time course reflect what does not happenduring the AB (or happens less), while the delay and itsseparate time course reflect what actually happens. Onone side, during the AB, it does not happen (or happensless) that the observer identifies T2 at the level ofconsciousness for a voluntary report. Fewer hits andmore suppression are found as observable consequencesof that impairment in processing T2. There is lesssuccessful processing and reporting of T2, as comparedwith the control conditions. However, on the other side,it is also shown that another attempt to give a response,probably based on partial and degraded information(isolated features, or types), is triggered after the firstattempt fails. This second attempt happens more fre-quently when T2 is presented during the blink, ascompared with the control conditions. The average delayreturns to a size similar to that for the control conditionwhen the T1–T2 lag is so long that any AB effect hasvanished. The idea of two sequential attempts to generatea response is at the core of the model of illusoryconjunctions of Botella et al. (2001).
Although the two time courses are different, they are notindependent. The WW condition shows the largest impair-ment, as reflected in the parameters of the first group,whereas the RR condition shows the smallest impairment(longer and deeper blink and larger suppression for the WWcondition; see Figs. 3 and 6). As was expected, the samehappens to the parameter with a different time course (thelargest delay is also observed for the WW condition,whereas the smallest is again observed for the RRcondition; see Fig. 5). Apparently, the delay and its timecourse are time dependent on the time course of the first
group of processes. The delay reflects processes that aretriggered after the processes reflected in the AB.
At the longest lag (lag 9), the average delay of theresponses recovers the values reached in the controlcondition. This result contradicts that of Vul et al.(2008a), who found a persistent delay effect with evenlonger lags. This difference is probably due to the fact thatwe employed a task that produced “genuine” illusoryconjunctions, instead of a cuing task. In tasks in whichone stimulus works as a cue for reporting another stimulus,the migrations are allowed in time but also involve shifts ofattention in the space domain (Reeves & Sperling, 1986).
Our results are not a by-product of the specific taskemployed, since we found many results familiar from ABexperiments. Besides the standard AB depicted in Fig. 3,we found that the duration and size of the AB is a functionof the processing load from both targets. Generallyspeaking, the task is more difficult for white targets thanfor red targets (as revealed by comparing the levels ofperformance in the control, one-target conditions; seeFig. 2). As a consequence, for a given T2 color (white orred), performance is worse when T1 is white than when it isred (the AB is longer and/or deeper). Simultaneously, for agiven T1 color (white or red), performance is worse whenT2 is white than when T2 is red (again, the AB is longerand/or deeper).
Furthermore, we found that a task switch between T1and T2 impairs performance on T1. As is shown in Fig. 2,this happens for both colors. In our experiment, the twotargets were reported after the series had finished, so that,probably during the switch, the identity of T1 wassometimes lost. When both targets were in the same color,there was no task switching, and this was not a source ofadditional errors with T1.
Illusory conjunctions and the AB
As was sketched in the introduction, Botella et al. (2001;Botella, Narváez, Suero, & Juola, 2007) proposed a two-stage model of the formation of illusory conjunctionsproduced as migrations in the temporal axis. In the firststage, the detection of the target-defining feature triggers anepisode of focalization of attention on the target. Atpresentation rates of 8–12 items per second, this firstattempt frequently succeeds. However, when it fails, asecond attempt is made (the second stage of the model) onthe basis of partial information (essentially, isolatedfeatures; Quinlan, 2003; Treisman & Gelade, 1980).
From the perspective of that model, what happens duringthe blink is that selective attention to T2 is, on average,delayed, an idea previously discussed by several authors(Chun, 1997a; Vul et al., 2008a). The consequences are thatfewer trials yield a reportable response on the first attempt,
1370 Atten Percept Psychophys (2011) 73:1361–1373

more trials are finished with a response from the secondattempt, and more trials do not yield any reportableresponse, increasing the rate of don’t know responses. Theprocessing of T1 and the episode triggered by the +1distractor suppress several items, which do not enter intoshort-term visual memory; the suppression includes bothT2 (when presented in positions close to T1) and thedistractors in the positions immediately following T1. As aconsequence, the hit rate is reduced (the AB itself), butother items are also suppressed. Of course, the temporalwindow of that episode varies as a function of the processingload for T1. Although the episode is triggered by theunexpected entering of a distractor into visual short-termmemory (the +1 distractor), once started, its duration is afunction of the duration of the processing of T1.
The items that survive the episode are not completelyprocessed; specifically, what survive are often the isolatedfeatures that compose them, because attention has not hadthe opportunity to convert them from types to tokens(Kanwisher, 1991). The second stage of Botella et al.’s(2001) model consists of a sophisticated guessing from therelative activation of the representation of the isolatedfeatures. Those relative activations are converted into candi-dates translating them into discrete states (Vul, Hanus, &Kanwisher, 2009). This attempt begins as soon as the firstattempt fails, and failures are more frequent during the blink.Its later beginning is reflected in the fact that the maximumdelay is reached around lag 4, later than the maximum AB.
One of our results also converges with the generallyassumed idea that the AB is actually an attentional (not aperceptual) effect. The frequency of items reported that werenot presented in the series was practically zero andindependent of the lag. If the quality of a perceptual analysisis impaired, it is expected that, sometimes, the items will bemiscategorized (Popple & Levi, 2008). As a consequence,the frequency of nonpresented but reported items should behigher for lags with a deeper AB effect (lags 2 and 3). Ourresults show that observers prefer to give a don’t knowresponse to a T2 presented during the blink than to makewhat they probably consider a pure guess (pure guesseswould be reflected in a higher probability of reporting anonpresented item).
The picture that emerges from our results matches thegeneral view depicted in the introduction: The AB istriggered by the detection of T1 (and probably filler 1) anddisappears gradually as the T1–T2 lag increases. Our resultsare compatible with several alternative explanations of themechanisms involved. Of course, the relationship betweenthe processing load for T1 and the length and size of theepisode demonstrates that what interferes during the ABepisode are the processes associated with T1 (Raymond etal., 1992; Shapiro et al., 1994). The rate of suppressionindicates that the effect of the interference is that the items
following T1 are not properly entered (or consolidated) intoshort-term visual memory (Chun & Potter, 1995). However,our results are also compatible with the idea that theepisode is triggered by the +1 item and that it consists inoscillations of the attentional enhancement of the items(Olivers & Meeter, 2008). Furthermore, the effect of areduced attentional impairment is that the response is basedon partial information (feature types), instead of reportableindividuated tokens (Bowman & Wyble, 2007; Vul et al.2008a). Apparently, all those models have elements willprove valuable for a more general, comprehensive view ofthe temporal dynamics of attention.
However, what is new in the experiments that haveanalyzed errors made during the AB is that they help us toget a more comprehensive view of this effect. As viewedfrom a model such as that of Botella et al. (2001), it can beconcluded that the AB deeply impairs the first attempt toyield a response (via focal attention). More responses areproduced as a second attempt, based on partial, degradedinformation and prone to generate illusory conjunctions.Those responses are not pure guesses. They mostly involvefeatures that have, indeed, been presented in the series, inpositions close to the target, and, on average, have comefrom positions later than when the target is presentedoutside the AB window.
Author Notes We thank Julio Lillo for his assistance in managingthe colors and Jim Juola for his help with the manuscript. Parts of theresults were presented at the 50th Annual Meeting of the PsychonomicSociety, Boston, MA.
Notes 1 One of the reviewers highlighted the risks of making such astrong statement, since, in fact, we do not know the average delay forlags 1 and 2. Although this is true, it is also true that in all theexperiments and conditions run in our laboratory, we have alwaysfound one-mode distributions. Even assuming that we are makingsome inference (we cannot check it directly), what we are saying isvery probably true. In three of the conditions, the function showhigher values for lag 4 than for lag 3, and in the other condition, thereis no difference between them. Assuming one-peak functions, we canstate safely that the maximum delay is produced later than lag 2.We have made similar inferences for other response indexes thatcannot be calculated for lags 1 and 2.
Appendix
What follows is a mathematical model that expressesperformance for T2/T1 as a function of the T1–T2 lag.Instead of being built from a conceptual model, it is anempirical development intended to allow more accuratecomparisons between experimental conditions. The finalmodel expresses performance at any lag as some reductionas compared with a control condition, without any effectfrom T1. Of course, for long lags, T2/T1 performanceasymptotically approaches that level of performance. The
Atten Percept Psychophys (2011) 73:1361–1373 1371

asymptotical performance is estimated from the averageperformance for several lags in the control, one-target,condition; it is the amount d in the model. The final model is
f ðlagÞ ¼ d � ð1� ða � ðlag � bÞ2Þ � e�c�lagÞ:
In this expression, f(lag) is the probability of a correctresponse to T2, given a hit for T1; a and c are scaleparameters; and b is a parameter of position. Table A1 showsthe estimates for the parameters, the R2 fit index, and threespecial values for each of the 4 two-target conditions (thefour fitted functions are depicted in Fig. 4). The special
values of Table A1 are the minimum value reached[ f (lagMin); this reflects the maximum depth of the AB], thelag at which the minimum is reached (lagMin), and the lag atwhich the value corresponding to 95% of the performance inthe control condition is reached (lag95). The values inTable A1 are obtained from the functions fitted for eachexperimental condition: f (lagMin) is the minimum of thefunction, lagMin is the value of the lag at which the functionreaches the minimum, and lag95 is the value of the lag atwhich the function reaches the amount equal to the product.95 ∙ d. The last two values reflect the time course of the AB.Larger values reflect a longer AB.
References
Botella, J., Barriopedro, M. I., & Suero, M. (2001). A model of theformation of illusory conjunctions in the time domain. Journal ofExperimental Psychology: Human Perception and Performance,27, 1452–1467.
Botella, J., & Eriksen, C. W. (1991). Pattern changes in rapid serialvisual presentation tasks without strategic shifts. Bulletin of thePsychonomic Society, 29, 105–108.
Botella, J., & Eriksen, C. W. (1992). Filtering versus parallelprocessing in RSVP tasks. Perception & Psychophysics, 51,334–343.
Botella, J., García, M. L., & Barriopedro, M. I. (1992). Intrusionpatterns in rapid serial visual presentation tasks with tworesponse dimensions. Perception & Psychophysics, 52, 547–552.
Botella, J., Narváez, M., Suero, M., & Juola, J. F. (2007). Parallelprocessing of stimulus features during RSVP: Evidence from thesecond response. Perception & Psychophysics, 69, 1315–1323.
Bowman, H., & Wyble, B. P. (2007). The simultaneous type, serialtoken model of temporal attention and working memory.Psychological Review, 114, 38–70.
Chun, M. M. (1997a). Temporal binding errors are redistributed by theattentional blink. Perception & Psychophysics, 59, 1191–1199.
Chun, M. M. (1997b). Types and tokens in visual processing: Adouble dissociation between the attentional blink and repetitionblindness. Journal of Experimental Psychology: Human Percep-tion and Performance, 23, 738–755.
Chun, M. M., & Potter, M. C. (1995). A two-stage model for multipletarget detection in rapid serial visual presentation. Journal ofExperimental Psychology: Human Perception and Performance,21, 109–127.
Di Lollo, V., Kawahara, J., Ghorashi, S. M. S., & Enns, J. T. (2005).The attentional blink: Resource depletion or temporary loss ofcontrol. Psychological Research, 69, 191–200.
Dux, P. E., & Harris, I. M. (2007a). On the failure of distractorinhibition in the attentional blink. Psychonomic Bulletin &Review, 14, 723–728.
Dux, P. E., & Harris, I. M. (2007b). Viewpoint costs occur duringconsolidation: Evidence from the attentional blink. Cognition,101, 47–58.
Dux, P. E., & Marois, R. (2009). The attentional blink: A review of dataand theory. Attention, Perception, & Psychophysics, 71, 1683–1700.
Jolicœur, P. (1998). Modulation of the attentional blink by onlineresponse selection: Evidence from speeded and unspeeded task1decisions. Memory & Cognition, 26, 1014–1032.
Jolicœur, P., Dell’Acqua, R., & Crebolder, J. M. (2001). Theattentional blink bottleneck. In K. Shapiro (Ed.), The limits ofattention: Temporal constraints in human information processing(pp. 82–99). Oxford: Oxford University Press.
Juola, J. F., Botella, J., & Palacios, A. (2004). Task and locationswitching effects on visual attention. Perception & Psychophysics,66, 1303–1317.
Kanwisher, N. (1991). Repetition blindness and illusory conjunctions:Errors in binding visual types with visual tokens. Journal ofExperimental Psychology: Human Perception and Performance,17, 404–421.
Kiesel, A., Steinhauser, M., Wendt, M., Falkenstein, M., Jost, K.,Philipp, A. M., & Koch, I. (2010). Control and interference intask switching—a review. Psychological Bulletin, 136, 849–874.
Koch, I., Gade, M., Schuch, S., & Philipp, A. M. (2010). The role ofinhibition in task switching: a review. Psychonomic Bulletin &Review, 17, 1–14.
Table A1 Models fitted from equation 1 for the four experimental conditions (T1/T2): parameter estimates, fit indices and several critical values(see text)
Condition Parameters R2 f(lagMin) LagMin Lag95
ba bb bc bd
RW 3.486 0.318 1.218 58.9 0.993 8.306 1.960 6.467
WW 4.215 0.781 1.052 54.4 0.975 5.081 2.682 7.963
WR 2.998 0.464 1.075 80.8 0.993 11.892 2.324 7.415
RR 4.422 0.441 1.349 85.2 0.992 23.379 1.924 5.816
1372 Atten Percept Psychophys (2011) 73:1361–1373

McLean, J. P., Broadbent, D. E., & Broadbent, M. H. P. (1983).Combining attributes in rapid serial visual presentation tasks.Quarterly Journal of Experimental Psychology, 35A, 171–186.
Monsell, S. (2003). Task switching. Trends in Cognitive Sciences, 7,134–140.
Nieuwenstein, M., Van der Burg, E., Theeuwes, J., Wyble, B., &Potter, M. (2009). Temporal constraints on conscious vision: Onthe ubiquitous nature of the attentional blink. Journal of Vision, 9(9, Article 18), 1–14.
Olivers, C. N. L., & Meeter, M. (2008). A boost and bounce theory oftemporal attention. Psychological Review, 115, 836–863.
Popple, A. V., & Levi, D. M. (2007). Attentional blink as errors intemporal binding. Vision Research, 47, 2973–2981.
Popple, A. V., & Levi, D. M. (2008). The attentional blink inamblyopia. Journal of Vision, 8(13, Article 12), 1–9.
Quinlan, P. T. (2003). Visual feature integration theory: Past, present,and future. Psychological Bulletin, 129, 643–673.
Raymond, J. E., Shapiro, K. L., & Arnell, K. M. (1992). Temporarysuppression of visual processing in an RSVP task: An attentionalblink? Journal of Experimental Psychology: Human Perceptionand Performance, 18, 849–860.
Reeves, A., & Sperling, G. (1986). Attention gating in short-termvisual memory. Psychological Review, 93, 180–206.
Shapiro, K. L., Raymond, J. E., & Arnell, K. M. (1994). Attention tovisual pattern information produces the attentional blink in rapidserial visual presentation. Journal of Experimental Psychology:Human Perception and Performance, 20, 357–371.
Treisman, A. M., & Gelade, G. (1980). A feature-integration theory ofattention. Cognitive Psychology, 12, 97–136.
Vul, E., Hanus, D., & Kanwisher, N. (2008). Delay of selective attentionduring the attentional blink. Vision Research, 48, 1902–1909.
Vul, E., Hanus, D., & Kanwisher, N. (2009). Attention asinference: Selection is probabilistic; responses are all-or-nonesamples. Journal of Experimental Psychology: General, 138,546–560.
Vul, E., Nieuwenstein, M., & Kanwisher, N. (2008). Temporalselection is suppressed, delayed, and diffused during theattentional blink. Psychological Science, 19, 55–61.
Wyble, B., Bowman, H., & Nieuwenstein, M. (2009). The attentionalblink provides episodic distinctiveness: Sparing at a cost. Journal ofExperimental Psychology: Human Perception and Performance,35, 787–807.
Atten Percept Psychophys (2011) 73:1361–1373 1373
Copyright © 2022 FDOKUMEN


![Disquotation and Infinite Conjunctions [Erkenntnis]](https://static.fdokumen.com/doc/165x107/631ccf205a0be56b6e0e6216/disquotation-and-infinite-conjunctions-erkenntnis.jpg)