Gamma Abnormalities During Perception of Illusory Figures in Autism
13
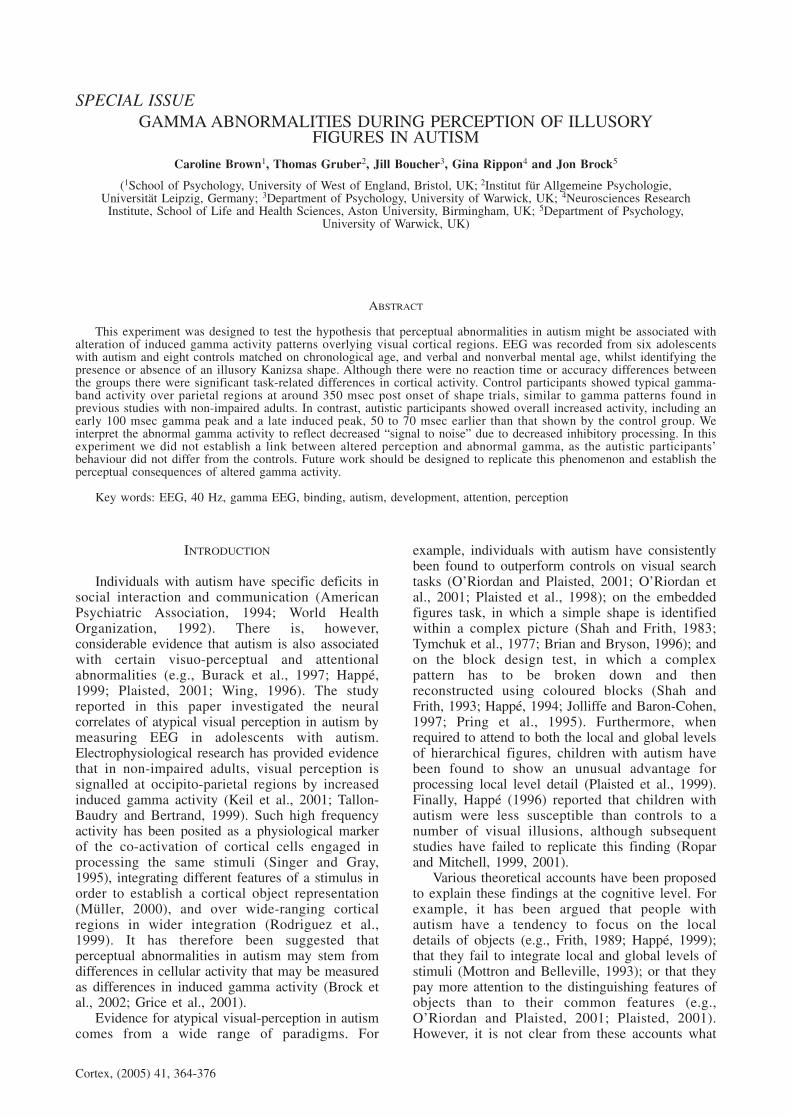
INTRODUCTION Individuals with autism have specific deficits in social interaction and communication (American Psychiatric Association, 1994; World Health Organization, 1992). There is, however, considerable evidence that autism is also associated with certain visuo-perceptual and attentional abnormalities (e.g., Burack et al., 1997; Happé, 1999; Plaisted, 2001; Wing, 1996). The study reported in this paper investigated the neural correlates of atypical visual perception in autism by measuring EEG in adolescents with autism. Electrophysiological research has provided evidence that in non-impaired adults, visual perception is signalled at occipito-parietal regions by increased induced gamma activity (Keil et al., 2001; Tallon- Baudry and Bertrand, 1999). Such high frequency activity has been posited as a physiological marker of the co-activation of cortical cells engaged in processing the same stimuli (Singer and Gray, 1995), integrating different features of a stimulus in order to establish a cortical object representation (Müller, 2000), and over wide-ranging cortical regions in wider integration (Rodriguez et al., 1999). It has therefore been suggested that perceptual abnormalities in autism may stem from differences in cellular activity that may be measured as differences in induced gamma activity (Brock et al., 2002; Grice et al., 2001). Evidence for atypical visual-perception in autism comes from a wide range of paradigms. For example, individuals with autism have consistently been found to outperform controls on visual search tasks (O’Riordan and Plaisted, 2001; O’Riordan et al., 2001; Plaisted et al., 1998); on the embedded figures task, in which a simple shape is identified within a complex picture (Shah and Frith, 1983; Tymchuk et al., 1977; Brian and Bryson, 1996); and on the block design test, in which a complex pattern has to be broken down and then reconstructed using coloured blocks (Shah and Frith, 1993; Happé, 1994; Jolliffe and Baron-Cohen, 1997; Pring et al., 1995). Furthermore, when required to attend to both the local and global levels of hierarchical figures, children with autism have been found to show an unusual advantage for processing local level detail (Plaisted et al., 1999). Finally, Happé (1996) reported that children with autism were less susceptible than controls to a number of visual illusions, although subsequent studies have failed to replicate this finding (Ropar and Mitchell, 1999, 2001). Various theoretical accounts have been proposed to explain these findings at the cognitive level. For example, it has been argued that people with autism have a tendency to focus on the local details of objects (e.g., Frith, 1989; Happé, 1999); that they fail to integrate local and global levels of stimuli (Mottron and Belleville, 1993); or that they pay more attention to the distinguishing features of objects than to their common features (e.g., O’Riordan and Plaisted, 2001; Plaisted, 2001). However, it is not clear from these accounts what Cortex, (2005) 41, 364-376 SPECIAL ISSUE GAMMA ABNORMALITIES DURING PERCEPTION OF ILLUSORY FIGURES IN AUTISM Caroline Brown 1 , Thomas Gruber 2 , Jill Boucher 3 , Gina Rippon 4 and Jon Brock 5 ( 1 School of Psychology, University of West of England, Bristol, UK; 2 Institut für Allgemeine Psychologie, Universität Leipzig, Germany; 3 Department of Psychology, University of Warwick, UK; 4 Neurosciences Research Institute, School of Life and Health Sciences, Aston University, Birmingham, UK; 5 Department of Psychology, University of Warwick, UK) ABSTRACT This experiment was designed to test the hypothesis that perceptual abnormalities in autism might be associated with alteration of induced gamma activity patterns overlying visual cortical regions. EEG was recorded from six adolescents with autism and eight controls matched on chronological age, and verbal and nonverbal mental age, whilst identifying the presence or absence of an illusory Kanizsa shape. Although there were no reaction time or accuracy differences between the groups there were significant task-related differences in cortical activity. Control participants showed typical gamma- band activity over parietal regions at around 350 msec post onset of shape trials, similar to gamma patterns found in previous studies with non-impaired adults. In contrast, autistic participants showed overall increased activity, including an early 100 msec gamma peak and a late induced peak, 50 to 70 msec earlier than that shown by the control group. We interpret the abnormal gamma activity to reflect decreased “signal to noise” due to decreased inhibitory processing. In this experiment we did not establish a link between altered perception and abnormal gamma, as the autistic participants’ behaviour did not differ from the controls. Future work should be designed to replicate this phenomenon and establish the perceptual consequences of altered gamma activity. Key words: EEG, 40 Hz, gamma EEG, binding, autism, development, attention, perception
Transcript of Gamma Abnormalities During Perception of Illusory Figures in Autism
INTRODUCTION
Individuals with autism have specific deficits insocial interaction and communication (AmericanPsychiatric Association, 1994; World HealthOrganization, 1992). There is, however,considerable evidence that autism is also associatedwith certain visuo-perceptual and attentionalabnormalities (e.g., Burack et al., 1997; Happé,1999; Plaisted, 2001; Wing, 1996). The studyreported in this paper investigated the neuralcorrelates of atypical visual perception in autism bymeasuring EEG in adolescents with autism.Electrophysiological research has provided evidencethat in non-impaired adults, visual perception issignalled at occipito-parietal regions by increasedinduced gamma activity (Keil et al., 2001; Tallon-Baudry and Bertrand, 1999). Such high frequencyactivity has been posited as a physiological markerof the co-activation of cortical cells engaged inprocessing the same stimuli (Singer and Gray,1995), integrating different features of a stimulus inorder to establish a cortical object representation(Müller, 2000), and over wide-ranging corticalregions in wider integration (Rodriguez et al.,1999). It has therefore been suggested thatperceptual abnormalities in autism may stem fromdifferences in cellular activity that may be measuredas differences in induced gamma activity (Brock etal., 2002; Grice et al., 2001).
Evidence for atypical visual-perception in autismcomes from a wide range of paradigms. For
example, individuals with autism have consistentlybeen found to outperform controls on visual searchtasks (O’Riordan and Plaisted, 2001; O’Riordan etal., 2001; Plaisted et al., 1998); on the embeddedfigures task, in which a simple shape is identifiedwithin a complex picture (Shah and Frith, 1983;Tymchuk et al., 1977; Brian and Bryson, 1996); andon the block design test, in which a complexpattern has to be broken down and thenreconstructed using coloured blocks (Shah andFrith, 1993; Happé, 1994; Jolliffe and Baron-Cohen,1997; Pring et al., 1995). Furthermore, whenrequired to attend to both the local and global levelsof hierarchical figures, children with autism havebeen found to show an unusual advantage forprocessing local level detail (Plaisted et al., 1999).Finally, Happé (1996) reported that children withautism were less susceptible than controls to anumber of visual illusions, although subsequentstudies have failed to replicate this finding (Roparand Mitchell, 1999, 2001).
Various theoretical accounts have been proposedto explain these findings at the cognitive level. Forexample, it has been argued that people withautism have a tendency to focus on the localdetails of objects (e.g., Frith, 1989; Happé, 1999);that they fail to integrate local and global levels ofstimuli (Mottron and Belleville, 1993); or that theypay more attention to the distinguishing features ofobjects than to their common features (e.g.,O’Riordan and Plaisted, 2001; Plaisted, 2001).However, it is not clear from these accounts what
Cortex, (2005) 41, 364-376
SPECIAL ISSUEGAMMA ABNORMALITIES DURING PERCEPTION OF ILLUSORY
FIGURES IN AUTISM
Caroline Brown1, Thomas Gruber2, Jill Boucher3, Gina Rippon4 and Jon Brock5
(1School of Psychology, University of West of England, Bristol, UK; 2Institut für Allgemeine Psychologie,Universität Leipzig, Germany; 3Department of Psychology, University of Warwick, UK; 4Neurosciences Research
Institute, School of Life and Health Sciences, Aston University, Birmingham, UK; 5Department of Psychology,University of Warwick, UK)
ABSTRACT
This experiment was designed to test the hypothesis that perceptual abnormalities in autism might be associated withalteration of induced gamma activity patterns overlying visual cortical regions. EEG was recorded from six adolescentswith autism and eight controls matched on chronological age, and verbal and nonverbal mental age, whilst identifying thepresence or absence of an illusory Kanizsa shape. Although there were no reaction time or accuracy differences betweenthe groups there were significant task-related differences in cortical activity. Control participants showed typical gamma-band activity over parietal regions at around 350 msec post onset of shape trials, similar to gamma patterns found inprevious studies with non-impaired adults. In contrast, autistic participants showed overall increased activity, including anearly 100 msec gamma peak and a late induced peak, 50 to 70 msec earlier than that shown by the control group. Weinterpret the abnormal gamma activity to reflect decreased “signal to noise” due to decreased inhibitory processing. In thisexperiment we did not establish a link between altered perception and abnormal gamma, as the autistic participants’behaviour did not differ from the controls. Future work should be designed to replicate this phenomenon and establish theperceptual consequences of altered gamma activity.
Key words: EEG, 40 Hz, gamma EEG, binding, autism, development, attention, perception

Visual perception and gamma activity in autism 365
the underlying neurophysiological mechanismsmight be.
In a recent paper (Brock et al., 2002), wesuggested that many of these behaviouralphenomena in autism could be understood in termsof impairment in the integration or ‘binding’ offunctionally discrete information processing fromacross the brain. Evidence from intra-cellularrecording (Singer and Gray, 1995) and scalprecorded EEG has linked this binding process withgamma-band activity (Müller et al., 1996; 1997;Tallon-Baudry and Bertrand, 1999; Keil et al.,2001). In unimpaired participants, the onset of avisual stimulus gives rise to a burst of gammaactivity over occipital and parieto-occipital sites ataround 250-300 msec. This also occurs whenillusory objects are perceived, for instance whenKanizsa stimuli are presented (Tallon-Baudry et al.,1996). These types of tasks may best be consideredas “bottom-up” or perceptual tasks. When morecomplex tasks are undertaken, discrete bursts ofgamma activity have been identified overlyingcortical regions thought to be engaged in thosetasks. For instance modulation of attention givesrise to occipito-parietal bursts of gamma activity(Gruber et al., 1999; Müller et al., 2000; Müllerand Gruber, 2001), and word and non-word tasksshow differential gamma activity over auditorycortical regions (Pulvermüller et al., 1999).Additionally, tasks that involve attention or top-down integration of features have given rise tosimultaneous bursts of gamma activity over frontaland occipito-parietal regions (Rodriguez et al.,1999). These findings led us to predict that, whereintegration of cortically-distant information wasimpaired, variations in gamma-band activity mightbe found. Correspondingly, we predicted thatperceptual abnormalities in autism might beassociated with alteration of induced gammaactivity patterns overlying visual cortical regions.
EEG recording and analysis has the advantageof very high temporal resolution, compared to sayfunctional Magnetic Resonance Imaging (fMRI). InEEG neural activity changes occurring within a fewmilliseconds can be shown, whereas in fMRIrecordings of cerebral blood flow change requireseveral minutes. In conventional EEG analysis allthe correct, artifact-free trials for a given conditionare initially baselined around the mean voltage of aperiod preceding onset of the trial, and thensummed and an average signal calculated for eachchannel recorded. This mean value is the EvokedPotential1, and depending upon both scalp locationand task being investigated a set of recognizedcomponents may be identified. Of particular interestto this study are visually evoked components calledN1, P1, N2, P2, and P3. The letter indicates
polarity, and the number the period after onset of avisual trial, i.e. 1 is in the 100-200 msec period, 2,the 200-300 msec and 3 at (variable) times after300 msec (Luck et al., 1990; O’Donnell et al.,1997). Most conventional analysis removes highfrequency activity by filtering it out, but as it hassuch relatively low power compared to the lowerfrequency activity, it is in fact quite acceptable tocalculate evoked potentials with the high frequencycomponent maintained.
Evoked potentials are considered to be thesummed activity of highly co-ordinated(synchronized) neural activity underlying the scalp(Hillyard and Picton, 1987), and it is this propertythat led electrophysiologists to investigate highfrequency (gamma) activity, as it has beensuggested that gamma activity is the signalbetween assemblies of neurons that they areworking on the same object (percept, idea,cognition). Consequently, early components (N1,P1) may be thought of as the overall increase ingeneralized activity, and early gamma componentsare measured at the same time over the samecortical regions during the attentional control ofperception (Herrmann et al., 1999). Latercomponents (N2, P2) may correspond with thebinding of inter-areal information, andcorresponding gamma components have also beenidentified (Tomberg, 1999). Because the P3represents a large positive extra-cellular charge andis variable in both onset and duration, it couldsignal that processing has been completed. Themethod used to identify gamma activity at latertime periods (induced gamma) identifies a gammaburst that occurs at varying times in each trial, inthe period preceding the P3 latency.
Evoked gamma band activity has beenidentified at a latency of around 100 msec poststimulus onset, over visual and auditory regions(Herrmann and Mecklinger, 2001; Yordanova et al.,1997; Bertrand and Tallon-Baudry, 2000 review).Evoked gamma-band response is highly phase-locked to stimulus onset, and is measured from theaverage (mean) of all summed trials, whereasinduced gamma band activity occurring later hasvariable onset latency and therefore can only beidentified on a trial-by-trial analysis. Hermann andMecklinger argue that evoked gamma band activityreflects the effect of attention on early visualprocessing. The separation of gamma activity into early and late components might be thought of as indirectly reflecting the different levels at which binding of neural response is required.The early component may be interpreted as thebinding of perceptual information within the samecortical area (i.e. intra-areal), whereas the latecomponent is assumed to reflect the binding offeed-forward and feed-back processing informationin a whole network of cortical areas (cortico-cortical) (Müller et al., 2000; Müller, 2000; Shibataet al., 1999).
1 This description simplifies the many variations that may be made in EEGrecording, for instance ongoing changes or response-related recordings maybe required, depending on the experimental paradigm.
Developmentally, onset of gamma band activityis critically related to the development of theperceptual ability to discriminate shapes. Thisaptitude develops in infants between the ages of 6and 9 months (Csibra, 2001), and Csibra et al.(2000) recently showed that gamma band activityover frontal regions became apparent as theperceptual ability to discriminate Kanizsa stimulideveloped. Research has shown that the locus ofgamma band activity shifts during development,which may be related to the development of matureattention systems. Gamma activity measured inchildren during auditory attention tasks (Yordanovaet al., 2000, 2002) showed that earlier indevelopment, (9-12 years) frontal gamma powerwas greater and more discriminative of stimulustype whereas later in development (13-16 years)parietal gamma power increased during attentiondemanding tasks.
Grice et al. (2001) compared gamma bandactivity over frontal regions in adults with autism,and unimpaired adults during a face discriminationparadigm. Unimpaired adults showed cleardiscriminative increases in frontal gamma activityduring presentation of upright faces compared withinverted faces. However, although adults withautism showed similar patterns of activity, theextent of gamma activity did not differsignificantly between upright and inverted faces.This suggests that in autism the gamma responsedoes not allow discrimination between stimuli.
In the current study, we further investigated theneural correlates of visual perception in autism bymeasuring gamma EEG during perception ofillusory Kanisza figures. The Kanizsa illusion hasbeen widely used to investigate processesunderlying perception, because the percept of theshape is overwhelming despite its illusory nature.Its arrangement allows the same objects to formboth a target-present and a target-absent condition,with inducers that can be oriented towards or away from each other. Conventional EEG researchhas shown that perception of Kanizsa shapes gives rise to a large negative peak (N2) at around250 msec after onset, followed by a positive peak(P300) at around 390 msec (Proverbio and Zani,2002). In spectral EEG research perception ofKanizsa has given rise to early evoked gammaband activity (Herrmann and Mecklinger, 1999,2001; Böttger, et al., 2002) and to the later induced gamma band component (Tallon et al.,1995; Tallon-Baudry et al., 1996). The inducedcomponent occurs at around the same latency asthe N2 component reported in ERP studies, that is250 msec.
It is unclear from previous behavioural studieswhether or not individuals with autism should beless susceptible to the Kanisza illusion than non-autistic individuals. Happé (1996) reported thatchildren with autism were less likely than controlsto report seeing an illusory shape. However, she
did not include a control condition in whichillusory shapes were not present. This concern wasaddressed by Ropar and Mitchell (1999, 2001),who failed to find any differences between childrenwith autism and controls in their susceptibility to a number of visual illusions, but these studies did not include any Kanizsa stimuli. Visualillusions may be subject to different cognitiveprocesses and neurobiological pathways (Gregory,2001), so it remains possible that individuals withautism may be relatively immune to Kaniszaillusions. The current study offered the opportunityto investigate both the behavioural response toKanisza illusions and the underlying neuralmechanisms in autism.
As part of a larger experiment, EEG recordingswere made of children with autism whilst theymade decisions regarding the presence or absenceof Kanizsa stimuli. It was predicted that theperceptual disturbances associated with autismwould be accompanied by differences in gammaband power over occipital, occipito-parietal orparietal regions (cf. Brock et al., 2002).
A crucial consideration was the control group toemploy in this exploratory study. Behaviouralstudies of autism often include younger typicallydeveloping children matched on a measure ofmental age. However, this approach offers thepotential confound that group differences in EEGpatterns may be explained simply in terms ofdifferences in cortical processing related tochronological age differences. To ensure thatdifferences in performance or neurophysiologicalcorrelates of performance of the Kanizsa task werenot confounded by differences in intelligence ordevelopmental stage, it was decided to test a groupof children matched for both chronological age andIQ. In the current study, therefore, children withautism were compared with a group of mentallyretarded children whose age and cognitive profilesmatched those of the children with autism.
METHOD
Participants
Twenty-four children between the ages of 11and 17 were recruited through special schools inand around Coventry, and as respondents to advertsplaced in the West Midlands Autistic SocietyNewsletter. All participants in the autism group hada clinical diagnosis of autism or Aspergersyndrome. The control participants were recruitedon the basis that they showed no otherdevelopmental disorder (e.g., Down Syndrome orFragile X Syndrome) to control only for mentalability with the group with autism. In the UK,children with non-syndrome related mentalretardation with reasonable language skills arecollectively assigned to a group described as
366 Caroline Brown and Others
Visual perception and gamma activity in autism 367
having “moderate learning difficulties” (MLD),which will be used to describe the control group inthe methods and results sections, whilst thechildren in the experimental group will bedescribed using the acronym ASD, (autisticspectrum disorder). All participating children hadsufficiently high language and cognitive skills toenable their understanding of the task and theexperimental procedure, and all were free fromepilepsy, had suffered no encephalic trauma andwere not taking neuroleptic or psychotropicmedication. Participants each received a £10 giftvoucher in recognition of their time andparticipation.
As might be expected given the difficultiesinvolved in collecting EEG data, it was found thatEEG data from many of these children were notuseable because of movement and eye-movementgenerated artifacts. Data are therefore reportedfrom sub-groups of six children with autism (theASD group) and eight mentally retarded children(the MLD group). Verbal and nonverbal mentalages were established using the Test of Receptionof Grammar [TROG] (Bishop, 1989) and theRavens Coloured Progressive Matrices [RAVENS](Raven, 1993) respectively. Parents were alsointerviewed using the Childhood Autism RatingScale [CARS] (Schopler et al., 1988). Independent-samples t-tests showed that the two groups wereclosely matched on chronological age, verbalmental age and non-verbal mental age, but that thechildren in the autism group had significantlyhigher scores on the CARS, as shown in Table I.
Stimuli
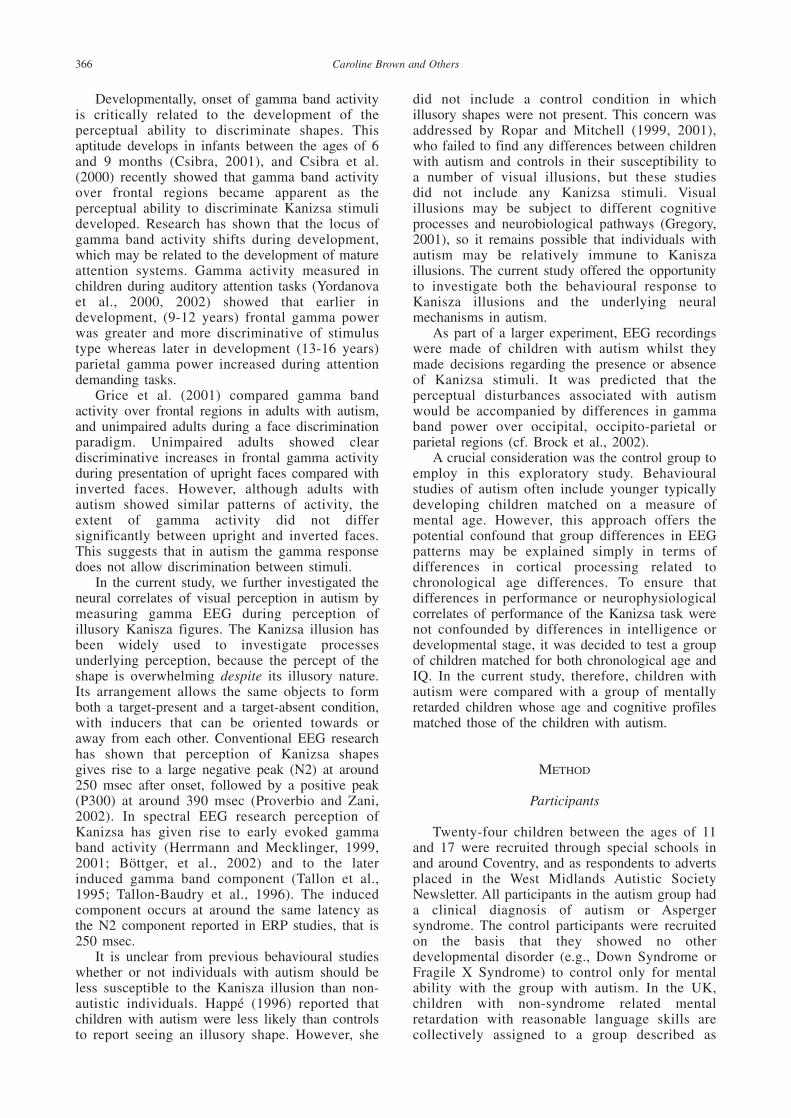
Stimuli for the EEG task were presented asblack and white images on a white screen within ablack border subtending 0.5° visual angle, thewhole image subtending 6.3° by 4.0° (h × w)visual angle in size. Examples of Kanizsa stimuliare shown in Figure 1. Stimuli were created inrectangles of 5 × 5 circles within the black border.This gave a set of 16 Kanizsa shape-stimuli eachof which were presented twice. Four exemplars ofKanizsa-random stimuli were created and used as‘target-absent’ control stimuli. Stimuli werepresented in a block of sixty-four trials, thirty-twoeach of Kanizsa-shape and Kanizsa-randomexemplars in randomised order.
Procedure
The volunteer children were initially tested forverbal age ability using the TROG in an intervieweither at their home or in an initial visit to thelaboratory. During this session the procedure wasexplained and outlined to both the child and theircarers using photographs of children beingrecorded using the SensorNet system. Inaccordance with British Psychological SocietyEthical Guidelines participants and carers werereassured that they could withdraw from the studyat any time, both in this and the later session.
The remaining cognitive measures wereadministered when the child attended the laboratoryfor EEG testing. In addition to the Ravens Matrices,participants were tested on the Block Design subtest(BDT) of the Wechsler Intelligence Scale forChildren (Wechsler, 1974), and on the Children’sEmbedded Figures Test (Witkin et al., 1971). TheCEFT was scored using the length of time (sec) ittook participants to identify the embedded figure,up to a maximum of 60 seconds (a time of 60seconds was recorded when participants failed toidentify the target shape), and reaction times werelog transformed (cf. Brian and Bryson, 1996).
Training was given in two stages. Initiallyparticipants were shown Kanizsa-shape andKanizsa-random stimuli in a book, and wereinstructed to point to a blue or green square to
TABLE I
Matching and Grouping Variables for Participant Groups
ASD MLD
M SD M SD t (12) p
AGE (years) 14.7 0.8 14.0 1.9 0.82 0.43TROG (score) 68.5 8.5 69.0 4.3 – 0.14 0.89TROG (age) 7.9 2.7 7.9 1.7 – –RAVENS (score) 26.8 7.3 24.6 7.6 0.55 0.59RAVENS (age) ~ 8.9 ~ 8.4 – –CARS (score) 34.5 3.2 19.8 2.6 9.47 0.00
Fig. 1 – Kanisza stimuli a) shape condition and b) randomcondition.

indicate whether they could see a shape or not.Only participants whose responses wereconsistently correct (100%) in this task proceededonto the second training phase. Three participantswere excluded at this point. The second phase oftraining was given once the SensorNet was in placeand recording conditions achieved within therecording booth. Training for the EEG task wasgiven by presenting stimuli on a computer screen,participants responding by means of a responsebox, pressing the blue button when they could seea rectangle, and pressing the green button when itwas absent.
Collection of EEG data was undertaken usingthe Geodesics Net system, which is much simplerto use than traditional caps because it consists of a lightweight net into which sponge coveredelectrodes are embedded. No pain or discomfort isreported by users, and this system is regularly usedin the collection of EEG data from infants (deHaan et al., 2002). Recording sessions took around25 minutes in total with the number of trials beinglimited to ensure that participants were able tomaintain necessary attention and alertness levels.The procedure was exactly the same as thatdescribed for the second training phase above.
All participants met the experimenters prior totaking part in the EEG recording, all weresufficiently language-able to understand both thetask and the recording procedures. Pace of theexperiment was set by the individual child andfollow-up comment from parents (and some of thechildren) suggested that the experience was one theparticipants had enjoyed.
EEG Recording and Analysis
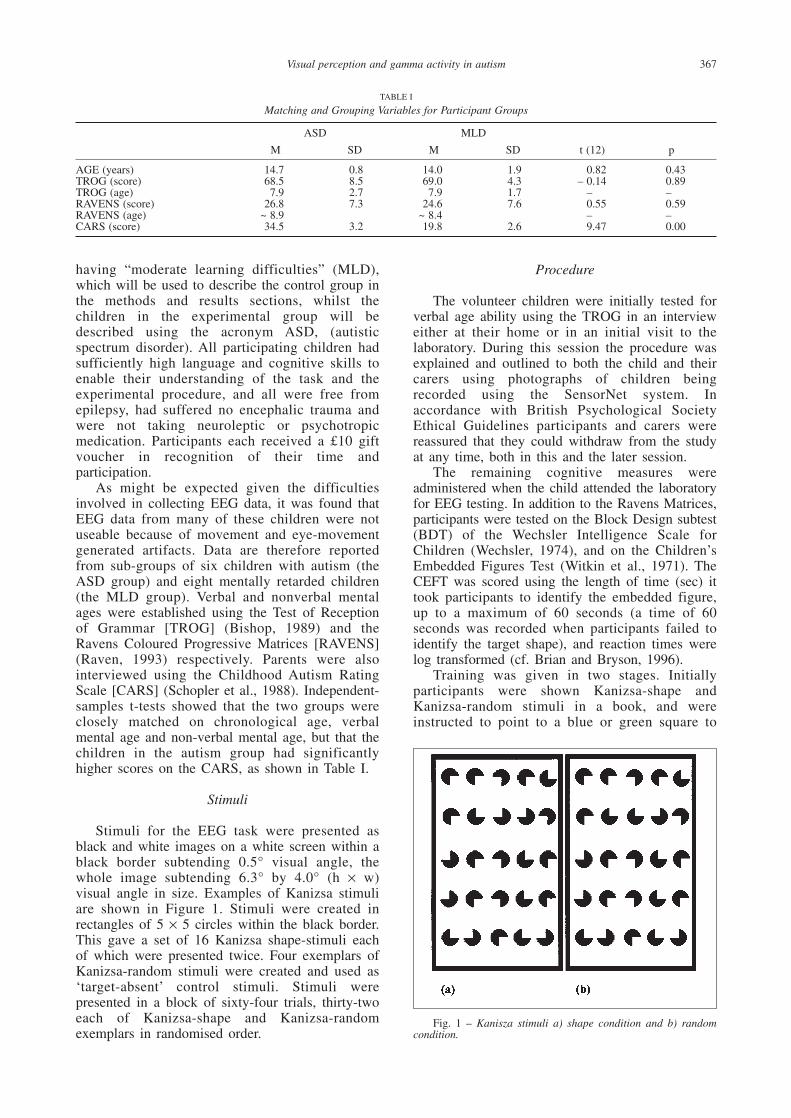
Continuous EEG data were recorded with a128-channel Electrical Geodesics Inc. Net Stationamplifier, via a dense array 128 electrodeGeodesics Sensor Net. The Vertex (Cz) was chosenas the reference, and impedances were kept below50 kW as recommended for the EGI high inputimpedance amplifier. Sampling rate was 250 Hz(any effect of aliasing would be expected togenerate introduction of lower frequency power,rather than high frequency gamma band effects),with an on-line bandpass filter of 0.1 to 200Hz,vertical and horizontal eye movements weremonitored using four of the 128 electrodes.Specific analysis was performed off-line on datafrom trials in which a correct answer was given.Further analysis was performed on a subset ofelectrodes corresponding to the sites of theextended 10-20 system (Jasper, 1958), as shown inFigure 2. Electrode sites used for the Time-Frequency plot were selected on the basis ofprevious findings regarding visual informationprocessing (Tallon-Baudry and Bertrand, 1999) andfindings demonstrating the establishment of corticalobject representations (Gruber et al., 2002).
Data Reduction and Analysis
EEG was initially segmented into epochs of2048 msec, consisting of 768 msec prior to onsetand 1024 msec post onset. Artifact correction wasperformed using the EGI NetStation correctionalgorithms; rejecting channels exceeding both avoltage threshold of 200 µV and a transitionthreshold of 100 µV. Channels were also rejectedwhere 80% or more of segments were identified as not acceptable. Individual segments were rejected where more than 20 channels were rejected;eye-blink threshold was set at 70 µV. Artifactcorrection was implemented using spherical-splineinterpolation (Ferree, 2000).
In the data reported here, all participantsprovided at least seven accurate, artifact free trialsin both Kanizsa shape and Kanizsa-randomconditions. A descriptive table of trials used in theanalysis is shown in Table II, no group differencesin either accuracy or number of artifact-free trialswere found. Significantly fewer trials wereavailable for analysis in the Kanizsa-randomcondition than the Kanizsa-shape condition [F (1, 12) = 5.090, p < 0.05].
Analysis of Spectral EEG
This analysis focused on non-phase lockedoscillatory activity, which was identified bysubtracting the mean evoked response (i.e. theERP) from each trial (Müller et al., 1996)a. Spectralchanges in bands ranging from delta to gammaband (4.9-97.7 Hz) activity were analysed usingwavelet analysis of artifact-free or corrected singleepochs. Spectral changes in oscillatory activityduring the experiment were analysed by means of aMorlet wavelet analysis. This method provides agood compromise between time and frequency
368 Caroline Brown and Others
a A given EEG-epoch can be modelled by the sum of the evoked responseplus the trial-by-trial fluctuation around the mean (Priestley, 1988). Thisanalysis focused on non-phase locked oscillatory activity, which wasidentified by subtracting the mean evoked response (i.e., the ERP) fromeach trial (Müller et al., 1996). Spectral changes in bands ranging fromdelta to gamma band activity were analysed using wavelet analysis ofartifact-free or corrected single epochs. Morlet wavelets were used, thusgiving reasonable time and frequency resolution (Sinnkonen et al., 1995),yielding information about higher frequencies over shorter time periods.Complex Morlet wavelets g may be generated for different frequencies f0within the time domain by
(1)
Where A’ depends upon sf , the width of the wavelet in the frequencydomain, the frequency band being analysed f0 and the constant m:
(2)
with
(3)
Therefore, using the constant ratio m, the width of the wavelet within thefrequency domain sf changes as a function of the frequency band f0. Thewavelet family used in this analysis was defined by m = f0/sf = 7; f0 range4.88 to 96.04 Hz in 0.49 Hz steps.This procedure has been proposed by Bertrand and Pantev (1994) and isdescribed in detail in Tallon-Baudry et al., 1998; Tallon-Baudry et al.,1997).
mf
f
= 0
σ
A mff' = σ π
π2 3
0
g t f A e et
i ft( , ) '–
02 2
2
202= σ π
Visual perception and gamma activity in autism 369
resolution (Sinkkonen et al., 1995). In order toachieve good time and frequency resolution in thegamma frequency range the wavelet family used isdefined by a constant m = f0/σf =7 (Tallon-Baudryand Bertrand, 1999) with wavelets ranging from4.88 to 97.65 Hz in 0.49 Hz steps. The analysisreported here was applied to wavelet coefficientsgenerated separately for all channels from a timeperiod from 32 msec prior to onset until 512 msecafter onset. Frequency powers identified during thesegment 32 msec prior to onset were used asbaseline values, which were subtracted from post-
onset power values. The short baseline periodreported here was chosen to avoid interference fromelectro-oculogram artifacts in order to maximize thenumber of trials available for this analysis. Meanbaseline power values for the 100 msec prior totrial onset are shown in Figure 3a. Baseline valueswere statistically compared and no differencebetween Kanizsa-condition or between groupswas found. Time-frequency plots (– 32 msec to512 msec) show negative as well as positivechanges in power across the power spectrum, wherepower levels were below those measured in
Fig. 2 – EGI Sensor Net Diagram, showing channels approximating to P1; P3; P2 and P4.
TABLE II
Number of Artifact-free Trials used in Data Analysis
ASD MLD
M SD Range M SD Range
Kanizsa-shape 22.5 5.8 8-30 16.5 5.6 9-26Kanizsa-random 22.7 8.52 8-31 22.5 8.3 7-31

the baseline period. Theoretical considerationssuggested that earlier (< 150 msec) peaks should betreated as a separate component from later (> 250msec) gamma band activity (Tallon-Baudry andBertrand, 1999; Bertrand and Tallon-Baudry, 2000).
Mean power values for channels correspondingto P1; P3; P2 and P4, were calculated for frequenciesbetween 29.3 and 41.5 Hz, and graphed in the time-frequency plot shown in Figure 3b. Separatestatistical comparisons were made for: 0-400 msec
(the time period as a whole), 80-120 msec (the earlypeak) and from 250-400 msec (the late peak).
RESULTS
Cognitive Battery
The ASD group (M = 25.8; SD = 14.8) scoredhigher than controls (M = 20.7; SD = 18.6) on the
370 Caroline Brown and Others
Fig. 3 – Mean 30-40 Hz gamma activity summed over channels P3; P1; P2: P4.a) Line plot showing changes in gamma activity in the 100 msec prior to stimulus onset, including the 32 msec baseline period.b) Line plot showing changes in gamma activity from 32 msec prior to, until 512 msec after trial onset.Both plots show the mean power values of the frequency band 30-40 Hz as they change over time summed across all four channels.
The upper plot, shows the level of 30-40 Hz power measured during the 100ms prior to baseline, with the baseline period used in thisanalysis indicated as a line from the x-axis at – 32 ms. The data from both the Kanizsa-shape and Kanizsa-random conditions arerepresented by thick and thin lines respectively, and from the group with autism (ASD) in red and the mentally retarded group (MLD) inblue. Because baseline values are subtracted from each trial prior to the averaging process, changes in gamma power can be positive –that is increased compared to baseline, or negative – where levels are reduced compared to baseline.

Visual perception and gamma activity in autism 371
block design test, although independent samples t-tests showed this was not significant [t (11) = 0.54,p = 0.60]. In the CEFT log-transformed scores ofreaction time and accuracy were lower for the ASDgroup (M = 2.397 SD = 0.176) than the MLDgroup (M = 2.569 SD = 0.188) indicating superiorperformance, but again an independent t-test ofthese scores failed to reach significance [t (12) = – 1.74, p = 0.11]. When the same comparison wasmade for all 24 participants, the ASD group (n =13, M = 2.045 SD = 0.258) performed significantlybetter than MLD group (n = 10, M = 2.268 SD =0.189) [t (21) = 2.301, p < 0.05].
Behavioural Task
The reaction time and accuracy data fordetection of the Kanisza shapes (mean and standarddeviations shown in Table III) were subjected toANOVA with group and condition (Kanizsa-shapevs. Kanizsa-random) as factors. For accuracy datathere were no significant main effects orinteractions (all F-values < 1). Reaction times weresignificantly longer in the Kanizsa-randomcondition than in the Kanizsa-shape condition [F (1, 12) = 8.813, p < 0.05]. However, the maineffect of group and the interaction between groupand condition were not significant (F-values < 1).
Spectral Analysis of EEG
Three observations can be made frominspection of the time-frequency plots: overall theASD group showed higher gamma power than theMLD group (0-400 msec); an early peak observedin the ASD group was not found in the MLDgroup (80-140 msec); the onset of the later gammacomponent was earlier in the ASD group than inthe MLD group (250-400 msec).
i) 0-400 msecThe averaged 30-40 Hz power across the first
400 msec after onset was subjected to ANOVAwith group and stimulus-condition as factors. Themain effect of stimulus condition approachedsignificance [F (1, 12) = 3.404, p = 0.09], as theKanizsa-shape condition was associated withgreater gamma power than Kanizsa-randomcondition. The interaction between stimulus-condition and group was highly significant [F (1,12) = 13.282, p < 0.01]. The interaction reflects theoverall increase in power manifested by the ASD
group compared to that in the control group, wherea very significant reduction in power compared tobaseline values in the Kanizsa-shape condition wasfound. Power values were approximately equivalentfor both groups in the Kanizsa-random condition.
ii) 80-140 msecThe early component (80-140 msec) was
subjected to ANOVA with group (ASD and MLD)and stimulus-condition (Kanizsa-shape andKanizsa-random) as factors. No main effect ofstimulus-condition was found [F (1, 12) = 2.554, p > 0.1]. A significant group by stimulus-conditioninteraction was found [F (1, 12) = 5.032, p < 0.05].Post hoc Tukeys HSD tests were performed on thedifferences between mean power values at this timeperiod. The power in both Kanizsa-shape andKanizsa-random conditions for the ASD groupwere not significantly different from one another,whereas the power levels shown by the MLDgroup in the Kanizsa-shape condition weresignificantly different from Kanizsa-randomcondition (p < 0.01) and from the ASD group (p <0.01) in both conditions.
iii) 250-450 msecThe later component was subjected to ANOVA
with group, stimulus-condition, and time period(250-300 msec vs. 300-350 msec vs. 350-450 msec)as factors. No main effects of time or stimulus-condition were found. There were significantinteractions between time and group [F (2, 24) =5.83, p < 0.01] and between stimulus–condition andgroup [F (1, 12) = 7.796, p < 0.05]. The interactionbetween group and time represents the earlier peakpower value shown by the ASD group, in the 250-300 msec period, compared to the MLD group peakpower value in the 350-400 msec period [t (12) =3.685, p < 0.01]. The stimulus–condition by groupinteraction reflects the equivalent levels of power inthe Kanizsa-random condition in both ASD andMLD groups, compared to the increased poweridentified in the ASD group during Kanizsa-shapecondition and the decrease in power in the MLDgroup. The difference in power between ASD andMLD groups in the Kanizsa-shape conditionapproached significance [t (12) = 2.025, p = 0.07].
DISCUSSION
The hypothesis guiding this study was thatabnormal gamma power would accompany
TABLE III
Reaction Time and Accuracy Value Means and Standard Deviations for Kanizsa Task
ASD MLD
% Acc RT (ms) % Acc RT (ms)
M SD M SD M SD M SD
Kanizsa-shape 93 6.6 1828 1170 88 5.0 1640 397Kanizsa-random 90 13.5 3005 1785 89 15.1 2949 829

perceptual disturbances in autism. This hypothesiswas only partially supported. There weresignificant group differences in gamma activity butno group differences in behaviour. We found thatthe control group of participants, mentally retardedadolescents, evinced the pattern of gamma found intypical, non-impaired adults, that is a distinct peakof gamma activity in the period 300-400 msec afteronset of the stimulus at parietal sites (Tallon-Baudry et al., 1996), embedded within an overallreduction in power. By contrast, the autistic groupdemonstrated overall increased activity (comparedto baseline), and the peaks occurred at earlier timepoints than in the mentally retarded group. Groupdifferences in the timing of gamma activity wereonly found in Kanizsa-shape trials, with bothgroups showing comparable gamma activity duringKanizsa-random trials. Whereas the control groupshowed reduced power levels in the first 300 msecof the Kanizsa-shape trials, the group with autismshowed increased gamma power.
The early differences in gamma activity suggestthat there may be an early recruitment of cellswithin visual areas of individuals with autism.Although, it is widely believed that visualperception in ASD is atypical, it has beenparticularly difficult to define experimentally, withsome researchers reporting better performance inperceptual tasks such as embedded figures (e.g.Shah and Frith, 1983) and others not (e.g. Brianand Bryson, 1996). Equally the finding that peoplewith autism are less susceptible to visual illusions(Happé, 1996) is not always replicated (Ropar and Mitchell, 1999). Behaviourally, the autisticgroup did not perform any better than the controlgroup, which indicates that, even if the group withautism did perceive the Kanizsa shapes morerapidly than the control group, the combinationmechanism that allows a judgement to be madeand a motor control decision to be planned andinstigated was not enabled. The disorder of autismis not homogenous, and with such a small sample no final conclusions may be drawn fromthe results reported here. Nevertheless there areclear gamma activity differences between bothgroups as predicted, despite the lack of behaviouraldifference. As outlined in the introduction, gammaactivity is ubiquitous and continuously measured inEEG. In non-autistic individuals it has been foundto increase during ‘target-present’ compared to‘target-absent’ type trials (Tallon-Baudry et al.,1996; Müller et al., 1996), here we found nodifference between shape and random conditions,suggesting that gamma activity in autism is notdiscriminating between stimulus conditions, a resultwhich is in line with that reported by Grice andcolleagues (Grice et al., 2001).
The difference between groups in gammaactivity at later stages in the epoch occurs in thedifference of onset of the late induced gamma peakat around 350 msec. In a non-impaired adult
population, such an increase is typically embeddedwithin an overall reduction in gamma-band activityprior to and after the peak at a slightly reducedoffset of around 300 msec, similar to that shownby the control group (Tallon-Baudry et al., 1996).The time-frequency line plots shown in Figure 3and the spectrogram in Figure 4 show that thecontrol group gamma peak post-300 msec onlyreaches approximately baseline values in responseto Kanizsa-shape stimuli. However, gamma levelsprior to and subsequent to the peak are markedlylower than baseline values throughout Kanizsa-shape trials and compared to overall levelsthroughout the Kanizsa-random trials. This impliesthat it is not the increase in gamma power to aspecific level, but an improvement in the signal tonoise ratio that is important in signalling relevance.Improving the signal to noise ratio requires eitherthat the relevant signal is increased in power orthat irrelevant ‘noise’ is reduced and of courseideally both solutions work in tandem.
It is possible that the gamma signal itselfincreases, hence the early increase in poweridentified in other research (e.g. Herrmann et al.,1996) as ‘evoked gamma’, and that surroundingnoise (other non-essential neurons firing at highfrequency) is reduced so that those cells that arebinding information can do so unambiguously andwithout extraneous input from neural cells whoseoutput is not relevant. We suggest therefore that theinduced gamma component reflects an inhibitiveprocess, which attenuates high frequency activity innon-participating neurons within an area duringprocessing, and that it is this inhibitive processwhich is defective in the group with autism.
The overall increase in control group gammapower measured during Kanizsa-random trials ispuzzling, but remarkably similar to activity patternsduring the same trials in the group with autism.Statistical comparison of absolute power values inthe control group late component peaks shows thatthe Kanizsa-random condition is indeed greaterthan that in the Kanizsa-shape condition, and thisis not what is usually found. However, in this taskparticipants were shown images in which theyeffectively had to search for a Kanizsa shape,rather like a serial search task. In ‘shape’conditions, the shape did indeed “pop-out”, and thesignal to noise ratio in gamma power wasincreased markedly for control group participants.In the ‘Kanizsa-random’ condition trials thereforethe increased overall gamma power may reflectincreased search activity across the image, eachpossible “shape” candidate eliciting a burst ofgamma activity.
One of the most pertinent criticisms of thegamma solution to the binding problem has beenthat an assembly of cells raising its activity level toaround 40 Hz does not in itself provide anunequivocal marker of stimulus processing. If otherneural groupings processing different stimuli also
372 Caroline Brown and Others

Visual perception and gamma activity in autism 373
raise their activity levels then the question remainsas to how independent assemblies signalrelatedness of their own stimulus whilst remainingdistinguishable from one another (Treisman, 1999;Shadlen and Movshon, 1999). We suggest heretherefore that peaks of gamma activity arecognitively salient only if they occur embeddedwithin a general inhibition of gamma activity insurrounding cells.
The necessity of gamma peaks being embeddedin more generalised gamma inhibition has aparallel in the very techniques employed here. EEGrecordings are particularly macroscopic inmeasurement, typically picking up the activity ofmillions of underlying cortical cells, which leads tomuch of the theoretical testing of theories ofbinding being drawn from many different researchtechniques (Casanova et al., 2002). Increases ingamma power are very small compared toincreases in power at lower frequencies whenmeasured at such a macroscopic level. Corticalresponses are likely to require some sort ofdynamic modulation to enable small increases ordecreases to be detected. For the signal to powerratio of a response to be sufficiently useful
therefore it is likely that widespread inhibitionneeds to be part of the dynamic processing system.
The population samples used in this preliminarystudy were necessarily very small, with someinevitable loss of viable EEG data occurring withmore learning disabled individuals and excludedfrom the data reported here. It was important thatthe control group used in this experiment werematched not only on intelligence but also inchronological age, so that maturational differencesin cognition and cognitive related gamma activity(Yordanova et al., 2000) were not confounded.
Future research should be undertaken, replicatingand increasing the depth of this study, using moretrials and more participants. Additionally the use ofa task like the embedded figures task (but greatlyincreased in scope as twelve exemplars would beinsufficient for EEG recordings to be meaningful)should be undertaken. If the perceptual anomalies inautism are directly measurable as very early burstsof uninhibited gamma over visual areas, such a taskwould be predicted to show clear differences overvisual areas. Embedded figures tasks have been usedas visuo-spatial tasks in non-patient populations, andhave shown that alpha power is related to search
Fig. 4 – Spectrogram showing power change in frequency band 30-40 Hz over first 500 msec of trial onset: Upper panels showrecordings from children with autism (ASD group); Lower panels show recordings from IQ matched controls (MLD group); Left handpanels show recordings during Kanizsa shape condition; Right hand panels show recordings during Kanizsa random condition.
Spectral activity (in this case in the 30-40Hz bandwidth) is ascertained from every correct behavioural trial in which there are noEEG artifacts, and the spectral activity found in the preceding baseline period is subtracted from that found in the trial. This gives riseto recorded changes in spectral power that can be both positive, where an increase in power is found (shown as red on colour bars) andnegative, where a decrease in power is identified (shown as blue on colour bars). The spectrogram is a contour plot that enables theobservation of changes in three dimensions: power, frequency and time. The data shown here are the average changes recorded overparietal sites corresponding to P1, P2, P3 and P4.

strategy (Lowenhard, 1972), but to the knowledge ofthe authors have not been used in similar researchinto gamma activity.
Two issues arise from this study with respect tothe difficulty in identifying perceptual differences inautism. Firstly, it is particularly difficult to findbehavioural tasks in which all people with autismrespond differently from those without autism.Secondly, therefore, it is difficult to identify whichelement or process in perception is missing orimpaired. It would be possible however to comparewhether autistic children ‘bind’ the Kanizsa visualillusion in the same way as non-autistic individualsusing an adapted form of the stimuli reported here.In future experiments both the control (see Figure5a) and experimental conditions (see Figure 5b)utilized here would be best changed so that all theinducers are aligned to face in the same quadrant –excepting those inducing the shape in the ‘shape’condition. An additional third condition could betested in which an alternative arrangement ofinducers, not arranged to form a shape, (see Figure5c) could be included. If children with autism do notsee the shape, but instead look for a specificarrangement of inducers, they should perform thethird condition equally as well as the shapecondition. Conversely, non-autistic populationswould see the shape condition faster and moreaccurately than either the control or ‘arrangement’condition.
To summarise, the current study showed thatthe perception of illusory objects is associated withincreased overall levels of gamma activity inchildren with autism, and further, we showed that
increased induced gamma power occurs earlier inthe group with autism than in age and IQ matchedcontrols performing the same task. The controlgroup of mentally retarded children showed asimilar pattern of gamma activity to that reportedin unimpaired adults (Tallon-Baudry et al., 1996),but at lower amplitude and at a longer latency.These results tentatively provide interesting anduseful information, both about the specificneurological processes occurring in autistic brainsand giving an insight into the large body of gammaresearch in typically functioning populations, whichwould certainly benefit from replication with alarger group of participants and including atypically developing control group.
Acknowledgments: This work was carried out as partof PPP Research Grant reference: 445/828, Brain-Behaviour Links in Autism. Grateful acknowledgement ismade to Gaynor Evans and Sarah Crispin for theirassistance in data collection.
REFERENCES
AMERICAN PSYCHOLOGICAL ASSOCIATION. Diagnostic andStatistical Manual of Mental Disorders (4th Edition).Washington DC: Author, 1994.
BERTRAND O and PANTEV C. Stimulus frequency dependence ofthe transient oscillatory auditory evoked response (40Hz)studied by electric and magnetic recordings in humans. In CPantev, T Elbert and B Lutekenhoner (Eds), OscillatoryEvent-related Brain Dynamics. New York: Plenum, 1994.
BERTRAND O and TALLON-BAUDRY C. Oscillatory gamma activityin humans: A possible role for object representation.International Journal of Psychophysiology, 38: 211-223,2000.
BISHOP DVM. TROG (Test for Reception of Grammar).Manchester University: Age and Cognitive PerformanceResearch Centre. 2nd Edition, 1989.
374 Caroline Brown and Others
Fig. 5 – Modified Kanizsa task.A better control for identifying “pop-out” of perceived shape as illusory contours are bound together would be for all the inducers
to be faced in the same quadrant. In the control condition this gives four sets of control stimulus (a) and in the shape condition in thisarrangement would give a possible 64 (16 locations by 4 inducer direction) stimuli (b). To further test whether children with autism donot see the shape but instead look for a particular arrangement of inducers a third condition (c) may be used, in which a non-shapecomposition of inducers may be cued.
Visual perception and gamma activity in autism 375
BÖTTGER D, HERRMANN CS and VON CRAMON DY. Amplitudedifferences of evoked alpha and gamma oscillations in two different age groups. International Journal ofPsychophysiology, 45: 245-251, 2002.
BRIAN JA and BRYSON SE. Disembedding performance andrecognition memory in autism/PDD. Journal of ChildPsychiatry, 37: 865-872, 1996.
BROCK J, BROWN C, BOUCHER J and RIPPON G. The temporalbinding deficit hypothesis of autism. Development andPsychopathology, 14: 209-224, 2002.
BURACK JA, ENNS JT, STAUDER JEA, MOTTRON L and RANDOLPHB. Attention and autism: Behavioral and electrophysiologicalevidence. In DJ Cohen and FR Volkmar (Eds), Handbook ofAutism and Pervasive Developmental Disorders. New York:Wiley, 1997.
BULLOCK TH. Signals and signs in the nervous system: Thedynamic anatomy of electrical activity is probablyinformation-rich. Proceedings of the National Academy ofSciences of the United States of America, 94: 1-6, 1997.
CASANOVA MF, BUXHOEVEDEN DP and BROWN C. Clinical andmacroscopic correlates of minicolumnar pathology in autism.Journal of Child Neurology, 17: 692-695 2002.
CSIBRA G. Fast-track report: Illusory contour figures areperceived as occluding surfaces by 8 month old infants.Developmental Science, 4: F7-F11, 2001.
CSIBRA G, DAVIS G, SPRATLING MW and JOHNSON MH. Gammaoscillations and object processing in the infant brain.Science, 290: 1582-1585, 2000.
DE HAAN M, PASCALIS O and JOHNSON MH. Specialization ofneural mechanisms underlying face recognition in humaninfants. Journal of Cognitive Neuroscience, 14: 199-209,2002.
FERREE TC. Spline interpolation of the scalp EEG. SecondaryTitl. EGI, 2000. http://www.egi.com/Technotes/Spline-Interpolation.pdf
FRITH U. Autism: Explaining the Enigma. Oxford: BlackwellScientific Publications, 1989.
GREGORY RL. Action potentials to potential actions. In TE Parks(Ed), Looking at Looking: An Introduction to the Intelligenceof Vision. Thousand Oaks: Sage Publications, 2001, pp. 51-71.
GRICE SJ, SPRATLING MW, KARMILOFF-SMITH A, HALIT H,CSIBRA G, DE HAAN M and JOHNSON MH. Disordered visualprocessing and oscillatory brain activity in autism andWilliams syndrome. Neuroreport, 12: 2697-2700, 2001.
GRUBER T, MÜLLER MM and KEIL A. Modulation of inducedgamma band responses in a perceptual learning task in thehuman EEG. Journal of Cognitive Neuroscience, 14: 732-744, 2002.
GRUBER T, MULLER MM, KEIL A and ELBERT T. Selective visual-spatial attention alters induced gamma band responses in thehuman EEG. Clinical Neurophysiology, 110: 2074-2085,1999.
HAPPÉ F. Autism: Cognitive deficit or cognitive style? Trends inCognitive Sciences, 3: 216-222, 1999.
HAPPÉ FGE. Wechsler IQ profile and theory of mind in autism:A research note. Journal of Child Psychology andPsychiatry, 35: 1461-1471, 1994.
HAPPÉ FGE. Studying weak central coherence at low levels:Children with autism do not succumb to visual illusions: Aresearch note. Journal of Child Psychology and Psychiatryand Allied Disciplines, 37: 873-877, 1996.
HERRMANN CS and MECKLINGER A. Magnetoencephalographicresponses to illusory figures: Early evoked gamma isaffected by processing of stimulus features. InternationalJournal of Psychophysiology, 38: 265-281, 1999.
HERRMANN CS and MECKLINGER A. Gamma activity in humanEEG is related to high-speed memory comparisons duringobject selective attention. Visual Cognition, 8: 593-608,2001.
HERRMANN CS, MECKLINGER A and PFEIFER E. Gamma responsesand ERPs in a visual classification task. ClinicalNeurophysiology, 110: 636-642, 1999.
HILLYARD SA and PICTON TW. Electrophysiology of cognition. InVB Mountcastle (Ed), Handbook of Physiology – the NervousSystem v. Bethseda: American Physiology Society, 1987.
JASPER HH. Report of committee on methods of clinicalexamination in electroencephalography. EEG and ClinicalNeurophsyiology, 10: 370-375, 1958.
JOLLIFE T and BARON-COHEN S. Are people with autism andAsperger syndrome faster than normal on the embeddedfigures test? Journal of Child Psychology and Psychiatryand Allied Disciplines, 38: 527-534, 1997.
KEIL A, GRUBER T and MÜLLER MM. Functional correlates ofmacroscopic high-frequency brain activity in the humanvisual system. Neuroscience and Biobehavioral Reviews, 25:527-534, 2001.
LOWENHARD P. Study of Witkin’s visual discrimination test andits electroencephalographic concomitants. Journal dePsychologie Normale et Pathologique, 4: 427-438, 1972.
LUCK SJ, HEINZE HJ, MANGUN GR and HILLYARD SA. Visualevent-related potentials index focused attention withinbilateral stimulus arrays .2. Functional dissociation of P1and N1 components. Electroencephalography and ClinicalNeurophysiology, 75: 528-542, 1990.
MOTTRON L and BELLEVILLE S. A study of perceptual analysis ina high-level autistic subject with exceptional graphicabilities. Brain and Cognition, 23: 279-309, 1993.
MÜLLER MM. Oscillatory cortical activities in the gamma bandin the human EEG induced by visual stimuli – representationof the stimulus? Acta Neurobiologiae Experimentalis, 60:49-65, 2000.
MÜLLER MM, BOSCH J, ELBERT T, KREITER A, SOSA MV, SOSAPV and ROCKSTROH B. Visually induced gamma-basedresponses in human electroencephalographic activity – a linkto animal studies. Experimental Brain Research, 112: 96-102, 1996.
MÜLLER MM and GRUBER T. Induced gamma-band responses inthe human EEG are related to attentional informationprocessing. Visual Cognition, 8: 579-592, 2001.
MÜLLER M, GRUBER T and KEIL A. Modulation of inducedgamma band activity in the human EEG by attention andvisual information processing. International Journal ofPsychophysiology, 38: 283-299, 2000.
MÜLLER MM, JUNGHOFER M, ELBERT T and ROCHSTROH B.Visually induced gamma-band responses to coherent andincoherent motion: A replication study. Neuroreport, 8:2575-2579, 1997.
O’DONNELL BF, SWEARER JM, SMITH LT, HOKAMA H andMCCARLEY RW. A topographic study of ERPs elicited byvisual feature discrimination. Brain Topography, 10: 133-143, 1997.
O’RIORDAN M and PLAISTED K. Enhanced discrimination inautism. Quarterly Journal of Experimental Psychology:Human Experimental Psychology, 54A: 961-979, 2001.
O’RIORDAN MA, PLAISTED KC, DRIVER J and BARON COHEN S.Superior visual search in autism. Journal of ExperimentalPsychology: Human Perception and Performance, 27: 719-730, 2001.
PLAISTED K, O’RIORDAN M and BARON COHEN S. Enhancedvisual search for a conjunctive target in autism. A researchnote. Journal of Child Psychology and Psychiatry, 39: 777-783, 1998.
PLAISTED K, SWETTENHAM J and REES L. Children with autismshow local precedence in a divided attention task and globalprecedence in selective attention task. Journal of ChildPsychology and Psychiatry, 40: 733-742, 1999.
PLAISTED KC. Reduced generalization in autism: An alternativeto weak central coherence. In JA Burack and T Charman(Eds), The Development of Autism: Perspectives from Theoryand Research. Mahwah: Lawrence Erlbaum Associates,2001, pp. 149-169.
PRIESTLEY DL. Analysis of Non-stationary and Non-linearSignals. New York: Academic, 1988.
PRING L, HERMELIN B and HEAVEY L. Savants, segments, art andautism. Journal of Child Psychology and Psychiatry andAllied Disciplines, 36: 1065-1076, 1995.
PROVERBIO AM and ZANI A. Electrophysiological indexes ofillusory contours perception in humans. Neuropsychologia,40: 479-491, 2002.
PULVERMÜLLER F, LUTZENBURGER W and PREISSL H. Nouns andverbs in the intact brain: Evidence from event-relatedpotentials and high frequency cortical responses. CerbralCortex, 9: 497-506, 1999.
RAVEN JC. Raven's Coloured Progressive Matrices: London,H.K. Lewis, for publisher, 1993.
RODRIGUEZ E, GEORGE N, LACHAUX J-P, MARTINERIE BR andVARELA FJ. Perception’s shadow: Long-distancesynchronization of human brain activity. Nature, 397: 430-433, 1999.
ROPAR D and MITCHELL P. Are individuals with autism andAsperger's syndrome susceptible to visual illusions? Journalof Child Psychology and Psychiatry and Allied Disciplines,40: 1283-1293, 1999.
ROPAR D and MITCHELL P. Susceptibility to illusions andperformance on visuospatial tasks in individuals with autism.

Journal of Child Psychology and Psychiatry and AlliedDisciplines, 42: 539-549, 2001.
SCHOPLER E, REICHLER RJ and ROCHEN RENNER B. CARS (theChildhood Autism Rating Scale). Los Angeles: WesternPsychological Services, 1988.
SHADLEN MN and MOVSHON JA. Synchrony unbound: A criticalevaluation of the temporal binding hypothesis. Neuron, 24:67-77, 1999.
SHAH A and FRITH U. An islet of ability in autistic children: Aresearch note. Journal of Child Psychology and Psychiatry,24: 613-620, 1983.
SHAH A and FRITH U. Why do autistic individuals show superiorperformance on the block design task? Journal of ChildPsychology and Psychiatry and Allied Disciplines, 34: 1351-1364, 1993.
SHIBATA T, SHIMOYAMA I, ITO T, ABLA D, IWASA H, KOSEKI K,YAMANOUCHI N, SATO T and NAKAJIMA Y. Attention changesthe peak latency of the visual gamma-band oscillation of theEEG. Neuroreport, 10: 1167-1170, 1999.
SINGER W and GRAY C. Visual feature integration and the temporalcorrelation hypothesis. Annual Review of Neuroscience, 18:555-586, 1995.
SINKKONEN J, TIITINEN H and NÄÄTÄNEN R. Gabor filters: Aninformative way for analyzing event-related brain activity.Journal of Neuroscience Methods, 56: 99-104, 1995.
TALLON C, BERTRAND O, BOUCHET P and PERNIER J. Gamma-range activity evoked by coherent visual-stimuli in humans.European Journal of Neuroscience, 7: 1285-1291, 1995.
TALLON-BAUDRY C and BERTRAND O. Oscillatory gamma activityin humans and its role in object representation. Trends inCognitive Sciences, 3: 151-162, 1999.
TALLON-BAUDRY C, BERTRAND O, DELPUECH C and PERNIER J.Stimulus specificity of phase-locked and non-phase-locked40Hz visual responses in human. Journal of Neuroscience,16: 4240-4249, 1996.
TALLON-BAUDRY C, BERTRAND O and PERNIER J. Evoked andinduced 40 Hz visual responses in man: From featurebinding to selective attention. Journal of Psychophysiology,12: 193, 1998.
TALLON-BAUDRY C, BERTRAND O, WIENBRUCH C, ROSS B andPANTEV C. Combined EEG and MEG recordings of visual 40Hz responses to illusory triangles in human. Neuroreport, 8:1103-1107, 1997.
TOMBERG C. Cognitive N140 electrogenesis and concomitant 40 Hz synchronization in mid-dorsolateral prefrontal cortex(area 46) identified in non-averaged human brain potentials.Neuroscience Letters, 266: 141-144, 1999.
TREISMAN A. Solutions to the binding problem: Progress throughcontroversy and convergence. Neuron, 24: 105-110, 1999.
TYMCHUK AJ, SIMMONS JQ and NEAFSEY S. Intellectualcharacteristics of adolescent childhood psychotics with highverbal ability. Journal of Mental Deficiency Research, 21:133-138, 1977.
WECHSLER D. Selected Papers of David Wechsler. Oxford,England: Academic Press, 1974.
WING L. The Autism spectrum: A Guide for Parents andProfessionals. London: Constable, 1996.
WITKIN HA, OLTMAN PK, RASKIN E and KARP S.A. TheEmbedded Figures Tests. Palo Alto, CA: ConsultingPsychologists Press, 1971.
WORLD HEALTH ORGANIZATION. International classification ofDiseases and Disorders. Geneva, Switzerland: Author, 1992.
YORDANOVA J, KOLEV V, HEINRICH H, BANASCHEWSKI T,WOERNER W and ROTHENBERGER A. Gamma band responsein children is related to task-stimulus processing.Neuroreport, 11: 2325-2330, 2000.
YORDANOVA J, KOLEV V, HEINRICH H, WOERNER W, BANASCHEWSKIT and ROTHENBERGER A. Developmental event-related gammaoscillations: Effects of auditory attention. European Journal ofNeuroscience, 16: 2214-2224, 2002.
YORDANOVA J, KOLEV V and DEMIRALP T. The phase-locking ofauditory gamma band responses in humans is sensitive totask processing. Neuroreport, 8: 3999-4004, 1997.
Caroline Brown, School of Psychology, University of West of England, 8 WoodlandRoad, Bristol BS8 1TN. e-mail: [email protected]
376 Caroline Brown and Others