Malaysian Economy in Figures 2009
49
Price : RM3.80 The Malaysian Economy in Figures 2009 Prepared by Economic Planning Unit, Prime Minister's Department
-
Upload
terengganu -
Category
Documents
-
view
0 -
download
0
Transcript of Malaysian Economy in Figures 2009

Price : RM3.80
The Malaysian Economy in Figures
2009
Prepared by
Economic Planning Unit, Prime Minister's Department

o Malaysia covers an area of about 330,252 square kilometers, consisting of states in Peninsular Malaysia,
namely Perlis, Kedah, Pulau Pinang, Perak, Selangor, Negeri Sembilan, Melaka, Johor, Pahang,
Terengganu, Kelantan and the Federal Territories of Kuala Lumpur and Putrajaya; Sabah and Sarawak on
the island of Borneo and the Federal Territory of Labuan off Sabah. Malaysia lies entirely in the equatorial
zone and the average daily temperature throughout Malaysia varies from 21C to 32C.
o Malaysia is a multi-ethnic country. The principal ethnic groups are Malay, Chinese and Indian. Other
significant groups are the indigenous people of Sabah and Sarawak, including Kadazan Dusun, Bajau,
Murut, Iban, Bidayuh and Melanau.
o Malaysia practises a system of Parliamentary democracy with constitutional monarchy. It has three branches
of government, namely the Executive, the Legislature and the Judiciary.
o The Malaysian Parliament is made up of the Yang di-Pertuan Agong, the Senate (upper house) with 70
members and the House of Representatives (lower house) with 222 members. Out of the 70 senators, 44
are appointed by the Yang di-Pertuan Agong while 26 are elected by the State legislatures. The general
election for the 222 members of the lower house must be held every five years.
Background on Malaysia
ii

iii
2008(p)
2009(f)
Population (million) 27.9 28.1
Labour force (million) 12.0 12.1
Employment (million) 11.5 11.5
Unemployment rate (%) 3.7 4.5
Nominal GDP (RM billion) 740.7 705.4
Nominal GNP (RM billion) 715.3 694.8
Real GDP growth rate (%) 4.6 -1.0 ~ +1.0
Per capita income RM 25,796 24,541
US$ 7,738 6,812
PPP(US$) 15,468 13,468
Inflation (% p.a) 5.4 1.5 ~ 2.0
Merchandise exports (RM billion) 664.2 495.8
Merchandise imports (RM billion) 494.1 387.6
Current account of BOP (% of GNP) 18.1 11.5
Exchange rate (RM/US$) 3.33 3.62 *
Notes: (p)
Preliminary (f)
Forecast
MALAYSIA : BASIC STATISTICS
* Data as at 30th April 2009
MALAYSIA

iv
Page Page
1. KEY ECONOMIC INDICATORS
1.1 1 4.1.2 12
1.2 1 4.1.3 12
1.3 1 4.1.4 12
1.4 1 4.1.5 12
1.5 2
1.6 2 4.2 12
1.7 2 4.2.1 12
1.8 2 4.2.2 12
4.2.3 122. AREA, POPULATION AND LABOUR FORCE 4.2.4 12
4.2.5 12
2.1 4 4.2.6 12
2.2 42.3 4 5. BALANCE OF PAYMENTS
2.4 5
2.5 6 5.1 15
2.6 6 5.2 15
5.3 153. GROSS DOMESTIC PRODUCT 5.4 15
5.5 15
3.1 7 5.6 15
3.2 7 5.7 15
3.3 83.4 8 6. BURSA MALAYSIA
3.5 10
3.6 11 6.1 17
6.2 174. PUBLIC SECTOR ACCOUNTS 6.3 17
6.4 17
4.1 12 6.5 17
4.1.1 12 6.6 18
THE MALAYSIAN ECONOMY IN FIGURES
as at April 2009
Table of Contents
Distributive Trade ……………………………………………………………………………
Federal Government Finance ……………………………………………………….
Total Revenue …………………………………………………………………………………
Composite Index …………………………………………………………………………………………………………………….
Market Valuation ……………………………………………………………………………………………………………………Selected World Stock Market Indices ………………………………………………………………………………..
New Listing ………………………………………………………………………………………………………………………………
Listed Companies ………………………………………………………………………………………………………………….
Turnover …………………………………………………………………………………………………………………………………..
Employment ……………………………………………………………………………………..
Supply ………………………………………………………………………………………………..
Demand …………………………………………………………………………………………….
Savings and Investment Gap ………………………………………………………..Major Output Production ………………………………………………………………
Manufacturing Production Index ………………………………………………….
Income ……………………………………………………………………………………………………………………………………..Current Transfers …………………………………………………………………………………………………………………..
Current Account Balance (net) …………………………………………………………………………………………..
Goods (net) ……………………………………………………………………………………………………………………………..
Services Account (net) …………………………………………………………………………………………………………
Capital & Financial Account Balance (net) ……………………………………………………………………….
Overall Balance ………………………………………………………………………………………………………………………
Area …………………………………………………………………………………………………..
Population ……………………………………………………………………………………….Population Age Structure ……………………………………………………………..
Population By Ethnic Group …………………………………………………………
Labour Force ……………………………………………………………………………………
NFPEs Surplus/ Deficit …………………………………………………………………………………………………………
Gross Domestic Product ………………………………………………………………………………
Total Public Sector Current Surplus/Deficit ……………………………………………………………………..Development Expenditure …………………………………………………………………………………………………….
Overall Surplus/Deficit ……………………………………………………………………………………………………………
External Debt …………………………………………………………………………………………………………………………..
Current Expenditure ……………………………………………………………………………………………………………….
Development Expenditure …………………………………………………………………………………………………….
Overall Surplus/Deficit …………………………………………………………………………………………………………..
Sources of Finance ……………………………………………………………………………………………………………….
Consolidated Public Sector Finance …………………………………………………………………………………
General Government ………………………………………………………………………………………………………………
Gross National Product …………………………………………………………………………………
Balance of Payments ……………………………………………………………………………………..
Federal Government Accounts ……………………………………………………………………
Price Indices ……………………………………………………………………………………………………..
Unemployment …………………………………………………………………………………………………
Exchange Rates ……………………………………………………………………………………………….
Money and Banking ………………………………………………………………………………………..

v
Page Page
7. APPROVED INVESTMENT PROJECTS
7.1 19 11.3 34
7.2 19 11.4 34
7.3 2012. INTERNATIONAL COMPARISON
8. EXTERNAL SECTOR
12.1 35
8.1 21 12.2 36
8.2 21 12.3 37
8.3 22 12.4 38
8.4 22 12.5 39
8.5 22 12.6 40
8.6 24 12.7 42
8.7 Tourist Arrivals by Region ……………………………………………………………..26
12.8 439. PRIVATIZATION 12.9 44
12.10 45
9.1 27 12.11 46
12.12 4710. ENERGY AND INFRASTRUCTURE 12.13 48
12.14 49
10.1 2810.2 28 13. 50
10.3 3010.4 30 14. INVESTORS' GUIDE
10.5 30 14.1 51
10.6 30 14.2 51
14.3 5111. QUALITY OF LIFE 14.4 51
11.1 31 15. FOREIGN EXCHANGE ADMINISTRATION POLICIES
11.2 32 15.1 52
15.2 56
Indices of Area and MQLI ……………………………………………………………..
Selected Social Indicators …………………………………………………………….Foreign Exchange Administration Rules Applicable to Residents ………………………………
Foreign Exchange Administration Rules Applicable to Non-Residents ……………………..
Others ……………………………………………………………………………………………………………………………………….
Privatization Achievement ……………………………………………………………
Primary Commercial Energy - Final Demand ……………………………..Electricity - Demand and Supply ……………………………………………………
Roads by Surface Type ………………………………………………………………….Railway Statistics …………………………………………………………………………….
Air Traffic Statistics ………………………………………………………………………..
Port Statistics ………………………………………………………………………………….
Science and Technology ………………………………………………………………………………………………………
The Knowledge-Based Economy Development Index (KDI) …………………………………………
MALAYSIA'S COMPETITIVENESS POSITION …………………………………………….
Income Tax Rate …………………………………………………………………………………………………………………….
Promotion of Investment Act ……………………………………………………………………………………………..
Income Tax Act ………………………………………………………………………………………………………………………
Government, Debt and Resource Flows …………………………………………………………………………..
Population, Urbanization and Population Density …………………………………………………………..Structure of Employment ……………………………………………………………………………………………………..
Quality of Life …………………………………………………………………………………………………………………………..
GNI Per Capita ………………………………………………………………………………………………………………………..
Information Age ……………………………………………………………………………………………………………………..
Trade Prices and Terms of Trade ………………………………………………..
Trade Balance by Main Trading Partners ……………………………….....
Real Gross Domestic Product ……………………………………………………………………………………………
Consumer Price Index ………………………………………………………………………………………………………......
Structure of Output ………………………………………………………………………………………………………………..
Structure of Demand ……………………………………………………………………………………………………………..
Current Account of Balance of Payments ……………………………………………………………………….
Savings and Investment ……………………………………………………………………………………………………….
Sources of Imports …………………………………………………………………………
Approved Investment Projects ……………………………………………………
Foreign Investment In Approved Projects …………………………………
Proposed Capital Investments In Approved Projects …………….
Gender-Related Information ………………………………………………………………………………………………..
Exports ………………………………………………………………………………………………
Poverty …………………………………………………………………………………………………………………………………….
Imports ………………………………………………………………………………………………
Direction of Exports ……………………………………………………………………….

1
1. KEY ECONOMIC INDICATORS
Unit RM million % p.a. RM million % p.a. RM million % p.a. RM million % p.a. RM million % p.a.
1.1 Gross Domestic Product
(in 2000 constant prices)
449,250 5.3 475,192 5.8 505,353 6.3 528,804 4.6 528,860 0.0
Agriculture, forestry & fishing 35,835 2.6 37,769 5.4 38,593 2.2 40,073 3.8 39,260 -2.0
Mining 42,472 -0.4 41,315 -2.7 42,663 3.3 42,337 -0.8 42,176 -0.4
Manufacturing 137,940 5.2 147,672 7.1 152,262 3.1 154,195 1.3 141,934 -8.0
Construction 14,685 -1.5 14,604 -0.5 15,279 4.6 15,604 2.1 16,071 3.0
Services 230,043 7.2 246,895 7.3 270,762 9.7 290,588 7.3 303,695 4.5
1.2 Gross National Product
(in 2000 constant prices)
424,294 5.3 454,625 7.1 482,239 6.1 496,077 2.9 504,864 1.8
Private consumption 216,247 9.1 230,222 6.5 255,028 10.8 276,527 8.4 286,205 3.5
Private investment 50,841 3.3 54,643 7.5 59,996 9.8 60,896 1.5 50,118 -17.7
Public consumption 58,395 6.5 61,258 4.9 65,299 6.6 72,880 11.6 78,187 7.3
Public investment 48,425 6.8 52,473 8.4 57,378 9.3 57,775 0.7 67,351 16.6
Exports of goods & services 554,261 8.3 592,898 7.0 617,628 4.2 626,824 1.5 522,913 -16.6
Imports of goods & services 475,838 8.9 516,412 8.5 544,059 5.4 556,015 2.2 473,102 -14.9
Per capita GNP RM 18,966 20,885 23,115 25,796 24,541
US$ 5,008 5,694 6,724 7,738 6,812
% of GNP % of GNP % of GNP % of GNP % of GNP
1.3 Balance of Payments
Goods (net) 128,892 25.9 134,558 24.2 127,673 20.3 170,116 23.8 108,103 15.6
Services & income (net) -33,555 6.7 -24,202 -4.3 -11,520 -1.8 -23,131 -3.2 -11,474 -1.7
Current account balance 78,367 15.7 93,504 16.8 100,410 16.0 129,936 18.1 80,003 11.5
Capital and financial account balance -36,991 -7.4 -43,488 -7.8 -37,710 -6.0 -123,596 -17.3 - -
Overall balance 13,550 2.7 25,158 4.5 45,296 7.2 -18,250 2.6 - -
Central Bank international reserves 265,240 53.2 290,399 52.2 335,695 53.4 317,445 44.4 - -
Months of retained imports 7.7 7.8 8.4 7.6 -
1.4 Federal Government Accounts
Revenue 106,304 21.3 123,546 22.2 139,885 22.3 159,793 22.3 160,836 23.2
Operating expenditure 97,744 19.6 107,694 19.4 123,084 19.6 153,499 21.5 159,170 22.9
Development expenditure (net) 27,284 5.5 34,961 6.3 37,460 6.0 41,889 5.9 55,500 8.0
Overall balance -18,724 -3.8 -19,109 -3.4 -20,659 -3.3 -35,594 -5.0 -53,834 -7.7
Notes : (p)
Preliminary (f)
Forecast
Sources : Economic Planning Unit, Ministry of Finance and Bank Negara Malaysia
2006 2007 2008 (P)
2009 (f)
2005

2
Unit 2001 2002 2003 2004 2005 2006 2007 2008 2009
1.5 Price Indices
Consumer Price Index (CPI) % p.a. 1.4 1.8 1.2 1.4 3.0 3.6 2.0 5.4 3.7 a/
Producer Price Index (PPI) % p.a. -0.2 -0.7 4.6 6.2 5.9 5.1 6.7 8.2 -6.6 a/
1.6 Unemployment % of labour force 3.6 3.5 3.6 3.5 3.5 3.3 3.2 3.7 4.5 f/
1.7 Exchange Rates (average for period)
RM / US$ 3.800 3.800 3.800 3.800 3.787 3.668 3.438 3.333 3.622 b/
RM / 100Yen 3.130 3.039 3.282 3.515 3.446 3.155 2.922 3.238 3.812 b/
RM / S$ 2.122 2.123 2.181 2.249 2.276 2.309 2.281 2.355 2.398 b/
RM / Pound Sterling 5.516 6.092 6.768 7.317 6.523 6.923 6.607 6.157 5.232 b/
1.8 Money and Banking
Money supply M1 RM million 81,016 89,512 102,441 114,550 124,338 141,367 169,007 182,996 179,677 c/
Money supply M2 RM million 364,723 386,512 429,437 532,636 614,346 727,684 796,876 903,378 921,858 c/
Money supply M3 RM million 471,731 504,150 553,058 621,226 672,835 760,302 832,738 931,780 949,274 c/
Commercial Banks
Total deposits RM million 368,792 388,406 433,008 550,930 644,891 768,085 821,002 936,321 951,355 c/
Total loans 1/
RM million 325,072 338,242 355,839 448,354 526,772 585,506 635,878 721,799 729,185 c/
Non-performing loans (6 months) % of total loans 7.4 6.9 6.4 5.3 4.4 3.7 2.4 1.7 1.6 c/
Interest rates
3-month interbank Avg. at end-period (%) 3.13 2.92 2.88 2.84 2.88 3.55 3.59 3.59 2.26 c/
3-month fixed deposit Avg. at end-period (%) 3.21 3.20 3.00 3.00 3.02 3.19 3.15 3.04 2.04 c/
Savings deposit Avg. at end-period (%) 2.28 2.12 1.86 1.58 1.41 1.48 1.44 1.40 0.95 c/
Base lending rate Avg. at end-period (%) 6.39 6.39 6.00 5.98 6.20 6.72 6.72 6.48 5.53 c/
3-month Treasury Bills Avg. at end-period (%) 2.79 2.73 2.79 2.40 2.50 3.23 3.43 3.35 1.94 c/
Notes : f/ Forecast
1/ Sub-total may not necessarily add up to grand total due to rounding. With effect from April 2006, folowing reclassifications under the Financial Institutions Statistical System (FISS),
loans/financing by economic sector/industry encompass non-household customers while loans by purpose encompass loans to all customers.
Therefore, a loan to a non-household customer will be reflected in both economic sector/industry and purpose. Loans by sector (economic/industry+household sector) = Loans by purpose (total loans)
Sources : Economic Planning Unit, Ministry of Finance, Department of Statistics and Bank Negara Malaysia
a/ Data as at Jan-March 2009
b/ Data as at 30th April 2009
c/ Data as at March 2009

3
MOVEMENT OF EXCHANGE RATES AGAINST THE RINGGIT
1985-2009
0.0
0.2
0.4
0.6
0.8
1.0
1.2
1.4
'85 '86 '87 '88 '89 '90 '91 '92 '93 '94 '95 '96 '97 '98 '99 '00 '01 '02 '03 '04 '05 '06 '07 '08 09
Pound Sterling (STG) Singapore Dollar (S$)
US Dollar (US$) Japanese Yen (¥100)
Value Per RM
* Data for 2009 up to 30th April
STG
US$
YEN
S$
*
GDP,CPI AND PPI, 1985-2009
(Annual Growth Rate)
-8
-6
-4
-2
0
2
4
6
8
10
12
'85'86'87'88'89'90'91'92'93'94'95'96'97'98'99'00'01'02'03'04'05'06'07 08 09
GDP Consumer Price Index* Producer Price Index*
Percentage (%)
(p) Preliminary (f) Forecast * Data as at Jan-March 2009
(f)(p)

4
2. AREA, POPULATION AND LABOUR FORCE
2.1 Area Sq. Km. 2.2 Population Unit 1970 1980 1990 2000 2001 2002 2003 2004 2005 2006 2007 2008 2009 (e)
Malaysia 330,252 Malaysia
Peninsular Malaysia 131,805 Number (Mid-year) mil 10.3 13.8 18.1 23.5 24.0 24.6 25.2 25.7 26.4 26.9 27.2 27.9 28.1
Sabah & Labuan 73,997 Growth % p.a. 2.7 2.4 2.4 3.4 2.0 2.6 2.7 2.0 2.8 1.6 1.4 2.4 0.7
Sarawak 124,450 Density per sq. km. 31.3 41.7 54.9 71.1 72.5 74.4 76.4 77.9 80.1 81.4 82.5 84.4 85.0
Age group % of % of % of % of % of % of % of % of % of
'000 Total '000 Total '000 Total '000 Total '000 Total '000 Total '000 Total '000 Total '000 Total
2.3 Population Age
Structure
0 - 14 4,847.4 44.5 5,542.0 39.9 6,774.9 37.4 8,003.1 34.1 7,830.1 29.6 7,803.0 29.0 7,772.0 28.5 7,738.4 27.8 7,703.2 27.4
15 - 64 5,678.0 52.2 7,845.7 56.5 10,669.1 58.9 14,560.0 62.0 17,515.1 66.2 17,924.3 66.7 18,278.6 67.1 18,921.2 67.9 19,103.7 68.1
65 & above 356.6 3.3 491.2 3.5 658.5 3.7 931.8 4.0 1,102.1 4.2 1,141.3 4.2 1,181.3 4.3 1,222.7 4.4 1,266.3 4.5
TOTAL 10,882.0 100.0 13,879.2 100.0 18,102.5 100.0 23,494.9 100.0 26,447.3 100.0 26,868.6 100.0 27,231.9 100.0 27,882.4 100.0 28,073.2 100.0
Note : (e)
Estimates
Sources : Economic Planning Unit and Department of Statistics
0.7
3.1
3.5
2.3
2007 2008 2009 (e) 1991-2009
Average Growth
(%)
1970 1980 2005 20061990 2000

5
Unit 2001 2002 2003 2004 2005 2006 2007 2008 2009
2.4 Population by Ethnic Group
Malaysian Citizens '000 22,492 22,891 23,276 23,628 23,985 24,345 24,702 25,056 25,409
Bumiputera '000 14,656 14,956 15,248 15,517 15,791 16,071 16,350 16,630 16,912
Malay '000 12,038 12,285 12,525 12,746 12,972 13,203 13,434 13,667 13,902
Other Bumiputera '000 2,618 2,671 2,722 2,770 2,819 2,868 2,915 2,963 3,010
Chinese '000 5,837 5,907 5,974 6,034 6,093 6,150 6,204 6,256 6,305
Indian '000 1,723 1,748 1,773 1,794 1,816 1,838 1,859 1,880 1,901
Others '000 277 279 281 283 285 287 288 290 292
Non-Malaysian Citizens '000 1,460 1,688 1,967 2,109 2,462 2,523 2,530 2,826 2,664
Source : Economic Planning Unit

6
Unit 2003 2004 2005 2006 2007 2008 2009(e)
2.5 Labour Force
Labour force '000 10,426 10,846 11,291 11,545 11,775 11,968 12,14225 25
Labour Force Participation Rates :
Total 1/ % 65.6 66.1 66.7 66.9 67.0 67.0 66.9
Male 2/ % 85.4 86.2 86.6 86.7 87.0 87.0 86.9
Female 3/ % 47.7 47.3 45.9 45.8 46.4 46.1 46.0
Unemployment % of labour force 3.6 3.5 3.5 3.3 3.2 3.7 4.5
2.6 Employment
Total '000 10,047 10,464 10,893 11,159 11,398 11,525 11,547
Agriculture % of total 14.1 13.4 12.9 12.9 12.5 12.0 12.0
Mining % of total 0.4 0.4 0.4 0.4 0.4 0.4 0.4
Manufacturing % of total 27.6 28.4 28.7 28.8 28.9 29.0 28.4
Construction % of total 7.7 7.3 7.0 7.0 6.8 6.6 6.6
Services % of total 50.2 50.4 51.0 51.0 51.5 52.0 52.61,035.0 4.2 1,150.2 4
Notes : (e)
Estimates 25293.5 # 100 26748.3 1/
Total number of people economically active as a percentage of total number in the working age population of 15 to 64 years 2/
Total number of people economically active as a percentage of total number of males in the working age population 3/
Total number of people economically active as a percentage of total number of females in the working age population
Sources : Economic Planning Unit and Department of Statistics

7
3. GROSS DOMESTIC PRODUCT
RM % RM % RM % RM % RM % million growth million growth million growth million growth million growth
3.1 Supply (at constant 2000 prices)
Agriculture, forestry & fishing 35,835 2.6 37,769 5.4 38,593 2.2 40,073 3.8 39,260 -2.0
Mining and quarrying 42,472 -0.4 41,315 -2.7 42,663 3.3 42,337 -0.8 42,176 -0.4
Manufacturing 137,940 5.2 147,672 7.1 152,262 3.1 154,195 1.3 141,934 -8.0
Construction 14,685 -1.5 14,604 -0.5 15,279 4.6 15,604 2.1 16,071 3.0
Services 230,043 7.2 246,895 7.3 270,761 9.7 290,588 7.3 303,695 4.5
Electricity, gas & water 13,851 5.7 14,631 5.6 15,196 3.9 15,522 2.1 15,336 -1.2
Transport, storage & communications 32,870 6.1 34,903 6.2 37,851 8.4 40,384 6.7 42,186 4.5
Wholesale & retail trade, hotels & restaurants 61,346 8.7 65,536 6.8 73,522 12.2 80,400 9.4 84,937 5.6
Finance, real estate & business services 65,541 7.8 71,023 8.4 80,516 13.4 85,042 5.6 87,494 2.9
Government services 30,371 7.5 33,498 10.3 35,004 4.5 39,168 11.9 42,223 7.8
Other services 26,064 4.3 27,304 4.8 28,673 5.0 30,072 4.9 31,485 4.7
Less : Undistributed FISIM 17,742 0.2 18,351 3.4 19,727 7.5 20,786 5.4 20,853 0.3
Plus : Import duties 6,017 -1.3 5,287 -12.1 5,521 4.4 6,793 23.0 6,576 -3.2GDP at purchasers' value 449,250 5.3 475,192 5.8 505,353 6.3 528,804 4.6 528,860 0.0
3.2 Demand (at constant 2000 prices)Private expenditure 267,088 7.9 284,865 6.7 315,024 10.6 337,423 7.1 336,323 -0.3
Consumption 216,247 9.1 230,222 6.5 255,028 10.8 276,527 8.4 286,205 3.5
Investment 50,841 3.3 54,643 7.5 59,996 9.8 60,896 1.5 50,118 -17.7
Public expenditure 106,820 6.7 113,731 6.5 122,667 7.9 130,655 6.5 145,538 11.4
Consumption 58,395 6.5 61,258 4.9 65,299 6.6 72,880 11.6 78,187 7.3
Investment 48,425 6.8 52,473 8.4 57,378 9.3 57,775 0.7 67,351 16.6
Exports of goods and services 554,261 8.3 592,898 7.0 617,628 4.2 626,824 1.5 522,913 -16.6
Imports of goods and services 475,838 8.9 516,412 8.5 544,059 5.4 556,015 2.2 473,102 -14.9GNP at purchasers' value 424,295 5.3 454,625 7.1 482,239 6.1 496,077 2.9 504,864 1.8
Notes : (p)
Preliminary (f)
Forecast
Sources : Economic Planning Unit, Ministry of Finance, Department of Statistics and Bank Negara Malaysia
2006 2007 2008 (p)
2009 (f)2005

8
Unit RM % RM % RM % RM % RM % million growth million growth million growth million growth million growth
3.3 Savings and Investment Gap
Savings :
RM million (current prices) current prices 182,782 9.7 213,677 16.9 241,206 12.9 271,531 12.6 223,716 -17.6
% of GNP 36.7 38.4 38.4 37.9 32.2
Investment 1/: current prices
RM million (current prices) 104,415 -4.4 120,173 15.1 140,796 17.2 141,595 0.6 143,713 1.5
% of GNP 20.9 21.6 22.4 19.8 20.7
Resource Balance 78,367 93,504 100,410 129,936 80,003
15.7 16.8 16.0 18.1 11.5
3.4 Major Products
Rubber '000 tonnes 1,126 -3.7 1,284 14.0 1,200 -6.6 1,078 -10.1 - -
Crude palm oil '000 tonnes 14,962 7.1 15,881 6.1 15,824 -0.4 17,734 12.1 - -
Sawlogs '000 cu.m 2/
22,398 2.8 21,894 -2.3 22,052 0.7 18,463 -16.3 - -
Tin '000 tonnes 2.9 4.1 2.4 -16.1 2.3 -5.5 2.5 36.8 - -
Crude oil & condensates '000 bpd 3/
704 -7.7 667 -5.2 683 2.4 694 1.7 - -
Natural gas mmscfd 4/
5,797 11.6 5,774 -0.4 5,884 1.9 5,579 -5.2 - -
Manufacturing production index 2005 =100 100.0 5.1 108.9 8.9 111.4 2.2 112.1 0.7 - -
Notes : (p)
Preliminary (f)
Forecast 1/
Including change in stock 2/
Cubic metres 3/
Barrels per day 4/
Million standard cubic feet per day
Sources : Economic Planning Unit, Ministry of Finance, Department of Statistics and Bank Negara Malaysia
2005 2006 2007 2008 (p)
2009 (f)

9
STRUCTURE OF PRODUCTION, 1980-2009
(% of GDP) 1/
1/: Excludes import duties and undistributed financial intermediate
services indirectly measured (FISIM)(p) Preliminary (f) Forecast
16.3
9.4
24.6
3.5
46.8
8.6
10.6
30.9
3.9
49.3
21.0
12.1
17.2
2.7
43.1
(f)
7.9
8.8
31.1
3.1
51.8
(p) 1980 1990 2000 2005 2006 2007 2008 2009
Agriculture
Mining
Manufacturing
Construction
Services
8.1
6.1
32.1
2.5
58.7
7.6
8.6
30.2
3.0
53.4
Perc
en
tag
e (
%)
8.0
9.4
30.8
3.3
51.1
7.4
8.0
26.8
3.0
57.4
GDP, CONSUMPTION AND INVESTMENT, 1985-2009
(Annual Growth Rate)
-50
-40
-30
-20
-10
0
10
20
30
40
-8
-6
-4
-2
0
2
4
6
8
10
12
'85 '86 '87 '88 '89 '90 '91 '92 '93 '94 '95 '96 '97 '98 '99 '00 '01 '02 '03 '04 '05 '06 '07 '08 '09
GDP (LHS) Total Consumption Total Investment
Percentage (%) Percentage (%)
(f)(p)
(p) Preliminary (f) Forecast

10
MANUFACTURING PRODUCTION INDEX ,
2006-2008
-5
0
5
10
15
20
25
30
'06 '07 '08
Total Export-oriented Domestic-oriented
% Annual
change

11
RM % RM % RM % RM % RM % million growth million growth million growth million growth million growth
3.6 Distributive Trade Wholesale
Value of sales 130,850 9.6 110,911 -15.2 140,088 26.3 161,023 14.9 193,613 20.2
Number of workers ('000) 166 -0.3 79 -52.4 85 7.8 105 23.5 108 2.5
Salaries & wages 3,436 -1.8 2,155 -37.3 2,781 29.0 3,447 24.0 4,206 22.0
Retail
Value of sales 38,442 5.4 59,384 54.5 71,692 20.7 95,836 33.7 116,104 21.4
Number of workers ('000) 228 -2.3 292 28.0 273 -6.8 274 0.7 313 14.1
Salaries & wages 1,410 -4.3 3,777 167.8 4,216 11.6 4,937 17.1 5,575 12.9
Motor Vehicles
Value of sales 25,743 0.3 27,826 8.1 25,380 -8.8 37,090 46.1 44,954 21.2
Number of workers ('000) 51 -5.5 38 -26.7 36 -5.0 51 41.9 56 10.2
Salaries & wages 921 -0.2 803 -12.8 950 18.3 1,359 43.2 1,725 26.9
Total
Value of sales 195,035 7.4 198,121 1.6 237,159 19.7 293,949 23.9 354,671 20.7
Number of workers ('000) 446 -1.9 409 -8.3 394 -3.8 431 9.4 477 10.8
Salaries & wages 5,767 -2.2 6,734 16.8 7,946 18.0 9,744 22.6 11,506 18.1
Sales per worker (RM) 436,965 9.6 483,991 10.8 602,340 24.5 682,729 13.3 743,545 8.9
Salaries & wages per worker (RM) 12,920 -0.3 16,451 27.3 20,181 22.7 22,631 12.1 24,122 6.6
Note : * Sampling frame changed in 2005 due to migration to classification based on Malaysia Standard Industry Classification 2000
Sources : Economic Planning Unit and Department of Statistics
2006* 2007* 2008*2004 2005*

12
4. PUBLIC SECTOR ACCOUNTS
Unit 2005 2006 2007 2008(p)
2009(f)
Unit 2005 2006 2007 2008(p)
2009(f)
4.1 Federal Government Finance 4.2 Consolidated Public Sector Finance4.1.1 Total revenue RM bil 106.3 123.5 139.9 159.8 160.8
a/4.2.1 General Government
% of GDP 20.3 21.5 21.8 21.6 22.8 Revenue RM bil 95.0 102.0 110.7 125.6 125.4
% of GNP 21.3 22.2 22.3 22.3 23.2 Operating expenditure RM bil 106.6 117.7 135.0 163.9 171.8
Direct taxes % of total 50.4 49.8 49.6 51.4 48.4 Current deficit RM bil -11.7 -15.8 -24.2 -38.3 -46.4
Indirect taxes % of total 25.4 20.3 18.4 19.2 15.3 % of GDP -2.2 -2.7 -3.8 -5.2 -6.6
Non-tax revenue % of total 23.6 29.1 31.4 28.7 35.8 % of GNP -2.3 -2.8 -3.9 -5.4 -6.7
4.2.2 Non-Financial Public
4.1.2 Current Expenditure RM bil 97.7 107.7 123.1 153.5 159.2 Enterprises(NFPEs)
Emoluments % of total 26.2 26.5 26.5 26.7 23.9 Surplus/Deficit RM bil 85.0 100.7 130.4 120.9 112.5
Supplies & services % of total 18.4 19.4 19.2 16.4 16.6 % of GDP 16.3 17.5 20.3 16.3 16.0
Asset acquisition % of total 1.6 1.8 2.1 1.8 2.1 % of GNP 17.0 18.1 20.8 16.9 16.2
Debt service charges % of total 11.9 11.6 10.5 8.3 8.5
Pension & gratitues % of total 7.0 6.5 6.7 6.5 5.8
Subsidies % of total 13.7 9.4 8.5 19.5 16.8 4.2.3 Total Public Sector Current
Others % of total 21.2 24.8 26.6 20.7 26.3 Surplus/Deficit RM bil 73.3 84.9 106.1 82.5 66.1
% of GDP 14.1 14.8 16.5 11.1 9.44.1.3 Development Expenditure RM bil 30.5 35.8 40.6 42.8 56.7 % of GNP 14.7 15.3 16.9 11.5 9.5
% of GDP 5.8 6.2 6.3 5.8 8.0
% of GNP 6.1 6.4 6.5 6.0 8.2
Economic services % of total 49.0 48.6 49.6 49.8 53.4 4.2.4 Development Expenditure RM bil 66.1 86.5 95.1 106.7 103.1
Social services % of total 24.4 26.6 31.8 32.0 35.2 % of GDP 12.6 15.1 14.8 14.4 14.6Security % of total 15.7 13.4 14.1 13.5 7.4 % of GNP 13.3 15.6 15.1 14.9 14.8
General administration % of total 10.9 11.4 4.6 4.7 4.0
4.2.5 Overall Surplus/Deficit RM bil 7.3 -1.6 11.1 -24.2 -37.0
4.1.4 Overall Surplus/Deficit RM bil -18.7 -19.1 -20.7 -35.6 -53.8 % of GDP 1.4 -0.3 1.7 -3.3 -5.2
% of GDP -3.6 -3.3 -3.2 -4.8 -7.6 % of GNP 1.5 -0.3 1.8 -3.4 -5.3
% of GNP -3.8 -3.4 -3.3 -5.0 -7.7
4.1.5 Sources of Finance (net) 4.2.6 External Debt
Domestic borrowing RM bil 12.7 17.8 25.8 35.7 48.2 Debt service ratio 1/
% 5.4 4.8 3.8 2.7 -
External borrowing RM bil -3.5 -3.1 -4.3 -0.5 5.6 Total debt RM bil 197.7 184.5 187.4 235.6 -
Change in assets RM bil 9.5 4.4 -0.8 0.4 - Medium and long term debt RM bil 150.7 141.7 133.0 155.6 -
Notes : (p)
Preliminary (f) Forecast 1/
% of exports of goods and servicesa/
Revenue used are inclusive of potential tax losses arising from implementation of second stimulus package on 10 March 2009
Sources : Economic Planning Unit, Ministry of Finance and Bank Negara Malaysia

13
FEDERAL GOVERNMENT FINANCE, 1985-2009
-70
-50
-30
-10
10
30
50
70
90
110
130
150
170
'85 '86 '87 '88 '89 '90 '91 '92 '93 '94 '95 '96 '97 '98 '99 '00 '01 '02 '03 '04 '05 '06 '07 '08 '09
Overall Balance Current Expenditure
Total Revenue Development Expenditure
RM Billion
(f)(p)
(p) Preliminary (b) Forecast
COMPONENTS OF FEDERAL GOVERNMENT OPERATING
EXPENDITURE, 1990-2009(Share to Total)
0%
10%
20%
30%
40%
50%
60%
70%
80%
90%
100%
'90 '91 '92 '93 '94 '95 '96 '97 '98 '99 '00 '01 '02 '03 '04 '05 '06 '07 '08 '09
Emoluments Pension & gratuities Debt service chargesGrants & transfers Supplies & services SubsidiesOthers
(p) (f)
(p) Preliminary (f) Forecast
Percentage (%)

14
SOURCES OF FEDERAL GOVERNMENT REVENUE
1985-2009
-20
-15
-10
-5
0
5
10
15
20
25
30
35
0
20
40
60
80
100
120
140
160
180
'85 '86 '87 '88 '89 '90 '91 '92 '93 '94 '95 '96 '97 '98 '99 '00 '01 '02 '03 '04 '05 '06 '07 '08 '09
Direct Taxes Indirect Taxes Non - Tax Revenue Total Revenue (% growth) (RHS)
RM Billion % Growth
(f)(p)
(p) Preliminary (f) Forecast
MALAYSIAN TAX STRUCTURE, 1990-2009DIRECT TAXES
INDIRECT TAXES
(p)
RM billion
RM billion
(f)
(p)
(p) Preliminary (f) Forecast
(f)

15
5. BALANCE OF PAYMENTS
ITEM % of % of % of % of % of % ofRM million GNP RM million GNP RM million GNP RM million GNP RM million GNP RM million GNP
5.1 Goods (net) 104,774 23.3 128,892 25.9 134,558 24.2 127,673 20.3 170,116 23.8 108,103 15.6
Exports 481,903 107.2 539,420 108.2 589,743 106.0 605,916 96.5 664,181 92.9 495,751 71.4Imports 377,129 83.9 410,529 82.4 455,185 81.8 478,243 76.1 494,065 69.1 387,647 55.8
5.2 Services Account (net) -8,199 -1.8 -9,612 -1.9 -6,931 -1.2 2,373 0.4 1,725 0.2 -854 -0.1
Transportation -17,545 -3.9 -15,880 -3.2 -19,620 -3.5 -13,173 -2.1 -14,644 -2.0 -14,148 -2.0Travel 19,096 4.2 18,683 3.7 23,501 4.2 29,115 4.6 28,221 3.9 24,263 3.5Other services -9,029 -2.0 -12,066 -2.4 -10,378 -1.9 -13,178 -2.1 -11,301 -1.6 -10,853 -1.6Government services n.i.e. -721 -0.2 -350 -0.1 -433 -0.1 -390 -0.1 -551 -0.1 -115 0.0
5.3 Income (net) -24,402 -5.4 -23,943 -4.8 -17,271 -3.1 -13,893 -2.2 -24,856 -3.5 -10,620 -1.5
Compensation of employees -995 -0.2 -535 -0.1 -283 -0.1 -600 -0.1 -726 -0.1 -1,150 -0.2Investment income -23,407 -5.2 -23,408 -4.7 -16,988 -3.1 -13,294 -2.1 -24,130 -3.4 -9,470 -1.4
5.4 Current Transfers -14,871 -3.3 -16,971 -3.4 -16,852 -3.0 -15,743 -2.5 -17,049 -2.4 -16,627 -2.4
5.5 Current Account Balance (net) 57,302 12.7 78,367 15.7 93,504 16.8 100,410 16.0 129,936 18.1 80,003 11.5
5.6 Capital & Financial Account
Balance(net)
Capital Account - - - -95 0.0 585 0.1 -Financial Account 19,347 4.3 -36,991 -7.4 -43,488 -7.8 -37,710 -6.0 -123,875 -17.3 - - Direct investment 9,739 2.2 3,749 0.8 22 0.0 -9,142 -1.5 -20,458 -2.9 - - Portfolio investment 32,994 7.3 -14,116 -2.8 12,911 2.3 18,355 2.9 -92,406 -12.9 - - Other investment -23,386 -5.2 -26,624 -5.3 -56,422 -10.1 -46,923 -7.5 -11,011 -1.5 - --
5.7 Overall balance 83,728 18.6 13,550 2.7 25,158 4.5 45,296 7.2 -18,250 -2.6 - -Central Bank international reserves (net) 251,690 56.0 265,240 53.2 290,399 52.2 335,695 53.5 317,445 44.4 - -
Months of retained imports 7.9 7.7 7.8 8.4 7.6 - - -
Notes :(p)
Preliminary (f)
Forecast
Sources : Economic Planning Unit and Department of Statistics
2008 (p)
2009 (f)
2004 2005 2006 2007

16
BALANCE ON SERVICES AND INCOME, 2003-2009
RM billion
(f)
(p)Preliminary (f) Forecast
(p)
BALANCE OF PAYMENTS, 1985-2009
-150
-100
-50
0
50
100
150
200
'85 '86 '87 '88 '89 '90 '91 '92 '93 '94 '95 '96 '97 '98 '99 '00 '01 '02 '03 '04 '05 '06 '07 '08 '09
Current Account Overall Balance Goods Services & Income Financial Account
RM billion
(f)
(p)Preliminary (f) Forecast
(p)

21
8. EXTERNAL SECTOR
Unit 2003 2004 2005 2006 2007 2008(p)
8.1 Exports
Total exports RM mil 397,844 481,253 536,234 588,966 605,153 663,514
Annual growth % 11.3 21.0 11.4 9.8 2.7 9.6
Major primary commoditiesRubber RM mil 3,583 5,205 5,787 8,235 7,335 8,110Palm oil RM mil 20,192 20,842 19,025 21,643 31,983 46,050
Sawlogs & sawn timber RM mil 5,182 5,677 6,630 6,594 6,208 5,504Crude oil & condensates RM mil 15,659 21,494 28,440 30,814 31,880 43,040
Manufacturing products RM mil 326,322 390,938 430,093 473,213 474,714 492,111
Annual growth % 8.0 19.8 10.0 10.0 0.3 3.7
Electrical & electronic products RM mil 222,851 257,221 282,682 300,861 288,326 277,276
Chemical & chemical products RM mil 21,200 27,836 29,971 32,893 37,421 40,974
Manufactures of metal RM mil 11,242 15,969 17,154 22,817 26,410 29,262
Optical & scientific equipment RM mil 9,156 11,615 12,318 13,558 13,612 14,944
8.2 Imports1/
Total imports RM mil 316,538 399,632 432,871 480,773 504,814 521,503
Annual growth % 4.4 26.3 8.3 11.1 5.0 3.3
Consumption goods RM mil 18,721 22,879 24,288 27,894 28,906 32,273
Intermediate goods RM mil 235,448 287,884 309,667 335,532 358,755 378,997
Capital goods RM mil 40,799 55,482 58,900 65,257 69,934 69,957
Others RM mil 13,080 16,045 18,323 19,170 21,666 18,533
Imports for re-exports RM mil 8,490 17,342 21,693 32,920 25,553 21,851
Notes : (p) Preliminary 1/ Based on Broad Economic Categories (BEC)
Sources : Department of Statistics and Bank Negara Malaysia

22
Unit 2003 2004 2005 2006 2007 2008(p)
8.3 Direction of Exports
USA % of total 19.6 18.8 19.6 18.8 15.6 12.5
Singapore % of total 15.7 14.9 15.6 15.4 14.6 14.7
North East Asia 1/
% of total 13.0 12.7 12.1 11.3 11.2 10.6
ASEAN 2/
% of total 9.1 10.1 10.4 10.7 11.1 11.1
Japan % of total 10.7 10.1 9.4 8.9 9.1 10.8
China % of total 6.5 6.7 6.6 7.2 8.8 9.5
8.4 Sources of Imports
North East Asia 1/
% of total 13.1 13.0 13.0 13.5 13.6 12.1
Japan % of total 17.1 16.1 14.5 13.2 13.0 12.5
ASEAN 2/
% of total 12.4 12.8 13.0 12.7 13.0 13.2
USA % of total 15.4 14.5 12.9 12.5 10.8 10.8
China % of total 8.7 9.8 11.5 12.1 12.9 12.8
Singapore % of total 11.7 11.1 11.7 11.7 11.5 11.0
8.5 Trade Prices and Terms of Trade
Export Price Index index (2000=100) 101.6 106.9 110.7 113.0 114.5 122.3
Import Price Index index (2000=100) 100.1 103.1 104.0 105.0 106.1 106.9
Terms of Trade index (2000=100) 101.5 103.7 106.5 107.6 107.9 114.3
Notes :(p)
Preliminary1/
Exclude Japan and China.2/
ASEAN-10 exclude Singapore
Sources : Department of Statistics and Bank Negara Malaysia

23
IMPORTS BY BROAD ECONOMIC CATEGORIES, 1991 & 2008 (% of Total )
1991
RM100,831 million
2008
RM 521,503 million
Consumption
goods
7.3
Capital goods19.2
Others4.1
Consumption goods
6.2
Capital goods13.4 Others
3.6
Intermediate goods72.7
Imports for
re-exports
4.2
Imports for
re-exports
5.0
Intermediate goods64.4
DIVERSIFICATION OF EXPORTS, 1991 & 2008 (% of Total)
Manufactured
64.9
Palm Oil
5.3Others
4.6Rubber
2.8
Tin
0.7
Forestry
7.4
Oil & gas
14.3
Manufactured
74.2
Palm Oil
6.9Others
4.0Rubber
1.2Tin
0.3
Forestry
0.8
Oil & gas
12.6
1991
RM94,497 million
2008
RM663,514 million
1/
1/
1/ Crude oil and condensates and liquefied natural gas.

24
8.6 Trade Balance by Main Trading Partners (RM million)
Exports Imports Balance Exports Imports Balance Exports Imports Balance Exports Imports Balance Exports Imports Balance
North America 93,269 59,621 33,649 108,106 58,001 50,106 114,353 62,614 51,739 97,800 57,261 40,540 85,960 59,710 26,250
United States 90,254 57,863 32,391 105,238 55,869 49,369 110,586 60,210 50,376 94,519 54,688 39,831 82,741 56,454 26,288Canada 3,016 1,758 1,258 2,868 2,132 737 3,767 2,404 1,363 3,281 2,573 708 3,219 3,256 -38
EU 60,478 47,845 12,633 63,100 50,301 12,799 74,941 54,757 20,184 77,824 59,941 17,882 74,868 61,681 13,187
France 7,084 5,533 1,551 6,912 5,637 1,275 7,942 7,696 246 7,352 7,717 -365 6,361 7,554 -1,192Germany 10,521 17,768 -7,247 11,173 19,275 -8,102 12,774 21,063 -8,288 14,832 23,423 -8,592 15,361 22,469 -7,108Netherlands 15,779 3,436 12,342 17,915 3,357 14,558 21,429 3,375 18,055 23,599 3,282 20,317 23,443 3,683 19,760United Kingdom 10,554 6,610 3,944 9,449 6,376 3,073 10,714 6,809 3,905 9,899 7,266 2,633 9,487 7,654 1,8330
ASEAN 120,298 95,601 24,698 139,519 106,681 32,838 153,560 117,442 36,118 155,560 123,421 32,139 171,189 126,397 44,792Brunei Darussalam 1,209 50 1,159 1,362 47 1,315 1,268 276 992 1,381 328 1,053 1,484 339 1,145
Indonesia 11,639 15,964 -4,325 12,540 16,553 -4,013 14,916 18,166 -3,250 17,749 21,379 -3,630 20,719 24,186 -3,467Philippines 7,384 10,707 -3,323 7,517 12,191 -4,674 7,974 10,640 -2,666 8,739 9,775 -1,036 9,761 6,940 2,821Singapore 71,938 44,278 27,660 83,596 50,586 33,011 90,751 56,188 34,563 88,508 57,955 30,552 97,765 57,321 40,444Thailand 22,900 21,974 926 28,746 22,857 5,889 31,177 26,276 4,901 29,984 27,006 2,978 31,755 29,269 2,4860
Far East 80,785 103,662 -22,878 85,663 112,653 -26,991 94,875 121,794 -26,919 108,277 130,443 -22,166 135,004 131,953 3,051
Japan 48,499 64,389 -15,890 50,509 62,773 -12,264 52,215 63,568 -11,354 55,241 65,539 -10,298 71,793 65,099 6,694China 32,286 39,274 -6,988 35,153 49,880 -14,727 42,660 58,226 -15,565 53,035 64,903 -11,868 63,211 66,854 -3,6430
NIEs 61,746 52,180 9,567 64,604 56,260 8,343 66,479 64,781 1,698 67,464 68,322 -857 70,437 62,967 7,470
Hong Kong 28,736 10,694 18,041 31,221 10,721 20,500 29,144 12,650 16,494 27,970 14,676 13,294 28,326 13,658 14,668South Korea 16,948 19,864 -2,916 18,329 21,581 -3,253 21,291 25,911 -4,620 23,032 24,933 -1,901 25,880 24,218 1,662Taiwan 16,062 21,621 -5,559 15,054 23,958 -8,904 16,044 26,220 -10,176 16,462 28,712 -12,250 16,230 25,091 -8,860
Central & South America 5,696 4,871 825 6,174 6,831 -657 7,853 8,100 -247 9,260 9,050 209 11,377 8,950 2,427Australia 15,812 6,793 9,019 18,138 8,146 9,992 16,711 8,884 7,827 20,400 10,205 10,195 24,410 11,764 12,646- -
TOTAL (including others) 481,253 399,632 81,621 536,234 432,871 103,363 588,966 480,773 108,194 605,153 504,814 100,339 663,514 521,503 142,011
Note : (p)
Preliminary
Sources: Department of Statistics and Bank Negara Malaysia
2006 2007 2008(p)
Country2004 2005

25
MALAYSIA’S IMPORTS BY ORIGIN, 1970 & 2008
Philippines 0.7%Thailand 15.8%
Others1/ 6.8%
Indonesia 21.5%
Singapore 33.2%
Brunei 28.8%
Indonesia 19.1%
Thailand 23.2%
Singapore 45.4%
2008RM521,503 million
1970RM4,288 million
1/ Include Brunei, Vietnam,
Myanmar, Laos and Cambodia
MALAYSIA’S EXPORTS BY DESTINATION, 1970 & 2008
Rest of the world19.0%
NIEs10.6%
Far East20.3%
ASEAN25.8%EU
11.3%
North America13.0%
Brunei 2.3%
Indonesia 2.5%
Thailand 3.5%
Philippines 6.8%
Singapore 84.9%
Indonesia 12.1%
Thailand 18.5%
Philippines 5.7%
Singapore 57.1%
Others1/ 6.6%
2008RM663,514 million
1970RM5,163 million
1/ Include Brunei, Vietnam,
Myanmar, Laos and Cambodia

26
TOURIST ARRIVALS, 2000-2008(‘000)
8.7 Tourist Arrivals by Region
'000 % of Total '000 % of Total '000 % of Total '000 % of Total '000 % of Total
ASIA 14,086 89.7 14,809 90.1 15,678 89.4 18,120 86.4 19,528 88.6
ASEAN 12,491 79.5 13,239 80.6 13,857 79.0 15,620 74.5 16,637 75.4
Eastern Asia 1,226 7.8 1,108 6.7 1,263 7.2 1,595 7.6 1,849 8.4
Sourthern Asia 237 1.5 309 1.9 371 2.1 659 3.1 763 3.5
Western Asia 131 0.8 153 0.9 187 1.1 245 1.2 264 1.2
AMERICAS 272 1.7 275 1.7 312 1.8 472 2.3 345 1.6
Caribbean 38 0.2 36 0.2 38 0.2 79 0.4 75 0.0
Central America 13 0.1 13 0.1 14 0.1 30 0.1 9 0.0
Northern America 180 1.1 185 1.1 211 1.2 254 1.2 301 1.4
Southern America 42 0.3 41 0.3 50 0.3 110 0.5 27 0.1
OCEANIA 266 1.7 339 2.1 355 2.0 441 2.1 486 2.2
EUROPE 540 3.4 618 3.8 673 3.8 830 4.0 1,011 4.6
Eastern Europe 30 0.2 27 0.2 34 0.2 65 0.3 60 0.3
Northern Europe 277 1.8 323 2.0 349 2.0 410 2.0 513 2.3
Southern Europe 85 0.5 86 0.5 87 0.5 115 0.5 92 0.4Western Europe 149 0.9 181 1.1 203 1.2 241 1.1 346 1.6
AFRICA 141 0.9 133 0.8 163 0.9 315 1.5 143 0.7
OTHERS 398 2.5 257 1.6 364 2.1 795 3.8 539 2.4
TOTAL 15,703 100.0 16,431 100.0 17,547 100.0 20,973 100.0 22,052 100.0
Source : Ministry of Tourism
2004 2005 2006 2007 2008Region
28
10. ENERGY AND INFRASTRUCTURE
PJ¹/ % of PJ¹/ % of PJ¹/ % of PJ¹/ % of PJ¹/ % of PJ¹/ % of PJ¹/ % of
Total Total Total Total Total Total Total
10.1 Primary Commercial Energy - Final Demand
Final Demand By Source :
Petroleum products 886.0 61.2 954.5 62.0 963.0 60.1 937.0 55.5 1,039.8 56.1 1,067.0 55.8 1,101.0 55.0
Electricity 264.1 18.3 287.1 18.7 291.0 18.2 304.3 18.0 321.5 17.4 334.4 17.5 354.3 17.7
Natural gas 246.3 17.0 246.4 16.0 292.0 18.2 389.8 23.1 433.9 23.4 451.9 23.6 481.9 24.1
Coal & coke 50.7 3.5 51.4 3.3 56.0 3.5 55.9 3.3 56.9 3.1 59.2 3.1 63.5 3.2
TOTAL 1,447.1 100.0 1,539.4 100.0 1,602.0 100.0 1,687.0 100.0 1,852.1 100.0 1,912.5 100.0 2,000.7 100.0
1999 2000 2001 2002 2003 2004 2005 2006 2007 2008(p)
2009(f)
10.2 Electricity - Demand and Supply
Peak demand (Megawatt) 9,690 10,657 11,055 11,833 12,504 13,848 13,809 14,375 15,172 15,669 16,132
Installed capacity (Megawatt) 13,625 14,291 14,761 15,483 18,562 19,423 19,380 20,125 21,559 21,674 24,023
Reserve margin (%) 40.6 34.1 33.5 30.8 48.4 40.3 40.3 40.0 42.1 38.3 48.9
Notes : (p)
Preliminary (f)
Forecast
1/ Joule is the unit of energy used to establish the equivalent physical heat content of each energy form, where 1 petajoule (PJ) = 1015 joules
Sources : Economic Planning Unit, Ministry of Energy, Green Technology and Water, Tenaga Nasional Berhad, Sabah Electricity Sdn. Bhd. and Sarawak Electricity Corporation Berhad
2009 (f)
2003 2004 2005 2006 2007 2008 (p)

29
GENERATION MIX OF ELECTRICITY, 1995-2009
(% of Total)
Oil (11.0)
Gas (67.8)
Hydro (11.3)
Gas (72.5)
Coal (9.7)
1995
(41,813 GWH)2009
(106,530 GWH)
2003(83,300 GWH)
Hydro (6.2)
Oil (4.1)
Coal (16.5)
Others (0.7)
Gas (63.0)
Hydro (5.4)
Coal (30.4)
Oil (1.1)
Others (0.1)
Others (0.2)

30
Unit 2003 2004 2005 2006 2007 2008 2009(f)
10.3 Roads By Surface Type
Paved km 59,113 59,255 59,277 59,816 67,851 83,622 n.a.
Unpaved km 17,687 18,042 18,396 18,440 19,174 38,505 n.a.
TOTAL km 76,800 77,297 77,673 78,256 87,025 122,127 n.a.
10.4 Railway Statistics
Inter-city daily ridership '000s 9.2 10.0 10.1 10.4 10.9 10.2 11.5KTM Komuter daily ridership '000s 67.5 75.0 85.7 95.9 106.0 100.1 116.5Light Rail daily ridership '000s 293.1 324.6 347.4 355.4 382.9 471.8 n.a.Total freight traffic '000 tonnes 4,607 4,610 4,039 4,466 8,248 4,824 9,200Container handling TEU's 276,586 302,735 310,011 333,050 389,616 306,278 391,632
10.5 Air Traffic Statistics
No. of Passengers
Domestic million 21.8 25.4 25.6 25.6 27.0 27.8 26.4
International million 12.3 15.5 17.2 18.2 19.3 21.1 21.1
TOTAL (including transit) million 34.1 40.9 42.8 43.8 46.3 48.9 47.5
Cargo Handled
Domestic tonnes 152,242 181,972 197,783 183,301 196,491 182,594 491,751
International tonnes 720,193 783,403 809,031 871,704 947,033 883,188 116,668TOTAL (including transit) tonnes 872,435 965,375 1,006,814 1,055,005 1,143,524 1,065,782 608,419
10.6 Port Statistics
Composition of Cargo Throughput
General cargo mil tonnes 31.7 40.9 44.7 35.1 35.6 19.9 16.9Dry bulk cargo mil tonnes 31.7 31.8 38.2 38.5 40.3 23.6 20.1
Liquid bulk cargo mil tonnes 98.6 101.9 103.8 104.5 110.2 43.6 37.0Containerized cargo mil tonnes/TEU's* 150.6 161.5 182.7 206.1 241.3 6.4 * 5.4 *TOTAL mil tonnes 312.6 336.1 369.4 384.2 391.8 87.1 ** 74.0 **
Notes : (f)
Forecast n.a. (not available) * Twenty-foot Equivalent units (million) ** Total exclude containerized cargo
Sources : Economic Planning Unit, Department of Statistics, Ministry of Transport, Ministry of Works, Malaysian Communications and Multimedia Commission and Malaysia Airports Holdings Berhad

31
123.54
132.27
121.74
130.31
128.41
137.0295.75
100.81
112.44
79.36
109.41
Income & Distribution
Working Life
Transport & Communications
Health
Education
HousingEnvironment
Family Life
Social Participation
Public Safety
Culture & Leisure
INDICES OF AREAS, 1990 & 2007
1990 2006 2007
11. QUALITY OF LIFE
Index 2006 2007% Change
(1990-2007)
11.1 Area Indices and the
Malaysian Quality of Life Index
Income & Distribution 122.14 123.54 23.5
Working Life 130.98 132.27 32.3
Transport & Communications 125.43 121.74 21.7
Health 129.04 130.31 30.3
Education 127.70 128.41 28.4
Housing 134.07 137.02 37.0
Environment 93.70 95.75 -4.3
Family Life 103.83 100.81 0.8
Social Participation 108.70 112.44 12.4
Public Safety 80.22 79.36 -20.6
Culture and Leisure 104.18 109.41 9.4
MQLI 114.50 115.60 15.6
Source : Economic Planning Unit
Note : 1990 is used as the base year

32
11.2 Selected Social Indicators
Unit 2003 2004 2005 2006 2007 2008 (p)
Indicators
Trade disputes number 378 321 381 333 302 267
Working days lost per 1,000 workers 0.1 3.3 4.8 0.5 0.2 0.3
Industrial accidents per 1,000 workers 73.9 69.1 61.1 58.3 56.3 n.a.
Private motorcars and motorcycles per 1,000 population 462 488 516 529 557 589
Telephone fixed lines per 1,000 population 181 172 166 161 158 n.a.
Cellular phones per 1,000 population 439 565 741 723 851 944(f)
Internet subscribers per 1,000 population 114 127 139 140 143 n.a.
Total road mileage km 76,800 77,297 77,673 78,256 104,112 122,127
Total railway tracks km 2,266 2,266 2,266 2,270 2,384 2,266
Average daily newspaper circulation per 1,000 population 147.9 154.5 148.4 143.5 138.6 1,406.1a/
Doctor-population ratio persons 1,377 1,402 1,300 1,214 1,145 n.a.
Crude birth rate per 1,000 population 20.6 19.1 19.4 19.0 17.6(p)
n.a.
Crude death rate per 1,000 population 4.5 4.5 4.5 4.5 4.4(p)
n.a.
Infant mortality rate per 1,000 live births 5.8 6.5 6.7 6.6 6.3(e)
n.a.
Maternal mortality rate per 1,000 population 0.4 0.3 0.3 0.3 0.3(e)
n.a.
Life expectancy at birth : male years 70.9 71.1 71.8 71.5 71.9(p)
n.a.
: female years 75.6 75.9 76.2 76.5 76.4(p)
n.a.
Beds in hospitals 1/
number 34,089 34,414 34,716 35,739 37,149 n.a.
Notes : (p)Preliminary
1/ Include government hospitals and special medical institutions
Sources : Economic Planning Unit, Department of Statistics, Ministry of Works, Ministry of Health, Ministry of Transport, Industrial Relations Department, Malaysian Communications & Multimedia Commission
and National Registration Department
(f)Forecast
(e)Estimate n.a. (not available)
a/Data as at 30 July 2008

33
Unit 2003 2004 2005 2006 2007 2008(p)
Indicators
Literacy rate % 95.0 95.1 95.0 95.0 92.3 92.1
Enrolment : primary school */
% 93.8 94.2 94.3 94.4 94.2 94.0
: lower secondary school % 81.8 82.0 84.4 84.8 85.1 86.3
: upper secondary school % 71.7 72.5 71.7 71.0 72.5 77.7
: tertiary **/
% 4.4 -0.1 4.5 7.8 15.7 5.2
Pupil-teacher ratio : primary pupils 17.6 17.2 16.5 16.1 11.1 14.3: secondary pupils 16.4 16.3 16.2 16.1 15.5 13.9
Electricity coverage : rural housing units % of population 91.5 92.7 92.9 93.3 93.5 94.3
Water coverage 2/
: total hour/units with piped water % 93.0 93.6 95.0 94.0 95.4 95.5
Low-cost housing and flat completed units 3/
number 48,858 35,619 54,957 51,870 37,692 17,420
Air quality % of stations with API < 50 78.4 74.5 78.0 78.0 100.0 59.0
Water quality % of clean rivers 49.2 48.3 54.8 63.6 63.6 n.a.Forested land % of total land 59.3 59.2 59.2 55.2 59.2 n.a.
Divorces % population aged 18-50 1.5 1.6 1.7 1.8 1.7 1.7b/
Household size number 4.6 4.6 4.6 4.6 4.3 n.a.
Membership in residents’ associations number 1,945 2,249 2,769 2,808 1,704 n.a.
Crimes per 1,000 population 6.2 6.1 6.0 7.5 7.7 n.a.
Road accidents (fatality rate) per 10,000 vehicles 4.9 4.5 4.2 4.0 3.7 3.6
Notes : */ Excluding pre-school enrolment in primary schools
(p) Preliminary
b/ Number of registered muslim divorces for Pahang and Johor until June 2008 n.a. (not available)
**/ Excluding pre-university (e.g. matriculation, pre-diploma and certificate) enrolment
2/Beginning from 2000, water coverage is presented by the percentage of population
3/ Data from National Property Information Centre (NAPIC) and National Housing Department
Sources : Economic Planning Unit, Department of Statistics, Ministry of Works, Ministry of Education, Ministry of Higher Education, National Registration Department, Department of Islamic Development Malaysia
and Royal Malaysian Police

34
11.3 Poverty *
Unit 1997 1999 2002 2004 2007 20081/
Incidence of poverty :
overall % of households 6.1 8.5 6.0 5.7 3.6 3.6
rural % of households 10.9 14.8 13.5 11.9 7.1 7.4
urban % of households 2.1 3.3 2.3 2.5 2.0 1.9
Incidence of hardcore poverty :
overall % of households 1.4 1.9 1.0 1.2 0.7 0.7
rural % of households 2.5 3.6 2.6 2.9 1.4 1.7
urban % of households 0.4 0.5 0.3 0.4 0.3 0.3
11.4 Gender-Related Information
Unit 2003 2004 2005 2006 2007 2008
Female population % 49.1 49.1 49.1 49.1 49.1 49.1
Female labour force % 35.9 36.0 35.6 35.6 36.1 35.7
Total female employed % 35.9 35.9 35.6 35.6 36.1 35.7
Female unemployed rate % 3.6 3.8 3.7 3.4 3.4 3.7
Female labour force participation rate % 47.7 47.3 45.9 45.8 46.4 45.7
Female primary schools enrolment % 48.6 48.6 48.6 48.6 48.6 48.6
Female secondary schools enrolment % 50.3 50.1 50.0 51.0 50.9 49.8
Female university enrolment % 60.9 60.6 61.2 61.4 61.7 61.7
Female members in Parliament 2/ % 14.5 15.9 13.8 14.2 13.4 13.5
Notes : * Based on Household Income Survey which is done once in a 2 years1/
Based on preliminary data 2/
Including the Senate
Sources : Economic Planning Unit, Department of Statistics, Ministry of Women, Family and Community Development, Ministry of Education and Ministry of Higher Education

35
REAL GDP GROWTH, 1987-2009
-8
-6
-4
-2
0
2
4
6
8
10
12
'87 '88 '89 '90 '91 '92 '93 '94 '95 '96 '97 '98 '99 '00 '01 '02 '03 '04 '05 '06 '07 '08 '09
Malaysia World Developing Countries
Annual Growth (%)
(f)
( f ) Forecast
12. INTERNATIONAL COMPARISON
Country 2004 2005 2006 2007 2008 2009 (f)
12.1 Real Gross Domestic Product
World (% Annual Growth) 4.9 4.5 5.1 5.2 3.2 -1.3
Advanced Economies 3.2 2.6 3.0 2.7 0.9 -3.8
Germany 1.2 0.8 3.0 2.5 1.3 -5.6Japan 2.7 1.9 2.0 2.4 -0.6 -6.2United Kingdom 2.8 2.1 2.8 3.0 0.7 -4.1United States 3.6 2.9 2.8 2.0 1.1 -2.8
Developing Countries 7.5 7.1 8.0 8.3 6.1 1.6
NIEs 5.9 4.7 5.6 5.7 1.5 -5.6
Hong Kong 8.5 7.1 7.0 6.4 2.5 -4.5Korea 4.6 4.0 5.2 5.1 2.2 -4.0Singapore 9.3 7.3 8.4 7.8 1.1 -10.0Taiwan 6.2 4.2 4.8 5.7 0.1 -7.5
ASEAN
Brunei Darussalam 0.5 0.4 4.4 0.6 -1.5 0.2 Indonesia 5.0 5.7 5.5 6.3 6.1 2.5 Malaysia 6.8 5.0 5.9 6.3 4.6 -1.0 ~ +1.0 *
Philippines 6.4 5.0 5.4 7.2 4.6 0.0Thailand 6.3 4.6 5.2 4.9 2.6 -3.0Vietnam 7.8 8.4 8.2 8.5 6.2 3.3
China 10.1 10.4 11.6 13.0 9.0 6.5
India 7.9 9.2 9.8 9.3 7.3 4.5
Notes :(f)
Forecast * Bank Negara Malaysia Annual Report 2008
Sources : Bank Negara Malaysia and World Economic Outlook April 2009
36
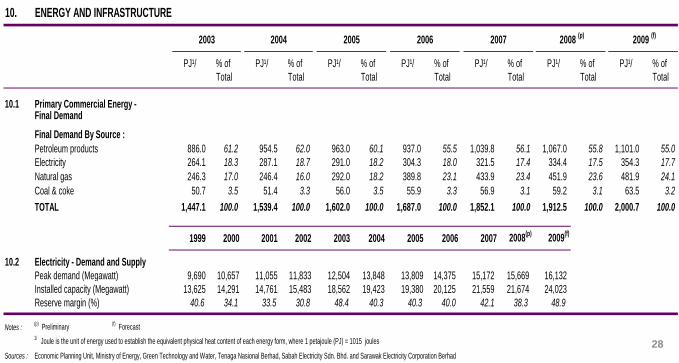
INFLATION RATE, 1990-2009
-5
0
5
10
15
20
25
'90 '95 '96 '97 '98 '99 '00 '01 '02 '03 '04 '05 '06 '07 '08 '09
Malaysia Developing Countries Advanced Economies
Percentage Change (%)
(f)
( f ) Forecast
Country 2004 2005 2006 2007 2008 2009 (f)
12.2 Consumer Price Index
(% Annual Growth)
Advanced Economies 2.0 2.3 2.4 2.2 3.4 -0.2
Germany 1.8 1.9 1.8 2.3 2.8 0.1Japan 0.0 -0.3 0.3 0.0 1.4 -1.0
United Kingdom1/
1.3 2.0 2.3 2.3 3.6 1.5United States 2.7 3.4 3.2 2.9 3.8 -0.9
Developing Countries 5.9 5.7 5.4 6.4 9.3 5.7
NIEs
Hong Kong -0.4 0.9 2.0 2.0 4.3 1.0Singapore 1.7 0.5 1.0 2.1 6.5 0.0Korea 3.6 2.8 2.2 2.5 4.7 1.7Taiwan 1.6 2.3 0.6 1.8 3.5 -2.0
ASEAN 6
Brunei Darussalam 0.9 1.1 0.2 0.3 2.7 1.2Indonesia 6.1 10.5 13.1 6.0 9.8 6.1Malaysia 1.4 3.0 3.6 2.0 5.4 1.5 ~ 2.0 *
Philippines 6.0 7.7 6.2 2.8 9.3 3.4Thailand 2.8 4.5 4.6 2.2 5.5 0.5Vietnam 7.9 8.4 7.5 8.3 23.1 6.0
China 3.9 1.8 1.5 4.8 5.9 0.1India 3.8 4.2 6.2 6.4 8.3 6.3
Notes :(f)
Forecast
* Bank Negara Malaysia Annual Report 20081/
Based on Eurostat's harmonized index of consumer prices
Sources : Economic Planning Unit and World Economic Outlook April 2009

37
GDP
(US$ billion) Agriculture Industry1/
Services
12.3 Structure of Output
Selected Developed Countries
Germany 2007 3,297.2 1.0 30.0 69.0Japan 2007 4,376.7 2.0 30.0 69.0United Kingdom 2007 2,727.8 1.0 24.0 75.0United States 2007 13,811.2 1.0 23.0 76.0
NIEsHong Kong 2007 206.7 0.0 9.0 91.0Singapore 2007 161.3 0.0 31.0 69.0Korea 2007 969.8 3.0 39.0 58.0
Taiwan 2007 383.3 1.4 27.5 71.1
ASEAN Indonesia 2007 432.8 14.0 47.0 39.0
Malaysia2/
2007 147.0 7.6 44.6 47.8Philippines 2007 144.1 14.0 31.0 55.0Thailand 2007 245.8 11.0 44.0 45.0Vietnam 2007 71.2 20.0 42.0 38.0
China 2007 3,280.1 12.0 48.0 40.0India 2007 1,171.0 18.0 29.0 53.0
Notes:1/
Includes mining, manufacturing, construction, electricity, gas and water2/
Adjusted for Import Duties less FISIM
Sources: Economic Planning Unit and World Development Report 2009
Country YearValue Added as percent of GDP (%)

38
Government
Consumption
12.4 Structure of Demand
(in current prices)
Selected Developed Countries
Germany 2007 18.0 56.7 18.6 46.9
Japan 2007 17.5 57.0 23.8 17.6
United Kingdom 2007 21.2 63.8 18.1 26.3
United States 2007 19.4 70.3 18.7 12.0
NIEs
Hong Kong 2007 8.0 59.8 21.4 207.3
Singapore 2007 10.5 39.6 24.9 230.9
Korea 2007 15.1 54.1 28.8 45.6
ASEAN
Indonesia 2007 8.3 63.5 24.9 29.4Malaysia 2007 12.2 45.6 21.7 110.2
Philippines 2007 9.7 69.4 14.0 42.6
Thailand 2007 12.2 53.7 26.8 73.2
Vietnam 2007 6.1 64.9 35.0 76.8
China 2007 13.3 35.4 42.8 38.8
India 2007 10.1 55.3 34.6 21.3
Sources : Economic Planning Unit, Department of Statistics, World Competitiveness Yearbook 2008 and Economist Intelligence Unit
Investment Services
Country Year
Percentage of GDP (%)
Private Gross Exports of
Consumption Domestic Goods &

39
2004 2005 2006 2007 2008 2009(f)
2004 2005 2006 2007 2008 2009(f)
12.5 Current Account of Balance of Payments (US$ billion)
Advanced Economies1/
Other Emerging Market
& Developing Countries1/
Exports (f.o.b.) 6,355.5 6,944.0 7,824.3 8,889.0 9,869.8 7,284.4 Exports (f.o.b.) 2,667.2 3,350.1 4,082.6 4,849.4 6,004.8 4,376.7
Imports (f.o.b.) 6,679.9 7,478.4 8,487.4 9,511.3 10,670.7 7,942.0 Imports (f.o.b.) 2,333.3 2,801.1 3,346.5 4,098.3 5,121.2 4,044.5
Trade balance -324.4 -534.4 -663.2 -622.4 -800.9 -657.7 Trade balance 334.0 549.0 736.0 751.0 883.7 332.2
Services (net) 175.9 212.6 275.8 374.6 429.8 339.0 Services (net) -67.7 -76.5 -95.4 -117.0 -141.1 -83.5
Balance on goods -148.5 -321.8 -387.3 -247.8 -371.1 -318.6 Balance on goods 266.3 472.4 640.7 634.1 742.5 248.7
and services and services
Income (net) 146.8 169.2 188.4 161.8 214.9 204.6 Income (net) -178.2 -192.6 -206.1 -228.1 -279.8 -222.0
Current transfers (net) -212.2 -241.4 -255.6 -303.6 -308.7 -257.3 Current transfers (net) 138.0 168.0 196.1 227.4 251.7 235.8
Current account balance -213.8 -394.0 -454.5 -389.6 -465.0 -371.3 Current account balance 226.1 447.8 630.6 633.4 714.4 262.4
Developing Asia1/
Malaysia2/ 3/
Exports (f.o.b.) 1,065.9 1,319.1 1,625.4 1,968.8 2,363.5 1,903.1 Exports (f.o.b.) 126.8 142.4 160.8 176.3 199.3 136.9
Imports (f.o.b.) 1,003.6 1,211.4 1,425.6 1,689.5 2,110.0 1,592.5 Imports (f.o.b.) 99.2 108.4 124.1 139.1 148.2 107.0
Trade balance 62.3 107.7 199.8 279.3 253.5 310.6 Trade balance 27.6 34.0 36.7 37.1 51.0 29.6
Services (net) -5.9 -3.8 2.9 16.8 27.2 52.9 Services (net) -2.1 -2.5 -1.9 0.7 0.5 -0.2
Balance on goods 56.4 103.9 202.7 296.1 280.7 363.5 Balance on goods 25.4 31.5 34.8 37.8 51.6 29.6
and services and services
Income (net) -35.7 -27.2 -20.9 -13.2 0.0 -16.7 Income (net) -6.4 -6.3 -4.7 -4.0 -7.5 -2.9
Current transfers (net) 68.7 85.6 100.7 123.6 141.6 134.5 Current transfers (net) -3.9 -4.5 -4.6 -4.6 -5.1 -4.6
Current account balance 89.3 162.3 282.4 406.5 422.4 481.3 Current account balance 15.1 20.7 25.5 29.2 39.0 22.1
Notes :(f)
Forecast1/
Data for 2008 is estimated
2/ Data for 2008 is preliminary
3/ Data for 2009 based on average period of Jan-April 2009 exchange rates, USD1=RM3.6225
Sources : Department of Statistics, Bank Negara Malaysia and World Economic Outlook April 2009

40
2003 2004 2005 2006 2007 2008 2009(f)
12.6 Savings and Investment
(as % of GDP)
World
Savings 20.9 22.0 22.8 23.9 24.4 24.2 22.4Investment 21.1 22.0 22.5 23.2 23.7 24.0 22.6
Advanced Economies
Savings 19.1 19.8 20.1 20.6 20.5 19.4 17.4Investment 19.9 20.5 21.0 21.4 21.3 20.8 18.3Resource Balance -0.3 -0.5 -0.9 -1.1 -0.6 -0.9 -0.8
Developing Asia
Savings 36.5 38.4 41.3 44.0 46.8 47.8 48.3Investment 33.7 35.8 37.2 38.0 39.9 42.0 42.0Resource Balance 1.8 1.6 2.6 4.3 5.0 3.9 4.8
Malaysia (as % of GNP)
Savings 36.9 37.0 36.7 38.4 38.4 37.9 32.2
Investment¹/
24.1 24.3 21.5 21.5 22.2 19.8 20.7Resource Balance 12.8 12.7 15.7 16.8 16.0 18.1 11.5
Notes : (f)
Forecast 1/
Including change in stock
Sources : Economic Planning Unit, Bank Negara and World Economic Outlook April 2009

41
WORLD SAVINGS RATE, 1990-2009 (% of GDP)
0
10
20
30
40
50
'90 '95 '96 '97 '98 '99 '00 '01 '02 '03 '04 '05 '06 '07 '08 '09
World Malaysia * Developing Asia Advanced Economies
Percentage (%)
(f)
* For Malaysia, savings rate refer to % of GNP( f ) Forecast
CURRENT ACCOUNT BALANCE,1990-2009
-10
0
10
20
30
40
50
-800
-600
-400
-200
0
200
400
600
800
'90 '91 '92 '93 '94 '95 '96 '97 '98 '99 '00 '01 '02 '03 '04 '05 '06 '07 '08 '09
Advanced Economies Developing Asia Other Developing Countries Malaysia
(f)
Advanced, Developing Asia & Other
Developing Countries (US$ billion)*
( f ) Forecast * Data for 2008 is estimated
Malaysia (US$ billion)
(RHS)

42
Central Central Overall External
Year Government Government Budget Debt
Current Revenue Expenditure Surplus/Deficit
(% of GDP) (% of GDP) (% of GDP) (% of GDP)
12.7 Government,
Debt And Resource Flows
Selected Developed Countries
Australia 2007 26.6 33.0 1.3 n.a. 22,266
Germany 2007 43.8 43.9 0.0 29.7 50,925
United Kingdom 2007 41.7 43.7 -2.9 n.a. 223,966
United States 2007 18.8 35.3 -1.2 16.9 232,839
NIEs
Hong Kong 2007 21.9 14.7 7.2 0.8 59,899
Korea 2007 22.5 24.8 0.4 1.2 2,628
Singapore 2007 24.9 12.7 2.7 0.0 24,137
ASEAN Indonesia 2007 17.9 19.1 -1.5 31.1 6,928
Malaysia 2007 21.8 25.5 -3.2 29.2 9,7171/
Philippines 2007 17.1 17.3 -0.1 22.7 2,928
Thailand 2007 17.7 19.8 -2.3 1.1 9,575
Vietnam 2007 27.3 32.4 -4.9 n.a. 6,739
China 2007 20.8 20.1 -0.7 0.1 83,521
India 2007 22.3 27.8 -3.2 2.4 22,950
Notes : 1/
Data refer to MIDA Approved Investment n.a. (not available)
Sources : Economic Planning Unit, Bank Negara Malaysia, World Competitiveness Yearbook 2008, Asia Development Outloook 2008, World Development Indicators 2008 and World Investment Report 2008
Country
Foreign
Direct Investment
Inflows
(US$ millions)
43
Surface Population Urban Population Percentage of
Area ('000) Density as % of Total Population using ('000 km²) (per km²) Population Improved Water Sources
(2007) (2007) (2007) (2007) (2006)
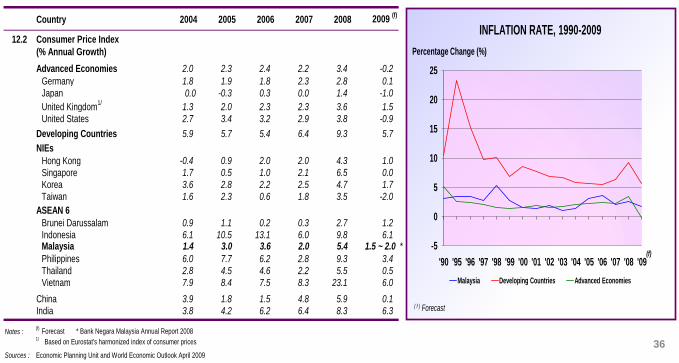
12.8 Population, Urbanization
and Population Density
Selected Developed Countries
Australia 7,741.2 21.0 2.7 93.0 100.0
Germany 357.1 82.3 230.4 89.0 100.0
Japan 378.0 127.8 338.1 66.0 100.0United Kingdom 243.6 60.9 250.5 89.0 100.0United States 9,632.0 305.9 31.3 81.0 99.0
NIEs
Hong Kong 1.1 6.9 6,300.0 99.0 99.0Korea 99.3 48.5 488.7 81.0 100.0Mexico 1,964.4 106.7 53.6 76.0 95.0
Singapore 1.0 4.6 6,557.1 99.0 100.0
ASEAN
Brunei Darussalam 5.8 0.4 67.2 74.0 99.9
Indonesia 1,904.6 224.9 118.5 50.0 80.0Malaysia 330.3 27.2 82.1 63.4 99.0
Philippines 300.0 90.5 293.0 64.0 93.0
Thailand 513.1 65.7 124.4 33.0 98.0
Vietnam 329.3 85.1 258.5 26.9 92.0
China 9,598.1 1,321.3 137.5 45.0 88.0
India 3,287.3 1,149.1 341.7 29.0 89.0
Sources : Economic Planning Unit, Ministry of Finance, World Development Indicators September 2008, World Competitiveness Yearbook 2008 and Statistical Yearbook for Asia and The Pacific 2007
Population
Country

44
Total
Employment
(million) Agriculture Industry1/
Services
12.9 Structure of Employment
Selected Developed Countries
Australia 10.5 3.5 21.5 75.1
Germany 39.7 2.2 25.5 72.3
Japan 64.1 4.3 27.6 68.2
United Kingdom 29.2 1.3 22.0 76.7
United States 146.1 1.5 19.8 78.7
NIEs
Hong Kong 3.5 0.3 13.4 86.3
Korea 23.4 7.7 26.3 66.0
Mexico 44.0 14.2 25.9 59.9
Singapore 2.7 0.0 31.6 68.4
Taiwan 10.3 5.5 36.6 57.9
ASEAN
Indonesia 97.6 42.0 18.6 39.4
Malaysia 11.4 12.2 36.5 51.0
Philippines 33.7 36.7 14.8 48.6
Thailand 36.3 39.7 21.9 38.4
China 769.9 42.6 25.2 32.2India 36.2 50.3 20.3 29.4
Note :1/
Includes manufacturing, mining, electricity, construction, gas and water for other countries
Sources : Economic Planning Unit and World Competitiveness Yearbook 2008
Country Year
2007
2007
2007
2007
2007
2007
2007
Employment by Sector (% of Total Employment)
2007
2007
2007
20072007
2007
2007
2007
2007

45
Infant Mortality Crude Internet Users Computers Adult Combined Cellular Mobile
at birth Rate Birth Rate (No of internet users per capita Literacy Rate Gross Enrolment Telephone Subscribers
(per 1,000 (per 1,000 per 1,000 people) (No of computers (% age 15 & above) Ratio in Education No. of Subscribers
live births) population) per 1,000 people) (%) (per 1,000 inhabitants)
2007 2006 2007 2007 2006 2006 2006
12.10 Quality of Life
Selected Developed
Countries
Germany 76.0 82.0 4.1 10.0 647.0 706.0 99.0 88.1 1,036.0
Japan 79.0 86.0 3.2 3.0 745.0 642.0 99.0 86.6 793.0
United Kingdom 77.0 81.0 5.0 24.0 697.0 729.0 99.0 89.2 1,164.0
United States 75.0 81.0 6.4 43.0 739.0 836.0 99.0 92.4 774.0
NIEs
Hong Kong 79.0 85.0 3.7 5.0 660.0 636.0 94.6 74.4 1,315.0
Korea 75.0 82.0 6.1 4.0 729.0 673.0 99.0 98.5 832.0
Singapore 78.0 82.0 3.0 5.0 706.0 651.0 94.6 64.4 1,093.0
Taiwan 74.6 80.8 5.5 12.6 637.0 488.0 97.3 83.6 1,020.0
ASEAN
Brunei Darussalam 79.5 74.8 5.5 28.0 417.0 74.61/ 94.6 78.5 789.0
Indonesia 66.0 70.0 26.6 41.0 112.0 25.0 91.0 68.2 283.0
Malaysia 71.5 76.5 6.3 19.0 559.0 262.0 95.0 71.5 755.0
Philippines 69.0 74.0 23.1 48.0 102.0 56.0 93.3 79.6 508.0
Thailand 66.0 75.0 10.6 42.0 159.0 86.0 93.9 78.0 630.0
Vietnam 68.0 73.0 19.5 18.0 205.0 11.71/ 90.3 62.3 182.0
China 70.0 74.0 22.1 7.0 129.0 65.0 93.0 68.7 353.0India 62.7 65.7 34.6 22.0 82.0 24.0 65.2 61.0 148.0
Notes:1/
Data as at 2006
Sources: Economic Planning Unit, World Development Indicators 2008, World Competitiveness Yearbook 2008, Human Development Report 2007/2008, Human Development Index 2008 and World Bank database
Life Expectancy
Country
2006
Male Female

46
Country 2002 2003 2004 2005 2006 2007
12.11 GNI Per Capita (US$)
Selected Developed Countries
Germany 22,670 25,250 30,120 34,580 36,620 38,860
Japan 33,550 34,510 37,180 38,980 38,410 37,670
United Kingdom 25,250 28,350 33,940 37,600 40,180 42,740
United States 35,060 37,610 41,400 43,740 44,970 46,040
NIEs
Hong Kong 24,750 25,430 26,810 27,670 28,460 31,610
Korea 9,930 12,020 13,980 15,830 17,690 19,690
Singapore 20,690 21,230 24,220 27,490 29,320 32,470
Taiwan 12,884 13,139 14,032 16,170 17,230 17,930
ASEAN
Indonesia 710 810 1,140 1,280 1,420 1,650
Malaysia 3,843 4,163 4,626 5,008 5,694 6,724
Philippines 1,020 1,080 1,170 1,300 1,420 1,620
Thailand 1,980 2,190 2,540 2,750 2,990 3,400
Vietnam 430 480 550 620 690 790
China 940 1,100 1,290 1,740 2,010 2,360
India 470 530 630 740 820 950
Sources : Economic Planning Unit, World Development Report 2009 and World Bank Database
47
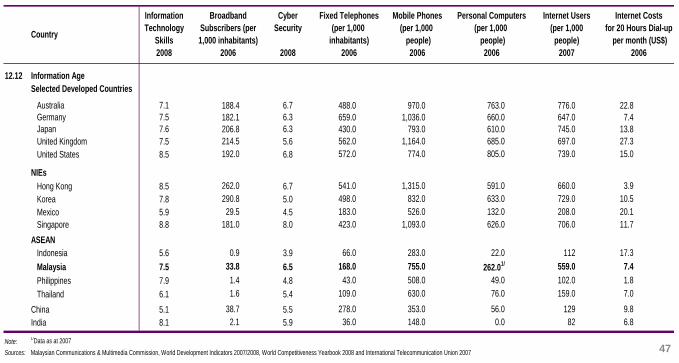
Information Broadband Cyber Fixed Telephones Mobile Phones Personal Computers Internet Users
Technology Subscribers (per Security (per 1,000 (per 1,000 (per 1,000 (per 1,000
Skills 1,000 inhabitants) inhabitants) people) people) people)
2008 2006 2008 2006 2006 2006 2007
12.12 Information Age
Selected Developed Countries
Australia 7.1 188.4 6.7 488.0 970.0 763.0 776.0 22.8
Germany 7.5 182.1 6.3 659.0 1,036.0 660.0 647.0 7.4
Japan 7.6 206.8 6.3 430.0 793.0 610.0 745.0 13.8
United Kingdom 7.5 214.5 5.6 562.0 1,164.0 685.0 697.0 27.3
United States 8.5 192.0 6.8 572.0 774.0 805.0 739.0 15.0
NIEs
Hong Kong 8.5 262.0 6.7 541.0 1,315.0 591.0 660.0 3.9
Korea 7.8 290.8 5.0 498.0 832.0 633.0 729.0 10.5
Mexico 5.9 29.5 4.5 183.0 526.0 132.0 208.0 20.1
Singapore 8.8 181.0 8.0 423.0 1,093.0 626.0 706.0 11.7
ASEAN
Indonesia 5.6 0.9 3.9 66.0 283.0 22.0 112 17.3
Malaysia 7.5 33.8 6.5 168.0 755.0 262.01/ 559.0 7.4
Philippines 7.9 1.4 4.8 43.0 508.0 49.0 102.0 1.8
Thailand 6.1 1.6 5.4 109.0 630.0 76.0 159.0 7.0
China 5.1 38.7 5.5 278.0 353.0 56.0 129 9.8
India 8.1 2.1 5.9 36.0 148.0 0.0 82 6.8
Note:1/
Data as at 2007
Sources: Malaysian Communications & Multimedia Commission, World Development Indicators 2007/2008, World Competitiveness Yearbook 2008 and International Telecommunication Union 2007
Internet Costs
for 20 Hours Dial-up
per month (US$)
2006
Country

48
Total Business High - Technology
Expenditure Expenditure Exports
on R&D on R&D (% of Manufactured
(% of GDP) (% of GDP) Exports)
2006 2006 2006
12.13 Science & Technology
Selected Developed Countries
Australia 7.1 5.9 1.8 1.1 3,371 12.3 7.7
Germany 6.6 6.3 2.5 1.8 154,757 16.7 8.1
Japan 6.7 6.2 3.3 2.5 126,618 21.6 7.0
United Kingdom 6.7 6.0 1.8 1.1 115,464 33.6 6.9
United States 7.5 7.9 2.6 1.8 219,179 30.1 8.3
NIEs
Hong Kong 7.8 6.6 0.8 0.4 1,788 11.4 6.9
Korea 5.7 5.2 3.2 2.5 92,945 32.0 5.0
Mexico 4.6 3.8 0.5 0.3 35,732 18.9 3.5
Singapore 8.7 8.3 2.3 1.5 124,133 57.8 8.4
ASEAN
Indonesia 5.2 4.2 n.a. n.a. 5,900 13.2 3.8Malaysia 6.7 6.6 0.6 0.5 63,411 53.8 6.1Philippines 5.9 4.1 0.1 0.1 27,626 67.6 4.3
Thailand 5.6 4.9 0.2 0.1 26,953 27.3 4.6
China 5.3 4.6 1.4 1.0 271,170 30.3 5.1India 6.6 5.5 0.6 0.1 3,511 4.8 4.9
Source: World Competitiveness Yearbook 2008
Technology
Country
2008
Funding for
Technological
Development
Intellectual
Property
Rights
Enforced
20082008
High -
Exports
(US$ million)
2006
Development &
Application of
Technology
Supported Sufficient

49
Note: The KDI was developed to assess Malaysia’s readiness to become a knowledge-based economy. It compares Malaysia’s position relative to 21
other countries, which are mainly developed. The KDI is derived from selected key factors required to drive a knowledge-based economy,
namely, computer infrastructure, infostructure, education and training as well as R&D and technology.
Source: Economic Planning Unit
890
1,331
1,728
1,940
2,702
2,892
3,630
3,767
3,883
4,267
4,324
4,344
4,373
4,439
4,476
4,604
4,665
4,761
5,038
5,040
5,053
5,726
India 22 (22)
Indonesia 21 (21)
Philippines 20 (20)
Thailand 19 (18)
China 18 (19)
MALAYSIA 17 (17)
New Zealand 16 (15)
Singapore 15 (14)
Ireland 14 (13)
Australia 13 (9)
Netherlands 12 (11)
Korea 11 (16)
Switzerland 10 (7)
Canada 9 (8)
Germany 8 (12)
Norway 7 (4)
United Kingdom 6 (10)
Finland 5 (3)
Sweden 4 (2)
Japan 3 (6)
Denmark 2 (5)
USA 1 (1)
Knowledge Development Index, 2000 and 2008Ranking for 2000 in brackets Scores
2000
2008
12.14 The Knowledge-based Economy Development Index (KDI), 2000/2008
2000 2008 2000 2008 2000 2008 2000 2008 2000 2008
l USA 1 1 4 9 9 10 3 2 1 1l Denmark 7 4 5 4 1 1 9 8 5 2l Japan 14 6 12 14 2 5 1 1 6 3l Sweden 6 7 1 3 11 4 2 4 2 4l Finland 4 11 2 13 2 3 5 3 3 5l United Kingdom 5 2 8 2 12 13 13 10 10 6l Norway 3 10 3 1 3 7 12 11 4 7l Germany 13 5 14 5 12 12 7 9 12 8l Canada 2 8 9 11 7 2 14 13 8 9l Switzerland 10 13 7 6 10 14 4 7 7 10l Korea 16 12 11 12 16 11 11 6 16 11l Netherlands 8 3 8 8 14 15 8 12 11 12l Australia 9 9 16 7 6 6 15 15 9 13l Ireland 15 16 15 10 4 8 10 14 13 14l Singapore 12 15 11 15 15 17 6 5 14 15l New Zealand 11 14 13 16 8 9 18 19 15 16l Malaysia 17 17 17 17 18 18 17 17 17 17
l China 18 18 18 19 19 16 20 18 19 18l Thailand 19 19 20 20 17 19 19 20 18 19l Philippines 21 21 21 18 21 21 16 16 20 20l Indonesia 22 22 19 22 20 20 21 22 21 21l India 20 20 22 21 22 22 22 21 22 22
Computer
Infrastructure Infostructure
Education
& Training
R&D and
Technology OVERALLCountries / Rank