A measurement theory of illusory conjunctions
31
1 A version of this paper is published in the Journal of Experimental Psychology: Human Perception and Performance, 251-269. The final version of this manuscript will differ from this version. This version is provided for personal use only. A Measurement Theory Of Illusory Conjunctions William Prinzmetal Richard B. Ivry University of California, Berkeley Diane Beck University College London Naomi Shimizu University of Hawaii at Manoa John A. Burns School of Medicine Illusory conjunctions are the incorrect perceptual combination of correctly perceived features, such as color and shape. Research on the phenomenon has been hampered by the lack of a measurement theory that accounts for guessing features, and well as the incorrect combination of correctly perceived features. Recently several investigators have suggested using multinomial models as a tool for measuring feature integration. We test the adequacy of these models in two experiments by testing whether model parameters reflect changes in stimulus factors. In a third experiment, we use confidence ratings as a tool for testing the model. Multinomial models accurately reflected both variations in stimulus factors and observers trial-by-trial confidence ratings. , The goal of the present research was to test a formal measurement theory of the perceptual phenomenon of illusory conjunctions. This phenomenon was first discussed by Treisman and Schmidt in 1982, providing one of the key pieces of evidence for Treisman’s feature integration theory (Treisman & Gelade, 1980). Observers, when briefly presented with strings of colored letters, sometimes reported colors and letters in incorrect combinations. For example, when the stimulus consisted of a green N, red X, and blue O, the reponse might be “Red N”. Treisman and Schmidt termed these errors illusory conjunctions because they were incorrect (illusory) conjunctions of perceived features. Illusory conjunctions are a robust phenomenon (for a complete review, see Prinzmetal, 1995). They can be found with many different stimulus features (e.g., Butler, Mewhort, & Browse, 1991; Gallant & Garner, 1988; Lasaga & Hecht, 1991; Treisman & Paterson, 1984). For example, Prinzmetal (1981) found that people will sometimes incorrectly combine vertical and horizontal lines to form an illusory plus sign. Illusory conjunctions are found in whole report tasks, visual search tasks, and matching tasks. The observation that illusory conjunctions are found in visual search and matching tasks, as well as whole report tasks, has made clear that the errors are not due to memory limitations, but appear to be perceptual in nature. Moreover, observers rate their confidence high on trials in which their report involves the incorrect combination of stimulus features.
-
Upload
independent -
Category
Documents
-
view
3 -
download
0
Transcript of A measurement theory of illusory conjunctions

1
A version of this paper is published in the Journal of Experimental Psychology: Human Perception andPerformance, 251-269. The final version of this manuscript will differ from this version. This versionis provided for personal use only.
A Measurement Theory Of Illusory ConjunctionsWilliam Prinzmetal
Richard B. Ivry
University of California, Berkeley
Diane Beck
University College London
Naomi Shimizu
University of Hawaii at Manoa
John A. Burns School of Medicine
Illusory conjunctions are the incorrect perceptual combination of correctly perceived features, such as colorand shape. Research on the phenomenon has been hampered by the lack of a measurement theory thataccounts for guessing features, and well as the incorrect combination of correctly perceived features. Recentlyseveral investigators have suggested using multinomial models as a tool for measuring feature integration.We test the adequacy of these models in two experiments by testing whether model parameters reflectchanges in stimulus factors. In a third experiment, we use confidence ratings as a tool for testing the model.Multinomial models accurately reflected both variations in stimulus factors and observers trial-by-trialconfidence ratings.,
The goal of the present research was to test aformal measurement theory of the perceptualphenomenon of illusory conjunctions. This phenomenonwas first discussed by Treisman and Schmidt in 1982,providing one of the key pieces of evidence forTreisman’s feature integration theory (Treisman &Gelade, 1980). Observers, when briefly presented withstrings of colored letters, sometimes reported colors andletters in incorrect combinations. For example, whenthe stimulus consisted of a green N, red X, and blue O,the reponse might be “Red N”. Treisman and Schmidttermed these errors illusory conjunctions because theywere incorrect (illusory) conjunctions of perceivedfeatures.
Illusory conjunctions are a robust phenomenon (fora complete review, see Prinzmetal, 1995). They can be foundwith many different stimulus features (e.g., Butler, Mewhort,& Browse, 1991; Gallant & Garner, 1988; Lasaga & Hecht,1991; Treisman & Paterson, 1984). For example,Prinzmetal (1981) found that people will sometimesincorrectly combine vertical and horizontal lines to form anillusory plus sign. Illusory conjunctions are found in wholereport tasks, visual search tasks, and matching tasks. Theobservation that illusory conjunctions are found in visualsearch and matching tasks, as well as whole report tasks, hasmade clear that the errors are not due to memory limitations,but appear to be perceptual in nature. Moreover, observersrate their confidence high on trials in which their reportinvolves the incorrect combination of stimulus features.

2
Illusory conjunctions can also be obtained even underextended viewing conditions. Prinzmetal, Henderson, andIvry (1995) controlled eye movements and presentedstrings of colored letters in the periphery for as long as 2seconds. Even without a diverting attention task, theyobtained as many illusory conjunctions under theseconditions as with brief exposures.
A variety of stimulus factors have been found toaffect feature integration A plethora of data hasdemonstrated that illusory conjunctions are more likelybetween adjacent than distant items (e.g., Ashby,Prinzmetal, Maddox, & Ivry, 1996; Chastain, 1982;Hazeltine, Prinzmetal, & Elliot, 1997; Keele, Cohen,Ivry, Liotti, & Yee, 1988; Prinzmetal & Millis-Wright,1984; Prinzmetal & Keysar, 1989; Wolford & Shum,1980). Organizational factors, such as similarity, goodcontinuation, and common fate affect illusoryconjunctions (Baylis, Driver, McLeod, 1992; Gallant &Garner, 1988; Ivry & Prinzmetal, 1991; Khurana, 1998;Lasaga & Hecht, 1991; Prinzmetal, 1981, 1995;Prinzmetal & Keysar, 1989). The general rule is thatfeatures that are part of the same perceptual group orobject are more likely to be incorrectly combined (forman illusory conjunction) than features from differentperceptual groups. These effects might not be surprisingin that the purpose of correctly binding features is toenable object recognition in displays with severalobjects. The effect of perceptual organizationsurprisingly extends to syllable or syllable-like units inprinted words. When presented with a string of coloredletters such as 'MAYBE,' observers will more likelyreport that the Y was the color of the M or A (within asyllable) than report that the Y was the color of the B orE (e.g., Prinzmetal, Treiman, & Rho, 1986; Prinzmetal,Hoffman & Vest, 1991; Rapp, 1992; Seidenberg, 1987;also see Prinzmetal & Millis-Wright, 1984, Prinzmetal,1990). Finally, we have begun to locate areas in thebrain that appear to be critical for feature integration(e.g., Arguin, Cavanagh, Joanette,1994; Cohen & Rafal,1991; Friedman-Hill, Robertson, Treisman, 1995).
While the empirical findings reviewed above areimpressive, most of the studies have lacked atheoretically justified, empirically verified method formeasuring illusory conjunctions. This is a potentiallyserious limitation: As we discuss below, reporting anincorrect conjunction of features does not necessarilymean that an illusory conjunction of features occurred.Consider a task in which the stimulus for each trialconsists of two colored letters, a colored target letter (Xor T) and a colored nontarget letter (O). The colors ofthe letters are chosen without replacement from a set offour possible stimulus colors (red, green, blue, andyellow). The observer's task is to report the target letter(e.g., red X). Suppose the display contained a red X anda blue O and the response was "blue X". This mightresult from an illusory conjunction. That is, theobserver might have incorrectly combined the color bluewith the target letter X, perceiving a blue X. On the
other hand, several other perceptual states could have lead tothe report "blue X." For example, observers might haveperceived the letter X, but not its color, and simply guessedblue.
What is needed is a measurement theory thatdistinguishes between the incorrect combination of features,and guesses that appear to be illusory conjunctions. We willrefer to the objective reports in which features from differentobjects are combined together as “conjunction responses”(e.g., blue X in the example). We will use the term illusoryconjunctions to refer to the subset of these responses inwhich the percept was actually the result of incorrectlyconjoining features from different objects. The task then isto estimate the rate of true incorrect feature combinations(illusory conjunctions) from the conjunction responses.
Different procedures have been adopted to correct forguessing in the context of illusory conjunction experiments.However, the theoretical justification for these methods israther murky and, as shown by Ashby et al. (1996), can leadto erroneous conclusions. These researchers (see also,Prinzmetal et al., 1995; Donk, 1999) developed analternative procedure to correct for guessing. This correctionprocedure was part of a general theory of feature binding(Ashby et al., 1996). However, for the present purpose, wecan restrict our discussion to the part of the theory concernedwith estimating the true probability of correct featurebinding.
To understand the correction for guessing, considerthe simple case of a student taking a 4- alternative multiplechoice test. The probability correct, P(C), is the sum ofitems the student knew, P(K), and correct guesses as shownbelow:P(C) = P(K) + (1/4 * (1 - P(K)) (1)P(K), the proportion of items the student knew can becalculated algebraically. The model that we will present foranalyzing the responses in illusory conjunction experimentsdoes not have an algebraic solution, so P(K) must be foundby an iterative search through possible solutions. Thesimple problem above is a binomial problem, since there areonly two outcomes on each item (correct and incorrect). Inthe illusory conjunction experiments of Ashby et al. (1996),there are many outcomes; hence it is a multinomial problem.
The multinomial approach was developed to analyzeexperiments in source memory (e.g., Johnson & Raye,1981) and has been extended in a number of directions byBatchelder & Riefer (1990; Riefer & Batchelder, 1988, 1994;cf. Banks, in press). There is an interesting computationalsimilarity between source memory and illusory conjunctionexperiments. In a source memory experiment, participantsmust correctly combine the source of an item of informationwith that item (e.g., Did you discover that fact in theNational Inquirer or the New York Times?). In an illusoryconjunction experiment, observers must correctly combineinformation from two sensory features (e.g., Was the X redor blue?). The details of the models are, however,substantially different.
------------------------Insert Table 1 about here

3
--------------------------The first step in developing a multinomial
model is to enumerate all of the possible outcomes of atrial. (See Dodson, Prinzmetal, & Shimamura, 1998,for a tutorial on multinomial model development). Inthe example given above, there are two colored letters oneach trial, a target letter (X or T) and a nontarget letter(O), with four possible colors. The observer’s task is toname the color and identity of the target (a Red X in theexample). As can be seen in Table 1, there are sixpossible outcomes on each trial. We designate eachresponse type with a 2-letter code. The first letterindicates whether the letter identity was correct (C) orincorrect (I). The second letter indicates the type of colorresponse. The observer could respond with the targetcolor (T, red in the example), the color of the nontargetletter (N, blue in the example), or some other color notpresent in the display (O, e.g., green or yellow). ThusCT indicates a totally correct response; CN indicates aconjunction response, CO indicates the correct letter buta color that was not part of the display, and so on. Thedescriptions listed in Table 1 have been adapted fromPrinzmetal et al. (1995) and Ashby et al, (1996).
--------------------------Insert Figure 1 about here
--------------------------The second step in developing a multinomial
model is to postulate psychological parameters thatmight lead to particular responses. In our basic illusoryconjunction model, we postulate the following five
parameters:1
TL the probability of correctly identifying the targetletterTC the probability of correctly identifying the targetcolorNC the probability of correctly identifying thenontarget color_ the probability of correctly binding the targetcolor to the target letterg a guessing parameter, described below
The next step is to develop a tree diagram thatdepicts how the various response categories arise. Ourbasic model is presented in Figure 1. This model allowsfor the occurrence of illusory conjunctions, but also hasbranches in which conjunction responses occur due toguessing. The diagram is not intended to be a processmodel; the order of the parameters in the tree is arbitrary.The tree simply describes that state of the parameters ona particular trial. Level I expresses the probability ofperceiving the target letter (TL) or not (1-TL). Levels IIand III express the probability of perceiving the targetand nontarget colors (TC , NC), respectively. Level IVexpresses the probability of correctly binding the targetcolor with the target letter (the parameter _).
The tree diagram in Figure 1 is actually simplerthan it might appear. The branch 1-TL is identical to the
branch TL except that when observers do not perceive thetarget letter, they guess a letter. On half of trials the guess
will be correct, and on half it will be incorrect.2
Each branch of the tree represents the probability fora specific set of events. For example, the probability that theobserver will perceive both of the target features and bindthem correctly is given by the product:TL * CT * NC * _ (2)This probability will lead to a correct response, TC .However there are other ways to obtain a correct response. Ifan observer did not perceive the target color, target letter, ornontarget letter, he or she might guess the correct response.
Note that everywhere the response 'O' occurs inFigure 1 (e.g., CO, IO) there is another color (designated Ø).The reason for two response categories is because 4 differentcolors were used in the experiment. Thus, there were alwaystwo "other colors", the two colors not present in the display.
If the observer did not perceive the target letter,target color, or nontarget color (bottom pathway), there are 8equally likely responses, one of which is a correct response(CT). The probability of a correct response is the sum of allthe pathways leading to the response CT. Similarly, theprobability of reporting the target letter and a color notpresent in the display (a color feature error), is the sum of allpathways leading to the response CO.
The critical parameter concerning illusoryconjunctions is _, the probability of correctly joiningfeatures. This parameter can vary from 1.0, in which casebinding is perfect, to 0.5, the situation in which thelikelihood of binding the target features together is random,or at chance (Prinzmetal et al., 1995; Ashby et al, 1996). Instudies of illusory conjunctions, the focus has generally beenon the response category called conjunction responses, CN,the situation in which the target letter is correctly identified,but is reported in the nontarget color. However, as can beseen in Figure 1, there are many paths resulting in CNresponses, and most of these are not the result of incorrectbinding. An important aspect of our modeling approach isthat estimates of the parameter _ provides a better measure offeature integration than estimates based directly on the ratioCN response to CO responses.
Level V represents a guessing bias, g. Thisparameter comes into play when only one color is perceived.In the model shown in Figure 1, g represents the probabilitythat the perceived color will be reported as the target color.Consider the path that leads to CN followed by an asterisk(CN*). The observer perceived the target letter (e.g., X), andthe nontarget color (e.g., blue), but not the target color (e.g.,red). Further, suppose the observer correctly binds thenontarget color with the nontarget letter.Phenomenologically, the observer perceived a blue O and anX of unknown color. At one extreme, the observer mightalways guess the one color that was perceived, that is, thenontarget color. In this situation, g would equal 1.0 and theresponse would be categorized as a conjunction response.However, these would not be true illusory conjunctions sincebinding was correct. At the other extreme, observers would

4
never guess the nontarget color (g = 0.0), that is theywould apply an exclusionary strategy.
For each of the 6 response categories listed inTable 1, the probability is simply the sum of all thepaths that lead to the particular response category. Forexample, the predicted probability correct is given by thefollowing:
p(CT) = TL * TC * NC * _ + (3)TL * (1-NC) * _ +TL * TC * (1-NC) * (1-__ * g +TL * (1-TC) * NC * _ * g +TL * (1-TC) * (1-NC) +(1-TL) * TC * NC * _ * 0.5 +(1-TL) * (1-NC) * _ * 0.5 +(1-TL) * TC * (1-NC) * (1-__ * g * 0.5 +(1-TL) * (1-TC) * NC * _ * g * 0.5 +(1-TL) * (1-TC) * (1-NC) * 0.5
In a similar manner, a formula is obtained foreach of the other response categories. Unlike the simpleexample given in formula 1, there is no algebraicsolution for the parameters (except for the parameter TL).Hence we adjust the parameters (i.e., TL , TC , etc.) so asto maximize the fit between the predicted responsefrequency and the actual response frequency. Inmultinomial models, the appropriate measure of
goodness of fit is G2 which is defined as:
(4)For each of the i response categories, ObsFreq is theobserved frequency, ObsProp is the observed proportion,PredProp is the predicted proportion. The smaller the
value of G2 the better the fit. There are several
methods3 of finding the best fitting parameters to
minimize G2.In a recent review of over 80 applications of
multinomial models, Batchelder and Riefer (Batchelder &Riefer, 1999) warn that "... a key question in thedevelopment of an MPT (multinomial processing tree)model is whether the model's parameters are, in fact,valid measure of their respective cognitive capacities. Ingeneral, validity of a model's parameters is essential ifone wishes to have confidence in an MPT model as avalid measurement tool" (p. 76). Thus as with anymeasurement tool, it is critical to empirically evaluatethe validity of the underlying model and, in particular,assess whether the parameters reflect the operation ofhypothesized cognitive processes.
The multinomial models that we have used inour studies of illusory conjunctions (Ashby et al., 1996;Prinzmetal et al., 1995; also see Thompson, Hall, &Pressing, in press) encompass aspects of a threshold
theory. In Figure 1, the parameters represent binary states--you either see the target letter or you don't. Such theorieshave been criticized as giving parameter estimates that arewrong or misleading (e.g., Kinchla, 1994). This problem isparticular critical with guessing parameters. While thiscriticism has been directed at studies using present-absentdetection tasks and source monitoring experiments, it is alsolikely to apply to illusory conjunctions experiments. Thus,the primary motivation for the current study was to test thevalidity of our multinomial approach for measuring featureintegration. As will be shown below, in most cases themodel performed well. However, there were someexceptions, and these led to interesting revisions in themodel.
Our approach was similar to that used to testmeasurement theories of recognition memory (Snodgrass &Corwin, 1988) and source memory (Bayen & Erdfelder,1996). We experimentally manipulated variables to see if theeffects would be restricted to specific parameters in the modelthat we identified a priori. In Experiment 1, we manipulatedthe display configuration in a way that we predicted woulduniquely affect the binding probability, _. We also includedan independent variable that was expected to affect theguessing parameter, g. In Experiment 2 we focused onindependent variables that were expected to affect theprobability of perceiving the target and nontarget colors. Wetook a different tack in Experiment 3. Here we obtainedconfidence judgments, with the expectation that high valuesfor parameters reflecting perception of the features would beassociated with high levels of confidence and high valuesassociated with guessing would be associated with low levelsof confidence. Experiment 1
A primary goal in Experiment 1was to demonstratethat the probability of correctly conjoining the color andshape features could be manipulated independently of theprobabilities associated with perceiving these features. Ourprevious work had indicated that this situation is not easy toobtain. Ashby et al. (1996) had shown that the bindingparameter _ varies with the distance between the target andnoise letters, with lower values occurring when the itemswere close together. However, the distance manipulation alsoaffected the probability of correctly identifying the targetletter. We attributed this effect to lateral masking, assumingthat masking is reduced when the inter-item distance is large.
In the current experiment, we again varied distance,but in addition, we also manipulated the configuration of thedisplays (Figure 2). We expected that one display would leadto many illusory conjunctions, whereas the other displaywould lead to few illusory conjunctions. Each displaycontained one colored target letter (T or X) and one colorednontarget letter. Within each display configuration, the twoitems were either close together ("near", Figures 2a,b) or farapart ("far", Figures 2c,d).
--------------------------Insert Figure 2 about here
--------------------------
G2 = 2* ObsFreq i( ) *lnObsProp i
PredProp i
∑

5
We expected that there would be more featureintegration errors in the near condition for three reasons.First, feature integration is worse when items are closetogether than far apart (e.g., Ashby et al., 1996).Second, in the near condition, the target and nontargetletters were part of the same perceptual group, in the farcondition they were part of different perceptual groups.Perceptual organization has been shown to be a powerfuldeterminant of feature integration (e.g., Prinzmetal,1981, 1995; Prinzmetal & Keysar, 1989). Third,illusory conjunctions are more likely between featuresthat are vertically or horizontally aligned (Lasaga &Hecht, 1991). We hoped to keep other errors constantbecause the eccentricity from fixation and amount ofmasking were approximately the same in the twoconditions. We use the terms "near" and "far" as a shortnotation for all of the above stimulus variables.
The second independent variable was designed toevaluate the guessing parameter, g. This parametercomes into play when the observer has only perceivedthe color of one of the items. As noted above, g canvary from 0 to 1.0. A probability of 0 would correspondto the situation where the observer uses the partialinformation to constrain the guessing set. In particular,the color of the perceived item is never reported for thecolor of the item for which color information is absent.At the other extreme, a probability of 1.0 wouldcorrespond to the situation where the perceived color isalways reported for both items. It is important torecognize that a high value of g will lead to manyconjunction responses, even if binding is perfect (Donk,1999). Whenever the participant only perceives the colorof the nontarget letter, a conjunction response will occurif the target letter is perceived or correctly guessed.
We would expect that g would reflect theprobability that colors are repeated in an experiment. Inmost illusory conjunction studies, the target color andnontarget colors are never the same (i.e., the colors areselected without replacement). Assuming the observersare informed of this constraint or become sensitive to it,g should be 0. The observer should exclude the perceivedcolor from the guessing set and they should not guessthat two colors are the same. However, if the target andnontarget colors are the same on some of the trials, (i.e.colors selected with replacement), then the observer mayinclude the perceived color in the guessing set. If theguessing probabilities were matched to the actualprobabilities, then g should equal the actualprobabilities. For example, if there are four possiblecolors, g should equal .25. We examined this issue in abetween-group manipulation. For the nonrepeat group,the target and nontarget color were never the same. Forthe repeat group, that target and nontarget color were thesame on 1/4 of the trials.
In summary, this experiment is a 2 x 2 designmanipulating display configuration and repetition. Thedisplay configuration manipulation is expected to affectthe probability of correctly joining features, _. Given
that we don't expect this manipulation to have any effect onfeature perception, we do not expect the parameter g to differfor the near and far conditions. In contrast, whether thecolors can repeat or not should affect g but not _..Manipulating these variables in the same experiment has oneadded advantage. The ideal situation to measure a guessingbias, g, would be in a situation in which observers did notmake illusory conjunctions. We expected this situation tohold in the far condition.
One problem with the model described for Figure 1is that the parameters g and _ are not mutually constrained:The same fit can be obtained for different pairs of the valuesg and _. To overcome this problem, we used a morecomplex experiment and model. In addition to reporting theidentity and color of the target letter, the observers were alsorequired to report the color of the nontarget color. The modelfor this more complex experiment is illustrated in Figures 3.Only the TL branch is illustrated, as the 1-TL branch isidentical except that the observer must guess the target letterand will only be correct on half of the trials.
With this expanded response information, we canassess the guessing parameter g for the nontarget color aswell as for the target color. In doing so we have a slightlymore complicated definition of g. Rather than representingthe probability of guessing that the only color perceivedbelongs to the target, g now represents the probability ofguessing that the color of both letters is the same. If onecolor is perceived, it is assigned to both letters. If no colorsare perceived, it is the probability that the same color isguessed for both letters. By requiring the observers to reportthe nontarget color, g becomes more constrained. Incomparing Figures 1 and 3, one can observe that g plays arole in many more response categories.
Requiring the observers to report the nontarget colorconfers a couple of additional advantages. First, there are now20 response categories instead of six. For each of the sixresponse categories shown in Table 1, there are threeadditional categories, designated by a third letter (see Table1). The third letter represents the observer's performance injudging the color of the nontarget letter. The letter Nindicates that the report of the nontarget color was correct.The letter T indicates that the target color was reported as thenontarget color. The letter O indicates that a color not in thedisplay was reported as the nontarget color ( other ). Sincethere were 4 possible display colors, whenever the tworeported colors were not in the display, they could either bethe same color, indicated as COO, or different colors,indicated as COØ. Note that the number of parametersremains fixed at five despite the increase to 20 responsecategories. Thus, the additional report requirement makes themodel more highly constrained.
--------------------------Insert Figure 3 about here
--------------------------A second advantage of the expanded report
requirement is related to the parameter NC. Ashby et al.(1996) found that the parameter NC was well constrainedonly when information about the nontarget color was

6
included in the observer's report. In many situations, anaccurate estimate of the probability of perceiving thenontarget color is not essential. However, given that ourfocus here is to test the model, it would seem importantto have as accurate an estimate of all of parameters as ispossible. Including a report of the nontarget color hasbeen shown to have minimal impact on the overallpattern of results, despite what might seem to be agreater cognitive load (Ashby et al., 1996).Method
Procedure. Each trial began with a whiterectangle, centered in the middle of the screen. Therectangle appeared before and after the stimulus, and thusserved as an energy mask. The exposure duration of theletter display was adjusted between blocks to maintainapproximately 75% correct responding. On days inwhich data was collected (see below) the exposureduration averaged 96 milliseconds (5.78 computerrefreshes at 60 hz), with a standard deviation of 20.79milliseconds). Following the stimulus, the whitemaking rectangle reappeared.
--------------------------Insert Figure 4 about here
--------------------------In the center of the post-stimulus rectangle was
a 3 x 4 matrix of colored square buttons (see Figure 4).The colors were the same within each of the three rowsand differed across the four columns. The matrix servedas a response palette. The observers were required to firstindicate the target letter and color by selecting one of the8 buttons on the top two rows of the response palette.They would click on the top row for a T response(buttons with the symbol '-'), and the second row for anX response ((buttons with the symbol '∞'). The letters Tand X were not used on the response buttons because ithas been found that following the stimulus string withanother alphanumeric string can cause errors (see Dixon,1986). Within each row, they were to use the buttonthat corresponded to the target color. Next, the observerwould indicate the color of the nontarget letter, thecolored O by selecting a button on the bottom row(button marked *). On trials in which the observer wascorrect on all three responses, the computer emitted abrief tone.
There were 96 trials in a block. In each block,the two configurations (near and far) and 4 positions (thestimulus in Figure 2 reflected about the vertical andhorizontal meridians) occurred equally often. The colorswere selected at random with the following constraints.With the no repeat group, the target and nontarget colorswere never the same. With the repeat group, the targetand nontarget were the same on 25% of the trials withina block. Observers were not informed about theseconstraints. Within the string, the colored O (nontargetitem) was always in the same relative position, but therewere two potential target positions (e.g., Figure 2a and2c vs. Figure 2b and 2c). This position was randomlydetermined on each trial, as was the target letter (T or X).
The order of trials within each block were random.Following each block, observers were told their overallpercent correct. Each participant was tested on five 1-hoursessions with six blocks of trials per session. The firstsession was practice, and the data from this session were notincluded in the analysis.
Following the last session, observers were asked thefollowing two questions: (1) Did you see any displays withrepeating color (i.e. two colors the same) and if so, on whatpercent of trials did this occur? (2) Did you see any displayswith two target letters, and if so, on what percent of trials didthis occur?
Stimuli. The stimuli were presented on a 13 in (33cm) Apple monitor controlled by a Macintosh II computer.The monitor had a screen resolution of 72 pixels per in(approximately 28 pixels per cm). The letters were createdwith a custom font such that the height and width of eachletter was equal. Each 4-letter string subtendedapproximately 5 degrees of visual angle in length. The
background of the monitor was black (7.4 cd/m2) and the
rectangular mask was white (94.0 cd/m2). The CIEcoordinates of the 4 colors, measured with a Minolta Chromameter, were as follows: red (x=.46, y=.33); green (x=.28,y=.48); blue (x=.17, y=.13); yellow (x=.40, y=.48). In theMacintosh computer code, the color values were as followsfor the 4 colors: red (r = $FF00, g = $2C00, b = $2C00);green (r = $2A00, g = $F200, b = $2A00); blue ( r= $2C00,g= $2C00, b= $FC00); yellow (r = $FF00, g = $FC00, b =
$0500). The luminance values were 35.0 cd/m2 (red), 60.0
cd/m2 (green), 24.0 cd/m2 (blue), 79.0 cd/m2 (yellow).The viewing distance was 40 cm and a chin rest was
used to minimize head movements. Room illumination waswith overhead fluorescent lighting.
Observers. Twelve observers, 4 male and 8 female,were recruited at the University of California, Berkeley.Their ages ranged from 19 to 23 years, and they had normalor corrected-to-normal vision and no known visual deficits.Observers were paid $5 per hour. Six observers wererandomly assigned to the Repeat condition and the other sixwere assigned to the No Repeat condition.Results
Raw response data. The proportion of responses foreach of the 20 response categories, averaged over observers,is given in Table 2. Because we wanted the analysis for theRepeat and Norepeat groups to be identical, we do notinclude the data from the Repeat group on trials in which thetarget and nontarget colors were identical.
--------------------------Insert Table 2 about here
--------------------------Performance in the Far condition was excellent,
with the proportion of correct responses (CTN) averagingapproximately 87% for both the Repeat and Norepeat groups.Many more errors occurred in the Near condition, and thiswas almost entirely due to an increase in the proportion ofconjunction reports (CNT). The remaining errors for both
7
the Near and Far groups were due to erroneous reports ofeither the nontarget color (CTO) or the target letter.
The raw data argue against a recent proposal byDonk (1999) that conjunction errors are the result ofconfusing the nontarget letter with the target letter. Anyresponses with our category label CN- (e.g., CNT, CNI)would be conjunction responses. According to Donk,these occur because observers confuse the colorednontarget letter (the letter O) with one of the targetletters (T or X). However, this explanation can notaccount for the numerous responses in the CN-categories, especially the high number of CNT responses(see Prinzmetal, Diedrichsen, & Ivry, 2000). Ourobservers reported the wrong letter on less than 2.5% ofthe trials (all the categories in Table 2). Donk's theorypredicts that conjunction reports should be just as likelywhen the target letter is incorrectly reported (IN-) aswhen the target letter is correctly reported (CN-). Thisprediction arises because these trials are instances wherethe nontarget O is mistakenly perceived as the targetletter and yet observers must respond X or T. If they areguessing X or T in these cases then they should get thetarget letter wrong as often as they get it right. As can beseen in the table, there were very few responses in thecategories IN- and many more in the categories CN-.Indeed, Donk's hypothesis that conjunction responses arenot due to faulty binding, but rather reflect perceptualconfusion is refuted by all of the data reported in thispaper.
Model Analysis. We start with a basic modelbased on Figure 3 in which there are five parameters thatare adjusted to provide the best fit of 20 data points. Wefit the model separately for the near and far conditions foreach subject. Because we wanted to separately estimatethe parameters for near and far conditions, we had 10parameters (5 near and 5 far) and 40 data points. The fitswere obtained using the method of gradient decent so as
to minimize G2 in the manner described by Dodson, etal. (1998). To ensure that the fits did not represent localminimums, at least 10 random starting values for eachparameter were used. Table 3 gives the mean parametervalues. In general, the fits were close to the observeddata. The sum of the squared error (SSE) averaged .002for the Norepeat group (range .000 to .004) and .001 for
the Repeat group (range .000 to .002).4
--------------------------Insert Table 3 about here
--------------------------The model analysis for the Nonrepeat group are
moderately straightforward (see Table 3). To comparethe two display configurations (near vs. far), we
conducted pairwise t-tests for each parameter.5 The TLand NC parameters did not significantly differ across nearand far conditions, t(5) = .40 and .004 for TL and NCparameters, respectively. The estimated probability ofperceiving the target letter (TL) was approximately .95whereas the probability of perceiving the nontarget color
(NC) was approximately .89. There was a small, butsignificant difference in the estimated probability ofperceiving the target color (TC) as a function of near vs. far.The parameter TC was higher in the far condition than thenear condition, .97 vs. .93, t(5) = 3.08, p < .01 (two tailed).We had not anticipated this small but reliable difference. Thedifference may have been due to lateral masking when thetwo colored items were adjacent. Alternatively, it couldrepresent an inaccuracy with the model. Whatever the causeof the difference, as we will show below, it does not affectthe interpretation of the other parameters in this experiment.
The critical parameters in this experiment were thefeature binding parameter, _, and the guessing parameters, g.Recall that _ = 1.0 represents perfect binding, and _ = 0.5 ischance binding. If the model is correctly measuring featureintegration errors, _ should be less in the near condition thanthe far condition. For the far condition, _ = 0.98, indicatingnearly perfect feature binding. For the near condition, _ =0.73, indicating less than perfect, but not random binding.The difference was reliable, t(5) = 8.83, p<.001.
Note that the differences in TC for near and farconditions can not account for the difference in _. Thedifference between TC for the near and far conditions wouldbe expected to minimize differences in ____Failures in featurebinding (1 - _ branches in Figure 3) only occur when one ormore of the color features are perceived. Thus, the differencein _ between the near and far conditions may beunderestimated.
In the current context, g refers to the probability ofreporting the same color for both the target and nontargetletters. In the Norepeat group, the two colors in the displaywere never the same. If observers are sensitive to thisinformation, the probability of guessing that a nonperceivedcolor was the same as a perceived color should be 0.0. Inaccord with this prediction, the parameter g averaged 0.01 and0.00 for near and far conditions, respectively, t(5) = 1.16, ns.
In summary, the model for the No repeat group wasvery successful. As expected, the main difference betweenthe near and far conditions was in the estimate of ___and theobservers rarely reported seeing both letters in the same coloras reflected in the low estimates of the parameter g.
Turning to the Repeat group, the results for thefeature perception and integration parameters were quitesimilar as those reported for the Norepeat group. Theestimated probability of perceiving the target letter (TL) andthe nontarget color (NC) did not significantly differ betweenthe near and far conditions, t(5) = .15 and .20 for TL and NCparameters, respectively. There was again a small, butsignificant difference in the estimated probability ofperceiving the target color (TC). TC was higher in the farcondition than the near condition, .96 vs. .93, t(5) = 5.71, p< .01 (two tailed). The feature binding parameter, _, washigher for the far condition, _ = 0.97, than for the nearcondition, _ = 0.75. The difference was reliable, t(5) = 10.17,p<.001.
As predicted, the estimate of the parameter g wasradically different for the Repeat group compared to theNorepeat group. We had predicted that the value of g would

8
be close to .25 given that there were four different colors,assuming pure guessing on trials in which only onecolor was perceived. The observed value for the farcondition, g = .28, was close to this value. However,the value for the near condition was much higher thanexpected, g = .42. The difference between the twoconditions was reliable, t(5) = 4.72, p < .001. We hadnot anticipated that this parameter would vary withdisplay condition. A guessing parameter, g, shouldreflect factors that affect guessing, not stimulus factors.The fact that g for the far condition averages near optimalguessing (i.e., 0.25) is encouraging, but the fact that itvaries between the near and far conditions indicates aproblem with the model.
Alternative Model for Repeat Group. We haveinvestigated various alternative models and present belowthe one that we believe provides the most parsimoniousaccount of the data. In our basic model (Figure 3),failures of feature binding (1 - _), result in atransposition of the two colors. That is, the target andnontarget color switch positions (or if only one colorwas perceived, it switches to the other letter). It is alsopossible that a color might migrate to a new letter,resulting in an illusory conjunction, but still remainassociated with its actual letter. This latter possibilitywould be akin to color spreading, a phenomena that hasbeen described in the literature (Prinzmetal, 1981; seealso, Prinzmetal & Keysar, 1989; Prinzmetal & Millis-Wright, 1984). This idea was investigated by Treismanand Schmidt (1982) in their seminal paper. Theyconcluded that features only switch positions; they foundno evidence of spreading. However, Prinzmetal (1981)asserted that features occasionally spread over severaldisplay items. In piloting the Norepeat condition, weoccasionally perceived two letters of the same color eventhough we knew this was not possible. Perhaps errors infeature integration reflect a composite of trials in whichfeature switches occur as well as trials in which onecolor spreads over both letters. Spreading would also beexpected to occur more often in the near condition. Sincethere is no parameter to measure this in the models inFigures 1 and 3, the excess responses of two identicalletters can only inflate the parameter, g. This post hochypothesis provides an account of the inflated values forg in the near condition.
Given this, we might assume that the estimateof g in the far condition represents the actual propensityto guess two identical colors. The mean value of .28 forg is close to the actual color probabilities (.25 of thetrials had a repeated color). In contrast, g in the nearcondition is a mixture of guessing and trials on which acolor spreads over both target and nontarget letters. Thusthe difference between g in the near and far conditionsrepresents this spreading parameter, which we will call s.This interpretation suggests that colors spread over letterwith a probability of .14 (g near - g far).
We tried several models that included aparameter, s. However, it soon became apparent that
with our task, g (guessing two colors were identical) and s (acolor spreading over two letters) can not be separatelyestimated; models with both s and g are mathematicallyequivalent. To understand this restriction, consider astimulus that contains a red T and a green O. A response of"red T, red O" could arise because the color red spread overboth letters, or because the observer perceived the color ofthe T and guessed the color of the O was the same. We cannot distinguish between these two scenarios since they bothinvolve reporting the same features. Nonetheless, twoconsiderations favor the spreading hypothesis. First, we havehad the phenomenal experience of seeing both letters in thesame color even when practicing under no repeat conditions.Second, it seems reasonable that a guessing parameter shouldnot vary between stimulus conditions. The need for anadditional parameter is only apparent in the Repeat condition.Discussion
The modeling results from Experiment 1 are, for themost part, in accord with the predictions we derived based ananalysis of the psychological status of the variousparameters. The first goal was to compare situations inwhich observers would make many feature integration errorsto one in which there would be few feature integration errors.In the near condition, binding errors, as indexed by theparameter _, were fairly common. In the far condition,feature binding was nearly perfect as indicated by _ valuesclose to 1.0 for all observers. Note that, while we use theterms "near" and "far", there are differences between the twoconditions in addition to just the distance between the items.Our focus here is not on why binding failures do not occurunder some conditions (e.g., distance, grouping), but ratheron how the parameters would be influenced when theprobability of correct binding varies. In terms of the otherparameters, we found that the probability of perceiving thetarget letter and nontarget color were nearly identical in thenear and far conditions. However, contrary to ourexpectations, observers appear to be slightly more accurate atidentifying the target color in the far condition than in thenear condition. This difference could only serve to minimizethe differences in the binding parameter, _.
The second goal of the experiment was to see ifobservers would be sensitive to the probability of repeatedcolors in the display, and whether this would this influencetheir guessing behavior. For one group of observers, thedisplays never contained two identical colors (Norepeatgroup); for the other group, a single color was used for boththe target and nontarget letter on one fourth of the trials(Repeat group). As expected, observers in the Norepeatcondition rarely reported the same color for both the targetand nontarget letter, and the estimated probability ofguessing the same color, g, was near 0. Ashby et al. (1996)had assumed observers use an exclusionary strategy when thefeature information is incomplete (e.g., only one colorperceived). For example, having perceived red for thenontarget item, observers would not guess red for the targetitem. The results for the Norepeat group support thisassumption.
9
For the Repeat group, observers were sensitiveto the probability of repeated colors. The averageprobability of guessing a repeated color, g, averaged .42for the near condition and .28 for the far condition. Thusas reflected in the model fits, observers were sensitive tothe fact that colors repeated in the display, and the modelfits reflected this fact. However, we had not anticipatedthat the parameter g would vary as a function of stimulusconditions. We had predicted that it would be the samefor the near and far conditions. This finding has led us toconsider an alternative model in which colors willsometimes spread from one letter to the other, an eventthat is more likely to occur when the distance betweenthe target and nontarget is small.
At this point, the data do not allow us toadjudicate between the original model and the color-spreading model. Because of this uncertainty, only theno repeat condition is used in the subsequentexperiments. We can safely assume that under suchconditions, observers will use an exclusionary strategywhen they perceive the color of only one of the displayitems.
Although the model were very clear inindicating that the observers in the Norepeat group donot guess a color twice (i.e., g ~ 0), the model is muteon why observers constrain their responses in thismanner. There are at least two possibilities. First, itmight be that observers consciously inhibit respondingwith the same color twice. According to thisexplanation, they might perceive two red letters on atrial, but refrain from reporting this because they believeit would not correspond to the actual display. Second,observers might unconsciously learn stimulusconstraints, and never (or rarely) perceive two identicalcolors. Because the parameter g is formally a 'guessing'parameter does not mean that it is not perceptual in thesense of reflecting what observers consciously perceive.
These two possibilities are not mutuallyexclusive. We have some evidence that g can reflectphenomenal experience. Observers were asked after thelast session whether they perceived displays in which thesame color was repeated, and if so, to estimate theprobability of this occurrence. As expected, all of theobservers in the Repeat condition reported that colorsrepeated and their estimates of how often it occurredvaried from 20 to 45% of the trials. Only one observerin the Norepeat group reported seeing a color repeated,and she reported that this occurred on 10 percent of thetrials (subject 2). If these retrospective reports reflectwhat observers perceive, it implies that observers quicklylearn constraints about the displays, and these constraintscan affect perception.Experiment 2
In Experiment 1, the independent variables werepredicted to influence the parameters corresponding tofeature binding and guessing. In Experiment 2, we turnout attention to the parameters associated with theperception of the display colors, TC and NC. To
investigate these parameters, we varied the saturation of thecolors, using two levels (high and low) that were variedindependently for the target and nontarget letters. Thus, therewere four saturation conditions (i.e. target and nontargetsaturated, target saturated/nontarget unsaturated, targetunsaturated/nontarget saturated, and target and nontargetunsaturated). We expected that the variation in saturationwould primarily influence the probability that the target andnontarget colors were perceived. It was unclear whethersaturation levels would influence the feature binding. Themodel sketched in Figure 3 does not assume any affect.However, our informal observations in preparing illusoryconjunction experiments has been that conjunction responsesare more likely to occur with unsaturated colors (e.g.Prinzmetal & Millis-Wright, 1984). We only included theno repeat condition of Experiment 1; thus, we expected theguessing parameter to be zero.Method
Procedure. The procedure for each trial wasessentially identical to that used in Experiment 1. The onlydifference was that there were three color choices (red, green,and blue). We did not include yellow since we were unableto generate a satisfactory version of an unsaturated yellow.The exposure duration was adjusted as in Experiment 1.During the test blocks, the exposure duration averaged 67milliseconds (4 computer refreshes at 60 hz.)
There were 96 trials in a block. These were evenlydivided between the near and far conditions (see Figure 2) andthe four saturation conditions. Two different colors wererandomly chosen on each trial, as well as the target letter (Xor T). Each observer was tested for 6 blocks per 1-hoursession for 9 days with the first session used as practice. Atotal of 4,608 trials per observer were used in the analyses.
Stimuli. The same stimulus configurations as inExperiment 1 were used. There were 3 possible target andnontarget colors. The saturated colors were the same as thered, green, and blue in Experiment 1. The unsaturated colorswere about half as saturated as the saturated colors. In theMacintosh computer code, the color values were as followsfor the three unsaturated colors: red (r = $FF00, g = $9580,b = $9580); green (r = $7F9F, g = $F200, b = $7F9F); blue( r= $9400, g= $9400, b= $FC00). The luminance values
of the unsaturated colors were 60.0 cd/m2 (red), 70.0 cd/m2
(green), and 53.0 cd/m2 (blue). The luminance values of theunsaturated colors were slightly less than the saturatedcolors. However, as indicated below, this did not affect theprobability of perceiving the target letter (TL).
Six observers, selected from the same population asin Experiment 1, were recruited at the University ofCalifornia, Berkeley. Observers were paid $5 per hour.Results
Raw response data. The proportion of responses forthe 18 response categories are shown in Table 4, listedseparately for the four saturation conditions and twoconfiguration (near/far) conditions. Note that there are only18 response categories per condition because there were only3 possible colors. For all conditions, the observers report allthree features and correctly bind the target features (CTN) on
10
at least a majority of the trials. Such reports are greatestwhen both target and nontarget are saturated, and lowestwhen they are both unsaturated. For the near condition,the second highest category of responses is theconjunction response category, CNT, which varies from.105 to .242. In the far condition, the average CNTresponse is only from .021 to .047. Thus, as inExperiment 1, the raw data indicate that many moreconjunction responses occur in the near condition.
--------------------------Insert Table 4 about here
--------------------------Model Analysis. We fitted the data for each
observer as before, using at least 10 starting values toavoid local minima. Given the results of Experiment 1,we fixed the value of g at 0, reducing the number of freeparameters to four. Separate fits were obtained for eachof the four saturation conditions under both near and farconditions. Table 5 presents the mean value of each ofthese parameters, along with goodness of fit measures.Because of the large number of conditions (8fits/observer), we do not show the results for individualobservers. However, to evaluate the patterns in theparameter estimates, we conducted a repeated measuresanalsysis of variance on each of the parameters. Factorsin this analysis were distance, target saturation, andnontarget saturation.
--------------------------Insert Table 5 about here
--------------------------The parameter TL did not significantly vary as a
function of any of the independent variables. The effectof distance, target saturation, and nontarget saturationwere F(1,5) = 4.59, 3.78, and 4.32, respectively. Noneof the interactions approached significance. This findingmay indicate that the perception of the target letter isindependent of the saturation level of this letter. Or, itmay reflect a ceiling effect in that the estimated values ofTL were quite high.
The results for TC were more complex. First,as predicted, the largest effect was caused by targetsaturation (see Table 5). TC was dramatically higherwhen the target color was saturated than when it was notsaturated, .990 vs. .766, F(1,5) = 73.97, p < .01. Thisfactor did not significantly interact with distance (near vs.far configurations). There were a number of smallereffects and interactions with both the parameters TC andNC (below) that were unanticipated. However, theseeffects seem to follow a simple pattern. First, theestimate of TC varied as a function of the saturationlevel of the nontarget color. Collapsing over the otherfactors, the mean value of TC when the nontarget wassaturated was 0.85; when the nontarget was unsaturated,the mean rose to .90, F(1,5) = 67.57, p < .01. Thiseffect can be described as a trade-off: when the nontargetis saturated it may draw attention away from the targetletter. This trade-off was greater when the target was notsaturated than when is was saturated as reflected in a
significant interaction between the saturation levels for thetarget and nontarget items, F(1,5) = 171.10, p < .01. Thetrade-off was also greater in the near condition compared tothe far condition, resulting in a significant interactionbetween distance and the nontarget color, F(1,5) = 9.27, p <.05.
The results in the analysis of NC as the dependentvariable followed a pattern that was similar to the analysis ofTC . The most dramatic effect on the parameter NC was thelevel of nontarget saturation. NC averaged 0.97 when thenontarget color was saturated, but only 0.73 when thenontarget color was not saturated, F(1,5) = 97.36, p < .01.NC was also larger in the near condition than in the farcondition, 0.89 vs. 0.81, F(1,5) = 97.36, p < .01, a resultthat was unexpected. One possibility is that, as attentionshifts towards the target letter, the probability of detectingthe nontarget color increases when it is close to the target.However, we did not obtain a similar result in Experiment 1.
Although not reliable, a similar trade-off wasobserved on NC as was described with TC . NC was slightlylower when the target color was saturated than not saturated,0.84 vs 0.86. This difference was reliably greater when thenontarget color was not saturated than when it was, F(1,5) =10.92, p < .05. The trade-off was also larger in the nearcondition than in the far condition, but again, the interactionwas not significant.
--------------------------Insert Figure 5 about here
--------------------------Similar to Experiment 1, the distance manipulation
had a marked effect on _, the feature binding parameter. Inthe far condition, feature binding was nearly perfect, 0.96; inthe near condition, it was 0.77, F(1,5) = 20.97, p < .01.More interesting, the saturation manipulation produced someinteresting effects on feature binding (Figure 5). As notedabove, we have previously informally observed that illusoryconjunctions are more likely with unsaturated colors (e.g.Prinzmetal & Millis-Wright, 1984). However, thisobservation has remained part of "lab-lore", and not beensubject to experimental investigation. The present resultsmake clear that feature binding errors were more commonwhen the target was not saturated (see Figure 5). Theparameter _ was .91 and .82 when the target was saturatedand unsaturated, respectively, F(1,5) = 38.61, p < .01.Moreover, there was a small but significant interactionbetween the target/nontarget and saturation variables on _,F(1,5) = 13.02, p < .05. When the target is not saturated,feature integration is more accurate (i.e., higher _) when thenontarget is saturated than when it is unsaturated. However,when the target is saturated, the opposite is true: correctfeature integration is greater with the nontarget is saturatedthan when it is saturated.Discussion
The purpose of Experiment 2 was to test thehypothesis that the estimates of the parameters TC and NCwill be sensitive to the salience of the target and nontargetcolors. We varied salience by varying the target andnontarget saturation. As expected, these parameter estimates

11
were strongly influenced by the saturation manipulation.In addition, the near/far manipulation in Experiment 2provides further evidence that the feature bindingparameter, _, is subject to distance constraints.
The modeling work revealed a number ofunexpected results. These unexpected finding weregenerally small in magnitude. Nonetheless, as shown bythe various interactions, the effects were consistent.There are two general interpretations that one might giveto these effects. First, they might simply reflect failuresof the model. In fact, in the General Discussion we willsuggest how the model could be changed to account forsome of these findings. Second, they might reflect trueaspects of feature integration and the task demands of theexperiment. We propose that some of the observedinteractions may reveal important insights into thebinding process.
Consider the finding that the parameter TCvaried as a function of the nontarget color saturation and,similarly, the parameter NC varied as a function of thetarget color saturation. TC was higher when thenontarget color was saturated compared to when thenontarget was not saturated. Moreover, this effect wasgreater when the target color was not saturated. Thispattern suggests that the observers' attention may bedrawn to the more saturated color. Thus when the targetcolor is not saturated and the nontarget color is saturated,observers tend to attend to the nontarget letter and NC isboosted. Similarly, when the nontarget color is notsaturated and the target color is saturated, observers tendto attend to the target letter, boosting TC . Thisexplanation accounts for many of the findings, but it isadmittedly, post hoc.
In keeping with the model depicted in Figure 3,we had also predicted that the binding parameter, _,would only be affected by the distance manipulations.However, for years we have deliberately chosennonsaturated colors for our illusory conjunctionexperiments because we have continually failed to obtaina large number of conjunction errors when using highlysaturated colors (e.g., Prinzmetal & Millis-Wright,1984). Experiment 2 provided verification of thisobservation.
In summary, as predicted, varying the saturationof the colors had its primary effect on the estimates ofthe two parameters associated with perceiving the targetand nontarget colors. The modeling work, though, didreveal two types of interactions that require further study.First, there is the interaction involvine the target andnontarget saturations on the parameter reflecting theother color. Varying the salience of the color of oneobject appears to have an effect on the likelihood thatanother object's color will be perceived. Second, there isthe interaction of salience on binding itself: unsaturatedtarget colors lead to more binding failures.Experiment 3
Experiment 3 had two goals. First, we testedthe adequacy of the multinomial approach for studying
feature integration in a novel manner. In the precedingexperiments we varied stimulus factors, and tested predictionsbased on how these factors would influence specificparameters. In Experiment 3, we did not vary the stimulus.Instead, on each trial the observers gave a confidence ratingon a scale from 1 (guessing) to 9 (very confident). Weassumed that the confidence ratings would be based on theobservers' assessment of how well they had perceived thestimulus features. Correspondingly, we predicted that theparameter estimates should correlate with the confidenceratings. TL, TC, NC, and __are likely to be higher on trialsin which the observers were confident, compared to trials inwhich their confidence was low. A priori, we do not know ifsome of the parameters will be more sensitive to theconfidence ratings than others.
The second goal of this experiment was to determinethe phenomenal reality of the "illusion" in illusoryconjunctions. At one extreme, illusory conjunctions may bejust as phenomenally real as correct perceptions. At theother extreme, illusory conjunctions may never seem likereal perceptions, but always result from guesses. Anintermediate position is that the trials on which conjunctionresponses are made (CN, see Table 1) will have, on average,lower confidence rating than correct responses (CT), but therewill be considerable overlap in the distributions so that someconjunction responses will have higher confidence ratingsthan correct responses. Treisman and Schmidt took a middleposition when they comment "At least some conjunctionerrors are consciously and confidently experienced asperceived physical objects rather than reflecting simplyguessing in the absence of information" (1982, p.138). Inone experiment, Treisman and Schmidt took confidenceratings, but unfortunately they only had two levels ofconfidence ("sure" and "think") so that it is difficult toevaluate the relationship between the different types ofresponses and the distribution of the confidence ratings.
In Experiment 3, we adopted a procedure that wasexpected to lead to a large proportion of conjunction errors.The displays were similar to the no repeat, near condition ofExperiments 1 and 2. The observers were only required toreport the target color and target letter. Subsequent to this,they were required to gave a confidence rating (1 to 9) toindicate their confidence for that trial. Because observers hadto make confidence ratings, we eliminated the nontarget colorresponses to keep the load in this experiment similar to theother experiments.Method
Procedure. On each trial, observers were brieflypresented a stimulus that contained a colored target letter (Xor T), a colored nontarget letter (the letter O). The observerresponded with the color and identity of the target letter byclicking the appropriate button on 3 x 2 response palette. Ifthe target letter was perceived to be T, the click was directedto the appropriate box on the top row; if the target letter wasperceived to be X, responses were made on the bottom row.Just below the palette was a row of nine buttons, labeled 1to 9 from left to right. After indicating the color and identityof the target letter, observers indicated their confidence by

12
clicking on one of the 9 buttons with 1 for leastconfident and 9 for most confident. Thus, as inexperiments 1 and 2, observers made two "clicks" eachtrial. All other aspects of the procedure were as in theprevious experiment. Over all the test sessions, theexposure duration averaged 107 ms.
Each observer was tested for five 1-hoursessions with the first session used for practice. Testsessions began with a minimum of 16 warm-up trials,followed by six blocks of 96 trials each, yielding a totalof 2880 observations per observer.
Stimuli. The stimulus in experiment 3consisted of a single row of four letters. The dimensionswere identical to the horizontal row of letters shown inFigures 3a and 3b. The two colored letters were alwaysadjacent to each other. Whether the target was on the leftor right of the colored O was randomly determined oneach trial. In each block of trials, the row of lettersappeared equally often in each of the four quadrants. Thetwo target letters (T and X) occurred equally often in eachof three colors (red, green, and blue). The target andnontarget colors were never the same.
Seven observers, selected as before, participatedin the experiment.Results
Raw response data. The mean number ofresponses for each of the 6 response categories and 9confidence ratings, averaged over observers, is given inTable 6. The most frequent response categorycorresponds to correct responses, CT, and the highesterror category is the conjunction responses, CN. As inthe other two experiments, conjunction responses aremuch more likely when the target letter is identified,CN, compared to when the wrong letter is reported, IN.This finding challenges the model proposed by Donk(1999) and indicates that at least some of the errors weredue to feature migration (see Prinzmetal, Diedrichsen, &Ivry, 2000).
--------------------------Insert Figure 6 and Table 6 about here
--------------------------The raw data give a clear picture of observers'
confidence when they make a conjunction response (CN).Figure 6 plots the proportion of conjunction responses(CN), correct responses (CT), and all other categories ofresponses that fall into each confidence bin. The sum ofeach of the curves is 1.0. The highest proportion ofcorrect responses were given the highest confidence level.When observers made conjunctions responses they were,on average, less confident than when they were correct.Nevertheless, confidence for correct responses andconjunction responses form overlapping distributions sothat there are a substantial number of trials on whichcorrect responses have lower ratings than conjunctionresponses. As shown in Figure 6, confidence was muchlower on trials in which errors other than conjunctionresponses occurred. One problem with an analysis basedon the raw data is that we can not separate correct
responses that resulted from veridical perception and thosethat resulted from guesses that were lucky.
Model Analysis. We fit the data with a modelidentical to that shown in Figure 1 with two exceptions.First, because we did not repeat colors, we fixed g = 0,eliminating one free parameter. Second, since there wereonly 3 colors in the experiment, the response categories CØand IØ do not exist. Even though there were 2880 responsesper observer, when the data was broken down into 9 responsecategories, there were many empty cells. Thus we createdfour data sets for each observer by combining across thelowest three ratings (C1-C3) and then grouping the pairs athigher confidence levels (C4-C5, C6-C7, C8-C9). Thus foreach of the seven observers we solved for TL , TC , NC, and _at four confidence levels. The fits, averaged over the 7observers, are given in Table 7. We conducted a one-wayrepeated ANOVA on each of the parameters as a function ofconfidence.
-------------------------Insert Table 7 about here
--------------------------The parameter TL significantly differed for the four
different confidence categories. For the lowest confidencelevel it averaged .787 and for the highest confidence level itaveraged .996, F(3,18) = 18.42, p < .01. The parametersthat represent the perception of the target and nontarget color,TC and NC also rose as confidence increased. However, theestimates of TC and NC did not significantly increase withconfidence, F(3,18) = 1.5 and1.93 for TC and NC,respectively, likely due to a ceiling effect. As can be seen inTable 6, responses that were classified as color feature errors(CO or IO) only occurred on less than 1% of the trials. Weassume that the colors were missed on some other trials, butthe participant guessed a color that had been part of thedisplay. Nonetheless, color perception was clearly quitegood in this experiment.
Most interesting, the parameter _ varied from .559for the least confident category to .940 for the most confidentcategory. The difference between _ over the four confidencecategories was reliable, F(3,18) = 114.11, p < .01. Thuswhen feature binding is near chance, observers have littleconfidence in their responses. When feature binding is nearperfect, observers are very confident in their responses.Discussion
In this experiment, we tested the adequacy ofmultinomial modeling in a unique way. Instead of changingstimulus conditions and tracking changes in parametervalues, we kept the stimulus conditions constant andobtained confidence ratings. We assumed that low confidencecorresponds to perceptual uncertainty. Thus the parametervalues should vary with confidence ratings. Indeed, all fourparameters varied with confidence, although the statisticswere only reliable for TL and _.
This experiment affords us the best view yet, of thephenomenal reality of feature integration errors. It is notsurprising that, on average, observers are more confidentwhen they make a correct response than when they make anerror. Similarly, as reflected in the estimate of _, the

13
likelihood of making an illusory conjunction increases asconfidence decreases. However, the results are in accordwith the claim of Triesman and Schmidt (1982) thatthere are some trials in which feature integration errorsappear to be as phenomenally real as correct responses.Our own experience is similar. We have served assubjects in many illusory conjunction experiments andcontinue to be amazed that a very clear perception of, forexample, a red T and blue O is wrong, that the displayactually contained a blue T and red O. In the currentexperiment, 5% of the trials in the highest confidencegroup (C8-C9) resulted in conjunction errors.
At first glance, it seems surprising that thebinding parameter is sensitive to confidence. It isintuitively reasonable to expect that the values of theparameters representing the features would be correlatedwith confidence. On some trials, the observers may havenot gotten a good look at the briefly presented stimuli--perhaps they blinked at the wrong time or weremomentarily distracted. But it isn't obvious that thesesorts of effects would influence binding. Binding requiresthat at least one shape and one color are perceived, andthe _ parameter describes the likelihood that the featureswill be bound correctly.
Why would binding become less accurate asconfidence goes down (or, alternatively, why doesconfidence go down as binding becomes less accurate)?To account for this, it is important to consider theunderlying mechanism or mechanisms that might causevariation in _. . Ashby et al. (1996) argue that truebinding errors are the result of variability in the perceivedlocation of features. If the display contains a blue T andred O, we may report a red T if the location of the T isperceived as closer to spatial representation of the redstimulus compared to the blue stimulus. While themodels described by Ashby et al. are similar to thatdepicted in Figure 3, _ was not computed separately foreach distance as in the present experiments, but ratherwas computed as a function of bivariate distributions ofperceived locations. In essence, Ashby et al. proposedthat feature integration errors were due to impreciselocation information (e.g., Friedman-Hill., Robertson, &Treisman, 1995;.Logan, 1996; Prinzmetal & Keysar,1989). When seen this way, it becomes clear that,similar to the way feature perception may be more fuzzyon trials in which confidence is reported to be low,perceived location may also be more variable on suchtrials.General Discussion
The goal of the experiments reported here was totest the adequacy of using multinomial models forinvestigating feature integration. We used twostrategies. In Experiments 1 and 2, stimulus factorswere varied to test specific predictions derived fromassumptions concerning the psychological status of themodel's parameters. For example, we varied a host offactors that have been shown to affect feature integrationsuch as inter-object distance and grouping. The feature
binding parameter, _, was significantly affected by thesemanipulations in both Experiments 1 and 2. In Experiment1, we also compared conditions in which the colors wereselected on each trial without replacement to conditions inwhich the colors were selected with replacement. Thus, inthe second condition, the same color could be associated withboth the target and nontarget letters. As predicted, thismanipulation affected the guessing parameter, g. InExperiment 2 we varied the saturation level of the colors.The parameters that reflect the probability of perceiving thetarget and nontarget color, TC and NC, were higher withsaturated colors than with nonstaturated colors.
In the third experiment, we took a novel approachfor testing the adequacy of the multinomial approach. Weobtained confidence ratings after each trial. We assumed thaton trials with low confidence, observers would be guessingmore often than on trials with high confidence. Hence, oneor more of the model parameters should be lower on trialswith low confidence. All of the parameters were lower ontrials that received low confidence. However, due to a ceilingeffect on color accuracy, this effect was only significant forthe parameters TL and _.
While the results were generally in accord with ourpredictions, there were two notable exceptions. First, inExperiment 1,the likelihood that an observer would guessthat the same color was used for both the target and nontargetwas higher than expected from base rate probabilities whenthe two items were close to one another. One hypothesis isthat when items are close together, observers are morewilling to guess that they were the same. Anotherhypothesis is that colors sometimes spread over adjacentitems (or locations). Color spreading has not beenincorporated into multinomial models of feature integration,and the present design precluded adding this parameter sincesuch a model would be mathematically equivalent to theoriginal. For this reason, we only included the no repeatcolor condition in Experiments 2 and 3.
The results of Experiment 1 convincinglydemonstrate that when colors do not repeat in a display,observers do not guess the same color twice. This does notmean that spreading no longer occurs. Rather, it may be thatobservers adopt an exclusionary strategy when they recognize(explictly or implicitly) that the two colors are alwaysdifferent. Hence the parameter g is essentially 0 and can bedropped from the model. We recommend this simplificationto other investigators.
The second unexpected finding was that, inExperiment 2, the color saturation manipulation not onlyaffected the likelihood of perceiving the color features (andminimally at that), but it also had an affect on the bindingparameter, _. Feature integration errors occurred at a higherrate when the target color was less saturated. We haveinformally observed this effect before, leading us to choosepastel colors when conducting illusory conjunctionexperiments. There is, of course, a danger in using colorsthat are too unsaturated: the parameters that reflect theprobability of perceiving the color will also become low.

14
As noted in the Introduction, the multinomialmodels described in this paper are not process models;rather they are intended as measurement tools. Thuswhile discovering that feature integration errors are morelikely with unsaturated colors, they do not tell us whythis is so. To understand why unsaturated colors mightlead to more feature integration errors, it is important toconsider models that assume that the representation(neural or psychological) of a colored stimulus can bedescribed as a distribution of activation over space (e.g.,Ashby, et al., 1996; Logan, 1996). It may be that anunsaturated color produces a weaker activation and thusthe representation of its location is more susceptible tonoise. Attention may also be drawn to saturated colors.Note that _ was affected mostly be the target colorsaturation, not the nontarget saturation.
Multinomial models have been criticizedbecause information is represented in an all-or-nonefashion. In our context, it is assumed that on each trial,the observer either knows the target color or has noinformation about this color. The models do not seemto allow for partial information. This approach can becontrasted with a continuous state theory, like signaldetection theory (SDT) that allows for partialinformation.
There are ways in which partial information canbe represented in multinomial models. Consider a sourcememory experiment reported by Dodson, Holland, andShimamura (1998). A list of words was read to eachparticipant by one of 4 people: 2 of the sources weremale and 2 were female. At test, participants werepresented a list of words and they had to determinewhether the words were old or new. For items judgedold, observers also had to indicate the source. The datawas best fit by a model that included a parameter forremembering the gender of the source, but not whichspecific male or female read the item. Knowledge ofgender in this context constitutes partial sourceinformation.
This approach could easily be extended tomodels of feature integration. Suppose the possibletarget colors were red, orange, blue and cyan. Anobserver might have partial information: know that thecolor was a "warm color" (red or orange), even if theycould not identify the exact color. One could include anadditional parameter to indicate whether a color wasperceived as a warm color or cool color and anotherparameter to indicate which specific color it was.
A comparison of how continuous-state models(e.g., SDT) and multinomial models represent partialinformation is revealing. The continuous state theory isdesigned to represent many states of partial information.However, it is vague on the nature of that partialinformation. The multinomial approach does not haveinfinite levels of partial information, but is also moreconstrained since it forces the investigator to preciselycharacterize the information (e.g., the discrimination ofwarm vs. cool colors).
Another criticism of the multinomial models is thatthe parameters are generally assumed to be independent.Thus, the probability of perceiving the target letter identity(TL) is formally independent of the probability of perceivingits color (TC). There are clearly situations where judgementsabout color and shape are not independent (e.g., Bonnel &Prinzmetal, 1998). There almost surely is a non-zerocorrelation between, for example, the perception of the targetletter and its color. For instance, on some trials, observerswill blink, not be attending, or not appropriately fixated. Onthese trials, observers will be forced to guess on both thetarget letter and target color. Similarly, in considering theinteractions observed in the saturation study, we proposedthat a trade-off might exist as attention is drawn to the moresalient stimulus.
In modeling various data sets, we have found thatone can easily include correlated parameters. Consider asituation where one suspects that the probability ofperceiving the target color and target letter are highlycorrelated. Working from the model in Figure 1, thecorrelated version would begin in the same manner at LevelI, using a single parameter for TL. At Level II, instead ofone parameter, TC, there are two parameters: TC given thetarget letter was perceived (TC | TL) and TC given the targetletter was not perceived (TC | ~TL). In this manner, thecorrelation can be tested. If the parameters (TC | TL) and(TC | ~TL) are not significantly different, then it isreasonable to simplify the situation and just use a single TCparameter. Indeed, in the studies presented here, it was notnecessary to use one of these models.
In conclusion, the multinomial approach provides arigorous yet flexible tool for the study of feature integration.While we have focused on the most common classes of thesemodels, ones that assume no correlation between the differentparameters and assume all-or-none states, it should bestraightforward to extend this approach to cases with partialinformation and correlated parameters. In promoting themultinomial approach, we do not intend to denigrate theutility of continuous state models. Indeed we havehypothesized a hybrid model with both multinomial andcontinuous state components (Ashby et al., 1996).However, it remains to be seen if continuous state modelscan be validated and applied as easily as the currentmultinomial approach. Until that time, our currentmultinomial approach provides a valid measurement tool forstudying feature integration.

15
ReferencesArguin, M., Cavanagh, P., & Joanette, Y. (1994).
Visual feature integration with an attentionaldeficit. Brain and Cognition , 24 , 44-56.
Ashby, F. G., Prinzmetal, W., Ivry, R., & Maddox, T.(1996). A Formal Theory of IllusoryConjunctions. Psychological Review 103 , 165-192.
Banks, W. P. (in press). Recognition and source memoryas multivariate decision processes.Psychological Science ,
Batchelder, W. H., & Riefer, D. M. (1990). Multinomialprocessing model of source monitoring.Psychological review , 97 , 548-564.
Fischer, e. H., & Laming, D. (Eds.). (1994). Analysis of a model for source monitoring . New York :Springer-Verlag:
Batchelder, W. H., & Riefer, D. M. (1999). Theoreticaland empirical review of multinomial processtree modeling. Peycholonomic Bulletin &Review , 6 , 57-66.
Bayen, U., & Erdfelder, E. (1996). SourceDiscrimination, Item Detection, andMultinomial Models of Source Monitoring.Journal of Experimental Psychology: Learning,Memory, and Cognition , 11 , 1-19.
Baylis, G. C., Driver, J., & McLeod, P. (1992).Movement and proximity contrainmiscombinations of colour and form.Perception , 21 , 201-218.
Bonnel, A.-M., & Prinzmetal, W. (1998). Dividingattention between the color and the shape ofobjects. Perception & Psychophysics , 60 , 113-124.
Butler, B. E., Mewhort, D. J. K., & Browse, R. A.(1991). When do letter features migrate? Aboundary condition for feature-integrationtheory. Perception & Psychophysics , 49 , 91-99.
Chastain, G. (1982). Feature mislocalizations andmisjudgments of intercharacter distance.Psychologicical Research , 44 , 51-66.
Cohen, A., & Rafal, R. D. (1991). Attention and featureintegration: illusory conjunctions in a patientwith a parietal lobe lesion. Psychologicalscience , 2 , 106-110.
Dodson, C. S., Prinzmetal, W., & Shimamura, A.(1998). Using Excel to estimate parametersfrom observed data: An example from sourcememory data. Behavioral Research Methods,Instruments & Computers , 30 , 517-526.
Dodson, C. S., Holland, P. W., & Shimamura, A. P.(1998). On the recollection of specific andpartial source information. Journal ofExperimental Psychology : Learning , Memory,and Cognition , 24 , 1121-1136.
Donk, M. (1999). Illusory conjunctions are an illusion: Theeffects of target-nontarget similarity on conjunctionand feature errors. Journal of ExperimentalPsychology: Human Perception and Pe rformance ,1999 , 1207-1253.
Erdfelder, E., Faul, F., & Buchner, A. (1996). GPOWER: Ageneral power analysis program. Behavior ResearchMethods, Instruments & Computers , 28 , 1-11.
Friedman-Hill, S. R., Robertson, L. C., & Treisman, A.(1995). Parietal contributions to visual featurebinding: Evidence from a patient with bilaterallesions. Science , 269 , 853-855.
Gallant, J. L., & Garner, W. R. (1988). Some effects ofdistance and structure on conjunction errors.Bulletin of the Psychonomic Society , 26 , 323-326.
Hazeltine, E., Prinzmetal, W., & Elliot, K. (1997). If its notthere, where is it: locating illusory conjunctions.Journal of Experimental Psychology: HumanPerception and Performance , 23 , 263-277.
Ivry, R. B., & Prinzmetal, W. (1991). Effect of featuresimilarity on illusory conjunctions. Perception &Psychophysics , 49 , 105-116.
Johnson, M. K., & Raye, C. L. (1981). Reality Monitoring.Psychological Review , 88 , 67-85.
Keele, S. W., Cohen, A., Ivry, R., Liotti, M., & Yee, P.(1988). Tests of a temporal theory of attentionalbinding. Journal of Experimental Psychology:Human Perception and Performance , 14 , 444-452.
Khurana, B. (1998). Visual structure and the integration ofform and color. Journal of ExperimentalPsychology: Human Perception and Performan ce ,24 , 1766-1785.
Kinchla, R. A. (1994). Comments on Batchelder and Riefer'smultinomial model for source monitoring.Psychological Review , 101 , 166-171.
Lasaga, M. I., & Hecht, H. (1991). Integration of localfeatures as a function of global goodness.Perception & Psychophysics , 49 , 201-211.
Logan, G. (1996). The CODE theory of visual attention: Anintegration of space-based and object-basedattention. Psychological Review , 103 , 603-649.
Prinzmetal, W. (1981). Principles of feature integration invisual perception. Perception & Psychophysics , 30 ,330-340.
Prinzmetal, W., & Millis-Wright, M. (1984). Cognitive andlinguistic factors affect visual feature integration.Cognitve Psychology , 16 , 305-340.
Prinzmetal, W., Presti, D. E., & Posner, M. I. (1986). Doesattention affect visual feature integration? Journal ofExperimental Psychology: Human Perception andPerformance , 12 , 361-369.
Prinzmetal, W., & Keysar, B. (1989). A functional theory ofillusory conjunctions and neon colors. Journal ofExperimental Psy chology: General , 118 , 165-190.

16
Prinzmetal, W., Treiman, R., & Rho, S. H. (1986).How to see a reading unit. Journal of Memoryand Language , 25 , 461-475.
Prinzmetal, W., Hoffman, H., & Vest, K. (1991).Automatic processes in word perception: ananalysis from illusory conjunctions. Journal ofexperimental psychology: human perception andperformance , 17 , 902-923.
Prinzmetal, W., Henderson, D., & Ivry, R. (1995).Loosening the constraints on illusoryconjunctions: the role of exposure duration andattention. Journal of Experimental Psychology:Human Perception and Performance , 21 , 1362-1375.
Prinzmetal, W., Nwachuku, I., Bodanski, L.,Blumenfeld, L., & Shimizu, N. (1997). Thephenomenology of attention Part 2: brightnessand contrast. Consciousness and Cognit ion , 6 ,372-412.
Prinzmetal, W., & Wilson, A. (1997). The Effect ofAttention on Phenomenal Length. Perception ,26 , 193-205.
Prinzmetal, W., Amiri, H., Allen, K., & Edwards, T.(1998). The phenomenology of attention Part 1:color, location, orientation, and "clarity".Journal of Experimental Psychology: HumanPerception and Performance , 24 , 261-282.
Prinzmetal, W., Diedrichsen, J., & Ivry, R. B. (2000).Illusory Conjunctions are Alive and Well: AReply to Donk (1999). Journal of ExperimentalPsychology: Hum an Perception andPerformance , submitted for publlication ,
Rapp, B. C. (1992). The nature of sublexicalorthographic organization: The bigram troughhypothesis examined. Journal of Memory andLanguage , 31 , 33-53.
Riefer, D. M., & Batchelder, D. (1988). Multinomialmodeling and the measurement of cognitiveprocesses. Psychological Review , 95 , 318-339.
Riefer, D. M., Hu, X., & Batchelder, W. H. (1994).Response strategies in source monitoring. Journalof Experimental Psychology: Learning, Memory,and Cognitio n , 20 , 680-693.
Seidenberg, M. (1987). Sublexical structures in visual wordrecognition: Access units or orthographicredundancy? file: Hillsdale, NJ: Erlbaum.
Snodgrass, J. G., & Corwin, J. (1988). Pragmatics ofmeasuring recognition memory: application todementia and amnesia. Journal of ExperimentalPsychology: General , 117 , 34-50.
Thompson, W. F., Hall, M. D., & Pressing, J. (in press).Pitch and duration in unfamiliar tone sequences.Journal of Experimental Psychology: HumanPerception & Performance ,
Treisman, A., & Gelade, G. (1980). A feature-integrationtheory of attention. Cognitive Psychology , 12 , 97-136.
Treisman, A., & Schmidt, H. (1982). Illusory conjunctionsin the perception of objects. Cognitive Psychology ,14 , 107-141.
Treisman, A., & Paterson, R. (1984). Emergent features,attention, and object perception. Journal ofExperimental Psychology: Human Perception andPerformance , 10 , 12-31.
Wolford, G., & Shum, K. H. (1980). Evidence for featureperturbations. Perception & Psychophysics , 27 ,409-420.
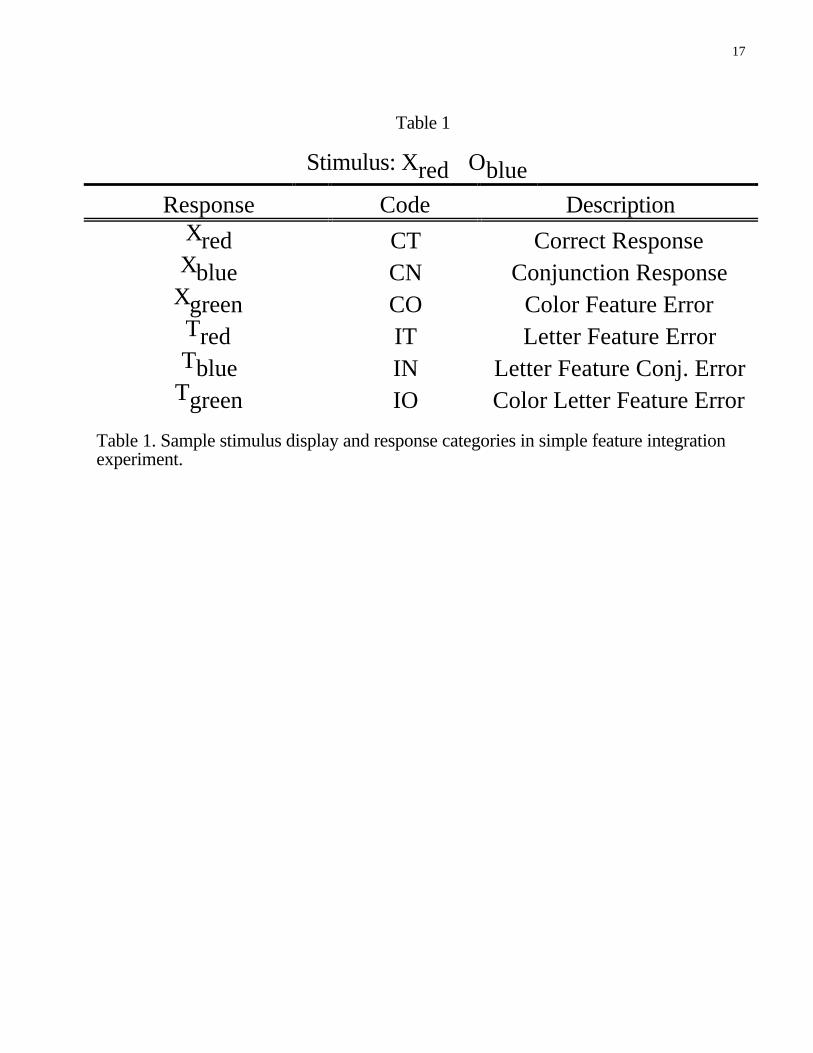
17
Table 1
Stimulus: Xred Oblue
Response Code DescriptionXred CT Correct ResponseXblue CN Conjunction Response
Xgreen CO Color Feature ErrorTred IT Letter Feature ErrorTblue IN Letter Feature Conj. Error
Tgreen IO Color Letter Feature Error
Table 1. Sample stimulus display and response categories in simple feature integrationexperiment.
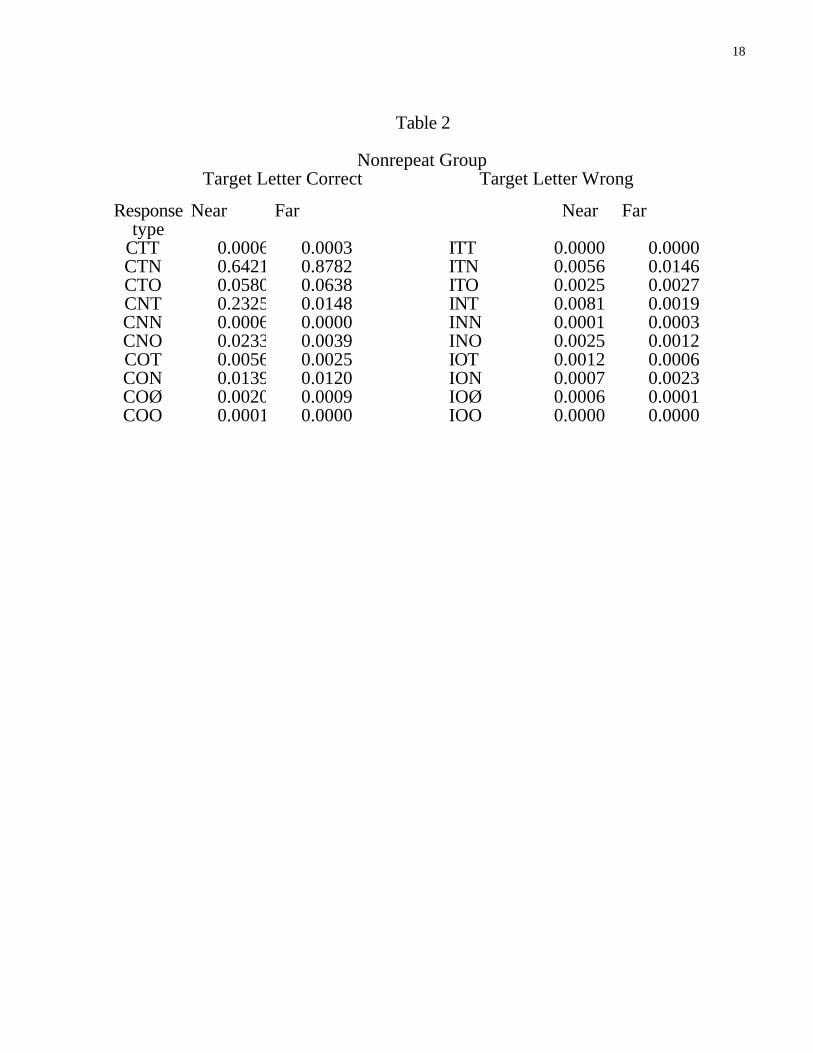
18
Table 2
Nonrepeat GroupTarget Letter Correct Target Letter Wrong
Responsetype
Near Far Near Far
CTT 0.0006 0.0003 ITT 0.0000 0.0000CTN 0.6421 0.8782 ITN 0.0056 0.0146CTO 0.0580 0.0638 ITO 0.0025 0.0027CNT 0.2325 0.0148 INT 0.0081 0.0019CNN 0.0006 0.0000 INN 0.0001 0.0003CNO 0.0233 0.0039 INO 0.0025 0.0012COT 0.0056 0.0025 IOT 0.0012 0.0006CON 0.0139 0.0120 ION 0.0007 0.0023COØ 0.0020 0.0009 IOØ 0.0006 0.0001COO 0.0001 0.0000 IOO 0.0000 0.0000

19
Table 2
Repeat GroupTarget Letter Correct Target Letter Wrong
Responsetype
Near Far Responsetype
Near Far
CTT 0.0199 0.0110 ITT 0.0014 0.0014CTN 0.6578 0.8818 ITN 0.0104 0.0139CTO 0.0272 0.0313 ITO 0.0010 0.0012CNT 0.2149 0.0262 INT 0.0075 0.0029CNN 0.0318 0.0079 INN 0.0015 0.0037CNO 0.0116 0.0025 INO 0.0008 0.0006COT 0.0027 0.0014 IOT 0.0002 0.0000CON 0.0093 0.0131 ION 0.0010 0.0000COØ 0.0000 0.0002 IOØ 0.0002 0.0000COO 0.0008 0.0002 IOO 0.0002 0.0010
Table 2. Proportion of each response category for Nonrepeat and Repeat groups. Notefor repeat group, proportions are based on 2880 trials per observer and for thenonrepeat group, proportions are based on 2160 trials per observer. Trials on which acolor repeated are not included in the table or analysis.

20
Table 3Nonrepeat Group
Subject: S1 S2 S3 S4 S5 S6 MeanTL
near0.951 0.972 0.984 0.943 0.910 0.984 0.957
TLfar
0.967 0.983 0.981 0.878 0.920 0.986 0.953
TCnear
0.922 0.959 0.950 0.923 0.872 0.980 0.934
TCfar
0.955 0.984 0.981 0.953 0.955 0.981 0.968
NCnear
0.917 0.956 0.937 0.893 0.650 0.987 0.890
NCfar
0.971 0.946 0.913 0.863 0.684 0.963 0.890
_near
0.737 0.689 0.713 0.760 0.828 0.650 0.729
_far
0.984 0.978 0.989 0.966 0.968 0.988 0.979
gnear
0.000 0.008 0.014 0.000 0.000 0.080 0.017
gfar
0.000 0.010 0.000 0.000 0.002 0.014 0.004
G2 65.558 88.838 73.835 240.382 212.536 43.611 120.793
SSE 6.34E-04
1.07E-03
3.59E-04
3.81E-03
3.78E-03
1.13E-04
1.63E-03

21
Table 3Repeat Group
Subject: S1 S2 S3 S4 S5 S6 MeanTL
near0.937 1.000 0.924 0.935 0.958 0.963 0.953
TLfar
0.935 0.988 0.984 0.912 0.947 0.940 0.951
TCnear
0.918 0.985 0.909 0.900 0.905 0.949 0.928
TCfar
0.967 0.995 0.954 0.939 0.936 0.974 0.961
NCnear
0.939 0.980 0.922 0.901 0.888 0.959 0.932
NCfar
0.973 0.989 0.949 0.880 0.833 0.983 0.934
_near
0.730 0.822 0.794 0.735 0.735 0.680 0.749
_far
0.973 0.992 0.993 0.961 0.898 0.984 0.967
gnear
0.465 0.334 0.511 0.370 0.319 0.492 0.415
gfar
0.450 0.165 0.305 0.210 0.155 0.402 0.281
G2 61.365 33.598 48.646 103.866 176.429 102.557 87.743
SSE 6.94E-04
4.17E-05
7.55E-04
2.12E-03
1.67E-03
7.28E-04
1.00E-03
Table 3. Fits for Experiment 1. The parameters are as follows: TL (probability ofperceving the target letter, TC (probability of perceiving the target color), NC(probability of perceiving the nontarget color); _ (the probability of correctly bindingcolors and letters), g (the probability of guessing two identical colors).

22
Table 4Near Condition
RESPONSE TargetSaturated;NontargetSaturated
TargetUnsaturated;NontargetSaturated
TargetSatrated;Nontarget
Unsaturated
TargetUnsaturated;NontargetUnsturated
CNO 0.002 0.065 0.001 0.051CNN 0.001 0.001 0.000 0.000CNT 0.174 0.229 0.105 0.242CON 0.003 0.088 0.002 0.039COO 0.000 0.000 0.000 0.000COT 0.000 0.001 0.011 0.019CTO 0.006 0.008 0.114 0.063CTN 0.801 0.584 0.759 0.567CTT 0.000 0.000 0.000 0.000INO 0.000 0.001 0.000 0.003INN 0.000 0.000 0.000 0.000INT 0.004 0.009 0.004 0.005ION 0.000 0.003 0.000 0.001IOO 0.000 0.000 0.000 0.000IOT 0.000 0.000 0.000 0.001ITO 0.000 0.000 0.001 0.001ITN 0.008 0.010 0.002 0.008ITT 0.000 0.000 0.000 0.000

23
Table 4Far Condition
RESPONSE TargetSaturated;NontargetSaturated
TargetUnsaturated;NontargetSaturated
TargetSatrated;Nontarget
Unsaturated
TargetUnsaturated;NontargetUnsturated
CNO 0.000 0.010 0.001 0.023CNN 0.001 0.001 0.001 0.001CNT 0.021 0.027 0.030 0.047CON 0.003 0.109 0.002 0.065COO 0.000 0.000 0.001 0.000COT 0.001 0.007 0.011 0.023CTO 0.014 0.017 0.167 0.121CTN 0.951 0.806 0.780 0.707CTT 0.000 0.001 0.000 0.000INO 0.000 0.002 0.000 0.002INN 0.000 0.000 0.000 0.000INT 0.003 0.004 0.001 0.002ION 0.000 0.005 0.001 0.002IOO 0.000 0.000 0.000 0.000IOT 0.000 0.000 0.000 0.000ITO 0.000 0.001 0.001 0.001ITN 0.006 0.011 0.004 0.007ITT 0.000 0.000 0.000 0.000
Table 4. Results for Experiment 2 broken down into response type and color condition.

24
Table 5
Condition TL TC NC _ G2 SSE
Target Near 0.973 0.988 0.986 0.819 27.083 1.69E-04Nontarget Far 0.981 0.990 0.969 0.975
Target Near 0.954 0.685 0.979 0.695 52.619 2.95E-03Nontarget Far 0.954 0.742 0.945 0.958
Target Near 0.986 0.992 0.747 0.879 31.055 4.12E-04Nontarget Far 0.987 0.988 0.637 0.959
Target Near 0.961 0.817 0.832 0.686 87.745 2.64E-03Nontarget Far 0.973 0.819 0.702 0.929
Table 5. Parameters and goodness of fit for Experiement 2. For Target and Nontarget,bold indicates saturated colors, plain text indicates unsaturated colors.

25
Table 6. Responses in Experiment 3.Confidence 1 2 3 4 5 6 7 8 9 Total
CN 67.7 65.7 95.3 89.9 83.7 64.7 48.9 26.9 13.6 556.3CO 8.1 3.4 4.1 2.4 0.9 1.0 0.6 0.3 0.4 21.3CT 78.9 104.3 172.6 223.9 269.1 306.4 364.7 305.9 367.4 2193.IN 27.4 13.1 12.6 7.7 6.4 2.7 2.7 1.0 0.3 74.0IO 2.4 0.0 0.4 0.1 0.1 0.3 0.1 0.1 0.0 3.7IT 15.1 3.3 5.0 2.3 1.4 1.6 2.0 0.3 0.6 31.6
Total 199.7 189.9 290.0 326.3 361.7 376.7 419.0 334.4 382.3 2880
Table 6. Number of responses as a function of response type and confidence ratings inExperiment 3 averaged over observer.
Table 7Confidence C1-C3 C4-C5 C6-C7 C8-C9
TL 0.787 0.944 0.977 0.996TC 0.973 0.992 1.000 1.000NC 0.929 0.985 0.971 0.976_ 0.559 0.729 0.848 0.940
G2 29.529 23.650 15.730 10.645
sse 4.09E-03 1.25E-03 2.01E-04 3.05E-05
Table 7. Average fits for observers in Experiment 7 with confidence rating as theindependent variable.
26
Author NotesThis research was supported by National Science Foundation grant SBR-9319103. Reprint requests should be
sent to W. Prinzmetal, Department of Psychology, University of California, Berkeley, CA 94720-1650 or [email protected].
Figure CaptionsFigure 1. Tree diagram for simple illusory conjunction experiment.Figure 2. Sample stimuli from Experiment 1. Panels a and b are examples of the near condition, c and d are example ofthe far condition. The + marks the center of the monitor.Figure 3. Model for illusory conjunctions when observers respond to the target letter, target color and nontarget color.Only trials in which the observer correctly identified the target letter are included in this panel.Figure 4. Response palette used in Experiments 1 and 2. The observer responded by "clicking" the mouse on buttonslocated on the screen.Figure 5. Feature integration parameter, _, as a function of target and nontarget saturation.Figure 6. Proportion of CN, CT, and all other responses as a function of confidence. Note that each function sums to1.0.
Footnotes1. With 6 response categories and 5 parameters, it seems that a perfect fit of the data would be guaranteed regardless of thevalidity of the model. However, in our experiments there are always additional independent variables so that the numberof parameters is always much less that the number of data points. Furthermore, even in the simplest case, there areinternal constraints in the model so that a perfect fit is not guaranteed (see Riefer, Hu, & Batchelder (1994).2. This treatment of perceiving the target letter is slightly different from Prinzmetal et al. (1995) and Ashby et al, (1996).However, in our experiments, the parameter TL is always very high and consequently, this branch contributes little to theresults. By using the same structure for the TL and 1-TL branches, the representation is much simpler.3. There are several easily available methods for fitting the data to a multinomial model. See Dodson et al. (1998) for atutorial on a simple method for fitting multinomial data using the Solver function in Excel™. This method has theadvantage in that it is available on a wide variety of platforms. Xiangen Ho has a program for PCs that has a graphicinterface and is designed especially for this kind of model (Batchelder & Riefer, 1999). The program is available athttp://irwin.psyc.memphis.edu/gpt/.
4. The values of G2 were generally significant by a chi square test suggesting that models should be rejected. However,the number of observations per observer for the Nonrepeat and Repeat groups was 2304 and 1728, respectively, hence thepower exceeds .9999 (Buchner, Faul, & Erdfelder, 1996). In these circumstances, it is not unexpected to get a significant
G2 (Batchelder & Riefer, 1994).5. An alternative method to determine whether parameters differ is to fit each observers data with a reduced model. Forexample, a reduced model would assume that TLnear and Tlfar the same. If the reduced model is not significantly different
than the full model then it is assumed that the extra parameter is not needed. In our experiments, examining individualdata, or testing for consistency across observers led to the same conclusions.

27
CNCOCØ
CN
1-TL
Level I Level II Level III Level IV Level V
CT
αCT
CN
CT
NC
CTCNCOCØ
NC
TC
1-NC
1-NC
1-TC
TL
α
1-α
g1-α1-g
CTCOCØ
CN1-α
α
g
1-g
CT - IT
αCT - IT
CN-IN
CT - IT
NC
CT - ITCN - INCO - IOCØ - IØ
NC
TC
1-NC
1-NC
1-TC
α
1-α
CN - INCO - IOCØ - IØ
g1-α1-g
CN - IN
CT - ITCO - IOCØ - IO
CN - IN1-α
α
g
1-g
*
Prinzmetal, et al., Figure 1

28
O O
O OOT
OO OX
O O
T
XO
O
a
b
c
d
2 degs.
OOOO
OOOO
OOOO
OOOO
Figure 2

29
CTNCTOCTØCNTCNOCNØCOTCØTCONCØO
α CTN
CNT
CTT
CTT
CNTCOTCØT
CTTCNNCOOCØO
CNN
CTNCONCØN
CNN
CNTCNOCNØ
CTNCTOCTØ
NC
TC
1-NC
1-NC
1-TC
TL
1-TL
α
1-α
α
g
g
g
g
1-α
1-g
1-g
1-g
1-g
Level I Level II Level III Level IV Level V
NC
1-α
Figure 3

30
Target 'T'
Target 'X'
Nontarget color
Red YellowGreen Blue
Figure 4
0.8
0.85
0.9
0.95
NontargetSaturated
NontargetNot Saturated
TargetSaturated
Target Not Saturated
Figure 5

31
0
0.1
0.2
0.3
0.4
0.5
1 2 3 4 5 6 7 8 9Confidence
Other ResponsesCTCN
Figure 6