Software Quality Measurement
55
Software Quality Measurement
-
Upload
khangminh22 -
Category
Documents
-
view
4 -
download
0
Transcript of Software Quality Measurement

Software Quality Measurement
© Butler Cox pic 1990
Martin Langham
BE,PSoftware Quality Measurement
PEP Paper 14, May 1990by Martin Langham
Martin Langhamis a senior consultant with Butler Cox in London,where he coordinates the company☂s systems managementconsulting activities. He has broad experience in the planning,management, and implementation of technically advanced com-puting applications, with a particular emphasis on databasemanagement, distributed computing, and data communications.During his time with Butler Cox, he has carried out numerousconsulting assignments. Recent projects in which he has beeninvolved include formulation of an information systemsstrategyfor an electricity supply utility, assessment of the managementaspects of an insurance company☂s data communications network,and preparation of recommendationsfor an international chemicalcompanyon the changes required to improve andstandardise itsEuropean developmentactivities. He has also been extensivelyinvolved in productivity assessments for PEP members,andis theprincipal authorof the Butler Cox Foundation Report Managing theEvolution of Corporate Databases.Prior to joining Butler Cox, he spent 10 years with BIS ASL, wherehe managedconsulting businessin the area of distributed systems.Earlier, he worked as a consultant with both ICL and Unisys,supporting major customersin both the public and private sectors.Martin Langham hasa BScin physics from Bristol University andis a memberof the British Computer Society. He is a frequentspeakerat conferencesand has published widely in the tradepress.

Published by Butler Cox pleButler Cox House
12 Bloomsbury SquareLondon WC1A 2LL
England
Copyright © Butler Cox ple 1990All rights reserved. No part of this publication may be reproduced by any method
without the prior consent of Butler Cox.
Printed in Great Britain by Flexiprint Ltd., Lancing, Sussex.
Butler Cox ple 1990
aeSoftware Quality Measurement
PEP Paper 14, May 1990by Martin Langham
ContentsGetting the best from software quality measurement 1There is someresistance to software quality measurement 1Existing software quality measurement programmesare oftenlimited in scope 3Structure of the paper 5Research sources 7
Using measurementsto improve the development processand controlindividual projects 8Use measurements to improve the development process 8Use measurements to control individual projects 12Defining users☂ quality requirements in measurable terms 16Understandusers☂ quality requirements 16Compile an appropriate set of measures 17Set quality priorities for applications development 24Using measurementsto predict the quality of the finalapplication 27Set and measure quality conformancetargets 27Set and measure quality design targets 30Measure quality using validated empirical relationships 32Recognise the limitations of each approach 37Measuringthe quality of existing applications 38Create a user-oriented set of measures 38Store the informationin an easily accessible form 39Identify where the quality of existing applications couldbe improved 44Putting a software quality measurement programmein place 47
Bibliography 49

Chapter 1
Getting the best from software quality
Software quality measurementprovides essential management
information to the systemsdepartment
Much of the published material istoo academic to be suitable for
Butler Cox pic 1990
commercial use
measurement
Many systems departments have initiated software quality-assurance programmes to increase the effectiveness of appli-cations development. The majority of systems departmentsfind,however,that it is very difficult to direct such programmes andto justify their cost when thereis no quantitative evidenceof theirbenefits. The missing component of many software quality-assurance programmesis software quality measurement.
Software quality measurement enables the qualities of appli-cations, such asreliability, ease of use, maintainability, and soon, to be quantified in useful and consistent terms. Properlyimplemented, a measurement programmewill help the systemsdepartmentto specify and produceapplicationsof the quality thatusers require, to identify where improvements might be madetothe development process, and to justify the costs of a softwarequality-assurance programme. In effect, software qualitymeasurementprovidesessential managementinformation to thesystems department.
In practice, however, software quality measurement has met withmixed success. In many systems departments, there isconsiderable resistance to the concept, generally based onmisunderstandings about its purpose, its cost, and the level ofeffort required to introduce it. In others, where qualitymeasurement programmeshave been implemented, only limitedbenefits have been gained, because the scope of the programmeshas been too narrow.While there is a wealth of material availableon the subject of software quality measurement, muchofit is ofa very academic nature, not well suited to the commercialenvironment, and much of it is applicable only to particularaspects of applications development. What is required is apractical, consistent, and comprehensive approach to measuringsoftware quality that will ensure that both users and developersare satisfied with the applications that are delivered.
THERE IS SOME RESISTANCE TO SOFTWAREQUALITY MEASUREMENT
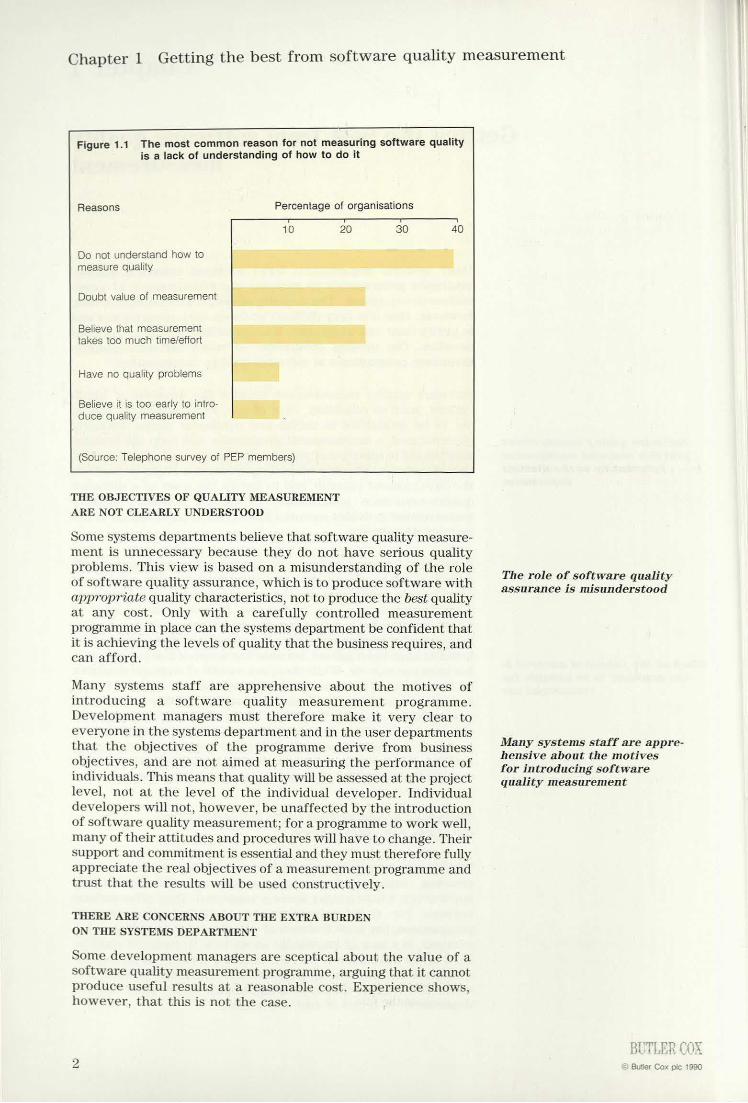
While interest in the subject of software quality measurementisgrowing, many systems departments are still developingapplications whose quality is never measured. They offer variousreasons for their reluctance to institute measurementprogrammes, the most commonof which, as shownin Figure 1.1overleaf, is a lack of knowledge about how to measure quality.Most of the others are based on misconceptionsaboutthe role ofquality measurementin the applications developmentprocess, andabout the burden that such programmes might place on thedepartment in terms of cost and effort.
Chapter 1 Getting the best from software quality measurement
Figure 1.1 The most commonreason for not measuring software qualityis a lack of understanding of how to doit
Reasons Percentage of organisations10 20 30 40
Do not understand how tomeasure quality
Doubt value of measurement
Believe that measurementtakes too muchtime/effort
Have no quality problems (jatess
Believe it is too early to intro-duce quality measurement
(Source: Telephone survey of PEP members) THE OBJECTIVES OF QUALITY MEASUREMENTARE NOT CLEARLY UNDERSTOODSome systems departments believe that software quality measure-ment is unnecessary because they do not haveserious qualityproblems. This view is based on a misunderstanding of the roleof software quality assurance, whichis to produce software withappropriate quality characteristics, not to produce the best qualityat any cost. Only with a carefully controlled measurementprogrammein place can the systems department be confident thatit is achieving the levels of quality that the business requires, andcan afford.Many systems staff are apprehensive about the motives ofintroducing a software quality measurement programme.Development managers must therefore make it very clear toeveryonein the systems departmentandin the user departmentsthat the objectives of the programme derive from businessobjectives, and are not aimed at measuring the performance ofindividuals. This means that quality will be assessed at the projectlevel, not at the level of the individual developer. Individualdevelopers will not, however, be unaffected by the introductionof software quality measurement; for a programmeto work well,manyof their attitudes and procedureswill have to change. Theirsupport and commitmentis essential and they must therefore fullyappreciate the real objectives of a measurement programme andtrust that the results will be used constructively.
THERE ARE CONCERNS ABOUT THE EXTRA BURDENON THE SYSTEMS DEPARTMENTSome development managersare sceptical about the value of asoftware quality measurement programme,arguing that it cannotproduce useful results at a reasonable cost. Experience shows,however, that this is not the case.
The role of software qualityassurance is misunderstood
Many systems staff are appre-hensive about the motivesfor introducing softwarequality measurement
©Butler Cox pic 1990
Chapter 1
Software quality measurementcan lead to significant cost
savings
It is important to start collectingmeasurement data as soon as
possible
At present, by far the greatestemphasis is given to measuring
qualities that are oflittleinterest to users
© Butler Cox ple 1990
Getting the best from software quality measurement
Gerald E Murine, the founder of METRIQS,the first specialistsoftware quality measurement company, claims that organisationsthat use his company☂s services have achieved considerable costsavings. In an article published in the November 1988edition ofQuality Progress, he quotes the results of the comparative analysisof data collected over a nine-year period on a project whosesoftware quality was measuredandsimilar projects whose qualitywas not measured.The total cost of the project, including the costof measuring software quality throughout the developmentproject, was reduced by 35 per cent. Most of the savings resultedfrom reductions in coding and module-testing effort. There werealso considerable improvements in the quality of the software.Evidence from PEP assessments confirms that the more ☁hard☂evidence developers have about the development process and theprojects in which they are involved, the better able they are tocontrol their work.A few PEP members believe that it is too early for them tointroduce quality measurement. It is important, however,to startcollecting measurement data as soon as possible so that systemsmanagers have a basis on which to plan future developments.Waiting until the development environment is stable is notjustified; if software quality measurementis to be of value in thelong term, it must be implemented in such a waythat it is stilluseful in a changing environment. Collecting the data requiredto measure software quality properly is not too onerous a task♥ useful benefits can be gained by spending the equivalent of1 or 2 per cent of development effort on gathering measurementdata. In many systems departments, muchofthe data will alreadybe available in a machine-readable form from systems used tomanage development resources, change requests, and thecorrection of software faults.
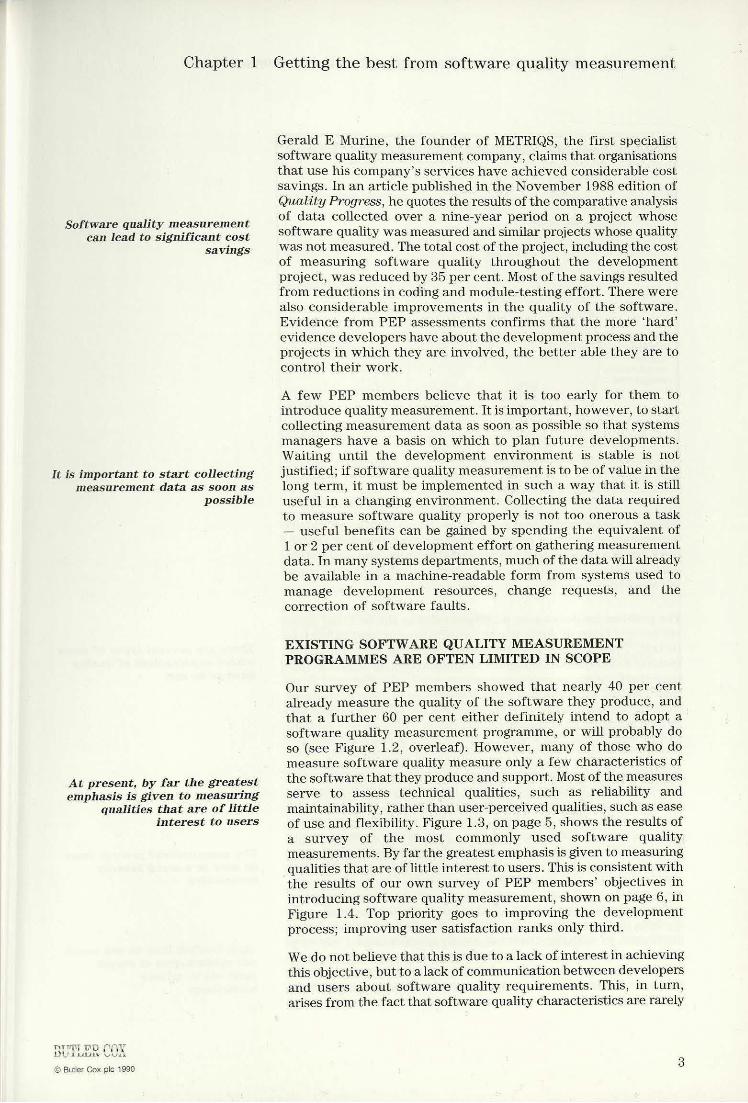
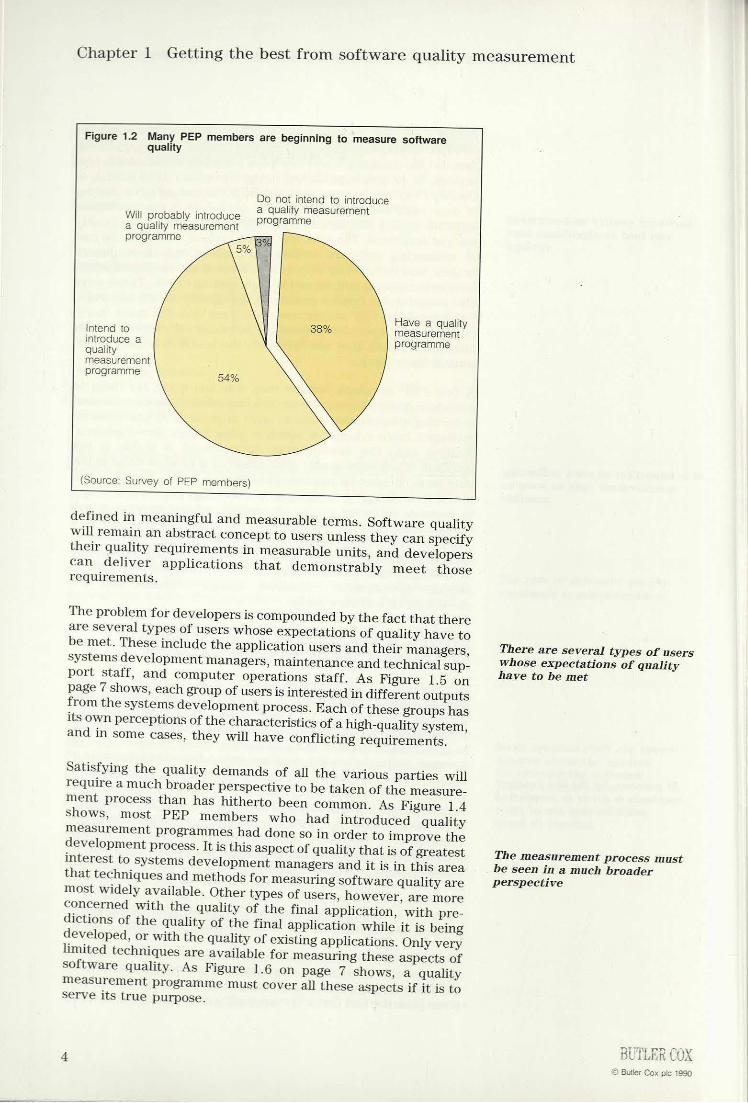
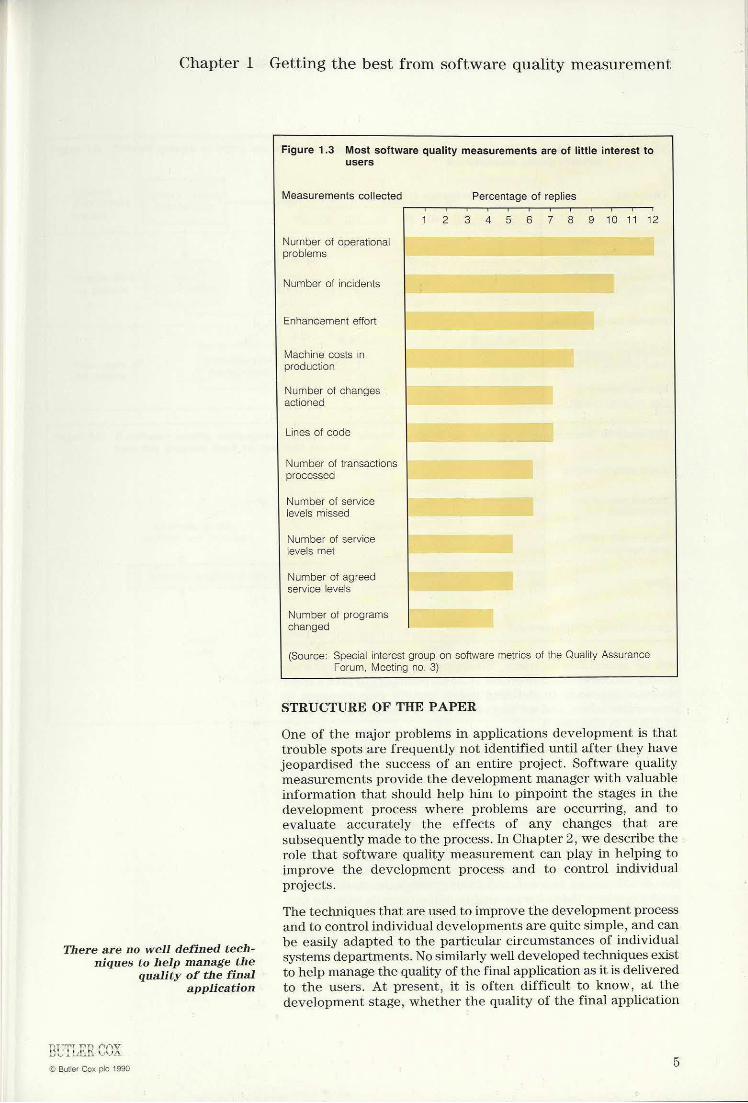
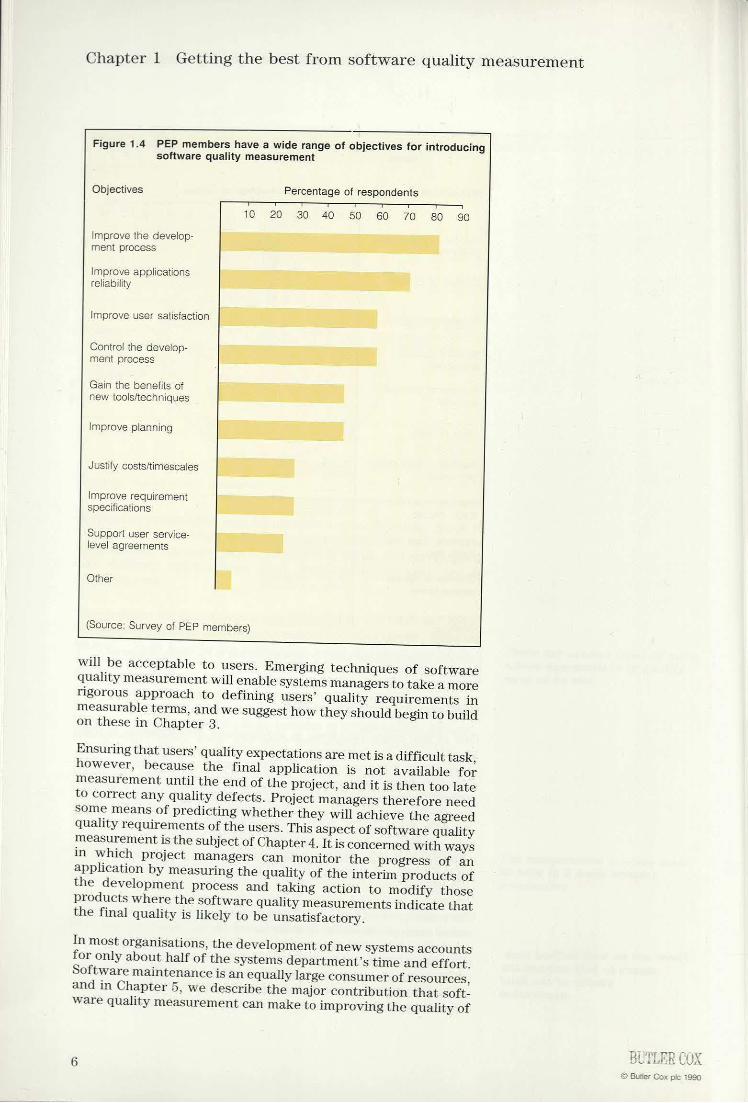
EXISTING SOFTWARE QUALITY MEASUREMENTPROGRAMMESARE OFTEN LIMITED IN SCOPEOur survey of PEP members showed that nearly 40 per centalready measure the quality of the software they produce, andthat a further 60 per cent either definitely intend to adopt asoftware quality measurement programme, or will probably doso (see Figure 1.2, overleaf). However, many of those who domeasure software quality measure only a few characteristics ofthe software that they produce and support. Most of the measuresserve to assess technical qualities, such as reliability andmaintainability, rather than user-perceived qualities, such as easeof use andflexibility. Figure 1.3, on page 5, showstheresults ofa survey of the most commonly used software qualitymeasurements. By far the greatest emphasisis given to measuringqualities that areoflittle interest to users. This is consistent withthe results of our own survey of PEP members☂ objectives inintroducing software quality measurement, shown on page6, inFigure 1.4. Top priority goes to improving the developmentprocess; improving user satisfaction ranksonly third.Wedonotbelieve that this is due to a lackof interest in achievingthis objective, but to a lack of communication between developersand users about software quality requirements. This, in turn,arises from the fact that software quality characteristics are rarely
Chapter 1 Getting the best from software quality measurement
Figure 1.2 Many PEP members are beginning to measure softwarequality
Do notintend to introduce: F a quality measurementWill probably introduce programmea@ quality measurementprogramme \ Have a qualityIntend to | Measurementintroduce a | programmequalitymeasurement\_programme \ (Source: Survey of PEP members)
defined in meaningful and measurable terms. Software qualitywill remain an abstract conceptto users unless they can specifytheir quality requirements in measurable units, and developerscan deliver applications that demonstrably meet thoserequirements.
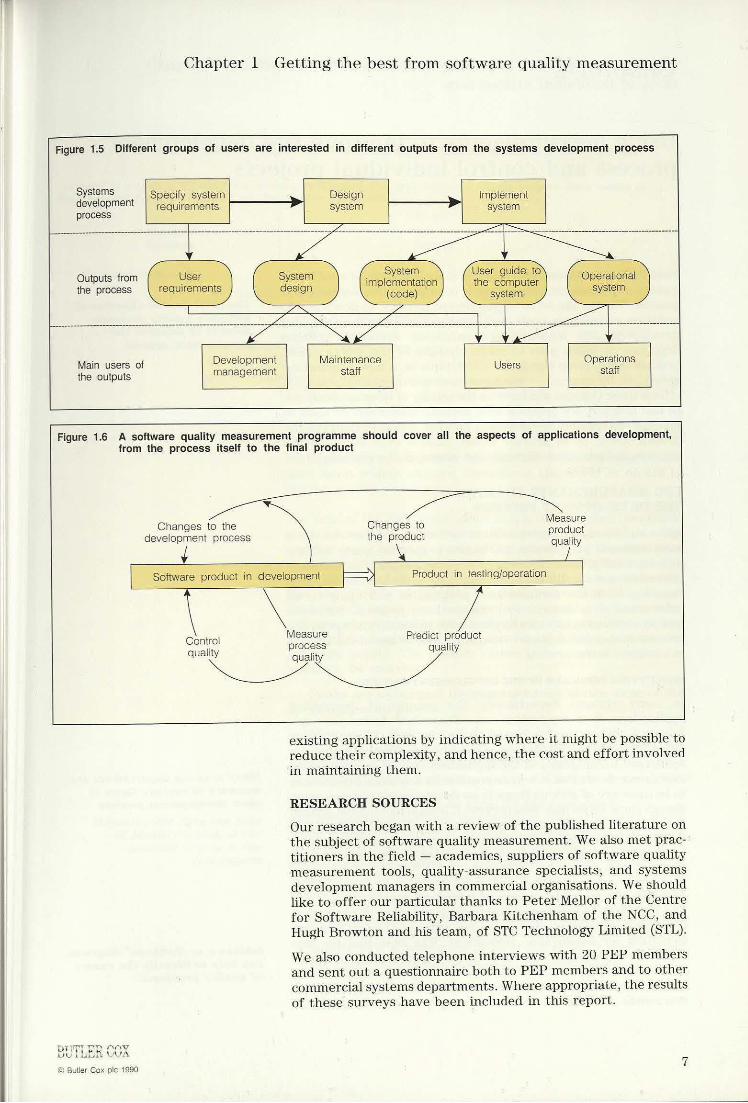
Theproblem for developers is compounded by the fact that thereare several types of users whose expectations of quality have tobe met. These include the application users and their managers,systems development managers, maintenance and technical sup-port staff, and computer operations staff. As Figure 1.5 onpage 7 shows, each groupofusers is interested in different outputsfrom the systems developmentprocess. Each of these groups hasits own perceptionsof the characteristics of a high-quality system,and in somecases, they will have conflicting requirements.Satisfying the quality demands of all the various parties willrequire a much broader perspective to be taken of the measure-ment process than has hitherto been common. As Figure 1.4shows, most PEP members who had
_
introduced qualitymeasurement programmes had doneso in order to improve thedevelopmentprocess.It is this aspect of quality thatis of greatestinterest to systems development managers anditis in this areathat techniques and methods for measuring software quality aremost widely available. Other types of users, however, are moreconcerned with the quality of the final application, with pre-dictions of the quality of the final application while it is beingdeveloped, or with the quality of existing applications. Only verylimited techniques are available for measuring these aspects ofsoftware quality. As Figure 1.6 on page 7 shows, a qualitymeasurement programme must coverall these aspectsif it is toserve its true purpose.
There are several types of userswhose expectations of qualityhave to be met
The measurementprocess mustbe seen in a much broaderperspective
© Butler Cox pic 1990
Chapter 1 Getting the best from software quality measurement
There are no well defined tech-niques to help manage the
© Butler Cox pic 1990
quality of the finalapplication
Figure 1.3. Most software quality measurementsareoflittle interest to
users
Measurementscollected Percentage of replies
12S TES Ce SOOma2Numberof operationalproblems
Numberofincidents
Enhancementeffort
Machinecostsinproduction
Numberof changesactioned
Lines of code
NumberoftransactionsprocessedNumberof servicelevels missedNumberof servicelevels metNumberof agreedservice levelsNumberof programschanged
(Source: Special interest group on software metrics of the Quality AssuranceForum, Meeting no. 3)
STRUCTURE OF THE PAPEROne of the major problemsin applications developmentis thattrouble spots are frequently not identified until after they havejeopardised the success of an entire project. Software qualitymeasurements provide the development manager with valuableinformation that should help him to pinpoint the stages in thedevelopment process where problems are occurring, and toevaluate accurately the effects of any changes that aresubsequently madeto the process. In Chapter 2, we describe therole that software quality measurement can play in helping toimprove the development process and to control individualprojects.The techniquesthat are used to improve the development processand to control individual developmentsare quite simple, and canbe easily adapted to the particular circumstances of individualsystems departments. No similarly well developed techniquesexistto help manage the quality of the final applicationas it is deliveredto the users. At present, it is often difficult to know, at thedevelopment stage, whether the quality of the final application
Chapter 1 Getting the best from software quality measurement
Figure 1.4 PEP members have a wide rangeof objectives for introducingsoftware quality measurement
Objectives Percentage of respondents
10 20 30 40 50 60 70 80 9g0Improve the develop-ment processImprove applicationsreliability
Improveusersatisfaction
Control the develop-ment processGain the benefits ofnew tools/techniques
Improve planning
Justify costs/timescales
Improve requirementspecificationsSupport user service-level agreements
Other
(Source: Survey of PEP members)
will be acceptable to users. Emerging techniques of softwarequality measurement will enable systems managersto take a morerigorous approach to defining users☂ quality requirements inmeasurable terms, and we suggest how they should begin to buildon these in Chapter 3.Ensuring that users☂ quality expectations are metis a difficult task,however, because the final application is not available formeasurement until the end of the project, andit is then too lateto correct any quality defects. Project managers therefore needSome meansof predicting whether they will achieve the agreedquality requirements ofthe users. This aspect of software qualitymeasurementis the subject of Chapter 4.It is concerned with waysin which project managers can monitor the progress of anapplication by measuring the quality of the interim products ofthe development process and taking action to modify thoseproducts where the software quality measurementsindicate thatthe final quality is likely to be unsatisfactory.In most organisations, the development of new systems accountsfor only about half of the systems department☂s time andeffort.Software maintenance is an equally large consumerof resources,and in Chapter 5, we describe the major contribution that soft-ware quality measurement can maketo improving the quality of
6© Butler Cox ple 1990
Chapter 1 Getting the best from software quality measurement
Figure 1.5 Different groups of users are interested in different outputs from the systems development process
Systems Ss an ☁Desipecify system Design ♥development
|
requirements > systemprocess EC
Outputs fromthe process
Main users of Development Maintenance eer Operationsthe outputs management staff staff
Figure 1.6 A software quality measurement programme should cover all the aspects of applications development,
from the processitself to the final product
MeasureChanges tothe product product\ ke
Product in testing/operation
Changes to thedevelopment process
Measure Predict productC | produconitte process qualityTeMate
existing applications by indicating where it might be possible toreduce their complexity, and hence,the cost and effort involvedin maintaining them.
RESEARCH SOURCESOur research began with a review of the published literature onthe subject of software quality measurement. Wealso met prac-titioners in the field ♥ academics, suppliers of software qualitymeasurement tools, quality-assurance specialists, and systemsdevelopment managers in commercial organisations. We shouldlike to offer our particular thanks to Peter Mellor of the Centrefor Software Reliability, Barbara Kitchenham of the NCC, andHugh Browton and his team, of STC Technology Limited (STL).Wealso conducted telephone interviews with 20 PEP membersand sent out a questionnaire both to PEP membersandto othercommercial systems departments. Where appropriate, the resultsof these surveys have been includedin this report.
© Butler Cox ple 1990 %
Chapter 2
Using measurements to improve the developmentprocess and control individual projects
Most PEP membersbelieve that the main objective of a softwarequality measurement programmeis to improve the developmentprocess. We use the term ☁developmentprocess☂ to describe themethods, techniques, tools, and organisational practices used fordeveloping and maintaining application systems. Systemsdepartments often plan to make changes to the developmentprocess ♥ adopting the latest CASE tools or a new applicationgenerator, for example ♥ but have no meansof establishing whateffects these changes will have on the quality of their applications.In this chapter, we describe how measurements can be used tomanage the systems developmentprocess, either to improve theprocess itself, or to provide better control over developmentprojects as they move through the stages of the process.
USE MEASUREMENTS TO IMPROVETHE DEVELOPMENT PROCESSQuite rightly, systems departments often choose first to use ameasurement programme to improve specific parts of thedevelopmentprocess. Starting in this way meansthat the data-collection task can be kept to a minimum and that any benefitsresulting from the measurement programme will apply to allsubsequent development and maintenance projects. Softwarequality measurements can be used both to identify areas in theprocess where problemsare occurring, and to assess the effectsof changes to the process.IDENTIFYING PROBLEMSIN THE DEVELOPMENT PROCESSIn many systems departments, the process of developingapplications is a mysterious art. Prescribed techniques arefollowed without question, and there is no way of quantifyingeither the positive contribution or the adverseeffects of particulartechniques to the quality of the application. Indeed, our consultingexperience showsthatit is quite possible for a systems departmentto be unawareofseriousflawsin its development process, eventhough these flaws may well preventit from achieving the qualityand productivity objectives that it has set. This problem can betackled in twostages: identifying the possible causes of a qualityproblem, and then applying the measures to identify the rootcause.Identify the possible causes of a lack of qualityThefirst stage is to obtain a full understanding of the area thatis causing concern so that possible causes of the problem areidentified for subsequent assessment. The best tool for thistask is an Ishikawaor ☁fishbone☂ diagram, an example of whichis shown in Figure 2.1. This type of diagram was inventedby Dr KaoruIshikawain 1952 to control processes in the Kawasakiiron works in Japan. (Dr Ishikawa is now recognised as Japan☂s
The most quoted objective ofsoftware quality measure-ment is to improve thedevelopment process
Many systems departments areunawareof serious flaws intheir development process
Ishikawa or ☁fishbone☂ diagramscan help to identify the causesof quality problems
jutier Cox pic 1990
Chapter 2 Using measurements to improve the development processand control individual projects
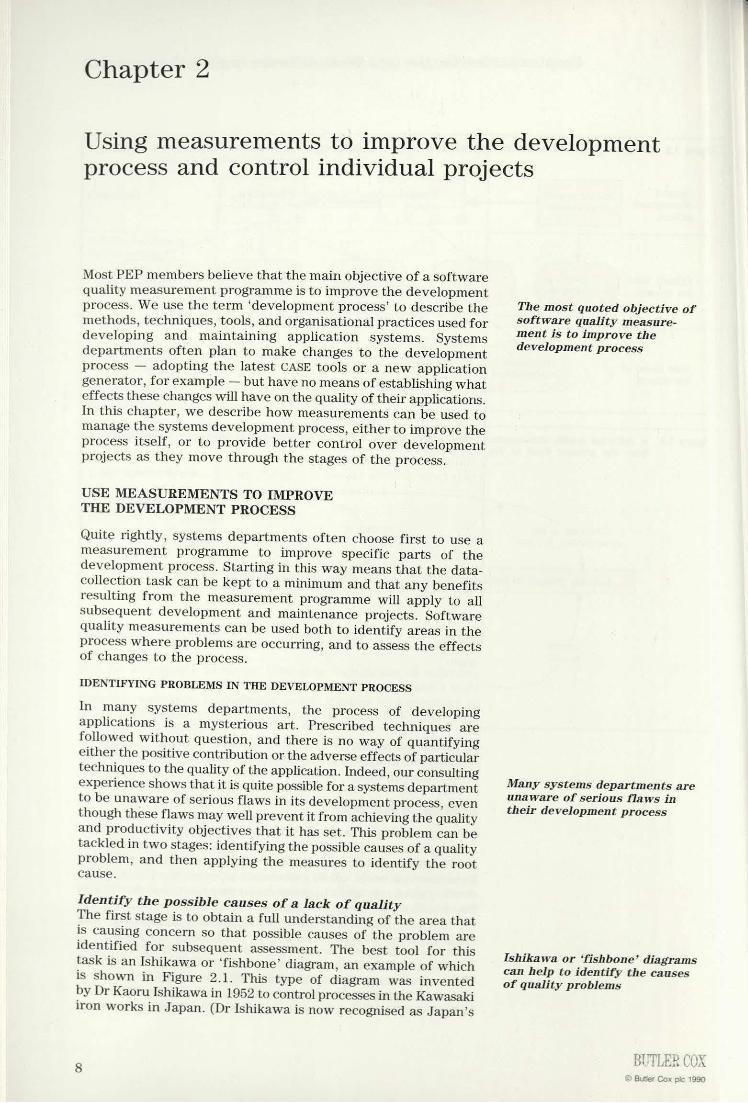
Figure 2.1 An Ishikawa or ☁fishbone☂ diagram can help to identify the possible causes of a quality problem
The ☁head☂ of the fish is the effect that is being investigated. The large ☁fishbones☂ are the possible major causes ofthat effect, and the small ☁fishbones☂ are the possible sub-causes.
External Poorinfluences methods
Many user changes Poortesting of releasesExcessive time pressure
Poor development methods Applicationsare unreliable
Use of low-level language Untrained users
Lack oftest tools Unskilled developers
Poor tools People problems
leading authority on quality control.) The Ishikawa diagram hassince been widely adopted throughout the world as an aid tosolving quality problems.The head of the☁fish☂ is the effect that is being studied (unreliableapplications, in our example). The large ☁fishbones☂ are thepossible major types of causesof that effect ♥ for example, poortools or methods, people problems, or external influences. Thesmall ☁fishbones☂are, in turn, the possible sub-causes, and so on.The objective is to identify the truly important causes, andfishbone diagrams are therefore often used in brainstormingsessions wherepossible causes of poor quality are discussed andanalysed, and subsequently explored further using measures ofsoftware quality. The possible causes to be explored might, forinstance, be that:♥ Faults are introduced disproportionately in one stage of the
development process.♥ Most of the faults are of one type.♥ Changes requested by users during development cause many
of the faults.Use measurementdata to identify the root cause
Measurement data can help The secondstage is to use measurement data to identify whichto identify which of the of the possible causesof the problemis the real culprit. Each cause
possible causesis the to be investigated will need a carefully designed ☁experiment☂toreal culprit collect data and analyse it. Two points are very important in
ensuring that the investigation producesa result that managementcan rely on:♥ Sufficient data should be collected and analysed to produce
statistically significant results. A description of ☁statisticalsignificance☂is beyond the scopeof this paper. A useful primeronstatistical analysisis listed in the bibliography.
♥ The conditions under which the data is collected should notchange.
© Butler Cox ple 1990 9

Chapter 2 Using measurements to improve the development processand control individual projects
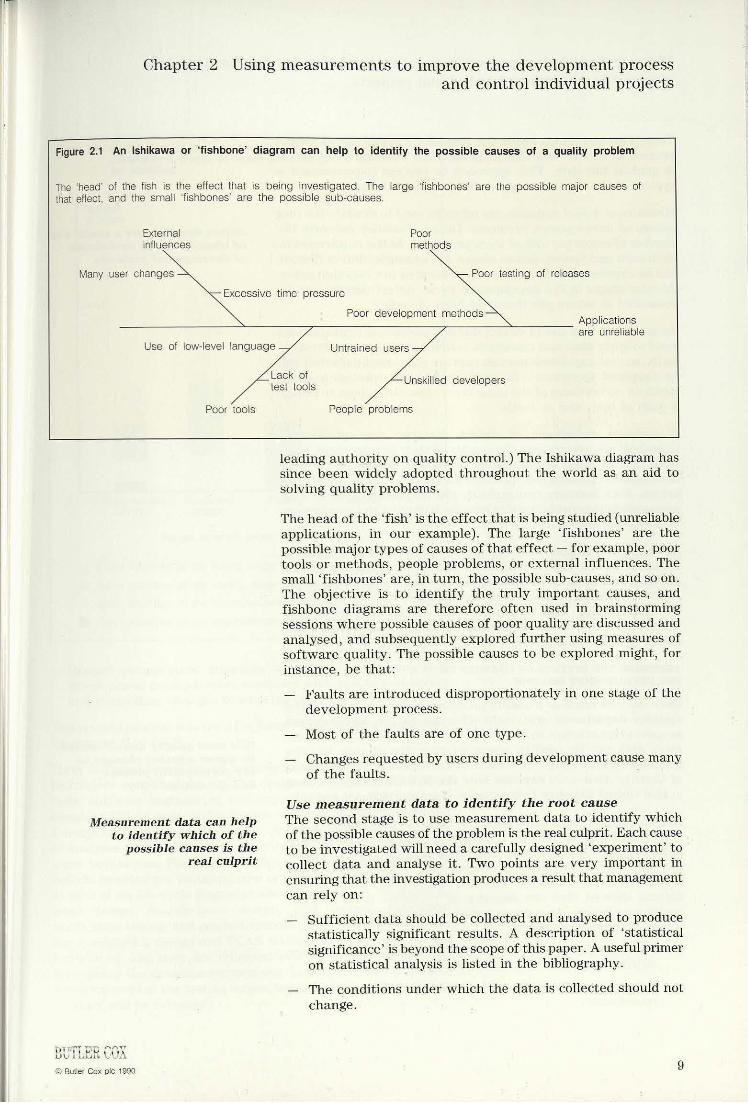
These two conditions imply the need for a stable developmentprocess in which each changeis carefully considered. Progressis gradual but sure. This approach to process improvement istypical of the Japanese approach to quality management.Measuresof defect densities can often be used to identify the rootcauses of development problems. Defect densities measure thenumberoferrors per unit of work produced. At the requirements-definition and system-design stages, for example, defect densitycan be expressedaserrors per page of text or per function point.At later stages in the developmentcycle, defect density can bemeasured as errors per thousand lines of code.To makethe best use of defect density measures, organisationsneedto apply clear and consistent definitions of the measurementunits, so that any developer can capture consistent data that canbe compared. Questions to be considered include whetherto countmultiple occurrencesof the sameerror separately, how to definea page of text, and so forth.If common definitions of defect densities are established,organisations can compare the quality of their development workwith that of other organisations to identify the areas of theirdevelopmentprocess that produce an above-average numberoferrors. Such industry comparisons are frequently used in PEPassessments to provideinsights into the strengths and weaknessesof a PEP member☂s development process.Figure 2.2 is a diagram that was used to analyse the developmentstages at which errors originated and were identified in onedevelopment project. About half of the errors originating at thefunctional-design stage did not, for example, cometo light untilthe testing stage. This type of analysis can be used to identifywhere inspections and walkthroughsare (and are not) an effectivemeans of improving quality.ASSESSING THE EFFECTS OF CHANGES TOTHE DEVELOPMENT PROCESSOncethe root cause of a quality problem has been identified, thesystems department will make changes to the developmentprocess in an attempt to resolve the problem. Quality measure-ment data can be used to assess whether the change has theintended effect. A paper publishedin the September1988 editionof Quality Assurance explains how the IBM CICS support teamat IBM United Kingdom Laboratories, Hursley Park, did just this.IBM recognisedthe needto set levels for software reliability anddefects such that customers would perceive the softwareas beingof high quality. The companyalso recognised the need to defineformally the development processes that would enable theseobjectives to be achieved. Analysis of the root causes of thedefects showed that the majority of problems resulted frominadequate design. As a consequence, three changes were madeto the development process:♥ Extensive use was madeof a high-level language (PLAS) forwriting new code.♥ A formal specification and design language (Z notation) wasintroduced.
10
Defect densities are a useful wayof identifying the root causesof development problems
IBM used quality measurementsto assess whether changes tothe development processhad the desired effect
© Butler Cox pic 1990
Chapter 2. Using measurements to improve the development processand control individual projects
Figure 2.2 Software measurements can be used to analyse thedevelopment stages at which errors originate and
are identified
Numberof errors
La ERequirements Functional Coding Testing
definition design
Stages at which errors originated
Errors identified at the testing stage©) Errors identified at the coding stage
Errors identified at the functional-design stageIM Errors identified at the requirements-definition stage
♥ Greater management attention was given to ensuring thatdevelopment methods were complied with, and to monitoringand controlling changes to existing code.
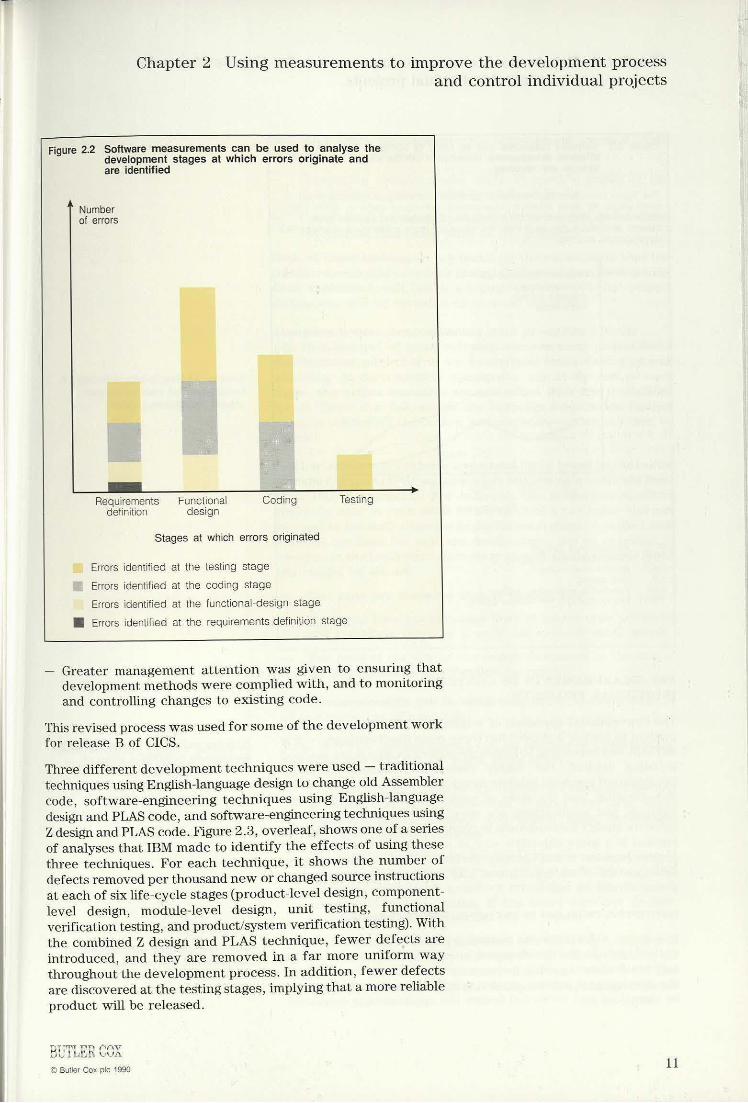
This revised process wasused for some of the development workfor release B of CICS.Three different development techniques were used ♥ traditionaltechniques using English-language design to change old Assemblercode, software-engineering techniques using English-languagedesign and PLAScode, and software-engineering techniques usingZ design and PLAScode.Figure 2.3, overleaf, shows one of aseriesof analyses that IBM madeto identify the effects of using thesethree techniques. For each technique, it shows the number ofdefects removed per thousand new or changed source instructionsat each ofsix life-cycle stages (product-level design, component-level design, module-level design, unit testing, functionalverification testing, and product/system verification testing). Withthe combined Z design and PLAS technique, fewer defects areintroduced, and they are removed in a far more uniform waythroughout the developmentprocess.In addition, fewerdefectsare discoveredat thetesting stages, implying that a morereliableproduct will be released.
© Butler Cox ple 1990 4
Chapter 2 Using measurements to improve the development processand control individual projects
Figure 2.3 Software measures can be used to compare the effects ofdifferent development techniques on the stages at whichdefects are removed
The figure compares the number of problems removed at each .develop-cea dace: foree different development techniques used by IBM's CICSsupport team. With one of the techniques (Z design and PLAS), fewerdefects are introduced, and they are removed more uniformly throughout thedevelopment process.
Problems removed perthousand new orchanged sourceinstructions25
, Assemblercay20 fi *
15
T T T TPLD CLD MLD UT FVT P/SVT
Development stage
PLD Product-level designCLD Component-level designMLD Module-level designUT. Unit testingFVT _Functional verification testingP/SVT Product/system verification testing (Source: Quality Assurance, vol. 14, no. 3, September 1988)
USE MEASUREMENTS TO CONTROLINDIVIDUAL PROJECTSThe conventional approach of relying solely on a developmentmethodto control a project has three main disadvantages ♥ it isdifficult and expensive to assess the extent to which the methodis being applied, the highly prescriptive nature of manydevelopment methodsinhibits developers☂ initiative and can bedemotivating, and the risks of project failure are high unlessmethods and applications are very carefully matched. Usingsoftware quality measurementin conjunction with a developmentmethod is a more objective way of assessing the progress of aproject because it can identify problems that occur during thedevelopment of an application, and indicate where correctiveaction should be taken.IDENTIFYING PROBLEMS IN THE DEVELOPMENT PROJECTIn essence, a development method is concerned with the qualityof the inputs to the development process, not the quality of theoutputs. Software quality measurements assess the outputs fromthe developmentprocess, so that potential quality problems canbe identified and corrected before the application is delivered,
Relying solely on a developmentmethodto control a projecthas disadvantages
Software quality measurementscomplement the develop-ment approach
© Butler Cox pic 1990
Chapter 2 Using measurements to improve the development process
At suitable checkpoints, actualmeasures can be compared
with predefined limits
Some software quality measurescan be monitored continuously
Butler Cox pic 1990
and control individual projects
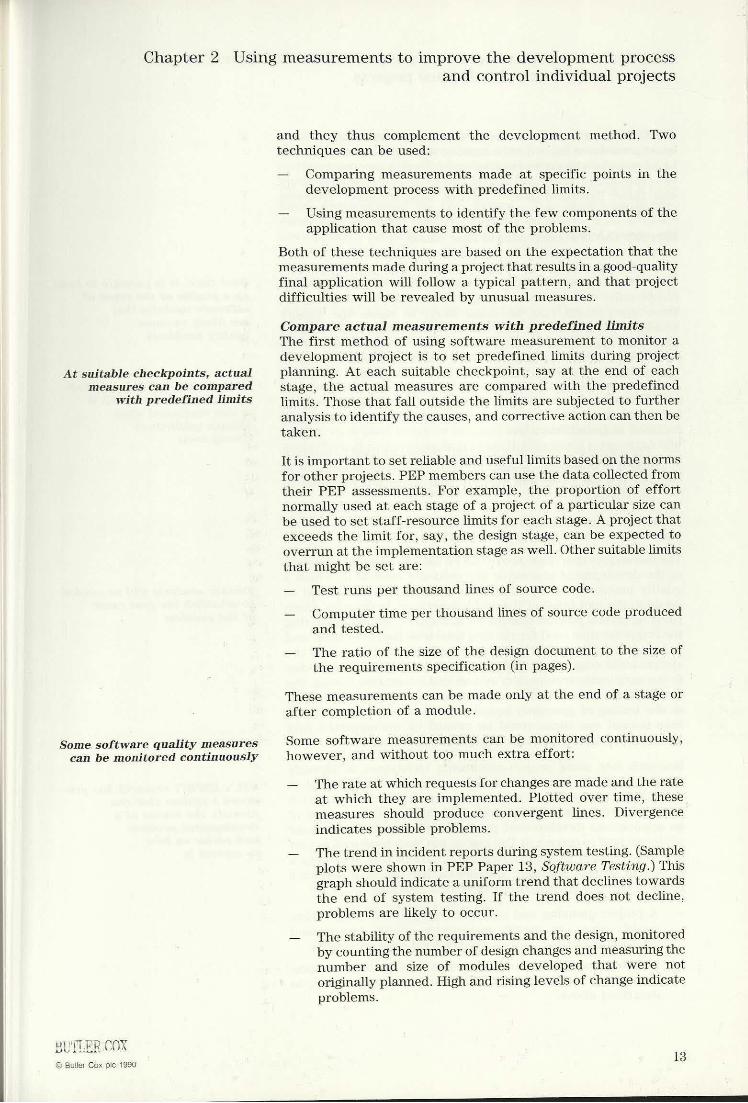
and they thus complement the development method. Twotechniques can be used:♥ Comparing measurements made at specific points in the
development process with predefinedlimits.♥ Using measurements to identify the few components of the
application that cause most of the problems.Both of these techniques are based on the expectation that themeasurements madeduring a project that results in a good-qualityfinal application will follow a typical pattern, and that projectdifficulties will be revealed by unusual measures.Compare actual measurements with predefined limitsThe first method of using software measurement to monitor adevelopment project is to set predefined limits during projectplanning. At each suitable checkpoint, say at the end of eachstage, the actual measures are compared with the predefinedlimits. Those that fall outside the limits are subjected to furtheranalysis to identify the causes, and corrective action can then betaken.It is importantto set reliable and usefullimits based on the normsfor other projects. PEP memberscan use the data collected fromtheir PEP assessments. For example, the proportion of effortnormally used at each stage of a project of a particular size canbe used to set staff-resource limits for each stage. A project thatexceeds the limit for, say, the design stage, can be expected tooverrun at the implementation stage as well. Other suitable limitsthat might be set are:♥ Test runs per thousandlines of source code.♥ Computer time per thousandlines of source code produced
and tested.♥ Theratio of the size of the design documentto the size of
the requirements specification (in pages).
These measurements can be made only at the end of a stage orafter completion of a module.Some software measurements can be monitored continuously,however, and without too muchextra effort:♥ The rate at which requests for changes are madeandtherate
at which they are implemented. Plotted over time, thesemeasures should produce convergent lines. Divergenceindicates possible problems.
♥ The trend inincidentreports during system testing. (Sampleplots were shown in PEP Paper 13, Software Testing.) Thisgraph should indicate a uniform trend that declines towardsthe end of system testing. If the trend does not decline,problemsare likely to occur.
♥ Thestability of the requirements and the design, monitoredby counting the numberof design changes and measuringthenumber and size of modules developed that were notoriginally planned. High andrising levels of change indicateproblems.
13
Chapter 2 Using measurements to improve the development processand control individual projects
In PEP Paper 13, we described how past experience can beusedto set predefined limits for the numberoferrors that can typicallybe expected at the system-testing stage. Testing progress can thenbe continuously monitored againstthis limit. This type of measureand those described above can be used to make frequentassessments of the ☁health☂ of a project.Identify the few components that causemost of the problemsIt is often the case that most of the quality problems of anapplication are caused by a small number of the softwarecomponents. The ability to identify, at the developmentstage,those components that are most likely to cause the qualityproblems will makeit possible for corrective action to be takenbefore the application is delivered. Overtime,it is possible to buildup a profile of the types of software modulesthat are likely tocause quality problems. Two useful measures to start with are:♥ The ratio of actual modulesizes to their expected sizes. Highratios may indicate modules that are too big to be developed
and tested efficiently.♥ The amountof computerand staff resources used to produceand test a module. A high level of resources in relation tothe module☂s size will indicate that there are problems indevelopingit.USING THE MEASUREMENTSTO INDICATE WHERECORRECTIVE ACTION SHOULD BE TAKENThe techniques described above can be used to pinpoint the stageof the development process or the software module in which aquality problem originates. Further analysis will be needed toestablish the root cause of the problem because,in practice, therecould be several possible reasonsforit. Suppose, for example, thatthe computer time used for runningtestsis plotted over time, andis found to fall outside the predefined limits at the end of thesystem-build stage. Higher-than-normal run times could be dueto the early commencementof system and integration testing, thedevelopment of code witha higher-than-usual numberof errors,or the testing of processor-bound algorithms. Likewise, lower-than-normal run times could be caused by uncompleted unittesting or by the discovery of easy-to-detect errors.Research into using project-monitoring techniques to identifyquality problems has been carried out in an ESPRIT project(REQUEST)led by STL(asister company of ICL). This researchhas produceda system that is able both to identify the cause ofan applications development problem and to provide relevantadvice on how tocorrectit. The system has been produced as partof an automated quality-management system that will help aquality or project manager throughout the life of a softwareproject. The quality-management system provides:♥ A project-planning andinitiation subsystem to help createquality plans, to specify measurable quality targets andrequired measures, and to predict final product quality.♥ A project-monitoring subsystem that uses quality measure-ment data to advise on project status in quality terms, asdescribed above.
14
Overtime, it is possible to buildup a profile of the types ofsoftware modules thatare likely to causequality problems
Further analysis will be neededto establish the root causeof the problem
STL☂s ESPRITresearch has pro-duced a system that canidentify the causes of adevelopment problemand advise on howto correctit
Butler Cox pic 1990

Chapter 2 Using measurements to improve the development process
Software quality measurementis likely to play an increas-
ingly important role in
Butler Cox ple 1990
controlling applica-tions quality
and control individual projects
♥ A project-assessment subsystem that reports on the finalproduct quality achieved and on expected maintenance andsupport costs implied by the level of quality achieved.
The prototypeof this system runs under Unix and parts of it havebeen demonstrated to the author. The project-monitoringsubsystem has been used successfully on several STC softwaredevelopment projects. We expect that this type of system willbecome commercially available by 1992/93.
In this chapter, we have described how software quality measure-ment can be used to improve the development process and tocontrol individual development projects. The techniques aresimple, well understood, and easily adaptable to the particularcircumstancesof individual systems departments. Unfortunately,nosimilarly well developed measurement techniques are currentlyavailable to help manage the quality of the final application asit is delivered to the users. In the future, software measurementis likely to play an increasingly important role in controllingapplications quality, just as the measurementof elapsed time andresources is used today to monitor and control project durationandeffort. It is therefore important that systems managers beginto build on the emerging techniquesthatare available. In the nextchapter, we offer guidelines on how they should dothis, to ensurethat they deliver applications that meet their users☂ qualityexpectations.
15

Chapter 3
Defining users☂ quality requirements inmeasurable terms
In this chapter, we show how software quality measurements canbe used to help managefinal applications quality so that users☂expectations are met. There are three stages in managing thequality of the final application: understanding the users☂ qualityrequirements, identifying an appropriate set of measures, andsetting quality priorities for applications developmentin terms ofthose measures.
UNDERSTAND USERS☂ QUALITY REQUIREMENTSSystems departments often state that they could producebetter-quality applications if their users gave them more time. On theother hand, users often do not understand why so muchdevelopmenteffort is spent on work that does not appear to bedirectly related to their requirements. The result is that neitherusersnor developers are satisfied with the quality of the deliveredapplications.We believe that this problem arises because it is difficult fordevelopers and users to communicate with each other about thequality requirements of applications software. In turn, thisdifficulty stems from the fact that software quality characteristicsare not usually defined in useful and measurable terms.Applications software quality will remain an abstract concept tousers unless they can specify their quality requirements inmeasurable units, and developers can deliver applications thatdemonstrably meet those requirements.Thefirst stage in managing the quality of an application as it isdelivered to the users is therefore to understand the qualityrequirements of its users. The classic definition of quality is☁fitness for purpose☂ and this means that different types ofapplications, and applications used by different types of users,will have different quality ☁profiles☂. Producing applications withan inappropriate quality profile wastes resources and does littleto satisfy users.There are several obstacles to be overcome before the systemsdepartment can be certain that it has identified the importantcriteria by which users will judge the quality of an application.In particular, users often cannot express their quality require-ments in terms meaningful to development staff. The systemsdepartment must therefore define quality characteristics in termsthat enable users to understand both how the characteristics aremeasuredand whatthe implications of poorandhigh quality are.Another problem arises from the fact that there are often conflictsbetween the quality requirements of different groups of users.As we emphasised in Chapter 1, the systems department must beable to reconcile the often conflicting quality needs of the variousgroups.
16
Software quality characteristicsare not usually defined in use-ful and measurable terms
The first stage is to understandthe quality requirementsof users
« Cox pic 1990
Chapter 3 Defining users☂ quality requirements in measurable terms
Users find it easier to specifyquality requirements withreference to applicationsthey use than to abstract
specifications
Quality measures must bederived from the businessobjectives of the software
quality measurementprogramme
© Butler Cox ple 1990
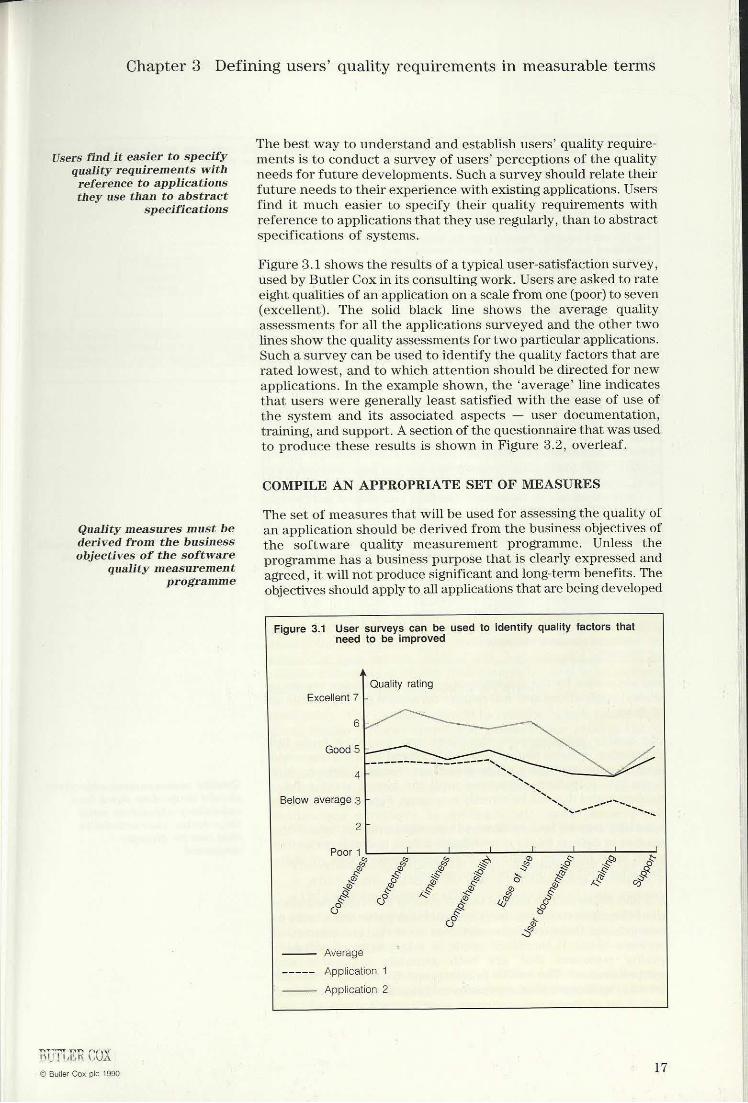
The best way to understandand establish users☂ quality require-mentsis to conduct a survey of users☂ perceptions of the qualityneedsfor future developments. Such a survey should relate theirfuture needsto their experience with existing applications. Usersfind it much easier to specify their quality requirements withreference to applications that they use regularly, than to abstractspecifications of systems.Figure 3.1 showstheresults of a typical user-satisfaction survey,used by Butler Coxin its consulting work. Users are asked to rateeight qualities of an application on a scale from one (poor) to seven(excellent). The solid black line shows the average qualityassessmentsforall the applications surveyed and the other twolines show the quality assessments for two particular applications.Such a survey can be used to identify the quality factors that arerated lowest, and to which attention should be directed for newapplications. In the example shown,the ☁average☂line indicatesthat users were generally least satisfied with the ease of use ofthe system and its associated aspects ♥ user documentation,training, and support. A section of the questionnaire that was usedto produce these results is shown in Figure 3.2, overleaf.
COMPILE AN APPROPRIATE SET OF MEASURESTheset of measuresthat will be used for assessing the quality ofan application should be derived from the business objectives ofthe software quality measurement programme. Unless theprogrammehasa business purposethat is clearly expressed andagreed,it will not produce significant and long-term benefits. Theobjectives should apply to all applications that are being developed Figure 3.1 User surveys can be usedto identify quality factors that
need to be improved
Quality ratingExcellent 7
De}
Averagea Application 1 Application 2
17

Chapter 3 Defining users☂ quality requirements in measurable terms
Figure 3.2 User survey questionnaires serve as the basis for identifying
where quality needs to be improved
Whatis your opinion of the existing systems applications that you use?The attachedlist contains the most important systems applications. Please selectfrom that list up to three applications that are the most important for you andthat you use frequently. Please answerthe following questions for each of theapplications selected by entering a score between 1 and into the threecolumns of boxes (leave boxes blank which do not apply to you).
insufficient poor good excellent1 2 3 4 5 6 /
completely not very important essentialirrelevant important
First Second Thirdapplication application application
3.1 Two-digit code for the application(see attachedlist)
3.2 How importantis this applicationfor your work?
3.3 Howsatisfied are you with thisapplication?
3.4 How doyouassessthis applicationconcerning:♥ Completenessof results?♥ Correctness ofresults?♥ Timeliness of results?♥ Clarity of results?♥ Ease of use?♥ User manual?♥ Training facilities?♥ Support available from systems
staff? Oooooo0o0o
aof
noOoo00o00
oof
Dooooooo
aof
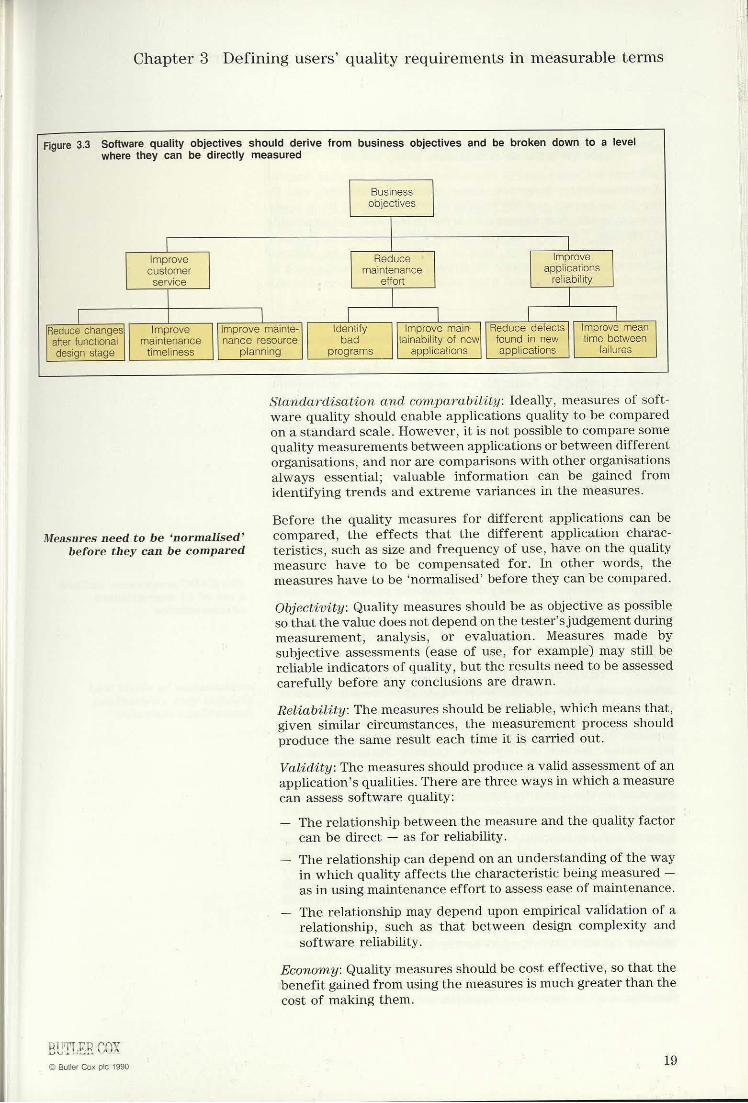
and supported by the department ♥ most users have access toseveral applications and will require consistent quality acrossallof them.The quality measurement objectives may be taken from theinformation systemsplan or separately agreed with the users andsystems managers. Each of the objectives should then be brokendown into subsidiary objectives until the lowest level definescharacteristics that can be directly measured. Figure 3.3illustratesthis process. Thus, the objective of improving applicationsreliability may be broken downin two objectives: to reduce thenumberof defects found in new applications, and to improve themean time between failures of an application. Both of thesecharacteristics can be directly measured.It is also important to ensure that the set of measures describesall of the characteristics that the systems department wishes tomeasure, and that there is the minimum ofoverlap andinteractionbetween them. It therefore needs to select a set of softwarequality measures that are both generally applicable andcomprehensive. The NCC publication, Measuring SoftwareQuality, by Richard Watts, provides useful guidelines for selectingsuch a set of measures, under six headings:
18
Quality measurement objectivesshould be broken down intosubsidiary objectives untilthey define characteristicsthat can be directlymeasured
© Butler Cox pic 1990
Chapter 3 Defining users☂ quality requirements in measurable terms
Figure 3.3 Software quality objectives should derive from business objectives and be broken downto level
where they can be directly measured
Businessobjectives
Improve Reduce ♥ Improvecustomer maintenance applicationsservice effort ☁reliability
Measures need to be ☁normalised☂before they can be compared
jutler Cox pic 1990
Standardisation and comparability: Ideally, measures of soft-ware quality should enable applications quality to be comparedon astandard scale. However,it is not possible to compare somequality measurements between applications or between differentorganisations, and nor are comparisons with other organisationsalways essential; valuable information can be gained fromidentifying trends and extreme variances in the measures.Before the quality measures for different applications can becompared, the effects that the different application charac-teristics, such as size and frequency of use, have on the qualitymeasure have to be compensated for. In other words, themeasures have to be ☁normalised☂ before they can be compared.Objectivity: Quality measures should be as objective as possibleso that the value does not depend onthe tester☂s judgementduringmeasurement, analysis, or evaluation. Measures made bysubjective assessments (ease of use, for example) maystill bereliable indicators of quality, but the results need to be assessedcarefully before any conclusions are drawn.Reliability: The measures should be reliable, which meansthat,given similar circumstances, the measurement process shouldproduce the same result each time it is carried out.Validity: The measures should producea valid assessment of anapplication☂s qualities. There are three ways in which a measurecan assess software quality:♥ Therelationship between the measure and the quality factor
can be direct ♥ as forreliability.♥ Therelationship can depend on an understanding of the way
in which quality affects the characteristic being measured ♥as in using maintenanceeffort to assess ease of maintenance.
♥ Therelationship may depend upon empirical validation of arelationship, such as that between design complexity andsoftwarereliability.
Economy: Quality measures should be cost effective, so that thebenefit gained from using the measures is much greater than thecost of making them.
19
Chapter 3 Defining users☂ quality requirements in measurable terms
Usefulness: The measures should provide information that helpsmanagement to decide on the action that needs to be taken.Different software quality characteristics have varying degreesof measurability, however. Some, such as reliability, can bedirectly measured and the results can be compared from appli-cation to application. Others are harder to measure and impossibleto compare. Usability, for example, can be assessed by the useronly in subjective terms, and in any case, will be defineddifferently from application to application. Constraints such asthese should be considered whenselecting the measures that willbe used.Several researchersinto quality assurance have producedlists ofquality measures. One of the most widely accepted amongsoftware quality-assurance experts, and the one that werecommend to PEP members,is that developed originally in theUnited States for the Rome Air Development Center, and knownas the RADC approach. The RADC approach to measuringsoftware quality derives from research work carried out in thelate 1970s and early 1980s. RADC had been pursuing a programmeintended to achieve better control of software since 1976. Theprogramme☂s aim wasto identify the key issues and provide a validmethod for specifying and measuring quality requirements forsoftware developed for major Air Force weapon systems.The programmedefined set of 11 user-oriented characteristics,or quality factors ♥ reliability, flexibility, maintainability, re-usability, correctness, testability, efficiency, usability, integrity(which actually refers to security), interoperability, and portability♥ which extend throughout the software life cycle. These 11 The RADC programmedefinedquality factors were originally defined to help predict the quality a set of 11 user-orientedof a final application as it is being developed. In Chapter 4, we characteristicsshow how the factors are used for this purpose. We have alsodevised an appropriate user-oriented measure for each of thefactors so that the quality of existing applications can be assessed.These measures are described in Chapter 5.Although the RADC approach wasoriginally defined for militaryapplications,it has successfully been applied to the developmentof commercial computing applications. (Full details of the RADCresearch have been published by the US National TechnicalInformation Service as Software Quality Measurement forDistributed Systems ♥ Final Report. Copies can be obtained fromILI, Index House, Ascot, Berkshire. The approach is clearlydescribed in the books by J Vincent, A Waters, and J Sinclair,listed in the bibliography.)Figure 3.4 shows how the 11 RADC quality factors match the fourquality characteristics that we defined in PEP Paper 9. For thepurpose of this paper, however, it is more convenient toclassifythe factors into three groups: those that are independent of aparticular application, those that are specific to a class ofapplication, and those that are application-specific.QUALITY FACTORS INDEPENDENT OF THE APPLICATIONSix of the 11 RADC quality factors describe characteristics thatcan be defined independently of the application, which meansthat the quality measures for different applications can be
© Butler Cox pic 1990

Chapter 3 Defining users☂ quality requirements in measurable terms
Low levels of maintenance
Butler Cox
productivity may indicateinflexible applications
1990
Figure 3.4 The 11 RADC quality factors can be categorised in terms of
the four quality characteristics defined in PEP Paper 9
Quality characteristics :Functional Technical Operational Ease of useIntegrity Correctness Efficiency. UsabilityInteroperability Re-usability ReliabilityPortability Maintainability
: FlexibilityTestability
compared. The reliability of an operating system, for example,can be compared with that of a computer game.ReliabilityReliability is defined as therate of failure of an application in use.The failures may be a partial or complete functional failure, orinaccuracies in results. The measureof this quality factor answersthe user☂s question: ☁☁Will the application work whenI use it andwill it produce accurate results?☝ It can be readily measuredbecause the frequency of application failures is often recordedby the operations department.FlexibilityTheflexibility of an application is the ease with which perfectiveand adaptive maintenancecan be done. (Perfective maintenanceis changing the software☂s structure to improve its performanceand maintainability; adaptive maintenance is concerned withenhancing and extending systems software to incorporate theevolving needs of users.) The measure of this quality factoranswers the question: ☁☁How easily can the functions of theapplication be changed?☝A further useful measure of flexibility is a comparison of theproductivity of the developmentstaff involved in making changeswith the productivity of those carrying out new developmentwork. This comparison (which can be based on Pls forenhancements and new developments) can be used to decidewhether to scrap and rewrite an application or to continuemaintaining it.MaintainabilityThe maintainability of an application is the ease with whichcorrective maintenance activity can be carried out. This measureanswers the question: ☁☁How easily can faults be fixed?☂ Ameasure of the maintainability of an application is the averageeffort required (in developer hours) to find and fix a fault.Re-usabilityThere-usability of an applicationis the extent to whichall or partsof the code can be re-used in other applications. This measureanswers the question: ☁☁Does this application provide an oppor-tunity to save costs by re-using its components in otherapplications?☝☂Measurementof this quality factor is difficult because the levelof actual, as opposed to intended, re-use cannot be established
21
Chapter 3 Defining users☂ quality requirements in measurable terms
until long after the application has been developed. A practicalmeasureof re-usability is the proportion of the application thatis composed of re-used modules.CorrectnessThe correctness of an application is the extent to which theapplication conforms to the stated requirements. This measureanswers the question: ☁☁How faithfully have the users☂ require-ments been implemented?☂☂ Correctness does not, however, assessthe ability of the application to producecorrect results. This ability _is an aspectof the reliability of the application. A suitable methodof measuring correctness is the number of application defectsfound. A defect is any difference between the applicationrequirements and its implementation.TestabilityThe testability of an application is the ease with which theapplication can be tested to ensure that it will perform its intendedfunction. This measure is an important attribute affecting thereliability and the cost of maintaining an application. It answersthe question: ☜☁Can I test the application thoroughly andeasily?☝☂A measureof the testability of the application is the numberoftest cases that are needed to test the application fully.
QUALITY FACTORS SPECIFIC TO A CLASS OF APPLICATIONTwoof the 11 quality factors (efficiency and usability) describecharacteristics that must be defined specifically for each classof application. Thus,for the class of workstation-based appli-cations, the important efficiency measures are memoryrequirements and speed of calculation. For batch programs,the important efficiency measures are processor usage andelapsed time to process a given volume of transactions.EfficiencyThe efficiency of an application is measured in terms of thecomputerresources neededto provide the required functionswith the required response time. Efficiency can be measuredin terms of processor usage, disc-storage requirements, and soon. Response time is not a measure of the efficiency of anapplication because it is a characteristic of the particularcombination of hardware and systems software in which theapplication runs, rather than a characteristic of the applicationssoftware. The measure ofthis quality factor answers the user☂squestion: ☁☁Will the application use a reasonable (affordable)amount of computer resources?☝UsabilityAn application has a high measureof usability if it can be usedeasily to produce useful results. The measure of this qualityfactor has two components: the effort required to learn and Usability is related to the effortuse the application, and the usefulness of the application. It required to learn how touse ananswers the user☂s question: ☁☁Will the application be useful @PPlication... .to me?☝☂Research has shownthat these two components of usabilityare a good indicator both of the likely level of use and of usersatisfaction with an application. Users consider an application
22 © Butler Cox plc 1990
Chapter 3 Defining users☂ quality requirements in measurable terms
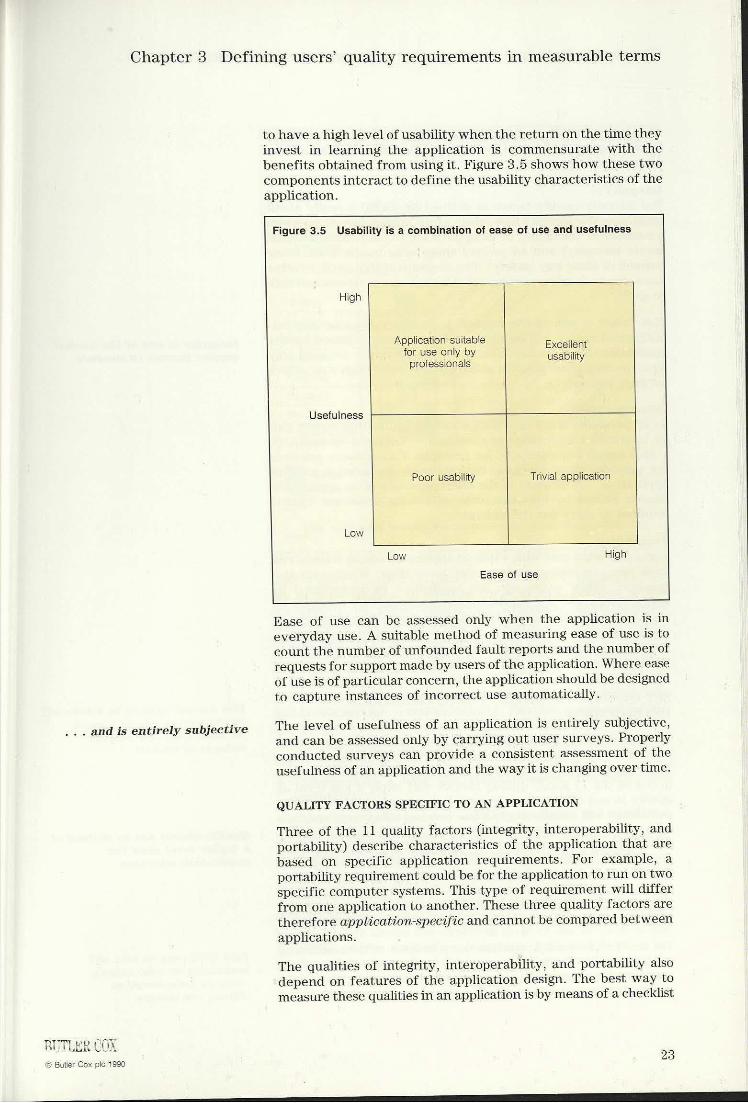
to have highlevelof usability when the return on the time theyinvest in learning the application is commensurate with thebenefits obtained from using it. Figure 3.5 shows how these twocomponentsinteract to define the usability characteristics of the
application.
Figure 3.5 Usability is a combination of ease of use and usefulness
High
Application suitable Excollonefor use only by usabilityprofessionals
Usefulness
Poorusability Trivial application
LowLow High
Ease of use
Ease of use can be assessed only when the application is ineveryday use. A suitable method of measuring ease of use is tocount the numberof unfoundedfault reports and the numberofrequests for support made byusersof the application. Where easeof useis of particular concern,the application should be designedto capture instances of incorrect use automatically.
. . and is entirely subjective The level of usefulness of an application is entirely subjective,and can be assessed only by carrying out user surveys. Properlyconducted surveys can provide a consistent assessment of theusefulness of an application and the wayit is changing overtime.
QUALITY FACTORS SPECIFIC TO AN APPLICATION
Three of the 11 quality factors (integrity, interoperability, andportability) describe characteristics of the application that arebased on specific application requirements. For example, aportability requirement could befor the application to run on twospecific computer systems. This type of requirement will differfrom one application to another. These three quality factors aretherefore application-specific and cannot be compared betweenapplications.
The qualities of integrity, interoperability, and portability alsodepend on features of the application design. The best way tomeasure these qualities in an application is by meansof a checklist
© Butler Cox ple 1990 23
__(tstitititititiiditiid#t(*#
nee
Chapter 3 Defining users☂ quality requirements in measurable terms
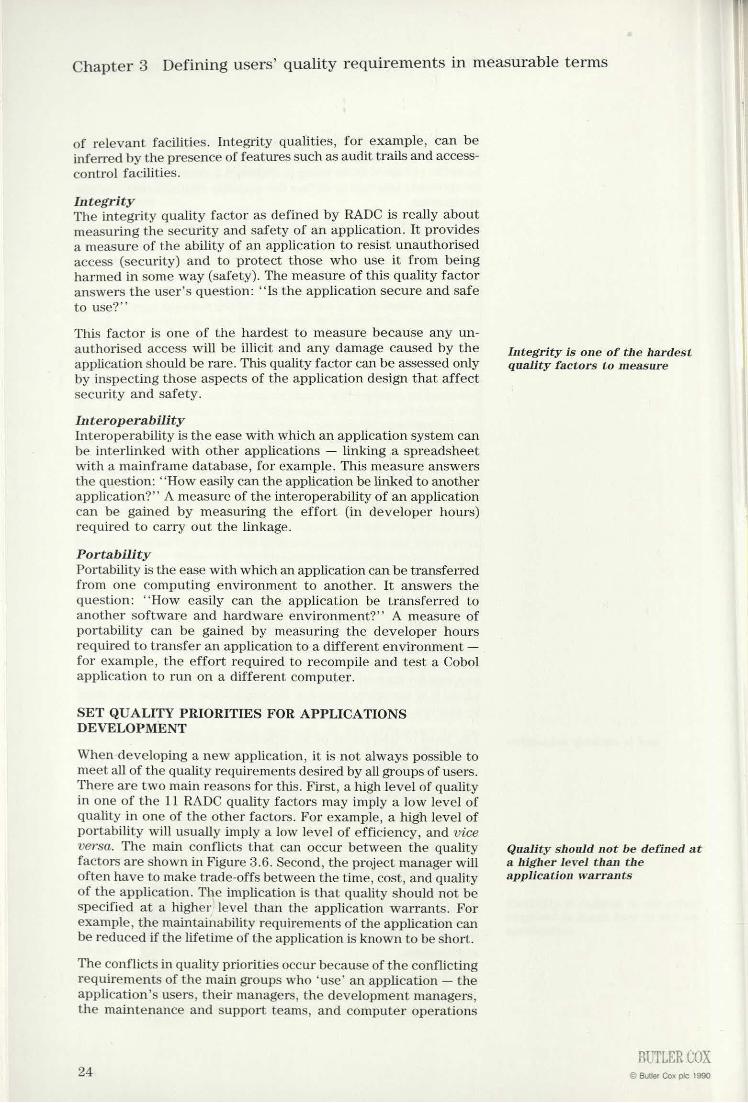
of relevant facilities. Integrity qualities, for example, can beinferred by the presence of features such as audit trails and access-control facilities.IntegrityThe integrity quality factor as defined by RADCis really aboutmeasuring the security and safety of an application. It providesa measureof the ability of an application to resist unauthorisedaccess (security) and to protect those who use it from beingharmed in some way(safety). The measureof this quality factoranswers the user☂s question: ☁☁Is the application secure and safeto use?☝☂This factor is one of the hardest to measure because any un-authorised access will be illicit and any damage caused by theapplication should be rare. This quality factor can be assessed onlyby inspecting those aspects of the application design that affectsecurity and safety.InteroperabilityInteroperability is the ease with which an application system canbe interlinked with other applications ♥ linking a spreadsheetwith a mainframe database, for example. This measure answersthe question: ☁☁Howeasily can the application be linked to anotherapplication?☂☂ A measureof the interoperability of an applicationcan be gained by measuring the effort (in developer hours)required to carry out the linkage.PortabilityPortability is the ease with which an application can be transferredfrom one computing environment to another. It answers thequestion: ☁☜☁How easily can the application be transferred toanother software and hardware environment?☂☂ A measure ofportability can be gained by measuring the developer hoursrequired to transfer an application to a different environment ♥for example, the effort required to recompile and test a Cobolapplication to run on a different computer.
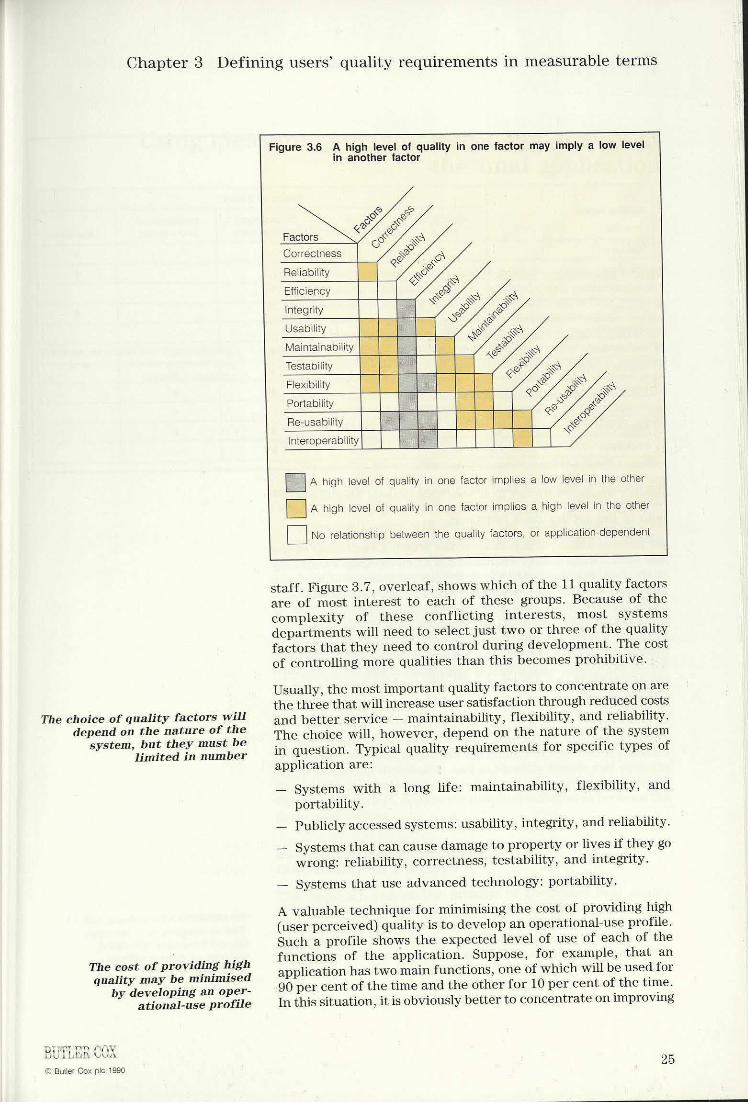
SET QUALITY PRIORITIES FOR APPLICATIONSDEVELOPMENTWhen developing a new application, it is not always possible tomeetall of the quality requirements desiredby all groupsof users.There are two main reasonsforthis. First, a high level of qualityin one of the 11 RADC quality factors may imply a low level ofquality in one of the other factors. For example, a high level ofportability will usually imply a low levelof efficiency, and viceversa. The main conflicts that can occur between the qualityfactors are shownin Figure 3.6. Second, the project managerwilloften have to maketrade-offs between the time, cost, and qualityof the application. The implication is that quality should not bespecified at a higher level than the application warrants. Forexample, the maintainability requirements of the application canbe reducedif the lifetime of the application is knowntobeshort.The conflicts in quality priorities occur becauseof the conflictingrequirements of the main groups who☁use☂ an application ♥ theapplication☂s users, their managers, the development managers,the maintenance and support teams, and computer operations
24
Integrity is one of the hardestquality factors to measure
Quality should not be defined ata higher level than theapplication warrants
Chapter 3 Defining users☂ quality requirements in measurable terms
Figure 3.6 A high level of quality in one factor may imply a low level
in another factor
FactorsCorrectness
Reliability EfficiencyIntegrityUsability
MaintainabilityTestabilityFlexibilityPortabilityRe-usability
Interoperability
A high level of quality in one factor implies a low level in the other
A high level of quality in one factor implies a high level in the other
(aa No relationship between the quality factors, or application-dependent
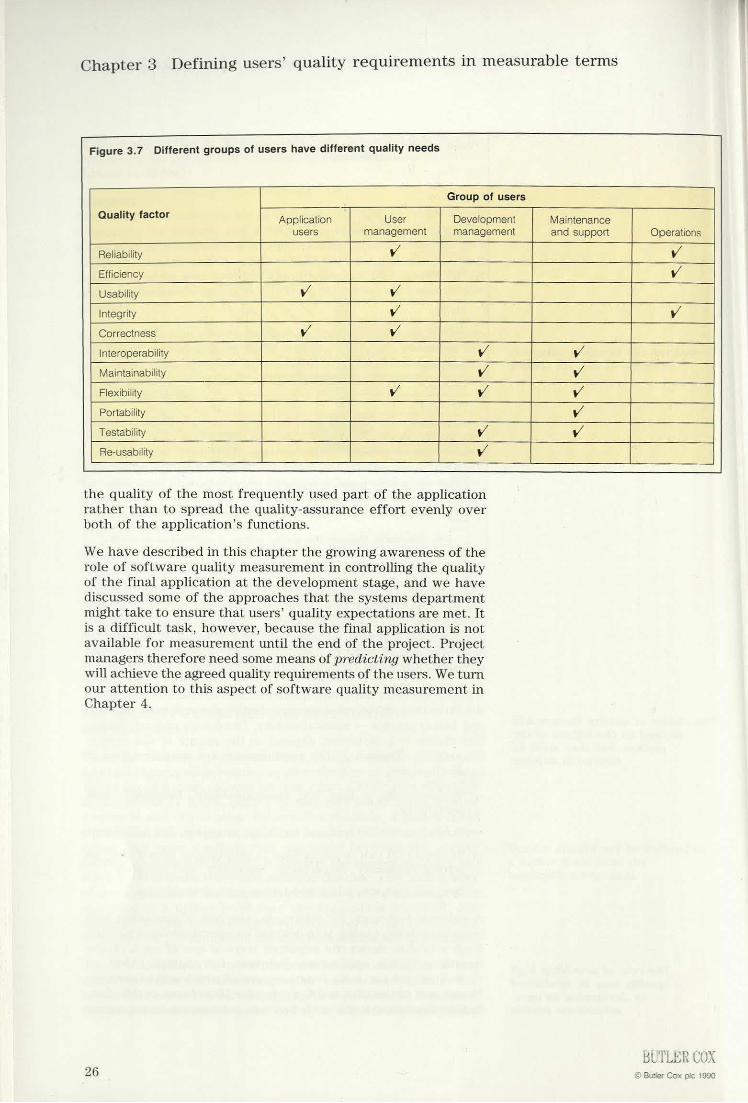
staff. Figure 3.7, overleaf, shows whichof the 11 quality factorsare of most interest to each of these groups. Because of thecomplexity of these conflicting interests, most systemsdepartments will need to select just two or three of the qualityfactors that they need to control during development. The costof controlling more qualities than this becomes prohibitive.
Usually, the most important quality factors to concentrate on arethe three thatwill increase usersatisfaction through reduced costsand better service ♥ maintainability, flexibility, and reliability.
depend:on ue cian cee The choice will, however, depend on the nature of the systemaySEEEeetide in question. Typical quality requirements for specific types of
application are:
The choice of quality factors will
♥ Systems with a long life: maintainability, flexibility, andportability.
♥ Publicly accessed systems: usability, integrity, and reliability.♥ Systems that can cause damage to property or lives if they go
wrong: reliability, correctness, testability, andintegrity.♥ Systems that use advanced technology: portability.
A valuable technique for minimising the cost of providing high(user perceived) quality is to develop an operational-use profile.Such a profile shows the expected level of use of each of the
The cost of providing high functions of the application. Suppose, for example, that anquality may be minimised application has twomain functions, one of which will be used for
by developing an oper- 90 per cent of the time and the otherfor 10 per cent of the time.ational-use profile In this situation,it is obviously better to concentrate on improving
© Butler Cox ple 1990 25
Chapter 3 Defining users☂ quality requirements in measurable terms
Figure 3.7 Different groups of users have different quality needs q)
Group of users Quality factor Application User Development Maintenanceusers management management and support Operations
Reliability v VvEfficiency VvUsability v
IntegrityCorrectness Vv SI
NS SN
Interoperability
MaintainabilityFlexibilityPortabilityTestabilityRe-usability
<
SiS
NSS
the quality of the most frequently used part of the applicationrather than to spread the quality-assurance effort evenly overboth of the application☂s functions.We havedescribed in this chapter the growing awarenessof therole of software quality measurementin controlling the qualityof the final application at the development stage, and we havediscussed some of the approaches that the systems departmentmight take to ensure that users☂ quality expectations are met. Itis a difficult task, however, because the final application is notavailable for measurement until the end of the project. Projectmanagerstherefore need some meansofpredicting whether theywill achieve the agreed quality requirements of the users. We turnour attention to this aspect of software quality measurement inChapter4.
26
© Butler Cox pic 1990
Chapter 4
Using measurementsto predict the quality of
Once an application is complete,it is too late to correct any
quality defects
In the quality-of-conformanceapproach, a project is sub-jectively assessed for itsconformance to quality
standards
©Butler Cox ple 1990
the final application
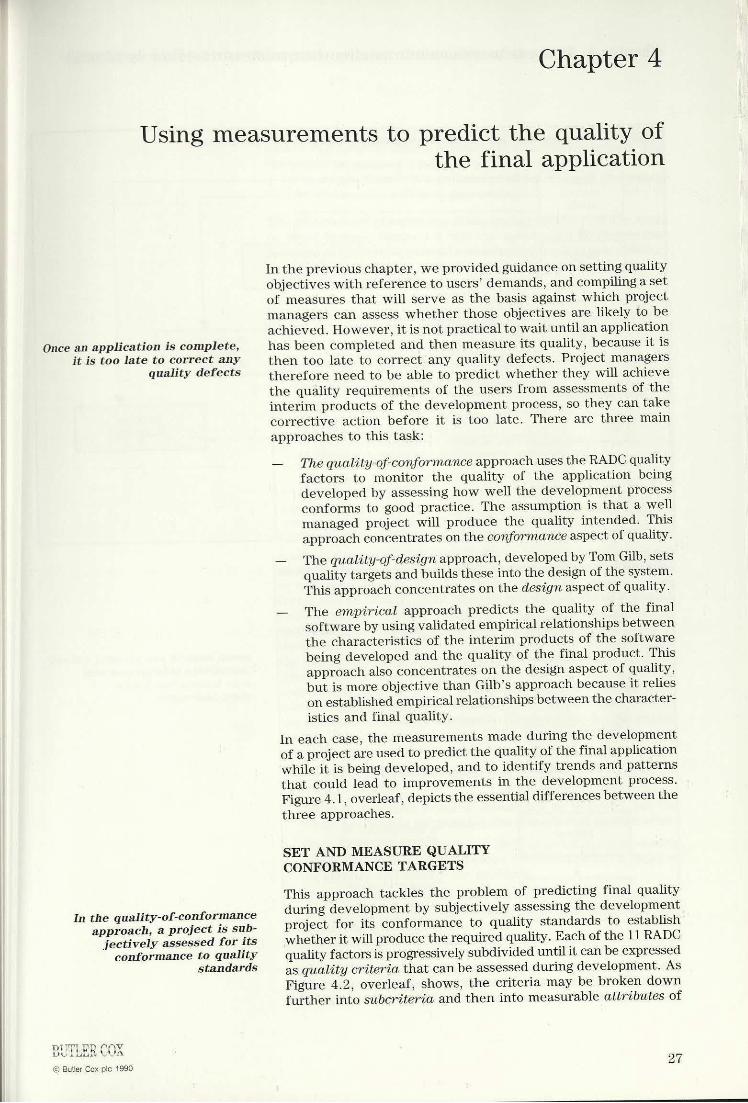
In the previous chapter, we provided guidanceonsetting qualityobjectives with reference to users☂ demands, and compiling a setof measures that will serve as the basis against which projectmanagers can assess whether those objectives are likely to beachieved. However,it is not practical to wait until an applicationhas been completed and then measureits quality, because it isthen too late to correct any quality defects. Project managerstherefore need to be able to predict whether they will achievethe quality requirements of the users from assessments of theinterim products of the development process, so they can takecorrective action before it is too late. There are three mainapproachesto this task:♥ The quality-of-conformance approach uses the RADCquality
factors to monitor the quality of the application beingdeveloped by assessing how well the development processconforms to good practice. The assumption is that a wellmanaged project will produce the quality intended. Thisapproach concentrates on the conformanceaspect of quality.
♥ The quality-of-design approach, developed by Tom Gilb, setsquality targets and builds these into the design of the system.This approach concentrates on the design aspect of quality.
♥ The empirical approach predicts the quality of the finalsoftware by using validated empirical relationships betweenthe characteristics of the interim products of the softwarebeing developed and the quality of the final product. Thisapproachalso concentrates on the design aspect of quality,but is more objective than Gilb☂s approach becauseit relieson established empirical relationships between the character-istics and final quality.
In each case, the measurements made during the developmentof a project are usedto predict the quality of the final applicationwhile it is being developed, and to identify trends and patternsthat could lead to improvements in the development process.Figure 4.1, overleaf, depicts the essential differences between thethree approaches.
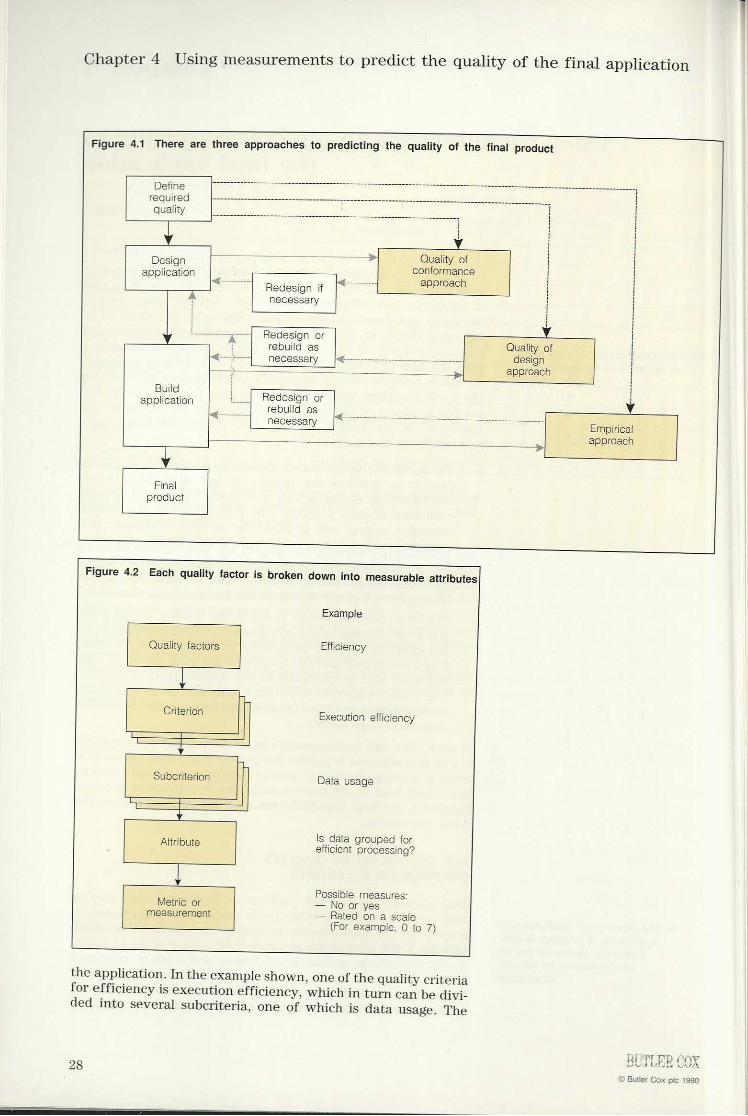
SET AND MEASURE QUALITYCONFORMANCE TARGETSThis approach tackles the problem of predicting final qualityduring development by subjectively assessing the developmentproject for its conformance to quality standards to establishwhetherit will produce the required quality. Each of the 11 RADCquality factorsis progressively subdivided until it can be expressedas quality criteria that can be assessed during development. AsFigure 4.2, overleaf, shows, the criteria may be broken downfurther into subcriteria and then into measurable attributes of
27
Chapter 4 Using measurements to predict the quality of the final application
Figure 4.1 There are three approaches to predicting the quality of the final product
Definerequired jquality i
y y}_♥__________ Quality of iBeen conformance |ee!
ne
ee approach ifr Redesignif is oe iA necessary i
tay---1 Redesign or s i☂ * rebuild as Quality inecessary design i♥♥♥♥♥ approach 1Build ; |eat i_.| Redesign or ifapplication ial soil as.| |Tiaalateseee y.necessary Empirical
approachSS
Finalproduct
Figure 4.2 Each quality factor is broken down into measurable attributes|
Example
Quality factors Efficiency
Criterion Execution efficiency
Subcriterion Data usage
; Is data grouped forAttribute efficient processing?
Possible measures:Metric or ♥ No or yesmeasurement ♥ Rated on a scale(For example, 0 to 7)
the application. In the example shown,oneof the quality criteriafor efficiency is execution efficiency, which in turn can be divi-ded into several subcriteria, one of which is data usage. The
28 © Butler Cox ple 1990
Chapter 4 Using measurementsto predict the quality of the final application
Quality criteria are broken downinto measurable attributes,
which are scored on a
©Butler Cox ple 1990
numerical scale
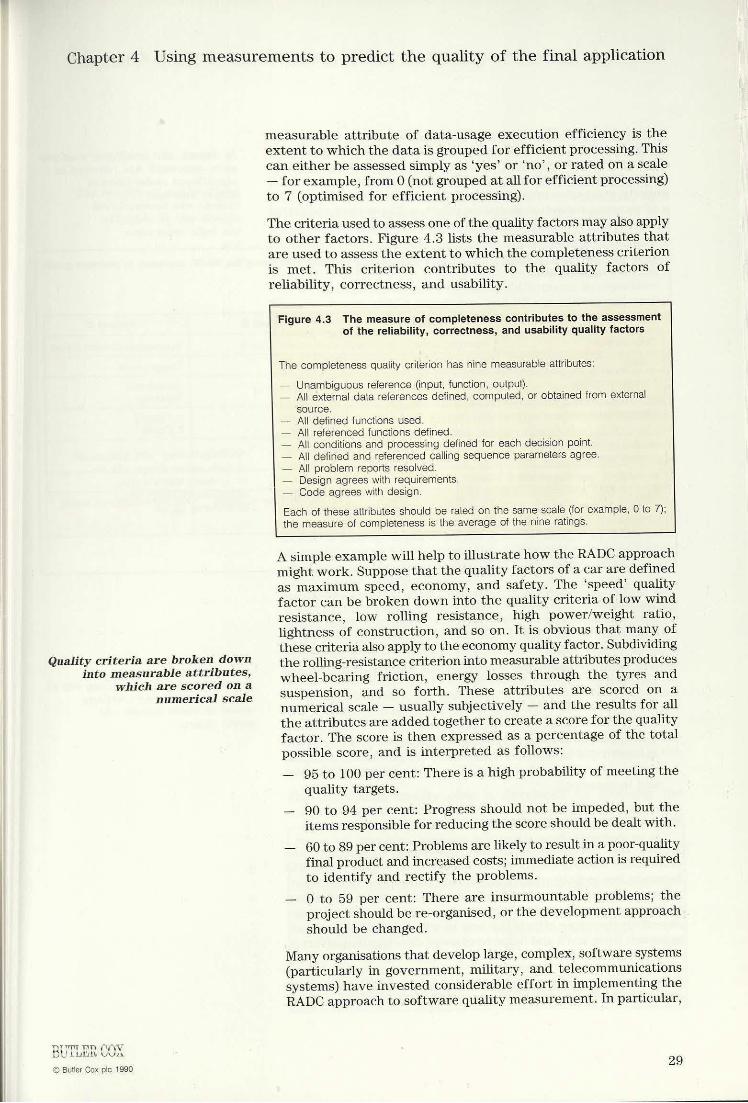
measurable attribute of data-usage execution efficiency is theextent to which the datais groupedfor efficient processing. Thiscan either be assessed simply as ☁yes☂ or ☁no☂, or rated on a scale♥ for example, from 0 (not grouped atall for efficient processing)to 7 (optimised for efficient processing).Thecriteria usedto assess one ofthe quality factors may also applyto other factors. Figure 4.3 lists the measurable attributes thatare usedto assess the extent to which the completeness criterionis met. This criterion contributes to the quality factors ofreliability, correctness, and usability. Figure 4.3 The measure of completenesscontributes to the assessment
of the reliability, correctness, and usability quality factors
The completeness quality criterion has nine measurable attributes:♥ Unambiguousreference(input, function, output).♥ All external data references defined, computed, or obtained from external
source.♥ All defined functions used.♥ All referenced functions defined.♥ All conditions and processing defined for each decision point.♥ All defined and referencedcalling sequence parameters agree.♥ All problem reports resolved.♥ Design agrees with requirements.♥ Code agrees with design.Eachof theseattributes should be rated on the same scale (for example,0 to 7);the measure of completenessis the average of the nineratings. A simple examplewill help to illustrate how the RADC approachmight work. Supposethat the quality factors of a car are definedas maximum speed, economy, and safety. The ☁speed☂ qualityfactor can be broken downinto the quality criteria of low windresistance, low rolling resistance, high power/weight ratio,lightness of construction, and so on.It is obvious that many ofthesecriteria also apply to the economyquality factor. Subdividingthe rolling-resistancecriterion into measurableattributes produceswheel-bearing friction, energy losses through the tyres andsuspension, and so forth. These attributes are scored on anumerical scale ♥ usually subjectively ♥ and theresults for allthe attributes are added togetherto create a score for the qualityfactor. The score is then expressed as a percentage of the totalpossible score, and is interpreted as follows:♥ 95 to 100 per cent: There is a high probability of meeting the
quality targets.♥ 90 to 94 per cent: Progress should not be impeded, but the
items responsible for reducingthe score should be dealt with.♥ 60 to 89 percent: Problemsare likely to result in a poor-quality
final product andincreased costs; immediate action is requiredto identify and rectify the problems.
♥ 0 to 59 per cent: There are insurmountable problems; theproject should be re-organised, or the development approachshould be changed.
Manyorganisations that develop large, complex, software systems(particularly in government, military, and telecommunicationssystems) have invested considerable effort in implementing theRADCapproachto software quality measurement. In particular,
29
Chapter 4 Using measurements to predict the quality of the final application
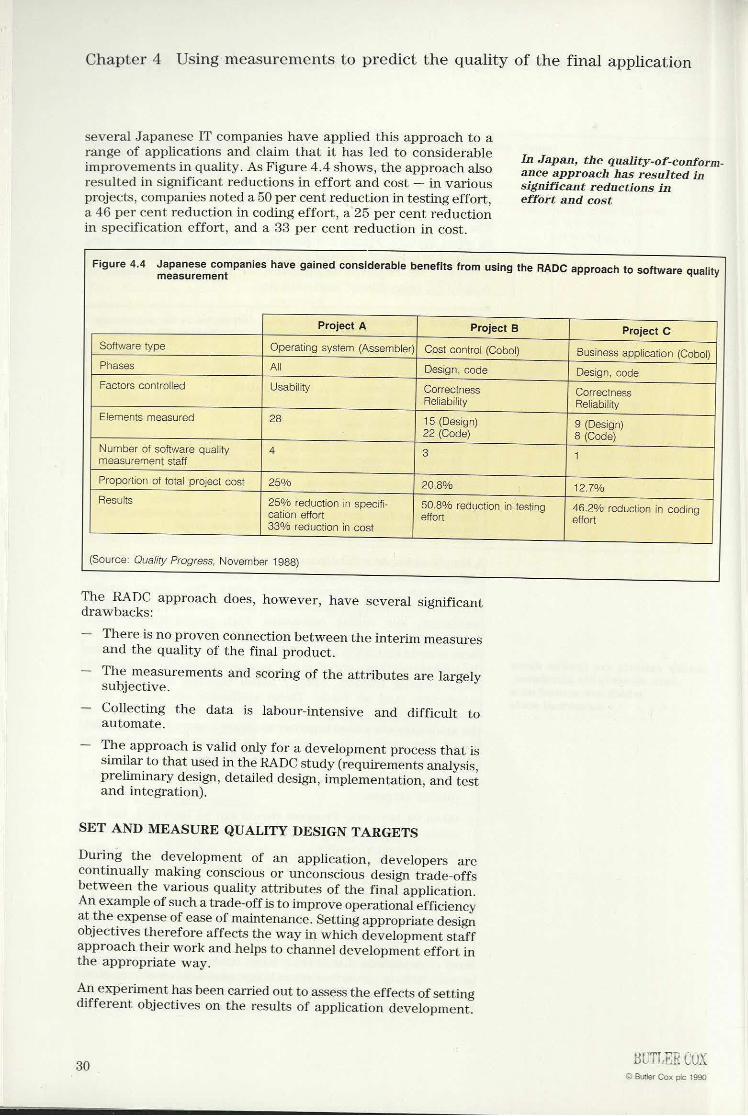
several Japanese IT companies have applied this approach to arange of applications and claim that it has led to considerableimprovementsin quality. As Figure 4.4 shows, the approach alsoresultedin significant reductions in effort and cost ♥ in variousprojects, companies noted a 50 per cent reductionin testing effort,a 46 per cent reduction in coding effort, a 25 per cent reductionin specification effort, and a 33 per cent reductionin cost.
In Japan, the quality-of-conform-ance approach has resulted insignificant reductions ineffort and cost
Figure 4.4 Japanese companieshave gained considerable benefits from using the RADC approachto software qualitymeasurement
Project A Project B Project CSoftware type Operating system (Assembler)} Cost control (Cobol) Business application (Cobol)Phases All Design, code Design, codeFactors controlled Usability Correctness CorrectnessReliability ReliabilityElements measured 28 15 (Design) 9 (Design)22 (Code) 8 (Code)Numberof software quality 4 3 imeasurementstaffProportion of total project cost 25% 20.8% 12.7%Results 25%reduction in specifi- 50.8%reduction in testing 46.2%reduction in codingcation effort effort effort33%reduction in cost
(Source: Quality Progress, November 1988)
The RADC approach does, however, have several significantdrawbacks:♥ There is no proven connection betweentheinterim measuresand the quality of the final product.♥ The measurements and scoring of the attributes are largelysubjective.♥ Collecting the data is labour-intensive and difficult toautomate.♥ The approachis valid only for a developmentprocessthat issimilar to that used in the RADC study (requirements analysis,preliminary design, detailed design, implementation, and testandintegration).
SET AND MEASURE QUALITY DESIGN TARGETSDuring the development of an application, developers arecontinually making conscious or unconscious design trade-offsbetween the various quality attributes of the final application.An example ofsuch a trade-offis to improveoperationalefficiencyat the expenseof ease of maintenance. Setting appropriate designobjectives therefore affects the way in which developmentstaffapproach their work and helps to channel developmenteffort inthe appropriate way.An experimenthas beencarried out to assess the effects of settingdifferent objectives on the results of application development.
30
© Butler Cox pic 1990
Chapter 4 Using measurements to predict the quality of the final application
The results of applicationsdevelopmentare clearlyaffected by the design
objectives that areset
Managing the ☁producibility☂of the application design
allows the quality ofthe final application
to be predicted
In the quality-of-design approach,quality objectives are set at
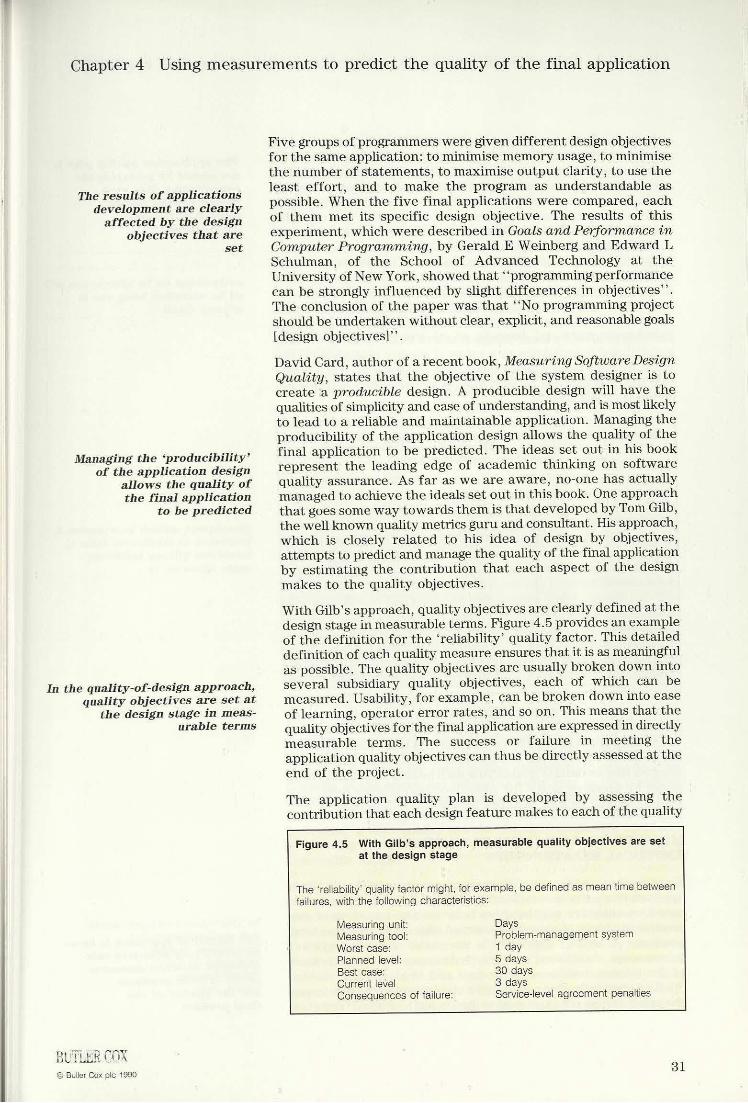
the design stage in meas-urable terms
© Butler Cox pic 1990
Five groups of programmers were given different design objectivesfor the sameapplication: to minimise memory usage, to minimisethe numberof statements, to maximise outputclarity, to use theleast effort, and to make the program as understandable aspossible. When thefive final applications were compared, eachof them met its specific design objective. The results of thisexperiment, which were described in Goals and Performance inComputer Programming, by Gerald E Weinberg and Edward LSchulman, of the School of Advanced Technology at theUniversity of New York, showedthat☁☁programming performancecan be strongly influencedbyslight differences in objectives☂☂.The conclusion of the paper wasthat ☁☁No programming projectshould be undertaken without clear, explicit, and reasonable goals[design objectives]☂☂.David Card, author of a recent book, Measuring Software DesignQuality, states that the objective of the system designer is tocreate a producible design. A producible design will have thequalities of simplicity and ease of understanding, and is mostlikelyto lead to a reliable and maintainable application. Managing theproducibility of the application design allows the quality of thefinal application to be predicted. The ideas set out in his bookrepresent the leading edge of academic thinking on softwarequality assurance. As far as we are aware, no-onehasactuallymanagedto achieve the ideals set out in this book. One approachthat goes some way towardsthem is that developed by Tom Gilb,the well known quality metrics guru and consultant. His approach,which is closely related to his idea of design by objectives,attemptsto predict and manage the quality of the final applicationby estimating the contribution that each aspect of the designmakes to the quality objectives.With Gilb☂s approach, quality objectivesare clearly defined at thedesign stage in measurable terms. Figure 4.5 provides an exampleof the definition for the ☁reliability☂ quality factor. This detaileddefinition of each quality measure ensuresthat it is as meaningfulas possible. The quality objectives are usually broken down intoseveral subsidiary quality objectives, each of which can bemeasured. Usability, for example, can be broken downinto easeof learning, operator error rates, and so on. This meansthat thequality objectives for the final application are expressedin directlymeasurable terms. The success or failure in meeting theapplication quality objectives can thus be directly assessed at theend of the project.The application quality plan is developed by assessing thecontribution that each design feature makesto each of the quality Figure 4.5 With Gilb☂s approach, measurable quality objectives are set
at the design stage
The☁reliability☂ quality factor might, for example, be defined as mean time betweenfailures, with the following characteristics:
Measuring unit: DaysMeasuringtool: Problem-management systemWorst case: 1 dayPlanned level: 5 daysBest case: 30 daysCurrentlevel 3 daysConsequencesoffailure: Service-level agreement penalties
31
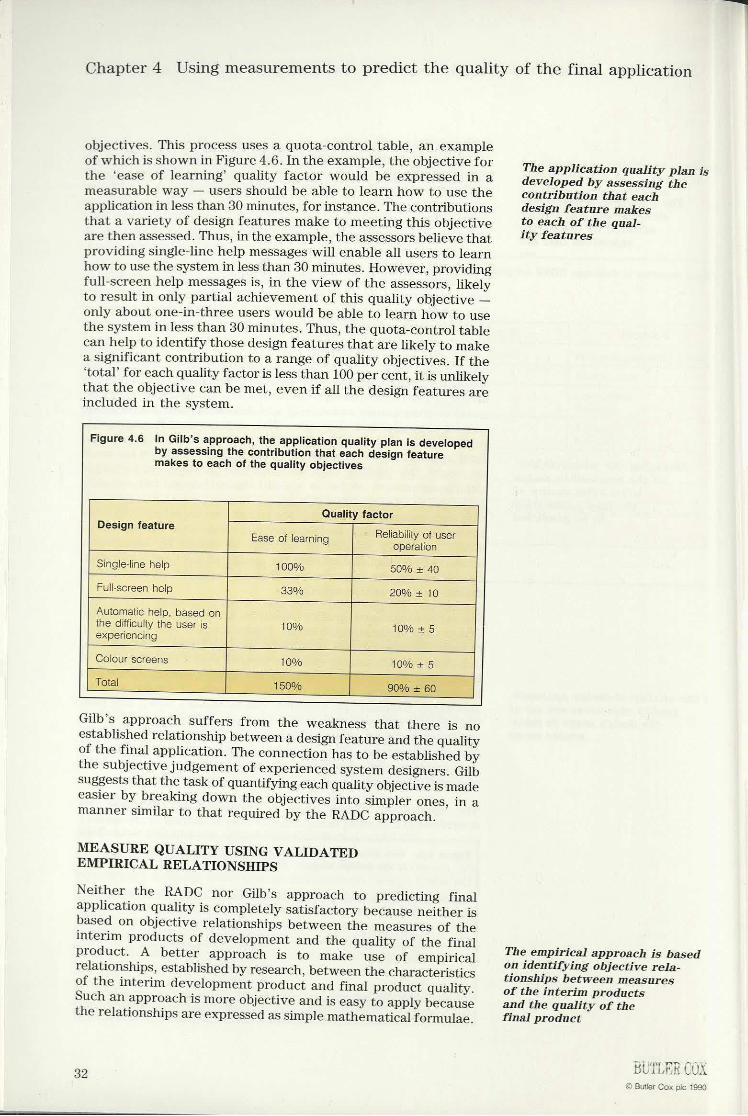
Chapter 4 Using measurements to predict the quality of the final application
objectives. This process uses a quota-control table, an exampleof which is shownin Figure 4.6. In the example, the objective forthe ☁ease of learning☂ quality factor would be expressed in ameasurable way ♥ users should be able to learn how to usetheapplication in less than 30 minutes, for instance. The contributionsthat a variety of design features make to meeting this objectiveare then assessed. Thus, in the example, the assessors believe thatproviding single-line help messageswill enable all users to learnhowto use the system in less than 30 minutes. However, providingfull-screen help messagesis, in the view of the assessors, likelyto result in only partial achievementof this quality objective ♥only about one-in-three users would be able to learn how to usethe system in less than 30 minutes. Thus, the quota-control tablecan help to identify those design features that are likely to makea significant contribution to a range of quality objectives. If the☁total☂ for each quality factoris less than 100 per cent, it is unlikelythat the objective can be met, even if all the design features areincludedin the system.
Figure 4.6 In Gilb☂s approach, the application quality plan is developedby assessing the contribution that each design featuremakesto each of the quality objectives
Quality factor Design feature aeEase oflearning Reliability of user
operationSingle-line help 100% 50% + 40Fullscreen help 33% 20% + 10Automatic help, based on 2the difficulty the user is 10% 10% +5experiencing Colour screens 10% +5
Gilb☂s approach suffers from the weakness that there is noestablished relationship between a design feature and the qualityof thefinal application. The connection hasto beestablished bythe subjective judgement of experienced system designers. Gilbsuggests that the task of quantifying each quality objective is madeeasier by breaking down the objectives into simpler ones, inamannersimilar to that required by the RADC approach.
MEASURE QUALITY USING VALIDATEDEMPIRICAL RELATIONSHIPSNeither the RADC nor Gilb☂s approach to predicting finalapplication quality is completely satisfactory because neitherisbased on objective relationships between the measures of theinterim products of development and the quality of the finalproduct. A better approach is to make use of empiricalrelationships, established by research, between the characteristicsof the interim development product and final product quality.Such an approach is more objective and is easy to apply becausethe relationships are expressed as simple mathematical formulae.
32
The application quality plan isdeveloped by assessing thecontribution that eachdesign feature makesto each of the qual-ity features
The empirical approach is basedon identifying objective rela-tionships between measuresof the interim productsand the quality of thefinal product
ler Cox pic 1990
Chapter 4 Using measurements to predict the quality of the final application
The complexity of an applicationis one goodindicator of its
likely quality
A measure of design complexityis most beneficial in detecting
potential quality problemsat an early stage
Measuring the complexity ofinformation flow is a
widely recognisedway of assessing
system-designcomplexity
© Butler Cox pic 1990
An important relationship is that between the complexity of thesystem design and the maintainability of the final application. Byensuring that design complexity does not exceed a predefinedlevel, the project manager can ensure that the maintainability ofthe final application reaches the target quality level.In general, the complexity of an application is a good indicatorof its likely quality. Complexity (or its opposite, simplicity) is aquality criterion that contributes to seven of the 11 RADC qualityfactors ♥ correctness, reliability, efficiency, maintainability,testability, flexibility, and re-usability. In addition, unlike manyof the other quality criteria, it does not adversely affect efficiencyso that trade-offs between these eight quality factors andefficiency do not have to be allowed for when consideringcomplexity.It is important, however, to distinguish between the complexityof the problem that the application has been designed to solveand the complexity of the application itself. A complex problemdoes not necessarily imply a complex solution, although the taskof developing a simple solution for a complex problem may bedifficult.Complexity can be measured in two ways: by measuring thecomplexity of the design based on the interconnections betweenthe modules and programsthat make up a system, or by measuringthe complexity of the code itself. A measure of design complexityis most beneficial in detecting potential quality problems at anearly stage, when they can be fixed quickly and cheaply.Unfortunately, the collectionof the basic data required to measuredesign complexity can be laborious, and at present, there are notools available to carry out this task automatically. Measuring codecomplexity has the disadvantagethat it cannottakeplace beforethe code has been written.If a module turns out to be too complex,further workis neededto simplify it. However,tools are availablefor measuring the complexity of code written in the more popularthird-generation languages.MEASURING DESIGN COMPLEXITYA high proportion of software errors discovered late in thedevelopmentlife cycle have their origins in the system-designstage. Figure 4.7, overleaf, showsthe distribution of the sourcesof software errors for three actual development projects. Themajority of the errors are related in some way to the design ofthe system. Reducing design complexityis highly likely to reducethe numberofdesignerrors, thereby increasing thelikelihood ofdelivering a high-quality system. Design complexity measuresdefine the success of the systems designer in developing aproducible design.Manyschemeshave been suggested for measuring system-designcomplexity. Many of these are based on assessing the modularstructure of a system; the most widely recognised is theinformation-flow complexity measure proposed by S M Henry andD G Kafura, of the University of Wisconsin-La Crosse, and lowaState University, respectively, which provides a measure ofmodule coupling (that is, the links between modules). Thismeasureis calculated from the information ☁fan-in☂ and ☁fan-out☂for each module. (Details of this measure can be found in
33
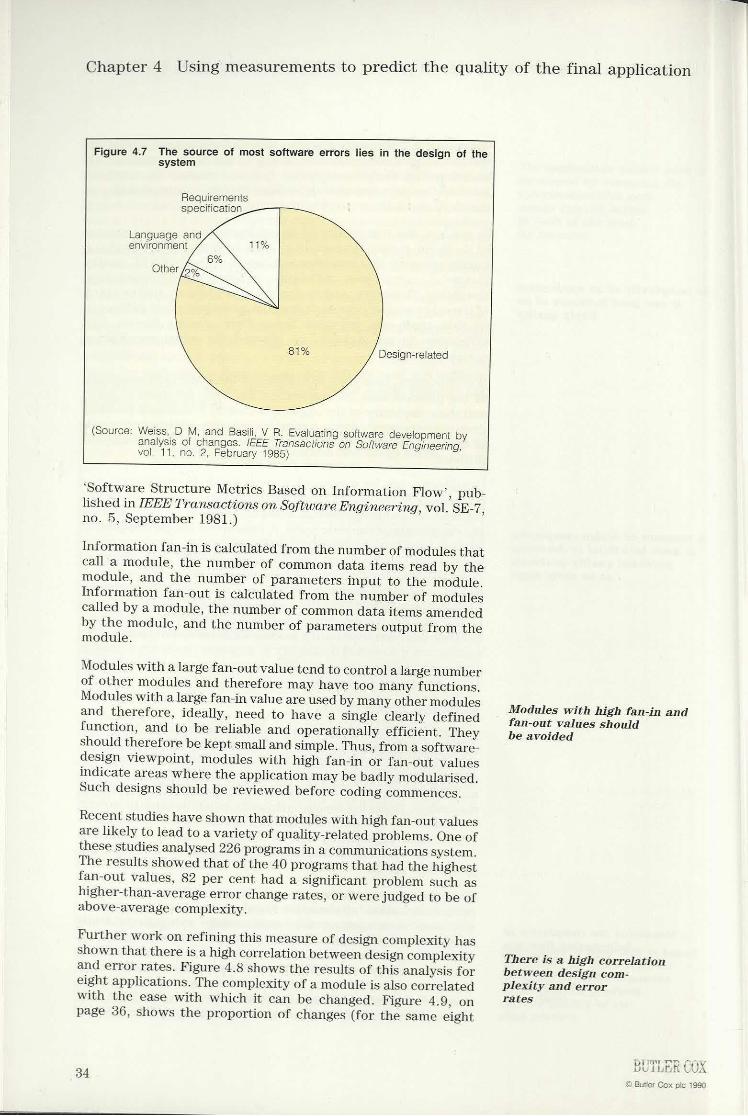
Chapter 4 Using measurements to predict the quality of the final application
Figure 4.7 The source of most software errors lies in the design of thesystem
Requirementsspecification
Language andenvironmentOther
/ Design-related
(Source: Weiss, D M, and Basili, V R. Evaluating software development byanalysis of changes. IEEE Transactions on Software Engineering,vol. 11, no. 2, February 1985) ☁Software Structure Metrics Based on Information Flow☂, pub-lished in IEEE Transactions on Software Engineering, vol. SE-7,no. 5, September 1981.)Information fan-in is calculated from the numberof modules thatcall a module, the number of commondata items read by themodule, and the number of parameters input to the module.Information fan-out is calculated from the number of modulescalled by a module, the number of common data items amendedby the module, and the numberof parameters output from themodule.Modules with a large fan-out value tend to control a large numberof other modules and therefore may have too manyfunctions.Moduleswith a large fan-in value are used by many other modulesand therefore, ideally, need to have a single clearly definedfunction, and to be reliable and operationally efficient. Theyshould therefore be kept small and simple. Thus, from a software-design viewpoint, modules with high fan-in or fan-out valuesindicate areas where the application may be badly modularised.Such designs should be reviewed before coding commences.Recent studies have shownthat modules with high fan-out valuesare likely to lead to a variety of quality-related problems. One ofthese studies analysed 226 programsin a communications system.The results showedthat of the 40 programsthat had the highestfan-out values, 82 per cent had a significant problem such ashigher-than-average error change rates, or were judged to be ofabove-average complexity.Further work on refining this measure of design complexity hasshownthat there is a high correlation between design complexityand error rates. Figure 4.8 showsthe results of this analysis foreight applications. The complexity of a module is also correlatedwith the ease with which it can be changed. Figure 4.9, onpage 36, showsthe proportion of changes (for the same eight
34
Modules with high fan-in andfan-out values shouldbe avoided
Thereis a high correlationbetween design com-plexity and errorrates
© Butler Cox pic 1990
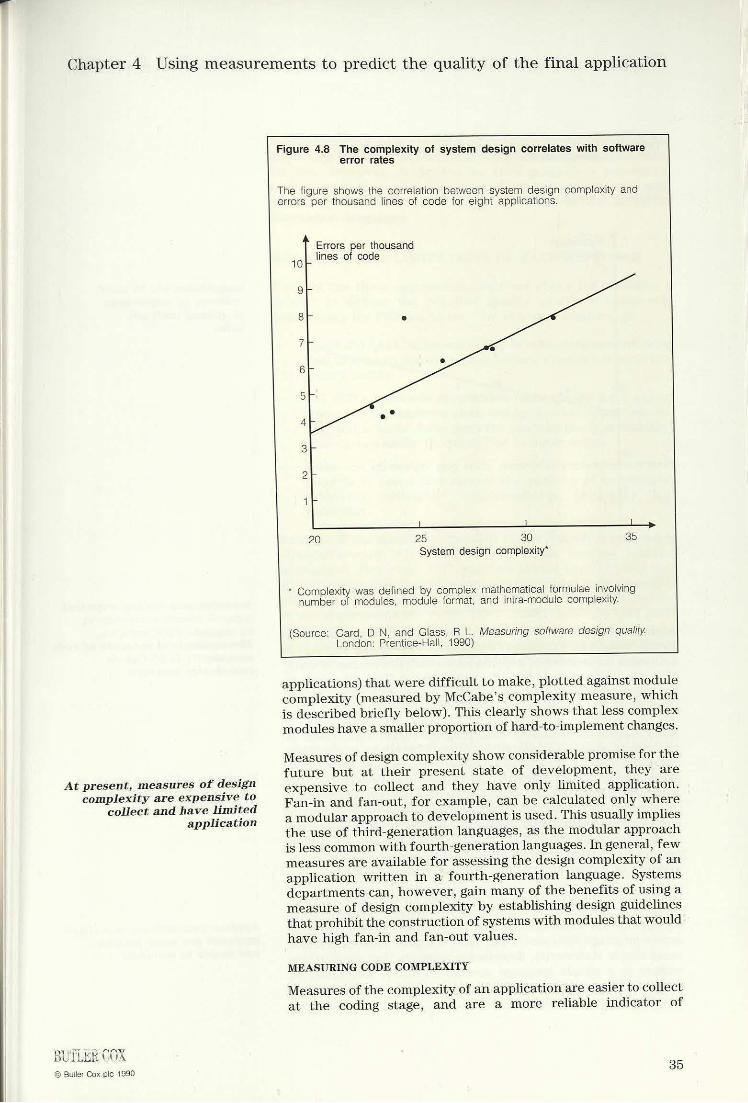
Chapter 4 Using measurements to predict the quality of the final application
At present, measures of designcomplexity are expensive to
collect and have limited
© Butler Cox pic 1990
application
Figure 4.8 The complexity of system design correlates with softwareerror rates
The figure shows the correlation between system design complexity anderrors per thousand lines of code for eight applications.
Errors per thousand|_ lines of code ! L !
20 25 30 35System design complexity*
* Complexity was defined by complex mathematical formulae involvingnumber of modules, module format, and intra-module complexity.
(Source: Card, D N, and Glass, R_L. Measuring software design quality. London: Prentice-Hall, 1990)
applications) that were difficult to make, plotted against modulecomplexity (measured by McCabe☂s complexity measure, whichis described briefly below). This clearly shows that less complexmodules have a smaller proportion of hard-to-implement changes.
Measuresof design complexity show considerable promisefor thefuture but at their present state of development, they areexpensive to collect and they have only limited application.Fan-in and fan-out, for example, can be calculated only wherea modular approach to developmentis used. This usually impliesthe use of third-generation languages, as the modular approachis less common with fourth-generation languages. In general, fewmeasures are available for assessing the design complexity of anapplication written in a fourth-generation language. Systemsdepartments can, however, gain many of the benefits of using ameasure of design complexity by establishing design guidelinesthat prohibit the construction of systems with modules that wouldhave high fan-in and fan-out values.MEASURING CODE COMPLEXITYMeasuresof the complexity of an application are easierto collectat the coding stage, and are a morereliable indicator of
35
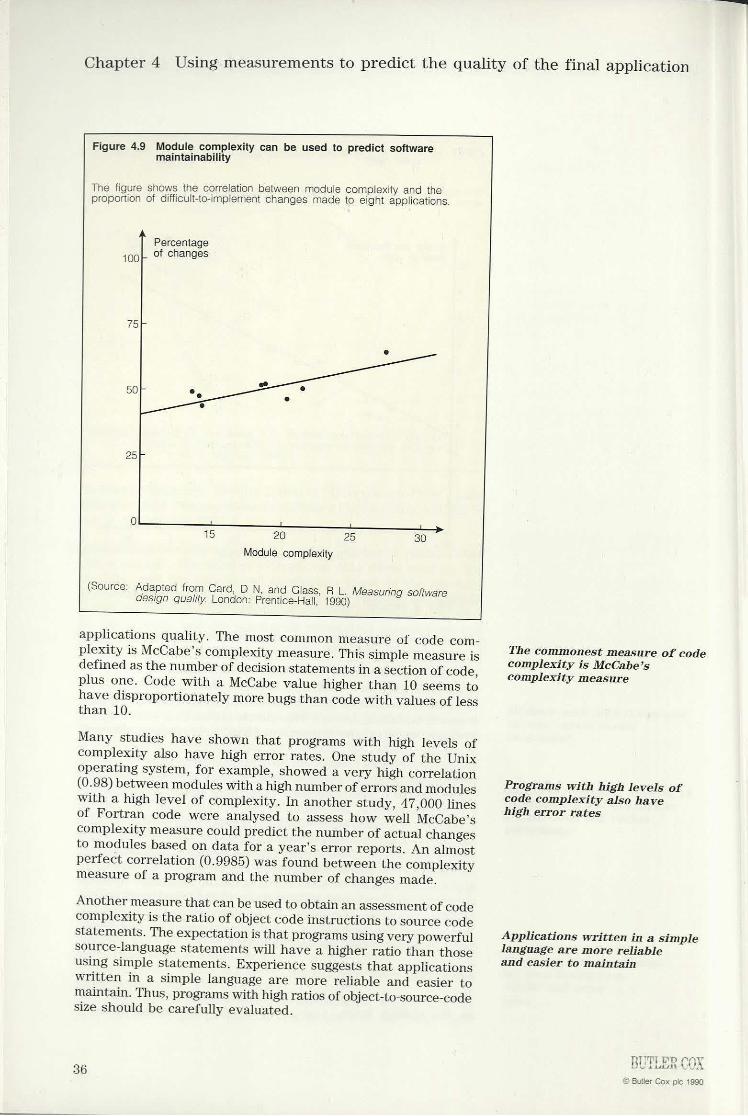
Chapter 4 Using measurements to predict the quality of the final application
Figure 4.9 Module complexity can be used to predict softwaremaintainability
The figure shows the correlation between module complexity and theproportion of difficult-to-implement changes made to eight applications.
A Percentage100 of changes
257 0 1 1 1 115 20 25 30Module complexity
(Source: Adapted from Card, D N, and Glass, R L. Measuring softwaredesign quality. London: Prentice-Hall, 1990) applications quality. The most common measure of code com-plexity is McCabe☂s complexity measure. This simple measureisdefined as the numberof decision statements in a section of code,plus one. Code with a McCabe value higher than 10 seems tohave disproportionately more bugs than code with valuesof lessthan 10.Many studies have shown that programs with high levels ofcomplexity also have high error rates. One study of the Unixoperating system, for example, showed a very high correlation(0.98) between modules witha high numberof errors and moduleswith a high level of complexity. In another study, 47,000 linesof Fortran code were analysed to assess how well McCabe☂scomplexity measure could predict the numberof actual changesto modules based on data for a year☂s error reports. An almostperfect correlation (0.9985) was found between the complexitymeasure of a program and the number of changes made.Another measurethat can be used to obtain an assessment of codecomplexity is the ratio of object code instructions to source codestatements. The expectationis that programsusing very powerfulsource-language statements will have a higher ratio than thoseusing simple statements. Experience suggests that applicationswritten in a simple language are more reliable and easier tomaintain. Thus, programs with highratios of object-to-source-codesize should be carefully evaluated.
The commonest measure of codecomplexity is McCabe☂scomplexity measure
Programs with high levels ofcode complexity also havehigh error rates
Applications written in a simpleJanguage are morereliableand easier to maintain
Cox pic 1990
Chapter 4 Using measurementsto predict the quality of the final application
None of the establishedapproaches to predict-
ing final quality isideal
Software quality measurementprogrammes should be able
to cope with changes in
jutler Cox pic 1990
the developmentprocess
Measurement of code complexity can be a useful technique forimprovingthereliability and maintainability of application code.Its use, however, is limited to third-generation procedurallanguages such as Cobol because there are, as yet, no wellestablished measuresof the complexity of code written in fourth-generation languages.
RECOGNISE THE LIMITATIONS OF EACH APPROACHNone of the three approaches described above for managing aproject to deliver the required quality profile is completelysatisfactory for PEP members. Our recommendations are:♥ Adapt the RADC approachto the development method being
usedin order to provide a more focused approach to software-quality audits.
♥ Use Gilb☂s approach to establish clear quality goals and tocreate the developmentplans and application-design featuresthat will achieve these goals for qualities (such as usability)that cannot easily be quantified in other ways.
♥ Make use of design and code complexity measures wherepossible to assess and control the qualities of correctness,reliability, efficiency, maintainability, testability, andflexibility.
Analysis of the measures discussed in this chapter is reasonablystraightforward while the development process remainsunchanged. However, PEP members should bear in mind thatadvancesin system development tools (integrated computer-aidedsoftware engineering, in particular) will leadto significant changesin the applications life cycle. They should therefore take greatcare in planningtheir software quality measurement programmeto ensure that future changes in the development process do notinvalidate a valuable set of software measurementdata.Wehave been concernedin this chapter with describing ways inwhich project managers can monitor the progress of an applicationby measuring the quality of the interim products of thedevelopmentprocess, and taking action to modify those productswhere the measuresindicate that the final quality is likely to beunsatisfactory. In most organisations, however, softwaremaintenance accounts for about the same amountof time andeffort as the development of new systems. The contribution thatsoftware quality measurement can maketo improving the qualityof existing applications and thereby reducing the cost of theirmaintenance is the subject of the next chapter.
37

Chapter 5
Measuring the quality of existing applications
So far in this report, we have concentrated on showing howsoftware quality measurements can be used as applications aredeveloped ♥ to improve the developmentprocessitself, to controlan applicationasit is developed, andto predict the quality of thefinal product. Much of the development department☂s workload,however,is concerned with maintainingexisting applications. Inthis chapter, we show how software quality measurement can beused to monitor and improve the quality of existing operationalapplications, thereby leading to a reduction in maintenancecosts.The quality of existing applications must, of course, be measuredin termsof the users☂ satisfaction with thefinal systems that aredelivered to them. This should not be too onerous a task sincea small numberof well chosen measureswill provide the basisof a comprehensive measurement programme. The data collectedin this process should be made widely available, and in the formthat most clearly demonstrates the point of a particular analysis.The analyseswill be of interest not only to those who collect andanalyse the data, but also to development staff, developmentmanagers, and user managers.It is in the interests of all thoseinvolvedto use software quality measurements to detect difficult-to-maintain or unreliable applications and to determine whichapplications can have their maintainability improved.
CREATE A USER-ORIENTED SET OF MEASURESOnce an application has been implemented,it is important toverify that it does, in fact, meet the users☂ quality requirements;the systems department must be able to demonstrate that it isdelivering the quality that was expected. In principle, usersatisfaction can be defined (on a scale of 0 to 1) as the qualityof the delivered application divided by the quality that the userswere expecting.To do this, systems departments need to present software qualitymeasurementsin termsthat are relevant to users☂ perceptions ofthe quality of the application rather than in termsthat indicatethe need for support from the systems department. For example:♥ Thereliability of an application should be measured in termsof failures per hundred hours of operation, rather than in termsof faults per thousandlines of code.♥ Theflexibility of an application should be specified in termsof the time taken to act on a request fora change, rather thanin terms of the total number of changes made.♥ Errors should beclassified by the impact they have on usersrather than by the type of design or coding fault that causedthem. Telling users that a particular class of error will cause
38
Software quality measurementcan be used to monitor andimprove the quality ofexisting applications
Quality measurement data shouldbe made widely available
Software quality measures mustbe presented in terms that arerelevant to users
Chapter 5 Measuring the quality of existing applications
User-oriented measures thereforeneed to be devised
A small numberof well chosenbasic measurements should
be adequate for mostprogrammes
It is not common practice, atpresent, for user managers
© Butler Cox pic 1990
to receive softwaremeasurementinformation
an application to be unavailable for use for several hoursismuch more meaningful than telling them that the problem wascaused by a coding error.
In our research, we were unable to identify a comprehensive setof measuresfor assessing the quality of existing applications. Wehave therefore taken each of the 11 RADC quality factors,described in Chapter 3, and devised an appropriate user-orientedmeasurefor it. (The RADC quality factors were originally definedto help manage andpredict quality during the developmentof anapplication.) In devising the measures, we have been consciousof the need for standardisation and comparability (the two mostimportant measurementselection criteria described in Chapter3).The measures we suggest are set out in Figure 5.1, overleaf. Itlists the basic data items that need to be captured from theapplication in order to produce the measures. The final☁calculation☂ columngives the formula for calculating each qualitymeasure from the basic data items. The calculations ensure thatthe measures are normalised so that they can be used to comparethe quality of different applications, where practical.
As in a database application, each of the basic data items mustbe carefully defined at the lowest level and in detail. For example,it is usually necessary to define the basic unit of staff effort ashours,to allow for the effects of overtime or different workinghoursin different locations. The relevantpart of the draft (and,as yet, unapproved) IEEE standard P-1061/D20 for a softwarequality metrics methodology (see Figure 5.2, on page 41) providesa useful template for the descriptions of the basic data items.
Since the same basic data items are needed for several of thesoftware quality measures, a comprehensive programme formeasuring the quality of existing applications can be based on asmall numberof well chosen basic measurements. These are listedin Figure 5.3, on page 41.
STORE THE INFORMATIONIN AN EASILYACCESSIBLE FORMEvenin large systems departments, the complexity and volumeof the basic data items needed for measuring the quality of existingapplicationsis not large, and many of them will be available inthe managementinformation systemsalready in use in the systemsdepartment(see Figure 5.4, on page 42). The data can easily bestored and manipulated on a spreadsheet system. As basic dataitems are entered into the spreadsheet, the quality measures canbe calculated automatically. Staff whocollect the information willthus receive instant analyses of it, but the database can also beeasily distributed to developmentstaff and managersto carry outtheir own analyses. Currently, it is not commonpractice for usermanagers to receive software measurement information (seeFigure 5.5, on page 42), but if they are to make informedjudgements, they, too, should receive the analyses.
Although the responsibility for data capture, and perhapsfirst-stage analysis, resides with development staff, the quality-assurance function must take overall responsibility for themanagement of the data and the production of the overall
39
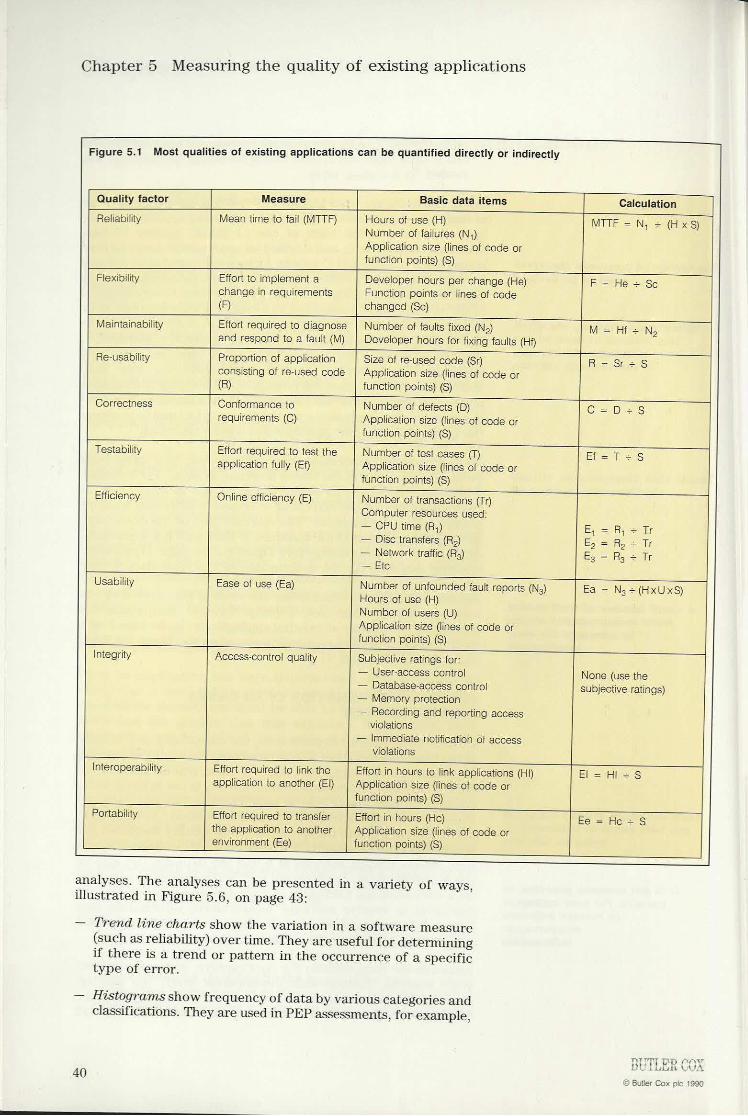
Chapter 5 Measuring the quality of existing applications
Figure 5.1 Most qualities of existing applications can be quantified directly or indirectly
Quality factor Measure Basic data items Calculation
Reliability Meantime to fail (MTTF) Hours of use (H) MTTF = N, = (HxS)Numberoffailures (Nj)Application size (lines of code orfunction points) (S)
Flexibility Effort to implement a Developer hours per change (He) F = He = Scchange in requirements Function points orlines of code(F) changed (Sc)Maintainability Effort required to diagnose
|
Numberoffaults fixed (No) M = Hf = Noand respondto a fault (M)
|
Developer hours for fixing faults (Hf)Re-usability Proportion of application Size of re-used code (Sr) R=Sr:Sconsisting of re-used code
|
Application size (lines of code or(R) function points) (S)Correctness Conformance to Numberof defects (D) C= pssrequirements (C) Application size (lines of code or
function points) (S)Testability Effort required to test the Numberof test cases (1) Be 3sapplication fully (Ef) Application size (lines of code or
function points) (S)Efficiency Online efficiency (E) Numberoftransactions (Tr)
Computer resources used:♥ CPUtime(R,) E, = R, + Tr♥ Disc transfers (Ro) Ep = Ro = Tr♥ Network traffic (Ra) E, = Rg + Tr= Ete
Usability Easeof use (Ea) Numberof unfounded fault reports (Na) Ea = N3 +(HxUxS)Hoursof use (H)Numberof users (U)Application size (lines of code orfunction points) (S)
Integrity Access-control quality Subjective ratings for:♥ User-access control♥ Database-accesscontrol♥ Memoryprotection♥ Recording and reporting access
violations♥ Immediate notification of access
violations
None(use thesubjective ratings)
the application to anotherenvironment (Ee) Interoperability Effort required to link the Effort in hours to link applications (HI) El = HI+Sapplication to another(El) Application size (lines of code or
function points) (S)Portability Effort required to transfer Effort in hours (He) Ee = HesApplication size (lines of code or
function points) (S)
analyses. The analyses can be presented in a variety of ways,illustrated in Figure 5.6, on page 43:♥ Trend line charts show the variation in a software measure(suchas reliability) over time. Theyare useful for determiningif there is a trend or pattern in the occurrence of a specifictype of error.♥ Histograms show frequencyof data by various categories andclassifications. They are used in PEP assessments, for example,
40
© Butler Cox pic 1990
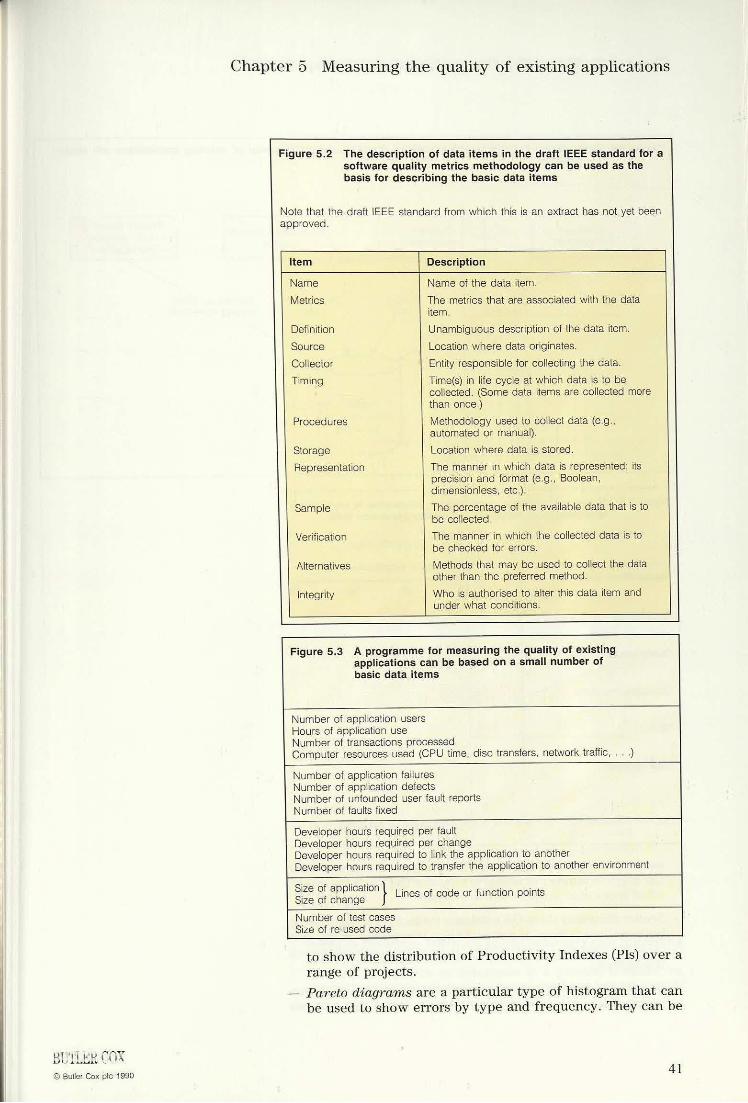
Chapter 5 Measuring the quality of existing applications
Figure 5.2 The description of data items in the draft IEEE standard for a
software quality metrics methodology can be used as thebasis for describing the basic data items
Note that the draft IEEE standard from whichthis is an extract has not yet beenapproved.
Item DescriptionName Nameof the data item.Metrics The metrics that are associated with the data
item.Definition Unambiguous description of the data item.Source Location where data originates.Collector Entity responsible for collecting the data.Timing Time(s)in life cycle at which data is to be
collected. (Some data items are collected morethan once.)
Procedures Methodology used to collect data (e.g.,automated or manual).
Storage Location where data is stored.Representation The mannerin which data is represented; its
precision and format (e.g., Boolean,dimensionless, etc.).
Sample The percentage of the available data thatis tobecollected.
Verification The mannerin which the collected data is tobe checkedfor errors.
Alternatives Methods that may be usedto collect the dataotherthan the preferred method.
Integrity Whois authorisedto alter this data item andunder what conditions. Figure 5.3 A programme for measuring the quality of existing
applications can be based on a small numberofbasic data items
Numberof application usersHours of application useNumberof transactions processedComputer resources used (CPUtime, disc transfers, networktraffic, . . )Numberof application failuresNumberof application defectsNumber of unfounded user fault reportsNumber offaults fixed Developer hours required perfaultDeveloper hours required per changeDeveloper hours required to link the application to anotherDeveloper hours required to transfer the application to another environment Size of applicationSize of change } Lines of code or function points Numberoftest casesSize of re-used code
to show the distribution of Productivity Indexes (PIs) over arange of projects.
♥ Pareto diagramsare a particular type of histogram that canbe used to show errors by type and frequency. They can be
© Buller Cox ple 1990 41
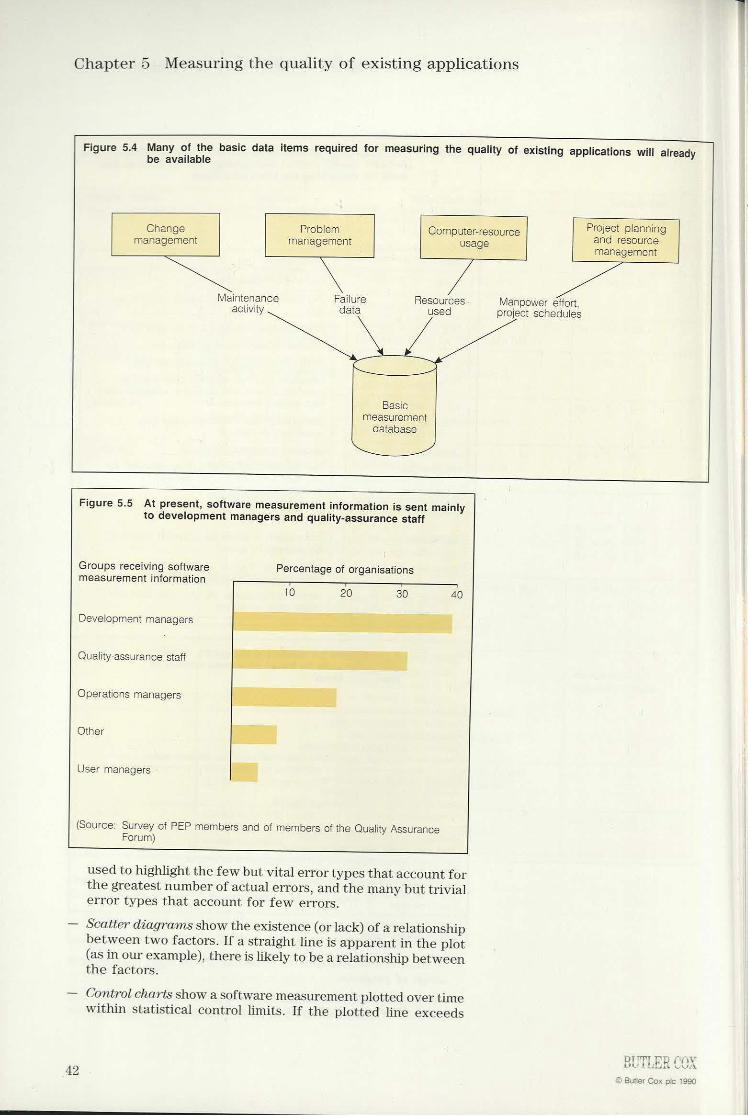
Chapter 5 Measuring the quality of existing applications
Figure 5.4 Manyof the basic data items required for measurin ig the quality of existing applications will already
activity
data
used project schedules Basicmeasurementdatabase
be available
Change Problem Computer-resource eeaesnagement eImanagement manag usage management
Maintenance Failure Resources Manpowereffort,
Figure 5.5 At present, software measurementinformation is sent mainlyto development managers and quality-assurancestaff
Groupsreceiving softwaremeasurementinformation Percentageof organisations
10 20 30Development managers
Quality-assurancestaff
Operations managers
Other
User managers
(Source: Survey of PEP members and of members of the Quality AssuranceForum) usedto highlight the few butvital error types that account forthe greatest numberof actualerrors, and the many buttrivialerror types that account for few errors.Scatter diagrams show the existence (or lack) of a relationshipbetween twofactors. If a straight line is apparentin the plot(as in our example), thereis likely to be a relationship betweenthe factors.Control charts show a software measurement plotted over timewithin statistical control limits. If the plotted line exceeds
42 © Butler Cox
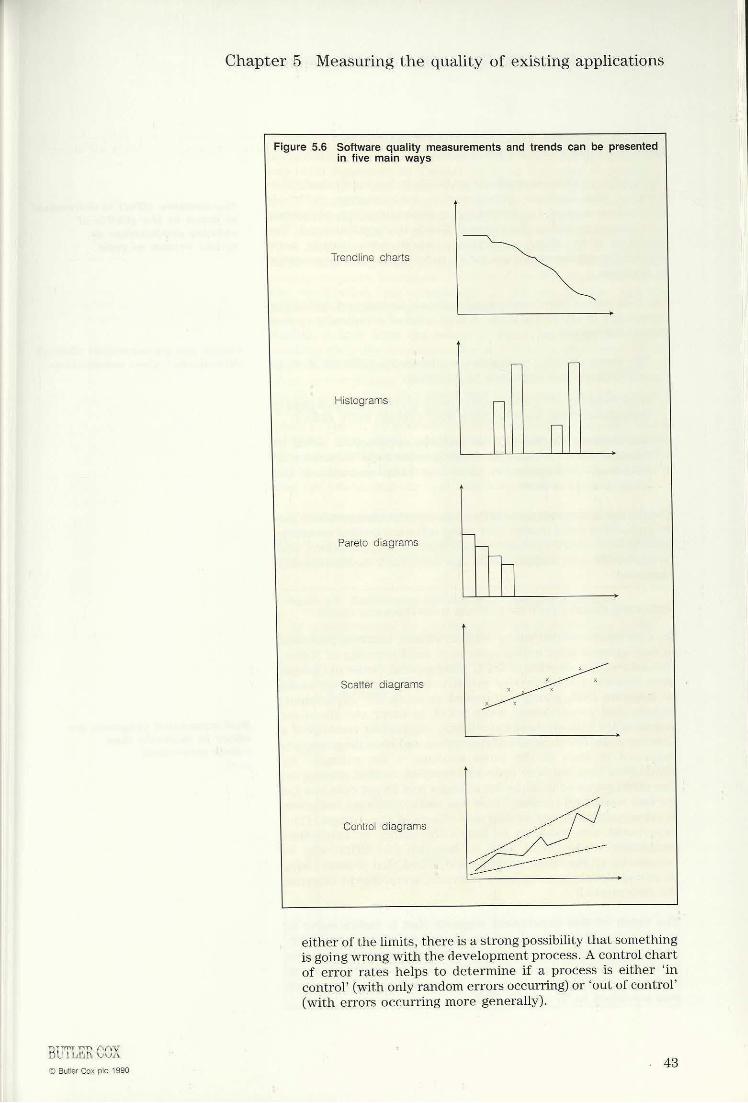
Chapter 5 Measuring the quality of existing applications
Figure 5.6 Software quality measurements and trends can be presentedin five main ways
Trendline charts
Histograms [
Pareto diagrams
Scatter diagrams
Control diagrams
eitherof the limits, there is a strong possibility that somethingis going wrong with the developmentprocess. A control chartof error rates helps to determine if a process is either ☁incontrol☂ (with only random errors occurring) or ☁out of control☂(with errors occurring more generally).
Cox ple 1990 - 43
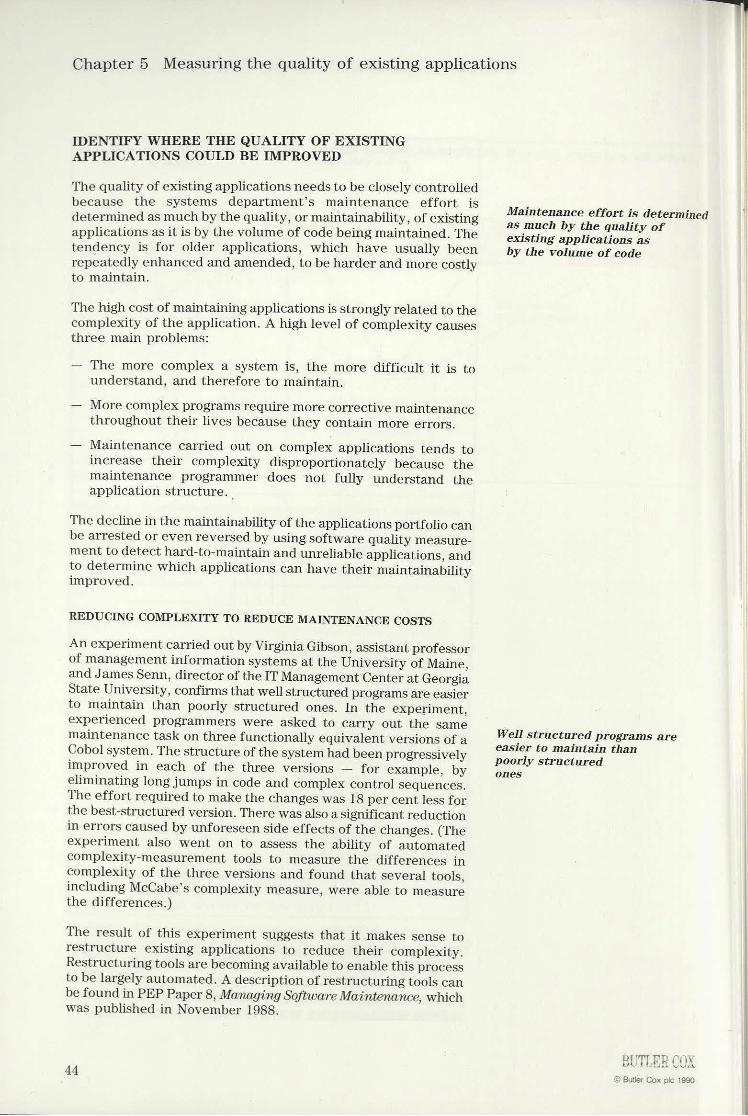
Chapter 5 Measuring the quality of existing applications
IDENTIFY WHERE THE QUALITY OF EXISTINGAPPLICATIONS COULD BE IMPROVED
The quality of existing applications needsto be closely controlledbecause the systems department☂s maintenance effort isdetermined as much bythe quality, or maintainability, of existingapplicationsasit is by the volumeof code being maintained. Thetendency is for older applications, which have usually beenrepeatedly enhanced and amended,to be harder and morecostlyto maintain.The high cost of maintaining applicationsis strongly related to thecomplexity of the application. A high level of complexity causesthree main problems:♥ The more complex a system is, the more difficult it is tounderstand, and therefore to maintain.♥ More complex programs require morecorrective maintenancethroughout their lives because they contain more errors.♥ Maintenance carried out on complex applications tends toincrease their complexity disproportionately because themaintenance programmer does not fully understand theapplication structure. _Thedecline in the maintainability of the applications portfolio canbe arrested or even reversed by using software quality measure-ment to detect hard-to-maintain and unreliable applications, andto determine which applications can have their maintainabilityimproved.
REDUCING COMPLEXITY TO REDUCE MAINTENANCE COSTSAn experimentcarried out by Virginia Gibson,assistant professorof managementinformation systemsat the University of Maine,and JamesSenn,director of the IT ManagementCenterat GeorgiaState University, confirmsthat well structured programsare easierto maintain than poorly structured ones. In the experiment,experienced programmers were asked to carry out the samemaintenancetask on three functionally equivalent versions of aCobol system. Thestructure of the system had been progressivelyimproved in each of the three versions ♥ for example, byeliminating long jumps in code and complex control sequences.The effort required to make the changes was 18 per centless forthe best-structured version. There was also a significant reductionin errors caused by unforeseenside effects of the changes. (Theexperiment also went on to assess the ability of automatedcomplexity-measurement tools to measure the differences incomplexity of the three versions and found that several tools,including McCabe☂s complexity measure, were able to measurethe differences.)The result of this experiment suggests that it makes sense torestructure existing applications to reduce their complexity.Restructuring tools are becoming available to enable this processto be largely automated. A description of restructuring tools canbe found in PEP Paper 8, Managing Software Maintenance, whichwas published in November 1988.
44
Maintenanceeffort is determined
as much bythe quality ofexisting applications asby the volumeof code
Well structured programs areeasier to maintain thanpoorly structuredones
ler Cox pic 1990
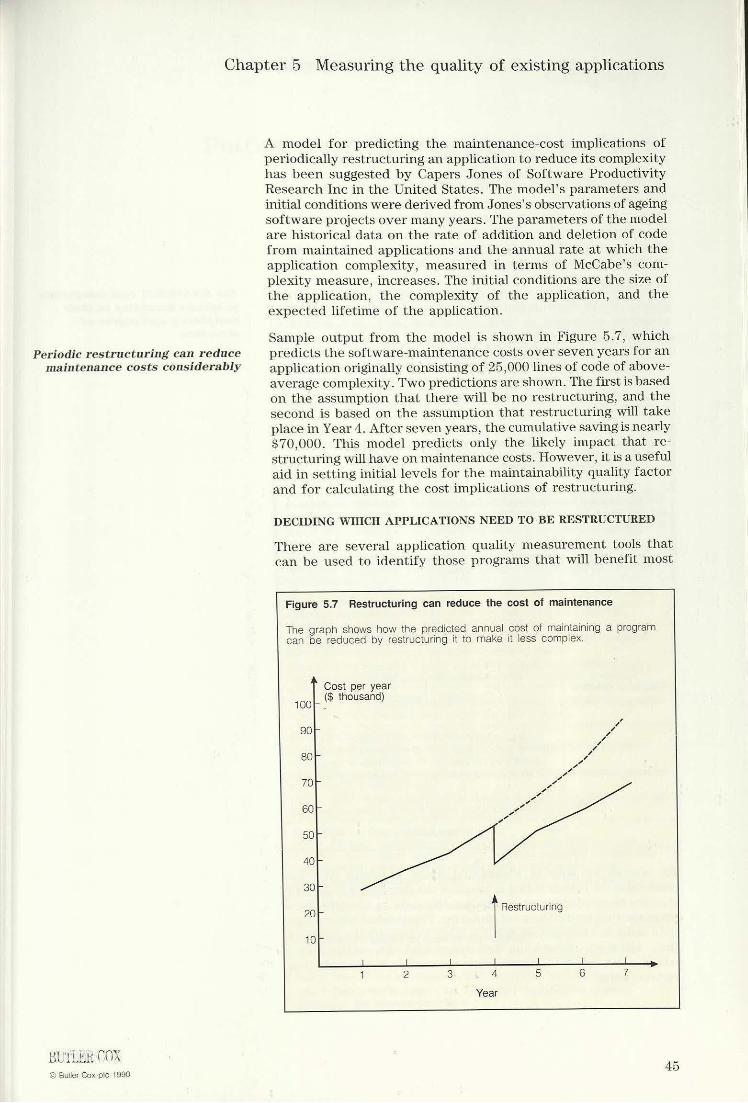
Chapter 5 Measuring the quality of existing applications
Periodic restructuring can reducemaintenance costs considerably
© Butler Cox pic 1990
A model for predicting the maintenance-cost implications ofperiodically restructuring an application to reduce its complexityhas been suggested by Capers Jones of Software ProductivityResearch Inc in the United States. The model☂s parameters andinitial conditions were derived from Jones☂s observations of ageingsoftware projects over many years. The parameters of the modelare historical data on the rate of addition and deletion of codefrom maintained applications and the annual rate at which theapplication complexity, measured in terms of McCabe☂s com-plexity measure, increases. The initial conditions are the size ofthe application, the complexity of the application, and theexpected lifetime of the application.Sample output from the model is shown in Figure 5.7, whichpredicts the software-maintenancecosts over seven years for anapplication originally consisting of 25,000 lines of code of above-average complexity. Two predictions are shown.Thefirst is basedon the assumption that there will be no restructuring, and thesecond is based on the assumption that restructuring will takeplace in Year 4. After seven years, the cumulative saving is nearly$70,000. This model predicts only the likely impact that re-structuring will have on maintenance costs. However, it isa usefulaid in settinginitial levels for the maintainability quality factorand for calculating the cost implications of restructuring.
DECIDING WHICH APPLICATIONS NEED TO BE RESTRUCTURED
There are several application quality measurement tools thatcan be used to identify those programs that will benefit most
Figure 5.7 Restructuring can reduce the cost of maintenance
The graph shows how the predicted annual cost of maintaining a programcan be reduced by restructuring it to make it less complex.
Cost per year\dtook & thousand)
gOsor
60P
40PF
20F Restructuring
45
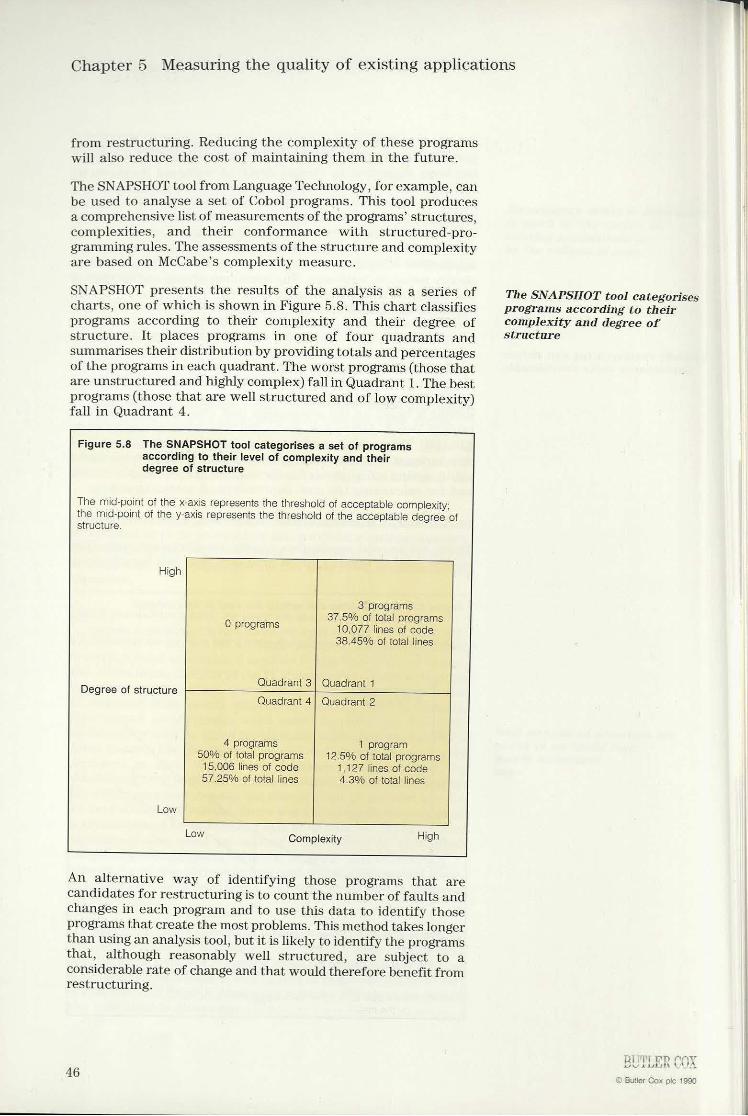
Chapter 5 Measuring the quality of existing applications
from restructuring. Reducing the complexity of these programswill also reduce the cost of maintaining them in the future.The SNAPSHOTtool from Language Technology, for example, canbe used to analyse a set of Cobol programs. This tool producesa comprehensivelist of measurements of the programs☂ structures,complexities, and their conformance with structured-pro-gramming rules. The assessments of the structure and complexityare based on McCabe☂s complexity measure.SNAPSHOTpresents the results of the analysis as a series ofcharts, one of which is shownin Figure 5.8. This chart classifiesprograms according to their complexity and their degree ofstructure. It places programs in one of four quadrants andsummarises their distribution by providing totals and percentagesof the programsin each quadrant. The worst programs(those thatare unstructured and highly complex)fall in Quadrant 1. The bestprograms(those that are well structured and of low complexity)fall in Quadrant 4.
Figure 5.8 The SNAPSHOTtoolcategorises a set of programsaccordingto their level of complexity and theirdegree of structure
The mid-point of the x-axis represents the threshold of acceptable complexity;the mid-point of the y-axis represents the threshold of the acceptable degree ofstructure.
High
3 programs37.5% of total programs0 programs 10,077lines of code38.45% oftotal lines
Quadrant 3} Quadrant1Quadrant 4} Quadrant 2 Degreeof structure 4 programs 1 program50% oftotal programs 12.5%of total programs15,006lines of code 1,127lines of code57.25%oftotal lines 4.3% oftotallines
Low
Low Complexity High An alternative way of identifying those programs that arecandidates for restructuringis to count the numberof faults andchangesin each program and to use this data to identify thoseprogramsthat create the most problems. This methodtakes longerthan using an analysis tool, butit is likely to identify the programsthat, although reasonably well structured, are subject to aconsiderable rate of change and that would therefore benefit fromrestructuring.
46
The SNAPSHOTtool categorisesprograms according to theircomplexity and degree ofstructure

Chapter 6
Putting a software quality measurementprogrammein place
In this paper, we have shown how a measurement programmecan be used to achieve practical goals, and how each type ofobjective can be achieved. Figure 6.1 summarisesthe actions thatsystems managers should take to ensurethat the software qualitymeasurement programmethat is put in place is practical andcomprehensive andthatit will have the support of both users andsystems developers. Figure 6.1 Action checklist
Improving the development processStep 1: \dentify software quality problem areas in the development process bygaining a full understanding of the area of concern and identifying alllikelycauses of development problems, for subsequent analysisStep 2: Analysethe likely causes of the problem that have beenidentified, usingcarefully selected software quality measurements to discover where the majorproblemslie.Step 3: Make changesto the process that will solve the problems that havebeen identified.Step 4: Use software quality measurements again to check that the changesintroduced have had the effect that was intended andthat no otherside-effectshave occurred. Controlling a developmentprojectStep 1: Establish measures that can be obtained during the applicationdevelopmentprocessthatwill indicate the ☁health☂ of the project.Step 2: Develop organisational norms for application development measuresfrom
a
historical database of measures of previous projects.Step 3: Collect measures from the application project being managed andcompare these measures with the normsestablished in Step 2 to identifyunusual measures.Step 4: Use the characteristic pattern of unusual measures to identify the actionrequired to bring the application project back under control. Defining users☂ quality requirementsStep 1: Understand andsetpriorities for users☂ quality requirements fromsurveys and from analysis of users☂ requirements.Step 2: Choose a comprehensive and usable set of quality measures, based onthe 11 RADC quality factors.Step 3: Define a unique set of quality priorities for each application and choosethose quality factors that will enable the quality priorities to be met.Predicting the final product qualityStep 1: Choose a combination of the three methods described in Chapter 4(quality of conformance, quality of design, empirical measures) that best suitsthe organisation☂s circumstances and the users☂ quality requirements.Step 2: Develop the chosen approach and fine-tuneit to the organisation☂sdevelopment environment.Step 3: Demonstrate the achievement of the correct quality with user-orientedsoftware quality measures. Measuring the quality of existing applicationsStep 1: Establish measures of maintainability (design and code complexity,numberof user changes, application failure rates, and so on).Step 2: Measure the application portfolio and identify the ☁bad apples.☂Step 3: Take action to improve the ☁bad apples☂ based on the problemsidentified by the measurement results.
© Butler Cox ple 1990 AT
Chapter 6 Putting a software quality measurement programmein place
Quality assurance has becomean essential part of the softwaredevelopment process, and quality measurement has, in turn,becomea critical element of the organisation☂s quality assurancetask. Without reliable measuresof the quality of the developmentprocess and of the final product, specifying and producingapplications of the quality that users require, assessing the effectsof changes to the developmentprocess, and justifying the costsof a software quality assurance programme will be virtuallyimpossible tasks for the systems development manager.
48
© Butler Cox pic 1990
© Butler Cox ple 1990
Bibliography
BooksCard, D N, and Glass, R L. Measuring software design quality.London: Prentice-Hall, 1990.Ehrenberg, ASC. A primer in data reduction: an introductorystatistics textbook. Chichester: John Wiley, 1986.Grady, R B, and Caswell, D L. Software metrics: establishing acompany-wide program. London:. Prentice-Hall, 1987.Ishikawa, K. What is total quality control? the Japanese way.London: Prentice-Hall, 1985.Vincent, J, Waters, A, and Sinclair, J. Software quality assurance:volume 1: practice and implementation. London: Prentice-Hall,1988.Vincent, J, Waters, A, and Sinclair, J. Software quality assurance:volume 2: a programguide. London: Prentice-Hall, 1988.StandardsStandard dictionary of measures to produce reliable software.IEEE 982.1. New York: Institute of Electrical and ElectronicsEngineers, 1988.Standardfor software quality metrics methodology. IEEE 1061.New York: Institute of Electrical and Electronics Engineers, 1989.
49
Butler CoxButler Cox is an independent, international con-sulting company specialising in areas relating toinformation technology.The company offers a unique blend of high-levelcommercial perspective and in-depth technicalexpertise: a capability which in recent years hasbeen put to the service of many of the world☂slargest and most successful organisations.The services provided include:Consulting for UsersGuiding and giving practical support to organisa-tionstrying to exploit technology effectively andsensibly.Consulting for SuppliersGuiding suppliers towards market opportunitiesand their exploitation.The Butler Cox FoundationKeeping major organisations abreast of develop-ments and their implications.Multiclient StudiesSurveying markets,their driving forces and poten-tial development.EducationThrough the Cranfield IT Institute (CITI),educating systems specialists, IT managers, linemanagers, and professionals to understand morefully how to apply and use today☂s technology.
PEPThe Butler Cox Productivity Enhancement Pro-gramme(PEP)is a participative service whose goalis to improve productivity in application systemsdevelopment.It providespractical help to systems developmentmanagers andidentifies the specific problems thatprevent them from using their developmentresources effectively. At the same time, the pro-gramme keeps these managers abreast of thelatest thinking and experience of experts andpractitioners in the field.The programmeconsists of individual guidance foreach subscriber in the form of a productivityassessment, and also publications and forummeetings commonto all subscribers.
©Butler Cox ple 1990
Productivity AssessmentEach subscribing organisation receives a confiden-tial managementassessmentofits systems develop-ment productivity. The assessment is based on acomparison of key development data fromselected subscriber projects against a large com-prehensive database.It is presentedin a detailedreport and subscribers are briefed at a meetingwith Butler Cox specialists.MeetingsEach quarterly PEP forum meetingfocuseson theissues highlighted in the previous PEP Paper. Themeetings give participants the opportunity todiscuss the topic in detail and to exchange viewswith managers from other memberorganisations.PEP PapersFour PEP Papers are produced each year. Theyconcentrate on specific aspects of system develop-mentproductivity and offer practical advice basedon recent research and experience. Thetopicsareselected to reflect the concerns of the memberswhile maintaining a balance between managementand technical issues.Previous PEP Papers1 Managing User Involvement in Systems
Development2 Computer-Aided Software Engineering (CASE)3 Planning and Managing Systems Development4 Requirements Definition: The Key to System
Development Productivity5 Managing Productivity in Systems Develop-
ment6 Managing Contemporary System Development
Methods7 Influence on Productivity of Staff Personality
and Team Working8 Managing Software Maintenance9 Quality Assurance in Systems Development10 Making Effective Use of Modern Development
Tools11 Organising the Systems Development Depart-
ment12 Trends in Systems Development Among PEPMembers13 Software Testing14 Software Quality MeasurementForthcoming PEP PapersSelecting Application PackagesProject Estimating and Control

Butler Cox ple
Butler Cox House, 12 Bloomsbury Square,London WC1A 2LL, England
® (071) 831 0101, Telex 8813717 BUTCOX GFax (071) 831 6250
Belgium and the NetherlandsButler Cox Benelux bvPrins Hendriklaan 52,
1075 BE Amsterdam, The Netherlands@ (020) 755 111, Fax (020) 755 331
FranceButler Cox SARL
Tour Akzo, 164 Rue Ambroise Croizat,93204 St Denis-Cédex 1, France@ (1) 48.20.61.64, Télécopieur (1) 48.20.72.58
Germany (FR), Austria, and SwitzerlandButler Cox GmbH
Richard-Wagner-Str. 13, 8000 Miinchen 2, West Germany@ (089) 5 23 40 01, Fax (089) 5 23 35 15Australia and New Zealand
Mr J CooperButler Cox Foundation
Level 10, 70 Pitt Street, Sydney, NSW 2000, Australia@ (02) 223 6922, Fax (02) 223 6997Finland
TT-Innovation OyMeritullinkatu 33, SF-00170 Helsinki, Finland@ (90) 135 1533, Fax (90) 135 2985
IrelandSD Consulting
72 Merrion Square, Dublin 2, Ireland®@ (01) 766088/762501, Telex 31077 EI,
Fax (01) 767945Italy
RSO Futura SrlVia Leopardi 1, 20123 Milano, Italy@ (02) 720 00 583, Fax (02) 806 800
ScandinaviaButler Cox Foundation Scandinavia AB
Jungfrudansen 21, Box 4040, 171 04 Solna, Sweden@ (08) 730 03 00, Fax (08) 730 15 67
Spain and PortugalT Network SA
Nuihez Morgado 3-6°b, 28036 Madrid, Spain@ (91) 733 9866, Fax (91) 733 9910