Corporate Water Stewardship: Achieving a Sustainable Balance


Achieving SoftwareQuality through Teamwork

For a listing of recent titles in the Artech House Computing Library,turn to the back of this book.

Achieving SoftwareQuality through Teamwork
Isabel Evans
Artech HouseBoston • London
www.artechhouse.com

Library of Congress Cataloging-in-Publication DataA catalog record for this book is available from the U.S. Library of Congress.
British Library Cataloguing in Publication DataEvans, Isabel
Achieving software quality through teamwork.—(Artech House computing library)1. Computer software—Quality control 2. Computer software—Development—Management3. Teams in the workplaceI. Title005.1’0684
ISBN 1-58053-662-XCover design by Yekaterina Ratner
© 2004 ARTECH HOUSE, INC.685 Canton StreetNorwood, MA 02062
The following are registered in the U.S. Patent and Trademark Office by Carnegie Mellon University: Capability Maturity Model,
CMM, and CMMI
. CMM Integration
SM, CMMI
SM, Personal Software Process
SM, PSP
SM, Team Software Process
SM, and TSP
SMare serv-
ice marks of Carnegie Mellon University; Capability Maturity Model
and CMM
are registered in the U.S. Patent and Trademark
Office.
Special permission to reproduce “Quotations from the SEI website (www.sei.cmu.edu), “2003, “Pathways to Process Maturity:
The Personal Software Process and Team Software Process” 2000 and “A Framework for Software Product Line Practice
Version 4.1” 2003 by Carnegie Mellon University, is granted by the Software Engineering Institute. No warranty. This Carnegie Mel-
lon University and Software Engineering Institue material is furnished on an “as is” basis. Carnegie Mellon University makes no war-
ranties of any kind, either expressed or implied as to any matter including, but not limited to, warranty of fitness for purpose or
merchantability, exclusivity or results obtained from use of the material. Carenegie Mellon University does not make any warranty of
any kind with respect to freedom from patent, trademark, or copyright infringement.
All material related to the EFQM model is Copyright © 1999–2003 by the European Foundation for Quality Management and is
reproduced here by permission of EFQM. Information about use of the EFQM Model is on the EFQM Web site http://www.efqm.org.
Crown copyright material is reproduced with the permission of the Controller of HMSO and the Queen’s Printer for Scotland.
Extracts from the “McCartney report” are under licence C02W0003641.
Extracts from DISC PD 0005: 1998 have been reproduced with the permission of BSI under license number 2003DH0297. British
Standards can be obtained from BSI Customer Services, 389 Chiswick High Road, London, W4 4AL. Tel +44 (0)20 8996 9001. E-mail:
MBTI
and Myers-Briggs Type Indicator
are registered trademarks of Consulting Psychologists Press Inc. Oxford Pyschologists
Press Ltd. has exclusive rights to the trademark in the UK. Extracts describing the MBTI are reproduced from the Team Technology
Web site by permission of Team Technology.
TPI
is a registered trademark of Sogeti Netherland B.V.
Appendix A, Table A.1: Belbin
is a registered trademark of Belbin Associates. Belbin Team Roles, from the work of Dr. Meredith
Belbin, are reproduced by permission of Belbin Associates and are © e-interplace, Belbin Associates, UK 2001. Reproducedby permis-
sion of Belbin Associates.
All rights reserved. Printed and bound in the United States of America. No part of this book may be reproduced or utilized in any
form or by any means, electronic or mechanical, including photocopying, recording, or by any information storage and retrieval sys-
tem, without permission in writing from the publisher.
All terms mentioned in this book that are known to be trademarks or service marks have been appropriately capitalized. Artech
House cannot attest to the accuracy of this information. Use of a term in this book should not be regarded as affecting the validity of any
trademark or service mark.
International Standard Book Number: 1-58053-662-X
10 9 8 7 6 5 4 3 2 1

For my brother, James, statistician, rock climber, mountaineer, 1958–2003.You encouraged me to write this book.

.

Contents
Forward xv
Preface xvii
Acknowledgments xxiii
1 Software Quality Matters . . . . . . . . . 1
1.1 Defining software quality 1
1.2 Fundamental concepts of excellence 5
1.3 EFQM Excellence Model 7
1.3.1 Enablers 7
1.3.2 Results 9
1.3.3 Excellence, the EFQM Excellence Model, the Malcolm Baldrige model,1.3.3 and other related models 10
1.4 ISO 9000:1994 and ISO 9000:2000 10
1.5 IT maturity models—CMM and relations 11
1.6 Team Software Process and Personal Software Process 12
1.7 Bringing the models together 13
References 15
Selected bibliography 16
2 Defining the Software Team . . . . . . . . 17
2.1 Teams in disunity 17
2.2 Defining the team 19
2.2.1 People who are customers and users of software 20
2.2.2 People who manage software projects 20
2.2.3 People who build software 21
2.2.4 People who measure software quality 21
2.2.5 People who provide the support and infrastructure for the project2.2.5 and the deployment of software 22
vii

2.3 Interaction between the groups and within each group 22
2.3.1 Differences in quality viewpoints 22
2.3.2 Intergroup relationships in CMM and Personal and Team Software2.3.2 Processes 24
2.3.3 Intergroup relationships and excellence frameworks—2.3.3 the EFQM Excellence Model 25
References 28
Selected bibliography 28
3 Roles and Quality: Customers . . . . . . . 31
3.1 Introducing the customers 31
3.2 Who could be in this group? 32
3.2.1 In-house customer 33
3.2.2 Third-party custom-made system customer 35
3.2.3 Third-party package or commercial off-the-shelf (COTS) customer 36
3.2.4 The IT specialist as customer 38
3.3 Quality viewpoint 38
3.4 Quality framework using the EFQM Excellence Model 39
3.4.1 The EFQM Excellence Model and the customer organization 39
3.4.2 EFQM Excellence Model enablers for customers 40
3.4.3 EFQM Excellence Model results for the customers 43
3.5 Communication between the customers and other groups 45
3.6 Summary of the group 47
References 49
Selected bibliography 49
4 Roles and Quality: Managers . . . . . . . . 51
4.1 Introducing the managers 51
4.2 Who could be in this group? 52
4.3 Quality viewpoint 53
4.4 Quality framework using the EFQM Excellence Model 54
4.4.1 The EFQM Excellence Model and the manager 54
4.4.2 EFQM Excellence Model enablers for the managers 57
4.4.3 EFQM Excellence Model results for the managers 65
4.5 Communication between the managers and other groups 68
4.5.1 Managers and communication cycles 68
4.5.2 The reporting process 70
4.6 Summary of the group 73
References 74
Selected bibliography 75
viii Contents

5 Roles and Quality: Builders . . . . . . . . 77
5.1 Introducing the builders 77
5.2 Who could be in this group? 79
5.3 Quality viewpoint 80
5.4 Quality framework using the EFQM Excellence Model 86
5.4.1 The EFQM Excellence Model and the builders 86
5.4.2 EFQM Excellence Model enablers for builders 87
5.4.3 EFQM Excellence Model results for the builders 92
5.5 Communication between the builders and other groups 95
5.6 Summary of the group 96
References 97
Selected bibliography 98
6 Roles and Quality: Measurers . . . . . . . 101
6.1 Introducing the measurers 101
6.1.1 Why do we need QA and QC? 101
6.1.2 Just measurers or also improvers of quality? 102
6.1.3 Defect prevention 103
6.1.4 The Hawthorne effect 105
6.2 Who could be in this group? 106
6.3 Quality viewpoint 106
6.4 Quality framework using the EFQM Excellence Model 113
6.4.1 The EFQM Excellence Model and the measurers 113
6.4.2 EFQM Excellence Model enablers for the measurers 114
6.4.3 EFQM Excellence Model results for the measurers 123
6.5 Communication between the measurers and other groups 125
6.6 Summary of the group 128
References 129
Selected bibliography 129
7 Roles and Quality: Supporters . . . . . . . 131
7.1 Introducing the supporters 131
7.2 Who could be in this group? 133
7.3 Quality viewpoint 134
7.4 Quality framework using the EFQM Excellence Model 136
7.4.1 The EFQM Excellence Model and the supporter 136
7.4.2 Enablers for the supporters 138
7.4.3 Results for the supporters 143
7.5 Communication between supporters and other groups 146
7.6 Summary of the group 147
Contents ix

7.7 Summary of all the groups 148
References 150
Selected bibliography 151
8 The Life Span of a Software System . . . . . 153
8.1 Life span or life cycle? 153
8.1.1 Start-up 155
8.1.2 Development 155
8.1.3 Delivery 156
8.1.4 Postdelivery 156
8.2 Entry and exit criteria between stages 157
8.3 Changes in quality viewpoints across the life span of a system 158
References 159
9 Start-Up for a Software-Development Project . . 161
9.1 Start-up—description 161
9.2 Start-up viewpoints 163
9.3 Entry criteria for start-up 164
9.4 Start-up—typical activities 165
9.4.1 Understanding the problem/idea 165
9.4.2 Decide whether the problem/idea is worth solving 168
9.4.3 Set general constraints and parameters for the solution 170
9.4.4 Agree on next stage 170
9.4.5 Contract for work 171
9.5 Exit from start-up stage 178
References 179
Selected bibliography 180
10 Software-Development Life Cycle . . . . . . 181
10.1 Software-development life cycle—description 181
10.1.1 Types of software acquisition project 182
10.1.2 Identifying the software products 183
10.1.3 SDLC task summary 183
10.2 SDLC viewpoints 184
10.3 Entry criteria for SDLC 186
10.3.1 Entry criteria following a detailed start-up 186
10.3.2 When no entry criteria have been defined 187
10.3.3 When entry criteria have not been met 187
10.3.4 Tailoring entry criteria 189
10.3.5 When no start-up stage took place 190
x Contents

10.4 SDLC—typical activities 190
10.4.1 Planning and monitoring 190
10.4.2 Managing change 191
10.4.3 Requirements 192
10.4.4 Design 193
10.4.5 Build 193
10.4.6 Testing 194
10.5 Entry and exit points within the SDLC 195
10.6 SDLC models 195
10.6.1 Waterfall model (big bang or phased) 196
10.6.2 Spiral, incremental, and iterative models 199
10.6.3 Evolutionary model 203
10.6.4 V-model 203
10.6.5 Advantages and disadvantages of the models 204
10.7 Quality views and the models—why we might wish10.7 to combine models 204
10.8 Exit from the SDLC 208
10.8.1 Exit criteria following a detailed acceptance test 208
10.8.2 When no exit criteria have been defined 209
10.8.3 When exit criteria have not been met 210
10.8.4 Tailoring exit criteria 210
10.8.5 When no acceptance criteria have been set 210
10.9 Conclusion 211
References 212
Selected bibliography 213
11 Delivery and Support When Going Live . . . . 215
11.1 Delivery—description 215
11.1.1 Delivery considerations 215
11.1.2 Identifying the delivery 217
11.2 Delivery viewpoints 218
11.3 Entry criteria for delivery 221
11.4 Delivery—typical activities 221
11.4.1 Person buys PC and software for self-installation 223
11.4.2 Single-site delivery of software 224
11.4.3 Multisite rollout of new software to existing infrastructure 224
11.4.4 Data migration project software and hardware changes 225
11.5 Exit from delivery 226
11.6 Conclusion 226
References 227
Selected bibliography 227
Contents xi

12 The Life of a System Postdelivery . . . . . . 229
12.1 Postdelivery—description 229
12.1.1 Postdelivery for different types of software acquisitions 230
12.2 Delivery viewpoints 231
12.3 Entry criteria for postdelivery 233
12.4 Postdelivery—typical activities 233
12.4.1 Use of the system 233
12.4.2 IT infrastructure and service management activities 234
12.4.3 Making changes to an existing system 236
12.4.4 Monitoring and evaluation 241
12.5 Exit from postdelivery 244
12.6 Conclusion 244
References 246
Selected bibliography 247
A Techniques and Methods . . . . . . . . 249
A.1 Communication, team dynamics, and meeting behavior 249
A.1.1 Belbin Team Roles 250
A.1.2 De Bono’s Six Thinking Hats 251
A.2 Communication styles 253
A.2.1 Myers-Briggs Type Indicators 253
A.2.2 Honey and Mumford Learning Styles 254
A.2.3 Kirton adaptors and innovators 255
A.2.4 Motivation studies 256
A.2.5 Transactional analysis 257
A.3 Techniques to identify and classify problems andA.3 assess ideas for solutions 259
A.3.1 Cause–effect, root cause, and solution analysis 259
A.3.2 Prototyping and ideas modeling 261
A.3.3 Assessing whether an idea is worth pursuing 262
A.4 Understanding aims and objectives 265
A.5 Review techniques 266
A.6 Improving graphics in reporting 267
A.7 Useful sources and groups 269
References 270
Selected bibliography 272
B Quality Planning Documents and Templates . . 273
B.1 The document family 273
B.2 Why we use document templates 275
xii Contents

B.3 Using the document standards to provide your own templates 278
B.4 Auditing considerations 278
B.5 The team’s information needs 278
B.6 Adapting templates 279
B.7 Keep it brief—do not repeat or copy information 279
B.8 Do you need a document at all? 279
B.9 Simple project audit plan and report templates 280
References 282
About the Author . . . . . . . . . . . 283
Index . . . . . . . . . . . . . . . 285
Contents xiii

.

Foreword
If you are in IT, you probably think of yourself as a technical person. Oftenthe emphasis is very much on the “technical” rather than the “person.” Yet,as Isabel points out, the majority of problems in IT are due to people prob-lems, not technical ones. Yes, producing quality software is a technical activ-ity, but software is produced by people, complete with talents and abilities,but also personalities, idiosyncracies, foibles, and emotions, and these peo-ple produce IT systems in teams, where the roles and perspectives of eachteam can differ significantly, especially about what constitutes quality.
If every person has a different view of what quality is, and the peopleinvolved don’t communicate well, is it any wonder that major problemsarise? What is the solution? Is it better processes? That has been tried. Is it amaturity model? That has been tried. Yet problems still abound, and peopleare still surprised by the fact that there are still problems with people!
Isabel sprinkles this book with numerous “overheard conversations”within IT organizations. Why do customers find developers arrogant? Whydo developers lack appreciation of business issues? Why do support staff feelleft out? Why do managers not appreciate the value of testing? I frequentlyfind myself in conversation with IT people, particularly testers and test man-agers, and I hear them saying many of the things that Isabel describes. Thisbook not only explains what is going on, but also shows how things can beimproved, bringing the ideas to life through Isabel’s rich source of anec-dotes. Reading this book will help you understand the viewpoint of the verypeople you often complain about!
The use of the EFQM Excellence Model as a framework to structure thebook gives a solid foundation for comparing different models of quality andshows where the different roles of the people involved fit together in a soft-ware development project and the life of that system. From a technical per-spective, the book gives useful guidance on achieving quality; Appendix Bincludes a summary of quality documents.
The project advice contained in the start-up section in Chapter 9 alonecould be worth the price of this book; it could save you a lot of time, money,and mistakes and is an aspect frequently overlooked and underemphasized.Appendix A is also a useful handbook on its own—a concise summary of
xv

people- and teamwork-related techniques and methods and where to go forfurther information.
This book will increase your understanding of the people with whomyou work. It may cause a wry smile or two as you recognize the behaviordescribed “to a T” of a colleague. Then you may find yourself thinking, “Sothat’s what they’re thinking, that’s why they do that; I never realized.” Per-haps you will even recognize yourself and realize why other people don’tseem to understand your view of quality.
This book is a rare breed. It explains why people issues are important, yetit does so in a way that will appeal to technical people.
Dorothy GrahamSenior ConsultantGrove Consultants
Macclesfield, United KingdomMay 2004
xvi Foreword

Preface
The cost of failed IT projects in the United States was recently estimated at$84 billion in just 1 year [1], so software quality matters more now than itever has, and it matters to you and me because we use that software. For allof us, our reliance on software is increasing year by year whether we realizeit or not. More of us are using software for more tasks than ever before,in information technology (IT), information systems (IS) for businesses,embedded systems in consumer goods such as phones, and, of course, acrossthe Internet [2]. The risks associated with software failure have increasedwith the use of software; these include greater exposure for organizationswhen software fails or is unsatisfactory, and greater disappointment or lossfor individuals when they are let down by software.
Meanwhile, pressures on modern organizations, including businesses,have increased in recent years. Pressures on organizations—the importanceof time to market, cost reduction, value for money, increased expectationand knowledge of customers, global communications, constant change, andthe need to find new markets—become pressures on software teams to pro-duce more software, more quickly, with increased expectations of what thatsoftware can deliver as benefits.
Why is IT so often disappointing? Why isn't software built correctly?One reason is quite simple: IT systems are built by people, and people makemistakes. This is true for any human activity, but in IT we have a number ofexacerbating circumstances:
◗ IT systems are often built by teams of people other than those whowill use them. In these circumstances, any poor communicationbetween people and teams increases the chances of mistakes.
◗ IT is relatively new, and we are working on a continuous learningcurve. Both the suppliers and users of software rarely have time to con-solidate knowledge before they face yet more change.
◗ IT departments are notorious for their failure to align the software theyproduce with the culture, processes, or objectives of the business forwhich the software is intended.
xvii

◗ IT systems are complex, and are becoming increasingly so in them-selves and in their intercommunications with other systems.
Only one of these (the last) is a technical problem, yet most of theemphasis for IT groups seeking improvement is on technical processes. Allthe other points in the list have to do with people, their ability to communi-cate well and understand each other, and their ability to learn from eachother and from experience.
We need a framework for IT projects that addresses the issues of soft-ware quality through an emphasis on teamwork and communication set ina framework aligned with the customers, their organizations, and theirgoals. To help achieve this goal, Achieving Software Quality through Teamworkanswers the following questions:
◗ Who should be involved in the development and deployment of soft-ware? People are going to work in teams to provide the software, sowe need the right teams.
◗ What are the differences and similarities between these people, espe-cially in their assumptions about quality? To achieve quality, the teamneeds to agree on what quality is.
◗ What are the ways of understanding communication preferences andhow conflict can arise from differences between these preferences?Teamwork requires mutual understanding and tolerance incommunication.
◗ How can that understanding be improved? By providing opportunitiesfor communication within and around the IT and organizationalprocesses, teamwork and communication are encouraged so that qual-ity is achieved.
◗ How can IT suppliers understand the goals of their client organiza-tions, whether nonprofit or commercial businesses, and how theymeasure success? IT suppliers must have an understanding of thequality framework used by their customers in order to produce qual-ity software. IT teamwork means including the customers.
This book was written in response to a number of people with whom Ihave worked over the years. It is for you if you, like they, have ever saidthings like:
◗ We’ve improved the processes, so why are the customers stillunhappy?
◗ I just can’t talk to the people in the business units (or IT, or manage-ment, and so forth). How can we understand each other?
◗ Why do they keep sending e-mails to me when I’d rather talk face-to-face?
◗ How can I provide quality if the managers just talk about costs?
xviii Preface

◗ How can I align my goals with what the customer really needs?
◗ Why do the IT people always deliver the wrong thing?
◗ What do the managers really do?
◗ I have just started as a team leader. What do I need to think about?
◗ Who needs to be involved at this stage?
◗ Why don’t the people in my team get along?
◗ Why do we always end up having an argument?
◗ We could get on with this if people stopped arguing!
◗ We’ve done some process improvements, and we’ve still got problems.
◗ I can’t stand all this touchy-feely people stuff. Can’t you just give mea process?
◗ Why do the IT people always cringe when I want to do a team-building exercise?
I hope you enjoy yourself!As I wrote, I imagined you reading this book. One colleague who reviewedsome chapters said to me, “I want to imagine that we are sitting by the firewith a glass of wine, sharing ideas and experiences,” and that is what Iwanted the atmosphere of the book to be like. I have used experience-basedanecdotes rather than scientifically gathered evidence. The stories I tellinclude lessons I have learned (and am still learning!) from my own mis-takes, situations I have observed, and anecdotes from colleagues and clients,and I hope that when you read them you will respond with “Oh, yes! Thatreminds me of when.…”
So enjoy this book; feel free to browse and dip into it as well as read itthrough. A key message from it is that there is more than one way of think-ing, and we are sensible to acknowledge them all, however strange theyseem to us. So bring your own ideas to the book and read interactively!
This is a huge subjectThis book is for you if you need an overview of a huge subject in one book,and the chance to find out more about the details that particularly interestyou. I have covered the whole life of a software system, together withdescribing all the people involved, so this is a sketchbook of what you needto consider, with extensive references to further information.
As you are busy, when you want further information you will need to getto it quickly and easily. To help you, wherever possible I have given severalreferences whenever possible to newer publications, including Web sites,short books or papers, or books that I have been able to locate in a libraryrather than have to order, so that you can get the next level of detail quickly
I hope you enjoy yourself! xix

and easily. I have also provided original book or paper citations, either in thereferences or in the selected bibliography in each chapter, so that if you justneed a little more information you can get it easily, but you can also findmore depth when you need it.
In Appendix A, I have given some suggested Internet search words foreach technique that I describe, as some of the references, especially for Websites, may change. I have also provided a list of useful organizations fromwhich you will be able to find more information.
Remember, this book is an overview and as a result there are many ref-erences, techniques, standards, methods, and frameworks that I have notcovered, but that should not inhibit you from considering them for yourown situation. If you prefer a different method at a particular point, simplyincorporate it into your recipe for success.
Finding your way around this bookThree of the chapters in the book provide overviews of ideas presented inthe chapters that follow them:
◗ Chapter 1 provides an overview of quality concepts used throughoutthe book.
◗ Chapter 2 provides an overview of the groups discussed in Chapters 3to 7.
◗ Chapter 8 provides an overview of the software life span described inChapters 9 to 12.
Chapter 1 sets out some ideas and definitions that are used throughoutthe book. Read this chapter first, as the ideas introduced are used through-out the book. I describe five definitions of quality and a number of quality orexcellence frameworks that provide the basis for the discussion in the rest ofthe book. Each definition of quality provides a different viewpoint aboutquality—what it is and how we might measure it. Some of the frameworksare organizational—the business will use them to set and check its direction.Others are IT-specific. I show how the organizational and IT standards canfit together.
Chapter 2 provides an overview of the groups of people who areinvolved in software, whether as producers or users. I have divided peopleinto five groups: customers, managers, builders, measurers, and supporters.I am not suggesting that an individual is assigned a role within a group, oralways stays within one group. Instead, I show how the five groups fit withparticular quality viewpoints, and that many people move between groups.
Chapters 3 to 7 each describe one of the groups in detail. Most readerswill find that they fit most closely into one of the groups, but spend sometime in the other groups. Read these chapters to get an overview of whateach group does and what its viewpoints are, so that you understand eachother better. Each of these chapters provides an overview of that group,
xx Preface

based on the organizational framework and the quality viewpointsdescribed in Chapter 1:
◗ Chapter 3 describes the customers and users of software systems.
◗ Chapter 4 describes the people who manage software projects andservices.
◗ Chapter 5 describes people who build products, not just the developersbut also technical authors, training providers, business analysts, anddesigners.
◗ Chapter 6 describes people who measure the quality of products andprocesses: the testers, inspectors, document reviewers, and auditors.
◗ Chapter 7 describes the people who support the software during itsdevelopment and deployment, by providing infrastructure for thesoftware and tools used to build and test it, as well as supporting thepeople who build, test, deliver, service, and use the system.
Chapter 8 gives an overview of the life of a piece of software or a systemfrom the moment it is conceived as an idea, through the software develop-ment life cycle, as it is installed or delivered, throughout its deployment as alive or production system, its maintenance and updating, and, finally, itsdecommissioning. It introduces Chapters 9 to 12, in which I discuss howcommunication needs to be considered and improved by all the groupsthroughout the life of a software system. I have only described the tech-niques applied by particular groups when they have an effect on communi-cation and teamwork; the chapters are not intended to explain everythingabout software projects but to highlight some aids to mutual understanding.For example, quality gates, or entry and exit criteria, between stages in aproject are important for process definition, and reviews are important foridentifying defects in products but they are both also important communica-tion points between the groups described in Chapters 2 to 7.
◗ Chapter 9 discusses what happens before we start to build soft-ware—we realize we have a problem to solve or an opportunity tograb, and we must decide whether we need software or somethingelse to solve our problem. It covers problem and solution analysis, riskanalysis, and setting the contract for the software development lifecycle, describing how to improve communication and understandingin order to launch the right project.
◗ Chapter 10 describes the software development life cycle and providesan overview of some models for software development, comparing andcontrasting the models’ effect on effective communication and team-work between groups.
◗ Chapter 11 describes the point of implementation of the software, typesof delivery, and what information is needed by different groups at thispoint.
Finding your way around this book xxi

◗ Chapter 12 describes the life of software once it is in use, and discussesthe importance of continued communication for evaluation of theprevious stages and for maintenance and optimization of thesoftware.
Throughout these chapters I refer to a number of techniques for under-standing other people’s communication styles. In Appendix A, I provide asummary of these techniques and sources for more detailed information. InAppendix B, I provide more information about tailoring standards anddocuments for a project based on published national and internationalstandards.
References
[1] Smith, K., “The Software Industry’s Bug Problem,” Quality Digest, reproduced onhttp://www.qualitydigest.com, April 2003.
[2] Sol, E. -J., “The Embedded Internet—Towards 100 Billion Devices,” EuroSTARConference, Stockholm, Sweden, 2001.
xxii Preface

Acknowledgments
Naturally, a book like this is only built on other people’s work and efforts,and you will see from the references that many practitioners and authorshave supported me by being earlier writers in the same areas of thought.This book weaves together threads that others have spun. I thank them allfor their inspiration over the years.
Many people helped me while I was writing this book, by their encour-agement, discussing ideas, providing support, and reviewing material. Col-leagues and clients have contributed with enormous generosity, discussingand challenging ideas, commenting and reviewing material and drafts, sug-gesting additional references, and providing valuable insights into the sub-ject. They encouraged me to continue; their comments, stories, and ideashave improved the book immeasurably. I wish to thank, among others, RickCraig, Dorothy Graham, Frank Johnstone, Mike Bowdon, Stuart Reid , PaulGerrard, Richard Warden, Tom Gilb, Julian Harty, David Hayman, Mike Hol-combe, Brenda Hubbard, John Smith, Norman Hughes, Kai Gilb, Jane Jeffs,Simon Mitchley, Fiona Powell, Lloyd Roden, Mike Smith, Jayne Weaver,Graham Thomas, Geoff Thompson, Neil Thompson, Erik van Veenendaal,John Watkins, Steve Allott, Jayne Weaver, Clive Bates, Mark Fewster, PatMyles, and Ian Bennett. I could not have completed this without the help ofBarbara Eastman, who encouraged me, proofread drafts, and pursued per-missions. Richard Delingpole’s graphic design expertise turned my roughideas into elegant figures. Tiina Ruonamaa, Tim Pitts, and the team of editorsat Artech House supported me throughout the project and kept me on track.
It is an honor for me that Dorothy Graham has written the forewordto this book. Thank you, Dorothy, for your help, encouragement, andfriendship.
My family has supported my writing during a bad year for usall—thank you. Finally, my partner, Dave, has been an unfailing supportthroughout—thank you, Dave, for everything you have done.
My thanks to all of you for your help; the book would not have beenpossible without you. As I am human, there will be mistakes in the book;the mistakes, of course, are my own.
xxiii

.

Software Quality Matters
In this chapter I shall:
◗ Demonstrate that there is no universal definition of quality:it varies with people and situation;
◗ Offer several definitions of quality;
◗ Show why it is necessary for all stakeholders in the software toagree on what they mean by “quality”;
◗ Introduce some models for managing quality;
◗ Show how you can integrate these models.
The developers are always so enthusiastic about the wonderful
new software when they hand it over for me to develop the train-
ing. Then the “buts” start … they tell me that when I demonstrate
the software I need to keep away from this transaction because of
the outstanding defects, and to watch out for the finance director
who’s still sore about the budget overrun. They tell me the inter-
face the users wanted wasn’t feasible and preparation of user
manuals has been de-scoped to a postlaunch activity. Once, on the
morning of the first course, the company announced that the new
software would “enable moving 40% of jobs overseas.” “Negative
trainees” would be an understatement!
—Trainer pointing out some forgotten aspects of quality
1.1 Defining software qualityLet us start looking at quality by examining the story above.What do the trainer’s frustrations reveal about our views ofquality?
1. The delivered software includes other products and services aswell as code; the people buying and using software do notjust need the code, they also need services and products suchas training, user guides, and support.
1
1Contents
1.1 Defining software quality
1.2 Fundamental concepts ofexcellence
1.3 EFQM Excellence Model
1.4 ISO 9000:1994 and ISO9000:2000
1.5 IT maturity models—CMM and relations
1.6 Team Software Processand Personal SoftwareProcess
1.7 Bringing the modelstogether
C H A P T E R

2. Quality cannot be defined by technical excellence alone—it also includeshuman factors such as communication and motivation, as well asvalue for money. The customer must be able to afford the productsand services, and enjoy the experience of dealing with the supplier aswell as using the products.
3. Different people will hold various views on whether quality is deliv-ered to the customer. The developers produced a fine product, with lotsof wonderful new features, so they were rightly enthusiastic, but theproduct had flaws, cost too much, did not meet the customer’s needs,and made the lives of their colleagues in training much harder. Also,the people losing their jobs would take a decidedly different viewabout whether a quality solution had been delivered.
We will find throughout this book that different people give differentdefinitions if we ask them what they mean by quality. When I ask peopleworking with software as users or on software development projects whatquality means, all sorts of ideas emerge. Some might mention cost, time,scope, specification, value, or standardization, whereas others talk aboutperfection, expectations, relationships, feelings, and emotions. Some of thiscan be accomplished by delivering code, but much is achieved from othersoftware products and services such as documentation and training. Somecan only be realized through less tangible things such as relationships andexpectations.
Why is this important? Because it causes difficulties when peopleinvolved in a project have different views of quality. If people do not haveshared goals and aspirations, their view of quality is affected. It means that, ifthey do not communicate their differences and negotiate a common goal,they may work against each other, while thinking they are all pullingtogether. There will be confusion about whether a delivered software prod-uct provides quality. So many systems are delivered that are not used, or notliked, or cannot be supported by training, documentation, and help provi-sioning. Yet the IT project teams are either unaware of, or surprised by, thereaction to what they have perceived as a successful project. We all believewe have done a good job and are mortified if our work is not well received!We commonly find a different view of whether a project has delivered a“quality product” if we talk to the customers and to the project team.Furthermore, we frequently find differences of opinion if we talk to the proj-ect manager, the developers, the testers, the trainers, and other groupswithin the project team. Each person may seem to hold a different view ofthe quality of the product and service, and, indeed, a different underlyingassumption of how to measure quality. So I will start by defining qualityfrom a variety of viewpoints.
Five distinct definitions for quality can be recognized.1 The definitions Iwill use are from [1]. They are the product-based, manufacturing-based,user-based, value-based, and transcendent definitions.
2 Software Quality Matters
1. The definitions of quality in this chapter and throughout the book are based on Chapter 1 of [1], reused by
permission of UTN Publishing. These definitions are based on work by [2] and were adapted by [3].

Two definitions of quality favored by IT people are the product-basedand the manufacturing-based definitions. In projects, we favor definitionsthat allow us to measure progress and success in delivery. We want to fixquality to something that is deliverable and measurable.
◗ In the product-based definition, quality is based on a well-defined setof software quality attributes that must be measured in an objectiveand quantitative way. We can derive acceptance criteria to objectivelyassess the quality of the delivered product. Example: Standards such asISO 9126 [4] define attributes such as reliability, usability, security, and func-tionality, together with measures for them. “The software is 98% reliablewhen running continuously over a 7-day period. Recovery time is less than 1minute at each failure.”
◗ The manufacturing-based definition focuses on the manufacture ofsoftware products, that is, their specification, design, and construction.Quality depends on the extent to which requirements have beenimplemented in conformance with the original requirements. Wemeasure faults and failures in products. Success is measured as ourability to follow a process and deliver products against agreed specifica-tions. We will verify (is the system correct to specification?) but if wedo not take account of the user-based definition of quality (see below),we may forget to validate (is this the right specification?). Example:Repeatable, auditable process with delivery that conforms to specification. “Thesoftware was built to specification, and there are a low number of defects.”
There are two other definitions of quality that reflect the views of thesoftware user and purchaser. These perspectives are about supporting theneeds of the organization and its stakeholders, within the organization’s con-straints. Because the pressures on an organization change over time, whatconstitutes “quality” may change over time to match. Sometimes thechanges will be tactical—“We must cut costs this quarter!”—and sometimes theymay be strategic—“We want to be market leaders!”—and these may conflict.
◗ The user-based definition says that quality is fitness for use. Softwarequality should be determined by the user(s) of a product in a specificbusiness situation. Different business characteristics require differenttypes of software products; not only to do different things, but also tocater to how different people want to carry out their tasks. This can besubjective and cannot be determined only on the basis of quantitativemetrics. It is the user-based definition that encourages us to validateas well as to verify the system. Example: Fit for purpose. “I can do my workefficiently and effectively when I use this software.”
◗ The value-based definition is focused on things that impact on therunning of the business as a whole. Software quality should always bedetermined by means of a decision process on trade-offs betweentime, effort, and cost aspects. This is done by communicating with allparties involved, for example, sponsors, customers, developers, and
1.1 Defining software quality 3

producers. Example: Return on Investment (ROI). “If we release the softwarenow, we will spend $250,000 extra on support in the first month. If we are amonth late, it will cost the organization $1 million in fines and lost business.Should we release or do more testing?”
Finally, we must acknowledge that we all know quality when we see it;our knowledge is based on our experiences, taste, affections, loyalties, andemotions. Unfortunately, this means different people will have differentreactions to a product: The transcendent definition states that quality can berecognized easily depending on the perceptions and the affective feelings ofan individual toward a type of software product. This means that we con-sider someone’s emotional response to a product or service. Did they enjoy it?Did they like the people they met? Are they happy? This is not easily measurable,but understanding this aspect of quality can be a first step toward theexplicit definition and measurement of quality. Example: Brand loyalty basedon affection. “I like using this software—it appeals to me.”
In a single project, we may have several definitions of quality in use, per-haps inadvertently and unacknowledged by all the people in the project. Itis important to realize that there is no “right” definition of quality. How wedefine “quality” for a particular product, service, or project is situational. Wesay, “It depends on….” Contrast the following:
◗ Air traffic control system: We are considering using the product/manu-facturing definitions because we need to ensure technical excellenceabove all else.
◗ Package to improve usability of Web pages for the visually impaired: We areconsidering using the user-based definition because we need to ensureit is fit for the purposes of this group.
◗ Software to launch an innovative new product and achieve “first mover”advantage: We are considering using a value-based definition becauseif we spend more to get a better product we may miss the market.
For most commercial or custom-made software, the customer is bestserved by balancing the definitions. In our particular project, we should askourselves: What is the greatest number or level of attributes (product-based)that we can deliver to support the users’ tasks (user-based) while giving thebest cost–benefit ratio (value-based) while following repeatable/quality-assured processes within a managed project (manufacturing-based)?
As a colleague remarked to me, “Compromise and a balance between thequality definitions is essential” (Frank Johnstone, personal communication,April 18, 2003). We need to define quality and to understand which defini-tions people buying, using, developing, testing, and supporting software use.This prevents the conflicts between stakeholders and enables us to under-stand why we are developing the software. In Chapters 2 to 7, we willexplore the different groups and which quality definitions they favor, andthen, in Chapters 8 to 12, we will look at how the different groups contribute
4 Software Quality Matters

throughout the life of software and systems, and the benefits that eachquality view brings.
Whichever definition(s) of quality we use—that of software users or sup-pliers—we all want to try to avoid mistakes. One way to try and do this is toadopt strong processes within a quality management framework. In qualitymanagement, our concern is to decide which processes to use and to adaptthose processes appropriately for a project. During the project, we will carryout quality assurance activities to check that the chosen process has been fol-lowed and is suitable. Quality control processes will check the products fordefects. The processes sit within an organizational culture and framework ofmanagement systems. Some quality management models are entirely processdriven; our task as people operating within the processes is to follow theprocesses as defined. If we are lucky, we might be asked to suggest improve-ments to the processes. Other models, specifically those described as excel-lence models to differentiate them from process-driven quality models, aremore focused on people and their capabilities and needs; here the activities ofthe project are focused on the ability of people to deliver services and prod-ucts that satisfy the customers. Some models have a greater emphasis onimprovement cycles than others; the Deming cycle, for example, proposed byW. Edwards Deming [5], has four stages, sometimes called the “Plan, Do,Check, and Act” cycle, and sometimes the “Plan, Do, Review, Improve”cycle. Here, we plan what to do and we do it. Then we review what we did.Was it successful? Did it go as planned? What should we improve? We thenput improvements in place, and plan the next cycle of activities. We will seethrough this book that this Deming improvement cycle works on a largescale, for example, when looking at the excellence framework for an organi-zation or for a project, but is particularly effective for making incrementalimprovements as we do work, whether as a team or individually.
We need to look at these models and understand the advantages and dis-advantages of each one.
1.2 Fundamental concepts of excellenceTo compare models, I shall use the Fundamental Concepts of Excellence setout by the European Foundation for Quality Management (EFQM) [6].These concepts are used in a number of models, including the EFQMExcellence Model, which is used by more than 20 member countries in theEuropean Union. Similar organizational models based on these conceptshave been developed in other countries. For example, Puay et al. [7] com-pare nine schemes, including the Malcolm Baldrige model [8] and the EFQMExcellence Model [6], in different countries (three European, two NorthAmerican, three Asian-Pacific, and one South American) against nine crite-ria: leadership, impact on society, resource management, strategy and policy,human resource management, process quality, results, customer manage-ment and satisfaction, and supplier/partner management and performance.It is these criteria that are reflected in the Fundamental Concepts ofExcellence.
1.2 Fundamental concepts of excellence 5

Other organizational quality and excellence initiatives, such as Six Sigmaand the Balanced Scorecard, also provide a way of discussing the goals of anorganization, deciding how to achieve those goals, and measuring whetherthey have been achieved.
In this book, I focus on the EFQM Excellence Model, but whichevermodel your organization uses, whether Baldrige or one of the others, youshould be able to map your model onto the ideas in this book. This isbecause, although the different models use slightly different words and placea different emphasis on the different criteria, the fundamentals of running asuccessful organization apply, worldwide. For example, I will link the EFQMExcellence Model to a number of other standards, specifically for use in IT. Inthe same way, in [9] the authors have linked Six Sigma to IT frameworks.
The Fundamental Concepts of Excellence of the EFQM ExcellenceModel [6] are:
◗ Results orientation: “Excellence is dependent upon balancing and satis-fying the needs of all relevant stakeholders (this includes the peopleemployed, customers, suppliers, and society in general, as well asthose with financial interests in the organization).”
◗ Customer focus: “The customer is the final arbiter of product and servicequality, and customer loyalty, retention, and market share gain are bestoptimized through a clear focus on the needs of current and potentialcustomers.”
◗ Leadership and constancy of purpose: “The behavior of an organization'sleaders creates a clarity and unity of purpose within the organizationand an environment in which the organization and its people canexcel.”
◗ Management by processes and facts: “Organizations perform more effec-tively when all inter-related activities are understood and systemati-cally managed, and decisions concerning current operations areplanned. Improvements are made using reliable information thatincludes stakeholder perceptions.”
◗ People development and involvement: “The full potential of an organiza-tion's people is best released through shared values and a culture of trustand empowerment, which encourages the involvement of everyone.”
◗ Continuous learning, innovation, and improvement: “Organizational per-formance is maximized when it is based on the management and shar-ing of knowledge within a culture of continuous learning, innovation,and improvement.”
◗ Partnership development. “An organization works more effectively whenit has mutually beneficial relationships, built on trust, sharing of knowl-edge, and integration, with its Partners.”
◗ Public responsibility. “The long-term interest of the organization and itspeople are best served by adopting an ethical approach and exceedingthe expectations and regulations of the community at large.”
6 Software Quality Matters

How can we encourage the Fundamental Concepts of Excellence and getthe best from our software teams? If you look at the Fundamental Conceptsof Excellence, you will see that process, which emphasizes manufacturingand product-based viewpoints, is only one part we need to consider. Whenwe look at the concepts, we see they involve considering and working withdifferent groups of people, and thinking about balancing the views of differ-ent stakeholders. To help us do this, I will use the concepts throughout thebook, to encourage a teamwork approach and allow all five quality defini-tions. Some quality models define quality processes for an individual to use,some are for teams, and some for organizations. The coverage of the qualitydefinitions and the emphasis on teamwork varies across the models. In thisbook, I will use a selection of the models. They are:
◗ A framework for organizational excellence, known as the EFQMExcellence Model [6] in Europe, which is similar to others, such as theMalcolm Baldrige model [8], used in the United States;
◗ Two process standards—ISO 9000:1994 and ISO 9000:2000 [10];
◗ A group of IT maturity models based around CMM (CapabilityMaturity Model) [11, 12] and two models for implementing CMM:the Team Software Process (TSP) [13] and the Personal SoftwareProcess (PSP) [14].
1.3 EFQM Excellence ModelThe European Foundation for Quality Management (EFQM) ExcellenceModel [6] is an organizational excellence model using a nonprescriptiveframework. It is not specifically an IT framework. It may be used withorganizations of any size and type and is intended for corporations, compa-nies, or nonprofit organizations. Here I am using it to help discuss a “mini-organization”: the software project. The EFQM Excellence Model provides aframework for excellence under nine criteria; five of these are “Enablers” forexcellence and four are measures of the “Results.” These are interlinked witha continuous improvement feedback loop known as RADAR (Results,Approach, Deployment, Assessment, and Review) (Figure 1.1).
1.3.1 Enablers
The Enablers are Leadership, Policy and Strategy, People, Partnerships andResources, and Processes. The results are Customer, People, Society, and KeyPerformance Results. In the following descriptions, I will first give thedescription for an entire organization and then for a project as a “mini-organization.”
1.3.1.1 Leadership
Excellence is led from the top. Leaders facilitate the achievement of the mis-sion and vision, and develop values for success. Leaders are personally
1.3 EFQM Excellence Model 7

involved in ensuring that the management system is developed andimplemented.
Project managers provide leadership for their projects under the leader-ship of the project board and sponsor. In the mini-organization the projectmanager is the leader.
1.3.1.2 Policy and Strategy
The vision of leaders is implemented via policies and strategies. Leadersfocus policy and strategy around the needs of the stakeholders and ensurethey are reflected in policies, plans, objectives, targets, and processes.
The specific strategy for the project (including any quality strategy) isderived from the organization’s overall policy and strategy. Additionally, itwill show where changes have been made to reflect the needs of a particularproject. The mini-organization requires its own strategies.
1.3.1.3 People
The organization manages, develops, and releases the knowledge and fullpotential of its people at individual, team-based, and organization-wide lev-els. The organization must consider how people are treated and valued.
In a project, for example, we need to consider not only who is workingon the project and the skills they bring, but also how their skills and experi-ence are enhanced during the project. During and after the project, peoplemust feel that they and their contributions were valued.
1.3.1.4 Partnerships and Resources
The organization plans and manages its external partnerships and internalresources in order to support its policy and strategy and the effective opera-tion of its processes. The organization considers partnerships with otherorganizations and how resources such as technology and information aremanaged. This divides into two distinct categories. The first includes thepeople outside our organization with whom we interact.
8 Software Quality Matters
KeyPerformanceResults
SocietyResults
CustomerResults
PeopleResults
Leadership Processes
Partnershipsand Resources
Innovation and learning
Policy andStrategy
People
ResultsEnablers
Figure 1.1 EFQM Excellence Model. (From: [6]. © 1999–2003 EFQM. Redrawn bypermission of EFQM.)

In the context of the mini-organization, I mean those external to ourproject. This might include how we liaise with suppliers and other projects.The second includes the (nonhuman) resources we require in order to com-plete our tasks, for example, management of the organization’s information,IT infrastructure, and negotiation for scarce facilities such as develop-ment/test environments.
1.3.1.5 Processes
The organization designs, manages, and improves its processes in order tosupport its policy and strategy and fully satisfy, and generate increasingvalue for, its customers and other stakeholders. In a project, we need to con-sider which processes are appropriate. If we have experienced people andlow-risk problems to solve, we might consider a lightweight, agile methodfor our IT project. If we have a high-risk project or inexperienced people, wemay find that heavy-duty processes with an audit trail may give us moreconfidence. We select processes appropriate to our problem and our team.
1.3.2 Results
There are four sets of results measurements. The first three have a percep-tion and a performance measure, whereas the fourth, key performanceresults, focuses on outcomes in relation to planned performance. As in theEnablers, I will show how the mini-organization of a project relates to thelarger organization.
1.3.2.1 Customer Results
These measure whether the organization is meeting the needs of its externalcustomers. Customer perception can be assessed through satisfaction sur-veys. Performance could be monitored by tracking the number of com-plaints and volume of repeat business. For a project team, or an IT teamundertaking a series of projects, we might measure the perception of thatteam or project by its customers, the users of the software, and the manag-ers of the purchasing organization.
1.3.2.2 People Results
Here, we measure what the organization is achieving for its people. Theorganization may survey employee perception and set performance targetsfor staff turnover and absence. Similarly, we could measure the motivationof the project team, people’s attitude to working on the project, and factorssuch as illness and turnover.
1.3.2.3 Society Results
Society results measure what the organization is achieving in relation tolocal, national, and international society where appropriate. We can
1.3 EFQM Excellence Model 9

measure how our organization is perceived in society, for example, throughfavorable press. A performance measure could be the attainment of awards,perhaps for corporate social responsibility.
Within a project, we might measure how the project measures againstcorporate targets for waste and energy management. We might also planfor, and measure use of, time for project members to carry out activities inthe local community.
1.3.2.4 Key Performance Results
These results measure what the organization is achieving in relation to itsplanned performance, including financial measures such as return oninvestment, profit, and turnover, and nonfinancial outcomes such as marketshare and sales success rates. For the project, indicators of its success mightinclude contribution to achieving increased business and decreasing costs,but we might also want to measure how well the project delivers against itsplanned budget.
1.3.3 Excellence, the EFQM Excellence Model, the MalcolmBaldrige model, and other related models
As we might expect, the EFQM Excellence Model meets the FundamentalConcepts of Excellence well. It is a European model, but is closely related toother models such as the U.S. model, the Malcolm Baldrige model [8]. TheBaldrige model has the same aims and a very similar framework. In both,organizations score points against the enablers and the results to accumu-late a total excellence score out of 1,000. Organizations compete againstthemselves—they seek to improve their score year by year. If organizationswish, they can compete against other organizations in an award scheme.The point of both models is to encourage the continuous improvement oforganizations, rather than to achieve a specific level.
1.4 ISO 9000:1994 and ISO 9000:2000ISO 9000:1994 [10] is a quality assurance standard for design and manufac-turing processes. It is rigid in its definition and interpretation of quality. Alarge number of processes are defined and must be adhered to by means ofaudit trails and evidence, regardless of whether these processes give the bestoutcome for the customer or for the project team on a particular project. InISO 9000:2000 [10], there are a smaller number of defined and docu-mented processes and a greater emphasis both on people understandingthe tasks that they have to perform and on customer satisfaction. ISO9000:2000 includes continuous improvement and moves toward the EFQMframework. Although the ISO 9000 standards meet some of the Funda-mental Concepts of Excellence, there are significant gaps, especially in ISO9000:1994. However, the standards are useful in IT projects as a guide forauditability.
10 Software Quality Matters

1.5 IT maturity models—CMM and relationsThe concept of organizational maturity and capability for an IT organizationwas developed at the Software Engineering Institute (SEI) [11] to define abetter way of producing software. It regards software as an engineeringdiscipline and groups organizations into five levels within the CapabilityMaturity Model (CMM):
◗ Level 1—Initial: Projects are ad hoc and chaotic. “Everyone has theirown process.”
◗ Level 2—Repeatable: Requirements are managed and projects are per-formed according to documented plans. “Every team has its ownprocess; teams can repeat work.”
◗ Level 3—Defined: Software engineering and management processes arestable and do not break down under stress. “Every team in the organi-zation uses the same process; we can start to deal with change.”
◗ Level 4—Managed: The organization manages its processes quantita-tively and measures performance and quality across all projects. “Thewhole organization is measuring so we KNOW how we are doing.”
◗ Level 5—Optimizing: Continual improvement and proactive defectresolution. “We can build on our knowledge to improve.”
Progress through these levels is measured by key process indicators(KPIs). All the indicators at one level must be met before an organizationcan be considered to be at that level. The levels and KPIs are focused on thesoftware development process and measurement of that process:
The CMM provides a staged approach to IT process improvement. The
underlying premise is good common sense: the IT organization needs to
walk before it runs. Sophisticated engineering and measurement processes
cannot be sustained unless they are built upon a framework of strong
basic management practices. Organizations that omit embedding Level 2
processes normally return to “ad hoc and chaotic” in periods of stress.
(Frank Johnstone, personal communication, April 18, 2003)
CMM covers software development, and considers testing as a part ofthis, with explicit requirements for testing included at Level 3 and above. Toenhance this, number of testers started to develop related models specificallyfor testing. These include TMM [15] and TPI [16], among others [17].These are all process models. They differ from the Fundamental Concepts ofExcellence in that they generally focus on process and measurement ofprocess to the exclusion of other issues, although, as the models develop,increasing heed is taken of the wider aspects of excellence. Difficulty withthe implementation and use of CMM gave rise to two further processmodels: the Team Software Process (TSP) and the Personal Software Process(PSP), which are described below. CMM and its relations continue todevelop. Recently the Software Engineering Institute has introduced the
1.5 IT maturity models—CMM and relations 11

CMMI (CMM Integration) and PCMM (People CMM) models, whichattempt to widen the applicability of the CMM concept to any engineeringdiscipline and to cover management of people. For the latest news on CMM
and its relations, please visit the Software Engineering Institute Web site[11]. A paper comparing some test assessment and improvement processeswas given by Stuart Reid at EuroSTAR 2003 [17].
1.6 Team Software Process and Personal SoftwareProcess
The Team Software Process (TSP) was developed at the Software Engineer-ing Institute “to help integrated engineering teams more effectively developsoftware-intensive products. This process method addresses many ofthe current problems of developing software-intensive products and showsteams and their management explicitly how to address them” [11]. The TSPidentifies that software projects fail because of teamwork problems and notbecause of technical issues. In [13] Watts Humphrey identifies ineffectiveleadership as a key problem for teams. The TSP requires the establishment ofgoals, the definition of team roles, the assessment of risks, and the produc-tion of a team plan. TSP permits whatever process structure makes the mostbusiness and technical sense. Teams are self-directed; in other words, theyplan and track their own work. Managers operate by coaching and motivat-ing the teams. In using the TSP, compliance to CMM Level 5 is expected.We can see some common ground with the Fundamental Concepts of Excel-lence, particularly in the areas of leadership, people, process, improvement,and measurement. There are gaps in focus on the needs of the customer. Inaddition, the assumption of CMM Level 5 means that the TSP is not so use-ful for organizations with less mature processes.
The Personal Software Process (PSP), developed by the Software Engi-neering Institute and based on CMM, is a process definition for softwareengineers enabling them to plan and track work. PSP provides a frameworkof processes for the software engineer. It emphasizes the need for individ-ual software engineers to receive intensive training before they use theprocesses. Good process is needed, but that will only work if people under-stand and are motivated to use the process. “Seventy percent of the cost ofdeveloping software is attributable to personnel costs; the skills, experience,and work habits of engineers largely determine the results of the soft-ware development process” [11]. This fits well with some aspects of the Fun-damental Concepts of Excellence; it considers process and people’s skills.However, the needs of the customer are not a focus for these models:
The Personal Software Process helps individual engineers to improve their
performance by bringing discipline to the way they develop software. ... It is
not a matter of creativity versus discipline, but of bringing discipline to the
work so that creativity can happen. … The PSP shows engineers how to
manage the quality of their products and how to make commitments they
can meet. It also provides them with the data to justify their plans. [11]
12 Software Quality Matters

1.7 Bringing the models togetherHaving briefly outlined these models, we can see how they complementeach other. CMM uses a staged approach to IT process improvement,which prescribes processes that the organization is ready to receive. PSP andTSP acknowledge the importance of people and teamwork in implementingand using processes. ISO 9000 shows us how to develop auditable processes.It is possible to fit all our organizational standards into a framework like theEFQM Excellence Model, and the ethos of the awards scheme is to encour-age organizations at a low level of maturity to take the first steps towardexcellence by assessment and improvement. It is possible to self assess andwork for initial improvements, but continuous improvement is encouragedby assessment and comparison with other organizations at a regional,national, and European level. However, it does not have an IT focus, so inFigure 1.2 I have overlaid onto the EFQM Excellence Model the methods,processes, and standards that have been mentioned so far. In Chapters 3–7, Iwill discuss how the EFQM Excellence Model can be used as a framework tohelp leadership, strategy, and policy aid individuals or teams in understand-ing their own objectives and how they fit with their organization.
Each model has gaps and most do not encourage all the five definitionsof quality (see Table 1.1). Only the EFQM Excellence Model, with its meas-urements of perception as well as performance, acknowledges the transcen-dent view of quality. At present, only the EFQM Excellence Model, with itsmeasures of key performance results, including financial results, acknowl-edges the value-based view of quality. PCMM performance measurement isset against the organization’s business objectives, but not yet, as far as I canascertain, as a value-based quality. However, together the models havestrength; from the ISO 9000 family we can use the idea of evidence andaudit trails, from the CMM family we can use the idea of developingmaturity of process, and from the EFQM we can use the quality concepts of
1.7 Bringing the models together 13
ResultsEnablers
Lead
ers
hip
CM
MI
and
TSP
Innovation and learningTSP, CMM and related models at level 5, ISO 9000:2000
People TSP,PSP, PCMM
Policy andStrategy, TSP
Partnershipsand ResourcesTSP
ProcessesCMM ,TSP, PSP,ISO 9000:1994,ISO 9000: 2000
People Results
Key
Perf
orm
ance
Re
sult
s
Customer ResultsISO 9000: 2000
Society Results
Figure 1.2 How the models fit in the EFQM Excellence Model. (After: [6].)

value and transcendent excellence. Organizations can benefit from any orall of these models. Meeting all the requirements of a model is rarely neces-sary or an end in itself. Organizations can select aspects of the models andchoose from the techniques suggested, to meet their specific needs. This isan approach that I encourage throughout this book.
There are other standards that apply to software development, delivery,and support. It is important to realize that these standards will always sitwithin an organizational and cultural framework. Our choice of particularstandards will reflect how we define quality, our industry/sector, our processmaturity, and what is appropriate for our particular project. These otherstandards I will cover as needed in the rest of the book. I will note here threereferences that also place software standards in a framework. We havealready mentioned a paper that sets software standards within Six Sigma [9].In addition, the Software and Systems Quality Framework (SSQF), [18]mentions the EFQM Excellence Model and Baldrige model, Six Sigma,CMM, and ISO 9000 as possible frameworks within which software stan-dards might be adopted, but concentrates on ISO 9000 as the exampleframework. A useful paper concentrating on testing-related standards can befound on the Testing Standards Web site [19], although it does not mentionthe EFQM Excellence Model and Baldrige model.
Finally, the move toward integrating standards together is becomingincreasingly important; organizations are moving toward integrated manage-ment systems that integrate quality, environmental, security, and financialmanagement systems into one framework, and also include informationmanagement within and beyond the IT systems. Standards for IT workcannot stand alone; they must be part of the organization’s integrated man-agement system in order to align with the organization’s aims. These willalign with excellence frameworks, whether these are the EFQM ExcellenceModel, Baldrige model, or another framework. Frameworks for IT servicemanagement already align with the EFQM Excellence Model and the Bald-rige model [20]. Whether providing new technology or exploiting existingtechnology, what is needed is for IT development and for project manage-ment to share that alignment. As organizations develop new excellence and
14 Software Quality Matters
Table 1.1 Views of Quality Across the Models
Model
Quality View EFQM/Baldrige CMM and Relations ISO 9000:1994 ISO 9000:2004
ISO 9000:2000 ✓
Transcendent ✓
User ✓ ✓
Value ✓ (✓ )
Product ✓ ✓
Manufacturing ✓ ✓ ✓ ✓
✓ is a primary quality view.(✓ ) is a quality view that may be taken by some people in this group.

management frameworks to face their changing world, IT development andsupport standards will need to follow.
References
[1] Evans, I., “Testing Fundamentals,” in The Testing Practitioner, E. van Veenendaal,(ed.), Den Bosch, the Netherlands: Uitgeverij Tutein Nolthenius, 2002, pp.13–30.
[2] Garvin, D., “What Does Product Quality Really Mean?” Sloan ManagementReview, Vol. 26, No. 1, 1984.
[3] Trienekens, J., and E. van Veenendaal, Software Quality from a Business Perspective,Deventer, the Netherlands: Kluwer, 1997.
[4] International Standards Organization/International ElectrotechnicalCommission (ISO/IEC), DTR 9126 Software Engineering—Software ProductQuality (Parts 1–4, 2000/2001).
[5] The W. Edwards Deming Institute, “Deming’s Teachings,” http://www.deming.org/theman/ articles/articles_gbnf04.html, November 2003.
[6] European Foundation for Quality Management, “EFQM Excellence Model” and“Fundamental Concepts of Excellence,” http://www.efqm.org, August 2003.
[7] Puay, S. H., et al., “A Comparative Study of the National Quality Awards,” TQMMagazine, Vol. 10, No. 1, pp. 30–39.
[8] Malcolm Baldrige model, http://www.quality.nist.gov/index.html, August2003.
[9] Gack, G. A., and K. Robison, “Integrating Improvement Initiatives: ConnectingSix Sigma for Software, CMMI, Personal Software Process, and Team SoftwareProcess,” Software Quality Professional, September 2003, pp. 5–13.
[10] International Standards Organization, ISO 9000:1994 and ISO 9000:2000Quality Systems.
[11] Software Engineering Institute, “Capability Maturity Model,” http://www.sei.cmu.\edu, July 2003.
[12] Caputo, K., CMM Implementation Guide: Choreographing Software ProcessImprovement, Reading, MA: Addison-Wesley, 1998.
[13] Humphrey, W., Introduction to the Team Software Process, Reading, MA: SEI, 2000.
[14] Humphrey, W., Introduction to the Personal Software Process, Reading, MA: SEI,1997.
[15] van Veenendaal, E., and R. Swinkels, “Testing Maturity Model,” in The TestingPractitioner, E. van Veenendaal, (ed.), Den Bosch, the Netherlands: UitgeverijTutein Nolthenius, 2002, pp. 289–300.
[16] Koomen, T., and M. Pol, Test Process Improvement, Reading, MA: Addison-Wesley, 1999.
[17] Reid, S. C., “Test Process Improvement—An Empirical Study,” EuroSTARConference paper, Amsterdam, the Netherlands 2003.
[18] British Standards Institute, PD0026:2003, Software and Systems QualityFramework—A Guide to the Use of ISO/IEC and Other Standards for Understanding
1.7 Bringing the models together 15

Quality in Software and Systems, London, England: British Standards Institute, May2003.
[19] Reid, S. C., “Software Testing Standards—Do They Know What They Are TalkingAbout?” http://www.testingstandards.co.uk/publications.htm, August 2003.
[20] IT Infrastructure Library, Best Practice for Service Delivery, Norwich, England: Officeof Government Commerce, 2002.
Selected bibliography
British Quality Foundation, How to Use the Model, London, England: British QualityFoundation, 2002.
British Quality Foundation, The Model in Practice 2, 2nd ed., London, England: BritishQuality Foundation, 2002.
Burnstein, I., T. Suwannasart, and C. R. Carlson, “Developing a Testing MaturityModel,” CrossTalk, August/September 1996.
European Foundation for Quality Management and British Quality Foundation,EFQM Excellence Model, London, England: British Quality Foundation; Brussels,Belgium: European Foundation for Quality Management, 2002.
Handy, C., Understanding Organizations, New York: Penguin, 1993.
Hayes, L., “Hello Up There! Will the Sarbanes–Oxley Act Finally Catapult QA to theBoardroom?” Sticky Minds Web site, http://www.stickyminds.com/sitewide.asp?Function=FEATUREDCOLUMN&ObjectId=6544&ObjectType=ARTCOL&btntopic=artcol&tt=LIMITCAT_6544_**WHERE**&tth=H, August 2003.
Kaplan, R. S., and D. P. Norton, The Balanced Scorecard, Boston, MA: Harvard BusinessSchool Press, 1996.
Larson A., Demystifying Six Sigma, New York: AMACOM, 2003.
Mullins, L. J., Management and Organisational Behaviour, 5th ed., New York: FinancialTimes/Pitman, 1999.
Seddon, J., and Vanguard Consulting, “Lean Service: Systems Thinking for ServiceOrganisations—The Business Excellence Model—Will It Deliver?”http://www.lean-service.com/6-3.asp, November 2003.
Sticky Minds Web site Round Table, facilitator Craig, R., “What Is Software Qualityand How Do You Measure Its Value?” http://www.stickyminds.com/s.asp?F=S6540_ROUND_46, August 2003.
Woodruff, W. D., “Introduction of Test Process Improvement and the Impact on theOrganisation,” Software Quality Professional, September 2003, pp. 24–32.
16 Software Quality Matters

Defining the Software Team
In this chapter I shall:
◗ Describe the stakeholder groups that make up the softwareteam;
◗ Discuss the mutual distrust between the team members andhow it might be overcome;
◗ Identify which definitions of quality from Chapter 1 best fit toeach group;
◗ Identify which of the quality models from Chapter 1 best fitthe groups;
◗ List techniques to help improve communication between thegroups.
It makes me wonder why senior managers don’t knock a few
heads together. After all, we are all fighting on the same side, or
should be.
—Comment from a test consultant, noting the disagreements
—between members of the software teams
2.1 Teams in disunitySome years ago, I was working with a software team to helpthem improve the quality of their delivered software. I met asuccession of people—first the testers, then the developers, thenthe business analysts, and, finally, a group of project managers.What was astounding was that each group was convinced thatthey were the least respected group and that they were thegroup that cared most about quality. They all described them-selves as being “on the bottom of the heap,” and commented onthe lack of support and the grief they received from the otherthree groups. They all pointed to the software user and to seniormanagement as “awkward customers.” What was going on?
17
2Contents
2.1 Teams in disunity
2.2 Defining the team
2.3 Interaction between thegroups and within eachgroup
C H A P T E R

Each person held strong views about their own contribution and that ofother people to the project and to quality. Studies of the motivation of ITpersonnel and users of IT systems have shown that people believe that theirown group enhances the project and other groups detract from it. Wardenand Nicholson, in their 1996 survey of motivation in IT staff [1], remarked:
IT is not a close-knit community of like-minded professionals. Many nega-
tive attributions are made about other groups lacking the motivation for
quality. Senior managers are accused of paying lip-service to quality, while
starving it of resources in pursuit of profit. Software developers are accused
of focusing on technical excellence, completely disregarding customers’
need for a quality product. Customers are accused of demanding levels of
quality which they are not prepared to pay for. These are among the most
common criticisms but there are many others. Each group within the pro-
fession makes negative attributions about other groups.
Table 2.1 shows that each group has a positive self-perception, but oftenfeels negatively about other groups. Many of you will recognize these inter-actions and misunderstandings.
I have illustrated all the chapters in this book with anecdotes from myown experience, and I hope that you will add stories of your own. Here are
18 Defining the Software Team
Table 2.1 Group Attitude Results
How
View Developers
ITInfrastructureStaff
SoftwareMaintainers IT Managers
QualityPractitioners Testers Users
Developers We’re OK. Don’t listen.Poor quality.
Will notdocument.
No businessawareness orinter-personalskills.
Resistchange. Alaw untothemselves.
Resentcriticism.
Computersare difficultto use andunreliable.
ITinfrastructurestaff
Alwayscomplaining.
We’re OK. Should filterrequests.
Bettercustomerorientation.
Understand. Understand.
Softwaremaintainers
Unpleasantjob, lowstatus.
Long delays We’re OK. Longdelays.
Resistchange.
Resentcriticism.
IT managers Want deliverytoo soon toget quality.
Should forcedevelopers toattend tousers.
Want deliverytoo soon toget quality.
We’re OK. No interest,no support.Don’tunderstand.
Don’t knowthe cost ofletting bugsthrough.
Qualitypractitioners
Waste time.Unrealistic.Don’tunderstand.
Understand Waste time.Unrealistic.Don’tunderstand.
A luxury.Only ifcustomersdemand it.
We’re OK. Understand.
Testers Unnecessary—we do that!
Understand Unnecessary—we do that!
Little skillneeded.
Understand. We’re OK.
Users Don’t knowwhat theywant.
Complain tous aboutsoftware.
Ask for trivialchanges.
Will not payfor qualitybut expect it.
Will not payfor qualitybut expect it.
Understand. We don’twant toknow abouttechnology.
Source: [1].

a few to start us off. Some are from colleagues and some are from my ownexperiences.
◗ On one project I worked on, testers and developers were not allowedto talk to each other because it would waste time!
◗ The testers didn’t check whether the reports they sent to the developerswere duplicates. They did not talk to other testers about what they werereporting. It really wasted the developers’ time.
◗ When I said I had not used a PC before, he treated me like an idiot …they are always so rude in the IT department.
◗ When I was asked to build the new software, I wanted to find outwhat I should be building—there was no specification—so I went totalk to the system users to see what they wanted. No one had toldthem the system was being changed, and they were furious. Theyspoke to my manager to ask what was happening. Main result: I wasreprimanded for talking to people outside the IT department.
Why don’t we get along? Maybe it’s because we should be talking toeach other and listening to each other more.
2.2 Defining the teamTo help us understand how to overcome this problem of mutual distrust, letus examine who is in the software team. I will include in “the team” all thestakeholders for quality. This is not only people who commission, design,build, deliver, and support the software, but also people who use or areaffected by the software. These definitions are based on my own experienceof software projects and customers.
I have divided the team into five groups of stakeholders, based upontheir main interests in the software project and, therefore, the definition ofquality that they favor. These groups do not map to skill sets or organiza-tional functions, and the people in each group will have various job titles. Aperson may be in more than one group for a particular project, or may movebetween groups in different projects. We will see how each group contrib-utes to the success of the software project in a particular way. The groupsare:
◗ People who are customers and users of software: customers;
◗ People who manage software projects: managers;
◗ People who build software: builders;
◗ People who measure software quality: measurers;
◗ People who provide the support and infrastructure for the project andthe deployment of software: supporters.
In Chapter 1, we saw that there are five definitions of quality:
2.2 Defining the team 19

◗ Product-based quality is based on a well-defined set of software qual-ity attributes that must be measured in an objective and quantitativeway.
◗ Manufacturing-based quality focuses on the manufacture of softwareproducts, that is, their specification, design, and construction.
◗ User-based quality is fitness for use.
◗ Value-based quality is focused on things that impact on the running ofthe business as a whole.
◗ Transcendent quality can be recognized easily depending on the per-ceptions and the affective feelings of an individual toward a type ofsoftware product.
We will see that each group favors particular views of quality, and this isone of the causes of disunity between the groups.
2.2.1 People who are customers and users of software
Customers include all the people who buy, use, and are affected by soft-ware. They include the people who will pay for the software: the projectsponsor, budget holder, or purchaser. The people who will use the softwarebelong in this group (see “Users” in Table 2.1). I also include here the cus-tomers of the end users—they do not use the software but are affected by itwhen they interact with the end users.
When I refer to customers later in the book, I mean anyone in thisgroup. They are all stakeholders for the quality of software because theycommission, buy, use and, are affected by the software.
This group will hold a transcendent view of quality; as we saw in Chap-ter 1, this includes one’s emotional reaction to a product or service. Theirprimary quality viewpoint is the user view of quality, so they will want thesoftware to be fit for their purposes. The purchasers will also hold thevalue-based view of quality, wherein quality is concerned with a product orservice being affordable and good value for money. This group is discussedin more detail in Chapter 3.
2.2.2 People who manage software projects
Managers include all the people who control the planning and manage-ment of the software project (see IT Managers in Table 2.1). For a particularproject there may be a hierarchy of control starting from a project/programboard. Reporting to the project board might be a program manager, one ormore project managers, and, working under them, project leaders and teamleaders. These people are stakeholders for quality because they are respon-sible for the time and budget control of the project, and for meetingplanned delivery requirements. These are important aspects of quality: thecustomer needs a product they can afford.
20 Defining the Software Team

This group will hold a transcendent view of quality. They will share withthe purchasers the value-based view of quality. They may also supporta manufacturing view of quality—an interest in process and identifyingdefects—especially if they come from an IT development background.
This group is discussed in more detail in Chapter 4.
2.2.3 People who build software
Builders are the people who specify, design, and build the software and otherproducts. This includes the development team (see Developers in Table 2.1).The people in this group include business and system analysts, softwarearchitects, designers, software engineers, programmers, developers, technicalwriters, and trainers. They are stakeholders for quality because they buildquality into the product, which includes not just the deliverables (for exam-ple, code, user guides, and training material) but also the interim products(for example, requirement definitions, designs, and specifications).
This group will hold a transcendent view of quality. Their primary qual-ity viewpoints are the manufacturing and product-based view of quality.The product-based viewpoint measures quality against the attributes of theproduct or service; its performance and reliability characteristics, for exam-ple. This group is discussed in more detail in Chapter 5.
2.2.4 People who measure software quality
Measurers include people who check the conformance to and suitability ofprocesses, as well as those who check the quality of the products, includingsoftware (see Quality Practitioners and Testers in Table 2.1). This groupmight include the quality assurance (QA) teams (e.g., audit and compli-ance) and quality control (QC) teams (e.g., test and inspection). By QA Imean processes and activities that check the suitability of and adherence toprocesses. QC, in contrast, includes processes and activities that check prod-ucts for completeness, correctness, suitability, and adherence to specifica-tion. The QA activities might include process review and quality or processaudit. The QC activities include software testing, software inspection, andproduct review. The membership of this group may be drawn from theother groups or they may be specialists. Beware of believing that this groupimproves the quality of products; in fact, what they do in this group ismeasure quality and provide information to the other groups. The measur-ers support decision making and quality improvement. You may be sur-prised by this idea, but consider this: the builders build quality into theproducts, the measurers measure the quality of the product. I will enlargeon this discussion in Chapter 6. This group will hold a transcendent view ofquality. They will also favor the manufacturing and product-based views ofquality. Some people in this group work mainly in user acceptance testingand will support the user view of quality. The group is discussed in moredetail in Chapter 6.
2.2 Defining the team 21

2.2.5 People who provide the support and infrastructure forthe project and the deployment of software
Supporters have an important part to play in achieving software quality.They are involved in two areas. First, this group maintains the softwarewhen it is delivered and accepted by the customers. They provide supportand infrastructure and are therefore stakeholders for quality in that theywill have requirements for the software. These relate particularly to its qual-ity attributes: security, performance, portability, and maintainability will allbe factors for this group. Second, this group will provide the support andinfrastructure for the other groups. They will supply the environments forthe building and testing of the software and will support the tool sets usedby all the groups in their work. The group includes the IT infrastructureteam, comprising IT operations, support, and maintenance; IT security; thehelp desk; service management; networking; and database administration(see IT Infrastructure Staff and Software Maintainers in Table 2.1).
This group will hold a transcendent view of quality. Their primary focusfor quality is the product-based view of quality, and they will also hold auser-based view of quality, especially as related to service levels. The groupis discussed in more detail in Chapter 7.
2.3 Interaction between the groups and within eachgroup
2.3.1 Differences in quality viewpoints
Because of the difference in quality viewpoints across the groups, andbecause different groups bring different expertise, there should be interac-tion between these five groups before, during, and after a software project.Each person will identify with one of the groups, and, for a particular proj-ect, may take roles drawn from one or more of the groups. If we look againat Table 2.1, we see the evidence for mistrust between the groups. I suggestfrom my own observations two possible reasons for this unfortunate state ofaffairs.
First, among other differences, the groups hold different viewpoints ofquality (see Table 2.2) and so will contribute effort toward achieving their
22 Defining the Software Team
Table 2.2 Views of Quality across the Groups
Group
Quality View Customer Manager Builder Measurer Supporter
Transcendent view ✓ ✓ ✓ ✓ ✓
User view ✓ (✓ ) ✓
Value view ✓ ✓ (✓ )
Product view ✓ ✓ ✓
Manufacturing view ✓ ✓ ✓
✓ is a primary quality view.(✓ ) is a quality view which may be taken by some people in this group.
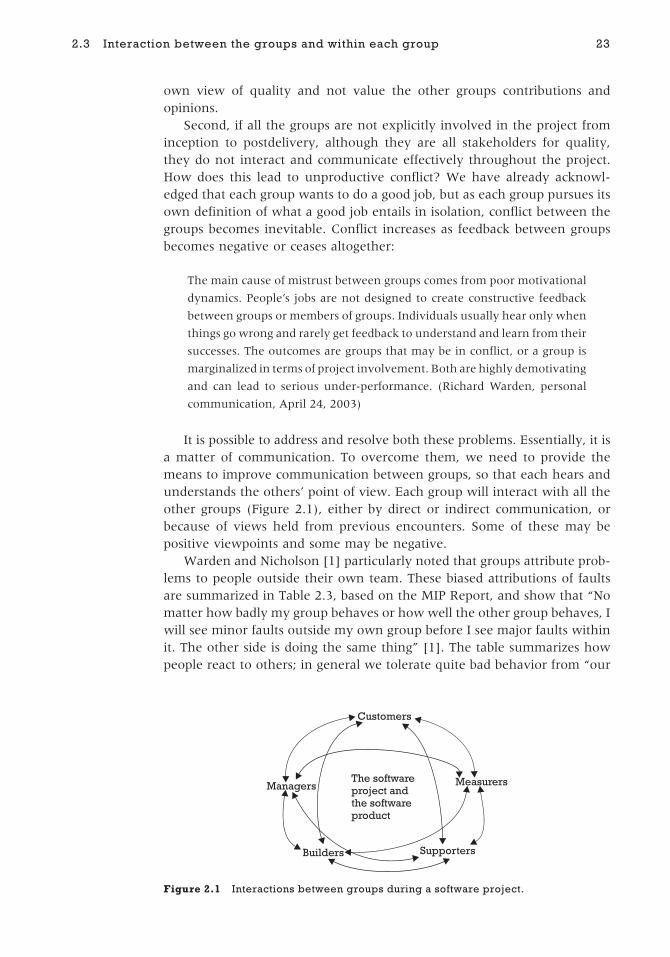
own view of quality and not value the other groups contributions andopinions.
Second, if all the groups are not explicitly involved in the project frominception to postdelivery, although they are all stakeholders for quality,they do not interact and communicate effectively throughout the project.How does this lead to unproductive conflict? We have already acknowl-edged that each group wants to do a good job, but as each group pursues itsown definition of what a good job entails in isolation, conflict between thegroups becomes inevitable. Conflict increases as feedback between groupsbecomes negative or ceases altogether:
The main cause of mistrust between groups comes from poor motivational
dynamics. People’s jobs are not designed to create constructive feedback
between groups or members of groups. Individuals usually hear only when
things go wrong and rarely get feedback to understand and learn from their
successes. The outcomes are groups that may be in conflict, or a group is
marginalized in terms of project involvement. Both are highly demotivating
and can lead to serious under-performance. (Richard Warden, personal
communication, April 24, 2003)
It is possible to address and resolve both these problems. Essentially, it isa matter of communication. To overcome them, we need to provide themeans to improve communication between groups, so that each hears andunderstands the others’ point of view. Each group will interact with all theother groups (Figure 2.1), either by direct or indirect communication, orbecause of views held from previous encounters. Some of these may bepositive viewpoints and some may be negative.
Warden and Nicholson [1] particularly noted that groups attribute prob-lems to people outside their own team. These biased attributions of faultsare summarized in Table 2.3, based on the MIP Report, and show that “Nomatter how badly my group behaves or how well the other group behaves, Iwill see minor faults outside my own group before I see major faults withinit. The other side is doing the same thing” [1]. The table summarizes howpeople react to others; in general we tolerate quite bad behavior from “our
2.3 Interaction between the groups and within each group 23
Measurers
SupportersBuilders
The softwareproject andthe softwareproduct
Managers
Customers
Figure 2.1 Interactions between groups during a software project.

gang,” but are quicker to take offense at the behavior of other groups. This ishuman nature and we must struggle to overcome it.
Each of the groups claims that they are motivated to improve perform-ance. However, as each group has its own set of priorities and definition ofquality, each often hears the others’ views as if they were in direct opposi-tion to their own. For example, Warden and Nicholson [1] found that infra-structure staff measure quality as reliability and service level. They considerthe pursuit of the latest technical excellence as an attack on quality, perhapsbecause use of “leading edge” technology will be more difficult to support.At the same time, developers may see this as a demand for more primitive,hence, less excellent, technology because they measure by product attrib-utes, and perhaps by a transcendent view of excellence. Both sides assumethat the others’ aspirations are equivalent to their own fears.
Do the quality, process, and excellence models that we looked at inChapter 1 help us with this problem?
2.3.2 Intergroup relationships in CMM and Personal andTeam Software Processes
In the Personal Software Process [2], the emphasis of the process describedis on the individual software engineer (the builder). Individuals are asked toplan and track their tasks and time in order that they can make and meetcommitments made to others. This individual self-discipline is an essentialingredient in the success of the software project as a whole. In the TeamSoftware Process [3], the team is made up of software engineers, each ofwhom is following the PSP, and is therefore using CMM Level 5 processes;it has been used with “pure software teams and with mixed teams of hard-ware, software, systems, and test professionals” [4]. The PSP and TSP do notinclude the customer (see Table 2.4).
The software engineers must interact with their customers in order tounderstand the requirements, budget, and timescale, but the customer is notseen as part of the team. It is often true as well that the support group (ITinfrastructure, operations and so on) are only involved in a minimal way.
This isolation of the software engineers from other groups is very com-mon in software project teams, but is it counterproductive? I would suggestthat it is. I have noticed that IT groups and software engineers are not well
24 Defining the Software Team
Table 2.3 Attribution of Faults and Problems Inside and Outside “My Group”
If someone in my groupbehaves well,
I make a positive attribution. I attribute their good behavior topersonal goodness.
If someone outside my groupbehaves well,
I look for a negative attribution. I attribute their good behavior toulterior motives.
If someone in my groupbehaves badly,
I struggle to make a positive attribution. I make excuses for their badbehavior.
If someone outside my groupbehaves badly,
I make a negative attribution. I attribute their bad behavior topersonal badness.

regarded by many of their customers. Why is this? Partly it is the numberand effect of defects in delivered software; this is the problem that softwareengineering processes such as CMM, the PSP, and the TSP are designed toovercome.
However, there are significant problems in communication between thegroups. On occasion, I have asked software customers their view of ITgroup. Typical responses are “arrogant,” “do not listen,” and “in a world oftheir own.” If you ask IT people about their customers, typical responses are“ignorant about IT,” “do not listen,” and “in a world of their own.” Do wesee a pattern here?
In my experience, the more the customers and supporters are involvedin the project, the greater the mutual understanding of the groups, the bet-ter the project, and the more well received the software product. What isimportant is the interaction between people. At the European SoftwareTesting and Review (EuroSTAR) Conference in 2002, one speaker remarkedthat although we talk about the HCI (human–computer interface), all theinterfaces are human to human—the people who designed and built thesoftware and the people who use it [5].
2.3.3 Intergroup relationships and excellenceframeworks—the EFQM Excellence Model
The EFQM Excellence Model (see Chapter 1 and [6]) has four criteria thatare relevant. These are people (i.e., employees, the team doing the work),customers, partners (i.e., second or third parties, suppliers), and society.These are matched to the groups I suggest in Table 2.5. A similar grouping isfound in other models, for example, the Malcolm Baldrige model [7], whichis the equivalent model in the United States.
2.3 Interaction between the groups and within each group 25
Table 2.4 PSP, TSP, and the Groups
PSP TSP Matches to:
Software engineer Software engineer Builder, Measurer, Manager
Does not include Does not include Customer
Does not include Infrastructure Supporter
Table 2.5 EFQM Excellence Model and the Groups
EFQM Criteria Matches to:
People—Enabler
People—Results
Builders, managers, measurers, and supporters
Partners—Enabler Supporters (e.g., infrastructure)
Builders (e.g., third-party software house)
Measurers (e.g., third-party test services company)
Customers—Results Customers
Society—Results Customers—people affected by the software

The EFQM Excellence Model does not tell you how to organize thesegroups or how to improve communication between them, but it does expectimprovement in the perceptions each has of the organization, and of theperformance measures of the organization in relation to that group.
It is important for the software team (including all five groups) to con-sider responsibilities and ownership for tasks and problems. For example,Obeng [8] points out that poorly focused communication between projectleaders and project sponsors can lead to a vicious circle of ineffective riskmanagement and increased time spent on getting projects back on track. Hesuggests actions for the project owners to improve their communication andcontrol. Similar charts of miscommunication and improved communicationcould be built for other role pairs in the project.
I am not suggesting that everyone has to agree the whole time! Forexample, the groups’ different expertise and viewpoint for quality should bewelcomed, as it provides a balance. Some conflict between groups is good!
In an environment of honest dialogue, the groups constructively challenge
each other. In most software situations, the interests of the customers
are best served by balancing several definitions of quality. Unchecked, a
dominant group will follow their own definition to an extreme. In effective
software teams, the supporters ensure that the technologies the builders
favor can be maintained. The managers guard the customer’s budget by pre-
venting the developers’ overengineering and the measurers being inappro-
priately cautious. In a healthy project, the builders challenge the customers’
requirements, pointing out attributes that they haven’t considered. (Frank
Johnstone, personal communication, April 18, 2003)
What we need are ways to improve our interrelationships and commu-nication. There are a number of techniques and tools that can help withimproving communication and fostering understanding between people.Some of these are summarized in Table 2.6, and there is more informationin Appendix A.
These methods of improving empathy and communication between peo-ple are vital because each of the five groups contributes to and benefits fromthe software. Each group will require information from the other groups inorder to progress and make decisions, but if you are trying to introduce theseideas, you may find resistance. Remember we can only change our ownbehavior, but how we behave to others will influence how others treat us. Inthe next five chapters, I will explore each of the groups in turn, suggestingwhat they can contribute to the project and what they require from othergroups during the project. Then, in Chapters 8 to 12, I will look at each stagein the software project life cycle and how each group contributes at eachstage. In these chapters, I will refer to techniques for improving and under-standing communication, such as those in Table 2.6. I will provide moreexplanation as particular techniques are demonstrated, either in later chap-ters or in Appendix A, together with sources for further information.
26 Defining the Software Team

2.3 Interaction between the groups and within each group 27
Table 2.6 Summary of Techniques for Improving Communication Between People
Subject Area Technique Examples Brief Description (see Appendix A for more)
Motivationmeasurement andjob design
MIP [1] MIP is based on the Job Characteristics Model ofMotivation [9]. The job diagnostic survey provides acomprehensive set of motivational measures. As aprocess model, it can diagnose problems withmotivational dynamics caused by poor job design.Psychometric measurement techniques do notprovide this capability.
Team relationshipsand natural roles/team skills
Belbin team scores [10] Teams need to understand their strengths andweaknesses as a team. A balance of roles/skills isrequired in the personalities in the team. Exampleroles: plants have new ideas, completer–finisherswant to finish to fine detail. Too many plants andyou will never finish anything.
Improvecommunication—Empathy withothers
MBTI [11]
Honey & MumfordLearning Styles [12]
Kirton Adaptorsand Innovators [13]
Different people have different personalities andcommunication styles. People who wave their armsaround and talk a lot can annoy people who like tobe quiet and think, and vice versa. Myers-BriggsType Indicator (MBTI) identifies four contrastingtype pairs (e.g., Introvert/Extrovert) leading to 16“types” (e.g., INTJ isIntrovert-iNtuitive-Thinking-Judging).
Honey & Mumford Learning Styles Questionnaireidentifies preferred learning styles (e.g., Pragmatistsand Theorists require different experiences to learn).
Kirton identifies preferred problem-solving methods(Adaptors versus Innovators)—do we break the rulesor work within them?
Motivation Maslow Hierarchyof Needs [14]
Until someone’s basic needs (e.g., food, shelter) aremet, this is likely to be all they are interested in.Once they have enough at one level, then othermotivators become more important. The cutoff pointfor moving from one point in the hierarchy toanother is different for different people.
Improvemeetings
De Bono’s SixThinking Hats [15]
Improve meetings by setting rules for behavior. Six“hats” are used. Everyone wears the same color hatat the same time. Example roles: Black Hat—pessimistic, Yellow Hat—optimistic, Red Hat—feelings, White Hat—facts. Allows meeting membersto move outside their stereotypes and allows time fordifferent, sometimes difficult, types ofcommunication.
Helping groupsagree on goals,aims, objectives, targets,and indicators
WeaverTriangle [16]
On a one-page diagram, the group identifies andagrees on the aim of the project (why it is beingdone) and associated indicators of success, then theobjectives of the project (what is to be done) andassociated targets. This helps identify wherestakeholders have different aims for the project.
Identify problemsand root causes,find solutions
Ishikawa fishbones[17, 18]
Use to identify problems, root causes of problems,and solutions. On a fishbone diagram, brainstormproblems, their possible causes, their root causes,and, therefore, solutions to the root cause.
Walkthroughreviews
Reviews [19] A type of review with the purpose of increasingunderstanding of a document. The author introducesthe audience to the document and takes themthrough it, explaining the content.

References
[1] Warden, R., and I. Nicholson, The MIP Report—Volume 2—1996 Motivational Surveyof IT Staff, 2nd ed., Bredon, England: Software Futures Ltd., 1996.
[2] Humphrey, W., Introduction to the Personal Software Process, Reading, MA: SEI,1997.
[3] Humphrey, W., Introduction to the Team Software Process, Reading, MA: SEI, 2000.
[4] Software Engineering Institute Web site http://www.sei.cmu.edu, accessed April2003.
[5] Hatton, L., “Quantifying Test Value: Some Examples and a Case Study,”EuroSTAR Conference, Edinburgh, Scotland, 2002.
[6] European Foundation for Quality Management Web site, http://www.efqm.org,accessed August 2003.
[7] Malcolm Baldrige model, http://www.quality.nist.gov/index.html, accessedAugust 2003.
[8] Obeng, E., “It’s Nobody’s Baby,” Project Manager Today, Vol. XV, No. 3, March2003.
[9] Hackman, J. R., and G. R. Oldham, The Job Diagnostic Survey: An Instrument for theDiagnosis of Jobs and the Evaluation of Job Redesign Projects, Technical Report No. 4,New Haven, CT: Yale University, Department of Administrative Sciences, 1974.
[10] Belbin Associates, “Belbin Team Roles,” http://www.belbin.com/belbin-team-roles.htm, accessed October 2003; also for assessment information.
[11] Team Technology, “Articles,” http://www.teamtechnology.co.uk/articles.html,November 2003.
[12] Honey, P., “What Are ‘Learning Styles’?” http://www.peterhoney.com/product/learningstyles, accessed November 2003. PeterHoney.com, 10 LindenAvenue, Maidenhead, Berks, SL6 6HB. Tel.: 01628633946. Fax: 01628633262.E-mail: [email protected].
[13] McHale, J., “Innovators Rule OK—Or Do They?” Training & Development, October1986, http://www.kaicentre.com/.
[14] Gywnne, R., “Maslow’s Hierarchy of Needs,” http://web.utk.edu/~gwynne/maslow.HTM, November 2003.
[15] de Bono, E., Six Thinking Hats, New York: Penguin, 1999.
[16] Evans, I., “The Troubled Project—Best Practice from Theory to Reality,”EuroSTAR Conference, Stockholm, Sweden, 2001.
[17] Robson, M., Problem Solving in Groups, Hampshire, England: Gower, 1995.
[18] TQMI, Problem Solving—Tools and Techniques, Cheshire, England: TQMI, 2001.
[19] IEEE 1028™ Standard for Software Reviews, 1997.
Selected bibliography
Honey, P., and A. Mumford, The Learning Styles Helper’s Guide, Maidenhead, England:Peter Honey Publications, 2002. PeterHoney.com, 10 Linden Avenue, Maidenhead,
28 Defining the Software Team

Berks, SL6 6HB. Tel.: 01628633946. Fax: 01628633262. E-mail: [email protected].
Kroeger, O., J. M. Thuesen, and H. Rutledge, Type Talk at Work: How the 16 PersonalityTypes Determine Your Success on the Job, New York: Bantam Doubleday Dell, 2002.
Maslow, A., Motivation and Personality, New York: Harper and Row, 1970.
Mullins, L. J., Management and Organisational Behaviour, 5th ed., New York: FinancialTimes/Pitman Publishing, 1999.
Rothman, J., “Team Building at Work,” STQE, July/August 2003, p. 64.
2.3 Interaction between the groups and within each group 29

.

Roles and Quality: Customers
In this chapter I shall:
◗ Introduce the members of the customers group and theirroles and activities;
◗ Introduce their quality viewpoint;
◗ Provide a framework for customers’ activities within theEFQM Excellence Model;
◗ Identify information flows between customers and the othergroups.
“Why do so many IT people think the world was started with a
requirements catalog? Don’t they understand there’s more to my
business than that. . . . I want them to understand what makes my
business tick. . . .” “And why are they so arrogant and rude? Per-
sonally I’d take on the guy who has fewer technical skills if I
thought he understood my world, and he treated me like a human
being.”
—Two customers for IT services compare notes on
just why they hate their IT departments
3.1 Introducing the customersIf it were not for customers, we would not build IT systems.Software is only there to solve people’s problems and helpthem carry out tasks more easily. The context for the tasksmight be in home computer use, for example, to play a game orshop on-line. It might be a work context, for example, toreorder stock or produce a report. The use of the computer maybe essential to the task, for example, to carry out complex cal-culations or to control a remote robotic arm in a dangerousenvironment. It may be intended to make the task easier, forexample, intraoffice communication.
31
3Contents
3.1 Introducing the customers
3.2 Who could be in thisgroup?
3.3 Quality viewpoint
3.4 Quality framework usingthe EFQM Excellence Model
3.5 Communication betweenthe customers and othergroups
3.6 Summary of the group
C H A P T E R

The customers for IT systems do not love their IT suppliers or the soft-ware. Software is only a tool, and if it is technically excellent but not seenas useful, it will be rejected. In one organization I visited, a staff satisfactionsurvey showed that almost all the problems associated with staff dissatisfac-tion were perceived to be caused by poor IT provision. We saw in the quoteabove that customers have various reasons for dissatisfaction; the IT workitself may be poor, and the IT people may not be liked, either. IT people areseen as self-satisfied and arrogant; customers may feel sneered at if they donot understand the technical jargon. The second customer in the quoteabove told me that the IT support person they chose eventually for theirteam was the least well qualified technically, but was the politest and theone who was able to work as part of the team. In order that the customersreceive the software they need, they have to communicate with those whosupply the software, either directly or by representation; communication isvital to success.
Not only do the customers observe that IT “solutions” fail to solve theirproblems, they often believe that software in fact adds to them, for example,by adding steps or by hiding information. Additionally, if IT people arefocused on providing functionality against a requirements list, they may losesight of why the customer wanted the software.
When I visit large IT organizations, it is easy to see who in the IT depart-ment is well regarded by the customers; look for the queues by particulardesks and you will know that those are people who have troubled them-selves not only to understand IT technicalities but also to understand theircustomers.
In this chapter, I will examine who the customers of IT systems are, whatthey want, and how the communication gap between IT people and theircustomers can be bridged.
3.2 Who could be in this group?For customers, the software is a tool, a means for them to perform tasks effi-ciently and effectively. This group includes:
◗ People who will pay for the software, for example, the project spon-sor, budget holder, or purchaser.
◗ People who will use the software delivered (see “users” in Chapter 2,Table 2.1), for example, the customer service agents working at the callcenter of a financial services organization also request a change to thesoftware they are using to match a new business process.
◗ The customers of the end users: They do not use the software but areaffected by it when they interact with the end users; for example, some-one who contacts the call center to make a change to an investmentmay comment on the services provided, and this may lead the customerservice agents to request a business process change, which leads to asoftware change.
32 Roles and Quality: Customers

◗ Society and government as customers: There may be a legislative changethat requires change in business processes, supporting systems, or both.
◗ Organizational customers: Other people in the organization who needparticular outcomes; for example, the finance group may want toreduce costs and so request streamlining changes.
◗ In IT organizations without a direct customer, for example, those com-panies building and selling packages for commercial or home use, themarketing or product design groups may commission software and arecustomers in that sense, but they will not use the software.
◗ The IT organization itself may request changes; for example, theoperational support group may wish to improve the maintainability,performance, or reliability of IT systems without changing the func-tionality and usability for the customer service agents.
These people are all stakeholders for the quality of software because theycommission, buy, use, and are affected by the software.1
Let us examine some different types of customers and their relationshipwith software and with other groups.
3.2.1 In-house customer
In this situation, the IT department works for the same company as the peo-ple who will use the software and those who will pay for it. The managers,builders, measurers, and supporters may have a captive audience of custom-ers who must use their services, or they may need to bid for projects if thecustomers choose to put work out to tender. I have seen this happen, withthe IT department bidding against external third parties, and with teamswithin the IT department bidding against each other for projects.
When the customer is in-house, the relationship between the groups canbecome very close. The managers, builders, measurers, and supporters havethe chance to understand the customer and the organization in enormousdetail. At best, this has the advantage that the IT people can provide a realdepth of service to the customers, who, in turn, can become involved easilythroughout the process of commissioning, building, delivering, and usingthe software. Careful choice of processes and methods, as described inChapters 9 to 12, can allow the customers’ constantly changing businessneeds to be met because all the groups are in the same organization andshould, therefore, have the same overall strategic goal. One IT customerremarked to me:
If staff turnover in customer departments is much higher than in IT, the
builders and supporters may have more business knowledge, which enables
them to help the customers identify how software can create profitable
3.2 Who could be in this group? 33
1. The IT Infrastructure Library (ITIL) [1] differentiates customers who pay for the software, and users who
actually use the software. In this book, I have included both those groups together as customers.

opportunities. This can, however, become detrimental to the relationship if
it reaches the point where the IT people are dismissive of the customers and
feel it is their role to tell them what they want.
So we see that it can be disadvantageous if the IT people become compla-cent about their customers, leading to the types of comments we saw at thestart of the chapter. The costs of work can be hidden; the IT work may beseen as “free” because no invoices change hands. Alternatively, if work ischarged by a system of internal billing, with customers having a budget touse for IT work and the IT group having charging rates to bill against thebudget, then both the customer and the other groups can monitor the costof the software, including the cost of changes. Communication difficultiescan arise because of the personality and cultural differences between thegroups. I am struck by how often customers complain that the others, espe-cially IT specialists, whether managers, builders, measurers, or supporters,are uncommunicative, arrogant and rude. Meanwhile, IT specialists com-plain that customers do not know what they want, and also misunderstandthe communication style of their customers. In one organization, I remem-ber the business users remarking on the difficulty of getting what theyneeded from the network support specialists; the technical team would notrespond to questions, and often did not even reply if spoken to directly. Oneday, I asked a member of the technical team if he thought there were com-munication difficulties across the teams. “No,” he said, “the network hasbeen up 100% this week.” So, I changed my question to “Do you talk withthe business people very often? Do they come and ask you when they havea technical problem, for example?” He said that they did come and ask ifthey had problems and that he would deal with the problems, but that thebusiness users tended to chat, fuss, and waste his time. What I observed tak-ing place were dialogues like the one in Table 3.1.
In truth, the people on the technical team didn’t see the need to providefeedback at the level their customers required it. How do we deal with thisproblem? The Myers-Briggs Type Indicator (MBTI) [2] seems to show thatdifferent personality types require and give different types and amountsof feedback during communication. This means that we need to try and
34 Roles and Quality: Customers
Table 3.1 Typical Dialogue Between a Technical Team and Its Customers in OneOrganization
Tom Customer says: “Hi—how are you? I’m trying to do my e-mail and I can’t get access tothe network—it just doesn’t seem to be working and . . . ”
Ted Technical thinks: I’d better look into that.
Tom Customer thinks: Did he hear me?
Ted Technical Solves problem but does not tell anyone
Tom Customer, some time later: “Is the network available yet?”
Ted Technical replies (irritated): “Yes, of course it is.”
Ted Technical thinks: Why does this person ask me stupid questions?
Tom Customer thinks: Why is this person so rude and unhelpful?

understand other people’s communication styles. As customers, we need toconsider whether we have communicated in a way that puts our messageacross, and that results in the feedback we require. The dialogue could bemanaged differently (see Table 3.2). This improved dialogue allows TomCustomer to know what is going on, while acknowledging Ted Technical’sdesire to minimize “unnecessary” conversation.
3.2.2 Third-party custom-made system customer
Here the customer asks another company to provide a software system, andthe supplying company is going to design and build the software to meet thecustomer’s specific requirements. Like a custom-made suit, it will be madeto fit the particular customer rather than being bought ready-made. Thisallows the customer to ask for tenders from a number of suppliers, and tomake a choice based on reputation, confidence, ease of relationship, under-standing of the customer’s organization and needs, expertise in a particularapplication or software type, standards followed, price, or whatever the keyfactor is for the customer organization. This allows the customer to pick themost suitable supplier to meet their needs and to pay them on a partnershipor contract-by-contract basis.
The third party will be keen to get repeat business and this should focusthem on making every effort to meet the customer’s changing needs; theywill not be complacent about their position as a supplier. However, if thecustomer and supplier are working to a fixed-price contract, the supplierwill resist change if this means that the service or product will be deliveredat a loss. We will see in Chapter 9 how much work is required to reach thepoint where we can agree on a contract for a software development lifecycle (SDLC), and the importance of involving all parties in understandingwhat is required. For a third-party supplier, the risks associated with agree-ing to a fixed-price contract when there are uncertainties are enormous, socustomers need to be consider what type of contract is best not only forthem but also for their suppliers. As one customer manager remarked to me:
A fixed-price contract that is not competitive to the supplier does not neces-
sarily make good business sense for the customer. Third parties have quit
punitive fixed price contracts, forcing the customer to reissue for tender. On
occasion, the delay caused has prevented the customer from realizing the
benefits predicted from the software.
3.2 Who could be in this group? 35
Table 3.2 Improved Dialogue Between a Technical Team Member and a Customer
Tom Customer says: “I can’t get access to the network. Will you look at it please?”
Ted Technical says: “Sure, give me five minutes to finish this reboot.”
Tom Customer says: “No problem. Give me a shout when the network is running, please.”
Ted Technical says: “Yup!”
Ted Technical Solves problem and shouts across, “OK now!”
Tom Customer says: “Thank you!”

Options for a single project might include a time and materials contract;time and materials to a budget ceiling; a series of short investigative projectsto reach a decision about the content of and type of contract; or agreementto use an evolutionary, iterative, or incremental approach (see Chapter 10for an explanation) in which the budget and scope could be renegotiated ona stage-by-stage basis.
Some customers prefer to build a partnership relationship with theirthird-party suppliers, rather than working on a project-by-project basis. Thiscan be more satisfying for the customer and for the supplier, as relationshipsbuild up over time; the supplier’s staff feel like real stakeholders in thecustomer’s success, and they can see the outcome of their work, whichincreases their satisfaction and motivation. In turn, this means that they arehappy to work with the customer, and, therefore, provide a better service tothe customer, who in turn reports increased satisfaction with the supplier.
A closely embedded relationship with a third-party supplier can lead tosimilar advantages and disadvantages as the relationship with in-house ITgroups that we discussed in Section 3.2.1, but, additionally, if the customer’scircumstances change very significantly it can be difficult to disentangle thetwo organizations. Communication difficulties can arise because of culturaldifferences between the organizations, as well as because of personality dif-ferences between the groups and individuals. Often, a supplier organizationwill put its most “customer-friendly” people in the jobs that require cus-tomer contact. This improves the customer–supplier interactions, but mayhave the effect of moving the dialogues in Tables 3.1 and 3.2 from the cus-tomer organization to the supplier organization.
With third parties, one great advantage is the “fresh look”; sometimes,an outsider can see our strengths and weaknesses and how to improve moreclearly than we can ourselves.
3.2.3 Third-party package or commercial off-the-shelf (COTS)customer
Sometimes, instead of ordering a custom-made solution tailored to our spe-cific problem, we may choose a “ready-made” or “off-the-shelf” product.This is referred to as commercial off-the-shelf (COTS) software. The cus-tomer should be able to buy, install, and run this software without any tai-loring or changes built especially for them, although there may be optionsthey can set within the package. In this case, the relationship between thecustomer and supplier may be quite limited or consultancy and support maybe offered as part of the purchase. It is likely that the builders and measurersnever meet the customer directly. Instead, the customer relationship ismanaged via the sales, marketing, support-line, or client-management func-tions within the supplier. For the customer, the contact is minimal, perhapslimited only to the support line when problems arise. However, customerscan influence what is built into future versions of the package, for example,by taking part in user groups, lobbying suppliers for change, and reportingproblems or improvement suggestions.
36 Roles and Quality: Customers

Many different types of customers will become involved with COTS soft-ware, such as the following:
◗ Large organizations: Such customers are likely to have their own ITdepartments or commission custom-made software; however, theywill probably choose COTS to automate those generic businessprocesses that do not give them a competitive advantage and so donot need to be different from their competitors’ processes. We see thisin the success of some payroll and accounting packages, which areused across many industries. In such COTS acquisitions, the largeorganizations normally change their business processes to fit thoserequired by the package, this being seen as a more economical solu-tion than commissioning custom-made software.
◗ Small businesses: Many small businesses do not have IT departments andcannot afford to engage third parties to build custom-made software;they are likely to buy COTS. Companies can get competitive advantagefrom COTS by using it differently to their competitors. For example,one colleague reported to me that several years ago that one smallimporter became the first participant in the (then) niche active sportsgoods market to use a stock control system that was standard in moremature sectors. For a while, this gave the company an edge over itsrivals.
◗ Home and hobby users: These customers use software for entertainment,socializing, pursuing a hobby, or doing chores. Sometimes they buyCOTS to change the way they do an existing activity, for example, usinge-mail to write to friends or using a spreadsheet to manage their per-sonal finances. Most computer games are, of course, creating a newneed.
◗ The niche user: There are very specialized COTS systems [3], for exam-ple, those used in military applications. You may see these referred toas NOTS (niche off-the-shelf) or MOTS (military off-the-shelf).2
With COTS suppliers, one of the supplier’s problems is that sometimesthere is no clear customer group; sales, marketing, client management, andthe support line or help desk act as a proxy customer for the other groups.The customers’ goals and requirements are found by market research, or bylooking at complaints and improvement suggestions. Market researchersinterview groups of likely or existing customers to help focus the supplier’sunderstanding of the customer’s viewpoints. However, the customers willsee these immediate contacts—the sales, marketing, client-management, orhelp-desk teams—as the face of the supplier, and direct any frustration withthe quality of the software at them. As a result, these contacts may becomebuilders by proxy!
3.2 Who could be in this group? 37
2. Definition copyrighted and used with permission of whatis.com (http://www.whatis.com) and TechTarget,
Inc.

We mentioned earlier that games programs are examples of an entirelynew product; before a computer game is invented, people do not knowthey need it. What happens when a product is entirely new? We may not,as customers, know that we need it; we have not specified requirements,and we have not noticed a need, we do not know we have a problem. Ihave seen cases in which one of the builders, a developer, or softwareengineer has invented a piece of software and then asked, “What couldwe use this for?” or has identified a way to solve a particular problem.Development of the ideas will then be led by sales and marketing basedon their knowledge of the end customers’ likely buying habits, and bymarket research.
3.2.4 The IT specialist as customer
Interestingly, people from all the groups become customers at some point,because all the groups use software tools to aid them in their work. Forexample:
◗ Managers use planning and reporting tools.
◗ Builders use compilers and software engineering and support tools.
◗ Measurers use test and review tools.
◗ Supporters use operational support tools and networking monitoringtools.
It is always instructive to see members of the IT group in receipt of a soft-ware tool, complaining about the lack of help messages, user guide, usabil-ity, functionality, and so on, and then to look at the customer reports ontheir last release. The IT specialists may also request changes to existing soft-ware in order to make it easier to support, for example, changes to make itmore reliable or have better throughput. User and business customers mustbe involved in these projects from the start-up discussions, even if they arenot the originators of the request for change. This is because any changemay have an impact on them; for example, I remember a performanceupgrade for a system that theoretically did not change the functionality but,in practice, resulted in a complete retest of functionality because the codehad been entirely rewritten. This was decided on by the builders of the sys-tem, but the user and support-line groups had not realized the amount oftesting that would be required from them, as they had not been involved inthe discussions at the start. As a result, the project was late in completingbecause the system and acceptance tests took longer than expected andresulted in more problems than expected.
3.3 Quality viewpointThe customer perspective is about supporting the needs of the individualcustomer, but also those of the organization and its stakeholders. These
38 Roles and Quality: Customers

needs must be met within the individual or organization’s constraints,whether of time, money, or expertise.
The user-based definition says that quality is fitness for use. Softwarequality should be determined by the user(s) of a product in a specific situa-tion, either in a home or a business. Different customer characteristicsrequire different “qualities” of a software product. This can be subjectiveand cannot be determined on the basis of quantitative metrics alone. It is theuser-based definition that encourages us to validate as well as verify the sys-tem. For example, fit for purpose might mean that I can do my work effi-ciently and effectively when I use this software.
This group may hold a transcendent view of quality. As we saw inChapter 1, transcendent quality is based on an emotional response to theproduct. For the supplier, especially of COTS software, the transcendentqualities will be very important. What is it that makes one software packagemore appealing than another? Different customers will hold views based onfashion, culture, prejudice, and previous experience. Customers need theanswers to these types of questions:
◗ When will I get it?
◗ Will it do what I want?
◗ Can I afford it?
◗ Can I rely on it?
◗ Will I enjoy using it?
◗ Will it make my life easier?
◗ Will it support our improvement strategy?
3.4 Quality framework using the EFQM ExcellenceModel
3.4.1 The EFQM Excellence Model and the customerorganization
For a business customer, software is used to help in tasks that allow theorganization’s goals to be met. In the EFQM Excellence Model (see thedescription in [4], for example) information systems come under the head-ing of “partnerships and resources,” that is, information and information sys-tems are resources that enable the organization to achieve its strategic goals.
Similarly, if we look at an organizational measurement system, such asthe Balanced Scorecard, information systems are seen as critically importanttools that enable employees to work effectively, so that they can contributeto the goals of the organization. We will look at how managers use the Bal-anced Scorecard in Chapter 4.
This means that the customer’s quality framework should influence thequality framework used by the other groups. For example, in one softwarecompany that provides third-party, custom-made software to its customers,the software company’s quality manual says that a project’s standards
3.4 Quality framework using the EFQM Excellence Model 39

should always at least equal the customer’s. If the customer has processesor practices that exceed the software company’s standards, those will beadopted for a project, but if the customer’s processes are less rigorous thanthose of the software company, then the software company’s processes willbe used.
The other groups need to be aware of the customer’s strategy and qual-ity framework, including any measurements and targets, in order that theycan deliver services and products that help the customer meet the organiza-tion’s quality targets. The emphasis will change, and this will change whatconstitutes quality for the organization. The organization may be driven bya need to meet a particular external standard, to keep within legislative orregulatory bounds, to increase market share, to reduce time to market, orto be a world leader for excellence of service. The supplier’s ability to recog-nize and adapt to the customer’s quality framework is a critical successfactor in the effectiveness of their relationship. The framework for the cus-tomer translates into departmental goals and, finally, into the personalobjectives and targets for an individual system user, but it also translatesinto a complementary subset of the supplier’s goals and, hence, into per-sonal objectives and targets for managers, builders, measurers, and sup-porters. This quality framework will drive what the customer needs fromthe software.
In Chapter 1, we looked at the EFQM Excellence Model and how it isdivided into nine parts: five enabling criteria and four criteria for measuringresults. In Section 3.4.2, we will look at how the EFQM Excellence Modelenablers could be interpreted for the customers of an IT project, and in Sec-tion 3.4.3, we will look at customer results. Remember that the EFQMExcellence Model is based on the fundamental concepts of excellence we dis-cussed in Chapter 1, and that equivalent models such as the Baldrige modelare available.
3.4.2 EFQM Excellence Model enablers for customers
3.4.2.1 Leadership
Leadership for customers is the leadership of their organization. If thevision and goals of the organization have not been communicated to thespecific customers who are commissioning software, then they will notcommission software that meets the quality goals of the organization. Thepressures on organizations will change the goals for the customers. Lately,for example, issues like information security and IT governance are playingan increasingly important role in organizations. Now, leadership in ITgovernance is expected from the board of directors and the executive man-agement, so it is integral to enterprise governance. Leadership from the topis required to ensure that the organization’s information systems sus-tain and extend the organization’s strategies and objectives. Leadershipfrom the top is also required to ensure that information and systems aresecure [5].
40 Roles and Quality: Customers

3.4.2.2 Policy and Strategy
The policies and strategies for the organization reflect the vision of theleaders. Customers of IT software and systems need to consider the policyand strategy for acquiring software that supports their information,improvement and organizational goals. As customers, we implement ITstrategies to reflect organizational strategies; for example, different custom-ers might need IT strategies to:
◗ Support the work in a particular industry sector, for example, differ-ent strategies for supplying the avionics industry, education sector, orhome computing.
◗ Support a marketing need, for example, different strategies to supportquick time to market with new products, high market demand,increased market share, or emphasis on a small number of high-valuecustomers.
◗ Support the administration of the rest of the business, for example,accounts and payroll.
Policies are brief statements that are the basic rules for how an organiza-tion conducts itself. As customers for IT, we want policies for obtaining ITsystems that enable us to fulfill our strategies. For example, different cus-tomers might have policies about:
◗ Acquisition types—“We will only buy COTS.”
◗ Supplier choice—“All suppliers must have achieved at least CMM [6]Level 3.”
◗ Supplier quality processes—“All acquired software must be designedand built complying to standards within the BSI Software and SystemsQuality Framework (SSQF) [7].”
◗ Relating to the supplier and involvement—“We want the supplier touse evolutionary delivery methods and to be involved at every stage.”
3.4.2.3 People
The people we are considering here are the customers themselves, becauseof their part in the software team. As we will see in Chapters 8 to 12, it isuseful if customers are involved throughout the life of software, not just asthe users of software, but also during the definition, build, and testing ofthe software. One of the advantages of the evolutionary delivery method,for example, is that the feedback cycle between the customer and theother groups is very fast. The customer is sent frequent improvements totheir software, and is also able to feed back to the supplier improvementideas needed to cope with changing requirements. According to Tom Gilb(at a seminar on Evolutionary Delivery, London, September 20, 2003),this feedback loop enhances the customer’s satisfaction with the softwaredelivery.
3.4 Quality framework using the EFQM Excellence Model 41

Customers can improve their contribution to the software quality andtheir understanding of the software project by learning how to take part incertain key activities. Some years ago, I worked at a software companywhere I helped to introduce a number of quality processes. We had puttogether an in-house document review process, based on experiences withwalkthrough and inspection methods that several of us had used in differentorganizations. This process allowed us to make decisions about the type ofreview based on the risks associated with the document, for example, thevalue of the contract, the difficulty of the technical work, and so on. Thereviews had the general structure of:
◗ Up to 2 hours preparation before the review to identify problems andsuggestions for improvement;
◗ Up to 2 hours meeting to document those problems and identify newones, with no more than six people attending, and optionally the sec-ond hour being used as a “solutions” meeting.
Time spent by each participant and the number of problems found werelogged, so we could check that people were using their time effectively andefficiently. You will see that as a process, this does not match the rigor orstructure of, for example, the Gilb and Graham inspection [8], but it was avast improvement over the previous situation, which was quite unstruc-tured. It was a good enough process. As part of an improvement program,we then decided to invite some of the customer organizations to take part indocument review training courses. The benefit to us as supplier and to themas customers was that when we asked customers to review contracts orrequirements, we all knew how to do it, how it was going to be organized,how much it would cost, and the purpose of the meeting. The customersenjoyed taking part and gained considerable satisfaction from contributingconstructive criticism and seeing it acted on. The software development lifecycle and the deliveries went far more smoothly; one of the directors com-mented to me that he spent far less time firefighting than ever before.
This principle of training customers to contribute more effectively can beapplied to a number of activities:
◗ Training in document reviews. For basic understanding of a reviewprocess, but also for review of particular artifacts. For example, “If youare reviewing a use case, expect to see.…”
◗ Training in user-acceptance testing, including an understanding of whyuser-acceptance testing is different from other types of testing, and whattechniques might be applied. For example, “If you are testing a Web siteyou will need to consider usability and security as well as functionality.”
◗ Training in process audits and reviews, including understandingwhy, during acceptance, the customer might want evidence of qualityactivities and how this might be found. For example, “If you arereviewing a supplier’s work, ask to have some tests run and reviewthe output from tests.”
42 Roles and Quality: Customers

3.4.2.4 Partnerships and Resources
The customer’s partners and resources for the software include all thegroups: those who are supplying the software and those who will support itduring use. The customers require a certain level of service from the soft-ware systems, and this will form the basis for the service level agreements(SLAs) with the supporters group. The criteria that the customers will use todecide whether to accept the software must reflect these SLAs because, inorder that the supporters group can fulfill the SLA, the software must becapable of delivering according to the SLA. Therefore, the customers mustwork with the supporters to set acceptance criteria. We will see in Chapter 9how to do this.
As well as partnerships with the supporters, customers will have part-nerships with non-IT suppliers and their own customers. The software sys-tems may need to share information, or they may need to be protected. Oneof the customer’s acceptance criteria for system attributes may consider howwell the delivered software supports control of interfaces with systems out-side the customer’s organization.
3.4.2.5 Processes
The customer’s business processes must be supported by the software andsystems. If the systems do not support and improve the organization, thereis no point having them. The business processes may be industry-specific orgeneral administration processes. They may also need to meet requirementsin particular quality standards, for example, ISO 9000 [9]. The businessprocesses should be designed to enable the customer to meet the organiza-tion’s strategy and goals efficiently and effectively. Any software systems arethere to make the work more effective and more efficient. The other groupsneed to understand the customer’s processes and standards in order to sup-port them.
3.4.3 EFQM Excellence Model results for the customers
3.4.3.1 Customer Results
The customers of the IT systems and software have their own customers.How does the software affect these customers? The customers need to findout how the services they offer to their customers could be improved, andthis may include improvements to the IT systems and software. Results ofsatisfaction surveys, complaints, letters of praise, and comments all indicatewhere processes and, hence, systems could be improved.
3.4.3.2 People Results
Are the people in the customer group who work with the IT groups happyto do so? Do the others in the customer group see them as representative? Itis important that the customer organization understands whether the IT
3.4 Quality framework using the EFQM Excellence Model 43

suppliers are good to work with. Look again at the quotation at the start ofthis chapter. These customers are not unhappy with the technical excellenceof the work done by their IT teams, nor are they questioning the number ofcoding defects. The two problems identified are lack of understanding of thebusiness in its essence and poor interpersonal skills. In one organization thatI visited, the staff satisfaction survey revealed that over 90% of the staff’scomplaints had to do with poor IT provision. This type of information allowsthe customers to show the other groups what changes are needed. Manyauthors, for example, Gilb [10] and Watkins [11], have observed that it isthe nonfunctional rather than the functional attributes that cause com-plaints or cause people to reject a product. This fits in with my practicalexperiences. Functionality is taken for granted, and is usually delivered, butthe real problems come in understanding what level of attributes such asreliability, security, and performance are required or deliverable. For thisreason, in Chapter 9 we will focus on nonfunctional acceptance criteria.
3.4.3.3 Society Results
We have already noted in Section 3.4.2.1 that as part of the governance ofthe organization, the governance of IT systems and their security is increas-ingly important, for governments and for society as a whole. Customersneed to consider what effect their organization has on society, and the viewthat society has of the organization. Consider how IT systems affect theimpact of an organization on society, both the perception that society has ofthe organization and measures of how the IT systems help the organizationto perform.
There will be legislative and regulatory controls set by government thatmust be obeyed. These include disability discrimination and data protectionlegislation. When looking at IT systems and projects, customers should con-sider how these support the organization in making products and servicesaccessible, while protecting privacy. For example, is it reasonable to use acopy of live databases to test a new version of the software? Leaving aside allthe technical reasons why this might be a bad idea, from a data protectionand security viewpoint is it right to allow detailed access to the data to peo-ple who would not normally see it?
It is also useful to consider the effect on society when reviewing risks. Ina financial services project, I looked at assessing the impact of problems witha group. We scored impact from 1 to 5, with 5 as highest impact. We set a“typical story” for each score to help us score the risks we were assessing,rather as in Table 3.3.
3.4.3.4 Key Performance Results
Key performance results measure financial results such as profit, return oninvestment, and turnover, but also measure nonfinancial results such asmarket share. The customer will want to know the efficiency and effective-ness of the IT systems in their contribution to the overall key performance
44 Roles and Quality: Customers

measures. The bottom line question is “Was it worth investing in the soft-ware—did we get a return on investment?” We will look in Chapter 4 athow the manager can use measures in the project that tie into the cus-tomer’s key performance measures; the customer needs to ensure that themanager knows what these are.
3.5 Communication between the customers and othergroups
We will see in Chapters 8 to 12 that customers are involved in the wholelife span of a piece of software, from its conception, through the softwaredevelopment life cycle (SDLC), during delivery, and postdelivery untildecommissioning. We will see that some of the SDLC models encouragecustomer involvement and other models do not. The advantage of havinglittle involvement to us as customers is that we order the software, andwhile it is being built and delivered we get on with other things. Superfi-cially, it looks as though we are being efficient with our time. The disadvan-tage is that during the period of the SDLC, things will change; our problemsas customers will change and the solutions we require will change. Thismeans that by the time we get the software, it is out of date. The disadvan-tage of SDLCs with high customer involvement is that it is time-consumingfor the customer, who also has “business as usual” to deal with as well asthe SDLC. The advantage is that it is far more likely that a useful softwaresolution will be delivered.
So we will see in the later chapters that communication between thecustomers and the other groups is needed throughout the whole life spanand that each of the groups must communicate with all the other groups.The customer needs to exchange information with all the other groups(Figure 3.1).
In order to decide whether it is worth acquiring new software, forexample, the customer needs to listen to the manager’s view on cost effec-tiveness, the builder’s knowledge of technical constraints, the measurer’s
3.5 Communication between the customers and other groups 45
Table 3.3 Assessing Impact of Risks—Effect on Society Scores High
Impact Score Description Story
5 External publicity—external customers affected
Chief operating officer appears on a consumer affairsprogram to explain why the systems have gone wrong.
4 External awareness—external customers affected
Letters and calls of complaint, dealt with individually.
3 Internal publicity—internal customers affected
There are system failures; the call-center staff canwork around these, but they are disruptive.
2 Internal awareness—internal customers affected
There are some minor system failures which the call-center staff can work round easily
1 No publicity—no customers affected
IT department affected by failures but can prevent thecall-center staff from being affected.

experiences of likelihood of problems, and the supporter’s view of impact onthe existing systems. A risk assessment would be done at this point, and, inparticular, customers need to assess the impact on the organization or busi-ness if the change is not made, if it goes wrong, or if it is late or over budget.In parallel with the risk assessment, therefore, the customers start to setconstraints for cost and time. While doing this, they should be listening tothe builders, supporters, and measurers’ views about the technical risks andthe technical constraints on what is being proposed. An SDLC may beappropriate, but it may not be the best solution. Whatever is decided on, acontract for the work needs to be agreed on. We will see in Chapter 9 howto reach agreement on aims, objectives, targets, and indicators, as well asmeasurable acceptance criteria. There may be constraints on the accuracyand precision of estimates, and customers should discuss this with the othergroups, and expect that estimates may have a broad range. At this stage,particularly in the planning for an SDLC, there will be many things that areunknown, so we would expect to see accurate ranges in the estimates,rather than precision:
◗ “I can complete this in the next 5 to 50 days” is likely to be an accu-rate estimate, but it is not a precise one.
◗ “I can complete this on October 23 at 2:57 p.m.” is a very precise esti-mate, but it may not be accurate.
It is also possible that the estimate makes us realize that it is not possibleto build and test what the customer wants within time and budget con-straints; something simpler must be agreed on. The customer must encour-age honest estimation. Too often, I have seen the IT team attempting toproduce an estimate that is acceptable rather than one that is realistic. Ifexperience of the customer’s reactions in the past has taught them that theywill get praised for a low estimate and criticized for a high one, it is humannature to produce an “acceptable” estimate now, and try to avoid the conse-quences later. Customers should particularly watch for the situation inwhich the people making the estimate are not going to be involved in thework; their job is to get the contract, and they may not be focused on theeffect of their estimate on the project team. Also beware of fixing the overallestimate too early; once changes are made to the requirements, whetherthese arise from change in the real world, correction of budget, or correction
46 Roles and Quality: Customers
Measurers
SupportersBuilders
The software projectand the software product
Managers
Customers
Figure 3.1 Communication between the groups.

of mistakes, this may mean changes to the estimates. Customers will need tonegotiate to deal with changes to requirements, whether these have been“set” and therefore require a contract renegotiation, or have been plannedfor. We know there will be change; we just cannot always anticipate whatthat change will be. Table 3.4 lists the information that customers have thatthe other groups need.
Customers need information from other groups in order to understandthe constraints on delivering their wish list. Table 3.5 lists the informationthat customers need from the other groups.
3.6 Summary of the groupWithout customers, there would be no software; their involvement andviews are critical to the other groups’ success. Customers have a vital contri-bution to make throughout the life of a software system. Their quality view-point, of the system being fit for its purpose, and their world, with itschanging risks and demands, must influence how the other groups work.managers, builders, measurers, and supporters only exist to enable the cus-tomers to achieve the organization’s goals.
3.6 Summary of the group 47
Table 3.4 Information That Customers Have That Others Need
Before the SDLC startsand updatedthroughout the SDLC
Which problems/ideas are important to the customer/organization and why
Changes in priority, new ideas, and problems
Whether any of the proposed solutions/prototypes are suitable
Reasons why they are/are not suitable
What the customer’s own customers need from them
Business constraints (time, cost, process, legal) and why these are constraints risks(impacts) to the organization if we fail or do not deliver the solution
Whether there are existing workarounds for this problem
Why this is important; the difference it will make
How we will measure success postdelivery
How we will accept the software (acceptance criteria)
What “fit for purpose” means in this case
During the SDLC An initial set of detailed requirements
User-acceptance testing—knowledge, business, budget, and time constraints
Changes, corrections, and refinements to requirements and acceptance criteria
Improvement suggestions for software, training, and documentation
Design of any new business processes
Delivery plan constraints and postdelivery SLA constraints
Revisions to the plans
Agreement on readiness to deliver
Authorization that the acceptance test has passed or failed
At delivery Confirmation that delivery is complete and accepted
Ready to start “real work” signal
Postdelivery Evaluation of the software in use; is it fit for its purpose?
Evaluation of the processes used; how could they be improved?

48 Roles and Quality: Customers
Table 3.5 Information That Customers Need from Others
Managers Possible solutions to problems/ideas
Cost and resource constraints and why these are constraints
Value quality viewpoint
Whether proposed aims/indicators are understood
Proposed objectives/targets for the solution
Whether proposed acceptance criteria are SMART (specific, measurable, achievable, realistic,and time-bound)
Nontechnical risks (likelihood of this going wrong) and nontechnical constraints such asresources, time, budget, and availability of people
Precision and accuracy of estimates, when refined estimates will be possible
Builders Possible solutions to problems/ideas
Technical constraints and why these are constraints
Why this problem/idea (for example, for a technical problem) is important and its impact onthe customers
Manufacturing/product quality viewpoint
Whether proposed aims/indicators are understood
Proposed objectives/targets for the solution
Whether proposed acceptance criteria are SMART (specific, measurable, achievable, realistic,and time-bound)
Technical risks (likelihood of this going wrong) and technical constraints
Precision and accuracy of estimates, when refined estimates will be possible
Supporters Possible solutions to problems/ideas
Technical constraints and why these are constraints
Why this problem/idea (for example, for a technical problem) is important and the impact onthe customers
Manufacturing/product quality viewpoint
Shared user quality viewpoint
Whether proposed aims/indicators are understood
Proposed objectives/targets for the solution
Whether proposed acceptance criteria are SMART (specific, measurable, achievable, realistic,and time-bound)
Technical risks (likelihood of this going wrong) and technical constraints
Precision and accuracy of estimates, when refined estimates will be possible
Constraints on SLAs postdelivery
Scope of supporters’ operational acceptance testing
Measurers Possible solutions to problems/ideas
Technical constraints and why these are constraints
Why this problem/idea (for example, for a technical problem) is important and the impact onthe customers
Manufacturing/product quality viewpoint
Whether proposed aims/indicators are understood
Proposed objectives/targets for the solution
Whether proposed acceptance criteria are SMART (specific, measurable, achievable, realistic,and time-bound)
Technical risks (likelihood of this going wrong) and technical constraints
Precision and accuracy of estimates, when refined estimates will be possible
Advice on acceptance testing
Advice on review processes
Assurance that QA and QC activities have taken place
Results of those activities

References
[1] IT Infrastructure Library, Best Practice for Service Support, Norwich, England:Office of Government Commerce, 2002, p. 7.
[2] Team Technology, “Working Out Your Myers Briggs Type,”http://www.teamtechnology.co.uk/tt/t-articl/mb-simpl.htm, October 2003.
[3] searchCRM.com (via http://www.whatis.com), “COTS, MOTS, GOTS, andNOTS,” http://searchcrm.techtarget.com/sDefinition/0,,sid11_gci789218,00.html, September 2003.
[4] British Quality Foundation, The Model in Practice 2, 2nd ed., London, England:British Quality Foundation, 2002, p. 86.
[5] Smith, M., “Govern IT,” British Quality Foundation IT & T Group Meeting, London,England, January 29, 2003.
[6] Software Engineering Institute, “Capability Maturity Model,” http://www.sei.cmu.edu, July 2003.
[7] British Standards Institute, PD0026:2003, Software and Systems QualityFramework—A Guide to the Use of ISO/IEC and Other Standards for UnderstandingQuality in Software and Systems, London, England: British Standards Institute,May 2003.
[8] Gilb, T., and D. Graham, Software Inspection, Reading, MA: Addison-Wesley,1993.
[9] International Standards Organization, ISO 9000:1994 and ISO 9000:2000Quality Systems 9000.
[10] Gilb, T., “Competitive Engineering,” http://www.result-planning.com/,September 2003 (Web site now replaced by http://www.gilb.com).
[11] Watkins, J., “How to Set Up and Operate a Usability Laboratory,” EuroSTARConference, Edinburgh, Scotland, 2002.
Selected bibliography
Buttrick, B., “Effective Project Sponsorship—Turning the Vision into the Realityof Success,” Project Manager Today, September–October 2003, pp. 12–13.
Information Systems Audit and Control Association, http://www.isaca.org.
IT Governance Institute, http://www.itgi.org/ITGI.
Kaplan, R. S., and D. P. Norton, The Balanced Scorecard, Boston, MA: HarvardBusiness School Press, 1996.
The National Strategy to Secure Cyberspace, http://www.whitehouse.gov/pcipb/.
Obeng, E., “Helping Stakeholders to Understand Requirements,” Project ManagerToday, July 2003, pp. 14–17.
3.6 Summary of the group 49

.

Roles and Quality: Managers
In this chapter I shall:
◗ Introduce the members of the managers’ group, their roles,and activities;
◗ Introduce their quality viewpoint;
◗ Provide a framework for the managers’ activities within theEFQM Excellence Model;
◗ Identify information flows between the managers and theother groups.
The tester challenges the project manager: “If we go live at the
planned date, I predict there will be problems! I want to test the
software more!” The project manager replies to the tester: “No!
We go live when we planned to!”
4.1 Introducing the managersIn Chapter 3, we learned that customers want to acquire soft-ware to help them carry out their tasks. They may have alimited budget, among other constraints. They will want thesoftware delivered as soon as possible so that they can startusing it. They will need to be supported during the acquisitionand use of the software.
The people who will provide the software and the sup-port for its use are technical experts: builders, measurers, andsupporters. They will focus on the details of the technicalsolution.
In contrast, the manager’s focus is on nontechnical aspectsof the work, such as budget control, planning, and reporting.Too often, the other groups see managers as the villains ofthe software development life cycle (SDLC). For example, ourtester above will be angry that the project manager will not
51
4Contents
4.1 Introducing the managers
4.2 Who could be in thisgroup?
4.3 Quality viewpoint
4.4 Quality framework usingthe EFQM Excellence Model
4.5 Communication betweenthe managers and othergroups
4.6 Summary of the group
C H A P T E R

delay the project to allow more testing. She may say, “Surely, the managercan see there will be problems. And, anyway, what has the project managercontributed apart from calling meetings that no one wants to go to?” Butthe tester may be wrong if the overall organizational imperatives are todeliver early. In this chapter, I will examine what managers do, and theirvalue-based view of quality and why it is useful.
Managers, if they are doing their jobs well, exist to enable other peopleto do what is required for the organization and the customer. They areneeded because IT projects and IT support are often complex, not just tech-nically but organizationally, involving large numbers of people, a restrictedbudget, and a tight timescale. The technical groups (builders, measurers,and supporters) are very focused on their own activities and, naturally,value them over other people’s work. They lose sight of the big pic-ture, as well as the budget and time constraints. There will be conflictsbetween groups and individuals, and competition for scarce resources.Risks will be perceived differently by different groups, and, as we are find-ing in Chapters 2 to 7, each group holds a radically different view ofquality.
So what do managers contribute? They keep everyone aligned to thegoals for the customer while keeping within the time and budget con-straints. They will negotiate between parties to arrange sharing of scarceresources, make decisions about how to proceed in the face of risks, listen tocomplaints from all directions, and soothe, calm, coach, and motivate theteam. Yes, managers make a contribution. A good manager will hold theteam together, through thick and thin, to achieve the goal.
4.2 Who could be in this group?Managers include all the people who control the planning and manage-ment of software delivery and support. This will include specialist proj-ect managers and team leaders, as well people who manage departmentsor teams that provide ongoing services and support (see IT Managers inChapter 2, Table 2.1). For a particular project, there may be a hierarchy ofcontrol, starting from a project/program board. Reporting to the projectboard might be a program manager, one or more project managers and,working under them, project leaders and team leaders. There may also be aproject office providing project management support. These people arestakeholders for quality because they are responsible for the time andbudget control of the project, and for meeting planned delivery require-ments. These are important aspects of quality: the customer needs a productthey can afford.
Of course, we all need to manage our own work. We need to plan whatwe do, and manage it so, in that respect, we are all managers—it is the sizeof what we manage that changes. For many of us, making the move frommanaging our own time to managing our team’s time is a very difficult tran-sition and we will look at that in this chapter.
52 Roles and Quality: Managers

4.3 Quality viewpointManagers tend to focus on two key measures: time and money. These twoconstraints on any work are very important. If the customer spends beyondtheir budget or if the software arrives too late to be of use, however techni-cally excellent it is, we have not delivered a quality solution to the cus-tomer’s problem. Therefore, this group favors the value-based definition ofquality.
As we saw in Chapter 1, the value-based definition is focused on thingsthat impact on the running of the business as a whole. Software quality isdetermined by a trade-off between time, effort, and cost aspects. Managerswill measure the cost–benefit ratio and return on investment (ROI). Theywill also plan and manage within a budget for time, effort, and cost. Becauseof their need to contain the work within a set budget, they may also supportone aspect of the manufacturing-based views of quality, that is, delivery toan agreed specification. They will see any change to the agreed specificationas “scope slip” and will want to avoid that. This is very important, particu-larly for teams delivering products or services within a fixed-price contractor to an immovable deadline. If a change in scope means additional work,the supplying organization may take a loss. In the long term, this couldmean the collapse of the organization. Managers will support processes andactivities that provide an immediate and a long-term ROI: a win now for theteam and the customer, and long-term customer satisfaction leading torepeat business.
Although this group may hold a view of quality which focuses on valuefor money, they also hold transcendent quality views. We saw in Chapter 1that we all “know quality when we see it”; our knowledge is based on ourexperiences, taste, affections, loyalties, and emotions. For managers, thismay mean they have a strongly held view about excellence based on theirprevious experience; this will vary depending on whether their premanage-ment experience was as a customer, a builder, a measurer, or a supporter.The “taken for granted” assumptions of managers may align particularlywith that one group. Managers find themselves wrestling with the qualityviews of all the groups in conflict during negotiations. Unfortunately, as dif-ferent people will have different assumptions, a manager, when negotiating,needs to be particularly careful not to assume that one group is correct andthe others are wrong.
A common cliché about managers is that they will deliver anything pro-vided they meet the budget and timescale, and they are not interested inquality, just in meeting the plan. When we examine behavior patterns, wecan see that the managers’ drive to meet the plan is essential. In a particulartraining course that I present, groups carry out a series of six risk assessmenttasks within a set time. What I have noticed is that when a group of projectmanagers carry out these tasks, they divide their time evenly between thesix tasks. However, a group of testers or developers given the same tasks andtimescale may only complete the first one or two tasks, although they willhave discussed and documented the risks in much more detail. The testers
4.3 Quality viewpoint 53

and developers did not see “missing the deadline” as a risk in itself, and, infact, asked for more time; they “overengineered” their tasks. The projectmanagers factored in “not meeting tight deadline” as one of the risks theyneeded to manage and produced a much sketchier, but adequate, solutionto the tasks. This is an object lesson in why we need managers. As we willsee in Chapters 5 and 6, when left to themselves, builders and measurersmay pursue excellence at the expense of all other considerations. Whenmanagers negotiate with the other groups, they need to express what theyrequire in a way that focuses on the other groups’ quality views. We can seein Table 4.1 how a project manager could use the other groups’ qualityviewpoints to start putting across ideas about cost–benefit ratio and value.
Managers of IT projects are often recruited from the builders’ group, butmay also come from the customers, measurers, or supporters’ groups. Thegroup managers come from will tend to bias their quality viewpoint, but oneof the jobs of the manager is to negotiate a balance between the viewpointsthat is suitable for a particular situation.
4.4 Quality framework using the EFQM ExcellenceModel
4.4.1 The EFQM Excellence Model and the manager
There are qualifications, standards and methodologies for project manage-ment and for management processes in general, but I am not going todescribe those here. I am not going to recommend a particular project man-agement methodology. What I want to do is pick out a few important aspectsof quality that are affected by management choices, and discuss these in thecontext of the EFQM Excellence Model we looked at in Chapter 1. We will
54 Roles and Quality: Managers
Table 4.1 A Project Manager Considering Other Viewpoints for Quality Impacts
Group and Quality View Possible Routes In Example Questions
Customer
User qualityview
Customer’s performancemeasures and indicatorsof success
What are the financial and nonfinancial goals for you onthis project?
What strategic benefits do you need to realize from thisproject?
Supporter
User and productquality view
Supporters’ service-levelmeasures
What SLAs do you have with the business?
What support budget do you have for supporting theproducts from this project?
Builder
Product andmanufacturingquality view
Builder’s knowledge oftechnical solutions
The customer needs to increase time to market for newproducts without compromising the excellence of serviceoffered; what technical trade-offs do we need to make tosupport this? Do you know a technique or tool thatwould help with this?
Measurer
Product andmanufacturingquality view
Measurer’s knowledge ofquality processes
The customer needs to decrease time to market for newproducts without compromising the excellence of serviceoffered; what quality processes do we need to apply tocheck the proposed solution? Given the limited budget,what are your recommendations for focusing testing andinspection processes?

see that we each need to tailor our methods in response to aspects of quality,culture, standards, risks, and expectations that affect our circumstances.
Whichever framework managers choose to follow, it should includesome quality-management activities. The quality-management system foran organization provides a framework of policies, standards, processes, andprocedures. Depending on the organization, these may be prescriptive andmandatory, perhaps because of external requirements, or they might be aframework of possible standards from which a manager chooses a suitableprocess for a particular project. This latter approach allows a manager to tai-lor the approach for a project to meet particular risks and customer expecta-tions. I have seen it used successfully in a number of organizations. We willsee an example in Chapter 6, where I will look at auditing. This selection ofan appropriate process and controls is a quality-planning activity and shouldtake place as part of project planning. The plan should include not just theschedule for the project, but also an assessment of risks and constraints, astatement of the aims and objectives for the project, and a series of planningdocuments describing the quality activities for the project (Figure 4.1).
This planning process will start during start-up (Chapter 9) and berefined at the start of the SDLC. However, it will continue during theSDLC and delivery (Chapters 10 and 11). Circumstances, risks, and what isimportant to the customer will change continuously and the managementframework must reflect the need for managing constant change. Of course,managers working to fixed-price contracts will have a difficult time withthis; they will either need to confine change to what can be achieved withinthe fixed price, agree with the customer that the fixed price is for a small,stable delivery, or renegotiate the contract. Some SDLC models, as we willsee in Chapter 10, provide for managing change better than others do.
Quality planning sets the processes for this specific project forquality assurance and quality-control assessment and measurement activi-ties, as well as setting the methods to be used for building the products.Quality assurance (QA) activities check that the processes are suitable andare being followed. Quality control (QC) checks the products for defects
4.4 Quality framework using the EFQM Excellence Model 55
Teststrategy
Testplans
Auditplan
Qualityplan
Riskassessment
Aims andobjectives
This project
MethodsStandardsPolicies
Company standards
Planning for quality
Figure 4.1 Planning for quality.

and improvements. These activities may provide feedback suggestions forimproving processes and products. Figure 4.2 is an adaptation for planningthat I have made of Deming’s Plan–Do–Review–Improve cycle [1]. We willexamine that again in Chapter 12.
If this evaluation is left until after delivery, it will be too late to learn andimprove the product we are delivering, so it makes sense to build evaluationinto the process steps. One of the key points about an evolutionary delivery,for example, is that it is accomplished in many small increments with a feed-back loop in each increment, allowing continuous improvement and learn-ing (see Chapter 10) [2].
In the EFQM Excellence Model [3], information systems come under theheading “partnerships and resources”—information and information sys-tems are resources that enable the organization to achieve its strategic goals.If we look at an organizational measurement system, such as the BalancedScorecard, information systems are seen as a critically important tool toenable employees to work effectively, so that they may contribute to thegoals for the organization. We will look at how managers use the BalancedScorecard later in this chapter.
Managers need to be aware of the customer’s strategy and quality frame-work, including any measurements and targets, in order to deliver servicesand products that help the customers meet their organizations’ quality tar-gets. The emphasis will change, and this will change what constitutes qualityfor the organization. The organization may be driven by a need to meet aparticular external standard, to keep within legislative or regulatory bounds,to increase market share, to reduce time to market, or to be a world leaderfor excellence of service. The manager’s ability to recognize and adapt to thecustomer’s quality framework is a critical success factor in the effectivenessof their relationship. The manager should refer to the customer’s goals whensetting team and project goals, translating these into personal objectives andtargets for themselves, and the builders, measurers, and supporters. Thisquality framework will drive what the customer needs from the software.
In Chapter 1, we looked at the EFQM Excellence Model and how it isdivided into nine parts; five enabling criteria and four criteria for measuringresults. In Section 4.4.2 we will look at how the EFQM Excellence Model
56 Roles and Quality: Managers
Identify defects in products
Qualityevaluation
Qualitycontrol
Qualityassurance
Qualityplanning
Identify defects in process
Identify improvements in process and productsQuality management activities
Figure 4.2 A quality-management planning cycle.

enablers could be interpreted for managers, and in Section 4.4.3 we willlook at manager results. Remember that this model is based on the Funda-mental Concepts of Excellence we discussed in Chapter 1, and that equiva-lent models such as the Baldrige model are available.
4.4.2 EFQM Excellence Model enablers for the managers
4.4.2.1 Leadership
Managers provide leadership for their teams. In order to provide leadership,they need leadership from their own managers and the board. The managerwill follow the lead given by the organization in matters of quality view-point and, hence, on whether value, fitness for purpose, manufacturingdefects, or product attributes will be the leading quality viewpoint. Manag-ers may also be torn between conflicting leads from the customer organiza-tion and more senior management in their own organization.
The manager is often the main conduit between the customer and therest of the team, relaying the customer’s aims and objectives. Through lead-ership, the effective manager communicates these to the team in a way thatcreates a common vision and unity of purpose. The CMMI frameworkthat we discussed in Chapter 1 includes a specific management practice to“Establish a Shared Vision” [4] for the team. A colleague commented to me:
This vital “big picture” increases commitment and enables all members of
the team to think beyond their own specialism and use alignment to the cus-
tomer’s objectives to validate their activities. Asking a selection of team
members to describe the objectives of one project resulted in a variety of
incorrect answers. The reason was that the managers believed in communi-
cating the minimum information that they thought the practitioners
needed to carry out their tasks. Unsurprisingly, commitment in the team
was low but it was also evident that a lot of activity in the team did not align
with the project’s objectives, and would have been challenged if the team
were aware of the project’s purpose.
The ability of a manager to inspire and motivate the team throughleadership cannot be underestimated. The behavior of someone the teamaccepts as a leader is characterized by honesty, trustworthiness, the ability tokeep a confidence, respect for others, and enthusiasm for achieving the aimsand objectives. If the leader does not believe in the cause, no one else will. Iremember visiting one project with some colleagues to provide consultancy.The project had been running for over a year and the team was tacklingsome extremely difficult but interesting problems. When we said, “It’s diffi-cult but we can do it—and it’ll be fun!” a team member said to me that noneof the management team leading the project to that point had indicated thatachieving the project’s aims was anything but difficult and unpleasant. Ifthe managers were not positive, how could the team be? When the newmanagement took a more robust attitude to the team’s ability to solve
4.4 Quality framework using the EFQM Excellence Model 57

problems, the project started to succeed. Of course, if managers lie about thedifficulty, they will quickly lose their team’s motivation, but part of a lead-er’s role is to understand what is necessary and what is possible.
4.4.2.2 Policy and Strategy
Managers set policy and strategy for their own areas based on their organi-zation’s policy and strategy. This will include policy and strategy for QA andQC, but we also need to define how the build and support activities aredone. In Chapters 5, 6, and 7, we will see some aspects of policy and strategyfor builders, measurers, and supporters; what managers need to consider ishow the customer policy and strategy are reflected in the strategy for theproject and, hence, for the all the work done.
Policies are brief statements that are the rules for how an organizationconducts itself. Managers also need policies for management activities; thesemay be documented or unwritten (“We always do it this way.”). The deci-sion about whether or not to document policy depends on the size of theorganization. (In this case, for example, does a particular project require itsown policy document, or does everyone in the project “know the rules”? Isthe policy statement at the organization level sufficient?) Policy statementsfor management might include topics such as:
◗ Authorization, for example, “documents may not be released to cus-tomers without an authorization sign off by a team leader.”
◗ Escalation, for example, “the project manager will always be informedof risks, issues and defects identified with an impact level of 4 or above.”
◗ Reporting, for example, “test team leaders will report progress againstplans to the test manager daily at 8:30 a.m.”
Strategies for managing show how the policies will be applied and whatapproach will be taken in a particular case. One mistake I have seen inexpe-rienced managers make is to believe that the project plan is just a schedule.In fact, the schedule is just part of what is needed to plan and control a proj-ect. Appendix B shows some of the documents we might need, including aquality plan, a configuration management plan, and a risk managementplan.
On a small piece of work, these might be used as a checklist of things tothink about, or a single document might be written that combines them all.In that case, keep it small—the size of the plan is not an indicator of its qual-ity. One very good aspect of tailoring is to allow the manager to combineand abbreviate documents where this is appropriate.
On a major project, we might need a whole set of documents, each ofwhich describes some aspect of the overall strategy for the work. Each docu-ment may have a different author, and part of the manager’s job, with theteam, is to make sure that the documents do make up a document family,do complement rather than contradict each other, there are no gaps, andthe overlaps are minimized. Part of the reason for defining a document
58 Roles and Quality: Managers

family is to allow child documents to just document differences and addi-tional information. A common error in large projects is to become over-whelmed with paperwork and electronic documents. Keep repetition acrossdocuments to a minimum, as it saves reading and update time.
If you are following a published project management method, you willfind that there will be a set of documents defined for your use. It is worthlooking at the rules in the method to see whether it is allowable to tailor,combine, and minimize documents.
4.4.2.3 People
Managers spend much of their time dealing with people. They are often thehub of communication between the customer and the other groups, andthey also deal with communications up and down any hierarchies. Manag-ers need to be good communicators, and this means that they need to:
◗ Be good at receiving information and showing they have received it.They must read and listen well, and provide feedback.
◗ Be good at giving information and making sure people have received it.They must speak and write clearly and elicit feedback.
◗ Understand other people and treat them fairly. They must persuade,negotiate, empathize, and know when to compromise and when to befirm, treating everyone fairly and taking into account their differentcommunication needs and quality viewpoints.
We have seen in Chapter 3 that one of reasons customers and builderssometimes do not get on is because of a difference in communication styles,and this is true for people in general. In Chapters 8 to 12, as we look at thestages of work that need to be managed, I will mention some techniquesthat help us improve communication.
Managers have a difficult mix of skills to acquire, and not all manag-ers have all these skills (which of us has?). One trick I find useful isto use a “personal improvement cycle.” As we saw in Section 4.4.1 andwill see in Chapter 12 when we look at evaluating software developmentprocesses, we use a plan–do–review–improve cycle. On a personal level itsimply means reflecting on how we manage ourselves during communica-tion with others and what we could do to improve the communication, notjust for ourselves, but also for the other people. Particular points to considerare cultural differences, personality differences, and communication styles,particularly when giving and receiving criticism [5–7].
I have noticed that one key factor in the success of a manager is consis-tency of behavior; if people know they can trust you, they work with you. Iremember one project manager who was very hard on everyone, but thiswas less of a problem for us “down the hierarchy” when we realized that hegave the same grief “up the hierarchy” to the project board and executives.
Another key factor is not being remote. Another very good project man-ager helped during a crisis weekend when technical staff were working
4.4 Quality framework using the EFQM Excellence Model 59

extra hours on some of the menial and housekeeping tasks to free time forthe team. This effort was much appreciated; he was seen to be in and work-ing when the team was doing overtime, and the work he was doing at thatpoint contributed directly to removing some of their burden.
4.4.2.4 Partnerships and Resources
I have worked in situations where the customer chose to bring in specialistsfrom a variety of organizations. For example, on one project, managerscame from the customer organization and were also brought in from a spe-cialist project-management consultancy; the builders and measurers camefrom third-party organizations as well as from the in-house IT group; andthe supporters were a separate group from the IT group, reporting through adifferent management structure, although they were in-house. The projectmanager spent much time negotiating between these parties. All were part-ners in the project, and were controlling different resources that wererequired if the project was to be successful.
An IT manager has pointed out to me that one key skill that a good man-ager has is political astuteness:
Managers often lead a virtual team that is united only by a shared task.
Whereas team leaders manage a group of practitioners in their own disci-
pline (such as builders or measurers), senior managers lead a matrix of spe-
cialists drawn from various functional areas (or companies), whose work
they do not understand in depth. These managers cannot depend on tradi-
tional sources of power such as the line hierarchy or resource ownership;
instead, they deploy a range of influencing tactics. They operate in two
worlds simultaneously: the rational world of budgets and schedules and the
shadowy world of organizational politics, which the specialists normally
don’t see.
Some new managers do all the things that I have recommended else-where in this chapter and still find unexpected opponents blocking or dis-rupting their projects. The same IT manager continued:
The experienced manager who spends all day in meetings and every even-
ing having dinner with key project stakeholders may be a joke in the team
but always gets the best people and delivers the right product.
These organizational partnerships through influence are critical to suc-cess, and the ability to nourish them makes the difference between those ofus who pursue technical careers and those of us who follow organizationalcareers. The ability to influence is not a sign of dishonesty, despite the suspi-cion of some IT technical staff; it is a way of communicating with peoplewho are stakeholders and have different communication styles (see Appen-dix A for communication styles).
60 Roles and Quality: Managers

4.4.2.5 Processes
The processes used by managers include skills such as planning, estimatingand reporting, for which there are various project management methodsand tools available. What I will do is to pick out some aspects of the mana-ger’s processes that particularly affect teamwork and quality.
Learning to be a manager. One aspect of IT management that I haveobserved over the years is that people are given their first managementresponsibilities without having the role explained to them or their existingwork removed; it is as though we believe that management activities areintuitive and take no time. In one typical instance, one of the developmentteam, let us call him Jeff Teamleader, was asked to team lead part waythrough a major project. A few weeks later when I visited the project, Jeffcame to me in a state of some distress; he was unable to carry out any of hiswork and was falling further and further behind. He could not understandwhat had happened.
When we talked it through, it turned out that until Jeff had been giventhe team leader role, he had a technically complex but organizationally sim-ple role; he had never needed a to-do list or a plan of action. Now, as teamleader, he had to plan and coordinate what the team as a whole was doing,produce some management deliverables such as estimates and reports, go tomeetings with the project manager, and negotiate and deal with conflictinside the team and with other teams. Also, he still had his own technicalwork to do. He had simply become overwhelmed and unable to do anythingas a consequence.
What was required? He needed a simple personal plan and a simpleteam plan, that would enable him with his team to make the big deliveryin a few weeks time, by breaking it down into chunks. Every day, heneeded to know what he and the team had to do that day, in order todeliver what was needed in the current week, so that the longer planwould work.
First, we sorted out his personal plan. We made a list of everything thathe had been asked to do or thought he had to do, including all the nontech-nical and nonproject tasks and building a plan for the team. We scored eachitem on the to-do list with an urgency, importance and size score. Wequickly identified some things that he did not have to do. Then we dividedup the to-do list as in Table 4.2, by deadline, importance, and urgency, put-ting together a day-by-day plan for the coming week, including a 5-minuteprogress review at the end of each day and a 10-minute session to plan thefollowing week at the end of Friday.
Once Jeff had this simple plan for next few days, he could start to planthe team’s work in the same way, and sort which parts of his own technicalrole to keep and which to delegate. It was much clearer to him and to themwhat really needed doing day to day. He calmed down; he could get a gripon the situation. Why hadn’t his manager, Liz, explained this to him as hetook over? I found two reasons when I talked to her:
4.4 Quality framework using the EFQM Excellence Model 61
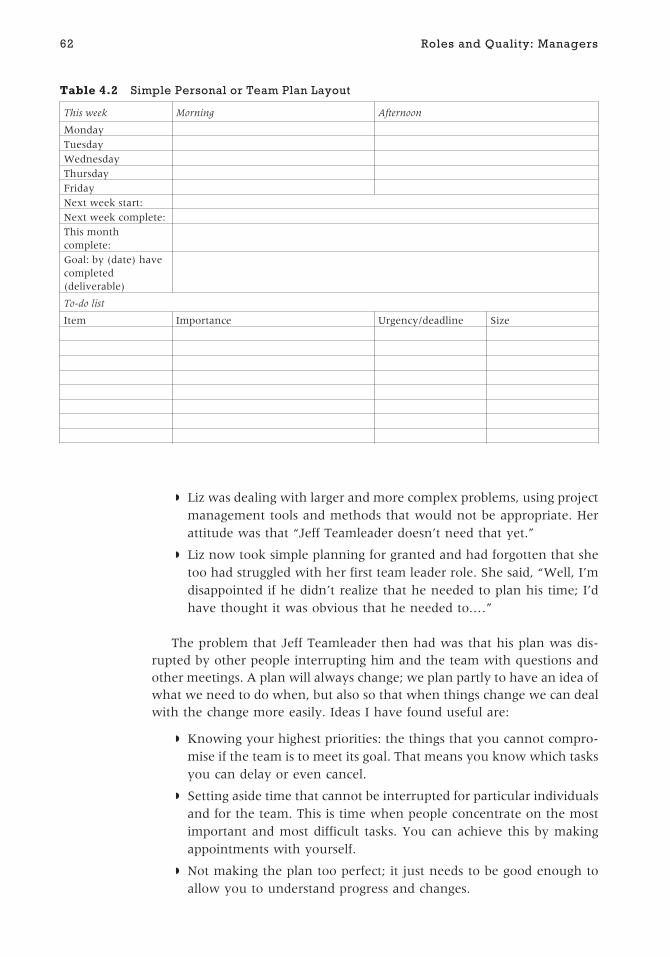
◗ Liz was dealing with larger and more complex problems, using projectmanagement tools and methods that would not be appropriate. Herattitude was that “Jeff Teamleader doesn’t need that yet.”
◗ Liz now took simple planning for granted and had forgotten that shetoo had struggled with her first team leader role. She said, “Well, I’mdisappointed if he didn’t realize that he needed to plan his time; I’dhave thought it was obvious that he needed to.…”
The problem that Jeff Teamleader then had was that his plan was dis-rupted by other people interrupting him and the team with questions andother meetings. A plan will always change; we plan partly to have an idea ofwhat we need to do when, but also so that when things change we can dealwith the change more easily. Ideas I have found useful are:
◗ Knowing your highest priorities: the things that you cannot compro-mise if the team is to meet its goal. That means you know which tasksyou can delay or even cancel.
◗ Setting aside time that cannot be interrupted for particular individualsand for the team. This is time when people concentrate on the mostimportant and most difficult tasks. You can achieve this by makingappointments with yourself.
◗ Not making the plan too perfect; it just needs to be good enough toallow you to understand progress and changes.
62 Roles and Quality: Managers
Table 4.2 Simple Personal or Team Plan Layout
This week Morning Afternoon
Monday
Tuesday
Wednesday
Thursday
Friday
Next week start:
Next week complete:
This monthcomplete:
Goal: by (date) havecompleted(deliverable)
To-do list
Item Importance Urgency/deadline Size
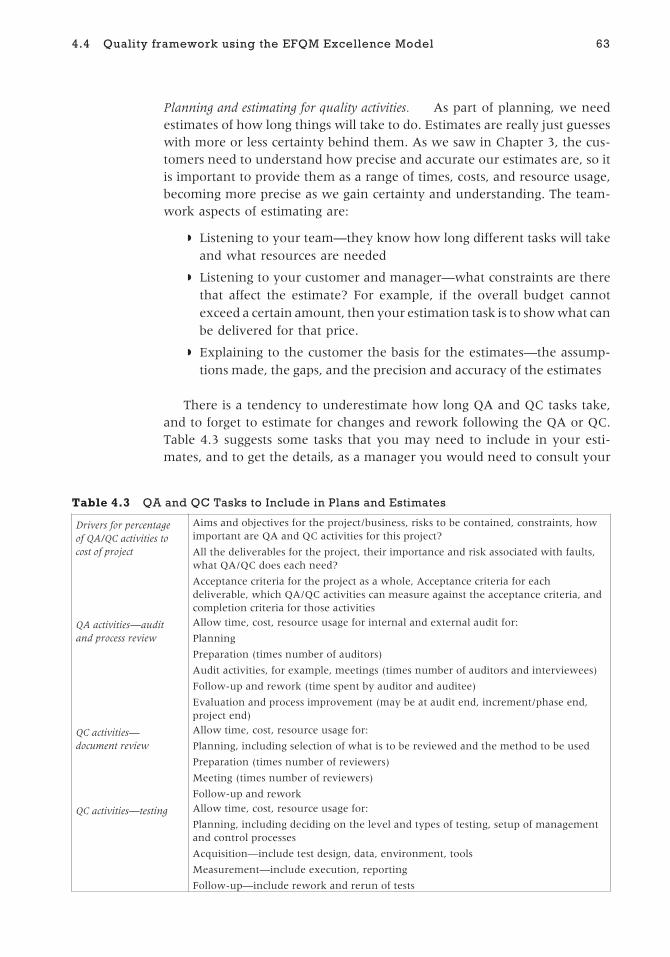
Planning and estimating for quality activities. As part of planning, we needestimates of how long things will take to do. Estimates are really just guesseswith more or less certainty behind them. As we saw in Chapter 3, the cus-tomers need to understand how precise and accurate our estimates are, so itis important to provide them as a range of times, costs, and resource usage,becoming more precise as we gain certainty and understanding. The team-work aspects of estimating are:
◗ Listening to your team—they know how long different tasks will takeand what resources are needed
◗ Listening to your customer and manager—what constraints are therethat affect the estimate? For example, if the overall budget cannotexceed a certain amount, then your estimation task is to show what canbe delivered for that price.
◗ Explaining to the customer the basis for the estimates—the assump-tions made, the gaps, and the precision and accuracy of the estimates
There is a tendency to underestimate how long QA and QC tasks take,and to forget to estimate for changes and rework following the QA or QC.Table 4.3 suggests some tasks that you may need to include in your esti-mates, and to get the details, as a manager you would need to consult your
4.4 Quality framework using the EFQM Excellence Model 63
Table 4.3 QA and QC Tasks to Include in Plans and Estimates
Drivers for percentageof QA/QC activities tocost of project
Aims and objectives for the project/business, risks to be contained, constraints, howimportant are QA and QC activities for this project?
All the deliverables for the project, their importance and risk associated with faults,what QA/QC does each need?
Acceptance criteria for the project as a whole, Acceptance criteria for eachdeliverable, which QA/QC activities can measure against the acceptance criteria, andcompletion criteria for those activities
QA activities—auditand process review
Allow time, cost, resource usage for internal and external audit for:
Planning
Preparation (times number of auditors)
Audit activities, for example, meetings (times number of auditors and interviewees)
Follow-up and rework (time spent by auditor and auditee)
Evaluation and process improvement (may be at audit end, increment/phase end,project end)
QC activities—document review
Allow time, cost, resource usage for:
Planning, including selection of what is to be reviewed and the method to be used
Preparation (times number of reviewers)
Meeting (times number of reviewers)
Follow-up and rework
QC activities—testing Allow time, cost, resource usage for:
Planning, including deciding on the level and types of testing, setup of managementand control processes
Acquisition—include test design, data, environment, tools
Measurement—include execution, reporting
Follow-up—include rework and rerun of tests

QA and QC experts to understand which techniques would be useful foryour project. You also need to estimate what knowledge and resources youwill require, and when you will need them. Tools, environments, and spe-cial skills may not be available to your team all the time, and there may beconflict with other teams for use of these resources, or they may not beavailable in your organization. In that case, you may need to estimate foroutsourcing or purchasing resources.
Monitoring, control, and measurement of progress. Once we have our planand our estimates, we need to track progress and make changes to the planas necessary. If, like Jeff Teamleader, our team’s work is contributing to apart of the overall plan, we need to be careful how we manage changes, asslippage in our work may have an effect on other people’s work; there aredependencies between the tasks. In a large project, the overall projectschedule may be controlled on a schedule of activities and tasks whichshows these dependencies on a PERT (program evaluation review tech-nique) chart. A PERT chart shows the length of time each task takes and thedependencies between tasks; it is a useful planning technique. A simpleexample is shown in Figure 4.3.
You can see from the figure that some tasks have to complete before oth-ers can start, but some can take place in parallel. You will see on each taskthe task name, the duration of the task, the earliest and latest days the taskcould start and finish, and the slack on the task. The slack is the amount oftime you can let a task slip before it makes the subsequent, dependent tasksslip. The path through the tasks with zero slack is the critical path, shown inbold in the figure. If anything on this path is late, the whole project will belate. If finishing on time is important, planning using a PERT chart to
64 Roles and Quality: Managers
0
Gather requirements
Tues
Tues
Tues
Tues
2 daysMon
Mon
Mon
Mon
Mon
Mon Mon
000
Design interfaces
1 dayWed
Wed Wed
Wed
1 day
1 day
Fri
Fri
Fri
Fri
2 days
2 days
4 days
Thurs
Thurs
Thurs
Thurs Thurs
Key:
LatestfinishSlack
Lateststart
Task name
Earliestfinish
DurationEarlieststart
Assumption:
Test products
Develop user guide
Develop training
Develop interfaces
3 days
Working days are Monday FridayA one-day task is started at 9 a.m.and completed at 5:30 p.m. on the same day.
−
Figure 4.3 Simple PERT chart.

understand dependencies and slack can be very useful. When monitoring,small amounts of slippage within slack may not be important to us, but ifthe slippage means that later tasks on the critical path will not complete ontime, it means we will not meet the deadline for the project. We mightreport using on a red–amber–green traffic lights system:
◗ Green tasks are completing within schedule.
◗ Amber tasks are finishing within slack.
◗ Red tasks have used up slack.
We can then identify where we have time problems: “If it weren’t fortask X, we’d be a green project.” Different levels of management mayrequire different levels of detail in reporting. I have seen some organizationsconcentrate on reporting on red and amber tasks only, whereas others onlyreport to the project board if the slip exceeds a certain amount. This cancause problems with accumulated small slips. For example, if managers onlytrack slippage by monitoring individual slips above a certain number ofdays, but there have been many small slips, they may not realize that thereal hidden slippage in the project may be much larger than documented.
There are other things to track apart from time used and time to com-plete against estimated time. For example:
◗ Overall budget to date against spending to date.
◗ Number of deliverables completed against how many you expected tocomplete by now.
◗ Cost to produce deliverables to date compared with what we expectedto spend on those deliverables.
◗ Quality of the deliverables against their acceptance criteria.
◗ Morale of the team (all groups—how happy are they now?).
◗ Delivery against targets.
◗ The organization’s objectives and the customers/supporters’ require-ments and how these are changing; how the project is changing tomeet the changing requirements.
We will talk in Chapter 10 about changing requirements during the soft-ware development life cycle, but here I want to discuss the use of a trackingand reporting mechanism that is used at the organizational level and couldbe adapted for an IT project: the Balanced Scorecard and its variants, some-times referred to as the project dashboard, which we will look at below.Another mechanism, Earned Value, is discussed in Appendix A.
4.4.3 EFQM Excellence Model results for the managers
4.4.3.1 Customer Results
The customer results for the manager to track are:
4.4 Quality framework using the EFQM Excellence Model 65

◗ Customer perception of the other groups. Managers should meet theircustomers regularly, and as part of such meetings need to check howthe customer feels about things. I remember a salesman once sayingto me, “What do you think you deliver?” I came up with a number ofanswers—completed audits and tests, reports, tested software, and soon. He said, “No—what you are delivering is happiness. Is the cus-tomer happy to see you? Are they pleased you are there?” We canmeasure this right now, throughout our work, and we can adapt todeal with any problems
◗ Customer performance results are also important; for example, do weget repeat business or extended projects from the customer? Have wea good reputation as a team and individually as managers? Thesemeasures may not be apparent until too late if we have not worked oncustomer perceptions during the project.
4.4.3.2 People Results
Here, we consider the measures we might apply to managers themselves.Table 4.4 suggests some measures. The first of these are perceptions—howthe managers feel about themselves in relation to the other groups and theirwork. The second group are the “harder” performance measures, staff turn-over, for example.
4.4.3.3 Society Results
Managers have a role in ensuring that society as a whole is considered, inline with corporate objectives. Table 4.5 shows some example results formeasurement. Quality here is not just the quality of the product itself, butthe quality of its effect on the organization and on society as a whole. Man-agers will have a responsibility for ensuring that their own team’s work doesnot breach standards in areas such as environmental management andimpact, organizational security, and corporate governance.
66 Roles and Quality: Managers
Table 4.4 People Results—Managers
Example of Possible Measures
Perceptions—surveys,interviews, compliments,and complaints
Has a motivational study provided positive feedback?
Are managers satisfied with their career paths, rewards?
Are the teams satisfied with their managers? Is the level of management andcontrol right for the individuals in the team?
Performanceindicators—internal tomanagers group
Does the managers group match up with the required qualifications andcompetencies? For example, do they have appropriate BCS qualifications [8]?
Are there particular signals of stress among the managers: excessive hours,absenteeism, and sickness levels compared with other groups?
What is the level of staff turnover compared with other groups and do peoplewant to be recruited into this group? For example, if we advertise a team leaderrole internally, do people apply?

4.4.3.4 Key Performance Results
It is important that the manager choose an appropriate set of measures formonitoring and controlling the project. This may seem obvious, but oftenwe choose measures that are not appropriate—we make the mistake ofmeasuring what we have always measured, or what is easy to measure,rather than what we need to know.
Within the organization as a whole, there will be a strategy with associ-ated measures, and both commercial and nonprofit organizations are startingto use Kaplan and Norton’s Balanced Scorecard [9–12]. This is a method tobalance different types of measure against each other. Examples might be:
◗ Long term versus short term;
◗ Financial versus nonfinancial;
◗ Leading and lagging indicators;
◗ Internal and external perspectives;
◗ Objective and subjective perspectives.
A simple example might be a balanced scorecard for a journey: We wantto get there as fast as possible, which will be expensive, but we also want totravel as cheaply as possible, which may mean a slower journey to conservefuel. There is a trade-off or balance between speed and cost.
Kaplan and Norton’s scorecard typically looks something like Figure 4.4.Financial, customer, internal, and learning measures are balanced againsteach other, with balanced objectives and targets.
There are as many variations in scorecards as there are organizationsusing them; [9–12] present several examples from real companies. What Isuggest is that if we know the goal and strategy for the organization, we canbuild a balanced scorecard for measuring quality in an IT project by balanc-ing the quality views against each other. Figure 4.5 shows an example.
The measures in this scorecard can:
4.4 Quality framework using the EFQM Excellence Model 67
Table 4.5 Society Results—How the Managers Relate to Society
Example of Possible Measures
Perceptions—externalto the group: surveys,interviews, compliments,and complaints
Are the managers seen by the organization and wider society as actingethically?
Do the managers ensure that the processes and systems act properly withregard to health risks, safety, hazards, and the environment?
Performance indicators—internalto managers group
Has the manager encouraged the team to work toward accolades, forexample, for paper- and energy-saving initiatives, in line with corporateinitiatives?
Have the managers supported the measurement group in checkingcompliance with external authorities’ certification?
Has the manager ensured that the team’s work complies to standardssuch as the ISO 14000 family (Environmental Management) and the ISO17799 family (Security Management)?

◗ Reflect the organization’s strategic measures and ensure that those onthe team all understand those measures;
◗ Balance the conflict between the value, user, product, and manufactur-ing views of quality;
◗ Be used continuously to report progress, not just against time and deliv-erables, but against quality targets;
◗ Be kept on one page or screen so it is easy to take in and agree upon;
◗ Be backed up by other measures and detailed explanation if requiredbut does speak for itself.
4.5 Communication between the managers and othergroups
4.5.1 Managers and communication cycles
We will see in Chapters 8 to 12 that managers are involved in the whole lifespan of a piece of software, from its conception, through the softwaredevelopment life cycle (SDLC), during delivery, and postdelivery untildecommissioning.
Managers need to negotiate with others and also to control project prog-ress. This can mean that the communication between managers and otherscan be difficult. Suppose that Liz Manager is waiting for a progress reportfrom Jeff Teamleader. The report was due yesterday and she has heardnothing. How should she approach Jeff? Maybe Liz is not good at confront-ing people. She might be tempted to wait and see what happens. But asmanager, she needs to know why the report is late; there may be a problemthat she needs to resolve that Jeff is reluctant to tell her about. One managerI worked for was quite unable to ask people for late reports. He would put anotice on the project notice board: “Will all team leaders please ensure thattheir reports are delivered on time; the following have not yet delivered thisweek’s report.…” The end result of his being unable to speak to his team
68 Roles and Quality: Managers
Balanced scorecard: simple organization example
Financial measures• Return on capital invested• Profit
Internal process measures• Process conformance• Process efficiency
Customer measures• Satisfaction survey• Complaints• Market share
Learning and innovation measures• Number of new products to market• Process improvements
Figure 4.4 Simplified typical balanced scorecard. (After: [9], p. 9.)

leaders directly to ask for their reports was that the team leaders, who didnot like the manager, did not understand the use of the reports, and who byand large were more experienced, started to put more energy into their“being late with the report” game. One particular old-timer said to me, “Ialways write the report on time, but I’m not going to give it to him unless heasks me himself; its an insult the way he puts those notices on the boardwithout speaking to me, when I sit right next to it.” I was too junior to askthe manager for his thoughts, but my reading of his behavior was he wasfrightened of the team leaders and so could not give or receive criticism suc-cessfully. All he needed to do was go to the team leaders and ask for thereports. I suspect that if he had done this once, they would have stopped thegame. During complicated interactions, we can only alter our own behavior,and hope that if we behave well, others will be encouraged to behave well[5–7, 13]. So, Liz Manager needs to ask Jeff Teamleader for his report, andshe needs to do that in a direct way. What affects Jeff’s response to therequest for the report is the manner in which it is made. Writers like Wag-ner [7] who use transactional analysis to describe behavior say we are sev-eral people at once—we have an internal dialogue that informs the dialoguewe have with the external world. We can choose to behave like adults andtreat others as adults, or we can behave like children or like parents. The egostates are:
◗ Adult—deals in facts: “The report was due yesterday.”
◗ Nurturing parent—wants to help: “I see you are having problems withthe report.”
◗ Critical parent—tells people off: “Why are you always late with thereport?”
◗ Natural child—likes to play and have fun: “Let’s have lunch and thinkabout it afterwards!”
4.5 Communication between the managers and other groups 69
Value-based quality• Return on investment actual versus projected• Spend to date actual versus planned (time, money)• Cost benefit
Balanced scorecard for quality
User-based quality• Customer perception• Percentage of tasks
completed using product
Improvements• Suggested• Implemented• Worked
Manufacturing-based quality• Number of defects in products• of nonconformances
to processNumber
Product-based quality• of acceptance criteria passed• Attribute level achieved
Number
Figure 4.5 Quality balanced scorecard. (After: [9], p. 9.)

◗ Rebellious child—does the opposite of what others want: “I’m notdoing the report!”
◗ Compliant child—assumes the blame: “Oh, I’m hopeless. I’m lateagain.”
Adult-to-adult transactions result in facts being communicated, but ifyou come and speak to me as though you are my parent, and are critical(“Why are you always late with the report?”), I may respond as a rebelliouschild (“I’m not doing the stupid report. It’s a waste of time. You do it.”) Thisis called a crossed communication; the unhelpful ego states feed off eachother and we build up to an argument. We could have had a more construc-tive, uncrossed dialogue:
Adult: “Is the report ready?”Adult: “No, but I will finish it this afternoon.”
The question is couched neutrally as a request for facts and so isresponded to with a neutral fact. Remember also that tone of voice and bodylanguage will also speak volumes; if the questioner uses “adult” wording buta “critical parent” tone of voice, she/he is still a “critical parent.”
Figure 4.6 shows how we can build up an expectation of poor communi-cation with those around us; our anticipation of problems causes us tocommunicate in a way that encourages a problematic response and it turnsinto a vicious circle. We give out the wrong signals and we get the wrongsignals back.
4.5.2 The reporting process
One key process for all managers is the reporting process. Measurers gatherinformation about processes and products and the managers, including testmanagers and quality managers, need to pass this on to other people in away that will be acceptable and understandable. Good information design is
70 Roles and Quality: Managers
Personal andorganizationalhistory
Repeatingcommunicationproblems
Games and scriptsRescuers, persecutors,and victimsCodependent behavior
Child
Adult
Parent
Why do people not listen?What goes wrong?
Poor communication
RCCCNC
A
NP
CP
Figure 4.6 Cycles of poor communication—our audience and us. (After: [7].)

vital; it is easy to hide your message in your report so that it is ignored ormisinterpreted. However well you have designed your audit or test process,however well you execute the process, if your reports are ignored, you mayas well have not bothered doing it. Reports are the managers’ deliverable toall the other groups:
◗ They help us understand progress and priorities.
◗ They help in decision making and risk assessment (they should showthe bad news and good news!).
◗ They inform management, our colleagues, and our teams.
When deciding what to report, we need to examine the facts. First, dowe have any facts? Managers need to report measurable facts, interpretationof those facts, and people’s perceptions, but should distinguish betweenthem. The measurers will provide the managers with data, which need to beinterpreted and reported, for example:
◗ “The audit found 23 critical deviations from the configuration-management standard” is a fact.
◗ “The nature of the deviations increases the risk of failure in this project”is an interpretation of the fact.
◗ “The project team are worried that the lack of a configuration man-agement process means that they cannot know whether they havecompleted the build” is a report of staff perception that comments onboth the fact and the interpretation.
All three provide important information which should be reported.When deciding what to report, do not collect information for the sake of
it. One mistake many people make is reporting either on what has alwaysbeen reported without questioning why, or only reporting on informationthat is easy to collect. Also, be prepared to report bad news as well as goodnews. In my experience, people want to hear the bad news; what they donot want is to get it when it is too late and without any ideas for improvingthe situation. Table 4.6 gives some ideas for consideration when deciding onmeasurement reporting.
4.5 Communication between the managers and other groups 71
Table 4.6 Planning Reporting—Questions
Who are our audience?Who is interested?
Customers, managers, builders, supporters, other measurers
Internal and external bodies
Who else?
What do they need to know?What are they interested in?
Time, money, quality (and include the different quality viewpoints),progress toward a goal
What else?
When do they need it? Daily, weekly, monthly, yearly
When an emergency happens? As risks increase? When issues arise?
What other cycles for your audience?
Why are they interested? Making decisions, assessing risks, looking for improvements
What else?

We often use graphics to report because they reveal data, especially fordisplaying complex ideas clearly, precisely, and efficiently but it is importantto remember that graphics can be abused, either by using graphics that arenot necessary or by distorting the data with the graphic [14–16]. Our eyesinterpret the representation of two- and three-dimensional images as hav-ing area or volume, and if these are used to show one-dimensional data, wewill see it as larger than it is, as we see in Figure 4.7.
One colleague remarked to me, “But I want to exaggerate the testresults—I want the customers to be really, really worried.…” I think he wasjoking, but the real point is, do you know that the graphs you produce areaccurate and will be accurately interpreted? There are some notes and otherexamples in Appendix A about the measures Tufte [15] suggests for check-ing your graphics: the lie factor, the data–ink ratio, and the data density of thegraphic.
Make sure you understand why you are using the graphic; is it fordescription, exploration, tabulation, or just decoration? Make sure youknow what message you are trying to put across. We tend to overdecorateour graphics [14–16] and thus hide what we are trying to say. Edward Tufte[15] suggests that we use “the greatest number of ideas in the shortest timewith the least ink in the smallest space” if we want to show the data.Many numbers in a small space encourages the eye to compare data. Istrongly recommend that you look at his work to understand good and badapproaches to information design and reporting.
Managers need information from other groups in order to understandthe constraints on delivering their wish list. Table 4.7 lists the informationthat managers need from the other groups.
Managers are conduits for information flow; they will gather informa-tion from all the groups and communicate it back to all the groups asreports, tactics, and decisions (Table 4.8 and Figure 4.8). They will do this atevery stage in the life of the software.
72 Roles and Quality: Managers
Number of bugs
Week
Distorted data representationThe Lie Factor
Number of bugsshown byarea
Number of bugsshown bydiameter
20015010050
4321
Figure 4.7 Distorted data representation. (After: [15].)

4.6 Summary of the groupManagers must communicate well with the other groups if they are to beeffective. They are responsible for planning, estimating, and controllingwork, as well as for making and enacting decisions. These are not intuitiveskills, and new managers need help as they take on the role.
Managers are the conduit for information flow through and between thegroups. Managers need to negotiate between the groups and ensure that theoptimum course is taken at each point. Use of a Balanced Scorecard will
4.6 Summary of the group 73
Table 4.7 Information That Managers Need from Others
Customers Goals, targets, strategy for the customer
Business constraints
Changes to circumstances
Acceptance criteria, set, reported on as pass or fail
Other managers Progress
Changes to circumstances
Builders Progress
Problems
Decisions required
Supporters Technical constraints
Timing constraints for delivery
Changes to circumstances
Acceptance criteria, set, reported on as pass or fail
Measurers Quality measures—number of nonconformances, defects, number of acceptancecriteria passed and failed
Progress
Problems
Decisions required
Table 4.8 Information That Managers Have That Others Need
At all stages Information gathered from each group
Experiences from previous projects
Constraints and policies
Effect of changes
Tactics and decisions based on policy, strategy, and circumstances
Managers
Builders
Supporters
MeasurersThe software projectand the software product
Customers
Figure 4.8 Communication between groups.

help in this negotiation. Use of clear reports is vital; managers need toensure that their reports tell the story they are intended to tell.
Managers are sometimes put in the position of being their team’s “par-ent” and need to consider carefully how they give and receive criticism.
References
[1] The W. Edwards Deming Institute, “Deming’s Teachings,” http://www.deming.org/theman/articles/articles_gbnf04.html, November 2003.
[2] Gilb, T., see papers on Evolutionary Delivery on http://www.gilb.com, including“Competitive Engineering: A Handbook for Systems and Software Engineering,”September 2003.
[3] European Foundation for Quality Management, “EFQM Excellence Model,”http://www. efqm.org, August 2003.
[4] Software Engineering Institute, “Capability Maturity Model Integrations(CMMI), Version 1.1,” http://www.sei.cmu.edu/pub/documents/02.reports/pdf/02tr004.pdf, October 2003.
[5] Tannen, D., “The Power of Talk,” Harvard Business Review, September 1995,pp. 138–148.
[6] Hathaway, P., Giving and Receiving Criticism, Los Altos, CA: Crisp Publications,1990.
[7] Wagner, A., The Transactional Manager—How to Solve People Problems withTransactional Analysis, Denver, CO: T.A. Communications, 1981.
[8] British Computer Society (BCS), “BCS Qualifications,” http://www1.bcs.org.uk/link.asp?sectionID=574, September 2003.
[9] Kaplan, R. S., and D. P. Norton, The Balanced Scorecard, Boston, MA: HarvardBusiness School Press, 1996.
[10] Bourne, M., and P. Bourne, Balanced Scorecard in a Week, London, England:Hodder and Stoughton, 2000.
[11] Olve, N. G., and A. Sjöstrand, The Balanced Scorecard, Oxford, England: Capstone,2002.
[12] British Quality Foundation and TQMI, “Using the Model and the Scorecard,”Seminar, Kettering, United Kingdom, September 2003.
[13] Copeland, L., “Testing as Co-Dependent Behaviour,” SIGiST Conference, the BCSSpecialist Interest Group in Software Testing, London 1999.
[14] Evans, I., “Get Your Message Across!” EuroSTAR Conference, Edinburgh, Scotland,2002.
[15] Tufte, E., Visual Display of Quantitative Information, Cheshire, CT: Graphics Press,1983.
[16] Huff, D., How to Lie with Statistics, New York: Penguin, 1974.
74 Roles and Quality: Managers

Selected bibliography
Adair, J., Effective Teambuilding, London, England: Pan, 1986.
Adair, J., Effective Time Management, London, England: Pan, 1988.
Berne, E., Games People Play, New York: Penguin, 1970.
Boddy, D., and D. Buchanan, Take the Lead: Interpersonal Skills for ProjectManagers, London, England: Financial Times Press, 1992.
Brooks, F. P., The Mythical Man Month, Reading, MA: Addison-Wesley Longman,1995.
Burnett, K., The Project Management Paradigm, London, England: Springer,Practitioner Series, 1998.
Chartered Management Institute (on-line checklists about management andquality topics), http://www.managers.org.uk.
Clarkson, M., Developing IT Staff, London, England: Springer, Practitioner Series,2001.
Crosby, P., Quality Is Free, New York: Mentor, 1980.
de Bono, E., Six Thinking Hats, New York: Penguin, 2000.
Evans, I., and I. Macfarlane, A Dictionary of IT Service Management, ITSMF, 2001.
Grove Consultants, “What Test Managers Say ... and Why Project ManagersDon’t Listen,” play presented at EuroSTAR Conference, Stockholm, Sweden,2001.
Hadley, T., “More Than a Thank You,” UK Excellence, August/September 2003.
Handy, C., Understanding Organizations, New York: Penguin, 1993.
Macfarlane, I., and C. Rudd, IT Service Management, Reading, England: IT ServiceManagement Forum, 2001.
Mullins, L. J., Management and Organisational Behaviour, 5th ed., New York:Financial Times/Pitman, 1999.
Pas, J., “Emotional Intelligence,” EuroSTAR Workshop, Stockholm, Sweden,2001.
Project Management Today (monthly journal), http://www.pmtoday.co.uk.
Schein, E., Organizational Culture and Leadership, San Francisco, CA: Jossey-Bass,1997.
Smith, J., How to Be a Better Time Manager, London, England: Kogan Page, 1997.
4.6 Summary of the group 75

.

Roles and Quality: Builders
In this chapter I shall:
◗ Introduce the members of the builders group, their roles, andactivities;
◗ Introduce their quality viewpoint;
◗ Provide a framework for the builders within the EFQM Excel-lence Model;
◗ Identify information flows between the builders and theother groups.
So I spent 2 months designing and building the new interface and
its underlying software. It’s got everything we discussed with the
users, and I added some extras that looked useful, after I’d talked
to the customer last week. You know I was here all night last
Thursday getting it finished for delivery into test on Friday. And
then at 10 o’clock on Friday morning, the tester comes up to me
and starts moaning about the interface being too complex. How
long could she have spent looking at it? I ask you! I just blew my
top. I said, “It’s my system; I designed it and I built it and I don’t
care what you think of it! It's not your business to criticize what it
does! You weren’t there when we discussed the spec.” We do all
the work and they do nothing but moan!
—Software engineer having a dramatic moment when
the tester complained (rather rudely) about the
complexity of the software interface
5.1 Introducing the buildersOf course, this group is vital to software quality—not only dothey build the products, but they build in quality. The people inthis group are wrestling with difficult problems as they create
77
5Contents
5.1 Introducing the builders
5.2 Who could be in thisgroup?
5.3 Quality viewpoint
5.4 Quality framework usingthe EFQM Excellence Model
5.5 Communication betweenthe builders and othergroups
5.6 Summary of the group
C H A P T E R

new products. Why is our software engineer so angry about the softwarebeing criticized by the tester? There are a number of reasons:
◗ Software engineers pride themselves in doing a good job; they want tobuild excellent products with few defects. In this case, the engineerhad done groundbreaking work over a long period of concentratedeffort.
◗ Once they build the product, it can be difficult to change it. In this case,a fundamental alteration to the design of the interface was beingsuggested.
◗ None of us likes having our work criticized, especially when we haveput in a huge effort and been creative. The builders group is vulnerableto criticism by the other groups as they are responsible for the products.
◗ When we offer criticism of other’s work, we need to consider thethree points above. In this case, the tester phrased the criticism verytactlessly. How do I know? Reader, I was that young tester and I lookback with embarrassment!
We have seen in Chapter 3 that customers need software to carry outtheir tasks, and that they want to do this as effectively and efficiently as pos-sible. We saw in Chapter 4 that managers contribute by planning and con-trolling resources, budget, and time scales; by acting as an informationconduit for decisions, to ensure that the proper communication takes placebetween people in the different groups; and by negotiating between thegroups. The builders will realize the customer’s requirements in productsand services; this means that they need direct communication with the cus-tomers, so the managers should encourage that if it is not happening. Alarge group of people with a variety of roles and skills contribute to thebuild. Many people think first of the teams and individuals who design andwrite the code for the software. One IT manager said to me: “Why are youtalking about ‘builders’? ‘Software engineer’ is a perfectly good term!” How-ever, many other products need to built along with the code itself, and thesecan be forgotten or neglected; remember our trainer in Chapter 1? Anothertrainer’s comment is that the request for training material to be designedand built is often made very late in the project:
I am so tired of being asked to write a training manual in two weeks, with
supporting training database, and exercises from scratch, when the software
has taken months to write, as though training development is easy to do and
takes no time. The software is wonderful; don't they want the training to do
it justice?
So, in this book, I emphasize that it is not just the code that is being built,and not just the software engineers who are involved. You might ask, “Willthe software engineers write the training material, help guides, and opera-tion support manuals? Those need building too!” Of course, the software
78 Roles and Quality: Builders

engineers could build all the products, but we need to ask ourselves if theywill have time and whether it is reasonable to assume that they have theskills required. For this reason I am using the term “builders” and include inthat category all the people who build products, whether these are deliveredto customers (software systems, training, user documentation), supporters(operations and support guides, system specifications, regression test packs),or only intended for use during the project itself.
5.2 Who could be in this group?Builders are the people who specify, design, and build the software andother products. The group includes a number of specialists:
◗ Those who work on the design and build of software systems;sometimes referred to as the development team (see developers inChapter 2, Table 2.1). In these roles, we find people who describethemselves as business and system analysts, software architects,designers, software engineers, analyst–programmers, programmers,and developers.
◗ Those who work on the development of textual and graphical support-ing information for the code and software system, whether this is on-line, on paper, or delivered face to face. In these roles we find peoplewho work as technical writers, authors, training developers, trainers,and graphic designers.
They are stakeholders for quality because they build quality into theproduct. The products include not just the delivered products (for example,code, user guides, training material) but also the interim products (forexample, requirement definitions, designs, and specifications).
As well as the main products—software, training material, and soon—built by the specialists, other people will build products required to aidin the build and support of the products; these are sometimes called infra-structure, support, interim, or secondary products. Almost everyoneinvolved will build something, including plans and reports. In this sense, weare all builders. Examples include:
◗ Supporters build supporting material, such as infrastructure andenvironments.
◗ Measurers build measurement material, such as review checklists,tests, and audit checklists.
◗ Managers build management material, such as plans and reports.
◗ Customers build inputs to the project, such as requirements andacceptance criteria.
This means that at some point we will all be builders, and we are allresponsible for building quality into our own products. What do we mean
5.2 Who could be in this group? 79

by building quality in? To find out, let us next look at the quality viewpointand framework of the builders.
5.3 Quality viewpointAlthough builders can be seen as date-driven, the pressure to deliver oftencomes from their managers and customers. Most builders tend to focus onbuilding products as well as possible. In order to support this, they favor themanufacturing and product-based views of quality.
In Chapter 1, we saw that the manufacturing-based definition focuses onthe specification, design, and construction of software products. Qualitydepends on the extent to which requirements have been implemented inconformance with the original requirements, and our success is measuredon our ability to follow a process and deliver products against agreed specifi-cations. Builders will adopt methods, processes, and tools that enable themto provide technically excellent solutions and to meet agreed specifications.
A problem with the manufacturing view is that if we focus on verifyingthat the system is correct to specification, we may forget to validate that wehave the right specification. For the builders, the progression through thesoftware development life cycle (SDLC) may move from product to product,with each product building on a foundation of the previous product in thestream. Once the customer’s requirements are understood, the softwaredesign is based on those requirements. The builders use the design todevelop the code and other material such as training courses and usermanuals. If the requirements are wrong, the final products are wrong,even though the designs were followed faithfully. Measurers also favor themanufacturing-based quality viewpoint, as we will see in Chapter 6, sobuilders and measurers can work together to ensure that verification andvalidation are applied to products and defects are prevented and removed.We will see in Chapters 9 and 10 that there are ways to overcome this prob-lem, by preparing for the SDLC properly: by choosing our SDLC model care-fully, and by anticipating that change will happen throughout the SDLC.
In addition to the manufacturing-based view, builders also favor aproduct-based definition of quality. As we saw in Chapter 1, this is aboutworking to a well-defined set of software quality attributes that can bemeasured in an objective and quantitative way. Builders can find customersvague about what they want, particularly in defining the nonfunctionalattributes of a software system. This is partly because software attributes aredifficult to describe and partly because it can be difficult to know whatis possible, particularly with new technology. The supporters share theproduct-based view of quality; they will be interested in product attributes,especially nonfunctional attributes such as throughput, security, reliabil-ity, and maintainability, which affect the operability of the delivered soft-ware [1]. They will also be interested in the customer’s user-based orfit-for-purpose viewpoint, because the supporters operate the help desk. Wewill look at the supporters in more detail in Chapter 7. It is, therefore,
80 Roles and Quality: Builders

worthwhile for the builders and the supporters to engage in dialogue earlyon and throughout the SDLC. Their product-based view pins down vague“wants” to specific attributes. We will see in Chapter 9 how to derive accep-tance criteria that allow objective assessment of the quality of the deliveredproduct, using standards such as ISO 9126. These product-based qualities orattributes are also important to builders because the priority given to par-ticular attributes will affect the design and build choices. For example, ifmaintainability is important, the code may be structured in a particular wayto allow changes to be made easily, but if a different attribute, for example,security or performance, is more important, the code may be structured dif-ferently and perhaps be harder to maintain.
Builders also hold a transcendent view of quality, as everyone does,based on their “taken for granted” assumptions; in this case, based on theirperceptions and their feelings toward a type of software product. For manybuilders, their transcendent view focuses on technical excellence or useof particular methods; for example, use of a particular SDLC model (seeChapter 10) or use of a particular technique or tool. A clichéd observation ofbuilders (including my observation of my own work in training develop-ment, authoring user guides, and, in the past, writing code) is of a group ofpeople who apply their expertise while obsessively pursuing technical excel-lence at the expense of a return on investment. They enjoy their own tech-nical innovations and yet can be reluctant to change their processes.
We have seen that the builders favor the manufacturing and product-based views of quality. These viewpoints are shared by many measurers,and this leads them to provide technical solutions of the highest possibleexcellence; their dedication to quality cannot be overstated. However, theirenthusiasm for what they do can blind them to the real quality aspira-tions of the customers, managers, and supporters. I discuss these groups inChapters 3, 4, and 7, and show how they hold two other quality viewpointsthat are quite different:
◗ The user-based definition says that quality is fitness for use. It is theuser-based definition that encourages us to validate as well as to verifythe system. The builders need to find out “Does the specificationreflect what attributes are needed to enable people do their work effi-ciently and effectively?” This viewpoint is important to the customersand to the supporters, the two groups most affected by the softwarepostdelivery (see Chapter 12).
◗ The value-based definition is focused on things that impact on the run-ning of the business as a whole. Software quality should always bedetermined by means of a decision process based on trade-offs betweentime, effort, and cost aspects. The builders need to find out “What arethe budget constraints for this build and how does that affect what weare able to deliver?” Value for money is important for managers andanyone responsible for budgets. The ROI for the software needs to bepredicted before delivery, and scope against the budget managed care-fully during the SDLC. It is worth noting here that employers of
5.3 Quality viewpoint 81

software engineering graduates complain that the graduates do nothave sufficient business and enterprise skills [2].
Along with acknowledging the user-based and value-based views ofquality, the builders need to understand others’ transcendent view of qual-ity. The builders must take into account the fact that other people’s takenfor granted viewpoints may well be different from their own. One importantpoint here is to examine the slant that builders may put on the manufactur-ing- and product-based quality viewpoints. Let us look at some examples.Here are some real remarks from builders, including a developer, an author,and an analyst:
◗ “I met the specification so there can’t be a problem,” said AliceDeveloper.
◗ “If you introduce a set process, I’ll just have to lower my standards tomeet it,” said Joe Author.
◗ “The specification defects arise because the testers won't review ourspecifications,” said Jenny Analyst.
These are three comments that contain a nugget of truth but which arealso flawed arguments. Let us look at them more closely.
Alice Developer is correct when she says, “I met the specification sothere can’t be a problem.” The code met the specification. Unfortunately,specifications can be out of date, or just wrong. They are written by people,so they will have mistakes and gaps in them. In the translation through thedifferent activities in the SDLC, the specification may have been workedon by several people as it was refined and detail was added. There mayhave been an initial misunderstanding that was compounded over theSDLC. Additionally, the customer’s requirements may have changed duringthe SDLC. This happens so frequently that we might almost take it as agiven—the requirements will change before delivery.
Corrections and changes will be needed, so builders, including AliceDeveloper, need to expect that. This makes some people wary of document-ing any requirements specification at all: “Why write it down if it is going tochange? We don’t have time to keep updating a specification!” But it is use-ful to write down the original specification and changes made to it. Then wehave a record of what has changed and why. Additionally, written specifica-tions can be checked for consistency, completeness, and correctness. Toencourage keeping specifications up to date, I like them to be as brief as theypossibly can, to encapsulate the facts and satisfy any standards or contrac-tual requirements. There is no virtue in writing long documents for theirown sake. Some agile methods [3] suggest using media that restrict thelength of the documents, for example, A5 cards. Keeping a record is worth-while. I have been in the situation with technical documentation, for exam-ple, where the structure and material have changed back and forth overtime. In order to explain to the managers and customers why I was behindtime against the plan and over budget, it was useful to have a record of why
82 Roles and Quality: Builders

changes had been requested as well as how long they had taken. Before Istarted keeping a written record of what changes were requested, it waseasy to get into arguments about why changes had been made and theamount of time it had taken to get from A to B to C and back to A again.
So change is to be expected, but do we want the builders to justmake those changes? Alice Developer was working within a contract and abudget, and had done exactly what was asked within those constraints. Ifshe had made the changes requested, she may have exceeded the budgetand time constraints, just as I was doing with the technical writing. Weboth needed to make some improvements in our process:
◗ We needed to assess the technical impact of the change requested;How big was it? How risky was it? How necessary was it?
◗ We needed to involve other groups in our assessment: the customers,managers, supporters, and measurers all would be able to contribute tothe discussion about whether the change was necessary and what itsimpact would be (risks, changes to budgets and estimates, effect onother work, what would not get done if this took priority).
◗ We needed to get agreement on the change.
It is worth remembering that the impact of a change may be much largerthan the immediate obvious change. One colleague was changing a trainingcourse recently. It looked like a simple change to combine two exercises intoone. In fact, combining the two exercises into one document was quite sim-ple, but far more time needed to be spent on changing the references in theslides, contents lists, tutor’s notes, printing and binding instructions, and soon. In the same way, a one- or two-line code change can lead to changes intraining material, help messages, support and user documentation, installa-tion guides, code comments, and other code modules.
“If you introduce a set process, I’ll just have to lower my standards tomeet it,”said Joe Author, an excellent practitioner with very high standardsof work. Why was the suggestion of introducing what measurers and man-agers saw as a quality improvement (the use of defined, documentedprocesses) seen as a threat to quality? Many builders see the introduction ofstandards as either a descent to the lowest common denominator, or as theintroduction of bureaucracy that will prevent them from carrying out theirwork. If processes are poorly designed or badly introduced, this may be thecase. What can the builders do to get the processes they need? The best wayis to get involved in the work of the designing and implementing processes,so that they own them. The experts who believe that introduction of stan-dards and processes will cause them to adopt poorer methods are the verypeople who design improved processes and to train others in using them.
Builders need sound processes at all stages to support them in the man-agement of change and the development of low-defect and appropriateproducts, and this includes use of QC processes on specifications to makethem as correct and complete as possible. The cost of changes to fix defects
5.3 Quality viewpoint 83

that could have been found earlier, saving rework, is a useful fact for build-ers to offer to customers and managers when asking for improvement in thespecification of systems. Measurers can help them with this fact gathering.We will see in Chapter 10 that there are SDLC models that provide moreopportunities both for checking that specifications are correct and complete,and for adapting to change during the SDLC, and in Chapter 12 we will dis-cuss the difference between fixing defects and making enhancements.
In saying “The specification defects arise because the testers won'treview our specifications,” Jenny Analyst, the builder, has misunderstoodwhere defects arise in products, and the tester has misunderstood that partof their role is to help the builder. In fact, this was just one comment in acatalogue of woe; the builders and measurers had a complete breakdown ofrelationship and simply did not cooperate at all. We will return to this storyin Chapter 6.
Although measurers and builders can appear to exist on different plan-ets, one reason that they come to loggerheads is that they are so similar.They share a manufacturing-based view of quality, with its emphasis ondefect removal. It can happen that the testers’ glee in finding defects ismatched by the developers’ irritation at being caught. One way to improvethis is for the testers to couch their defect reports more politely. However, asthis is the builder’s chapter, let us think about what the builders can do tohelp. I have seen a number of things that have helped build the relationshipbetween the groups:
◗ Workshops and training for the builders and the measurers together,where they can discuss what reviews and testing are needed and howthese should be done.
◗ Clear roles and goals for reviews, as we discuss in Chapters 8–12, so thateveryone understands what needs to be reviewed and why. The meas-urers and builders share responsibility for setting the goals and makingthe plans for the reviews.
◗ Review of the measurers’ plans, test designs, and reports by the build-ers, thus allowing a reciprocal arrangement.
◗ Builders welcoming defect reports on their products (sometimes thismight be through gritted teeth, as we all know when our own work isreviewed). Each identified defect is a chance to improve some-thing—this product by correcting, future products and processes byintroducing defect prevention methods, and the defect reportingprocess itself.
Communication is key, as always. In a recent software testing course,the group was an equal mix of developers and testers who worked together.I asked the developers and the testers two questions each:
◗ What information did the developers need when the testers sent thema defect report?
◗ What information did the testers send with a defect report?
84 Roles and Quality: Builders

◗ What information did the developers return with a completed defectreport?
◗ What information did the testers need when a completed defectreport was returned?
When we put the results up on the flip chart, there was almost no rela-tionship between the information supplied and that actually required. Assoon as the two groups had a chance to reflect on what was happening, theywere able to see how to improve the defect resolution cycle. The importantinformation that each group needed was not obvious or intuitive to theother group. The developers needed to explain to the testers what informa-tion they required in the defect reports. The testers needed to explain to thedevelopers what information they needed when a defect report wasreturned to them for retest.
In Table 5.1, we see how an example builder, a business analyst, mightconsider other quality viewpoints. We will look at communication betweengroups in Section 5.5; here, we are considering what questions about
5.3 Quality viewpoint 85
Table 5.1 Analyst Considering Other Viewpoints for Quality Impacts
Group andQuality View Possible Routes in Example Questions
Customer
User-basedquality view
Find out the importanceof fit for purpose onparticular features,functions and attributes
What are the goals for the product; what do you want toachieve? What will be the impact on your work if this goeswrong? If it is not available, can you work without it? Howmuch extra time would that take?
Are there alternative ways you could achieve the same results?
Supporter
User- andproduct-basedquality view
Find out the importancefor operability and fit forpurpose of importantattributes
What will be the impact on your work if this goes wrong?
If this attribute is not available, can you work without it? Howmuch extra time would that take?
What is the minimum level of (reliability/security/and so forth)that is acceptable?
If we delivered X, would that make your life easier or moredifficult? What information do you need to be able to supportthe products? What service-level agreements do we need toconsider/support?
Other builders
Product andmanufacturingquality view
Find out which attributesare technically possible
What information do you need in the specification in order tobuild the (code/training/support documentation/userguide/installation guide)
How quickly do you need that?
Can you build to an early draft expecting changes?
Which attributes/technical areas will pose particular problems?
Measurers
Manufacturingquality view
Find out what will makethe product measurableand, hence, testable
What information do you need from me in order to review thedocument/test the software/audit the process?
Which functional/nonfunctional areas have given rise to mostproblems for testing and where have you identified defect hotspots?
Manager
Value-basedquality view
Identify the cost of buildingand changing thespecifications and the costof repair/rework
The cost to the customer and supporter of not making thechange is X, and the cost of making the change is Y. The costimpact if we make the change and it goes wrong is Z. Can weafford to make the change? Can we afford to not make thechange?
quality we might consider in order to understand other people’s assump-tions about quality as a means of improving understanding.
Particular people in the builder group may have other quality views. Inmy experience, trainers and technical authors may be closer to the custom-ers in their view of quality than the developers and business analysts. Moreexperienced developers can often be very close in quality view to both thesupporters and measurers in their organization.
5.4 Quality framework using the EFQM ExcellenceModel
5.4.1 The EFQM Excellence Model and the builders
There are a number of well-accepted process frameworks that specificallyaddress the work of many of the roles within the builder group and howthose roles interact. Within a particular organization or team, requirementsgathering, business analysis, systems analysis, design, and coding work maybe carried out by different people, with the work being passed from one per-son to another; or one person may undertake several or all of the roles. Wewill look at several generic SDLC models and a tailored model with roles inChapter 10. In this chapter, I want to set the builders in a framework basedon the EFQM Excellence Model [4].
As we saw in Chapter 1, there are a number of frameworks for softwarework, including the SEI’s CMM family [5], and means of implementing itsrequirements, such as TSP [6] and PSP [7]. Additionally standards bodiessuch as IEEE [8] and BSI [9] provide software engineering frameworks andstandards. The IT Infrastructure Library (ITIL) has a framework for applica-tion management [1], which includes not just application development butalso management and optimization of the application in use. This setsapplication management within an EFQM framework, and also discussesthe similar Baldrige framework used in the United States. Other buildersalso have standards and process frameworks; for example, there are styleguides for authors, such as The Chicago Manual of Style by the University ofChicago Press [10].
Each organization needs to draw from these models and frameworks todevelop processes and standards in a framework appropriate for the type ofwork, the risks, the experience levels, and the customer expectations ofprocess. For some customers, particular standards, methods or techniquesare required, as discussed by Reid in [11]. Some customers, perhaps requir-ing an engineering approach to control risk, may demand achievement of aparticular CMM level with particular associated processes. Other customersmay face risks in achieving time to market; there may be pressure for a fast-track process, which might lead to a different set of processes. The builder’squality framework must match to the customer’s quality framework so thatthe delivered products are not underengineered and unfit for purpose, noroverengineered and too expensive.
86 Roles and Quality: Builders

The builders are suppliers, and any supplier’s ability to recognize andadapt to their customer’s quality framework is a critical success factor in theeffectiveness of their relationship. The framework for the customer trans-lates into departmental goals and, finally, into the personal objectives andtargets for an individual system user, but it also translates into a comple-mentary subset of the supplier’s goals, and, hence, into personal objectivesand targets for all the builders. This quality framework will drive what thecustomer needs from the software.
In Chapter 1, we looked at the EFQM Excellence Model and how it isdivided into nine parts: five enabling criteria and four criteria for measuringresults. In Section 5.4.2, we will look at how the EFQM Excellence Modelenablers could be interpreted for builders, and in Section 5.4.3 we will lookat builder results. Remember that this model is based on the fundamentalconcepts of excellence we discussed in Chapter 1 and that equivalent mod-els such as the Baldrige model are available.
5.4.2 EFQM Excellence Model enablers for builders
5.4.2.1 Leadership
We saw in Chapter 2 that the Motivation Survey carried out by Warden andNicholson [12] showed dissatisfaction between groups. One interestingfinding is that although technical experts, for example developers, want toorganize their own work, they often feel isolated because they lack feedbackfrom their managers; they lack leadership. In the absence of leadership fromtheir managers, people will either become demotivated, or they will lookwithin their peer group for a leader. I have observed situations in develop-ment teams and in authoring teams where the actual line manager is notthe natural leader of the team and may even be bypassed. I remember oneexcellent developer, Dave Tech-Expert, who disliked his manager for beingweak both as a person and technically “He doesn’t understand my work andhe asks stupid questions, but he never listens and he never supports me inmeetings,” said Dave. Over the years, Dave built a strong relationship with aspecific customer team, based on mutual respect and understanding of thetechnical difficulties in that customer area. The result was that, regardless ofagreed-upon project plans, both Dave and the customer bypassed the man-ager to organize the work that actually happened in that area. The managercontinued to report against the project plan, not realizing it was irrelevant;Dave had simply agreed to anything that would make his manager be quietand go away. A vicious circle was in place, with each action by the manager,the customer, and Dave compounding the mutual suspicion (Figure 5.1).
Warden and Nicholson [12] found that the builders group needed lead-ership, but that their leaders had to have some technical expertise andunderstanding, so that the builders knew that they could trust the leader tomake intelligent decisions. If they do not trust their managers, they willadopt unofficial leaders, sometimes known as influence leaders.
5.4 Quality framework using the EFQM Excellence Model 87
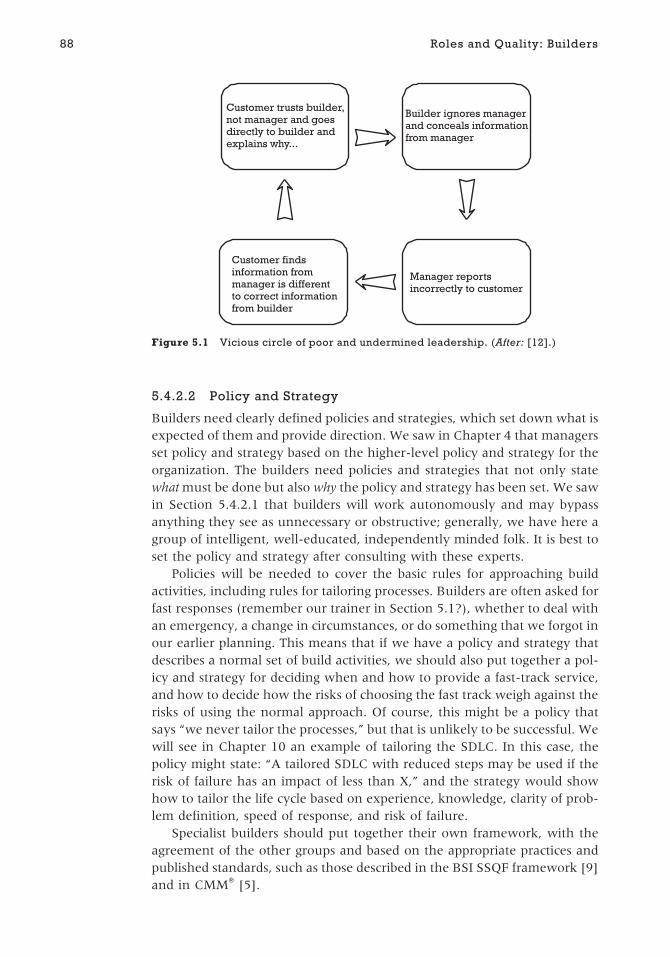
5.4.2.2 Policy and Strategy
Builders need clearly defined policies and strategies, which set down what isexpected of them and provide direction. We saw in Chapter 4 that managersset policy and strategy based on the higher-level policy and strategy for theorganization. The builders need policies and strategies that not only statewhat must be done but also why the policy and strategy has been set. We sawin Section 5.4.2.1 that builders will work autonomously and may bypassanything they see as unnecessary or obstructive; generally, we have here agroup of intelligent, well-educated, independently minded folk. It is best toset the policy and strategy after consulting with these experts.
Policies will be needed to cover the basic rules for approaching buildactivities, including rules for tailoring processes. Builders are often asked forfast responses (remember our trainer in Section 5.1?), whether to deal withan emergency, a change in circumstances, or do something that we forgot inour earlier planning. This means that if we have a policy and strategy thatdescribes a normal set of build activities, we should also put together a pol-icy and strategy for deciding when and how to provide a fast-track service,and how to decide how the risks of choosing the fast track weigh against therisks of using the normal approach. Of course, this might be a policy thatsays “we never tailor the processes,” but that is unlikely to be successful. Wewill see in Chapter 10 an example of tailoring the SDLC. In this case, thepolicy might state: “A tailored SDLC with reduced steps may be used if therisk of failure has an impact of less than X,” and the strategy would showhow to tailor the life cycle based on experience, knowledge, clarity of prob-lem definition, speed of response, and risk of failure.
Specialist builders should put together their own framework, with theagreement of the other groups and based on the appropriate practices andpublished standards, such as those described in the BSI SSQF framework [9]and in CMM [5].
88 Roles and Quality: Builders
Manager reportsincorrectly to customer
Customer findsinformation frommanager is differentto correct informationfrom builder
Builder ignores managerand conceals informationfrom manager
Customer trusts builder,not manager and goesdirectly to builder andexplains why...
Figure 5.1 Vicious circle of poor and undermined leadership. (After: [12].)

5.4.2.3 People
We have already noted in Sections 5.4.2.1 and 5.4.2.2 some of the charac-teristics of builders. This group faces the major challenge of using their crea-tivity and skills to realize the products and services, and their work ismeasured and judged by the other groups.
The Motivation Survey [12] found that many IT staff want work that hasa high motivating potential score, that is, it scores highly for things like thevariety of skills required, autonomy of work, significance of the task to theorganization, and the chance to complete a task from beginning to end andsee the outcome. The survey also found that the range of work went fromroles that were excessively understimulating to work that was more com-plex than it was possible to carry out. The latter was exacerbated by the ten-dency of IT people to automate parts of their tasks that are repetitive andboring, thus leaving them with only the complex parts. They are actuallymaking their jobs harder.
Builders need a mix of skills, and these would generally be providedwithin a team rather than by a single individual. Their education, training,and work experiences will of course include all the technical skills andunderstanding of the methods, techniques, and tools for their tasks. It isworth considering the communication and team analysis techniques, forexample, Belbin team roles and the MBTI analysis, discussed in Sections A.1and A.2, as well as technical skills, when putting together a team. Builders’education, training, and work experiences should also include an under-standing of:
◗ The measurement techniques they will need to apply to their ownwork and to other people’s work. Not only do builders carry out QCactivities such as reviews and testing, in which they will need train-ing, but, in my experience, they also make excellent QA reviewersand auditors if trained in the techniques. I noted before that buildersrespect technical excellence, so having the technical experts carryout process and product reviews across projects spreads knowledgeand increases the probability that the QA and QC processes will beaccepted as useful.
◗ The management skills they require for control of their own time andwork within a team. This is the focus of the TSP [6] and PSP [7], whichemphasize the planning, control, and reporting required by individualsoftware engineers and by teams.
◗ The interpersonal skills (sometimes called soft skills) to improve theircommunication with all the groups, including the builders themselves.Kent Beck [3] describes five values without which XP (eXtreme Pro-gramming) will not work. I think they are values without which anyhuman endeavor will not work: good communication between people;simplicity in choice of action; concrete feedback to aid communicationand simplicity; courage to confront and fix problems, if necessary by
5.4 Quality framework using the EFQM Excellence Model 89

discarding work and starting again; and, finally, what Beck describes asthe deeper value of respect for others.
◗ Their customer’s goals and strategy in order that they focus their tech-nical, measurement, management, and interpersonal skills towardsolving the organization’s real problems. This is increasingly impor-tant. For example misalignment of IT to the organizations’ goals iscited in the McCartney report [13] as a reason for frequent IT proj-ect failures. I recently asked a number of IT customers in differentorganizations what they wanted from IT people. Although some ofthe responses asked for greater engineering or technical skills, oth-ers wanted greater business awareness. One customer said, “Per-haps one danger I perceive in the competency-aligned improvementmodel (which is generally strong) is that the focus may be ‘profes-sional’ rather than ‘entrepreneurial.’ By that I mean more maturebusiness/systems analysis is seen as an end in itself, rather than ameans to doing things faster, smarter, and cheaper and making moremoney for us all.”
5.4.2.4 Partnerships and Resources
As we saw in Chapter 1, partnerships cover people outside our team, ourproject, or our organization with whom we need to exchange informa-tion or cooperate with in some way. Resources are the things like ITenvironments, information, and equipment that we need to carry out ourwork.
Builders have partnerships with all the other groups and within thebuilder group, both to exchange information and because some work maybe done by others and passed between individuals. They may also havepartnerships with builders in other organizations. Some examples of typicalpartnerships might include:
◗ Between groups: with the customers and supporters to define theproblem to be resolved and share information about possible solu-tions, risks, and the fit-for-purpose, user-based quality view;
◗ Between groups: with the measurers to define quality measures forproducts, carry out QA and QC processes to improve products andprocesses, and to resolve defects;
◗ Between groups: with the managers to understand constraints ontime, budget, and resources, and the impact these may have ontechnical risk;
◗ Within the builders group: developers with designers and analysts toshare information and review products concerned with building code;
◗ Within the builders group: software engineers with training designersand authors to share information and review products concerned withbuilding supporting material such as training courses and user guides;
90 Roles and Quality: Builders

◗ Outside the SDLC, with builders and supporters for other projects tonegotiate sharing of scarce resources such as environments and tools;
◗ Outside the organization, with third-party suppliers that the organiza-tion has selected to outsource some of the IT work.
5.4.2.5 Processes
As we saw in Section 5.4.1, there are a number of published frameworks forbuilders’ work, and these tend to be biased toward process definition ratherthan to the other enablers that we looked at in Sections 5.4.2.1 to 5.4.2.4above. The difficulty that software engineers in particular have is not findinga process definition, but in finding the right process definition for their cir-cumstances. I am not going to describe the candidate processes here; eachorganization needs to select from those available and will undoubtedly wantto adapt the chosen model to their own circumstances. I just want to notethat we need to consider a number of factors in choosing a process. Theseinclude:
◗ Builders’ buy-in: Do the builders understand the proposed process? Dothey need training, support, and mentoring? Will the process bringthem benefits and do they understand those benefits? If there areparts of the process that make life more difficult for the builders, isthere a rational reason for them in terms of benefits to the organiza-tion as a whole?
◗ Other groups’ buy-in: Do the other groups understand the process? Howmuch are they involved in the process? Do they need training, support,and mentoring? Will the process bring them benefits and do theyunderstand those benefits? If there are parts of the process that makelife more difficult for them is there a rational reason for them in terms ofbenefits to the organization as a whole?
◗ Flexibility and appropriateness of the processes: If the organization hasmany types and sizes of project, is it clear and easy to tailor theprocesses? Has paperwork and bureaucracy been minimized? Is thereenough documentation and not too much? Is there sufficient controlto minimize technical risk and human error, balanced against theprocess not being excessively expensive to run? Is it easy to changeand update the process? Does it meet any external process require-ments? Is it easy to identify entry and exit criteria at each step? Arecommunication points where information is shared identified? Areresponsibilities and authorities identified? Does the process allow forchanges in the customer and supporter requirements, and for changescaused by rectifying mistakes?
The choice of process needs to balance the needs of differentgroups—part of the reason for having an agreed-on process is to give assur-ance to all the stakeholders that they can trust that the right things are being
5.4 Quality framework using the EFQM Excellence Model 91

done. The different quality views of groups means that their expectations ofwhat should be laid down in a process will vary. For example, when thebuilders design their processes, they will need buy-in from all the groups, byshowing how the process will support them:
◗ Customers need the process to help them get what they need to solvetheir continuously changing problems and aspirations, and to knowhow the process will meet the demands of the organization, its cus-tomers, and society as a whole—all part of “fit-for-purpose,” user-based quality.
◗ Managers need the process to support them in controlling budgets forcost, time, and resources within and across projects, to see how it willhelp them deal with change and offset technical against financial risks,and for it to support improvements to future planning, estimation, andcontrol—all part of financial/corporate, value-based quality.
◗ Supporters need the process to include their involvement both in set-ting requirements and acceptance criteria for product attributes. Theyneed assurance that the process will result in software that can be sup-ported within the IT infrastructure and the IT service and applica-tion management standards—all part of “fit-for-purpose,” user- andproduct-based quality.
◗ Measurers need the process to acknowledge their focus on defect iden-tification, removal and prevention. They need to agree on how meas-urement processes (QA audits, QC reviews, and testing) are includedin the process—for example, that they take place early enough forthem to be effective and efficient—and mutual agreement on whatinformation needs to be communicated and when, including informa-tion about change.
◗ Builders need to know that their tasks are included in the process,with links to their own processes early enough for them to completetheir products, and with mutual agreement on what informationneeds to be communicated and when, including information aboutchange.
5.4.3 EFQM Excellence Model results for the builders
5.4.3.1 Customer Results
Customer results are the measure of the effect we have on our customers.Who are the builders’ customers? In fact, as well as the customers for thesoftware itself, all the groups are customers of the builders. If we lookat what the EFQM Excellence Model [4] refers to as customer percep-tion results and customer performance indicators, we see that perceptionresults are measured externally; we ask people outside our group for theirviews of us. Customer performance indicators measure what actually hap-pens to our group; whether we get repeat business from a customer,
92 Roles and Quality: Builders

for example. Both measures are needed so that we see the differencebetween a customer’s reported perception: “We think you are doing a greatjob,” and whether the customer actually invites the builder back for futureprojects. Examples of the type of results that could be measured are inTable 5.2.
5.4.3.2 People Results
In this case, the People Results measure what the builders think aboutthemselves. As with the Customer Results, we measure perception andperformance.
We have already seen that this group has quite specific motivationalneeds [12]. They need a stimulating environment and yet need support andleadership so that they are not alienated.
We will discuss SDLC models in Chapter 10, but I want to note here thatsome of the models encourage projects with team members involvedthroughout the SDLC and with frequent feedback loops, whereas otherstake a more production-line approach. I remember that in one organization,the business analysts would be involved in the first two to six weeks of aproject to gather requirements, and after that would move on to their nextproject. They never saw the outcome of the projects. One person remarkedto me, “I don’t even know if any code is built as a result of my work, letalone whether it is delivered and worked. I don’t know if I solve people’sproblems.” This is the essence of the alienating production line—“Peoplefrustrated by work that goes nowhere and an increasingly intrusive systemof management that means they have less and less control over what theydo” [14]. SDLC models that encourage involvement throughout the SDLC,allow interaction and feedback between the groups, and allow the teams tomake decisions and to control their own work, will provide a better workingenvironment for builders. According to Tom Gilb (at a seminar on Evolu-tionary Delivery in London in September 2003), the frequent-feedback loopis particularly important in improving individual and group motivation. Itseems reasonable to suppose that there may be improvements in individu-al’s motivation using models such as XP, which encourage such feedback
5.4 Quality framework using the EFQM Excellence Model 93
Table 5.2 Customer Results—What the Other Groups Think of Builders
Example of Possible Measures
Perceptions (external to the group),surveys, interviews, compliments, andcomplaints
Have the builders got a good image?
Do other groups report that they find the builders easy to deal with(for example, helpful, flexible, honest, and proactive)?
Are the builders seen as reliable, providing good value, providing agood service?
Performance indicators—measurementof outcomes
Do we get asked back for additional projects?
Are people proactive in coming to us for help?
Are our products usually accepted and used over a reasonable lifespan?
Do other groups complain about our work?

loops, compared with the waterfall model, which has a production-lineapproach.
We mentioned in Section 5.4.2.3 that IT staff require stimulating work.One colleague described to me what happened when his teammates gotbored; they had a competition to see who could use the most programmingconstructs in their programs, not because they were needed, but just to trythem out. The result was programs that functionally did what they weresupposed to do, but did it in a very convoluted way. I am glad I am notmaintaining those programs! A measurable result of the boredom of thosepeople was the number of lines of unnecessary code added for fun. Exam-ples of the type of results that could be measured are shown in Table 5.3.
5.4.3.3 Society Results
For the EFQM Excellence Model, society means society at large, andalthough we might want to measure this, we could interpret “society” for ateam as only including their organization. Again, we consider perceptionand performance indicators. Examples of the type of results that could bemeasured are shown in Table 5.4.
94 Roles and Quality: Builders
Table 5.3 People Results—What the Builders Think of Themselves
Example of Possible Measures
Perceptions—“external” measurementof the group viewpoints by theorganization asking for opinion throughsurveys, interviews, compliments, andcomplaints
Has a motivational study provided positive feedback?
Are builders satisfied with their career paths, rewards?
Performance indicators—“internal” tobuilders group. Measurement ofpeople’s viewpoints by their actualbehavior/attributes
Does the builders group match up to the required qualificationsand competencies? For example, do they have appropriate BCSqualifications [15]
What are absenteeism and sickness levels compared with othergroups? Are trainers showing a different absence pattern todevelopers?
What is the level of staff turnover compared with other groups anddo people want to be recruited into this group? For example, if weadvertise a business analysis course internally, is it over- orundersubscribed?
Table 5.4 Society Results—How the Builders Relate to Society
Example of Possible Measures
Perceptions—external to thegroup—surveys, interviews,compliments, and complaints
Are the builders seen by the organization and wider society as actingethically?
Do the auditors and testers check that the systems act properly with regard tohealth risks, safety, hazards, and the environment?
Performanceindicators—internal tobuilders group
Has the group won any accolades, for example, for paper- and energy-savinginitiatives, in line with corporate initiatives?
Has the group been recognized for its efforts to reduce security risksinternally and externally, including customer data confidentiality, preventionof spam and virus attacks, and IT governance provisions?

5.4.3.4 Key Performance Results
The EFQM Excellence Model divides key performance measures into twoareas: financial and nonfinancial measures. Some examples are shown inTable 5.5. It is important to reflect on why the organization needs an ITgroup; unless software is itself the revenue-earning product of the organiza-tion, the only reason for the software is to service the needs of the organiza-tion, allowing its customers and users to carry out their work more easily.For a business, this will mean that the key performance results for IT and,hence, the builders, must reflect the commercial drivers for the organiza-tion. For a nonprofit organization, again, the builders must support theorganization’s goals, increasing the efficiency and effectiveness of the serv-ices and products provided.
5.5 Communication between the builders and othergroups
We will see in Chapters 8 to 12 that builders are involved in the whole lifespan of a piece of software, from its conception, through the softwaredevelopment life cycle (SDLC), during delivery, and postdelivery untildecommissioning.
Builders have a large responsibility in communication to and from theother groups. They need to understand what is required, and they need tocommunicate back what is possible and what has been achieved. A problemwith this is that IT people may have quite different personality types andcommunication styles than their customers [16–18]. It appears that a largerproportion of IT people tend to be introverts, working by intuition, thinking,and judgment skills. If across the general population and, therefore, amongthe builder’s customers there is a bias toward extroverted behavior andworking more by perception or emotional ways of thinking, we can see thatthere will be a clash of communication styles. I have seen this particularlywhere sales, marketing, or customer service staff need to work with IT. IfPhil Marketing-Mann is emoting and waving his arms around, Dave Tech-Expert may just ignore him and, as he has brought his laptop into the meet-ing, just get on with some other work. One comment in [18] is that whereasmany IT people prefer written communication, their customers may prefer
5.5 Communication between the builders and other groups 95
Table 5.5 Key Performance Results—Financial and Corporate
Example of Possible Measures
Financial What is the return on investment (ROI) for the software we have delivered this year(cost of software/money saved/number of new customers/market share gained)?
Nonfinancial Number of projects/customers who request our team to carry out IT-related work, andthe size of these projects
Cycle times for responding to customer requests
Innovation by the builders (e.g., new technology to support time to market with newproducts)

face-to-face communication. This alone can give rise to misunderstandingand resentment. This is an important factor in the success of the builders:
… [P]otential weaknesses for the organization lie in the lack of feeling and
perception. These can become key issues if you need more flexibility and a
greater focus on the customer for future success. A culture biased toward
thinking and judgment is in danger of neglecting how the customer feels
about the service he or she is getting, which can be an important factor in the
decision to buy. [18]
Of course, in some builder–customer relationships the preferences maybe reversed. What is important is that the communication preferences in aparticular situation are understood. There is more about personality typesand communication in Chapters 8 to 12 and Appendix A. In Figure 5.2, Ihave shown the communications between builders and the other groups.Builders have information that others need (Table 5.6) and they also needinformation from other people in order to understand the constraints ondelivering their wish list. Table 5.7 lists the information that builders needfrom the other groups.
Remember, it is not just the content but also the manner of the commu-nication that is important. All the groups need to understand that theywill favor different communication styles, and that individuals within thegroups may or may not fall into the usual pattern for the group; we mustbeware of pigeonholing people. The lesson is that each builder needs tounderstand their own favored communication style and to consider thefavored communication styles of other people within their own and othergroups. If you are interested in discovering your own preferred style, youmay wish to look at the Myers-Briggs Type Indicator (MBTI) and take anMBTI quick test (see [17]).
5.6 Summary of the groupBuilders are essential to the quality and success of software and systems,and their technical skills are needed throughout the life of software. How-ever, builders must communicate well with each other and the other groupsif they are to be effective. This means considering how they demonstrate
96 Roles and Quality: Builders
Supporters
Builders
The software projectand the software product
Managers MeasurersCustomers
Figure 5.2 Communication between groups.

that they provide results and assurance for other groups, understandingother’s quality views and communication styles, and explaining their ownquality view and preferred communication style in a way that is under-standable to the rest of the team. People with other communication stylesand preferences, within and outside the builders group, should also haveconsideration for the builders’ preferences as individuals. This will help toensure that that the good communication that is essential for the builders’success is maintained.
References
[1] IT Infrastructure Library, Best Practice for Application Management, London,England: Office of Government Commerce, 2002.
5.6 Summary of the group 97
Table 5.7 Information That Builders Need from Others
Customers Business constraints
Business risks
Business requirements
Evaluation of quality of system when it is in use
Managers Financial, time, and resource constraints
Progress toward goal
Changes to goals and constraints
Other builders Progress with products (different builders will be responsible for different products:specifications, designs, code, training material, and so on)
Changes to products
Supporters Technical constraints for live system
Acceptance criteria
Evaluation of quality of system when it is in use
Measurers Acceptance criteria passed
Defects and nonconformances identified
Table 5.6 Information That Builders Have That Others Need
Before the SDLC startsand updated throughoutthe SDLC
Technical constraints
Technical innovations
Technical risks
During the SDLC Results of QC done by the builders themselves
Technical risks and areas on which to focus QA and QC work
List of known problems when products are delivered to QC or go live
Progress, problems, changes to risks, changes to constraints
At delivery List of known problems
List of incomplete products
Delivery and installation requirements
Postdelivery Evaluation comments
Improvement ideas

[2] Holcombe, M., and M. Gheorgha, “Enterprise Skills in the Curriculum,” Ingenia,Vol. 15, February/March 2003, pp. 56–61.
[3] Beck, K., Extreme Programming Explained, Reading, MA: Addison-Wesley, 2001.
[4] European Foundation for Quality Management, “EFQM Excellence Model,”http:// www.efqm.org, August 2003.
[5] Software Engineering Institute, “Capability Maturity Model,” http://www.sei.cmu.edu, July 2003.
[6] Humphrey, W., Introduction to the Team Software Process, Reading, MA: SEI, 2000.
[7] Humphrey, W., Introduction to the Personal Software Process, Reading, MA: SEI,1997.
[8] IEEE standards; see Web site http://standards.ieee.org/.
[9] British Standards Institute, PD0026:2003, Software and Systems QualityFramework—A Guide to the Use of ISO/IEC and Other Standards for UnderstandingQuality in Software and Systems, London, England: British Standards Institute, May2003.
[10] The University of Chicago Press, The Chicago Manual of Style, 15th ed., Chicago, IL:The University of Chicago Press, 2003.
[11] Reid, S. C, “Software Testing Standards—Do They Know What They Are TalkingAbout?” http://www.testingstandards.co.uk/publications.htm, August 2003.
[12] Warden, R., and I. Nicholson, The MIP Report, Volume 2: 1996 Motivational Survey ofIT Staff, 2nd ed., Bredon, England: Software Futures Ltd., 1996.
[13] Cabinet Office, Successful IT: Modernising Government in Action, London, England:HMSO, 2000.
[14] Smith, P., “Alien Resurrection,” http://www.chartist.org.uk/articles/econsoc/jul03smith.htm, October 2003.
[15] British Computer Society Qualifications, http://www1.bcs.org.uk/link.asp?sectionID=574, September 2003.
[16] Kroeger, O., J. M. Thuesen, and H. Rutledge, Type Talk at Work: How the 16Personality Types Determine Your Success on the Job, New York: Bantam DoubledayDell, 2002.
[17] Team Technology Web site, “Working Out Your Myers Briggs Type,” http://www.teamtechnology.co.uk/tt/t-articl/mb-simpl.htm, October 2003.
[18] Team Technology Web site, “The Mother of Strategic Systems Issues:Personality,” http://www.teamtechnology.co.uk/tt/t-articl/news1.htm, October2003.
Selected bibliography
Adair, J., Effective Teambuilding, London, England: Pan Books, 2003.
Adair, J., Effective Time Management, London, England: Pan Books, 2003.
Brooks, F. P., The Mythical Man Month, Reading, MA: Addison-Wesley, 1995.
Caputo, K., CMM Implementation Guide: Choreographing Software ProcessImprovement, Reading, MA: Addison-Wesley, 1998.
98 Roles and Quality: Builders

Clarkson, M., Developing IT Staff, London, England: Springer Practitioner Series,2001.
Crosby, P. B., Quality Is Free, New York: McGraw-Hill, 1979.
Detiénne, F., Software Design—Cognitive Aspects, New York: Springer-Verlag,2001.
Fowler, M., and K. Scott, UML Distilled, Reading, MA: Addison-Wesley, 1997.
Gershuny, J., After Industrial Society, New York: Macmillan Press, 1978.
Kruchten, P., The Rational Unified Process, Reading, MA: Addison-Wesley, 1999.
Nance, R. E., and J. D. Arthur, Managing Software Quality, New York: Springer-Verlag, 2002.
Parker, S. R., et al., The Sociology of Industry, London, England: George, Allen andUnwin, 1978.
Schein, E., Organizational Culture and Leadership, San Francisco, CA: Jossey-Bass,1997.
Smith, J., How to Be a Better Time Manager, London, England: Kogan Page, 1997.
5.6 Summary of the group 99

.

Roles and Quality: Measurers
In this chapter I shall:
◗ Introduce the members of the measurers group, their roles,and activities;
◗ Introduce their quality viewpoint;
◗ Provide a framework for the measurers’ activities within theEFQM Excellence Model;
◗ Identify information flows between the measurers and theother groups.
I’m going to buy a magic wand, and then when the development
manager says to me, “We’ve finished the build, now can you do
the quality stuff,” I can just wave the wand and make it happen.
—Quality assurance manager complaining about the
way quality activities are regarded in projects
6.1 Introducing the measurers6.1.1 Why do we need QA and QC?
Software projects generally include some activities such as test-ing, to check the software before it is released for live use, andauditing, to check that appropriate processes are followed dur-ing the project. We need to do this because humans make mis-takes. This includes making poor decisions and building thingswith faults in them. Once we have made a mistake, it is oftendifficult for us to find it, so we ask someone else to check whatwe have done. A software project is generally quite complex,with many decisions to be made and many products leading tothe final delivered software. This means that there are lotsof opportunities for people to get things wrong. They may
101
6Contents
6.1 Introducing the measurers
6.2 Who could be in this6.2 group?
6.3 Quality viewpoint
6.4 Quality framework usingthe EFQM Excellence Model
6.5 Communication betweenthe measurers and othergroups
6.6 Summary of the group
C H A P T E R

misunderstand each other, or make wrong assumptions, or simply slip up inwhat they are doing.
During the software-development life cycle (SDLC), testing and otherquality activities are used to identify and prevent mistakes. So why was ourquality assurance manager frustrated? The problem was that the develop-ment manager believed that the QA and QC activities introduced quality intothe products and, therefore, that the QA manager was responsible for thequality. As we saw in Chapter 1, quality assurance activities (QA) are usedfor checking processes, and quality control (QC) for checking products. Theoutput from QA and QC activities is a set of measures of quality. In fact, QAand QC activities do not change the quality of anything; all they do is to pro-vide information about the quality of the processes and of deliverables fromthose processes, in order that the processes and products can be changed.
6.1.2 Just measurers or also improvers of quality?
Someone recently commented to me that “The test group does improve thequality by finding faults (early) in the requirements and later in the designand code. I do not think we spend up to half of the development budget justto measure quality,” so let us consider that point.
I would say that the test group has contributed to the quality of the deliv-ered product by identifying faults, and the earlier they find the faults, thegreater the value of their contribution, because of the money and timesaved. But the testers have not changed the quality of the deliverable; thedeliverable does not change when the tests are run or the results analyzed.
The tests have provided information about the quality, that is, the identi-fication of a number of faults and the areas of the product that meet theiracceptance criteria. If the products are changed or if a suitable workaroundto the defect can be provided, the tests have contributed to reducing failuresduring use.
This is true also for other forms of QC, for example, document review.The process of the review itself gathers information about the quality of theproduct under review, but does not in itself change it. However, the docu-ment reviewers contribute to the quality of the document by suggestingimprovements and by identifying defects.
As a result of the testers’ or reviewers’ measurements, the team as awhole (customers, managers, builders, supporters and measurers) can makea decision about how to deal with the faults; they may be removed, orworked around, or ignored. That decision will be driven by the user-basedquality view (is it fit for purpose?), the value-based quality view (will thecost of fixing it be less than the cost of leaving it?), and the transcendentquality view (do we like it?), as well as the manufacturing-based qualityview (are there defects in the product?), and product-based quality view(does the product have the agreed attributes?).
We spend a large part of the budget on testing and other QC activities tounderstand all these quality views; we need information about the numberof defects in the product to give us a view of its manufacturing- and
102 Roles and Quality: Measurers

product-based quality, so that we can form what will be a decision based onall the quality views.
Similarly, those measurers involved in looking at processes, for example,auditors, carry out QA tasks that provide information about processes, and adecision is then made about whether to enforce or change those processes.QA activities measure both the appropriateness of the chosen process andhow well the process is adhered to. An audit or process review does not, initself, change the processes; it simply comments on them. Auditors will alsomeasure how closely a process adheres to standards and to legislative orregulatory demands. We hope that by choosing processes wisely and adher-ing to them, we will prevent people from making mistakes, and, hence, pre-vent them from breaking mandatory requirements or building defects intoproducts.
Preventing defects in the products reduces the places where failure canoccur when a product is used, and the process improvement aspect of QA isan important one. However, the people in this group, while in this group, canonly observe, measure and recommend improvements in the process. It isthe people who actually carry out the work who implement the processimprovements, thus preventing defects.
This is why, instead of calling this group the testers, or the QA group, orthe QC group, I have chosen to describe them as the measurers. This is toemphasize that their contribution is to provide information for all the groupsby measuring the quality of the software, other products, the processes. Themeasurers support decision making and quality improvement.
These measures may be negative; for example, the number of defects ina product, or the number of times a process was not followed correctly.Additionally, we might want positive measures; for example, the number ofrequirements successfully delivered or the number of acceptance criteriapassed. In Sections 6.1.3 and 6.1.4, I will enlarge on two aspects of QA andQC that do seem to directly affect improvement.
6.1.3 Defect prevention
QC activities need to be carefully timed. We will see in Chapters 9 to 12 howQA and QC activities are used appropriately at each stage in the life of a soft-ware system. Before we even start the software-development life cycle(SDLC) we need to decide whether we need an SDLC at all. Our biggest mis-take can be to do the wrong project or to build something we just did notneed.
We will see in Chapter 9 all the activities we need to do before we start anSDLC and that measurers, whether QA or QC specialists, are vital to this partof the process. Carrying out QA and QC on the processes and deliverables atthis stage, for example, on the contract for the project, helps us start the rightSDLC, which prevents us from making mistakes later on. The earlier QA andQC are carried out, the earlier defects are removed. These early defects tendto propagate through later deliverables; in other words, a mistake in the out-line of the project aims and objectives, or an omission in the delivery list on
6.1 Introducing the measurers 103

the outline plan could lead to many mistakes in the project itself (Figure 6.1).In this figure, I illustrate two paths to problems; in path one, we simply dothe wrong project; this one massive mistake leads to all the project activi-ties and products being defective—a costly misunderstanding. In path two,although we are working on the right project, we make some mistakes indefining the requirements, which escalate through the SDLC.
For example, we need a periodic report from the system—(the periodmay vary)—but it is documented as monthly because that is given as anexample during a meeting. This affects a number of design choices. Thereport is designed to deliver the previous month’s data at the month end.The system archive and clear-down is designed to match the reporting cycle,
104 Roles and Quality: Measurers
Defects propagation and removal
Start-up
Softwaredevelopmentlife cycle
Design
Test
Build
Route 2: mistakesmade at eachstage in project
Mistakes in onedesign lead tofaults in severalproducts duringbuild
Product accepted for delivery but complaints.Costs: meeting and discussion time, customermotivation, IT team motivation, rework costs,supplier reputation, deinstallation of systemafter use
Product delivered but never used.Costs: new acquisition project requiredsupplier reputation lost, customer timewasted, reduced morale of IT and customerstaff, loss of business, missed opportunities
Route 1: problemundefined - wrongproject started
Postdelivery
Delivery
Requirements
Figure 6.1 Defects propagation and removal.
so that the previous month's data is archived following the report; only 31table lines are allowed on the current-month data collection fields. Thedesigns affect nine programs, so each of them is wrong. Early tests are basedon the requirements and design specifications, so they report no problems,but the user-acceptance test raises defects in all the programs. The IT teamdo not agree that they are defects, because the software meets specification.The software is accepted for delivery after much argument, but there arecomplaints after the first month that the reports can only be done at monthend, and that data is autoarchived following the report so it cannot be usedagain. This is fixed, but when one user tries to report after three months,which is their preferred cycle, the data table cannot hold all the data becauseit is only 31 lines long. The resulting costs include meeting and discussiontime, customer motivation, IT team motivation, rework costs, supplier repu-tation, maintenance to the system, and a recurrence of problems once the“fix” is in place.
Errors made in defining the requirements for the software solution canbe found early on in the SDLC, by checking the requirements for defects andomissions immediately after the requirements have been gathered. Remov-ing defects in the requirements prevents them from being propagated intolater activities and deliverables such as design and build. We will see inChapter 10 how different SDLC models encourage QA and QC to be carriedout at different times, with a greater or lesser emphasis on defect preventionand defect removal.
6.1.4 The Hawthorne effect
One problem with understanding whether our quality measurements causeimprovement or not is the Hawthorne effect. Named after the Hawthorneworks of the Western Electric Company in Chicago, where the phenome-non was first observed, it indicates that people change behavior if theyknow they are being observed, or if they know that a process change is sup-posed to improve something. One definition of the Hawthorne effect is:
An experimental effect in the direction expected but not for the reason
expected; that is, a significant positive effect that turns out to have no causal
basis in the theoretical motivation for the intervention, but is apparently
due to the effect on the participants of knowing themselves to be studied in
connection with the outcomes measured. [1]
This means that the very act of carrying out QA or QC may change thequality of the product or adherence to the process because people knowthey are being observed. This change can be positive or negative, in myexperience, depending on the maturity of the organization and individu-als. Some people will take a view that “someone else is going to checkthis…” and let their standards slip, whereas others’ pride in their workmeans that they give it extra checks themselves before submitting it to QCor QA.
6.1 Introducing the measurers 105

6.2 Who could be in this group?Measurers include specialists who spend all their time in this group, andmembers of the other groups who take on a measurement role for a particu-lar project, or carry out measurement tasks from time to time. Specialists inthe measurers group include:
◗ People who audit or check the conformance to and suitability ofprocesses; their measures are made against process standards—qualityassurance specialists (see quality practitioners in Chapter 2, Table 2.1).
◗ People who measure the quality of the products, including software,using processes and activities to check for completeness, correctness,suitability, and adherence to specification—quality control specialists(see testers in Chapter 2, Table 2.1).
Although many organizations have specialists or teams focused on QAand QC activities, for example, audit and compliance teams, it is unusual forthe measurement of quality to be left entirely to specialists. One commonreason for this is that there are not enough specialists in the organization tocarry out the work. We will also see in this chapter, and in Chapters 8 to 12,which describe the life span of software, that different types of checks areneeded at different times. This means that, as required, the customers, man-agers, builders and supporters may all carry out measurement activities.These might include part-time or temporary membership in the qualityassurance (QA) teams and quality control (QC) teams:
◗ The QA teams carry out activities that check that teams have selectedsuitable processes and are adhering to them. QA activities mightinclude process review and quality or process audit.
◗ The QC activities include software testing, software inspection, andproduct review, and there may be, for example, test teams and inspec-tion teams.
We all check our own work, and so we all measure quality; but specialistmeasurers hold a particular viewpoint of quality. Let us examine that next.
6.3 Quality viewpointBoth QA and QC tend to focus on discovering defects against specificationsor standards. This means that specialists for these activities favor the manu-facturing view of quality. As we discussed in Chapter 1, manufacturing-based quality focuses on the manufacture of software products, that is, theirspecification, design, and construction. For specialist QA and QC people,therefore, quality depends on the extent to which requirements have beenimplemented in conformance with the original requirements.
When measurement focuses on faults and failures in products, success ismeasured by our ability to follow a process and deliver products against
106 Roles and Quality: Measurers

agreed-on specifications, so the report that “the software was built to specifi-cation and there are a low number of defects” might lead to a recommenda-tion to release the system for live use, even if it does not do what thecustomer needs.
We can see this reflected in QA standards such as ISO 9000:1994 [2],and in QC standards, for example, BS 7925-1 [3] and BS 7925-2 [4]:
◗ An audit against ISO 9000:1994 will look for a documented processand evidence that the documented process is followed. It is concernedthat a contract has been agreed on and met, but not whether that con-tract describes a suitable product for the customer.
◗ In BS 7925-1, testing is defined as the “process of exercising softwareto verify that it satisfies specified requirements and to detect errors.”Using this definition, we will verify (“is the system correct to specifica-tion?”), but if we do not take account of the user-based definition ofquality (see Chapter 3, Customers), we may forget to validate (“is thisthe right specification?”).
As well as a manufacturing view, many measurers hold a product-basedview of quality. Here, quality is based on a well-defined set of software qual-ity attributes that must be measured in an objective and quantitative way.This quality viewpoint is particularly appealing to measurers because it pro-vides a way of changing concepts which are often ill-defined and amorphousinto neat, measurable acceptance criteria. We can use acceptance criteria toobjectively assess the quality of the delivered product. Rather than reportingin vague, unquantified terms that “the software appears to be reliable,” wecan measure and report clearly, “The software is 98% reliable when runningcontinuously over a 7-day period. Recovery time is less than 1 minute ateach failure.” We can use standards such as ISO 9126 [5] to help us defineattributes measurably. These include reliability, usability, security, and func-tionality attributes. We will see how to do this in Chapter 9.
Most people, and that includes measurers, hold a transcendent view ofquality. As we saw in Chapter 1, this means that we “know quality when wesee it”; our knowledge is based on our experiences, taste, affections, loyal-ties, and emotions. Unfortunately, this means different people will have dif-ferent reactions to a product, so it is hard to agree on what is “right.” Thetranscendent definition for a particular person will be based on that indi-vidual’s “taken-for-granted” assumptions. For many specialist measurers,their transcendent quality viewpoint is strongly attached to a taken forgranted assumption that quality is related only to specification, numberof defects, and product attributes. For these people, unless products andservices can be measured against an agreed-on standard and meet or exceedthat standard, they are inherently lacking in quality. For other specialistmeasurers, their taken-for-granted assumption is that a pursuit of defects(identification, removal, or prevention) and of product attributes (numberand level of implementations) almost regardless of cost or time, must be agood thing.
6.3 Quality viewpoint 107

A clichéd observation of specialist measurers (and I am one myself) isthat common characteristics of people in the group are pedantry, obsessiveattention to detail, a strongly developed ability to complain, and a delight inother people’s mistakes. As a group, we can be difficult for others to dealwith and perceived as unhelpful and focused on our own concerns (seeChapter 2).
So the measurers favor manufacturing and product views of quality andwithin those tend to focus on defects and non conformance. At its mostextreme, the quality specialists’ manufacturing-based quality view can berigid and not focused on the overall needs of the customers and the organi-zation. To improve their relationship with the other groups, they must con-sider the groups’ quality viewpoints. As we saw in Chapters 1 and 2, twoother definitions of quality reflect the views of the people using the softwareand those who pay for it. These perspectives are about supporting the needsof the organization and its stakeholders, within the organization’s con-straints; therefore, what constitutes “quality” may change over time.
◗ The user-based definition says that quality is fitness for use. It is theuser-based definition that encourages us to validate as well as to verifythe system. The measurers need to find out, “Can people do theirwork efficiently and effectively using this software?” This viewpoint isimportant to the customers and to the supporters, the two groupsmost affected by the software postdelivery (see Chapter 12).
◗ The value-based definition is focused on things that impact on therunning of the business as a whole. Software quality should alwaysbe determined by means of a decision process based on trade-offsbetween time, effort, and cost aspects. The measurers need to findout, “If we release the software now, how much extra will we spendon support in the first month? If we are a month late, what will it costthe organization in fines and lost business? Should we release or domore testing?” Value for money is important for managers and any-one responsible for budgets. The ROI for the software needs to be pre-dicted before delivery and measured postdelivery (see Chapter 12) inorder that the organization as a whole can evaluate whether the proj-ect was worthwhile.
Along with acknowledging the user-based and value-based views ofquality, the measurers must acknowledge that the transcendent view ofquality depends on the individual. The measurers must take into accountthe fact that other people’s taken-for-granted viewpoints may well be differ-ent from their own view. One important point here is to examine the differ-ent slant that builders and measurers may put on the manufacturing- andproduct-based quality viewpoints. As we saw in Chapter 5, builders, par-ticularly those working in software development rather than other areas ofproduct build, focus on technical excellence as a means for enhancing theirwork. They tend to be interested in the process aspects of manufactur-ing and in the enhancement of product attributes. They are also on the
108 Roles and Quality: Measurers

receiving end of criticism from the measurers about their processes and theirproducts, which can cause communication problems (Chapter 2).
Let us look at some examples, looking at one subgroup within the meas-urers, specialist system testers. These people test software systems, often aspart of an independent group within the project but separate from thebuilders. Here are three real remarks I have heard system testers make:
◗ Sam Tester: “We will not test without a written specification.”
◗ Jo Senior-Tester: “If we’re not aiming for zero defects how many do wewant?”
◗ Jim Test-Expert: “We cannot sacrifice quality to cost.”
These views are all correct, yet simultaneously wrong. Let us examinethem one at a time.
“We will not test without a written specification.” Sam Tester needs thespecification in order to draw up tests and expected results for those tests.Without a written specification, it is difficult not just for the testers to pro-ceed, but also for all the groups to remember what has been agreed on.However, simply to refuse to continue until a written specification is pro-vided is unhelpful to the other groups if they had not expected to provide awritten specification. The pragmatic approach for this occasion might be forthe tester to agree to research the expected results by interviewing the cus-tomers. The tester then, as part of the measurement process, measures thecost of late development of the specification, in terms of additional workdone and the number of defects in the build that could have been preventedhad there been a written specification. This can be used to persuade all thegroups to agree on improvements in process for the next project. Forimprovements to be accepted, the tester must provide the informationshowing how the other groups’ quality viewpoints are met. This means thatmeasurements must be changed into information that addresses those view-points, to make it easy for others to buy into the suggestion for change. Forexample, does the software do what the customers and supporters require,or does it stray from a “fit-for-purpose” model? Is it missing things that areneeded? From the managers’ viewpoint, what was the cost of exceeding “fitfor purpose” by adding unnecessary things, and what was the cost andimpact of defects found late that could have been identified in a writtenspecification? When talking to the builders, focus on their transcendentview of quality as technical excellence (see Chapter 5), and the aspects ofthe manufacturing and product-based viewpoints that would be enhancedby a written specification. Would a clearer definition of what is requiredallow them to concentrate on building technically excellent solutions thatwill be more easily accepted, thus reducing boring rework? In Chapter 9, wewill look at what we can do before we start to build software, to provide aclearer definition of what is required. In Chapter 12 we will look at evalua-tion of delivered systems.
“If we’re not aiming for zero defects how many do we want?” Jo Senior-Tester is concerned that if the testing has not uncovered all the defects in the
6.3 Quality viewpoint 109

products, and that these defects have been corrected, the delivery will be ofan unacceptable quality. Also, testers know in their hearts (transcendent qual-ity) that they want to deliver a product that is perfect. Their argument is, “Ifwe are not looking for perfection, how flawed is OK? With products andservices outside software, we don’t expect defects, do we?” In fact, customersand supporters are not bothered by defects as such. What they want to avoidis failures. By this I mean that the product not behaving as they expect itshould. They will also differentiate between high and low impact failures.They need the products to be fit for purpose rather than perfect, and the soft-ware defects may not lead to high impact failures. The tester needs to workwith the customer and supporter to define acceptance criteria that encapsu-late a “fit-for-purpose” view. We will see how to do this in Chapter 9.
“We cannot sacrifice quality to cost,” explained Jim Test-Expert. Thiscomment is a continuation from the last one. The tester is concerned that theother groups are only interested in the cost, at present, but that later therewill be a backlash, possibly directed at the tester, if the delivered products aredisappointing. From a manager’s viewpoint, cost and quality are inextricablylinked in the value-based view of quality. For the customers and supporters,too, the budget they are prepared to spend must be balanced against theirwish list. Builders, conversely, can be fixated on delivering additional attrib-utes and see that as adding value and quality. Testing these additional attrib-utes may be a problem for the tester if it adds unplanned scope and cost. Ifcost is the limiting factor in this project, the tester needs to explain what test-ing is possible within the budget, what testing cannot be done, and the risksassociated with not doing that testing. In some projects, the goal is to deliverthe minimum that will allow the customers to proceed—quality in that caseis closely tied to fit for purpose and value for money. In other projects, thegoal may be reducing risk in a safety-critical situation—quality in that casemay be tied to product attributes such as reliability and to manufactur-ing goals such as defect prevention and removal. If, as testers, we believequality will be impacted, we need to examine “what aspect of quality isnow adversely affected and could be improved by increased spending?” Indoing this, we need to not just focus on process, defects, and attributes(manufacturing and product views) but also to provide value, user, and tran-scendent examples of quality loss (see Table 6.1). The precise questions touse depend on the relationships between the groups, so these are just exam-ples. Using questions allows each group to arrive at its own conclusion, basedon its own quality view. As above, defining “fit-for-purpose” acceptance cri-teria will help prevent this problem, and in Chapter 9 we will also see how toarrive at a common understanding of risks and constraints across the groups.
When considering the quality costs and the impact of QA and QCactivities on the project, it is important to remember that quality activitiescan in themselves damage quality. This idea surprises and offends some qualitypractitioners but it must be faced. Traditional quality economics supportsthe testers I described above because it assumes that all quality activities areinherently a “good thing.” Yes, there is a trade-off between the cost ofthe quality activities and the cost of the failures that they may prevent;
110 Roles and Quality: Measurers

however, the possibility that quality activities can detract from a project isnot considered. This view is now being challenged [6] and the distinction issometimes made between quality costs (activities that contribute to the fit-ness for purpose) and quality losses (activities that cost money but make nocontribution to the fitness for purpose of the product). Adopting this mind-set goes some way to wedding the value-based quality definition to thosequality viewpoints normally held by measurers. In one organization, a teamof measurers were introduced to the concept of “quality loss,” and on exam-ining their activities found several examples of value-destroying qualityactivity. All of the following are failures in efficiency and effectiveness thatcolleagues and I have seen in more than one organization:
◗ Inspections and other document reviews for which participants havenot prepared. These take time but have a low defect-detection rate.Just “having the inspection” in order to get the sign-off against thequality policy does not improve the quality of the product.
6.3 Quality viewpoint 111
Table 6.1 Tester Considering Other Viewpoints for Quality Impacts
Group andQuality View
Possible Routes intoa Discussion withThis Group Example Questions
CustomerUser-basedquality view
Find out theimpact on fit forpurpose if thingsgo wrong
What is the impact on your work if this goes wrong?
If this feature is not available, can you work without it?
How much extra time would that take?
Where would you like testing to concentrate?
From what you have said, it looks like if we find problems theywill have X impact. Do you agree?
SupporterUser andproduct-basedqualityview
Find out theimpact on fit forpurpose andimportantattributes if thingsgo wrong.
What is the impact on your work if this goes wrong?
If this attribute is not available, can you work without it?
How much extra time would that take?
Where would you like testing to concentrate?
What is the minimum level of (reliability/security/…) that isacceptable?
What is the postdelivery support budget?
From what you have said, it looks like if we find problems theywill have Y impact. Do you agree?
BuilderProduct- andmanufacturing-based quality view
Find out thelikelihood ofdifferent areasgoing wrong
Which attributes and areas would you like testing to concentrateon?
Which areas were hardest/easiest to build?
From what you have said, it looks like I might find it useful tolook at areas A, B, and C. Do you agree?
The software has just done this. Is that what you would expect?
How difficult would it be to make changes in this area?
ManagerValue-based qualityview
Identify the cost ofthings goingwrong and thecost ofrepair/support.
What budget do we have for support after going live?
The impact of not testing these areas is X additional time (hencecost) for the customers and Y additional time (hence cost) for thesupporters. The likelihood of them going wrong is Z, so the risk ofthem going wrong (likelihood times impact) is [Z * (proportion ofX + proportion of Y)].

◗ Project audits carried out by staff who are not politically empowered.These require significant time investments from project teams as well asthe auditors, and consistently fail to escalate significant noncon-formances from standards. They may even make the situation worsebecause the political status of the auditors may be used as a reason toprevent measurements being taken.
◗ User-acceptance testing directly replicating the tests carried out in sys-tem testing (at cost), while not identifying additional defects, instead ofcarrying outtests at different levels, each having their own purpose andfocus.
◗ Practitioners may be trained in quality methods that they consider tobe only theoretically valid, and thus they may not implement themon their projects. In one organization, I found that the senior manage-ment had sent teams on a test techniques training course as a “treat.”The view was that if they had some (any) training, this would keepthem quiet for a while and improve their motivation, but there wasno intention to allow any changes in working practice as a result ofthe training. As a result, the teams were more demotivated followingtheir return to their desks because they were not allowed to apply thetechniques they had learned. Additionally, a large proportion of theyear’s training budget had been used.
Carrying out this type of exercise helps eliminate costly but ineffectiveactivities and it helps the measurers evaluate their own activities throughthe value-based quality definition.
It is important to note that, because this group is so widely supple-mented by recruits from all the other groups, many individuals hold widerquality views. The important thing for each individual is to consider whichquality view they are favoring, and then consider the other views:
◗ Some people in this group work mainly in user-acceptance testing andwill support the user-based view of quality. They may be closer to thecustomer view and need to take extra time to consider value-, prod-uct-, and manufacturing-based views.
◗ An increasing number of measurers are test automation specialists; theycan be closer to builders in outlook. They need to make sure that theydo not forget the user- and value-based views.
◗ Quality managers and test managers may take on aspects of the manager’sgroup, and be more focused on ROI and value for money, so theyshould make an additional effort to remember the user-, manufactur-ing-, and product-based views.
◗ The work of audit and compliance groups might take on aspects of the cus-tomers and/or managers groups and consider fit for purpose and ROI aswell as compliance to standards and regulations, broadening their viewfrom manufacturing defects to user and value views.
112 Roles and Quality: Measurers

◗ If the testers look after the customer help desk as well as testing prod-ucts, which does happen in some package suppliers, they becomemore focused on supporter activities during installation and postdeliv-ery, and will be trying to consider user- and product-based quality aswell as manufacturing-based quality.
6.4 Quality framework using the EFQM ExcellenceModel
6.4.1 The EFQM Excellence Model and the measurers
The measurers are, almost by definition, very interested in frameworks thatinclude defined processes, standards, and specifications for work, includ-ing their own. Their measurements take place against that frameworkof processes, standards, and specifications. Quality assurance standards,including the ISO 9000 series, can be used to define the QA and QCprocesses as well as the organization’s overall processes. There are also spe-cific professional bodies, standards, frameworks, and best-practice guidesfor all aspects of QA and QC work. Some sources for these are listed inAppendix A, but you should remember that there are others, specificallycountry-based and industry-sector-based ones. I have chosen these exam-ples for useful onward links as well as useful information. I would particu-larly recommend Stuart Reid’s paper comparing test standards [7] and aBSI paper putting a number of software standards into a Software and Sys-tem Quality Framework (SSQF) [8]. The BSI paper sets the software andsystems standards within an organizational model taken from the ISO9000:2000 [9] family of standards that we looked at in Chapter 1, but itcompares this to the EFQM Excellence Model [10] and other quality frame-works, some of which are industry specific. It shows how a framework ofstandards can be used for the development and delivery of software, andplaces these within both a technical framework and an enterprise frame-work. It also sets out a measurement framework, including the QA and QCactivities. For QA specialists, whether carrying out process reviews, audit-ing or making process improvement suggestions, this paper is a useful start-ing point. Reid’s paper concentrates on standards that particularly relate toQC and, within that, software testing. This paper is good reading both forQC practitioners, whether testers or reviewers, and for QA specialists whoare auditing or reviewing the test process.
When designing the quality framework for a particular set of measurers,it is essential to consider the quality framework for the customer (Chapter3). The customer’s goals inform their quality framework, and, in turn, thisshould inform the measurers’ quality framework, and also the teams’ andindividuals’ personal objectives and targets.
In Chapter 1, we looked at the EFQM Excellence Model [10] and how itis divided into nine parts: five enabling criteria and four criteria for measur-ing results. In Section 6.4.2 we will look at how the EFQM Excellence
6.4 Quality framework using the EFQM Excellence Model 113

Model enablers could be interpreted for measurers, and in Section 6.4.3 wewill look at measurers’ results. Remember that this model is based on thefundamental concepts of excellence we discussed in Chapter 1, and thatequivalent models such as the Baldrige model are available.
6.4.2 EFQM Excellence Model enablers for the measurers
6.4.2.1 Leadership
In order that the measurers are supported in their role, the organization willrequire leadership. As we saw in Chapter 1, project managers provide lead-ership to their projects, drawing on the lead they are given by the organiza-tion’s board and management. Measurers particularly require leadershipsupport for their activities, for two related reasons:
◗ Because the measurers do not build products, their activities may notbe seen as “adding” anything.
◗ Because the measurers are often messengers bringing bad news, theircontribution is seen as negative.
This leads to comments like the one I heard from a programmer once: “Idon’t like testers; all they do is break things!”; and from a senior managertalking about a colleague he hoped would leave (!), “He doesn’t contributeanything useful—let’s put him in the quality group until he retires.” Leadersin the organization and in the project must support the measurers’ activities:
◗ By making the measurers’ process and product measures clear to allparties;
◗ By helping all the groups to agree on a shared quality viewpoint.
6.4.2.2 Policy and Strategy
Policy and Strategy in an organization set down what is expected. For themeasurers, an organization would need to have policies that lay down thebasic rules for approaching these activities:
◗ A QA policy, including audit and process review;
◗ A QC policy, including test, inspection, and product review.
Strategies and high-level plans would be needed for the organizationand, perhaps in more detail for particular programs of work or projects, forboth QA and QC activities. The strategies and overall plans might include:
◗ An audit plan for the organization, including the approach, responsi-bilities, and a schedule of dates for audits;
◗ A strategy for testing for the organization or for a program, describingthe risks to be addressed by testing, the approach, the test stagesrequired in each project, and the completion criteria for the testing;
114 Roles and Quality: Measurers

◗ A review plan for a particular project, listing the products to bereviewed, the type of reviews required for each product, the goal ofeach review, and the entry and exit criteria for the reviews.
I have not attempted to give the full list of strategies and plans, nor haveI suggested complete contents lists. The specialist measurers should havetheir framework in place, including tailored standards based on ISO andIEEE standards (see Appendixes A and B for sources). Members of othergroups should expect to support the use of those standards.
6.4.2.3 People
Specialist and nonspecialist measurers—skill and aptitude mix. The peoplewho carry out measurement activities need to be selected for interest andaptitude in the area, but will require training in the QA and QC activities.When we examine the measurers group, as well as the specialists, we seepeople entering and leaving the group, carrying out QA and QC measure-ment activities. This means members of all groups will need training andsupport in these areas (Table 6.2).
Aptitude and interest are very important, but if we list what we mightexpect from people in this group, we see that it is most unlikely that a singleindividual will have all the aptitudes and skills we require:
◗ IT skills, for example, analysis and design skills, data modeling,coding;
◗ Knowledge of software engineering processes;
◗ Knowledge of QA processes, for example, audit, review, problem root-cause analysis;
◗ Business/industry sector knowledge;
◗ Specific software package knowledge;
◗ Knowledge of QC processes, for example, test design, inspection,review;
6.4 Quality framework using the EFQM Excellence Model 115
Table 6.2 QA and QC Training Requirements Across the Group
Group QA/QC Activities That Require Support and Training
Measurers Audit process, QA review process, document reviews (e.g., inspection, peer review,walkthrough, test design techniques)
Builders Document reviews (e.g., inspection, peer review, walkthrough)
Tests [e.g., component-test design and execution (“programmer testing” or unit testing),integration test design and execution]
Customers Document reviews (e.g., inspection, peer review, walkthrough)
Tests (e.g., acceptance-test design and execution
Supporters Document reviews (e.g., inspection, peer review, walkthrough)
Tests (e.g., acceptance-test design and execution)
Managers Document reviews (e.g., inspection, peer review, walkthrough)
Management reviews (e.g., plan reviews, progress reviews, examination of test-management reports and metrics)

◗ Test tool experience;
◗ Project management, planning, scheduling;
◗ Enthusiasm;
◗ Attention to detail;
◗ Tact;
◗ Firmness;
◗ Ability to negotiate;
◗ Ability to generate ideas;
◗ Ability to work under stress.
And you can no doubt think of others!For this reason, it is best to build up teams of people with complemen-
tary skills. For example, Lloyd Roden, in his 1999 EuroSTAR presentation[11], identified four types of testers, with different styles of work (Table6.3). These styles are all needed in a successful tester, but one individual isvery unlikely to exhibit all these characteristics. So the QA and QC teams,including the test teams, need to have a mix of people.
Using the skill mix effectively. There are good reasons to organize the QAand the QC teams to use different personality traits effectively. This is bothto allow individuals to shine in roles that allow them to use their skills andpreferences, but also to match the team members’ communication styles totheir audience. In one organization I visited, the IT quality assurance groupdecided to have two groups of people in its QA review and audit team. Thefirst group consisted of people chosen because they were known to beknowledgeable and experienced, and who were well liked and had a naturaltendency to be helpful. This group carried out process reviews and auditswith the project managers, agreed on lists of project risks, and reported aset of recommended improvements to processes. They were characterizedas the “village bobbies” (old-fashioned local policemen, whose role wasto patrol, advise, and gently admonish). Their objective was to “supportprojects and implement standards,” and the consultants’ unthreateningapproach meant that projects invited them in. The second group were muchfiercer, and their role was to work on projects that had refused the firstgroup's help and were now failing or at risk. They were charged with
116 Roles and Quality: Measurers
Table 6.3 Roden’s Tester Type Matrix (Partial)
Pragmatist Pioneer
Efficiency
Results
Tasks
Change
Risks
Involving others
Analyst Facilitator
Accuracy
Proof
Standards
Networking
Consensus
Status quo
Source: [11].

enforcing processes and escalating problems on projects at risk of failure.The IT quality manager commented:
One of the key features of our quality approach is recognition that (a) proj-
ects are very heterogeneous, thus standards are only a template; (b) we need
to empower practitioners to optimize standards. The result is the recogni-
tion that an effective IT quality system is dynamic; this means that we recog-
nize both adherence and adaptive quality controls. In one audit, the
majority [of deviations from process] were deliberate, based upon consid-
ered assessment of the projects’ circumstances. Was the project wrong?
Absolutely not. When taking on QM, my second-highest issue was that proj-
ects are not tailoring development standards to meet their needs; rather these are
interpreted as an inflexible rulebook. This means that projects are not realizing the
risk mitigation predicted from adopting a methodology. Most of [the team’s] time
is spent selling the benefits of standards, then coaching the practitioners on
them (point of need, desk-based) … helping the teams to tailor the stan-
dards to their circumstances.
Team organization. One question I am often asked is, “How should the QAand QC teams be organized?” Unfortunately, this is one of those questionsthat does not have a single correct answer. Some possibilities are shown inTable 6.4. Generally speaking, the greater the risks associated with things
6.4 Quality framework using the EFQM Excellence Model 117
Table 6.4 QA and QC Team Independence
Review Team Comment
Specialists—external (e.g.,third-party testers,third-party inspectionteam, external auditors)
Effective at finding defects against defined process or specification, objective,independent, focused on their customer (may not be project team’s customer).Customers and managers will listen to external bodies.
May cause fear. May not know enough about the organization. May be seen asan obstacle. Problems may be disguised or hidden.
Independentspecialists—internal (e.g.,test team or auditreporting to qualitydirector rather thandevelopment director)
Effective at finding defects against defined process or specification, objective,independent, focused on their customer (may not be project team’s customer),understand the organization’s quality drivers, voice on the board.
May cause fear. May not know enough about the project. May not understandthe project’s quality drivers. May be seen as an obstacle. Problems may bedisguised or hidden. Quality may be seen as owned by the QA/QC team.
Specialists—advise peergroup teams how to carryout QA and QC. Carry outspot checks on the QA/QC.
Only a small group of specialists needed. Quality owned by the build teams.Knowledge transfer.
May be not so effective or efficient as specialists have to learn new techniques.Builders may take a less objective stance in their QA/QC activities.
Peer group (e.g.,walkthrough or test teamreporting to thedevelopment manager).One project audits anotherproject.
Effective at finding defects against defined process, also at making processimprovement suggestions. Understand the problems, “in same boat,” allies, willreview each other.
Less objective. Less independent. Can be difficult to report defects in peer’swork. Needs strong leadership and support from managers, and from anindependent QA/QC specialist group.
Buddy checks author’swork; team leader checksteam following processes.
Cheaper than a team, and quicker, but less likely to find defects. Not as effectiveor objective. Cheap. Team leaders should be “doing this anyway.”
Author checks own work Cheap for low-risk products but often not effective if there are any risks tocontain.

going wrong or mistakes being made, the more likely we are to use an inde-pendent QA or QC team.
Typically, we find that different levels of independence are requireddepending on circumstances:
◗ The higher the risk, the more independent and specialist QA and QCteams will be appropriate.
◗ At different stages in the project, different levels of independence maybe useful. For example, using specialist testers to help the developersdesign component tests should increase effectiveness. If the develop-ers run the tests this keeps an efficient test run/debug cycle at thisstage, which could be followed by independent specialists runningintegration and system tests.
Motivation and appreciation. When Warden and Nicholson carried outtheir motivational study [12] (see Chapter 2), one of their key findings washow very demotivated software quality practitioners were. It seemed to be,on examining their roles and their specific job design (the task mix and theopportunities for personal growth), that many of the interviewees had jobsthat swung between being excessively stressful and very boring. Key pointsraised by Warden and Nicholson from the survey results include:
◗ Testers reported that they used a low variety of skills and could beconfined to test execution rather than being able to spend time on testdesign and problem analysis.
◗ QA staff reported that they performed too many control tasks and notenough that create improvements.
◗ QA staff reported they did not get enough direction from management.
◗ Both QA staff and testers reported they did not get feedback from theirjobs; it was difficult to tell if their efforts had made a difference.
◗ Both QA staff and testers reported that they did not get positive feed-back from their colleagues, whether this was people from the customer,builder, manager, or supporter groups, and this was considered to bebecause they were the bringers of bad news.
◗ QA and QC staff had lower pay levels and less job security than otherIT practitioners.
This finding is borne out by the BCS Industry Structure Model [13],which describes a career progression for various IT roles. The developerroles have a career progression to a higher level than testing roles, yet I can-not think of any real reason why a test specialist, provided qualifications, apti-tude, and experience levels are equivalent to a development specialist, should notalso aspire to an IT director role. Notice, however that QA/audit roles areshown to have a higher progression toward management than QC/testingroles, perhaps because a QA/audit view looks at process rather than specificproducts, and is focused toward improvement rather than toward defect
118 Roles and Quality: Measurers

identification. I am increasingly hearing testers talk about defect prevention,indicating, perhaps, that there is a move toward QA and away from QC bysome individuals. Despite the career progression issues, most quality practi-tioners I meet, whether QA or QC specialists, are passionate about theirwork; they may feel unappreciated but they are filled with a belief about theimportance of what they do and what they want to achieve.
6.4.2.4 Partnerships and Resources
As we saw in Chapter 1, partnerships cover people outside our team, ourproject, or our organization with whom we need to exchange informationor cooperate in some way. Resources are the things like IT environments,information, and equipment that we need to carry out our work.
For measurers, there are partnerships with other measurement teams,both inside and outside the organization. For example, if I am working as atest manager, I find it useful to meet the audit and compliance teams to seeif they have particular areas of interest in the testing. Similarly, I wouldwant to find out what other test managers are doing. This might include dis-cussions with testers working for other organizations on the same project tosee where they are concentrating their testing and whether we are compet-ing for resources. I might also look at the output from inspections/reviewsand liaise with those teams in the same way. In each case, we are sharinginformation to ensure that our work complements the other groups’ workrather than repeating it.
Resources for measurers include IT resources such as tools and test envi-ronments. These are often scarce. I remember arriving on one project at thepoint at which we had intended to use a particular test environment. Hav-ing been assured by the organization’s IT and business management thatours was the most critical project and that nothing would stand in our way,we were surprised to find several other projects vying for the environment,all of whom had also been told their project was the most important. Iwould recommend liaison across the organization as well as within the proj-ect to make sure that there is no conflict.
6.4.2.5 Processes
Measurement framework. These are the processes specific to the measurers,not the processes and products they measure. These are the tasks, tools, andtechniques that improve software quality by improving the way qualitymeasures are collected and analyzed, and may be divided into two groups:
◗ QA audit processes, used to check adherence to processes;
◗ QC review and test processes, used to check products such as docu-ments and code for defects
In the BSI SSQF [8], a group of standards are noted under the measure-ment framework, including standards for the software measurement process,
6.4 Quality framework using the EFQM Excellence Model 119

audit, software product evaluation, software product metrics, problemresolution, process assessment, and process improvement. You will findstandards bodies listed in Appendix A. Standards are important—not onlybecause they should encapsulate best practice, but also because adherence tostandards should give our customers some degree of assurance about howwe have carried out work. However, they can be quite dry reading, and soyou may prefer to refer to a textbook at first. There are a number of goodbooks about QA and QC processes available; you will find a few of themlisted in the selected bibliography at the end of this chapter. I am not going toexplain the steps through the processes in this book, instead, I am going toconcentrate on how to carry out the processes in a way that enhances team-work and quality.
Measurement and improvement. One key point about these measurementprocesses is that they encapsulate the idea of improvement; not just ofthe processes and products being measured but also of the measurementprocesses themselves (Figure 6.2). Measurers must lead by acknowledgingtheir own mistakes and improving their own processes if their suggestionsfor improvement to other people’s products and processes are to be wellreceived.
120 Roles and Quality: Measurers
QA process QC process
Project process
Request feedback on QC processesIdentify to QC processesimprovements
Identify product defectsSuggest product improvementsSuggest process improvements
QA of QC processesQC of QA output
Quality measurementsFeedback
Improvements,suggestions,and feedback
Request feedback on QA processIdentify improvements to QA process
Identify process nonconformancesIdentify process problemsSuggest process improvements
Figure 6.2 Measurement processes include improvement.

6.4 Quality framework using the EFQM Excellence Model 121
Table 6.5 Rules of Thumb for QA and QC Activities
It is the product or the process we areassessing and measuring, not the people
Try not to make it personal; check whether you have anypersonal baggage you are taking into the activity—you arenot supposed to have favorites or be out for vengeance! Ifyou have strong personal feelings that you cannot overcome(such as love or hate), maybe some else should do it insteadof you.
Before the activity starts, it should beexplained to anyone who is “on thereceiving end” and not familiar with theactivity
Why, how, who, where, what?—“Hi, I just wanted tointroduce myself. Your manager may have said that I’mauditing this project to look at configuration managementprocesses. What I’ll need to do is visit you sometime thisweek to discuss what you do and to look at some examples.”
The goals, rules, and plan for the activityshould be clearly communicated to allthe parties
Why, how, who, where, what?—“As we agreed at the startof the project, I’m going to be auditing your area in the nextfew days, in order to check adherence to configurationmanagement standards. This is nothing to worry about; whatwe check is whether the process you use is suitable for yourproject. We will want to pick up your good ideas to sharethem with other teams, and we may be able to suggest someimprovement ideas to help you. I’ll need to interview somepeople and I’ll need to look at the directory contents.”
During the activity, collect and classifyinformation, openly
During the activity, the measurers collect information, andthis should carefully and clearly documented, differentiatingbetween fact, interpretation, and perception (see Chapter 4).Typically, I make handwritten notes, or you could use ahandheld tape recorder, and enter them into the logging toolor type them up immediately on concluding a session or eachevening, if it is a several-day activity.
Use the interviewee’s jargon, not our own An example when auditing test processes is that if you ask anontester, “Do you use the V-model?” they will probably sayno, but if you ask them, “Do you review requirements beforeyou start design?” they may well say yes. As people may notknow the names of standards and processes, ask themquestions about what they do, not what they call it. (If youwant to know about the V-model, see Chapter 10.)
Find some positive and some negativethings to say
There will always be at least one positive point you can makebut, at the same time, everyone appreciates someconstructive criticism.
After the activity, give feedback quickly After the activity, immediate feedback should be given to allthe authors and participants on the findings and they shouldhave a chance to comment and add facts, interpretations,and perceptions.
Get feedback from others Feedback is requested from the authors and participants onthe activity—how could it be improved and what wouldmake it more useful to the authors and participants? Facts,interpretations, and perceptions are logged about theactivity.
Make sure people know the findings This might be a detailed catalogue report, an overviewmanagement report, or simply access to a logging tool suchas is used for test findings, but if the points logged so far area “good enough” report, I might not write anything extra; Iwill make sure everyone who needs to know about thefinding does know.
Monitor the outcomes—what happenedas a result of the activity?
Monitor what actions were taken and why. This generallymeans follow-up conversations with all the interestedparties.
Always ask other people to QA/QCour QA and QC work
“If it’s sauce for the goose, then it’s sauce for gander,” as mygrandmother used to say. Showing that we also need helpwill encourage others to receive help.

Whether we are planning to carry out QA processes such as audit or QCprocesses such as document review and testing, we should remember somesimple general rules of thumb. Table 6.5 shows my rules of thumb. I do notalways keep to them (it depends on circumstance), but they are my mentalstart point and checklist. The specific QA or QC process might be, for exam-ple, a document review, executing some testing, or carrying out an audit, soin the table I have called it the activity for brevity and to distinguish it fromthe product or process being assessed.
There are times when these rules of thumb do not apply or apply differ-ently. As we saw above, we may need to follow up some gentle advisoryreviews with a harsher audit if risks are escalating and teams are notresponding to suggestions. We would also see a difference in emphasis indifferent types of QA and QC activities:
◗ In an external audit for compliance to a certification, the timing, rules,and goals for the audit would be set by the external body, and theconduct of the audit is very strict, with minimal feedback.
◗ In an internal audit or a QA process review, we might want to loosenthe rules and allow discussion and information exchange. I havefound this especially useful with peer reviews of processes—getting acouple of project managers or business analysts from different areas totalk to each other can be a great experience for both and a fine way toshare good practice. I remember that in one organization, the consen-sus during the audit training was that just doing an ISO 9000-styleaudit [2] was not helpful; what the teams wanted was to share ideasfor improvement, not just to look for compliance to an externalstandard.
The reporting process. One key process for all measurers is the reportingprocess. Measurers gather information about processes and products andneed to pass this to other people in a way that will be acceptable and under-standable. Good information design is vital; it is easy to hide your messageso that it is ignored or misinterpreted. However well you have designedyour audit or test process, however well you execute the process, if yourresults are ignored you may as well have not bothered doing it. Reports arethe managers’ deliverable to all the other groups, and the information thatthe measurers provide is vital for making these reports an accurate reflec-tion of the quality of services and deliverables. In Chapter 4, I look at someaspects of report design that managers and measurers should consider whensetting up reporting for QA and QC. When deciding what to report, do notcollect information for the sake of it. One mistake many people make isreporting either on what has always been reported without questioningwhy, or only reporting on information that is easy to collect. As measurers,we need to reflect other quality views in our reports as we saw in Table 6.1.Also, be prepared to report bad news as well as good news. In my experi-ence, people want to hear the bad news; what they don’t want is to get itwhen it is too late and without any ideas for improving the situation.
122 Roles and Quality: Measurers

6.4.3 EFQM Excellence Model results for the measurers
6.4.3.1 Customer Results
Customer Results are the measure of the effect we have on our customers.Who are the measurers’ customers? In fact, as well as the customers for thesoftware itself, all the groups are customers of the measurers: the managers,the builders, and the supporters. Measurers should look at what the EFQMExcellence Model [10] refers to as customer perception results and customerperformance indicators. Perception results are measured externally; we askthe other groups for their views. Performance indicators are measured inter-nally; what actually did other groups do? Both measures are needed so thatwe see the difference between “we think you are doing a great job” andactually being invited back for new projects. In one organization, the head of anew QA group said to me, “I’ll know we’ve succeeded when the managerscome to me to ask for audits.” Examples of the type of results that could bemeasured are shown in Table 6.6.
6.4.3.2 People Results
In this case, the People Results measure what the measurers think aboutthemselves. We saw in Section 6.4.2.3 that Warden and Nicholson foundtwo groups within the measurers to be demotivated. The use of a sophisti-cated and proven measurement technique such as the motivational surveyprocess used by Warden and Nicholson allows a much greater depth ofunderstanding of people’s motivation and of how to improve this. As withthe customer results, EFQM Excellence Model people results are dividedinto two groups: the perceptions and the performance indicators. Examplesof the type of results that could be measured are shown in Table 6.7.
6.4.3.3 Society Results
For the EFQM Excellence Model, society means society at large, andalthough we might want to measure this for the organization, we could alsointerpret it for a particular project as the wider organizational culture withinwhich the measurers work. Again, we consider perception and performance
6.4 Quality framework using the EFQM Excellence Model 123
Table 6.6 Customer Results—What the Other Groups Think of Measurers
Example of Possible Measures
Perceptions—external to thegroup—surveys, interviews,compliments, and complaints
Have the measurers got a good image?
Do other groups report that they find the measurers easy to deal with (forexample, are they helpful, flexible, honest, and proactive)?
Are the measurers seen as reliable, providing good value, providing a goodservice?
Performance indicators—measurement of outcomes
Do we get asked back in for new projects?
Are people proactive in coming to us for help?
Are our reports usually accepted?
Do other groups complain about our work?

indicators. Examples of the type of results that could be measured areshown in Table 6.8.
6.4.3.4 Key Performance Results
The EFQM Excellence Model divides key performance measures into twoareas: financial and nonfinancial measures. There was a big debate amongdelegates at the EuroSTAR Conference in 2002 about how to measurereturn on investment in testing, and it quickly became apparent that nonfi-nancial as well as financial costs and benefits needed to be measured. Exam-ples of the type of financial and nonfinancial results that could be measuredare shown in Table 6.9. I recently asked a manager in a large IT organizationin what ways his testers could improve their services to the organization. Hisresponse was that he wanted not just improved technical skills—“more bugsfound”—but also an improved understanding of the financial drivers for theorganization—“will this make us money?”
124 Roles and Quality: Measurers
Table 6.7 People Results—What the Measurers Think of Themselves
Example of Possible Measures
Perceptions—external to thegroup—surveys, interviews,compliments, and complaints
Has a motivational study provided positive feedback?
Are measurers satisfied with their career path, rewards?
Performance indicators—internal tomeasurers group
Does the measurers group match up to the required qualificationsand competencies? For example, do they have appropriate BCSqualifications [14]?
What are absenteeism and sickness levels compared with othergroups? Are audit staff showing a different absence pattern toother staff?
What is the level of staff turnover compared with other groups anddo people want to be recruited into this group? For example, if weadvertise a document inspection course internally, is it over- orundersubscribed?
Table 6.8 Society Results—How the Measurers Relate to Society
Example of Possible Measures
Perceptions—externalto the group—surveys,interviews, compliments,and complaints
Are the measurers seen by the organization andwider society as acting ethically?
Do the auditors and testers check that the systemsact properly with regard to health risks, safety,hazards, and the environment?
Performance indicators—internal to measurers group
Has the test group won any accolades, for example,for paper- and energy-saving initiatives, in line withcorporate initiatives?
Has the audit group checked that certification andclearances with external authorities have beenauthorized and cleared properly?

6.5 Communication between the measurers and othergroups
We will see in Chapters 8 to 12 that measurers are involved in the whole lifespan of a piece of software, from its conception, through the software-development life cycle (SDLC), during delivery, and postdelivery untildecommissioning. We will see that some of the SDLC models encouragemeasurer involvement and other models do not.
First, let us think about what it is like to have your work tested,reviewed, or audited. If we think about people’s feelings, we can see thatcommunication before, during, and after a QA or QC process is very impor-tant. People are often apprehensive if their work is to be examined by otherpeople and, therefore, can become defensive.
Here is a story from a colleague about interrelationships between somemeasurers and a group of builders.
One of the main risks that I raised was that mutual distrust between
groups—particularly business analysts and the test team—was inhibiting
productivity, and until addressed would militate against improvement. The
6.5 Communication between the measurers and other groups 125
Table 6.9 Key Performance Results—Financial and Corporate
Example of Possible Measures
Financial What is the return on investment (ROI) for the audits we have carried out this year (costof audits, number of noncompliances detected, predicted failure costs of noncompliances)?
What is the cost–benefit ratio of the system-testing activities, for example, cost of runningthe system test team, against predicted cost of failures if testing had not been done? (Thebenefit is the money saved by doing testing.) Compare with the cost–benefit ratio if testingand other QC activities had been carried out earlier. Consider quality losses.
Nonfinancial Number of projects that request process reviews, and the size of these projects.
Cycle times for testing and for document review; how quickly do the builders get feedbackon their products and how accurate is that feedback?
Innovation by the measurers (e.g., new techniques to enable faster implementation ofsystems to support time to market with new products).
Table 6.10 Some Measurers and Builders Indulge in Bad-Mouthing Each Other
Person Their Comment
Test manager “The problems in the project are caused by the poor quality specifications.”
Business analyst 1 “The specification defects arise because the testers won’t review ourspecifications.”
Tester 1 “I would never speak to a business analyst!”
(When asked why she did not highlight defects in the specification.)
Tester 2 “It’s so frustrating—the analysts think we’re a waste of space. It’s the way thatothers carry on.... It reflects badly on me.... They don’t see what I do.”
Business analyst 2 “The testers are the problem—we have no idea what they do. They areover-resourced and don’t have the right skills.”
Tester 3 “The business analysts don’t do anything—they’re lazy.”
Business analyst 3 “What does the (lead tester) do? ... plan his holiday, I think.”

comments I got from interview sessions were revelatory [see Table 6.10].
Neither group had any awareness of what the other group was actually
doing; all were frustrated with the situation.
Is the test manager right? Are the problems in the project caused by poorquality specifications? I do not think so; the poor quality of the specifica-tions is a symptom and not a cause. The problems here are caused by dis-trust and poor communication. Once test execution had started, mycolleague’s pessimism about the outcome proved to be well founded: “Dur-ing test execution, 50% of UAT conditions generated an error and 50% ofthese were specification defects.”
My colleague also observed that the dissonant relationships were a bigimpediment to delivery:
The most amazing manifestation of this was in how defects were resolved.
The business analysts and testers sat together in an integrated team but
didn’t interact. Testers entered questions for the analysts in a spreadsheet,
for example: Is this word in the output meant to be capitalized? Once a week, the
business analysts would enter replies into the spreadsheet. As there had
been a dispute about the format of the spreadsheet (the testers “won”), sev-
eral business analysts refused to participate in the process. Directly observed
result: simple queries about the specifications took weeks to resolve, causing
the testing process to slip massively. The fascinating thing was that they had
been provided with the environment to work closely (colocated, integrated
team), but the relationships were totally broken.
What strikes me most here is how very badly both groups are behaving.Instead of partnership, we have conflict. As we each can only alter our ownbehavior and as this is a chapter about the measurers, I shall concentrate ontheir behavior—what could these testers do to improve the business ana-lysts’ view of them? Here are some ideas:
◗ Change the communication system; start talking to the business ana-lysts instead of sending them spreadsheets.
◗ Ensure that the queries are not trivial; focus on what is important ratherthan what is easy.
◗ Be polite to the analysts—they are as busy you are.
◗ Be seen to work hard and concentrate; stop the “holiday planning.”
◗ Ask the analysts what they need from you; treat them as a customerand provide a service.
Measurers need to share information with all the groups (Figure 6.3). Inorder to decide where to focus QA and QC activities, measurers need tounderstand the quality views of all the groups, particularly the customer’sgoal; the risks—both the impact and the likelihood of problems; and thebudget for the project. For example, audit teams will concentrate on high-risk projects, where failure would have a high impact.
126 Roles and Quality: Measurers

In Table 6.11, I have identified information that the measurers gatherthat is needed by other parties. Some of these are measures directly made,for example, numbers of defects; some of them are extrapolations from
6.5 Communication between the measurers and other groups 127
Measurers
SupportersBuilders
Managers
Customers
Figure 6.3 Communication between groups.
Table 6.11 Information That Measurers Have That Others Need
Before the SDLCstarts and updatedthroughout the SDLC
Identification of similar problems/solutions
Identification and assessment of technical and business risks
What QA and QC is necessary to address the risks
What QA and QC is possible within budget constraints
Advice on methods, processes, and standards, generic and tailored
During the SDLC Fast and early feedback on the success of the SDLC tailoring, by audit
Reassessment of risks and consequent retailoring advice
Improvement suggestions to make activities more effective and efficient
Defect identification by review of requirements, design, specifications, code, trainingmaterial, and documentation
Defect identification by designing, executing, and following up tests of software andprocesses
Advice on next steps if stage entry and exit criteria are not met
Quality measures, including number of defects, risk assessments, cost projections,acceptance criteria passed, projected impact of leaving/repairing defects, includingcost, time, and exposure
Refinements to requirements, acceptance criteria, priorities, risks, constraints
Advice to nonspecialists and members of other groups
At delivery Known defects list
Advice on next steps if stage entry and exit criteria are not met
Quality measures, including number of defects, risk assessments, cost projections,acceptance criteria passed, projected impact of leaving/repairing defects, includingcost, time, and exposure
Postdelivery Evaluation of risk assessment. Were all the risks identified correctly? Did we haveany surprises that we should have anticipated? If any risks were identified and didnot become problems, is this because we misjudged the likelihood or whether it justdid not happen this time?
Evaluation of QA and QC processes, efficiency, and effectiveness of quality processes
Evaluation of management, build, and support processes, improvement suggestionsfor all processes
Advice on impact of change
Aid in using tools and techniques (e.g., regression test packs)
Aid in using known problem lists and workarounds

those measures, for example, projected costs of repairing the defects and thecost of leaving them; and some are information based on experience.
Measurers need information from other groups, in order to understandthe constraints on delivering their wish list. Table 6.12 lists the informationmeasurers need from the other groups.
6.6 Summary of the groupMeasurers must communicate well with the other groups if they are to beeffective. Indeed, many measurers will be in other groups. The contributionof QA and QC to the success of a project can be enormous, but if the
128 Roles and Quality: Measurers
Table 6.12 Information That Measurers Need from Others
Customers Who the customers are and their real needs;
Constraints and risks for the customer;
Understanding of the customer’s user-based quality viewpoints;
Aims and objectives and acceptance criteria for the project;
Mandatory requirements;
Business view of risks (likelihood and impact);
Quality targets within the constraints;
Changes to requirements, acceptance criteria, aims, risks, and constraints;
Number and impact of defects reported during live use;
Customer satisfaction with the delivered products;
Improvement suggestions for quality processes;
Test priorities for the next release;
Evaluation of QA/QC effectiveness.
Managers Constraints and risks for managers;
Better understanding of the manager’s value-based quality viewpoints;
Understand and agree to an outline plan, including constraints such as dates and costs;
Changes to requirements, acceptance criteria, aims, risks, and constraints;
Evaluation of QA/QC efficiency from the managers.
Builders Constraints and risks for builders;
Better understanding of the builder’s manufacturing and product quality viewpoints;
Understand the technical view of risks (likelihood of errors being made in the build);
Requests for changes to requirements, acceptance criteria, aims, risks, constraints, andchanges to design, code and other products;
Evaluation of QA/QC effectiveness.
Supporters Constraints and risks for supporters;
Better understanding of the supporters’ user and product quality viewpoints;
Understand the technical and business view of risks (likelihood and impact) on existingsystem;
Supporters’ requirements and acceptance criteria;
Changes to requirements, acceptance criteria, aims, risks, and constraints;
Number and impact of defects reported during live use;
Customer satisfaction with the delivered products as expressed to help desk;
Supporter satisfaction with the delivered products;
Evaluation of QA/QC effectiveness.

behavior of measurement specialists alienates the other groups, then nobenefits will be realized.
We will see in Chapters 8 to 12 how measurement, whether through QAor QC activities is necessary throughout the life of a software system.
References
[1] Draper, S. W., “The Hawthorne Effect: A Note,” http://www.psy.gla.ac.uk/~steve/hawth.html (March 12, 2003), September 2003.
[2] International Standards Organization, ISO 9000: 1994 Quality Systems.
[3] British Standards Institute, BS7925-1:1998, “Software Testing, Part 1:Vocabulary.”
[4] British Standards Institute, BS7925-2:1998, “Software Testing, Part 2: SoftwareComponent Testing.”
[5] International Standards Organization/International Electrotechnical Commis-sion (ISO/IEC), DTR 9126, Software Engineering—Software Product Quality(Parts 1–4, 2000/2001).
[6] Giakatis, G., T. Enkawa, and K. Washitani, “Hidden Quality Costs and theDistinction Between Quality Cost and Quality Loss,” Total Quality Management,Vol. 12, 2001, pp. 179–190.
[7] Reid, S. C., “Software Testing Standards—Do They Know What They are TalkingAbout?” http://www.testingstandards.co.uk/publications.htm, August 2003.
[8] British Standards Institute, PD0026:2003, Software and Systems QualityFramework—A Guide to the Use of ISO/IEC and Other Standards for UnderstandingQuality in Software and Systems, London, England: British Standards Institute,May 2003.
[9] International Standards Organization, ISO 9000:2000, Quality Systems.
[10] European Foundation for Quality Management, “EFQM Excellence Model,”http://www. efqm.org, August 2003.
[11] Roden, L., “Choosing and Managing the Ideal Test Team,” EuroSTAR Conference,1999.
[12] Warden, R., and I. Nicholson, The MIP Report—Volume 2—1996 MotivationalSurvey of IT Staff, 2nd ed., Bredon, England: Software Futures Ltd., 1996.
[13] British Computer Society, “Industry Structure Model,” http://www1.bcs.org.uk/link.asp? sectionID=574, September 2003.
[14] British Computer Society, “BCS Qualifications,” http://www1.bcs.org.uk/link.asp?sectionID=574, September 2003.
Selected bibliography
The American Society for Quality Web site has articles and information aboutquality issues on http://www.asq.org, including a quality glossary athttp://www.aq.org/info/glossary/index.html.
6.6 Summary of the group 129

Craig, R. D., and S. P. Jaskiel, Systematic Software Testing, Norwood, MA: ArtechHouse, 2002.
Crosby, P, Quality Is Free, New York: Mentor, 1980.
The W. Edwards Deming Institute Web site has articles on Deming’s work athttp://www.deming.org/theman/articles/articles_gbnf04.html.
Dustin, E., Effective Software Testing, Reading, MA: Addison-Wesley, 2003.
Galin, D., “Software Quality Metrics—From Theory to Implementation,”Software Quality Professional, June 2003, pp. 24–31.
Gerrard, P., and N. Thompson, Risk Based E-Business Testing, Norwood, MA:Artech House, 2002.
Gilb, T., and D. Graham, Software Inspection, Reading, MA: Addison-Wesley,1993.
Kaner, C., J. Bach, and B. Pettichord, Lessons Learned in Software Testing, NewYork: Wiley, 2002.
Pol, M., and E. van Veenendaal, Structured Testing of Information Systems, Deventer,the Netherlands: Kluwer, 1998.
Spaine, S., and S. P. Jaskiel, The Web Testing Handbook, Orange Park, FL: STQE,2001.
The Sticky Minds Web site has roundtable sessions has a continuously changingrange of articles and discussions on testing and software quality issues onhttp://www.stickyminds.com .
All issues of the STQE Journal (about to become Better Software).
Watkins, J., Testing IT: An Off the Shelf Software Testing Process, Cambridge, England:Cambridge University Press, 2001.
Wilborn, W., “Dynamic Auditing of Quality Assurance: Concept and Method,”International Journal of Quality and Reliability Management, Vol. 7, No. 3, 1989,pp. 35–42.
130 Roles and Quality: Measurers

Roles and Quality: Supporters
In this chapter I shall:
◗ Introduce the members of the supporters group, their roles,and activities;
◗ Introduce their quality viewpoint;
◗ Provide a framework for the supporters activities within theEFQM Excellence Model;
◗ Identify information flows between the supporters and theother groups.
So the first we hear about the new system is when we are asked to
give it an operational acceptance test, just before the project team
plan to put it live, so there’s no time to do anything much. We get
delivery of the software and run a quick test of the overnight
batch; it now takes too long. Turns out the development guys and
the testers never asked Operations about what constraints are on
the time slots. That meant a last-minute fix! I didn’t realize you
didn’t know about it.… I’d have told you if I’d realized. Yeah, we
knew it was coming, but we didn’t realize the mess they’d made of
the user interface. The help desk is inundated with calls, and the
extra network traffic is way over the capacity we’d planned for it.
They should’ve come to talk to us; we’d have put them right. Now
we’ve got to pick up the pieces.
—Some supporters moan about the newly implemented software
7.1 Introducing the supportersOnce the software has been and built and delivered, the cus-tomers will use it. This postdelivery period in the life of soft-ware, described in Chapter 12, is the longest period in the lifeof software, and its most important time; after all, if the soft-ware does not have a postdelivery life, what use is it?
131
7Contents
7.1 Introducing the supporters
7.2 Who could be in thisgroup?
7.3 Quality viewpoint
7.4 Quality framework usingthe EFQM Excellence Model
7.5 Communication betweensupporters and othergroups
7.6 Summary of the group
7.7 Summary of all the groups
C H A P T E R

Postdelivery, a group of IT specialists look after the software and the cus-tomers, providing a number of support and IT infrastructure services. Thesepeople provide the management, support, and infrastructure for the deploy-ment, update, optimization, and use of the software. Additionally, thisgroup plays an important role during the software-development life cycle(SDLC), providing the infrastructure and support within which the productsare built as well as support for specialist tools used by all the other groups.They also keep “business as usual” going on the IT systems during the SDLCand the delivery.
Because of their role in supporting the software, this group has abreadth and depth of knowledge unrivaled by any of the other groups.They see the software in use and in context with the rest of the system.They work with the software from its delivery to its decommissioning,supporting it and its users. They are the first to hear about its faultsfrom the user community, and they will be the people who fix thosefaults. I have chosen to call this group the supporters because they supportall the IT-related activities of the other groups and, hence, the organi-zation as a whole. They are critical to the success of the software andof the organization as a whole. Why, in our story at the start of thechapter, are the supporters so fed up? Well, you cannot provide a goodsupporting service unless the software is supportable, and the deliveredsoftware is unsupportable. They have information that would have helpedthe builders and measurers deliver better software. They have service needsthat have not been met. They are on the receiving end of complaintsabout the software from the customers, but they were not involved in itsdesignor build. They may even be subject to penalties against service-levelagreements that have been compromised by the poor performance of thesoftware.
Too often, in my experience, the supporters are involved too little andtoo late in the SDLC. So, why have I left them until last in this group ofchapters? It is to emphasize their importance. Builders (Chapter 5) are cen-tral to this group of chapters and to the delivery of products, including soft-ware. They are aided in their work by managers (Chapter 4), who areconduits for information, and by measurers (Chapter 6), who provideinformation about the products and processes. All this work is done for thecustomers (Chapter 3); without them we would not need or build the prod-ucts to support them in their work. Without the supporters, the customersmight not be able to use the software. This is because customers may nothave the technical knowledge, interest, or time to support the softwarethemselves, for example, when:
◗ Software has to be deployed on a complex infrastructure of hardware,communications, and systems software.
◗ Software has to be protected against infiltration, losses, and other secu-rity risks, as does the information stored with it.
◗ Communications and on-line and batch-processing systems have to bemonitored, and sometimes nursed, day and night.
132 Roles and Quality: Supporters

◗ Software and its infrastructure require updates and changes, whichneed to be deployed without adversely affecting business as usual(BAU).
◗ Complex software is not learned quickly; the customers need the sup-port of a help desk as they use more of the software’s features.
◗ The software is optimized during its life and use [1].
The supporters have knowledge, experience, and information that noneof the other groups have. Just like the customers, they have requirementsand acceptance criteria for the software, which will enable it not simply tobe functionally correct and provide the features the customers need, butalso to provide quality in use [2], by having appropriate attributes of per-formance, security, reliability, and so on. So, the customer and supporterchapters “bookend” the chapters about the people they need to inform. Justlike the customers, the supporters need to be involved right from the start ofplanning the software, through the SDLC, as well as during use and deploy-ment. Many of the points about customer contact throughout the book alsoapply to supporters.
In this chapter, we will see that of all the groups, the supporters is theone that is most mature in its understanding of the importance of IT to theorganization, and has standards that acknowledge and depend on widerorganizational excellence frameworks. We will see in Chapters 8 to 12 thatthe involvement of the supporters is vital throughout the entire process ofplanning and executing the SDLC, not just at the point of delivery andafter, because of this understanding of the attributes and the activitiesnecessary to provide the IT services required by the organization and thecustomers.
7.2 Who could be in this group?Supporters carry out all the IT service management activities required tosupport the organization. Generally, these jobs will be done by specialists. Itis likely that the team that looked after the IT infrastructure, communica-tions, and networks would be different from the team that manned the helpdesk. The specialists we might encounter include:
◗ Service-support specialists, including people who deal with the serv-ice desk, incident management, problem management, configurationmanagement, change management, and release management;
◗ Service-delivery specialists, including those who work in capacitymanagement, financial management for IT systems, availabilitymanagement, service-level management, and IT service-continuitymanagement;
◗ Information and communications technology (ICT) specialists, who arespecialists dealing with network-service management, operations
7.2 Who could be in this group? 133

management, management of local processors, computer installation,and acceptance and systems management;
◗ IT security specialists, who will deal with internal and external securityof the IT systems and the information held within them;
◗ Software-maintenance specialists, including those who deal with sys-tems and data conversion, as well as those who correct and enhancesoftware.
Specialist supporters are important stakeholders for quality. There aretwo parts to their involvement:
◗ First, this group maintains the software when it is delivered andaccepted by the customers; they provide support and infrastructureand are therefore stakeholders for quality in that they will haverequirements for the software, particularly in its quality attributes.Security, performance, portability, and maintainability will all be fac-tors for this group.
◗ Second, this group affects the quality of processes and productsbecause they provide the support and infrastructure for the othergroups during the SDLC. They will supply the environments for thebuilding and testing of the software and will support the tool sets usedby all the groups in their work. The group includes the IT infrastruc-ture team, comprising IT operations, support, and maintenance; ITsecurity; the help desk; service management; networking; and data-base administration (see IT infrastructure staff and software maintain-ers in Chapter 2, Table 2.1).
Many of us get involved in these activities in some way. Anyone whowrites documents has to deal with change management and version controlfor those documents, for example. In smaller organizations, people maymove between groups, sometimes building and supporting the software sys-tems. Indeed, it could be argued that most software engineers work in soft-ware maintenance rather than software development. Most projects areabout altering existing software rather than building entirely new systems.Similarly, in some organizations there may be an overlap between themeasurers and supporters. In several organizations, I have seen the systemtesters also manning the help desk. This can be useful, as the testers developtheir understanding of the customers’ real use problems, but I have seen thesituation were the team is overwhelmed by the volume of testing and help-desk calls for which they are responsible.
7.3 Quality viewpointSupporters need the software to be supportable; it needs to be fit for purposeand to have attributes that make it supportable. It needs to fit within infra-structure constraints and operational profiles. Remember our supporters at
134 Roles and Quality: Supporters

the start of the chapter—if the batch cannot run in its assigned slot, laterprocesses are affected, and this may result in the on-line system not beingavailable on time for the customers. Supporters tend to be more aware oforganizational requirements that affect the wider organization than other ITstaff, because they come up against problems more directly. I remember see-ing a payroll system in which the overnight batch run for the weekly paidstaff took somewhat longer than previously. It would not fit into the over-night schedule on Wednesday night, so someone in the development groupsuggested it could run in the freer Thursday night schedule. Weekly workerswere either paid into their bank accounts, or by cash. Running the batchThursday still left time for the head office weekly paid staff to get their cashenvelopes by lunchtime as usual. What the head-office-based, monthly sala-ried development staff did not consider was that the manual workers for theorganization worked remotely from head office, some as many as 50 milesaway. This was why the payroll ran Wednesday; it left time to put cash intoenvelopes and take it to the remote sites, to enable the manual workers to bepaid at lunchtime on Friday. If the payroll was run on Thursday, these work-ers would not receive their money until Monday, unless the courier couldleave by 10 a.m., meaning that the cash clerks would need to start work at 7a.m. instead of 9 a.m. every Friday. What implications does this have for theorganization? It is an unplanned change in working practices. We wouldneed to consider the reaction of the workforce and unions, the effect onmanagement and the human resources department, adverse publicity in thepress, possible strike action, and so on. Yet the IT development manager saidto me, “Why does the time the courier leaves the pay office affect us? That’snot an IT issue!” Yes, I am afraid it is, because the working of the IT system isaffecting the organization and its staff. It was the supporters who understoodand pointed out the problem, because they knew the special provisions thatwould be required if the Wednesday payroll failed in the existing system andit had to be run as one-off process on a Thursday night.
Supporters favor the product-based definition of quality, based on awell-defined set of software quality attributes that must be measured in anobjective and quantitative way. We can derive acceptance criteria to objec-tively assess the quality of the delivered product. The supporters need thisobjective measurement of attributes to help them ensure that they will meetthe service levels expected by their customers, the IT users, and the organi-zation. For example, standards such as ISO 9126 [2] define quality—in-useattributes that directly affect the supporters’ work. Typical attributes are reli-ability, usability, security and maintainability.
Supporters also favor the user-based definition that says that quality isfitness for use. This is because they will be using the software, as operationsteams, for example, but also because they are in the first line for dealingwith user inquiries and customer complaints. In the user-based view, soft-ware quality is determined by the user(s) of a product in a specific businesssituation. Different business characteristics require different “qualities” of asoftware product. For example, the usability of the interfaces for operationssuch as daily updating of security measures against virus and spam attack,
7.3 Quality viewpoint 135

running the daily batch systems, back-up and recovery, installing and dein-stalling software, will all be of interest to the supporters, because they arethe users of those programs.
The supporters’ managers will focus particularly on service levels.This may include a provision for the cost of supporting the systems. InChapter 12, we will meet a disenchanted support manager caught byservice costs rising with a new software release. Failing to meet the serv-ice levels may incur a penalty clause. This means supporters and theirmanagers have an interest in the value-based view of quality, specifi-cally whether the money saved or spent during the SDLC is justified bysavings in use of the system. We will look in Chapter 12 at evaluatingpostdelivery.
This group’s transcendent view of quality—their taken-for-grantedassumptions about the systems—include notions of stability, reliability ofservice levels, and long-term benefits. These assumptions about qualityreflect the supporters’ need to carry out their own work efficiently andeffectively, as well as supporting the customers’ use of the software to meetthe organization’s ends.
We can see in Table 7.1 how supporters, in this example a help-deskteam, could consider the other groups’ quality viewpoints to help themunderstand the supporters’ quality requirements.
7.4 Quality framework using the EFQM ExcellenceModel
7.4.1 The EFQM Excellence Model and the supporter
As I mentioned earlier, the supporters have a mature standards framework.This is supported by a global organization, the IT Service ManagementForum (itSMF) [3] which supports an associated library of process descrip-tions and guides, including the IT Infrastructure Library (ITIL). This libraryhas been developed since 1989 [4], has recently been updated, and is beingreleased as a series of seven guides. The ITIL books set service managementwithin an EFQM Excellence Model [5] framework, and also discusses thesimilar Baldrige [6] framework used in the United States. The subjects inITIL are:
◗ Service Support—covering service desk, incident management, prob-lem management, configuration management, change management,and release management [7];
◗ Service Delivery—covering capacity management, financial manage-ment for IT systems, availability management, service-level manage-ment, and IT continuity management [8];
◗ Security Management—covering fundamentals of informationsecurity, relationship of security management to other aspects ofservice management, and security management measures [9];
136 Roles and Quality: Supporters

◗ The Business Perspective (was scheduled to be due in 2004)—coveringbusiness relationship management, partnerships and outsourcing,continuous improvement, and exploitation of ICT for businessadvantage [10];
◗ ICT Infrastructure Management (not yet available)—covering networkservices, operations, local processors, computer installation and accep-tance, and systems management [10];
◗ Application Management—covering SDLC support, testing of IT serv-ices, and business change [1];
◗ Planning to Implement Service Management—a “how to start”guide [11].
Along with and aligned to ITIL, standards and qualifications are being orhave been developed [12, 13] to cover service management.
7.4 Quality framework using the EFQM Excellence Model 137
Table 7.1 Help-Desk Team Considering Other Viewpoints for Quality Impacts
Group andQuality View
Possible Routes into aDiscussion with This Group Example Questions and Areas for Discussion
Customer
User-basedquality view
Shared viewpoint—discuss the impact on fitfor purpose if things gowrong
Impact on business as usual (BAU) of failure, for example,cost of system outage to the business, work throughputefficiency for customer.
Builder
Product- andmanufacturing-based qualityview
Shared product view;product attributes
Show empathy formanufacturing view;technical excellence anddefect likelihood.
Which nonfunctional areas has the customer discussed withyou?
These are the nonfunctional attributes that experience showsus are important for BAU—the attributes most oftencommented on by customers calling the help desk.
Volunteer to review specifications/requirements for possibleattribute problems (functional and nonfunctional).
Provide list of common help-desk issues and discuss technicalinnovations that could help improve these areas.
MeasurerProduct- andmanufacturing-based qualityview
Shared product view;product attributes
Show empathy formanufacturing view;defect likelihood andimpact.
Priority of tests and document reviews. These are thenonfunctional attributes that experience shows us areimportant for BAU—the attributes most often commented onby customers calling the help desk.
Volunteer to review and comment on test designs and testresults; these are our acceptance criteria for productattributes.
Discuss how to assign priority for defects, based on impactand likelihood for BAU.
Provide support for setting up like-live environments fortests; provide example tests.
ManagerValue-basedquality view
Identify the cost of thingsgoing wrong and the costof repair/support.
Service-level agreements and their penalty clauses, sharedrisk on penalty clauses.
Cost of support, ROI on maintenance changes.
This is the cost of system outage.
This is the cost in customer and supporter time/efficiency lossin help-desk calls.

Supporters may provide services to the customer as in-house suppliersor as third-party suppliers (see Chapter 3). The supporters’ ability to recog-nize and adapt to the customer’s quality framework is a critical success fac-tor in the effectiveness of their relationship, whether they are internal orthird- party suppliers. The framework for the customer translates intodepartmental goals and, finally, into the personal objectives and targets foran individual system user, but it also translates into a complementary sub-set of the service management supplier’s goals and, hence, into service-level agreements (SLAs). These will lead to personal objectives and targetsfor all the supporters. This quality framework will drive what the customerneeds from the software and from the SLAs.
In Chapter 1, we looked at the EFQM Excellence Model and how it isdivided into nine parts: five enabling criteria and four criteria for measuringresults. In Section 7.4.2, we will look at how the EFQM Excellence Modelenablers could be interpreted for supporters, and in Section 7.4.3 we willlook at supporter results. Remember that this model is based on the funda-mental concepts of excellence we discussed in Chapter 1 and that equivalentmodels such as the Baldrige model are available.
7.4.2 Enablers for the supporters
7.4.2.1 Leadership
The supporters’ activities are vital to the success of the organization, not justduring BAU, but also during periods of change to the organization and ITprovisions, and in enabling the organization to deal with threats to businesscontinuity.
It is easy for the organization to take the supporters for granted; some-times the only feedback they get is when things go wrong. For this reason, itis particularly important that the organization’s leaders take account of serv-ice management in recognition schemes as well as in reward schemes [8].For example, if the operations staff keep the overnight batches running ontime through day-to-day problems, no one outside the group may notice,unless their leaders can alert senior management and, hence, the organiza-tion’s leaders that a bonus (reward) and a thank you (recognition) is needed[14]. Supporters may also have to “pick up the pieces” after an unsuccessfulsoftware delivery, specifically in dealing with customer complaints and infixing operational problems. We will meet in Chapter 12 a supporter reelingunder the strain of looking after software delivered by a different team.
Similarly, it is easy for business managers to neglect areas that do notresolve immediate problems. Ensuring proper IT service continuity manage-ment plans [8] requires strong leadership and a strategy agreed to at the toplevel and implemented and communicated through the whole organization.
An interesting point raised by Warden and Nicholson in their motiva-tional survey [15] is that the introduction of improved processes, forexample, the adoption of the ITIL processes, while providing a processimprovement, in some cases lowered staff motivation when jobs werechanged radically without good communication from leaders. This is an
138 Roles and Quality: Supporters

important point for leaders. My observation is that professional staff in allgroups will want and expect the adoption of appropriate recognized stan-dards, but they do not respond to imposition of standards, especially withoutsuitable training.
7.4.2.2 Policy and Strategy
The organization will need policies and strategies for all aspects of servicemanagement; these briefly set out the overall rules for the supporter team’swork; for example, an organization might have a release policy [7] thatdefines release definition (for example “major releases are numbered v1.x,v2.x and must include significant changes to critical attributes of the sys-tem”), required deliverables, preferred timing for implementations, or timesto avoid (for example “implementations always take place at least twoweeks before month/year ends”).
These policies must be agreed on and clearly communicated, whetherthey are documented (preferable in a large organization to ensure they arenot miscommunicated) or passed on by oral tradition: “We always do it thisway.”
The policy rules will be translated into strategies for the supporter’sactivities. These will show the approach that the supporters will take tomeet the goals of the organization. The different teams within the support-ers group—IT Infrastructure, help desk, the software maintenance teams,and so on—will have strategies and detailed plans for their own work. Ofcourse, it would be easy for these strategies to become misaligned with eachother and with the strategies of the other groups, such as the builders. TheITIL books [e.g., 7] use a nice analogy—that of tectonic plates. The areas ofinterest and control overlap and demarcation lines are not clear. It is at theseoverlaps that friction occurs. We have seen in Chapters 3 to 6 that the othergroups each have policies and strategies. Now, even if all the groups workfor the same organization, some considerable effort in communication isneeded to make sure each group understands the others. Policies and strate-gies need to be discussed, agreed on, and mutually understood, the overlapsof demarcation particularly being a focus for communication. The support-ers’ policy and strategy must support the customers’ policy and strategy, butthey also must support the managers, builders and measurers. If some or allof the supporters are from third-party organizations, the communicationduring agreement on the contract and SLAs as well as throughout the rela-tionship will need to be nurtured across all the groups and across organiza-tions, as we saw in Chapter 3.
7.4.2.3 People
The supporters group includes a variety of specialists, who may be workingin different teams and through separate management structures. They mayalso work in a separate management structure from the builders and meas-urers. This isolation of teams can lead to one of the problems our supporters
7.4 Quality framework using the EFQM Excellence Model 139

at the start of the chapter experienced: poor or nonexistent communicationleads to ineffective, inefficient service delivery to the customers.
Increasing specialization also means that individual supporters may onlysee part of each problem or solution—work is divided up and passed alongfrom one team to another. If little or no feedback is received by the support-ers on the effectiveness of their work, this can be alienating and demotivat-ing, just as we saw it was for the builders in Chapter 5. One finding ofWarden and Nicholson [15] was that the feedback received by supporterswas mainly negative, but was about the quality of the software—somethingthey typically had no control over—rather than about their own service lev-els. Typically, an SDLC team of builders and measurers deliver the softwareand other products. The customer uses them, and when things go wrongcomplains to a supporter (e.g, one on the help desk). Thus, the supporterdoes not get feedback on the level of service they provided but on the poorproduct provided by another team. The customers do not ring up to say thatthe product is good, and when there have been problems they will not be ina mood to comment on the good aspects of the supporters’ work. The effi-cient and effective running of the IT infrastructure, communications links,background processes, and so on is something we tend, as computer users, totake for granted. We only notice them when they go wrong, so the support-ers receive poor feedback and, as a result, can become demotivated.
In addition to the problem of feedback, there can be a problemof status. The other groups may undervalue the supporters. I remem-ber some years ago interviewing a software engineering graduate whoexplained that he did not expect to do any software support or maintenancebecause that was “boring, low-skill” work. For him, software engineeringmeant developing brand new systems from nothing, and then—in my viewquite, bizarrely—never needing to change them or to support the customer.Instead, “in the unlikely event that anything was wrong with the software”or if the customer “changed their minds about what they wanted,” a newsystem would be built. We had quite a painful conversation about the real-ity of life with software; the frequent problems and misunderstandings dur-ing the SDLC, and the need for constant change to reflect the customers’constantly changing world. In my own view, the work of supporters shouldbe seen as high status; it is not only critical but also extremely difficult,requiring both technical and personal skills. For example, one of the centralpoints of application management as described by ITIL [1] is that software inuse will be optimized throughout its life. Changing software, as we will seein Chapter 12, is very difficult; the supporters’ role in maintaining and opti-mizing the systems in order to meet the customers’ changing needs and toimprove service to them should not be undervalued. Some SDLC mod-els—for example, XP [16] and Evolutionary Delivery [17]—acknowledge,indeed expect, change. We might even see these as software-maintenancelife cycles (SMLCs) rather than SDLCs, and the people delivering via theselife cycles as supporters rather than builders, software engineers as mainte-nance staff rather than development staff. Could it just be the poor per-ceived image of software maintenance that prevents this?
140 Roles and Quality: Supporters

A breadth and depth of technical skills are also required to understandand be able to deal with the range of technology used by the customers, andto assess the technical and business implications of changes in technology. Arecent example of change is the increased IT and commercial security risksposed by organizations requiring desktop machines to have Internet accessas well as access to internal systems.
Supporters need a mix of skills. Their education, training and workexperiences will, of course, include all the technical skills and understandingof the methods, techniques, and tools for their tasks. Just as for the builders,it should also include an understanding of:
◗ The measurement techniques they will need to apply to their own workand to other people’s work. For example, supporters carry out QCactivities such as reviews and testing, specifically the OperationalAcceptance Test (OAT) in which they will need training. Supportersalso employ measures that will be needed for the ongoing manage-ment of SLAs, and toolsets for providing these. An example might bethe network traffic our supporters are discussing at the start of thechapter. They will have an optimum traffic volume calculated and bemeasuring against that. Too little traffic and we have a network that isnot cost-effective: too much and the traffic takes too long. Supporterslike the maintainers and the help desk will be interested in measuresof products on delivery. For example, we can measure code complex-ity and use it to understand the difficulty of future maintenance,while measures of the usability, reliability, and stability of the soft-ware will give the help-desk team a view of how busy they may beafter delivery.
◗ The management skills they require for control of their own time andwork within a team. Supporters need the skills, experience, and sup-port to assess risk, negotiate between parties, and manage against SLAs.The focus of ITIL and the itSMF (for example, [1]) is on management.The management skills of supporters need to include an understandingof organizational issues, providing input to the business IT strategy, ITgovernance, IT risk management, and management of IT and systemsto support business change. Recent publications, for example, [18, 19],emphasize the increasing importance of these areas.
◗ The interpersonal skills (sometimes called soft skills) to improve theircommunication with all the groups, including the other teams of sup-porters, and to deal sympathetically with people reporting problems tothem. One unfortunate thing I have seen is the frustration of somesupport-line engineers with what they see as stupid questions: “If theyjust looked at page 123 of the manual, they would find the answer.” Agood supporter empathizes with the customer’s view—maybe if theuser can’t find the answer, the manual is too complicated or has beenwritten in IT jargon rather than the user’s language, or possibly hasbeen badly translated if the software and manual are to be used in many
7.4 Quality framework using the EFQM Excellence Model 141

countries or the supporter’s first language may not be the customer’sfirst language.
◗ We said above that part of the management skills supporters needinclude strategic planning; this must fit with their customer’s goals and
strategy so that they can focus their technical, measurement, manage-ment, and interpersonal skills toward solving the organization’s realproblems. The links between the customers and the supporters shouldbe very strong.
7.4.2.4 Partnerships and Resources
Supporters operate in a network of partnerships within and outside theorganization. These partnerships are in place to help provide the resourcesmanaged by the supporters, including the hardware, communications,systems, and software, and the data and information that provideknowledge.
Examples of supporter partnerships are:
◗ Between groups: with the builders, customers, and measurers todefine acceptance criteria for nonfunctional attributes such asreliability, security, performance, to define the problem to be solved,and share information about risks and the fit-for-purpose, user-basedquality view.
◗ Between groups: with the managers to discuss service-level agree-ments, costs, and value.
◗ Between groups: with the measurers to understand how operationalacceptance criteria can be measured during testing.
◗ Between groups: with the builders and measurers to understand whatresources and environments are required during an SDLC; also withthe help-desk team and the trainers to discuss likely training needs andtraining success.
◗ Within the supporters group: for example, our supporters at the start ofthe chapter would benefit from sharing plans and news regularly.
◗ Outside a particular SDLC, to understand possible conflicts in resourcerequirements across several projects, or conflicts between the SDLCand BAU.
◗ Outside the organization: for example, with hardware and equipmentsuppliers, to plan delivery schedules against capacity and demandforecasts.
7.4.2.5 Processes
Many of the points made in Chapter 5 about builder’s processes also applyto supporters. However, one advantage is that there is a globally acceptabledefinition of the required processes and management for their work in the
142 Roles and Quality: Supporters

IT Infrastructure Library (ITIL) [1, 7–11]. These volumes provide processdescriptions and flowcharts, as well getting-started guides and contextdescriptions of quality standards and excellence frameworks. They alsocross-reference each other well. These process descriptions need to beadapted by particular organizations to fit their own requirements.
It is also important to realize that the introduction of new processes willrequire management of that change. Introduction of new processes orchanges into existing working practice can cause motivation problems [15],especially if imposed without consultation and training. It is always worthasking the technical experts to design the processes, based on publishedstandards and their own experience of what is appropriate, then includeless-experienced people in the reviews both of the processes and of trainingmaterial for the processes.
Remember, too, that people do not always follow the processes. Some-times this means that the process is unworkable; perhaps it cannot be fol-lowed in the available time. Sometimes it means they have not understoodthe reason for the process. I remember one place I worked in many yearsago where a small team of builders and measurers working on a minicom-puter also had to be their own supporters in certain aspects; we took turnscarrying out the daily backup, for example. The process for this was quiteclear and written down: a number of tapes were circulated through thedaily and weekly backups so that on each day the oldest backup was over-written. Thus, a set of backups over the previous two weeks was alwaysavailable. A log was kept of the backups, recording who had done them andso on. I went into the machine room one day to collect something andfound the senior programmer, Simon, looking at the tapes in amazeddespair. A series of backups had been made over a number of days withoutcirculating tapes properly. We had lost this week. as it had been overwrittenby today. If the computer had failed before today’s backup, a week of workwould have been lost rather than just today’s work. The person who haddone the backup was not being deliberately malign, they just did not realizethe implication of what they had done. Simon ran a training sessionexplaining not just what must be done but why it was important to do it fol-lowing the process. People are not stupid, and one of the ways they mani-fest intelligence is by seeing how to “improve” processes. The problem isthat if the reason for doing something is not clear, an optimization mayremove a safeguard and increase risk beyond what is acceptable.
7.4.3 Results for the supporters
7.4.3.1 Customer Results
All the groups are customers of the supporters because they support the ITsystems and software used by all the groups. Their customers will each meas-ure them against their own quality measures—implicit or explicit—and thesupporters need to measure their performance for their customers consider-ing those quality viewpoints when setting service-level agreements with cus-tomers. We are interested in both the customer perceptions and the actual
7.4 Quality framework using the EFQM Excellence Model 143

performance against service-level agreements. Table 7.2 shows some of thepossible measures.
The supporters are in a position to collect customer results not just fortheir own services, but also to allow evaluation of the builders’ and measur-ers’ work done during the SDLC. This should be agreed on and used in col-laboration with the other groups.
7.4.3.2 People Results
Here, the supporters measure themselves. What is their own reaction totheir work and their services? Again, we will measure perception and per-formance. There are a number of factors that make supporters roles difficult:
◗ The work can be very reactive, for example, on a help desk or supportline, and is therefore paced not by the person but by the frequency ofcalls. This makes it difficult for people to plan their time and tasks.
◗ The work is divided between many interlocked and overlappingprocesses, with many communication points, so it can be complex tocontrol, for example, with ITIL. If we look just at the Service Supportbook [7] it describes 17 processes, and the Service Delivery book [8]describes another 16 processes; these may be being carried out by oneor many teams depending on the size of the organization.
◗ The quality and attributes of products and services being supporteddepend on the product delivery team, who may not be involved in thesupport of the products and services. This means that the supporters donot have control over the products’ quality and yet are affected by it.
◗ The work may involve unsocial hours and shift work because theinfrastructure and systems may be in use and need to be supported 24hours a day. This may involve tedious waiting interspersed withemergencies, which means that concentration cannot be allowed tolapse. I remember visiting some computer operators in a windowlessdarkened room filled with monitoring screens that had to be watchedcontinuously for abnormal changes in network traffic. It was not anatural or ideal environment for a human.
144 Roles and Quality: Supporters
Table 7.2 Customer Results—What the Other Groups Think of Supporters
Example of Possible Measures
Perceptions—external tothe group—surveys,interviews, compliments,and complaints
Have the supporters got a good image?
Do other groups report that they find them easy to deal with (for example, arethey helpful, flexible, honest, and proactive)?
Are they seen as reliable, providing good value, providing a good service?
Performance indicators—measures of outcomes
Have we met service-levels agreements for all aspects of service to ourcustomers—service availability, response times, help-line query responses,closure rate on problems, incidents, issues, recidivist problems, service andunavailability?

For these reasons, careful monitoring of people results for the supportersis important, as is a related rewards and recognition scheme. Examples ofthe type of results that could be measured are shown in Table 7.3.
7.4.3.3 Society Results
For the EFQM Excellence Model, society means society at large, althoughwe could interpret it as meaning the wider organization. Again, we considerperception and performance indicators. Examples of the type of results thatcould be measured are shown in Table 7.4.
7.4 Quality framework using the EFQM Excellence Model 145
Table 7.3 People Results—What the Supporters Think of Themselves
Example of Possible Measures
Perceptions—external to thegroup—surveys, interviews,compliments, and complaints
Has a motivational study provided positive feedback?
Are supporters satisfied with their career path, rewards?
Performance indicators—internalto supporters group
Does the supporters group match up to the required qualifications andcompetencies? For example, do they have appropriate BCSqualifications [13]?
What are absenteeism and sickness levels compared with other groups?Are overnight operators showing a different absence pattern than ITsecurity staff?
What is the level of staff turnover compared with other groups and dopeople want to be recruited into this group? For example, if weadvertise a help-desk post internally, is it over- or undersubscribed byinternal applicants?
Table 7.4 Society Results—How the Supporters Relate to Society
Example of Possible Measures
Perceptions—external to thegroup—surveys, interviews,compliments, and complaints
Are the supporters seen by the organization and wider society as actingethically?
Do the auditors and testers check that the IT Infrastructure and systemsact properly with regard to health risks, safety hazards, and theenvironment? This might include checking that the delivered IT servicecomplies with legislation on data protection, availability of services topeople with disabilities, or pollution control.
Performance indicators—internalto builders group
Has the group won any accolades, for example, for paper- andenergy-saving initiatives, in line with corporate initiatives?
Has the group been recognized in its efforts to reduce security risksinternally and externally, including customer data confidentiality,prevention of spam and virus attacks, and IT governance provisions?
Is there any consideration in the SLAs of the effect of IT on society,environment, and people? Are there links across the organization sothat the management of IT systems, data, information, and knowledge ispart of an integrated management system that includes, for example,the overall security, environmental, quality, and financial management?

7.4.3.4 Key Performance Results
As we have seen in earlier chapters, the EFQM Excellence Model divideskey performance measures into two areas: financial and nonfinancial meas-ures. Some examples are shown in Table 7.5. It is important to measure thesupporter’s services against the needs of the organization. For a business,this will mean that the key performance results must reflect the commercialdrivers for the organization. For a nonprofit organization, again, the resultsmust support the organization’s goals, increasing the efficiency and effec-tiveness of the services and products provided.
7.5 Communication between supporters and othergroups
We will see in Chapters 8 to 12 that supporters are involved in the wholelife span of a piece of software, from its conception, through the software-development life cycle (SDLC), during delivery, and postdelivery untildecommissioning. We will see that some of the SDLC models encouragesupporter involvement and other models do not.
We have seen that supporters communicate with all the other groups,but that they are often reactive in communication by the nature of theirwork. If this is the case, perhaps the supporters should instigate communi-cations with the other groups so they can find out what is planned, and canbecome part of the SDLC. As with the customers, the advantage of havinglittle involvement to us as supporters is that while it is being built and deliv-ered we get on with other things. Superficially, it looks as though we arebeing efficient with our time. The disadvantage is that during the period ofthe SDLC, things will change; our customers’ problems will change, it maybe that the underlying infrastructure will change, and, therefore, the solu-tions we require will change. This means by the time we get the software, itis out of date. The disadvantage of SDLCs with high supporter involvementis that it is time-consuming when we have business as usual to deal with aswell as the SDLC. The advantage is that it is far more likely that a useful soft-ware solution will be delivered. So we will see in the later chapters thatcommunication between the supporters and the other groups is needed
146 Roles and Quality: Supporters
Table 7.5 Key Performance Results—Financial and Corporate
Example of Possible Measures
Financial What is the return on investment (ROI) for the services we have delivered this year(cost of services/money saved/number of new customers/market share gained)?
Nonfinancial Number of projects/customers who request our team to carry out IT-related work,and the size of these projects
Cycle times for responding to customer requests and questions
Innovation by the supporter (e.g., new technology to support time to market withnew products)
How closely have SLAs been met or exceeded?
How well did the agreed-upon SLAs match the goals of the organization?

throughout the whole life span. The supporters need to communicate withall the other groups (Figure 7.1) because they have information that thosegroups need.
We will see in Chapters 8 to 12 that from before the SDLC starts until thesoftware is decommissioned, the other groups need the supporters. As thingsin and around the project develop and change, this may affect the SDLC. Iremember a project in which we had decided to focus much attention duringsystem test on performance testing, because the performance of the systemafter change was assessed as the greatest risk to the success of the project.Part way through the system test, the live environment underwent a hard-ware upgrade that enhanced the performance of the live systems. It becameapparent that our fears about performance had been resolved by thisupgrade. We reassessed risk, and as a result discarded our strategy of per-formance testing, concentrating our efforts on other aspects of the systemthat were now at higher risk than performance. Without information fromthe supporters, we measurers would not have known about the environ-ment upgrade, as our environment was not being upgraded, so we wouldhave wasted effort instead of concentrating on the real risks. Table 7.6 listssome of the information that supporter have that other groups need.
Supporters need information from other groups in order to understandthe constraints on delivering their wish list. Table 7.7 lists the informationsupporters need from the other groups
At the end of the postdelivery period, during decommissioning, support-ers will be involved to review the decommissioning plans and aid inrehearsal of the decommissioning processes. Supporters will need to assesswhat parts of the QA and QC library and other data are archived, and whatis destroyed. This includes considerations of legal issues with complianceand with data protection.
7.6 Summary of the groupSupporters must communicate well with the other groups if they are to beeffective. They have a vital role to play in the success of the organization, insupporting all the groups to get the best from IT. This group has a deepunderstanding both of the technical risks to systems as changes are intro-duced and of the real needs of the customer. Having worked with the
7.6 Summary of the group 147
Measurers
SupportersBuilders
The software projectand the software product
Managers
Customers
Figure 7.1 Communication between groups.

customers’ delivered software, they understand how it stands up to real use.They have knowledge of the risks to the business of software failure andwhich areas of the software are critical to the organization. They can andmust be involved throughout the life span of the software, from conceptionand through the SDLC, as well as during delivery and use of the system untildecommissioning.
7.7 Summary of all the groupsAll the groups are important to the success of the IT provision for an organi-zation. We have seen in Chapters 3 to 7 that each group has information
148 Roles and Quality: Supporters
Table 7.6 Information That Supporters Have That Others NeedBefore the SDLC startsand updatedthroughout the SDLC
Possible solutions to problems/ideas;
Technical constraints and why these are constraints, for example, in theenvironment;
Why this problem/idea (e.g., for a technical problem) is important and the impacton the customers for business as usual;
Whether proposed aims/indicators are understood;
Proposed objectives/targets for the solution;
Whether proposed customer acceptance criteria are SMART (specific, measurable,achievable, realistic, and time-bound);
Identification of supporter acceptance criteria;
Technical risks (likelihood of this going wrong) and technical constraints;
Precision and accuracy of estimates, when refined estimates will be possible;
Constraints on SLAs postdelivery;
Scope of supporters’ operational acceptance testing.
During the SDLC Manufacturing/product quality viewpoint—what attributes are of most importanceand acceptance criteria for these attributes;
User quality viewpoint—the operational, fit-for-purpose view of the software, withupdated information as this changes over the SDLC;
Technical impact of proposed changes in scope;
Review and testing comments on proposed products to measure how closely theymeet acceptance criteria, especially for nonfunctional attributes;
Changes in IT infrastructure, systems, software, and other services that may affectthe SDLC plans.
At delivery Confirmation that the delivery is complete and acceptable.
Postdelivery Evaluation of the software, how it affects the SLAs, whether it is fit for purpose,number of defects identified, improvements, and optimizations;
Evaluation of the processes used and how they could be improved;
Number of defects reported during live use;
Customer satisfaction with the delivered products;
Supporter satisfaction with the delivered products;
Efficiency and effectiveness of quality processes;
Improvement suggestions for all processes;
Advice on impact of change.

7.7 Summary of all the groups 149
Table 7.7 Information That Supporters Need from Others
Managers Organization goals and strategy;
Changes to the goals and strategy, immediate tactics;
Problems and issues;
Forecast requirements for IT and infrastructure;
Feedback on services provided;
SLA requirements;
Customer acceptance criteria.
Builders Cost and resource constraints and why these are constraints;
Value quality viewpoint;
Whether proposed aims/indicators are understood;
Proposed objectives/targets for the solution;
Whether proposed acceptance criteria are SMART (specific, measurable, achievable,realistic, and time-bound);
Nontechnical risks (likelihood of this going wrong) and nontechnical constraints such asresources, time, budget, and people availability;
Precision and accuracy of estimates, when refined estimates will be possible;
Feedback on services provided.
Builders Manufacturing/product quality viewpoint;
Whether proposed aims/indicators are understood;
Proposed objectives/targets for the solution;
Whether proposed acceptance criteria are SMART (specific, measurable, achievable,realistic, and time-bound);
Technical risks (likelihood of this going wrong) and technical constraints;
Precision and accuracy of estimates, when refined estimates will be possible;
Update on progress;
Environmental requirements for the SDLC;
Environmental requirements for delivery and live use;
Feedback on services provided.
Other supporters Feedback on progress with problems, incidents, and issues;
Changes in risks;
Feedback on services provided;
Supporter acceptance criteria.
Measurers Manufacturing/product quality viewpoint;
Whether proposed aims/indicators are understood;
Proposed objectives/targets for the solution;
Whether proposed acceptance criteria are SMART (specific, measurable, achievable,realistic, and time-bound);
Technical risks (likelihood of this going wrong) and technical constraints;
Precision and accuracy of estimates, when refined estimates will be possible;
Update on progress;
Environmental requirements for the SDLC;
Environmental requirements for delivery and live use;
Feedback on services provided;
Advice on acceptance testing;
Advice on review processes;
Assurance that QA and QC activities have taken place;
Results of those activities;
Aid in using tools and techniques (e.g., regression test packs);
Aid in using known problem lists and workarounds.
that the others need, and that this information may change throughout theSDLC and the life of the software during use.
Customers provide a user-based, fit-for-purpose view, which changescontinuously to meet the changes in the real world. Managers understandthe nontechnical constraints on the organization and act as an informationconduit between the groups. Builders use their technical knowledge to pro-vide solutions to the customers’ problems. Measurers provide informationthat allow all groups to decide on whether the products are of an acceptablequality for use and optimization over time. Supporters provide an under-standing of technical risks to business as usual, together with the supportinginfrastructure for all the groups’ activities.
In Chapters 8 to 12 we will follow the life of software from its conceptionto its decommissioning, and we will look at the communication methodsand techniques we can use to help these five important but disparate groupsunderstand each other and relate to each other’s needs and strengths.
References
[1] IT Infrastructure Library, Best Practice for Application Management, London,England: Office of Government Commerce, 2002.
[2] International Standards Organization/International Electrotechnical Com-mission (ISO/IEC), DTR 9126, Software Engineering—Software Product Quality(Parts 1–4, 2000/2001).
[3] IT Service Management Forum, http://www.itsmf.com, October 2003.
[4] Quagliariello, P., “Introduction to IT Service Management, ITIL, and ITIL CapacityManagement,” http://www.pultorak.com/home/speaking_engagements/pre-sentations/2003_03_07_cmg.pdf, October 2003.
[5] European Foundation for Quality Management, “EFQM Excellence Model” and“Fundamental Concepts of Excellence,” http://www.efqm.org, August 2003.
[6] Malcolm Baldrige model, http://www.quality.nist.gov/index.html, August 2003.
[7] IT Infrastructure Library, Best Practice for Service Support, London, England: Officeof Government Commerce, 2002.
[8] IT Infrastructure Library, Best Practice for Service Delivery, London, England: Officeof Government Commerce, 2002.
[9] IT Infrastructure Library, Best Practice for Security Management, London, England:Office of Government Commerce, 1999.
[10] The Stationery Office Web site, http://www.tsonline.co.uk/bookshop/bookstore.asp?FO= 1150345, October 2003.
[11] IT Infrastructure Library, Planning to Implement Service Management, London,England: Office of Government Commerce, 2002.
[12] IT Service Management Forum, “BS 15000 IT, Service Management,”http://www.bs15000certification.com, October 2003.
[13] British Computer Society Qualifications, http://www1.bcs.org.uk/link.asp?sectionID=574, September 2003.
150 Roles and Quality: Supporters

[14] British Quality Foundation, “Recognition and Reward: Keep Your StaffSmiling,” UK Excellence, August/September 2003 (whole issue devoted torewards and recognition).
[15] Warden, R., and I. Nicholson, The MIP Report—Volume 2—1996 MotivationalSurvey of IT Staff, 2nd ed., Bredon, England: Software Futures Ltd., 1996.
[16] Beck, K., Extreme Programming Explained—Embrace Change, Reading, MA:Addison-Wesley, 2001.
[17] Gilb, T., papers on Evolutionary Delivery on http://www.gilb.com.
[18] The Office of Government Commerce, How to Manage Business and IT Strategies,London, England: HMSO, 2002.
[19] The Office of Government Commerce, How to Manage Business Change, London,England: HMSO, 2002.
Selected bibliography
IT Service Management Forum, A Dictionary of IT Service Management: Terms,Acronyms and Abbreviations: Version I, London, England: The Stationery Office,2001.
IT Service Management Forum, A Dictionary of IT Service Management: Terms,Acronyms and Abbreviations: Version I (North America), London, England: TheStationery Office, 2001.
IT Service Management Forum, IT Service Management: A Companion to the ITInfrastructure Library: Version 2, London, England: The Stationery Office, 2001.
7.7 Summary of all the groups 151

.

The Life Span of a SoftwareSystem
In this chapter I shall:
◗ Introduce the concept of software life span;
◗ Describe the stages in a software system’s life span;
◗ Discuss where the quality definitions from Chapter 1 best fit inthe stages;
◗ Introduce the concept of entry and exit criteria betweenstages;
◗ Prepare you for the detailed stage descriptions of Chapters 9to 12.
As a business, we’re crippled by our system! My development
manager has just told me that removing the annual manage-
ment charge from our premium account is going to take 50
days’ effort. Our competitors do this sort of thing in 5 minutes.
Unbelievable!
—Chief operating officer (COO), lamenting those of us
who do not think beyond implementation
8.1 Life span or life cycle?How do we avoid the problems upsetting the irate COO? Tohelp, I am suggesting that we focus on the “life span” of a soft-ware system. The dictionary defines life span as “the length oftime for which a person or animal lives or a thing functions”[1]. The life span of a software system begins when someoneidentifies a business problem that may be solved with software,continues through build and delivery, and, finally, ends withits decommissioning. The life of a software system includeswhat is often referred to as the software-development life cycle
153
8Contents
8.1 Life span or life cycle?
8.2 Entry and exit criteriabetween stages
8.3 Changes in qualityviewpoints across the lifespan of a system
C H A P T E R

(SDLC), which includes the design, build, testing, and delivery of the sys-tem. For most systems, the SDLC is a relatively short part of its life span.
Most systems spend the greatest part of their life span in use, being sup-ported and maintained [2]. For example, many of you will remember theworries before January 1, 2000, that systems would not cope with yearsstarting with “20” rather than “19.” Some of the systems in question weremore than 20 years old and still in use. Many organizations continue todepend on such software. Why replace something that works? Modern sys-tems show the same pattern of a relatively short SDLC, followed by a longlife of use and maintenance. Web sites spring to mind: After the initiallaunch they are continuously used and simultaneously changed.
Thinking about the life span of a software system instead of focusing onits development life cycle forces us to take a wider view of quality. We aremore likely to consider the value view. This is surely beneficial, as manyorganizations struggle with the cost of ownership for their legacy systems.We will also think about the user view: how the customers will deploy thesoftware. We may even identify the requirements of those tasked withsupporting it. Understanding the life span of software affects our interpreta-tion of the product and manufacturing views. We may develop tacticalsoftware intended to meet a finite need (short life span) very differentlyfrom a core system our organization intends to use for many years (longlife span). In either case, the software is only there to support otheractivities. The McCartney report emphasizes that “Delivering IT is only everpart of the implementation of new, more effective ways of working.…Achieving this requires a clear vision of the context in which IT is beingimplemented” [3].
Because the SDLC is often loosely referred to as the software life cycle, Ihave chosen to use “life span” to refer to the entire life of a software system,in order to differentiate the initial development from the rest of the soft-ware’s existence.1
The purpose of this chapter is to outline the four main stages I will dis-tinguish throughout the life span of a software system. These four stages Ihave called start-up, development (the SDLC), delivery, and postdelivery (whenthe customers use the system until it is decommissioned). Maintenancechanges are made to the system during postdelivery. You may use differentnames for these parts of the life span in your organization, or you may findthat an SDLC is defined but not start-up, delivery, or postdelivery, or thatall four stages are regarded as part of the SDLC. Do not worry about that;the naming and organization of the stages is simply to help us manage ourwork. The division into four life span stages that I am making is very simple(see Figure 8.1).
154 The Life Span of a Software System
1. The IT Infrastructure Library refers to the “Application Management Lifecycle,” containing Application
Development (which includes the SDLC), and “Service Management” for the postdelivery activities. I have
decided that for this book, life span and life cycle are simpler and easier to differentiate [4].

8.1.1 Start-up
At this stage, members of the customer group realize that they have a prob-lem that needs to be solved. They request the provision of a software solu-tion. I use the word problem here; it may, of course, be an opportunity, forexample, to expand into a new marketplace; or an outside requirement, forexample, a legislative change, rather than a problem. In a healthy organiza-tion where relationships between groups are strong, managers and buildersin IT may trigger start-up. IT can create opportunities by suggesting technicalpossibilities unknown to the customers. For example, in a major supermar-ket group, the customers knew that ordering stock for Christmas was anightmare, and accepted that they would overorder and run out of prod-ucts. Surely, that is part of their business, isn’t it? The IT director identified asoftware package that could manage the inventory more effectively, basedon predicted demand. The customers were unaware that this was possible,but were delighted when the project had an almost immediate payback.
In start-up, we must understand the problem, and if we do not, exploreit more. We need to decide whether a software solution is appropriate, and,if it is, agree on the overall constraints, acceptance criteria, and thus the typeof SDLC. If we decide to follow a software solution, we need some formal orinformal contract between the groups. This is covered in Chapter 9.
8.1.2 Development
At this stage, a software project is undertaken, through the SDLC. Thisincludes requirement definition, design, build and test activities to bring thesoftware solution from the high-level definition of the start-up stage to asystem ready for live delivery. It is important to remember that this is notjust code being built by developers. Remember our poor trainer from Chap-ter 1. People will also be busy designing, building, and testing training,documentation, and support materials. If the software being developed is apackage for commercial sale, the support material may include sales and
8.1 Life span or life cycle? 155
Postdelivery
Delivery
Development (SDLC)
Start-up
Entry: Criteria to judge whether we areready to start a stage; do we haveeverything we need?
En
try
En
try
En
try
En
try
Exit: Criteria to judge whether we areready to complete a stage; have wedone everything we should have done?
Exi
t
Exi
t
Exi
t
Exi
t
Figure 8.1 Life span stages.

marketing material. For an in-house business system, it may include busi-ness process manuals. These are all part of the delivered product.
The work required might include the acquisition of a commercial off-the-shelf (COTS) system, building a custom-made system, tailoring a pack-age, or making changes to an existing live system.
Members of all groups will be involved, directly or indirectly, but thefocus is on the builders and measurers.
There are several different life-cycle models for software development.Some of these have been in use for many years, but new models and varia-tions on the models have been developed over the years. The changes to themodels have been made as customer problems, perceptions of quality, andthe technologies available have evolved. I will look at the main groups ofmodels. We will examine their advantages and disadvantages, and considerhow to combine their best aspects to customize a life cycle. This is covered inChapter 10.
8.1.3 Delivery
This is the point where the completed software solution is moved to live use.It is a time of anxiety for all the groups. The customers take delivery of thesoftware and start to use it. Members of all groups will support the delivery,but their viewpoints will be quite different. The customer and supporters arevery engaged at this point. Will the system really work? Will they be able touse it? Will the delivery go well? The builders and managers have quite a dif-ferent reason for anxiety at this point. Will the project team be able to finishthis project and (with more or less relief) move onto a shiny new project?For the measurers, fairly or unfairly, their efforts in assessing quality are nowunder the microscope. Did they make the right assessment? At delivery,many activities will come together at a single milestone in the project plan.This is a short, intense period of stress, anxiety, and emotions that are a rol-lercoaster between despair and elation. I will discuss delivery in Chapter 11.
8.1.4 Postdelivery
This is the life of the software while it is being used until it is decommis-sioned. It is the longest part of a software system’s life span [5, 6], and iswhere the benefits of the software are realized; “A project or program is onlysuccessful if it delivers the benefits for which it was initiated” [3]. Customersuse the software while supporters maintain and support it. Although theproject team has often disbanded, all groups have an interest in quality atthis stage (see Section 8.3). Additionally, it is almost certain that the soft-ware will undergo maintenance changes. Customers will identify new prob-lems to be resolved and new opportunities to grasp, and will encounter newoutside requirements. The system may need to be enhanced, corrected, andadapted to changes in its environment. To aid this, supporters may need tochange it to make future support and maintenance easier. So the system willbe subject to successive cycles of change, often with many changes taking
156 The Life Span of a Software System

place in parallel (Figure 8.2). Each maintenance change will have a start-up(SU), development (SDLC/SMLC), and delivery (D), feeding into the post-delivery (PD) system. Figure 8.2 shows new SDLCs, involving the wholecast of characters from before, that could be described as SMLCs (software-maintenance life cycles). This is covered in Chapter 12.
8.2 Entry and exit criteria between stagesEach stage has within it some entry criteria (the criteria for starting thatstage) and some exit criteria (the criteria for completing the stage). Somepeople call these the “quality gates.” The entry criteria to a stage must matchthe exit criteria from the previous stage, like a series of jigsaw puzzle pieces.This may seem obvious, but I have seen projects affected badly by mis-understandings at the hand-over points between stages as confusion arisesbetween people about responsibilities, authority, acceptance criteria, andquality. The reason for entry and exit criteria is to clarify to people how andwhen a handover can take place, and when it should not take place. In aproject or program with several parallel activities, a set of exit criteria mayfeed more than one set of entry criteria, and a set of entry criteria may needexits from more than one previous activity. Long stages, for example theSDLC itself, will have entry and exit criteria to control the steps within thestage. We will see examples of this in later chapters.
Each entry and exit point needs an owner. This is someone who has theknowledge and authority to judge that the criteria are complete, by using achecklist [7] or by best judgment. The former is more objective; if the check-list is complete we move on, otherwise we do not. Using best judgmentalone can result in an argument about whether the criteria are fulfilled ornot, especially if the ownership and responsibility for the quality gates arenot clear. Sometimes, we want to ignore the criteria. For example, during
8.2 Entry and exit criteria between stages 157
PD
= PostdeliveryPD= DeliveryD
= Development (the softwaredevelopment life cycle or thesoftware maintenance life cycle)
SDLC/SMLC
= Start-upSU
DD D
D
D
SDLC/SMLC
SDLC/SMLC
SDLC/SMLC
SDLC/SMLC
SDLC/SMLC
SU SU
SU
SU
SU
Figure 8.2 Change cycles to a software system.

start-up the project team may want to start work before all the acceptancecriteria are set, in the belief that this will save time. If this is the case, weneed to examine why we set the criteria in a particular way and the risks wetake in not fulfilling the criteria. As we will see in Chapters 9 to 12, the pre-cise entry and exit criteria depend on the situation, so checklists will need tobe tailored. As well as an owner, identify an escalation authority, to makejudgments in borderline cases.
Table 8.1 gives an example of simple entry and exit criteria betweenstages; we will discuss them in detail within each stage. Typically some typeof review is required to check that the criteria have been fulfilled properly;for example, [3] suggests a peer review at “project gateways.”
8.3 Changes in quality viewpoints across the life spanof a system
Software quality is important throughout the life span of a software system.It can be built in or neglected at each stage of a system’s life span. In Chapter1, we looked at five definitions of quality and at associated quality view-points. Now I will consider how these viewpoints change across the life spanof the software system.
The dominant group at each stage will dictate the prevailing view (seeTable 8.2), but each group will still hold onto its preferred view, sometimeseven feeling that their view is being discounted. For example, during devel-opment, the easiest view for the project team to use—the manufacturingview—will mean that they concentrate on delivering to specification.
158 The Life Span of a Software System
Table 8.2 Prevailing Views of Quality Across the Life Span
Stage
Quality View Start-Up SDLC Delivery Postdelivery
Transcendent view ✓ ✓ ✓ ✓
User view ✓ (✓ late) ✓ ✓
Value view ✓ ✓
Product view ✓ ✓
Manufacturing view ✓ ✓
✓ is a primary quality view.(✓ ) is a quality view that may be taken by some people in this stage.
Table 8.1 Example of Entry and Exit Criteria for Stages in the Life Span
Entry Exit
Start-up Problem identified Contract for SDLC
Development Contact for SDLC Acceptance test passed
Delivery Acceptance test passed Load to live use complete
Postdelivery Load to live use complete Decommissioning complete

However, when delivery happens, the user view will prevail. The buildersfeel pleased that they have delivered to specification, and are then stunnedto find the system rejected by the customers.
This happens more often than one might suppose, either because thespecification was wrong, or because it was misinterpreted, or because theworld has changed so that the specification is out of date by the time the sys-tem is delivered.
Once the system is in use, we can measure its effect. The managers willbe interested in measures of value for money and return on investment,supporting the value-based view of quality. Supporters, measurers, andbuilders will be interested in measures of defects reported during use, sup-porting manufacturing- and product-based views of quality. Customers andsupporters engage with the software day to day. They hold a transcendentview of quality (“Are we enjoying this system?”) but also the user-basedview. They will have a perception of the software as fit for purpose orotherwise.
In the next four chapters, I will describe the quality activities at eachstage, showing what people can do as a team at each stage to build in andmeasure quality, therefore achieving software quality through teamwork.
References
[1] Compact Oxford English Dictionary, 2nd ed., Oxford, England: Oxford UniversityPress, 2002.
[2] Hetzel, W., The Complete Guide to Software Testing, Wellesley, MA: QED, 1984.
[3] Cabinet Office, Successful IT: Modernising Government in Action, London, England:HMSO, 2000.
[4] IT Infrastructure Library, Best Practice for Application Management, London,England: Office of Government Commerce, 2002.
[5] Baxter, I. D., and C. W. Pidgeon, “Software Change Through DesignMaintenance,” International Conference on Software Maintenance (ICSM ’97), 1997.
[6] Yourdon, E., “Long-Term Thinking,” Computerworld, October 2000,http://www.computerworld.com/managementtopics/management/story/0,10801,52398,00.html, accessed January 2004.
[7] Gilb, T., and D. Graham, Software Inspection, Reading, MA: Addison-Wesley,1993.
8.3 Changes in quality viewpoints across the life span of a system 159

.
Start-Up for aSoftware-Development Project
In this chapter I shall:
◗ Describe the entry criteria, steps, and exit criteria for thestart-up stage;
◗ Show how to use this stage to decide whether software devel-opment is required;
◗ Identify the quality definitions from Chapter 1 that prevail atstart-up;
◗ Identify how each of the groups identified in Chapter 2becomes involved at start-up;
◗ Introduce techniques for analyzing problems and solutions,setting aims and objectives, and defining acceptance criteriaand constraints.
Is that what you thought the reason is for this project? That’s not
why I want it done.…
—The development and business managers discover, several
—months into the project, that they have opposing goals
I would have thought it was obvious that we wouldn’t want this!
—Customer rejecting software on delivery
9.1 Start-up—descriptionWe realize that we have a problem, or an opportunity (forexample, to expand into a new marketplace), or an outsiderequirement such as a legislative change. We must understandit and decide how to resolve it before we launch into deliveringa solution. Although many of us see quality as delivering aproject excellently, the most important project decision is
161
9Contents
9.1 Start-up—description
9.2 Start-up viewpoints
9.3 Entry criteria for start-up
9.4 Start-up—typicalactivities
9.5 Exit from start-up stage
C H A P T E R

ensuring that we do the right project. If the builders do not understand theproblem and the customers’ and managers’ quality views and their con-straints, they may build software that is too costly or not fit for purpose. Thecost of making that mistake is huge compared with setting up the projectcorrectly in the first place: One commentator reported that the cost of failedIT projects in the United States was estimated at $84 billion [1]. The cost offinding our mistakes and sorting them out escalates throughout the project[2]. The cost of doing the wrong project could be phenomenal; our biggest riskis spending a lot of money and not resolving our problem. However, once weidentify that we have a problem, our impulse is to start doing something,anything, to show that we are taking action. This means that we dive straightinto delivery without really knowing what we want to do. Our projects gowrong before they have started! So, in this chapter, I am going to show youhow to make the difficult move from a complex and messy business prob-lem to a project that is clear and structured. We will set the foundation forfuture work, possibly including a software-development life cycle (SDLC)and delivery (see Figure 9.1).
As an SDLC is costly, it is worth spending some time and effort doing thisstage well. We might decide that we cannot resolve this problem by a soft-ware solution, or that we prefer to use a manual solution, or to do nothing.We must:
◗ Explore the problem until we understand it.
◗ Decide whether this problem is worth solving.
◗ Set general constraints and parameters for the solution.
◗ Decide how to approach the problem; for example, a software solutionmay be appropriate.
◗ Agree on a formal or informal contract of work, with constraints,acceptance criteria, and an outline or high-level plan.
As we see in Figure 9.2, we will not just work our way down the list,checking each off in order; we will find that we need to revisit interrelatedtasks as we investigate the problem. We cycle round, investigating the prob-lem until we have enough information to either decide to do nothing, tohave a manual solution, or to have a software solution to the problem.
162 Start-Up for a Software-Development Project
SDLC = Software development life cycleD = DeliveryPD = PostdeliveryStart-up
PD
D
SDLC
Figure 9.1 Life-cycle stage diagram.
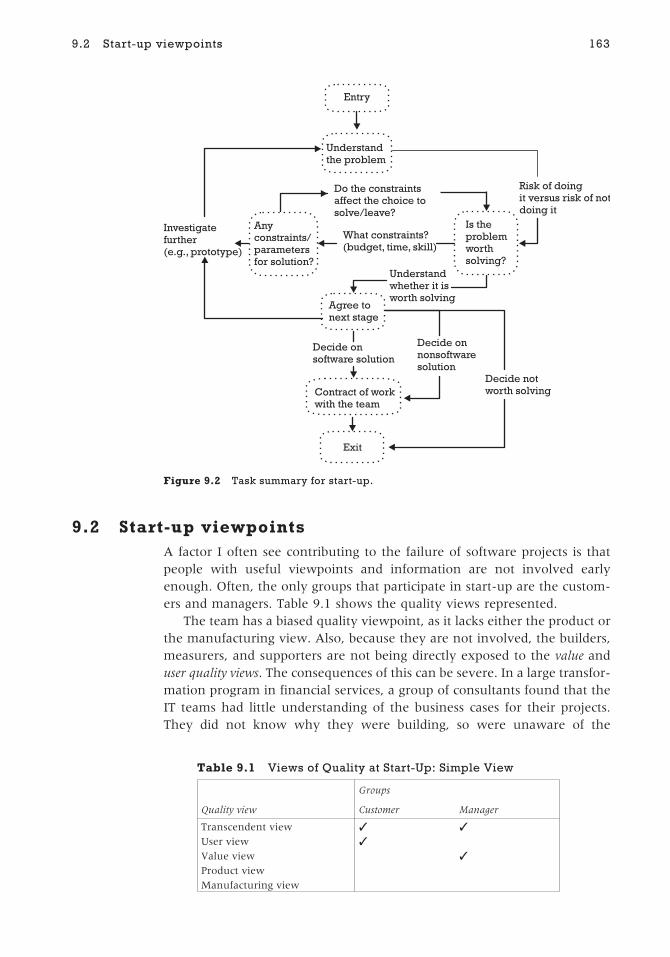
9.2 Start-up viewpointsA factor I often see contributing to the failure of software projects is thatpeople with useful viewpoints and information are not involved earlyenough. Often, the only groups that participate in start-up are the custom-ers and managers. Table 9.1 shows the quality views represented.
The team has a biased quality viewpoint, as it lacks either the product orthe manufacturing view. Also, because they are not involved, the builders,measurers, and supporters are not being directly exposed to the value anduser quality views. The consequences of this can be severe. In a large transfor-mation program in financial services, a group of consultants found that theIT teams had little understanding of the business cases for their projects.They did not know why they were building, so were unaware of the
9.2 Start-up viewpoints 163
Anyconstraints/parametersfor solution?
Investigatefurther(e.g., prototype)
Agree tonext stage
Understandwhether it isworth solving
What constraints?(budget, time, skill)
Is theproblemworthsolving?
Do the constraintsaffect the choice tosolve/leave?
Risk of doingit versus risk of notdoing it
Understandthe problem
Entry
Contract of workwith the team
Decide notworth solving
Decide onnonsoftwaresolution
Decide onsoftware solution
Exit
Figure 9.2 Task summary for start-up.
Table 9.1 Views of Quality at Start-Up: Simple View
Groups
Quality view Customer Manager
Transcendent view ✓ ✓
User view ✓
Value view ✓
Product view
Manufacturing view

organizational impact of going over budget or missing scope. They deliveredsoftware that often failed to meet business expectations.
Table 9.2 shows that involving all the groups covers the quality view-points and thus provides wider knowledge of the problem and potentialsolutions.
Some IT people, including builders, measurers, and managers, expressfrustration that the customers often do not know what they want, but wemust realize that it is difficult to understand many problems. Often, whencustomers call in consultants “All [they know] is that something is notworking right and [they] need some kind of help” [3]. In some situations,there is no clear customer group. Suppose your organization builds softwarepackages that are purchased by customers “off the shelf.” You may not havedirect contact with your “real” customers. Sales, marketing, or marketresearch people could represent the customers or involve customers viamarket research. In one company producing project management packages,the “key customers” for each release were representatives from group mar-keting and the customer help desk.
9.3 Entry criteria for start-upThe entry criteria for a stage are the rules or reasons by which we decide weare ready to start that stage. This might include a list of input deliverables ora list of events that have to have happened. For the start-up stage, these arequite simple (Table 9.3); we realize we need something—a problem solved, achange in our processes, a new product supported. We have an idea for animprovement or a change. This may be enough, but in some organizations it
164 Start-Up for a Software-Development Project
Table 9.2 Views of Quality at Start-Up: Teamwork View
Groups
Quality view Customer Manager Builder Measurer Supporter
Transcendent view ✓ ✓ ✓ ✓ ✓
User view ✓ (✓ ) ✓
Value view ✓
Product view ✓ ✓ ✓
Manufacturing view ✓ ✓
✓ is a primary quality view.(✓ ) is a quality view that may be taken by some people in this group.
Table 9.3 Example of Simple Entry Criteria and Owners for Start-up Stage
Example Entry Criterion Example Owner
System or process problem identified Change control group
Legislation change identified Audit and compliance
Idea for new product identified Marketing
Process improvement identified Process owner

may be the entry into a suggestion scheme or a change process. When youdefine entry criteria and steps for your start-up stage, look at your existingscheme, and decide what ideas from this chapter you would like to add toimprove it.
9.4 Start-up—typical activities9.4.1 Understanding the problem/idea
Once a problem or idea has been identified, we can use various methods toanalyze it. Remember that I am using “problem” as shorthand for “problem,outside requirement, opportunity, or other reason for wanting to changethe status quo.” This step is critical, so beware underplaying it. If you get thisbit wrong, the project could already be doomed to fail! People will have pre-conceptions about what needs to be done, even if they are using the word“problem,” as TQMI1 [4] identifies:
◗ Solution: “our problem is that we need a new Web-based interface.”
◗ Symptom: “our problem is people keep making mistakes in data input.”
◗ Decision: “our problem is deciding which supplier to choose.”
◗ Problem: “our problem is that it isn’t working as we expected.”
Involving all groups will help prevent you from confusing the symptomwith the cause. Be radical and dig deep until you find the real problem. Youwill need to consider many possible and underlying causes; for example, acustomer complaint might have one or more root causes (Table 9.4).
There are many methods for understanding problems and solutions.Some you will find particularly useful are cause–effect or root-cause analy-sis, solution analysis, brainstorming, and prototyping (see Table 9.5). Youwill probably use cause–effect/solution (C-E/S) analysis and brainstormingon your first pass, followed by methods such as prototyping as you start try-ing to identify possible solutions (see Figure 9.3).
9.4 Start-up—typical activities 165
Table 9.4 Severe Customer Complaint Root Causes
Problem Severe Customer Complaint
Apparent cause Poor quality products
Possible underlyingcauses
Product is badly designed/badly built/fails too quickly, and too often.
Product not matched to customer need/misadvertised/missold.
Customer expectations not managed against feasible targets/too expensive, late.
Poor quality service/customer complaints not handled well/customer passed fromperson to person, multiple calls required to resolve problem.
Root cause inthis case
The customer had a minor problem that escalated as multiple calls were required toresolve it.
Solution Improve customer complaints procedure to ensure a fast resolution to problems.
1. Reproduced by permission of TQMI Ltd., from Problem Solving—Tools and Techniques.

166 Start-Up for a Software-Development Project
Table 9.5 Summary of Techniques for Start-Up
Subject AreaTechniqueExamples In 30 Seconds… (see Appendix A for more)
Identifyproblemsand root causes,find solutions
Ishikawafishbones[4, 5]
Use to identify problems, root causes of problems and solutions. On afishbone diagram, brainstorm problems, their possible causes, theirroot causes, and, therefore, solutions to the root cause. See Chapter 12for an example.
Reviewdocumentsand otherproducts
Walkthrough[6],inspections[2, 6],peer review[6]
Walkthrough is a review with the purpose of increasing understandingof a document. The author introduces the audience to the documentand takes them through it, explaining the content. Inspection is aformal review with the purpose of identifying and preventing defectsand nonconformities to standards and specifications. Peer reviewadditionally allows discussion.
Improvemeetingsand improvecontributions
De Bono’sSixThinkingHats [7]
Improve meetings by setting rules for behavior. Six “hats” are used.Everyone wears the same color hat at the same time: Blue Hat—meeting structure, Black Hat—pessimistic, Yellow Hat— optimistic, RedHat—feelings, White Hat—facts, Green Hat—creative ideas. Allowsmeeting members to move outside their stereotypes and allows timefor different, sometimes difficult types of communication.
Helping groupsagree on aims,objectives,targets, andindicators
Weavertriangle [8]
On a one-page diagram, the group identifies and agrees on the aim ofthe project (why it is being done) and associated indicators of success,then on the objectives of the project (what is to be done) andassociated targets. They identify where stakeholders have differentaims for the project.
Understand/explore ideas
Prototyping[9, 10]
Not an SDLC! We prototype to try out ideas or, if we are not sure whatwe want, we build a model of a possible solution(s). Discuss theprototype and review it. Two types of prototyping in software are“lo-fi” and “hi-fi.” In hi-fi (high-fidelity), we build screens like thosethe customer will see. Lo-fi (low-fidelity) prototyping uses paper/white board. In lo-fi there is no danger of believing the prototype is thesoftware.
Modeling andpicturing,stories,metaphors[11–13]
There are a number of modeling and picturing techniques that can beworth exploring with lo-fi prototyping. These include Rich Picturingand Mind Mapping. Sketching a picture of a problem, solution, or ideacan clarify it. Use stories, metaphors, and analogy as well; they canhelp understanding.
Understand whetheran idea is worthpursuing
Riskworkshopbybrainstorming[4, 5]
A brainstorming workshop is run to list all the possible risks people canidentify. Risks are sorted into groups, also separate risks (might happenin the future), issues (problems right now) and constraints. Risks arescored for impact and likelihood, and ranked to give a prioritized list.
Cost–benefitanalysis [5]
Cost–benefit analysis is done by calculating the predicted benefits ofthe proposed change (time, money saved) and setting this against thepredicted cost.
Choose whichidea to pursue
Paretoanalysis [4]
The Pareto principle suggests that 80% of the problems are the resultof 20% of the causes. Gather data on the frequency ofproblems/causes, and then resolve the most frequent.
Teamrelationshipsand naturalroles/teamskills
Belbin teamscores [14]
The SDLC can fail because of personal rather than technical factors.Teams need to understand their strengths and weaknesses as a team. Abalance of roles/skills is required in the personalities in the team.Example roles: plants have new ideas; completer–finishers want tofinish to fine detail. Too many plants and you will never finishanything.

If you do not have direct access to your customers, your sales and mar-keting group may use market research or ethnographical techniques at thisstage. This includes observing or interviewing groups of likely or existingcustomers to help focus understanding of the customer’s viewpoint, withuse of prototypes. For example, Philips uses their “HomeLab” in Eindhovento observe how people react to new technology, because it is only by observ-ing people living with the technology that they can identify which ideas aregood in practice, as well as in theory [18].
The output from this stage is a problem statement. This does not need tobe formal. The aim is to provide a short, clear description of your analyzedproblem. I would advise that you get others to have a peer review or a walk-through of the problem statement before you go any further into start-up.
Do not forget that allowing different viewpoints to be heard during dis-cussion of ideas is important. People who are disillusioned may respondnegatively to any new idea, including use of new techniques. If people say,“Yes, but…” or “We’ve tried that and it didn’t work…,” do not dismiss them.You will need to persist and show people that their contributions are
9.4 Start-up—typical activities 167
Idea/problem/opportunity/necessity
C-E/S analysis/brainstorming
Goodideas
Betterideas
Discardedideas
Build anddiscuss hi-fi
screen prototype
paper prototypediscuss low-fi
Build and
Decide what to do:software or manual solutionor do nothing
Maylead to...
Gather during C-E/Sanalysis brainstorming
Eventually...
Gatherduring prototyping
Maylead to...
Gatherduring prototyping
Maylead to...
Maylead to...
Maylead to...
Gatherduring prototyping
Maylead to...
Maylead to...May
lead to...
Gatherduring prototyping
Gather during C-E/Sanalysis brainstorming
Figure 9.3 Problem and solution analysis cycles during start-up.
Table 9.5 (Continued)Improvecommunication—Empathy withothers
MBTI [15],Honey &Mumford[16],Kirton [17]
Different people have different personalities and communication styles.People who wave their arms around and talk a lot can annoy peoplewho like to be quiet and think, and vice versa. The Myers-Briggs TypeIndicator (MBTI) identifies four contrasting type pairs, e.g.,Introvert/Extrovert, leading to 16 “types” (e.g. INTJ isIntrovert-iNtuitive-Thinking-Judging). The Honey & Mumford LearningStyles Questionnaire identifies preferred learning styles (e.g., Pragmatistsvs. Theorists require different experiences to learn). Kirton identifiespreferred problem-solving methods (Adaptors vs. Innovators)—do webreak the rules or work within them?

listened to seriously. People get into a habit of always reacting in the sameway; they consistently either support or condemn suggestions [3]. Using DeBono’s Six Hats [7] helps resolve this by encouraging everyone to expresspositive and negative views (see Table 9.5 and Appendix A). You may alsofind, as I have, that when you bring the groups together some people arevery loud and others reticent. In certain organizational cultures, staff arereluctant to challenge or disagree with their superiors [3]. If you find this,then use techniques to help people express their views. For example, allideas or comments could be submitted anonymously in advance of theworkshop, then discussed “blind” (Frank Johnstone, personal correspon-dence, April 24, 2003). Technology can help; some organizations use on-line meetings and chat rooms to allow challenges to be presented safely.
Your view of the problem becomes more complete as you look at it fromdifferent quality perspectives. Every group should participate in workshopsto identify problems and ideas, suggest solutions, build prototypes, and pro-vide examples of similar business situations and how they were solved(Table 9.6).
9.4.2 Decide whether the problem/idea is worth solving
We now have some understanding of our problem or idea. We need to con-sider whether it is worth doing anything about it, and answering thesequestions will help us:
◗ What benefits will we realize by solving this problem?
◗ What risks are we taking if we do not do this?
◗ What risks are we taking if we do it and it goes wrong?
◗ What benefits might we not realize if we attempt it but it goes wrong?
Both action and inaction hold risks. For some of the entry criteriaexamples in Table 9.3, there is no doubt that a software project will be
168 Start-Up for a Software-Development Project
Table 9.6 Group Contributions to Understanding the Problem
Activity:
Group
C = Customer, M = Manager,
B = Builder, Me = Measurer, S = Supporter
Identify problem, idea All groups
Provide example of similarproblems and solutions
All groups
Take part in discussions andworkshops
All groups
Identify solutions and buildprototypes
All groups
Review role: C M B Me S
Review/test ideas and prototypesagainst a quality viewpoint:U = User, V = Value,M = Manufacturing, P = Product
U
V
V M
P
M
P
U
U
P

undertaken. If a legislative change is required that affects the software sys-tems, then the question is not “is this a good idea?” but “how shall wechange the software?” If there is a choice and there may be risks in makingchanges, it might be better to accept the problem or not implement the newidea, having assessed the risk. For example, not implementing a newproduct gives us a risk of losing market share because our customers maymove to our competitors. Implementing the new product may increase ournumber of customers and sales, and we should be able to predict the benefitgained. But supposing our infrastructure (warehousing, sales support, andso on) cannot support the increase? We may end up giving poor service toall our customers, and so lose more business than if we had done nothing.
We also need to consider whether there are risks involved with anyexpectations, for example the target date for getting the new product tomarket. What is the risk if we miss that date? What is the risk that the datewill be too difficult a target for us to meet? You can see that there are twoparts to the risk: we need to consider the likelihood that something will gowrong and the impact if it does go wrong. I have generally found that thecustomers, managers, and supporters have a good understanding of theimpact of problems on the existing organization and infrastructure. Build-ers, measurers, and supporters understand where technical problems arelikely to arise; they will understand the technical difficulties in solving theproblem and the effect of constraints. Customers and managers understandwhere business complexity and constraints make problems likely.
The EFQM Excellence Model (see Chapter 1 and [19]) helps structurethe way we think about the impact of either not doing something or doing itwrong. Consider the following:
◗ Impact on our organization’s customers—service levels, goods, expec-tations, continuing delivery;
◗ Impact on the people in our organization—motivation, staff turnover,attitudes, development, loss of IT infrastructure/support;
◗ Impact on our partners and resources—support of systems andprocesses, damage to existing IT and other infrastructure;
◗ Impact on society—PR, attitudes, legislation, compliance;
◗ Impact on key performance results—financial, market share.
When we consider the likelihood of something going wrong if we do nottake action and if we do take action, we look at our areas of weakness:
◗ Technical constraints and difficulties, for example, complexity, lack ofknowledge of the technical aspects, limits to existing systems;
◗ Business constraints and difficulties, for example, complexity, lack ofbusiness knowledge, product or service delivery constraints;
◗ Use of, lack of, or misuse of tools, techniques, processes, and standards;
◗ Constraints, for example, in time, budget, personnel, skill levels, orother resources;
9.4 Start-up—typical activities 169

◗ Measurement of past experience and predictions from that.
The methods you can use were listed in Table 9.5 and are explained inAppendix A. They include risk workshops and cost–benefit analysis. Youwill probably need to consider risks and benefits along with constraints (seeSection 9.4.3) because they will affect each other; if you only have thebudget to build a family saloon car, do not expect it to be armor-plated. Ifyou are deciding which of a group of problems to solve to get the greatestcost–benefit ratio, try using Pareto analysis (80% of the problems are theresult of 20% of the causes), choosing the most frequent problems/causesto resolve [4].
9.4.3 Set general constraints and parameters for the solution
Some organizations like to keep the risk workshops, constraints definition,and cost–benefit analysis quite separate, but I have found that the con-straints will often come out naturally during the risk workshop. You maywant use part of the risk workshop specifically to collect constraints. Theconstraints, risks, and benefits tend to interrelate. If you have a constrainton timescale or budget, you may not be able to do as much as you wantedto do. This might increase your risks, but the risks associated with increasedspending may be greater. Someone who took on a course of mine yearsago gave me a wonderful analogy—it is like going to buy a washingmachine:
You go into the shop, and ask the sales assistant the price of washing
machines. Suppose the assistant says that they range from $800 to $1,500.
You only have $15. The assistant will point out that for that money, you can
buy a bucket, a washboard, and some soap. You have kept within your
budget constraints and avoided the risks associated with getting into debt.
However, you are taking some additional risks—the washing will be done at
a lower temperature, so it may be not so effective, and you are going to get
soap on your skin (risk of “washerwoman’s hand”).
All the groups will be able to contribute to the discussion of constraints.Customers and managers will know about service level, timescale, budget,and resource and personnel constraints. Builders, measurers, and support-ers will know about technical, knowledge, infrastructure, resources, andskills constraints. In particular, the supporters will understand the con-straints against current IT service delivery and capacity [20, 21]. Whileexamining the constraints, build prototype plans. Are any of the ideas “run-ners” within the constraints?
9.4.4 Agree on next stage
We have identified a problem or idea and we have looked at whether it isworth dealing with. Now we need to decide what to do. All the groups have
170 Start-Up for a Software-Development Project

a contribution to make, so consider having a walkthrough of the informa-tion gathered so far, encouraging questions, comments, and additions. In awalkthrough, the author of a document takes the meeting through thedocument step by step, allowing them to ask questions and gather informa-tion (see Table 9.5 and Appendix A). This promotes greater understandingand helps find areas of ambiguity and mistakes. Display all the informationgathered so that the whole group can see it. I prefer putting everything onthe wall to allow everyone to look at it at the same time, standing and walk-ing from chart to chart. It helps the team to discuss and think as a team. Usea data projector and a PC, or flip charts from the workshops. If peopleare geographically remote, consider on-line review and meeting tools, orvideoconferencing.
Once the team has discussed the information, they can make a decisionabout what to do next. We have four options:
◗ Do nothing—decide that the problem is not worth solving. Log thedecision.
◗ Do more work on investigating the problem. Perhaps do some proto-typing, but check that you have the time, budget, and permission tocarry on.
◗ Decide not to develop software, but to address the problem throughyour people or processes. For example, the solution might includerecruitment, process change, or building a manual solution. Draw up acontract for the work.
◗ Decide that we need a software solution. Draw up a contract for thework.
9.4.5 Contract for work
Watts Humphrey remarked that one problem with software schedules isthat managers view them as contract-like commitments but the softwareengineers (builders) do not view them as personal commitments: “Toooften, software commitments are based on little more than hope” [22]. Weneed an agreement or contract between the groups. I am not (necessarily)talking about the legal contract between a customer and third-party sup-plier; it could be a formal or an informal contract between groups within anorganization, but it is a commitment. The Personal Software Process (PSP)[22] and the Team Software Process (TSP) [23] emphasize the importanceof this commitment, but how do we reach it? It is vital that everyoneagrees on:
◗ The aims and the objectives for the work;
◗ The constraints for the work—dates, budget, people, resources, techni-cal, and business;
◗ Acceptance criteria that define how we will know the work has beencompleted satisfactorily.
9.4 Start-up—typical activities 171

Everyone needs to agree on what has been planned and check that it ispossible, by contributing to and reviewing the contract. This contract is thebasis for the project(s) that will deliver the solution required by the custom-ers, perhaps including an SDLC. Sometimes, it is easy to agree the contract;the problem or idea is well understood. Often, teams find this step difficult;perhaps the customers are not sure what they want, or cannot define it, orsometimes the builders and measurers are not sure they can build and testthe software within the constraints. If the team cannot agree on the aimsand objectives for the work, plus at least overall constraints and high-levelacceptance criteria, it is probably not wise to agree on a contract for anSDLC; the problem or idea is not well enough understood to make a sensiblecommitment to the work.
There may be reluctance to contribute difficult or controversial ideas incontract negotiation meetings—“If I put my head above the parapet will Iget shot?” This is particularly true if different groups disagree about what ispossible within constraints. To prevent the loudest voice being the only oneheard, use the techniques mentioned earlier to control contributions to thediscussion.
9.4.5.1 Aims and objectives for the work
A project’s aims describe why it is being undertaken. They answer the ques-tion, “Why are we doing this?” The answer is not “to build a Web site” but“to increase market share.” Objectives are what you will do in order to reachan aim: “Our aim is to increase market share, so one of our objectives is tobuild a Web site.” Each aim is associated with one or more objectives, other-wise it will not happen. Every objective must meet one or more aims, other-wise, why do it? Indicators measure the impact that the project has on thebusiness. Did the project make a difference? Were the aims met? Has it real-ized benefits or mitigated risks? Indicators enable us to assess whether theaims have been met. Targets measure project delivery, monitoring whetherthe objectives have been achieved. We know whether a requirement iswithin our scope by testing to see if it aligns with the project aims andobjectives.
A useful technique to help define and agree on aims and objectives is aWeaver triangle [8] (see Figure 9.4, Table 9.5, and Appendix A) as itprovides a picture of the project on one page. I have used a Weaver trianglewith software projects to demonstrate that key people around the projecthad radically different ideas of the real aim of the project. The reason oneproject was failing was that there was no agreement about why it wasbeing done. Each team had taken off with different aims, in a differentdirection.
All the groups participate in defining and agreeing on the aims, objec-tives, targets, and indicators, remembering to check that they are SMART(specific, measurable, achievable, realistic and time-bound). If the team can-not agree on SMART aims and objectives, do not set the contract. Investi-gate the problem further.
172 Start-Up for a Software-Development Project

9.4.5.2 Constraints for the work
We have already looked at gathering the constraints. At this stage, we areconfirming that they are correct and complete, and that the project can bedelivered inside its constraints. In particular, managers will set date andbudget constraints, against value measures. These need to be checked andagreed on by the other groups. As before, the builders, measurers, and sup-porters identify technical constraints, for example, IT service levels andcapacity [22, 23]. These need to be understood and agreed on by the othergroups. If the team cannot identify the constraints, at least at a high level,for example, the maximum budget, do not set the contract. Investigate theproblem further and prototype the plan to see if it is possible to deliverwithin reasonable constraints. If there is some leeway in constraints, reflectthis in the contract:
◗ “This date must be met—legal requirement” is mandatory.
◗ “Marketing have planned a July launch to meet the build up for theholiday market (November/December), latest launch is August” ismandatory with some leeway.
◗ “Would like to complete work before March next year” is a preferreddate and could be renegotiated.
9.4 Start-up—typical activities 173
increased customer spendingdecreased costsincreased profitsincreased investment in new opportunities
Indicators:
To increasecustomerspending whiledecreasing costs
Aim:
Objectives
To decreasefor the organization
of servingthe customerthe cost
To increasethe opportunitiesfor customersto buyfrom us
Specific aims:
Targets:initial research complete (date)on-line shop plan complete (date)deliver stage 1 by (date)budget for stage 1 (cost)
By improvingour warehousingand deliverysystems to serviceincreased customers
By streamliningour back officesystems to servicethe increasedcustomers
By building asecure,user-friendly,reliableon-line shop
By researchingcustomerpreferredshoppingoptions
Figure 9.4 Weaver triangle. (After: [8].)

9.4.5.3 Acceptance criteria
Setting acceptance criteria at this stage is very important. The acceptance cri-teria are the means by which we know if a product or service is acceptable ornot. They describe the attributes of a product or service, and the “pass mark”for each attribute for acceptability. If acceptance criteria are not defined orthey are vague, we are in danger of building the wrong system. Like the tar-gets and indicators, acceptance criteria must be SMART. Many projects arereasonably good at defining what the software should do (its functionality).Very few customers and managers, in my experience, give much thought tohow the software should function. This is best illustrated by an example. AnATM machine should provide cash—that is its function. How quickly should itprovide the cash—within 2 hours or within 1 minute? This is a nonfunctionalattribute—it describes how the software works. They are often taken forgranted. In the ATM example, it seems obvious that 2 hours is too long towait for the money. The problem is that people’s assumptions about theseattributes may differ, so that although one might assume that the nonfunc-tional attributes are too obvious to mention, they may be interpreted differ-ently by other people in the team. Whether the project includes an SDLC ornot, acceptance criteria will be needed, in order that we can check that theproject has delivered acceptable products and services.
Software standard ISO 9126 [24] describes attributes of software, andmeasures for those attributes, but, as you will see, we could adapt some ofthe attributes for nonsoftware solutions. If we use ISO 9126 to help usdefine acceptance criteria, we can improve their SMARTness. This increasesthe likelihood of the right software being delivered.
ISO 9126 breaks down the functional and nonfunctional attributes ofsoftware into a series of subattributes, questions and metrics. Some exam-ples are shown in Table 9.7.
Let us take usability as an example. People find it hard to define andmeasure usability, so “give up” on trying to write acceptance criteria or try-ing to measure whether the software is acceptable. Look at Table 9.8, andyou will see increasing refinement of one aspect of usability until we arriveat measurable acceptance criteria. Statements 1 and 2 are impossible tomeasure. No attempt is made to define “usability.” Statement 3 crudelyqualifies what usability means but it will be hard to measure, and it will,therefore, be difficult to design and build software that meets the customers’usability needs. Statement 4 is a little better; we know that some trainingwill be needed but we have no definition of a new user. Is it someone new
174 Start-Up for a Software-Development Project
Table 9.7 Examples of Attributes, Based on ISO 9126
Example Attribute Example Subattribute Example Question or Statement
Functionality Suitability Does the function perform tasks that do not conform tospecified ones in requirements specifications or user manuals?
Usability Understandability Percentage of functions evident to user
Security Access controllability Is there any failing to defend against illegal access or illegaloperation?

to this particular software or to software in general? Statement 5 (based onISO 9126 metrics under “Usability” for Learnability, Efficiency and Effec-tiveness) is measurable. Having more measurable acceptance criteria meansit is easier to assess whether they meet other aspects of SMARTness.
The various nonfunctional attributes of software are of interest to differ-ent groups, so I would expect all the groups to be involved in setting accep-tance criteria. Table 9.9 (based on discussions in 2002–2003 between DavidHayman and me) lists attributes and groups. Remember when looking atthe table that the customer group includes executives and sponsors as wellas the software users.
9.4 Start-up—typical activities 175
Table 9.8 Making Acceptance Criteria Measurable
1. I assumed you would make it easy to use.
2. It must be user-friendly.
3. I want it to be as easy as the current system.
4. A new user must be able to use it with 30 minutes training.
5. Based on a sample of 20 typical users, at least 90% must learn to use the system in less than 30minutes. After training, 100% of the sample users must be able to complete the standard “10 typicaltasks” sequence without help, 95% of them completing it without help in less than 5 minutes.
Table 9.9 Selection of Nonfunctional Attributes and Groups
Attribute Group Setting Acceptance Criteria and Reason
Performance (e.g.,performance, stress,volume, scalability)
Customers—want good response from system
Supporters—do not want bottlenecks in the infrastructure and systems
Security Customers—Government and compliance requirements, CIA model(confidentiality, integrity, and accessibility of information)
Supporters—infrastructure and firewalls
Reliability (e.g.,reliability, availability,recovery)
Customers—service levels, product availability, lost sales, compliance, safety, avoidwasted time and lost work
Supporters—reduce system restarts and help-desk calls, avoid wasted time and lostwork
Usability Customers—attractive system to use and to market, supports users at their skilllevel—not too easy, not too difficult—efficiency and effectiveness for userscompleting tasks, avoid wasted time, mistakes, increase productivity
Supporters—reduce help-desk calls
IT support (e.g.,installability, portability,compatibility,conversion, memorymanagement,maintainability)
Supporters—need to support it within the existing infrastructure (e.g., amount ofmemory required, ease/cost of making changes)
Managers—cost of changes to infrastructure, cost of making changes
Attribute Group focus for reviewing acceptance criteria
All attributes reviewed Measurers: they are testable (specific and measurable)
Builders and supporters: they can be delivered within the constraints (achievableand realistic)
Customers: they are what is required (realistic and time-bound)
Managers: they are within cost/time constraints (realistic and time-bound)

Some of these attributes are specific to software, but others could beapplied or adapted to nonsoftware projects. For example, suppose our proj-ect is to write some manual business processes. We would still look at attrib-utes and acceptance criteria, for example:
◗ Usability—people are able to learn and use the new processes to carryout their tasks;
◗ Maintainability—able to update the business processes;
◗ Performance—throughput of tasks and business processesbottlenecks.
Just as in Chapter 1, where we saw that there is no “right” definition ofquality, there is no “right” set of acceptance criteria. It is situational. Con-trast the following:
◗ Air traffic control system—safety critical, so the emphasis is on reli-ability, recovery, performance, and security, but usability will also beimportant.
◗ Package to improve usability of Web pages for the visually impaired—itis browser-based, so usability and maintainability will be important.
◗ Software to launch an innovative new product and achieve “first-mover” advantage—marketing may produce a high initial demandand a new user group so stress and usability will be important.
We might believe that in a perfect world we would have no constraints,but this is not reality. For most commercial organizations, it would beunnecessarily expensive to have all the attributes “at 100%.” Usually, thecustomer is best served by balancing the quality viewpoints. This meansplanning to deliver some attributes at a lower standard than what would beachievable in a perfect model. This is necessary to avoid sacrificing the non-product quality viewpoints. In our project, which of security, performance, reli-ability, and so on are most important to us? What are we prepared to investin this software? The quality we want to build into the product and the proj-ect is a negotiated compromise. In practice, this comes down to identifyingthe greatest number or level of attributes (product-based quality) that:
◗ We can deliver (we have constraints of money, time, resources, andskills);
◗ To support the users’ tasks (user-based quality);
◗ While giving best cost–benefit ratio (value-based quality);
◗ While following repeatable/quality assured processes within a managedproject with minimized defects (manufacturing-based quality).
The balance that we want to achieve between the quality viewpoints isdefined, then formalized in the acceptance criteria that we set for the func-tional and nonfunctional attributes of the software product and project
176 Start-Up for a Software-Development Project

deliverables (for example, specifications). Our acceptance criteria will pre-vent conflicts between stakeholders, provide guidance on how we developthe software, and mitigate against failing to meet the customer group’sexpectations.
Customers can find nonfunctional attributes difficult to conceptualize.As an example, in one project the customers had to set acceptance criteriafor performance and response time. Initially they considered 20 secondsresponse time to be acceptable, even short. It sounds short. It is short whenone is running for a train! However, the customers found it an unacceptabletime for a Web page to load from the corporate intranet when they saw it live.The builders and supporters must be very proactive in helping the businessdefine the nonfunctional acceptance criteria. Something that helped in theexample above was a performance prototype; one of the team simply stoppedthe meeting for 20 seconds, allowing no speaking, no writing, and no move-ment, to demonstrate “what 20 seconds really feels like.” You could alsobuild prototypes and scenarios to help develop availability requirements andacceptance criteria.
Package vendors should note that customers often make purchasesbased on nonfunctional attributes, where functionality is similar in differ-ent products. Poor nonfunctional attributes may mean a product will berejected [25]. Part of the market and other research for the project shouldexplore this, with acceptance criteria set by the help-desk, support, sales,and marketing teams. Because the attributes are not described in the stan-dard in everyday language, it can be useful to translate them into question-naires, as suggested by Trienekens and van Veenendaal [26]. For example,asking “Have you an alternative way of carrying out your task if the soft-ware is not available?” provides an insight into reliability acceptance crite-ria. The weighting of replies for all the questions gives the priorities foracceptance [27].
The team should agree on the priority for the system attributes, becausethe most important attributes will be the focus for designing what is built. Ifthe team then cannot set SMART acceptance criteria for the high-priorityattributes, or cannot agree on the priority, try some prototyping to help gen-erate ideas. Acceptance criteria should include the measurement of indica-tors. Indicators (for example, “percentage increase in market share”) aremeasured after the project completes, so acceptance criteria should showwhich attributes contribute to the aims and, hence, to the indicators.
9.4.5.4 Outline plan
Once the aims and objectives, constraints and acceptance criteria have beenagreed on, we can build an outline plan, based on the prototype plans webuilt before. The reason for doing this is to examine whether it is reasonableto provide a solution within the constraints that meets the aims, objectives,and acceptance criteria. This plan is unlikely to be very accurate or precise;expect to see “ball park” figures, and an allowance for replanning duringany project.
9.4 Start-up—typical activities 177

9.4.5.5 Reviewing the contract
Any contract for further work should be reviewed by walkthrough, forunderstanding, and then by an inspection or similar review to identifydefects. Whereas the walkthrough is mainly for sharing information andunderstanding, the inspection is a review that is focused on finding defects(see Table 9.5 and Appendix A) so both are needed to ensure we have theright contract. Each group will bring a different perspective to the review(Table 9.10). Note that a joint customer/supplier contract review is a require-ment of ISO 9000, because the contract is the agreement and commitment tothe work. It is important that the acceptance criteria for the software arereviewed, both for SMARTness and against the constraints, aims, objectives,targets, and indicators. Use a peer review or an inspection (Table 9.5 and [2,17]), and ensure that each quality view is covered in the review. If the teamcannot set, review, and agree on the contract including the acceptance crite-ria at least at a high level, then it is too soon to set the contract.
9.5 Exit from start-up stageThe exit from start-up happens either because we have decided to do noth-ing, or because we have a contract for further work. Examples of exitcriteria are shown in Table 9.11. The specific exit criteria you use willdepend on your organization. You may be feeding into some other planningprocess at this stage or you may go straight into a project, for examplean SDLC. In some organizations, additional planning and authorization isrequired depending on the likely cost or risks of a proposed project.
Different organizations use different document names depending on theproject management process. You may see the exit decision in a documentcalled any of project idea form, project mandate, initiation document, projectapproach, or authorization to proceed. The important point is that it shoulddocument or refer to the output from all the steps covered in this chapter.
In this chapter, I have shown you some techniques that help you decidewhether you need a SDLC and how to improve the contract for the work.
178 Start-Up for a Software-Development Project
Table 9.10 Review Perspectives at Exit from Start-Up
Group Quality Risks Constraints
Aims, Objectives,Targets,Indicators, AcceptanceCriteria, Outline Plan
Customer User Impact onorganization
Business, service level,time, cost
Realistic, time-bound
Managers Value Impact on otherprojects
Cost, time, skills,resources
Realistic, time-bound
Builder Manufacturing,product
Likelihood—technical
Technical skills,knowledge, infrastructure
Achievable, realistic
Measurers Product,manufacturing
Likelihood—previousfailures, predictions
Technical skills,knowledge, infrastructure
Specific, measurable
Supporters User, product Impact onexisting systems
Technical skills,knowledge, infrastructure
Achievable, realistic

These techniques were summarized in Table 9.5. In the next chapter, I willdescribe the SDLC.
References
[1] Smith, K., “The Software Industry’s Bug Problem,” Quality Digest, 2003;reproduced on http://www.qualitydigest.com, April 2003.
[2] Gilb, T., and D. Graham, Software Inspection, Reading, MA: Addison-Wesley,1993.
[3] Schein, E. H., Process Consulting, Vol. 1: Its Role in Organizational Development,Reading, MA: Addison-Wesley, 1988.
[4] TQMI, Problem Solving—Tools and Techniques, Frodsham, England: TQMI, 2001.
[5] Robson, M., Problem Solving in Groups, Aldershot, England: Gower, 1995.
[6] IEEE 1028™ Standard for Software Reviews, 1997.
[7] de Bono, E., Six Thinking Hats®, New York: Penguin, 1999.
[8] Evans, I., “The Troubled Project—Best Practice from Theory to Reality,”EuroSTAR Conference, 2001.
[9] Hohmann, L., “Lo-Fi GUI Design,” Software Testing and Quality Engineering, 1, 5,24–29, September 1999.
[10] Nance, R. E., and J. D. Arthur, Managing Software Quality, New York: Springer-Verlag, 2002.
[11] Freeburn, G., “Mind Mapping 101 for Testers,” EuroSTAR Conference, 2002.
[12] Buzan, T., The Mind Map Book, London, England: BBC Consumer Publishing,2003.
9.5 Exit from start-up stage 179
Table 9.11 Example of Exit Criteria for Start-Up Stage
Example Exit CriteriaExample Deliverables Documented,Reviewed, and Agreed Upon Example Authorization Owners
1. “Understanding theproblem/idea” step complete
Problem statement, prototypeassessments
Joint sign-off by representatives ofall groups
2. “Decide whether problem/idea isworth solving” step complete
Problem assessment, cost–benefitanalysis, risk assessment
Joint sign-off by representatives ofall groups
3. “General constraints andparameters” step complete
Project proposal/brief Joint sign-off by representatives ofall groups
4. “Agree on next stage” stepcomplete
Aims and objectives, constraints,acceptance criteria, outline plan
Joint sign-off by representatives ofall groups
5. Criteria 1, 2, 3, 4 complete withdecision to do nothing
Entry in suggestion scheme log Process owner
6. Criteria 1, 2, 3, 4 complete withhigh-level contract for SDLC
Project mandate Process owner
7. Criteria 1, 2, 3, 4 complete withauthorization for system change
Initiation document Process owner
8. Criteria 1, 2, 3, 4 complete withauthorization for nonsoftware solution
Project idea form Process owner

[13] “Drawing Concerns: A Structured Rich Picturing Approach,” http://business.unisa.edu.au/cobar/documents/richpic_colin.pdf, November 2003.
[14] Belbin Associates, “Belbin Team Roles,” http://www.belbin.com/belbin-team-roles.htm, October 2003.
[15] Team Technology Web site, “The Mother of Strategic Systems Issues:Personality,” http://www.teamtechnology.co.uk/tt/t-articl/news1.htm, October2003.
[16] Honey, P., “Learning Styles,” http://www.peterhoney.co.uk/product/learningstyles, October 2003. PeterHoney.com, 10 Linden Avenue,Maidenhead, Berks, SL6 6HB. Tel.: 01628633946. Fax: 01628633262. E-mail:[email protected].
[17] McHale, J., “Innovators Rule OK—Or Do They?” Training & Development, October1986; reproduced on http://www.kaicentre.com/, July 2003.
[18] Johnson, R., “Somebody’s Watching You” Sunday Times, May 11, 2003.
[19] European Foundation for Quality Management, “EFQM Excellence Model,”http://www.efqm.org, August 2003.
[20] IT Infrastructure Library, Best Practice for Service Delivery, London, England: ITInfrastructure Library, OGC/TSO, 2001.
[21] IT Infrastructure Library, Best Practice for Service Support, London, England: ITInfrastructure Library, OGC/TSO, 2002.
[22] Humphrey, W., Introduction to the Personal Software Process, Reading, MA: SEI,1997.
[23] Humphrey, W., Introduction to the Team Software Process, Reading, MA: SEI, 2000.
[24] International Standards Organization/International Electrotechnical Commis-sion (ISO/IEC), DTR 9126, Software Engineering—Software Product Quality(Parts 1–4, 2000/2001).
[25] Watkins, J., “How to Set Up and Operate a Usability Laboratory,” EuroSTARConference, 2002.
[26] Trienkekens, J. J. M., and E. P. W. M. van Veenendaal, Software Quality from aBusiness Perspective, Dordrecht, the Netherlands: Kluwer Bedrijfsinformatie, 1997.
[27] Hendriks, R., E. van Veenendaal, and R. van Vonderen, “Measuring SoftwareQuality,” in E. van Veenendaal, The Testing Practitioner, Den Bosch, theNetherlands: Uitgeverig Tutein Nolthenius, 2002, pp. 81–92.
Selected bibliography
Belbin, R. M., Management Teams–Why They Succeed or Fail, London, England:Butterworth Heinemann, 1981.
Boehm, B. W., Software Engineering Economics, Englewood Cliffs, NJ: Prentice-Hall, 1981.
Obeng, E., “Helping Stakeholders to Understand Requirements,” Project ManagerToday, July 2003, pp. 14–17.
180 Start-Up for a Software-Development Project

Software-Development LifeCycle
In this chapter I shall:
◗ Describe the entry criteria, steps, and exit criteria for theSDLC;
◗ Outline and compare several approaches for the SDLC, espe-cially for readers who are not software specialists;
◗ Identify the quality definitions from Chapter 1, which prevailat this stage;
◗ Identify how each of the groups identified in Chapter 2become involved at this stage;
◗ Identify techniques that improve teamwork during the SDLC.
The users are moaning about the software; they say it is doing the
wrong thing, but it is functioning according to the specification.
When I saw the bug report, I marked it “Not a bug.” They’re just
wasting my time!
—Irate builder, trying to get on with work
What do you mean it was not in the specification? You people
wrote the specification. It’s not my fault if you didn’t keep it up to
date!
—Irate customer trying to use the software
10.1 Software-development lifecycle—descriptionThe builders and customers are at loggerheads. Although thebuilders have developed what was specified, that is not whatthe customer really needs. Both are right from their own pointof view, but they need a way to understand each other betterin order that the customer’s expectations meet the builder’s
181
10Contents
10.1 Software-development life10.1 cycle—description
10.2 SDLC viewpoints
10.3 Entry criteria for SDLC
10.4 SDLC—typical activities
10.5 Entry and exit points10.1 within the SDLC
10.6 SDLC models
10.7 Quality views and the10.1 models—why we might10.1 wish to combine models
10.8 Exit from the SDLC
10.9 Conclusion
C H A P T E R

delivery. The project of building a software system to deliver to a customeris controlled via a software-development life cycle (SDLC). Some SDLCs areformally defined within methodologies. Others are informal but under-stood by those who use them—“We always do it this way.” Regardless ofthe formality of the definition, all SDLCs are intended to deliver what thecustomer requires and to avoid the problems of our irate builder andcustomer.
In this chapter, I will compare models to see how well they do this. I willshow you how the models used for the SDLC include detailed specificationof what is needed, design of the solution, and the building and testing ofproducts that will deliver what is needed.
In Figure 10.1, we see that the SDLC sits in the software lifespan between start-up (covered in Chapter 9) and delivery (covered inChapter 11). During start-up, we identified a problem or idea, investigatedit, and decided it was worth building a software solution, so we set a formalor informal contract of work for the SDLC. At the end of the SDLC, if we aresuccessful, the software is delivered. It will be used postdelivery, as it ismaintained and supported for the rest of its life span. The SDLC is not build-ing to the moment of delivery, but to postdelivery when the software isused.
10.1.1 Types of software acquisition project
The purpose of an SDLC is to provide a software solution to help the cus-tomers solve the problems identified during start-up. The acquisition of thesoftware to resolve a particular problem might be achieved in several ways,for example:
◗ Custom-made system: The whole software system is designed and builtto meet a specific customer’s requirements; the customer may chooseto have the software built by a third-party supplier, that is, anotherorganization, or to use an in-house development team consisting ofby people who work for the customer’s organization.
◗ COTS system: The customer buys a commercial off-the-shelf (COTS) sys-tem or package, sometime referred to as shrink-wrapped software,from a package vendor (a third party who sells COTS packages).
◗ Tailored package: The customer buys a package, but has some tailoringdone to it by the supplier; these are changes made to meet specificrequirements of the customers.
Any of these would be covered by an SDLC, but the customers will havemore or less control over the detailed content of the software depending onthe type of system chosen.
The customer may also decide to resolve their problem by requesting achange to an existing system. We will cover these maintenance changes inChapter 12, but it is worth remarking that the same activities as in an SDLC
182 Software-Development Life Cycle

would take place in a maintenance change. The specification, design, build,and test of the change may be quite small activities, or may be equivalent toan SDLC, and, indeed, use the same life cycle model up to the point ofdelivery.
10.1.2 Identifying the software products
Remember that this is not just code being built by developers; people willalso be busy designing, building, and testing training, documentation, andsupport materials. If the software being developed is a package for commer-cial sale, the support material may include sales and marketing material. Foran in-house business system, it may include business process manuals.These are all part of the delivered product. When I talk about “software” or“product,” I mean all of these types of deliverables. The media of deliverymight be electronic, paper, on a microchip, or by semaphore signals; it doesnot matter.
10.1.3 SDLC task summary
There are several different life-cycle models for software development. Inthis chapter, we are interested in how the SDLC models help us achievesoftware quality, so rather than describing them fully, I am only going tooutline them and give references to further information. The life-cycle mod-els have changed over time to reflect the changes in customer group prob-lems, perceptions of quality, and technologies available. Generally theyhave been described as development life cycles, but some of them include ormay be adapted to maintenance activities. They have a number of steps incommon. In some of the models we will see that these are performed onceand in others some or all the steps are repeated or broken down into sub-steps. Put very simply, the fundamental steps are:
◗ Planning and monitoring—we plan what we will do and when we willdo it, then track progress against our plan.
◗ Managing change—the real world will change around the SDLC and thedeliverables required from the SDLC may need to change to reflectreality.
10.1 Software-development life cycle—description 183
S = Start-upSDLC = Software development life cycleD = DeliveryPD = Postdelivery
S
PD
D
SDLC
Figure 10.1 Life span stage diagram.

◗ Requirements—we make a detailed description of what we want.
◗ Design—we design the solution, including the software to meet therequirements.
◗ Build—we build the software based on the designs.
◗ Testing—we test to make sure that the software functions properly.
10.2 SDLC viewpointsJust as we saw in Chapter 9 that start-up fails if the right people are notinvolved, during the SDLC we can have problems if we do not make surethat we take account of all viewpoints throughout the project. Sometimes,the customers set the contract, order the software, and then leave the man-agers, builders, and measurers to get on with it: “It’s obvious what we want!Just do it!” This means that the customers are not involved in the SDLC.Similarly, the supporters may not be involved in the SDLC, only being“invited to the party” at delivery. If this happens, it limits the quality view-points (see Table 10.1, the definitions in Chapter 1, and assignment togroups in Chapter 2).
We saw in Chapter 2 that the builders and measurers tend to focus onmanufacturing and product quality, rather than value or user quality. Themanufacturing viewpoint focuses on delivering to specification and remov-ing defects (differences between the product and its specification). The prod-uct viewpoint focuses on attributes such as functionality, performance, andsecurity: how they are specified and built. Some builders and measur-ers, especially user-acceptance testers, do empathize with the user view,adopting a “fit-for-purpose” approach, but often these are people who areinvolved late in the SDLC, sometimes too late to influence design decisions.
Both builders and measurers hold a transcendent viewpoint (“In myheart I know what is right”) that pursues technical excellence or achievingzero defects in software rather than cost-effectiveness or value. One col-league, an excellent tester, said to me when we discussed the value view-point, “But we must not sacrifice quality to cost.” He was forgetting thatalthough his manufacturing definition of quality focuses on removingdefects, in the value view, keeping within costs is a major contributor toquality.
184 Software-Development Life Cycle
Table 10.1 Views of Quality During SDLC—Simple
Group
Quality View Builder Measurer
Transcendent view ✓ ✓
User view (✓ can be late in SDLC)
Value view
Product view ✓ ✓
Manufacturing view ✓ ✓
✓ is a primary quality view.(✓ ) is a quality view that may be taken by some people in this group.

When delivery takes place, the user and value viewpoints will prevail.The builders and measurers feel pleased that they have delivered to specifi-cation, and are then stunned to find the system rejected or criticized. Per-haps the specification was wrong, misinterpreted, or out of date. Perhaps anoverambitious solution had been built, which means that the software hascost more or taken longer than budgeted. The customers, managers, andsupporters turn on the others: “How could they have been so careless andextravagant?” The builders and measurers retaliate: “If you hadn’t keptchanging your minds…,” and so on.
Much of this can be avoided by a careful start-up (see Chapter 9) butduring the project some things will change (see Table 10.2 for examples)and unless all the groups are represented on the project, the SDLC may pro-ceed without allowing for changes that will be necessary during the SDLC.We can deal with change in the SDLC provided we acknowledge that it isgoing to happen.
Getting everyone involved in the SDLC team will stop quality viewsbeing forgotten during the SDLC (Table 10.3) and will allow the changes inthe organization’s requirements to be reflected throughout the SDLC.
10.2 SDLC viewpoints 185
Table 10.2 Examples of Changes During the SDLC
Real-world changes The customers’ needs, hence the requirements for the software, will change toreflect their changing environment. These might be changes in themarketplace within which an organization operates, or legislative changes thataffect how an organization may operate. If the SDLC team are not aware ofthese changes they will deliver unwanted software. As an example, theMcCartney report [1] cites a project at an insurance company in the UnitedStates. By the time the project was finished, the company no longer sold theproduct to be supported by the software being delivered.
IT infrastructure changes The hardware/network/system on which the software will be used maychange, thus changing constraints and risks for the software. In one project Iworked on, performance was a critical risk, but a hardware upgrade changedthe performance constraints, thus changing the risk focus of the project fromperformance to other areas.
Existing systems (IT andbusiness) changes
The new system does not “plug in” as anticipated, either because the builderswere not aware of the detail of the IT environment and infrastructure orbecause it changed during the SDLC. The McCartney report [1] cites agovernment IT project in which changes to the existing systems during theSDLC made integration of the new system into the existing systems difficult.
Skills changes People with expertise may leave or join the organization or the project,changing the project’s capabilities and thus what could be delivered.
Leadership and organizationchanges
The organization’s priorities may change, so the project may become more orless critical than it was, perhaps meaning a change in timescale, budget,people, or resources.
Risk changes Risks change over time. One mistake project teams often make is to build arisk register at the start of the project and then never reassess the risks. Lowrisks at the start of a project may grow to come back and bite you later on:“Maybe the worst risk in a project is a lack of an ongoing risk assessment andrisk management process” (David Hayman, personal correspondence, March2003).
Errors made during start-up We may realize we have made some mistakes during start-up—we are onlyhuman and we may have missed something. Building the solution weintended may be harder than we thought, we may have misunderstood anaim, or we may realize that acceptance criteria cannot be met within targets.

10.3 Entry criteria for SDLC
10.3.1 Entry criteria following a detailed start-up
If we have done everything suggested in Chapter 9, we arrive at the start ofthe SDLC with a contract and additional information gathered duringstart-up, which should include:
◗ Problem/solution analysis—“What problem are we trying to solve?”
◗ Constraints analysis—“What financial, time, organizational, and tech-nical constraints do we have?”
◗ Cost–benefit analysis—“What benefits do we expect within ourbudget?”
◗ Risk analysis—“What is the likelihood that this will go wrong and theimpact if it does or if we do not do it?”
◗ Aims and objectives for the SDLC—“Why are we doing this? What dif-ference will this project make to the organization?”
◗ Targets and indicators—“How will we measure progress and whetherthe project has been worthwhile? Are we making a difference?”
◗ Acceptance criteria—“How will we know if we have succeeded?”
186 Software-Development Life Cycle
Table 10.3 Views of Quality During SDLC—Teamwork
Groups
Quality view Customer Manager Builder Measurer Supporter
Transcendent view ✓ ✓ ✓ ✓ ✓
User view ✓ (✓ ) ✓
Value view ✓
Product view ✓ ✓ ✓
Manufacturing view ✓ ✓
Table 10.4 Example Entry Criteria and Owners for SDLC
Example of Entry Criteria Example of Entry Documents Example of Authorization Owners
1. All start-up stepscomplete, deliverablesdocumented, reviewed,agreed on, and signed off
Problem statement, prototype assessments,problem assessment, cost–benefit analysis, riskassessment, project proposal/brief, aims andobjectives, targets and indicators, constraints,acceptance criteria, outline plan
SDLC project sponsor, processowner, project manager
2. Contract reviewed,agreed, and authorized
Documents from (1) completed, contractchecklist completed, all documents received
Project manager
3. System changeauthorized
Documents from (1) completed and received,change mandate signed
IT support manager
4. Process changeauthorized
Documents from (1) completed and received,change mandate signed
Process owner

When we check the entry criteria for the SDLC, we should see all of thisinformation in the contract and associated documents. Table 10.4 showssome simple examples of entry criteria for different projects. You may callsome of these things slightly different names in your organization; that doesnot matter, as long as you have the information indicated.
10.3.2 When no entry criteria have been defined
If no entry criteria have been defined for an SDLC in your organization, youmay find that you start work without all the information you need. In thissituation, for your current project, whatever its size or status, I would rec-ommend that you try to document something to describe the entry into theSDLC, even on the smallest SDLC. The virtue lies not in the size of the docu-mentation, but in its clear content. At a minimum, take an approach of “onone page” to see if you can capture the essence of the problem in a checklistform like the one in Table 10.5 to give you a basic set of entry criteria. Usethe checklist to see which areas you need to investigate more fully; forexample, do you have clear acceptance criteria and constraints?
To prevent this problem from recurring, improve the SDLC model that isused in your organization by adding entry criteria to the model.
10.3.3 When entry criteria have not been met
Strictly, if the entry criteria have not been met, we must not start the SDLC.In order that we can be strict, it is important that the entry criteria are:
10.3 Entry criteria for SDLC 187
Table 10.5 Checklist of Entry Criteria Form for a Small SDLC
Project name, date of form completion
Problem/solution analysis—Do we understand what problem are we trying to solve? Is that understandingshared by all parties?
Problem statement:
Constraints analysis—Have the financial, time, organizational, and technical constraints been defined andagreed on?
Constraints statement:
Cost–benefit analysis—Do we understand our expected benefits within our budget?
Cost–benefit statement:
Risk analysis—Have we analyzed the likelihood that this will go wrong and the impact if it does or if we donot do it?
Likelihood:
Impact of doing it wrong:
Impact of not doing it:
Aims and objectives for the SDLC—Do we understand why are we doing this? What difference will thisproject make to the organization? How will we measure progress against the aims and objectives?
Aim and objectives of the SDLC:
Targets and indicators of success:
Acceptance criteria—How will we know if we have succeeded?
Agreement
Signed
Date
Customer Builder Manager Measurer Supporter

◗ Objective;
◗ Defined in a way that is SMART (specific, measurable, achievable, real-istic, and time-bound);
◗ Necessary rather than simply desirable.
However, there are occasions when we might decide to waive the entrycriteria. This may happen if we decide that the entry criteria are excessiveor incorrect, or if we believe we are faced with an emergency. There arealso occasions when we may wish to increase the entry criteria, for exam-ple, if we see that the SDLC is at a higher risk than our normal projects.
10.3.3.1 We decide the entry criteria are excessive or incorrect
If the entry criteria include items that are desirable rather than necessary,we may wish to redefine them. This requires careful thought; if you do nothave all the entry documents or you do not have an authorization to start,what risks are you taking? If the decision is made to bypass or reducethe entry criteria, do we understand the risks we are taking? Is the riskacceptable? I would recommend that you document the reason for decidingthat the entry criteria can be reduced or ignored, as part of your proj-ect documentation. This might be in the quality plan, which typicallydocuments the quality gates for a project. If the defined entry criteria areincorrect, we should redocument them, again with an explanation, and,if possible, suggest a process improvement that would prevent us frommaking the same mistake again. Use the checklist in Table 10.5 to help youdo this.
10.3.3.2 It’s an emergency
As we saw in Chapter 1, in CMM [2] one of the differences between high-maturity and low-maturity organizations is how the organization reacts tochange or crisis. A high-maturity organization holds onto processes duringchange and crisis, as this helps to manage the problems. A low-maturityorganization will discard the processes during emergencies, believing thatthey add bureaucracy rather than value. This is counterproductive, espe-cially with the entry into an SDLC. The processes should be defined at a suit-able level of control without unnecessary bureaucracy; if a metric or a pieceof paperwork does not facilitate control, do not have it in the process. With-out clear constraints and acceptance criteria, it is difficult to know when tostop work in the SDLC; we have nothing on which to base our exit criteria.In an emergency, this means that we may forget to do something vital. Iwould recommend that an emergency request still goes through entry crite-ria, because in an emergency we need processes to support our decisions;we are more likely to make mistakes if we are doing something in a hurry.Some organizations define an emergency SDLC, which encapsulates thespirit of the controls on a single checklist. This can be a useful approach.
188 Software-Development Life Cycle

10.3.3.3 We decide the entry criteria are insufficient
If we perceive high risk in the SDLC, we may decide that the defined entrycriteria are not stringent enough. In this case, we should add additional cri-teria, or increase the “pass level” for the entry criteria. We can do this if weallow tailored entry criteria.
10.3.4 Tailoring entry criteria
In several organizations I have observed, project managers have available anumber of agreed-on SDLC templates, and they select an SDLC with suit-able entry criteria, to meet the specific risk levels for their own projects.Suppose that a particular organization decides on the stringency of the entrycriteria for an SDLC based on three factors, the estimated cost of the work,the estimated size in days, and the perceived risk. Each factor is assessed ona score of 1 (low) to 3 (high). The factor scores are multiplied together togive an overall score that will be between 1 (1 · 1 · 1) and 27 (3 · 3 · 3). Thescore is used to pick entry criteria levels from a list like the one in Table 10.6.
10.3 Entry criteria for SDLC 189
Table 10.6 Example Tailored Entry Criteria
Cost · Size · Risk
Score
Example Entry Criteria
Example entry documents Example authorization owners
1–5 1. E-mail with request for change from customer, copied tomanager, builder, measurer, and supporter
2. Entry checklist in Table 10.5 completed
Deliverables: E-mail and acknowledgment, entry checklistin Table 10.5
Customer,
builder
6–12 1. As above, plus
2. Request raised at monthly change planning meeting
3. Additional problem statement/assessment, constraints,acceptance criteria documentation completed
Deliverables: As above, plus additional notes on problemstatement/assessment, constraints, acceptance criteria
Customer,
process owner,
builder,
manager
12–20 1. As above, plus
2. Acceptance criteria prioritized and documented withmetrics from ISO 9126
3. Solution prototyping
Deliverables: As above, plus additional work on cost–benefitanalysis, constraints, acceptance criteria documentation
Customer, processowner, project manager
20–27 1. As above, plus
2. Additional risk management planning carried out byprocess owner and project manager
3. Project authorization board has discussed and agreed tothe change and risk plan
Deliverables: As above, plus additional work on problemstatement, prototype assessments, problem assessment,cost–benefit analysis, risk assessment, project proposal/brief,aims and objectives, targets and indicators, constraints,acceptance criteria, outline plan, project authorization
Project authorization board,project sponsor, processowner, project manager

10.3.5 When no start-up stage took place
It may well be that you are at the start of an SDLC, or even partway throughit, and you do not have a detailed start-up as described in Chapter 9. Whatdo you do?
◗ Start of SDLC—Large: If you are at the start of a large or high-riskSDLC, I would recommend that you carry out the activities in Chapter9 before proceeding, in order that you can plan the SDLC.
◗ Start of SDLC—Small: If you are at the start of or working on a very smallSDLC, you may feel you do not need formal documented entry deliver-ables, but you will need the information content of the deliverables,documented or in the team’s heads. You will need this to plan the proj-ect, and to control it, especially when the going gets tough. Use thechecklist in Table 10.5 to help you decide whether you have enoughinformation, or whether you should investigate fully.
◗ Midway through SDLC: If you are midway through an SDLC as you readthis, you may be wondering how to apply these ideas: “Shouldn’t thecustomer and manager have sorted this out when the contract wassigned?” Yes, perhaps so, but if they have not, or if the informationyou have is not full enough, you may have to revisit the start-upactivities. You will need acceptance criteria in order to understand ifthe software is ready for delivery, for example, and you will certainlyneed to know your constraints. Use the checklist in Table 10.5 to helpyou decide what you need to find out, in order to complete the project.
10.4 SDLC—typical activities
10.4.1 Planning and monitoring
It is essential to have a plan for the SDLC. The plan must be based on theinformation identified during start-up. For most organizations, there will beconstraints on cost, time, resources, and skills; we will not have an infinitebudget. The acceptance criteria identified at start-up need to be met withinthe constraints.
The entry criteria give us enough information to start planning. The planneeds to describe how the SDLC will deliver within the constraints, meetingthe acceptance criteria and containing the risks, to meet the aims of theproject. We will also need to break down the plan into smaller, moredetailed plans (bite-sized chunks). One project manager I know assignsresponsibility for detailed planning of each chunk to people within the teamsaying, “Tell me how you will deliver what you need to do within thistimescale.” This is very effective as it allows each team within the project tounderstand their constraints and to own their own plan.
Once the plan is put together, it needs to be reviewed and agreed on. TheTeam Software Process (TSP) [3] recommends a “launch” at the start of the
190 Software-Development Life Cycle

SDLC, where the team goes through the plan and commits to it. A sharedplanning process followed by a launch meeting allows people to discuss theplan, share causes for optimism and pessimism, understand each other, andso commit to the plan and the SDLC team wholeheartedly.
The plan is used throughout the SDLC to track, measure, and controlprogress. We inevitably replan during the SDLC as we learn more; it isworth designing replan points into the SDLC and acknowledging those inthe contract of work.
Planning and control need to take place at different levels of detail fordifferent people; we need to understand what we do today to be on time atthe end of this week for our team, in order to meet that major projectmilestone in three months. This will match with reporting requirementsbetween the groups, as we saw in Chapters 3 to 7. Managers carry out plan-ning and control with the help of builders, measurers, customers, and sup-porters. We saw in Chapter 4 that this is needed on a day-to-day basis sothat we manage our time to complete tasks today that contribute to meetingan end date months away. We also saw how dependencies between tasksmean they may be on the critical path—if they are not completed on time,then the whole project becomes late. The plan will need to be reviewed; allthe groups need to agree that it is a plan to which they can deliver. In par-ticular, there will be intergroup dependencies on the plan—everyone needsto understand and commit to these.
10.4.2 Managing change
During the SDLC, things will change and this will affect the plan and all theactivities of the SDLC. One project manager I know regards his plan as “Abasis for making changes”; he says “The plan is a description of what will nothappen in the future.” We saw in Section 10.2 that we will have to dealwith changes in circumstance during the SDLC. These types of changes willaffect the SDLC in different ways.
We will see later in this chapter that some of the SDLC models aremore amenable to managing change than others, but here let us considerwhich SDLC activities are particularly affected by different types of change.Table 10.7 shows the most affected areas for each type of change. Thechanges may affect any of the activities; for example, the plan may be
10.4 SDLC—typical activities 191
Table 10.7 Example of SDLC Activities Affected by Example Change Type
SDLC Activity
Most Affected Areas
Plan Requirements Design Build Test
Real-world changes ✓ ✓ ✓
IT infrastructure changes ✓ ✓ ✓
Existing systems (IT and business) changes ✓ ✓ ✓
Skills changes ✓ ✓ ✓ ✓
Leadership and organization changes ✓ ✓
Risk changes ✓ ✓
Errors made during start-up ✓ ✓ ✓ ✓ ✓

affected by any of the changes, and leadership changes may affect any of theareas, but in the table I have indicated the most immediate effects. Some ofthese cause a chain reaction; we can see that real-world changes may affectthe customers’ requirements; if these change, then the design, build, andtest of the software will also change. Changes to risk will affect the plan andspecifically will affect the focus for testing.
If the SDLC model we choose is very rigid, then, superficially, it canappear easier to plan and manage it. However, the rigidity in the SDLC andthe contractual arrangements around it make it very difficult to allowchanges, whether these have arisen from errors we have made or from realchanges in circumstances around the SDLC. This means we are in danger ofdelivering the wrong solution. We might deliver the wrong product attrib-utes, or deliver solutions with manufacturing defects, at reduced value tothe organization, with reduced usefulness, damaging attitudes to the teamor the chosen solution.
A more flexible SDLC model, designed to allow for change, removes theproblem of rigidity in the solution, but is more difficult to manage becauseeveryone (customer, manager, builder, measurer, and supporter) needs toallow for uncertainty and change in the plans. For example, in the TSP [3],Watts Humphrey suggests a multiphase approach with a “relaunch” meet-ing for the team at the start of each phase.
10.4.3 Requirements
Some statement of the customers’ requirements is needed. The supportersand the managers will also have requirements. The basis of these is the prob-lem/solution analysis and the acceptance criteria defined at start-up. Duringrequirements definition these are explored in much greater depth. Thebuilders will document the requirements; often, this will be done by special-ists in analysis. The customers, managers, and supporters all contribute tothe acceptance criteria and hence to the requirements (see Chapter 9). Therequirements will need to be reviewed. The customers, managers, and sup-porters will need to review that the builders have a correct understanding ofthe requirements. The builders, who have not directly been involved inrequirements gathering need to know that the requirements have beendefined in a way that allow them to design and build the software. The meas-urers, including testers, want to know that the requirements are testable;that it will be possible to measure whether the requirements have been met.The requirements will include:
◗ Software/system requirements;
◗ Infrastructure, operational, and support requirements;
◗ Training requirements (for software, support and business processes);
◗ Documentation requirements (for software, support, and businessprocesses);
◗ Business process requirements (manual processes, for example);
192 Software-Development Life Cycle
◗ Implementation requirements (for example, media, time constraints,phased or big bang, ability to roll back) [4];
◗ Data transfer requirements; for a data migration this might includethe contents of databases and standing.
All of these will be needed for the solution to be implemented.
10.4.4 Design
The solution will need to be designed. The design is based on the require-ments. Some life cycle models divide this into several design areas. You willfind that different models and methods have different names for the designstages, but there are three main design steps. An overall business-processdesign looks at the processes within which the customers will use the sys-tem, and would include design of training, documentation, and businessprocesses. System architecture is the design of the overall software system.A detailed technical design covers the design of individual programs withinthe software. In this chapter, for ease of explanation, I have grouped thesetogether as design. Builders will carry out and document the design. Thesedesigns will need to be reviewed. The supporters’ acceptance criteria directlyaffect the design, for example, for performance, memory management, andmaintainability requirements (see Chapter 9), and so they will want toreview those designs. Customers may become involved in reviewing screenand report designs, both functionally and for usability. Builders need toknow they will be able to build the software from the designs. Measurerswant to know that the designs are testable; that it will be possible tomeasure whether the design goals have been met. Managers will want toreview the designs for cost-effectiveness and value, for example, reductionin future maintenance costs.
The design will include:
◗ Software/system;
◗ Infrastructure, operational, and support processes and equipment;
◗ Training (for software, support, and business processes);
◗ Documentation (for software, support, and business processes);
◗ Business processes (manual processes, for example);
◗ Implementation processes, including rollout and rollback plans;
◗ Data conversion design.
10.4.5 Build
The solutions need to be built. What is built and how it is built is based onthe requirements and design. This includes writing code, but also building allthe other software products. Training material, user guides, business processmanuals, marketing material, and support manuals all need to be built.All these software products can be reviewed against acceptance criteria.
10.4 SDLC—typical activities 193

Supporters review the code and support material. Customers review train-ing, user, process, and marketing material. Measurers will review all the soft-ware products for testability and to prepare for testing. Managers will reviewprogress and costs. Builders will take part in those reviews, to cross-check thedifferent types of product and to check adherence to standards.
The build will include:
◗ Software/system;
◗ Infrastructure, operational, and support processes and equipment;
◗ Training (for software, support, and business processes);
◗ Documentation (for software, support, and business processes);
◗ Business processes (manual processes, for example);
◗ Implementation processes, including rollout and rollback plans;
◗ Data conversion software.
10.4.6 Testing
The software products need to be checked. As with design, there are severaltypes of testing, and they are named differently in different models and indifferent organizations. Typically, models allow for four levels of dynamictesting. This is testing where code is executed. The lowest level of dynamictesting is often called unit, program, component, or module testing; thebuilding blocks of the system are tested individually as they are built. Next,the building blocks are linked or integrated together, and the links aretested; typically, this is known as integration, link. or string testing. Thesetwo levels of testing will be based on the design and the code. Once all thebuilding blocks have been integrated together, system testing takes place;the system as a whole and the processes using it are exercised. This level oftesting is based on the requirements and the design. It may also be neces-sary to test how this system interacts with other systems. Finally, accep-tance testing takes place; this checks the system against the acceptancecriteria to decide whether it can be delivered. Various types of tests are runat each level, to check functional and nonfunctional attributes (see Chapter9). Specialist testers will be jumping up and down at this point and shout-ing, “Testing is not just done at the end of the SDLC!” That is absolutelytrue; we have opportunities to test statically as well. This is testing donewithout executing the code. It includes all the review activities we did dur-ing start-up, planning, review, design and build, plus static analysis, bywhich we examine the code for flaws without executing it. These are allmeasurement activities. As we saw in Chapter 6, people from any of thegroups may join the measurers group on a temporary basis. The test designsand the test results should be reviewed. The choice of people to carry outthe review depends on the level of testing; any of the groups might beinvolved.
Depending on the scope of the project, the test stages might includetesting of:
194 Software-Development Life Cycle

◗ Software/system (reviews of products, component, integration, sys-tem, and acceptance);
◗ Infrastructure, operational and support processes and equipment(reviews of products and operational acceptance);
◗ Training (reviews of products, trial runs, and walkthroughs);
◗ Documentation (reviews of products, trial runs, and walkthroughs);
◗ Business processes (review of products, walkthroughs, acceptancetesting);
◗ Implementation processes, including rollout and rollback plans (reviewof products, walkthroughs, acceptance testing);
◗ Data conversion process and software (conversion software testing,data checks, dry runs).
10.5 Entry and exit points within the SDLCThere are entry and exit points between the steps; sometimes, these arecalled quality or project gates. Depending on the SDLC model that the proj-ect uses, these may appear at different points. As we will see, some life-cyclemodels have a strict cutoff between steps. In others, steps are omitted,repeated, or overlapped. The strictness of the criteria depends on the leveland type of risk for the project as well as the skill set of the people on theteam. In some SDLC models, particular handover points are regarded withsignificance and very formal entry and exit points are used. These are some-times referred to as quality gates or project gates [1]. They are often usedwhere control of the work is handed from one team to another, to ensurethat all the deliverables have been handed over and are fit for purpose.
An example of a simple SDLC is found in Figure 10.2, showing theminor entry and exit points, indicated by an arrow between activity rectan-gles, and the major quality gates, indicated by the rounded rectangles. For asimple situation, if no training material, business processes, or infrastructurechanges are required, this may be enough. Figure 10.3 shows a moredetailed SDLC. Here the major quality gates are shown, and the activitiesbetween them explicitly include all the products and activities types, as wellas differentiation between possible exit routes—to deliver a product or can-cel the project, for example.
10.6 SDLC modelsPeople talk about big bang, phased, iterative, and incremental approaches,but not everyone uses the words in the same way. In what follows, I will usebuilding a model village as an analogy for how the terms are used in thedescriptions below. The steps taken in building this village are set in ital-ics. First, I will give an outline of the models, with the advantages and
10.5 Entry and exit points within the SDLC 195
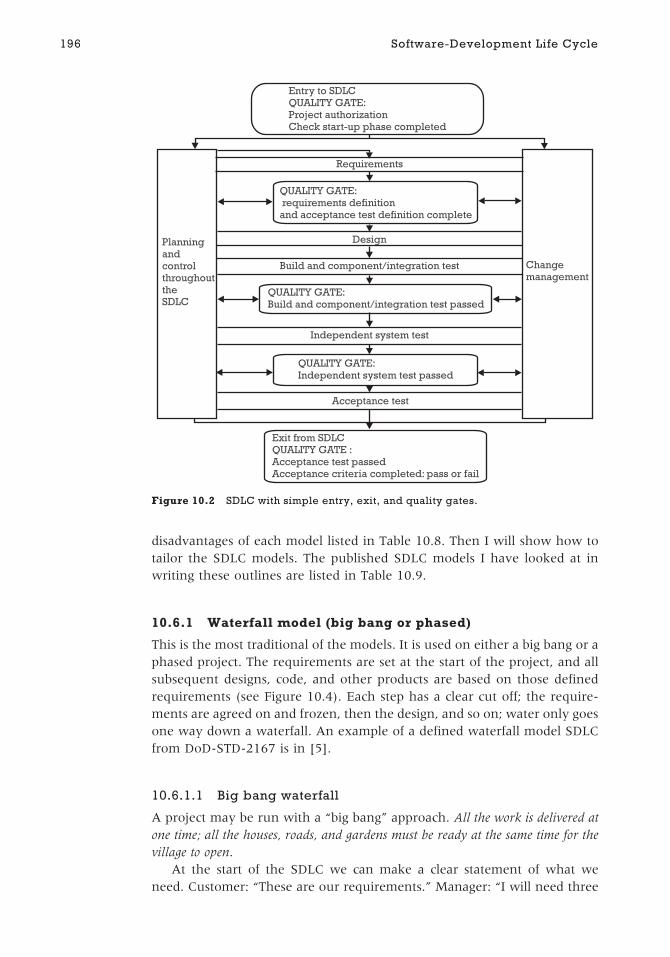
disadvantages of each model listed in Table 10.8. Then I will show how totailor the SDLC models. The published SDLC models I have looked at inwriting these outlines are listed in Table 10.9.
10.6.1 Waterfall model (big bang or phased)
This is the most traditional of the models. It is used on either a big bang or aphased project. The requirements are set at the start of the project, and allsubsequent designs, code, and other products are based on those definedrequirements (see Figure 10.4). Each step has a clear cut off; the require-ments are agreed on and frozen, then the design, and so on; water only goesone way down a waterfall. An example of a defined waterfall model SDLCfrom DoD-STD-2167 is in [5].
10.6.1.1 Big bang waterfall
A project may be run with a “big bang” approach. All the work is delivered atone time; all the houses, roads, and gardens must be ready at the same time for thevillage to open.
At the start of the SDLC we can make a clear statement of what weneed. Customer: “These are our requirements.” Manager: “I will need three
196 Software-Development Life Cycle
Changemanagement
PlanningandcontrolthroughouttheSDLC
Exit from SDLCQUALITY GATE :Acceptance test passedAcceptance criteria completed: pass or fail
Acceptance test
QUALITY GATE:Independent system test passed
Independent system test
QUALITY GATE:Build and component/integration test passed
Build and component/integration test
Design
QUALITY GATE:requirements definitionand acceptance test definition complete
Requirements
Entry to SDLCQUALITY GATE:Project authorizationCheck start-up phase completed
Figure 10.2 SDLC with simple entry, exit, and quality gates.

analysts for 6 weeks, then five designers for 10 weeks, then 15 programmersfor 10 weeks, then five testers for 6 weeks.” After the requirements sign-off,measurers, customers, and supporters do not become involved again untiltesting.
10.6.1.2 Phased waterfall
In a project that has a “phased” approach, the work is grouped into separatechunks and delivered at intervals perhaps by different teams. The village is
10.6 SDLC models 197
Delivery with noknown problems
Delivery withknown problem list
Cancel SDLC -No delivery
Exit from SDLCQUALITY GATE
Acceptance test passedAcceptance criteria completed: pass or fail
User and operational acceptance test, implementation rehearsals
QUALITY GATEIndependent system test passed
Independent system test
QUALITY GATEBuild complete
Test complete/passed, review complete/passed,test infrastructure ready
Pla
nn
ing
and
con
tro
l th
roug
ho
utth
eSD
LC
Ch
ang
em
anag
em
en
t
Prepare testinfrastructurefor system andacceptance test
Build andreview/test
Build andreview/test
Build andreview/test
Build andtest
Build andreview/test
Build andcomponent/integration test
System andintegrationtest definitions
Businessprocessdesign
Documentationdesign
Trainingdesign
Infrastructuredesign
Implementationdesign
Softwaredesign
QUALITY GATERequirements definition and acceptance test definition complete
Acceptancetest definition
Businessprocessrequirements
Documentationrequirements
Trainingrequirements
Infrastructurerequirements
Implementationrequirements
Softwarerequirements
Overall requirements
Entry to SDLCQUALITY GATEProject authorizationCheck start-up phase completed
Figure 10.3 SDLC with detailed entry, exit, and quality gates.

198 Software-Development Life Cycle
Table 10.8 Advantages and Disadvantages of the Models
Life Cycle Advantages Disadvantages
Waterfall—phasedor big bang
Clear-cut steps make project managementand resource management easier. Audittrail.
ISO 9000 compliant
One chance to get it right, mistakes inrequirements and design are not founduntil testing; costly to repair. Does notallow for changing requirements.
Incremental Enables larger problems to be tackled insmall chunks by one team.
Does not, unless combined with iterationor spiral or evolutionary, solve thewaterfall problems.
Iterative/spiral Allows for change and high customerinvolvement
Can be time-boxed (value view—cutlosses if not productive).
Some practitioners say it is easy tomanage time. Allows refinement of plansand ideas.
Testing earlier—faults found earlier. Doimportant areas first.
Time for test and regression test increases.Long time between start and going live.Some practitioners say not so clear-cut formanagement by stages, could be harder tocontrol time and costs, less clarity onmilestones.
Evolutionary As iterative/spiral, plus bite-sizedmilestones, short time between start andgoing live, deliver important areas first.
As iterative/spiral, plus risk of faults goinglive sooner if insufficient testing.
V-model Easy to manage; clear contract sign-offpoints, meets ISO 9000:1994. Test iscontinuous and cost-effective as defectsfound and fixed earlier.
Resourcing different, early weight to lifecycle can seem bureaucratic. Can feelcostly early in the life cycle.
Table 10.9 SDLC Models Referred to in This Chapter
Example of the SDLC Model Comment
Boehm’s Spiral Model [5, 6] Uses prototyping and replanning with reassessment of risksand constraints with each prototype.
Team Software Process (TSP) [3] Emphasis on clearly defined team roles and goals, checklists ofactivities, measurement, use of CMM Level 5 processes.Phased or iterative approach.
Giddings Domain-Dependent Life Cycle [5] Waterfall model with feedback loops, and experimentation orprototyping.
Rational Unified Process (RUP) [7] Based on the spiral model, uses iterations within increments,with testing happening throughout the SDLC. Emphasis ondefining, building, and testing the most important parts of thesoftware first.
eXtreme Programming (XP) [8] Incremental approach, relies on continuous (automated)testing by builders, on oral rather than writtencommunication, and close collaboration.
Dynamic Systems Development Method(DSDM) [9]
Phased or incremental approach, with strong emphasis onpeople, their skills, and their ability to work in teams.
Gilb’s Evolutionary Model [10] Incremental or phased approach with delivery at the end ofeach increment.
DOD-STD-2167 Model [5] Classic waterfall model.
V- and W-model [11, 12], Component TestProcess Life Cycle [13], STEP (SystematicTest and Evaluation Process) [11]
Life cycles that emphasize the place of and control of softwaretesting; these may be considered as fitting with the other lifecycles. In this chapter, I have concentrated on the V-modeland how it might fit in the SDLC models.

divided into four sectors (N, S, E, and W) that are worked on as separate projects. Thewhole of a sector is delivered together as one project, but each sector might be ready ona different date. It is possible to divide a waterfall style into phases, which runin parallel, provided that the work can be divided into distinct chunks, eachbeing smaller, more manageable miniprojects with its own team.
10.6.1.3 When to use the waterfall method
The waterfall is a good model to use if:
◗ The contract for the work is complete, correct, and unambiguous.
◗ The requirements and acceptance criteria are complete, correct, andunambiguous.
◗ The work can be completed within the constraints.
◗ No change is expected in the requirements or design—the customers’world is static.
◗ The problem and solution are well understood and clearly defined.
◗ No one is going to make mistakes in the requirements or design.
It is very rare (I am tempted to give a probability of approaching zero) forall these to be true for a software development; software is too complicated,the world is constantly changing, and people are fallible. We need some-thing better.
10.6.2 Spiral, incremental, and iterative models
There is a large family of incremental and iterative models that were devel-oped from the 1980s onwards as a response to the problems of the waterfallmodel. These include increments in miniwaterfalls and in iterative or spiralmodels, as well as evolutionary models.
10.6.2.1 Incremental
In an incremental project (Figure 10.5), the work is chunked in a differentway from a phased model. The work is divided into houses, roads, and gardens.The roads are put in place, then the houses, and, finally, the gardens. The
10.6 SDLC models 199
Live
Test
Build
Design
Requirements
Figure 10.4 Waterfall model—big bang.

incremental model is similar to the phased model, but one team can work on all theincrements, whereas in the phased model, separate teams deal with each phase inparallel. This approach is useful if:
◗ The problem is too large for the team to tackle at one time, so buildingin stages is sensible
◗ The solution must to “go live” all at once
10.6.2.2 Iterative and spiral models
In an iterative approach (see Figure 10.6), steps in the project are repeated(iterated) allowing work to be revisited and refined. The most important roads,with houses and gardens, are put in place first. As new houses are built, additionalroads and gardens are added, and existing structures may be altered to fit with thenew areas.
The spiral model [5, 6], as shown in Figure 10.7, uses a series of proto-types, and through the prototyping refines our understanding of what we
200 Software-Development Life Cycle
Live
Increment 3Increment 2Increment 1
Test1
Build1
Design1
Reqs1
Test2
Build2
Design2
Reqs2
Test3
Build3
Design3
Reqs3
Figure 10.5 Incremental model.
Live
Iteration 3Iteration 2Iteration 1
Test3+2+1
Build3+2+1
Design3+2+1
Reqs3+2+1
Test2+1
Build2+1
Design2+1
Reqs2+1
Test1
Build1
Design1
Reqs1
Figure 10.6 General iterative model.

want to build, and our understanding of the risks, constraints, and so on.With each circuit of the spiral, we refine our plans against our improvedunderstanding. We build a paper plan of the village, then a cardboard scalemodel, then a full-scale model. As a result, we refine our understanding of what isrequired in each house, garden, and road, and we are able to cater for changes inrequirements.
The iterative and spiral models are more exploratory than the othermodels; they suggest that the same areas of requirements, design, build, andtest are revisited repeatedly during the project, in order to correct errors,refine understanding, and introduce changes. However, each iteration willtake more effort and time, to ensure that changes to existing structures aredefined, made, and tested properly, and that unchanged areas have notbeen adversely affected. This is known as retest and regression test. The abil-ity to change requirements may be useful for the customer, but is difficultfor managers and builders if a fixed-price contract is agreed. As a colleagueremarked to me, “Changing requirements can be an advantage and a disad-vantage. If you have bid a project very thinly in a competitive tenderprocess, the last thing you want to do us allow the customer to changerequirements. It can make the difference between making money on theproject or losing it.” In particular, the spiral model encourages the use ofprototyping (see Table 10.10 and Appendix A) as a technique to clarify whatis required and to try out different ideas. It is useful because it acknowledgesthat we may not know everything we need to know, particularly abouttimescales and budget, at the start of the SDLC. Additionally, validation(does the specification describe what the customer needs?) and verification(have we met the specification?) take place at each step. In the TSP [3], forexample, a “relaunch” of the plan is carried out at the start of each iteration.
10.6 SDLC models 201
Implementation
Test
Design validation
BuildDesign
Requirementsvalidation
Concept
Prototype
Risk
anal
ysis
Planning cycles
Aims, constraints
Requirements
Figure 10.7 Spiral model. (After: [5].)

202 Software-Development Life Cycle
Table 10.10 Summary of Techniques for Teamwork During the SDLC
Subject Area Technique Examples In 30 Seconds… {see Appendix A for more)
Teamrelationshipsand naturalroles/teamskills
Belbin teamscores [14]
The SDLC can fail because of personal rather than technical factors.Teams need to understand their strengths and weaknesses as a team.A balance of roles/skills is required in the personalities in the team.Example roles: plants have new ideas; completer–finishers want tofinish to fine detail. Too many plants and you will never finishanything.
Improvecommunication—empathy withothers
MBTI [15] Different people have different personalities and communicationstyles. People who wave their arms around and talk a lot can annoypeople who like to be quiet and think, and vice versa. TheMyers-Briggs Type Indicator (MBTI) identifies four contrasting typepairs (e.g., Introvert/Extrovert), leading to 16 “types” (e.g., INTJ isIntrovert-iNtuitive-Thinking-Judging).
Honey &Mumford[16]
The Honey & Mumford Learning Styles Questionnaire identifiespreferred learning styles (e.g., Pragmatists and Theorists requiredifferent experiences to learn).
Kirton [17] Kirton identifies preferred problem solving methods (Adaptorsversus Innovators)—do we break the rules or work within them?
Improvemeetings
De Bono’s SixThinkingHats [18]
Improve meetings by setting rules for behavior. Six “hats” are used.Everyone wears the same color hat at the same time: BlueHat—meeting structure, Black Hat—pessimistic, YellowHat—optimistic, Red Hat—feelings, White Hat—facts, GreenHat—creative ideas. Allows meeting members to move outside theirstereotypes and allows time for different, sometimes difficult typesof communication.
Identify problemsand root causes,find solutions
Ishikawafishbones[19, 20]
Use to identify problems, root causes of problems and solutions. Ona fishbone diagram, brainstorm problems, their possible causes, theirroot causes, and, therefore, solutions to the root cause.
Reviewdocumentsand otherproducts
Reviews[21, 22]
There are five types of review: management review, technicalreview, inspection, walk-through, and audit—all of which arerelevant throughout the SDLC. Specialist testers regard them as aform of testing because they are used to find and prevent defects inproducts and processes.
Understand/explore ideas
Prototyping[5, 23]
Not an SDLC! We prototype to try out ideas or, if we are not surewhat we want, we build a model of a possible solution(s). There aretwo types of prototyping in software, “lo-fi” and “hi-fi.” In hi-fi(high-fidelity), we build screens like those the customer will see.Lo-fi (low-fidelity) prototyping uses paper/white board. Discuss theprototype and review it. There is no danger of believing it is thesoftware.
Modeling andpicturing,stories,metaphors[24–27]
There are a number of modeling and picturing techniques that canbe worth exploring with lo-fi prototyping. These include RichPicturing and Mind Mapping. Sketching a picture of a problem,solution, or idea can clarify it. Use stories, metaphors, and analogyas well; they can aid in understanding.
Understandwhether an ideais worthpursuing
Risk workshopbybrainstorming[19, 20]
A brainstorming workshop is run to list all the possible risks peoplecan identify. The risks are sorted into groups, separating risks (mighthappen in the future) from issues (problems right now) andconstraints. The risks are scored for impact and likelihood, andranked to give a prioritized list.
Cost–benefitanalysis [19]
Cost–benefit analysis is done by calculating the predicted benefits ofthe proposed change (time, money saved) and setting this againstthe predicted cost.
Track progress Earned value[28]
Not only is it possible to track cost against budget, but also what thecost so far was supposed to achieve compared with what actuallyhas been done.

One problem that has occurred with the use of the iterative models is thecommonly held belief among managers and customers that testing isreduced, for example, by removing test levels or by reducing the time to test.This is not the case. A colleague notes: “The clear implication of iterativemethods is that you start testing earlier and test more often through the lifecycle, not to mention the regression testing of all the earlier work; ergo, youdo more testing.” For example, in eXtreme Programming (XP) [7], the SDLChas two levels of testing (programmer and user) instead of four. I havereceived mixed reports of how well this works; XP enthusiasts say it workswell and streamlines the project, but some testers are reporting differently:
The theory is very plausible-plan and design test before development. Sim-
plified roles and responsibilities, simplified testing phases. The reality … is
very different. In practice, testing seems to fare even worse under an XP
project than a traditional one (in terms of being neglected or done poorly).
10.6.3 Evolutionary model
We can see that the incremental, iterative, and spiral models all still sufferfrom the problem of the length of time from the start of the SDLC todelivery of software for use by the customers. The evolutionary model(Figure 10.8) was developed, for example, by Gilb [8], because it helps tobreak down the software into chunks that can be delivered earlier to thecustomer; this means that the real-life problem is at least partly resolvedmore quickly. According to Tom Gilb (at a seminar on Evolutionary Deliv-ery, London, England, September 20, 2003), two characteristics that markan evolutionary delivery as opposed to either an incremental or a phaseddelivery are the very large number of small increments and deliveries andthe emphasis on feedback loops at each delivery so that continuousimprovement is built into the SDLC. The first deliveries of the village put dirtroads in place, plus some houses with basic rooms complete and the gardens laid tograss, in order that the first families can move in. In the later deliveries, the roads areasphalted, additional road furniture is installed (benches, night and security light-ing), play and garden rooms are added, spare bedrooms fitted out in the existinghouses, and new houses are added. As deliveries progress, each provides some newimprovement: gardens are relaid according to individual requirements for flower bedsand paths, garden sheds are installed, water features and other refinements areadded to the gardens, and the kitchens are refurbished.
10.6.4 V-model
The V-model and its close relation the W-model [12] were developedby testers who wanted to emphasize the cost-effectiveness of early test-ing. V-model SDLCs explicitly describe review activities as early testing.They expect that specialist testers are involved from requirements definitiononward. In the village, buildings inspectors are involved from the planning stageonwards, as are representatives of the people who will “accept” the village as suitable
10.6 SDLC models 203

to live in. They look at and comment on the plans and decide what checks they will doduring building. At each step in the early part of the SDLC, products are builtthat relate to the dynamic stages of testing. Therefore, three things can hap-pen together, as shown in Figure 10.9. Different V- and W-models mayshow these three steps in slightly different ways but, in essence, what ishappening is that:
◗ A product is built (for example, the requirements, the designs, thecode).
◗ The product is reviewed, by peer review, inspection or walkthrough, toshow it matches the products at the previous stage, to show it meets aparticular standard, and to show that it can be used as input to the nextstep.
◗ Test designs are built that will be used later to run dynamic tests thatapply to this product and that demonstrate whether the product istestable.
10.6.5 Advantages and disadvantages of the models
The models each have advantages and disadvantages. These were summa-rized in Table 10.8.
10.7 Quality views and the models—why we mightwish to combine models
We can see in Table 10.11 that the models favor particular quality views,because of which groups are involved in the SDLC.
204 Software-Development Life Cycle
Deliveries....................1 to 19
Deliverycycle 7
Live
Acceptance test
19181716151413121110987654321
B B B B B B B B B B B B B B B B BB B BD D D D D D D D D D D D D D D D D D D
T T T T T T T T T T T T T T T T TT T TR R R R R R R R R R R R R R R R R R R
Test
Design Build
Requirements
Figure 10.8 Evolutionary model in incremental SDLC.

The models I have shown are generic models. You will find off-the-shelfmodels and variations described in different companies’ standards as well asin books and methodologies (see Table 10.10). You will also see variationson the themes in the models. It is perfectly reasonable to tailor the models tofit what your organization needs, and use published models in a “pick andmix” fashion. However, I do recommend that having looked at the modelsyou settle on a tailored model and a few variations for your organization,with suitable additional tailoring rules. No model is perfect; you will need touse common sense and experience to tailor the model to specific projects,but if you allow a complete free-for-all, chaos will quickly ensue. I haveseen situations in which each project is using its own terminology, methods,and measurements, resenting any “outside” ideas. The outcome is that
10.7 Quality views and the models—why we might wish to combine models 205
Reviewbuild
Build
Runcomponenttest
Designcomponenttest
Reviewdesign
Writedetaileddesign
Runintegrationtest
Design integration test
Reviewdesign
Writedesign
Live
Runacceptance test
Runsystemtest
Design system test
Reviewrequirements
Writerequirements
Design acceptance test
Figure 10.9 V-model.
Table 10.11 Quality Views and the Models
Life Cycle
Quality View WaterfallSpiral/Iterative/Evolutionary V-Model Combined
Transcendent ✓ ✓ ✓ ✓
User view ✓ ✓
Value view ✓ ✓
Product view ✓ ✓
Manufacturing view ✓ ✓ ✓

projects cannot be compared, people cannot easily transfer between proj-ects, hostility between projects emerges, and organizations fail to learn fromexperience because projects guard their own outcomes.
Let us try an example. We look at our organization and assess that:
◗ Involvement of real customers will help us get the requirements right,and acknowledgment of changing requirements means we want toinvolve the customer right through the SDLC.
◗ Appropriate level of control and processes—we do not have very expe-rienced people, but time to market is important so we need to have con-trol without too much bureaucracy.
◗ Early testing to focus on areas of importance will help us deliveragainst risks. Maybe static testing (static analysis and reviews) mighthelp us.
From this, we might choose to pick aspects of evolutionary delivery to getimportant functionality to the customers early, but combine it with someaspects of XP. Because our team is not mature, we would not use the wholeof XP, but we might adopt the principle of continuous retest by the program-mers and continuous customer involvement. From the V-model, we coulduse early reviews of requirements and designs, early test design, and staticanalysis on code. This would be useful if we could involve one of our experi-enced testers to check the requirements and design for testability, plus to setsome detailed entry and exit criteria for steps in which we know we haveparticular technical weaknesses. To reduce time to market, we might takethe risk of combining test levels or removing the formal entry and exitcriteria except for high-risk steps. We now have a life cycle like the one inFigure 10.10, tailored to the risks and constraints for our situation [29].
I have seen tailored SDLCs introduced with a marked positive effect, notjust on manufacturing quality, but across the quality definitions and groups.For example, in one organization, a framework with entry and exit criteriafor the SDLC and for steps within the SDLC gave project teams the ability totailor for large and small projects. They could split or combine steps anddeliverables. The control of the SDLC was through authorization on the
206 Software-Development Life Cycle
Evolutionary delivery gives us frequent deliveries to liveV-model gives us reinstatement of test levels lost fromXP, plus entry and exit criteria at key points
Acceptance test
10987654321
Live
Deliveries...................1 to 10
Figure 10.10 Evolutionary, XP, and V-model combined.

entry and exit criteria at each mandatory quality gate within the SDLC. Anexample of this is shown in Table 10.12, showing an SDLC tailored to aone-page form that describes a particular project. The customer has made arequest for what looks like a fairly small and simple piece of work. With themanager and a senior builder, the checklist in Table 10.5 has been com-pleted, and an assessment of the likely cost, size, and risk has been made, togive the Cost · Size · Risk calculation of less than nine. However, the feasibil-ity of providing a simple enough solution is not clear, so a waterfall modelwould not be suitable. The team believes it will be necessary to produce aprototype to demonstrate that the proposed solution is possible within theconstraints of time and budget. A small team of relatively experienced peo-ple is available. This suggests that an SDLC tailored to combine some steps ispossible, especially as some of the team members are highly experienced inthis application area. The team involved will consist of:
◗ Tom Customer (TC), who has made the request for work to be done,will be involved throughout to help in defining requirements, testprototypes, and test delivered software (user-acceptance test or UAT).
◗ Mary Builder (MB) (a senior software engineer) and Fred Builder (FB)(a programmer in training) will help TC define requirements, designthe solution, build prototypes and deliverables, and carry out their owntesting during each iteration.
10.7 Quality views and the models—why we might wish to combine models 207
Table 10.12 Tailored SDLC for the XYZ Project
Iteration and Step People During Step, Delivering Exit Review TeamAuthorize toMove On
Iteration 1planning
TC, DM—Plan for iteration 1, based on entrychecklist, C · S · R 9
TC, MB, JS, DM, JM, FM TC
Requirements/design/build/test
TC, MB, FB—build and test prototype TC, MB, FB, JS, JM TC
MB
Iteration 2planning
TC, DM, MB—Refined plan for iteration 2,based on prototype, test results, actual effort,and cost or no-go decision
TC, MB, JS, DM, JM, FM TC, DM
Requirements/design/build/initial test
TC, MB, FB—Refine requirements andinterface design, first build of solution. JMbuilds tests, environment for independent test.
TC, MB, FB, JS, JM, FM TC, MB
Independent test JM—perform independent test of first build TC, JM, MB TC, DM
Iteration 3planning
TC, DM, MB, JM—Refined plan for iteration 3,based on test results, actual effort, and cost orno-go decision
TC, MB, JS, DM, JM, FM TC,DM
Requirements/design
TC, MB, FB—Refined requirements andinterface design, TC, JS, JM build tests, twoenvironments for independent tests (UATand OAT)
TC, MB, JS, DM, JM, FM TC, MB, JS
Build/test MB, FB—build of solution
JM—Independent test of build in environment 1
MB, FB, JM, TC, JS TC, JS, JM
Independent test TC, JS—Operational and user-acceptance test(OAT and UAT) in like-live environment 2leading to decision:
Solution ready for delivery to live use orno-go decision
TC, JS, JM, MB, FB, DM TC, JS

◗ Jenny Supporter (JS) will review the design at each iteration for impli-cations around the infrastructure and existing systems, and will run anoperational acceptance test (OAT) as part of iteration 3.
◗ Dave Manager (DM) will aid with planning and decision making, checkthat the work is staying within time/budget constraints, and be an esca-lation point for all team members.
◗ Joe Measurer (JM) is a specialist tester who will carry out reviews of therequirements and design at each stage, review test results at each itera-tion, and plan and carry out independent testing in iterations 2 and 3.
◗ Fiona Measurer (FM) is a quality and process specialist who willreview that the SDLC tailoring and the plans are suitable for the levelof risk, cost, and size of project.
The team decides to tailor the life cycle. They want to combine the flexi-bility, replanning, and prototyping of the spiral model, the idea of earlytester involvement and reviewing from the V-model, and a three-iterationSDLC. Some of the activities will not have formal exit criteria; effectivelythey are combined into single steps. The entry criterion for each step is thecompletion of the previous step plus any preparation activities. Exit reviewsand authorization to move on are done formally at significant points giventhe size of the project.
10.8 Exit from the SDLC10.8.1 Exit criteria following a detailed acceptance test
If the SDLC completes after an acceptance test based on SMART acceptancecriteria like those defined in Chapter 9, it is easy to make the go/no-go deci-sion for taking the software to live use. Either the acceptance criteria havebeen met or they have not. In Table 10.13, we see simplified example exitcriteria for different projects. Notice that the exit from the SDLC may be todeliver software for use, or the SDLC may be stopped and nothing deliveredfor use. The acceptance test, by which the customer and the supporterdecide whether they are prepared to run the software for real, live use mayhave several outcomes:
◗ The test passes completely; no problems are identified during the test.
◗ Some tests have failed but the software is sufficiently fit for purpose thatit can be accepted and used with workarounds planned for identifiedproblems.
◗ The acceptance test fails and the software needs changing; these meanthe software will have to be tested again.
◗ The acceptance test fails and it is judged that the cost and risk of fixingthe problems is too great. Nothing is delivered for live use; fixing soft-ware is difficult, and prone to cause chain-reaction problems. TheSDLC is stopped.
208 Software-Development Life Cycle

10.8.2 When no exit criteria have been defined
If you have not defined exit criteria from the SDLC, how will you knowwhen to stop? It might be that you make the decision to go live because youhave run out of time or budget, or because you have completed all theplanned tests, or because our manager will get angry if we do not deliversoon. Any of these could be the right or the wrong reason for stopping. If wethink of the quality definitions and the groups, each group will have a pre-ferred quality reason for stopping or continuing:
◗ Customers may be desperate for the new software, and they willgo with fit-for-purpose rather than perfect, or, indeed, what is inthe specification, but may be less sanguine once defective code isdelivered.
◗ Managers will be watching the time and cost of the SDLC—they want toensure the organization gets a proper return on investment and doesnot spend excessively.
◗ Builders want to ensure that they have implemented all the featuresand attributes from the specification.
◗ Measurers can become excessively focused on defect identification andremoval at the expense of time and budget constraints.
◗ Supporters will go with fit-for-purpose rather than perfect, or, indeed,what is in the specification, but may be less sanguine once defectivecode is delivered.
10.8 Exit from the SDLC 209
Table 10.13 Example of Exit Criteria for SDLC Stage
Example of
Exit Criteria
Example of Deliverables Documented,
Reviewed, and Agreed Upon
Example of
Authorization Owners
Acceptance test completed
and passed in all
aspects; software
will move to delivery.
Acceptance test summary report, including acceptance of the
implementation/rollback plan, infrastructure, training,
documentation, processes, and software.
Process owner,
support manager
Acceptance test
completed and failed;
users and supporters
willing to accept as
is with documented
work rounds.
Acceptance test summary report including acceptance or otherwise
of the implementation/rollback plan, infrastructure, training,
documentation, processes, and software.
Cost–benefit analysis
Known problem and workaround list.
Process owner,
support manager
Acceptance test
completed and failed;
rework software and
rerun tests.
Acceptance test summary report including acceptance or otherwise
of the implementation/rollback plan, infrastructure, training,
documentation, processes, and software.
Cost–benefit analysis.
Rework and rerun plan.
Process owner
Acceptance test
completed and failed;
cancel project.
Acceptance test summary report including acceptance or otherwise
of the implementation/rollback plan, infrastructure, training,
documentation, processes, and software.
Cost–benefit analysis.
Definition of alternative solution.
Process owner

If no exit criteria are defined and agreed on between the groups, the dif-fering viewpoints will mean that the team argues about whether the soft-ware is ready for delivery or not. If you are approaching the end of an SDLCwithout agreed exit criteria, then I suggest you attempt to document andagree on some criteria for acceptance (see Section 10.8.5). You also need toidentify the circumstances under which the software would not be acceptedand the actions to be taken in that case.
To prevent this problem from recurring, improve the SDLC model that isused in your organization by adding exit criteria to the model.
10.8.3 When exit criteria have not been met
As with the entry criteria, if the exit criteria have not been met, we must notexit the SDLC. In order that we can be strict, it is important that the exit cri-teria are:
◗ Objective;
◗ Defined in a way that is SMART;
◗ Necessary rather than simply desirable.
However, there are occasions when we might decide to waive the exitcriteria. This may happen if we decide that the exit criteria are excessive orincorrect, or if we believe this is an emergency. There are also occasionswhen we may wish to increase the exit criteria, for example, if we see thatthe SDLC is at higher risk than our normal projects. Exactly the same les-sons apply as we discussed in Section 10.3.3, so I will not repeat them here.It suffices to say that the exit from the SDLC should match to the entry todelivery (Chapter 11).
10.8.4 Tailoring exit criteria
Exit criteria will be similar for different SDLC models, but there may be dif-ferences for specific projects or pieces of work. As with the entry criteria, tai-loring against cost, budget, and risk measures may help teams to chooseappropriate exit criteria for a particular project. Table 10.14 shows someexamples.
10.8.5 When no acceptance criteria have been set
However late it is in the SDLC, if we do not have acceptance criteria, weshould try to set some. For the acceptance criteria, it may well be too late todo anything about attributes the team has not considered. Use Table 9.8 inChapter 9 to help you build a checklist of attributes to consider as accep-tance criteria.
To prevent this problem from occurring in the future, improve theprocess to include a detailed start-up for the SDLC.
210 Software-Development Life Cycle

10.9 ConclusionNo single SDLC model is perfect. What we choose depends on our definitionof quality, our constraints and our risks. All the life cycles have similar steps,and we must tailor SDLC models to fit the risk level and constraints within aparticular project.
There are more deliverables that just the software systems. We must alsoplan for delivery of:
◗ Infrastructure, operational, and support processes and equipment;
◗ Training (for software, support, and business processes);
◗ Documentation (for software, support, and business processes);
10.9 Conclusion 211
Table 10.14 Example of Exit Criteria Tailored to Projects
C · S · R Score
Example of Exit Criteria
Example of Exit Documents Example of Authorization Owners
1–5 1. E-mail with notification of change completion andrequest to move code to live from builder to supporter,and customer, copied to manager and measurer
Deliverables: E-mail and acknowledgment, codestandards checklist complete by builder, customertest results
Customer, supporter
6–12 1. As above, plus
2. Request raised at monthly change managementmeeting
3. Tests completed by independent tester and bycustomer/supporter
Deliverables: As above, plus acceptance criteriacompletion report, evidence from testing. and knownfault list
Customer, process owner,supporter builder, manager
12–20 1. As above, plus
2. Acceptance criteria metrics from ISO 9126 completedand reviewed
3. Separate unit, system and acceptance test stagescomplete
Deliverables: As above, plus acceptance criteriadocumentation, evidence from all testing stages andknown fault/workaround list
Customer, process owner,project manager
20–27 1. As above, plus
2. Additional risk assessment on delivery carried out byprocess owner and project manager
3. Implementation planning, including contingencyplanning completed
4. Project authorization board has discussed and agreedto the implementation and risk plan for delivery
Deliverables: As above, plus additional work on riskassessment, achievement of aims and objectives, targetsand indicators, constraints, acceptance criteria,implementation plan, project authorization to complete
Project authorization board,SDLC project sponsor, processowner, project manager

◗ Business and manual processes;
◗ Implementation processes, including rollout and rollback plans;
◗ Data, for example, during a data migration, both databases and stand-ing data.
It is worth having some pretailored SDLC models, associated with differ-ent levels of risk and different types of projects. All SDLCs need somestart-up beforehand; you cannot be successful with any SDLC unless youhave fulfilled the entry criteria. All SDLCs require good communicationbetween all groups. All are aimed at delivery, which we will look at inChapter 11.
References
[1] Reid, S. C., “Software Testing Standards—Do They Know What They Are TalkingAbout?” http://www.testingstandards.co.uk/publications.htm, August 2003.
[2] Software Engineering Institute, “Capability Maturity Model,” http://www.sei.cmu.edu, July 2003.
[3] Humphrey, W., Introduction to the Team Software Process, Reading, MA: SEI, 2000.
[4] IT Infrastructure Library, Best Practice for Service Management, London, England:Office of Government Commerce, 2002.
[5] Nance, R. E., and J. D. Arthur, Managing Software Quality, New York:Springer-Verlag, 2002.
[6] Boehm, B. W., “A Spiral Model of Software Development and Enhancement,”IEEE Computer, Vol. 21, No. 5, 1988, pp. 61–72.
[7] Kruchten, P., The Rational Unified Process, Reading, MA: Addison-Wesley, 1999.
[8] Beck, K., Extreme Programming Explained, Reading, MA: Addison-Wesley, 2001.
[9] DSDM, DSDM, http://www.dsdm.org, April 2003.
[10] Gilb, T., papers on Evolutionary Delivery on http://www.gilb.com, including“Competitive Engineering: A Handbook for Systems and Software Engineering,”http://www.gilb.com, September 2003.
[11] Craig, R. D. and S. P. Jaskiel, Systematic Software Testing, Norwood, MA: ArtechHouse, 2002.
[12] Gerrard, P., and N. Thompson, Risk Based E-Business Testing, Norwood, MA:Artech House, 2002.
[13] BSI, BS7925-2:1998, Software Testing—Part 2: Software Component Testing,BSI 1998.
[14] Belbin Associates, “Belbin Team Roles,” http://www.belbin.com/belbin-team-roles.htm, October 2003.
[15] Team Technology Web site, “Working Out Your Myers Briggs Type,” http://www.teamtechnology.co.uk/tt/t-articl/mb-simpl.htm, October 2003.
[16] Honey, P., “Learning Styles,” http://www.peterhoney.co.uk/product/ learningstyles, October 2003.
212 Software-Development Life Cycle

[17] Kirton, “Adaptors and Innovators Defined,” KAI Web site, http://www.kaicentre.com/, July 2003.
[18] de Bono, E., Six Thinking Hats®, New York: Penguin, 1999.
[19] Robson, M., Problem Solving in Groups, Aldershot, England: Gower, 1995.
[20] TQMI, Problem Solving—Tools and Techniques, Frodsham, England: TQMI, 2001.
[21] IEEE 1028™ Standard for Software Reviews, 1997.
[22] Gilb, T., and D. Graham, Software Inspection, Reading, MA: Addison-Wesley,1993.
[23] Hohmann, L., “Lo-Fi GUI Design,” Software Testing and Quality Engineering, Vol. 1,No. 5, September 1999.
[24] “Drawing Concerns: A Structured Rich Picturing Approach,” http://business.unisa.edu.au/cobar/documents/richpic_colin.pdf, November 2003.
[25] Rose, J., “Soft Systems Methodology as a Social Science Research Tool,” http://www.cs.auc.dk/~jeremy/pdf%20files/SSM.pdf.
[26] Buzan, T., The Mind Map Book, London, England: BBC Consumer Publishing,2003.
[27] Freeburn, G., “Mind Mapping 101 for Testers,” EuroSTAR Conference, Edinburgh,Scotland, 2002.
[28] Pavyer, E., “An Introduction to Earned Value Management,” Project ManagerToday, Vol. 11, April 2003.
[29] Evans, I., “The Risks We Take with Testing,” British Quality Foundation IT&TGroup Meeting, February 2003.
Selected bibliography
Belbin, R. M., Management Teams—Why They Succeed or Fail, London, England:Butterworth Heinemann, 1981.
Belbin, R. M., Team Roles at Work, London, England: Butterworth Heinemann,1995.
Gilb, T., Principles of Software Engineering Management, Reading, MA:Addison-Wesley, 1988.
Gnatz, M., et al., “The Living Software Quality Process,” Software QualityProfessional, June 2003, pp. 4–16.
Honey, P., and A. Mumford, The Learning Styles Helper’s Guide, Maidenhead,England: Peter Honey Publications, 2002. PeterHoney.com, 10 Linden Avenue,Maidenhead, Berks, SL6 6HB. Tel.: 0162863946. Fax: 01628633262. E-mail:[email protected].
Kroeger, O., J. M. Thuesen, and H. Rutledge, Type Talk at Work: How the 16Personality Types Determine Your Success on the Job, New York: Bantam DoubledayDell, 2002.
McHale, J., “Innovators Rule OK—Or Do They?” Training & Development,October 1986, http://www.kaicentre.com/.
Sticky Minds Web site Roundtable, facilitator Craig, R., “What Is SoftwareQuality and How Do You Measure Its Value?” http://www.stickyminds.com/s.asp?F=S6540_ROUND_46, August 2003.
10.9 Conclusion 213

.

Delivery and Support WhenGoing Live
In this chapter I shall:
◗ Describe the entry criteria, steps, and exit criteria fordelivery;
◗ Identify the quality definitions from Chapter 1 that prevail atthis stage;
◗ Identify how each of the groups identified in Chapter 2become involved at this stage;
◗ Introduce techniques that aid teamwork at this stage.
It’s 10 p.m. on Sunday; either we complete the implementation
and work around the defects, or we roll back now. We cannot wait
any longer, or there isn’t time to roll back and be ready for
Monday.
—Customer makes an assessment of the path of least
damage during a flawed implementation
11.1 Delivery—description11.1.1 Delivery considerations
Delivery is the point in the life span of software after thesoftware-development life cycle (SDLC) has completed whenproducts are moved to live use. It is a (relatively) short butanxious period of time, but it is highly importance; manyactivities will come together at a single milestone in theproject plan. Delivery is not always a success; sometimes theimplementation fails and we have to roll back by removingthe software and restoring the systems to their predeliverystate. “Postponement of a system’s implementation is painful
215
11Contents
11.1 Delivery—description
11.2 Delivery viewpoints
11.3 Entry criteria for11.3 delivery
11.4 Delivery—typical11.3 activities
11.5 Exit from delivery
11.6 Conclusion
C H A P T E R

and often very costly. The implementation of a poor system, however, ismuch more costly and also much more painful” [1]. The roots of a faileddelivery are found in the entry and exit criteria for the SDLC, which I dis-cussed in Chapters 9 and 10.
Delivery comes between the SDLC and the postdelivery period when thesoftware is used (Figure 11.1). As with the earlier stages, all the groups havea significant contribution to make but they do not always realize their part.In this chapter, I will discuss the activities carried out during delivery, andhow all the team can contribute to making it a success. Specific activitiesneed to be planned and managed leading to the delivery point if the deliveryis to be achieved without problems.
There are things to consider when planning the delivery, depending onthe type of software, the other deliverables that come with the softwaresolution, and the type of customer:
◗ Installation team: The installation of the software plus any other prod-ucts may be done by the customer, or by a team from the supportgroup (operations or help desk) or by the build team themselves.
◗ Method of delivery: Delivery and installation of the software might be bydifferent media (download from Internet/intranet, by transfer within aconfiguration management system, by use of removable media such asdiskettes, tapes, or CDs). Delivery of other products such as training andsupport may be face to face, via documentation, or via other media suchas video and CD.
◗ Time period for installation: Delivery and installation may be a shortprocess, taking minutes, or it may be an extended process. In the lattercase, it may take place overnight, over a weekend, or over a longerperiod. For a large installation, it may be phased in geographically or insome other way, or there may be a pilot project.
◗ Urgency of the delivery: Sometimes, emergency changes to systems arerequired, and in this case the change may require a special process inorder to speed up the delivery without losing control.
◗ Support around the delivery: A small delivery may not require particularsupport; perhaps the minimum would be a release notice with a knownproblem list. Larger deliveries may be supported by training, which
216 Delivery and Support When Going Live
S = Start-upSDLC = Software development life cycleD = DeliveryPD = Postdelivery
PD
D
SDLC
S
Figure 11.1 Life span stages.

would then be a deliverable in itself. Other support to a software deliv-ery might include expert teams to work on support lines or with thesoftware users. The need for additional support depends on how trans-parent the delivery is to the people using the IT systems.
◗ Quality measures of the deliverables: The release notice will typically listany known problems and workarounds for the deliverables. The qual-ity measures for the deliverables will affect the decision to make thedelivery or not. This includes an assessment of the known problems andwhether the exit criteria for the SDLC were met.
◗ Size of delivery: Different delivery strategies may be required for new“green field” systems, small and large changes to existing systems, sin-gle changes, and groups of changes.
11.1.2 Identifying the delivery
A delivery will consist of one or more of the following deliverables, built andtested during the SDLC:
◗ Software;
◗ Infrastructure, for example new hardware, communications equip-ment, systems software, plus operational and support processes;
◗ Training material and delivery of training for software, support, andbusiness processes;
◗ Documentation for software, support, and business processes, forexample, user and support guides;
◗ Business and other processes as well as process changes, for both man-ual and IT processes;
◗ Implementation processes, including rollout and rollback plans;
◗ Data, for example, during a data migration, both databases and stand-ing data.
The delivery plan should identify all the deliverables, each identifiedwith its version number and status, under a configuration management sys-tem. A configuration management system is used to make sure we deliverthe right version of each deliverable; this is because as we build and testdeliverables, they will go through many revisi ons. It is an easy human errorto deliver the wrong version. The group of deliverables to be releasedtogether may be identified with a release ID [2]. This is updated for laterdeliveries of changes to an existing system so that the size and type of thedelivery is identified in the release ID: for example, if the first release intolive use is identified as “V1”:
◗ “V2” is a major release that contains significant changes to V1.
◗ “V1.1” is a minor release of small changes to V1.
◗ “V1.1.1” is an emergency fix to the system.
11.1 Delivery—description 217

In an SDLC that takes place as part of an organization or business trans-fer, the point of delivery might also be the point at which the business isresponsible for transferred customers and staff. Although this would notnormally be considered as part of the SDLC delivery, the introduction ofthese people to the new organization would need to be managed as part ofan overall business delivery process, including introductions and inductiontraining.
11.2 Delivery viewpointsEach group has a view of when the point of delivery happens, and of what isincluded in the delivery. For the builders, they may only be interested in thedeliverables for which they have direct responsibility. For example, withinthe build group, developers will be interested in the delivery of their code,trainers will be interested in the delivery of the training, and technicalauthors in the delivery of the user guides. It is interesting to note that inIntroduction to the Team Software Process [3], the final step in the software engi-neering project is the postmortem, which comes immediately after the systemtest; the implication is that the software engineers hand over the code at thispoint, before the acceptance test, so the user-acceptance test would be car-ried out by the customers, leading into the delivery, to be carried out by cus-tomers and supporters. From the viewpoint of the supporters, the deliverycovers code and the infrastructure to support it. For example, in the IT Infra-structure Library (ITIL) manual Best Practice for Service Support [2] underRelease Management, the main components of a release for delivery areidentified as:
◗ Application programs, developed in-house or externally, includingpackages;
◗ Utility software;
◗ Systems software;
◗ Hardware and hardware specifications;
◗ Assembly instructions and documentation, including user manuals.
Notice how this includes everything in which the supporters will beinterested, but not training or business processes, which some IT peoplewould regard as outside the SDLC. Yet, from the customer viewpoint, with-out the business processes and training, it may not be possible to take deliv-ery of the software successfully.
Thus, we see that if we take a simple view of the point of delivery, wemay forget to deliver something needed by one of the groups. Some projectsmay see the delivery as being the responsibility of the customers and thesupporters, with the managers, builders, and measurers simply handingover tested code and no other material. The managers, builders, and meas-urers have taken the system to the end of either system test for handover to
218 Delivery and Support When Going Live

the acceptance test, or have supported it to the end of the acceptance test. Atacceptance, the project is complete. The deliverables are handed over, andthe customer and supporter proceed on their own. The supporter perhapscarries out the installation of the software, and the customer prepares to useit, perhaps by reading the user guide. In other projects, such as the deliveryof a commercial off-the-shelf (COTS) package, the customer may not evenhave a supporter to carry out the installation. For example, in a one- ortwo-person company, the acquisition of a desktop computer, with wordprocessing and accounting software, may only require a purchase order anda visit to the local computer store, with the person using the PC carrying outthe entire installation themselves.
As we see in Table 11.1, if only the customer and supporter are involved,this results in a limited quality viewpoint, which may or may not matterdepending on the size and complexity of the delivery.
If the SDLC has been carried out with a viewpoint limited to the builder,measurer, and manager (see Table 10.1 in Chapter 10) we may quickly findthat the customer and supporter views of whether they have received aquality system is at odds with the others’ views of whether they have deliv-ered quality.
In many large projects, particularly for custom-made or tailored sys-tems, the builders, measurers, and managers will aid in the delivery, andmay well have a team to support the customers and supporters as the cus-tomers take delivery of the software and start to use it. Although membersof all groups will support the delivery, their viewpoints will be quite differ-ent (Table 11.2):
11.2 Delivery viewpoints 219
Table 11.1 Views of Quality at Delivery—Simple
Groups
Quality View Customer Supporter
Transcendent view ✓ ✓
User view ✓ ✓
Value view
Product view ✓
Manufacturing view
Table 11.2 Views of Quality at Delivery—Teamwork
Groups
Quality View Customer Manager Builder Measurer Supporter
Transcendent view ✓ ✓ ✓ ✓ ✓
User view ✓ (✓ ) ✓
Value view ✓
Product view ✓ ✓ ✓
Manufacturing view ✓ ✓
✓ is a primary quality view.(✓ ) is a quality view that may be taken by some people in this group.

◗ Customers are very engaged at this point. Will the system work forreal? Will they be able to use it? Will the delivery go well? From theuser quality viewpoint, will the system be fit for purpose?
◗ Supporters are also very engaged; they will be rolling out the systemand starting to support it. Their questions and viewpoint are similar tothat of the customer, with the addition of a product viewpoint thatlooks at the effect of attributes in the system as a whole; for exam-ple, how does the new software affect performance of the overallsystem?
◗ Managers have quite a different reason for anxiety at this point. Willthe project team be able to finish this project and (with more or lessrelief) move onto a shiny new project? Using the value quality view-point, did the project come in within budget and time scale, and can anydelays in delivery be prevented?
◗ Builders will be pleased to have completed the project; they will want tosee a clean sign-off against the delivery. From their manufacturing andproduct quality views, is the delivery defect free and does the softwarehave all the specified attributes?
◗ Measurers will share the builders’ views and, in addition, will be wor-ried about their efforts in assessing quality from the manufacturingview. They will be focused on defects identified during delivery thatwere not identified earlier.
For a release of any complexity, it is likely that many people will beinvolved. It may be useful to have a responsibility matrix [2] to show who isinvolved and with what responsibilities for the different types of SDLC andprojects. This might be arranged by size and risk, as well as by technicalcontent of the delivery; for example, whether the delivery is of a boughtpackage, a customized package, database changes, hardware changes, orcustom-made software. For example, in contrast with our one- or two-person company above, in a large organization, depending on its processes,the purchase and installation of a PC with word processor and accountingsoftware may require involvement from a logistics group, the desktop sup-port group, the change management team, IT security, an electrical equip-ment safety team, and so on. The authority and responsibilities for deliverytasks would be included in the responsibility matrix, which could be incor-porated with the entry and exit criteria for delivery.
In particular, the support of builders and measurers will be needed to aidin resolving any problems that arise during the delivery. Managers need tobe involved to make cost–benefit analysis for any change of plan during thedelivery.
The period around the delivery needs to be managed carefully becausechange is taking place. The unfamiliar system requires a learning curvefrom the customers and supporters. There also may well be “teething prob-lems” as the system is first used. The enthusiasm for the new software may
220 Delivery and Support When Going Live

drop significantly if benefits from the delivery cannot be realized rightaway. Enthusiasm for the system may not be regained until significantbenefits have been demonstrated for the system. This is referred to as the“Silver Bullet Life Cycle” [2]. Managing the relationships and communica-tion between the groups is vital in order that the team works through thedelivery taking account of changes in attitude and confidence as well as thetechnical activities. Using the teamwork techniques listed in Table 11.3and described in Appendix A will help to manage the communications.
11.3 Entry criteria for deliveryThe entry criteria for delivery must include all the exit criteria for theSDLC, but may include additional tasks required for the delivery into liveuse, if these tasks have not been defined as part of the SDLC. Table 11.4shows some example entry criteria for which preparation for delivery interms of an implementation and rollback plan has been completed withinthe SDLC, but other aspects of infrastructure and service support have notbeen included.
As the SDLC may not include consideration of release and rollout plans,the entry criteria for delivery should explicitly mention completion of tasksbeyond simply the delivery of the software. The specific entry criteria willdepend on the type of organization and the type of delivery. In particular,evidence of acceptance testing of a delivery should include testing not justthe functionality of the software, but ascertaining that it can be installed andbacked out (deinstalled) [2].
Apart from use of the software, there are a number of services that areneeded postdelivery, and I will discuss them in Chapter 12. We should notneed to carry out detailed planning and delivery of these services for everySDLC; these activities should be in place in order that we can support soft-ware systems. For a project in which we are acquiring a new system on anew infrastructure, we would plan and set them up as part of the whole ITinfrastructure, so our entry criteria would include checking that all the sup-port and infrastructure is in place to support the live system. For a projectin which we are delivering new software to an existing infrastructure, wewould need to review whether changes were needed in any of these areasto support the delivery and use of the software. The completion of thesechanges would become part of the entry criteria for delivery for that par-ticular project. A very good description of the type of infrastructure activi-ties required and checklists for reviewing delivery plans are in the ITILService Delivery and Service Support Manuals [2, 4].
11.4 Delivery—typical activitiesThe activities that take place during delivery depend on the size and com-plexity of the project. This is best illustrated by some examples.
11.3 Entry criteria for delivery 221

222 Delivery and Support When Going Live
Table 11.3 Summary of Techniques for Teamwork in Delivery
Subject Area Technique Examples In 30 seconds… (see Appendix A for more)
Delivery Pilot projects [5, 6] A limited delivery to a small area, which enables thecustomers and suppliers to test delivery and use of theproposed system before rollout to a large number of sites.
Delivery Releasemanagement[2, 4, 7]
“Release management builds the final customer solution,which also includes instantiation of the developing andtesting environment. In a product-line context, releasemanagement includes the release of core assets to productdevelopers. When shopping for CM tools, make sure the oneyou buy can help you build releases.” [7]
Delivery Buildmanagement[2, 4, 7]
“Build management enables developers to create a version ofa product, which can be anything from a single component toa complete customer solution for the purpose of testingand/or integration.” [7]
Team relationshipsand natural roles/teamskills
Belbin teamroles [8]
The SDLC can fail because of personal rather than technicalfactors. Teams need to understand their strengths andweaknesses as a team. A balance of roles/skills is required inthe personalities in the team. Example roles: plants have newideas; completer–finishers want to finish to fine detail. Toomany plants and you will never finish anything.
Improvecommunication—empathy withothers
MBTI [9] Different people have different personalities andcommunication styles. People who wave their arms aroundand talk a lot can annoy people who like to be quiet andthink, and vice versa. The Myers-Briggs Type Indicator(MBTI) identifies four contrasting type pairs (e.g.,Introvert/Extrovert) leading to 16 “types” (e.g., INTJ isIntrovert-iNtuitive-Thinking-Judging).
Honey &Mumford [10]
The Honey & Mumford Learning Styles Questionnaireidentifies preferred learning styles (e.g., Pragmatists vs.Theorists) require different experiences to learn.
Kirton [11] Kirton identifies preferred problem solving methods (Adaptorsvs. Innovators)—do we break the rules or work within them?
Improve meetings De Bono’s SixThinkingHats [12]
Improve meetings by setting rules for behavior. Six “hats” areused. Everyone wears the same color hat at the same time:Blue Hat—meeting structure, Black Hat—pessimistic, YellowHat—optimistic, Red Hat—feelings, White Hat—facts, GreenHat—creative ideas. Allows meeting members to moveoutside their stereotypes and allows time for different,sometimes difficult types of communication.
Identify problems androot causes, findsolutions
Ishikawafishbones[13, 14]
Use to identify problems, root causes of problems andsolutions. On a fishbone diagram, brainstorm problems,their possible causes, their root causes, and, therefore,solutions to the root cause.
Review documentsand other products
Reviews[15, 16]
There are five types of review: management review, technicalreview, inspection, walkthrough, and audit—allof which are relevant throughout the SDLC. Specialist testersregard them as a form of testing, because they are used tofind and prevent defects in products and processes.
Understand whetheran idea is worthpursuing
Risk workshop bybrainstorming[13, 14]
A brainstorming workshop is run to list all the possiblerisks people can identify. The risks are sorted into groups,separating risks (might happen in the future) from issues(problems right now) and constraints. The risks are scored forimpact and likelihood, and ranked to give a prioritized list.
Cost–benefitanalysis[13, 14]
Cost–benefit analysis is done by calculating the predictedbenefits of the proposed change (time, money saved) andsetting this against the predicted cost.

11.4.1 Person buys PC and software for self-installation
The builders, measurers, managers, and supporters will work for the PC andsoftware vendors. They must prepare the product with everything the cus-tomers will need to support them through delivery and into use of the sys-tem. The level of intervention by a specialist with technical knowledge ofPCs will need to be reduced by improving the installation process itself, per-haps by automation, but also by providing step-by-step instructions not justfor the installation of the software but including steps to take before andafter the installation. Additionally, supporting documentation should bewritten in the customer’s terminology, not in IT terminology. The deliveryactivities that might be typical here would be for the customer to:
◗ Check all the delivered components against a supplied parts checklist.
◗ Assemble hardware following a step-by-step guide
◗ Boot up system and follow on-screen initialization steps.
◗ Customize system.
◗ Back up system.
◗ Install purchased software package, following steps in the installationguide.
11.4 Delivery—typical activities 223
Table 11.4 Example Entry Criteria for Delivery
Example of Entry Criteria Example of Entry DocumentsExample ofAuthorization Owners
1. Acceptance test completedand passed in all aspects;software will move to delivery
Acceptance test summary report, including acceptanceof the implementation/rollback plan, infrastructure,training, documentation, processes, and software
Process owner,support manager
2. Acceptance test completedand failed; users and supporterswilling to accept as is withdocumented workarounds
Acceptance test summary report, including acceptanceor otherwise of the implementation/rollback plan,infrastructure, training, documentation, processes, andsoftware
Cost–benefit analysis
Known problem and workaround list.
Process owner,support manager
3. Hardware change: Either 1 or2 completed, plus hardwaredelivery complete
Hardware implementation test complete andaccepted
Infrastructuremanager
4. Additional support line/helpdesk required: Either 1 or 2completed, plus support planimplemented
Support policies and processes complete andagreed on
Support line/help-desk infrastructure (hardware,communications, and software tools) completeand accepted
Support personnel trained and ready
Support line/help-desk manager
5. Change to business processesrequired: Either 1 or 2 completeplus business process changesagreed on, tested and accepted,and business training complete
Business processes agreed on
Business personnel trained and ready
Process manager,customer servicesmanager

◗ Check that the installed software works as expected.
◗ If it does work, make a backup of the system.
◗ If it does not work, deinstall following the manufacturer’s deinstalla-tion instructions.
Of course, at the point where the customer finds that the software doesnot work, they may want to take a number of actions: following the trou-bleshooting guide supplied by the manufacturer, ringing the help line, look-ing at on-line help, or asking for their money back [17].
11.4.2 Single-site delivery of software
For a delivery of new software or an upgrade to an existing system, the stepswithin delivery need to protect processes or people using the system fromunexpected changes. The delivery steps might include:
◗ Awareness, education, and training prior to the delivery—people aremade aware that a change will be made and given any training theywill need, plus details of additional support such as additional help-line numbers.
◗ Carry out normal day’s processing on system.
◗ Carry out end-of-day processes on system.
◗ Back up system.
◗ Overnight, install new software, following steps in the installationprocedures.
◗ Check that the installed software works as expected.
◗ If it does work, make a back up of the system and make ready to go live.
◗ If it does not work, deinstall following the deinstallation instructionsand make ready to go live with the old system.
If the installation was not successful, the team may chose to go live withthe changes anyway; the exit criteria for the delivery would need to definethe acceptance levels.
11.4.3 Multisite rollout of new software to existinginfrastructure
The steps will be similar to the single-site delivery but will be repeated ateach site, and there may be a delay in the rollout or installation to allow thepeople using and supporting the system to become used to it. For a multisiteinstallation a phased approach is easier to manage and less prone to errorthan a “big bang” approach [6]. For new software, for example taking on asoftware tool that replaces manual activities with a radical change in process,a pilot project may be useful. In fact, pilots are useful when the customer forthe delivery is the IT group itself; for example, when taking on a new testing
224 Delivery and Support When Going Live

tool, piloting the use of the tool in a small group and then rolling out to therest of the IT teams is generally recommended [7]. The steps might include:
◗ Choose pilot and make a draft implementation rollout plan forremaining sites.
◗ Awareness sessions for the pilot and release plan.
◗ Implement on the pilot system, as a single-site process, including edu-cation and training.
◗ Monitor and evaluate the pilot, confirm or update rollout plan.
◗ If proceeding, roll out to the next site, as a single-site process, includingeducation and training.
◗ If not proceeding, roll back.
◗ Monitor and evaluate the site, confirm or update rollout plan.
If the pilot is not successful, a decision needs to be made about how toproceed, so the pilot needs its own acceptance and exit criteria. For a withproblems, we might decide to go ahead with the implementation rolloutanyway, or to implement it only in certain areas, or to change/rework thesoftware and repilot, or roll back and look for a different solution.
Once the pilot is complete, if a part of the rollout is not successful thenext move is more difficult; this means that rollback plans should be consid-ered in detail at each stage. If the pilot and the first phase of rollout havebeen accepted, but the second phase fails, should we roll back just the sec-ond phase or to the first phase and pilot as well? Will it still be possible toroll back if data on the systems relies on the new software? Will formats stillbe compatible? The implication of rollout and rollback must be consideredin the delivery planning.
11.4.4 Data migration project software and hardware changes
In this type of project, the delivery is more complex. The project mightrequire making changes to the target system to ready it for the new data,removing data from the source system, perhaps converting its format, load-ing it to the target system, and checking that all the data has been moved.The delivery may take place over several days, and activities on differentsystems may be taking place in parallel:
◗ Prior to the migration, deliver the software and hardware changes tothe target system (see Section 11.4.3).
◗ Carry out final day’s processing on source system.
◗ Carry out end-of-day processes on source system.
◗ Back up source system.
◗ Extract source data.
◗ Final day’s processing on target system.
◗ Carry out end-of-day processes on target system.
11.4 Delivery—typical activities 225

◗ Back up target system.
◗ Convert data.
◗ Load converted data.
◗ Check that all data has loaded.
◗ If all data has loaded successfully, go live on target system.
◗ If data has not loaded successfully, restore to backup on source andtarget.
If the data migration was not successful, the team may chose to go liveanyway; the exit criteria for the migration delivery would need to define theacceptance level for the data. Migrations may be carried out as a big bang orwith a phased approach. As with the multisite approach, the delivery planmust consider the implications of rollout and rollback.
11.5 Exit from deliveryExit from delivery takes place when the exit criteria for delivery have beenmet. This will either be:
◗ When the release activities have completed successfully and the sys-tem is ready for live use; it will then move into the postdelivery stage(Chapter 12);
◗ When the release is declared unsuccessful and the release has beenrolled back.
Table 11.5 lists some examples of exit criteria for delivery.
11.6 ConclusionThe delivery requires involvement of all groups, whether it results in a suc-cessful rollout or in a rollback. There are standard IT infrastructure processesthat support the delivery.
226 Delivery and Support When Going Live
Table 11.5 Example of Exit Criteria from Delivery
Example ofExit Criteria
Example of Deliverables Documented,Reviewed, and Agreed Upon
Example ofAuthorization Owners
Installation and releasecomplete, ready for live use
Delivery checklist complete and reviewed
Updated IT service
Updated configuration management system (newsoftware, live version)
Decommission checklist complete
Known defect list
Resolved defect list
Process owner, ITinfrastructure manager
Release rollback complete Deinstallation checklist complete and reviewed
System restore to preinstallation back up complete
Process owner, ITinfrastructure manager

References
[1] Pol, M., and van E. Veenendaal, Structured Testing of Information Systems,Deventer, the Netherlands: Kluwer BedrijfsInformatie, 1998.
[2] IT Infrastructure Library, Best Practice for Service Support, London, England: Officeof Government Commerce, 2002.
[3] Humphrey, W., Introduction to the Team Software Process, Reading, MA:Addison-Wesley, 2000.
[4] IT Infrastructure Library, Best Practice for Service Delivery, London: Office ofGovernment Commerce, 2002.
[5] Craig, R. D., and S. P. Jaskiel, Systematic Software Testing, Norwood, MA: ArtechHouse, 2002.
[6] Fewster, M., and D. Graham, Software Test Automation, Reading, MA:Addison-Wesley, 1999.
[7] Software Engineering Institute, “A Framework for Software Product LinePractice,” v4.1, Software Engineering Institute Web site, http://www.sei.cmu.edu.
[8] Belbin Associates, “Belbin Team Roles,” http://www.belbin.com/belbin-team-roles.htm, October 2003.
[9] Team Technology Web site, “Working Out Your Myers Briggs Type,”http://www.teamtechnology.co.uk/tt/t-articl/mb-simpl.htm, October 2003.
[10] Honey, P., “Learning Styles,” http://www.peterhoney.co.uk/product/learningstyles, October 2003. PeterHoney.com, 10 Linden Avenue, Maidenhead, Berks,SL6 6HB. Tel.: 01628633946. Fax: 01628633262. E-mail: [email protected].
[11] Kirton, M. J., “Adaptors and Innovators Defined,” see KAI Web site,http://www. kaicentre.com/, July 2003.
[12] de Bono, E., Six Thinking Hats, New York: Penguin, 1999.
[13] Robson, M., Problem Solving in Groups, Aldershot, England: Gower, 1993.
[14] TQMI, Problem Solving—Tools and Techniques, Frodsham, England: TQMI, 2001.
[15] IEEE 1028™ Standard for Software Reviews, 1997.
[16] Gilb, T., and D. Graham, Software Inspection, Reading, MA: Addison-Wesley,1993.
[17] Kaner, C., Bad Software, New York: Wiley, 1998.
Selected bibliography
Belbin, R. M., Management Teams—Why They Succeed or Fail, London, England:Butterworth Heinemann, 1981.
Honey, P., and A. Mumford, The Learning Styles Helper’s Guide, Maidenhead,England: Peter Honey Publications, 2002. PeterHoney.com, 10 Linden Avenue,Maidenhead, Berks, SL6 6HB. Tel.: 01628633946. Fax: 01628633262. E-mail:[email protected].
Kroeger, O., J. M. Thuesen, and H. Rutledge, Type Talk at Work: How the 16Personality Types Determine Your Success on the Job, New York: Bantam DoubledayDell, 2002.
McHale, J., “Innovators Rule OK—Or Do They?” Training & Development,October 1986, http://www.kaicentre.com/.
11.6 Conclusion 227

.

The Life of a System Postdelivery
In this chapter I shall:
◗ Describe the entry criteria, steps, and exit criteria for thepostdelivery stage;
◗ Identify the quality definitions from Chapter 1, which prevailat this stage;
◗ Identify how each of the groups identified in Chapter 2become involved at this stage;
◗ Introduce the types of support activities carried out at thisstage, especially for readers who are not support specialists,including the different types of maintenance changes to thedelivered system;
◗ Introduce techniques that aid teamwork at this stage.
My team has been given the assignment of picking up after this
latest “wow project.” We need to run several manual batch jobs
each day and I’m getting beaten up because the support cost has
gone up by 30% since implementation. I think the project team
got a bonus for this mess!
—Cynical application maintenance manager wondering why
no one involves supporters until after delivery!
12.1 Postdelivery—descriptionPostdelivery covers the life of the software from when it is firstdelivered and while it is being used until it is decommissioned.It is the longest part of a software system’s life span. During thistime, customers use the software while supporters maintainand support it. It comes after the delivery stage covered inChapter 11 (see Figure 12.1).
229
12Contents
12.1 Postdelivery—description
12.2 Delivery viewpoints
12.3 Entry criteria for12.3 postdelivery
12.4 Postdelivery—typical12.4 activities
12.5 Exit from postdelivery
12.6 Conclusion
C H A P T E R

12.1.1 Postdelivery for different types of softwareacquisitions
Postdelivery activities will be different for different types of customers, sys-tems, and software. Let us look at some examples.
12.1.1.1 Commercial off-the-shelf (COTS) package installed bycustomer
The customer installs the software and uses it. Postdelivery, if the softwaredoes not work as expected, they might deinstall and replace it by somethingelse, contact the vendor’s help line for assistance, or find a workaround bythemselves. The vendor may advertise patches that fix reported bugs, andthese may be delivered to the customer on request for the customer toinstall. If the vendor produces a new version of the software, with enhance-ments, the customer may choose to install the upgrade or to continue usingthe existing system without the upgrade. The postdelivery activities are:
◗ Use of the software;
◗ Customer applying patches and upgrades when they are ready, ifwanted;
◗ Deinstallation.
12.1.1.2 System developed in-house
The software system is likely to be used during office hours by the usergroup (customers). There may be overnight batch processing run on behalfof the user group by the operations team (supporters). From time to timemaintenance changes will be applied. These may be requested by the usersthemselves, or they may be required by the IT infrastructure team toimprove support of the system. During the postdelivery period, the IT infra-structure activities will include monitoring and evaluating the system, andproposing changes. Eventually, the system will be decommissioned, and inthe lead-up to that point, data might be migrated to a new system. Activitiespostdelivery include:
◗ Use of the software;
230 The Life of a System Postdelivery
S = Start-upSDLC = Software development life cycleD = DeliveryPD = Postdelivery
PD
D
SDLC
S
Figure 12.1 Life span stage.
◗ Development and installation of maintenance changes;
◗ Monitoring of the system infrastructure and service levels;
◗ Deinstallation and decommissioning.
12.1.1.3 Third-party developed system
The third party who developed the software will have a contract with thecustomer that describes the scope of their responsibility. It may be that theycomplete their responsibility when the acceptance test is complete, or whendelivery is complete, or when some agreed-on period of time has passed (awarranty period), or they may have a long-term support contract. Theactivities might be the same as the COTS package, but perhaps in a largerorganization the IT infrastructure group (supporters) would provide supportfor installation and a service/support line. It might be that the source codehas been delivered and the supporters will carry out maintenance changes,or the third-party suppliers may make the maintenance changes. The activi-ties would include:
◗ Use of the software;
◗ Development and installation of maintenance changes;
◗ Monitoring of the system infrastructure and service levels;
◗ Deinstallation and decommissioning.
12.1.1.4 System with periodic updates
Some software is delivered with an assumption of periodic updates; a goodexample is a virus checker. Here the vendor will supply upgrades at regularintervals; for example, monthly by mail or weekly via a download to thecustomer system. Typical activities include:
◗ Use of the software;
◗ Development and installation of upgrades;
◗ Deinstallation and decommissioning.
12.2 Delivery viewpointsOnce we have installed the software and it is in use, we will evaluate it. By“we,” I mean any one who has an interest in the delivery. We ask: Does ithelp the customers? Are they happy with it? However, if only the views ofthe customers are considered in evaluating the software, we will find thatwe have not considered all the quality views (see Table 12.1).
In fact, a true evaluation of the software can only be made by involvingall the groups, because although the project team has disbanded, all groupshave an interest in quality at this stage. It is almost certain that the softwarewill have maintenance changes, and these may involve work from the
12.2 Delivery viewpoints 231

original development team as well as from maintainers working within thesupporters group. Even with a COTS system installed by the customer, thebuilders, measurers, managers, and supporters at the vendor will have aview on the quality of the software.
For the evaluation, managers will be interested in measures of value formoney and return on investment, supporting the value-based view ofquality.
Supporters, measurers, and builders will be interested in measures ofdefects reported during use, supporting a manufacturing- and product-based view of quality. It is only once the software is live that we can evalu-ate the effectiveness of our defect prevention, identification and removalactivities, including inspection, review, and testing activities. For example,test effectiveness could be measured by comparing the number of problemsfound in live use of the software with the number found during testing,and a similar measure could be made for reviews and inspections [1, 2]. Ifmany more defects are found during QC processes such as testing andreview than during live use, our quality measurement processes may beconsidered effective. We may additionally want to measure where we havemade mistakes and introduced defects, in order to introduce improvementsto reduce defects in future, as the fewer defects introduced, the better ourplanning and build processes were. A very simple example might help:
◗ Suppose we find 30 defects during our testing and reviews. In thefirst 6 months after delivery, we find another 20 defects. The totalnumber of defects is 50. The efficiency of our defect finding processesis 30/50 = 60%.
◗ We analyze the 50 defects. Fifteen were introduced at the point wherewe gathered the requirements and were caused by misunderstandingsbetween the customers and builders. We introduce some training andprocess changes to improve communication between the groups dur-ing requirement gathering, and set an expectation or target for areduction in these types of defects in the next project. When we ana-lyze the defects from that project, we will measure and compare to seeif our process changes resulted in reduced defects.
232 The Life of a System Postdelivery
Table 12.1 Views of Quality at Postdelivery—Simple
Group
Quality View Customer
Transcendent view ✓
User view ✓
Value view
Product view
Manufacturing view

Of course, that is a very simplified example. You would need to takeonto account the other variables such as comparative size and complexity ofthe projects, and you might want to measure the cost rather than thenumber of defects. Of course, there may still be defects we have not foundyet. Perhaps we would want to measure again after 12 months. All I want toindicate here is that it is possible to make measurements and use them toevaluate what work has been done as well as to drive improvement initia-tives for the future.
Customers and supporters engage with the software day to day. Theyhold a transcendent view of quality (“are we enjoying this system?”) butalso the user-based view. They will have a perception of the software as fitfor purpose or otherwise. They will evaluate whether the software hassolved the problem they identified (Chapter 9) during start-up.
Involving all the groups gives a wider view of the quality of the system inuse (Table 12.2).
12.3 Entry criteria for postdeliveryPostdelivery can only be entered if the delivery itself has been successful. Ifthe delivery was rolled back or canceled, then the new software is not inoperation. Example entry criteria are shown in Table 12.3.
12.4 Postdelivery—typical activities12.4.1 Use of the system
This is the whole reason for the work up to the point of delivery. A softwaresolution has been defined, designed, built, tested, and delivered. Finally, the
12.3 Entry criteria for postdelivery 233
Table 12.2 Views of Quality at Postdelivery—Teamwork
Groups
Quality View Customer Manager Builder Measurer Supporter
Transcendent view ✓ ✓ ✓ ✓ ✓
User view ✓ ✓ ✓
Value view ✓
Product view ✓ ✓ ✓
Manufacturing view ✓ ✓
Table 12.3 Example Entry Criteria for Delivery
Example of Entry Criteria Example of Entry Documents Example of Authorization Owners
Installation and release complete,ready for live use
Delivery checklist complete andreviewed, updated IT service,updated configurationmanagement system (newsoftware, live version), knowndefect list, resolved defect list
Process owner, IT infrastructuremanager

customers can use the software that will, we hope, resolve the problem oropportunity identified during start-up. The customers will use the softwareto carry out their tasks.
As we saw in Chapter 11, when software is first delivered, there may beproblems, either with the delivery or with the delivered product. These willneed to be resolved during the delivery period, either by fixing the problemor by working around it. Additionally, the users of the system will be new toit, and will need to learn how to use the system efficiently. This means thatduring the immediate postdelivery period, the customers may feel disillu-sioned. For example, I have recently taken delivery of a new laptop com-puter. My pleasure in unpacking the parcel with the shiny new machinehad dissipated by two days later as I was still trying to install all the software,migrate my data, learn a slightly different keyboard layout, and get the lap-top settings as I wanted. I was quite ready to throw it out of the window!
Once the bedding in of the software has been accomplished and the ini-tial learning curve has been climbed, customers should start to gain benefitsfrom the use of the new software. The organization as a whole will want tomonitor that the cost of the software is outweighed by the benefit of usingit. This should be measured over a period of time, taking into account thedip in enthusiasm (Figure 12.2 and [3, 4]).
Over time, the customers will require changes to the software, to correctproblems, or to enhance the facilities available or to meet some change inrequirements. They need to make a request for a change, and the changewould be planned using the start-up activities we saw in Chapter 9. I willdiscuss changes to software in Section 12.4.3.
12.4.2 IT infrastructure and service management activities
The activities postdelivery include use of the software, monitoring of thesystem, evaluation of the system, maintenance and update of the system,and infrastructure support. The activities needed to support an organiza-tion’s IT provision are covered in a number of best-practice guides, codes ofpractice, and standards, as we saw in Chapter 7; see, for example, those in[3–12]. If we talk to the supporters, we will find typically that they carry out
234 The Life of a System Postdelivery
TIME
Enthusiasm
BenefitPeriod ofblame...
Figure 12.2 Silver bullet life cycle. (From: [3]. © 1998 DISC PD 0005:1998.Reprinted with permission.)

activities based on the recommendations of the IT Service ManagementForum [7], which is an international center of expertise for IT service man-agement. For example, the IT Infrastructure Library (ITIL), [4, 6, 8] and BSICode of Practice for IT Service Management [3] identify activities for ITinfrastructure management, service support, and delivery that focus on thecustomer’s access to services that support the business functions, and thelevel and costs of those activities. These include:
◗ The service, support, or help desk is the customer’s first port of call ifsomething goes wrong; they rely on the other activities in this group.
◗ Incident management is intended to restore normal service as quickly aspossible and minimize impact.
◗ Problem management seeks to minimize the impact of incidents and pre-vent recurrence of incidents.
◗ Configuration management identifies relationships between items thatmake up a system.
◗ Change management controls changes made to the configuration.
◗ Release management controls packages of changes as identified releases.
◗ Service-level management is about understanding, agreeing on, and moni-toring the level of service provided by the IT system, perhaps by meas-uring against service-level agreements.
◗ IT financial management controls running costs for the IT systems, budg-eting, accounting, and charging for services.
◗ Capacity management covers the monitoring and tuning of existing serv-ices, plus forecasting future requirements.
◗ IT service-continuity management is a subset of business continuity anddefines a minimum set of IT provision for business continuity; forexample, looking at whether during a change or release recovery/roll-back is possible.
◗ Availability management looks at the factors from a customer viewpointthat are concerned with availability and reliability of the IT services.
◗ Security management defines and monitors the security of the IT systemsand the software.
◗ Infrastructure management, including network service management,operations management, computer installation and acceptance, andsystems management will continue throughout the life of the soft-ware and the IT system as a whole.
Note: If you are new to this subject area, or just need an overview, [9–11]are quick guides to the subject.
During the life of the software, changes to the overall system and theinfrastructure will be needed. The supporters may need to upgrade hardwareor software components that support the software the customers actuallyuse. A start-up activity to analyze the problem would be needed, followed by
12.4 Postdelivery—typical activities 235

a project to provide a solution, which might be paper-based, software-based,hardware-based, or use some other media, or a mixture of these.
Many of the techniques we discussed in Chapter 9 for identifying andanalyzing problems, for example, the Ishikawa fishbone, are specificallymentioned in ITIL [4] as tools to use postdelivery. Figure 12.3 shows anexample of a partially completed fishbone diagram for customer complaintsabout the help desk; the complaints have been grouped under suitableheadings, showing some of the underlying reasons (root causes) for theproblems. In this example, the customers have complained that the help-desk staff are unaware of new software. During the session to discuss thecomplaints and put together the fishbone diagram, the help-desk team real-ized that they did not receive a known problem list for the new software.They did not know that the software had been delivered!
12.4.3 Making changes to an existing system
During the life of the software postdelivery, customers will identify newproblems to be resolved and new opportunities to grasp, and will encounternew outside requirements. The system may need to be enhanced, correctedor adapted to changes in its environment. To accomplish this, support-ers may need to have it changed to make future support and maintenanceeasier.
When changes are made to existing software, this is called soft-ware maintenance. It takes place in a software-maintenance life cycle(SMLC). Most software projects are SMLCs rather than SDLCs, because soft-ware spends most of its life in the postdelivery stage, being used andchanged. Often, when people say they are working on a SDLC, they areactually working in software maintenance. So the system will be subject tosuccessive cycles of change, often with many changes taking place in paral-lel (Figure 12.4). In fact, these are new SDLCs, involving the whole castof characters from before, and could be described as SMLCs (software-maintenance life cycles).
There are four main types of maintenance changes to software systems:
◗ Corrective;
◗ Enhancement;
◗ Perfective;
◗ Adaptive.
12.4.3.1 Corrective maintenance
These are maintenance changes to rectify problems identified in products;making fixes to software, and correcting typographical or factual errorsmade in documents.
Corrections may be high-priority, even emergency, changes that need tobe done at speed. Many corrections are not high priority or emergency, andcan be built and released in groups or with other maintenance work.
236 The Life of a System Postdelivery

12.4 Postdelivery—typical activities 237
Fishbone of customer complaints about the help desk
Customer complaintsabout help-desk staff
Unable to accessthe frequently askedquestions Web page
FAQ Web pageonly supportedon some versionsof browser; not allcustomershave that
Customer complaintsabout help-desk technology
Wait too long inphone queue
Customers unhappywith help-deskprovision
Help desk is slow tofollow up calls
Customers forgettheir call numbersand have to start anew call
Customer complaintsabout help-desk processes
Did not have knownproblems list
Help-desk staff do nothave knowledge ofnewly installedsoftware
Help-deskstaff soundpatronizingin their responses
Help-desk staffgive overtechnicalresponses and arehard to understand
Help-desk staff do not understand customer’sbusiness viewpoint/problems
Figure 12.3 Example of an Ishikawa fishbone.
PD
D D D D DD
D
D
D
D
SDLC
SDLC/SMLC
SDLC/SMLC
SDLC/SMLC
SDLC/SMLC
SDLC/SMLC
SDLC/SMLC
SDLC/SMLC
SDLC/SMLC
SU
SU
SUSUSUSU
SU
SU
SU
First phaseof delivery
Systemstart-up
Systemdecommissioned/
switched off
System closeddown to use
Corrections (bug-fixes)
Preparation forclose-down, extractof data, anddecommissioning
Second phaseof delivery
SU = Start-upSDLC/SMLC = the software-development life cycle or the software-maintenance life cycleD = DeliveryPD = Postdelivery
Enhancements
Figure 12.4 Parallel changes during postdelivery.

Even emergency changes that take place overnight need to be controlledwithin the life span structure I suggest. Suppose for example, that the over-night batch run stops unexpectedly, or that the company e-commerce Website becomes unavailable. The maintenance to restore the service must takeplace as quickly as possible.
Despite the need for speed, the emergency change will require a start-up(problem and solution definition), some SDLC/SMLC activities, includingrequirements, design, build and test, and delivery. Because it is an emer-gency, a well-understood process with a suitable level of control and followup is vital; it is during an emergency that we make mistakes. An SMLCdesigned as an “on one page” form with suitable checkpoints, tests, andsign-off may well be appropriate. It is important that the actions taken aredocumented. I am reminded of a notice I saw over a nurses’ station in a hos-pital recently, “If it isn’t documented, it didn’t happen.” Once the emer-gency is over, it is easy to forget what steps we took, and these might cause achain reaction, resulting in other problems. Also, following the first-aid fixto the emergency problem, we may wish to revisit the changes, and perhapseven rework them to improve the fix.
Nonemergency fixes may be grouped and worked on in an agreed-upontimescale. Depending on the size of the fixes, it may be appropriate to use atailored rather than a full SDLC, as we saw in Chapter 10.
12.4.3.2 Enhancements
Here the change is to enhance or improve some attribute of the software,either functional or nonfunctional. A group of minor enhancements wouldlead to a minor release and one or more major enhancements may lead to amajor release, as we saw in Chapter 11. Enhancements and nonemergencyfixes are often treated together; grouped according to priority, for example,and released in groups, in an agreed-upon timescale. Depending on the sizeof the changes, it may be appropriate to use a tailored rather than a fullSDLC, as we saw in Chapter 10.
If we build and implement many small enhancements at one time, thismight in itself be a major release in terms of risk; the size of the whole set ofchanges must be considered, as well as the impact of individual changes on“business as usual” and the possible interaction of changes.
One important point to consider is that there can be critical disagree-ment about whether changes are enhancements or correction of defects.This can be a contractual, even a legal issue. If a supplier organization hasto absorb the cost of correcting defects within a fixed-price contract, itmay resist accepting requirements problems as defects. The relationshipbetween groups at this stage can deteriorate as arguments rage aboutwhether a required change is a correction or an enhancement. If the cus-tomers are charged for enhancements but not for corrections, the argumentfrom the builders and measurers may be that the software has been deliv-ered to meet its specification, and if the customers require a change, thismust be an enhancement. However, the customers may have interpreted
238 The Life of a System Postdelivery

the specification differently, or the specification could be wrong. If we carryout the activities we discussed in Chapters 9 and 10, we should find thatthese differences of opinion are reduced. It is also important to have anagreement between all parties that defines what is considered a correctionand what is considered an enhancement.
12.4.3.3 Perfective maintenance
This is work done to make the software more maintainable in future. This isimportant to reduce support and maintenance costs. Typical problems withsoftware that is changed frequently and used over a long period of timeinclude:
◗ The people who know the software and who know the reasons why ithas a certain structure leave, taking knowledge with them.
◗ The documentation that describes the system (requirements docu-ments, design specifications) is not updated with the software, so it isout of date and does not describe the software.
◗ The code becomes increasingly complicated as it is changed over time,and, eventually, it is not possible to tell what is affected by a change.
◗ The complexity and lack of definitive information make it increasinglydifficult to test the changes to the software, especially as softwaretends to become more complex as it is changed over time.
In one organization, I remember that a package had been customized forparticular clients, but each client’s software was built on some central code.One of the programmers, in making a change to a client area of the code,changed code that affected all the clients, without realizing it. It was so diffi-cult to understand the code that this mistake was not surprising; the softwarehad grown almost organically over the years, and was not structured for easymaintenance. It was also impossible to know that the testing had covered thechanges and the rest of the software sufficiently. The software needed to becompletely restructured to make it possible to maintain and test it.
The activities in perfective maintenance include rewriting code toimprove its structure (reengineering the code) and writing specification anddesign documents that describe the existing system (retrodocumentation).
12.4.3.4 Adaptive maintenance
These maintenance changes are made to support changes in the software’senvironment; for example, it may be necessary to upgrade hardware orsystems software, or other supporting parts of the IT infrastructure. The soft-ware may need to be changed—adapted—to work properly in its new envi-ronment. This may include “porting” software or migrating data to a newinfrastructure, in which case the software or the data or both may need to beadapted. An example would be my new laptop; moving my databases onto
12.4 Postdelivery—typical activities 239
the new laptop was easy—copy to and from removable media. However, inorder to use the data in the database, I had to make a choice either to allowthe upgraded database software to reformat the data, in which case I wouldnot be able to use it on the older laptop, or to use it as read-only. The newsoftware was going to carry out adaptive maintenance on the data to changeits format.
12.4.3.5 Who gets involved in a change?
All the groups have an interest in the changes made:
◗ Customer: How will this change affect me? What is its impact? Whatare the implications for my normal work? Will it affect business asusual? Will it benefit me? What are the risks? Do I want this change?
◗ Supporter: How will this change affect me? What is its impact? What arethe implications for the IT infrastructure and for service management?Will it benefit me? What are the risks? Do I want this change?
◗ Manager: What are the cost implications of making the change and ofnot making the change? Will there be a cost–benefit trade-off? If we dothis work, what other work has to be halted? What is the priority of thischange compared with others?
◗ Builder: Will I be asked to make the change? Do I want to make thechange? Do I understand the change?
◗ Measurer: Will I be asked to test the change? What else needs testing?Can I test the change?
Whatever the size of the change we want to make, we need to involveall the groups and go through the activities described in Chapters 9, 10, and11. For a small change we would do a “cut-down” version of the activi-ties—the checklist approach we have looked at in the earlier chapters. For alarge change we would take a more detailed approach. Even an emergencyfix requires involvement from the different groups, to get an understandingof the impact of the problem and the proposed fix. In one organization, theovernight call went not just to the analyst/programmer who would imple-ment the change, but also to a senior business user who would assess theimpact on business as usual of the proposed fix, compared with the impactof the problem itself.
12.4.3.6 Testing changes to software
Testing changes to existing systems is difficult. Because it is easy to makechanges that have an unexpected effect on software, we want to make surethat the change works, and that other parts of the software have not beenchanged. The assessment of the impact of any proposed changes must bemade both in terms of what products are effected—“If this screen ischanged, the user documentation and the training material also needchanging”—and also in terms of what measurement and assessment is
240 The Life of a System Postdelivery

needed—“If this screen is changed, I need to test that the change is correctin all those products, and also to check that these other related parts of thesoftware and other products have not changed.” This is known as regressiontesting; we need to check that we have not changed anything we should nothave changed. The need for regression testing means that changes that looksimple may be expensive; the requirements, design and build part of theSMLC may be easy and cheap to do, but the testing, including a regressiontest, may take a long time and be difficult to plan and execute. I do not wantto get into the detail of regression testing here, but it must be consideredwhen considering the impact of a change:
You are right to emphasize the testing task. I remember one major bank say-
ing that whenever they had made significant changes to their core banking
system, they always had to run a regression test that cost several million dol-
lars, and took several weeks to complete. (Richard Warden, personal com-
munication, July 2003)
There is no reason to suppose the burden will decrease with Web siteand e-commerce work; continuous change will mean continuous regressiontesting of very public functional and nonfunctional attributes.
12.4.4 Monitoring and evaluation
During the postdelivery period, we can monitor the use of the software andcollect information that will help us measure the success of the originalSDLC and of subsequent SMLCs. We can also monitor and evaluate theservice management and infrastructure management services.
Because the postdelivery period of the software is the longest part of itslife span, we will want to look for improvements in the software itself and inthe surrounding support services. ITIL [4], for example, suggests use of theDeming Cycle, proposed by W. Edwards Deming [13]. The cycle has fourstages, sometimes called the Plan, Do, Check, and Act cycle and sometimesthe Plan, Do, Review, and Improve cycle (see Figure 12.5). Here, we planwhat to do, and we do it. Then we review what we did. Was it successful?Did it go as planned? What should we improve? We then put improvementsin place and plan the next cycle of activities.
12.4.4.1 Evaluation of the SDLC/SMLC
A formal evaluation of each SDLC/SMLC is important; this should involverepresentatives of all the groups. The evaluation needs to be timed sensi-tively, and may need to be a series of evaluations over a period of time. Iremember one project manager saying, “Never have the end-of-projectparty until six months after the software’s been installed!” Table 12.4 showssome possible timings for evaluation and the advantages and disadvantagesof each.
12.4 Postdelivery—typical activities 241

Evaluation meetings need to be managed carefully, so take into con-sideration of some of the team and communication techniques we havediscussed in earlier chapters. Use the Six Hats [14] technique described inAppendix A, for example, to help participants look for good points as well asbad points for the evaluation (Table 12.5).
12.4.4.2 Ongoing monitoring and evaluation of software
Part of the service delivery work will include monitoring the software andsurrounding services, including numbers of problems reporting to the helpdesk or support lines. These should be used to analyze whether:
◗ SDLC/SMLC software/code products could be improved, for example,if problems are being reported that could be resolved by better design,or might have been found with improved testing.
◗ Other SDLC/SMLC products could be improved, for example, if a task isdescribed in the on-line help or user guide, but customers cannot find
242 The Life of a System Postdelivery
Three cycles of improvement
PlanPlan
Plan
Cycle 3
Cycle 2
Cycle 1
Improve
Improve
Improve
Review
Review
Review
Do
Do
Do
Figure 12.5 Plan, Do, Review, and Improve cycle. (After: [13].)
Table 12.4 Timing the Postdelivery Evaluation of the SDLC/SMLC
Time After Delivery Advantage Disadvantage
Immediately Will not have forgotten the good and badpoints of the SDLC/SMLC.
Too soon to tell if the software works inreality.
During the immediatepostdelivery period
Will not have forgotten the good and badpoints of the SDLC/SMLC.
May be too busy. May be too soon toassess.
During low point ofperiod of blame(Figure 12.2)
Will not lose information about theproblems and areas for improvement.
Will be only focused on bad points.Evaluation meeting likely to beunpleasant.
Six months afterdelivery
Can do cost–benefit analysis against aperiod of use. Successes and problemsseen against perspective of real use.
Too late to influence the followingprojects. Team now focused on otherprojects. May have forgotten bothproblems and what was done well.

the information, it does not mean they are foolish; it means the userguide and on-line help should be improved.
◗ SDLC/SMLC software/code and other products are not deterioratingover time; for example, as changes are made to code, it can becomemore complex, until it is far too expensive to change and test success-fully. Tools are available for measuring software complexity, so this can
12.4 Postdelivery—typical activities 243
Table 12.5 Techniques Used to Aid Teamwork Postdelivery
Subject Area Technique Examples In 30 Seconds… (see Appendix A for more)
Team relationshipsand naturalroles/team skills
Belbin Team Scores [15] Support of the software can fail because of personal ratherthan technical factors. Teams need to understand theirstrengths and weaknesses as a team. A balance ofroles/skills is required in the personalities in the team.Example roles: plants have new ideas; completer–finisherswant to finish to fine detail. Too many plants and you willnever finish anything.
Improvecommunication—empathy with others
MBTI [16]
Honey & Mumford [17]
Kirton [18]
Different people have different personalities andcommunication styles. People who wave their arms aroundand talk a lot can annoy people who like to be quiet andthink, and vice versa. The Myers-Briggs Type Indicator(MBTI) identifies four contrasting type pairs, e.g.,Introvert/Extrovert, leading to 16 “types” (e.g., INTJ isIntrovert-iNtuitive-Thinking-Judging). The Honey & MumfordLearning Styles Questionnaire identifies preferred learningstyles (e.g., Pragmatists vs. Theorists) require differentexperiences to learn. Kirton identifies preferredproblem-solving methods (Adaptors vs. Innovators)—do webreak the rules or work within them?
Improve meetings De Bono’s Six ThinkingHats [14]
Improve meetings by setting rules for behavior. Six “hats”are used. Everyone wears the same color hat at the sametime: Blue Hat—meeting structure, Black Hat—pessimistic,Yellow Hat—optimistic, Red Hat—feelings, White Hat—facts, Green Hat—creative ideas. Allows meeting membersto move outside their stereotypes and allows time fordifferent, sometimes difficult types of communication.
Identify problemsand root causes, findsolutions
Ishikawa fishbones[4, 19]
Use to identify problems, root causes of problems andsolutions. On a fishbone diagram, brainstorm problems,their possible causes, their root causes, and, therefore,solutions to the root cause.
Review processes Reviews [2, 20] For processes use audit. For checking process documentsuse walkthrough, peer review, or inspection.
Understand whetheran idea is worthpursuing
Risk workshop bybrainstorming [19, 21]
Cost–benefit analysis[4, 21]
A brainstorming workshop is run to list all the possiblerisks people can identify. The risks are sorted into groups,separating risks (might happen in the future) from issues(problems right now) and constraints. The risks are scoredfor impact and likelihood, and ranked to give a prioritizedlist.
Cost–benefit analysis is done by calculating the predictedbenefits of the proposed change (time, money saved) andsetting this against the predicted cost. An example of aworked cost–benefit analysis for service support is in [4], ageneral worked example is in [21], and there is also anexample in Appendix A.

be monitored over time. Additionally, other products can become outof step with the code, and this can be monitored through configurationmanagement if it is applied to all products and not just the code.
◗ Service support and delivery could be improved. For example, if cus-tomers find they are waiting too long for a response from the helpdesk, what could be done to improve call turnaround?
12.4.4.3 Monitoring and evaluating the postdelivery processes
This can be done by carrying out process audits [20] to check that thedefined processes are being followed and that they are suitable. ITIL suggestsuse of the EFQM Excellence Model or its U.S. equivalent, the Baldrige crite-ria [4, 22, 23]. As we saw in Chapter 1, EFQM would expect evaluation ofmeasured performance and perceptions of the postdelivery services fromthe viewpoint of the Customers. Society results measure what the organizationis achieving in relation to local, national and international society, whereappropriate—the wider customer group. It would also expect measurementof People (those who are employed to carry out the work, in this case, thebuilders, measurers, supporters, and managers). EFQM expects measure-ment of the Key Performance Results, including financial measures such asreturn on investment, which will interest the managers and customers.
12.5 Exit from postdeliveryWe only exit from postdelivery when the software is deinstalled (removed)or the system closes down. This may never happen; some software is morethan 20 years old, and if it is still working, there is no real reason to removeit. Some systems and software are deinstalled or decommissioned. The exitfrom postdelivery will generally take place when the replacement softwareis available. Typically, a full SDLC (Chapter 10) and delivery will have com-pleted successfully before the old software is removed and the old infra-structure decommissioned. It may be that the old and new software are runin parallel for a while; the same tasks being carried out on both until thecustomers and supporters are satisfied that the new software and system hasbeen delivered correctly. In Table 12.6, we see examples of exit criteria forpostdelivery.
12.6 ConclusionIn Chapters 8 to 12, we have followed a software system through its lifespan, from start-up, through the SDLC, into delivery, and so into theactivities of postdelivery, including repeated SMLCs. In summary the activi-ties are:
◗ Start-up: We explore the problem until we understand it, decidewhether it is worth solving, set general constraints and parameters for
244 The Life of a System Postdelivery

the solution, decide how to approach the problem, for example, asoftware solution may be appropriate, and agree on a formal or infor-mal contract of work, with constraints and acceptance criteria and anoutline or high-level plan.
◗ SDLC: We plan the SDLC in detail and monitor the activities, we managechange, we define the requirements in detail, we design products,including the software code, we build the software based on the designs,and we test to see that the software and other deliverables are OK.
◗ Delivery: We install the software and check that it has installed correctly.
◗ Postdelivery: We use the software, carry out service delivery and sup-port activities, carry out IT infrastructure activities, make changes tothe software, and monitor and evaluate the postdelivery activities tolook for improvements.
At each stage, all the groups must contribute; at each stage customers,managers, builders, measurers, and supporters help enable software qualityto be built into the software and to be confirmed. We saw in Chapters 3 to 7that each group holds its own view of quality, and that all these views arereasonable and must be considered.
No single standard will help right through the software life span. TheEFQM Excellence Model [22] will provide a framework for all activities, andwith techniques like Balanced Scorecard [24], enable a strong alignmentbetween the goals of IT and its customers, perhaps in one integrated man-agement system. Within that elements of CMM [25] and its relations, suchas the Team and Personal Software Processes [26, 27], ISO 9000 [28] willenable us to control our work during the SDLC and help us decide whichSDLC model we use, whereas the ITIL [4] will provide a structure during thedeployment and optimization of the software as it is being used andchanged.
12.6 Conclusion 245
Table 12.6 Example of Exit Criteria from Postdelivery
Example of Exit CriteriaExample of Deliverables Documented,Reviewed, and Agreed Upon Example of Authorization Owners
System ready to decommission:new system accepted, datamigrated
Acceptance criteria sign-off list.
Accepted new system (SDLC exitand delivery exit).
Data migration controls sign-off.
Parallel run sign-off.
Business process owner,infrastructure manager
System decommission complete Data migration complete.
Parallel run complete.
Software and data back up andarchive complete.
Software close-down checklistcomplete.
Hardware close-down checklistcomplete.
Business process owner,infrastructure manager

Teamwork and communication is fostered by clear processes, whichencourage involvement from all the groups, and recognize their differentviewpoints. Clear entry and exit points agreed on by all the groups will helpthis. I mentioned W. Edwards Deming earlier; he distilled his philosophy ofquality management into 14 points [13]. In the ITIL [4], a number of thesepoints are highlighted, and at the top of their list is a key point: “Break downbarriers—improve communication between departments” [4, 13].
Let me take this further: Break down barriers between people; commu-nication and team work are key to achieving software quality. It is not myresponsibility, and it is not your responsibility. It is our responsibility,together.
References
[1] Fewster, M., and D. Graham, Software Test Automation, Reading, MA: Addison-Wesley, 1999, pp. 211–219.
[2] Gilb, T., and D. Graham, Software Inspection, Reading, MA: Addison-Wesley,1993, pp. 386–388.
[3] British Standards Institute, DISC PD 0005:1998, Code of Practice for IT ServiceManagement, 1998 (PD0005).
[4] IT Infrastructure Library, Best Practice for Service Support, London, England: Officeof Government Commerce, 2002.
[5] IT Service Management Forum, “BS 15000 IT Service Management,” http://www.bs15000certification.com, October 2003.
[6] IT Infrastructure Library, Best Practice for Service Delivery, London, England: Officeof Government Commerce, 2002.
[7] IT Service Management Forum, “IT Service Management Forum,” http://www.itsmf.com, October 2003.
[8] IT Infrastructure Library, “IT Infrastructure Library”; see the ITIL Web sitehttp://www.itil.co.uk or the TSO Web site http://www.tsonline.co.uk/bookshop/bookstore.asp?FO=1150345, October 2003.
[9] IT Service Management Forum, A Dictionary of IT Service Management: Terms,Acronyms and Abbreviations: Version 1, London, England: The Stationery Office,2001.
[10] IT Service Management Forum, IT Service Management: A Companion to the ITInfrastructure Library: Version 2, London, England: The Stationery Office, 2001.
[11] IT Service Management Forum, A Dictionary of IT Service Management: Terms,Acronyms and Abbreviations: Version 1 (North America), London, England: TheStationery Office, 2001.
[12] British Computer Society, BCS Qualifications, http://www1.bcs.org.uk/link.asp?sectionID=574, September 2003.
[13] The W. Edwards Deming Institute, “Deming’s Teachings,” http://www.deming.org/theman/ articles/articles_gbnf04.html, November 2003.
[14] de Bono, E., Six Thinking Hats, New York: Penguin, 1999.
246 The Life of a System Postdelivery

[15] Belbin Associates, “Belbin Team Roles,” http://www.belbin.com/belbin-team-roles.htm, October 2003.
[16] Team Technology Web site, “Working Out Your Myers Briggs Type,” http://www.teamtechnology.co.uk/tt/t-articl/mb-simpl.htm October 2003.
[17] Honey, P., “Learning Styles,” http://www.peterhoney.co.uk/product/learningstyles, October 2003. PeterHoney.com, 10 Linden Avenue, Maidenhead, Berks,SL6 6HB. Tel.: 01628633946. Fax: 01628633262. E-mail: [email protected].
[18] Kirton, M. J., “Adaptors and Innovators Defined,” KAI Web site,http://www.kaicentre.com/, July 2003.
[19] TQMI, Problem Solving—Tools and Techniques, Frodsham, England: TQMI, 2001.
[20] IEEE 1028™ Standard for Software Reviews, 1997.
[21] Robson, M., Problem Solving in Groups, Aldershot, England: Gower, 1995.
[22] European Foundation for Quality Management, “EFQM Excellence Model,”http://www. efqm.org, August 2003.
[23] Malcolm Baldrige model, http://www.quality.nist.gov/index.html, August2003.
[24] Kaplan, R. S., and D. P. Norton, The Balanced Scorecard, Boston, MA: HarvardBusiness School Press, 1996.
[25] Software Engineering Institute, “Capability Maturity Model,” http://www.sei.cmu.edu, July 2003.
[26] Humphrey, W., Introduction to the Team Software Process, Reading, MA: SEI, 2000.
[27] Humphrey, W., Introduction to the Personal Software Process, Reading, MA: SEI,1997.
[28] International Standard Institute, ISO 9000:1994 and ISO 9000:2000 QualitySystems.
Selected bibliography
Belbin, R. M., Management Teams—Why They Succeed or Fail, London, England:Butterworth Heinemann, 1981.
Deming, W. E., Out of the Crisis, Cambridge, MA: MIT Press, 2000.
Honey, P., and Mumford, A., The Learning Styles Helper’s Guide, Maidenhead,England: Peter Honey Publications, 2002. PeterHoney.com, 10 Linden Avenue,Maidenhead, Berks, SL6 6HB. Tel: 01628633946. Fax: 01628633262. E-mail:[email protected].
IT Infrastructure Library, Best Practice for Application Management, London,England: Office of Government Commerce, 2002.
IT Infrastructure Library, Best Practice for Security Management, London, England:Office of Government Commerce, 2002.
Kroeger, O., J. M. Thuesen, and H. Rutledge, Type Talk at Work: How the 16Personality Types Determine Your Success on the Job, New York: Bantam DoubledayDell, 2002.
McHale, J., “Innovators Rule OK—Or Do They?” Training & Development,October 1986, http://www.kaicentre.com/.
Quagliariello, P., “Introduction to IT Service Management, ITIL and ITIL CapacityManagement,” http://www.pultorak.com/home/speaking_engagements/pre-sentations/ 2003_03_07_cmg.pdf, October 2003.
12.6 Conclusion 247

.

Appendix A
Techniques and Methods
This appendix is summary of the techniques mentioned in the chapters,with additional information and resources for you to follow up ideas thatinterest you. If you start a literature or Internet search for any of these topicsyou will find much more information and other related or similar tech-niques. This appendix is intended to introduce you to ideas and resourcesrather than to be a complete compendium of the techniques available.
A.1 Communication, team dynamics, and meetingbehavior
We all carry with us taken-for-granted assumptions about the world andother people—what is normal and how people should behave—and it theseassumptions that allow us to build trust between individuals within groupsand organizations [1]. Although many taken-for-granted assumptions areshared, there will be differences between cultures, organizations, and fam-ily/friendship groups. Just because you “always do it that way” it does notmean it is the right way. One of our assumptions can be that others willshare our taken-for-granted assumptions. If we discover that other peoplehave different core beliefs, we are surprised and may dismiss their views aswrong—it is hard to see other people’s view. We may also assume that otherpeople communicate in the same way as we do, that they share our sense ofhumor, use body language in the same way, and share our preference forwritten, pictorial, or verbal messages. I recently had a discussion with a col-league because we could not understand each other. It turns out that weused two key phrases in opposite ways, both equally correct but meaningthe opposite of each other:
◗ I had used “I think” to mean “I am not sure” but my colleague hadused “I think” to mean “I am certain.”
◗ My colleague had used “I feel” to mean “I am not sure” but I had used“I feel” to mean “I am certain.”
249

These communication differences are increased by cultural differencesbetween organizations, and between colleagues from different types oforganization, and from different countries. We need to be careful of ourown taken-for-granted assumption, and be aware of other people’s withoutdismissing them. This section is an introduction to some of the techniquesand ideas people have developed to help understand and bridge communi-cation gaps.
In this appendix, I will introduce a number of ways of examining com-munication preferences. It is very important that to get the most from thesetechniques, you use this as just a taster. I have suggested search words tohelp you find out more from the Internet, and there are books, journals, andWeb sites in the references and selected bibliography. Be aware also thatyou will not get the most from some of these techniques without the help ofspecialists; psychometric tests are not to be played with.
For this section, the Internet/Web search words are: taken-for-grantedassumptions, communication skills, team work, ethnomethodology, sociol-ogy, team dynamics, body language, transactional analysis, personalitytypes, culture, Garfinkel, Busco, emotional intelligence, and Goleman.
A.1.1 Belbin Team Roles
Whether teams are drawn from all the groups (customer, manager, builder,measurer, supporter) or from a single group, work can fail to be successful ifpeople in the group do not understand their strengths and weaknesses asteam members. This means we may fail to deliver and support software suc-cessfully because of personal rather than technical factors. Teams need tounderstand their strengths and weaknesses as a team. Belbin [2–4] defined anumber of roles that people take when in a team. These are summarized inTable A.1.
A balance of roles/skills is required in the personalities in the team if it isto be successful. For example, plants have new ideas whereas completer–fin-ishers want to finish to fine detail. If you have too many plants in the teamyou will never finish anything, but if you only had completer–finishers, youmight not have so many new ideas. Each person in the team takes an assess-ment, and this provides a picture of the strengths and weaknesses of theteam as a whole. All the roles are needed, so if one is missing, either theteam fails or some team members take on secondary roles. I have certainlyobserved that people will change roles depending on the particular team,but they may not be comfortable. Most people will score to show a mix ofthe team roles.
Assessment is by a questionnaire that is administered and marked by aBelbin assessor. Details of how to get a Belbin assessment for a team can befound on their Web site [4]. Assessments may be on-line or by mail. Theyalso provide training for certification in use of Belbin assessments. It is bestto use qualified people to administer these types of tests.
The earlier work by Belbin [2] has been updated, and the latest thinkingis in [3, 4].
250 Appendix A

In this section the Internet/Web search words are: Belbin, team, teamdynamics, and team roles.
A.1.2 De Bono’s Six Thinking Hats
Sometimes in meetings, we either find that the same people always contrib-ute the in the same way—“Joe’s always so pessimistic and negative” or“Mary never acknowledges there might be problems”—and sometimes themeeting dissolves into acrimonious chaos, with people no longer on speak-ing terms. Can we do anything about this? Edward de Bono [5] decided thatwe could, and the Six Thinking Hats was the result. I first came across it asan idea for improving software projects from Jens Pas’ EuroSTAR presenta-tion and workshop [6] as a means of introducing emotional intelligence torationally biased software projects; in other words, allowing fact-based peo-ple an opportunity to also express emotional views.
Use of de Bono’s Six Hats at a meeting encourages people to take differ-ent roles at the meeting, and to categorize their communication and thusimprove it. This means that it is acceptable to express emotion, for example,but we separate those communications from the other communications,such as collection of facts. The six hat colors and their meaning are summa-rized in Table A.2.
By using the hats, we set rules for behavior. Everyone wears the samecolor hat at the same time, and the hats are not associated with particular
A.1 Communication, team dynamics, and meeting behavior 251
Table A.1 Belbin Team Roles
Team Role Contribution Allowable Weakness
Plant Creative, imaginative, unorthodox
Solves difficult problems
Ignores incidentals
Too preoccupied to communicate effectively
Resourceinvestigator
Extrovert, enthusiastic, communicative
Explores opportunities
Develops contacts
Overoptimistic
Loses interest once initial enthusiasm haspassed
Coordinator Mature, confident, a good chairperson
Clarifies goals, promotes decision making,delegates well
Can be seen as manipulative
Offloads personal work
Shaper Challenging, dynamic, thrives on pressure
The drive and courage to overcome obstacles
Prone to provocation
Offends people’s feelings
MonitorEvaluator
Sober, strategic and discerning
Sees all options
Judges accurately
Lacks drive and ability to inspire others
Teamworker Cooperative, mild, perceptive and diplomatic
Listens, builds, averts friction
Indecisive in crunch situations
Implementer Disciplined, reliable, conservative and efficient
Turns ideas into practical actions
Somewhat inflexible
Slow to respond to new possibilities
Completer–finisher
Painstaking, conscientious, anxious
Searches out errors and omissions
Delivers on time
Inclined to worry unduly
Reluctant to delegate
Specialist Single minded, self-starting, dedicated
Provides knowledge and skills in rare supply
Contributes on only a narrow front
Dwells on technicalities

people. This allows meeting members to move outside their perceivedstereotypes and allows time for different, sometimes difficult types of com-munication. De Bono discussed the order and way the hats are used; itdepends on the meeting and the problem, as well as the team’s experiencein using the techniques. Suppose we have a meeting to discuss a design foran interface. We might have a meeting agenda like this:
◗ Blue Hat to set the scene—why are we here and what do we want toachieve?
◗ White Hat—what facts do we have about the design that every one canagree on?
◗ Red Hat—do we like or dislike the design—what is our gut feel about it?
◗ Yellow Hat—what are the good things about the design?
◗ Black Hat—what disadvantages can we see in the design?
◗ Green Hat—can we identify new ideas to help us overcome the blackhat points?
◗ Red Hat—how do we feel now about this design?
◗ Blue Hat to close the meeting—what are the next steps?
The advantages that de Bono identifies [5] are:
Powerful, focused working which is
◗ Time saving because the meeting is not run as a series of confronta-tional arguments, thus
◗ Removing of ego by removing confrontation allowing the meeting to dealwith
◗ One thing at a time.
252 Appendix A
Table A.2 Six Hats at a Meeting
Hat ColorWhen we ask everyone to wear this color hat, it means the meeting willfocus on
White Providing facts—what information do we have? Do we know it is fact,or is it opinion?
Red Adding to the White Hat thinking by expressing our feeling about thesituation we are discussing and working from intuition, hunches,opinion—what do we feel? What is our “gut reaction”? Can weidentify sensitivities?
Black Identifying what could go wrong—should we be cautious about this?What risks are there? What have we overlooked? What if?
Yellow Looking for the positive things—what benefits are there? What new proposalsdo we have? How can we make this happen? What if? Leading to …
Green Creating new ideas—supposing we tried…? We could do it this way instead!
Blue Thinking about the process of the meeting itself—was that what we meet tocover? Which hat would be useful now? Have we spent long enough inBlack Hat?

All the ideas from all the people at the meeting at treated as parallelrather than confrontational—once a complete picture has been arrived atusing the Six Hats then it is easier for people to agree a solution or make adecision. We can use the hats to change the focus of the meeting: “It lookslike with the Yellow Hat thinking we have identified some real advantagesto the approach we’re discussing. Let’s just try some Black Hat think-ing—what are the disadvantages?”
You can find more information about de Bono’s work on thinking,including the Six Thinking Hats, on his Web site [7].
In this section the Internet/Web search words are: de Bono, Six Hats,Meetings, and team work.
A.2 Communication stylesIn order to improve communication with others, we need to understandtheir points of view and communication styles. We need to empathize withothers. I do not intend to pigeonhole people by discussing these indicatorsof communication styles, but I think it is useful to consider that our ownpreferences are not “right”—they are just preferences. My observationof people is that their preferences will change with mood, context, andgroup mix.
A.2.1 Myers-Briggs Type Indicators
The work of Myers and Briggs, described, for example, in [8–11], suggestedthat different people have different personalities and communication styles.To put it at its simplest, people who wave their arms around and talk a lotcan annoy people who like to be quiet and think, and vice versa. Myers andBriggs built the Myers-Briggs Type Indicator (MBTI), which identifies four con-trasting type pairs:
◗ E and I: Extroversion (e.g., prefers social interaction) versus Introver-sion (e.g., quiet and private)
◗ S and N: Sensing (e.g., experience and practicality) versus iNtuition(e.g., prefers novelty and aspiration)
◗ T and F: Thinking (e.g., prefers analytic or critical approach) versusFeeling (e.g., prefers sympathizing and appreciative approach)
◗ J and P: Judgment (e.g., prefers firmness and control) versus Percep-tion (e.g., prefers flexibility and spontaneity).
There are other factors which make up the pairs, as you see if you look at[8–11]. These four pairings give rise to 16 “types” (e.g., INTJ is Introvert-iNtuitive-Thinking-Judging), as summarized in Table A.3.
We discussed briefly in Chapter 5, how these communication prefer-ences might affect the communication between builders and other groups.Conflicts arise between any two people, regardless of group. You can see
A.2 Communication styles 253
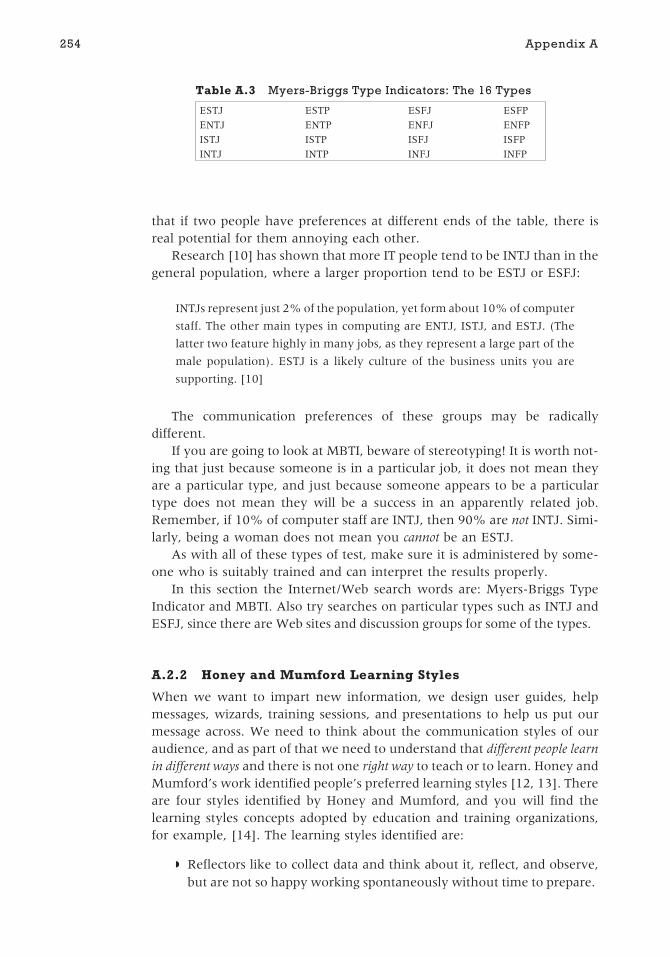
that if two people have preferences at different ends of the table, there isreal potential for them annoying each other.
Research [10] has shown that more IT people tend to be INTJ than in thegeneral population, where a larger proportion tend to be ESTJ or ESFJ:
INTJs represent just 2% of the population, yet form about 10% of computer
staff. The other main types in computing are ENTJ, ISTJ, and ESTJ. (The
latter two feature highly in many jobs, as they represent a large part of the
male population). ESTJ is a likely culture of the business units you are
supporting. [10]
The communication preferences of these groups may be radicallydifferent.
If you are going to look at MBTI, beware of stereotyping! It is worth not-ing that just because someone is in a particular job, it does not mean theyare a particular type, and just because someone appears to be a particulartype does not mean they will be a success in an apparently related job.Remember, if 10% of computer staff are INTJ, then 90% are not INTJ. Simi-larly, being a woman does not mean you cannot be an ESTJ.
As with all of these types of test, make sure it is administered by some-one who is suitably trained and can interpret the results properly.
In this section the Internet/Web search words are: Myers-Briggs TypeIndicator and MBTI. Also try searches on particular types such as INTJ andESFJ, since there are Web sites and discussion groups for some of the types.
A.2.2 Honey and Mumford Learning Styles
When we want to impart new information, we design user guides, helpmessages, wizards, training sessions, and presentations to help us put ourmessage across. We need to think about the communication styles of ouraudience, and as part of that we need to understand that different people learnin different ways and there is not one right way to teach or to learn. Honey andMumford’s work identified people’s preferred learning styles [12, 13]. Thereare four styles identified by Honey and Mumford, and you will find thelearning styles concepts adopted by education and training organizations,for example, [14]. The learning styles identified are:
◗ Reflectors like to collect data and think about it, reflect, and observe,but are not so happy working spontaneously without time to prepare.
254 Appendix A
Table A.3 Myers-Briggs Type Indicators: The 16 Types
ESTJ ESTP ESFJ ESFP
ENTJ ENTP ENFJ ENFP
ISTJ ISTP ISFJ ISFP
INTJ INTP INFJ INFP

◗ Activists like to do things, work in teams, and try things out, but theylearn less from teaching by lectures or reading on their own.
◗ Theorists like new ideas and enjoy adapting and integrating observa-tions into complex and logically sound theories, but they do not enjoysituations that emphasize emotion and feelings, or unstructured activi-ties with poor briefing.
◗ Pragmatists like training that is related to their immediate job or prob-lem, where they have a model to follow, but they do not like trainingwith no apparent payback to the learning, or if they see the event orlearning is “all theory.”
This means that when we need to get new ideas across to people, weneed to think about two things:
◗ Who needs to know about what and can we identify their preferredlearning style? For example, not everyone will learn from a slidepresentation.
◗ Who would be good at delivering the information in that style? Forexample, not everyone is comfortable with teaching a role play/groupwork session.
If we are implementing a large, new system affecting many people wemay need to offer several different ways for people to learn about the sys-tem itself, when and how it will be implemented, and how to get help andfurther information. We may even want to consider how we organize QAand QC measurement activities using these ideas; activists and pragmatistsmay find that a review of a working prototype, perhaps with a role playrehearsal, helps them to identify potential problems, and perhaps theoristsand reflectors may get more from an inspection process.
The importance of learning and creativity in management is beingincreasingly recognized and other theories have been advanced, but as thereis evidence that the Honey and Mumford approach links with the MBTI wediscussed in Section A.2.1, and it is designed specifically to link to organiza-tions and management [15], I have just described this one approach.
The Learning Styles Helper’s Guide and The Learning Styles Questionnaire 80Item Version (containing the questionnaire) are copyrighted by and availablefrom Peter Honey Publications. The questionnaire is also available on-line athttp://www.peterhoney.com or from Peter Honey Publications Limited, 10Linden Avenue, Maidenhead, Berks SL6 6HB. A description of the learningstyles is reproduced by permission of Peter Honey [13].
In this section the Internet/Web search words are: Honey, Mumford,learning styles, reflector, activist, theorist, pragmatist, and training styles.
A.2.3 Kirton adaptors and innovators
Kirton’s work on adaptors and innovators looks at two groups of characteris-tics that each of us have to a greater or lesser degree; we are a mix. Adaptor
A.2 Communication styles 255

characteristics are those of discipline, efficiency, and resolving problemswithin the existing rule set and with an eye to maintaining the team’s cohe-sion. Innovators challenge the rules, and may appear to adaptors to beinsensitive to needs of the team; they enjoy radical change and challengingthe accepted rules. This theory is not about ability; it assumes all people arecreative and instead asks “Will someone prefer to be creative within therules or by breaking the rules?” We all find ourselves somewhere on thecontinuum between extreme adaptor and extreme innovator:
The beauty about the KAI is that it makes no negative evaluations about
people. Whatever point you find yourself on along the continuum, you will
find advantages and disadvantages associated with being there. Indeed,
what will be useful and appropriate (advantageous) in one situation might
cause problems in another. Armed with this insight, it then becomes possi-
ble for people to make informed choices about how they cope with the situa-
tions they find themselves in. [16]
The KAI characteristics are measured by a short test; information aboutthis is on the KAI Web site [17]. Again, it needs to be properly administeredand interpreted by a trained and certified KAI administrator.
In this section the Internet/Web search words are: KAI, Kirton, adaptor,innovator, and creativity.
A.2.4 Motivation studies
“We have sent them on a training course, we have bought them new PCsand we paid them a bonus—and they are still miserable! What’s wrong withthese people?” That director of a software company had motivational prob-lems in his teams, and just could not solve them. What was wrong?
I have mentioned in a number of chapters the work on motivation doneby Warden and Nicholson [18], which is based on the Job CharacteristicsModel of Motivation [19]. The job diagnostic survey provides a comprehen-sive set of motivational measures. As a process model, it can diagnose prob-lems with motivational dynamics caused by poor job design. Psychometricmeasurement techniques do not provide this capability.
A number of other studies into what motivates people have been carriedout; see [11, 20] for some examples. One commonly used is based on workby Maslow in the mid-twentieth century [21], which developed into theMaslow Hierarchy of Needs, described in many books and Web sites, for exam-ple, references [22–24]. Maslow’s original levels of need may be described as:
◗ Physiological—food, water, sleep;
◗ Safety—freedom from danger;
◗ Love—need to belong to a group, friendship;
◗ Esteem—reputation beyond family and friends;
◗ Self-actualization—self-fulfillment.
256 Appendix A

The model has developed over the years, by different authors, so if youlook at this, particularly by Internet searches, you may see the hierarchyextended or detailed added to explicitly mention cognitive, aesthetic, andspiritual needs as well as the need to help others.
Until someone’s basic needs (for example, food and shelter) are met, thismay be all they are interested in. Once they have enough at one level, thenother motivators become more important —however much more food yougive them, they will not be any happier. The cutoff point for moving fromone point in the hierarchy to another is different for different people, so forsome people “enough” at one level is different from another person’s needat that level.
When we look at these two studies together with the personality traitswe have examined above, we can see that there may be many reasons whyour director’s teams might still be unhappy and fed up. Interestingly, thisoriginated as a term in falconry—when you overfeed a hawk, it sulks until ithas finished digesting; it has had enough food and is described as a fed-up fal-con. The many people in the organization may have
◗ Conflicting communication and learning styles—they may not under-stand each other and the director;
◗ Different needs from their jobs—some will want to follow a process,some will want to “fly free”;
◗ Jobs that are too stressful, too boring, or just badly designed—somepeople will want less stressful job, some will work best under pressure;
◗ All the fulfillment they need at a particular level, so reward and recog-nition at that level may not work—they may prefer a sabbatical to a payraise, for example;
◗ Become irritated by what they see as “gestures” by the director, whenthey see other causes for their problems.
Motivation is not simple. People are not simple. Each person is anindividual, with likes, dislikes, preferences, moods, and a life outside theteam.
In this section the Internet/Web search words are: motivation, Maslow,hierarchy of needs, Motivation Improvement Programme, Mayo, Haw-thorne, McGregor on Theory X and Theory Y, Likert on Exploitative,Benevolent, Consultative and Participative management of organizations,McClelland on achievement motivation, Argyris on bureaucratic, pyrami-dal versus humanistic, and democratic organizations.
A.2.5 Transactional analysis
We discussed transactional analysis in Chapter 4, based on Wagner’s work[25], which itself refers to earlier work by Berne, for example, [26].Wagner’s book is useful to us here because it concentrates on work relation-ships rather than personal relationships or family situations.
A.2 Communication styles 257

The idea of transactional analysis as described by Wagner is that we areall six people rather than just one and that some of these six “inner people”are effective in dealing with others, but some of the “inner people” are notso useful. The six inner people or ego states Wagner identifies are:
◗ The natural child—an effective ego state that acts spontaneously,expresses feelings, and has need for recognition, structure andstimulation.
◗ The adult—an effective ego state that is logical and reasonable; it deals infacts rather than feelings.
◗ The nurturing parent—an effective ego state that is firm with others, butalso understanding, sensitive, and caring.
◗ The critical parent—an ineffective ego state that uses body language, ges-ture and tone of voice to “tell others off,” perhaps by sarcasm, pointingthe finger, or a raised voice.
◗ The rebellious child—an ineffective ego state that gets angry and staysangry, is very negative, does not listen, may deliberately forget things,or procrastinate.
◗ The compliant child—an ineffective ego state that blames itself, uses asoft voice and whines, and is very careful and self-protective.
As we saw in Chapter 4, communication between the effective ego statesis generally useful. We can create and play if we are both in “natural child.”We can exchange facts clearly in adult to adult communication, and ournurturing parent ego states mean we can empathize and help each other. Ifwe cross into the ineffective ego states, we will argue, whine, and blamewithout communicating or changing anything; in fact, we may make thingsworse. We need a way to move out of the ineffective states into effectivestates, and the de Bono Six Hats [5–7] that we discussed in this sectionallow us to do that, by providing a formal behavior pattern that acknowl-edges feelings as well as facts.
As Wagner discusses [25], the use of TA is not just in personal relation-ships in the family. Looking at our own behavior whether as a manager orin reacting to our managers and colleagues is useful, as supervising, delegat-ing, making decisions, resolving conflict, and hiring or firing people mayallcause unexpected behavior, and this may be caused by ineffective egostates.
A related study area is emotional intelligence. You will findchecklists on these “soft skill” areas on the Chartered Management Insti-tute Web site.
In this section the Internet/Web search words are: transactional analysis,“games people play,” scripts, ego states, Berne, Wagner, and emotionalintelligence.
258 Appendix A

A.3 Techniques to identify and classify problems andassess ideas for solutions
A.3.1 Cause–effect, root cause, and solution analysis
Cause–effect analysis helps us look for the root causes of problems, usingcause and effect diagrams, sometimes called fishbone diagrams because of theirshape, or Ishikawa diagrams after the person who first developed them, butnow widely used in identifying quality and other problems [27, 28]. Thediagram is simply a means of helping us think about and classify the causesof problems and their underlying root causes.
The first step is to draw a fishbone diagram with the effect (which is theproblem or symptom noticed) on the head of the fish. Then, label the ribs ofthe fishbone to show typical areas of root cause. You can choose your labels.Typical ones are the 4 Ms—Manpower, Machines, Materials, Methods [27],or the “PEMPEM” labels, which gives People, Environment, Methods, Plant,Equipment, Materials [28], or you could make up your own labels. FigureA.1 shows a fishbone at the start of a meeting, as it was drawn up on thewhiteboard. There had been a series of complaints about the help-desk pro-vision. These have been divided into three groups, and each group placed ona separate arrow. A fourth arrow has been added for “other complaints” incase we have forgotten anything.
If you were in the team discussing this, you would now use discussionand brainstorming to generate causes for the effect. Try to group the ideason the fishbone to show how they relate to each other. The next step is toallow the ideas to incubate. Robson [28] suggests putting the diagram on apublic board so other people can see, comment, and add to it, and so thatthe people can suggest other causes. We discussed this example in Chapter12, so you will see the completed fishbone in Figure 12.3.
Having identified some root causes, we may want to “reverse” the fish-bone, to go from a problem to a solution [27, 28]. To do this, we draw thediagram in reverse, write our proposed solution in the box, and then underour fishbone headings discuss whether the proposed solution will work:
A.3 Techniques to identify and classify problems and assess ideas for solutions 259
Fishbone diagram before start of discussion about customer complaints
Customer unhappywith help-deskprovision
Other customercomplaints about help desk
Customer complaintsabout help-desktechnology
Customer complaintsabout help-desk processes
Customer complaintsabout help-desk staff
Figure A.1 Ishikawa fishbone diagram—empty at start of discussion.
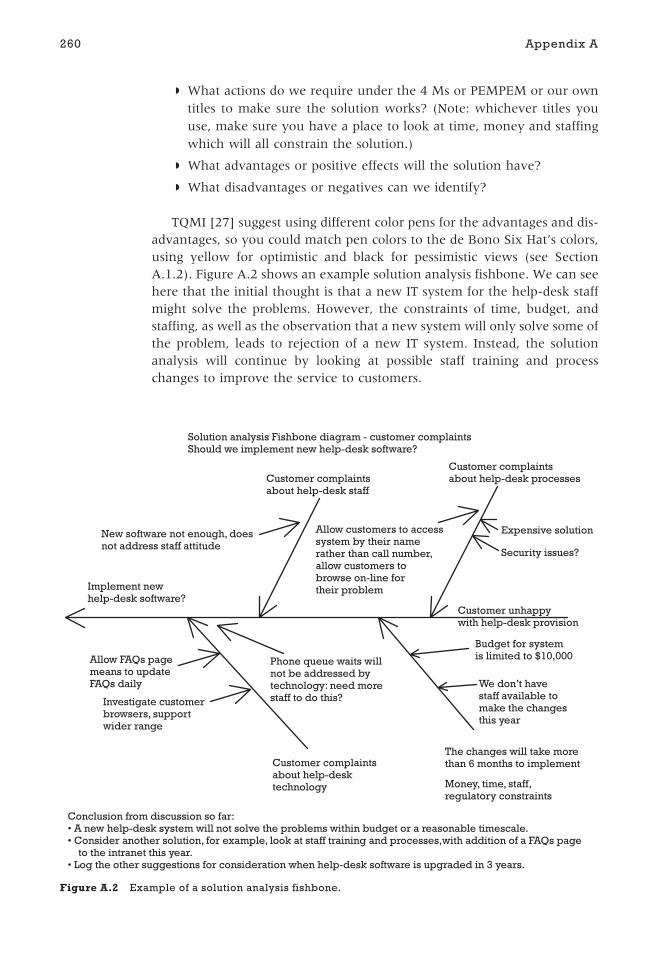
◗ What actions do we require under the 4 Ms or PEMPEM or our owntitles to make sure the solution works? (Note: whichever titles youuse, make sure you have a place to look at time, money and staffingwhich will all constrain the solution.)
◗ What advantages or positive effects will the solution have?
◗ What disadvantages or negatives can we identify?
TQMI [27] suggest using different color pens for the advantages and dis-advantages, so you could match pen colors to the de Bono Six Hat’s colors,using yellow for optimistic and black for pessimistic views (see SectionA.1.2). Figure A.2 shows an example solution analysis fishbone. We can seehere that the initial thought is that a new IT system for the help-desk staffmight solve the problems. However, the constraints of time, budget, andstaffing, as well as the observation that a new system will only solve some ofthe problem, leads to rejection of a new IT system. Instead, the solutionanalysis will continue by looking at possible staff training and processchanges to improve the service to customers.
260 Appendix A
Solution analysis Fishbone diagram - customer complaintsShould we implement new help-desk software?
Money, time, staff,regulatory constraints
The changes will take morethan 6 months to implement
We don’t havestaff available tomake the changesthis year
Budget for systemis limited to $10,000
Customer complaintsabout help-desktechnology
Phone queue waits willnot be addressed bytechnology: need morestaff to do this?Investigate customer
browsers, supportwider range
Allow FAQs pagemeans to updateFAQs daily
Implement newhelp-desk software?
New software not enough, doesnot address staff attitude
Allow customers to accesssystem by their namerather than call number,allow customers tobrowse on-line fortheir problem
Customer unhappywith help-desk provision
Security issues?
Expensive solution
Customer complaintsabout help-desk processesCustomer complaints
about help-desk staff
Conclusion from discussion so far:• A new help-desk system will not solve the problems within budget or a reasonable timescale.• Consider another solution, for example, look at staff training and processes,with addition of a FAQs page
to the intranet this year.• Log the other suggestions for consideration when help-desk software is upgraded in 3 years.
Figure A.2 Example of a solution analysis fishbone.

In these methods, brainstorming is a useful technique for gatheringideas. When using brainstorming, it is worth marking the start of the brain-storm session by agreeing or reminding ourselves of some rules [27, 28].The precise rules may vary between organizations, so it is worth clarifyingthem. Typical rules include:
◗ All ideas are allowed.
◗ All ideas are documented.
◗ There is no discussion or evaluation during ideas gathering.
◗ Be relaxed.
◗ Do not criticize other’s ideas.
In this section the Internet/Web search words are: Ishikawa fishbone,root cause analysis, solution analysis, and brainstorm.
A.3.2 Prototyping and ideas modeling
Prototyping is not an SDLC. It is a method of exploring a problem andpotential solutions in order that the right solution can be selected. Prototyp-ing is not just used in software; it is used in many fields to test design ideas.For example, if you make clothes, you may choose to use ready-made pat-terns as bought, or to alter ready-made patterns to fit your particular shape.Alternatively, you might build clothes against a general design but meas-ured for a specific person (for example, a custom-made suit), or you coulddesign your own clothes with unique patterns.
In all cases, you can use a prototype, called a muslin, toile, or form, whichyou use to try out the pattern. Using a cheap material, such as muslin, youbuild the garment from the pattern, in order to see if it turns out as youexpect. Does the garment fit? Does it fall well? Does it flatter you? We dothis to check our ideas and ability to understand what we need to do with-out cutting into the expensive cloth that we will use for the final garment.
Particularly if we are designing clothes rather than using an off-the-shelfpattern, a prototype is essential to try out new ideas.
Keen sewers will use a muslin to check out a new pattern; they are usingthe prototype to try out their understanding of and adjustments to “off-the-shelf” solutions. You only use the prototype to try out ideas—you will not be wear-ing it in reality.
If you want to see a good example of prototyping using muslin, look at asewing publication, for example, Threads magazine [29], where user testingof sewing pattern software is done by making a set of prototype patterns fordifferent sized and shaped people. The authors built prototypes to explorecommercial off-the-shelf pattern fitting programs and decide which one torecommend.
In software, we can use prototypes in the same way. We can try outideas if we are not sure what we want. In that situation, we do not want tobuild the real software. Instead we want to build a model of it, in order thatwe can explore the problem and potential solutions.
A.3 Techniques to identify and classify problems and assess ideas for solutions 261
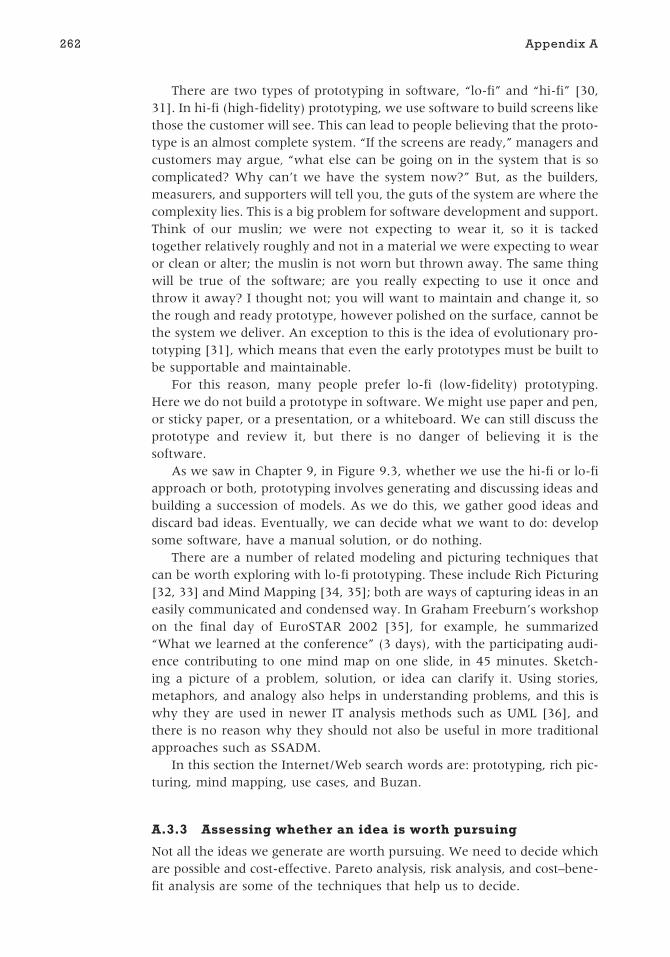
There are two types of prototyping in software, “lo-fi” and “hi-fi” [30,31]. In hi-fi (high-fidelity) prototyping, we use software to build screens likethose the customer will see. This can lead to people believing that the proto-type is an almost complete system. “If the screens are ready,” managers andcustomers may argue, “what else can be going on in the system that is socomplicated? Why can’t we have the system now?” But, as the builders,measurers, and supporters will tell you, the guts of the system are where thecomplexity lies. This is a big problem for software development and support.Think of our muslin; we were not expecting to wear it, so it is tackedtogether relatively roughly and not in a material we were expecting to wearor clean or alter; the muslin is not worn but thrown away. The same thingwill be true of the software; are you really expecting to use it once andthrow it away? I thought not; you will want to maintain and change it, sothe rough and ready prototype, however polished on the surface, cannot bethe system we deliver. An exception to this is the idea of evolutionary pro-totyping [31], which means that even the early prototypes must be built tobe supportable and maintainable.
For this reason, many people prefer lo-fi (low-fidelity) prototyping.Here we do not build a prototype in software. We might use paper and pen,or sticky paper, or a presentation, or a whiteboard. We can still discuss theprototype and review it, but there is no danger of believing it is thesoftware.
As we saw in Chapter 9, in Figure 9.3, whether we use the hi-fi or lo-fiapproach or both, prototyping involves generating and discussing ideas andbuilding a succession of models. As we do this, we gather good ideas anddiscard bad ideas. Eventually, we can decide what we want to do: developsome software, have a manual solution, or do nothing.
There are a number of related modeling and picturing techniques thatcan be worth exploring with lo-fi prototyping. These include Rich Picturing[32, 33] and Mind Mapping [34, 35]; both are ways of capturing ideas in aneasily communicated and condensed way. In Graham Freeburn’s workshopon the final day of EuroSTAR 2002 [35], for example, he summarized“What we learned at the conference” (3 days), with the participating audi-ence contributing to one mind map on one slide, in 45 minutes. Sketch-ing a picture of a problem, solution, or idea can clarify it. Using stories,metaphors, and analogy also helps in understanding problems, and this iswhy they are used in newer IT analysis methods such as UML [36], andthere is no reason why they should not also be useful in more traditionalapproaches such as SSADM.
In this section the Internet/Web search words are: prototyping, rich pic-turing, mind mapping, use cases, and Buzan.
A.3.3 Assessing whether an idea is worth pursuing
Not all the ideas we generate are worth pursuing. We need to decide whichare possible and cost-effective. Pareto analysis, risk analysis, and cost–bene-fit analysis are some of the techniques that help us to decide.
262 Appendix A

Pareto analysis [27, 28] is based on the “Pareto principle,” which sug-gests that 80% of the problems are the result of 20% of the causes. Thismeans that if we can identify solutions to those 20% of the problems, weshould get a better, more effective payback from our chosen solution. Todecide which problems to solve, identify which are the most frequent. To dothis, gather data on the frequency of problems and the underlying causes.The most frequent problems and causes are candidates for resolving, so theideas that address those problems may be worth pursuing.
In risk analysis, we use techniques such as brainstorming to list all thepossible risks people can identify. Risks are sorted into groups, by topic area.We may find we have identified some issues (things that are problems now)and constraints (known limits to any solution we suggest) as well as risks.Risks have not yet happened, but may happen (turn into an issue or prob-lem) in the future. When we assess a risk we need to know its likelihood ofturning into a problem, as well as the impact if it does. There is therefore anelement of forecasting in risk assessment. When we are assessing possiblesolutions to problems for their risk, we are asking whether the risk of pursu-ing a solution is greater or less than the risk of an alternative solution ordoing nothing:
◗ If we do nothing, what could go wrong?
◗ If we adopt this solution and it goes as we expect what chain-reactionproblems might we have?
◗ If we adopt this solution and it goes wrong, what problems arise fromwrong delivery or nondelivery?
In each case we need to:
◗ List potential problems (risks).
◗ Identify the likelihood of each risk becoming a problem and use somescoring system.
◗ Identify the impact of each risk if it does become a problem and usesome scoring system.
◗ Multiply impact by likelihood to get a risk score.
◗ Rank the risks.
◗ Identify what you can do to reduce risk or remove it.
◗ Decide whether the probable consequences of adopting or discardingthe solution.
You will see variations on this theme in different people’s work. Forexample, Hans Schaefer’s work on risk assessment for software testing looksat the impact of failure as criticality of system, frequency of usage, and visi-bility of the problem [37]; whereas in TQMI’s Failure Prevention Analysis[27], probability and consequence are used to calculate an overall rating foreach possible failure’s root cause, and these are used to rank to possiblefailures.
A.3 Techniques to identify and classify problems and assess ideas for solutions 263

Cost–benefit analysis [28] is done by calculating the predicted benefits ofthe proposed change and setting this against the predicted cost. The steps inmaking a cost–benefit analysis, at its simplest are:
◗ Identify the financial costs of the solution—for example, direct costsof the solution in equipment, resources, and loss of time on revenueearning activities if staff are diverted to the project.
◗ Identify the nonfinancial costs of the solution. These may translate intofinancial costs but you may find it easier to start by listing them andthen attempt to translate them. Examples might be adverse publicity,staff dissatisfaction with the change, and customer complaints.
◗ Identify the financial benefits of the solution—money saved by effi-ciency increases, additional sales, and customers.
◗ Identify the nonfinancial benefits of the solution. Again, these maytranslate into financial benefits but you may find it easier to list themfirst and put a price on them afterward. Examples might be improve-ments to staff morale, greater effectiveness in serving the customer, andimproved image of the organization.
◗ Use this information to workout the “payback” over a number ofyears (see Table A.4). We can see that with the accumulated costs ofthe original implementation and support year by year, we will not geta payback until year 6.
When you look at the cost–benefit of an idea, you will need to look athow the benefits of the idea match to the organization’s goals. This will giveyou an insight into whether the idea helps the organization’s goals—a bene-fit—or whether it detracts from the organization’s goals—a cost. You maywell find that financial and nonfinancial targets have been set with thegoals, and your cost–benefit discussion needs to reflect these targets. Forexample, if your organization uses a Balanced Scorecard, as we saw inChapter 4, financial goals will be balanced against customer, process, andinnovation costs and benefits. This information will help put together acost–benefit discussion in terms familiar to senior management showinghow their goals will be affected by your idea.
You may also wish to look at earned value management or budgeted cost ofwork performed measures [38], which allow you not only to track cost andbudget, but also what the cost so far was supposed to achieve compared
264 Appendix A
Table A.4 Cost, Benefit, and Payback (in Dollars)
Year Cost This Year Benefit This Year Accumulated Cost Accumulated Benefit Benefit Minus Cost
1 100,000 0 100,000 0 −100,000
2 2,000 25,000 102,000 25,000 −77,000
3 2,000 25,000 104,000 50,000 −54,000
4 2,000 25,000 106,000 75,000 −31,000
5 2,000 25,000 108,000 100,000 −8,000
6 2,000 25,000 110,000 125,000 15,000

with what actually has been done. To put it simply, we may have savedbudget, but we have not delivered. In Table A.5, we see that although weare apparently under budget, we are behind in delivery, and therefore inearned value. We have, in fact, overspent compared with what we havedelivered.
In this section the Internet/Web search words are: Pareto, 80–20 rule,failure prevention analysis, risk, impact, likelihood, probability, conse-quence, exposure, risk tree, risk-based testing, Schaefer, cost, benefit, pay-back period, financial planning, cash flow forecasting, profit and lossforecasting, business financial planning, balanced business scorecard, bal-anced scorecard, Kaplan and Norton scorecard, earned value management(EVM), and budgeted cost of work performed (BCWP).
A.4 Understanding aims and objectivesWe saw in Chapter 9 (Figure 9.4) that we need to set aims, objectives, tar-gets, and indicators. One useful technique is the Weaver triangle. This wasoriginally developed by Jayne Weaver for use with nonprofit organizations,and, with her help, I then adapted it for use in IT and business projects [39]On a one-page diagram, the group identifies and agrees on the aim of theproject (why it is being done) and associated indicators of success, then theobjectives of the project (what is to be done) and associated targets. Thishelps identify where stakeholders have different aims for the project. Theform is used to encourage teams to focus in one an overall aim or goal, andto show pictorially how the aims and objectives fit together. Some groundrules are:
◗ The aim should answer the questions “why are we doing this?” and“what difference will this make?”
◗ The specific aims should break down the overall aim in some detailedaims, but avoid having more than three to five of these, or you will getconfused.
◗ Each specific aim also answers a “why?” and “what difference?”question.
◗ In order for the aims to be achieved, something needs to bedone—these are the objectives—so each specific aim must be associatedwith at least one objective.
◗ The objectives each answer the question “What do we need to do inorder to meet the aim?”
A.4 Understanding aims and objectives 265
Table A.5 Earned Value Calculations
Budgeted Cost to Date Planned Delivery to Date Actual Costs to Date Actual Delivery to Date Earned Value
$1,000 Five documents(earned value $200per document)
$800 (underbudget)
Three documents(behind schedule)
$600 (this is $400behind the expectedearned value)

◗ There will be several objectives, which may be projects within a pro-gram or parts of a project, depending on their size.
◗ Each objective must be focused on achieving at least one of the aims,otherwise there is no in point doing it.
◗ Aims are measured by indicators that measure whether we are makingthe difference we intended.
◗ Objectives are measured by delivery targets such as savings, number ofpeople affected, delivery dates, and budget.
◗ Indicator and target measures should be linked to measures used gener-ally in the organization; for example, you could show how these meas-ures link to the organization’s balanced scorecard.
◗ Consensus is required between the stakeholders; this is not done bythe managers and told to everyone else; it requires contributions anddiscussion from all the groups.
In this section the Internet/Web search words are: target, indicator, Gilband Planguage, Seddon, and systems thinking, which will show alternativeviews about target setting and methods. There is none for Weaver triangle,as this is newly published.
A.5 Review techniquesThere are five types of review [40]: management review, technical review,inspection, walkthrough, and audit, all of which are relevant duringstart-up, throughout the software-development life cycle (SDLC), and dur-ing delivery, as well as during the software-maintenance life cycles (SMLC)in the postdelivery period. Specialist testers regard them as a form of testing,because they are used to find and prevent defects in products and processes,but they can be used by any of the groups. Further, they may be used as anopportunity for communication between the groups. The review types havedifferent purposes:
◗ The management review is carried out to check progress againstplans.
◗ The technical or peer review has the purpose of identifying confor-mance to specification and finding defects in a document.
◗ An inspection is a formal review with the purpose of identifying andpreventing defects, based on a sample from a document.
◗ A walkthrough is a review with the purpose of increasing understand-ing of a document.
◗ Audits are used to check process conformance rather than products.
We saw in Chapter 3 how useful taking part in reviews can be for thecustomer, and that the review process need not be complicated. Gilb and
266 Appendix A

Graham provide a full description of the Inspection process, with exampleforms [41], and the standard [40] provides an overview of each of thereview processes. To get the best from reviews, it is best for people to havesome training to understand how to review, and to have a process to follow.For all the reviews, it is good to:
◗ Set a policy for reviews. Decide what must be reviewed and whichtype of review is needed. Also decide what should be reviewed butcould be left in an emergency, what could be reviewed if there is time,and what will not be reviewed, perhaps based on the risks associatedwith errors in the products or processes under review.
◗ Plan to have reviews. Allow time and resource for the activities as wesaw in Chapter 4, and use a project review and audit plan structure likethe one in Appendix B.
◗ Plan each particular review—its goals, who should be involved, andwhat specifically you want them to check, write, or improve the prepa-ration checklists. An example of an audit checklist is in Appendix B.
◗ Communicate with everyone who will take part to explain what willhappen and why the review will be done.
◗ Train reviewers so they know how to prepare—it is not enough to justread a document. Try to use it, or to match it against a related documentsuch as standards, policy, or another product document.
◗ Ensure that each reviewer has prepared properly—do not hold thereview unless everyone has prepared. A review where a reviewer is ill-prepared is just a waste of time and money because you will not find somany defects and you will not gain the same understanding.
◗ Make sure the review is of the product or process not the person—it needsto be objective and helpful not accusing. Some of the communicationtechniques in this appendix may help.
◗ Follow up the review. Improve this product and this iteration of theprocess, but also put in place improvements for the future to preventfuture problems.
◗ Measure the reviews cost–benefit (time/money spent and faultsremoved/failures prevented) ratio and suggest improvements to theefficiency and effectiveness of the review process itself.
In this section the Internet/Web search words are: software review, tech-nical review, inspection, and Fagan inspection statistical process control.
A.6 Improving graphics in reportingI thoroughly recommend Edward Tufte’s books [42–44]. Not only are theypacked with useful information, but they are also a delight to handle and toread, being their own example of good information design. In Chapter 4, I
A.6 Improving graphics in reporting 267

showed an example of a distorted graphic (Figure 4.7) and the equationsproposed by Tufte that allow us to measure the distortion of data in agraphic [42].
The lie factor, which we saw shown in Chapter 4, Figure 4.7, gives ameasure of the exaggeration of data in a graphic. The data ink ratio, shown inFigure A.3, is a measure of how much of the graphic provides informationand how much is decorative. The data density, Figure A.4, compares thenumber of data items with the size of the graphic. In summary, the equa-tions are as shown in Figure A.5.
In this section the Internet/Web search words are: Tufte, informationdesign, and graphics press.
268 Appendix A
05
10 10
0
8 86 6
5
15
20
25
30
35
Data density
Data density is 4/9 = 0.4The graphic is 9 square cm
Outstanding
FixedThe data matrix has only 4 entries:
Data density is 4/39 = 0.1The graphic is 39 square cm
Outstanding
FixedThe data matrix has only 4 entries:
Outstanding OutstandingFixed FixedTotal
Figure A.3 Data ink ratio in graphics. (After: [42].)
56.3
56.3
No need to have all six ways!
6 ways of telling the value from this bar
Data ink ratio - don’t repeat information...
Figure A.4 Data density in graphics. (After: [42].)

A.7 Useful sources and groupsThis section is just a starting list of useful further information and groups.There are many quality techniques and standards that I have not covered inthis book. New ideas for improving IT provision are always coming to light.The list in Table A.6 and the following Internet/Web search words are just astarting point for your future research.
A.7 Useful sources and groups 269
Table A.6 Some Sources for QA and QC Standards, Frameworks, and Best Practice
The National Strategy to Secure Cyberspace http://www.whitehouse.gov/pcipb/IT Governance Institute http://www.itgi.orgInformation Systems Audit and Control Association http://www.isaca.orgThe Institute of Internal Auditors http://www.theiia.org/Institute of Quality Assurance http://www.iqa.org/American Society for Quality http://www.asq.orgTesting Standards Working Party http://www.testingstandards.co.ukSticky Minds http://www.stickyminds.comBSI http://www.bsi.org.ukISO http://www.iso.chIEEE http://www.ieee.orgTickIT http://www.tickit.org/international.htmNational Institute Standards http://hissa.ncsl.nist.govOffice of Government Commerce http://www.ogc.gov.ukSuccessful IT: Modernizing Government in Action http://www.ogc.gov.uk/index.asp?docid=2632Six Sigma and robust design http://www.isixsigma.comJuran articles http://www.juran.comTufte articles http://www.edwardtufte.comDeming articles http://www.deming.org/Acronyms expanded http://www.acronymfinder.com/Technical terms explained http://whatis.comEFQM—European Foundation for Quality Management http://www.efqm.orgBQF—British Quality Foundation http://www.quality-foundation.co.ukSEI—Software Engineering Institute http://www.sei.cmu.eduESI—European Software Institute http://www.esi.es/FORTEST—formal methods and testing http://www.fortest.org.uk/BCS Industry Structure Model http://www.bcs.org.ukBCS Special Interest Groups http://www.bcs.org.ukBSC Qualifications http://www.bcs.org.ukInternational Software Testing Qualification Board http://www.istqb.orgChartered Management Institute http://www.managers.org.ukFor an alternative view of quality models… http://www.lean-service.comBalanced Score Card Group http://www.bscol.comSoftware Quality Professional JournalBetter Software (previously STQE) JournalProject Manager Today Journal
Data density =
Data ink ratio =
The Lie Factor =
area of data graphic
number of entries in data matrix
total ink used to print the graphic
data ink
size of effect in data
size of effect shown in graphic
Figure A.5 Tufte’s data graphics equations (From: [42]. © 1983 Graphics Press.Reprinted with permission.)

In this section the Internet/Web search words are: quality, excellence,quality improvement, governance, audit, standards, software engineering,Crosby, Juran, Deming, CMM, TMM, process improvement, patterns,exploratory testing, agile methods, agile manifesto, key process, softwaretesting, verification, validation, continuous improvement, Just In Time, SixSigma, Taguchi, and Sarbanes-Oxley Act.
References
[1] Busco, C., et al., “When Crisis Arises and the Need for Change ConfrontsIndividuals: Trust for Accounting and Accounting for Trust,” http://www.cimaglobal.com/downloads/research_enroac_busco.pdf, November 2003.
[2] Belbin, R. M., Management Teams—Why They Succeed or Fail, London, England:Butterworth Heinemann, 1981.
[3] Belbin, R. M., Team Roles at Work, London, England: Butterworth Heinemann,1995.
[4] Belbin Associates, “Belbin Team Roles,” http://www.belbin.com/belbin-team-roles.htm, October 2003.
[5] de Bono, E., Six Thinking Hats, New York: Penguin Books, 1999.
[6] Pas, J., “Emotional Intelligence as the Key to Software Quality,” EuroSTARConference, Stockholm, Sweden, 2001.
[7] de Bono, E., “Edward de Bono’s Web,” http://www.edwdebono.com/, October2003.
[8] Kroeger, O., J. M. Thuesen, and H. Rutledge, Type Talk at Work: How the 16Personality Types Determine Your Success on the Job, New York: Bantam DoubledayDell, 2002.
[9] Team Technology Web site, “Working Out Your Myers Briggs Type,” http://www.teamtechnology.co.uk/tt/t-articl/mb-simpl.htm, October 2003.
[10] Team Technology Web site,“The Mother of Strategic Systems Issues: Personality,”http://www.teamtechnology.co.uk/tt/t-articl/news1.htm, October 2003.
[11] Mullins, L. J., Management and Organisational Behaviour, 5th ed., New York:Financial Times/Pitman, 1999, p. 313.
[12] Honey, P., and A. Mumford, The Learning Styles Helper’s Guide, Maidenhead,England: Peter Honey Publications, 2002, http://www.peterhoney.com.PeterHoney.com, 10 Linden Avenue, Maidenhead, Berks, SL6 6HB. Tel.:01628633946. Fax: 01628633262. E-mail: [email protected].
[13] Honey, P., “Learning Styles,” http://www.peterhoney.co.uk/product/learningstyles, October 2003. PeterHoney.com, 10 Linden Avenue,Maidenhead, Berks, SL6 6HB. Tel.: 01628633946. Fax: 01628633262. E-mail:[email protected].
[14] Campaign for Learning, http://www.campaign-for-learning.org.uk/aboutyourlearning/whatlearning.htm, October 2003.
[15] Hicks, L., “The Nature of Learning,” in L. J. Mullins, (ed.), Management andOrganisational Behaviour, 5th ed., New York: Financial Times/Pitman, 1999,pp. 344–375.
270 Appendix A

[16] McHale, J., “Innovators Rule OK—Or Do They?” Training & Development,October 1986, http://www.kaicentre.com/.
[17] Kirton, “Adaptors and Innovators Defined,” KAI Web site, http://www.kaicentre.com/, July 2003.
[18] Warden, R., and I. Nicholson, The MIP Report—Volume 2—1996 MotivationalSurvey of IT Staff, 2nd ed., Bredon, England: Software Futures Ltd., 1996.
[19] Hackman, J. R., and G. R. Oldham The Job Diagnostic Survey: An Instrument for theDiagnosis of Jobs and the Evaluation of Job Redesign Projects, Technical Report No. 4,New Haven, CT: Yale University, Department of Administrative Sciences, 1974.
[20] Accel-team.com, http://www.accel-team.com/human_relations, October 2003.
[21] Maslow, A., Motivation and Personality, New York: Harper and Row, 1954.
[22] Maslow, A., Motivation and Personality, New York: Harper and Row, 1970.
[23] Gywnne, R., “Maslow’s Hierarchy of Needs,” http://web.utk.edu/~gwynne/maslow.HTM, November 2003.
[24] Accel-team.com, “Maslow’s Hierarchy of Needs,” http://www.accel-team.com/human_relations/hrels_02_maslow.html, October 2003.
[25] Wagner, A., The Transactional Manager—How to Solve People Problems withTransactional Analysis, Denver, CO: T.A. Communications, 1981.
[26] Berne, E., Games People Play, New York: Grove Press, 1964.
[27] TQMI, Problem Solving—Tools and Techniques, Frodsham, England: TQMI, 2001.
[28] Robson, M., Problem Solving in Groups, Aldershot, England: Gower, 1995.
[29] Neukam, J., and J. Sauer, “Pattern-Drafting Software,” Threads, May 2003, pp.42–49.
[30] Hohmann, L., “Lo-Fi GUI Design,” Software Testing and Quality Engineering, Vol. 1,No. 5, September 1999, pp. 24–29.
[31] Nance, R. E., and J. D. Arthur, Managing Software Quality, New York:Springer-Verlag, 2002.
[32] “Drawing Concerns: A Structured Rich Picturing Approach,” http://business.unisa.edu.au/cobar/documents/richpic_colin.pdf, November 2003.
[33] Rose, J., “Soft Systems Methodology as a Social Science Research Tool,” http://www.cs.auc.dk/~jeremy/pdf%20files/SSM.pdf.
[34] Buzan, T., The Mind Map Book, London, England: BBC Consumer Publishing,2003.
[35] Freeburn, G., “Mind Mapping 101 for Testers,” EuroSTAR Conference, Edinburgh,Scotland, 2002.
[36] Fowler, M., and K. Scott, UML Distilled, Reading, MA: Addison-Wesley, 1997.
[37] Schaefer, H., “Testing—The Bad Game and the Good Game,” BCS SIGiSTConference, Edinburgh, Scotland, 1997.
[38] Pavyer, E., “An Introduction to Earned Value Management,” Project ManagerToday, Vol. 11, April 2003.
[39] Evans, I., “The Troubled Project—Best Practice from Theory to Reality,”EuroSTAR Conference, Stockholm, Sweden, 2001.
A.7 Useful sources and groups 271

[40] IEEE 1028™ Standard for Software Reviews, 1997.
[41] Gilb, T., and D. Graham, Software Inspection, Reading, MA: Addison-Wesley,1993.
[42] Tufte, E., The Visual Display of Quantitative Information (Equations from p. 57, theLie Factor; p. 93, The Data Ink Ratio; p. 162, Data Density), Cheshire, CT:Graphics Press, 1983.
[43] Tufte, E., Visual Explanations, Cheshire, CT: Graphics Press, 1990.
[44] Tufte, E., Envisioning Information, Cheshire, CT: Graphics Press, 1997.
Selected bibliography
Crosby, P., Quality Is Free, New York: Penguin, 1980.
Garfinkel, H., Studies in Ethnomethodology, Englewood Cliffs, NJ: Prentice-Hall,1967.
Handy, C., Understanding Organizations, New York: Penguin, 1993.
Hofstede, G. H., The Game of Budget Control, London, England: Tavistock, 1968.
Humphreys, W., “Pathways to Process Maturity: The Personal Software Processand Team Software Process,” http://interactive.sei.cmu.edu/Features/1999/June/Background/Background.jun99.htm, August 2003.
Northcott, D., Capital Investment Decision Making, San Diego, CA: Academic Press,1992.
Ould, M., Managing Software Quality and Business Risk, New York: Wiley, 1999.
Perry, W. E. and R. W. Rice, Surviving the Top Ten Challenges of Software Testing: APeople-Oriented Approach, New York: Dorset House, 1997.
Winant, B., “Visual Requirements,” STQE, June 2003, pp. 34–42.
272 Appendix A

Appendix B
Quality Planning Documents and Templates
B.1 The document familyAs we saw in Chapter 4 (see Figure 4.1), the quality planning required for aparticular project will be based on the organization’s standards, including itspolicies and chosen methods of work. Within an individual project, once theaims, objectives, risks, and constraints for the project are understood, wecan develop a family of documents which describe how for this project we willcarry out our work. We have seen that quality planning for the SDLCshould involve all the groups. This activity should be part of project plan-ning. There are a number of documents that might be needed; on a smallproject I would have these as paragraph headings in the project plan,whereas on a large project, you might need a series of documents, with lev-els of detail from a strategy through detailed plans. Table B.1 lists the levelsof quality planning documents.
273
Table B.1 Quality Planning Documents
This is what wedo as an organization
Policy documents organization level, brief, part of organization QMS
This is how we willdo it as an organization
Standards and processes organization level, descriptive, steps “how to”,organization Quality Management System (QMS) for all activities, not justQA/QC activities
This is what we willdo for this SDLC
Project QMS or quality plan
Program/project level, documents tailoring decisions based on risk andconstraints, choice and tailoring of SDLC (see Chapter 10), may include policy,standards, and processes, where these differ from the organization leveldocuments, for QA, QC, management, and build activities
This is how we carryout QA/QC activitiesfor this SDLC
QA: Audit and review strategy and overall plan
QC: Document review strategy and overall plan
QC: Testing strategy and overall plan
Project/program level, responsibilities, overall approach based on tailored QMS,which groups will contribute to which QA/QC activities
This is how we will carryout this particular QA/QCactivity
Detailed plans for each particular audit, review, document review, test level,stage within SDLC, specific, detailed approach, detailed task plan, specificresponsibilities

In an organization with a documented Quality Management System(QMS) there will be a documented policy for both QA and QC activities,describing at a high level what is expected for any SDLC. Even if the organi-zation does not have written policies, there will be unwritten, taken-for-granted assumptions: “We always do it this way.” The policies will be backedup by process descriptions, procedures, and standards. Again, in someorganizations these will be documented, but in others they are based onword of mouth, individual expertise, and training. Some important ques-tions to think about are:
◗ Have we chosen the appropriate standards/methods/tools and tech-niques to carry out our work?
◗ Do they need adapting for this project?
◗ Are there specific expectations or rules from our customers about howwe do the work—do we need to follow a particular standard ormethod?
◗ Are we doing the right QA/QC activities bearing in mind the risks andconstraints?
◗ Are the QA and QC activities sufficient to meet any external or internalrequirements?
◗ Does everyone agree that these QA and QC activities are needed?
◗ Have they been defined in a way that will allow measurement ofproduct and process?
In order to allow these questions to be considered, I think it is useful tohave a written QMS that contains the policies, processes, and standards, but,importantly, has a rule that “the processes and standards can be tailored tosuit the risks and constraints for the particular project” We have seen someexamples of tailoring in Chapter 12. In Figure B.1, we can see an exampledocument family. Remember this is just an example; you may choose tohave fewer documents by combining some of them.
We see in the figure that the documents we developed during start-up(Chapter 9) plus the company policies and standard drive what appears inthe project documents. The documents in the project that address qualityinclude the project plan itself, the risk-management plan, the configuration-management plan, and the quality plan. These documents—or project planparts in a small project—need to be developed together; they are a comple-mentary set. Each may be the parent for a document family. In this figure,we will develop the quality branch. The quality plan divides into three mainparts in this project: an audit plan, a plan for which documents to inspect orreview, and an overall plan for testing. Each of these branches has a similarstructure, so let us just look at the audit branch. There will be several audits,and each will need a plan. This is not a large document; it just means that weneed to agree on the time and place for each audit, who will be involved,book rooms and so on. It might be just a checklist or an e-mail to confirm
274 Appendix B

what the auditor and team being audited have agreed. After each audit, ashort report is needed, just the good points and areas for improvement in alist, with priorities. Do not write much, but do share it with the team youhave audited and get their feedback. Finally, all the quality activities feedinto an overall quality report, which helps all the groups decide on the out-come of the project, but also feeds improvements to the company standards.
B.2 Why we use document templatesWe need to know which documents we have to write, why we write them,and what their contents should be. To save everyone time deciding what isneeded, it is useful to have a set of standard document templates. There area number of standards that provide document templates, for example:
B.2 Why we use document templates 275
Overall SDLCquality report
Reports onindividualtest phases
Reports onindividualreviews
Report onindividualaudits
Plans fortest phases
Plans forindividualreviews
Plans forindividualaudits
QC: testingoverall plan
QC: documentreview overallplan
QA: auditoverall plan
Configurationmanagementplan
Riskmanagementplan
Quality plan
Project plan
Methods
Standards
Policies
Company standards
Initial overallplan (ballpark)
AcceptancecriteriaConstraints
Riskassessment
Aims andobjectives
Contract (see Chapter 9)
Typical document family
Figure B.1 Typical document family.

◗ IEEE standards, including standards for project plans [1], quality plans[2], test documentation [3], requirements documents [4], and userdocumentation [5];
◗ BSI standards, including standards for documenting component test-ing [6].
The standard bodies update these documents, and so it is best to consultthe standards bodies for the latest versions. For example, IEEE 829™ [3] isthe Test Documentation standard. If you look on the IEEE Web site [7], youwill see IEEE 829:1983, which is superseded, and IEEE 829:1998, which attime of writing is the current standard, but you will also see IEEE P829,which is a project to revise the standard by bringing it into line with currentthinking, and other, more recent standards, which will result in the 1998version being superseded.
These standards should be your source for deciding on the content ofyour own document templates, but almost inevitably, you will find that youwant to adapt the standards in some way. Tables B.2 through B.5 are delib-erately not a complete set of documents, so that you are encouraged to findout what the standards bodies are offering, and to obtain the latest standardsfor each type of document. Sources of information are:
◗ IEEE [7];
◗ BSI [8], including the BSI Software and Systems Quality Framework(SSQF) [9];
276 Appendix B
Table B.2 Example of a Project Plan Template
Project plan Not just the schedule. To allow discussion of whether the project is possible—using toolsand techniques like PERT (see Chapter 4), we can model the project. Loosely based on [1],tailored over use.
Project planfor project:
Author Date Status Version
Reference To higher level documents—do not repeat information from higher level documents inthis document; just document differences, new information, and exceptions (e.g., projectauthorization, terms of reference)
Introduction Overview
Deliverables List of all the deliverables
Evolution Change control
Vocabulary Definitions and acronyms on this project
References Documents that will expand on the information in this document if required (e.g., qualityplan, configuration management plan, risk management plan)
Organization Process model, organizational structure, organization boundaries and interfaces, projectresponsibilities, managerial process, objectives, and priorities
Risk Assumptions, dependencies and constraints, risk management, monitoring and controllingmechanisms
People Staffing plan, staffing needs, staff available, training and induction plans, rewards andrecognition plans, teams, team dynamics
Methods Technical processes, methods, tools and techniques, software documentation, projectsupport functions
Schedule Work packages, dependencies, resource requirements, budget and resource allocation,schedule

◗ ISO [11];
◗ Testing Standards Web site [12], including Reid’s paper comparing test-ing standards [13];
◗ ITIL [14];
◗ itSMF [15].
B.2 Why we use document templates 277
Table B.3 Example of a Quality Plan Template
Quality plan Document approach, specifically exceptions to policy and standards, help you consider andplan for QA/QC activities, evidence of decisions, rule book for actions, checklist for QA/QCactivities.
Loosely based on [2], tailored over experience.
Quality plan for project: Author Date Status Version
Reference To higher-level documents—do not repeat information from higher-level documents inthis document; just document differences, new information and exceptions (e.g., projectauthorization, terms of reference, project plan)
Qualityobjectives
Summary, list of items subject to the quality plan, features of interest, items not subject tothe quality plan, specific quality objectives
Approach General approach, selection of methods including QA/QC Methods, pass and fail criteria,sign off procedures, suspension and resumption, corrective actions
Exceptions List of differences from policies and standards, adaptations made to templates, otherchanges to normal process
QM tasks anddeliverables
QM deliverables, QM, QP, QA, QC tasks, test, inspection, examination and audit programs
Scheduling/resourcing
Environmental needs, responsibilities and authorities, resources required and resourcesavailable, staff and training needs, schedule, budget
Risks Specific risk areas, float available, contingency plans
Review Change control on this plan, review points on this plan
Other What else might we need to think about?
Lower-leveldocuments
List documents which will expand on this information if required (e.g., configurationmanagement plan, risk management plan, test plan)
Table B.4 Example of a Risk Management Plan Template
Riskmanagementplan
Gain agreement from all parties on control of risk, define management processes for RM.
This template is experience-based; there is an IEEE standard in [10].
For Project: Author Date Status Version
Reference To project plan, risk assessment, risk register
Introduction Purpose, Scope, Definitions/mnemonics
Management Responsibilities and authorities, escalation
Activities Risk reassessment cycles—timing, responsibilities
Risk identification and assessment activities
Risk containment measures—criteria for deciding whether a risk is to be treated byprevention, mitigation, or contingency plans, or is to be accepted
Relationship to quality plan—QA and QC activities related to risk
Review Change control on this plan, review points on this plan
Otherinformation
What else might we need to think about?
References Quality plans, including audit plans, review plans, test plans
Approvals Who needs to approve? Who needs to buy in? Who needs to know?

B.3 Using the document standards to provide yourown templates
Put together a set of templates as a starting point for all projects, and havetwo or three “sizes”—perhaps an “emergency” template, an “agile” tem-plate, and a “high-risk” template, as we discussed in Chapter 10—and setthe policy for projects by adapting these. Make sure these templates provideenough information for anyone who needs to understand or take on aspectsof the work. For example, do the supporters need additional informationbecause they will take on the maintenance of the system after delivery?
B.4 Auditing considerationsConsider whether you will be audited, who by, and if there is an expecta-tion that you adhere to particular documentation standards. If so, you needto understand whether you are allowed to adapt the published standard; forexample a customer may require you to provide “test documentation writ-ten to meet the IEEE 829 Test Documentation Standard” [3]. What does thismean? To which date standard are they referring? Can you adapt it? If youcan adapt, document the adaptation and make it clear how it meets thestandard.
B.5 The team’s information needsThe team size and experience may affect how much you document. For asmall project team, with membership from all the groups and good
278 Appendix B
Table B.5 Example of a Configuration Management Plan Template
Configurationmanagementplan
Gain agreement from all parties on control of changes, define management processes forCM
Loosely based on [16], tailored from experience.
For Project: Author Date Status Version
Reference To higher level documents—do not repeat information from higher level documents in thisdocument; just document differences, new information and exceptions
Introduction Purpose
Scope
Definitions/mnemonics
Management Organizations, SCR responsibilities, Interface control, status accounting, audits, CC board
Activities Configuration identification, configuration control, configuration status accounting, auditsand reviews, tools, techniques and methodologies, supplier control, records collection andretention
Review Change control on this plan, review points on this plan
OtherInformation
What else might we need to think about?
References List documents which will expand on the information in this document if required
Approvals Who needs to approve? Who needs to buy in? Who needs to know?

communication skills, who have worked together before and who are work-ing on a fast track project, you need to use these documents as checklist ofthings to remember. Maybe you only have to document the exceptions torules you have previously developed. However, if you have a large team ofpeople, and perhaps working together for the first time, perhaps from differ-ent organizations, you need to find a way to communicate and agree howthings will be done. Try using the document headings as an agenda for a dis-cussion meeting. Then document and review the outcome to check that youall have a common understanding. Remember to communicate the infor-mation; I remember seeing a very good test strategy that was only known toits author; no one else had read it, yet the development manager and theoperations group both needed information from that document.
B.6 Adapting templatesIf you adapt document templates for a particular project, when you startyour next project, go back to the original templates. Otherwise you will for-get why you adapted the template in a particular way, and perhaps misssomething important from the original template. Expect the document tem-plates to change over time. When you make changes to the templates,go back to the standards and think about why each section is there andwhether you will be missing something if you change it (see Tables B.2through B.5).
B.7 Keep it brief—do not repeat or copy informationTry to evolve a family of documents, with the lower-level documents onlyadding information, not repeating information from higher up the familytree. An example family tree is shown in Figure B.2. You will see that wemay not need the detailed plans on all the branches of the tree.
As a general rule, just document any changes and exceptions. Discour-age people from copying chunks from one document to another; repeatedinformation makes update harder.
Do not allow people to pick up completed documents, copy them, andalter them; they may stop thinking about the content of the document andproducing it may become a chore done for no purpose. The important thingabout these documents is that they help us think and solve problems.
B.8 Do you need a document at all?We write documents to communicate and to reach agreement. You may notneed a set of text documents on paper; that may not be the best way to com-municate or to reach agreement. You may be better off with a Web site, apresentation, a notice board, diagrams, a spreadsheet, a video of the discus-sion meeting, a video of the project sponsor—you decide what is best.
B.6 Adapting templates 279

B.9 Simple project audit plan and report templatesThese documents are ones I have developed based on the test and qualitydocumentation [2, 3], and then tailored. For each planned audit, for exam-ple, in a spreadsheet, collect the following information, initially for planningand then for tracking:
◗ For Planning the headings are: Topic area, Topic detail, Audit plannedmonth, Audit team, Audit place, Audit goal.
◗ For a Detailed plan for one audit: Audit checklist or reference to it.
◗ For Tracking against plan the headings are: Audit done date, Audit out-come, refer to Audit report, All issues resolved?
For a particular audit, the audit detailed plan may be a checklist. Anexample audit checklist that the auditor has started to develop for codemaintainability might look like Table B.6.
The report for audits may be a text report, or it could be a spreadsheet ofpositive observations and areas of concern, or you may wish to log noncon-formances to standards in the same way and place that you log inspectionand test defects—in the defect logging system—or you might wish to use theaudit primarily to identify risks, in which case log them in the risk register.For each point identify:
280 Appendix B
TestreadinessTestreadiness
TestreadinessTestreadiness
TestreadinessTestreadiness
TestreadinessTestreadiness
Phase 3Acceptancetest plan
Phase 3Systemtest plan
Stage testspecifications
Stage testspecifications
Stage testspecifications
Stage testspecifications
Phase 3overall testplan
Phase 2 testplan
Phase 1 testplan
Test strategy
Test Document Family
Test reportandcertificates
Test reportandcertificates
Test reportandcertificates
Test reportandcertificates
Figure B.2 Typical test documentation family. (After: [3].)

◗ The specific point for example by audit name/number/date;
◗ Auditor name (person who raised the point);
◗ Review area;
◗ Reference to document or source of information;
◗ Description of area of concern or positive observation;
◗ Metric used and measurement;
◗ If this is an area of concern, identify risks associated (likelihood of prob-lems arising and impact of those problems if they arise);
◗ If this is a reaudit, assessment of changes in risk since last audit;
◗ Prediction of outcome;
◗ Suggested resolution;
◗ Comment from audited team/team leader;
B.9 Simple project audit plan and report templates 281
Table B.6 Example of an Audit Checklist (Maintainability Audit)
For Project: Topic area Audit team Date Status Version
Code quality—Maintainability
Logistics andplanning
Speak to team leader of the area to be audited and explaining what will happen
Identify who will be interviewed
Set times for a start meeting, interviews and a closing meeting
Book rooms if required
Review goal Establish whether the project deliverables will be acceptably maintainable
InitialQuestions
What are the maintainability acceptance criteria for the project?
Are these set at a level which meets the customer’s needs?
What analysis of maintainability is being carried out by the team?
How complex is the code?
How internally consistent and correct is the code?
Does the code have areas that cannot be executed?
How does the team check that data is defined and used correctly across interfaces?
What static analysis tools being used to support maintainability measures?
Which factors does the chosen tool address?
How easily will changes be made to the delivered code?
Metrics Number of programs checked/number of programs
For each program checked:
Program size: Lines of code or number of programs or number of objects
Code complexity: as measured using the ABC tool set
Developer assessment (perception measure) of maintenance ease: predicted number ofhours to make changes (see example of changes set), predicted number of faults,perception of “trickiness”
Note: Check whether they are using ISO 9126 [17] for any Maintainability measures
Method Static analysis of code using tools and inspection
Interview of project members
Interview development manager
Inspect coding standards
Audit date Refer to audit report

◗ Actual resolution;
◗ Date resolved
◗ Sign-off by audited team/team leader;
◗ Sign-off by auditor/audit team leader.
References
[1] IEEE™ 1058:1998 Standard for Software Project Management Plans.
[2] IEEE™ 730:1989 Standard for Software Quality Assurance Plans.
[3] IEEE™ 829:1998 Standard for Software Test Documentation.
[4] IEEE™ 830:1998 Recommended Practice for Software RequirementsSpecifications.
[5] IEEE™ 1063:2001 Standard for Software User Documentation.
[6] British Standards Institute, BS7925-2:1998 Software Testing, Part 2 Softwarecomponent testing.
[7] IEEE Web site, http://www.ieee.org.
[8] British Standards Institute Web site, http://www.bsi.org.uk.
[9] British Standards Institute, PD0026:2003, “Software and Systems QualityFramework—A Guide to the Use of ISO/IEC and Other Standards forUnderstanding Quality in Software and Systems,” May 2003.
[10] IEEE 1540-2001™ Standard for Software Life Cycle Processes—RiskManagement.
[11] International Standards Organization Web site, http://www.iso.ch.
[12] Testing Standards Working Party Web site, http://www.testingstandards.co.uk.
[13] Reid, S. C., “Software Testing Standards—Do They Know What They Are TalkingAbout?” http://www.testingstandards.co.uk/publications.htm, August 2003.
[14] IT Infrastructure Library, Web site http://www.itil.co.uk.
[15] IT Service Management Forum, http://www.itsmf.com, October 2003.
[16] IEEE 828:1998™ Standard for Software Configuration Management Plans.
[17] International Standards Organization/International Electrotechnical Com-mission (ISO/IEC) DTR 9126 Software Engineering—Software Product Quality(Parts 1–4, 2000/2001).
282 Appendix B

About the Author
Isabel Evans has 20 years of experience in the IT industry, mainly in qualitymanagement, testing, training, and documentation. She has helped organi-zations in the development of procedures, standards, and methods to aid inthe testing of software during development and maintenance projects. Shehas managed test groups and performed testing design and development forthe acceptance and system testing of packages and bespoke systems. Ms.Evans has also provided quality assurance support, release management,and customer support for IT organizations. She has worked independentlysince 1992, running her own company, IE Testing Consultancy Ltd. Afterworking closely with Testing Solutions Group (TSG) since 2002, Ms. Evansjoined the company in January 2004.
Ms. Evans writes and presents courses; for TSG, these include courses forbeginners, the ISEB Foundation, and Practitioner Certificates in SoftwareTesting and specialist courses in testing and quality methods. In the past shehas provided training and tutorial material in quality management, projectmanagement, and documentation skills. While she has a sound theoreticalbasis for testing and quality, her own experience as a tester and as a qualityconsultant provides a practical approach and real-life experiences.
As well as presenting seminars and training courses to clients, Ms. Evanshas spoken on software quality, testing, and test management at confer-ences in the United Kingdom, Europe, and the United States, includingEuroSTAR, PSST, Quality Forum, BCS SIGIST, and the Year 2000 and EUROSummit. She regularly attends conferences, courses, and meetings in herinterest areas. Ms. Evans has been a member of various working parties andgroups to contribute to improvement in software quality and testing, includ-ing the Quality Forum Testing Metrics Forum, the Customer SatisfactionMeasurement working party, and the BCS SIGIST Test Standards WorkingParty, currently developing nonfunctional testing standards.
283

.

Index
AAcceptance criteria, 174–77
maintainability, 176measurable, making, 175performance, 176reliability, 177setting, 174SMART, 177usability, 176
Adaptive maintenance, 239–40Aims and objectives, 172–73, 265–66Audits
considerations, 278defined, 266external, 122internal, 122plans, 280–82project, 112
Availability management, 235
BBelbin
team roles, 250–51team scores, 27
Big bang waterfall, 196–97, 199Budgeted cost of work performed (BCWP), 265Builders, 77–97
buy-in, 91, 92change involvement, 240communication responsibility, 95communication with other groups, 95–96corrections and changes, 82–83criticism, 78customer results, 92–93delivery and, 220EFQM Excellence Model and, 86–87EFQM Excellence Model enablers for, 87–92EFQM Excellence Model results for, 92–95group, 19, 21
group members, 79–80group summary, 96–97information needed by, 97information that others need, 97introducing, 77–79key performance results, 95leadership, 87–88manufacturing-based view, 80measurers and, 84, 125partnerships and resources, 90–91people, 89–90people results, 93–94policy and strategy, 88processes, 83, 91–92product-based view, 81quality framework, 86–95quality viewpoint, 80–86SDLC and, 80society results, 94as suppliers, 87transcendent view, 81See also Groups
CCapability Maturity Model (CMM), 7, 11–12
Integration(CMMI
), 11–12intergroup relationships, 24–25levels, 11People (PCMM), 12, 13software development, 11
Capacity management, 235Cause–effect analysis, 259–61Change management, 183, 191–92, 235Change(s), 236–41
adaptive maintenance, 239–40builders and, 82–83corrective maintenance, 236–38cost of, 83–84enhancements, 238–39
285
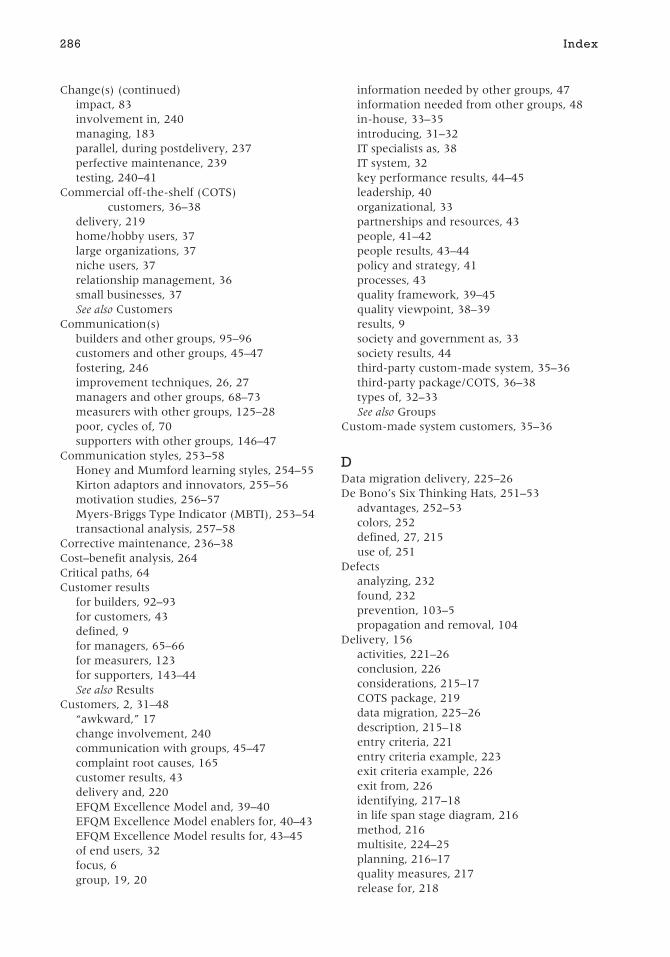
Change(s) (continued)impact, 83involvement in, 240managing, 183parallel, during postdelivery, 237perfective maintenance, 239testing, 240–41
Commercial off-the-shelf (COTS)customers, 36–38
delivery, 219home/hobby users, 37large organizations, 37niche users, 37relationship management, 36small businesses, 37See also Customers
Communication(s)builders and other groups, 95–96customers and other groups, 45–47fostering, 246improvement techniques, 26, 27managers and other groups, 68–73measurers with other groups, 125–28poor, cycles of, 70supporters with other groups, 146–47
Communication styles, 253–58Honey and Mumford learning styles, 254–55Kirton adaptors and innovators, 255–56motivation studies, 256–57Myers-Briggs Type Indicator (MBTI), 253–54transactional analysis, 257–58
Corrective maintenance, 236–38Cost–benefit analysis, 264Critical paths, 64Customer results
for builders, 92–93for customers, 43defined, 9for managers, 65–66for measurers, 123for supporters, 143–44See also Results
Customers, 2, 31–48“awkward,” 17change involvement, 240communication with groups, 45–47complaint root causes, 165customer results, 43delivery and, 220EFQM Excellence Model and, 39–40EFQM Excellence Model enablers for, 40–43EFQM Excellence Model results for, 43–45of end users, 32focus, 6group, 19, 20
information needed by other groups, 47information needed from other groups, 48in-house, 33–35introducing, 31–32IT specialists as, 38IT system, 32key performance results, 44–45leadership, 40organizational, 33partnerships and resources, 43people, 41–42people results, 43–44policy and strategy, 41processes, 43quality framework, 39–45quality viewpoint, 38–39results, 9society and government as, 33society results, 44third-party custom-made system, 35–36third-party package/COTS, 36–38types of, 32–33See also Groups
Custom-made system customers, 35–36
DData migration delivery, 225–26De Bono’s Six Thinking Hats, 251–53
advantages, 252–53colors, 252defined, 27, 215use of, 251
Defectsanalyzing, 232found, 232prevention, 103–5propagation and removal, 104
Delivery, 156activities, 221–26conclusion, 226considerations, 215–17COTS package, 219data migration, 225–26description, 215–18entry criteria, 221entry criteria example, 223exit criteria example, 226exit from, 226identifying, 217–18in life span stage diagram, 216method, 216multisite, 224–25planning, 216–17quality measures, 217release for, 218
286 Index

self-installation, 223–24single-site, 224size, 217support around, 216–17teamwork techniques summary, 222–23urgency, 216viewpoints, 218–21See also Software system life span
Deming cycle, 5, 56Design, 184
defined, 193elements, 193See also Software development life
cycle (SDLC)Development stage. See Software development
life cycle (SDLC)Distorted data representation, 72Document templates, 275–78
adapting, 279configuration management plan example,
278creating, 278project plan example, 276quality plan example, 277risk management plan example, 277See also Quality planning documents
EEarned value management (EVM), 264, 265EFQM Excellence Model, 7–10, 13–15
builders and, 86–87continuous learning, innovation,
improvement, 6customer focus, 6custom organization and, 39–40defined, 5, 7enablers, 7–9enablers for builders, 87–92enablers for customers, 40–43enablers for managers, 57–65enablers for measurers, 114–22enablers for supporters, 138–43as framework, 13fundamental concepts, 6–7illustrated, 8intergroup relationships, 25–26key performance results, 10leadership, 6, 7–8management by processes and facts, 6measurers and, 113–14models in, 13–15partnership development, 6people development and involvement, 6public responsibility, 6results, 9–10
results for builders, 92–95results for customers, 43–45results for managers, 65–68results for measurers, 123–25results for supporters, 143–46results orientation, 6supporters and, 136–38
Ego states, 258Enablers, 7–9
for builders, 87–92for customers, 40–43leadership, 7–8, 40, 57–58, 87–88, 114,
138–39for managers, 57–65for measurers, 114–22partnerships and resources, 8–9, 43, 60,
90–91, 119, 142people, 8, 41–42, 59–60, 89–90, 115–19,
139–42policy and strategy, 8, 41, 58–59, 88,
114–15, 139processes, 9, 43, 61–65, 91–92, 119–22,
142–43for supporters, 138–43See also EFQM Excellence Model
Enhancements, 238–39European Foundation for Quality Management.
See EFQM Excellence ModelEvaluation
SDLC/SMLC, 241–42timing, 242
Evolutionary model, 198advantages/disadvantages, 198defined, 203illustrated, 204See also SDLC models
Excellence concepts, 5–7EXtreme Programming (XP), 203
FFed-up falcon, 257Feedback
MBTI, 34personality types and, 34supporter problem, 140for testers, 118
GGames programs, 38Graphics
data density, 268data ink ratio, 268equations, 269improving, 267–69
Index 287

Graphics (continued)lie factor, 268
Groupsattitudes, 18builders, 19, 21, 77–97customers, 19, 20, 31–48EFQM Excellence Model and, 25–26interaction between, 22–27intergroup relationships, 24–26list of, 19managers, 19, 20–21, 51–74measurers, 19, 21, 101–26motivation, 24nonfunctional attributes and, 175organization, 26problems attributed to people outside, 23–24quality views across, 22summary, 148–50supporters, 19, 22, 131–50See also Teams
HHawthorne effect, 105Help-desk team, 137Honey and Mumford
learning styles, 254–55Learning Styles Helper’s Guide, 255Learning Styles Questionnaire, 27, 255
IICT specialists, 133–34Ideas
modeling, 261–62pursuing, 262–65start-up and, 165–70
Incident management, 235Incremental model, 199–200
advantages/disadvantages, 198defined, 199–200example, 198illustrated, 200See also SDLC models
Influence leaders, 87Infrastructure management, 235In-house customers, 33–35
group relationships, 33technical team dialog, 34See also Customers
Inspections, 266Inspectors, 111Installation
self, 223–24team, 216time period for, 216
See also DeliveryIshikawa fishbones, 237
defined, 27, 259diagram illustration, 259solution, 260
ISO 9000:1994, 10ISO 9000:2000, 10ISO 9126, 174Iterative/spiral model, 200–203
advantages/disadvantages, 198examples, 198exploratory nature of, 201iterative, illustrated, 200spiral illustrated, 201use problems, 203See also SDLC models
IT Infrastructure Library (ITIL), 136–37IT service–continuity management, 235IT Service Management Forum, 235IT specialists
as customers, 38security, 134
KKey performance results
for customers, 44–45defined, 10for managers, 67–68for measurers, 124–25for supporters, 146See also Results
Kirton adaptors and innovators, 255–56characteristics, 256defined, 27
LLeadership, 6, 7–8
for builders, 87–88for customers, 40defined, 6influence, 87for managers, 57–58for measurers, 114poor/undetermined, circle of, 88for supporters, 138–39See also Enablers
Lie factor, 72, 268
MMaintainability, 176Maintenance
adaptive, 239–40corrective, 236–38
288 Index
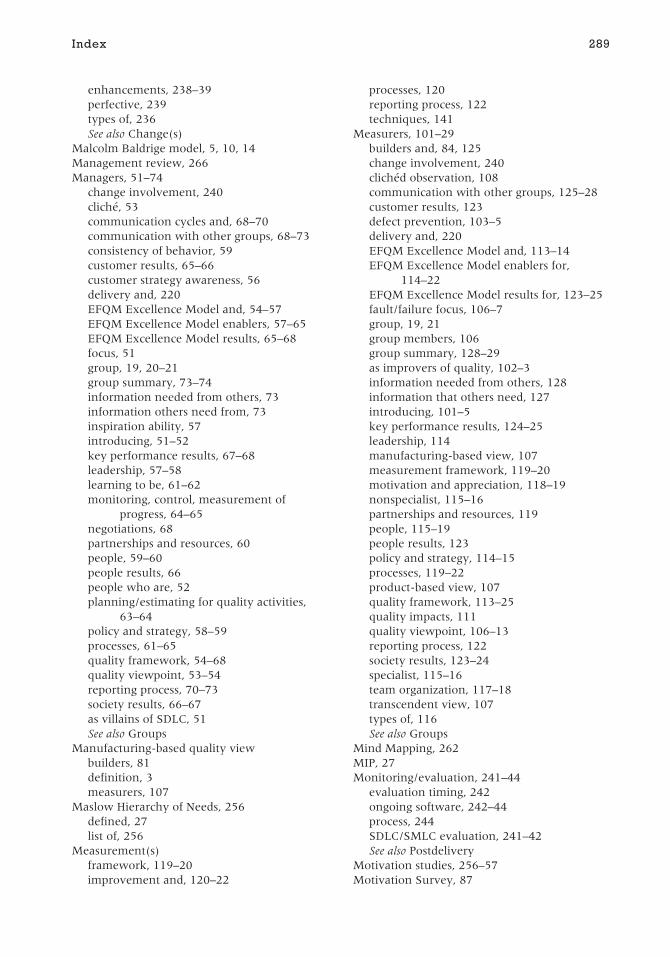
enhancements, 238–39perfective, 239types of, 236See also Change(s)
Malcolm Baldrige model, 5, 10, 14Management review, 266Managers, 51–74
change involvement, 240cliché, 53communication cycles and, 68–70communication with other groups, 68–73consistency of behavior, 59customer results, 65–66customer strategy awareness, 56delivery and, 220EFQM Excellence Model and, 54–57EFQM Excellence Model enablers, 57–65EFQM Excellence Model results, 65–68focus, 51group, 19, 20–21group summary, 73–74information needed from others, 73information others need from, 73inspiration ability, 57introducing, 51–52key performance results, 67–68leadership, 57–58learning to be, 61–62monitoring, control, measurement of
progress, 64–65negotiations, 68partnerships and resources, 60people, 59–60people results, 66people who are, 52planning/estimating for quality activities,
63–64policy and strategy, 58–59processes, 61–65quality framework, 54–68quality viewpoint, 53–54reporting process, 70–73society results, 66–67as villains of SDLC, 51See also Groups
Manufacturing-based quality viewbuilders, 81definition, 3measurers, 107
Maslow Hierarchy of Needs, 256defined, 27list of, 256
Measurement(s)framework, 119–20improvement and, 120–22
processes, 120reporting process, 122techniques, 141
Measurers, 101–29builders and, 84, 125change involvement, 240clichéd observation, 108communication with other groups, 125–28customer results, 123defect prevention, 103–5delivery and, 220EFQM Excellence Model and, 113–14EFQM Excellence Model enablers for,
114–22EFQM Excellence Model results for, 123–25fault/failure focus, 106–7group, 19, 21group members, 106group summary, 128–29as improvers of quality, 102–3information needed from others, 128information that others need, 127introducing, 101–5key performance results, 124–25leadership, 114manufacturing-based view, 107measurement framework, 119–20motivation and appreciation, 118–19nonspecialist, 115–16partnerships and resources, 119people, 115–19people results, 123policy and strategy, 114–15processes, 119–22product-based view, 107quality framework, 113–25quality impacts, 111quality viewpoint, 106–13reporting process, 122society results, 123–24specialist, 115–16team organization, 117–18transcendent view, 107types of, 116See also Groups
Mind Mapping, 262MIP, 27Monitoring/evaluation, 241–44
evaluation timing, 242ongoing software, 242–44process, 244SDLC/SMLC evaluation, 241–42See also Postdelivery
Motivation studies, 256–57Motivation Survey, 87
Index 289

Multisite delivery, 224–25Myers-Briggs Type Indicator (MBTI), 253–54
16 types, 254contrasting pair types, 253defined, 27feedback, 34See also Communication styles
NNonfunctional attributes, 174
delivery planning, 176importance of, 175selection of, 175
OOperational Acceptance Test (OAT), 141Organization, this book, xx–xxiiOutline plan, 177
PPartnerships
development, 6organizational, 60
Partnerships and resources, 8–9for builders, 90–91for customers, 43defined, 8–9for managers, 80for measurers, 119for supporters, 142See also Enablers
People, 8for builders, 89–90communication improvement techniques,
26, 27for customers, 41–42defined, 8for managers, 59–60for measurers, 115–19for supporters, 139–42See also Enablers
People CMM (PCMM), 12, 13People results
for builders, 93–94for customers, 43–44defined, 9for managers, 66for measurers, 123for supporters, 144–45See also Results
Perfective maintenance, 239Performance, 176
acceptance criteria, 176
prototype, 177See also Key performance results
Personal Software Process (PSP), 11, 12defined, 12development, 12intergroup relationships, 24–25process emphasis, 24
PERT charts, 64Phased waterfall, 197–99Policies
building activities, 88defined, 58managers setting, 58rules translation, 139
Policy and strategyfor builders, 88for customers, 41defined, 8for managers, 58–59for measurers, 114–15for supporters, 139See also Enablers
Postdelivery, 156–57, 229–46activities, 233–44change making, 236–41conclusion, 244–46COTS package (customer installation), 230defined, 229description, 229–31entry criteria, 233entry criteria example, 233exit criteria example, 245exit from, 244IT infrastructure and service management
activities, 234–36in life span stage diagram, 230monitoring/evaluation, 241–44system developed in-house, 230–31system with periodic updates, 231teamwork techniques, 243third-party developed system, 231viewpoints, 231–33See also Software system life span
Problem management, 235Problems
analysis cycle, 167group contributions to understanding,
168–70likelihood, 169sketching pictures of, 262solution decision, 168–70solutions parameters/constraints, 170statements, 167understanding, 165–68view of, 168
290 Index
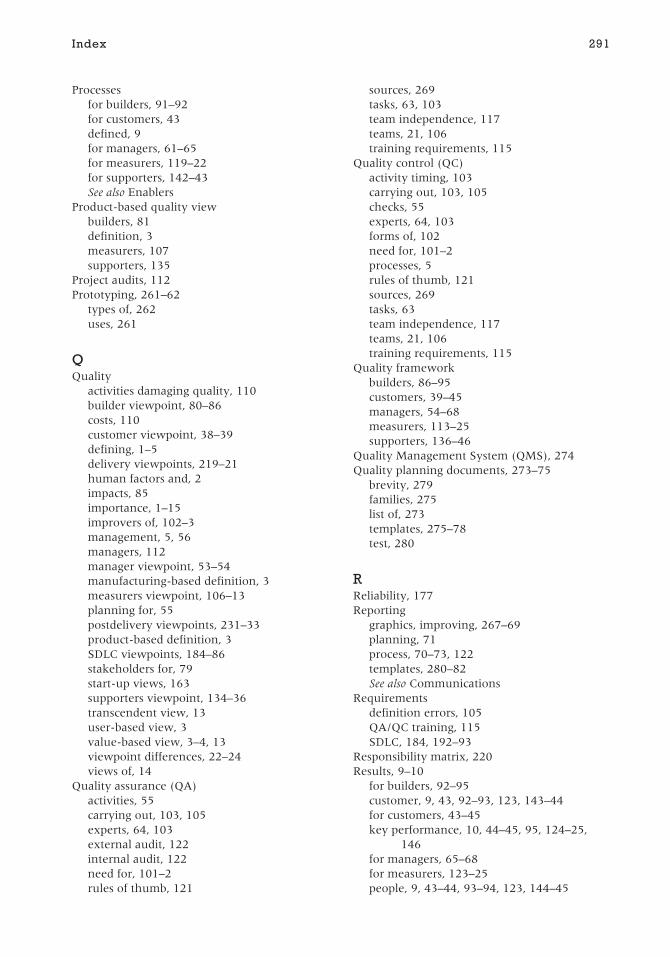
Processesfor builders, 91–92for customers, 43defined, 9for managers, 61–65for measurers, 119–22for supporters, 142–43See also Enablers
Product-based quality viewbuilders, 81definition, 3measurers, 107supporters, 135
Project audits, 112Prototyping, 261–62
types of, 262uses, 261
QQuality
activities damaging quality, 110builder viewpoint, 80–86costs, 110customer viewpoint, 38–39defining, 1–5delivery viewpoints, 219–21human factors and, 2impacts, 85importance, 1–15improvers of, 102–3management, 5, 56managers, 112manager viewpoint, 53–54manufacturing-based definition, 3measurers viewpoint, 106–13planning for, 55postdelivery viewpoints, 231–33product-based definition, 3SDLC viewpoints, 184–86stakeholders for, 79start-up views, 163supporters viewpoint, 134–36transcendent view, 13user-based view, 3value-based view, 3–4, 13viewpoint differences, 22–24views of, 14
Quality assurance (QA)activities, 55carrying out, 103, 105experts, 64, 103external audit, 122internal audit, 122need for, 101–2rules of thumb, 121
sources, 269tasks, 63, 103team independence, 117teams, 21, 106training requirements, 115
Quality control (QC)activity timing, 103carrying out, 103, 105checks, 55experts, 64, 103forms of, 102need for, 101–2processes, 5rules of thumb, 121sources, 269tasks, 63team independence, 117teams, 21, 106training requirements, 115
Quality frameworkbuilders, 86–95customers, 39–45managers, 54–68measurers, 113–25supporters, 136–46
Quality Management System (QMS), 274Quality planning documents, 273–75
brevity, 279families, 275list of, 273templates, 275–78test, 280
RReliability, 177Reporting
graphics, improving, 267–69planning, 71process, 70–73, 122templates, 280–82See also Communications
Requirementsdefinition errors, 105QA/QC training, 115SDLC, 184, 192–93
Responsibility matrix, 220Results, 9–10
for builders, 92–95customer, 9, 43, 92–93, 123, 143–44for customers, 43–45key performance, 10, 44–45, 95, 124–25,
146for managers, 65–68for measurers, 123–25people, 9, 43–44, 93–94, 123, 144–45
Index 291

Results (continued)society, 9–10, 44, 94, 123–24, 145for supporters, 143–46See also EFQM Excellence Model
Return on investment (ROI), 53Reviews
audits, 266guidelines, 267inspection, 266management, 266technical/peer, 266techniques, 266–67training, 267walkthrough, 27, 266work contract, 178
Rich Picturing, 262
SScorecards
defined, 67illustrated, 68measures, 67–68quality balanced, 69variations, 67
SDLC entry criteria, 186–90checklist, 187excessive, 188incorrect, 188insufficient, 189not defined, 187not met, 187–89tailoring, 189See also Software development life cycle
(SDLC)SDLC exit criteria, 208–11
example, 209following detailed acceptance test, 208not defined, 209–10not met, 210not set, 210tailored, example, 211tailoring, 210See also Software development life cycle
(SDLC)SDLC models, 195–204
advantages/disadvantages, 198evolutionary, 198examples, 198incremental, 199–200iterative/spiral, 200–203quality views and, 204–8V-model, 203–4waterfall, 196–99W-model, 198, 204
See also Software development life cycle(SDLC)
Security management, 235Self-installation, 223–24Service-delivery specialists, 133Service-level agreements (SLAs), 138Service-level management, 235Silver bullet life cycle, 234Single-site delivery, 224SMART acceptance criteria, 177Society results
for builders, 94for customers, 44defined, 9–10for mangers, 66–67for measurers, 123–24for supporters, 145See also Results
Softwareacquisition of, 182deployment, 132games, 38optimization, 133products identification, 183protection, 132purpose of, 31supportable, 134–35as tool, 32updates/changes, 133
Software and Systems Quality Framework(SSQF), 14, 113
Software development life cycle (SDLC),35, 155–56, 181–212
activities, 190–95build, 184, 193–94builders and, 80change examples, 185change management, 183, 191–92conclusion, 211–12customer involvement and, 45defined, 154, 181–82definition of, 182description, 181–84design, 184, 193entry/exit points within, 195evaluating, 241–42exit from, 208–11in life span stage diagram, 183managers as villains, 51no start-up stage and, 190planning and monitoring, 183, 190–91purpose, 182requirements, 184, 192–93in software system life span, 154task summary, 183–84
292 Index

teams, 185, 191teamwork techniques, 202testing, 102, 184, 194–95viewpoints, 184–86See also SDLC entry criteria; SDLC exit
criteria; SDLC modelsSoftware engineers. See BuildersSoftware-maintenance life cycles (SMLCs),
140, 236evaluating, 241–42software projects as, 236
Software-maintenance specialists, 134Software quality. See QualitySoftware system life span, 153–59
change cycles, 157delivery, 156, 215–26development, 155–56, 181–212entry/exit criteria between stages, 157–58postdelivery, 156–57, 229–46quality importance, 158quality viewpoint changes across, 158–59stages, 154stages illustration, 155start-up, 153, 155, 161–79
SSADM, 262Start-up, 153, 155, 161–79
activities, 165–78constraints/parameters setup, 170description, 161–63entry criteria, 164–65exit criteria, 179exit from, 178–79in life-cycle stage diagram, 162next stage agreement, 170–71problem/idea solution decision, 168–70problem/idea understanding, 165–68task summary, 163teamwork view, 164techniques summary, 166–67viewpoints, 163–64work contracting, 171–78See also Software system life span
Strategiesfor managers, 58for measurers, 114–15See also Policy and strategy
Supporters, 131–50change involvement, 240communication with other groups, 146–47customer results, 143–44delivery and, 220EFQM Excellence Model and, 136–38EFQM Excellence Model enablers for,
138–43EFQM Excellence Model results for, 143–46
group, 19, 22group composition, 133–34group summary, 147–48information for other groups, 148information needed by others, 149interpersonal skills, 141–42introducing, 131–33key performance results, 146knowledge, 132leadership, 138–39management skills, 141measurement techniques, 141partnerships and resources, 142people, 139–42people results, 144–45policy and strategy, 139problem view, 140processes, 142–43product-based view, 135quality framework, 136–46quality viewpoint, 134–36service-support specialists, 133skills, 141society results, 145too little involvement, 132transcendent view, 136user-based view, 135–36See also Groups
TTaken-for-granted assumption, 249Teams
defining, 19–22in disunity, 17–19help-desk, 137information needs, 278–79installation, 216organization, 117–18personalities, 250plan layout, 62QA, 21QC, 21roles, 250–51SDLC, 185, 191strengths/weaknesses, 250
Team Software Process (TSP), 7, 11, 12defined, 12development, 12intergroup relationships, 24–25
Teamworkfostering, 246start-up view, 164techniques during SDLC, 202techniques in delivery, 222techniques to aid postdelivery, 243
Index 293

Technical/peer review, 266Test automation specialists, 112Testers
feedback for, 118skill variety, 118types of, 116See also Measurers
Testing, 102changes, 240–41code execution, 194elements, 195SDLC, 184, 194–95user-acceptance, 112without written specification, 109
Test managers, 112Third-party customers, 35–38
custom-made system, 35–36package/COTS, 36–38
TQMI, 165, 260Transactional analysis, 257–58
defined, 258ego states, 258
UUsability, 176User-acceptance testing, 112User-based quality view
builders and, 81definition, 3, 81measurers and, 108supporters, 135–36
VValue-based quality view
builders and, 81–82definition, 3–4, 81–82measurers and, 108
V-model, 203–4advantages/disadvantages, 198defined, 203example, 198illustrated, 205See also SDLC models
WWalkthroughs, 27, 266Waterfall model, 196–99
advantages/disadvantages, 198big bang, 196–97, 199examples, 198phased, 197–99when to use, 199See also SDLC models
Weaver triangledefined, 27illustrated, 173uses, 172
W-model, 198, 204Work
acceptance criteria, 174–77aims/objectives, 172constraints for, 173contracting, 171–78contract review, 178outline plan, 177
294 Index

Recent Titles in the Artech HouseComputing Library
Achieving Software Quality through Teamwork, Isabel Evans
Action Focused Assessment for Software Process Improvement, Tim Kasse
Advanced ANSI SQL Data Modeling and Structure Processing, Michael M. David
Advanced Database Technology and Design, Mario Piattini and Oscar Díaz, editors
Agent-Based Software Development, Michael Luck, Ronald Ashri,and Mark d’Inverno
Building Reliable Component-Based Software Systems, Ivica Crnkovicand Magnus Larsson, editors
Business Process Implementation for IT Professionals and Managers,Robert B. Walford
Data Modeling and Design for Today’s Architectures, Angelo Bobak
Developing Secure Distributed Systems with CORBA, Ulrich Langand Rudolf Schreiner
Discovering Real Business Requirements for Software Project Success,Robin F. Goldsmith
Future Codes: Essays in Advanced Computer Technology and the Law,Curtis E. A. Karnow
Global Distributed Applications with Windows® DNA, Enrique Madrona
A Guide to Software Configuration Management, Alexis Leon
Guide to Standards and Specifications for Designing Web Software, Stan Mageeand Leonard L. Tripp
Implementing and Integrating Product Data Management and SoftwareConfiguration, Ivica Crnkovic, Ulf Asklund, and Annita Persson Dahlqvist
Internet Commerce Development, Craig Standing
Knowledge Management Strategy and Technology, Richard F. Bellaverand John M. Lusa, editors
Managing Computer Networks: A Case-Based Reasoning Approach, Lundy Lewis
Metadata Management for Information Control and Business Success, Guy Tozer
Multimedia Database Management Systems, Guojun Lu
Practical Guide to Software Quality Management, Second Edition, John W. Horch
295

Practical Insight into CMMI®, Tim Kasse
Practical Process Simulation Using Object-Oriented Techniques and C++,José Garrido
A Practitioner’s Guide to Software Test Design, Lee Copeland
Risk-Based E-Business Testing, Paul Gerrard and Neil Thompson
Secure Messaging with PGP and S/MIME, Rolf Oppliger
Software Fault Tolerance Techniques and Implementation, Laura L. Pullum
Software Verification and Validation for Practitioners and Managers, SecondEdition, Steven R. Rakitin
Strategic Software Production with Domain-Oriented Reuse, Paolo Predonzani,Giancarlo Succi, and Tullio Vernazza
Successful Evolution of Software Systems, Hongji Yang and Martin Ward
Systematic Process Improvement Using ISO 9001:2000 and CMMI®, Boris Mutafelijaand Harvey Stromberg
Systematic Software Testing, Rick D. Craig and Stefan P. Jaskiel
Systems Modeling for Business Process Improvement, David Bustard,Peter Kawalek, and Mark Norris, editors
Testing and Quality Assurance for Component-Based Software, Jerry Zeyu Gao,H. -S. Jacob Tsao, and Ye Wu
User-Centered Information Design for Improved Software Usability,Pradeep Henry
Workflow Modeling: Tools for Process Improvement and ApplicationDevelopment, Alec Sharp and Patrick McDermott
For further information on these and other Artech House titles,
including previously considered out-of-print books now available through our
In-Print-Forever® (IPF®) program, contact:
Artech House Artech House
685 Canton Street 46 Gillingham Street
Norwood, MA 02062 London SW1V 1AH UK
Phone: 781-769-9750 Phone: +44 (0)20 7596-8750
Fax: 781-769-6334 Fax: +44 (0)20 7630-0166
e-mail: [email protected] e-mail: [email protected]
Find us on the World Wide Web at:www.artechhouse.com
296
Copyright © 2022 FDOKUMEN