Guillermo Fernández, Rasgos dramáticos de la novela histórica española
Upload
khangminh22Category
view
0download
0
Teamwork in Contests∗
Jorge Lemus† Guillermo Marshall‡
March 8, 2022
Abstract
Using data from a popular online-contests platform, we study teamwork in contests.Our reduced-form evidence shows that teamwork causes productivity gains in the formof higher quality submissions rather than more quantity. We then estimate a structuralmodel to understand players’ dynamic incentives to form teams throughout a contest,incorporating that teamwork improves performance but is also costly. Our estimatesshow that teamwork is quite costly, which explains the scarcity of teams in the dataeven when teamwork improves performance. Using our estimates, we show that anincrease in competition motivates teamwork. We also show that banning teamwork isdetrimental to contest performance; the less costly it is for players to form teams, thebetter the contest outcomes. Lastly, we find that similarly-ranked players form mostteams, and they do so later with noisier performance feedback, showing the role ofinformation asymmetry on team formation.
Keywords: Contests, teamwork, collaboration, contest design
∗Acknowledgements: We thank workshop and conference participants at the Econometric Society WinterMeeting (University of Nottingham), Pontificia Universidad Católica de Chile, and University of BritishColumbia (Sauder School of Business) for helpful comments and suggestions. Guillermo Marshall is supportedin part by funding from the Social Sciences and Humanities Research Council. All errors are our own.
†University of Illinois at Urbana-Champaign, Department of Economics; [email protected]‡University of British Columbia, Sauder School of Business; [email protected]
1

1 Introduction
The organization of innovation has changed dramatically following the rise of online contests.Over the last decade, firms and government agencies have sponsored thousands of online con-tests offering large monetary prizes. A firm’s manager who needs to solve a specific problemfinds in an online competition access to an otherwise expensive production technology: alarge number of capable workers willing to spend effort to solve a problem. The organi-zation of workers is crucial, as teamwork has been shown to improve productivity in othersettings (Hamilton et al., 2003; Jones, 2009). Teamwork policies vary across platforms thathost online contests, so before choosing where to sponsor a competition, a manager needs tounderstand how these policies impact performance.
Our contribution is to empirically investigate teamwork in contests. Specifically, we studythe impact of teamwork on team performance in large online competitions and the impact ofcontest design on team formation. We combine policy evaluation techniques and a structuralmodel of team formation in contests to answer these questions. Our empirical setting isKaggle (www.kaggle.com), the largest platform for hosting online data-science competitions(prediction contests), where players create algorithms to predict the outcome of a randomvariable conditional on a set of covariates.1 Kaggle competitions usually last several months,offer large monetary prizes, and attract thousands of participants, who are allowed to makemultiple submissions over time.
At least five factors make Kaggle an ideal setting to causally estimate the effect of teamworkon players’ performance and, hence, on contest outcomes. First, each competition attractsthousands of participants, who can form teams. Second, players can make multiple submis-sions over time, allowing us to keep track of their performance over time. Third, players musthave made at least one submission prior to forming a team. This allows us to observe theperformance of each player before and after they form their team. Fourth, each submission isevaluated based on a predetermined, objective metric (e.g., root mean squared error). Fifth,players have access to a real-time public leaderboard providing noisy feedback about the stateof the competition.2
1For instance, the ride-sharing company Lyft is hosting a competition where participants need to predictthe movement of traffic agents around an autonomous vehicle.
2Kaggle evaluates each submission on two subsets of the data to obtain two scores. The first is the publicscore, which is posted on a public leaderboard in real time with the objective of informing (with a certaindegree of noise) players about the performance of all participants. The second score is the private score,which is concealed until the end of the competition and is used by Kaggle to determine the winner of thecompetition. Public and private scores are highly correlated.
2

Our sample includes 149 Kaggle competitions and offers detailed information about theperformance of every submission in a competition, the identity of the player making eachsubmission, and team formation. These data allow us to reconstruct the public leaderboardand the organization of players into teams at every moment of time in each competition.This public information is also available to players throughout the competition.
We identify the impact of teamwork on team performance by exploiting the timing of teamformation during a competition. We compare the performance of players who form a teamwith those who work solo (and never form a team) both before and after the team forms usinga differences-in-differences design. The identification argument is that the performance of thecontrol solo players and the team members would have followed the same trend had the teamnot formed. In the estimation, we resort to several methods to deal with the fact that teamformation is endogenous, i.e., players form teams because they expect benefits exceeding thecosts of forming a team. First, we use matching on observables (e.g., performance of teammembers up until the team forms) to accommodate the case in which team formation is afunction of observables (e.g., the gains of forming a team are explained by the performanceof players), but as good as random among a set of individuals with the same observables.Second, we implement a Heckman-style selection model (Heckman, 1979) to accommodatethe case in which team formation responds to unobservables as well as observables. We finda positive relationship between teamwork and performance using all of these methods.
Our baseline estimates imply that teamwork increases a player’s scores by an average of 0.04to 0.1 standard deviations, which is roughly equivalent to the median score difference betweenthe winner of a competition and the player ranked in the 40th position. This finding isconsistent with evidence from other settings showing that teamwork improves performance.When estimating dynamic effects, we find that, team members, prior to forming a team,perform no differently than the comparison group (solo players). However, their performancesignificantly increases shortly after the team formation, and these performance gains persistover time.
We use a similar research design to study the impact of teamwork on the number of sub-missions, and we find two results. First, we find that 8.4 percent of teams stop makingsubmissions after they form (which we call “failed” teams), suggesting that the benefits ofteamwork are uncertain. Second, among the teams that remain active, teamwork does notchange the team member’s average number of submissions. That is, the aggregate numberof submissions by all team members is, on average, equal before and after the team forms.
While teams perform better than solo players, they represent less than 8 percent of all players
3

in the contest (e.g., 92 percent are solo players). The small number of teams is consistentwith other findings in the literature, and can be attributed to a number of factors, such asmatching frictions (Boudreau et al., 2017), moral hazard concerns (Bonatti and Hörner, 2011;Georgiadis, 2015), asymmetric information (Lin et al., 2013), or credit allocation Bikard et al.(2015). In our setting, matching frictions could hinder collaboration because players struggleto find a partner who speaks or writes code in the same language and has a compatibleskill set and personality. Asymmetric information about the type of a potential partner—aplayer’s ability, commitment to work, or preference over approaches for solving a problem—may prevent partnerships from forming. Any of these problems can trigger the demise of ateam (recall that in our data 8.4 percent of teams fail).
To explore the players’ incentives to form teams during the competition and shed light onwhether platforms should facilitate teamwork, we build a structural model of team formationin dynamic contests, where players get random opportunities to form teams. Motivated byour finding that teamwork improves performance, we assume that players working in teamsare more likely to achieve high scores. This is the driving force that pushes players to formteams. There are three factors that counteract the incentive to form a team: (1) playersneed to split the prize if they win; (2) a team can fail; and (3) forming a team is costly.We estimate the primitives of the model, including the distribution of the team-formationcost, and find that the average cost of forming a team across all contests in our data is 52percent of the prize. While these costs are heterogeneous across players, most players find ittoo costly to form a team, even knowing that their performance will improve conditional onnot failing.
Using the estimates of our structural model, we show that allowing teamwork increases acontest’s maximum score but decreases the total number of submissions. The increase in themaximum score is attributed to the boost in the performance of players who work in teamsthat do not fail, whereas the decrease in the number of submissions is attributed to the teamsthat fail and stop making submissions. While most contests in Kaggle allow teamwork, notevery platform that hosts contests, nor every online contest directly sponsored by firms andgovernment agencies permit teamwork. Our results suggest that every contest sponsor shouldbe aware of the potential benefit of allowing teamwork.
The next question we ask is whether, conditional on allowing teamwork, a contest spon-sor would benefit from investing in facilitating teamwork, i.e., making team formation lesscostly. In practice, a platform could facilitate teamwork by allowing players to communicate,providing easy access other player’s profiles (e.g. history of achievements), or incorporating
4

online-collaboration tools. Any of these initiatives would likely reduce the cost of formingteams which, theoretically, has an ambiguous effect on contest outcomes. On the one hand,when team formation is less costly, more teams will form, so team members are more likelyto produce high-scoring submissions, as teamwork improves performance relative to workingsolo. On the other hand, a fraction of teams fails, leaving fewer competitors able to makesubmissions, reducing the number of submissions. To answer this question, we compute thecounterfactual equilibria of contests where we reduce the team formation cost. We find thatthe lower the cost of forming a team, the more teams, the fewer submissions, and the higherthe maximum score. In other words, the benefit of facilitating teamwork outweighs the cost.
Next, we use our estimates of the structural model to shed light on the impact of competitivepressure on contest outcomes. We increase the competitive pressure that players face in acontest by simulating a contest that lasts longer. We find that longer contests increase thenumber of teams. Part of this effect is mechanic, since there are more opportunities to forma team in a longer contest. However, we find that the number of teams per unit of time alsoincreases. Thus, players anticipating a longer competition are motivated to work in teamsto improve their chances of winning. This result suggests a greater impact of teamwork inmore competitive environments.
Lastly, we present complementary evidence on some of the factors that might hinder team-work in contests. First, we find evidence of assortative matching: teams are more likely toform among similarly-ranked players. Forming a team with a “similar” player may allevi-ate asymmetric-information concerns (ability) and also balance the “power dynamics” insidethe team. We observe similar assortative-matching patterns along the dimensions of per-formance in past competitions and contributions to the community (e.g., code sharing andmessage posting on public forums). Second, we exploit variation in the precision of the publicleaderboard across competitions to assess the role of incomplete information. We find thatcollaboration occurs earlier in competitions providing more precise performance feedback.We interpret this finding as indicative of rational use of the information content of signals:fewer signals are needed to overcome information asymmetries when signals are more precise.
Our results have implications for contest design. Broadly speaking, contests should facilitatethe formation of self-organized teams.3 First, a public leaderboard is vital; it allows players tolearn about the performance of prospective partners in the current competition. Second, theleaderboard should be as informative as possible.4 Third, information about past performance
3Blasco et al. (2013) shows that self-organized teams perform better than randomly-formed teams.4The contest designer needs to consider overfitting concerns with a perfectly informative leaderboard.
5

should be as informative as possible.5 Fourth, the platform should provide opportunitiesto signal skills beyond performance in the current competition. In Kaggle, for example,competitors can develop and share code to analyze a dataset even if they do not participatein a competition. Fifth, the platform should facilitate the enforcement of prize splits amongteam members.6 From a managerial perspective, these are all low-cost interventions that cangreatly enhance the value of hosting online contests.
Related Literature. A central question in economics is how a firm should organize itsworkers. As innovation becomes more complex (Bloom et al., 2020), Jones (2009) documentsthat teamwork allows inventors to cope with an expanding knowledge frontier. We alsoobserve this in Kaggle competitions, where the share of teams has increased over time.
One of our contributions is to show that teamwork improves performance in contests. Insettings other than contests, researchers have found that teamwork improves performance(see, e.g., Hamilton et al., 2003; Jones, 2009; Waldinger, 2012; Ahmadpoor and Jones, 2019).Our data do not allow us to observe task-allocation within a team, so we cannot uncover themechanism underlying the performance gains. The literature has put foward several plau-sible mechanism. First, Büyükboyacı and Robbett (2017) and Büyükboyaci and Robbett(2019) find evidence of productivity gains from exploiting comparative advantages amongheterogeneous workers. Second, Girotra et al. (2010) find that teams formed after playersindependently work on their ideas perform better than teams where members work togethersince the team’s inception. Third, LiCalzi and Surucu (2012) model the impact of knowledgediversity on team performance. Fourth, using data on academic papers, patents, and soft-ware products Wu et al. (2019) shows that smaller teams produce more disruptive research,whereas larger teams expand on the existing knowledge. Fifth, a predominately experimen-tal literature examines the level of strategic sophistication of groups versus individuals (see,e.g., Cooper and Kagel, 2005; Sutter et al., 2013; Müller and Tan, 2013; Feri et al., 2010).A literature review by Charness and Sutter (2012) shows that performance gains could beexplained by team decisions being less likely influenced by biases, cognitive limitations, andsocial considerations. Sixth, Bandiera et al. (2013) use a field experiment to study the im-pact of different incentives schemes on workers decision to form a team with friends or toassortatively match by skill.
Relative to these findings, in our data: we do not observe player’s comparative advantages5Kaggle allocates “medals” based on performance. However, some have questioned the real value of a
medal, especially if each member of a multiplayer team gets one regardless of their contribution.6In some competitions, it is up to the winning team to reallocate the prize money among its members. In
others, the platform allocates the prize in even shares between the team members unless the team requestsan alternative prize distribution. See, e.g., some competitions hosted in the platform DrivenData.org.
6

but we find that similarly-ranked players form most teams; players must work independentlybefore forming a team (on average, players send 16 solo submissions before forming a team);two- and three-member teams represent 80 percent of all teams; and larger teams do notnecessarily perform better. We present a structural model in which team formation is drivenby reaping the benefits of higher productivity against the cost of forming a team and thepossibility that the team could fail.
Teamwork may also have long-lasting consequences. For instance, (Ahmadpoor and Jones,2019) find that teamwork has greater impact than solo work. Azoulay et al. (2010) andJaravel et al. (2018) show that the premature death of high-skilled team members worsensthe future performance of the remaining team members. We provide descriptive evidencesuggesting that teamwork benefits players in future contests; players who work in teams aremore likely to do better in future contests.
Some descriptive articles, which do not provide causal estimates of the impact of teamworkon contest outcomes, have also studied teamwork in Kaggle competitions. Wang et al. (2019)discuss repeated participation in Kaggle competitions. Dissanayake et al. (2019) documentthat members with similar characteristics form most teams, although teams where membershave diverse characteristics perform better. Dissanayake et al. (2015) also find that lessdiverse teams perform worse, unless most of their members are high-skilled. None of thesepapers structurally estimate a model of team formation.
2 Background and Data
2.1 Kaggle Competitions
Kaggle is a platform that hosts online prediction competitions, where participants predict arandom variable (e.g., YouTube sponsored a competition where players had to predict videotags for videos). The player with the most accurate predictions wins the competition. Wefocus on featured competitions, which are hosted by a company (e.g., YouTube, Expedia)and pay an average monetary prize of $48,434 (USD). These competitions usually attractmany players, last several months, and participants can submit multiple times before the endof the competition (though there is a limit on the number of submissions that players canmake in a given day).
Participants of Kaggle competitions have access to two datasets. The first one, the training
7

dataset, includes both an outcome variable and covariates, and is used by the participantsto train their algorithms. The second one, the test dataset, only includes covariates. Whenmaking a submission, the player must submit outcome-variable predictions for each obser-vation in the test dataset. Kaggle partitions the test dataset in two subsets and evaluatesthe out-of-sample performance of each submission on these two subsets.7 The out-of-sampleperformance of each submission on the first subset, the public score, is instantly posted ona public leaderboard.8 The out-of-sample performance of each submission on the secondsubset, the private score, is made public at the end of the competition only and is used todetermine the winner. Public and private scores are highly correlated (the correlation in oursample is 0.99), making public scores informative but noisy signals of performance.
Players are free to form teams subject to some restrictions. First, each member of thenew team must have made at least one submission prior to the team formation. In oursample, team players submitted an average of 16 submissions prior to the team formation.Second, the cumulative number of submissions by all team members prior to the mergercannot exceed a threshold—the maximum allowed submissions per day times the numberof days the competition has been running. Third, they must form their team before theteam-formation deadline chosen by Kaggle for each competition. Fourth, players cannot bedisband teams that have made submissions.
2.2 Data and Descriptive Evidence
We use publicly available information on 149 featured competitions hosted by Kaggle.9 Anobservation in our dataset is a submission in a contest. For each submission, we observe itstimestamp, an identifier for the player (and team) who made it, and its public and privatescores. We also observe data on team formation: the exact date when a player joins a team,whether the team fails (i.e., stops making submissions). These data allow us to keep trackof the performance of a player (or team) during the contest as well as reconstruct both thepublic and private leaderboard at every instant of time.
Table 1 reports competition-level summary statistics. The table shows that these competi-tions offer a monetary prize of $48,434 (USD) on average, with some competitions offering asmuch as $1,200,000, and attract a large number of participants who make many submissions.
7Players do not know which of these subsets a given observation in the test dataset belongs to.8The evaluation criterion for the out-of-sample performance of a submission varies across contests. Ex-
amples of evaluation criteria include the root mean squared error or R2.9https://www.kaggle.com/kaggle/meta-kaggle
8

On average, 1,495 teams made at least one submission, and the competitions received an av-erage of 24,787 submissions. We standardize the public and private scores of the submissionsvariables at the competition level (they have mean 0 and standard deviation 1) to facilitatecomparison across competitions. Depending on the contest’s evaluation metric, players com-pete to achieve low scores (e.g., RMSE) or high scores (e.g., R2). We transform scores sothat higher scores can always be interpreted as better scores.
Table 1: Competition-level summary statistics
Count Mean St. Dev. Min Max(1) (2) (3) (4) (5)
Total number of submissions 149 24,787.48 32,416.34 139.00 159,810Total number of teams 149 1,495.04 1,772.96 29 10,450Total number of players 149 1,587.93 1,881.41 30 11,111Average team size 149 1.17 0.13 1.01 1.74Reward quantity (USD) 149 48,434.21 128,676.46 0 1,200,000
Notes: An observation is a competition.
Table 2 presents the distribution of team size across competitions.10 Panel A includes the fullsample of teams and shows that 92 percent of them have a single member and 4.6 percentof teams have two members. Panel B restricts attention to the teams that finish the contestwithin the top 50 and shows that teamwork is more frequent in the top 50: Only 71 percentof these teams have a single member, while 13 percent have two.
One important fact about teams is that 8.4 percent of them “fail,” i.e., they stop makingsubmissions after they form. Furthermore, most player who form a team do so only once(84.3 percent of players). This suggest that some players may regret forming a team, eventhough they may have believed it was a good idea ex ante, or that players reap all the benefitsfrom teamwork after participating in a team once.
The scant number of teams and non-negligible rate of team failure suggests that forming ateam is costly and the prospects of forming a team are uncertain. However, the evidenceshows that teams that do not fail do well relative to single players. First, Table 2 shows thatteams are relatively more common among the top 50 players. Second, Figure 1 shows theshare of teams across contests by player ranking at the end of the competition, and the figurereveals that higher ranked players are likelier to be part of a team. For instance, about 60percent of the time a team took the first place, while only about 30 percent of the time ateam took the 30th place. Thus, top players are far more likely work in teams than solo.
10Figure A.1, in the Online Appendix, shows that distribution of team-formation time is roughly uniform.
9

Table 2: Distribution of team size across competitions
Freq. Percent CumulativeNumber of members (1) (2) (3)Panel A: All teams1 205,193 92.11 92.112 10,302 4.62 96.743 3,873 1.74 98.484 1,799 0.81 99.285 or more 1,594 0.72 100.00Total 222,761 100.00
Panel B: Top 50 teams1 5,260 71.35 71.352 984 13.35 84.703 503 6.82 91.524 273 3.70 95.235 or more 352 4.77 100.00Total 7,372 100.00
Notes: An observation is a competition–team combination. The top 50 teams are the teams who finishedwithin the first fifty positions of the private leaderboard in each competition.
One of the goals of our paper is to understand if there is a causal relationship betweenteamwork and performance. Sections 3 and 4 are devoted to studying whether this positiverelationship between teamwork and performance is, in fact, causal. In Sections 5 and 6 weexplore the cost of forming teams, and in Section 6 we investigate the impact of asymmetricinformation on team formation and failure.
3 Empirical Strategy
To measure the impact of teamwork on performance, we exploit variation on the state of acompetition at the time of team formation. We compare the performance of team membersbefore and after they join a team with the performance of solo players.
Our main estimating equation is
yi,j,c,t = β · 1{post team formation}i,j,c,t + h(xi,j,c,t, δ) + µj,c + λc,t + εi,j,c,t, (1)
where yi,j,c,t is a measure of an outcome variable i (e.g., score of submission i) by “player” j (a
10

Figure 1: Share of teamwork by final ranking
0.2
.4.6
Shar
e of
mul
tipla
yer t
eam
s
1 5 10 15 20 25 30Final ranking
Notes: An observation is a team that finished a competition in the top 30 positions of the final ranking.
team or a solo player) in competition c at time t, 1{post team formation}i,j,c,t is an indicatorthat takes the value one if player j forms a time at time t, xi,j,c,t is a vector of time-varyingplayer-level state variables, such as the player’s distance to the maximum score on the publicleaderboard, which is a time-dependent variable defined as the difference between the player’sscore at time t and the maximum score at time t. The term h(·, δ) is a quadratic function ofthe state variables, µj,c and λc,t are player–competition and competition–time fixed effects,respectively, and εi,j,c,t is an error term clustered at the player level. We also estimate aversion of equation (1) that allows for time-varying effects,
yi,j,c,t =6∑
τ=−61{τ weeks before/after team formation}i,j,c,tβτ +h(xi,j,c,t, δ) +µj,c+λc,t+ εi,j,c,t,
(2)where β−τ and βτ , for τ = 1, ..., 6 capture, respectively, the performance of a player τ weeksbefore and τ weeks after the team forms, for players who join a team.11 In our analysis,all the submissions of all members of team j have the same team identifier, even those thatare submitted before the team forms. The coefficient of interest, β, therefore, measures theimpact of teamwork on the overall performance of all team members. We restrict our analysisto teams that did not fail, i.e., teams that send at least one submission after they form.
Identification. The main identification assumption is that treatment assignment is uncon-founded. That is, the probability that a solo player is exposed to the treatment (i.e., forms ateam) may depend on player-level state variables (xi,j,c,t) and the player’s ability to produce
11We normalize the coefficient β−1 to zero. β0 captures the effect of teamwork at the week of the teamformation.
11

high scores (captured in the player-level fixed effects), but it does not depend on the potentialoutcomes (Imbens and Rubin, 2015). In our framework, this can also be interpreted as form-ing a team being exogenous conditional on player-level state variables and the player’s abilityto produce high scores, implying that the treatment is uncorrelated with performance-relatedunobservables in the error term. Under this assumption, β can be identified by comparingthe observed scores of treated and non-treated teams that have similar state variables.
The unconfoundedness assumption is compatible with the idea that team formation is en-dogenous, i.e., a set of players form a team when they expect that the benefits will exceedthe costs of forming a team. In particular, unconfoundedness accommodates the cases inwhich a player’s decision to form a team can be explained based on observable state variables(e.g., their position in the leaderboard) or performance-unrelated unobservables (e.g., thesize of their social network). This assumption, however, does not accommodate the case inwhich performance-related unobservables in the error term affect the decision to form a team.For example, a violation of the unconfoundedness assumption would occur if all participantshad perfect foresight about the gains of teamwork and these gains are heterogeneous acrossplayers. In this case, team formation would only occur among players expecting sufficientlylarge gains, and these gains would at least in part appear in the error term.
Plausibility of Unconfoundness. We assess the plausibility of the unconfoundness as-sumption in two ways. First, we use the estimates of equation (2) to evaluate whether theperformance of treated and non-treated teams, conditional on state variables, exhibit similartrends running up to the time of the team formation. Second, we present descriptive evidencesuggesting that collaboration gains are uncertain, from the perspective of a solo player, whichimplies that post team formation performance-related unobservables are unlikely to be theonly driver of team formation.12
Estimation Methods. The first approach uses the full sample of solo players and two-member teams. We exclude larger teams to insulate our estimates of the impacts of collabo-ration from instances of multiple treatments during the competition (i.e., teams that invitemultiple players during the competition and thus experience the benefits of collaboration inmultiple different occasions). If the treatment assignment is unconfounded, the estimated βcoefficient will capture the causal impact of teamwork on outcomes.
We estimate the coefficients of interest in three ways. First, we estimate the equations above12Another concern is that we may not observe collaboration instances that are informal. That is, players
who share information or code but never formally merge. We note that to the extent that collaborationincreases performance, not observing these informal arrangements would lead us to underestimate the impactof collaboration on team performance.
12

using the full sample, which amounts to a differences-in-differences design where we controlfor observable variables and fixed effects.
Second, we estimate the equations above using exact matching to alleviate the concern thattreated and control players differ in observables. Specifically, we match every team memberwith a non-treated solo players that have the same state variables at the time of the teamformation (e.g., the same number of cumulative submissions and distance to the maximumscore on the leaderboard). Although all of our specifications control for these state vari-ables, the matched subsample ensures that we are comparing teams that are observationallyequivalent except for being exposed to teamwork. Although players must submit at least onesubmission prior to forming a team, they are not required to make more submissions aftermerging. We observe 8,466 teams between two players for which submissions were recordedafter the time of the team formation. Our matching procedure matches 7,474 of these teamswith solo players with the same characteristics at the time of the team formation (i.e., thesame number of cumulative submissions and the same distance to the maximum score on theleaderboard). Table A.1 in the Online Appendix presents a balance analysis for the treatedand control teams in the matched subsample.
Third, we use a two-step, Heckman-style selection bias correction (Heckman, 1979) similar tothe one used by Lee (1978). In the first step, we estimate a player-level probit model for theprobability of forming a team at time t given a rich set of state variables and an indicator forwhether the player is eligible to form a team.13 Players are eligible to form a team if they jointhe competition before a preset deadline to form teams. Players must join the competition todownload the data and learn about the rules of the competition (one of which is the deadlineto form teams). Lemus and Marshall (2021) document that the distribution of entry times ofplayers is roughly uniform throughout a contest, suggesting that players learn about a compe-tition at different times and likely join for reasons that are unrelated to the potential benefitsof team formation, making entry time (or the eligibility indicator to be precise) a plausiblyexogenous shifter of the probability of forming a team. We then use the probit estimatesto compute the Mills ratio for every player–time combination, which captures the expectedvalue of unobservables governing the decision to form a team (conditional on treatment). Wethen incorporate the Mills ratio estimates in a version of Equation 1. This approach hasthe benefit of relaxing the requirement of the treatment indicator being uncorrelated withperformance-related unobservables (i.e., it relaxes the unconfoundness assumption).
13Specifically, for every contest, we estimate Pr(formed teami,j,c,t = 1) = Φ(α + 1{elegible}i,j,c,tβ +h(xi,j,c,t, δ)), where i is a player; the notation is the same as in Equation 1.
13

4 The Impact of Teamwork on Performance
4.1 Scores
We begin our discussion on the impacts of teamwork by measuring its effect on performance,i.e., the variable y corresponds to scores. Figure 2 presents our estimates for Equation 2,which allows us to measure the performance effects of teamwork starting from 6 weeks priorto the actual team formation until 6 weeks after. We conduct the analysis for both thepublic and private scores on two samples. In Panel A, we make use of the full sample ofsolo players and two-member teams, which implies that solo players are the control for two-member teams. In Panel B, we further restrict the sample so that every player in a team ismatched with a solo player with the same covariates at the time of the team formation (i.e.,the same number of cumulative submissions and the same distance to the maximum scoreon the leaderboard). All specifications include player–competition fixed effects, competition–day fixed effects, and a second-degree polynomial of a number of player-level state variables.These state variables include, at any given time t, the total number of submissions by allplayers up until t, total number of submissions by the player making the submission upuntil t, total number of submissions by the team making the submission (possibly a soloplayer) up until t, the submitting player’s team’s distance to the maximum score on thepublic leaderboard at t, and the fraction of contest time that had elapsed at t. Although thedecision to form a team may respond to state variables, which we are flexibly controlling for,our identification assumption is that team formation does not respond to performance-relatedunobservables (i.e., treatment assignment is unconfounded).
Figure 2 (Panel A) shows that, prior to the actual team formation, public and private scoresfor treated and non-treated players are statistically indistinguishable, which provides supportfor our assumption of unconfounded treatment assignment. After the actual team formation,treated players (those who join a team) perform significantly better than non-treated players,with effects that manifest immediately and last for at least 6 weeks after the team formation.In the first week after the team forms, the effect is about 0.05 or 0.06 standard deviations, andthen it climbs to about 0.11 or 0.12 standard deviations and remains at that level thereafter.14
Panel B repeats the exercise using the matched subsample. The figures look very similar tothose in Panel A, with the exception that the estimated effects are smaller in magnitudethan those in Panel A. The smaller magnitudes likely reflect that the control and treatmentgroups in Panel B are less different in the state variables that predict good performance.
14Recall that both public and private scores are standardized (i.e., have mean 0 and standard deviation 1).
14

Figure 2: The impact of collaboration on scores: Team-level estimates
Panel A: Baseline estimates
-.2
-.1
0.1
.2S
core
diff
eren
ces
-6 weeks New member +7 weeks
-.2
-.1
0.1
.2S
core
diff
eren
ces
-6 weeks New member +7 weeks
1) Public score 2) Private score
Panel B: Matching estimates
-.2
-.1
0.1
.2S
core
diff
eren
ces
-6 weeks New member +7 weeks
-.2
-.1
0.1
.2S
core
diff
eren
ces
-6 weeks New member +7 weeks
1) Public score 2) Private score
Notes: Standard errors are clustered at the team-level, and 95-percent confidence intervals are depicted inthe figures. An observation is a submission made by a team in a competition. All specifications include teamfixed effects, competition–day fixed effects, and a second-degree polynomial of variables: total number ofsubmissions by all teams up until the submission time, total number of submissions by the team making thesubmission up until the submission time, total number of submissions by the member of the team making thesubmission up until the submission time, the submitting team’s distance to the maximum score on the publicleaderboard at the submission time, and the fraction of contest time that had elapsed at the submission time.The sample is restricted to include submissions by treated teams that took place six weeks before or afterthe week in which the team changed its team size, and it also restricts attention to teams with one or twomembers. Panel B further restricts the sample to ensure balance in observables (measured at the time oftreatment).
15
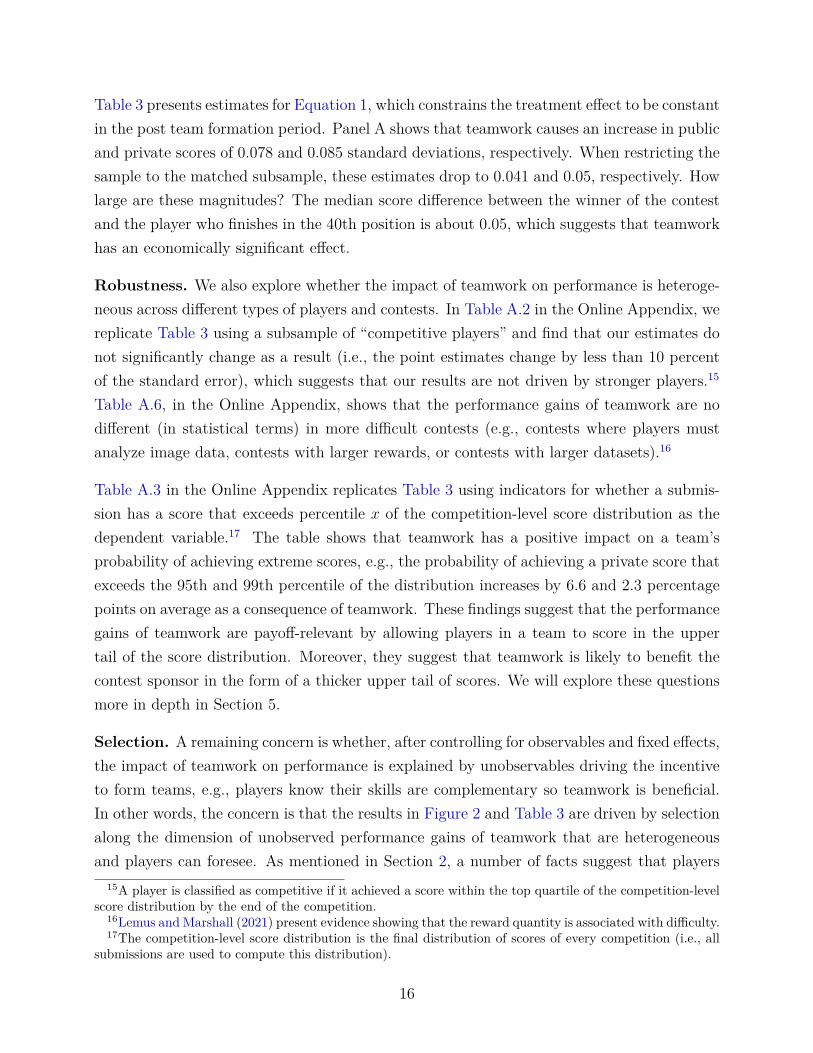
Table 3 presents estimates for Equation 1, which constrains the treatment effect to be constantin the post team formation period. Panel A shows that teamwork causes an increase in publicand private scores of 0.078 and 0.085 standard deviations, respectively. When restricting thesample to the matched subsample, these estimates drop to 0.041 and 0.05, respectively. Howlarge are these magnitudes? The median score difference between the winner of the contestand the player who finishes in the 40th position is about 0.05, which suggests that teamworkhas an economically significant effect.
Robustness. We also explore whether the impact of teamwork on performance is heteroge-neous across different types of players and contests. In Table A.2 in the Online Appendix, wereplicate Table 3 using a subsample of “competitive players” and find that our estimates donot significantly change as a result (i.e., the point estimates change by less than 10 percentof the standard error), which suggests that our results are not driven by stronger players.15
Table A.6, in the Online Appendix, shows that the performance gains of teamwork are nodifferent (in statistical terms) in more difficult contests (e.g., contests where players mustanalyze image data, contests with larger rewards, or contests with larger datasets).16
Table A.3 in the Online Appendix replicates Table 3 using indicators for whether a submis-sion has a score that exceeds percentile x of the competition-level score distribution as thedependent variable.17 The table shows that teamwork has a positive impact on a team’sprobability of achieving extreme scores, e.g., the probability of achieving a private score thatexceeds the 95th and 99th percentile of the distribution increases by 6.6 and 2.3 percentagepoints on average as a consequence of teamwork. These findings suggest that the performancegains of teamwork are payoff-relevant by allowing players in a team to score in the uppertail of the score distribution. Moreover, they suggest that teamwork is likely to benefit thecontest sponsor in the form of a thicker upper tail of scores. We will explore these questionsmore in depth in Section 5.
Selection. A remaining concern is whether, after controlling for observables and fixed effects,the impact of teamwork on performance is explained by unobservables driving the incentiveto form teams, e.g., players know their skills are complementary so teamwork is beneficial.In other words, the concern is that the results in Figure 2 and Table 3 are driven by selectionalong the dimension of unobserved performance gains of teamwork that are heterogeneousand players can foresee. As mentioned in Section 2, a number of facts suggest that players
15A player is classified as competitive if it achieved a score within the top quartile of the competition-levelscore distribution by the end of the competition.
16Lemus and Marshall (2021) present evidence showing that the reward quantity is associated with difficulty.17The competition-level score distribution is the final distribution of scores of every competition (i.e., all
submissions are used to compute this distribution).
16
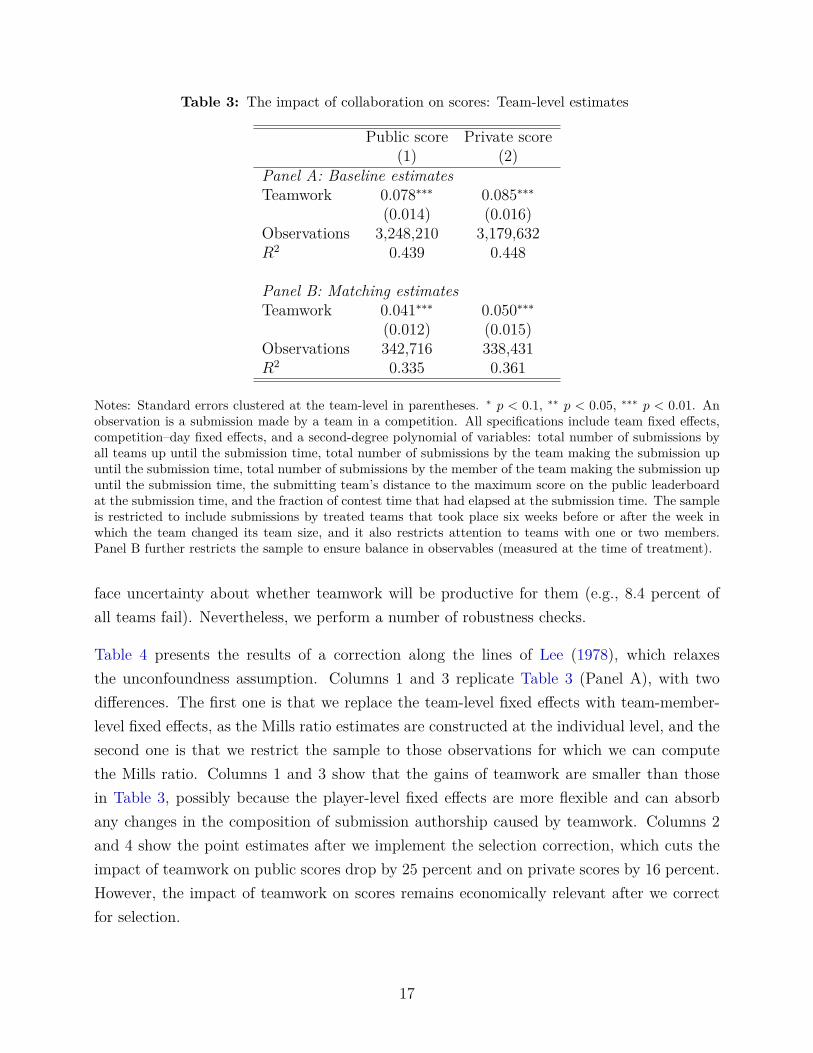
Table 3: The impact of collaboration on scores: Team-level estimates
Public score Private score(1) (2)
Panel A: Baseline estimatesTeamwork 0.078∗∗∗ 0.085∗∗∗
(0.014) (0.016)Observations 3,248,210 3,179,632R2 0.439 0.448
Panel B: Matching estimatesTeamwork 0.041∗∗∗ 0.050∗∗∗
(0.012) (0.015)Observations 342,716 338,431R2 0.335 0.361
Notes: Standard errors clustered at the team-level in parentheses. ∗ p < 0.1, ∗∗ p < 0.05, ∗∗∗ p < 0.01. Anobservation is a submission made by a team in a competition. All specifications include team fixed effects,competition–day fixed effects, and a second-degree polynomial of variables: total number of submissions byall teams up until the submission time, total number of submissions by the team making the submission upuntil the submission time, total number of submissions by the member of the team making the submission upuntil the submission time, the submitting team’s distance to the maximum score on the public leaderboardat the submission time, and the fraction of contest time that had elapsed at the submission time. The sampleis restricted to include submissions by treated teams that took place six weeks before or after the week inwhich the team changed its team size, and it also restricts attention to teams with one or two members.Panel B further restricts the sample to ensure balance in observables (measured at the time of treatment).
face uncertainty about whether teamwork will be productive for them (e.g., 8.4 percent ofall teams fail). Nevertheless, we perform a number of robustness checks.
Table 4 presents the results of a correction along the lines of Lee (1978), which relaxesthe unconfoundness assumption. Columns 1 and 3 replicate Table 3 (Panel A), with twodifferences. The first one is that we replace the team-level fixed effects with team-member-level fixed effects, as the Mills ratio estimates are constructed at the individual level, and thesecond one is that we restrict the sample to those observations for which we can computethe Mills ratio. Columns 1 and 3 show that the gains of teamwork are smaller than thosein Table 3, possibly because the player-level fixed effects are more flexible and can absorbany changes in the composition of submission authorship caused by teamwork. Columns 2and 4 show the point estimates after we implement the selection correction, which cuts theimpact of teamwork on public scores drop by 25 percent and on private scores by 16 percent.However, the impact of teamwork on scores remains economically relevant after we correctfor selection.
17

Table 4: The impact of collaboration on scores: Player-level estimates
Public score Private score(1) (2) (3) (4)
Teamwork 0.027∗∗∗ 0.020∗∗∗ 0.032∗∗∗ 0.027∗∗∗(0.008) (0.008) (0.010) (0.010)
Mills ratio No Yes No YesObservations 2,547,264 2,547,264 2,478,046 2,478,046R2 0.385 0.385 0.394 0.394
Notes: Standard errors clustered at the team-level in parentheses. ∗ p < 0.1, ∗∗ p < 0.05, ∗∗∗ p < 0.01. Anobservation is a submission made by a player in a competition. All specifications include player-competitionfixed effects, competition–day fixed effects, and a second-degree polynomial of variables: total number ofsubmissions by all teams up until the submission time, total number of submissions by the team making thesubmission up until the submission time, total number of submissions by the member of the team making thesubmission up until the submission time, the submitting team’s distance to the maximum score on the publicleaderboard at the submission time, and the fraction of contest time that had elapsed at the submissiontime. The Mills ratio is computed based on estimates of a Probit model on the decision to form a team,which is estimated separately for each competition, and includes a dummy for whether the user enteredthe competition before the team formation deadline as well as a second-degree polynomial of the variablesdescribed above. The sample is restricted to include submissions by treated teams that took place six weeksbefore or after the week in which the team changed its team size, submissions for which the Mills ratio canbe computed, and to teams with one or two members.
In addition, Table A.4, in the Online Appendix, replicates Table 3 restricting the sample oftreated players to those who are forming a team for the first time. If players who know thebenefit of teamwork select into working in teams, one would expect that players who havenever worked in teams are more likely suffer some organizational costs (e.g., they might notallocate tasks correctly), which would likely negatively impact their performance. Thus, ifwe would expect a smaller coefficient on this sample. However, we find larger estimates,suggesting that this form of selection is not explaining our results. One possibility is thatthe excitement of working in teams for the first time motivate players to perform better.
Second, Table A.5 in the Online Appendix shows that the impact of teamwork on performanceis unaffected by the timing of the team formation (whether the team was formed early or latein the competition). If players form teams because they know that there are large benefitsfrom teamwork, one would expect that teams would form as early as possible to maximize thebenefits of teamwork.18 In particular, those who expect the greatest benefits of collaborationshould form teams earlier. We do not see this happening. Moreover, on average, players whoform teams have sent 16 submissions prior to the team formation.
18As previously mentioned, Figure A.1 in the Online Appendix shows that team formation occurs through-out the competition and is not concentrated at the beginning.
18

Table 5: The impact of collaboration on the number of submissions: Team-level estimates
Number of submissions Number of submissionsper week per week (while active)
(1) (2)Panel A: Baseline estimatesNew member -1.488∗∗∗ 0.162
(0.213) (0.405)Observations 1,307,553 424,819R2 0.657 0.688
Panel B: Matching estimatesNew member -0.119 0.279
(0.181) (0.201)Observations 75,962 43,690R2 0.537 0.573
Notes: Standard errors clustered at the team-level in parentheses. ∗ p < 0.1, ∗∗ p < 0.05, ∗∗∗ p < 0.01.An observation is a competition–team–week combination. All specifications include team fixed effects andcompetition–week fixed effects. The sample is restricted to include submissions that took place in the firsttwelve weeks of the competition and teams of up to two members. Panel B further restricts the sample toensure balance in observables (measured at the time of treatment).
These pieces of evidence combined points towards a positive causal relationship betweenteamwork and productivity.
4.2 Number of submissions
We next study the impact of teamwork on the number of submissions by a team. We estimatea version of Equation 1 where the dependent variable, y, corresponds to the number ofsubmissions by each team in every week of the competition. In the analysis, an observationis a team–week–competition combination. We estimate specifications that differ in howwe treat the weeks in which a team makes zero submissions. In the first specification, allteam–week combinations are included, whereas in the second we only include the team-weekcombinations that lie between the first and last week with a positive submission count forthat team (i.e., the weeks when the team was active).19 Both specifications should lead tosimilar estimates unless treated teams choose to exit the competition sooner or later thannon-treated teams.
19For example, if a teams makes 0, 1, 0, 1, and 0 submissions in the five weeks of a competition, respectively,we only include weeks 2, 3 and 4 in the estimation sample. This choice is based on the assumption that theteam did not enter until week 2 and was already inactive in week 5.
19

Table 5 presents the estimates of our analysis. Panel A shows that teamwork causes thenumber of submissions per week by a player to decrease by 1.5 submissions when includingall player–week combinations (Column 1) or to not decrease at all when considering onlythe active periods of teams (Column 2). We find similar qualitative effects when looking atthe matched subsample (Panel B), but the effects are not statistically different than zero.These estimates suggest that players do not change their behavior significantly after theyform teams.
We note that this analysis only considers teams that made at least one submission after theirformation. As mentioned in Section 2, 8.4 percent of teams “fail” and make no submissionsafter they form. Thus, Table 5 shows that teams that remain active do not seem to bechanging the rate at which they make submissions (Column 2). However, a significant shareof teams fail, so the number of submissions considering all teams, including those that fail,decreases (Column 1).
What do these results imply for contest design? The competition sponsor cares about thebest submissions in the competition. Allowing teamwork creates a tradeoff: successful teamsincrease performance but some of them fail. Thus, a contest that bans teamwork wouldreceive more, lower-quality submissions, while one that permits teamwork would receivefewer, higher-quality submissions.
To determine whether teamwork leads to better outcomes, we would need to compare theequilibrium in a contest that allows teamwork with the equilibrium of a similar contest thatbans teamwork. We cannot do this with our data because we only observe contests that allowteamwork. For this reason, in the next section, we develop a structural model to measurethe impact of banning teamwork on contest outcomes.
5 Equilibrium Effects of Teamwork
In this section, we present a structural model of team formation. We estimate key structuralparameters and use them to investigate the impact of contest design and competition onteam formation and contest outcomes.
20

5.1 Empirical Model
There are N forward-looking players competing in a contest. Time is discrete, the horizonis infinite, and payoffs are not discounted. Players make submissions over time and areallowed to form teams. At every period, only one player (either a solo player or a team) isthe leader and everyone else is a follower. A public leaderboard displays, in real-time, themaximum score and the identity of the leader. The game can end in two ways: (1) in anygiven period the contest ends with probability µ; (2) the contest ends when the maximumscore has reached a value s̄. The leader at the end of the contest earns a prize of π andfollowers get 0. In the event that a team wins the contest, the team members of the winningteam split the prize evenly.
We denote a state by (s, n), where s is the current maximum score, and n = (nsp, na, nf),where nsp = N − 2(na + nf) is the number of solo players, na is the number of active teams,and nf is the number of failed teams. Players publicly observe and keep track of these statevariables. Thus, the state space is:
S = {(s, n) : s = 0, ε, ..., s̄; na = 0, ..., N/2; nf = 0, ..., na; nsp = N − 2(na + nf)}.
For any period in which the contest has not ended, there are two independent and mutuallyexclusive events: (1) With probability λ1 one of the active players makes a submission.When a player of type θ ∈ {sp (solo player), team} makes a submission, the maximum scores increases to s + ε with probability qθ(s), where qθ(·) is decreasing (i.e., it becomes harderto advance the maximum score as the maximum score increases). (2) With probability λ2
one of the follower solo players can form a team (but cannot make a submission).
A follower solo player choosing to form a team can always do so provided that nsp ≥ 2(i.e., there are at least two solo players available). The benefit of teamwork is capturedby teams advancing the maximum score with a higher probability: qteam(s) > qsp(s). Thecost of teamwork has two components: a direct cost of forming a team (players draw ateam-formation cost, c, from the distribution K) and probabilistic success (a team fails withprobability 1− γ). Team failure is inspired by the descriptive evidence in Section 2, that is,we assume that when a team forms and fails its members become inactive (i.e., they stopmaking submissions). We assume that the player proposing to form the team bears the team-formation cost. Furthermore, in the event of winning, team members split the prize evenly.When solo player benefits from teamwork inclusive of paying the team-formation cost, anyother solo player invited to join a team without paying the team formation cost will accept
21

because solo-players’ incentives are symmetric.
At any moment in the contest, there are four different type of players: (1) a follower soloplayer, (2) a follower team, (3) a team leading the competition, and (4) a solo player leadingthe competition. The terminal values for each type of player are
F spend = 0, F team
end = 0, Lteamend = π
2 , Lspend = π.
We next derive the value functions for each type of player and proceed to compute theequilibrium of the game.
Solo Player, Follower. The interim value of a follower solo player (denoted by player i) is
F sps,n = µF sp
end + (1− µ)[ψ(n)F sp
s,n + λ1
NF sp,owns,n + 2na
Nλ1F
sp,rival teams,n
+(nsp − 1)N
λ1Fsp,rival sps,n + (nsp − 1)
Nλ2F
sp, team formss,n + 1
Nλ2F
sp, forms teams,n
].
In this expression, with probability µ the contest ends and player i receives F spend. If the contest
does not end, which occurs with probability 1 − µ, there are 6 cases: (1) with probabilityψ(n), none of the active players plays and none of the solo players can form a team. Thus,the state does not evolve and player i receives continuation value F sp
s,n. (2) With probabilityλ1/N , player i plays and receives F sp,own
s,n . (3) With probability 2na
Nλ1, a team plays and player
i receives F sp,rival teams,n . (4) With probability (nsp−1)
Nλ1, one of the solo players (other than i)
plays, and player i receives F sp,rival sps,n . (5) With probability (nsp−1)
Nλ2, one of the solo players
can choose to form a team, and player i receives F sp, team formss,n . (6) With probability 1
Nλ2,
player i can form a team and receives F sp, forms teams,n .
The probability that nobody plays nor forms a team is
ψ(n) = (1− λ1 − λ2 + 2λ1nf/N + 2λ2(na + nf )/N),
which is the complementary probability of someone playing or deciding to form a team. Next,a play by a player of type θ ∈ {sp, team} transitions the state from (s, n) to (s′, n) withprobability qθ(s). If the play that increases the maximum comes from a follower, then thatfollower becomes the leader and the former leader becomes a follower. Thus, the continuation
22

values after a player makes a submission are given by
F sp,owns,n = qsp(s)Lsp
s′,n + (1− qsp(s))F sps,n,
F sp,rival teams,n = qteam(s)F sp
s′,n + (1− qteam(s))F sps,n,
F sp,rival sps,n = qsp(s)F sp
s′,n + (1− qsp(s))F sps,n.
The value of player i when solo players j (with j 6= i) can form a team is
F sp, team formss,n = (1− ps,n)F sp
s,n + ps,n1
nsp − 1(γF team
s,(nsp−2,na+1,nf) + (1− γ) · 0)
+ps,nnsp − 2nsp − 1
(γF sp
s,(nsp−2,na+1,nf) + (1− γ)F sps,(nsp−2,na,nf+1)
)Player j chooses to not form a team with probability 1− ps,n, in which case player i receivesF sps,n, and where ps,n is an equilibrium object we derive below. With probability ps,n, player j
chooses to form a team with one of the nsp−1 solo players.20 The new team includes player iwith probability 1/(nsp−1) (i.e., every available solo player is chosen with equal probability).If successful, with probability γ, player i receives F team
s,(nsp−2,na+1,nf), and with probability (1−γ),she receives 0 (i.e., the value of a failed team). With probability (nsp− 2)/(nsp− 1), player jforms a team with a solo player other than player i. Player i continues being a follower soloplayer, and the there is one more active team with probability γ and one more failed teamwith probability 1− γ.
Lastly, we have player i’s decision to form a team. There are three factors influencing thisdecision. First, there is a direct cost, c ∼ K, of forming a team. Second, with probabilityγ the team will fail and i will get 0. Third, while a team increases the chances of becomingthe leader of the competition (because qteam(s) > qsp(s), for all s), the prize is evenly splitamong team members. Thus, a solo player forms a team only if the marginal benefit is largerthan the cost, which implies that the probability of team formation is
ps,n = Pr(c < γF teams,(nsp−2,na+1,nf) − F sp
s,n), (3)
and the expected continuation value of forming a team is
F sp, forms teams,n = Ec
[max{γF team
s,(nsp−2,na+1,nf) + (1− γ) · 0− c, F sps,n}
].
20In the model, players are not keeping track of whether the leader is a solo player or a team. If the leaderis a solo player, then one fewer player is available to form a team, but we are not incorporating that into themodel, as it only affects the interim payoff of a solo player and the effect is small.
23
Team, Leader. The interim value of a player that is a member of the team leading thecompetition (denoted team i) is
Lteams,n = µLteam
end + (1− µ)[ψ(n)Lteam
s,n + 2λ1
NLteam,owns,n + 2(na − 1)
Nλ1L
team,rival teams,n
+nsp
Nλ1L
team,rival sps,n + nsp
Nλ2L
team, team formss,n
]
In this expression, with probability µ, the contest ends and team i receives continuationvalue Lteam
end . If the contest does not end, which occurs with probability 1 − µ, there are 5cases: (1) with probability ψ(n), none of the active players is selected to play and none of thesolo players can choose to form a team and each member of team i receives Lteam
s,n ; (2) withprobability 2λ1/N , one of the members of team i is selected to play, and each member ofteam i receives Lteam,own
s,n ; (3) with probability 2(na−1)N
λ1, one of the players in a rival team isselected to play, and each member of team i receives Lteam,rival team
s,n ; (4) with probability nsp
Nλ1,
one of the solo players is selected to play, and each member of team i receives Lteam,rival sps,n ;
and, finally, (5) with probability nsp
Nλ2, one of the solo players can choose to form a team, and
each member of team i receives Lteam, team formss,n . The expressions for these values are given by
ψ(n) = (1− λ1 − λ2 + 2λ1nf/N + 2λ2(na + nf)/N),
Lteam,owns,n = qteam(s)Lteam
s′,n + (1− qteam(s))Lteams,n ,
Lteam,rival teams,n = qteam(s)F team
s′,n + (1− qteam(s))Lteams,n ,
Lteam,rival sps,n = qsp(s)F team
s′,n + (1− qsp(s))Lteams,n ,
Lteam, team formss,n = ps,n[γLteam
s,(nsp−2,na+1,nf) + (1− γ)Lteams,(nsp−2,na,nf+1)] + (1− ps,n)Lteam
s,n ,
where ps,n is the conditional probability that a solo player decides to form a team, whichis the equilibrium object given by Equation 3. In Lteam, team forms
s,n , with probability γ thecomposition of teams and solo players changes: there will be one more team and two fewersolo players. With probability 1− γ, two solo players become “inactive” and the number offailed teams increase by one. The last term, (1 − ps,n)Lteam
s,n , corresponds to the case wherea solo player can form a team but chooses not to do so. In these expressions, whenever aplayer makes a submission, the player becomes the leader of the competition with probabilityqteam(s) if the player is in a team, and with probability qsp(s) if the player is a solo player.
24

Team, Follower. The interim value of a follower team is
F teams,n = (1− µ)
[ψ(n)F team
s,n + 2λ1
NF team,owns,n + 2(na − 1)
Nλ1F
team,rival teams,n
+nsp
Nλ1F
team,rival sps,n + nsp
Nλ2F
team, team formss,n
]
When the contest does not end, there are 5 cases analogous to the cases for a team leadingthe competition. The expressions for these values are given by
ψ(n) = (1− λ1 − λ2 + 2λ1nf/N + 2λ2(na + nf)/N),
F team,owns,n = qteam(s)Lteam
s′,n + (1− qteam(s))F teams,n ,
F team,rival teams,n = qteam(s)F team
s′,n + (1− qteam(s))F teams,n ,
F team,rival sps,n = qsp(s)F team
s′,n + (1− qsp(s))F teams,n ,
F team, team formss,n = ps,n[γF team
s,(nsp−2,na+1,nf) + (1− γ)F teams,(nsp−2,na,nf+1)] + (1− ps,n)F team
s,n ,
Solo Player, Leader. The interim value of a solo player who leads the competition is
Lsps,n = µLsp
end + (1− µ)[(ψ(n) + λ2/N)Lsp
s,n + λ1
NLsp,owns,n + 2na
Nλ1L
sp,rival teams,n
+(nsp − 1)N
λ1Lsp,rival sps,n + (nsp − 1)
Nλ2L
sp, team formss,n
]
Again, when the contest does not end, there are 5 cases analogous to the cases for a teamleading the competition. The expressions for these values are given by
ψ(n) = (1− λ1 − λ2 + 2λ1nf/N + 2λ2(na + nf)/N),
Lsp,owns,n = qteam(s)Lsp
s′,n + (1− qteam(s))Lsps,n,
Lsp,rival teams,n = qteam(s)F sp
s′,n + (1− qteam(s))Lsps,n,
Lsp,rival sps,n = qsp(s)F sp
s′,n + (1− qsp(s))Lsps,n,
Lsp, team formss,n = ps,n[γLsp
s,(nsp−2,na+1,nf) + (1− γ)Lsps,(nsp−2,na,nf+1)] + (1− ps,n)Lsp
s,n,
Discussion of Modeling Assumptions. Our model is a simple framework that capturesteam formation in contests where players are presented with opportunities to form teamsover time and (dynamically) choose whether to form a team. To keep the model tractable,our framework is stylized and abstracts from a number of complexities, which allows us tofocus on the incentives of team formation.
25

The benefit of teamwork is to increase the likelihood of becoming the competition leader.This assumption is motivated by our empirical findings in Section 4. On the other hand,forming teams is costly and uncertain (some team fails). Moreover, in the event of winning,team members share the prize. Players take into account the benefit and the cost of formingteams whenever they get a stochastically-arriving opportunity to form a team. In terms ofdynamic incentives, players take into account: (1) the current score; (2) the cost of forminga team; (3) the likelihood that they will have a future opportunity to form a team; (4) theexpected composition of players in the rest of the contest (i.e., rivals may form teams in thefuture). All these factors affect a player’s decision to form a team.
We make simplifying assumptions to reduce the state space and facilitate model estimation.These assumptions include a stochastic end of the contest (to avoid keeping track of time),a maximum score at which the contest ends (to solve by backwards induction); having onlytwo types of players: leaders and followers (to avoid keeping track of scores of each player),stochastic play (to avoid modelling the decision to play or not whenever an opportunitypresents), teams of at most two members (to reduce the number of value functions we needto write). Changing any of these assumptions would likely preserve our results qualitativelybut add much computational burden.
5.2 Estimation and Model Fit
We estimate the model using a full-solution method. To compute the equilibrium of the game,we exploit that the state variables are directional (e.g., the maximum score or the numberof teams can only increase or stay the same) and that they are capped (e.g., the maximumscore and the number of teams cannot exceed s̄ and N/2, respectively). This allows us tocompute the equilibrium by backward induction.
The full set of primitives for a given contest include i) the probability that an active player canplay, λ1; ii) the probability that an active solo player can form a team, λ2; iii) the functionsqteam(s) and qsp(s), which indicate the probability of advancing the maximum score given thatthe current maximum score is s for a team and a solo player, respectively; iv) the probabilityof team failure, 1− γ; v) the probability that the contest ends, µ; and vi) the distribution ofteam-formation costs, K(c;σ) = cσ, where σ > 0 and the support of the distribution is theinterval [0, 1].21 We allow these primitives to vary at the contest level.
We use a two-step procedure to estimate the primitives of each contest. In the first step, we21We normalize the size of the prize to be 1 for every contest.
26

estimate primitives i)-v) without using the full structure of the model. In the second step,we use the estimates of these primitives to estimate the cost distribution using a generalizedmethod of moments (GMM) estimator.
We specify the functions qθ(s), where θ ∈ {team, sp} as
qθ(s) = exp{βθ0 + β1s}/(1 + exp{βθ0 + β1s}),
and we estimate βθ0 and β1 using a maximum-likelihood estimator, using data on whethereach submission increased the maximum score as well as the maximum score at the time ofeach submission (s). Because in some competitions the maximum score is rather constant,we pool the data from all competitions to gain power in estimating the parameter β1, whichwe constrain to be uniform across contests. We allow βθ0 to vary across contests.
We also estimate directly from the data the probability that at any given period a playerplays, λ1, and the probability that a team fails, 1− γ. We set µ = 1
T, so in expectation the
contest duration matches the length of the contest in the data. We also set the probabilitythat a player can form a team, λ2, to be 1− λ1.22
In the second step, we estimate the parameter σ of the cost distribution, K(c;σ) = cσ, whereσ > 0. We use a GMM estimator, where for each contest k, we estimate σ by minimizing thedifference between the number of teams observed in the data and predicted by the model:mk(σ) = teamsdatak − teamsmodelk . The GMM estimator for σ in contest k is then given by
σ̂ = arg minσ
m̂k(σ)2.
We present asymptotic standard errors.
We use the full-solution method to compute the moment mk(σ) for a given value of σ. Thatis, for a given σ, we compute the equilibrium of the game using backward induction toobtain the matrices of conditional-choice probabilities (CCPs) governing the decision to formteams, p. p is of dimensions S × N3 (S is the size of the set of possible scores and N isthe number of players that can be solo players, team players, or failed-team players) whereelement (s, nsp, na, nf) of p is pjt,n.23 Using the CCPs, we simulate equilibrium outcomes by
22Both λ2 and the cost of making a merger impact the equilibrium number of mergers. We set λ2 = 1−λ1to avoid an identification problem caused by the interplay between λ2 and the cost of making mergers inexplaining the observed number of mergers.
23In the estimation, S varies across contests. In a given contest, the set of scores is set to include all uniquemaximum scores in the competition as well as the values s̄ + [0.001 : 0.001 : 0.08], where s̄ is the highestobserved score in the competition.
27

simulating the game ns = 500 times and averaging equilibrium outcomes across simulations.
Lastly, we restrict the sample to the top 40 players in each contest (measured by the rank-ing of players at the end of the competition), i.e., N = 40. We make this choice for tworeasons: First, these players are more likely to form teams. Second, this group of playersis less heterogeneous than the entire pool of players, which allows us to abstract away frommodeling player heterogeneity. We also restrict attention to the 80 contests that exhibitedteam formation among the top 40 players.
Table 6: Empirical model estimates
Panel A: Common parameters across contestsEstimate SE
γ 0.74 0.01β1 (q) -1.486 0.035βteams0 − βsp0 (q) 1.161 0.064
Panel B: Contest-specific parameters (partial list of contests)λ1 SE σ SE βsp0 (q) SE N
TGS Salt Identification Challenge 0.082 0.008 1.4 0.207 -1 0.205 95Quick, Draw! Doodle Recognition Challenge 0.072 0.007 1.54 0.363 -2.783 0.183 91RSNA Pneumonia Detection Challenge 0.191 0.016 1.275 0.313 -3.429 0.387 94Human Protein Atlas Image Classification 0.159 0.012 1.394 0.222 -3.235 0.286 118Traveling Santa 2018 - Prime Paths 0.071 0.006 1.772 0.762 -1.321 0.212 103Google Cloud & NCAA ML Competition 2019-Mens 0.12 0.011 1.09 0.086 -1.768 0.25 92Instant Gratification 0.158 0.014 1.318 0.271 -2.411 0.351 93Predicting Molecular Properties 0.109 0.009 1.351 0.171 -2.226 0.209 114SIIM-ACR Pneumothorax Segmentation 0.138 0.014 1.044 0.139 -2.966 0.511 68Lyft 3D Object Detection for Autonomous Vehicles 0.138 0.011 1.693 0.621 -2.299 0.182 126Santas Workshop Tour 2019 0.066 0.008 1.149 0.113 -2.925 0.273 67Predict HIV Progression 0.08 0.008 1.381 0.179 -0.932 0.203 87Chess ratings - Elo versus the Rest of the World 0.18 0.013 1.271 0.223 -2.072 0.263 136Tourism Forecasting Part One 0.29 0.023 1.302 0.656 -2.005 0.323 80Tourism Forecasting Part Two 0.103 0.009 1.309 0.374 -5.346 0.216 108R Package Recommendation Engine 0.096 0.008 1.264 0.124 -3.4 0.185 112
Notes: SE stands for asymptotic standard errors. See Table A.7 in the Online Appendix for the estimates ofthe full list of contests.
Figure 3 shows the fit of the model. Panels A and B show that the model is able to replicatewell both the number of submissions and the number of teams in a contest. Panel C showsthat, while the model tends to under-estimate the maximum score, especially for those withlarge maximum score, the correlation between the data and model predictions is still high(about 78 percent).
Figure A.2 in the Online Appendix shows the distribution of the average cost of forming ateam across contests. On average, the mean cost of forming a team is 52 percent of the prize.
28

Figure 3: Model fit, by equilibrium outcome
05
10N
umbe
r of m
erge
rs (d
ata)
0 5 10Number of mergers (model)
5010
015
020
0N
umbe
r of s
ubm
issi
ons
(dat
a)
50 100 150 200Number of submissions (model)
A) Number of teams B) Number of submissions
01
23
4M
ax s
core
(dat
a)
0 1 2 3 4Max score (model)
C) Maximum score
Notes: The figures plot equilibrium outcomes in the data against those predicted by the model estimates.Model predictions are computed via simulation. Specifically, we simulate the game ns = 500 times andcompute the average for each equilibrium outcome across simulations.
Given that team members split the prize in two in case of winning, only a few players findforming a team worth it (i.e., those who get a particularly good draw of the cost of forminga team). This explains the rather puzzling finding that only a few players form teams eventhough there are performance gains.
5.3 Incentives to Form Teams and the Impact of Teamwork
In this section, we ask two questions. First, we study the impact of teamwork on contestoutcomes. Second, we investigate the impact of competition and team-formation costs onteam-formation incentives and contest outcomes. To answer these questions, we use ourmodel estimates to compute the equilibria of each contest under counterfactual scenarios.
First, most Kaggle competitions allow teamwork but some do not. Why would an online-
29

contest platform, such as Kaggle, permit teamwork? Other online-contest platforms neverpermit teamwork, nor do some online contests directly sponsored by government agencies.To shed light on whether teamwork improves contest outcomes, Table 7 reports a comparisonbetween the equilibrium where teamwork is allowed and the equilibrium where teamwork isforbidden for each contest in our sample. Column 1 shows that allowing teamwork on averagedecreases the number of submissions. The reason is that some teams fail, which accounts forfewer submissions in equilibrium. Despite the fact that there are fewer submissions overall,Column 2 shows that teamwork on average increases the maximum score. The reason for theincrease is due to productivity gains by successful teams, which more than compensate thereduction in number of submissions as a result of failed teams. These results suggest thatcontest designers should allow teamwork.
Table 7: Equilibrium impact of allowing teamwork
(1) (2)Number of
submissions (in logs) Maximum scoreTeamwork Allowed -0.036∗∗∗ 0.019∗∗∗
(0.002) (0.003)Observations 160 160R2 0.99 0.99
Notes: Standard errors clustered at the competition-level in parentheses. ∗ p < 0.1, ∗∗ p < 0.05, ∗∗∗ p < 0.01.An observation is a competition–treatment combination, where treatment ∈ {no teamwork, teamwork}. Allspecifications include competition fixed effects.
Next, we explore whether a platform that already allows teamwork should make an effort tofacilitate the formation of teams. For instance, allowing players to communicate, to accessother player’s profiles, or incorporating online-collaboration tools may facilitate teamwork byreducing the cost of forming a team.
To investigate the impact of facilitating teamwork, we take every contest in our sample andcompute the equilibrium of that contest if the average cost of forming a team decreased bya value ranging between 10 percent and 50 percent. The theoretical impact of reducing thecost of team formation on contest outcomes is ambiguous. On the one hand, when teamformation is less costly, more teams will form. This implies that high-scoring submissionswill be more likely to arise, as teams improve their performance relative to solo players, whichis the main finding in Section 4. On the other hand, a fraction of team fails, leaving fewercompetitors making submissions, reducing the number of submissions.
Figure 4 presents our results showing that making team formation less costly increases the
30

Figure 4: Equilibrium outcomes with reduced costs of team formation
5010
015
020
0Pe
rcen
tage
cha
nge
in #
of m
erge
rs
10% 20% 30% 40% 50%Decrease in average cost of merger
-20
-15
-10
-50
Perc
enta
ge c
hang
e in
# o
f sub
mis
sion
s
10% 20% 30% 40% 50%Decrease in average cost of merger
A) Number of mergers B) Number of submissions
0.0
2.0
4.0
6.0
8.1
Cha
nge
in m
ax s
core
(in
st. d
evia
tions
)
10% 20% 30% 40% 50%Decrease in average cost of merger
C) Maximum score
Notes: The figures plot equilibrium outcomes predicted by the model estimates (as well as 95 percentconfidence bands) when the expected cost of forming a team decreases by X percent in each contest(X ∈ {10, 20, 30, 40, 50}). Model predictions are computed via simulation. Specifically, we simulate thegame ns = 500 times and compute the average for each equilibrium outcome across simulations.
number of teams (panel A), reduces the number of submissions (panel B) due to failedteams, and has a positive impact on the maximum score. That is, even though the numberof submissions decreases the maximum score increases. In other words, the performanceimprovement that we identify in Section 4, more than compensates for the reduction in thenumber of submissions due to failed teams.
Next, we investigate the impact of more competition on team formation and contest outcomes.Does higher competitive pressure encourage teamwork? Increasing the length of the contestis one way to capture higher competitive pressure. In our model, this is equivalent to reducingthe probability that the contest ends at any given period (i.e., reducing µ). A longer contestgives each player more chances to play but it also creates more future competition. Figure 5shows that more competition encourages teamwork. Part of this effect is mechanic becausein a longer contest there are more opportunities to form teams. To focus on the change
31

in number of teams caused by incentives and not from the fact that the contest is longer,Figure 5 (Panel B) shows the percentage change in the number of teams per period, i.e.,(number of teams)/(contest length). The figure shows that, after controlling for the contestlength, the number of teams increases (at least for small increases in competition). Thissuggests that teamwork is more valuable when players expect more future competition.
Figure 5 (Panel C) shows that the number of submissions increases when the length of thecompetition increases. More teams mean that more teams will fail but the teams that do notfail have more time to send submissions. The rate of team failure is lower than the increasein the number of submissions due to a longer contest duration, so the number of submissionsincreases. Figure 5 (Panel D) shows that the two effects combined (more teams sending moresubmissions) imply that the maximum score also increases. These results indicate that thelevel of competition in a contest plays a crucial role in the incentives to form teams. Playerswant to form teams to increase their productivity because they are less likely to win byworking solo. On the flip side, reducing competition reduces the incentive to work in teamsbecause there will be fewer submissions, so a less productive solo player stands a good chanceof winning the contest. While forming a team increases a player’s productivity, it also splitsthe prize in case of winning. Therefore, our results suggest that players will prefer to competesolo in less competitive contests.
6 Facilitating Teamwork: The Role of Information
Before forming teams, players need to assess the value of collaboration, especially consideringthat 8.4 percent of all teams fail. As we mentioned in the introduction, there are many factorsthat can deter players from forming teams, including concerns of about a potential partner’sability. Naturally, players will try to screen potential partners before forming a team.
There are different ways to screen potential partners. First, players can use the leaderboardto look at other players’ performance in the current competition. Figure 6 plots each teammember’s distance to the maximum score on the leaderboard immediately before they forma team. The figure shows three patterns: (1) teams usually form among players who areperforming similarly at the time of the merger; (2) finding (1) becomes stronger when playersforming teams are closer to the top of the leaderboard; (3) team formation is more likely tooccur among players closer to the top of the leaderboard.
Second, players could learn about potential teammates by looking at their performance in
32

Figure 5: Equilibrium outcomes with increased competition levels
1020
3040
50Pe
rcen
tage
cha
nge
in #
of m
erge
rs
10% 20% 30% 40% 50%Increase in average length of competition
24
68
10Pe
rcen
tage
cha
nge
in m
erge
rs p
er p
erio
d
10% 20% 30% 40% 50%Increase in average length of competition
A) Number of teams B) Number of teams per period
1020
3040
5060
Perc
enta
ge c
hang
e in
# o
f sub
mis
sion
s
10% 20% 30% 40% 50%Increase in average length of competition
0.0
5.1
.15
Cha
nge
in m
ax s
core
(in
st. d
evia
tions
)
10% 20% 30% 40% 50%Increase in average length of competition
C) Number of submissions D) Maximum score
Notes: The figures plot equilibrium outcomes predicted by the model estimates (as well as 95 per-cent confidence bands) when the expected contest length increases by X percent in each contest (X ∈{10, 20, 30, 40, 50}). Model predictions are computed via simulation. Specifically, we simulate the gamens = 500 times and compute the average for each equilibrium outcome across simulations.
past competitions. Figure A.3 in the Online Appendix shows that players who have performedwell in the past are more likely to form teams with other players who have similarly performedwell in the past.24
Third, players could learn about potential teammates by looking at whether they have sharedcode with other Kaggle users or have participated on the Kaggle discussion board.25 Kaggleusers can rate both shared code and forum messages, which provides a signal about the
24For first-time Kaggle participants, this information is missing.25Code sharing might be altruistically motivated by the joy of enhancing learning in the community, or
strategically motivated to signal skills to other player. Tausczik and Wang (2017) investigate community-levelsharing of code in 25 Kaggle contests. They find that 10 percent of users, those doing relatively well but notat the top of the competition, were the most likely to share code. They also find that sharing code improvedindividual, but not collective performance. Hutter et al. (2011) and Bullinger et al. (2010) also discuss thetrade-off between cooperation and competition in online contests.
33

Figure 6: Team member heterogeneity at the time of the merger
0.2
.4.6
.81
Mem
ber 1
's di
stan
ce to
lead
er
0 .2 .4 .6 .8Member 2's distance to leader
Notes: The figure plots the distance of each team member to the leader at the moment of forming a team.These figures restrict attention to teams in which both members had submitted at least 5 submissions priorto the merger.
expertise or ability of a potential teammate. Figure A.3 in the Online Appendix showsevidence of assortative matching along these dimensions. We find that players who haveposted more messages in forums or who have shared code that has been well-received in thecommunity are more likely to form teams.
Next, we investigate whether teams composed of “similar” players are more likely to succeed.We measure similarity between players in a given contest by the disparity between the numberof submissions and the maximum score among team members before the team forms. Table 8shows that when “dissimilar” players form a team, they are more likely to fail. The tableshows that a one standard deviation increase in the difference of the team members’ numberof submissions before the team forms increases the probability that the team fails by 3.4percent. A one standard deviation increase in the difference of the team members’ maximumscore before the the team forms increases the probability that the team fails by 11.2 percent.
All these findings suggests that players want to partner up with “serious” players (those whoare actively involved in the Kaggle community) and also with players that are similar to them.One reason for why players may prefer to choose teammates that are similar to themselvesis to avoid possibly conflicting power dynamics (see, e.g., Greer et al., 2017). These findingsalso provide a justification to our assumption in Section 5 that players pay a “cost” to forma team, e.g., spending time trying to figure out who to partner with.
While the leaderboard is informative about the performance of potential teammates, thepublic score is only a noisy signal of the private score (i.e., the payoff-relevant performance
34

Table 8: Probability of a failed team: OLS estimates
(1)failed
Difference in submissions (in st. dev.) 0.034∗∗∗(0.006)
Difference in max score (in st. dev.) 0.112∗∗∗(0.006)
Observations 7,578R2 0.425
Notes: Robust standard errors in parentheses. An observation is a team. The regression includes competitionfixed effects. Difference in submissions (max score) is the difference in the number of submissions (max score)at the time of team formation, which are normalized to have standard deviation 1.
measure). We exploit variation in the precision of the public score as a signal of the privatescore across contests to measure the impact of asymmetric information on team formation.Table 9 shows that both the number of submissions and the time of the merger decrease withthe precision of the information in the leaderboard. We interpret this finding as indicatingthe informativeness of more precise signals: When information is more precise, fewer signalsare needed to form a more precise posterior belief about the type of a potential teammate,which leads to earlier team formation.
Table 9: The impact of performance feedback noise on team formation outcomes: Player-levelestimates
Number of submissions Time ofprior to team (in logs) team formation (in logs)
(1) (2)Feedback precision (in St. Dev.) -0.037∗∗ -0.062∗∗∗
(0.016) (0.018)Observations 4,410 4,410R2 0.201 0.043
Notes: Robust standard errors in parentheses. ∗ p < 0.1, ∗∗ p < 0.05, ∗∗∗ p < 0.01. An observation isa competition–player combination over the sample of team players. “Feedback precision” is a measure in[0,100] readily available in the data. When it is 100, the public and private scores take the same value; whenit is 0, the public score is uncorrelated with the private score (see Section 2). We standardize it to simplifythe interpretation of our results (the mean and standard deviation before standardizing are 31.6 and 23.4,respectively). All specifications include contest-level controls (i.e., total reward quantity, number of prizes,maximum daily submissions, contest length, dataset size, image data indicator) and player-level controls (i.e.,public score of first submission, number of past competitions). Column 1 further controls for the time of theteam’s formation, where time is the fraction of the contest time elapsed at the time of team formation.
These findings suggest that players face asymmetric information when forming teams. As
35

a consequence, our findings have clear implications for contest design. Platforms that aredesign to reduce information asymmetries may facilitate teamwork, which improves the scoreof the best submission in a contest.
7 Discussion
Our findings suggest that teamwork causes an economically significant performance improve-ment (for both high- and low-ranked teams) that equals the median score difference betweenthe winner of a competition and the player ranked in the 40th position. Furthermore, per-formance gains do not come from more quantity but rather from higher quality.
Motivated by this reduced-form evidence, we build and estimate a structural model to shedlight on the players incentives to form teams in a dynamic contest. In the model, teamworkincreases productivity but it is costly and some teams fail. Our estimates show that theaverage cost of forming a team equals 52 percent of the contest prize. The high average costexplains the scarcity of teams in Kaggle contests: Only 8 percent of participants are part ofa team. Using our estimates, we simulate the equilibrium of each contest under alternativecontest designs to answer questions such as, should contests allow teams? What is the impactof facilitating teamwork? What is the impact of competitive pressure on teamwork? Ourresults show that contest platforms should allow teamwork and facilitate the formation ofteams. We also find that greater competition encourages teamwork.
In the last section of the paper, we provide evidence showing that players closer to the top ofthe competition are more likely to team up, and they team up with similarly-ranked players.Exploiting the variation in the informativeness of the public leaderboard we show that teamsform earlier in competitions with more precise signals. This suggests that players use thecurrent standing in the competition, as well as players’ historical information, to “screen”for potential partners. To complement our analysis, we informally interview some Kaggleparticipants with teamwork experience to inquire about team formation, asking them: “Howconcerned are you that your teammate will not be a good match?” We reproduce verbatimanswers below, which align with our findings on screening potential teammates.
“I would team up with a person only if I am very sure that I will learn somethingfrom that person. I would check that person LinkedIn profile and would also haveconversations with that person over call before teaming up. LinkedIn and theirprevious kaggle work can serve as good indicator. Also during the call, I ask them
36

what have they done so far in the competition. I decide based on the answerswhich they give to this question”
“previous experience at kaggle, posts in the current competition, and the currentresults. Also it is very important if I already participated in another competitionwith the person. So I know the capabilities of the person, and how hard he/shecan work.”
“I just want to team up with someone smart who I’ll enjoy collaborating with.If they’ve done well in other competitions, that’s good enough. If they are doingwell in the same competition, it could be do to noise.”
“In general, teamwork on kaggle works the following way: At the beginning ofthe competition everybody participates alone. A few weeks before the end of thecompetition, you look for somebody close to you on a leaderboard and team upwith them. You share your solutions, discuss all the ideas, and decide what to donext. Sometimes everybody brainstorms and works on the new ideas together,sometimes everybody continues to improve their solutions, and then combinethem.”
Our results have implications for managers seeking to sponsor competitions in existing online-contest platforms, and for managers designing such competitions. First, our finding thatteamwork improves performance suggests that contests should permit the formation of self-organized teams. Second, our findings on the high cost of team formation and assortativematching suggest that platforms should facilitate teamwork. For instance, an informativeleaderboard allow players to signal their ability through their performance in current thecompetition. Access to historical performance, or the possibility to signal in other ways,reduces information asymmetries and facilitates teamwork.26 Thus, managers should sponsorcontests that allow and encourage teamwork, and choose platforms that also do so.
Our data does not allow us to uncover task-allocation within teams, which would shed lighton the mechanism behind the performance gains. We leave this for future research.
26In Kaggle, for instance, players can upload their own datasets, share code to analyze a dataset, and postmessages on forums that are rated by other users. Other online contest platforms do not allow for theseopportunities, which could be detrimental for teamwork and overall performance.
37

8 References
Ahmadpoor, Mohammad and Benjamin F Jones (2019) “Decoding team and individual im-pact in science and invention,” Proceedings of the National Academy of Sciences, 116 (28),13885–13890.
Azoulay, Pierre, Joshua S Graff Zivin, and Jialan Wang (2010) “Superstar extinction,” TheQuarterly Journal of Economics, 125 (2), 549–589.
Bandiera, Oriana, Iwan Barankay, and Imran Rasul (2013) “Team incentives: Evidence froma firm level experiment,” Journal of the European Economic Association, 11 (5), 1079–1114.
Bikard, Michaël, Fiona Murray, and Joshua S Gans (2015) “Exploring trade-offs in theorganization of scientific work: Collaboration and scientific reward,” Management science,61 (7), 1473–1495.
Blasco, Andrea, Kevin J Boudreau, Karim R Lakhani, Michael Menietti, and Christoph Riedl(2013) “Do Crowds have the Wisdom to Self-Organize?”.
Bloom, Nicholas, Charles I Jones, John Van Reenen, and Michael Webb (2020) “Are ideasgetting harder to find?” American Economic Review, 110 (4), 1104–44.
Bonatti, Alessandro and Johannes Hörner (2011) “Collaborating,” American Economic Re-view, 101 (2), 632–63.
Boudreau, Kevin J, Tom Brady, Ina Ganguli, Patrick Gaule, Eva Guinan, Anthony Hollen-berg, and Karim R Lakhani (2017) “A field experiment on search costs and the formationof scientific collaborations,” Review of Economics and Statistics, 99 (4), 565–576.
Bullinger, Angelika C, Anne-Katrin Neyer, Matthias Rass, and Kathrin M Moeslein (2010)“Community-based innovation contests: Where competition meets cooperation,” Creativityand innovation management, 19 (3), 290–303.
Büyükboyacı, Mürüvvet and Andrea Robbett (2017) “Collaboration and free-riding in teamcontests,” Labour Economics, 49, 162–178.
Büyükboyaci, Mürüvvet and Andrea Robbett (2019) “Team formation with complementaryskills,” Journal of Economics & Management Strategy, 28 (4), 713–733.
Charness, Gary and Matthias Sutter (2012) “Groups make better self-interested decisions,”Journal of Economic Perspectives, 26 (3), 157–76.
Cooper, David J and John H Kagel (2005) “Are two heads better than one? Team versusindividual play in signaling games,” American Economic Review, 95 (3), 477–509.
Dissanayake, Indika, Sridhar Nerur, and Jie Zhang (2019) “Team Formation and Performancein Online Crowdsourcing Competitions: The Role of Homophily and Diversity in Solver
38

Characteristics.”
Dissanayake, Indika, Jie Zhang, and Bin Gu (2015) “Task division for team success in crowd-sourcing contests: Resource allocation and alignment effects,” Journal of ManagementInformation Systems, 32 (2), 8–39.
Feri, Francesco, Bernd Irlenbusch, and Matthias Sutter (2010) “Efficiency gains from team-based coordination—large-scale experimental evidence,” American Economic Review, 100(4), 1892–1912.
Georgiadis, George (2015) “Projects and team dynamics,” The Review of Economic Studies,82 (1), 187–218.
Girotra, Karan, Christian Terwiesch, and Karl T Ulrich (2010) “Idea generation and thequality of the best idea,” Management science, 56 (4), 591–605.
Greer, Lindred L, Lisanne Van Bunderen, and Siyu Yu (2017) “The dysfunctions of power inteams: A review and emergent conflict perspective,” Research in Organizational Behavior,37, 103–124.
Hamilton, Barton H, Jack A Nickerson, and Hideo Owan (2003) “Team incentives and workerheterogeneity: An empirical analysis of the impact of teams on productivity and partici-pation,” Journal of political Economy, 111 (3), 465–497.
Heckman, James J (1979) “Sample selection bias as a specification error,” Econometrica:Journal of the econometric society, 153–161.
Hutter, Katja, Julia Hautz, Johann Füller, Julia Mueller, and Kurt Matzler (2011) “Commu-nitition: The tension between competition and collaboration in community-based designcontests,” Creativity and innovation management, 20 (1), 3–21.
Imbens, Guido W and Donald B Rubin (2015) Causal inference in statistics, social, andbiomedical sciences: Cambridge University Press.
Jaravel, Xavier, Neviana Petkova, and Alex Bell (2018) “Team-specific capital and innova-tion,” American Economic Review, 108 (4-5), 1034–73.
Jones, Benjamin F (2009) “The burden of knowledge and the “death of the renaissance man”:Is innovation getting harder?” The Review of Economic Studies, 76 (1), 283–317.
Lee, Lung-Fei (1978) “Unionism and wage rates: A simultaneous equations model with qual-itative and limited dependent variables,” International economic review, 415–433.
Lemus, Jorge and Guillermo Marshall (2021) “Dynamic tournament design: Evidence fromprediction contests,” Journal of Political Economy, 129 (2), 383–420.
LiCalzi, Marco and Oktay Surucu (2012) “The power of diversity over large solution spaces,”Management Science, 58 (7), 1408–1421.
39

Lin, Mingfeng, Nagpurnanand R Prabhala, and Siva Viswanathan (2013) “Judging borrowersby the company they keep: Friendship networks and information asymmetry in online peer-to-peer lending,” Management Science, 59 (1), 17–35.
Müller, Wieland and Fangfang Tan (2013) “Who acts more like a game theorist? Group andindividual play in a sequential market game and the effect of the time horizon,” Gamesand Economic Behavior, 82, 658–674.
Sutter, Matthias, Simon Czermak, and Francesco Feri (2013) “Strategic sophistication ofindividuals and teams. Experimental evidence,” European economic review, 64, 395–410.
Tausczik, Yla and Ping Wang (2017) “To Share, or Not to Share? Community-Level Col-laboration in Open Innovation Contests,” Proceedings of the ACM on Human-ComputerInteraction, 1 (CSCW), 1–23.
Waldinger, Fabian (2012) “Peer effects in science: Evidence from the dismissal of scientistsin Nazi Germany,” The Review of Economic Studies, 79 (2), 838–861.
Wang, Xuan, Hanieh Javadi Khasraghi, and Helmut Schneider (2019) “Towards an Under-standing of Participants’ Sustained Participation in Crowdsourcing Contests,” InformationSystems Management, 1–14.
Wu, Lingfei, Dashun Wang, and James A Evans (2019) “Large teams develop and smallteams disrupt science and technology,” Nature, 566 (7744), 378–382.
40

Online Appendix
Teamwork in ContestsSupplemental Material – Intended for Online Publication
i

Figure A.1: Timing of team mergers: Cumulative probability function
0
.2
.4
.6
.8
1
Cum
ulat
ive
Prob
abilit
y
0 .2 .4 .6 .8 1Fraction of time elapsed at the time of the merger
Notes: An observation is a team that welcomed a new member during the competition.
Figure A.2: Average cost of team formation.
05
1015
Den
sity
.4 .45 .5 .55 .6 .65Average cost of forming a team
Note: An observation is contest.
ii

Figure A.3: Are players matching up with players who have similar observed outcomes?
A) Number of kernels uploaded in the past B) Number of votes earned by kernels
C) Number of past messages on D) Number of past participationsthe discussion board in the top 30
Notes: An observation is a multiplayer team. Panel A plots the number of kernels (also known as notebooks)posted by the team members in the past. Kernels are code that players can post so that any user can makeuse of it. Panel B plots the number of votes earned by the kernels posted by the different team members.Panel C plots the number of discussion board messages posted by the team members in the past. Panel Dplots the number of past participations where the team members finished in the top 30 positions.
Table A.1: Balance table: pre-merger covariates across treated and non-treated (matched) teams
Distance to max scoreNumber of submissions on public leaderboard Team size atup to time of merger at time of merger time of merger
(1) (2) (3)Non-treated teams 15.955 1.446 1Treated teams 15.955 1.447 1p-value 1.000 0.978 1.000
Notes: Treated teams are teams who welcomed a new member during the competition, non-treated teamsare teams who did not change their team size during the competition. The last row of the table reports thep-value of a differences-in-mean test.
iii

Table A.2: The impact of collaboration on scores: Team-level estimates, competitive teams sub-sample
Public score Private score(1) (2)
New member 0.075∗∗∗ 0.084∗∗∗(0.016) (0.018)
Observations 2,008,287 2,008,287R2 0.302 0.308
Notes: Standard errors clustered at the team-level in parentheses. ∗ p < 0.1, ∗∗ p < 0.05, ∗∗∗ p < 0.01. Anobservation is a submission made by a team in a competition. The sample is restricted to competitive teams,which are defined as teams that obtained scores above the 75th percentile of the score distribution in theircompetition. All specifications include team fixed effects, competition–day fixed effects, and a second-degreepolynomial of variables: total number of submissions by all teams up until the submission time, total numberof submissions by the team making the submission up until the submission time, total number of submissionsby the member of the team making the submission up until the submission time, the submitting team’sdistance to the maximum score on the public leaderboard at the submission time, and the fraction of contesttime that had elapsed at the submission time. The sample is restricted to include submissions by treatedteams that took place six weeks before or after the week in which the team changed its team size, and it alsorestricts attention to teams with one or two members.
Table A.3: The impact of collaboration on extreme scores: Team-level estimates
1{score > p75} 1{score > p90} 1{score > p95} 1{score > p99}(1) (2) (3) (4)
Panel A: Public scoreNew member 0.074∗∗∗ 0.084∗∗∗ 0.070∗∗∗ 0.023∗∗∗
(0.008) (0.009) (0.009) (0.005)Observations 3,248,210 3,248,210 3,248,210 3,248,210R2 0.564 0.570 0.633 0.836
Panel B: Private scoreNew member 0.067∗∗∗ 0.077∗∗∗ 0.066∗∗∗ 0.023∗∗∗
(0.008) (0.009) (0.009) (0.005)Observations 3,179,632 3,179,632 3,179,632 3,179,632R2 0.541 0.454 0.433 0.453
Notes: Standard errors clustered at the team-level in parentheses. ∗ p < 0.1, ∗∗ p < 0.05, ∗∗∗ p < 0.01. Anobservation is a submission made by a team in a competition. 1{score > pX} is an indicator that takesthe value one if the submission’s score exceeded percentile X of the competition-level score distribution. Allspecifications include team fixed effects, competition–day fixed effects, and a second-degree polynomial ofvariables: total number of submissions by all teams up until the submission time, total number of submissionsby the team making the submission up until the submission time, total number of submissions by the memberof the team making the submission up until the submission time, the submitting team’s distance to themaximum score on the public leaderboard at the submission time, and the fraction of contest time that hadelapsed at the submission time. The sample is restricted to include submissions by treated teams that tookplace six weeks before or after the week in which the team changed its team size, and it also restricts attentionto teams with one or two members.
iv

Table A.4: The impact of collaboration on scores: Team-level estimates, first-time collaboratorssubsample
Public score Private score(1) (2)
New member 0.114∗∗∗ 0.121∗∗∗(0.019) (0.023)
Observations 3,121,785 3,054,446R2 0.444 0.453
Notes: Standard errors clustered at the team-level in parentheses. ∗ p < 0.1, ∗∗ p < 0.05, ∗∗∗ p < 0.01. Anobservation is a submission made by a team in a competition. All specifications include team fixed effects,competition–day fixed effects, and a second-degree polynomial of variables: total number of submissions byall teams up until the submission time, total number of submissions by the team making the submission upuntil the submission time, total number of submissions by the member of the team making the submission upuntil the submission time, the submitting team’s distance to the maximum score on the public leaderboardat the submission time, and the fraction of contest time that had elapsed at the submission time. The sampleis restricted to include untreated teams and treated teams whose members are participating in a multiplayerteam for the first time (i.e., in all previous competitions, if any, they participated in a single-member team).Further, the sample is restricted to include submissions by treated teams that took place six weeks before orafter the week in which the team changed its team size, and it also restricts attention to teams with one ortwo members.
Table A.5: The impact of collaboration on scores: Team-level estimates, heterogeneity analysiswith respect to time of merger
Public score Private score(1) (2)
New member (early merger) 0.080∗∗∗ 0.081∗∗(0.024) (0.035)
New member (late merger) 0.078∗∗∗ 0.086∗∗∗(0.017) (0.018)
Observations 3,248,210 3,179,632R2 0.439 0.448
Notes: Standard errors clustered at the team-level in parentheses. ∗ p < 0.1, ∗∗ p < 0.05, ∗∗∗ p < 0.01. Anobservation is a submission made by a team in a competition. All specifications include team fixed effects,competition–day fixed effects, and a second-degree polynomial of variables: total number of submissions byall teams up until the submission time, total number of submissions by the team making the submission upuntil the submission time, total number of submissions by the member of the team making the submission upuntil the submission time, the submitting team’s distance to the maximum score on the public leaderboardat the submission time, and the fraction of contest time that had elapsed at the submission time. The sampleis restricted to include submissions by treated teams that took place six weeks before or after the week inwhich the team changed its team size, and it also restricts attention to teams with one or two members. Anearly merger (late merger) is defined as a merger that took place when less (more) than 50 percent of thecontest time had elapsed.
v
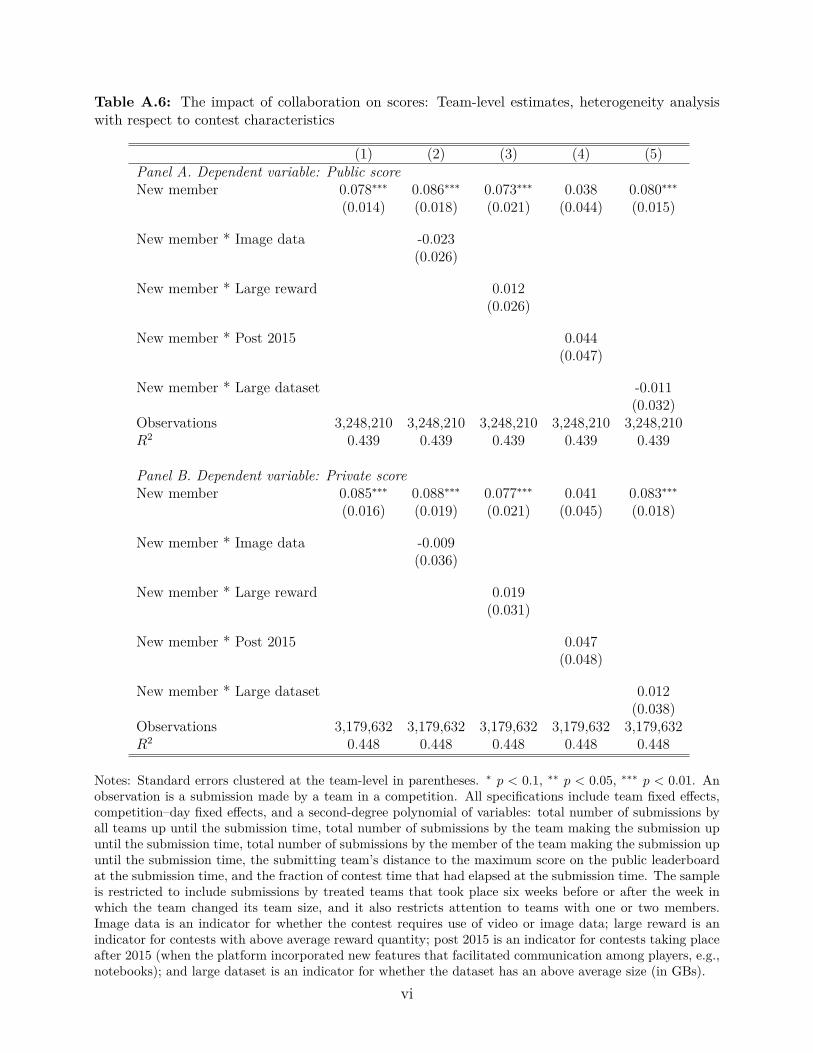
Table A.6: The impact of collaboration on scores: Team-level estimates, heterogeneity analysiswith respect to contest characteristics
(1) (2) (3) (4) (5)Panel A. Dependent variable: Public scoreNew member 0.078∗∗∗ 0.086∗∗∗ 0.073∗∗∗ 0.038 0.080∗∗∗
(0.014) (0.018) (0.021) (0.044) (0.015)
New member * Image data -0.023(0.026)
New member * Large reward 0.012(0.026)
New member * Post 2015 0.044(0.047)
New member * Large dataset -0.011(0.032)
Observations 3,248,210 3,248,210 3,248,210 3,248,210 3,248,210R2 0.439 0.439 0.439 0.439 0.439
Panel B. Dependent variable: Private scoreNew member 0.085∗∗∗ 0.088∗∗∗ 0.077∗∗∗ 0.041 0.083∗∗∗
(0.016) (0.019) (0.021) (0.045) (0.018)
New member * Image data -0.009(0.036)
New member * Large reward 0.019(0.031)
New member * Post 2015 0.047(0.048)
New member * Large dataset 0.012(0.038)
Observations 3,179,632 3,179,632 3,179,632 3,179,632 3,179,632R2 0.448 0.448 0.448 0.448 0.448
Notes: Standard errors clustered at the team-level in parentheses. ∗ p < 0.1, ∗∗ p < 0.05, ∗∗∗ p < 0.01. Anobservation is a submission made by a team in a competition. All specifications include team fixed effects,competition–day fixed effects, and a second-degree polynomial of variables: total number of submissions byall teams up until the submission time, total number of submissions by the team making the submission upuntil the submission time, total number of submissions by the member of the team making the submission upuntil the submission time, the submitting team’s distance to the maximum score on the public leaderboardat the submission time, and the fraction of contest time that had elapsed at the submission time. The sampleis restricted to include submissions by treated teams that took place six weeks before or after the week inwhich the team changed its team size, and it also restricts attention to teams with one or two members.Image data is an indicator for whether the contest requires use of video or image data; large reward is anindicator for contests with above average reward quantity; post 2015 is an indicator for contests taking placeafter 2015 (when the platform incorporated new features that facilitated communication among players, e.g.,notebooks); and large dataset is an indicator for whether the dataset has an above average size (in GBs).
vi

Table A.7: Empirical model estimates: Contest-specific parameters
λ1 SE σ SE β0 (q) SE NTGS Salt Identification Challenge 0.082 0.008 1.4 0.207 -1 0.205 95Quick, Draw! Doodle Recognition Challenge 0.072 0.007 1.54 0.363 -2.783 0.183 91RSNA Pneumonia Detection Challenge 0.191 0.016 1.275 0.313 -3.429 0.387 94Human Protein Atlas Image Classification 0.159 0.012 1.394 0.222 -3.235 0.286 118Traveling Santa 2018 - Prime Paths 0.071 0.006 1.772 0.762 -1.321 0.212 103Google Cloud & NCAA ML Competition 2019-Mens 0.12 0.011 1.09 0.086 -1.768 0.25 92Instant Gratification 0.158 0.014 1.318 0.271 -2.411 0.351 93Predicting Molecular Properties 0.109 0.009 1.351 0.171 -2.226 0.209 114SIIM-ACR Pneumothorax Segmentation 0.138 0.014 1.044 0.139 -2.966 0.511 68Lyft 3D Object Detection for Autonomous Vehicles 0.138 0.011 1.693 0.621 -2.299 0.182 126Santas Workshop Tour 2019 0.066 0.008 1.149 0.113 -2.925 0.273 67Predict HIV Progression 0.08 0.008 1.381 0.179 -0.932 0.203 87Chess ratings - Elo versus the Rest of the World 0.18 0.013 1.271 0.223 -2.072 0.263 136Tourism Forecasting Part One 0.29 0.023 1.302 0.656 -2.005 0.323 80Tourism Forecasting Part Two 0.103 0.009 1.309 0.374 -5.346 0.216 108R Package Recommendation Engine 0.096 0.008 1.264 0.124 -3.4 0.185 112IJCNN Social Network Challenge 0.045 0.005 1.27 0.108 -0.867 0.282 68Stay Alert! The Ford Challenge 0.101 0.008 1.27 0.124 -3.546 0.278 125Mapping Dark Matter 0.61 0.019 1 0.035 -2.613 0.243 161ICDAR 2011 - Arabic Writer Identification 0.103 0.009 0.981 0.084 -3.179 0.242 99Dont Overfit! 0.041 0.006 1.472 0.706 -3.09 0.238 50Wikipedias Participation Challenge 0.092 0.008 1.1 0.09 -4.962 0.201 101Allstate Claim Prediction Challenge 0.222 0.014 1.119 0.157 -3.84 0.236 160dunnhumbys Shopper Challenge 0.082 0.007 1.557 0.274 -1.718 0.165 118Semi-Supervised Feature Learning 0.167 0.013 1.402 0.395 -2.524 0.208 122Give Me Some Credit 0.093 0.009 1.034 0.081 -3.526 0.254 83Dont Get Kicked! 0.308 0.018 1 0.005 -2.68 0.152 133CHALEARN Gesture Challenge 0.114 0.01 0.984 0.052 -4.217 0.192 112What Do You Know? 0.134 0.013 0.868 0.074 -4.739 0.289 79Photo Quality Prediction 0.201 0.013 0.917 0.053 -3.268 0.237 142The Hewlett Foundation: Automated Essay Scoring 0.097 0.01 1.118 0.083 -3.774 0.196 80KDD Cup 2012, Track 2 0.088 0.011 1.211 0.333 -2.731 0.172 57Predicting a Biological Response 0.24 0.014 1.367 0.19 -3.614 0.166 170Online Product Sales 0.208 0.014 1.034 0.069 -3.187 0.208 137Belkin Energy Disaggregation Competition 0.067 0.006 1.03 0.045 -5.004 0.194 101Merck Molecular Activity Challenge 0.257 0.015 0.943 0.032 -3.978 0.2 173Predict Closed Questions on Stack Overflow 0.155 0.014 0.72 0.03 -1.989 0.153 82Traveling Santa Problem 0.069 0.009 1.2 0.259 -3.543 0.371 53Blue Book for Bulldozers 0.265 0.014 0.712 0.018 -5.867 0.18 197Job Salary Prediction 0.114 0.009 1.09 0.086 -1.818 0.208 115The Marinexplore and Cornell University Whale Detection Challenge 0.164 0.012 0.751 0.028 -5.453 0.177 124KDD Cup 2013 - Author-Paper Identification Challenge (Track 1) 0.25 0.015 0.744 0.032 -5.164 0.165 159KDD Cup 2013 - Author Disambiguation Challenge (Track 2) 0.163 0.012 0.782 0.031 -4.987 0.171 129See Click Predict Fix 0.194 0.012 0.849 0.036 -3.729 0.266 161Packing Santas Sleigh 0.063 0.006 1.243 0.086 -1.672 0.432 97Higgs Boson Machine Learning Challenge 0.211 0.017 0.716 0.046 -3.164 0.127 96Liberty Mutual Group - Fire Peril Loss Cost 0.077 0.008 1.054 0.084 -3.763 0.458 84Helping Santas Helpers 0.106 0.01 1.228 0.602 -6.125 0.179 95March Machine Learning Mania 2015 0.106 0.008 1.035 0.059 -4.746 0.157 125Otto Group Product Classification Challenge 0.117 0.011 0.982 0.117 -5.4 0.143 86ICDM 2015: Drawbridge Cross-Device Connections 0.28 0.015 1.008 0.065 -4.4 0.19 188Caterpillar Tube Pricing 0.085 0.008 1.193 0.173 -4.071 0.22 93Liberty Mutual Group: Property Inspection Prediction 0.12 0.011 1.398 0.408 -2.781 0.323 85Springleaf Marketing Response 0.289 0.016 0.94 0.075 -4.547 0.149 170Truly Native? 0.19 0.014 0.796 0.039 -4.999 0.152 128The Allen AI Science Challenge 0.079 0.007 1.286 0.142 -3.238 0.196 99Santas Stolen Sleigh 0.036 0.004 1 0.006 -4.432 0.36 64Second Annual Data Science Bowl 0.113 0.009 1.154 0.169 -1.028 0.165 111BNP Paribas Cardif Claims Management 0.1 0.009 1.046 0.052 -2.872 0.191 109Home Depot Product Search Relevance 0.102 0.01 0.9 0.064 -6.12 0.191 86Santander Customer Satisfaction 0.103 0.009 0.923 0.056 -5.988 0.181 114Expedia Hotel Recommendations 0.117 0.009 1.156 0.075 -2.798 0.185 148Ultrasound Nerve Segmentation 0.196 0.018 0.793 0.073 -4.249 0.247 73Draper Satellite Image Chronology 0.083 0.012 1 0.016 -4.151 0.395 41Predicting Red Hat Business Value 0.11 0.013 1.192 1.145 -4.838 0.718 53TalkingData Mobile User Demographics 0.111 0.011 1.07 0.067 -1.961 0.218 77Outbrain Click Prediction 0.176 0.014 1.537 0.571 -0.616 0.341 108The Nature Conservancy Fisheries Monitoring 0.128 0.009 0.919 0.034 -4.135 0.204 164Dstl Satellite Imagery Feature Detection 0.07 0.007 1.241 0.19 -2.788 0.241 76Cdiscounts Image Classification Challenge 0.128 0.009 0.816 0.041 -5.158 0.169 141Recruit Restaurant Visitor Forecasting 0.145 0.011 0.911 0.069 -4.742 0.199 120Statoil/C-CORE Iceberg Classifier Challenge 0.09 0.01 1.123 0.118 -1.046 0.403 70TrackML Particle Tracking Challenge 0.076 0.007 1.424 0.264 -3.937 0.157 90Santa Gift Matching Challenge 0.121 0.012 0.888 0.046 -4.131 0.14 74Google Cloud & NCAA ML Competition 2018-Mens 0.077 0.01 1.124 0.206 -4.599 0.329 50Google Cloud & NCAA ML Competition 2018-Womens 0.27 0.019 0.65 0.037 -5.805 0.169 110Google AI Open Images - Object Detection Track 0.06 0.007 1 0.043 -5.158 0.166 66Google AI Open Images - Visual Relationship Track 0.095 0.009 1 0.009 -4.168 0.379 82Airbus Ship Detection Challenge 0.089 0.01 1.007 0.077 -1.485 0.205 65Peking University/Baidu - Autonomous Driving 0.121 0.013 0.607 0.027 -5.692 0.265 71
Notes: SE stands for asymptotic standard errors.vii
Copyright © 2022 FDOKUMEN