
How Mutual Fund Voting Shapes Proxy Contests - NYU Stern
68
Picking Friends Before Picking (Proxy) Fights: How Mutual Fund Voting Shapes Proxy Contests * Alon Brav † Wei Jiang ‡ Tao Li § James Pinnington ¶ June 2018 Abstract This paper studies mutual fund voting in proxy contests using a comprehensive sample of voting records over the period 2008 – 2015, taking into account selective targeting by activists. We find that firm, fund, and event characteristics generate substantial heterogeneity among investors in their support for the dissident, including their reliance on proxy advisors. Notably, active funds are significantly more pro-dissident than passive funds. We also uncover evidence consistent with a large unobserved fund “inherent stance” that cannot be explained by observable fund or event characteristics. In particular, we document a positive correlation between the propensity for targeting by activists and pro-activist voting by mutual funds, based both on observables and unobservables. This finding suggests that a relatively pro-activist shareholder base is a key factor driving activists’ selection of targets. * The authors have benefited from discussions with Reena Aggarwal, Patrick Bolton, Yaniv Grinstein, and Ron Kaniel. We acknowledge comments from seminar and conference participants at Columbia Business School, Columbia Law School, IDC Herzliya, Penn State, SUFE, GSU CEAR Finance Conference, FTSE World Investment Forum, 10th Annual Hedge Fund Research Conference, and University of Connecticut Risk Conference. Juerui Feng, Jonathan Foss, Ellen He, Jin Li, Elif Memet, Tomas Mondino, Brandon J. Park, Chunyu Qu, Yiting Xu, Zhicheng Xu, and Daheng Yang provided excellent research assistance. † Alon Brav is the Robert L. Dickens Professor of Finance at Fuqua School of Business, Duke University, ECGI and NBER. He can be reached at [email protected]. ‡ Wei Jiang is the Arthur F. Burns Professor of Free and Competitive Enterprise, Finance and Economics Division, Columbia Business School, and NBER. She can be reached at [email protected]. § Tao Li is Assistant Professor of Finance at Warrington College of Business, the University of Florida. He can be reached at [email protected]. ¶ James Pinnington is a Ph.D. candidate in Finance at Duke University. He can be reached at [email protected]. 1
-
Upload
khangminh22 -
Category
Documents
-
view
1 -
download
0
Transcript of How Mutual Fund Voting Shapes Proxy Contests - NYU Stern
Picking Friends Before Picking (Proxy) Fights:
How Mutual Fund Voting Shapes Proxy Contests∗
Alon Brav† Wei Jiang‡ Tao Li§ James Pinnington¶
June 2018
Abstract
This paper studies mutual fund voting in proxy contests using a comprehensive sample of votingrecords over the period 2008 – 2015, taking into account selective targeting by activists. We findthat firm, fund, and event characteristics generate substantial heterogeneity among investors intheir support for the dissident, including their reliance on proxy advisors. Notably, active fundsare significantly more pro-dissident than passive funds. We also uncover evidence consistentwith a large unobserved fund “inherent stance” that cannot be explained by observable fund orevent characteristics. In particular, we document a positive correlation between the propensityfor targeting by activists and pro-activist voting by mutual funds, based both on observablesand unobservables. This finding suggests that a relatively pro-activist shareholder base is a keyfactor driving activists’ selection of targets.
∗The authors have benefited from discussions with Reena Aggarwal, Patrick Bolton, Yaniv Grinstein, and Ron Kaniel.We acknowledge comments from seminar and conference participants at Columbia Business School, Columbia LawSchool, IDC Herzliya, Penn State, SUFE, GSU CEAR Finance Conference, FTSE World Investment Forum, 10thAnnual Hedge Fund Research Conference, and University of Connecticut Risk Conference. Juerui Feng, JonathanFoss, Ellen He, Jin Li, Elif Memet, Tomas Mondino, Brandon J. Park, Chunyu Qu, Yiting Xu, Zhicheng Xu, andDaheng Yang provided excellent research assistance.†Alon Brav is the Robert L. Dickens Professor of Finance at Fuqua School of Business, Duke University, ECGI andNBER. He can be reached at [email protected].‡Wei Jiang is the Arthur F. Burns Professor of Free and Competitive Enterprise, Finance and Economics Division,Columbia Business School, and NBER. She can be reached at [email protected].§Tao Li is Assistant Professor of Finance at Warrington College of Business, the University of Florida. He can bereached at [email protected].¶James Pinnington is a Ph.D. candidate in Finance at Duke University. He can be reached [email protected].
1
1 Introduction
Over the past two decades, the frequency of proxy contests for board representation or control
has increased markedly as shareholder activism has become both an established investment strategy
and an important form of corporate governance. Dissident shareholders often prevail in these
contests, winning 49.5% of the proxy contests that reached the voting stage from 2008 to 2015.
Since dissident shareholders typically own only 5 − 10 percent of the outstanding target stock,
fellow shareholder support is necessary for the success of any campaign. The general apathy of
retail investors in engaging in voting matters implies that it is crucial that dissidents obtain the
support of a majority of the institutional shareholders of the targeted firms. “Picking friends,” that
is, the selection of a target with a pro-activist shareholder base, is thus a first-order factor in an
activist’s plan prior to launching a proxy contest. Damien Park, the co-chairman of the Conference
Board’s Expert Committee on Shareholder Activism, summarized the situation as ”obtaining a
clear understanding of how company shareholders will vote in a contested election is one of the
most important components of any activist campaign.”
The mandatory disclosure of mutual fund proxy voting records adopted in April 2003 and the
availability of voting record databases such as Voting Analytics, have led to a significant growth
in the literature analyzing the voting behavior of institutional investors.1 However, the standard
voting data provided by Voting Analytics covers only votes cast by the top mutual fund families in
non-contested meetings for Russell 3000 firms. This study focuses, instead, on the voting behavior
of mutual funds in proxy contests with data that we gather directly from individual form N-PX
filings. We thus hope to advance the literature that has so far mostly analyzed institutional investor
voting in uncontested management and shareholder proposals. Voting decisions in proxy contests
are arguably more informative and entail higher stakes for all parties involved compared with
routine proxy voting for which investor votes are mostly precatory.
Our first contribution is a descriptive analysis relating firm, event, and investor characteristics
to mutual funds’ support for dissidents on materialized proxy contests. As expected, mutual funds’
support for the dissidents is higher when Tobin’s q is lower, and when recent stock return or return
1 Papers studying management and/or shareholder proposals in uncontested meetings include Cai, Garner, andWalkling (2009), Choi, Fisch, and Kahan (2013), Cunat, Gine, and Guadalupe (2012), Dimmock, Gerken, Ivkovic,and Weisbener (2016), Duan and Jiao (2016), Matvos and Ostrovsky (2010), Iliev and Lowry (2015), Morgan,Poulsen, Wolf, and Yang (2011), Malenko and Shen (2016), He, Huang, and Zhao (2017), and Kedia, Starks, andWang (2017). The following studies examine the incentives affecting mutual fund voting: Ashraf, Jayaraman, andRyan (2012), Butler and Gurun (2012), Cvijanovic, Dasgupta, and Zachariadis (2016), Davis and Kim (2007), Matvosand Ostrovsky (2008), Harford, Jenter, and Li (2011), and Bodnaruk and Rossi (2016).
2
on assets is lower. Presumably, subpar valuation or performance makes alternative leadership and
strategies more appealing to shareholders. Mutual funds are more likely to vote for hedge fund
activists rather than other types of dissidents, consistent with the belief that hedge funds have clear,
value-oriented goals and are an effective force for governance (Brav, Jiang, Partnoy, and Thomas
(2008)). Dissidents who frequently launch activist campaigns do not enjoy more support but those
that demonstrate persistence and commitment within the campaigns that they do launch see higher
support. Not surprisingly, dissidents enjoy more support after a high announcement return, where
the latter serves as a proxy for the market’s expectation of the activists’ success in achieving their
goals.
Multiple fund characteristics predict support for dissidents. One salient pattern is that passively-
managed funds are significantly less likely than active funds to vote for dissidents (the difference
of 11 − 12 percentage points is significant at the 1% level). The gap between active and passive
votes has been persistent across years, and is even larger for small capitalization target companies.
Though predicted by theory (see a recent review by Bebchuk, Cohen, and Hirst (2017)), this is the
first direct evidence that passive funds are significantly more “pro-management” than active funds
in proxy contests. A similar pattern holds at the family-level, that is, the most pro-dissident fund
families typically have a low fraction of passive funds, and vice versa. A potential explanation is
that passive funds – index and exchange-traded funds – are not rewarded by “beating the index,”
but are instead motivated to minimize expense ratios as well as tracking errors (Elton, Gruber,
and Busse (2004); Choi, Laibson, and Madrian (2010); Lund (2018)). As a result, they are not
incentivized to confront the incumbent management.
We further explore whether mutual fund voting is motivated by a portfolio effect rather than
just the impact on the company under consideration. Such an effect would be similar to voting
considerations under cross-holdings in M&As (Matvos and Ostrovsky (2008); Harford, Jenter, and
Li (2011)), and is also related to the effect of “common ownership” (Azar, Schmalz, and Tecu
(2018)). We find that a fund is more likely to support a dissident when the abnormal returns of
the fund’s same-industry sub-portfolio is higher, consistent with the hypothesis that mutual funds
make voting decisions partly based on the value implication of the proxy contest on their portfolios.
Moreover, funds earning a positive basis-adjusted return (return net of cost of investment) on the
target stock are 7.0 percentage points less likely to support the dissident than a fund earning a
negative return, suggesting that shareholders that are frustrated due to loss of invested capital in
3

the target stock tend to favor the changes proposed by the dissident.
Leading proxy advisory firms, i.e., Institutional Shareholder Services (“ISS”) and Glass, Lewis
& Co. (“Glass Lewis”), are important participants in proxy voting. A “For” recommendation for
a dissident is associated with about 35% higher support rate. This evidence is consistent with
Alexander, Chen, Seppi, and Spatt (2010), who find that ISS’s certification is associated with more
successful proxy fights by dissidents. However, there is significant heterogeneity in the extent to
which fund families conform to advisories’ recommendations. Overall, smaller fund families tend
to vote more closely in the direction of the proxy advisor recommendations, presumably because
they lack resources to conduct independent proxy research.
Our main set of analyses adopts an integrated approach to model voting in proxy contests. In
such a model, every firm-year is a potential target of a proxy contest on which all investors have
a view (supporting the incumbent or favoring a change). However, their views are only revealed
as votes if the contest materializes and proceeds to the voting stage. Thus, the model is set up to
take into account the fact that observed votes are not a random selection out of all latent events
and, as a result, do not necessarily represent mutual funds’ underlying voting rules for all potential
contests.
We begin with a parsimonious two-equation system using a full-information maximum likeli-
hood estimation method. The first is the selection equation, for which the information is recorded
at the firm-year level (including investor information aggregated at the firm level). This equation
represents a firm’s vulnerability to being targeted by dissidents for a proxy contest in a given
year. The second equation is a “voting equation,” where information is more granular at the fund-
firm-year level, and which represents the latent voting rule employed by mutual funds, regardless of
whether the proxy contest actually takes place. The system has to overcome “partial observability”
as the voting information is observed only when the firm-year is selected as a target by the activists.
Because the decisions made by the activists in targeting (at the firm-year level) and those by the in-
vestors in voting (at the investor-firm-year level) require information at different aggregation levels,
the system can be identified even when the same underlying economic factors affect both targeting
and voting decisions. The estimated coefficient of correlation between the residual propensity of
targeting by an activist and the residual propensity to support the activist by investors is positive,
0.19 (statistically significant at the 1% level), supporting the notion that activists tend to target
firms with strong shareholder support beyond the predictive power of observable characteristics.
4

Next, we proceed to explicitly model two dimensions where selection takes place. First, we
assess the extent to which actively-managed funds buy into or sell out of companies after the an-
nouncement of a proxy contest, as well as their choice to participate in the voting conditional on
their holdings of the target shares. Mutual fund shareholders’ participation in voting amounts
to 94% of funds in our sample. Funds exercise a “no show” when the target company is of low
profile, typically a small firm with low valuation, and when their holdings are small. Moreover,
funds are more likely to skip voting if there is no proxy advisor recommendation to follow. Hence,
shareholders’ no show is associated with high cost of acquring information relative to the benefit of
casting an informed vote. Buying-in (selling-out) subsequent to the announcement of the contest ac-
counts for 5.5% (1.4%) of the funds, which is not significantly higher than the normal inter-quartile
turnover. These “marginal” investors tend to have smaller holdings, and do not demonstrate consis-
tent voting preferences in favor of either the management or dissident. Therefore, investor turnover
post-announcement ought not distort our inferences based on the shareholder base observable to
the activists at the pre-targeting stage.
The second dimension of selection we attempt to incorporate is activists’ targeting based on,
among other factors, the stance of the shareholder base at the candidate target. For this purpose,
we quantify that part of individual shareholder inherent stance that can be aggregated at the firm-
year level. We begin by constructing measures for mutual funds’ pro-activist stance based on their
voting records prior to each contest, so that we only use information that was available to the
activists. The first measure of a fund’s inherent stance is based on each fund’s voting outcome
relative to fellow funds voting in the same contests, which is effectively the fund’s fixed effect in
voting, in addition to an event fixed effect. Since we use within-event information, this measure
filters out the endogeneity due to selective targeting by the activists. The second measure of a fund’s
inherent stance is an ordinal ranking of funds’ past voting records based on pair-wise comparisons,
where each permutation of possible pairs of funds are ranked for their pro-activism stance based
on the common set of contests they voted upon so as to remove the effect due to (active) funds’
non-random selection of their holdings. After controlling for firm and fund characteristics, a two
standard-deviation change in the two proxies, aggregated at the firm-year level, capture 24% to
63% of the unconditional probability of targeting. Interestingly, a pro-activist shareholder base
predicts a higher likelihood of a settlement than reaching a vote, suggesting that management may
resort to settlements when the activist poses a credible threat in expected shareholder support.
5
Next, we propose two measures capturing mutual fund’s degree of “ISS conformity” and “per-
suadability.” The first measure is based on the tendency of a company’s institutional shareholder
base to be swayed by the proxy advisors’ recommendations. The second measure builds on the idea
that a fund that is willing to carefully assess the merit of each case is likely to have high variation
in the votes cast over time; we therefore proxy for the fund’s flexibility using the variation in the
votes it has cast in the past prior to the proxy contest. We find that activists are more likely
to target companies whose shareholder base can be swayed by the proxy advisors, or that can be
reasoned with and thus potentially persuaded to vote for the dissident. Moreover, both measures
also predict that contests will reach the voting stage rather than settle suggesting that both sides
are more likely to fight to the end if they feel that the investors and/or the leading proxy advisors
can be persuaded.
2 Institutional Background
Our study encompasses all contested events that require direct shareholder voting over the pe-
riod between 2008 and 2015, including contested director elections and written consent solicitations
to replace directors. In contested events, at least one shareholder takes a different position from
that endorsed by the company’s current board and management. For example, if a shareholder
decides to nominate a slate of “dissident” directors in addition to the candidates supported by the
incumbent board’s nominating committee, a contested election will take place for all or part of the
board of directors.
The proxy fight between DuPont, an iconic American company, and Trian Partners, a leading
activist investor, best exemplifies the underlying institutional framework, as well as the intricacies
of our data collection process.
2.1 Trian Partners’ Intervention at DuPont
Activist investor Trian Partners first engaged with the management of E. I. du Pont de Nemours
and Company (“DuPont”) in mid 2013. The exchange between the parties extended over a two-
year period, centering on change to the firm’s conglomerate structure, reduction of excess corporate
costs, modification of capital allocation plans, and change to corporate governance. By early 2015,
the parties were unable to settle on board membership for the activist to avert a proxy fight, which
6
took place on May 13, 2015 at DuPont’s annual shareholder meeting. At the time, Trian Partners
owned 2.7% of DuPont shares, and DuPont insiders owned 0.3%. DuPont shareholders faced the
choice to either support Trian Partners by electing its founding partner, Nelson Peltz, and three
other dissident nominees, or support the incumbent management team led by CEO Ellen Kullman
by re-electing all sitting directors. Both sides launched aggressive public campaigns trying to win
over the remaining institutional investors who were expected to be the pivotal voters in a seemingly
close contest.2
The high-profile proxy battle resulted in a loss to Trian Partners. DuPont won with 53.5%
of the votes, rejecting all of Trian’s candidates and re-electing all incumbent directors. DuPont
claimed victory but subsequently implemented cost cutting measures as well as asset spin-offs that
were in line with the activist’s goals. Relevant to this study is the way different asset managers
voted their shares. Table 1 provides the actual votes cast by mutual funds affiliated with the top
10 fund families. Several distinct patterns emerge.
[Insert Table 1 here.]
First, DuPont’s top mutual fund shareholders are the “usual” names of institutional investors
with significant ownership in other S&P 500 index member companies. The top five mutual fund
families, BlackRock, American Funds (Capital Group), Vanguard, State Street, and Fidelity, col-
lectively owned 25.4%. Indeed, had one of the three passive institutions that voted against Trian
Partners changed its support that would have sufficed for Nelson Peltz to win a board seat.3 Sec-
ond, votes in favor of the dissident from within the same fund family are clustered at the two
extremes, either 0% or 100%. However, we do observe some remaining disagreement, allowing for
within-family analysis in some of our later analysis.
Third, and most important, is the near dichotomous stance between passively- and actively-
managed funds in this case. All top fund families that are primarily in passive management,
notably, BlackRock, Vanguard, and State Street, voted in favor of the management. In contrast,
almost all actively managed fund complexes, with the exception of Franklin Resources, voted for
the activist. This difference is consistent with the evidence reported later in the paper that passive
2 According to a USA Today article, DuPont spent $15 million on the proxy contest, while Trian Partners spent $8million (see, “DuPont spent $15M to keep activist investor off board,” by Jeff Mordock, May 19, 2015).
3 See “Peltz One Big Shareholder Vote Away From DuPont Board Seat, Tally Shows,” The Wall Street Journal, byDavid Benoit and Jacob Bunge, May 19, 2015. In the final vote count, according to DuPont’s June 9, 2015 8-K/Afiling, DuPont’s board nominee, Lois D. Juliber, won the fewest votes, at 53.5% of the voted shares while NelsonPeltz won 45.8% of shares voted. The difference was about 54 million shares.
7
funds’ average vote for dissidents has been consistently lower than that of active funds in each of
the eight years in our sample, from 2008 to 2015.
3 Data and Sample Overview
3.1 Data Sources
3.1.1 Contested Shareholder Interventions
The sample of contested interventions spans the fiscal years 2008 through 2015. Both man-
agement and the dissident shareholder are required to file with the SEC a Form DEFC 14A, or
the “definitive contested proxy statement,” in order to allow shareholders to vote on their respec-
tive ballots. We manually download all DEFC 14A filings from EDGAR for the period July 1,
2008 through June 30, 2015. This step results in 326 unique proxy contests, in which both the
management and the dissident proposed competing slates of director nominees. We trace back the
dissident’s date of announcement, which is usually launched by the filing of a Form PREC 14A, the
“preliminary contested proxy statement,” although some of these events are initiated by a schedule
13D filing or a press release. We then search for subsequent proxy filings and 8K/10Q filings to
determine whether the shareholder meeting actually took place or not. If a shareholder meeting
did indeed take place we record the firm name, its CIK and CUSIP numbers, the dissident’s name,
and the meeting date. Our sample includes 232 unique contested meetings.
Next, we extract the following information from Form DEFC 14A for both the management’s
and shareholder dissident’s proxy cards: the proposal number, the sponsor (management or share-
holder), and the text of the proposal. The management’s proxy card lists director candidates
nominated by the management, while the dissident’s proxy card contains director nominees spon-
sored by the dissident. Each proxy card also includes other management- or shareholder-sponsored
proposals, if any.
Finally, since some contested meetings take place even though neither party has filed a DEFC
14A (only a PREC 14A, or a 13D filing), we supplement the above hand-collected data with a
comprehensive review of proxy contests included in SharkRepellent, a data provider that specializes
in corporate governance. This step yields 40 additional contested voting events, which brings the
total to 272 events that reached a meeting. We are able to obtain voting records from at least
8
one mutual fund for 215 of these contests. The rest are typically over-the-counter stocks or small
capitalization firms that mutual funds do not hold. We then use the firms’ CIK numbers to merge
the sample with CRSP and Compustat databases, resulting in 188 contested meetings for which
data is available in these databases.
The procedure described above yields 94 proxy contests in which a DEFC 14A filing was
submitted but the contest was either settled (75 events) or withdrawn (19 events). Contested
campaigns are often settled or withdrawn after the dissident has filed a PREC 14A, a schedule 13D
or a press release and before a DEFC 14A is filed. Further manual search for such cases in PREC
14A, schedule 13D, press release, and SharkRepellent yields an additional 138 settled contests and
39 withdrawn events. This brings the total number of settled events to 213 and withdrawn events
to 58 over our sample period. Matching these events to CRSP and Compustat results in a sample
of 194 settled and 43 withdrawn events.4
3.1.2 Mutual Fund Voting Records
The key input to this study is the full voting records of registered investment companies in
proxy contests during our sample period. U.S. mutual fund companies are required to publicly
disclose their proxy voting records via N-PX filings on the EDGAR website, including, for each
holding, the company name, ticker, CUSIP, fund name, meeting date, meeting type (annual or
special), proposal number, proposal text, sponsor (management or shareholder), management’s
recommendation, and the vote cast for each proposal or contest. Unfortunately, standard databases,
such as ISS’s Voting Analytics, do not systematically contain voting records for proxy contests due
to a lack of standardized format in such reporting. Instead, ISS collects voting records mostly for
non-contested meetings for Russell 3000 firms held by top mutual fund families.5
Different fund families adopt different styles to structure the information provided in their
N-PX filings, and, at times, funds within the same family use a variety of formats for these records,
complicating the gathering of the voting data.6 The heterogeneity in reporting style can be seen
in Appendix A1 in which we include a sample of original voting records by two Vanguard funds
4 Bebchuk, Brav, Jiang, and Keusch (2017) analyze the drivers, nature, and consequences of settlement agreements.5 According to ISS, between fiscal years 2004 and 2006, ISS collected voting records by the top 100 families. From2007 onward, ISS has collected routine voting records by the top 300 families.
6 For example, some families upload htm filings, other families use the txt format, and some families embed txtdocuments in htm templates. A number of other families have switched from txt format to htm over our sampleperiod.
9

and two Northern Lights funds relating to DuPont’s proxy contest described earlier in section 2.1.
Vanguard funds all file uniformly, while each Northern Lights fund adopts its own unique format.
For example, Northern Lights’s Covered Bridge Fund did not include the dissident proxy card
that they did not vote on while Northern Lights’s Persimmon Long/Short Fund included both the
management and dissident cards.
We adopt a multi-step procedure to extract information from form N-PX. First, we develop
multiple computer scripts to parse all N-PX records by the top 100 mutual fund families from
EDGAR between July 1, 2007 and June 30, 2015, and extract the following information: family
name, fund name, company name, CUSIP, meeting date, meeting type (annual or special), proposal
number, proposal text, sponsor (management or shareholder), management’s recommendation, and
vote cast for each proposal. From this superset we are able to retrieve the voting records for the 188
proxy contests using the associated target company names/CUSIPs and meeting dates. According
to the CRSP Mutual Fund database, as of December 2016, the top 100 families account for 85.2%
of assets under management (and a similar representation of voting power) by all mutual funds.
We then manually search for voting records of the remaining (smaller) fund families. Given
that the number of funds per family is low we first download all of their N-PX filings for fiscal years
2008-2015 and then, for each fiscal year, search for filings that include the 188 target names/CUSIPs.
This significantly reduces the number of N-PX filings that need to be checked. Finally, we manually
collect voting records by these funds on the contested events. Combining the data sets collected in
these two steps, we obtain 5, 313 unique funds from 615 unique fund families, and 27, 289 meeting-
fund pairs or firm-year-fund observations.
3.1.3 Institutional Holdings
We obtain mutual fund quarterly holdings from the Thomson Reuters S12 Mutual Funds
database. The sample includes all SEC-registered mutual funds for the period January 1994 through
December 2015. The holdings are adjusted for stock splits. Following Frazzini (2006), we drop
observations when the number of shares held by a fund exceeds the number of outstanding shares
at quarter end. For all the stock-fund-year pairs, we download the CUSIP, the number of shares,
and a unique fund ID assigned by Thomson Reuters. The holdings data are then merged with
CRSP to obtain the firms’ stock price.
Next, for each fund identified in the mutual fund voting database (see Section 3.1.2), we first
10

download all of their tickers from the EDGAR N-PX forms and use these tickers to merge with
mutual funds in the CRSP Mutual Fund database. We utilize the MFLINKS tables on the Wharton
Research Data Services (“WRDS”) to match the CRSP funds to the Thomson Reuters S12 data.7
This step yields 14,209 observations. Finally, we manually search all the unmatched voting fund
names in Thomson Reuters S12 and obtain 1,964 additional matched observations.
We also retrieve information on a firm’s other institutional owners from Thomson Reuters
13F database. The SEC requires all institutions with at least $100 million in total holdings to
file Schedule 13Fs within 45 calendar days of quarter-end with ownership information on 13(f)
securities. All holdings of an issuer of more than 10,000 shares or of a value of $200,000 or more
must be reported. We retrieve the stock name, CUSIP, and two measures of ownership. The first,
the number of sole voting shares held, and the second, all shares held by the institution.
3.2 Event, Fund, and Firm Level Variables
3.2.1 Event Characteristics
The variables described in this section are designed to capture event-related specific attributes.
The first set of variables describe the dissident. Hedge fund dissident is a dummy variable equal
to 1 if the dissident is a hedge fund and 0 otherwise. We further proxy for a dissident’s experience
with the variable # past events by dissident by counting the activist’s past interventions using a
comprehensive database of hedge fund activist events launched by the hedge funds beginning in
1994. We scale this count by the number of years since the earliest year when campaigns by the
individual dissidents are launched.8 Number counting aside, we attempt to proxy for the activist’s
commitment in these past engagements. The variable Past campaign intensity is a weighted average
of three modes of engagement: passive communication, submission of shareholder proposals, and
more confrontational actions, including the threat of a proxy contest, initiation of an actual proxy
contest, a lawsuit, and a takeover bid. We assign increasing weights to each of these tactics as
7 We thank Yuehua Tang for suggesting the use of mutual fund tickers for matching N-PX funds to funds in CRSPand Thomson Reuters S12.
8 The dataset covers activism events in the U.S. over the period 1994-2015 and is an extension of the sample usedin Brav, Jiang, Partnoy, and Thomas (2008), and Brav, Jiang, and Kim (2015) and is based upon the same sampleselection criteria. These events are identified mainly through Schedule 13D filings to the SEC, but also includesactivism events at below 5% stakes using news archive search.
11
follows:
Past campaign intensity =(# Communication)× 1 + (# Proposal)× 2 + (# Confront)× 3)
# of Years
where # Communication is the number of events in which the activist sought to communicate
with the board/management. # Proposal is the number of events in which the dissident submitted
shareholder proposals but without further disapproval. # Confront is the number of confrontational
events in which the activist threatened to sue or launch a proxy contest, initiated a proxy contest,
a lawsuit, a takeover bid or asked for board representation. # of Years is the number of years since
the earliest year (post 1994) when the campaign was launched.
The literature has shown that leading proxy advisors, especially ISS and to some extent Glass
Lewis, have significant sway of up to 30% on institutional votes (Cai, Garner, and Walkling (2009);
Malenko and Shen (2016); Li (2016)). Hence, we incorporate proxy advisors’ recommendations in
our analysis. ISS for dissident is a dummy variable equal to 1 if ISS recommends that investors
vote “For” the dissident, and 0 for a recommendation “Against” the dissident. To locate ISS’s
voting recommendations, we check all company and dissident proxy filings between the DEFC 14A
date and meeting date, and record the final recommendation disclosed by either party. For the
events missing ISS recommendations, we supplement with information from ISS’s Voting Analytics
database, SharkRepellent, as well as news search in Factiva. These steps yield 83 “For” recom-
mendations and 76 “Against” recommendations by ISS. Glass Lewis for dissident is constructed
similarly. We obtain 34 “For” recommendations and 102 “Against” recommendations by Glass
Lewis.9
3.2.2 Fund Characteristics
The next set of variables are meant to capture fund-level heterogeneity. Passive fund is a
dummy variable equal to 1 if the fund is passively managed.10 The variable % disagreement within
family last year provides the percent of proxy contests in the previous year for which there is
9 Since at least one party is incentivized to publicize the proxy advisors’ stance that is in its favor these steps shouldreveal the full extent of ISS and Glass Lewis recommendations.
10We search for names including the following indexation-related strings such as Index, Idx, Indx, INDEX, Ind(where indicates a space), and ETF, as well as names of common indices such as Russell and S&P, or if the fundis categorized as an index/ETF in the CRSP Mutual Fund database.
12

disagreement in voting within the fund family, where disagreement arises if at least one fund voted
in a different direction from other funds within the same fund family. Fund total assets (in billions
of dollars) is the sum of each portfolio’s total dollar value, as recorded in the Thomson Reuters
S12 database. Holding as % of fund total assets is a fund’s dollar ownership of the target stock as
a percentage of a fund’s total assets. Holding as % of firm equity is a fund’s share in the target
stock as a percentage of the target’s outstanding shares. The last three variables are measured at
the quarter end prior to the contested meeting.
3.2.3 Fund-Event Characteristics
Additional heterogeneity arises at the fund-event paired level. While Announcement return,
the cumulative abnormal return between −10 days and +10 days around the announcement of the
proxy contest, is common to all funds, Sub-portfolio CAR [-10,+10], the same abnormal return for
a fund’s sub-portfolio containing all firms in the same industry as the target firm, is calibrated to
each fund-event. Industry is defined at the SIC four-digit level if it results in at least three firms
in the portfolio, and is expanded to the SIC three-digit or two-digit industry, otherwise.
Positive basis-adjusted return is an indicator equal to 1 if the current stock price is above
the value-weighted cost basis, and 0 otherwise. For any fund and at any date t, the price basis
construction follows Frazzini (2006) and equals,
Basist = λ−1t∑
n=0
Sharest,t−nPricet−n,
in which Sharest,t−n is the number of shares the fund acquired at date t − n that it still holds
at date t, λ is a normalizing constant such that λ =∑t
n=0 Sharest,t−n. The beginning month
is constrained to January 1994. Finally, Holding horizon is the number of consecutive quarters in
which a mutual fund holds the target stock.
3.2.4 Firm Characteristics
Several common firm characteristics serve as control variables in our analyses. Market capi-
talization, MV , is measured in billions of dollars; Tobin’s q, is the sum of book value of debt and
market value of equity, scaled by book assets; Return-on-assets, ROA, is earnings before interest,
13
tax, depreciation and amortization, or EBITDA, scaled by book assets; Leverage is the ratio of debt
to the sum of debt and equity, all in book values; Prior-year stock return is the buy-and-hold re-
turn during the 12 months prior to the contested meeting; Dividend yield is common and preferred
dividends divided by the market value of common stock plus book value of preferred; industry
concentration is captured by the Herfindahl index of sales (HHI); and Institutional ownership, is
the fraction of shares held by institutional investors at the quarter end before the meeting, as re-
ported by the Thomson Reuters Ownership Database. All of the variables above, except Prior-year
stock return, and Institutional ownership, are measured at the fiscal year end before the contested
meeting.
3.3 Sample Overview
3.3.1 Proxy Contests and Voting
Table 2 provides descriptive statistics on 425 proxy contests over the period 2008-2015, in
which the target firms are covered by CRSP/Compustat. Panel A provides the annual frequency
of proxy contests that resulted in a vote, a settlement, or were withdrawn. The number of proxy
contests was at a high of 84 in 2008, but then dropped by nearly a half by 2010 and has since
remained at an average of 44 events per year through 2015. About 44% of all proxy contests in our
sample resulted in a vote, while 46% were settled prior to the shareholder meeting. The remaining
10% were withdrawn by the dissidents.
[Insert Table 2 here.]
Panel B provides the breakdown of events by the Fama-French 12 industry classifications.
The Finance industry includes the largest number of proxy contests, comprising 23.1% of the
sample. However, the industry is still significantly underrepresented considering that nearly 41%
of all Compustat firms are in the Finance industry (measured by firm-year frequency). Next
in the frequency ranking is Business Equipment, representing 17.2% of our proxy contests sample,
compared to 11.0% of the Compustat universe. The difference is significant at the 1% level. Panel C
provides information on the dissidents launching the proxy contest. 146 hedge funds are responsible
for 315 contests, or 74.1% of the sample, indicating the presence of repeat players. Next, individual
investors launch 73 contests and companies initiate 28 contests.
14
3.3.2 Overview of Voted Contests
Table 3 provides summary statistics on the subset of contests that eventually reached the voting
stage, which is of particular importance for analyzing funds’ voting behavior. Panel A reports event-
specific characteristics. The first three rows reveal that voted contests represent highly pivotal
situations. When a proxy contest proceeds to voting, both the incumbent management and the
dissident shareholder ought to expect that their probability of winning is not significantly below 0.5.
Had this not been the case, management would choose to settle or the dissident shareholder would
withdraw (Bebchuk, Brav, Jiang, and Keusch (2017)). Indeed, the statistics support such tradeoffs.
In our sample, activists have won 49.5% of the voted contests and ISS supports the dissident slate
52.3% of the time (when a recommendation is issued). Both numbers are indistinguishable from
one-half. In an average contest, the dissident receives 40.5% of the votes, indicating that when a
dissident wins (loses) the margin is relatively small (large). In contrast, Glass Lewis only supports
the dissident 23.3% of the time. The different degree of support for the dissident by the two leading
proxy advisors echoes the findings of Li (2016) and Bubb and Catan (2018). Nearly 70% of the time
the dissident is a hedge fund. Dissidents launched 2.2 proxy contests, on average, per year. Their
track records are such that they won, on average, 0.7 of past activist engagements, where success
includes the achievement of at least one of their stated goals. In addition, the average dissident’s
past campaign intensity, as defined in section 3.2.1, is 3.5.
[Insert Table 3 here.]
Panel B provides evidence on fund characteristics. Passively managed funds comprise 38.6% of
all the event-fund observations, while they comprise just 15.9% of all the unique funds. For a given
fund family, there is at least one fund voting in a different direction from other funds within the
same family in 5.5% of proxy contests. The overall low level of disagreement within fund families
is consistent with the documented voting pattern in uncontested shareholder meetings (Iliev and
Lowry (2015)). At the fund level, the average (median) past support rate for the dissidents is 34.8%
(33.3%). The average fund has a portfolio value of $4.3 billion, with a median of $0.4 billion. The
average fund invests 0.5% of its assets in the target stock, which amounts to 0.2% of the outstanding
stock.
Fund characteristics are presented in Panel C. The average mutual fund holds the target for
7.5 quarters, with a median of 5.0 quarters. Same-industry firms in the fund’s portfolio experience
15
a positive abnormal return of 3.0% on average, and a median of 1.7%. This is consistent with
Gantchev, Gredil, and Jotikasthira (2016) who find a positive return effect at the industry level
upon announcement of activism. On average, 79% of funds bought the target firm at a price lower
than the current stock price, hence the positive basis-adjusted returns.
Panel D presents statistics for the target companies. Columns (1)-(3) provide the average,
median, and standard deviation for selected attributes, and columns (4)-(7) show a comparison to
matched firms. In columns (4)-(5), matched firms for each target are all other firms from the same
year and same industry (four-digit SIC). In columns (6)-(7), we match each event firm to a control
firm from the same year and the same industry (two-digit SIC) with the closest propensity score,
where the propensity score is estimated using all firm characteristics.
Target firms are significantly smaller than Compustat-matched companies (at the 5% level),
with an average (median) market value of $1.8 ($0.3) billion. However, dissidents tend to launch
proxy contests at firms with more institutional owners, whose votes are crucial for the dissidents to
win the looming proxy battle. Targets in proxy contests have a lower Tobin’s q and poorer stock
performance, implying that one major goal of proxy contests is to reduce undervaluation of the
target firms. Firms going through proxy contests also have a lower dividend yield (insignificant at
the 10% level), suggesting that one goal for dissidents is to seek higher payouts. Relative to their
matched peers, targets have a marginally higher ROA (not significant at the 10% level). These
patterns are broadly consistent with Fos (2017). Last, as shown in columns (6)-(7) of Panel D,
differences in all company characteristics between target firms and the propensity score matched
sample are not significant at the 10% level, indicating that the propensity score produces a close
match along all these important dimensions.
Panel E provides information on the distribution of ownership by mutual funds in target firms,
non-target firms, and the propensity score matched firms. For each firm, we count the smallest
number of largest mutual funds that are needed to reach an ownership percentile threshold. The
average (median) number of these large fund investors that collectively own 5% at the target firm
is 4.4 (2). It is nearly a half of the number for the non-targets at this threshold, consistent with the
idea that dissidents select target firms in which it is easier to communicate with a more concentrated
investor base. The number of funds increases steadily and by the 25% threshold of ownership there
is no significant difference across the three groups of firms. The average (median) number of fund
investors at this ownership level at the target firms is 65.3 (24).
16
4 Descriptive Analyses of Mutual Fund Voting in Proxy Contests
4.1 Mutual Fund Voting Sorted by Event and Fund Characteristics
Panels A to C of Table 3 describe the general pattern of mutual fund voting in proxy contests.
Columns (4)-(6) give the support rate for the dissident’s slate at a low and high level for each fund,
firm, event, and fund-event characteristic, and test for their differences. For all other variables, the
cutoff for high- and low-level is the median value of a characteristic variable.
At the event level, when ISS issues a “For” recommendation for a dissident, mutual funds’ sup-
port rate is 57.5%, compared with a support rate of 17.8% when the recommendation is “Against.”
This order of magnitude for ISS’s potential influence, up to 40 percentage points, is consistent with
prior research on the conformity of institutional votes to ISS recommendations. Similarly, a change
in the recommendation by Glass Lewis is associated with a 22 percentage points difference in fund
votes.
When the dissident is a hedge fund, mutual funds support its slate 42.1% of the time, compared
with a support rate of 25.3% otherwise. Mutual funds do not seem to be impressed by the sheer
quantity of a dissident’s past campaigns, as proxied by the number of past activist engagements.
Finally, when the dissident announcement return is high, mutual funds tend to support the dissi-
dent, consistent with the idea that the market believes that the dissident is more likely to succeed
in achieving its goals. All of the differences above are significant at the 1% or 5% level, except for
past campaign intensity which is insignificant at the 10% level.
We next examine how fund-level characteristics are associated mutual funds’ support for dis-
sidents. As shown in Table 3, Panel B, passively-managed funds are significantly less likely than
active funds to support a dissident, and the difference of 8.8 percentage points is significant at the
1% level. Furthermore, in Figure 1, Panel A, we plot passive and active managed mutual funds’
support rate for dissidents in proxy contests over fiscal years 2008 - 2015.11 It is evident that active
funds are consistently more likely to support dissidents, with the difference being the largest in
2010. In Figure 1, Panel B, we further compare passive and active funds’ support for dissidents
sorted by market capitalization of the target firm. Passive funds’ support for dissidents in small
cap target firms is similar to that in large caps. While active funds’ support for dissidents is higher
than that of passive funds in both size sorts, we observe much higher support in small caps targets,
11We first average across funds in a given event before averaging across all the events in that year.
17
51% of the time, compared with a support rate of 38% in large cap targets.
[Insert Figure 1 here.]
Not surprisingly, a fund’s past support rate for dissidents strongly predicts its support for
dissident nominees in the current proxy contest. The difference is significant at the 1% level. We
also find that when a fund invests a higher proportion of its assets in a target stock, it tends to
support management more often. Significant holders of a stock typically interact with management
more often, and might not want to annoy management by voting against them so they could lose
continued access to management. Iliev and Lowry (2015) find a similar result for uncontested
meetings when ISS recommends against the management. However, we do not find any economic
or statistical significant relationship between votes for dissidents and percent disagreement in family
past year, fund total assets, or investment as percentage of firm equity.
Finally, in Panel C, we examine whether key fund-event characteristics are related to funds’
support for dissidents. Positive basis-adjusted return is negatively correlated with the support
rate (the difference is significant at the 10% level), suggesting that “unhappy” shareholders, who
have had bad investment returns, are more likely to support changes proposed by dissidents. On
the other hand, sub-portfolio CAR is positively related to mutual funds’ votes for the dissident,
indicating that funds make voting decisions based on the overall performance of their portfolios
(the difference is significant at the 10% level). Holding horizon, however, is not related to funds’
support rate both economically and statistically.12
4.2 Voting Patterns by Mutual Fund Families in Proxy Contests
A central goal of this study is to uncover how mutual fund investors vote in proxy contests, one
of the most important venues for corporate governance by shareholders. Table 4 Panel A reports
the voting outcome by the top ten institutions by assets under management (“AUM”). The top
three are BlackRock, Vanguard, and State Street, who collectively managed $11.7 trillion of assets
as of December 2016. Vanguard participated in 85% of the proxy contests between 2008 and 2015,
followed by BlackRock and State Street. The smallest institution among the top 10 asset managers,
Wellington, also voted in over 100 proxy contests.
12Appendix A3 provides additional descriptive statistics linking mutual fund voting and pro-dissident recommenda-tions by the proxy-advisors ISS and Glass Lewis.
18
[Insert Table 4 here.]
The voting decisions for the top ten institutions reveal a noteworthy positive relation between
the number of passive funds within the family and support for management. The majority of
Vanguard, State Street and BlackRock assets are in passive funds. They are more likely to vote
in contests due to their comprehensive holdings and, more importantly, more likely to vote for
management. The support rate for dissidents ranges from 16.8% by Vanguard to 34.8% by Black-
Rock. On the other end of the spectrum, Goldman Sachs funds and American Funds are almost
all actively managed. Their support rates for dissidents are 62.5% and 39.5%, respectively.
Panel B contrasts the most and least pro-dissident fund families among the top 100 frequent
voters based on the average outcome of their votes. These funds participated in at least 32 proxy
contests during our sample period. Mutual of America, with an AUM of $15.7 billion, voted for
dissidents 68% of the time, the highest in our sample. Next are Gabelli, Goldman Sachs, SA Funds,
and Janus, with dissident-support rates ranging from 54.2% to 62.9%. On the other end, Rydex
Investments, the least pro-dissident family, supported dissidents in only 2.6% of the time. The
rest of the five families with the lowest dissident-support rates, including California Investment
Trust and Vanguard, range between 3.1% and 19.2%. Echoing the pattern in Panel A, the most
pro-dissident families tend to have few passively managed funds, and vice versa.
5 An Integrated Analysis of Proxy Contests and Voting
5.1 Investor Voting Behavior Incorporating Contest Target Selection
5.1.1 Empirical Specification
In equilibrium, investors’ voting decisions in proxy contests and dissidents’ target selection are
jointly determined. Since the support from the majority of shareholders defines success in proxy
contests, rational activists must pick battles in companies with a sympathetic shareholder base
and try to win over their support. Gauging shareholder support is necessary given that dissidents
and insiders tend to hold quite comparable stakes, and the support of disinterested shareholders is
therefore crucial for the success of a campaign.13 The selection of targets by dissident sharehold-
13Fos and Jiang (2016) report that in proxy contests, the average ownership by the incumbents and dissidents are10.9% and 9.6%, respectively.
19
ers implies that an analysis of shareholder voting behavior conditional on the materialization of
proxy contests, while informative, may not represent the underlying “voting rules” by institutional
investors.
In this section, we present a parsimonious model to capture the joint contest-voting dynamics.
Let i, j, t be indices for firm, investor, and year, respectively. The basic model is set-up as follows:
V ote∗i,j,t = Xi,tγ + Zi,j,tλ+ εi,j,t; V otei,j,t = (V ote∗i,j,t > 0); (1a)
Contest∗i,t = Wi,tβ + Z[i,t]i,j,tδ + ui,t; Contesti,t = (Contest∗i,t > 0); (1b)
V otei,j,t is observed iff Contesti,t = 1. (1c)
Equation (1a) gives the unconditional voting model employed by institutional investor j if firm
i is under a proxy-contest in year t. Both firm-year variables, Xi,t, and investor-level variables,
Zi,j,t, affect the voting outcome. The vector of variables Zi,j,t = {Z [1]j , Z
[2]j,t , Z
[3]i,j,t}, includes time-
invariant fund specific variables, Z[1]j , such as whether the fund is passively managed, time-variant
fund specific variables, Z[2]j,t , such as fund size; and fund-event level variables, Z
[3]i,j,t, such as basis-
adjusted returns. Random noise as well as unobserved independent variables are grouped into εi,j,t,
the residual. The voting outcome is V otei,j,t = 1, where fund j votes in favor of the dissident in the
proxy contest in firm-year (i, t) if the fund’s pro-dissident propensity, V ote∗i,j,t, exceeds a threshold
which we normalize to zero. Importantly, the voting outcome is only observed when there is an
actual contest, that is, when Contesti,t = 1.
Equation (1b) models the vulnerability of a given firm in a given year to being the target of
a proxy contest.14 The vulnerability, Contest∗i,t, is related to observed firm-year characteristics,
Wi,t and Z[i,t]i,j,t, and a residual ui,t. A proxy contest will materialize, i.e., Contesti,t = 1, when the
vulnerability exceeds a threshold, which is normalized to zero. Wi,t includes firm-level variables
that are deemed to potentially affect the propensity to target, including firm characteristics as well
as performance. In addition, Z[i,t]i,j,t captures the the aggregate profiles of the shareholders in the
firm at the time, to be discussed further below.
The model has a close-form solution with the assumption that the residuals are binormally
14In this section we only consider proxy contests that persist to the voting stage since the analyses are built on actualfund voting. We analyze the full set of announced proxy contests, including those that last to the voting stage, thosethat result in a settlement between both parties, and contests that have been withdrawn by the activist in Section5.2. In the current analysis, firms that experience an announced but withdrawn or settled contest are excluded fromthe control sample.
20
distributed. The estimation using a full-information maximum likelihood (“FIML”) method is
detailed in Appendix A4. It is closest to the model developed in Van de Ven and Van Pragg (1981)
in which one probit model becomes observable depending on a second probit model. It can also
be viewed as a special case of Heckman (1979) who models a system of two processes, one on
participation, and the other on the outcome conditional on participation.
Our setting differs from the standard probit models with selection in that the two processes
in Equation (1) operate at different levels. How an individual investor casts its vote in a contest is
potentially affected by circumstances at the firm-investor-year level (i.e., (i, j, t)), while dissidents’
targeting decision is based on factors at the firm-year level (i.e., (i, t)), including investor-level
information aggregated to the event. When aggregating the investor-level information we apply a
value-weighted scheme in which the weights, wi,j,t, are proportional to investor j’s voting rights
(equivalently, ownership stakes in most cases), in firm i in year t. That is, for any variable Zi,j,t,
its firm-year-level aggregation is:
Z[i,t]i,j,t =
1
ni,t
ni,t∑j=1
wi,j,t Zi,j,t , (2)
where ni,t is the number of investors who would be voting if a contest, indexed by (i, t), was to
take place.
Moreover, because proxy voting takes place after the announcement of targeting, with an
average (median) time lag of 189 (128) days, the information that investors have at the voting
stage is broader than the information that dissidents had when selecting the target. We therefore
assume that Wi,t ⊂ Xi,t. The incremental variables in Xi,t mostly capture information revealed
since the announcement of a proxy contest, including the identity as well as the track record of the
dissident.
This setup allows for factors that drive dissident targeting and investors voting that are not
observed to the econometrician. The two processes in Equation (1) are simultaneous because the
correlation between the two residuals that subsume the unobserved determinants, Corr(ui,t, εi,j,t),
is potentially nonzero. The economics of proxy fights allows us to hypothesize that the correlation
is likely to be positive. That is, if the residual εi,j,t, which captures, in addition to a random noise,
unobserved elements that swing investors toward supporting the activist, is overall higher, then the
firm ought to be a more attractive target during the year, all else being equal. This ought to be
21
the case given that dissidents have some knowledge about shareholder stance beyond what can be
predicted by observable characteristics.
The goal of our estimation is to uncover the determinants of investors’ support for dissidents,
using voting data from materialized proxy contests as well as firm-level data for the superset of tar-
gets and nontargets. Relative to this setup, a reduced-form estimation based on voted contests only
(reported for completeness in Appendix A2), is potentially biased due to the non-random selection
by the activists. Suppose, for example, that firm underperformance contributes to the merit of the
activist agenda. Then, in the hypothetical world in which shareholders are asked to vote between
the “incumbent management” and “change” in every shareholder annual meeting (firm-year), we
would have observed that shareholders are more likely to vote for “change” in underperforming
firms. However, when a proxy contest does take place, it is either because the target company,
other things being equal, is underperforming or it is a desirable target for other reasons despite
its good performance. When these two possibilities are pooled together, the relationship between
the support for the dissident and underperformance becomes less clear among the observed voting
records. This economic setting is analogous to the one in the classic labor economics model in which
the relation between earnings and education is moderated in the observed sample of people who
choose to participate in the labor market. As the level of education increases (which is positively
correlated with the propensity of participation based on observables), participation by people with
(unobserved) lower innate ability also increases.
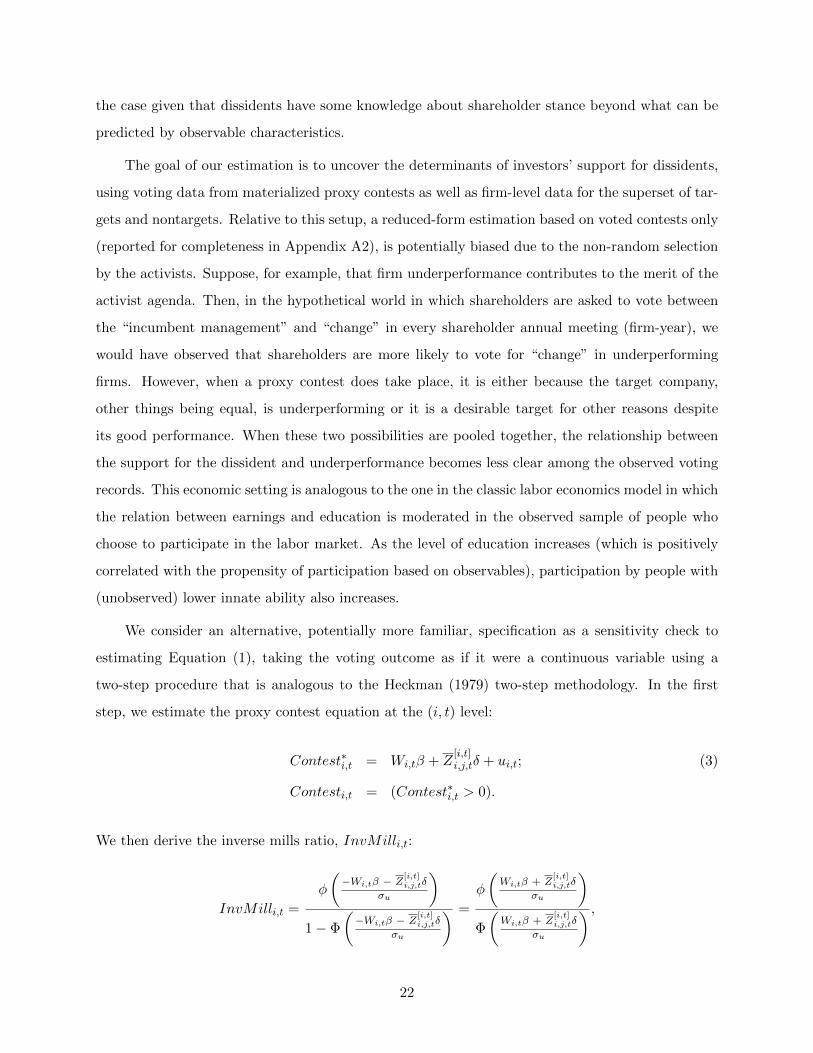
We consider an alternative, potentially more familiar, specification as a sensitivity check to
estimating Equation (1), taking the voting outcome as if it were a continuous variable using a
two-step procedure that is analogous to the Heckman (1979) two-step methodology. In the first
step, we estimate the proxy contest equation at the (i, t) level:
Contest∗i,t = Wi,tβ + Z[i,t]i,j,tδ + ui,t; (3)
Contesti,t = (Contest∗i,t > 0).
We then derive the inverse mills ratio, InvMilli,t:
InvMilli,t =
φ
(−Wi,tβ − Z
[i,t]i,j,tδ
σu
)1− Φ
(−Wi,tβ − Z
[i,t]i,j,tδ
σu
) =
φ
(Wi,tβ + Z
[i,t]i,j,tδ
σu
)Φ
(Wi,tβ + Z
[i,t]i,j,tδ
σu
) ,
22
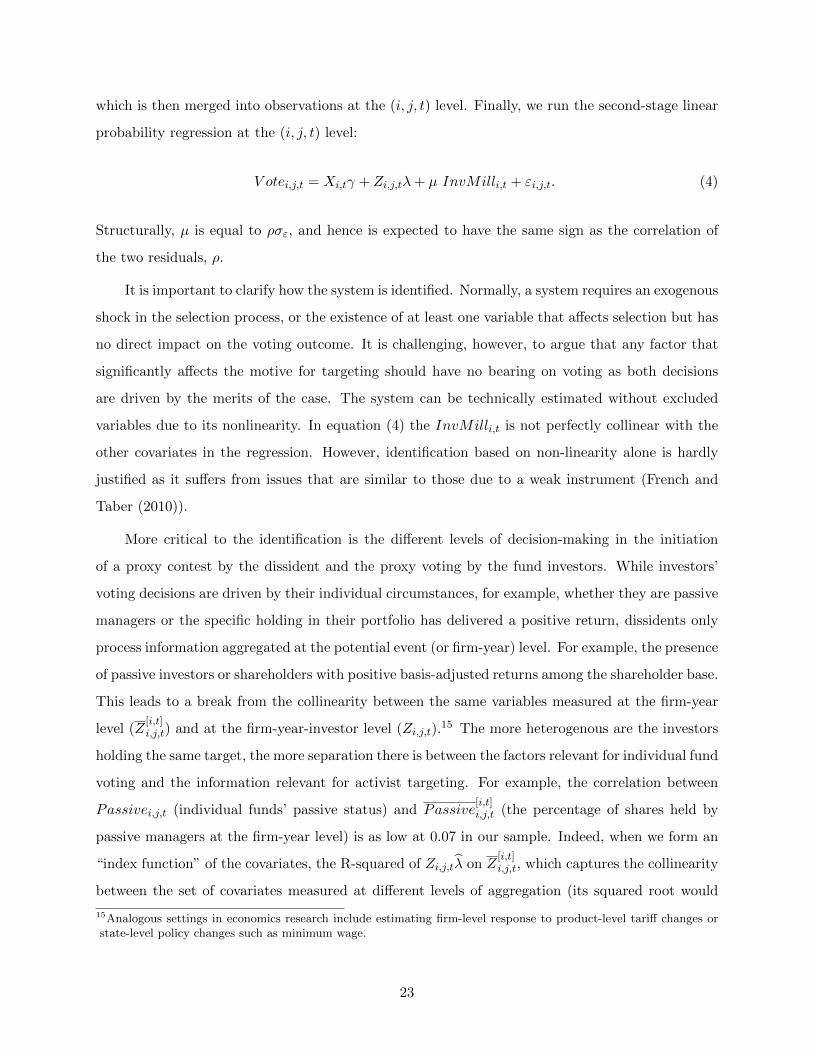
which is then merged into observations at the (i, j, t) level. Finally, we run the second-stage linear
probability regression at the (i, j, t) level:
V otei,j,t = Xi,tγ + Zi,j,tλ+ µ InvMilli,t + εi,j,t. (4)
Structurally, µ is equal to ρσε, and hence is expected to have the same sign as the correlation of
the two residuals, ρ.
It is important to clarify how the system is identified. Normally, a system requires an exogenous
shock in the selection process, or the existence of at least one variable that affects selection but has
no direct impact on the voting outcome. It is challenging, however, to argue that any factor that
significantly affects the motive for targeting should have no bearing on voting as both decisions
are driven by the merits of the case. The system can be technically estimated without excluded
variables due to its nonlinearity. In equation (4) the InvMilli,t is not perfectly collinear with the
other covariates in the regression. However, identification based on non-linearity alone is hardly
justified as it suffers from issues that are similar to those due to a weak instrument (French and
Taber (2010)).
More critical to the identification is the different levels of decision-making in the initiation
of a proxy contest by the dissident and the proxy voting by the fund investors. While investors’
voting decisions are driven by their individual circumstances, for example, whether they are passive
managers or the specific holding in their portfolio has delivered a positive return, dissidents only
process information aggregated at the potential event (or firm-year) level. For example, the presence
of passive investors or shareholders with positive basis-adjusted returns among the shareholder base.
This leads to a break from the collinearity between the same variables measured at the firm-year
level (Z[i,t]i,j,t) and at the firm-year-investor level (Zi,j,t).
15 The more heterogenous are the investors
holding the same target, the more separation there is between the factors relevant for individual fund
voting and the information relevant for activist targeting. For example, the correlation between
Passivei,j,t (individual funds’ passive status) and Passive[i,t]i,j,t (the percentage of shares held by
passive managers at the firm-year level) is as low at 0.07 in our sample. Indeed, when we form an
“index function” of the covariates, the R-squared of Zi,j,tλ on Z[i,t]i,j,t, which captures the collinearity
between the set of covariates measured at different levels of aggregation (its squared root would
15Analogous settings in economics research include estimating firm-level response to product-level tariff changes orstate-level policy changes such as minimum wage.
23
be the correlation of the two index functions), is 0.046, which is much smaller than the perfect
R-squared = 1.16
Finally, it is important to recognize that in the current model activists take as given the
shareholder base in potential targets. However, a dimension of selection that may impact the
targeting-voting dynamics is one in which some actively-managed funds choose to invest in or divest
from a firm depending on their propensity to support the activist if proxy contests materialize.
While the system modeled herein allows for a correlation between activist targeting and investor
voting propensity, it does not model the potential correlation between investors’ selective investment
and their stance toward activism along unobservable dimensions. We do, however, address this
issue in two ways: First, we present a robustness check in which we include only passive funds
so that discretionary investment is not an issue. Second, section 5.1.3 models investor turnover
post announcement of a contest (and potentially before the record date). We find that the mutual
fund shareholder turnover around proxy contests does not exceed the normal frequency of portfolio
reshuffling and that the new shareholders do not vote systematically differently from the existing
ones. Hence, investor selection is unlikely to affect our main results.
5.1.2 Discussion of Empirical Results
The results from estimating the FIML system in Equation (1) and the two-step approach in (3)
and (4) are reported in Table 5. The overall pattern shown in the two panels is largely consistent.
First and foremost, the estimated coefficient of correlation of the residuals, ρ, is positive at 0.19, and
so is the coefficient on the inverse mills ratio, 0.13, in the two-step estimation. Both are statistically
significant at the 1% level. This confirms the hypothesis that activists are more likely to target
firms with unobservables that predict stronger shareholder support, beyond the predictive ability
of an econometrician who relies solely on observable information.
[Insert Table 5 here.]
The statistical relation is also consistent with anecdotal evidence that activists routinely ana-
lyze the past voting records of shareholders to gauge the extent to which they are receptive to an
16It is worth noting that our model allows the activists to adopt general and multiple aggregation functionsf [i,t](Zi,j,t), other than the value-weighted average, to assess the situation at the event level. For example, f [i,t](Zi,j,t)can be the average characteristics of the top ten shareholders, or the dispersion of shareholder characteristics in apotential target. It remains true that any f [i,t](Zi,j,t) is going to have relatively low correlation with any linearfunction of Zi,j,t because Zi,j,t contains variation in investor voting stance within the same event which cannot beexplained by any variable (or any functions of variables) measured at the event (firm-year level).
24

activist campaign, and they frequently assess the attitude of key shareholders prior to launching
a campaign, or even prior to making an investment in a company.17 A company may have all the
attributes an activist finds attractive from a value perspective, but if the shareholder base appears
difficult to persuade, the activist will be less likely to intervene. Because the SEC rules since 1992
do not prevent activists and institutional investor from communicating before the intervention be-
comes public (Bradley, Brav, Goldstein, and Jiang (2010), Fos (2017)), activists can often form
a forecast of shareholder support that is more accurate than a statistical model based on public
information.
Results in columns (1) and (2) indicate that dissidents are more likely to receive shareholder
support when the target firm is underperforming (especially in terms of ROA), when the dissident
has a track record of deep involvement in past campaigns (as measured by Past campaign intensity),
when the investment is a large stake relative to the fund’s portfolio, and when the investment
has been a disappointment in that the current price is even below the cost basis for the fund.
Shareholders are also more likely to support dissidents in more concentrated industries (proxied
by HHI ), supporting the hypothesis that shareholder governance becomes more important when
competition in the product market is weaker (Giroud and Mueller (2010)).18
Importantly, passive funds are about 12 percentage points less likely to vote for the dissidents.
The same pattern is echoed in Bubb and Catan (2018) who find that passive managers are signif-
icantly more pro-management in both shareholder- and management-initiated proposals. Because
the passive status of a fund is exogenous (determined at the inception of the funds and does not
change over time), its strong relation between the pro-management voting attitude in proxy contests
cannot be explained by reverse causality or a missing common factor that affects both.19
Appendix A2, provides reduced-form probit analyses relating voting outcomes to covariates
17See “Dealing with Activist Hedge Funds and Other Activist Investors,” a report by Wachtell, Lipton, Rosen, &Katz, January 2017: http://www.wlrk.com/webdocs/wlrknew/WLRKMemos/WLRK/WLRK.25490.17.pdf.
18We have also examined the effect of the incremental industry concentration induced by common ownership, or theMHHI measure developed in Azar, Schmalz, and Tecu (2018). We find that it is not related to either voting behavioror targeting vulnerability. The work by Azar et al. suggests that firm decision making takes into account the welfareof “common owners” but does not have direct predictions of how individual investors should vote in a contest.
19It is worth noting that this result does not necessarily contradict Appel, Gormley, and Keim (2018), who show thatactivism is more likely to escalate to more confrontational interventions (including proxy contests), conditional onactivist campaigns, if the target has more passive ownership. We show that passive investors are more likely to votefor the management, and hence dissidents are less likely to target companies with high passive ownership for proxycontests, out of all companies. Appel et al., on the other hand, identify a local effect at the cut-off between theRussel 1000 and 2000 indices, and the authors are careful to state that the relation informs a choice among firms atthat range. A full set of analyses applying the Appel et al. method to our data is available from the authors uponrequest.
25

conditional on voted contests, for the full sample as well as subsamples sorted by passively- and
actively-managed funds as well as the largest funds vs. the rest. Comparing the results in columns
(1) and (2) of Panel A with those in Appendix A2 (full sample), we observe some differences.
For example, Prior-year stock return and Dividend yield, whose coefficients are insignificant when
we neglect selection, are now negatively and positively related to the propensity to support the
dissident.
The relation between targeting and firm characteristics, reported in columns (4) and (5) is
overall consistent with the literature. Not surprisingly, targets of proxy contests tend to have low
market valuation (low Tobin’s q) which dissidents often use to criticize the incumbent management.
This is consistent with Fos (2017), who finds that almost 40% of dissidents in proxy contests state
that the main reason for the campaign is to reduce undervaluation. Potential targets are also large
firms with a high institutional shareholder base, including public and private pensions and hedge
funds, in addition to mutual funds, whose support the dissidents need to secure a victory at the
contested meeting.
The last few variables in Table 5 reflect how the shareholder base is an important factor
in activists’ targeting consideration, which has not been systematically analyzed in the literature.
Dissidents are significantly less likely to target a firm that is heavily held by passive funds, suggesting
that these sophisticated investors understand that passive funds are reluctant to support their
agenda. Because dissidents can potentially gain more votes with effective persuasion when the
average mutual fund holding the firm is larger or its investment in the stock is more significant,
these are regarded as positive signals. When a large number of investors in a firm have a negative
raw return in the stock, captured by Positive basis-adjusted return, aggregated at the firm-year
level, the firm becomes an attractive target, presumably because the loss of capital in an absolute
sense leads to disappointment for investors who therefore favor a change (even after controlling for
benchmark adjusted stock returns).
5.1.3 Selection by Funds: Voting Participation and Trading Prior to Voting
This section closes the loop on the potential selection by actively-managed mutual funds that
invest in companies partly based on their voting attitude in proxy contests. Li and Schwartz-Ziv
(2018) show that shareholder trades and votes are related around shareholder meetings. A priori,
the direction of the selection is unclear. A fund manager might take a “Wall Street walk” by
26
selling shares in a firm she perceives poorly so as to avert a vote against the manager (Admati and
Pfleiderer (2009); Edmans (2009)). Alternatively, a pro-activist fund may want to accumulate a
block in firms that are vulnerable to (or already in) activist situations (Kedia, Starks, and Wang
(2017), He and Li (2017)). We now examine what motivates investor selection along three different
margins.
No Show. Shareholders are not legally required to vote though most institutional shareholders
do, especially after the SEC rule change in 2003 mandating disclosure of votes by mutual funds.
“No show” funds are those that have holdings but do not participate in the voting process. It is
difficult to classify no-show funds exactly since the disclosure of quarterly holdings does not allow
us to pin down the change in holdings relative to the record date. Given this constraint, we define
as no-show fund-event observations that satisfy the following criteria: (i) The fund has at least one
recorded vote during the year; (ii) the fund has held the stock in the target company at both quarter
end Q− 1 and quarter end Q, where Q is where the record date falls; (iii) there is no disclosed vote
by the fund in the target company. By these criteria, about 6.4% of the funds engaged in no-show
in the average contest.20
Table 6 column (1) provides evidence regarding the underlying causes for no-show. No show
is more likely when the firm is small, the stake is small (relative to both all shares outstanding and
the fund’s own assets under management), and the overall institutional ownership is high. The
benefit of influencing control is presumably low in these situations. Funds are more likely to skip
voting if there is no ISS/Glass Lewis recommendation to follow, or they have high conformity to
advisory recommendations and low variation in past voting outcomes. These factors reflect the
cost of information acquisition.
[Insert Table 6 here.]
One reason commonly cited for funds’ no-show is that shares lent out on the record date cannot
be voted by the owners. However, in recent years institutional shareholders have become conscious
about calling back the shares on loan prior to the record date especially for high-stake voting
events (Aggarwal, Saffi, and Sturgess (2015)). Our finding that passively-managed funds, which
20The turnout rate is consistent with what other researchers report about an overall participation rate of around75%, and much lower participation rate by retail investors at around 30%, see, e.g., Cvijanovic, Groen-Xu, andZachariadis (2017).
27
are significantly more likely to lend out their shares, are no more likely to skip voting confirms
that stock lending is unlikely a driving force in this setting. The results are overall consistent with
mutual funds’ common justification for no-show that abstention from voting reflects the fact that
the cost of casting an informed vote exceeds the expected benefit.
Buy-into-Voting and Sell-out-of-Voting. Funds can buy into a company after the latter has
become the target of an activist but before the record date, analogous to what risk arbitrageurs do
in M&A. Again, with quarterly holdings information, we can only approximate buy-into-voting by
requiring that a voting fund has disclosed holdings in quarter Q but not in quarter Q− 1 or Q− 2,
where Q is the quarter that contains the record date. According to this definition, 5.5% of the funds
at the voting stage are new entrants. Table 6 column (2) analyzes the characteristics of buy-into-
voting funds, relative to all funds that cast votes in the contest. Overall, actively managed funds
that buy-into-voting seem to be motivated by poor performance (by valuation, ROA, and stock
returns), consistent with an “arbitrage” motive similar to that in M&A for targets that potentially
benefit more from a change (Jiang, Li, and Mei (2017)). Finally, in unreported results we confirm
that the voting outcomes of the buying-in funds are not significantly different from the existing
funds in the same events.
Next, we classify a actively-managed, sell-out-of-voting fund as a non-voting fund that disclosed
holdings in quarters Q − 2 and Q − 1 but not in Q.21 We find that only 1.4% of the funds are
sell-out-of-voting funds by this definition. Selling funds have significantly smaller stakes in the
target companies compared to voting funds. Because proxy advisors usually issue recommendations
after the record date, funds that want to get in or out for voting-related motives cannot make
their decisions conditional on the recommendations – hence these variables are omitted from the
regressions. In a placebo test in which we set a “pseudo-event time” to be two quarters prior to the
announcements of proxy contests, we find that the “pseudo buy-into” and “pseudo sell-out” rates
to be 4.9% and 1.3%, respectively, not significantly different from the shareholder turnover levels
around the proxy contests.
Overall, the evidence in this section mitigates the concern that the shareholder turnover biases
the estimation in the joint system of (1a) and (1b) in which we assume that activists take the
shareholder base as given.
21In both cases, the requirement of holdings status in Q − 2 rules out frequent inter-quartile portfolio changes bysome funds. The results are very similar if we drop the Q− 2 filter.
28
5.2 Activist Targeting Incorporating Investor Pro-Activist Stance and Persuad-
ability
The evidence presented earlier (section 5.1.2 and Table 5) is consistent with the idea that an
investor’s expected level of support for an activist, conditional on firm and event characteristics
that are observable to the econometrician, is a significant element of activists’ decision in selecting
targets. By definition, this investor stance cannot be explained by observable characteristics, but
is an attribute that both the company and the activist can gauge in forming their strategies.
To give content to investor support, we develop measures that capture investors’ inherent “pro-
activist stance” based on the directional voting outcomes that took place prior to each contest. We
also form proxies for the extent to which investors have exhibited the willingness to learn and be
persuaded, and for the extent to which the investor base is influenced by the leading proxy advisors.
We then examine how the measures for investor “pro-activist stance” and “persuadability” of the
shareholder base at each potential target affects the activists’ selection of these target firms, and
how these measures predict differentially proxy contests that are eventually voted upon, settled, or
withdrawn.22
5.2.1 Investor Pro-Activist Stance
A Fund Fixed Effect-Based Measure The measure is based on the information that one can
derive from a model for investor voting behavior, relative to peers voting in the same contest.
Consider the following linear probability model:
V otei,j,t = Zi,j,tλ+ ηt + αi,t + Φj + εi,j,t, (5)
where time-varying fund and fund-event variables are included. Moreover, ηt is the yearly fixed
effect (estimated with yearly dummy variables), αi,t is the event fixed effect, and Φj is the fund
fixed effect capturing a fund’s inherent pro-activist stance. E[αi,t] = E[Φj ] = 0, but fixed effects
could be correlated with the covariates. Conditional on a given contest, a fund that votes in
favor of the activist should be considered more pro-activist than a fund that votes in favor of the
management in the same event. Importantly, the inclusion of the event fixed effect αi,t filters out
22In contemporaneous work, Kedia, Starks, and Wang (2017) propose three proxies for what they term “activism-friendly” institutions, based on ownership changes in the past, and ask how the presence of such institutions affectsthe likelihood of hedge fund activism and its ex-post success.
29
the influence due to endogenous matching between materialized contests and firms because this
measure uses only information from the within-event variation in fund voting.
We estimate equation (5) using a dual fixed effect model that accommodate two high-dimensional
fixed effects. From the estimation we recover Φj .23 We construct estimates of Φj,t annually for all
funds, using rolling time windows from the beginning of the sample up to the previous year, t− 1,
to ensure that it is based on information available (and observable to the activists) at the time of
targeting. For this reason, we do not construct the measure for the first year of our sample period.
In order to construct a stance measure that is net of the variation due to fund characteristics,
we use the residual, Φj,t, from the following cross-sectional regression for each fixed-effect stance
estimate:
Φj = π0 + π1Fund Sizej + π2Fund Family Sizej + π3Passivej + Φj . (6)
Covariates in (6) that vary over the estimation period are averaged.
To the activists, the relevant investor stance is an aggregation of investor stance at a potential
target. Aggregation can potentially take many different functional forms. We consider the follow-
ing two metrics that are simple and intuitive but our analysis is not restricted by the particular
functional form with which we aggregate investor stance:
Average of all investors: Φi,t =1
ni,t
ni,t∑j=1
wi,j,t Φj,t, (7)
Average of the top investors: Φi,t =1
n20%i,t
n20i,t∑
j=1
wi,j,t Φj,t. (8)
The first measure averages over all investors in a given company using value weights while the
second measure averages over the smallest number of the largest investors who collectively own at
least 20% of the target i in time t, denoted n20i,t. Among all contests, the average (median) number
of in-sample investors is 125 (82) and the average (median) for the top investors that collectively
own 20%, as shown in Table 3, panel E, is 37 (14). Investor concentration flattens out considerably
after the 20% mark due to skewness in investors’ stake size. Hence, 20% is a reasonable threshold
23Generally, estimated fixed effects are often time inconsistent due to the relatively small sample size within a typicalfixed effect group and the large number of fixed effect groups relative to the sample size. This concern is mitigateddue to the fact that the event fixed effects are based on quite large groups. The average number of observations foran event is 125.
30
characterizing activists’ targeted effort in winning the support of major shareholders. The average
of these measures is close to zero by construction.
It is important to note that although event fixed effects filter out the endogeneity in activists’
selection of a target firm, the measure is still potentially affected by a different source of endogeneity,
namely, the non-random matching between (actively-managed) funds and companies. If all funds
participate in all proxy contests, or if investors’ participation in proxy voting is unrelated to their
attitude toward activism, then Φi,t is an unbiased measure for investor stance. In other words, the
following identifying assumption is sufficient for these measures to be unbiased:
Identifying assumption 1. For a given fund, the average pro-activist stance of all its peers
(other funds voting in the contest), averaged over all events that this fund participates in, is equal
to the investor population average (which is normalized to zero).
It is, however, plausible that a pro-activist investor may invest in companies with like-minded
fellow shareholders. As a result, Φi,t may underestimate the pro-activist stance of companies with
a “diligent” shareholder base because all investors involved in the same events are benchmarked
to the average stance of their diligent peers. This is analogous to the case in which a class fixed-
effect-adjusted grade point average (“GPA”) of an excellent student underestimates the student’s
academic performance because strong students tend to take more challenging courses with stronger
peers. For this reason, we now explore an alternative measure that addresses this specific issue.
Pairwise Rank Measure An alternative proxy for pro-activist stance, which does not require
Identifying Assumption 1, is based on pairwise comparisons of the pairs’ “common support,” that
is, the common events that any pair of mutual funds participated in. The methodology, developed
in operations research (Marden (1995) and Jamieson and Nowak (2011)), ranks a collection of
objects based on pairwise comparisons, that is, by the ranking of two objects at a time. The goal
is to form a ranking over a set of n mutual funds in our sample, Θ = (θ1, θ2, ...θn) with a mapping
σ : {1, 2, ..., n} → {1, 2, ..., n} that prescribes an order
σ (Θ) : θσ(1) ≺ θσ(2) ≺ ... ≺ θσ(n)
where θj ≺ θk means that fund j precedes fund k in the ranking, or that the former is more
pro-activist than the latter.
31

A full sorting, with ties allowed, can be obtained using pairwise comparisons, where the ranking
of any pair of funds j and k is based on all nj,k contest events in which both funds j and k voted
on. We rank,
θj ≺ (or ≺ , or ∼ ) θk, if
nj,k∑(i,t)=1
V otei,j,t > (or < , or = )
nj,k∑(i,t)=1
V otei,k,t.
In other words, any pair of funds are ranked based on their votes in the common contests so that
if their voting outcomes differ then one can make an inference about their relative pro-activist
stance.24 Because of the common support requirement, a pairwise comparison is not distorted by
potentially endogenous matching between funds and events. All pairwise comparisons (C2n = n!/2)
contribute to the full ranking. Following our earlier example concerning student grading, this is
equivalent to comparing any pair of two students based on the common courses they took, and
then ranking all students based on the pairwise ranking.
Next, let Rj,t ∈ {1, 2, ...nt} be the resulting ranking of fund j among all nt funds based on all
historical information up to year t − 1. As in Section 5.2.1, we do not construct the measure for
the first year of our sample period. Moreover, to ensure that the rank measure is uncorrelated with
fund characteristics we use the residual from the following regression similar to (6):
Rj = π0 + π1FundSizej + π2FundFamily Sizej + π3Passivej + Rj (9)
To facilitate the interpretation we normalize Rj and Rj to be a uniformly distributed variable
bounded between 0 and 1, conforming to the scale of a rank variable. Finally, we construct the
following two metrics for each firm-year analogous to (7) and (8):
Average of all investors: Ri,t =1
ni,t
ni,t∑j=1
wi,j,t Rj , (10)
Average of the top investors: Ri,t =1
n20%i,t
n20i,t∑
j=1
wi,j,t Rj . (11)
Both measures are bounded between 0 and 1, and the average is close to 0.5.
24The fact that investors might have a different interpretation of the event characteristics (e.g., the attribution of afirm’s poor performance) does not affect the consistency of this measure since the variation in a fund’s interpretationshould not lead to a directional bias. If an investor evaluates events in a way that is systematically optimistic orpessimistic towards the management, then such a tendency will be captured by the inherent stance.
32

The proxy Rj is not affected by activists’ endogenous targeting at the firm-year level. As with
the measure based on fund fixed effects, it only uses within-event fund voting information so that
any unobserved heterogeneity at the firm-year level is differenced out. More importantly, it does not
require Identifying Assumption 1 because the “common support” ensures that it is not affected by
the selection bias due to different funds matching with different companies. This measure, however,
requires its own identifying assumption, specified below:
Identifying Assumption 2: The ranking of funds’ pro-activist stance is transitive; that is, if
θj ≺ θk and θk ≺ θl based on respective pairwise comparisons, then in expectation, fund j is more
pro-activist than fund l.
This assumption is intuitive but its actual validity is an empirical question. In the rank data
Rj we have constructed, we find that cases showing a contradiction constitute fewer than 0.3%
of all possible permutations for which we have direct comparison data. Hence, the assumption is
reasonable both theoretically and empirically.
5.2.2 Modelling Investor “Persuadability”
When a proxy contest proceeds to voting, both the incumbent management and the dissident
shareholder ought to expect that their probability of winning is not significantly below 0.5. Such
an expectation is justified by the statistics of our sample (see Table 3 Panel A). To the extent that
activists anticipate a narrow margin in ex post materialized contests then it is plausible that they
would choose to target companies with shareholders who are willing to heed the information and
analysis supporting the dissidents’ agenda. Conditional on a proxy fight, both sides are also more
likely to bring the fight to a vote if they feel that there is more room for persuasion.
We model persuadability with a proxy for the degree to which shareholders learn and revise
their beliefs regarding the benefit from either the management or activists’ plan. Given that
materialized contests represent near-pivotal situations, a fund with a diffuse prior belief should
exhibit high variation among its own votes cast in different events. In other words, a fund that
is not beholden to a specific narrative, be it that of management or the dissident, and is willing
to carefully assess the merit of each case is likely to have high variation in the votes cast over
time. Following this idea, we construct a within fund variation measure, denoted σj , which is the
standard deviation of a fund’s voting outcome in the years prior to the contest. As in Section 5.2.1,
we then form the residual measure, σj , and its aggregation at the firm-year level, σi,t, to obtain
33

Past voting variation.
5.2.3 Influence by Proxy Advisors
The literature has shown that leading proxy advisory firms, notably ISS and Glass Lewis, exert
considerable influence on the voting behavior of their institutional investor clients. Previous work by
Ertimur, Ferri, and Oesch (2013) and Malenko and Shen (2016) shows that ISS sways up to 30% of
the votes in routine proxy votes, mostly in uncontested situations, using data from Voting Analytics.
To gauge the potential influence of advisors in proxy contests, in unreported analysis we conduct
a diagnostic test by adding proxy advisors’ recommendation as an additional regressor to the
reduced-form voting prediction model find that the marginal probability for this regressor is 36.0%
(t-statistic = 10.6). While acknowledging that the causal effect is not identified by such a simple
regression, we note that the magnitude of the correlation between proxy advisors’ recommendations
and voting outcomes is comparable to findings for uncontested situations. Important to our setting,
Li (2016) shows that since the dramatic increase of firm coverage by Glass Lewis in 2007, which is
the first year of contests in our sample, competition has mitigated the potential pro-management
bias by ISS due to its conflict of interest from other businesses with client firms.
A priori, it is unclear whether activists prefer an institutional shareholder base that is more
likely to be swayed by proxy advisors since those investors subscribe to the latter’s voting guidelines
and are reluctant to make their own decisions due to sheer “laziness,” lack of resources, or due to
avoidance of conflicts. On the one hand, independently minded investors might pay more heed to
the debate between management and the dissident in order to assess their merits. On the other
hand, dissidents can concentrate their effort on persuading only one or two institutions, namely,
the leading proxy advisors, if a large proportion of the shareholders conform to or follow their
recommendations.
The stance of the leading proxy advisors is often times crucial for activists’ success. Base on
supporting rates, ISS is more pro-activist than the average shareholder (52.3% vs. 49.5%). More
importantly, activists are able to win 69.6% of the contests with the proxy advisor’s blessing, and
only 34.9% absent such support. Given these stylized facts, the persuasion of the leading proxy
advisors is of even higher (and more concentrated) stake for the activists than engaging individual
shareholders.25
25Industry publications (e.g., www.theactivistinvestor.com/The Activist Investor/Proxy Advisors.html) acknowledge
34
To assess individual funds’ conformity to leading advisors’ recommendation, we estimate the
βj loading coefficient from regression fund j’s voting-for-dissident on the “ISS/GL composite rec-
ommendation” using all the events the fund voted in. In the composite recommendation, we use
the recommendation (1 for the dissident and 0 for the management) of either ISS of Glass Lewis if
only one of them provides a recommendation, or the average if both issue recommendation. The
event is dropped if no recommendation is available.
Appendix A3 reports the fund families that demonstrate the highest and lowest conformity
to the leading proxy advisors. First American Funds and Bridegeway Capital lead with their
βj coefficients being 0.97 and 0.92. On the other end, Gabelli Asset Management and Rydex
Investments, with βj coefficients that are slightly negative at −0.12 and −0.02, seem to cast vote
in ways completely independent from what are recommended by the advisors. Perhaps counter
to common perception, we find that passive funds have βj values that are, on average, 0.12 lower
than active funds (significant at the 5% level). That is, passive funds are less likely to follow ISS,
possibly due to the fact that most passive funds belong to large mutual fund complexes (such as
BlackRock) which are able to devote resources to in-house research when casting their votes.26
We then obtain βj as the residual from a regression of βj on the most salient fund character-
istics analogous to (9) using information available at each point of time. Finally, we obtain the
Conformity to proxy advisors measure, βi,t, by aggregating at the firm-year level for all sharehold-
ers and for the largest shareholders holding up a 20% stake in the target firm, analogous to (7) and
(8).
5.2.4 Shareholder Stance Predicts the Occurrence and Outcomes of Proxy Contests
Table 7 provides results from estimating the activist targeting equation with the additional
proxies for stance developed in this section. The sample for this regression consists of firm-year
level observations for all non-targets and all materialized contests. Importantly, in this analysis
we are able to include contests that do not go into the voting stage, that is, proxy fights that are
eventually settled or withdrawn. Because the two pro-activist stance measures are highly correlated
(with a correlation coefficient of 0.67), we include them separately in different regressions. Past
and suggest that activist investors solicit endorsements from leading proxy advisors. The communication resemblescorporate meetings with debt rating agencies or equity analysts.
26The fact that passive funds rely less on ISS recommendations contrasts with the finding of Iliev and Lowry (2014)analyzing votes in mostly noncontested events although the relation between ISS-conformity and fund size is consis-tent with their evidence.
35
voting variation and Conformity to proxy advisors have a modest correlation coefficient of 0.13,
and are not meaningfully correlated with the pro-activist stance measures. Panel A presents results
using proxies for investor stance based on all investors in a given firm-year while the proxies for
stance in Panel B are based on measures representing the top 20% investors.
[Insert Table 7 here]
Columns (1) and (3) of Panel A show that the pro-activist stance of a company’s shareholder
base, based on historical information and known at the time of engagement, is a significant (at the
5% and 1% levels) predictor for whether the company becomes a target, conditional on all firm
characteristics and other observable investor characteristics aggregated at the firm-year level. For a
two-standard-deviation increase around the mean of investors’ pro-activist stance, the probability
increases by 29 (76) basis points for the firm to become a target, other things being equal. Such a
magnitude represents about 24−63 percent of the unconditional probability of targeting. Similarly,
a two-standard deviation increase in the measures for persuadability, namely, Past voting variation,
is associated with an increase of 53 basis points in the probability of targeting. The analogous
marginal effect of Conformity to proxy advisors is an increase of 32 basis points. Both effects are
economically large, indicating that activists are more motivated when there is greater room for
persuasion, directly toward shareholders or indirectly through the proxy advisors.
Columns (2) and (4) adopt an unordered multinomial logit model to explore how shareholder
stance and other covariates predict contests with different outcomes (voted, settled, and with-
drawn), relative to the base outcome of “non-events,” in an integrated estimation framework.
Several interesting findings emerge. First, while it is not surprising that contests that are ex post
withdrawn bear the weakest relation with shareholder pro-activist stance, it is intriguing that fund
stance is more strongly related to settled than voted contests. In other words, materialized contests
are more likely to settle, rather than proceed into the voting stage, when shareholders’ support is
stronger conditional on other event characteristics. This is consistent with Bebchuk et al. (2017)
who posit that management is more likely to engage the activists for a settlement when the latter
pose a more credible threat. In addition, since proxy solicitation is costly for both parties the
activists may consider settlements as an appealing outcome if they accomplish the same goals.
Second, when shareholders are more flexibly minded, contests are more likely to result in
voting rather than get settled or withdrawn. A materialized contest already represents a situation
36
in which the incumbent and activist disagree. As such, both sides should be motivated to engage
shareholders for their support if the shareholders are expected to exercise careful judgment based
on the evidence presented on the specific situation, which makes voting a more likely outcome.
Relatedly, contests are also more likely to proceed to the voting stage if shareholders are more
influenced by the proxy advisors, suggesting that leading proxy advisors occupy a unique position
shaping the proxy votes by mutual funds (Bubb and Catan (2018) and Bolton, Li, Ravina, and
Rosenthal (2018)).
Finally, the coefficients on q, stock return, and dividend yield, are largest in magnitude for
contests that are subsequently withdrawn. If one views ex post withdrawn contests as more likely
to be of “low quality” ex ante, then firm performance seems to be the most powerful factors to fend
off the relatively “frivolous” contests.
Results in Panel B, relating contests to investor stance based on the top 20% investors in each
firm-year, are qualitatively similar to those in Panel A. In other words, if activists select targets
based on the expected stance and persuadability of the largest shareholders, the outcomes are very
similar compared to the situation where the decision is made on a full shareholder base.
6 Conclusion
Using a comprehensive sample of proxy contests and mutual fund voting records from 2008
to 2015 we study what determines mutual funds’ voting patterns in contested meetings and how
investors’ voting and dissidents’ targeting decisions are jointly determined in equilibrium. Certain
firm level variables, such as Tobin’s q, or stock price performance, negatively predict funds’ support
for a dissident. We find that proxy advisory firms’ endorsement is an important predictor for votes
in favor of a dissident. More importantly, there is substantial variation in mutual funds voting.
Passively-managed funds are less likely to vote for a dissident, while higher abnormal returns of
same-industry firms in funds’ portfolios or lower basis-adjusted returns predict more support. Our
selection model reveals a positive correlation between the propensity for targeting by dissidents
and that of pro-dissident voting by investors, both based on the observables and unobservables.
This finding suggests that a relatively pro-activist shareholder base is an important criterion for
activists in picking their proxy contest targets.
37

References
Alexander, Cindy, Mark Chen, Duane Seppi, and Chester Spatt, 2010, Interim news and the role
of proxy voting advice, Review of Financial Studies 23, 4419-4454.
Anton, Miguel, Florian Ederer, Mireia Gine, and Martin Schmalz, 2016, Common ownership, com-
petition, and top management incentives, working paper, IESE Business School.
Appel, Iran R., Todd A. Gormley, and Donald B. Keim, 2017. Standing on the shoulders of giants:
The effect of passive investors on activism.
Ashraf, Rasha, Narayanan Jayaraman, and Harley E. Ryan, 2012, Do pension-related business ties
influence mutual fund proxy voting? Evidence from shareholder proposals on Executive compen-
sation, Journal of Financial and Quantitative Analysis 47(3), 567-588.
Azar, Jose, Martin C. Schmalz, and Isabel Tecu, 2017, Anti-competitive effects of common owner-
ship, forthcoming Journal of Finance.
Bebchuk, Lucian, Alon Brav, Wei Jiang, and Thomas Keusch, 2017, Dancing with activists, working
paper, Harvard University.
Bebchuk, Lucian, Alma Cohen, and Scott Hirst, 2017, The Agency Problems of Institutional In-
vestors, Journal of Economic Perspectives 31, 89-102.
Bolton, Patrick, Tao Li, Enrichetta Ravina, and Howard Rosenthal, 2018, Investor ideology, working
paper, Columbia University.
Brav, Alon, Wei Jiang, Frank Partnoy, and Randall Thomas, 2008, Hedge fund activism, corporate
governance, and firm performance, Journal of Finance 63(4), 1729-1775.
Brav, Alon, Wei Jiang, and Hyunseob Kim, 2015, The real effects of hedge fund activism: Produc-
tivity, asset allocation, and labor outcomes, Review of Financial Studies 28(10), 2723-2769.
Bubb, Ryan, and Emiliano Catan, 2018, The party structure of mutual funds, working paper, New
York University.
Butler, Alexander W. and Umit G. Gurun, 2012, Educational networks, mutual fund voting pat-
terns, and CEO compensation, Review of Financial Studies 25, 2533-2562.
38
Bodnaruk, Andriy and Marco Rossi, 2016, Dual ownership, returns, and voting in mergers, Journal
of Financial Economics 120, 58-80.
Cai, Jie, Jacqueline L. Garner, and Ralph A. Walkling, 2009, Electing directors, Journal of of
Finance 64(5), 2389-2421.
Choi, Stephen, Jill Fisch, and Marcel Kahan, 2013, Who calls the shots? How mutual funds vote
on director elections, Harvard Business Law Review 3, 35-81.
Choi, James J., David Laibson, and Brigitte C. Madrian, 2010, Why does the Law of One Price
fail? An experiment on index mutual funds Review of Financial Studies 23(4), 1405-1432.
Cunat, Vicente, Mireia Gine, and Maria Guadalupe, 2012. The vote is cast: The effect of corporate
governance on shareholder value, Journal of Finance 67, 1943-1977.
Cvijanovic, Dragana, Amil Dasgupta, and Konstantinos E. Zachariadis, 2016, Tie that bind: How
business connections affect mutual fund activism, Journal of Finance 71(6), 2933-2966.
Cvijanovic, Dragana, Moqi Gronen-Xu, and Konstantinos E. Zachariadis, 2017, Free-riders and
underdogs: Participation in corporate voting, workig paper, Kenan-Flagler Business School.
Davis, Gerard F. and E. Han Kim, 2007, Business ties and proxy voting by mutual funds, Journal
of Financial Economics 85, 552-570.
Dimmock, Stephen G., William C. Gerken, Zoran Ivkovic, and Scott J. Weisbener, 2016, Capital
gains lock-in and governance choices, working paper, Nanyang Technological University.
Duan, Ying and Yawen Jiao, 2016, The role of mutual funds in corporate governance: Evidence from
mutual funds’ proxy voting and trading behavior, Journal of Financial and Quantitative Analysis
51, 489-513.
Elton, Edwin J., Martin J. Gruber, and Jeffrey A. Busse, 2004, Are investors rational? Choices
among index funds, Journal of Finance 59(1), 261-288.
Eritmur, Yonca, Fabrizio Ferri, and David Oesch, 2013, Shareholder votes and proxy advisors:
Evidence from Say on Pay, Journal of Accounting Research 51(5), 951-996.
Fos, Vyacheslav and Wei Jiang, 2016, Out-of-the-money CEOs: Private control premium and option
exercises, Review of Financial Studies 29, 1549-1585.
39
Fos, Vyacheslav, 2017, The disciplinary effects of proxy contests, Management Science 63(3), 655-
671.
French, Eric and Christopher Taber, 2010, Identification of models of the labor market, Handbook
of Labor Economics 4a, Elsevier.
Gantchev, Nickolay, Oleg Gredil, and Pab Jotikasthira, 2016, Governance under the Gun: Spillover
effects of hedge fund activism, working paper, Southern Methodist University.
Gillan, Stuart and Laura Starks, 2007, The evolution of shareholder activism in the United States,
Journal of Applied Corporate Finance 19(1), 55-73.
Giroud, Xavier, and Holger M. Mueller, 2010, Does corporate governance matter in competitive
industries? Journal of Financial Economics 95, 312-331.
Harford, Jarrad, Dirk Jenter, and Kai Li, 2011, Institutional cross-holdings and their effect on
acquisition decisions, Journal of Financial Economics 99, 27-39.
Heckman, James J., 1979, Sample selection bias as a specification error, Econometrica 47(1), 153-
161.
He, Jie, Jiekun Huang, and Shan Zhao, 2017, Internalizing governance externalities: The role of
institutional cross-ownership, working paper, University of Illinois.
He, Ellen and Tao Li, 2017, The benefits of friendship in hedge fund activism, working paper,
University of Florida.
Iliev, Peter and Michelle Lowry, 2015, Are mutual funds active voters? Review of Financial Studies
28(2), 446-485.
Jamieson, Kevin and Robert Nowak, 2011, Active ranking using pairwise comparisons, Advances
in Neural Information Processing Systems 24, 2240-2248.
Kedia, Simi, Laura Starks, and Xianjue Wang, 2017, Institutional investors and hedge fund ac-
tivism, working paper, University of Texas at Austin.
Li, Tao, 2016, Outsourcing corporate governance: Conflicts of interest within the proxy advisory
industry, forthcoming Management Science.
40
Li, Sophia Zhengzi and Miriam Schwartz-Ziv, 2018, How are shareholder votes and trades related?
working paper, Rutgers Business school.
Lund, Dorothy Shapiro, 2018, The Case against passive shareholder voting, forthcoming Journal
of Corporation Law.
Malenko, Nadya and Yao Shen, 2016, The role of proxy advisory firms: Evidence from a regression-
discontinuity design, Review of Financial Studies 29(12), 3394-3427.
Marden, John I., 1995, Analyzing and modeling rank data, Chapman & Hall/CRC Monographs on
Statistics & Applied Probability.
Matvos, Gregor and Michael Ostrovsky, 2008, Cross-ownership, returns, and voting in mergers,
Journal of Financial Economics 89, 391-403.
Matvos, Gregor and Michael Ostrovsky, 2010, Heterogeneity and peer effects in mutual fund proxy
voting, Journal of Financial Economics 98, 90-112.
Morgan, Angela, Annette Poulsen, Jack Wolf, and Tian Yang, 2011, Mutual funds as monitors:
Evidence from mutual fund voting. Journal of Corporate Finance 17, 914-928.
O’Brien, Daniel P. and Steven C. Salop, 2000, Competitive effects of partial ownership: Financial
interest and corporate control, Antitrust Law Journal 67, 559-614.
Toonkel, Jessica and Soyoung Kim, 2013, Activist investors find allies in mutual, pension funds,
Reuters, April 9, 2013.
Van de Ven, Wynand P.M.M. and Bernard M.S. Van Praag, 1981, The demand for deductibles in
private health insurance: A probit model with sample selection, Journal of Econometrics 17(2),
229-252.
41
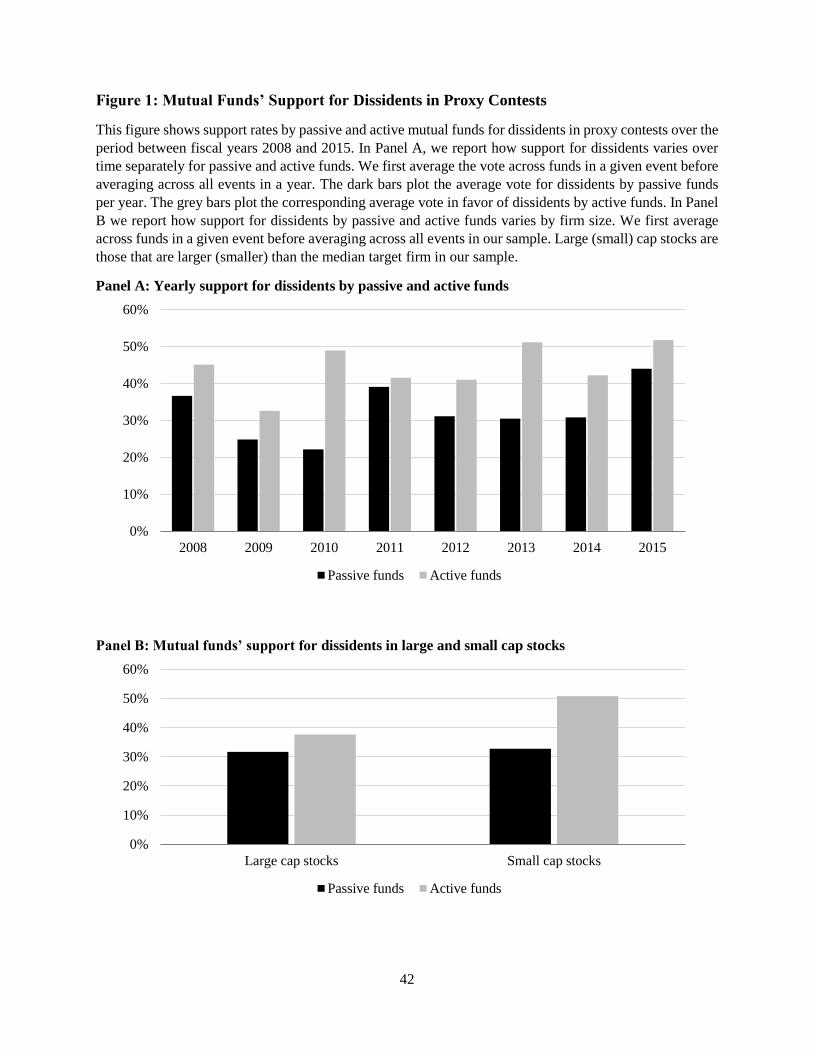
42
Figure 1: Mutual Funds’ Support for Dissidents in Proxy Contests
This figure shows support rates by passive and active mutual funds for dissidents in proxy contests over the
period between fiscal years 2008 and 2015. In Panel A, we report how support for dissidents varies over
time separately for passive and active funds. We first average the vote across funds in a given event before
averaging across all events in a year. The dark bars plot the average vote for dissidents by passive funds
per year. The grey bars plot the corresponding average vote in favor of dissidents by active funds. In Panel
B we report how support for dissidents by passive and active funds varies by firm size. We first average
across funds in a given event before averaging across all events in our sample. Large (small) cap stocks are
those that are larger (smaller) than the median target firm in our sample.
Panel A: Yearly support for dissidents by passive and active funds
Panel B: Mutual funds’ support for dissidents in large and small cap stocks
0%
10%
20%
30%
40%
50%
60%
2008 2009 2010 2011 2012 2013 2014 2015
Passive funds Active funds
0%
10%
20%
30%
40%
50%
60%
Large cap stocks Small cap stocks
Passive funds Active funds
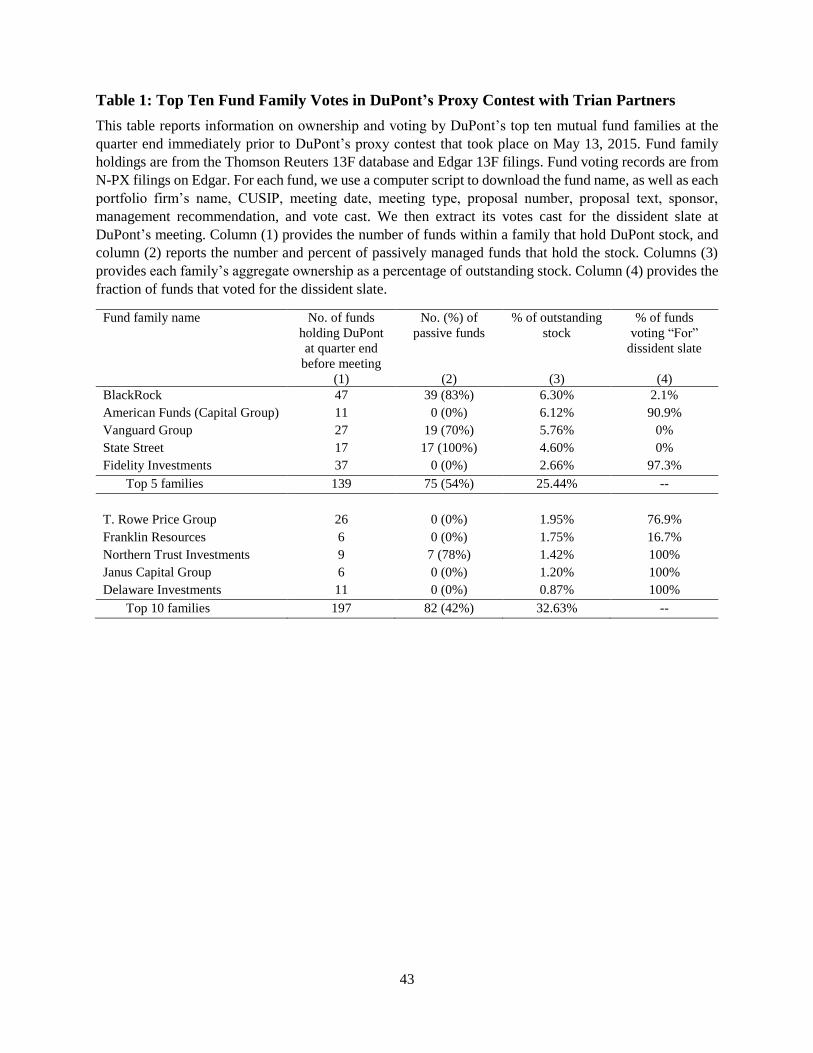
43
Table 1: Top Ten Fund Family Votes in DuPont’s Proxy Contest with Trian Partners
This table reports information on ownership and voting by DuPont’s top ten mutual fund families at the
quarter end immediately prior to DuPont’s proxy contest that took place on May 13, 2015. Fund family
holdings are from the Thomson Reuters 13F database and Edgar 13F filings. Fund voting records are from
N-PX filings on Edgar. For each fund, we use a computer script to download the fund name, as well as each
portfolio firm’s name, CUSIP, meeting date, meeting type, proposal number, proposal text, sponsor,
management recommendation, and vote cast. We then extract its votes cast for the dissident slate at
DuPont’s meeting. Column (1) provides the number of funds within a family that hold DuPont stock, and
column (2) reports the number and percent of passively managed funds that hold the stock. Columns (3)
provides each family’s aggregate ownership as a percentage of outstanding stock. Column (4) provides the
fraction of funds that voted for the dissident slate.
Fund family name No. of funds
holding DuPont
at quarter end
before meeting
No. (%) of
passive funds
% of outstanding
stock
% of funds
voting “For”
dissident slate
(1) (2) (3) (4)
BlackRock 47 39 (83%) 6.30% 2.1%
American Funds (Capital Group) 11 0 (0%) 6.12% 90.9%
Vanguard Group 27 19 (70%) 5.76% 0%
State Street 17 17 (100%) 4.60% 0%
Fidelity Investments 37 0 (0%) 2.66% 97.3%
Top 5 families 139 75 (54%) 25.44% --
T. Rowe Price Group 26 0 (0%) 1.95% 76.9%
Franklin Resources 6 0 (0%) 1.75% 16.7%
Northern Trust Investments 9 7 (78%) 1.42% 100%
Janus Capital Group 6 0 (0%) 1.20% 100%
Delaware Investments 11 0 (0%) 0.87% 100%
Top 10 families 197 82 (42%) 32.63% --
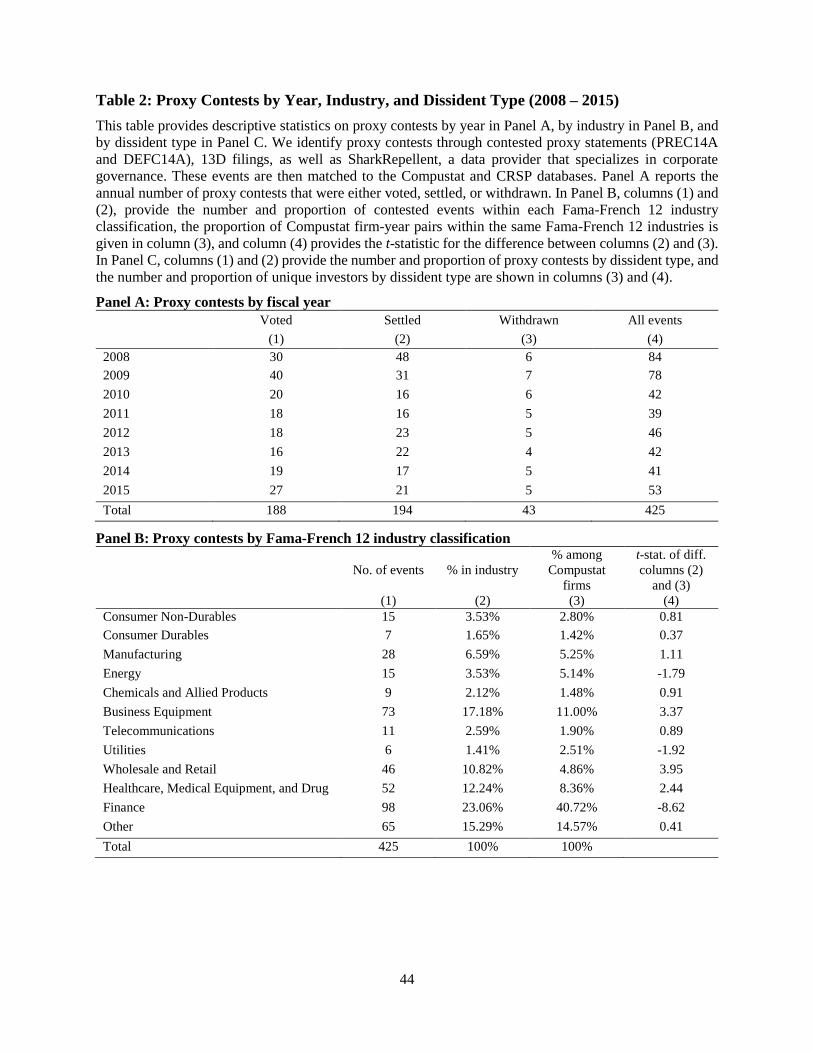
44
Table 2: Proxy Contests by Year, Industry, and Dissident Type (2008 – 2015)
This table provides descriptive statistics on proxy contests by year in Panel A, by industry in Panel B, and
by dissident type in Panel C. We identify proxy contests through contested proxy statements (PREC14A
and DEFC14A), 13D filings, as well as SharkRepellent, a data provider that specializes in corporate
governance. These events are then matched to the Compustat and CRSP databases. Panel A reports the
annual number of proxy contests that were either voted, settled, or withdrawn. In Panel B, columns (1) and
(2), provide the number and proportion of contested events within each Fama-French 12 industry
classification, the proportion of Compustat firm-year pairs within the same Fama-French 12 industries is
given in column (3), and column (4) provides the t-statistic for the difference between columns (2) and (3).
In Panel C, columns (1) and (2) provide the number and proportion of proxy contests by dissident type, and
the number and proportion of unique investors by dissident type are shown in columns (3) and (4).
Panel A: Proxy contests by fiscal year
Voted Settled Withdrawn All events
(1) (2) (3) (4)
2008 30 48 6 84
2009 40 31 7 78
2010 20 16 6 42
2011 18 16 5 39
2012 18 23 5 46
2013 16 22 4 42
2014 19 17 5 41
2015 27 21 5 53
Total 188 194 43 425
Panel B: Proxy contests by Fama-French 12 industry classification
No. of events % in industry
% among
Compustat
firms
t-stat. of diff.
columns (2)
and (3)
(1) (2) (3) (4)
Consumer Non-Durables 15 3.53% 2.80% 0.81
Consumer Durables 7 1.65% 1.42% 0.37
Manufacturing 28 6.59% 5.25% 1.11
Energy 15 3.53% 5.14% -1.79
Chemicals and Allied Products 9 2.12% 1.48% 0.91
Business Equipment 73 17.18% 11.00% 3.37
Telecommunications 11 2.59% 1.90% 0.89
Utilities 6 1.41% 2.51% -1.92
Wholesale and Retail 46 10.82% 4.86% 3.95
Healthcare, Medical Equipment, and Drug 52 12.24% 8.36% 2.44
Finance 98 23.06% 40.72% -8.62
Other 65 15.29% 14.57% 0.41
Total 425 100% 100%
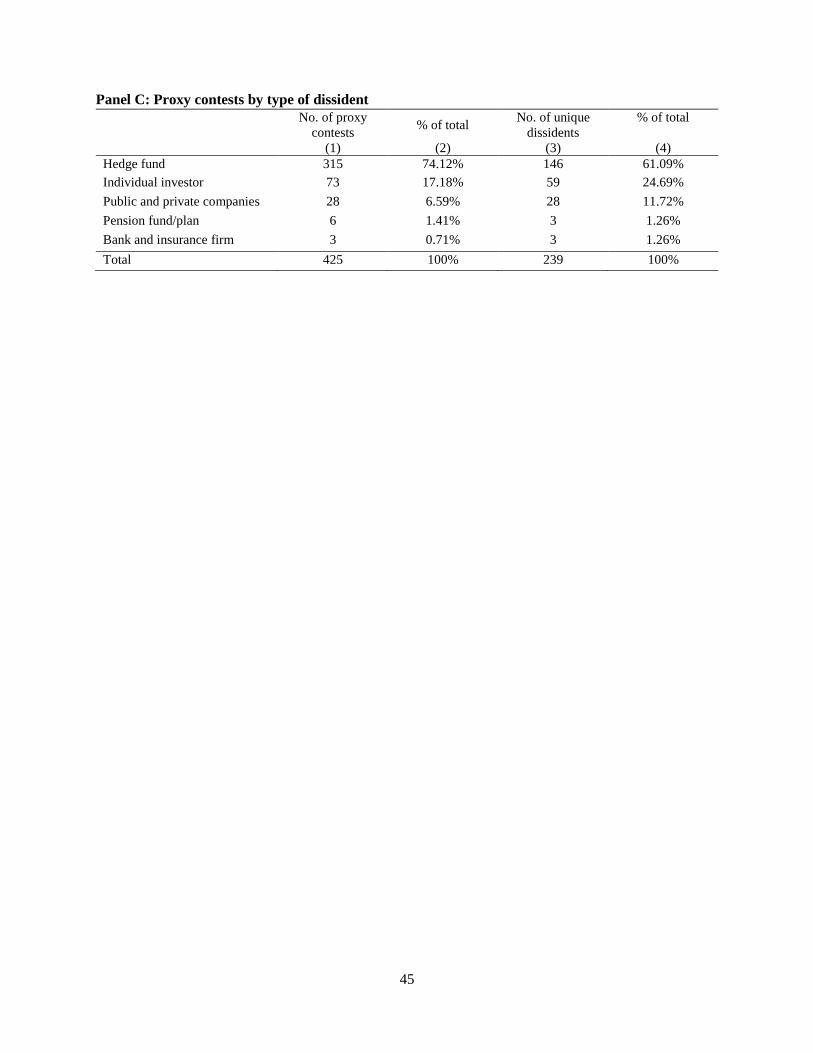
45
Panel C: Proxy contests by type of dissident
No. of proxy
contests % of total
No. of unique
dissidents
% of total
(1) (2) (3) (4)
Hedge fund 315 74.12% 146 61.09%
Individual investor 73 17.18% 59 24.69%
Public and private companies 28 6.59% 28 11.72%
Pension fund/plan 6 1.41% 3 1.26%
Bank and insurance firm 3 0.71% 3 1.26%
Total 425 100% 239 100%
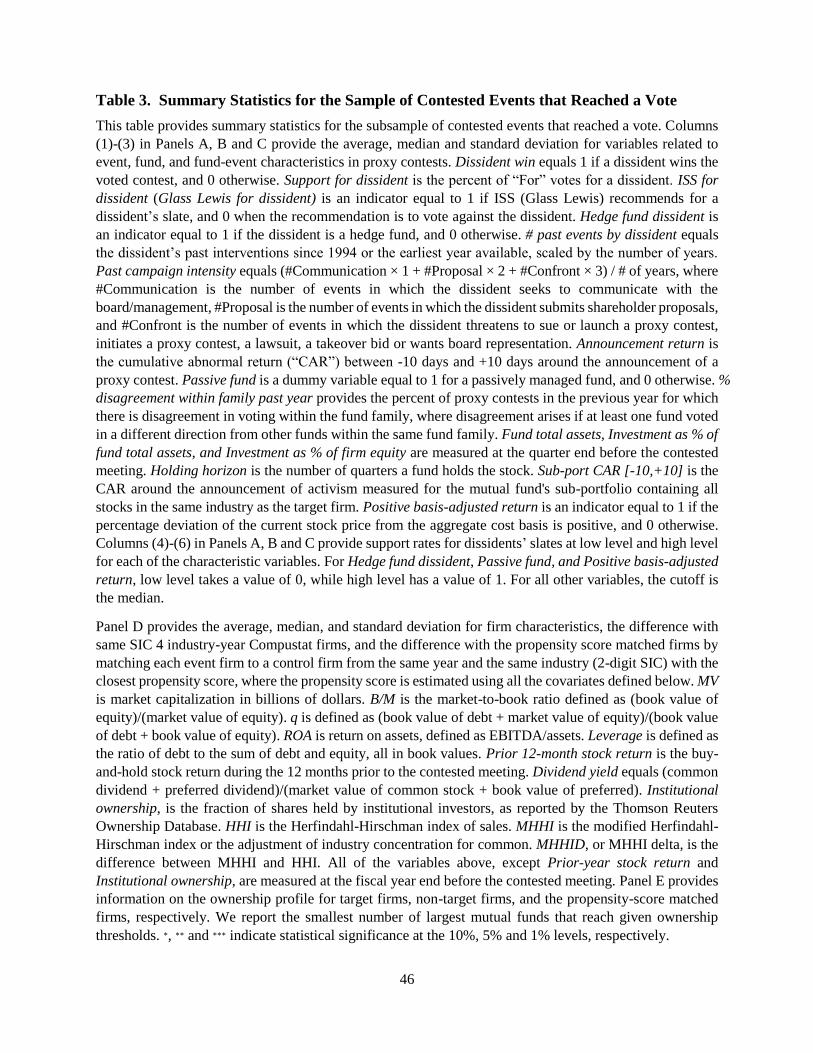
46
Table 3. Summary Statistics for the Sample of Contested Events that Reached a Vote
This table provides summary statistics for the subsample of contested events that reached a vote. Columns
(1)-(3) in Panels A, B and C provide the average, median and standard deviation for variables related to
event, fund, and fund-event characteristics in proxy contests. Dissident win equals 1 if a dissident wins the
voted contest, and 0 otherwise. Support for dissident is the percent of “For” votes for a dissident. ISS for
dissident (Glass Lewis for dissident) is an indicator equal to 1 if ISS (Glass Lewis) recommends for a
dissident’s slate, and 0 when the recommendation is to vote against the dissident. Hedge fund dissident is
an indicator equal to 1 if the dissident is a hedge fund, and 0 otherwise. # past events by dissident equals
the dissident’s past interventions since 1994 or the earliest year available, scaled by the number of years.
Past campaign intensity equals (#Communication × 1 + #Proposal × 2 + #Confront × 3) / # of years, where
#Communication is the number of events in which the dissident seeks to communicate with the
board/management, #Proposal is the number of events in which the dissident submits shareholder proposals,
and #Confront is the number of events in which the dissident threatens to sue or launch a proxy contest,
initiates a proxy contest, a lawsuit, a takeover bid or wants board representation. Announcement return is
the cumulative abnormal return (“CAR”) between -10 days and +10 days around the announcement of a
proxy contest. Passive fund is a dummy variable equal to 1 for a passively managed fund, and 0 otherwise. %
disagreement within family past year provides the percent of proxy contests in the previous year for which
there is disagreement in voting within the fund family, where disagreement arises if at least one fund voted
in a different direction from other funds within the same fund family. Fund total assets, Investment as % of
fund total assets, and Investment as % of firm equity are measured at the quarter end before the contested
meeting. Holding horizon is the number of quarters a fund holds the stock. Sub-port CAR [-10,+10] is the
CAR around the announcement of activism measured for the mutual fund's sub-portfolio containing all
stocks in the same industry as the target firm. Positive basis-adjusted return is an indicator equal to 1 if the
percentage deviation of the current stock price from the aggregate cost basis is positive, and 0 otherwise.
Columns (4)-(6) in Panels A, B and C provide support rates for dissidents’ slates at low level and high level
for each of the characteristic variables. For Hedge fund dissident, Passive fund, and Positive basis-adjusted
return, low level takes a value of 0, while high level has a value of 1. For all other variables, the cutoff is
the median.
Panel D provides the average, median, and standard deviation for firm characteristics, the difference with
same SIC 4 industry-year Compustat firms, and the difference with the propensity score matched firms by
matching each event firm to a control firm from the same year and the same industry (2-digit SIC) with the
closest propensity score, where the propensity score is estimated using all the covariates defined below. MV
is market capitalization in billions of dollars. B/M is the market-to-book ratio defined as (book value of
equity)/(market value of equity). q is defined as (book value of debt + market value of equity)/(book value
of debt + book value of equity). ROA is return on assets, defined as EBITDA/assets. Leverage is defined as
the ratio of debt to the sum of debt and equity, all in book values. Prior 12-month stock return is the buy-
and-hold stock return during the 12 months prior to the contested meeting. Dividend yield equals (common
dividend + preferred dividend)/(market value of common stock + book value of preferred). Institutional
ownership, is the fraction of shares held by institutional investors, as reported by the Thomson Reuters
Ownership Database. HHI is the Herfindahl-Hirschman index of sales. MHHI is the modified Herfindahl-
Hirschman index or the adjustment of industry concentration for common. MHHID, or MHHI delta, is the
difference between MHHI and HHI. All of the variables above, except Prior-year stock return and
Institutional ownership, are measured at the fiscal year end before the contested meeting. Panel E provides
information on the ownership profile for target firms, non-target firms, and the propensity-score matched
firms, respectively. We report the smallest number of largest mutual funds that reach given ownership
thresholds. ∗, ∗∗ and ∗∗∗ indicate statistical significance at the 10%, 5% and 1% levels, respectively.
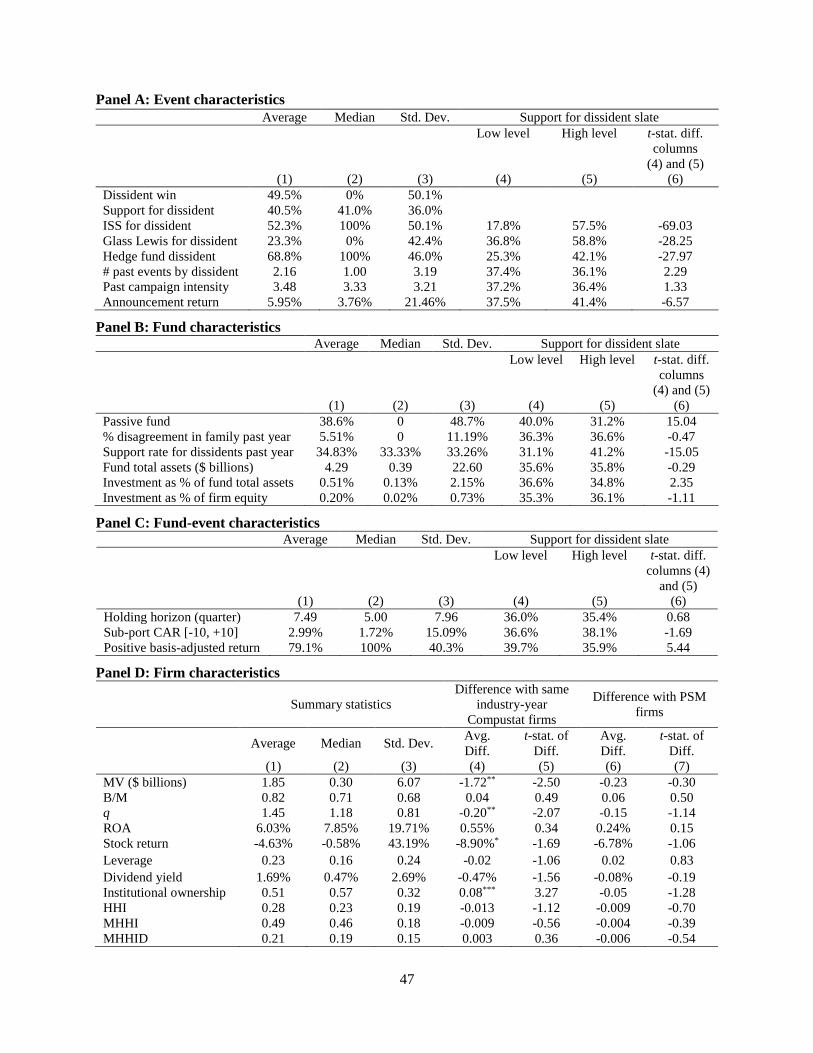
47
Panel A: Event characteristics
Average Median Std. Dev. Support for dissident slate
Low level High level t-stat. diff.
columns
(4) and (5)
(1) (2) (3) (4) (5) (6)
Dissident win 49.5% 0% 50.1%
Support for dissident 40.5% 41.0% 36.0%
ISS for dissident 52.3% 100% 50.1% 17.8% 57.5% -69.03
Glass Lewis for dissident 23.3% 0% 42.4% 36.8% 58.8% -28.25
Hedge fund dissident 68.8% 100% 46.0% 25.3% 42.1% -27.97
# past events by dissident 2.16 1.00 3.19 37.4% 36.1% 2.29
Past campaign intensity 3.48 3.33 3.21 37.2% 36.4% 1.33
Announcement return 5.95% 3.76% 21.46% 37.5% 41.4% -6.57
Panel B: Fund characteristics Average Median Std. Dev. Support for dissident slate
Low level High level t-stat. diff.
columns
(4) and (5)
(1) (2) (3) (4) (5) (6)
Passive fund 38.6% 0 48.7% 40.0% 31.2% 15.04
% disagreement in family past year 5.51% 0 11.19% 36.3% 36.6% -0.47
Support rate for dissidents past year 34.83% 33.33% 33.26% 31.1% 41.2% -15.05
Fund total assets ($ billions) 4.29 0.39 22.60 35.6% 35.8% -0.29
Investment as % of fund total assets 0.51% 0.13% 2.15% 36.6% 34.8% 2.35
Investment as % of firm equity 0.20% 0.02% 0.73% 35.3% 36.1% -1.11
Panel C: Fund-event characteristics Average Median Std. Dev. Support for dissident slate
Low level High level t-stat. diff.
columns (4)
and (5)
(1) (2) (3) (4) (5) (6)
Holding horizon (quarter) 7.49 5.00 7.96 36.0% 35.4% 0.68
Sub-port CAR [-10, +10] 2.99% 1.72% 15.09% 36.6% 38.1% -1.69
Positive basis-adjusted return 79.1% 100% 40.3% 39.7% 35.9% 5.44
Panel D: Firm characteristics
Summary statistics
Difference with same
industry-year
Compustat firms
Difference with PSM
firms
Average Median Std. Dev. Avg.
Diff.
t-stat. of
Diff.
Avg.
Diff.
t-stat. of
Diff.
(1) (2) (3) (4) (5) (6) (7)
MV ($ billions) 1.85 0.30 6.07 -1.72** -2.50 -0.23 -0.30
B/M 0.82 0.71 0.68 0.04 0.49 0.06 0.50
q 1.45 1.18 0.81 -0.20** -2.07 -0.15 -1.14
ROA 6.03% 7.85% 19.71% 0.55% 0.34 0.24% 0.15
Stock return -4.63% -0.58% 43.19% -8.90%* -1.69 -6.78% -1.06
Leverage 0.23 0.16 0.24 -0.02 -1.06 0.02 0.83
Dividend yield 1.69% 0.47% 2.69% -0.47% -1.56 -0.08% -0.19
Institutional ownership 0.51 0.57 0.32 0.08*** 3.27 -0.05 -1.28
HHI 0.28 0.23 0.19 -0.013 -1.12 -0.009 -0.70
MHHI 0.49 0.46 0.18 -0.009 -0.56 -0.004 -0.39
MHHID 0.21 0.19 0.15 0.003 0.36 -0.006 -0.54
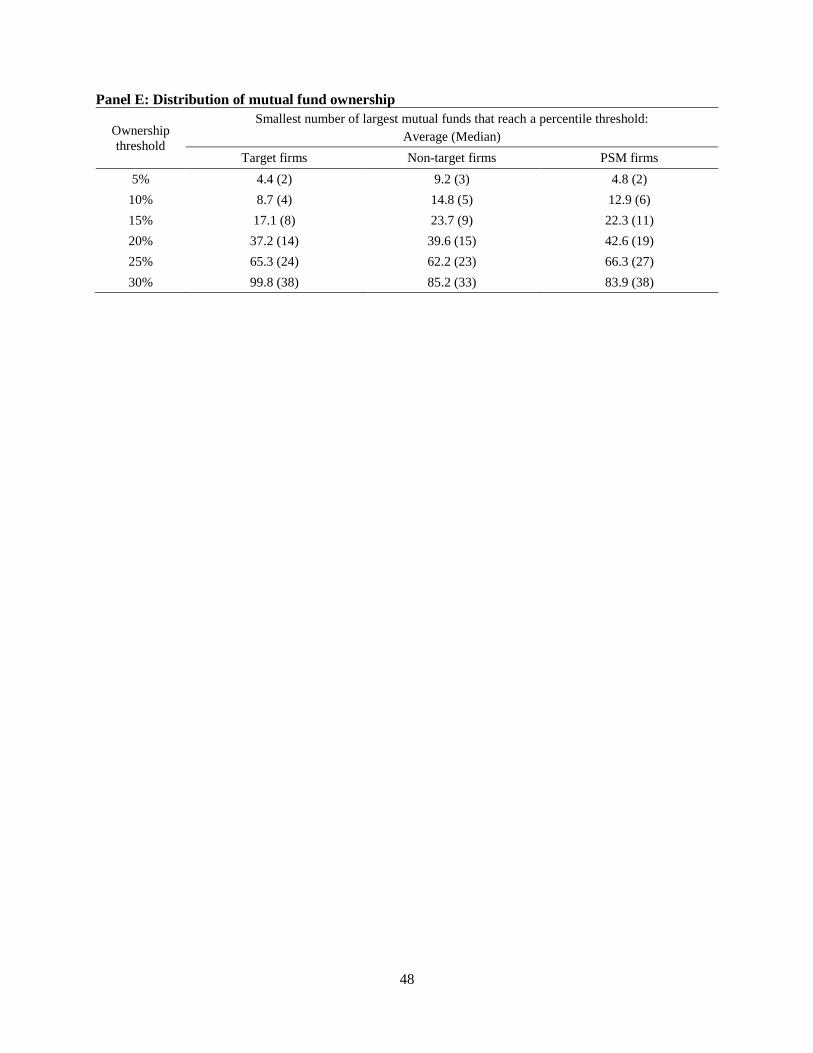
48
Panel E: Distribution of mutual fund ownership
Ownership
threshold
Smallest number of largest mutual funds that reach a percentile threshold:
Average (Median)
Target firms Non-target firms PSM firms
5% 4.4 (2) 9.2 (3) 4.8 (2)
10% 8.7 (4) 14.8 (5) 12.9 (6)
15% 17.1 (8) 23.7 (9) 22.3 (11)
20% 37.2 (14) 39.6 (15) 42.6 (19)
25% 65.3 (24) 62.2 (23) 66.3 (27)
30% 99.8 (38) 85.2 (33) 83.9 (38)
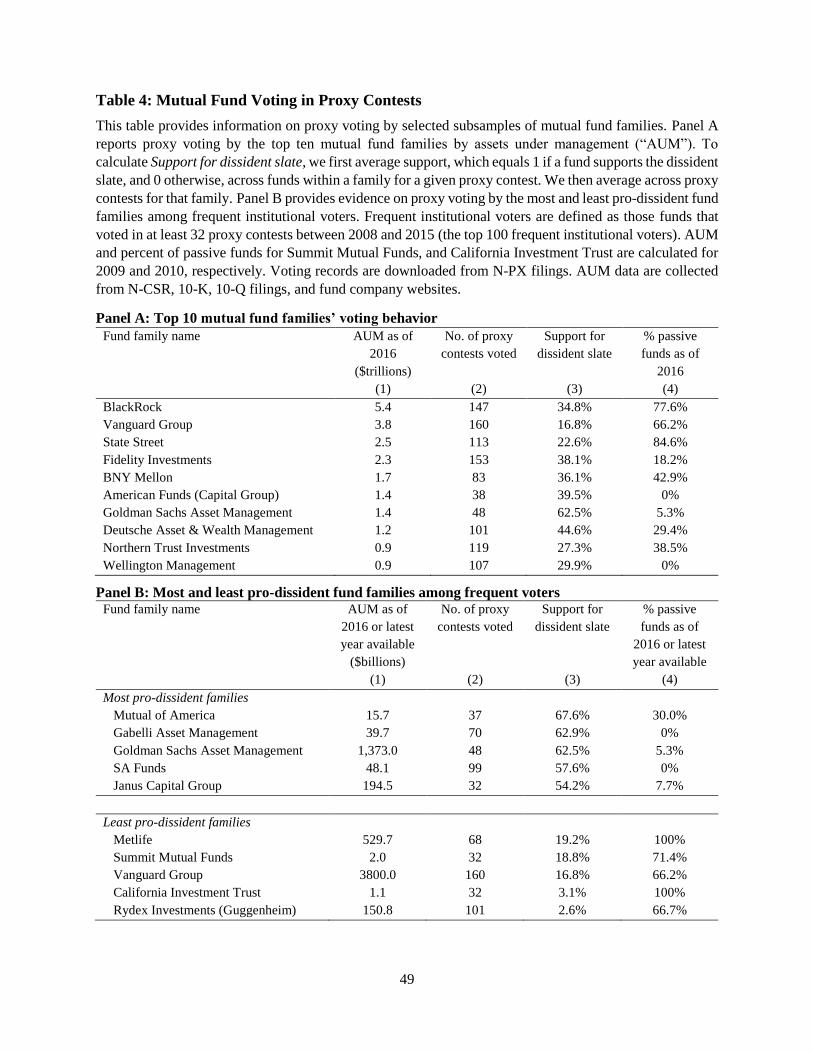
49
Table 4: Mutual Fund Voting in Proxy Contests
This table provides information on proxy voting by selected subsamples of mutual fund families. Panel A
reports proxy voting by the top ten mutual fund families by assets under management (“AUM”). To
calculate Support for dissident slate, we first average support, which equals 1 if a fund supports the dissident
slate, and 0 otherwise, across funds within a family for a given proxy contest. We then average across proxy
contests for that family. Panel B provides evidence on proxy voting by the most and least pro-dissident fund
families among frequent institutional voters. Frequent institutional voters are defined as those funds that
voted in at least 32 proxy contests between 2008 and 2015 (the top 100 frequent institutional voters). AUM
and percent of passive funds for Summit Mutual Funds, and California Investment Trust are calculated for
2009 and 2010, respectively. Voting records are downloaded from N-PX filings. AUM data are collected
from N-CSR, 10-K, 10-Q filings, and fund company websites.
Panel A: Top 10 mutual fund families’ voting behavior
Fund family name AUM as of
2016
($trillions)
No. of proxy
contests voted
Support for
dissident slate
% passive
funds as of
2016
(1) (2) (3) (4)
BlackRock 5.4 147 34.8% 77.6%
Vanguard Group 3.8 160 16.8% 66.2%
State Street 2.5 113 22.6% 84.6%
Fidelity Investments 2.3 153 38.1% 18.2%
BNY Mellon 1.7 83 36.1% 42.9%
American Funds (Capital Group) 1.4 38 39.5% 0%
Goldman Sachs Asset Management 1.4 48 62.5% 5.3%
Deutsche Asset & Wealth Management 1.2 101 44.6% 29.4%
Northern Trust Investments 0.9 119 27.3% 38.5%
Wellington Management 0.9 107 29.9% 0%
Panel B: Most and least pro-dissident fund families among frequent voters Fund family name AUM as of
2016 or latest
year available
($billions)
No. of proxy
contests voted
Support for
dissident slate
% passive
funds as of
2016 or latest
year available
(1) (2) (3) (4)
Most pro-dissident families
Mutual of America 15.7 37 67.6% 30.0%
Gabelli Asset Management 39.7 70 62.9% 0%
Goldman Sachs Asset Management 1,373.0 48 62.5% 5.3%
SA Funds 48.1 99 57.6% 0%
Janus Capital Group 194.5 32 54.2% 7.7%
Least pro-dissident families
Metlife 529.7 68 19.2% 100%
Summit Mutual Funds 2.0 32 18.8% 71.4%
Vanguard Group 3800.0 160 16.8% 66.2%
California Investment Trust 1.1 32 3.1% 100%
Rydex Investments (Guggenheim) 150.8 101 2.6% 66.7%
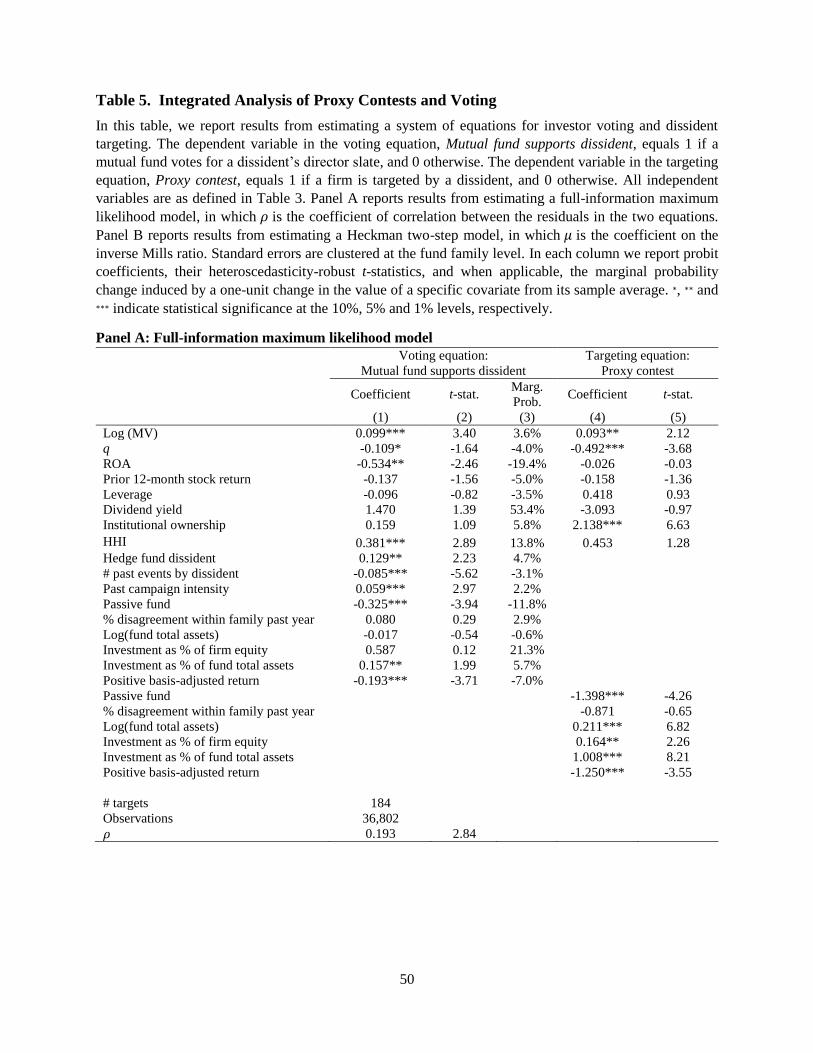
50
Table 5. Integrated Analysis of Proxy Contests and Voting
In this table, we report results from estimating a system of equations for investor voting and dissident
targeting. The dependent variable in the voting equation, Mutual fund supports dissident, equals 1 if a
mutual fund votes for a dissident’s director slate, and 0 otherwise. The dependent variable in the targeting
equation, Proxy contest, equals 1 if a firm is targeted by a dissident, and 0 otherwise. All independent
variables are as defined in Table 3. Panel A reports results from estimating a full-information maximum
likelihood model, in which 𝜌 is the coefficient of correlation between the residuals in the two equations.
Panel B reports results from estimating a Heckman two-step model, in which 𝜇 is the coefficient on the
inverse Mills ratio. Standard errors are clustered at the fund family level. In each column we report probit
coefficients, their heteroscedasticity-robust t-statistics, and when applicable, the marginal probability
change induced by a one-unit change in the value of a specific covariate from its sample average. ∗, ∗∗ and ∗∗∗ indicate statistical significance at the 10%, 5% and 1% levels, respectively.
Panel A: Full-information maximum likelihood model
Voting equation:
Mutual fund supports dissident
Targeting equation:
Proxy contest
Coefficient t-stat. Marg.
Prob. Coefficient t-stat.
(1) (2) (3) (4) (5)
Log (MV) 0.099*** 3.40 3.6% 0.093** 2.12
q -0.109* -1.64 -4.0% -0.492*** -3.68
ROA -0.534** -2.46 -19.4% -0.026 -0.03
Prior 12-month stock return -0.137 -1.56 -5.0% -0.158 -1.36
Leverage -0.096 -0.82 -3.5% 0.418 0.93
Dividend yield 1.470 1.39 53.4% -3.093 -0.97
Institutional ownership 0.159 1.09 5.8% 2.138*** 6.63
HHI 0.381*** 2.89 13.8% 0.453 1.28
Hedge fund dissident 0.129** 2.23 4.7%
# past events by dissident -0.085*** -5.62 -3.1%
Past campaign intensity 0.059*** 2.97 2.2%
Passive fund -0.325*** -3.94 -11.8%
% disagreement within family past year 0.080 0.29 2.9%
Log(fund total assets) -0.017 -0.54 -0.6%
Investment as % of firm equity 0.587 0.12 21.3%
Investment as % of fund total assets 0.157** 1.99 5.7%
Positive basis-adjusted return -0.193*** -3.71 -7.0%
Passive fund -1.398*** -4.26
% disagreement within family past year -0.871 -0.65
Log(fund total assets) 0.211*** 6.82
Investment as % of firm equity 0.164** 2.26
Investment as % of fund total assets 1.008*** 8.21
Positive basis-adjusted return -1.250*** -3.55
# targets 184
Observations 36,802
𝜌 0.193 2.84
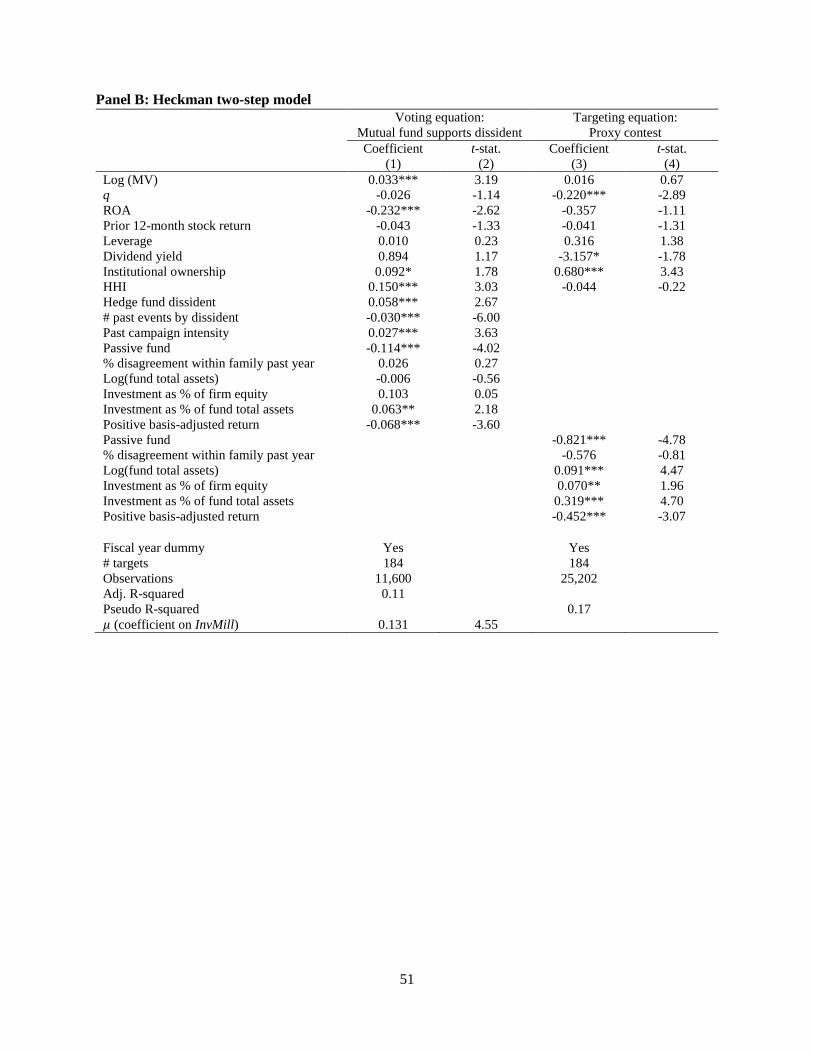
51
Panel B: Heckman two-step model
Voting equation:
Mutual fund supports dissident
Targeting equation:
Proxy contest
Coefficient t-stat. Coefficient t-stat.
(1) (2) (3) (4)
Log (MV) 0.033*** 3.19 0.016 0.67
q -0.026 -1.14 -0.220*** -2.89
ROA -0.232*** -2.62 -0.357 -1.11
Prior 12-month stock return -0.043 -1.33 -0.041 -1.31
Leverage 0.010 0.23 0.316 1.38
Dividend yield 0.894 1.17 -3.157* -1.78
Institutional ownership 0.092* 1.78 0.680*** 3.43
HHI 0.150*** 3.03 -0.044 -0.22
Hedge fund dissident 0.058*** 2.67
# past events by dissident -0.030*** -6.00
Past campaign intensity 0.027*** 3.63
Passive fund -0.114*** -4.02
% disagreement within family past year 0.026 0.27
Log(fund total assets) -0.006 -0.56
Investment as % of firm equity 0.103 0.05
Investment as % of fund total assets 0.063** 2.18
Positive basis-adjusted return -0.068*** -3.60
Passive fund -0.821*** -4.78
% disagreement within family past year -0.576 -0.81
Log(fund total assets) 0.091*** 4.47
Investment as % of firm equity 0.070** 1.96
Investment as % of fund total assets 0.319*** 4.70
Positive basis-adjusted return -0.452*** -3.07
Fiscal year dummy Yes Yes
# targets 184 184
Observations 11,600 25,202
Adj. R-squared 0.11
Pseudo R-squared 0.17
𝜇 (coefficient on InvMill) 0.131 4.55
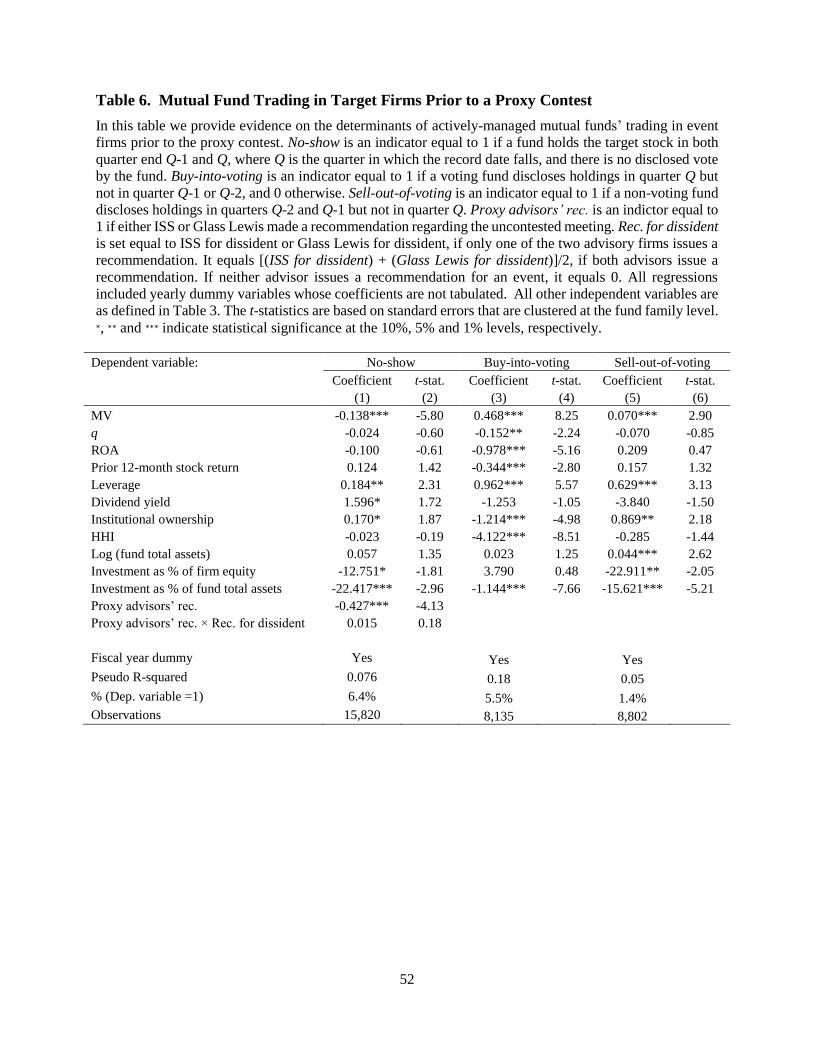
52
Table 6. Mutual Fund Trading in Target Firms Prior to a Proxy Contest
In this table we provide evidence on the determinants of actively-managed mutual funds’ trading in event
firms prior to the proxy contest. No-show is an indicator equal to 1 if a fund holds the target stock in both
quarter end Q-1 and Q, where Q is the quarter in which the record date falls, and there is no disclosed vote
by the fund. Buy-into-voting is an indicator equal to 1 if a voting fund discloses holdings in quarter Q but
not in quarter Q-1 or Q-2, and 0 otherwise. Sell-out-of-voting is an indicator equal to 1 if a non-voting fund
discloses holdings in quarters Q-2 and Q-1 but not in quarter Q. Proxy advisors’ rec. is an indictor equal to
1 if either ISS or Glass Lewis made a recommendation regarding the uncontested meeting. Rec. for dissident
is set equal to ISS for dissident or Glass Lewis for dissident, if only one of the two advisory firms issues a
recommendation. It equals [(ISS for dissident) + (Glass Lewis for dissident)]/2, if both advisors issue a
recommendation. If neither advisor issues a recommendation for an event, it equals 0. All regressions
included yearly dummy variables whose coefficients are not tabulated. All other independent variables are
as defined in Table 3. The t-statistics are based on standard errors that are clustered at the fund family level. ∗, ∗∗ and ∗∗∗ indicate statistical significance at the 10%, 5% and 1% levels, respectively.
Dependent variable: No-show Buy-into-voting Sell-out-of-voting
Coefficient t-stat. Coefficient t-stat. Coefficient t-stat.
(1) (2) (3) (4) (5) (6)
MV -0.138*** -5.80 0.468*** 8.25 0.070*** 2.90
q -0.024 -0.60 -0.152** -2.24 -0.070 -0.85
ROA -0.100 -0.61 -0.978*** -5.16 0.209 0.47
Prior 12-month stock return 0.124 1.42 -0.344*** -2.80 0.157 1.32
Leverage 0.184** 2.31 0.962*** 5.57 0.629*** 3.13
Dividend yield 1.596* 1.72 -1.253 -1.05 -3.840 -1.50
Institutional ownership 0.170* 1.87 -1.214*** -4.98 0.869** 2.18
HHI -0.023 -0.19 -4.122*** -8.51 -0.285 -1.44
Log (fund total assets) 0.057 1.35 0.023 1.25 0.044*** 2.62
Investment as % of firm equity -12.751* -1.81 3.790 0.48 -22.911** -2.05
Investment as % of fund total assets -22.417*** -2.96 -1.144*** -7.66 -15.621*** -5.21
Proxy advisors’ rec. -0.427*** -4.13
Proxy advisors’ rec. × Rec. for dissident 0.015 0.18
Fiscal year dummy Yes Yes Yes
Pseudo R-squared 0.076 0.18 0.05
% (Dep. variable =1) 6.4% 5.5% 1.4%
Observations 15,820 8,135 8,802
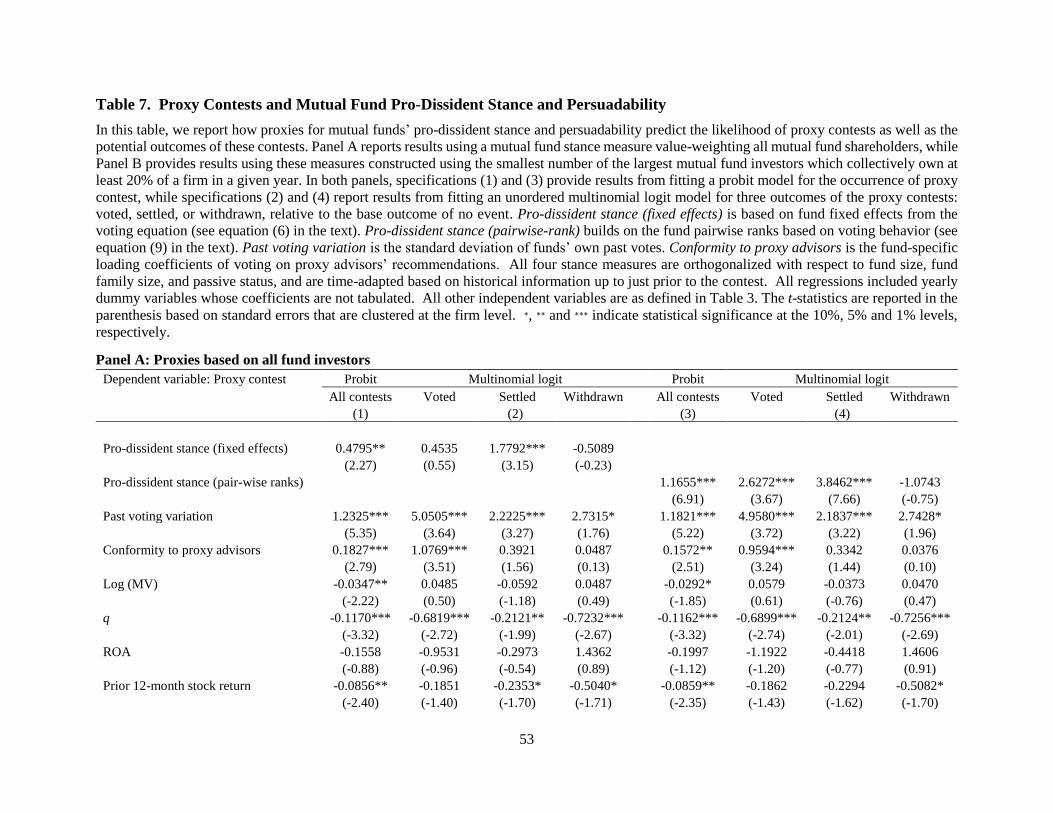
53
Table 7. Proxy Contests and Mutual Fund Pro-Dissident Stance and Persuadability
In this table, we report how proxies for mutual funds’ pro-dissident stance and persuadability predict the likelihood of proxy contests as well as the
potential outcomes of these contests. Panel A reports results using a mutual fund stance measure value-weighting all mutual fund shareholders, while
Panel B provides results using these measures constructed using the smallest number of the largest mutual fund investors which collectively own at
least 20% of a firm in a given year. In both panels, specifications (1) and (3) provide results from fitting a probit model for the occurrence of proxy
contest, while specifications (2) and (4) report results from fitting an unordered multinomial logit model for three outcomes of the proxy contests:
voted, settled, or withdrawn, relative to the base outcome of no event. Pro-dissident stance (fixed effects) is based on fund fixed effects from the
voting equation (see equation (6) in the text). Pro-dissident stance (pairwise-rank) builds on the fund pairwise ranks based on voting behavior (see
equation (9) in the text). Past voting variation is the standard deviation of funds’ own past votes. Conformity to proxy advisors is the fund-specific
loading coefficients of voting on proxy advisors’ recommendations. All four stance measures are orthogonalized with respect to fund size, fund
family size, and passive status, and are time-adapted based on historical information up to just prior to the contest. All regressions included yearly
dummy variables whose coefficients are not tabulated. All other independent variables are as defined in Table 3. The t-statistics are reported in the
parenthesis based on standard errors that are clustered at the firm level. ∗, ∗∗ and ∗∗∗ indicate statistical significance at the 10%, 5% and 1% levels,
respectively.
Panel A: Proxies based on all fund investors
Dependent variable: Proxy contest Probit Multinomial logit Probit Multinomial logit
All contests Voted Settled Withdrawn All contests Voted Settled Withdrawn
(1) (2) (3) (4)
Pro-dissident stance (fixed effects) 0.4795** 0.4535 1.7792*** -0.5089
(2.27) (0.55) (3.15) (-0.23)
Pro-dissident stance (pair-wise ranks) 1.1655*** 2.6272*** 3.8462*** -1.0743
(6.91) (3.67) (7.66) (-0.75)
Past voting variation 1.2325*** 5.0505*** 2.2225*** 2.7315* 1.1821*** 4.9580*** 2.1837*** 2.7428*
(5.35) (3.64) (3.27) (1.76) (5.22) (3.72) (3.22) (1.96)
Conformity to proxy advisors 0.1827*** 1.0769*** 0.3921 0.0487 0.1572** 0.9594*** 0.3342 0.0376
(2.79) (3.51) (1.56) (0.13) (2.51) (3.24) (1.44) (0.10)
Log (MV) -0.0347** 0.0485 -0.0592 0.0487 -0.0292* 0.0579 -0.0373 0.0470
(-2.22) (0.50) (-1.18) (0.49) (-1.85) (0.61) (-0.76) (0.47)
q -0.1170*** -0.6819*** -0.2121** -0.7232*** -0.1162*** -0.6899*** -0.2124** -0.7256***
(-3.32) (-2.72) (-1.99) (-2.67) (-3.32) (-2.74) (-2.01) (-2.69)
ROA -0.1558 -0.9531 -0.2973 1.4362 -0.1997 -1.1922 -0.4418 1.4606
(-0.88) (-0.96) (-0.54) (0.89) (-1.12) (-1.20) (-0.77) (0.91)
Prior 12-month stock return -0.0856** -0.1851 -0.2353* -0.5040* -0.0859** -0.1862 -0.2294 -0.5082*
(-2.40) (-1.40) (-1.70) (-1.71) (-2.35) (-1.43) (-1.62) (-1.70)
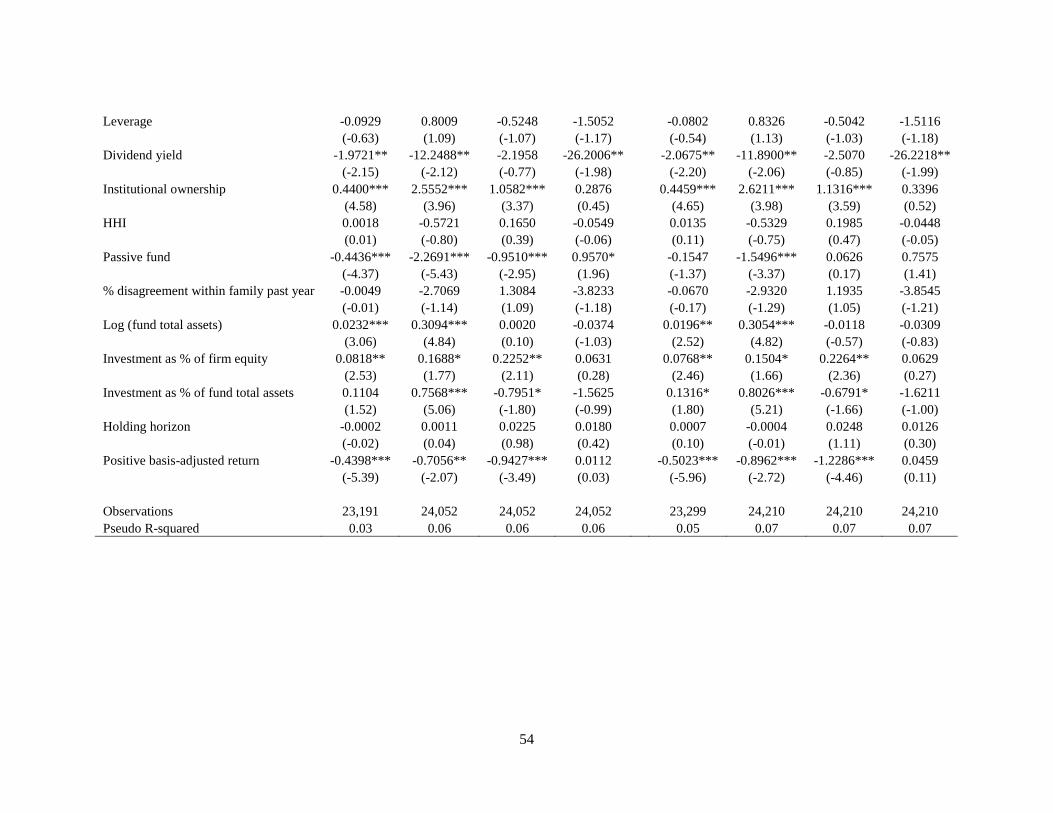
54
Leverage -0.0929 0.8009 -0.5248 -1.5052 -0.0802 0.8326 -0.5042 -1.5116
(-0.63) (1.09) (-1.07) (-1.17) (-0.54) (1.13) (-1.03) (-1.18)
Dividend yield -1.9721** -12.2488** -2.1958 -26.2006** -2.0675** -11.8900** -2.5070 -26.2218**
(-2.15) (-2.12) (-0.77) (-1.98) (-2.20) (-2.06) (-0.85) (-1.99)
Institutional ownership 0.4400*** 2.5552*** 1.0582*** 0.2876 0.4459*** 2.6211*** 1.1316*** 0.3396
(4.58) (3.96) (3.37) (0.45) (4.65) (3.98) (3.59) (0.52)
HHI 0.0018 -0.5721 0.1650 -0.0549 0.0135 -0.5329 0.1985 -0.0448
(0.01) (-0.80) (0.39) (-0.06) (0.11) (-0.75) (0.47) (-0.05)
Passive fund -0.4436*** -2.2691*** -0.9510*** 0.9570* -0.1547 -1.5496*** 0.0626 0.7575
(-4.37) (-5.43) (-2.95) (1.96) (-1.37) (-3.37) (0.17) (1.41)
% disagreement within family past year -0.0049 -2.7069 1.3084 -3.8233 -0.0670 -2.9320 1.1935 -3.8545
(-0.01) (-1.14) (1.09) (-1.18) (-0.17) (-1.29) (1.05) (-1.21)
Log (fund total assets) 0.0232*** 0.3094*** 0.0020 -0.0374 0.0196** 0.3054*** -0.0118 -0.0309
(3.06) (4.84) (0.10) (-1.03) (2.52) (4.82) (-0.57) (-0.83)
Investment as % of firm equity 0.0818** 0.1688* 0.2252** 0.0631 0.0768** 0.1504* 0.2264** 0.0629
(2.53) (1.77) (2.11) (0.28) (2.46) (1.66) (2.36) (0.27)
Investment as % of fund total assets 0.1104 0.7568*** -0.7951* -1.5625 0.1316* 0.8026*** -0.6791* -1.6211
(1.52) (5.06) (-1.80) (-0.99) (1.80) (5.21) (-1.66) (-1.00)
Holding horizon -0.0002 0.0011 0.0225 0.0180 0.0007 -0.0004 0.0248 0.0126
(-0.02) (0.04) (0.98) (0.42) (0.10) (-0.01) (1.11) (0.30)
Positive basis-adjusted return -0.4398*** -0.7056** -0.9427*** 0.0112 -0.5023*** -0.8962*** -1.2286*** 0.0459
(-5.39) (-2.07) (-3.49) (0.03) (-5.96) (-2.72) (-4.46) (0.11)
Observations 23,191 24,052 24,052 24,052 23,299 24,210 24,210 24,210
Pseudo R-squared 0.03 0.06 0.06 0.06 0.05 0.07 0.07 0.07

55
Panel B: Proxies based on the top 20% fund investors
Dependent variable: Proxy contest Probit Multinomial logit Probit Multinomial logit
All contests Voted Settled Withdrawn All contests Voted Settled Withdrawn
(1) (2) (3) (4)
Pro-dissident stance (fixed effects) 0.5180*** 1.1986 1.6037*** -0.0308
(2.74) (1.34) (3.35) (-0.02)
Pro-dissident stance (pair-wise ranks) 0.9812*** 1.1908* 3.2032*** 0.3496
(6.12) (1.80) (6.87) (0.21)
Past voting variation 0.8687*** 2.6049** 2.2099*** 1.2134 0.7998*** 2.4431** 2.0048*** 1.1503
(3.87) (2.23) (3.25) (0.84) (3.67) (2.09) (3.10) (0.80)
Conformity to proxy advisors 0.1573** 1.1819*** 0.1763 0.0881 0.1513** 1.1650*** 0.1732 0.0700
(2.40) (4.62) (0.82) (0.25) (2.51) (4.72) (0.93) (0.21)
Log (MV) -0.0332** 0.0558 -0.0727 0.0254 -0.0296* 0.0613 -0.0646 0.0265
(-2.07) (0.64) (-1.34) (0.23) (-1.84) (0.71) (-1.22) (0.24)
q -0.1172*** -0.7834*** -0.2278* -0.7758** -0.1192*** -0.7723*** -0.2277** -0.7759**
(-3.21) (-2.90) (-1.95) (-2.35) (-3.31) (-2.97) (-1.99) (-2.37)
ROA -0.2681 -1.1645 -0.5148 0.7336 -0.3048* -1.2666 -0.6121 0.7299
(-1.51) (-1.04) (-0.87) (0.44) (-1.70) (-1.13) (-1.01) (0.44)
Prior 12-month stock return -0.0792** -0.1728 -0.1542 -0.6749** -0.0792** -0.1709 -0.1459 -0.6765**
(-2.24) (-1.57) (-1.60) (-2.30) (-2.21) (-1.57) (-1.52) (-2.31)
Leverage -0.0476 0.9022 -0.4178 -1.5223 -0.0414 0.9070 -0.3949 -1.5104
(-0.32) (1.23) (-0.83) (-1.12) (-0.27) (1.24) (-0.78) (-1.11)
Dividend yield -1.9657** -11.2257** -1.9218 -24.1390* -2.0225** -11.1132* -2.1889 -24.1982*
(-2.09) (-1.96) (-0.64) (-1.69) (-2.12) (-1.93) (-0.71) (-1.70)
Institutional ownership 0.4064*** 2.3590*** 0.9959*** 0.5066 0.4014*** 2.3684*** 1.0024*** 0.5030
(4.15) (3.55) (2.93) (0.83) (4.13) (3.55) (3.00) (0.82)
HHI -0.0002 -0.4813 0.0834 -0.0721 -0.0006 -0.4960 0.0778 -0.0678
(-0.00) (-0.70) (0.21) (-0.08) (-0.01) (-0.71) (0.19) (-0.07)
Passive fund -0.4972*** -2.3967*** -1.2419*** 0.6925 -0.2909** -2.2423*** -0.4704 0.7905
(-4.57) (-4.61) (-3.56) (1.23) (-2.48) (-4.22) (-1.26) (1.24)
% disagreement within family past year 0.1950 -1.9458 2.1815* -4.3250 0.0942 -1.8543 1.8375* -4.3483
(0.45) (-0.88) (1.85) (-1.05) (0.22) (-0.85) (1.65) (-1.05)
Log (fund total assets) 0.0239*** 0.3306*** 0.0279 -0.0381 0.0211*** 0.3277*** 0.0165 -0.0394
(2.97) (4.76) (1.17) (-0.81) (2.60) (4.74) (0.68) (-0.87)
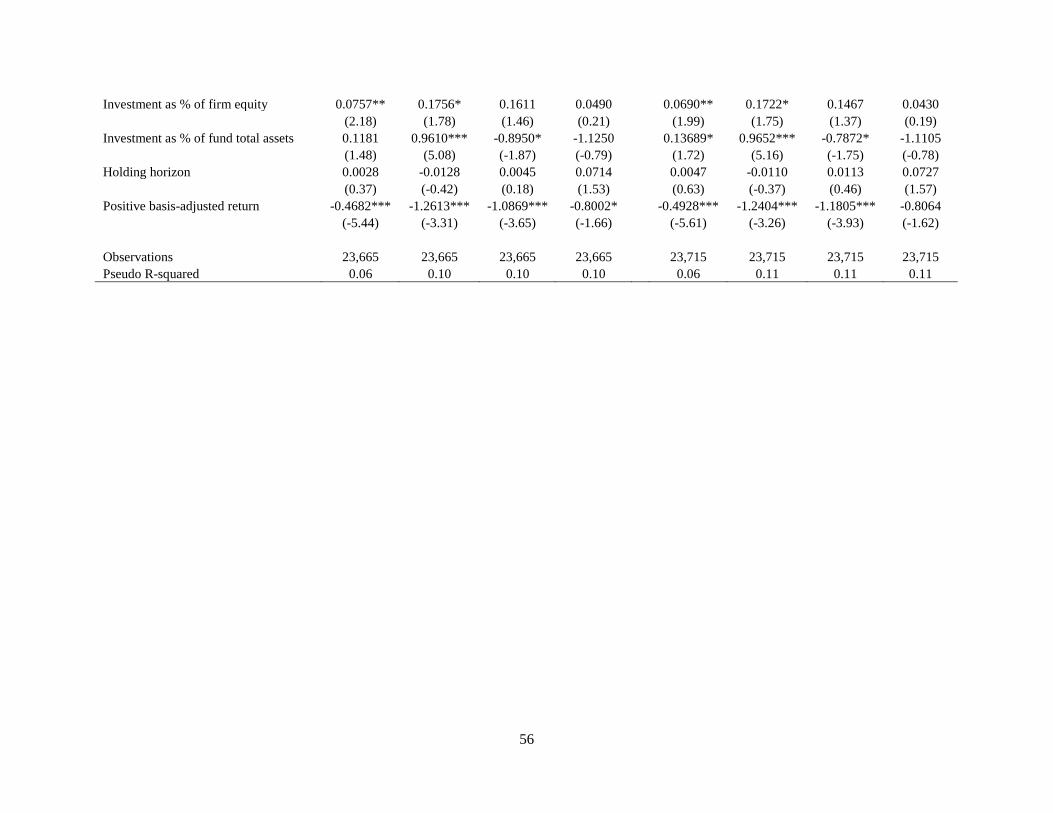
56
Investment as % of firm equity 0.0757** 0.1756* 0.1611 0.0490 0.0690** 0.1722* 0.1467 0.0430
(2.18) (1.78) (1.46) (0.21) (1.99) (1.75) (1.37) (0.19)
Investment as % of fund total assets 0.1181 0.9610*** -0.8950* -1.1250 0.13689* 0.9652*** -0.7872* -1.1105
(1.48) (5.08) (-1.87) (-0.79) (1.72) (5.16) (-1.75) (-0.78)
Holding horizon 0.0028 -0.0128 0.0045 0.0714 0.0047 -0.0110 0.0113 0.0727
(0.37) (-0.42) (0.18) (1.53) (0.63) (-0.37) (0.46) (1.57)
Positive basis-adjusted return -0.4682*** -1.2613*** -1.0869*** -0.8002* -0.4928*** -1.2404*** -1.1805*** -0.8064
(-5.44) (-3.31) (-3.65) (-1.66) (-5.61) (-3.26) (-3.93) (-1.62)
Observations 23,665 23,665 23,665 23,665 23,715 23,715 23,715 23,715
Pseudo R-squared 0.06 0.10 0.10 0.10 0.06 0.11 0.11 0.11

1
Appendix for
Picking Friends Before Picking (Proxy) Fights:
How Mutual Fund Voting Shapes Proxy Contests
Alon Brav Wei Jiang Tao Li
June 2018

2
Appendix A1. Sample Voting Records
This appendix provides samples from four N-PX files for funds submitting their voting records in the
DuPont May/13/2015 proxy fight.
Sample N-PX #1: Voting by the Vanguard Institutional Total Stock Market Index Fund submitted in the
annual report of proxy voting record by the Vanguard Institutional Index Funds. Available at:
https://www.sec.gov/Archives/edgar/data/862084/000093247115007129/institutionalindexfunds0870.htm
ISSUER: E. I. du Pont de Nemours and Company TICKER: DD CUSIP: 263534109
MEETING DATE: 5/13/2015
PROPOSAL: PROPOSED BY VOTED? VOTE
CAST
FOR
/AGAINST
MGMT
PROPOSAL #1.1: ELECT DIRECTOR LAMBERTO ANDREOTTI ISSUER YES FOR FOR PROPOSAL #1.2: ELECT DIRECTOR EDWARD D. BREEN ISSUER YES FOR FOR
PROPOSAL #1.3: ELECT DIRECTOR ROBERT A. BROWN ISSUER YES FOR FOR
PROPOSAL #1.4: ELECT DIRECTOR ALEXANDER M. CUTLER ISSUER YES FOR FOR
PROPOSAL #1.5: ELECT DIRECTOR ELEUTHERE I. DU PONT ISSUER YES FOR FOR
PROPOSAL #1.6: ELECT DIRECTOR JAMES L. GALLOGLY ISSUER YES FOR FOR
PROPOSAL #1.7: ELECT DIRECTOR MARILLYN A. HEWSON ISSUER YES FOR FOR
PROPOSAL #1.8: ELECT DIRECTOR LOIS D. JULIBER ISSUER YES FOR FOR
PROPOSAL #1.9: ELECT DIRECTOR ELLEN J. KULLMAN ISSUER YES FOR FOR
PROPOSAL #1.10: ELECT DIRECTOR ULF M. SCHNEIDER ISSUER YES FOR FOR
PROPOSAL #1.11: ELECT DIRECTOR LEE M. THOMAS ISSUER YES FOR FOR
PROPOSAL #1.12: ELECT DIRECTOR PATRICK J. WARD ISSUER YES FOR FOR
PROPOSAL #2: RATIFY AUDITORS ISSUER YES FOR FOR
PROPOSAL #3: ADVISORY VOTE TO RATIFY NAMED EXECUTIVE
OFFICERS' COMPENSATION ISSUER YES FOR FOR
PROPOSAL #4: REPORT ON LOBBYING PAYMENTS AND POLICY SHAREHOLDER YES AGAINST FOR PROPOSAL #5: REPORT ON HERBICIDE USE ON GMO CROPS SHAREHOLDER YES AGAINST FOR
PROPOSAL #6: ESTABLISH COMMITTEE ON PLANT CLOSURES SHAREHOLDER YES AGAINST FOR
PROPOSAL #7: REPEAL AMENDMENTS TO THE COMPANY'S BYLAWS ADOPTED WITHOUT STOCKHOLDER APPROVAL AFTER
AUGUST 12, 2013
SHAREHOLDER YES AGAINST FOR
PROPOSAL #1.1: ELECT DIRECTOR NELSON PELTZ ISSUER NO N/A N/A
PROPOSAL #1.2: ELECT DIRECTOR JOHN H. MYERS ISSUER NO N/A N/A
PROPOSAL #1.3: ELECT DIRECTOR ARTHUR B. WINKLEBLACK ISSUER NO N/A N/A
PROPOSAL #1.4: ELECT DIRECTOR ROBERT J. ZATTA ISSUER NO N/A N/A
PROPOSAL #1.5: MANAGEMENT NOMINEE – LAMBERTO
ANDREOTTI ISSUER NO N/A N/A
PROPOSAL #1.6: MANAGEMENT NOMINEE - EDWARD D. BREEN ISSUER NO N/A N/A
PROPOSAL #1.7: MANAGEMENT NOMINEE - ELEUTHERE I. DU
PONT ISSUER NO N/A N/A
PROPOSAL #1.8: MANAGEMENT NOMINEE - JAMES L. GALLOGLY ISSUER NO N/A N/A
PROPOSAL #1.9: MANAGEMENT NOMINEE - MARILLYN A.
HEWSON ISSUER NO N/A N/A
PROPOSAL #1.10: MANAGEMENT NOMINEE - ELLEN J. KULLMAN ISSUER NO N/A N/A
PROPOSAL #1.11: MANAGEMENT NOMINEE - ULF M. SCHNEIDER ISSUER NO N/A N/A
PROPOSAL #1.12: MANAGEMENT NOMINEE - PATRICK J. WARD ISSUER NO N/A N/A
PROPOSAL #2: RATIFY AUDITORS ISSUER NO N/A N/A
PROPOSAL #3: ADVISORY VOTE TO RATIFY NAMED EXECUTIVE
OFFICERS' COMPENSATION ISSUER NO N/A N/A
PROPOSAL #4: REPORT ON LOBBYING PAYMENTS AND POLICY SHAREHOLDER NO N/A N/A
PROPOSAL #5: REPORT ON HERBICIDE USE ON GMO CROPS SHAREHOLDER NO N/A N/A
PROPOSAL #6: ESTABLISH COMMITTEE ON PLANT CLOSURES SHAREHOLDER NO N/A N/A
PROPOSAL #7: REPEAL AMENDMENTS TO THE COMPANY'S
BYLAWS ADOPTED WITHOUT STOCKHOLDER APPROVAL AFTER AUGUST 12, 2013
SHAREHOLDER NO N/A N/A
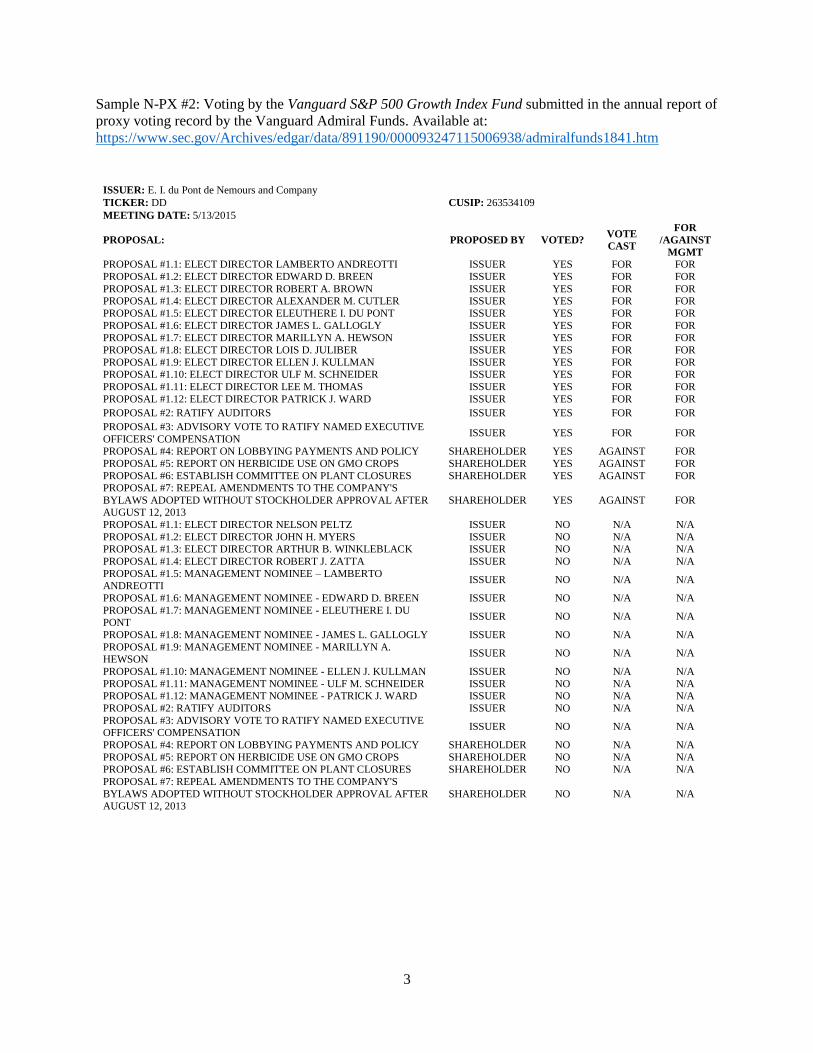
3
Sample N-PX #2: Voting by the Vanguard S&P 500 Growth Index Fund submitted in the annual report of
proxy voting record by the Vanguard Admiral Funds. Available at:
https://www.sec.gov/Archives/edgar/data/891190/000093247115006938/admiralfunds1841.htm
ISSUER: E. I. du Pont de Nemours and Company
TICKER: DD CUSIP: 263534109
MEETING DATE: 5/13/2015
PROPOSAL: PROPOSED BY VOTED? VOTE
CAST
FOR
/AGAINST
MGMT
PROPOSAL #1.1: ELECT DIRECTOR LAMBERTO ANDREOTTI ISSUER YES FOR FOR
PROPOSAL #1.2: ELECT DIRECTOR EDWARD D. BREEN ISSUER YES FOR FOR
PROPOSAL #1.3: ELECT DIRECTOR ROBERT A. BROWN ISSUER YES FOR FOR
PROPOSAL #1.4: ELECT DIRECTOR ALEXANDER M. CUTLER ISSUER YES FOR FOR
PROPOSAL #1.5: ELECT DIRECTOR ELEUTHERE I. DU PONT ISSUER YES FOR FOR
PROPOSAL #1.6: ELECT DIRECTOR JAMES L. GALLOGLY ISSUER YES FOR FOR
PROPOSAL #1.7: ELECT DIRECTOR MARILLYN A. HEWSON ISSUER YES FOR FOR
PROPOSAL #1.8: ELECT DIRECTOR LOIS D. JULIBER ISSUER YES FOR FOR
PROPOSAL #1.9: ELECT DIRECTOR ELLEN J. KULLMAN ISSUER YES FOR FOR
PROPOSAL #1.10: ELECT DIRECTOR ULF M. SCHNEIDER ISSUER YES FOR FOR
PROPOSAL #1.11: ELECT DIRECTOR LEE M. THOMAS ISSUER YES FOR FOR
PROPOSAL #1.12: ELECT DIRECTOR PATRICK J. WARD ISSUER YES FOR FOR
PROPOSAL #2: RATIFY AUDITORS ISSUER YES FOR FOR
PROPOSAL #3: ADVISORY VOTE TO RATIFY NAMED EXECUTIVE
OFFICERS' COMPENSATION ISSUER YES FOR FOR
PROPOSAL #4: REPORT ON LOBBYING PAYMENTS AND POLICY SHAREHOLDER YES AGAINST FOR
PROPOSAL #5: REPORT ON HERBICIDE USE ON GMO CROPS SHAREHOLDER YES AGAINST FOR
PROPOSAL #6: ESTABLISH COMMITTEE ON PLANT CLOSURES SHAREHOLDER YES AGAINST FOR PROPOSAL #7: REPEAL AMENDMENTS TO THE COMPANY'S
BYLAWS ADOPTED WITHOUT STOCKHOLDER APPROVAL AFTER AUGUST 12, 2013
SHAREHOLDER YES AGAINST FOR
PROPOSAL #1.1: ELECT DIRECTOR NELSON PELTZ ISSUER NO N/A N/A
PROPOSAL #1.2: ELECT DIRECTOR JOHN H. MYERS ISSUER NO N/A N/A
PROPOSAL #1.3: ELECT DIRECTOR ARTHUR B. WINKLEBLACK ISSUER NO N/A N/A
PROPOSAL #1.4: ELECT DIRECTOR ROBERT J. ZATTA ISSUER NO N/A N/A
PROPOSAL #1.5: MANAGEMENT NOMINEE – LAMBERTO ANDREOTTI
ISSUER NO N/A N/A
PROPOSAL #1.6: MANAGEMENT NOMINEE - EDWARD D. BREEN ISSUER NO N/A N/A
PROPOSAL #1.7: MANAGEMENT NOMINEE - ELEUTHERE I. DU PONT
ISSUER NO N/A N/A
PROPOSAL #1.8: MANAGEMENT NOMINEE - JAMES L. GALLOGLY ISSUER NO N/A N/A
PROPOSAL #1.9: MANAGEMENT NOMINEE - MARILLYN A. HEWSON
ISSUER NO N/A N/A
PROPOSAL #1.10: MANAGEMENT NOMINEE - ELLEN J. KULLMAN ISSUER NO N/A N/A
PROPOSAL #1.11: MANAGEMENT NOMINEE - ULF M. SCHNEIDER ISSUER NO N/A N/A
PROPOSAL #1.12: MANAGEMENT NOMINEE - PATRICK J. WARD ISSUER NO N/A N/A
PROPOSAL #2: RATIFY AUDITORS ISSUER NO N/A N/A
PROPOSAL #3: ADVISORY VOTE TO RATIFY NAMED EXECUTIVE OFFICERS' COMPENSATION
ISSUER NO N/A N/A
PROPOSAL #4: REPORT ON LOBBYING PAYMENTS AND POLICY SHAREHOLDER NO N/A N/A
PROPOSAL #5: REPORT ON HERBICIDE USE ON GMO CROPS SHAREHOLDER NO N/A N/A
PROPOSAL #6: ESTABLISH COMMITTEE ON PLANT CLOSURES SHAREHOLDER NO N/A N/A
PROPOSAL #7: REPEAL AMENDMENTS TO THE COMPANY'S
BYLAWS ADOPTED WITHOUT STOCKHOLDER APPROVAL AFTER AUGUST 12, 2013
SHAREHOLDER NO N/A N/A
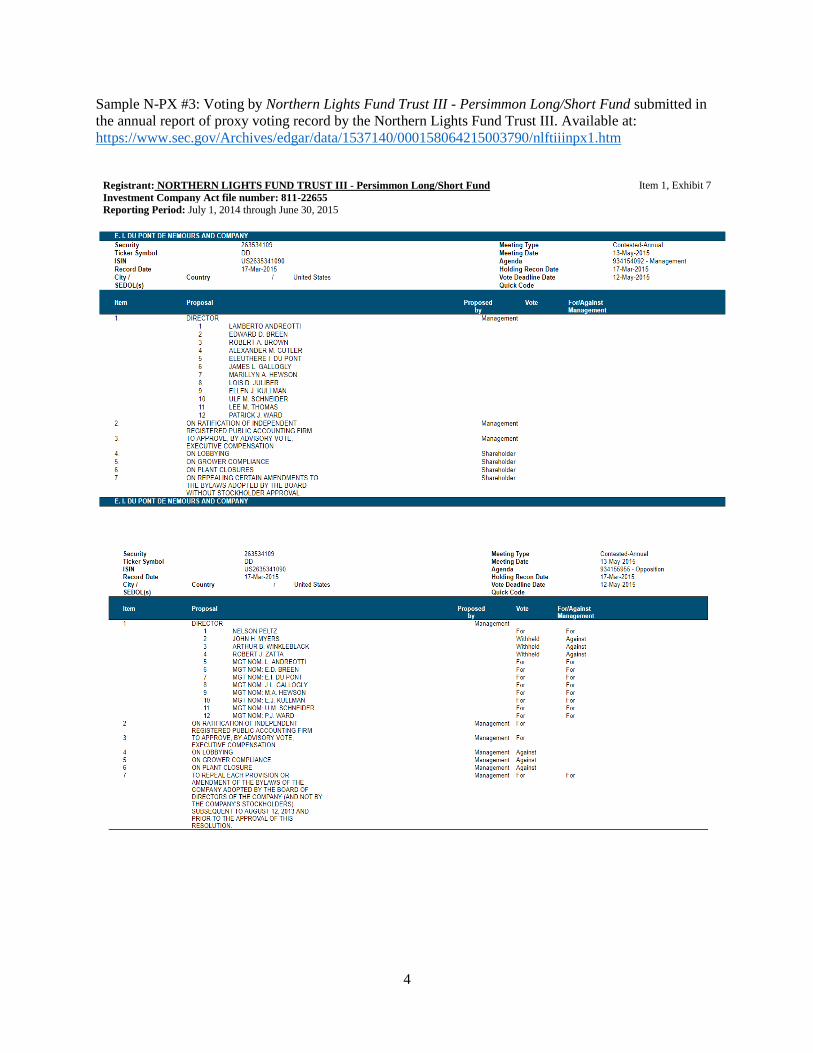
4
Sample N-PX #3: Voting by Northern Lights Fund Trust III - Persimmon Long/Short Fund submitted in
the annual report of proxy voting record by the Northern Lights Fund Trust III. Available at:
https://www.sec.gov/Archives/edgar/data/1537140/000158064215003790/nlftiiinpx1.htm
Registrant: NORTHERN LIGHTS FUND TRUST III - Persimmon Long/Short Fund Item 1, Exhibit 7 Investment Company Act file number: 811-22655
Reporting Period: July 1, 2014 through June 30, 2015
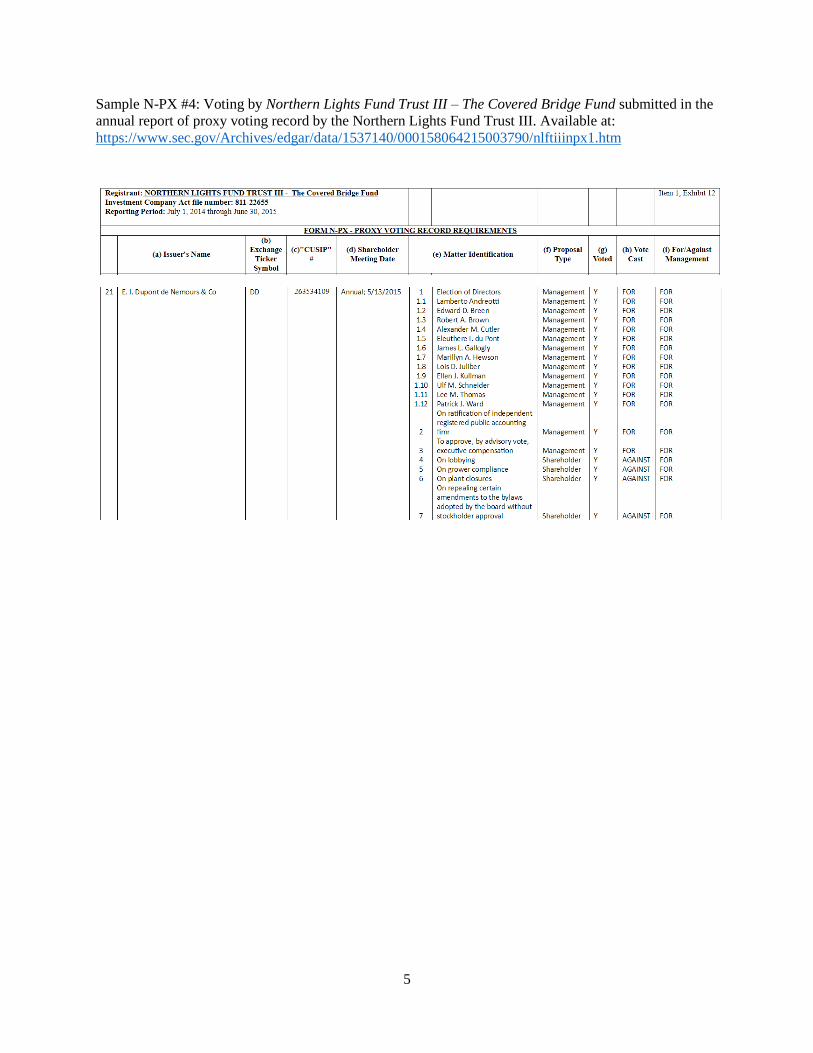
5
Sample N-PX #4: Voting by Northern Lights Fund Trust III – The Covered Bridge Fund submitted in the
annual report of proxy voting record by the Northern Lights Fund Trust III. Available at:
https://www.sec.gov/Archives/edgar/data/1537140/000158064215003790/nlftiiinpx1.htm
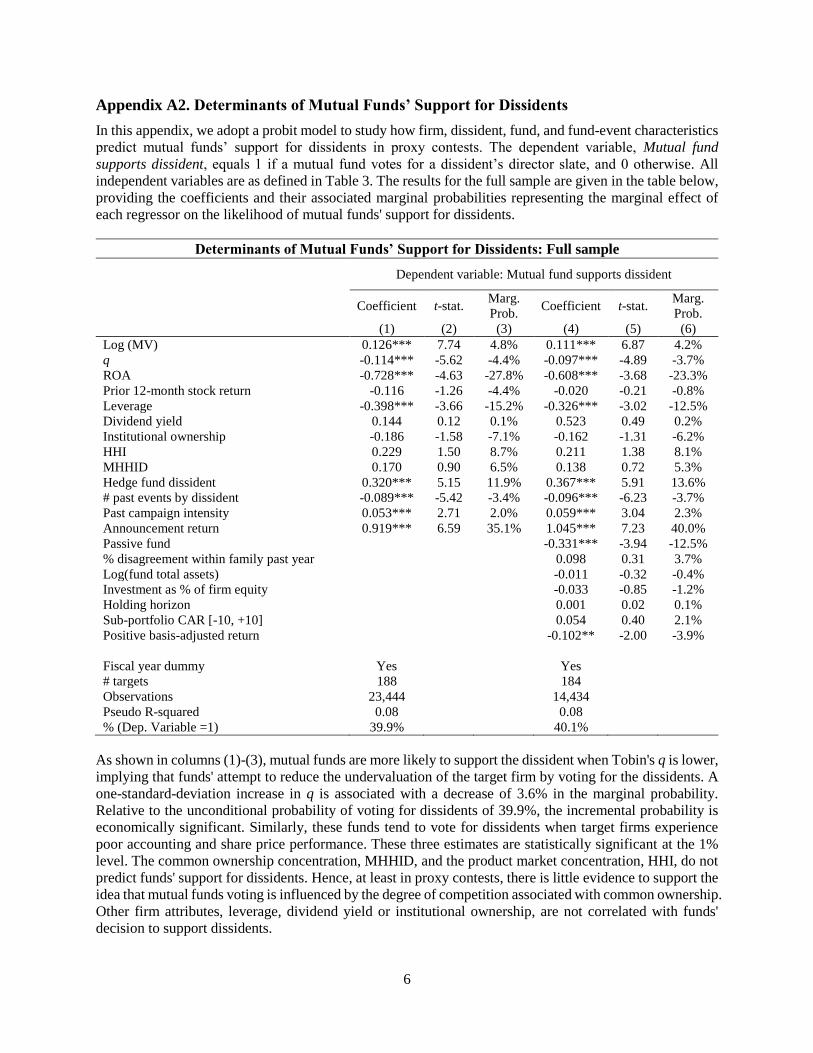
6
Appendix A2. Determinants of Mutual Funds’ Support for Dissidents
In this appendix, we adopt a probit model to study how firm, dissident, fund, and fund-event characteristics
predict mutual funds’ support for dissidents in proxy contests. The dependent variable, Mutual fund
supports dissident, equals 1 if a mutual fund votes for a dissident’s director slate, and 0 otherwise. All
independent variables are as defined in Table 3. The results for the full sample are given in the table below,
providing the coefficients and their associated marginal probabilities representing the marginal effect of
each regressor on the likelihood of mutual funds' support for dissidents.
Determinants of Mutual Funds’ Support for Dissidents: Full sample
Dependent variable: Mutual fund supports dissident
Coefficient t-stat. Marg.
Prob. Coefficient t-stat.
Marg.
Prob.
(1) (2) (3) (4) (5) (6)
Log (MV) 0.126*** 7.74 4.8% 0.111*** 6.87 4.2%
q -0.114*** -5.62 -4.4% -0.097*** -4.89 -3.7%
ROA -0.728*** -4.63 -27.8% -0.608*** -3.68 -23.3%
Prior 12-month stock return -0.116 -1.26 -4.4% -0.020 -0.21 -0.8%
Leverage -0.398*** -3.66 -15.2% -0.326*** -3.02 -12.5%
Dividend yield 0.144 0.12 0.1% 0.523 0.49 0.2%
Institutional ownership -0.186 -1.58 -7.1% -0.162 -1.31 -6.2%
HHI 0.229 1.50 8.7% 0.211 1.38 8.1%
MHHID 0.170 0.90 6.5% 0.138 0.72 5.3%
Hedge fund dissident 0.320*** 5.15 11.9% 0.367*** 5.91 13.6%
# past events by dissident -0.089*** -5.42 -3.4% -0.096*** -6.23 -3.7%
Past campaign intensity 0.053*** 2.71 2.0% 0.059*** 3.04 2.3%
Announcement return 0.919*** 6.59 35.1% 1.045*** 7.23 40.0%
Passive fund -0.331*** -3.94 -12.5%
% disagreement within family past year 0.098 0.31 3.7%
Log(fund total assets) -0.011 -0.32 -0.4%
Investment as % of firm equity -0.033 -0.85 -1.2%
Holding horizon 0.001 0.02 0.1%
Sub-portfolio CAR [-10, +10] 0.054 0.40 2.1%
Positive basis-adjusted return -0.102** -2.00 -3.9%
Fiscal year dummy Yes Yes
# targets 188 184
Observations 23,444 14,434
Pseudo R-squared 0.08 0.08
% (Dep. Variable =1) 39.9% 40.1%
As shown in columns (1)-(3), mutual funds are more likely to support the dissident when Tobin's q is lower,
implying that funds' attempt to reduce the undervaluation of the target firm by voting for the dissidents. A
one-standard-deviation increase in q is associated with a decrease of 3.6% in the marginal probability.
Relative to the unconditional probability of voting for dissidents of 39.9%, the incremental probability is
economically significant. Similarly, these funds tend to vote for dissidents when target firms experience
poor accounting and share price performance. These three estimates are statistically significant at the 1%
level. The common ownership concentration, MHHID, and the product market concentration, HHI, do not
predict funds' support for dissidents. Hence, at least in proxy contests, there is little evidence to support the
idea that mutual funds voting is influenced by the degree of competition associated with common ownership.
Other firm attributes, leverage, dividend yield or institutional ownership, are not correlated with funds'
decision to support dissidents.
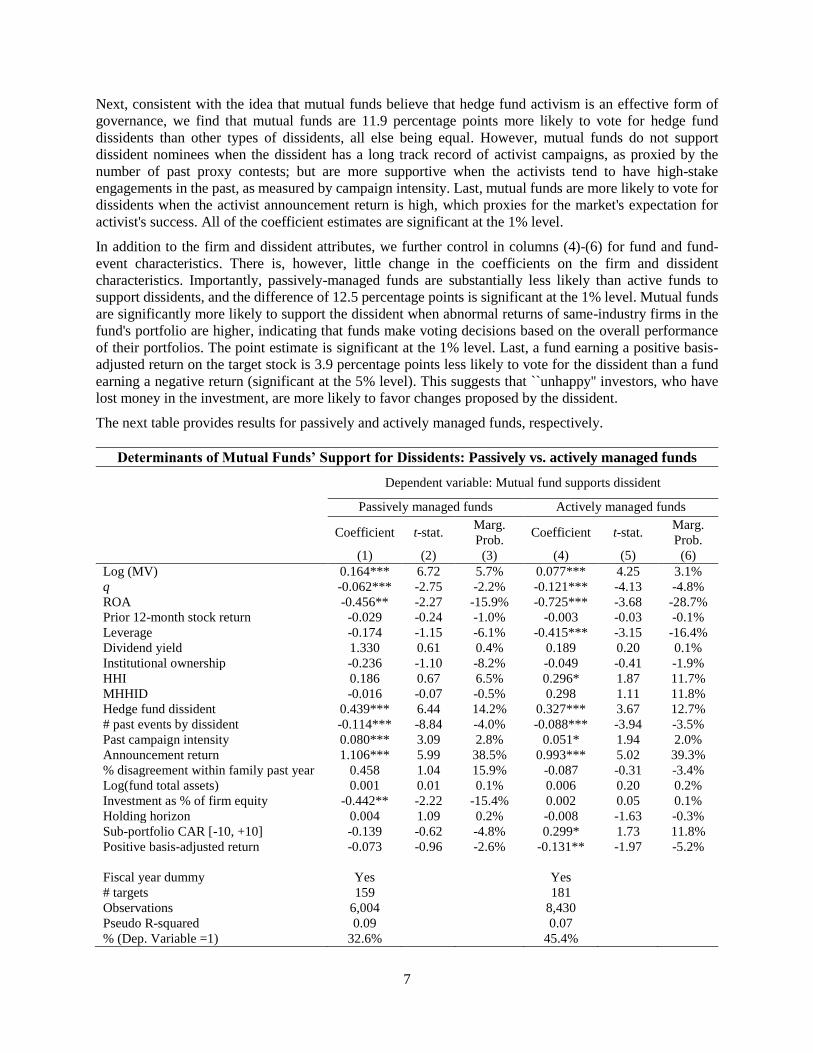
7
Next, consistent with the idea that mutual funds believe that hedge fund activism is an effective form of
governance, we find that mutual funds are 11.9 percentage points more likely to vote for hedge fund
dissidents than other types of dissidents, all else being equal. However, mutual funds do not support
dissident nominees when the dissident has a long track record of activist campaigns, as proxied by the
number of past proxy contests; but are more supportive when the activists tend to have high-stake
engagements in the past, as measured by campaign intensity. Last, mutual funds are more likely to vote for
dissidents when the activist announcement return is high, which proxies for the market's expectation for
activist's success. All of the coefficient estimates are significant at the 1% level.
In addition to the firm and dissident attributes, we further control in columns (4)-(6) for fund and fund-
event characteristics. There is, however, little change in the coefficients on the firm and dissident
characteristics. Importantly, passively-managed funds are substantially less likely than active funds to
support dissidents, and the difference of 12.5 percentage points is significant at the 1% level. Mutual funds
are significantly more likely to support the dissident when abnormal returns of same-industry firms in the
fund's portfolio are higher, indicating that funds make voting decisions based on the overall performance
of their portfolios. The point estimate is significant at the 1% level. Last, a fund earning a positive basis-
adjusted return on the target stock is 3.9 percentage points less likely to vote for the dissident than a fund
earning a negative return (significant at the 5% level). This suggests that ``unhappy'' investors, who have
lost money in the investment, are more likely to favor changes proposed by the dissident.
The next table provides results for passively and actively managed funds, respectively.
Determinants of Mutual Funds’ Support for Dissidents: Passively vs. actively managed funds
Dependent variable: Mutual fund supports dissident
Passively managed funds Actively managed funds
Coefficient t-stat. Marg.
Prob. Coefficient t-stat.
Marg.
Prob.
(1) (2) (3) (4) (5) (6)
Log (MV) 0.164*** 6.72 5.7% 0.077*** 4.25 3.1%
q -0.062*** -2.75 -2.2% -0.121*** -4.13 -4.8%
ROA -0.456** -2.27 -15.9% -0.725*** -3.68 -28.7%
Prior 12-month stock return -0.029 -0.24 -1.0% -0.003 -0.03 -0.1%
Leverage -0.174 -1.15 -6.1% -0.415*** -3.15 -16.4%
Dividend yield 1.330 0.61 0.4% 0.189 0.20 0.1%
Institutional ownership -0.236 -1.10 -8.2% -0.049 -0.41 -1.9%
HHI 0.186 0.67 6.5% 0.296* 1.87 11.7%
MHHID -0.016 -0.07 -0.5% 0.298 1.11 11.8%
Hedge fund dissident 0.439*** 6.44 14.2% 0.327*** 3.67 12.7%
# past events by dissident -0.114*** -8.84 -4.0% -0.088*** -3.94 -3.5%
Past campaign intensity 0.080*** 3.09 2.8% 0.051* 1.94 2.0%
Announcement return 1.106*** 5.99 38.5% 0.993*** 5.02 39.3%
% disagreement within family past year 0.458 1.04 15.9% -0.087 -0.31 -3.4%
Log(fund total assets) 0.001 0.01 0.1% 0.006 0.20 0.2%
Investment as % of firm equity -0.442** -2.22 -15.4% 0.002 0.05 0.1%
Holding horizon 0.004 1.09 0.2% -0.008 -1.63 -0.3%
Sub-portfolio CAR [-10, +10] -0.139 -0.62 -4.8% 0.299* 1.73 11.8%
Positive basis-adjusted return -0.073 -0.96 -2.6% -0.131** -1.97 -5.2%
Fiscal year dummy Yes Yes
# targets 159 181
Observations 6,004 8,430
Pseudo R-squared 0.09 0.07
% (Dep. Variable =1) 32.6% 45.4%
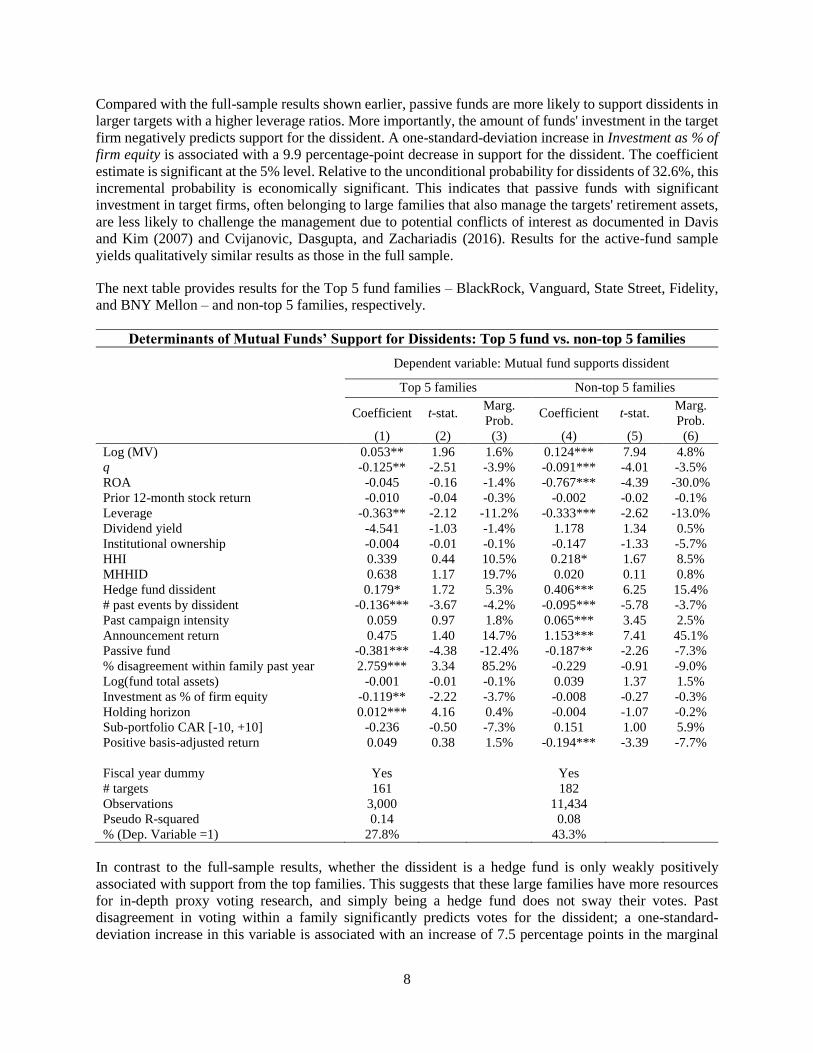
8
Compared with the full-sample results shown earlier, passive funds are more likely to support dissidents in
larger targets with a higher leverage ratios. More importantly, the amount of funds' investment in the target
firm negatively predicts support for the dissident. A one-standard-deviation increase in Investment as % of
firm equity is associated with a 9.9 percentage-point decrease in support for the dissident. The coefficient
estimate is significant at the 5% level. Relative to the unconditional probability for dissidents of 32.6%, this
incremental probability is economically significant. This indicates that passive funds with significant
investment in target firms, often belonging to large families that also manage the targets' retirement assets,
are less likely to challenge the management due to potential conflicts of interest as documented in Davis
and Kim (2007) and Cvijanovic, Dasgupta, and Zachariadis (2016). Results for the active-fund sample
yields qualitatively similar results as those in the full sample.
The next table provides results for the Top 5 fund families – BlackRock, Vanguard, State Street, Fidelity,
and BNY Mellon – and non-top 5 families, respectively.
Determinants of Mutual Funds’ Support for Dissidents: Top 5 fund vs. non-top 5 families
Dependent variable: Mutual fund supports dissident
Top 5 families Non-top 5 families
Coefficient t-stat. Marg.
Prob. Coefficient t-stat.
Marg.
Prob.
(1) (2) (3) (4) (5) (6)
Log (MV) 0.053** 1.96 1.6% 0.124*** 7.94 4.8%
q -0.125** -2.51 -3.9% -0.091*** -4.01 -3.5%
ROA -0.045 -0.16 -1.4% -0.767*** -4.39 -30.0%
Prior 12-month stock return -0.010 -0.04 -0.3% -0.002 -0.02 -0.1%
Leverage -0.363** -2.12 -11.2% -0.333*** -2.62 -13.0%
Dividend yield -4.541 -1.03 -1.4% 1.178 1.34 0.5%
Institutional ownership -0.004 -0.01 -0.1% -0.147 -1.33 -5.7%
HHI 0.339 0.44 10.5% 0.218* 1.67 8.5%
MHHID 0.638 1.17 19.7% 0.020 0.11 0.8%
Hedge fund dissident 0.179* 1.72 5.3% 0.406*** 6.25 15.4%
# past events by dissident -0.136*** -3.67 -4.2% -0.095*** -5.78 -3.7%
Past campaign intensity 0.059 0.97 1.8% 0.065*** 3.45 2.5%
Announcement return 0.475 1.40 14.7% 1.153*** 7.41 45.1%
Passive fund -0.381*** -4.38 -12.4% -0.187** -2.26 -7.3%
% disagreement within family past year 2.759*** 3.34 85.2% -0.229 -0.91 -9.0%
Log(fund total assets) -0.001 -0.01 -0.1% 0.039 1.37 1.5%
Investment as % of firm equity -0.119** -2.22 -3.7% -0.008 -0.27 -0.3%
Holding horizon 0.012*** 4.16 0.4% -0.004 -1.07 -0.2%
Sub-portfolio CAR [-10, +10] -0.236 -0.50 -7.3% 0.151 1.00 5.9%
Positive basis-adjusted return 0.049 0.38 1.5% -0.194*** -3.39 -7.7%
Fiscal year dummy Yes Yes
# targets 161 182
Observations 3,000 11,434
Pseudo R-squared 0.14 0.08
% (Dep. Variable =1) 27.8% 43.3%
In contrast to the full-sample results, whether the dissident is a hedge fund is only weakly positively
associated with support from the top families. This suggests that these large families have more resources
for in-depth proxy voting research, and simply being a hedge fund does not sway their votes. Past
disagreement in voting within a family significantly predicts votes for the dissident; a one-standard-
deviation increase in this variable is associated with an increase of 7.5 percentage points in the marginal
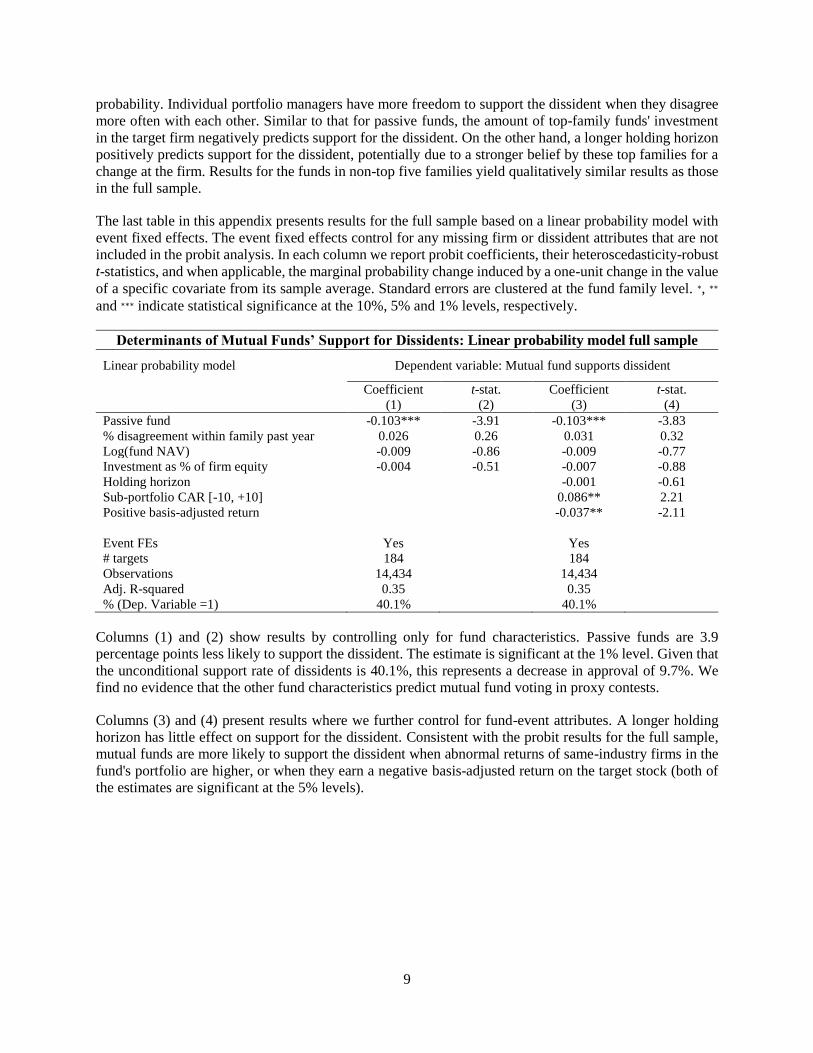
9
probability. Individual portfolio managers have more freedom to support the dissident when they disagree
more often with each other. Similar to that for passive funds, the amount of top-family funds' investment
in the target firm negatively predicts support for the dissident. On the other hand, a longer holding horizon
positively predicts support for the dissident, potentially due to a stronger belief by these top families for a
change at the firm. Results for the funds in non-top five families yield qualitatively similar results as those
in the full sample.
The last table in this appendix presents results for the full sample based on a linear probability model with
event fixed effects. The event fixed effects control for any missing firm or dissident attributes that are not
included in the probit analysis. In each column we report probit coefficients, their heteroscedasticity-robust
t-statistics, and when applicable, the marginal probability change induced by a one-unit change in the value
of a specific covariate from its sample average. Standard errors are clustered at the fund family level. ∗, ∗∗
and ∗∗∗ indicate statistical significance at the 10%, 5% and 1% levels, respectively.
Determinants of Mutual Funds’ Support for Dissidents: Linear probability model full sample
Linear probability model Dependent variable: Mutual fund supports dissident
Coefficient t-stat. Coefficient t-stat.
(1) (2) (3) (4)
Passive fund -0.103*** -3.91 -0.103*** -3.83
% disagreement within family past year 0.026 0.26 0.031 0.32
Log(fund NAV) -0.009 -0.86 -0.009 -0.77
Investment as % of firm equity -0.004 -0.51 -0.007 -0.88
Holding horizon -0.001 -0.61
Sub-portfolio CAR [-10, +10] 0.086** 2.21
Positive basis-adjusted return -0.037** -2.11
Event FEs Yes Yes
# targets 184 184
Observations 14,434 14,434
Adj. R-squared 0.35 0.35
% (Dep. Variable =1) 40.1% 40.1%
Columns (1) and (2) show results by controlling only for fund characteristics. Passive funds are 3.9
percentage points less likely to support the dissident. The estimate is significant at the 1% level. Given that
the unconditional support rate of dissidents is 40.1%, this represents a decrease in approval of 9.7%. We
find no evidence that the other fund characteristics predict mutual fund voting in proxy contests.
Columns (3) and (4) present results where we further control for fund-event attributes. A longer holding
horizon has little effect on support for the dissident. Consistent with the probit results for the full sample,
mutual funds are more likely to support the dissident when abnormal returns of same-industry firms in the
fund's portfolio are higher, or when they earn a negative basis-adjusted return on the target stock (both of
the estimates are significant at the 5% levels).
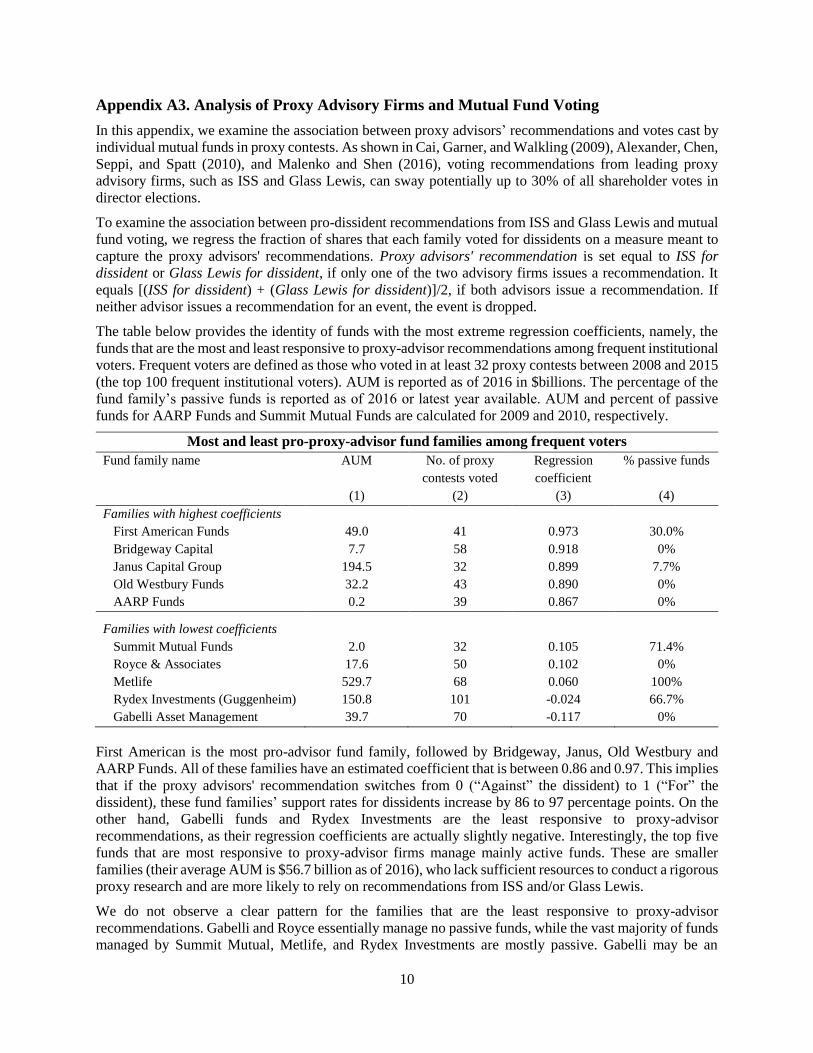
10
Appendix A3. Analysis of Proxy Advisory Firms and Mutual Fund Voting
In this appendix, we examine the association between proxy advisors’ recommendations and votes cast by
individual mutual funds in proxy contests. As shown in Cai, Garner, and Walkling (2009), Alexander, Chen,
Seppi, and Spatt (2010), and Malenko and Shen (2016), voting recommendations from leading proxy
advisory firms, such as ISS and Glass Lewis, can sway potentially up to 30% of all shareholder votes in
director elections.
To examine the association between pro-dissident recommendations from ISS and Glass Lewis and mutual
fund voting, we regress the fraction of shares that each family voted for dissidents on a measure meant to
capture the proxy advisors' recommendations. Proxy advisors' recommendation is set equal to ISS for
dissident or Glass Lewis for dissident, if only one of the two advisory firms issues a recommendation. It
equals [(ISS for dissident) + (Glass Lewis for dissident)]/2, if both advisors issue a recommendation. If
neither advisor issues a recommendation for an event, the event is dropped.
The table below provides the identity of funds with the most extreme regression coefficients, namely, the
funds that are the most and least responsive to proxy-advisor recommendations among frequent institutional
voters. Frequent voters are defined as those who voted in at least 32 proxy contests between 2008 and 2015
(the top 100 frequent institutional voters). AUM is reported as of 2016 in $billions. The percentage of the
fund family’s passive funds is reported as of 2016 or latest year available. AUM and percent of passive
funds for AARP Funds and Summit Mutual Funds are calculated for 2009 and 2010, respectively.
Most and least pro-proxy-advisor fund families among frequent voters
Fund family name AUM No. of proxy
contests voted
Regression
coefficient
% passive funds
(1) (2) (3) (4)
Families with highest coefficients
First American Funds 49.0 41 0.973 30.0%
Bridgeway Capital 7.7 58 0.918 0%
Janus Capital Group 194.5 32 0.899 7.7%
Old Westbury Funds 32.2 43 0.890 0%
AARP Funds 0.2 39 0.867 0%
Families with lowest coefficients
Summit Mutual Funds 2.0 32 0.105 71.4%
Royce & Associates 17.6 50 0.102 0%
Metlife 529.7 68 0.060 100%
Rydex Investments (Guggenheim) 150.8 101 -0.024 66.7%
Gabelli Asset Management 39.7 70 -0.117 0%
First American is the most pro-advisor fund family, followed by Bridgeway, Janus, Old Westbury and
AARP Funds. All of these families have an estimated coefficient that is between 0.86 and 0.97. This implies
that if the proxy advisors' recommendation switches from 0 (“Against” the dissident) to 1 (“For” the
dissident), these fund families’ support rates for dissidents increase by 86 to 97 percentage points. On the
other hand, Gabelli funds and Rydex Investments are the least responsive to proxy-advisor
recommendations, as their regression coefficients are actually slightly negative. Interestingly, the top five
funds that are most responsive to proxy-advisor firms manage mainly active funds. These are smaller
families (their average AUM is $56.7 billion as of 2016), who lack sufficient resources to conduct a rigorous
proxy research and are more likely to rely on recommendations from ISS and/or Glass Lewis.
We do not observe a clear pattern for the families that are the least responsive to proxy-advisor
recommendations. Gabelli and Royce essentially manage no passive funds, while the vast majority of funds
managed by Summit Mutual, Metlife, and Rydex Investments are mostly passive. Gabelli may be an
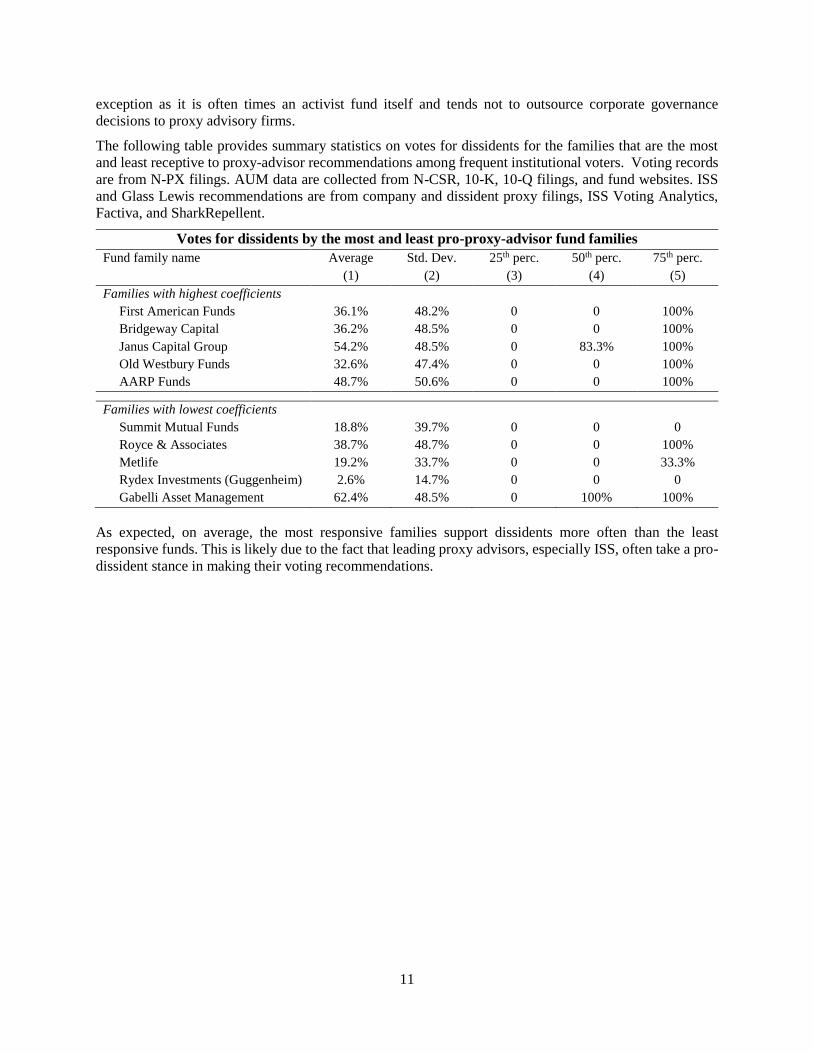
11
exception as it is often times an activist fund itself and tends not to outsource corporate governance
decisions to proxy advisory firms.
The following table provides summary statistics on votes for dissidents for the families that are the most
and least receptive to proxy-advisor recommendations among frequent institutional voters. Voting records
are from N-PX filings. AUM data are collected from N-CSR, 10-K, 10-Q filings, and fund websites. ISS
and Glass Lewis recommendations are from company and dissident proxy filings, ISS Voting Analytics,
Factiva, and SharkRepellent.
Votes for dissidents by the most and least pro-proxy-advisor fund families
Fund family name Average Std. Dev. 25th perc. 50th perc. 75th perc.
(1) (2) (3) (4) (5)
Families with highest coefficients
First American Funds 36.1% 48.2% 0 0 100%
Bridgeway Capital 36.2% 48.5% 0 0 100%
Janus Capital Group 54.2% 48.5% 0 83.3% 100%
Old Westbury Funds 32.6% 47.4% 0 0 100%
AARP Funds 48.7% 50.6% 0 0 100%
Families with lowest coefficients
Summit Mutual Funds 18.8% 39.7% 0 0 0
Royce & Associates 38.7% 48.7% 0 0 100%
Metlife 19.2% 33.7% 0 0 33.3%
Rydex Investments (Guggenheim) 2.6% 14.7% 0 0 0
Gabelli Asset Management 62.4% 48.5% 0 100% 100%
As expected, on average, the most responsive families support dissidents more often than the least
responsive funds. This is likely due to the fact that leading proxy advisors, especially ISS, often take a pro-
dissident stance in making their voting recommendations.

12
Appendix A4. Joint Estimation of Targeting and Voting Decisions with Full-Information
Maximum Likelihood (FIML) Method
Let Φ(𝑥) and Φ2(𝑥1, 𝑥2, 𝜌) be the cumulative probability functions of univariate and bivariate
normal distributions, respectively, following standard notation. Let,
𝐿0 = Φ (−𝑊𝑖,𝑡𝛽 − ��𝑖,𝑗,𝑡[𝑖,𝑡]
𝛿) = 1 − Φ (𝑊𝑖,𝑡𝛽 + ��𝑖,𝑗,𝑡[𝑖,𝑡]
𝛿)
𝐿11 = Φ2 (𝑊𝑖,𝑡𝛽 + ��𝑖,𝑗,𝑡[𝑖,𝑡]
𝛿, 𝑋𝑖,𝑡𝛾 + 𝑍𝑖,𝑗,𝑡𝜆, 𝜌)
𝐿10 = Φ (𝑊𝑖,𝑡𝛽 + ��𝑖,𝑗,𝑡[𝑖,𝑡]
𝛿) − Φ2 (𝑊𝑖,𝑡𝛽 + ��𝑖,𝑗,𝑡[𝑖,𝑡]
𝛿, 𝑋𝑖,𝑡𝛾 + 𝑍𝑖,𝑗,𝑡𝜆, 𝜌)
Based on Equation (1) in the text, there are three types of observations in the sample with the
following probabilities:
Outcome Likelihood Unit of observation Number of observations
𝐶𝑜𝑛𝑡𝑒𝑠𝑡𝑖,𝑡 = 0 𝐿0 (𝑖, 𝑡) 𝑛0
𝐶𝑜𝑛𝑡𝑒𝑠𝑡𝑖,𝑡 = 1; 𝑉𝑜𝑡𝑒𝑖,𝑗,𝑡 = 0 𝐿10 (𝑖, 𝑗, 𝑡) 𝑛10
𝐶𝑜𝑛𝑡𝑒𝑠𝑡𝑖,𝑡 = 1; 𝑉𝑜𝑡𝑒𝑖,𝑗,𝑡 = 1 𝐿11 (𝑖, 𝑗, 𝑡) 𝑛11
Accordingly, the full-information maximum likelihood (FIML) is:
ln 𝐿 =1
𝑛0∑ ln 𝐿0
{𝑖,𝑡}∈(𝐶𝑜𝑛𝑡𝑒𝑠𝑡𝑖,𝑡=0)
+1
𝑛11∑ ln 𝐿11
{𝑖,𝑗,𝑡}∈(𝐶𝑜𝑛𝑡𝑒𝑠𝑡𝑖,𝑡=1∩𝑉𝑜𝑡𝑒𝑖,𝑗,𝑡=1)
+1
𝑛10∑ ln 𝐿10
{𝑖,𝑗,𝑡}∈(𝐶𝑜𝑛𝑡𝑒𝑠𝑡𝑖,𝑡=1∩𝑉𝑜𝑡𝑒𝑖,𝑗,𝑡=0)
In addition to the estimation of the coefficients on the independent variables, the maximum
likelihood also yields the estimated correlation of the residuals across the two equations, ��.