Optimizing daily fantasy sports contests through stochastic ...
64
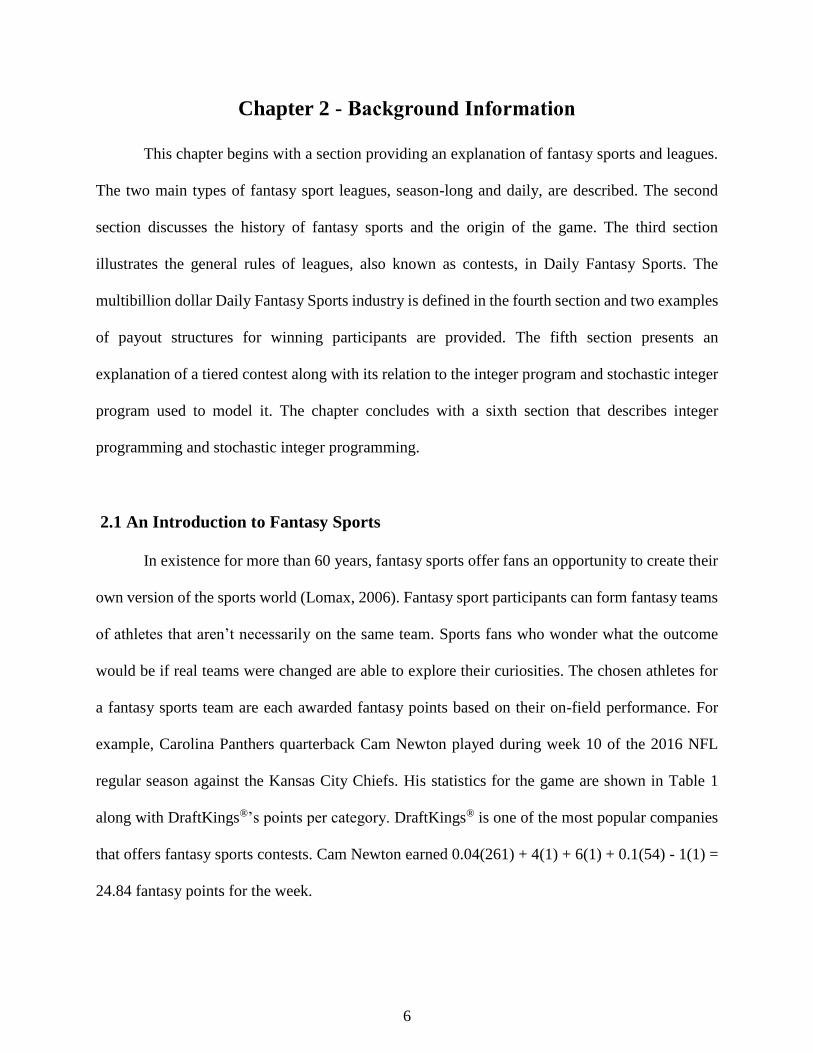
Optimizing daily fantasy sports contests through stochastic integer programming by Sarah Newell B.S.I.E., Kansas State University, 2017 A THESIS submitted in partial fulfillment of the requirements for the degree MASTER OF SCIENCE Department of Industrial and Manufacturing Systems Engineering College of Engineering KANSAS STATE UNIVERSITY Manhattan, Kansas 2017 Approved by: Major Professor Dr. Todd Easton brought to you by CORE View metadata, citation and similar papers at core.ac.uk provided by K-State Research Exchange
-
Upload
khangminh22 -
Category
Documents
-
view
3 -
download
0
Transcript of Optimizing daily fantasy sports contests through stochastic ...

Optimizing daily fantasy sports contests through stochastic integer programming
by
Sarah Newell
B.S.I.E., Kansas State University, 2017
A THESIS
submitted in partial fulfillment of the requirements for the degree
MASTER OF SCIENCE
Department of Industrial and Manufacturing Systems Engineering
College of Engineering
KANSAS STATE UNIVERSITY
Manhattan, Kansas
2017
Approved by:
Major Professor
Dr. Todd Easton
brought to you by COREView metadata, citation and similar papers at core.ac.uk
provided by K-State Research Exchange

Copyright
© Sarah Newell 2017.
Abstract
The possibility of becoming a millionaire attracts over 200,000 daily fantasy sports
(DFS) contest entries each Sunday of the NFL season. Millions of people play fantasy sports and
the companies sponsoring daily fantasy sports are worth billions of dollars. This thesis develops
optimization models for daily fantasy sports with an emphasis on tiered contests. A tiered contest
has many different payout values, including the highly sought after million-dollar prize.
The primary contribution of this thesis is the first model to optimize the expected payout
of a tiered DFS contest. The stochastic integer program, MMIP, takes into account the possibility
that selected athletes will earn a distribution of fantasy points, rather than a single predetermined
value. The players are assumed to have a normal distribution and thus the team’s fantasy points
is a normal distribution. The standard deviation of the team’s performance is approximated
through a piecewise linear function, and the probabilities of earning cumulative payouts are
calculated. MMIP solves quickly and easily fits the majority of daily fantasy sports contests.
Additionally, daily fantasy sports have landed in a tense political climate due to
contestants hopes of winning the million-dollar prize. Through two studies that compare the
performance of randomly selected fantasy teams with teams chosen by strategy, this thesis
conclusively determines that daily fantasy sports are not games of chance and should not be
considered gambling.
Besides creating the first optimization model for DFS tiered contests, this thesis also
provides methods and techniques that can be applied to other stochastic integer programs. It is
the author’s hope that this thesis not only opens the door for clever ways of modeling, but also
inspires sports fans and teams to think more analytically about player selection.
iv
Table of Contents
List of Figures ................................................................................................................................ vi
List of Tables ................................................................................................................................ vii
Dedication .................................................................................................................................... viii
Chapter 1 - Introduction .................................................................................................................. 1
1.1 Research Motivation ......................................................................................................... 3
1.2 Research Contribution ...................................................................................................... 3
1.3 Outline ............................................................................................................................... 4
Chapter 2 - Background Information .............................................................................................. 6
2.1 An Introduction to Fantasy Sports .................................................................................... 6
2.2 Fantasy Sport Origins and History .................................................................................... 7
2.3 Sports Leagues .................................................................................................................. 8
2.4 Daily Fantasy Sports ......................................................................................................... 9
2.5 Tiered Contests ............................................................................................................... 11
2.6 Integer Programming ...................................................................................................... 12
2.7 Stochastic Integer Programming ..................................................................................... 14
Chapter 3 - Optimization Models of Fantasy Sports .................................................................... 18
3.1 Fantasy Point Distribution .............................................................................................. 18
3.2 EFPIP: Integer Program for Maximizing Expected Fantasy Points ............................... 22
3.3 MMIP: A Stochastic Integer Program for Maximizing Expected Payout of a Tiered DFS
............................................................................................................................................... 25
3.4 Computational Results .................................................................................................... 34
Chapter 4 - Are Fantasy Sports Gambling? .................................................................................. 41
4.1 Legal and Political DFS Gambling Argument ................................................................ 41
4.2 Are Daily Fantasy Sports Gambling? ............................................................................. 42
4.2.1 Comparison of IP and Randomly Selected Teams ...................................................... 44
4.2.2. Entering Randomly Selected Teams into MLB DFS Double-ups .......................... 46
4.3 Results ............................................................................................................................. 49
Chapter 5 - Conclusion and Future Research ............................................................................... 51
5.1 Future Work .................................................................................................................... 52

v
Chapter 6 - References .................................................................................................................. 54
vi
List of Figures
Figure 1: Two normally distributed fantasy teams ....................................................................... 19
Figure 2: Cumulative probabilities of winning a payout in a double up contest .......................... 20
Figure 3: Cumulative probabilities of earning a payout in a tiered contest .................................. 21
Figure 4: Partitioning the Normal Curve ...................................................................................... 27
Figure 5: Piecewise linear estimation of true variance ................................................................. 28
vii
List of Tables
Table 1: Cam Newton’s Fantasy Points for Week 10 of the 2016 NFL Season ............................. 7
Table 2: DraftKings® NFL Millionaire Maker Tournament ......................................................... 12
Table 3: Stochastic Knapsack Problem Values ............................................................................ 16
Table 4: Team Probabilities of earning fantasy point thresholds ................................................. 21
Table 5: Weeks 6-17 MMIP Team Statistics ................................................................................ 36
Table 6: Weeks 6-17 EFPIP Team Statistics ................................................................................ 37
Table 7: Probability of earning between ej and ej+1 points for payout lj in MMIP Week 17 ........ 38
Table 8: Probability of earning at least ej points for payout lj in IP Week 17 .............................. 39
Table 9: EFPIP vs. MMIP performance in double up contest ...................................................... 40
Table 10: Fantasy Points Earned................................................................................................... 45
Table 11: Results of 35 MLB DraftKings® Double up Contests .................................................. 48

viii
Dedication
This thesis is dedicated to my parents, Deborah and Scott Newell, and my brother Ben.
Thank you for your endless support while instilling me with the confidence needed to surpass
life’s obstacles.

1
Chapter 1 - Introduction
The sports industry is responsible for an estimated six-million jobs in the United States.
Lawyers, economists, facility personnel, manufacturers, administration, media providers, and
more are employed to support this enormous industry. The National Football League had over 17
million attendants during the 2014 season (Shank, 2014). In addition to the employment affects,
sport is infused into modern society and impacts billions of people worldwide (FSTA, 2016).
Many people dream of playing sports professionally, coaching, and owning a team. The
creation of fantasy sports provides a partial avenue for such aspirations. Approximately 56.8
million people worldwide played fantasy sports in 2015 (FSTA, 2016). The Fantasy sports
industry is expected to grow annually by 41% and generate $14.4 billion by the year 2020
(Heitner, 2016).
A fantasy sport is a game that allows its participants to act as the owner of a sports team.
As the owner of a fantasy team, a game participant selects real-life players of the professional
sport to be a part of his or her team. The on field performance of the professional athlete is used
to calculate the amount of fantasy points earned for the fantasy team. For example, a quarterback
who throws a touchdown in a game earns 4 fantasy points. Fantasy point values are based on key
statistics relative to the player’s sport and position on the team.
The goal of the fantasy sports participant is to select a team that earns as many fantasy
points as possible. Participants enter their fantasy team into a contest in which their team is
ranked amongst other fantasy teams that have entered the contest. Free contests exist, but many
participants choose to pay an entry fee in hopes of winning contest prizes. There are different
types of contests, each with their own rules on how prize money will be distributed at the end.
One example is a Head-to-Head contest, in which the participant will face exactly one opposing
2
fantasy team. The team with the most points will take roughly 85% of the combined entry fees.
Double ups are a contest type where many participants can enter a fantasy team. All entrants are
ranked amongst each other by fantasy points, and approximately the top 43% of fantasy teams
will earn double their entry fee. Tiered contests are similar to double ups in the fact many people
play and are ranked amongst each other. They differ in the fact that tiered contests pay out a cash
prize to the highest ranked fantasy team, a lower-value cash prize to the 2nd place team, and so
on, decreasing the cash prize value until the prize pool has run out. Roughly 20% of participants
earn a payout in a tiered contest.
A form of fantasy sports is known as Daily Fantasy Sports (DFS), where the fantasy
sports contest lasts for a single set of games, typically ranging from a single day to a full week.
Another form is season long fantasy leagues, in which the contest lasts for the duration of the
sport’s season. Season long leagues are played more for the entertainment aspect than the hope
of a payout. A participant who pays an entry fee to a season long contest would have to wait
months to find out if they will win or lose, whereas DFS offers results within days. Participants
feel that, even if they didn’t get the payout this week, there are still chances available for every
week of the season. The hope that one day, their team will earn cash motivates them to keep
entering contests day after day.
It is common to see DFS tiered contests with over 100,000 participant entries. In DFS
tiered contests, the participant who earns the most fantasy points in the contest pool can earn a
million dollars, depending on the contest. The popularity of tiered contests developed rapidly
because participants are attracted to the idea that, by paying a small entry fee, they may be able
to win the grand prize and Daily Fantasy Sports could change their lives.
3
The popularity and growth of the DFS industry began to catch the attention of politicians
in America. In October of 2016, the State of Nevada deemed that operating DFS in Nevada is
illegal without a gambling license (Drape, 2015). The decision by Nevada, the gambling capital
of the world, is arguably the most impactful on the fantasy sports industry (Drape, 2015). Shortly
after this ruling Attorney Generals of New York, Texas, and Illinois followed by stating that it is
illegal for individuals in their states to participate in DFS (Drape, 2015). Fans and companies
who choose to participate in DFS unlicensed in these states will be fined and potentially face ten
years in prison (Purdum, 2015).
The accusations that Daily Fantasy Sports should be considered gambling present a major
issue for the multibillion-dollar industry. Fewer players will be able to legally enter contests.
Professional sporting leagues as well as the media also face potential harm. Research shows that
fantasy sport participation increases game attendance and sports media viewership (Nesbit,
2010).
1.1 Research Motivation
Recent politics indicates there may be limited time available to try to win at DFS by
playing with an optimal strategy. The motivation of this research is to create optimization models
that perform well in DFS. In particular, the goal is to develop a model that performs well in
tiered contest to win a substantial amount of money. The model should seek to determine a team
that maximizes the expected payout of a tiered contest.
1.2 Research Contribution
This thesis’ primary contribution is the first optimization model to optimize the expected
payout of a tiered DFS contest. A stochastic integer program is built by assuming each NFL
4
athlete’s fantasy points are independently and normally distributed according to their mean and
standard deviation. The team’s fantasy point distribution is then discretized to determine the
probability of earning a given point threshold. Each possible threshold provides an incremental
payout from the lesser payout. This stochastic integer program produces an optimal combination
of athletes for a fantasy team, which maximizes the expected payout. A computational study
shows that this stochastic integer program is computationally tractable.
A secondary contribution is the generation of models to mimic how DFS participants
play fantasy. One model is the first integer program to maximize an NFL’s average fantasy
points, which imitates an intelligent player’s fantasy picks. A secondary model uses the
acceptance and rejection rule from simulation to portray an unskilled player. Through
computational studies, it is shown that the intelligent player outperforms the unskilled player in a
statistically significant fashion. Furthermore, an actual study showed that if DFS was truly a
game of chance, then the study resulted in a probability about equivalent to winning the power
ball lottery. Thus, we can conclude that DFS is not predominantly a game of chance and is a
game of skill. Nevada and other states have drawn the wrong conclusion on DFS sports.
1.3 Outline
Chapter 2 introduces the reader to background information necessary to understand the
scope and reasoning behind the development of this research. An introduction to fantasy sports
and explanation of fantasy sports history provides a basic understanding. The different types of
sports leagues are shared along with a more in-depth description of the type chosen for this
thesis, daily fantasy sports. The different types of daily fantasy sports contests are discussed. A
formal definition of both integer programming and stochastic integer programming, along with
an example, is given.
5
Chapter 3 provides the contributions of this thesis. The importance of the distribution of
fantasy points for a team is explained to clarify the assumptions made for both models. The
integer program for maximizing expected fantasy points is shared along with the stochastic
integer program for maximizing expected payout of a daily fantasy sports tiered contest.
Computational results are described.
Chapter 4 seeks to answer a question that has been on many lawmaker’s minds in recent
years: are daily fantasy sports gambling? The legal climate of daily fantasy sports in 2017 is
discussed. Studies provide evidence that will answer the proposed question. First, randomly
selected teams simulate the athlete selection process. Then, randomly selected teams are entered
into real DraftKings® contests and their performance is evaluated. The probability of never
winning a payout is discussed and is comparable to the chances of winning the lottery.
This thesis concludes in Chapter 5. The findings of each study are summarized and
conclusions are drawn based on results. Advice for selecting athletes for a fantasy team is
provided, and an opinion to the legal question of daily fantasy sports is discussed based on the
studies in this thesis. Many avenues for future research exist and are shared within this chapter.
6
Chapter 2 - Background Information
This chapter begins with a section providing an explanation of fantasy sports and leagues.
The two main types of fantasy sport leagues, season-long and daily, are described. The second
section discusses the history of fantasy sports and the origin of the game. The third section
illustrates the general rules of leagues, also known as contests, in Daily Fantasy Sports. The
multibillion dollar Daily Fantasy Sports industry is defined in the fourth section and two examples
of payout structures for winning participants are provided. The fifth section presents an
explanation of a tiered contest along with its relation to the integer program and stochastic integer
program used to model it. The chapter concludes with a sixth section that describes integer
programming and stochastic integer programming.
2.1 An Introduction to Fantasy Sports
In existence for more than 60 years, fantasy sports offer fans an opportunity to create their
own version of the sports world (Lomax, 2006). Fantasy sport participants can form fantasy teams
of athletes that aren’t necessarily on the same team. Sports fans who wonder what the outcome
would be if real teams were changed are able to explore their curiosities. The chosen athletes for
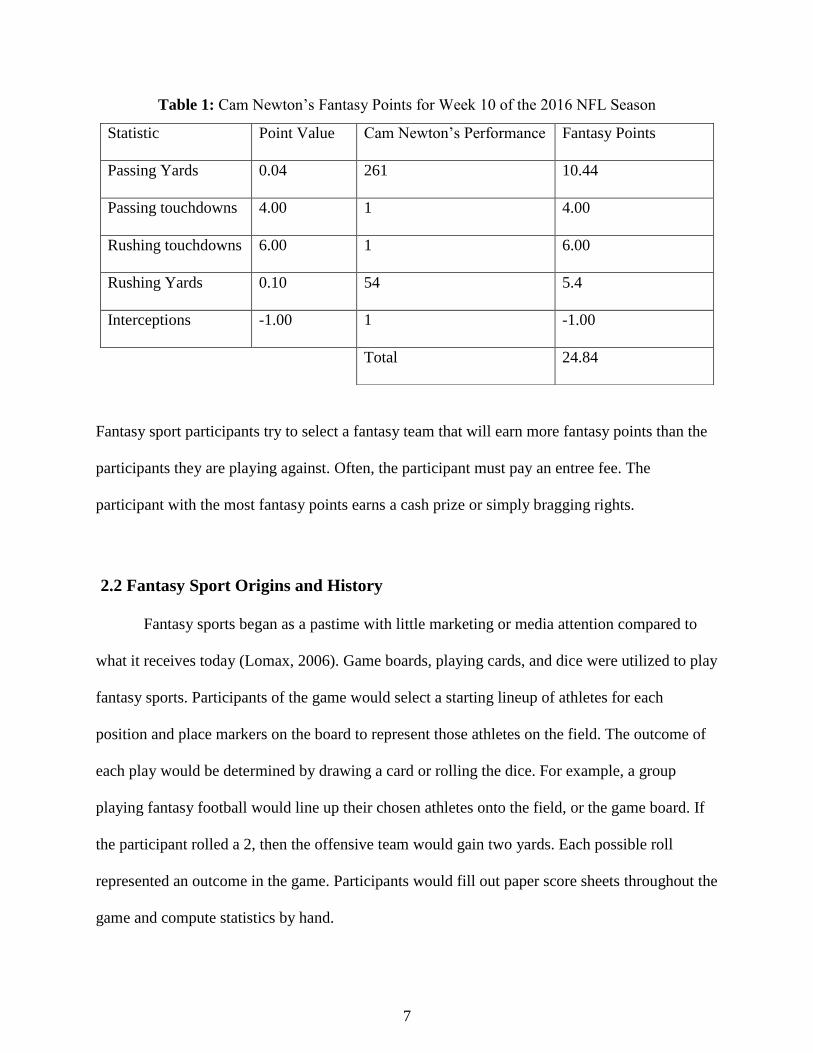
a fantasy sports team are each awarded fantasy points based on their on-field performance. For
example, Carolina Panthers quarterback Cam Newton played during week 10 of the 2016 NFL
regular season against the Kansas City Chiefs. His statistics for the game are shown in Table 1
along with DraftKings®’s points per category. DraftKings® is one of the most popular companies
that offers fantasy sports contests. Cam Newton earned 0.04(261) + 4(1) + 6(1) + 0.1(54) - 1(1) =
24.84 fantasy points for the week.
7
Table 1: Cam Newton’s Fantasy Points for Week 10 of the 2016 NFL Season
Fantasy sport participants try to select a fantasy team that will earn more fantasy points than the
participants they are playing against. Often, the participant must pay an entree fee. The
participant with the most fantasy points earns a cash prize or simply bragging rights.
2.2 Fantasy Sport Origins and History
Fantasy sports began as a pastime with little marketing or media attention compared to
what it receives today (Lomax, 2006). Game boards, playing cards, and dice were utilized to play
fantasy sports. Participants of the game would select a starting lineup of athletes for each
position and place markers on the board to represent those athletes on the field. The outcome of
each play would be determined by drawing a card or rolling the dice. For example, a group
playing fantasy football would line up their chosen athletes onto the field, or the game board. If
the participant rolled a 2, then the offensive team would gain two yards. Each possible roll
represented an outcome in the game. Participants would fill out paper score sheets throughout the
game and compute statistics by hand.
Statistic Point Value Cam Newton’s Performance Fantasy Points
Passing Yards 0.04 261 10.44
Passing touchdowns 4.00 1 4.00
Rushing touchdowns 6.00 1 6.00
Rushing Yards 0.10 54 5.4
Interceptions -1.00 1 -1.00
Total 24.84
8
Fantasy football, one of the most popular fantasy sports alongside baseball, first began in
1962 (Lomax, 2006). Bill Winkenbach, a limited partner of the Oakland Raiders, along with two
journalists for the Oakland Tribune were on a trip to New York with the Raiders. In their hotel
room, the Greater Oakland Professional Pigskin Prognosticators league (GOPPPL), known today
as fantasy football, was born. Since then, developments in technology have taken fantasy sports
to a new level, providing participants real-time statistics and making it much easier for a person
with little sports knowledge to participate.
2.3 Sports Leagues
Numerous types of fantasy sport leagues exist, all of which run concurrently with the
season of the sport. In season-long fantasy leagues, participants virtually draft a set of athletes
for their roster. Two fantasy team owners in the same league cannot own the same athlete, so it is
important to have an athlete selection strategy before drafting a team. At the conclusion of the
draft, a participant’s fantasy team roster will contain enough athletes to fill a team each week and
still have athletes on the bench.
During the sport season, every participant’s fantasy team is matched with another
participant’s fantasy team each week to act as opponents. Participants will select athletes from
their drafted roster to represent their fantasy team that week. The two opponents compete, and
the fantasy team that earns the greater amount of fantasy points is declared the winner. The
teams with the most wins throughout the season qualify for the playoffs. Eventually a season
champion is crowned.
Athletes can be traded between teams throughout the season. Participants also have the
option of removing an athlete from their team in order to add an unclaimed athlete. The process
9
of drafting and trading athletes requires additional strategy and some consideration of the
opposing fantasy team owners’ decisions. The vast amount of changes and decisions that can be
made throughout the season limit the planning horizon when drafting a team. A participant could
draft a team with their favorite athlete, but find out a week later that the athlete is injured for the
rest of the season. The unpredictability of season-long leagues leads the author to believe that it
is best to optimize over a short period of time, where the planning horizon considers statistics
that are relevant to the current status of the athletes. Thus, daily fantasy sports provide the perfect
opportunity to optimize drafting teams for a short window of time.
2.4 Daily Fantasy Sports
Daily Fantasy Sports differ greatly from season-long leagues. In the case of Daily
Fantasy Sports, or DFS, the drafted fantasy team lasts for a single day rather than a full season.
Additionally, multiple participants are able to select the same athlete, allowing for DFS
participants to draft the athletes they believe will earn the most fantasy points without
considering the opposing team’s possible draft choices. To increase the difficulty of the contest,
DFS restricts participants by implementing a salary cap. Athletes are assigned a virtual salary
each week based on their perceived value and skill. The sum of the salaries for a selected team
roster must not exceed the given salary cap. This prevents a DFS participant from choosing all of
the expensive, and therefore likely the “best” athletes.
Together, two companies hold over 90% of the DFS market share: FanDuel®, founded in
2009, and DraftKings®, founded in 2012. Each company runs a website which hosts DFS
contests for several sports. Together, these companies have processed three billion dollars in
DFS contest entry fees (Van Natta, 2016). Entry fees range from free to over $10,000 per entry,
and some contests pay out prizes of up to one-million dollars depending on the contest
10
(DraftKings®, 2016). Consequently, DFS attracts those who aim to use their knowledge of sports
to earn a cash prize.
Daily Fantasy Sports participants spend an average of 8.67 hours each week participating
in fantasy sports, including researching athlete ability and likelihood of their team performing
well. Participants also invest money into decision making tools as they construct their fantasy
teams. An estimated 30% of fantasy sport participants use additional websites to research
athletes and other factors. Together, these participants spend $656 million annually to purchase
additional information and decision-making tools (Smith et al, 2006).
There are numerous types of DFS contests, each varying on the amount of cash paid out
to winning teams, known as the payout structure. Many contests award the top finishing teams
with an identical prize amount. In such a case, a participant receives no benefit from creating an
extremely strong team, but rather a team that performs just well enough to reach the prize-
winning threshold. An example of this payout structure is in DraftKings® double up contests,
where the top 43% of fantasy teams earn a payout of double their entry fee.
Mathematically modeling a double up contest is fairly straightforward. An integer
program can be developed and easily solved in most cases. In fact, models for these types of
contests are available in cricket (Burke et al, 2016), soccer (Bonomo et al, 2014), and cycling
(Belien et al, 2013). These models all maximize the expected points of the fantasy team subject
to the team and salary cap restrictions. A minor contribution of this thesis is the first such integer
program for NFL teams and it is presented in Section 3.1.

11
2.5 Tiered Contests
Another type of contest rewards participants based upon fantasy team rank. In these
tiered contests, the top finisher receives an extremely high reward. The motivation of this
research is to develop a stochastic integer program to maximize the expected payout of a tiered
contest.
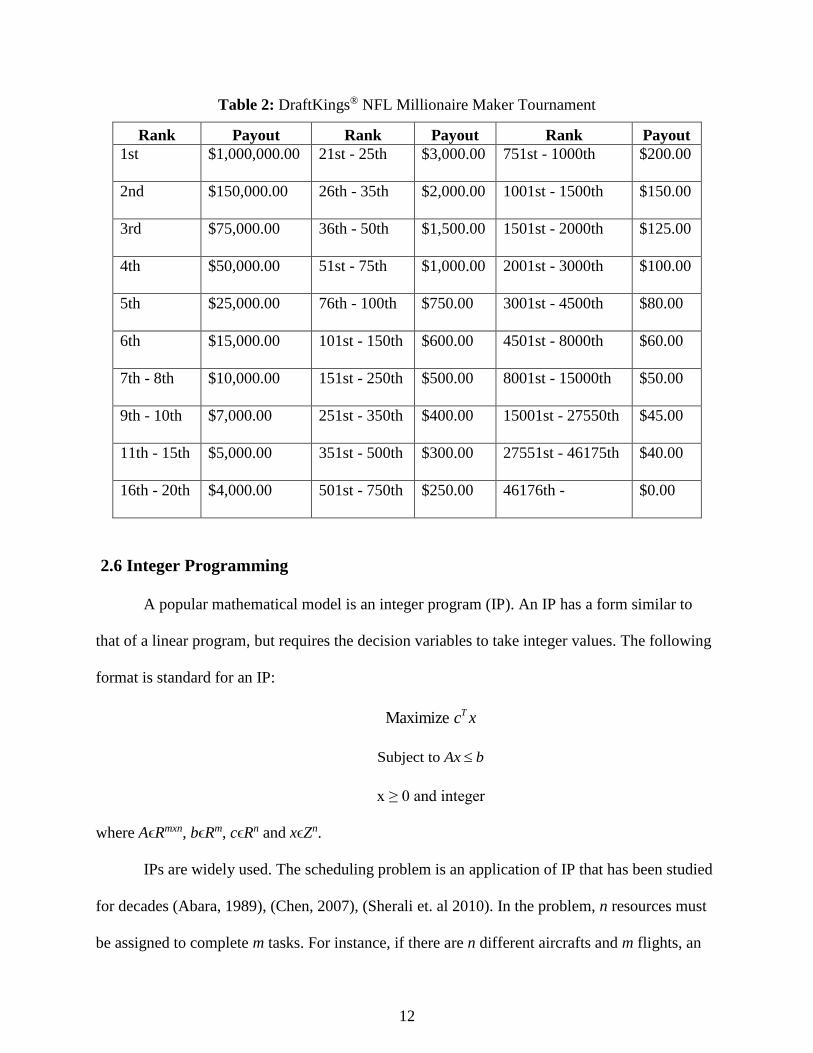
To describe a tiered contest, DraftKings® NFL Millionaire Maker Tournament is used for
this research. The contest occurs on Sundays of the NFL season, accepts over 230,000 entries,
and each participant pays an entry fee of $27. The top 20% of entries split a $4,000,000 prize
pool (DraftKings®, 2016)The payout table for DraftKings® NFL Millionaire Maker Tournament
is in Table 2.
Contest participants must choose nine of the athletes from the NFL teams playing that
day to be on their fantasy team. There are six different positions that must be filled on a fantasy
football team: one quarterback, three wide receivers, two running backs, one tight end, a flex
(running back, wide receiver or tight end), and a team defense/special teams.
DraftKings® assigns a fantasy point value to several statistics for each position. Each
DFS participant in the contest is ranked by the total amount of fantasy points earned. Payouts are
then provided to the top performers according to Table 2.
Each athlete is assigned a salary by DraftKings® and the contestant is allowed $50,000
virtual dollars to create a team. Once the fantasy team is chosen, the DFS participant waits to see
the result of their chosen athletes’ performance and obtain the payout. The primary research
contribution is the first model to optimize a tiered contest.
12
Table 2: DraftKings® NFL Millionaire Maker Tournament
Rank Payout Rank Payout Rank Payout
1st $1,000,000.00 21st - 25th $3,000.00 751st - 1000th $200.00
2nd $150,000.00 26th - 35th $2,000.00 1001st - 1500th $150.00
3rd $75,000.00 36th - 50th $1,500.00 1501st - 2000th $125.00
4th $50,000.00 51st - 75th $1,000.00 2001st - 3000th $100.00
5th $25,000.00 76th - 100th $750.00 3001st - 4500th $80.00
6th $15,000.00 101st - 150th $600.00 4501st - 8000th $60.00
7th - 8th $10,000.00 151st - 250th $500.00 8001st - 15000th $50.00
9th - 10th $7,000.00 251st - 350th $400.00 15001st - 27550th $45.00
11th - 15th $5,000.00 351st - 500th $300.00 27551st - 46175th $40.00
16th - 20th $4,000.00 501st - 750th $250.00 46176th - $0.00
2.6 Integer Programming
A popular mathematical model is an integer program (IP). An IP has a form similar to
that of a linear program, but requires the decision variables to take integer values. The following
format is standard for an IP:
Maximize Tc x
Subject to Ax b
x ≥ 0 and integer
where AϵRmxn, bϵRm, cϵRn and xϵZn.
IPs are widely used. The scheduling problem is an application of IP that has been studied
for decades (Abara, 1989), (Chen, 2007), (Sherali et. al 2010). In the problem, n resources must
be assigned to complete m tasks. For instance, if there are n different aircrafts and m flights, an
13
IP can determine the optimal assignments of aircrafts to flights based on cost. The objective of
the scheduling problem is to satisfy all flight requirements in a way that minimizes cost or
maximizes profit (Yu, 2012).
Another classic IP is the Traveling Salesman Problem (TSP) (Gutin and Punnen, 2006).
This problem involves a salesman who lives in one of n cities. The salesman must travel to each
of the remaining n-1 cities exactly once before returning home. The objective of TSP is to
determine the minimum distance the salesman can travel while still visiting each city exactly one
time. Approaches to solving TSP have been developed throughout the years with the goal of
speeding up computation time (Miller, 1960), (Applegate, 2011).
More examples of IPs include scheduling sports tournaments (Easton and Nemhauser,
2001), deciding shape and intensity of radiation therapy for cancer patients (Lee et. al 2003), and
production planning for a business (Pochet and Wolsey, 2006). Water resource modeling in
times of scarcity, hospital staffing, and pollution control have all been positively impacted by
integer programming (Birge and Louveaux, 2011).
The knapsack problem is a classic integer programming formulation. There are several
items available, and the knapsack owner is aware of each item’s weight and value. The goal is to
select the combination of objects that the knapsack can carry while also maximizing the sum of
the selected objects’ values. For example, say there is a knapsack that can carry a maximum
weight W. There are n objects, each of weight wi and value si for i = 1, …, n.
14
An IP formulation of the knapsack problem is
1
Maximizen
i i
i
s x
1
Subject ton
i i
i
w x W
{0,1}for all 1,...,ix i n
Integer Programs are NP-hard (Karp, 1972), thus all known existing algorithms require
exponential time to solve. A common algorithm used to solve IPs is branch and bound. Given an
integer program, the branch and bound method is initiated by computing the linear relaxation
solution to the IP. The linear relaxation of an IP is created by simply removing the requirement
that the output must be of integer value. The solution to the linear relaxation becomes the starting
node. The next step is to branch, or create upper and lower bounds of a selected non-integer
variable, off of the starting node. Each branch acts as a constraint, and the problem is re-solved
with the new constraint to determine another solution, or node. The IP is solved when all nodes
have been fathomed. In order to be fathomed, the node must meet at minimum one of three
requirements. The node has an integer solution, is infeasible, or has an objective value which is
less than or equal to the current best solution. Much research has been done to speed up branch
and bound. Techniques include cutting planes (Marchand et. al 2002), specialized branching
(Vanderbeck, 2011), and search algorithms (Garfinkel and Nemhauser, 1972).
2.7 Stochastic Integer Programming
Another popular variant of an IP, and the modeling technique used in this research, is
Stochastic Integer Programming (SIP). SIP incorporates probabilities into the integer program.

15
Typically, the probabilities are incorporated as an expected value, but that is not always
necessary. Frequently, the SIP takes the form of
Maximize E(cTx +dTp)
Subject to Ax +Dp ≤ b
1Tp = 1
x ≥ 0, 0 ≤ p ≤ 1
where AϵRmxn, DϵRmxp, b ϵRm, c ϵ Rn, d ϵ Rp, x ϵ Zn and y ϵ R+p
SIPs typically model various scenarios, each with its own probability. The probability
that a scenario occurs is denoted by variable p. SIPs have been used in preparing supplies for an
oncoming natural disaster (Rawls and Turnquist, 2010), financial portfolio selection (Suvrajeet et
al 2006), and in managing a forest fires to minimize damage (Belval et. Al, 2015).
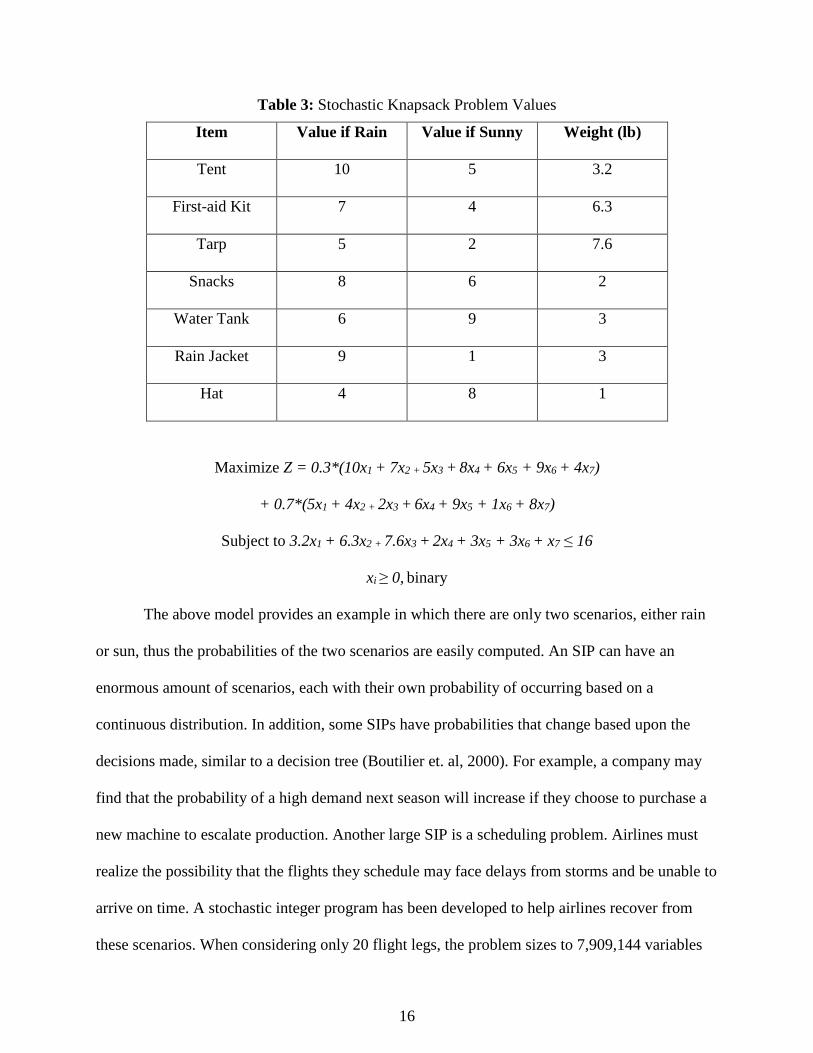
To describe SIPs, consider a knapsack problem that is stochastic. A woman is packing for
a weekend hike and has 7 items she can choose from to pack in her knapsack. She has
determined that the knapsack can carry up to 16 pounds without tearing. Each of the items she
can pack has a different value based upon whether or not it rains. Table 3 provides the volume of
each item and the values depending upon the weather. The SIP formulation is also listed below.
16
Table 3: Stochastic Knapsack Problem Values
Item Value if Rain Value if Sunny Weight (lb)
Tent 10 5 3.2
First-aid Kit 7 4 6.3
Tarp 5 2 7.6
Snacks 8 6 2
Water Tank 6 9 3
Rain Jacket 9 1 3
Hat 4 8 1
Maximize Z = 0.3*(10x1 + 7x2 + 5x3 + 8x4 + 6x5 + 9x6 + 4x7)
+ 0.7*(5x1 + 4x2 + 2x3 + 6x4 + 9x5 + 1x6 + 8x7)
Subject to 3.2x1 + 6.3x2 + 7.6x3 + 2x4 + 3x5 + 3x6 + x7 ≤ 16
xi ≥ 0, binary
The above model provides an example in which there are only two scenarios, either rain
or sun, thus the probabilities of the two scenarios are easily computed. An SIP can have an
enormous amount of scenarios, each with their own probability of occurring based on a
continuous distribution. In addition, some SIPs have probabilities that change based upon the
decisions made, similar to a decision tree (Boutilier et. al, 2000). For example, a company may
find that the probability of a high demand next season will increase if they choose to purchase a
new machine to escalate production. Another large SIP is a scheduling problem. Airlines must
realize the possibility that the flights they schedule may face delays from storms and be unable to
arrive on time. A stochastic integer program has been developed to help airlines recover from
these scenarios. When considering only 20 flight legs, the problem sizes to 7,909,144 variables

17
and 26 constraints (Lan et. al, 2006). The enormous size of this SIP is a common problem with
many SIPs, which has led researchers to develop advanced computational strategies to solve
them.
A method for dealing with such large problems is to create sections of the continuous
probability distribution and perform recourse. This allows for testing whether or not the
probability of a scenario lies within a known range and shrinks the problem down to a size that
can be handled. For instance, one may break a normal distribution curve into 40 partitions.
Rather than searching through a continuous line for the exact probability, the scenario’s
probability can be approximated if it is known to lie within one of the partitions.
Just as IPs, stochastic integer programs are most often solved with branch and bound.
Besides recourse, other common techniques include usings a two-stage model (Shabbir et. Al,
2004) or parallel computing (Golden et. al, 2008).
The SIP from this research does not require new advanced computational methods in
order to be solved. It is solved by branch and bound using CPLEX 12.6 optimization software.
The following chapter details the optimization models, an IP and SIP for Daily Fantasy Sports,
produced for this thesis and provides computational results of the models.

18
Chapter 3 - Optimization Models of Fantasy Sports
This chapter details the mathematical research contributions of this thesis. The first
section describes the distribution of fantasy points for athletes and fantasy teams. Next, the
second section presents a simple integer program for maximizing expected fantasy points. It is
then followed by a third section which explains the primary contribution: a stochastic integer
program that maximizes a fantasy team’s expected payout of a tiered daily fantasy sports contest.
A computational study and analysis is described in the fourth and final section.
3.1 Fantasy Point Distribution
Every athlete has a distribution of fantasy points for each week. For fantasy teams, the
sum of the athletes’ distributions is equal to the distribution of points earned by the fantasy team.
A primary assumption of this thesis is that each player’s fantasy points follow a normal
distribution and are independent from all other players. Thus, the distribution of the fantasy
team’s points is a normal distribution with a mean equal to the sum of the means of the players.
The standard deviation is the square root of the sum of the variances of the players.
It is important to note that, although the athletes all follow a normal distribution, not all
contest payout structures are equivalent. For example, in a double up contest the participant only
needs to earn more points than 43% of their opponents. No benefit is given to a having an
extremely high number of fantasy points, because the payout is the same for all that exceed the
points of the lower 57% of participants. Essentially, one only needs to strive to earn enough
points for a payout rather than the most points possible. This directly contrasts a tiered contest,
where the payout increases as more fantasy points are earned.
19
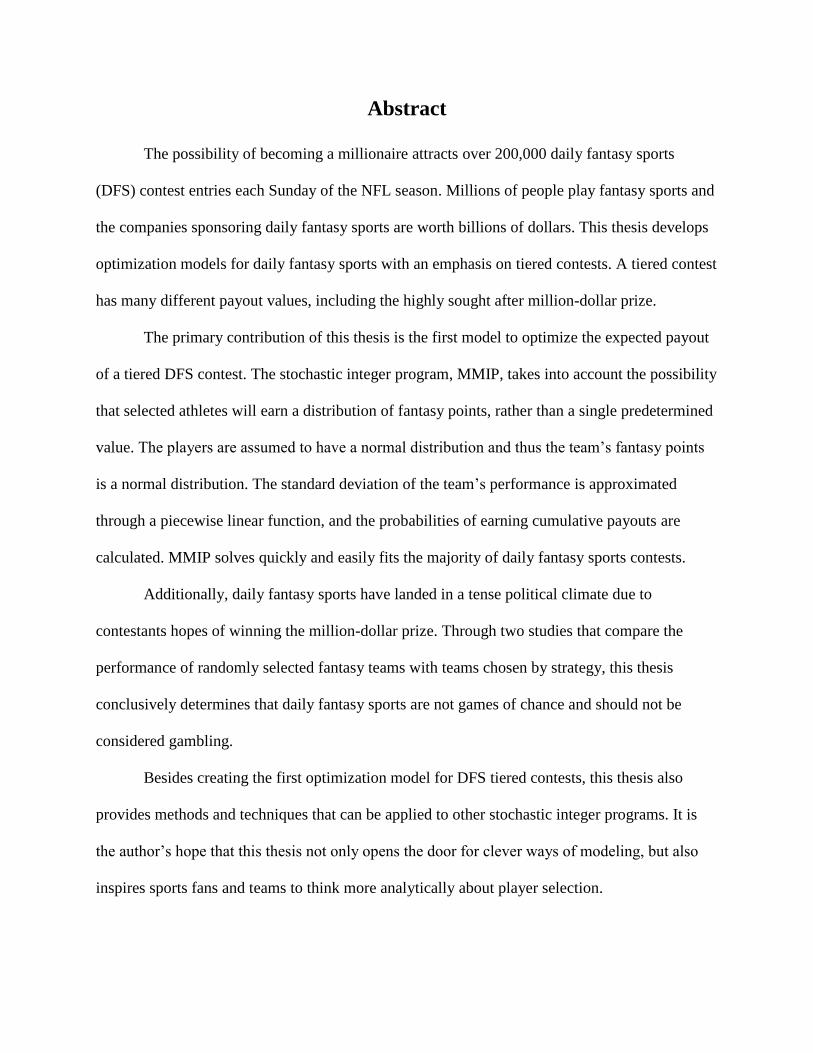
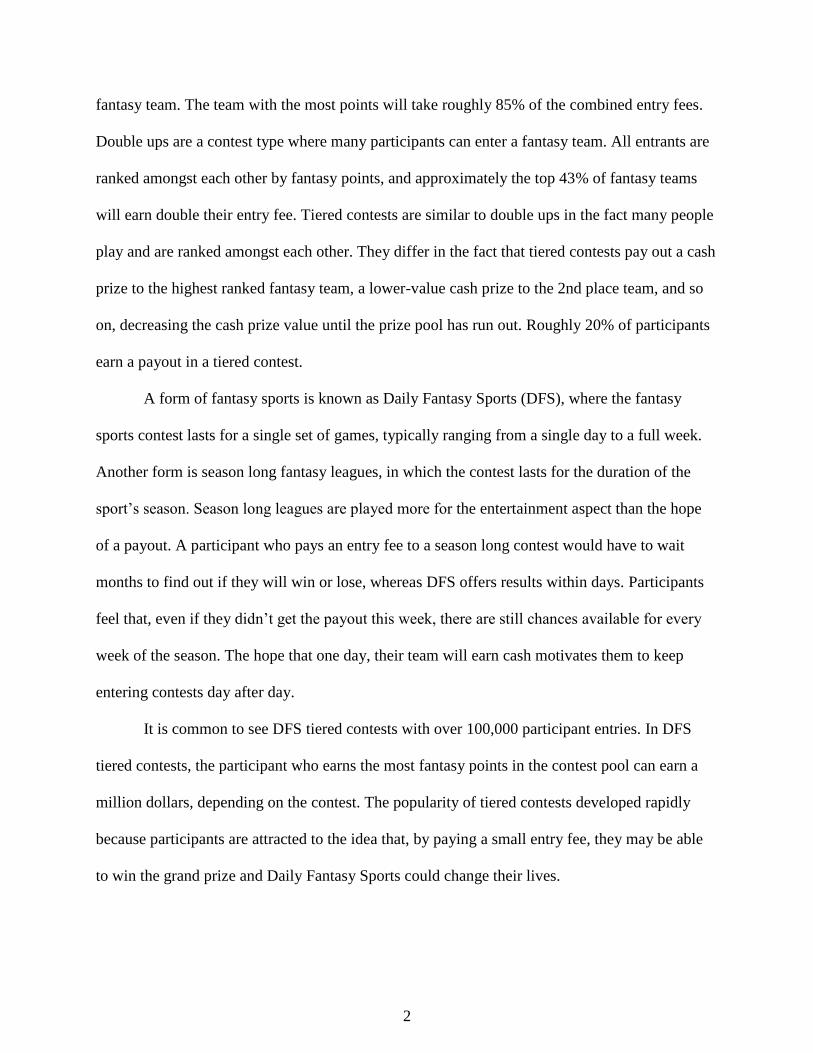
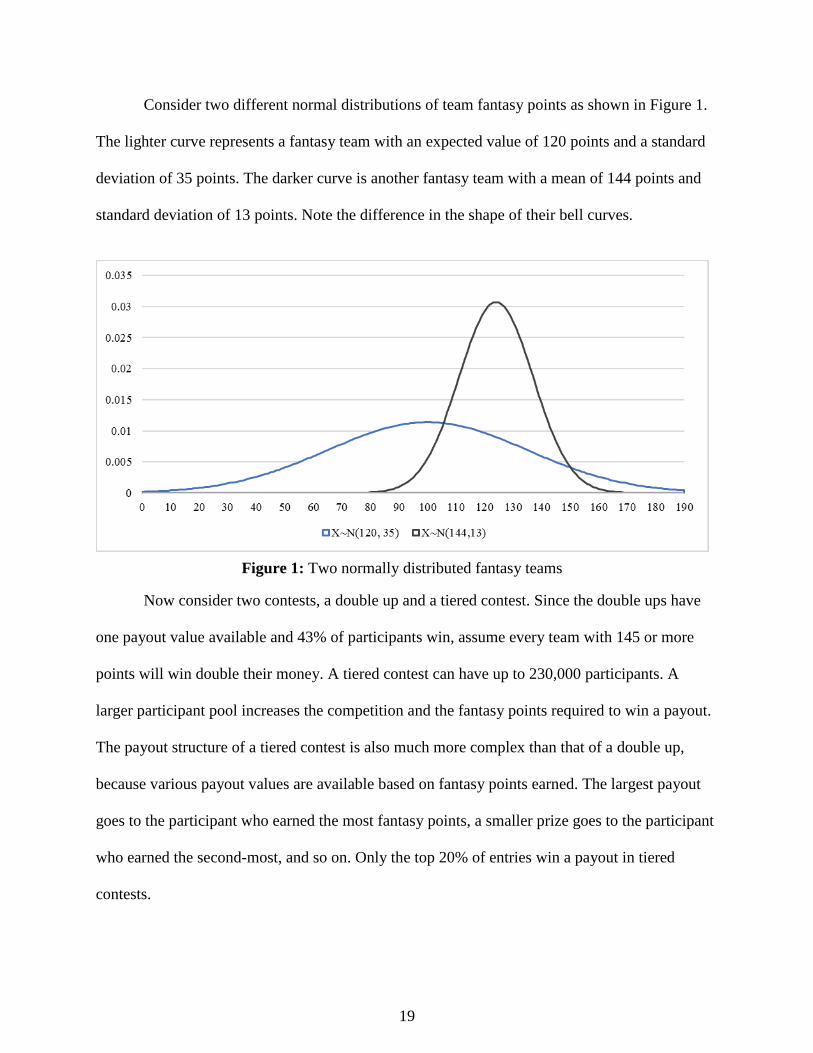
Consider two different normal distributions of team fantasy points as shown in Figure 1.
The lighter curve represents a fantasy team with an expected value of 120 points and a standard
deviation of 35 points. The darker curve is another fantasy team with a mean of 144 points and
standard deviation of 13 points. Note the difference in the shape of their bell curves.
Now consider two contests, a double up and a tiered contest. Since the double ups have
one payout value available and 43% of participants win, assume every team with 145 or more
points will win double their money. A tiered contest can have up to 230,000 participants. A
larger participant pool increases the competition and the fantasy points required to win a payout.
The payout structure of a tiered contest is also much more complex than that of a double up,
because various payout values are available based on fantasy points earned. The largest payout
goes to the participant who earned the most fantasy points, a smaller prize goes to the participant
who earned the second-most, and so on. Only the top 20% of entries win a payout in tiered
contests.
Figure 1: Two normally distributed fantasy teams

20
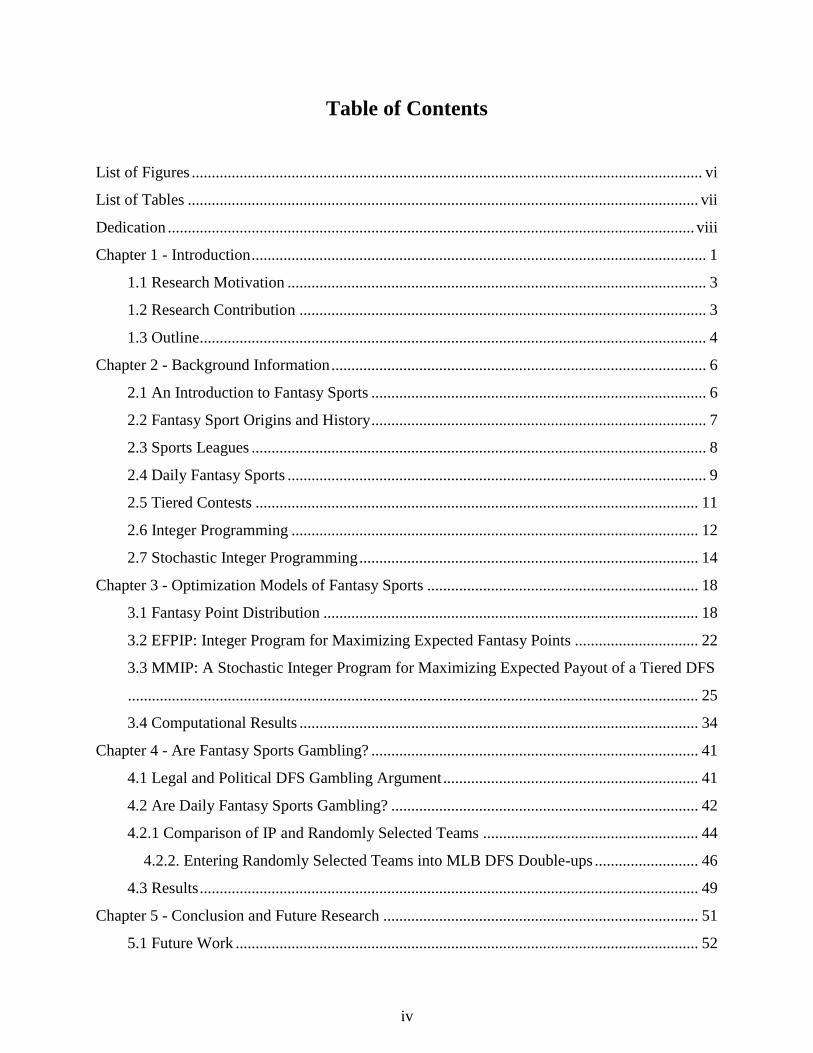
In a tiered contest, an average of 158.29 points are required to win a payout and 253.76
points results in the millionaire prize (DFSgold, 2017). The tiered estimated point thresholds are
the average of points needed to win the lowest payout available and the million dollar prize for
each week of the 2016-2017 NFL season on DraftKings®.
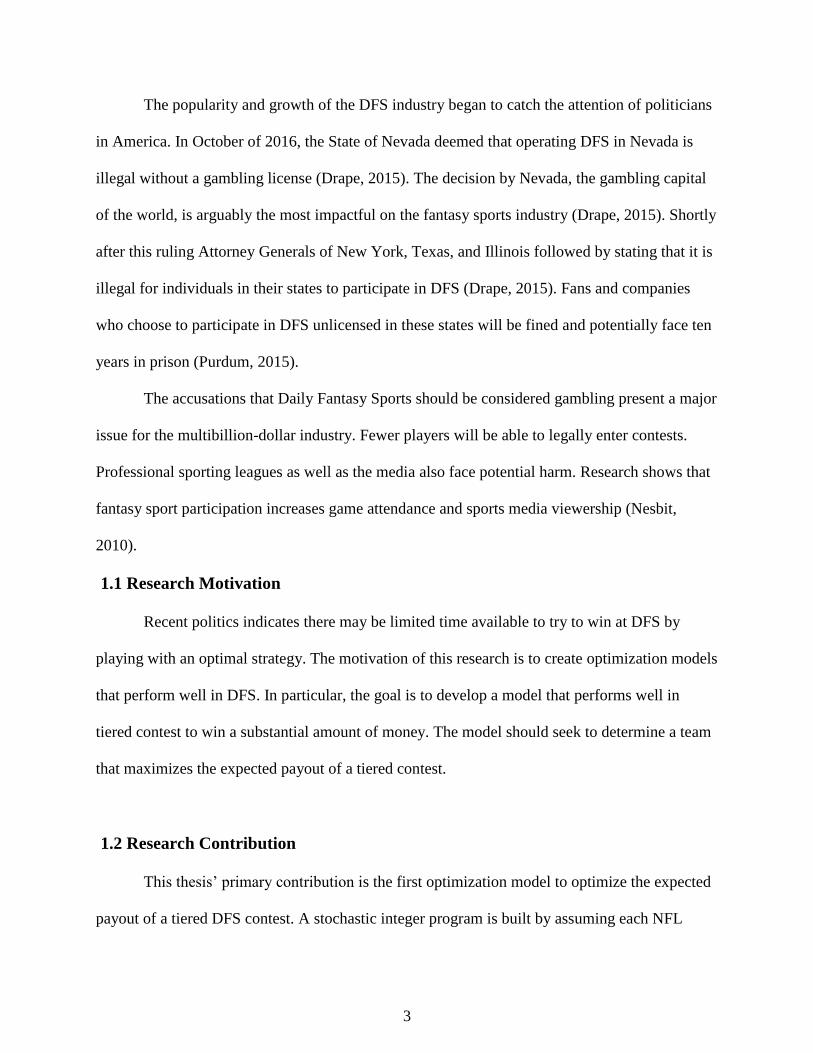
Observe in Figure 2 that if the team with the X ~ N(144, 13) curve plays in the double up,
the there is a reasonable probability of earning enough points to win a payout. In fact, this team
has a 0.4693 probability of earning money. For the X ~ N(120, 35) curve, there is a smaller
probability of 0.2375. This suggests that teams with a higher mean and lower variance perform
better in double up contests.
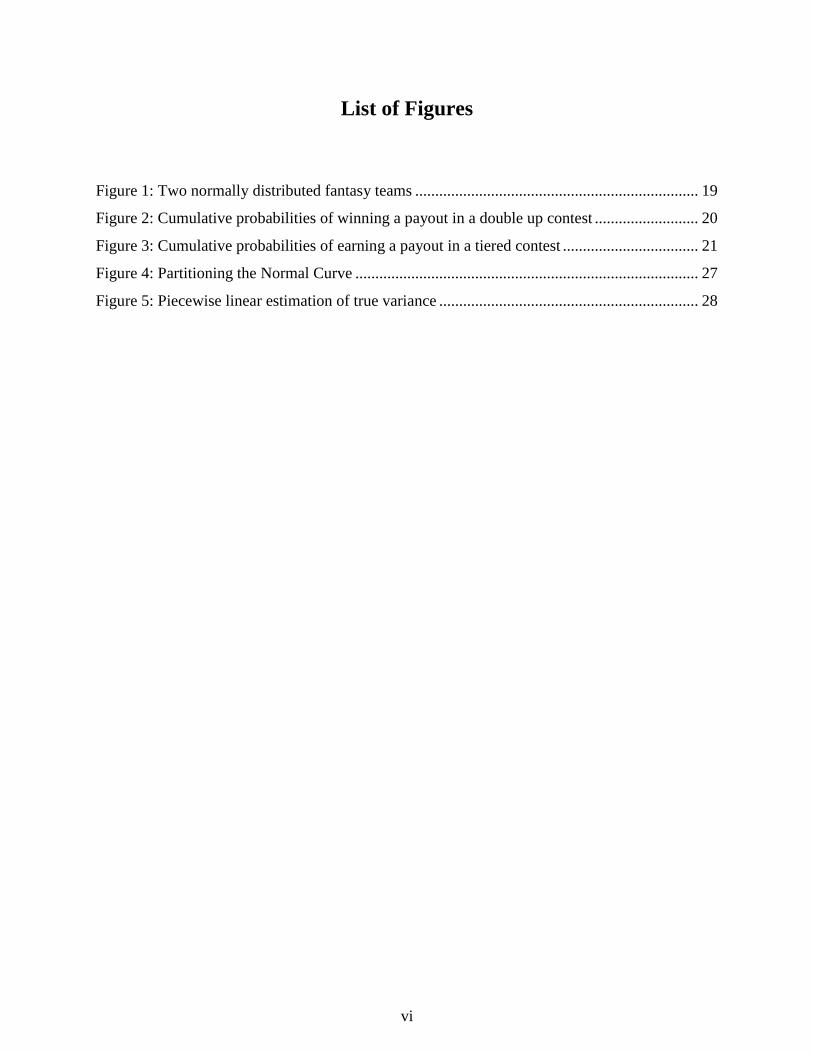
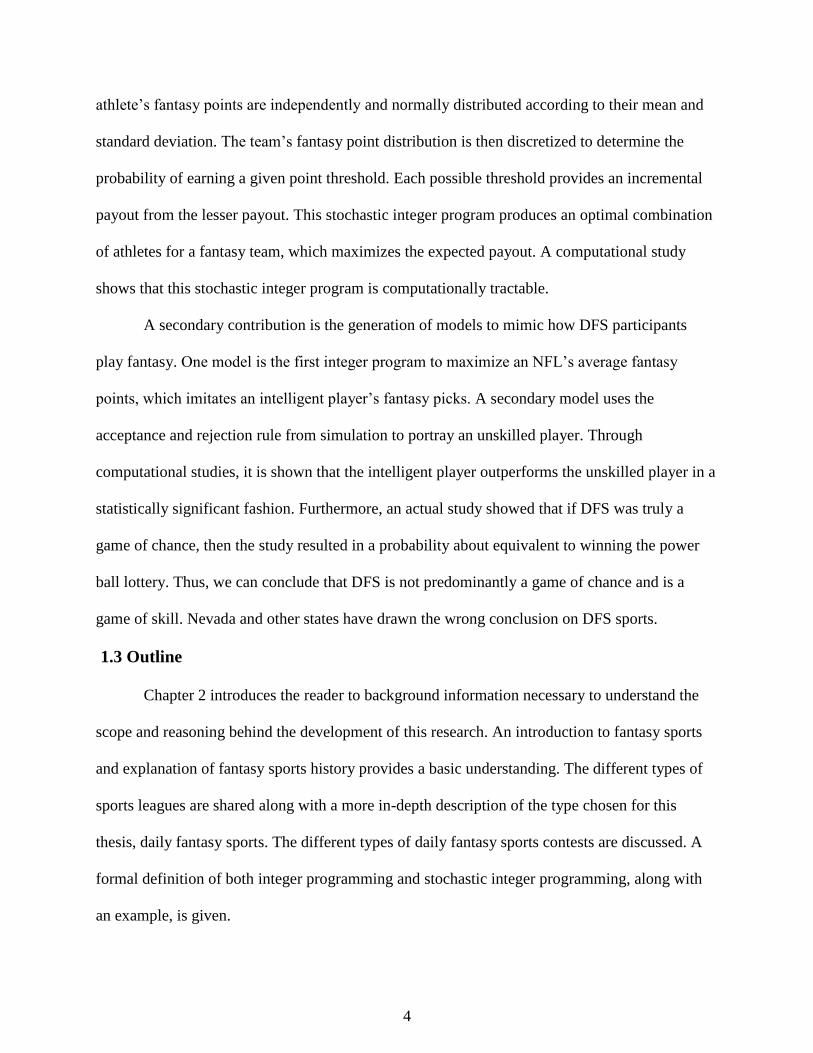
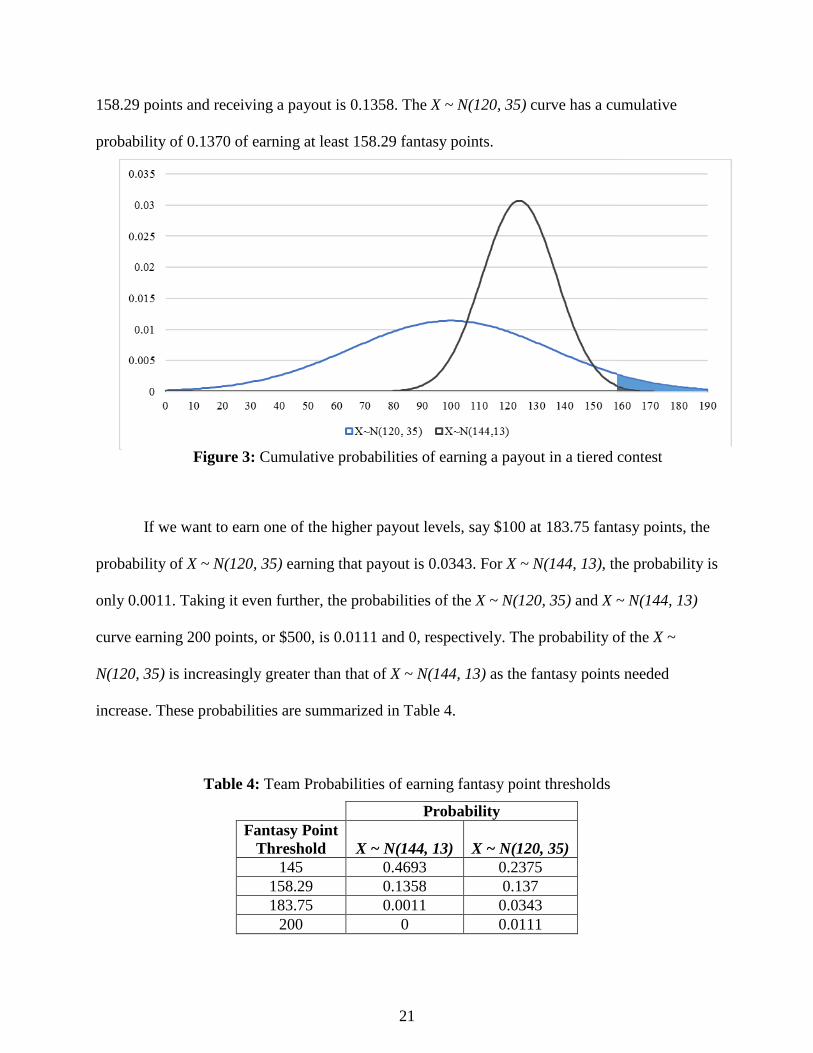
Figure 3 represents the same two fantasy teams now entered in a tiered contest. Here, we
see the benefit of a reasonable mean but large variance in tiered contests as the payout levels
increase. For instance, the cumulative probability of the X ~ N(144, 13) curve earning at least
Figure 2: Cumulative probabilities of winning a payout in a double up contest
21
158.29 points and receiving a payout is 0.1358. The X ~ N(120, 35) curve has a cumulative
probability of 0.1370 of earning at least 158.29 fantasy points.
If we want to earn one of the higher payout levels, say $100 at 183.75 fantasy points, the
probability of X ~ N(120, 35) earning that payout is 0.0343. For X ~ N(144, 13), the probability is
only 0.0011. Taking it even further, the probabilities of the X ~ N(120, 35) and X ~ N(144, 13)
curve earning 200 points, or $500, is 0.0111 and 0, respectively. The probability of the X ~
N(120, 35) is increasingly greater than that of X ~ N(144, 13) as the fantasy points needed
increase. These probabilities are summarized in Table 4.
Table 4: Team Probabilities of earning fantasy point thresholds
Probability
Fantasy Point
Threshold X ~ N(144, 13) X ~ N(120, 35)
145 0.4693 0.2375
158.29 0.1358 0.137
183.75 0.0011 0.0343
200 0 0.0111
Figure 3: Cumulative probabilities of earning a payout in a tiered contest
22
3.2 EFPIP: Integer Program for Maximizing Expected Fantasy Points
Winning daily fantasy sports is a matter of selecting the athletes that earn the most
fantasy points. The usefulness of integer programming in decision making is clear, motivating
the author to apply the technique to decision-making when creating a DFS lineup.
The data of the IP includes all athletes that are available for selection in the current week
of DFS. In addition, the athlete salaries are given by DraftKings®. The parameter si is the salary
assigned to an athlete by DraftKings® for the given contest. The parameter i represents the
anticipated number of fantasy points an athlete will earn in the contest. The anticipated fantasy
points for an athlete are calculated as the mean of points earned so far in the season. Thus, one
would expect i to become more accurate as the season progresses.
Researchers have used other techniques to determine each athlete’s anticipated fantasy
points, or i . A previous study determines i as the athlete’s average of a given statistic
multiplied by the defense/special team’s performance in defending that same statistic (Becker
and Sun, 2016). For instance, consider quarterback Drew Brees playing against the Kansas City
Chiefs (KC) in 2016. Brees’ estimated passing yards against KC would be the product of the
average number of passing yards he has earned and the percentage of passing yards allowed by
KC. This is calculated for each of the performance statistics that relate to the quarterback
position. The sum of all statistics will be the expected performance of Drew Brees againist KC.
The same process would be performed for all remaining athlete positions. The historical
performance of each offensive athlete and defense/special teams can be considered across
multiple seasons, with the current season weighted most heavily. Other research considers the
strength of a defense/special teams by assigning a z-score based on performance in defending a
statistic against the average of the NFL. Each statistic is assigned a weight based on the
23
researcher’s opinion. The product of an offensive athlete’s performance, the weight, and the z
score weight is determined as the anticipated fantasy points for that athlete (Boyd, 2014).
Finally, some utilize the expected fantasy points provided by websites such as Yahoo!, ESPN,
DraftKings® and more. As this thesis focuses on modeling, the author feels that the mean of the
current season provides a sufficient i for this research, although this is trivially adjustable to
these other measures.
The input data of the IP is all athletes that are available for selection in the current week
of DFS. Each of the athletes are placed into the set A, which is divided into subsets by position.
All athletes who play the position of quarterback are members of subset Q, running backs are
members of subset R, wide receivers of subset W, tight ends of subset T, and each team in the
National Football League (NFL) is a member of subset D, used to select a team defense/special
teams. For example, one may select the Kansas City Chiefs defense/special teams for the fantasy
team.
The input data is
A = {a1,…,an}, which is the set of all athletes and teams entering the contest
Q A, the set of all quarterbacks
R A, the set of all running backs
W A, the set of all wide receivers
T A, the set of all tight ends
D A, the set of all teams, which is used to select a defense/special teams.
Observe that .A Q R W T D The input parameters are
the salary assigned to athlete
the anticipated fantasy points earned by athlete
i
i
s i i A
i i A
24
Each decision variable, all binary, represents whether or not the athlete is selected for the fantasy
team. Thus, each athlete is assigned a variable xi, which is equal to 1 if the athlete is selected for
the fantasy team and equal to 0 if not selected. Thus, the decision variables are
1 if player is selected for the fantasy team
0 otherwisei
ix i A
The Expected Fantasy Points Integer Program (EFPIP) is
Maximize i ii Ax
Subject to:
1 (1)
2 (2)
3 (3)
1 (4)
7 (5)
1 (6)
0000 (7)
ii Q
ii R
ii W
ii T
ii R W T
ii D
i ii P
x
x
x
x
x
x
s x
xi є{0,1}n for all i є A (8)
The constraints (1) through (6) ensure that the appropriate number of athletes are selected
for each position. DraftKings® requires that a fantasy team has exactly one quarterback, which is
required by the IP in constraint (1). Continuing to follow DraftKings® requirements,at least two
running backs are required by constraint (2), at least three wide receivers by constraint (3), and at
minimum one tight is required by constraint (4). DraftKings® also requires exactly one flex
25
athlete. A flex athlete must play the position of running back, wide receiver, or tight end. The
flex is chosen in addition to the running backs, wide receivers, and tight end that have already
been selected. In other words, if two running backs, three wide recievers, one tight end, and one
flex athlete are chosen as required, the sum is seven selected players as stated by constraint (5).
The requirement of selecting one defense/special teams is set by constraint (6). The DraftKings®
team salary cap is set to 50,000. Thus, constraint (7) ensures that the sum of the selected athlete
salaries does not exceed the salary cap required by DraftKings® of $50,000. Finally, constraint
(8) requires that each athlete’s decision variable takes a binary value.
To the best of the author’s knowledge, EFPIP is the first IP to model DFS for the NFL. A
similar model was developed for the English sport cricket (Bhattacharjee, Dibyojyoti, Saikia,
2015). The research presented in this thesis expands the IP models of fantasy sports by
incorporating stochastic modeling to further increase the probability of getting paid.
EFPIP was created and solved using CPLEX 12.5, a commercial software package. None
of the problems required over 1 seconds on a Pentium 4 3.3 GHz processor with 12 GB of RAM.
Thus, EFPIP is simple to solve and results are described in the computational study found in
section 3.4.
3.3 MMIP: A Stochastic Integer Program for Maximizing Expected Payout of a
Tiered DFS
The primary contribution of this research is a stochastic integer program which
maximizes the expected payout of a tiered DFS contest, referred to as MMIP. In a tiered DFS
contest, participants earn a cash prize dependent on their fantasy team's performance. The

26
highest payout will be awarded to first place, a lower payout will be awarded to second place,
and so on.
The number of points that a fantasy team earns is the sum of the player’s distributions.
Thus, the expected payout for any contest is the sum over all payouts multiplied by the
probability that the team achieves that payout level. Prior to the athletes playing, the fantasy
points required to earn a particular payout is unknown and is estimated for each payout level.
The DFS tiered contest defines the payout structure. Let the set of payouts in the
structure, or cash levels, be L={l1, l2,…, lm}. For example, the NFL millionaire maker tournament
has l1 = $1,000,000, l2 = $100,000, …, l30 = $25 and l31 = $0. Prior to the contest, the amount of
needed to earn a particular payout in level is estimated and given as E = {e1, e2,…, em}. For
instance, a participant would need to earn at least e1 = 253.76 points to reach the $1,000,000
payout level. The estimated points for a payout of $100,000 would need to earn between 250.57
and 253.76 fantasy points. To receive the $25 payout, the team must score 158.29 or more
points.
A vital component of MMIP is the modeling of the payouts from a cumulative payout
standpoint. If the participant ends up exceeding 253.76 points and winning the $1,000,000 prize,
it is equivalent to earning an additional $900,000, which is the incremental increase in payout
from l2 = $100,000 to l1 = $1,000,000. This is done for each incremental increase between
ascending payout levels in L and is denoted by αj = lj - lj+1 for j = 1, ..., m-1. Therefore, α1 =
$900,000, α2 = $40,000, …, α30 = $25.
Due to the construction of E, any team earning 158.29 or more points earns $25. Thus,
the expected payout of a team is the probability that a team earns 253.76 or more points
multiplied by $900,000 plus the probability that a team earns 250.57 or more points multiplied

27
by $100,000. This continues summing until the probability that the team earns 158.29 or more
multiplied by $25.
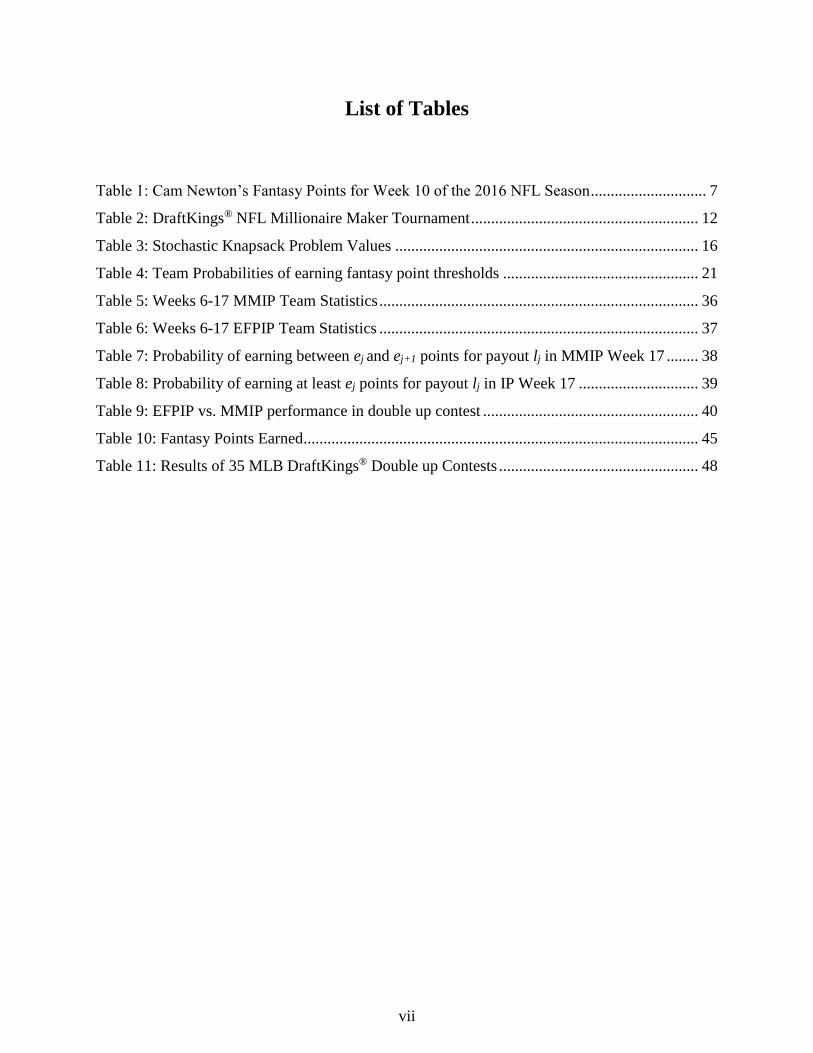
Since the normal distribution is severely nonlinear and the fact that there are a limited
number of different payout levels, the model discretizes the cumulative normal distribution based
upon a standard normal. To achieve this let R = {r1,…,rq} be an ascending set of points. Denote
Z = {z1,…,zq} to be the probability that a point of a standard normal occurs between rk and ∞ for
k = 1,…, q. For example, if R = {1, 2, 3}, then Z = {.1587, .0228, .0013}. In other words, r1 = 1
and the probability that a standard normal is larger than one standard deviation is .1587. The
probability that a standard normal is larger than r2, or two standard deviations above the mean is
0.0228. This is shown in Figure 4, where solid region represents the 0.1587 probability and the
overlaying stripes represent the 0.0228 probability.
The team’s variance is merely the sum of the individual player’s variance. However, to
calculate a normal probability, one needs the standard deviation. To maintain linearity of the
Figure 4: Partitioning the Normal Curve
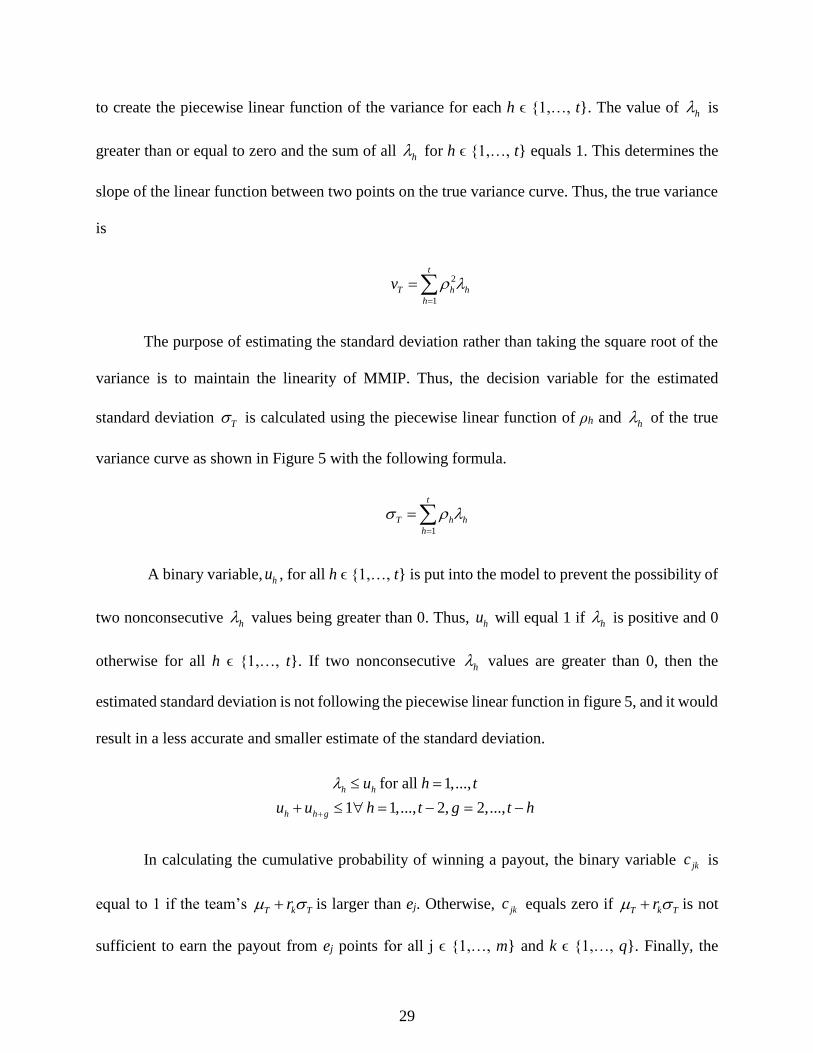
28
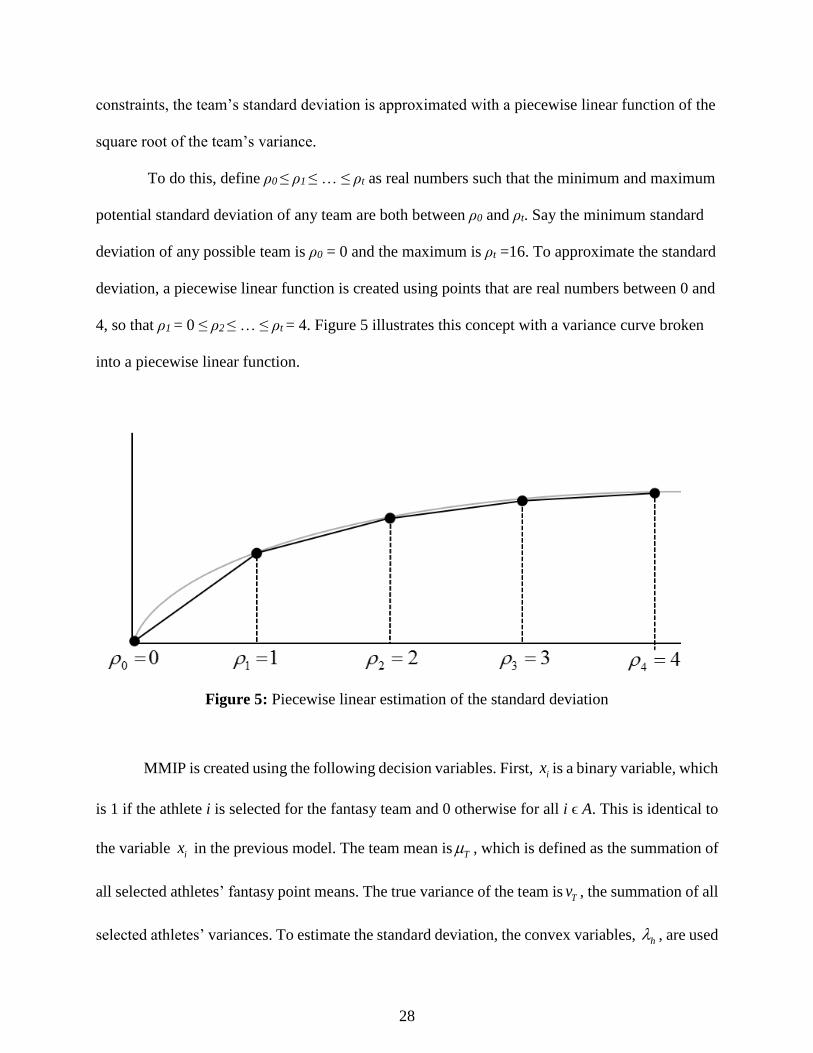
constraints, the team’s standard deviation is approximated with a piecewise linear function of the
square root of the team’s variance.
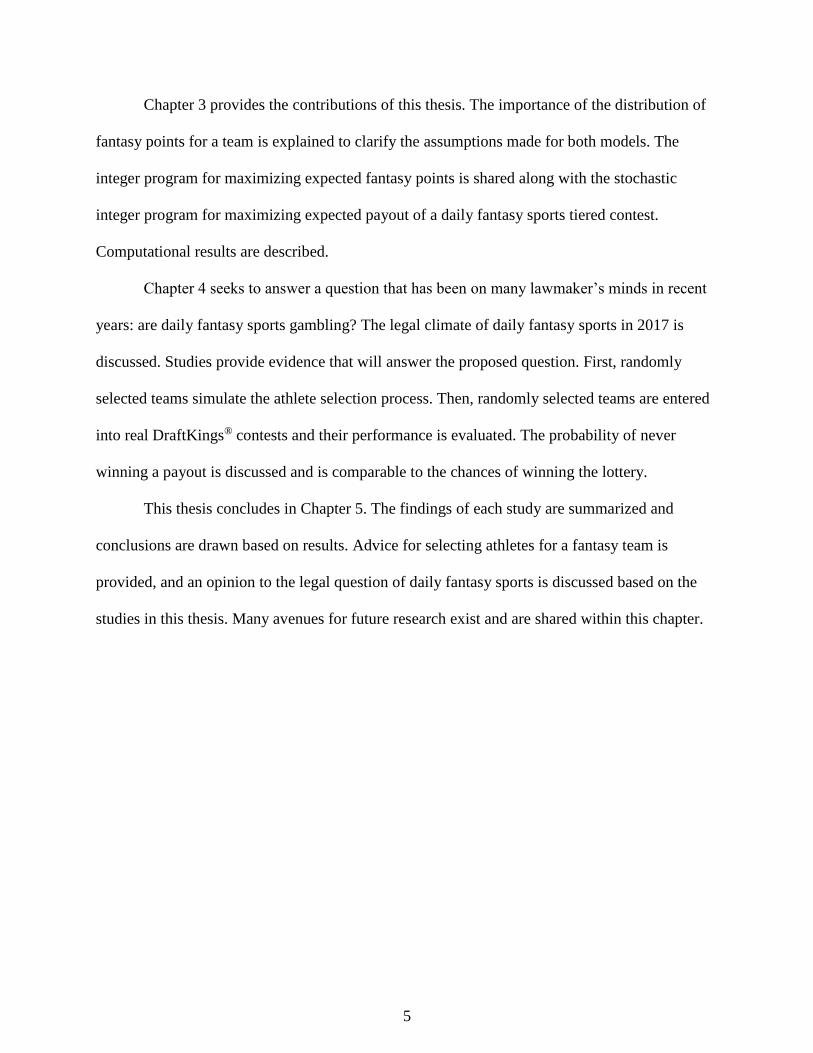
To do this, define ρ0 ≤ ρ1 ≤ … ≤ ρt as real numbers such that the minimum and maximum
potential standard deviation of any team are both between ρ0 and ρt. Say the minimum standard
deviation of any possible team is ρ0 = 0 and the maximum is ρt =16. To approximate the standard
deviation, a piecewise linear function is created using points that are real numbers between 0 and
4, so that ρ1 = 0 ≤ ρ2 ≤ … ≤ ρt = 4. Figure 5 illustrates this concept with a variance curve broken
into a piecewise linear function.
MMIP is created using the following decision variables. First, ix is a binary variable, which
is 1 if the athlete i is selected for the fantasy team and 0 otherwise for all i ϵ A. This is identical to
the variable ix in the previous model. The team mean is T , which is defined as the summation of
all selected athletes’ fantasy point means. The true variance of the team is Tv , the summation of all
selected athletes’ variances. To estimate the standard deviation, the convex variables, h , are used
Figure 5: Piecewise linear estimation of the standard deviation
29
to create the piecewise linear function of the variance for each h ϵ {1,…, t}. The value of h is
greater than or equal to zero and the sum of all h for h ϵ {1,…, t} equals 1. This determines the
slope of the linear function between two points on the true variance curve. Thus, the true variance
is
2
1
t
T h h
h
v
The purpose of estimating the standard deviation rather than taking the square root of the
variance is to maintain the linearity of MMIP. Thus, the decision variable for the estimated
standard deviation T is calculated using the piecewise linear function of ρh and h of the true
variance curve as shown in Figure 5 with the following formula.
1
t
T h h
h
A binary variable, hu , for all h ϵ {1,…, t} is put into the model to prevent the possibility of
two nonconsecutive h values being greater than 0. Thus, hu will equal 1 if h is positive and 0
otherwise for all h ϵ {1,…, t}. If two nonconsecutive h values are greater than 0, then the
estimated standard deviation is not following the piecewise linear function in figure 5, and it would
result in a less accurate and smaller estimate of the standard deviation.
for all 1,...,
1 1,..., 2, 2,...,
h h
h h g
u h t
u u h t g t h
In calculating the cumulative probability of winning a payout, the binary variable jkc is
equal to 1 if the team’s T k Tr is larger than ej. Otherwise, jkc equals zero if
T k Tr is not
sufficient to earn the payout from ej points for all j ϵ {1,…, m} and k ϵ {1,…, q}. Finally, the
30
cumulative probability that the team earns at least ej points is the decision variable jp , which is
calculated by multiplying all zk by jkc .
With this information, the MMIP can now be formalized. This begins by gathering the data
for each tiered DFS. The player data is
1,..., , the set of all athletes and teams
, the set of all quarterbacks
, the set of all running backs
, the set of all wide receivers
, the set of all tight ends
, the set of all defen
nA a a
Q A
R A
W A
T A
D A
se/special teams
the salary assigned to player for all
the sample mean fantasy points of player for all
the sample standard deviation fantasy points of player for all
i
i
i
s i i A
i i A
i i A
The contest data is
1
1 1
1
,..., , the set of all tiered payout levels for all 1,...,
- , the incremental increase from payout level to for all 1,..., 1
,..., , the set of estimated points required to
m
j j j j j
m
L l l j m
l l l l j m
E e e
1
1
earn incremental payout for 1,...,
,..., , the set of ascending points representing the number of standard deviations from the mean
,..., , the probabilities that a standard normal distribu
q
q
j j m
R r r
Z z z
1
tion is greater than for 1,...,
,..., , the points used to linearly approximate the standard deviation from the variance
k
t
r k q
The decision variables are
if athlete is chosen for fantasy teamfor all
therwise
the expected number of points earned by the selected fantasy team
the variance of po
1
i
o
t
0
n s
i
T
T
x i
v
iA
earned by the selected fantasy team
the estimated standard deviation of points earned by the selected fantasy teamT
31
the convex proportion used to estimate the standard deviation of the fantasy team for all 1, ,
1 if and only iffor all 1, ,
0 otherwise
if r +
therwise
0
1
0 o
k T T j
h
h
h
jk
h t
hu t
ec
for all 1, , and 1, ,
the probability that the fantasy team earns at least points for all 1, ,jjp
j m k q
e j m
The Millionaire Maker Integer Program (MMIP) is
Maximize j j
j L
p
Subject to:
2
2
1
1
1 (1)
2 (2)
3 (3)
1 (4)
7 (5)
1 (6)
50,000 (7)
(8)
(9)
(10)
1 (11)
for all 1,..., (12)
i
i Q
i
i R
i
i W
i
i T
ii R W T
i
i D
i i
i A
T i ii A
T i ii A
t
T h h
h
t
h
h
h h
x
x
x
x
x
x
s x
x
v x
v
u h t

32
1
1
1 1,..., 2, 2,..., (13)
(14)
for all 1,... and 1,..., (15)
( ) 0.001 (1 ) for all 1,..., and 1,..., (16)
for all 1,... (17)
{0,1} f
h h g
t
T h h
h
T k T j jk
T k T j jk
q
j jk k
k
i
u u h t g t h
r e Mc j m k q
r e M c j m k q
p c z j m
x
or all 1,..., (18)
{0,1} for all 1,... and 1,..., (19)
0 1 for all 1,... (20)
0 (21)
0 (22)
{0,1} for all 1,..., (23)
0 for all 1,..., (24)
0 for all 1,..., (25)
jk
j
T
T
h
h
h
i n
c j m k q
p j m
v
u h t
h t
h t
The objective function maximizes the expected payout by multiplying the payout
increments j by the probability that the fantasy team will earn at least enough fantasy points to
achieve incremental payout jp . The output is the expected winnings of the contest, which is
maximized by selecting athletes that will help to reach high fantasy point values. The more
fantasy points a participant can earn, the higher the probability of their fantasy team earning a
top payout.
Constraints (1) through (6) ensure that the required number of athletes for each position
are selected for the fantasy team. For example, a fantasy team requires exactly one quarterback,
thus the sum of all selected quarterbacks must equal one as shown in constraint (1). Constraint
(7) ensures that the fantasy team’s salary is under the salary cap set by DraftKings®. The salary
cap is set to $50,000 for DraftKings® DFS contests. The fantasy team’s salary is calculated by
33
taking the sum of all selected player’s salaries. Thus, to earn the top payout, a participant cannot
just use the strategy of selecting all of the most expensive athletes. These first seven constraints
are identical to the previous model in section 3.1.
Each athlete is assumed to be an independent random variable from a normal distribution.
Therefore, the team’s fantasy points fit a normal distribution with a mean and variance that is the
sum of each selected individual athlete’s mean and variance. Thus, the fantasy team’s mean and
variance is calculated in (8) and (9), respectively. The mean and variance are true values of the
team’s fantasy points, but to retain linearity of the model, the square root of the variance cannot
be taken to get the value of the team’s standard deviation. Rather, another technique must be
used to estimate standard deviation.
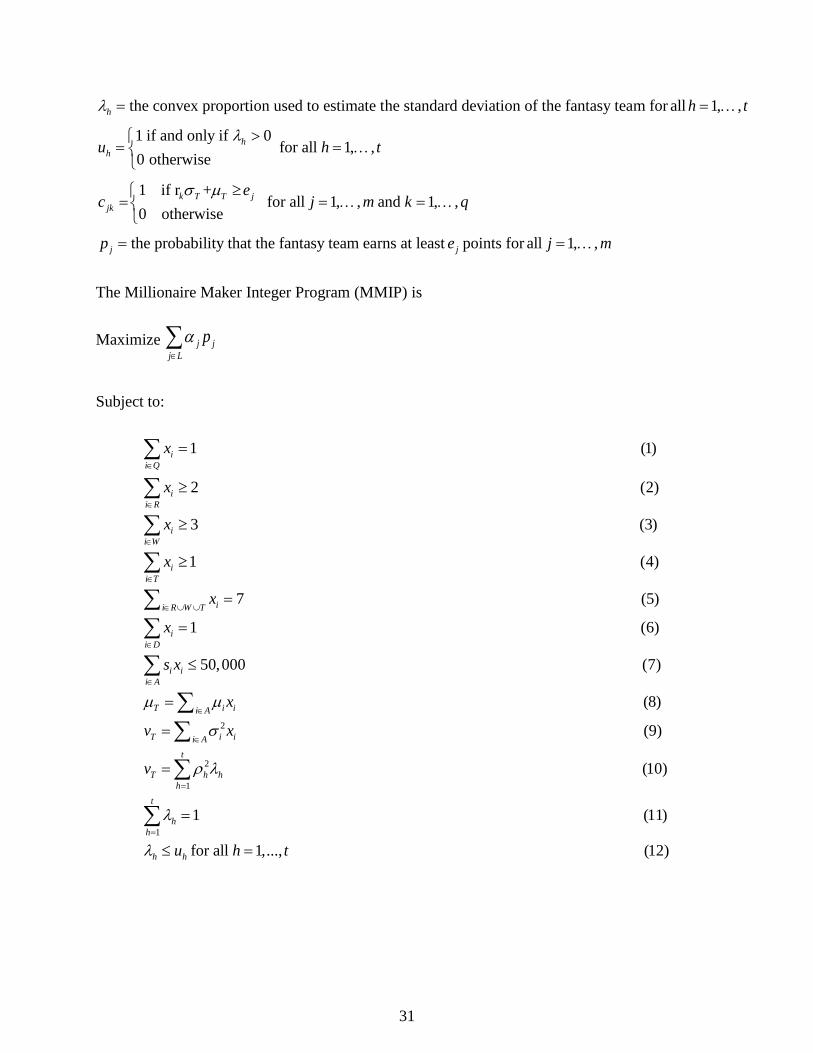
The team’s standard deviation is estimated through a piecewise linear function of the
team’s variance with constraints (10) through (14). For better comprehension, this approximation
technique was introduced with the decision variables to estimate the standard deviation of the
team. The team’s variance is approximated in constraint (10) through 1,..., t . Constraints
(11) - (14) provide a convex combination with at most two adjacent nonzero λ’s of the team’s
standard deviation. Refer to Figure 5 for a visual representation. This method is a standard
technique for approximating nonlinear functions.
The probability that the fantasy team will earn ej points, or the amount of points needed
to earn payout level lj, is calculated in constraints (15) through (17). The fantasy team’s mean
and standard deviation are put into constraints (15) and (16) to force the binary variable cjk to
equal 1 or 0. Constraint (15) forces cjk to equal 1 when the fantasy team mean plus rk multiplied
by the team’s estimated standard deviation is larger than ej, the number of fantasy points needed
34
to earn payout level lj. When the team’s mean plus rk standard deviations is less than ej points, cjk
will be forced to zero through constraint (16).
Constraint (17) determines the total probability the fantasy team will earn payout level lj.
Since cjk =1 if the team with rk standard deviations is enough to earn payout ej, the probability of
earning incremental payout ej equals the sum of all of zkcjk over all k for each payout level j. This
is accurate due to the incremental payout and the fact that the zk is calculated as anything above
rk. Finally, constraints (18) through (24) set the range of each decision variable.
Now MMIP has been created, the performance of selected teams can be studied. The
following section provides computational results for MMIP. The reader should note that as
Kansas State University is a public institution, thus the teams from this model have never been
entered into an actual fantasy contest. Consequently, the study here is purely academic in nature.
3.4 Computational Results
The MMIP has been coded in Python 2.7 and run for each week of the 2016-2017 NFL
season starting with week six. The study was performed on a PC Intel® CoreTM i7-6700 CPU at
3.4 GHz and 32 GB of RAM. Data was not incorporated from previous seasons under the
assumption that the previous years’ statistics have minimal impact on the current season
performance. One would expect the model to gain accuracy as the season progresses due to the
increase in data available for the season.
Another difference from the model to an actual DFS contest is the pool of athletes that
MMIP can select. Every athlete that played during the given week of the NFL season is eligible
to be a member of the fantasy team. In real DFS contests, the participant does not always have
the choice of every game played during the week, but rather must choose from an athlete pool

35
from a limited set of the week’s games. Thus, this MMIP had far more options for athletes in this
study than are truly available in a DFS contest. MMIP can easily be modified to reflect the actual
set of athletes available for a given contest. One would just need to insert the set of athletes and
remove those that are not eligible.
This study used t = 61 partitions of the true variance curve for ρt. The estimates are from
0 to 60, incrementing by 1. Thus, 0,1,...,60 . The majority of team variances are between
10 and 40. Therefore, the maximum error of the estimated standard deviation is bounded by .02
and the justification for linearly approximating the team’s standard deviation should have little to
no impact on the accuracy of the results.
MMIP uses over 100 different intervals of standard deviations rk to determine the
probability pk of earning at least T k Tr points. The z-table begins with 0.2 standard
deviations, climbing by 0.01 until arriving at 0.9. The standard deviations then increase by a
0.001 step size until 0.999 is reached, where the step size becomes 0.0001 until 0.9999. Finally,
the step size shrinks to 0.00001 until ending at 0.99999. Thus, rh = 4.26489 and the maximum
selected fantasy points that a team can reach is 4.26489T T . Furthermore, the team should
only perform at least that well 1 in 100,000 times.
This number of partitions may seem excessive to the reader. Recall that over 100,000
contestants enter the tournament. Furthermore, the largest payouts occur as the probability of
achieving that score or more approaches 0. For instance, the difference in expected value
between a 0.0001 probability of winning $1,000,000 and 0.00005 is $50. Thus, having this latter
set of small probabilities provides a substantial impact on the expected value. Additionally, a
failure to partition the space sufficiently may result in identical probability of earning the same
prize, which implies some prizes could never be won by a fantasy team due to the partitions rk.
36
Table 5: Weeks 6-17 MMIP Team Statistics
Week Team Mean Team Standard Deviation
6 165.06 38.28
7 171.63 37.32
8 183.66 34.23
9 180.24 35.74
10 174.26 32.50
11 164.29 32.03
12 167.06 31.16
13 167.31 33.61
14 165.58 28.68
15 157.99 31.05
16 150.73 33.52
17 150.25 31.53
Average 166.51 33.304
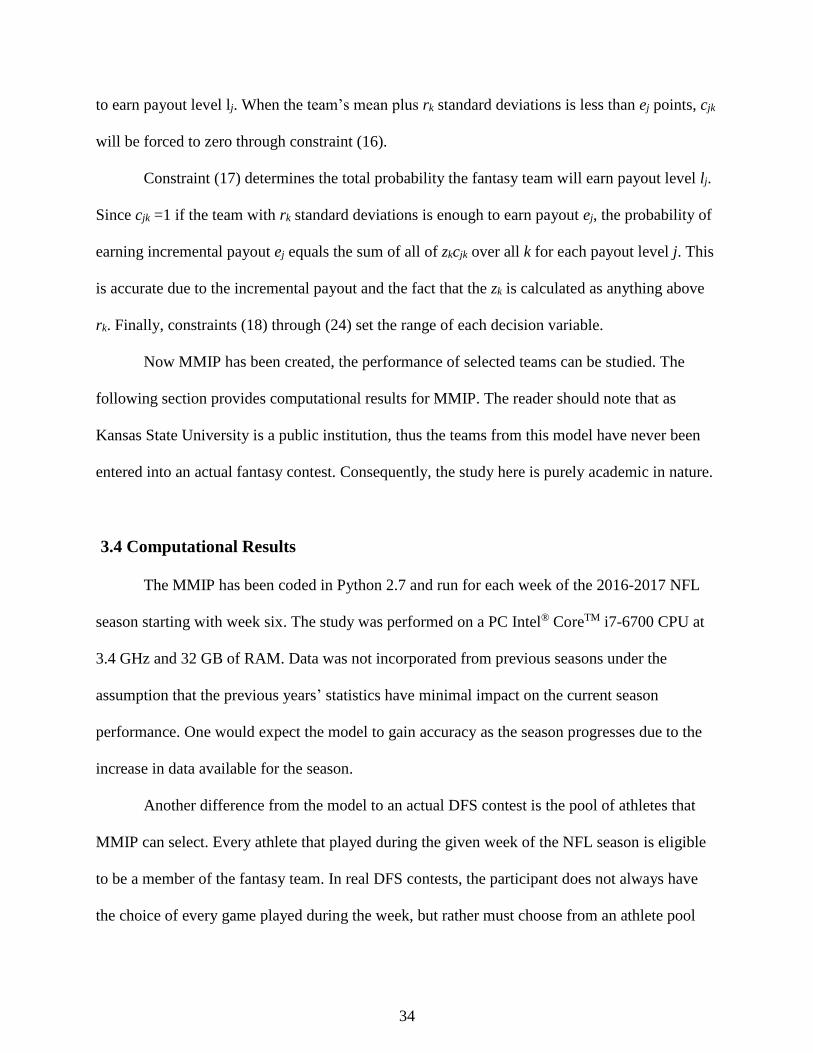
These MMIPs are reasonably large. They have over 100,000 constraints and 3,500
variables. Fortunately, none of the MMIPs required over 30 seconds to solve. Consequently, the
number of partitions and linear approximations could be increased and still maintain tractability.
However, the current model obtains a solution that is sufficiently close to a real-world solution.
The team mean and standard deviation for weeks 6 through 17 for optimal teams
generated by MMIP are displayed above in Table 5. Note that over the season, the mean
fluctuates while the standard deviation decreases. This aligns with the prediction that the team’s
expected value would become more realistic over the course of the season due to having more
data. Additionally, the buildup of data decreased the standard deviation over time as predicted.
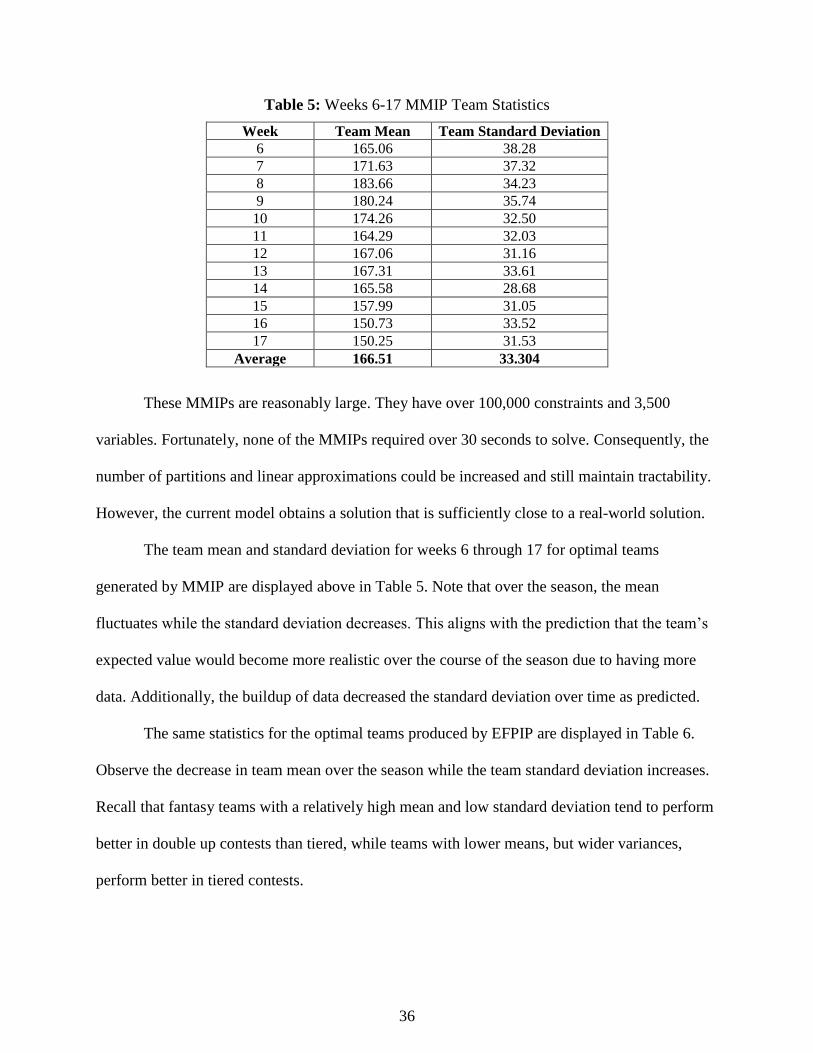
The same statistics for the optimal teams produced by EFPIP are displayed in Table 6.
Observe the decrease in team mean over the season while the team standard deviation increases.
Recall that fantasy teams with a relatively high mean and low standard deviation tend to perform
better in double up contests than tiered, while teams with lower means, but wider variances,
perform better in tiered contests.
37
Table 6: Weeks 6-17 EFPIP Team Statistics
Week Team Mean Team Standard Deviation
6 176.16 26.93
7 179.22 29.14
8 190.06 27.20
9 184.89 30.40
10 176.56 27.91
11 167.42 25.73
12 170.61 28.11
13 172.58 30.37
14 171.79 25.27
15 166.06 24.89
16 162.60 27.10
17 159.54 23.78
Average 173.12 27.236
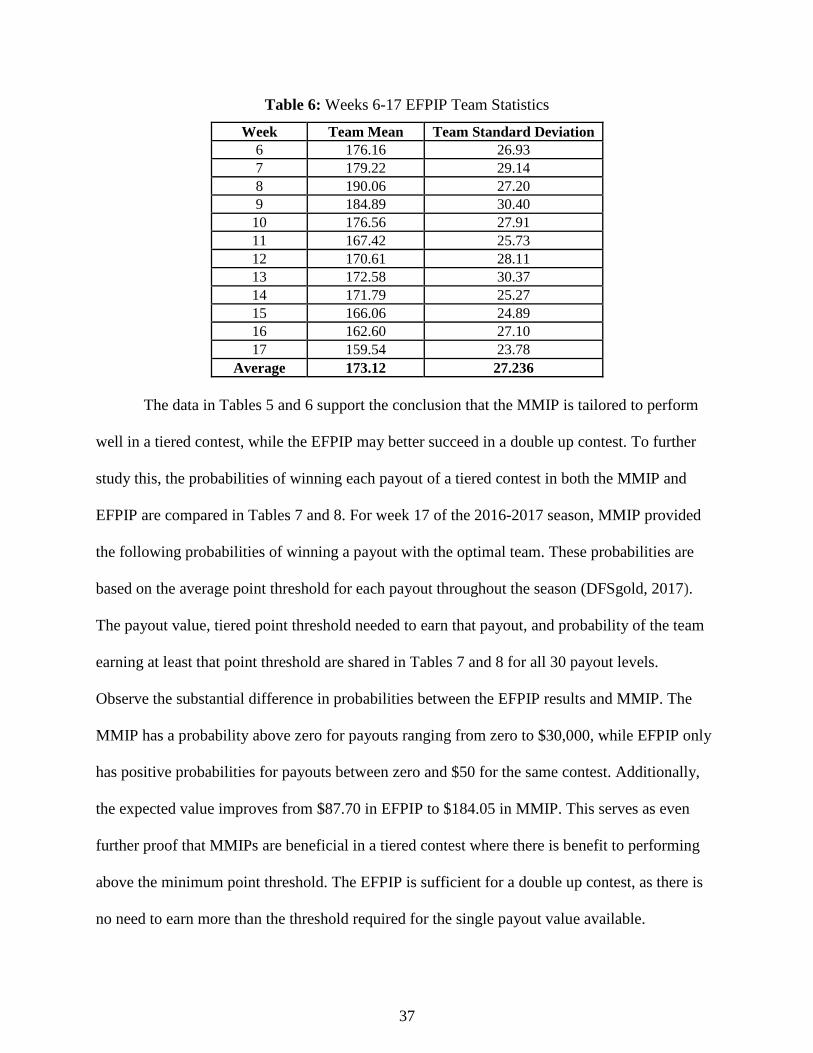
The data in Tables 5 and 6 support the conclusion that the MMIP is tailored to perform
well in a tiered contest, while the EFPIP may better succeed in a double up contest. To further
study this, the probabilities of winning each payout of a tiered contest in both the MMIP and
EFPIP are compared in Tables 7 and 8. For week 17 of the 2016-2017 season, MMIP provided
the following probabilities of winning a payout with the optimal team. These probabilities are
based on the average point threshold for each payout throughout the season (DFSgold, 2017).
The payout value, tiered point threshold needed to earn that payout, and probability of the team
earning at least that point threshold are shared in Tables 7 and 8 for all 30 payout levels.
Observe the substantial difference in probabilities between the EFPIP results and MMIP. The
MMIP has a probability above zero for payouts ranging from zero to $30,000, while EFPIP only
has positive probabilities for payouts between zero and $50 for the same contest. Additionally,
the expected value improves from $87.70 in EFPIP to $184.05 in MMIP. This serves as even
further proof that MMIPs are beneficial in a tiered contest where there is benefit to performing
above the minimum point threshold. The EFPIP is sufficient for a double up contest, as there is
no need to earn more than the threshold required for the single payout value available.
38
Table 7: Probability of earning between ej and ej+1 points for payout lj in MMIP Week 17
Payout Fantasy Points Probability Payout Fantasy Points Probability
$1,000,000.00 253.76 0.00% $750.00 202.84-206.03 1.00%
$100,000.00 250.58 0.00% $500.00 199.66-202.84 1.00%
$60,000.00 247.4 0.00% $300.00 196.48-199.66 2.00%
$40,000.00 244.21+ 0.00% $200.00 193.30-196.48 1.00%
$30,000.00 241.03-244.21 0.15% $150.00 190.11-193.30 2.00%
$20,000.00 237.85-241.03 0.05% $125.00 186.93-190.11 2.00%
$15,000.00 234.67-237.85 0.10% $100.00 183.75-186.93 2.00%
$10,000.00 231.48-234.67 0.10% $80.00 180.57-183.75 2.00%
$7,500.00 228.30-231.48 0.20% $65.00 177.38-180.57 3.00%
$5,000.00 225.12-228.30 0.20% $50.00 174.20-177.38 3.00%
$4,000.00 221.94-225.12 0.10% $40.00 171.02-174.20 3.00%
$3,000.00 218.75-221.94 0.00% $35.00 167.84-171.02 3.00%
$2,500.00 215.57-218.75 0.00% $30.00 164.65-167.84 4.00%
$2,000.00 212.39-215.57 1.10% $25.00 158.29-164.65 7.00%
$1,500.00 209.21-212.39 1.00% $0 0.00-158.29 61%
$1,000.00 206.03-209.21 0.00% Expected Value $184.05
39
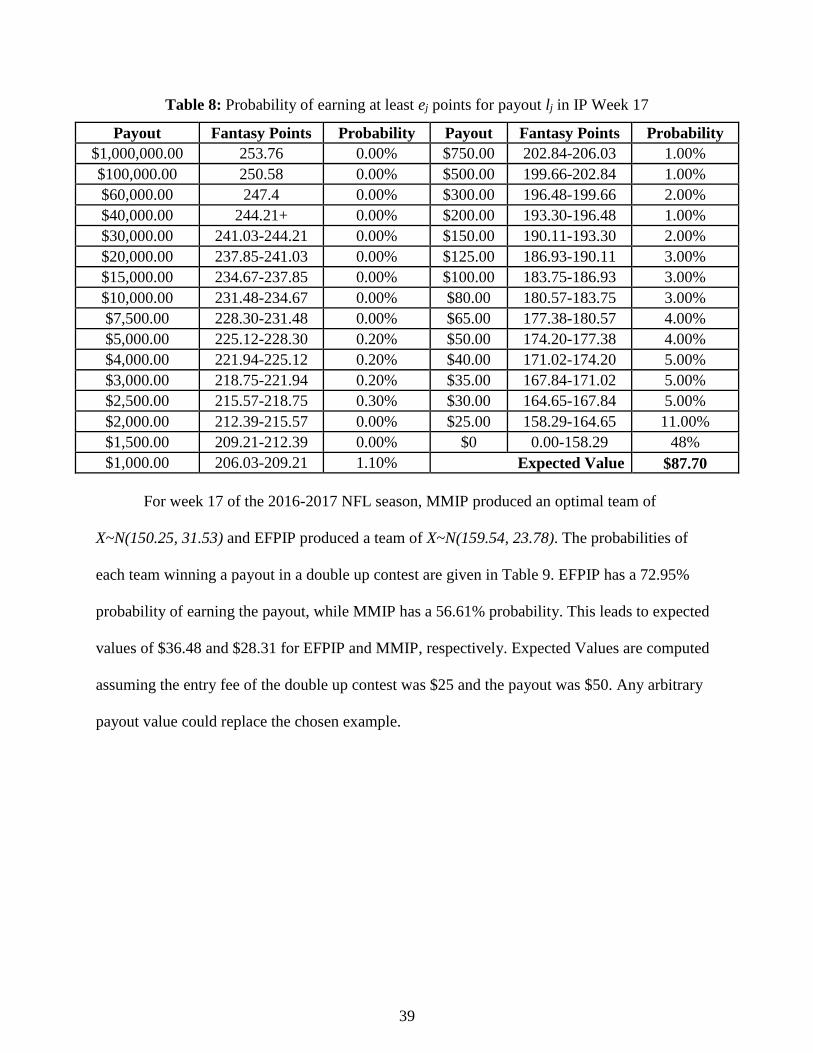
Table 8: Probability of earning at least ej points for payout lj in IP Week 17
Payout Fantasy Points Probability Payout Fantasy Points Probability
$1,000,000.00 253.76 0.00% $750.00 202.84-206.03 1.00%
$100,000.00 250.58 0.00% $500.00 199.66-202.84 1.00%
$60,000.00 247.4 0.00% $300.00 196.48-199.66 2.00%
$40,000.00 244.21+ 0.00% $200.00 193.30-196.48 1.00%
$30,000.00 241.03-244.21 0.00% $150.00 190.11-193.30 2.00%
$20,000.00 237.85-241.03 0.00% $125.00 186.93-190.11 3.00%
$15,000.00 234.67-237.85 0.00% $100.00 183.75-186.93 3.00%
$10,000.00 231.48-234.67 0.00% $80.00 180.57-183.75 3.00%
$7,500.00 228.30-231.48 0.00% $65.00 177.38-180.57 4.00%
$5,000.00 225.12-228.30 0.20% $50.00 174.20-177.38 4.00%
$4,000.00 221.94-225.12 0.20% $40.00 171.02-174.20 5.00%
$3,000.00 218.75-221.94 0.20% $35.00 167.84-171.02 5.00%
$2,500.00 215.57-218.75 0.30% $30.00 164.65-167.84 5.00%
$2,000.00 212.39-215.57 0.00% $25.00 158.29-164.65 11.00%
$1,500.00 209.21-212.39 0.00% $0 0.00-158.29 48%
$1,000.00 206.03-209.21 1.10% Expected Value $87.70
For week 17 of the 2016-2017 NFL season, MMIP produced an optimal team of
X~N(150.25, 31.53) and EFPIP produced a team of X~N(159.54, 23.78). The probabilities of
each team winning a payout in a double up contest are given in Table 9. EFPIP has a 72.95%
probability of earning the payout, while MMIP has a 56.61% probability. This leads to expected
values of $36.48 and $28.31 for EFPIP and MMIP, respectively. Expected Values are computed
assuming the entry fee of the double up contest was $25 and the payout was $50. Any arbitrary
payout value could replace the chosen example.

40
Table 9: EFPIP vs. MMIP performance in double up contest
Optimization Model Team Distribution P(X ≥ 148) Expected Value
EFPIP X~N(159.54, 23.78) 72.95% $36.48
MMIP X~N(150.25, 31.53) 56.61% $28.31
Repeatedly, MMIP earned better expected payouts in tiered contests than EFPIP. The
goal of MMIP was to maximize the probability, hoping to reach above what EFPIP had already
accomplished. The expectation that fantasy teams with a relatively decent mean but high
standard deviation would perform better in tiered contests than fantasy teams with high means
and low standard deviations proved true in this study. There is a benefit to selecting a team with
a high mean and low standard deviation for a double up contest. Most importantly, this thesis
accomplishes the task of maximizing the expected payout in a tiered contest for DFS.
Although the probability of earning a payout each week was maximized successfully, that
does not necessarily mean the model would be worth using in real life fantasy sports. If these
teams were entered, the fantasy points earned would have all been under 150 points. This is
rarely, if ever, enough points to earn even the lowest possible payout. A participant would
possibly have to wait a couple of NFL seasons before winning a payout in this contest. Not only
is that expensive because entry fees are typically over $20 for the Millionaire Maker® contest,
but losing repeatedly is discouraging. Providing better estimates of the athletes’ fantasy point
distribution would substantially enhance the probability of winning more consistently.
After extensively studying fantasy sports, an obvious question is whether or not this
research can provide information related to the general public’s perception of fantasy sports.
Thus, the next chapter provides mathematical evidence and insight into the question of whether
or not daily fantasy sports should require a gambling license.
41
Chapter 4 - Are Fantasy Sports Gambling?
This chapter aims to answer a question that is a contentious topic in many states: should
daily fantasy sports be considered gambling? The first section considers some of the legal and
political arguments surrounding DFS, as well as the standard definition of gambling. The second
section answers the question of whether or not DFS is gambling. This is accomplished through a
computational study and live contest entries. The third and final section concludes with the
answer to the DFS gambling question.
4.1 Legal and Political DFS Gambling Argument
In October of 2016, the State of Nevada began requiring DFS hosts to file for a gambling
license in order to operate in the state. Fans and companies who choose to participate in DFS
unlicensed will be fined and potentially face ten years in prison (Purdum, 2015). The decision by
Nevada, the gambling capital of the world, is arguably the most impactful on fantasy sports and
was followed by many other states making a similar decision. (Drape, 2015). As of March 2017,
most DFS hosts do not take customers in the states of Arizona, Alabama, Hawaii, Idaho, Iowa,
Louisiana, Montana, Nevada, Texas, Delaware and Washington (Grove, 2017).
This does not mean that these states have deemed DFS illegal; rather, a gambling license
is required for the hosts to operate. DFS hosts such as FanDuel® and DraftKings® are not rushing
to apply for a gambling license. Standing their ground, these companies claim DFS should not be
considered gambling. DFS hosts will contradict themselves if they begin applying for gambling
licenses, furthering the states’ arguments as they attempt to affirm that DFS is indeed gambling.
Countless legal battles have ensued, with legislation being proposed in 41 states as of March
2017 (Gouker, 2017). Much of the legislation requires similar licensure as Nevada.
42
The accusations that Daily Fantasy Sports should be considered gambling present a major
issue for the multibillion-dollar industry. Fewer players are legally able to enter contests. The
issue has damaged FanDuel® and DraftKings® reputation as well as their financial status. Media
conglomerate Fox withdrew 65 million dollars of their investment in DraftKings® in early 2016,
claiming that the value of DraftKings® had plummeted by 60% (Isidore, 2016). Once worth over
a billion dollars combined, the companies have decided to combine their resources after multiple
years of legal fights and will merge in late 2017 (Drape, 2016). In addition to harming DFS host
companies, the legal climate for DFS has caused a potential for professional sporting leagues and
the media to be damaged. Research shows that fantasy sport participation increases game
attendance and sports media viewership (Nesbit, 2010).
In order for an activity to be considered gambling, the element of chance must be
dominantly present over skill (Rose, 2009). DFS companies argue that their games “are not
gambling because they involve more skill than luck” (Drape, 2016). This argument raises the
following question: Can a DFS participant increase the amount of fantasy points they accrue per
game by increasing their own knowledge of the sport? If so, DFS is predominately a game of
skill rather than chance.
4.2 Are Daily Fantasy Sports Gambling?
If DFS is truly a game of chance, every team should be equally likely to win. Thus, a
randomly selected team should perform as well as any strategy for choosing teams. This section
evaluates two different studies. First, random teams are generated and evaluated using
simulation. The random teams’ performances are compared to teams that were selected using the
EFPIP in section 3.1. To further the argument, randomly selected teams are entered into a Major
43
League Baseball (MLB) DraftKings® double up contest for the second study to determine how
often one can win in DFS when lacking a strategy.
Feasible random teams can be generated using simulation. Simulation is widely used in
both industry and academia (Law, 2013). Simulation uses pseudorandom numbers to
approximate the theoretical outcome of a situation. For instance, one may use random numbers
between 1 and 6 to determine the probability of rolling a 3 on a die. Manufacturing companies
benefit from using simulation to determine the expected value of lean alternatives before
spending the money for implementation (Abdulmalek, Rajgopal 2007). Simulation has also been
used to reduce patient wait-time in a hospital emergency department (Duguay and Chetouane,
2007). Simulation is attractive because it provides an avenue for testing alternatives, gathering
information, and allows users to compute key statistics without actually implementing the
scenario in case it fails.
To demonstrate how random fantasy teams were selected, consider a DFS contest with 25
quarterbacks available. Python 2.7 generates a random number from 1 to 25 after each
quarterback has been assigned a number. If Python 2.7 generates the number 8, the 8th
quarterback is selected for the fantasy team. This repeats for all position requirements on the
fantasy team. Once the team has been formed, the sum of all selected player salaries is computed
to determine whether or not the team is feasible and within the salary cap. If infeasible, the team
is discarded and the process repeats again. This process of generating random numbers and
rejecting infeasible solutions until a feasible solution appears is known as the acceptance
rejection principle.
44
4.2.1 Comparison of IP and Randomly Selected Teams
The first study was conducted using FanDuel®’s DFS contest rules for the NFL. Data was
collected to identify the factors that contribute to a fantasy team score. The points awarded for
athlete performance in FanDuel® differ from DraftKings®, thus the results from these different
contest hosts is not compared. FanDuel® implements a salary cap just as DraftKings® does, but it
is set at $60,000 rather than $50,000. It is also required that a kicker be added to the FanDuel®
fantasy team lineup, whereas DraftKings® does not consider that NFL position. Data on relevant
statistics for each of the six positions was imported from Yahoo!® Sports website using
Microsoft Excel and Python 2.7. Data was collected for all 17 weeks of the 2015-2016 NFL
Regular season. The player’s virtual salary for each week is taken from FanDuel®.
The study compares the random teams (unskilled participants) with the EFPIP teams
(skilled participants) for weeks 8 through 17. The average points collected by a player from all
previous weeks is the anticipated fantasy points ( i ) for that player. Earlier weeks were not
analyzed because the author felt that sufficient data was not available to calculate a reasonable
anticipated fantasy points for each player. The EFPIP was created and solved using CPLEX 12.5.
EFPIP is simple to solve and none of the problems required over 2 seconds on a Pentium 4 3.3
GHz processor with 12 GB of RAM.
A preliminary study revealed that teams with a measly salary of $30,000 or less were
being selected randomly and performed poorly. It is assumed that even a person with little to no
experience with DFS would try to make the most of their allotted virtual dollars. Thus, to make
the randomly generated teams more realistic, it was required that the randomly selected team’s
salary had to be greater than 90% of the salary cap.
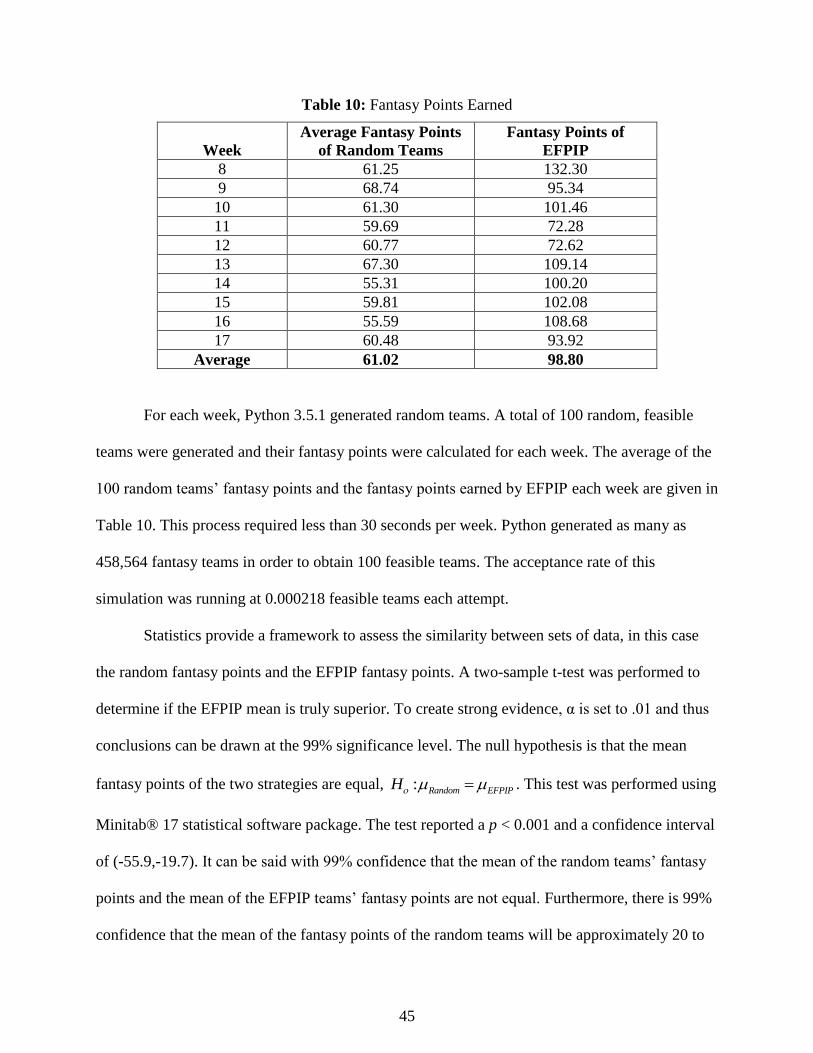
45
Table 10: Fantasy Points Earned
Week
Average Fantasy Points
of Random Teams
Fantasy Points of
EFPIP
8 61.25 132.30
9 68.74 95.34
10 61.30 101.46
11 59.69 72.28
12 60.77 72.62
13 67.30 109.14
14 55.31 100.20
15 59.81 102.08
16 55.59 108.68
17 60.48 93.92
Average 61.02 98.80
For each week, Python 3.5.1 generated random teams. A total of 100 random, feasible
teams were generated and their fantasy points were calculated for each week. The average of the
100 random teams’ fantasy points and the fantasy points earned by EFPIP each week are given in
Table 10. This process required less than 30 seconds per week. Python generated as many as
458,564 fantasy teams in order to obtain 100 feasible teams. The acceptance rate of this
simulation was running at 0.000218 feasible teams each attempt.
Statistics provide a framework to assess the similarity between sets of data, in this case
the random fantasy points and the EFPIP fantasy points. A two-sample t-test was performed to
determine if the EFPIP mean is truly superior. To create strong evidence, α is set to .01 and thus
conclusions can be drawn at the 99% significance level. The null hypothesis is that the mean
fantasy points of the two strategies are equal, : Random EFPIPH . This test was performed using
Minitab® 17 statistical software package. The test reported a p < 0.001 and a confidence interval
of (-55.9,-19.7). It can be said with 99% confidence that the mean of the random teams’ fantasy
points and the mean of the EFPIP teams’ fantasy points are not equal. Furthermore, there is 99%
confidence that the mean of the fantasy points of the random teams will be approximately 20 to
46
55 points worse than the mean of EFPIP’s fantasy points. Consequently, statistics show the
FanDuel® NFL contest is not a game of chance.
4.2.2. Entering Randomly Selected Teams into MLB DFS double ups
Randomly selected teams performed poorly in a simulation environment. However,
simulation is not real life. The next step was to test how randomly selected teams performed in a
real double up contest. To provide diversity among both sports and providers, MLB double up
contest were entered from DraftKings®.
The randomization model was updated to reflect the player positions of baseball rather
than American football. Since money was on the line, a lower salary cap was not instituted. Only
teams that were infeasible were rejected through the acceptance rejection process. Everything
else remained the same and the teams generated from the code were entered into the contests.
From September 8th to October 13th, 2016, a total of 35 distinct random fantasy teams
were entered into double up contests. To provide sufficient randomization, no individual contest
had more than three entries. Additionally, the number of contestants ranged from 50 to almost
2500 over the contests. Consequently, the data is taken from a wide range of double up contests
offered by DraftKings®.
The total cost of playing 35 double up contests was $85. It should be noted that the
money to perform this study was provided by my advisor and no money from Kansas State
University was used for this study. Additionally, the study was performed on my own laptop in
my apartment, where I wrote the code. Other than writing this thesis and a future paper along
with backing up my code and data, none of this work used Kansas State University’s resources.
The most relevant data from each of these contests is found in Table 11. The most
astonishing results is that not a single team won a payout. Furthermore, the teams performed

47
extremely poorly. The teams ranked in the lowest 6.12% of the participant pool on average, thus
performing worse than 93.88% of double up entries. The worst ranking of all the entries landed
in last place, while the best was still worse than 52.33% of the other teams.
If daily fantasy games are truly games of chance, then every team should be equally
likely to win or lose. Thus, the probability of losing a double up contest would be equal to the
number of entrants minus the number of winners divided by the total number of entrants. Contest
1 had a pool of 574 contestants and the top 250 earned a payout. Thus, the probability of losing
contest 1 is 1
574 250100% 56.45%
574y
where yi denotes the probability of losing the ith
contest.
This calculation was performed for all 35 of the MLB double up contests. Thus, the
probability of losing 35 straight double ups, denoted by Y, is the product of the these
probabilities, 35
1i iY y . The probability of losing 35 out of 35 contests equals
0.0000000031939340, or 1 in 312,681,518. This is an extremely small probability, thus
DraftKings® MLB double up contests are not games of chance.
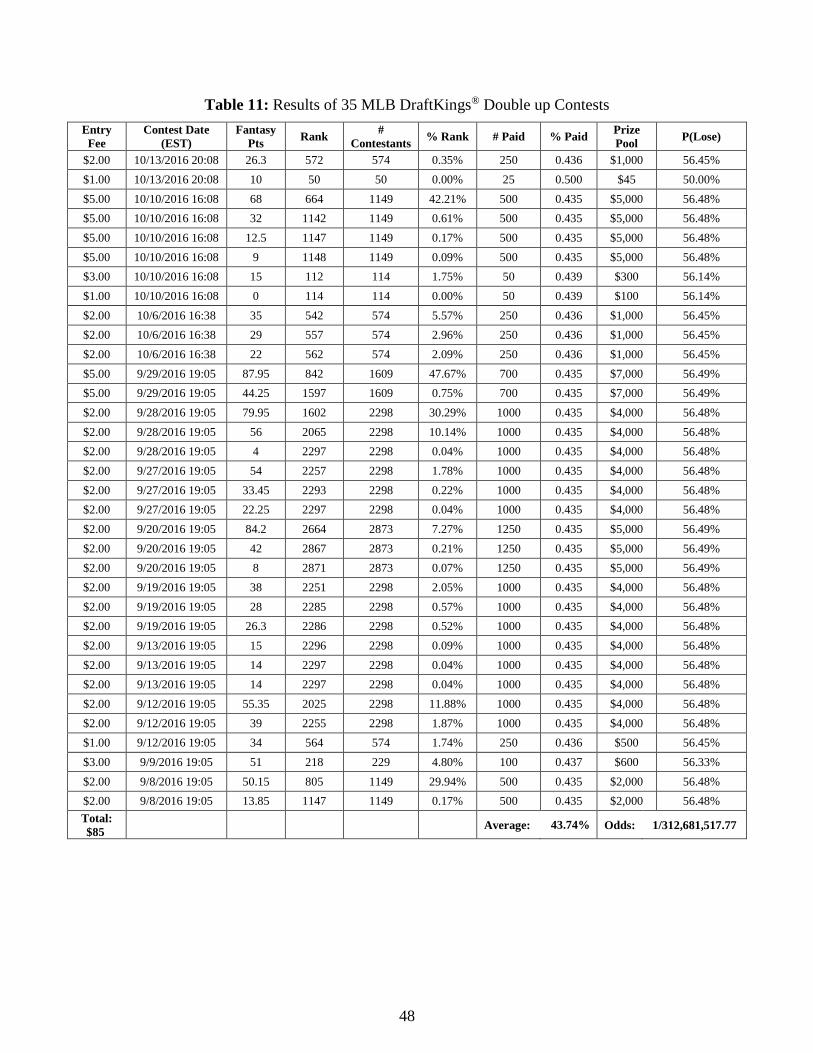
48
Table 11: Results of 35 MLB DraftKings® Double up Contests
Entry
Fee
Contest Date
(EST)
Fantasy
Pts Rank
#
Contestants % Rank # Paid % Paid
Prize
Pool P(Lose)
$2.00 10/13/2016 20:08 26.3 572 574 0.35% 250 0.436 $1,000 56.45%
$1.00 10/13/2016 20:08 10 50 50 0.00% 25 0.500 $45 50.00%
$5.00 10/10/2016 16:08 68 664 1149 42.21% 500 0.435 $5,000 56.48%
$5.00 10/10/2016 16:08 32 1142 1149 0.61% 500 0.435 $5,000 56.48%
$5.00 10/10/2016 16:08 12.5 1147 1149 0.17% 500 0.435 $5,000 56.48%
$5.00 10/10/2016 16:08 9 1148 1149 0.09% 500 0.435 $5,000 56.48%
$3.00 10/10/2016 16:08 15 112 114 1.75% 50 0.439 $300 56.14%
$1.00 10/10/2016 16:08 0 114 114 0.00% 50 0.439 $100 56.14%
$2.00 10/6/2016 16:38 35 542 574 5.57% 250 0.436 $1,000 56.45%
$2.00 10/6/2016 16:38 29 557 574 2.96% 250 0.436 $1,000 56.45%
$2.00 10/6/2016 16:38 22 562 574 2.09% 250 0.436 $1,000 56.45%
$5.00 9/29/2016 19:05 87.95 842 1609 47.67% 700 0.435 $7,000 56.49%
$5.00 9/29/2016 19:05 44.25 1597 1609 0.75% 700 0.435 $7,000 56.49%
$2.00 9/28/2016 19:05 79.95 1602 2298 30.29% 1000 0.435 $4,000 56.48%
$2.00 9/28/2016 19:05 56 2065 2298 10.14% 1000 0.435 $4,000 56.48%
$2.00 9/28/2016 19:05 4 2297 2298 0.04% 1000 0.435 $4,000 56.48%
$2.00 9/27/2016 19:05 54 2257 2298 1.78% 1000 0.435 $4,000 56.48%
$2.00 9/27/2016 19:05 33.45 2293 2298 0.22% 1000 0.435 $4,000 56.48%
$2.00 9/27/2016 19:05 22.25 2297 2298 0.04% 1000 0.435 $4,000 56.48%
$2.00 9/20/2016 19:05 84.2 2664 2873 7.27% 1250 0.435 $5,000 56.49%
$2.00 9/20/2016 19:05 42 2867 2873 0.21% 1250 0.435 $5,000 56.49%
$2.00 9/20/2016 19:05 8 2871 2873 0.07% 1250 0.435 $5,000 56.49%
$2.00 9/19/2016 19:05 38 2251 2298 2.05% 1000 0.435 $4,000 56.48%
$2.00 9/19/2016 19:05 28 2285 2298 0.57% 1000 0.435 $4,000 56.48%
$2.00 9/19/2016 19:05 26.3 2286 2298 0.52% 1000 0.435 $4,000 56.48%
$2.00 9/13/2016 19:05 15 2296 2298 0.09% 1000 0.435 $4,000 56.48%
$2.00 9/13/2016 19:05 14 2297 2298 0.04% 1000 0.435 $4,000 56.48%
$2.00 9/13/2016 19:05 14 2297 2298 0.04% 1000 0.435 $4,000 56.48%
$2.00 9/12/2016 19:05 55.35 2025 2298 11.88% 1000 0.435 $4,000 56.48%
$2.00 9/12/2016 19:05 39 2255 2298 1.87% 1000 0.435 $4,000 56.48%
$1.00 9/12/2016 19:05 34 564 574 1.74% 250 0.436 $500 56.45%
$3.00 9/9/2016 19:05 51 218 229 4.80% 100 0.437 $600 56.33%
$2.00 9/8/2016 19:05 50.15 805 1149 29.94% 500 0.435 $2,000 56.48%
$2.00 9/8/2016 19:05 13.85 1147 1149 0.17% 500 0.435 $2,000 56.48%
Total:
$85 Average: 43.74% Odds: 1/312,681,517.77

49
4.3 Results
Daily fantasy sports continue to be a topic that is contested by many. This chapter set out
to answer that debated question: are daily fantasy sports gambling? A study was performed first
using simulation. The acceptance-rejection principle of simulation was used to generate 1,000
randomly selected teams, or 100 for the last ten weeks of the 2015-2016 NFL season. The
performance of each team was measured based on the rules of FanDuel® DFS NFL contests and
compared to the performance of optimal teams created by EFPIP in those same weeks. The
EFPIP teams proved to perform better than randomly selected teams with 99% confidence.
To further the study, randomly selected teams were entered into 35 straight DFS double
up contests. These double up contests were for MLB games rather than NFL, thus the player
positions and fantasy scoring were altered to match that of MLB DFS. In all 35 consecutive
double ups, the randomly selected teams did not earn a single payout. The percentage of entrants
who received a payout was around 43.5%. Losing 35 double up contests, the odds of entering a
randomly selected fantasy team that will win a payout are at most 1 in 312,681,518. This is about
equivalent to winning the Powerball® lottery (Lazarus, 2017), flipping a coin 28 times and
getting all heads, and even being stuck by lightning twice in the same year. Probabilistically, this
study shows that daily fantasy sports are not games of chance.
As previously stated, the typical definition of gambling is an activity whose outcome is
predominately determined by chance rather than skill. If daily fantasy sports were truly left to
chance, the randomly selected teams for both the simulation and real entries should have
performed better. It was found with 99% confidence that teams chosen with skill, in this case the
optimization model, will have a higher mean than teams chosen without skill for FanDuel® NFL.
Additionally, the ridiculous odds of losing 35 out of 35 double up contests with randomly

50
selected teams speaks for itself. This probability is less than that of winning the Powerball®. DFS
was able to prove itself with not one, but two different host companies: FanDuel® and
DraftKings®. The argument against DFS being gambling still holds between both NFL and
MLB. Daily fantasy sports do not fit the standard definition of gambling, and courts should
consider this as cases move forward.
51
Chapter 5 - Conclusion and Future Research
This thesis, motivated by the current events surrounding daily fantasy sports, developed
both an integer program and stochastic integer program to optimize daily fantasy sports. Tiered
contests were selected as none of the existing literature has modeled these type of contests.
Furthermore, tiered contests incorporate more payout levels, some worth a million dollars,
providing incentives for participants to keep returning to play.
The primary contribution of this thesis is the first optimization model, MMIP, to optimize
the expected payout of a tiered DFS contest. This is modeled through a stochastic integer program,
which takes into account the possibility that the athletes that are selected will not necessarily earn
the number of fantasy points expected. Complications included selecting a statistical distribution
to use for all players, determining the cumulative payouts and their probabilities, and
approximating the variance. A piecewise linear function was used to estimate the variance curve
to retain the model’s linearity.
Computational results revealed the MMIP ended with a lower mean than EFPIP, but a
higher standard deviation. The high standard deviation achieved by MMIP accomplishes the goal
of optimizing the expected payout, for which higher standard deviations increase the probability
of earning each payout. The expected payout of MMIP is almost twice as much as that of EFPIP.
The question of whether or not daily fantasy sports is gambling has been answered. Not
only did random teams perform poorly in a simulation environment for NFL FanDuel® contests,
but random teams also lost 35 straight double up contests in DraftKings® MLB. Across two
different sports and two DFS host companies, random teams did not achieve as many points as
other teams that were selected with strategy. Daily fantasy sports are not predominately determined
by chance, and thus they are not gambling, but games of skill.
52
MMIP can easily be manipulated to fit a majority of fantasy sports situations. For example,
when converting from NFL to MLB, one only has to update the constraints to reflect the position
requirements of the sport as well as the scoring system. Different contest rules can be implemented
other than the DraftKings® Millionaire Maker simply by updating the payout levels and point
thresholds. Statistics other than the mean can be incorporated. Consequently, little future work
exists on modeling DFS from this thesis because MMIP is so flexible. Topics for study are
suggested, but these will not contribute more than MMIP already does to optimization models of
DFS.
5.1 Future Work
The probability of earning a payout each week was maximized successfully, but that
does not necessarily mean the author will utilize this model in real life fantasy sports. The actual
average expected fantasy points were all under 150 points, which is rarely, if ever, enough points
to earn even the lowest possible payout. The focus of this thesis was modeling DFS rather than
creating a tool to win the top prize.
The primary avenue for improvement lies in the estimates for the players or the
distribution selected for the team. One possibility for improvement is the covariance. This is a
likely contributor to a fantasy score because athletes tend to play better with some teammates or
opponents than others. Adding this to the model could determine if a statistically significant
improvement exists by adding covariance to the value of the team variance in MMIP. Another
interesting question is whether or not changing the statistical distribution of a fantasy team,
rather than assuming a normal distribution, would benefit the team’s performance. One could
attempt to fit each individual player to their own distribution to improve accuracy of the
predicted fantasy score, or test different distributions for all teams to see which improve a
53
fantasy score the most. Additional factors to study include whether or not the athlete is home or
away, the weather, or injuries.
This thesis studied DFS over two sports: MLB and NFL. There are many more
internationally recognized sports; the Olympics hosts 56 sports between the summer and winter
games (IOC, 2017). Thus, it is not surprising that fantasy contests exist for much more than the
two sports studied in this thesis. Interesting questions to pursue include: Can MMIP perform
better in some daily fantasy sports than others? What factors contribute most to a fantasy score in
specific sports? Is there a common factor that improves the fantasy score and expected payout
across all sports?
The modeling techniques and methods used in this thesis can easily be applied to other
stochastic integer programs. For example, implementing the cumulative view of payouts will
help make other stochastic integer programs easier to solve.
In summary, DFS is an enjoyable pastime that engages people from all over the world in
friendly competition over the games they love. It is the author’s hope that this thesis not only
opens the door for clever ways of modeling, but also inspires sports fans and teams (particularly
the Kansas City Chiefs and Royals) to think more analytically about selecting athletes.
54
Chapter 6 - References
Abara, Jeph. "Applying integer linear programming to the fleet assignment
problem." Interfaces 19.4 (1989): 20-28.
Abdulmalek, Fawaz A., and Jayant Rajgopal. "Analyzing the benefits of lean manufacturing and
value stream mapping via simulation: A process sector case study." International Journal of
production economics 107.1 (2007): 223-236.
Ahmed, Shabbir, Alan J. King, and Gyana Parija. "A multi-stage stochastic integer programming
approach for capacity expansion under uncertainty." Journal of Global Optimization 26.1 (2003):
3-24.
Ahmed, Shabbir, Mohit Tawarmalani, and Nikolaos V. Sahinidis. "A finite branch-and-bound
algorithm for two-stage stochastic integer programs." Mathematical Programming 100.2 (2004):
355-377.
Applegate, David L., et al The traveling salesman problem: a computational study. Princeton
university press, 2011.
Becker, Adrian, and Xu Andy Sun. "An analytical approach for fantasy football draft and lineup
management." Journal of Quantitative Analysis in Sports 12.1 (2016): 17-30.
Belval, Erin J., Yu Wei, and Michael Bevers. "A stochastic mixed integer program to model
spatial wildfire behavior and suppression placement decisions with uncertain
weather." Canadian Journal of Forest Research 46.2 (2015): 234-248.
Birge, John R., and Francois Louveaux. Introduction to stochastic programming. Springer
Science & Business Media, 2011.
Boutilier, Craig, Richard Dearden, and Moisés Goldszmidt. "Stochastic dynamic programming
with factored representations." Artificial intelligence 121.1 (2000): 49-107.
Boyd, Evan. "A New Method for Ranking Quarterback Fantasy Performance with Assessment
Using Distances Between Rankings." (2014).
Chen, Kejia, and Ping Ji. "A mixed integer programming model for advanced planning and
scheduling (APS)." European Journal of Operational Research 181.1 (2007): 515-522.
Daily Fantasy Sports Report - DFSgold. Daily Fantasy Sports Report - DFSgold. DFSgold, n.d.
Web. 13 Mar. 2017. http://www.dfsgold.com.
Drape, Joe. " DraftKings®and FanDuel®Agree to Merge Daily Fantasy Sports Operations." The
New York Times. The New York Times, 18 Nov. 2016. Web. 10 Mar. 2017.
https://www.nytimes.com/2016/11/19/sports/draftkings-FanDuel-merger-fantasy-
sports.html?_r=0.
55
Duguay, Christine, and Fatah Chetouane. "Modeling and improving emergency department
systems using discrete event simulation." Simulation 83.4 (2007): 311-320.
Easton, Kelly, George Nemhauser, and Michael Trick. "The Traveling Tournament Problem
Description and Benchmarks." Principles and Practice of Constraint Programming — CP
2001 Lecture Notes in Computer Science (2001): 580-84 Garfinkel, Robert S., and George L.
Nemhauser. Integer programming. Vol. 4. New York: Wiley, 1972.
Golden, Bruce L., S. Raghavan, and Edward A. Wasil. The vehicle routing problem: latest
advances and new challenges. New York: Springer Science Business Media, 2008.
Gouker, Dustin. "Daily Fantasy Sports - Bill Tracker." Legal Sports Report. LegalSportsReport,
n.d. Web. 10 Mar. 2017. http://www.legalsportsreport.com/dfs-bill-tracker/.
Grove, Chris. "No Chance That All 50 States Allow Daily Fantasy Sports 'Very Soon'" Legal
Sports Report. LegalSportsReport, 10 Mar. 2017. Web. 10 Mar. 2017.
http://www.legalsportsreport.com/13285/50-states-fantasy-sports/.
Gutin, Gregory, and Abraham P. Punnen. The Traveling Salesman Problem and Its Variations.
Boston, MA: Springer US, 2006.
Isidore, Chris. "DraftKings' value has tumbled by 60%, Fox says." CNNMoney. Cable News
Network, n.d. Web. 10 Mar. 2017. http://money.cnn.com/2016/02/10/media/draftkings-value-
fox-investment/.
Karp, Richard M. "Reducibility among combinatorial problems." Complexity of computer
computations. springer US, 1972. 85-103.
Lan, Shan, John-Paul Clarke, and Cynthia Barnhart. "Planning for robust airline operations:
Optimizing aircraft routings and flight departure times to minimize passenger
disruptions." Transportation science 40.1 (2006): 15-28.
Lazarus, David. "Your long, long odds of winning the Publishers Clearing House
sweepstakes." Los Angeles Times. Los Angeles Times, n.d. Web. 16 Mar. 2017.
http://www.latimes.com/business/la-fi-lazarus-lottery-scams-20170315-story.html
Lee, Eva K., Tim Fox, and Ian Crocker. "Integer programming applied to intensity-modulated
radiation therapy treatment planning." Annals of Operations Research 119.1-4 (2003): 165-181.
Lomax, Richard G. "Fantasy sports: History, game types, and research." Handbook of sports and
media (2006): 383-392.
Marchand, Hugues, et al "Cutting planes in integer and mixed integer programming." Discrete
Applied Mathematics 123.1 (2002): 397-446.
Miller, Clair E., Albert W. Tucker, and Richard A. Zemlin. "Integer programming formulation of
traveling salesman problems." Journal of the ACM (JACM) 7.4 (1960): 326-329.
56
Pochet, Yves, and Laurence A. Wolsey. Production planning by mixed integer programming.
Springer Science & Business Media, 2006.
Rawls, Carmen G., and Mark A. Turnquist. "Pre-positioning of emergency supplies for disaster
response." Transportation research part B: Methodological 44.4 (2010): 521-534.
Sen, Suvrajeet, Lihua Yu, and Talat Genc. "A stochastic programming approach to power
portfolio optimization." Operations Research 54.1 (2006): 55-72.
Sherali, Hanif D., Ki-Hwan Bae, and Mohamed Haouari. "Integrated airline schedule design and
fleet assignment: Polyhedral analysis and Benders' decomposition approach." INFORMS Journal
on Computing 22.4 (2010): 500-513.
Vanderbeck, François. "Branching in branch-and-price: a generic scheme." Mathematical
Programming 130.2 (2011): 249-294.
Yu, Gang, ed. Operations research in the airline industry. Vol. 9. Springer Science & Business
Media, 2012.
"Daily Fantasy Football, MLB, NBA, NHL Leagues for cash." FanDuel. FanDuel, n.d. Web. 16
Mar. 2017. https://www.FanDuel.com/.
" DraftKings®| Daily Fantasy Sports For Cash." DraftKings®- Daily Fantasy Sports for Cash.
DraftKings, n.d. Web. 16 Mar. 2017. https://www.draftkings.com/.
"Sports." International Olympic Committee. IOC, 24 Mar. 2017. Web. 26 Mar. 2017.
https://www.olympic.org/sports.