Measurement of Quality of Employment during COVID-19 ...
18
1 OCTOBER 2021 Ministry of Manpower, Singapore Manpower Research and Statistics Department (MRSD) Measurement of Quality of Employment during COVID-19, Singapore
-
Upload
khangminh22 -
Category
Documents
-
view
3 -
download
0
Transcript of Measurement of Quality of Employment during COVID-19 ...
1
OCTOBER 2021
Ministry of Manpower, Singapore Manpower Research and Statistics Department (MRSD)
Measurement of Quality of Employment during COVID-19, Singapore
2
Introduction
COVID-19 first surfaced at the end of 2019 and the situation quickly escalated to a pandemic across the world in March 2020. The pandemic has disrupted the global economy due to the shift in the lifestyle and behavior of people. As one of the world’s most globalized economy, Singapore’s labour market situation was also severely affected. Singapore GDP fell from 374.4 billion in 2019 to 340.0 billion in 2020. Timely information on the labour market is critical to make deliberate policy moves during different phases of the pandemic. As such, the Manpower Research and Statistics Department (MRSD), of the Ministry of Manpower, Singapore has swiftly deployed several statistical programs to provide data users with relevant and timely insights. These includes increase in the frequency of unemployment tracking (from quarterly to monthly), compilation of an Occupational Employment Dataset and several flash surveys for quick sensing on COVID-19 related topics. This report serves to give a more comprehensive view on the measurement of quality of employment-based information glimpsed from these new initiatives.

3
Part 1: Overall COVID-19 Impact on Singapore Labour Landscape Timeline of COVID-19
To have a better sense of COVID-19 impact on Singapore’s labour landscape, let us take a look at the key dates on how the pandemic has unfolded.
1 Vaccinated-differentiated measures applied from 10 Aug. 21, for those who have completed the full vaccination regime, and observed the 14 days period from their last dose. Timeline is updated up until 15 September 2021.
4
Part 2: Labour Market Indicators
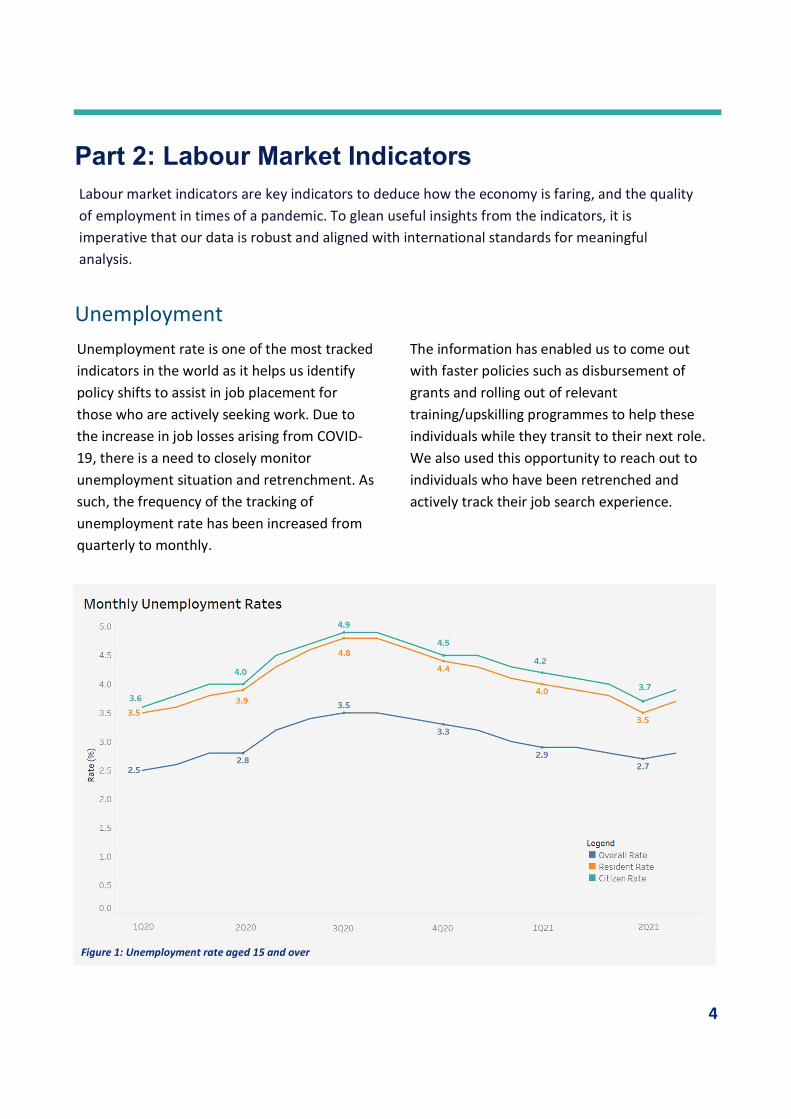
Unemployment Unemployment rate is one of the most tracked indicators in the world as it helps us identify policy shifts to assist in job placement for those who are actively seeking work. Due to the increase in job losses arising from COVID-19, there is a need to closely monitor unemployment situation and retrenchment. As such, the frequency of the tracking of unemployment rate has been increased from quarterly to monthly.
The information has enabled us to come out with faster policies such as disbursement of grants and rolling out of relevant training/upskilling programmes to help these individuals while they transit to their next role. We also used this opportunity to reach out to individuals who have been retrenched and actively track their job search experience.
Figure 1: Unemployment rate aged 15 and over
Labour market indicators are key indicators to deduce how the economy is faring, and the quality of employment in times of a pandemic. To glean useful insights from the indicators, it is imperative that our data is robust and aligned with international standards for meaningful analysis.
5
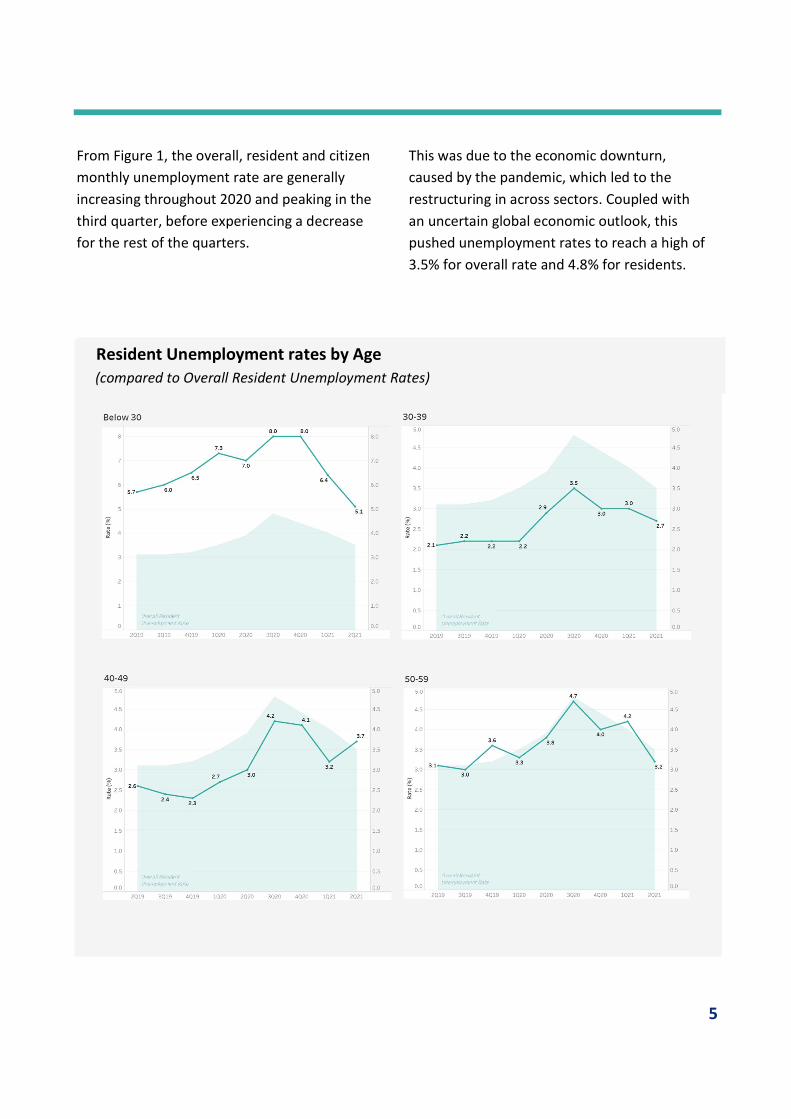
From Figure 1, the overall, resident and citizen monthly unemployment rate are generally increasing throughout 2020 and peaking in the third quarter, before experiencing a decrease for the rest of the quarters.
This was due to the economic downturn, caused by the pandemic, which led to the restructuring in across sectors. Coupled with an uncertain global economic outlook, this pushed unemployment rates to reach a high of 3.5% for overall rate and 4.8% for residents.
Resident Unemployment rates by Age (compared to Overall Resident Unemployment Rates)
6
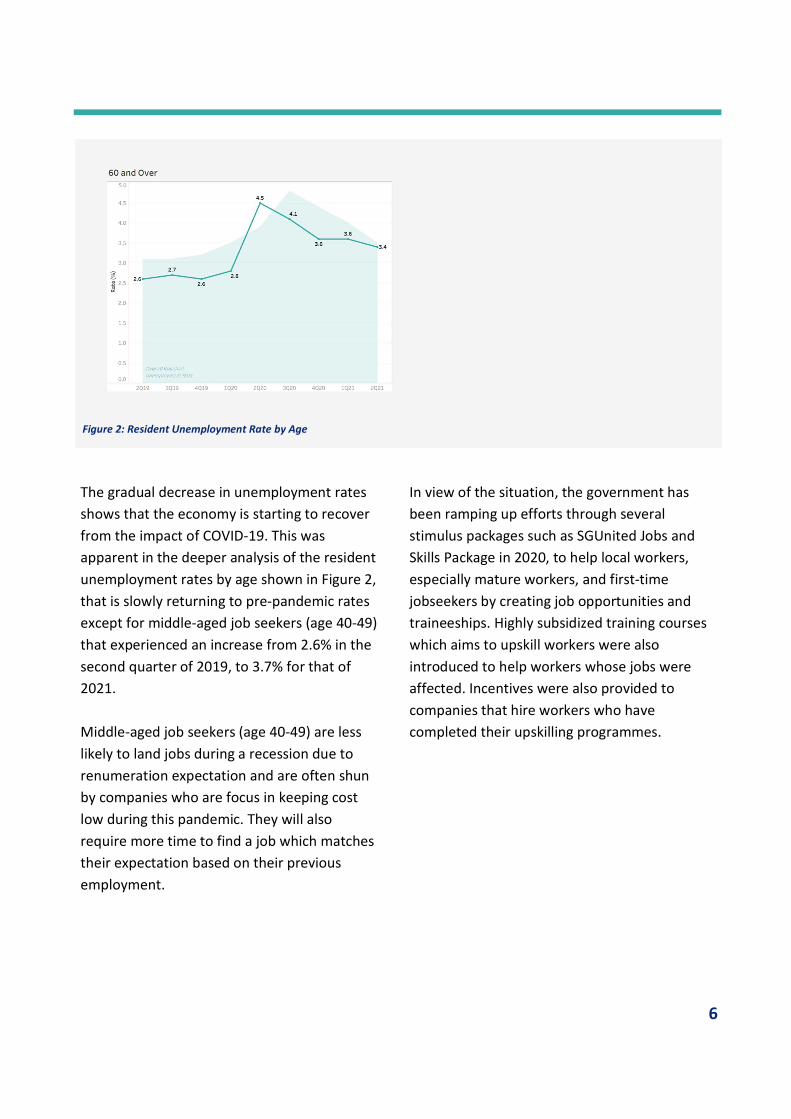
The gradual decrease in unemployment rates shows that the economy is starting to recover from the impact of COVID-19. This was apparent in the deeper analysis of the resident unemployment rates by age shown in Figure 2, that is slowly returning to pre-pandemic rates except for middle-aged job seekers (age 40-49) that experienced an increase from 2.6% in the second quarter of 2019, to 3.7% for that of 2021. Middle-aged job seekers (age 40-49) are less likely to land jobs during a recession due to renumeration expectation and are often shun by companies who are focus in keeping cost low during this pandemic. They will also require more time to find a job which matches their expectation based on their previous employment.
In view of the situation, the government has been ramping up efforts through several stimulus packages such as SGUnited Jobs and Skills Package in 2020, to help local workers, especially mature workers, and first-time jobseekers by creating job opportunities and traineeships. Highly subsidized training courses which aims to upskill workers were also introduced to help workers whose jobs were affected. Incentives were also provided to companies that hire workers who have completed their upskilling programmes.
Figure 2: Resident Unemployment Rate by Age
7
Retrenchment
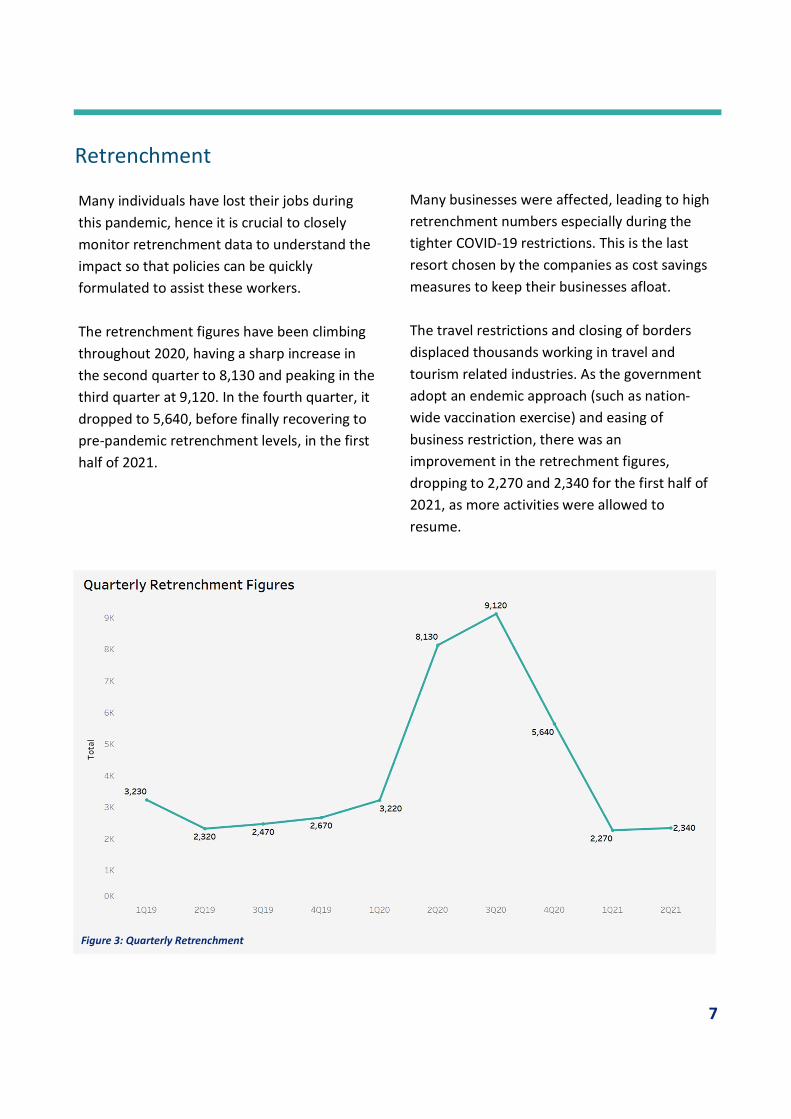
Many individuals have lost their jobs during this pandemic, hence it is crucial to closely monitor retrenchment data to understand the impact so that policies can be quickly formulated to assist these workers. The retrenchment figures have been climbing throughout 2020, having a sharp increase in the second quarter to 8,130 and peaking in the third quarter at 9,120. In the fourth quarter, it dropped to 5,640, before finally recovering to pre-pandemic retrenchment levels, in the first half of 2021.
Many businesses were affected, leading to high retrenchment numbers especially during the tighter COVID-19 restrictions. This is the last resort chosen by the companies as cost savings measures to keep their businesses afloat. The travel restrictions and closing of borders displaced thousands working in travel and tourism related industries. As the government adopt an endemic approach (such as nation-wide vaccination exercise) and easing of business restriction, there was an improvement in the retrechment figures, dropping to 2,270 and 2,340 for the first half of 2021, as more activities were allowed to resume.
Figure 3: Quarterly Retrenchment

8
Figure 4: Quarterly Retrenchment by Occupational groups
The largest group affected by retrenchment was the Clerical, Sales and Service Workers which increased to 1,820, during the second quarter of 2020, this was mainly due to the Circuit Breaker imposed to curtail the disease which impacted
the Food & Beverage, Accommodations and Retail industries, since they hire the bulk of these workers. Companies may not have enough resources to indefinitely upkeep their workforce due to the uncertainty of the safe management measures.
2Q19 3Q19 4Q19 1Q20 2Q20 3Q20 4Q20 1Q21 2Q21
Professional, Managers, Executive & Technicians
240 -30 80 60 1,790 970 -1,710 -1,060 60
Clerical, Sales and Services Workers
-150 60 -20 360 1,820 270 -630 -1,790 -50
Production & Transport Operators, Cleaners & Labourers
-1,010 130 140 130 1,300 -240 -1,140 -530 60
9
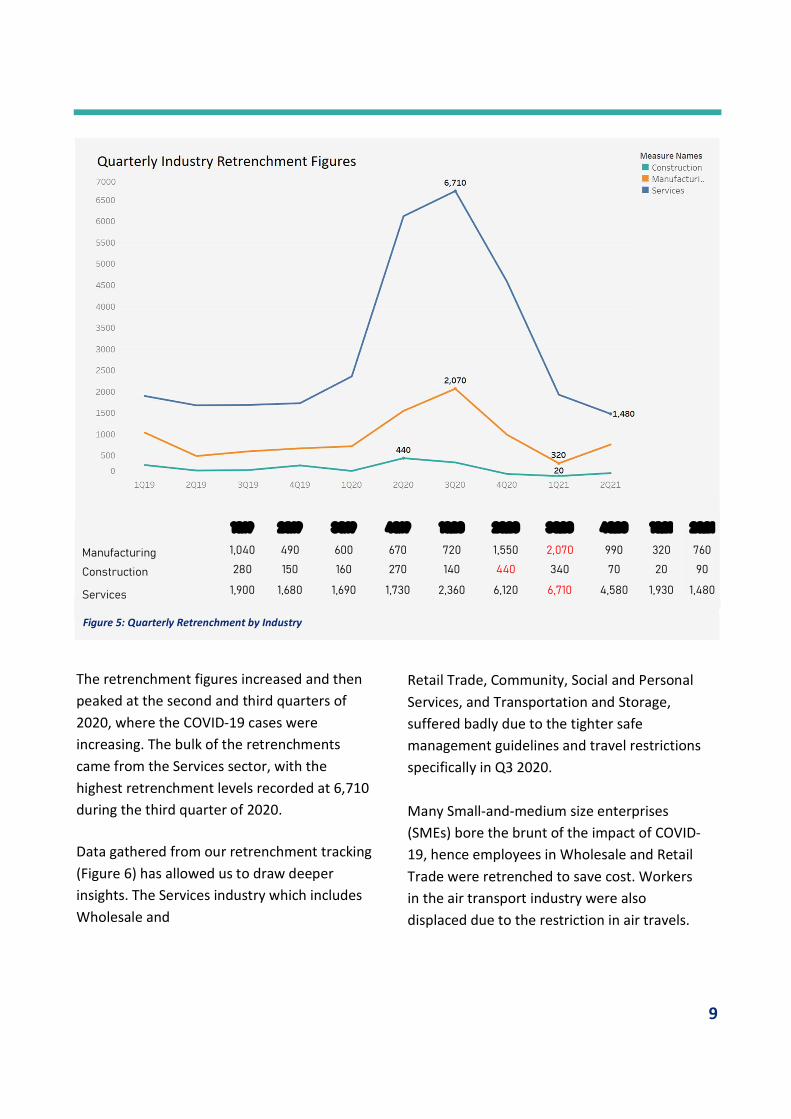
Figure 5: Quarterly Retrenchment by Industry
The retrenchment figures increased and then peaked at the second and third quarters of 2020, where the COVID-19 cases were increasing. The bulk of the retrenchments came from the Services sector, with the highest retrenchment levels recorded at 6,710 during the third quarter of 2020. Data gathered from our retrenchment tracking (Figure 6) has allowed us to draw deeper insights. The Services industry which includes Wholesale and
Retail Trade, Community, Social and Personal Services, and Transportation and Storage, suffered badly due to the tighter safe management guidelines and travel restrictions specifically in Q3 2020. Many Small-and-medium size enterprises (SMEs) bore the brunt of the impact of COVID-19, hence employees in Wholesale and Retail Trade were retrenched to save cost. Workers in the air transport industry were also displaced due to the restriction in air travels.
1Q19 2Q19 3Q19 4Q19 1Q20 2Q20 3Q20 4Q20 1Q21 2Q21
Manufacturing 1,040 490 600 670 720 1,550 2,070 990 320 760
Construction 280 150 160 270 140 440 340 70 20 90
Services 1,900 1,680 1,690 1,730 2,360 6,120 6,710 4,580 1,930 1,480
10
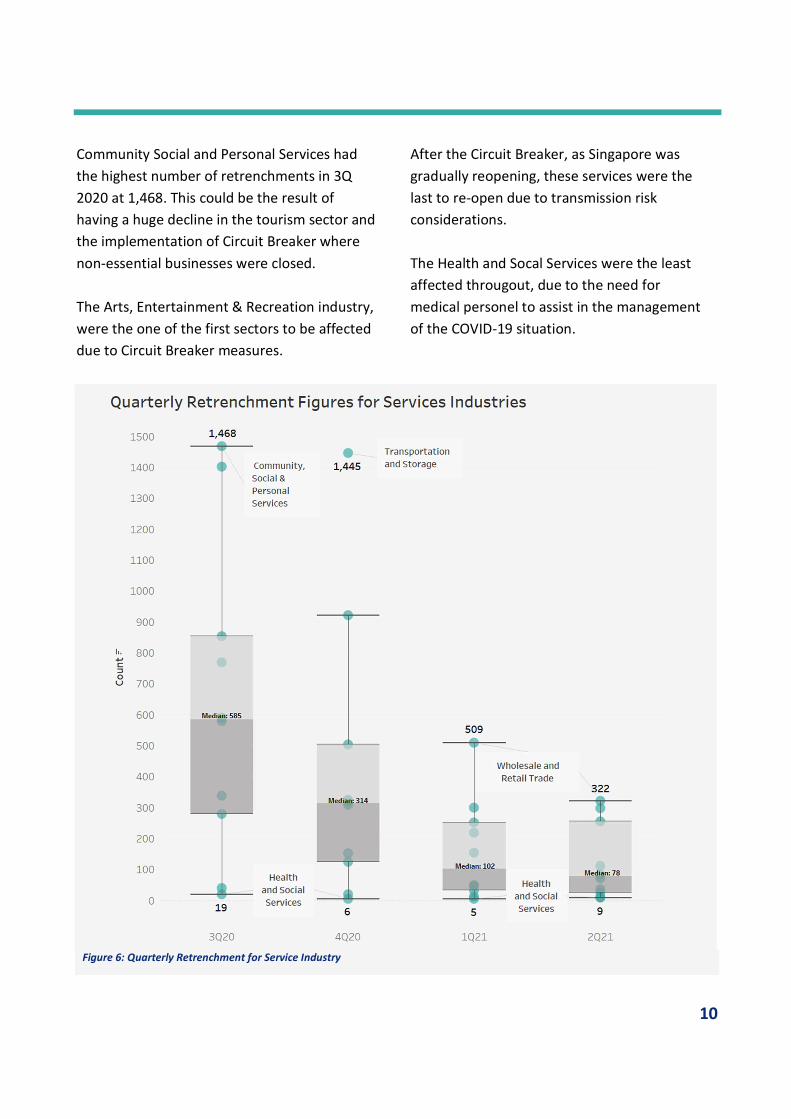
Figure 6: Quarterly Retrenchment for Service Industry
Community Social and Personal Services had the highest number of retrenchments in 3Q 2020 at 1,468. This could be the result of having a huge decline in the tourism sector and the implementation of Circuit Breaker where non-essential businesses were closed. The Arts, Entertainment & Recreation industry, were the one of the first sectors to be affected due to Circuit Breaker measures.
After the Circuit Breaker, as Singapore was gradually reopening, these services were the last to re-open due to transmission risk considerations. The Health and Socal Services were the least affected througout, due to the need for medical personel to assist in the management of the COVID-19 situation.
11
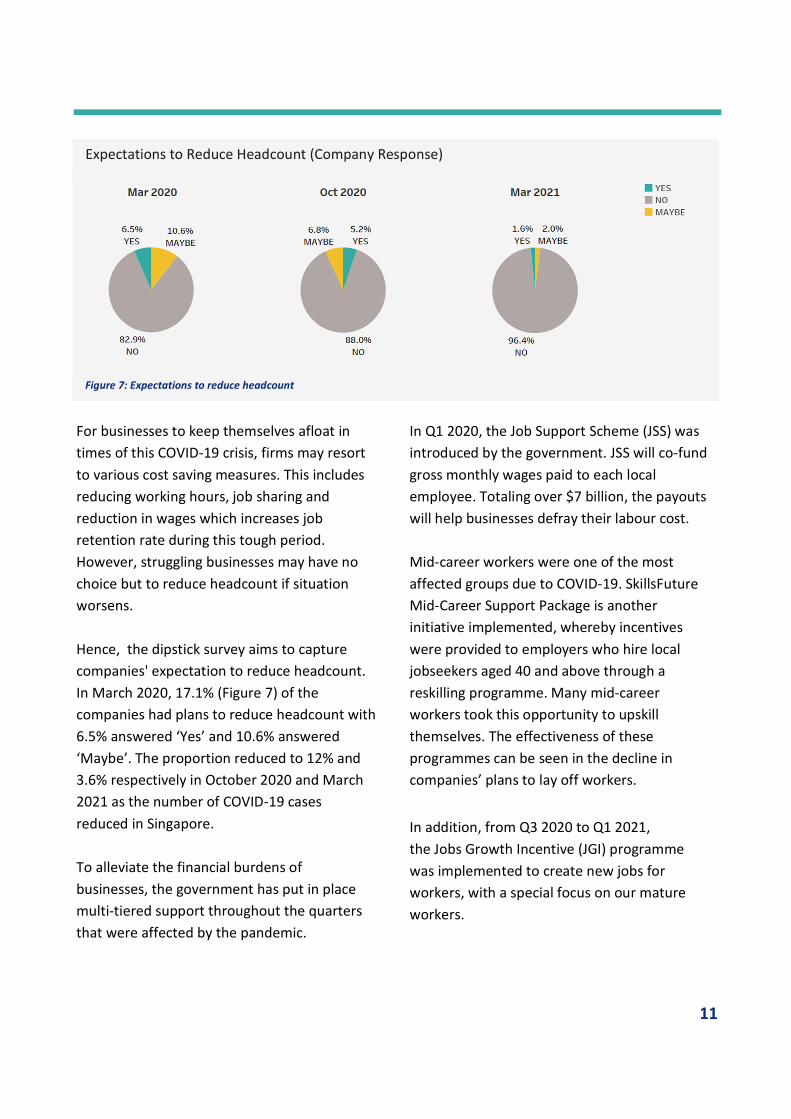
For businesses to keep themselves afloat in times of this COVID-19 crisis, firms may resort to various cost saving measures. This includes reducing working hours, job sharing and reduction in wages which increases job retention rate during this tough period. However, struggling businesses may have no choice but to reduce headcount if situation worsens. Hence, the dipstick survey aims to capture companies' expectation to reduce headcount. In March 2020, 17.1% (Figure 7) of the companies had plans to reduce headcount with 6.5% answered ‘Yes’ and 10.6% answered ‘Maybe’. The proportion reduced to 12% and 3.6% respectively in October 2020 and March 2021 as the number of COVID-19 cases reduced in Singapore. To alleviate the financial burdens of businesses, the government has put in place multi-tiered support throughout the quarters that were affected by the pandemic.
Expectations to Reduce Headcount (Company Response)
Figure 7: Expectations to reduce headcount
In Q1 2020, the Job Support Scheme (JSS) was introduced by the government. JSS will co-fund gross monthly wages paid to each local employee. Totaling over $7 billion, the payouts will help businesses defray their labour cost. Mid-career workers were one of the most affected groups due to COVID-19. SkillsFuture Mid-Career Support Package is another initiative implemented, whereby incentives were provided to employers who hire local jobseekers aged 40 and above through a reskilling programme. Many mid-career workers took this opportunity to upskill themselves. The effectiveness of these programmes can be seen in the decline in companies’ plans to lay off workers.
In addition, from Q3 2020 to Q1 2021, the Jobs Growth Incentive (JGI) programme was implemented to create new jobs for workers, with a special focus on our mature workers.
12
Employment
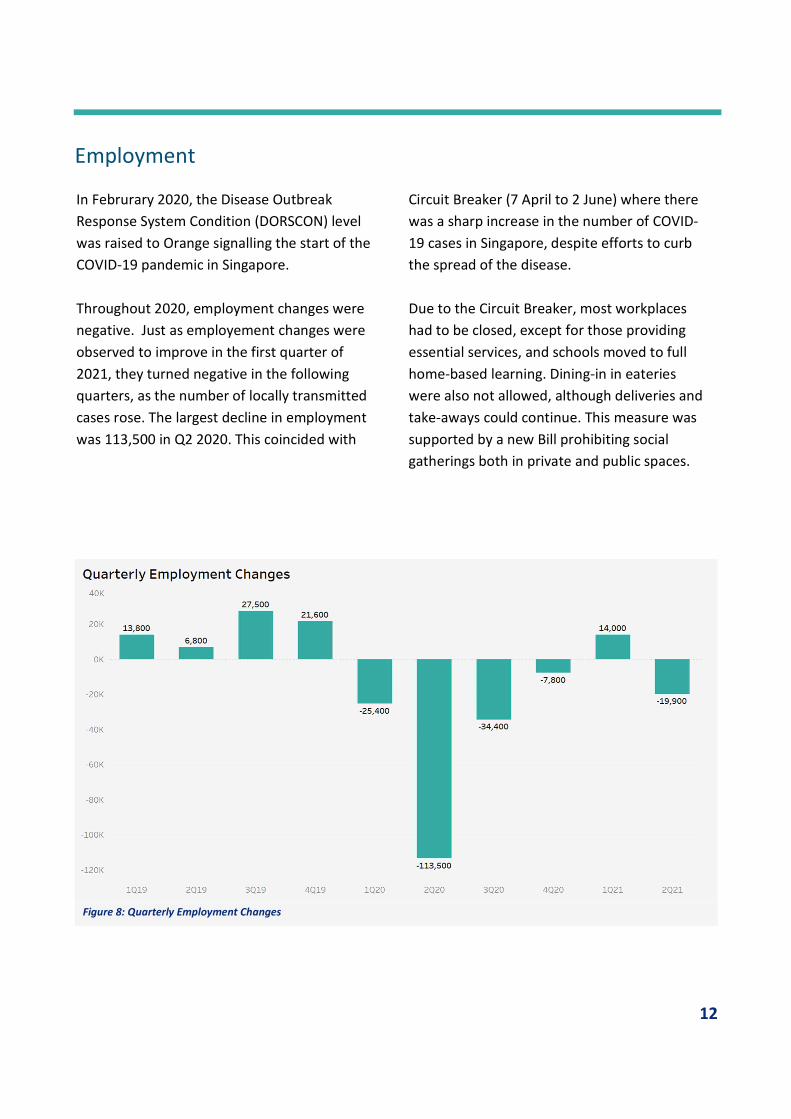
In Februrary 2020, the Disease Outbreak Response System Condition (DORSCON) level was raised to Orange signalling the start of the COVID-19 pandemic in Singapore. Throughout 2020, employment changes were negative. Just as employement changes were observed to improve in the first quarter of 2021, they turned negative in the following quarters, as the number of locally transmitted cases rose. The largest decline in employment was 113,500 in Q2 2020. This coincided with
Circuit Breaker (7 April to 2 June) where there was a sharp increase in the number of COVID-19 cases in Singapore, despite efforts to curb the spread of the disease. Due to the Circuit Breaker, most workplaces had to be closed, except for those providing essential services, and schools moved to full home-based learning. Dining-in in eateries were also not allowed, although deliveries and take-aways could continue. This measure was supported by a new Bill prohibiting social gatherings both in private and public spaces.
Figure 8: Quarterly Employment Changes
13
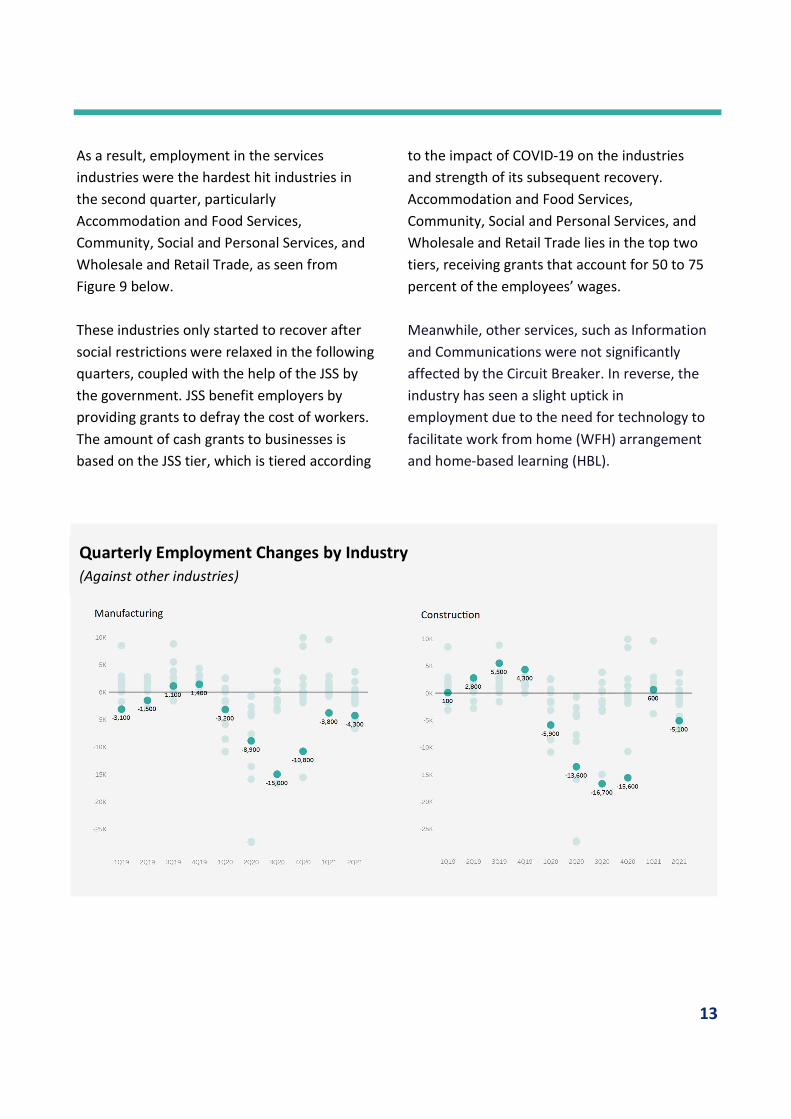
As a result, employment in the services industries were the hardest hit industries in the second quarter, particularly Accommodation and Food Services, Community, Social and Personal Services, and Wholesale and Retail Trade, as seen from Figure 9 below. These industries only started to recover after social restrictions were relaxed in the following quarters, coupled with the help of the JSS by the government. JSS benefit employers by providing grants to defray the cost of workers. The amount of cash grants to businesses is based on the JSS tier, which is tiered according
to the impact of COVID-19 on the industries and strength of its subsequent recovery. Accommodation and Food Services, Community, Social and Personal Services, and Wholesale and Retail Trade lies in the top two tiers, receiving grants that account for 50 to 75 percent of the employees’ wages. Meanwhile, other services, such as Information and Communications were not significantly affected by the Circuit Breaker. In reverse, the industry has seen a slight uptick in employment due to the need for technology to facilitate work from home (WFH) arrangement and home-based learning (HBL).
Quarterly Employment Changes by Industry (Against other industries)

14
Services Industries
15
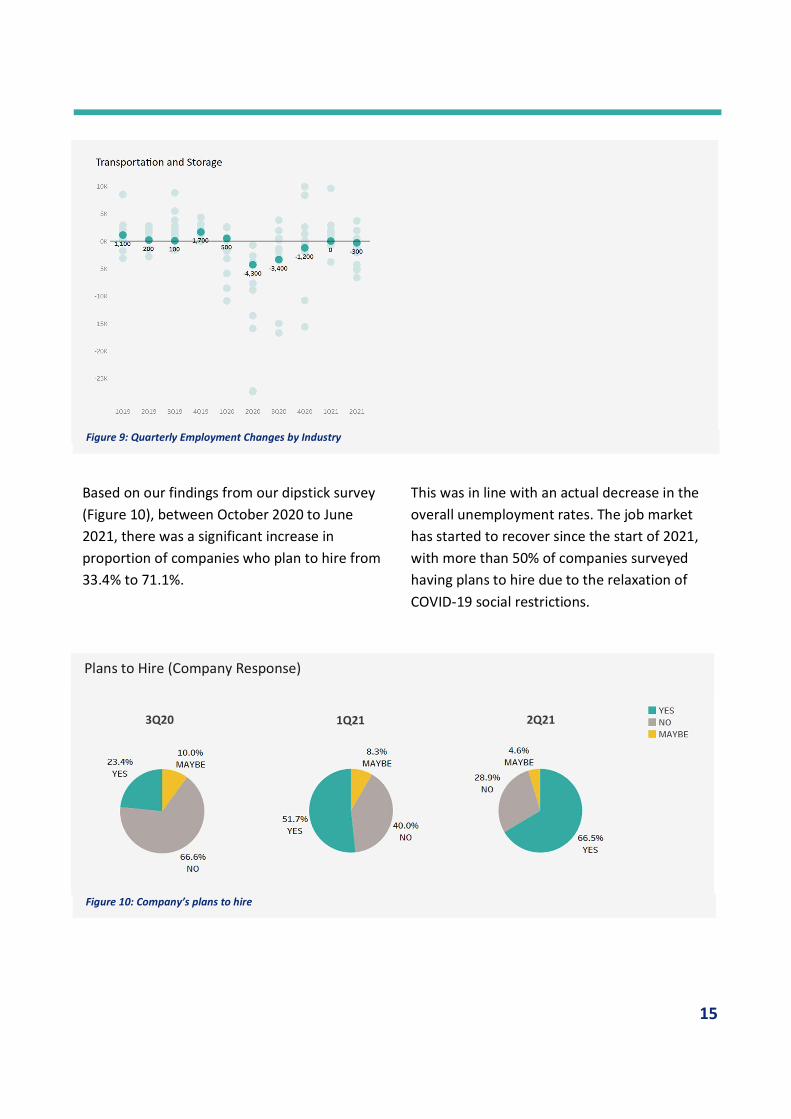
This was in line with an actual decrease in the overall unemployment rates. The job market has started to recover since the start of 2021, with more than 50% of companies surveyed having plans to hire due to the relaxation of COVID-19 social restrictions.
Based on our findings from our dipstick survey (Figure 10), between October 2020 to June 2021, there was a significant increase in proportion of companies who plan to hire from 33.4% to 71.1%.
Figure 9: Quarterly Employment Changes by Industry
Plans to Hire (Company Response)
3Q20 1Q21 2Q21
Figure 10: Company’s plans to hire
16
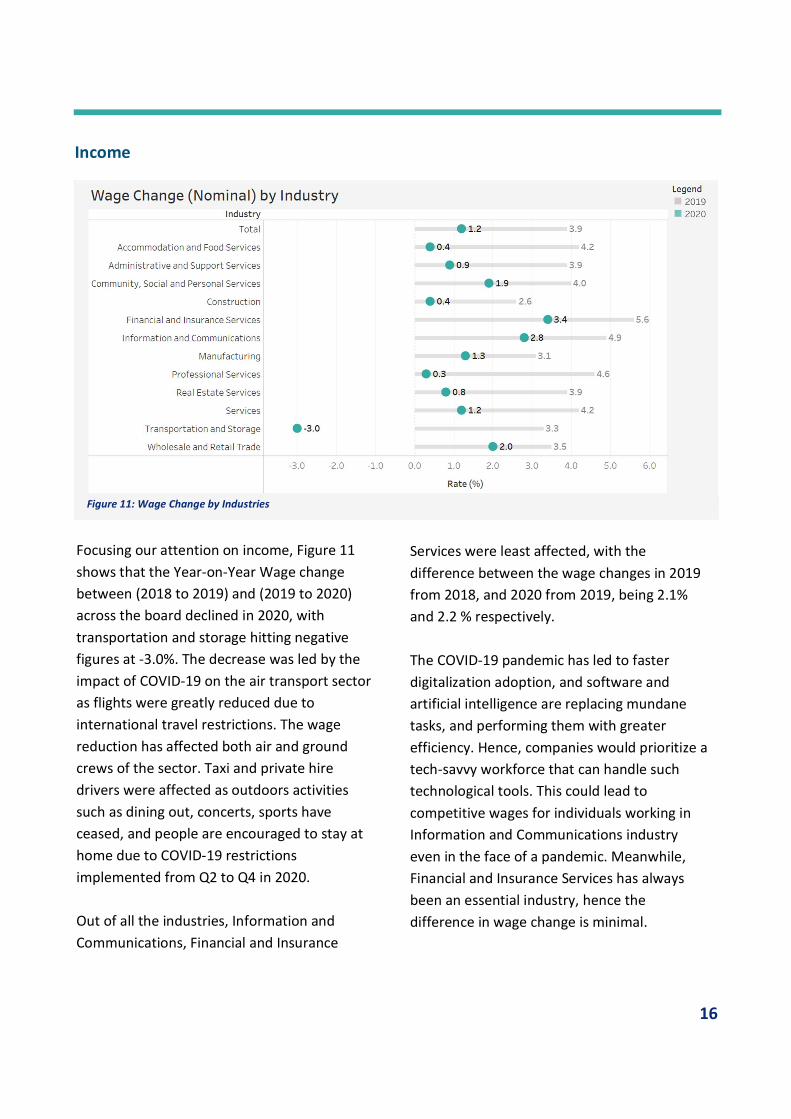
Income
Focusing our attention on income, Figure 11 shows that the Year-on-Year Wage change between (2018 to 2019) and (2019 to 2020) across the board declined in 2020, with transportation and storage hitting negative figures at -3.0%. The decrease was led by the impact of COVID-19 on the air transport sector as flights were greatly reduced due to international travel restrictions. The wage reduction has affected both air and ground crews of the sector. Taxi and private hire drivers were affected as outdoors activities such as dining out, concerts, sports have ceased, and people are encouraged to stay at home due to COVID-19 restrictions implemented from Q2 to Q4 in 2020. Out of all the industries, Information and Communications, Financial and Insurance
Services were least affected, with the difference between the wage changes in 2019 from 2018, and 2020 from 2019, being 2.1% and 2.2 % respectively. The COVID-19 pandemic has led to faster digitalization adoption, and software and artificial intelligence are replacing mundane tasks, and performing them with greater efficiency. Hence, companies would prioritize a tech-savvy workforce that can handle such technological tools. This could lead to competitive wages for individuals working in Information and Communications industry even in the face of a pandemic. Meanwhile, Financial and Insurance Services has always been an essential industry, hence the difference in wage change is minimal.
Figure 11: Wage Change by Industries
17
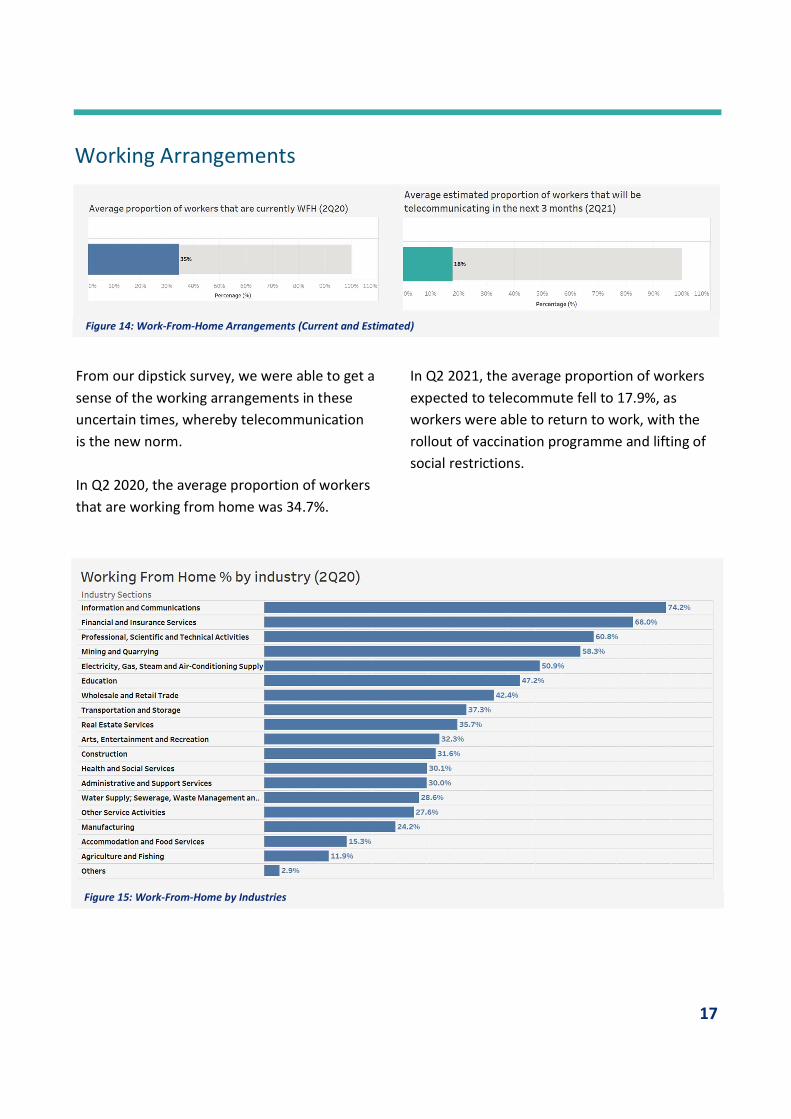
From our dipstick survey, we were able to get a sense of the working arrangements in these uncertain times, whereby telecommunication is the new norm. In Q2 2020, the average proportion of workers that are working from home was 34.7%.
Working Arrangements
Figure 14: Work-From-Home Arrangements (Current and Estimated)
In Q2 2021, the average proportion of workers expected to telecommute fell to 17.9%, as workers were able to return to work, with the rollout of vaccination programme and lifting of social restrictions.
Figure 15: Work-From-Home by Industries
18
As seen from Figure 15, over 60% of the workers in Information and Communication and Financial and Insurance and Professional, Scientific, and Technical activities sectors were working from home, in Q2 2020. This is due to the availability of the necessary equipment due to the nature of the industry. On the other hand, the bottom 3 industries include Manufacturing, Accommodation and Food services and Agriculture and Fishing sectors. Workers are unable to telecommute due to the inherent nature of the work.
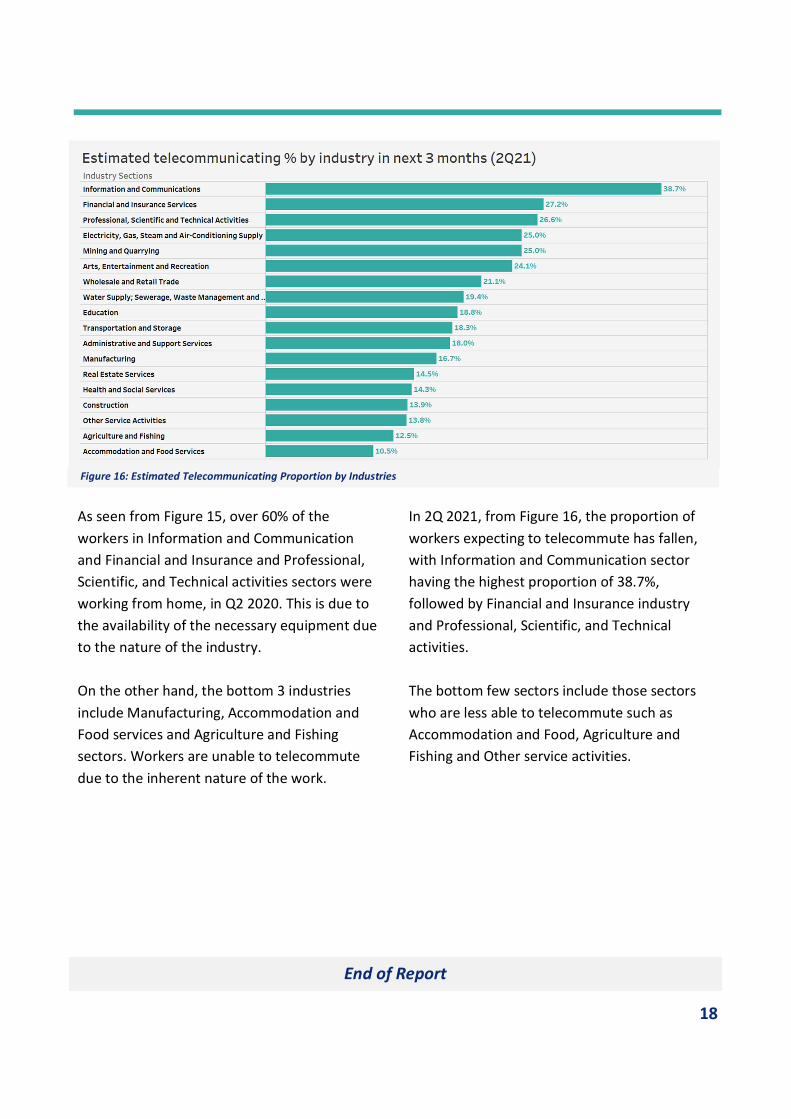
In 2Q 2021, from Figure 16, the proportion of workers expecting to telecommute has fallen, with Information and Communication sector having the highest proportion of 38.7%, followed by Financial and Insurance industry and Professional, Scientific, and Technical activities. The bottom few sectors include those sectors who are less able to telecommute such as Accommodation and Food, Agriculture and Fishing and Other service activities.
End of Report
Figure 16: Estimated Telecommunicating Proportion by Industries