
A shared cortical bottleneck underlying Attentional Blink and Psychological Refractory Period

Electrophysiological evidence of visual encoding deficits
in a cross-modal attentional blink paradigm
R. DELL’ACQUA,a P. JOLICOEUR,b F. PESCIARELLI,c R. JOB,c and D. PALOMBAc
aDepartment of Human Sciences and Center for Neuroscience, University of Ferrara, Ferrara, ItalybDepartement de Psychologie, Universite de Montreal, Montreal, CanadacDepartment of Developmental Psychology, University of Padova, Padova, Italy
Abstract
Two experiments are reported in which two target stimuli, T1 and T2, were presented at variable stimulus onset
asynchronies (SOAs). In Experiment 1, T1 and T2 were visual stimuli embedded in a rapid serial visual presentation
(RSVP) stream of distractors. Participants were asked to report T1 and T2 at the end of the stream. In Experiment 2,
T1 was an auditory stimulus, and T2 a visual stimulus embedded in an RSVP stream. Participants made a speeded
discriminative response to T1, and reported T2 at the end of the stream. An attentional blink (AB) effect was observed
in both experiments: T2 report suffered at short SOA compared to long SOA. During the AB, the amplitude of the
P300 component of the event-related potential (ERP) locked to T2 onset was sensibly reduced in both experiments.
Behavioral and ERP results were very similar across the two experiments. Implications for models of the AB effect are
discussed.
Descriptors: Attentional blink, P300, Visual memory, Cognitive limitation
Two different paradigms have been used extensively to study
attentional limitations affecting the processing of two sequen-
tially presented targets: The attentional blink (AB) paradigm and
the psychological refractory period (PRP) paradigm. In both
paradigms, performance on the second target is strongly
dependent on the time interval between the onset of the first
target and the onset of the second target (i.e., stimulus onset
asynchrony or SOA), whereas performance on the first target is
affected much less by the SOA manipulation. In the AB
paradigm, the two targets (usually designated as T1 and T2)
are often embedded in a stream of distractor stimuli presented
using the rapid serial visual presentation (RSVP; e.g., Raymond,
Shapiro, & Arnell, 1992) method. Generally, the accuracy of
report of T2 is impaired when the SOA between the two targets is
shorter than 500-600ms and T1 must also be processed. This
decrement in report accuracy is the AB effect. In the PRP
paradigm, the stimuli are usually presented in isolation, and
speeded responses are made to each stimulus. The PRP effect is a
progressive increase in response time to the second stimulus as
the SOA between the two stimuli is reduced (see Pashler, 1994,
for a review).
Despite the difference in method used to investigate the AB
effect and the PRP effect, recent empirical work and theorizing
about these two attentional deficits have illuminated some
interesting similarities concerning the functional causes of these
attentional deficits (Crebolder, Jolicoeur, & McIlwaine, 2002;
Jolicoeur, Dell’Acqua, Crebolder, 2001; Luck & Vogel, 2001;
Ruthruff & Pashler, 2001). Although early work on the AB effect
suggested a perceptual locus (e.g., Raymond et al., 1992), later
work has implicated a late, postperceptual locus of this effect
(e.g, Jolicoeur & Dell’Acqua, 2000; Luck, Vogel, & Shapiro,
1996; Vogel, Luck, & Shapiro, 1998). There is also considerable
evidence for a late locus of interference in the PRP paradigm
(Pashler & Johnston, 1989; see Pashler, 1994, for a review).
Thus, performance deficits in both paradigms reflect postper-
ceptual capacity limitations.
The results of Vogel et al. (1998) suggesting a late locus of AB
interference are particularly interesting. The second target in one
of their experiments (Experiment 2, p. 1662) was aword, whereas
the first target was a string of repeated digits. These targets were
presented in an RSVP stream consisting of strings of random
letters. The RSVP stream was preceded by a context word
(exposed for 1,000ms). The target word could either be
semantically congruent or semantically incongruent with the
context word. The subjects were instructed to report the digit,
and indicate whether the context word and the target word
following the digit were semantically congruent words or not.
The event-related potentials (ERPs) time-locked to the target
word onset were recorded. A strong AB effect was observed:
When the target word followed the digit at an intermediate SOA
(252ms), the semantic judgment accuracy was substantially
This research was supported by grants from the Italian Ministry of
Scientific Research to R.D. (FIRB 2001 RBAU01LE9P). The authors
are indebted to F. Vespignani for help in the analysis of the
electrophysiological data.Address reprint requests to: Roberto Dell’Acqua, Department of
Human Sciences, 38, Via Savonarola, 44100 Ferrara, Italy. E-mail:[email protected].
Psychophysiology, 40 (2003), 629–639. Blackwell Publishing Inc. Printed in the USA.Copyright r 2003 Society for Psychophysiological Research
629

lower than at the other SOAs (84 and 588ms). In contrast, the
magnitude of the N400 response to semantically incongruent
words had the same normal amplitude at all SOAs. The N400
response suggests that T2 was identified and processed to the
level of meaning. Furthermore, the fact that the N400 response
did not vary with SOA suggests that the meaning of the target
words was activated at all three SOAs (thus, independently on
the AB). In a different experiment, Vogel et al. found a reduced
P300 response to an infrequent T2 letter stimulus presented
during the AB (Experiment 4, p. 1666). Although different
interpretations have been proposed for the P300 response (e.g.,
Donchin, 1981; Verleger, 1988), there is a general consensus that
P300 represents electrophysiological evidence for the updating of
information in working memory (WM; Donchin & Coles, 1988;
Johnson, 1986). Findings of a suppressed P300 wave time-locked
toT2 during theABhave thus been taken as evidence that theAB
reflects a failure to encode T2 into visual WM (VWM; Vogel et
al., 1998). The fact that the SOA manipulation in the AB
paradigm does not affect the magnitude of the N400 response
suggests that the AB does not prevent the retrieval of semantic
information associated with T2. Jointly, these two results suggest
that targets that cannot be reported because of the AB have,
nonetheless, been fully identified (intact N400), but have not
been encoded into VWM (suppressed P300).
The results obtained by Vogel et al. (1998) provide strong
support for models that postulate that the AB phenomenon is an
encoding deficit, and is caused by limitations at a stage of
processing involved in consolidating the transient perceptual
representation of T2 into a durable VWM representation (Chun
& Potter, 1995; Jolicoeur, 1998; Jolicoeur & Dell’Acqua, 1998,
1999; Wong, 2002). When consolidation is engaged for T1,
consolidation of a fleeting and temporarily unstable T2 must
wait, increasing the probability that the perceptual representa-
tion of T2 decays, or is masked by trailing stimuli (Brehaut,
Enns, & Di Lollo, 1999). According to the attentional dwell
model (Ward, Duncan, & Shapiro, 1996), identification and/or
detection of serially presented visual targets draws on a common
pool of attentional resources. In this framework, the AB effect
reflects the reduced availability of attentional resources for the
consolidation of T2 in VWMwhen a portion of these resources is
allocated to the consolidation of T1 in visual VWM. A model
that is not included in the aforementioned subset is the proposal
advanced by (Shapiro, Raymond, and Arnell 1994; see also
Maki, Frigen, & Paulson, 1997; Raymond, Shapiro, & Arnell,
1995), according to which the AB effect arises after T1, T2, and
distractors immediately following T1 and T2 in the RSVP stream
have already reached the status of VWM representations. The
attentional blink is explained, in this optic, in terms of
interference affecting T2 at or just before a retrieval stage, due
to the presence in VWMof concurrently active, competing items.
Other evidence suggests that encoding information into
VWM is subject to processing capacity limitations. Jolicoeur
(1999), for instance, combined the requirement of making a
speeded response to an auditory T1 with the delayed report of a
visual T2. T1 was a pure tone presented at two frequencies. T2
was always a target letter embedded in an RSVP stream of
distractors. Subjects made a speeded choice response to T1 based
on pitch, and reported T2 without speed pressure at the end of
each trial. The logic of this paradigm rested on the idea of using a
first task known to cause a PRP effect in the PRP paradigm, and
merging it with a task normally employed in AB studies in order
to test whether the presentation of T1 and T2 in cross-modal
conditions would bring about an AB effect. Indeed, large and
reliable AB effects were consistently found in this and similar
paradigms (Jolicoeur, 1999; see also Dell’Acqua & Jolicoeur,
2000; Dell’Acqua, Turatto, & Jolicoeur, 2001; Jolicoeur,
Dell’Acqua, & Crebolder, 2000). The similarity between the
impairments described by Jolicoeur and those found in typical
AB experiments suggest a possible functional similarity in the
underlying causes of the two effects. Jolicoeur argued that both
response selection and short-term consolidation are mental
operations carried out by central mechanisms, such that both are
subject tomutual interference when engaged concurrently for the
execution of temporally overlapping, independent tasks (see also
Arnell & Jolicoeur, 1999).
Our present goal was to test the hypothesis that the
performance deficit described by Jolicoeur (1999), like the deficit
observed in typical AB experiments, can be characterized in
terms of a failure to update VWM when T2 is temporally
contiguous to T1. This would provide evidence that using a
speeded task on an auditory T1, which is typical in most PRP
designs, generates the same consequences on T2 processing as
those hypothesized to be subtended in the AB effect observed in
RSVP contexts, in which all stimuli are presented visually and
targets are associated with delayed responses. We did this by
focusing on the P300 component elicited by a masked T2
embedded in anRSVP streamof distractors. In Experiment 1, we
set out to replicate the results obtained by Vogel et al. (1998), and
so T1 and T2 were both visual stimuli embedded in an RSVP
stream that had to be reported without speed pressure at the end
of the trial. In contrast, in Experiment 2, T1 was an auditory
stimulus associated with a speeded choice task. In both
experiments, we measured the accuracy of report of T2 and the
ERP locked to the onset of T2. Given previous results (e.g.,
Jolicoeur, 1999), we expected to find an AB effect in both
experiments, and we expected that the AB effect produced in
Experiment 1 would be reflected in a large reduction of the P300
component of the ERP locked to the onset of T2 (Vogel et al.,
1998). The new empirical question was whether a similar effect
would also be found in Experiment 2, in which the performance
deficit in Task 2 was generated by a different, cross-modal task
performed in response to T1. Suppression of the P300 wave time-
locked to T2 following the cross-modal, speeded Task 1 in
Experiment 2 would provide further converging evidence for a
similarity between the underlying cause of the visually elicitedAB
(in the ‘‘standard paradigm’’) and the cause of the cross-modal
effect reported by Jolicoeur (1999).
EXPERIMENT 1
In Experiment 1, we used the same experimental settings and
methodology as those used by Vogel et al. (1998) in their
Experiment 4. Stimuli were displayed using the RSVP method.
Each RSVP stream contained two target stimuli that had to be
identified and reported with no speed pressure at the end of the
RSVP stream presentation. The first target stimulus (T1) was a
digit, and the second target stimulus (T2) was the letterE on 25%
of the trials, or a different letter (chosen randomly among all
letters except E) on the remaining 75% of the trials. On half of
the blocks of trials, subjects had to report the digit in T1, and
report whether an E was present in the stream of stimuli
following T1. On the other half of the blocks of trials, the digit in
T1 could be ignored, and only T2 required an overt response.
630 R. Dell’Acqua et al.

The use of task-defined stimulus categories for T2 differing in
frequency (25% E vs. 75% non-E trials) is tied to a specific
difficulty that is encountered with ERP quantification under
RSVP conditions. A target item in the RSVP stream generates an
electrical perturbation that lasts several hundred milliseconds
following its onset, and overlaps considerably with analogous
electrical perturbations evoked by the items preceding and
following the target item in the same stream. Isolating a P300
component elicited by the target item in this context with the use
of standard techniques is problematic. To solve this problem,
Vogel et al. adopted a variant of the irrelevant-probe technique
developed in ERP studies on spatial attention (e.g., Luck &
Hillyard, 1995). The logic behind the use of this technique hinges
on two demonstrated facts. The first fact is that voltage fields
summate linearly. The second fact is that the P300 amplitude is
probability sensitive, with larger P300 components elicited by
stimuli falling in the less frequent task-defined stimulus category
(Donchin, 1981). Jointly, these two facts provide the necessary
support to the following assumption. On the hypothesis that the
ERP elicited on E trials is the sum of an enlarged P300 response
and an electrical response modulated by the other items in the
RSVP stream, whereas the ERP elicited on non-E trials only
reflects the response to the other items in the stream, a pure P300
response to the stimulus E may be isolated by subtracting the
ERP generated on non-E trials from the ERP response generated
on E trials. This technique was used to generate the electro-
physiological results of Experiment 1 and Experiment 2.
Method
Seventeen observers volunteered to participate, all with normal
or corrected-to-normal vision. The stimuli were black (0.4 cd/
msq) uppercase letters (A–Z) and white (25 cd/msq) digits (1–9)
presented on a gray (11 cd/msq) background. The stimuli were
presented at the center of the monitor of a computer, at a rate of
10 items per second (no interstimulus interval). Each character
subtended 1.0 degree of visual angle in height and in width. The
viewing distance was approximately 60 cm. Each trial began with
the presentation of a fixation point at the center of the screen that
disappeared upon trial initiation. After 600ms, the RSVP of
characters began. There were 6 to 9 randomly selected letters
prior to a digit (T1), and 10 to 12 letters following T1. T2 was
either the first, third, or ninth letter following T1, corresponding
to a T1-T2 SOA of either 100, 300, or 900ms, respectively. T2
was the letter E on 25% of the trials. On the remaining 75% of
the trials, T2 was one letter selected at random from the set of
available letters excluding E. In five blocks of 60 trials each,
observers pressed one of two keys (i.e., the keys 1 and 2 of the
numeric keypad of the keyboard) at the end of the RSVP to
indicate whether the T1 digit was odd or even, and they pressed a
third key (i.e., the key E of the keyboard) to indicate whether one
of the letters following T1 was the letterE. In another five blocks,
observers ignored T1 and only indicated whether one of the
letters following T1 was the letter E. In both types of trials, when
T2 was not the letter E, observers moved on to the beginning of
the next trial by pressing the space bar. The order of block types
(single-task vs. dual-task) was random.
Electroencephalographic (EEG) activity was recorded from
tin electrodes located at sites Fz, Cz, Pz (10/20 System; Jasper,
1958), referenced to the mastoids. Vertical eye movements
(EOG) were bipolarly recorded from one electrode above and
one electrode below the left eye. The EEG and the EOG were
amplified with a bandpass filter of 0.05–40Hz, at a sampling rate
of 250Hz, and with a gain of 2500 (accuracy 0.034mV/LSB,range 71.1mV). Impedance at each electrode site was main-
tained below 5KO. A number of steps were taken to reduce and
quantify EEG data. First, a regression procedure to remove
ocular artifacts from the EEG recordings was applied to the
continuous bioelectrical data. Epochs associated with the
stimulus in the T2 position, which extended temporally from
200ms prestimulus to 1,000ms poststimulus, were extracted
from the continuous data, and the bioelectrical signal at each
recording site within each epoch was baseline corrected using the
mean activity recorded during the 200-ms prestimulus period. At
any electrode location, epochs in which EEG activity exceeded
7100mVwere eliminated. ERP waveforms included only epochs
time-locked to T2 onset that were associated with a correct
response to T1. Trials containing ocular artifacts, movement
artifacts, or amplifier saturations were excluded from the
averaged ERP waveforms (11%). Separate grand average
waveforms for each condition and for each stimulus category
were finally generated, and difference waves were constructed by
subtracting the ERP waveforms elicited by the frequent T2
category (non-E letter) from the ERP waveforms elicited by the
infrequent T2 stimulus category (E). The P300 component
amplitude values were estimated based on these difference waves
as the mean amplitude 300–700ms poststimulus,1 relative to the
200-ms prestimulus baseline.
Behavioral data (mean percent accurate responses to T1 and
mean hit rate for responding E when E was presented in T2) and
electrophysiological data (i.e., mean P300 amplitude values in
the subtracted ERP waveforms) were submitted to analysis of
variance (ANOVA), in which the task on T1 (single-task vs.
dual-task), and SOA (100ms vs. 300ms vs. 900ms) were treated
as within-subject factors. Recording site (Cz vs. Fz vs. Pz) was
included as an additional within-subject factor in the analysis
performed on the electrophysiological data.
Results
Behavior
Mean T2 report accuracy is shown in Figure 1 (upper panel) as a
function of the task on T1 (either report T1, labeledDual-Task in
the figure, or ignore T1, labeled Single-Task in the figure), and as
a function of SOA. T2 performance was lower in the dual-task
condition than in the single-task condition at the two shorter
SOAs, but was nearly equivalent across single-task and dual-task
conditions at the longest SOA. Significant effects of both T1 task,
F(1,16)5 133.3, po.01, SOA, F(2,32)5 4.0, po.04, and their
interaction, F(2,32)5 12.6, po.01, were found. In the dual-task
condition, T2 performance at the two shorter SOAs did not differ
Attentional blink and electrophysiology 631
1In this study, we report and discuss electrophysiological resultsobtained by considering a P300 component amplitude calculated on thebasis of a time window of 300–700ms. This time window differs slightlyfrom the time window considered by Vogel et al. (1998) in an analogousexperimental context (i.e., 400–800ms). Although the present timewindow seems to capture with more precision the overall P300 amplitudeextension (from the latency of the earliest notable deviation frombaselineof the ERP function to its return to baseline after reaching the positivepeak), we also performed parallel analyses for Experiment 1 andExperiment 2 on P300 amplitudes based on a time window of 400–800ms, finding no difference between the two sets of statistical analyses.
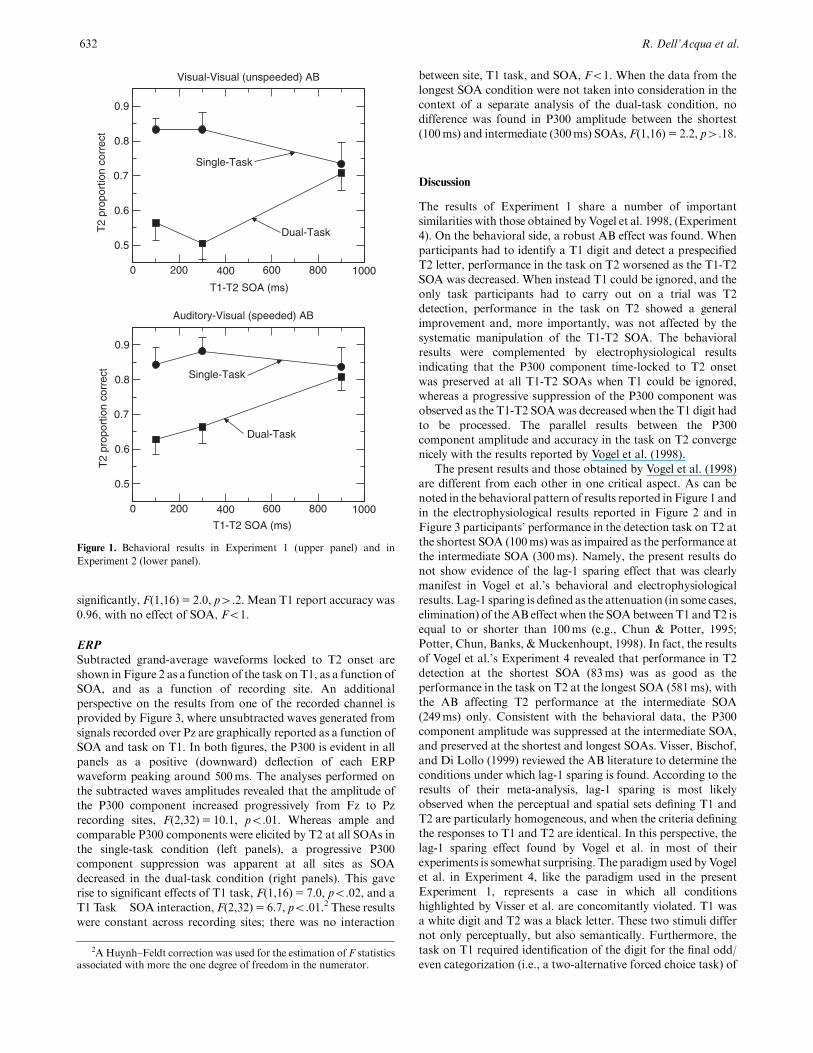
significantly, F(1,16)5 2.0, p4.2. Mean T1 report accuracy was
0.96, with no effect of SOA, Fo1.
ERP
Subtracted grand-average waveforms locked to T2 onset are
shown in Figure 2 as a function of the task on T1, as a function of
SOA, and as a function of recording site. An additional
perspective on the results from one of the recorded channel is
provided by Figure 3, where unsubtracted waves generated from
signals recorded over Pz are graphically reported as a function of
SOA and task on T1. In both figures, the P300 is evident in all
panels as a positive (downward) deflection of each ERP
waveform peaking around 500ms. The analyses performed on
the subtracted waves amplitudes revealed that the amplitude of
the P300 component increased progressively from Fz to Pz
recording sites, F(2,32)5 10.1, po.01. Whereas ample and
comparable P300 components were elicited by T2 at all SOAs in
the single-task condition (left panels), a progressive P300
component suppression was apparent at all sites as SOA
decreased in the dual-task condition (right panels). This gave
rise to significant effects of T1 task, F(1,16)5 7.0, po.02, and a
T1 Task� SOA interaction, F(2,32)5 6.7, po.01.2 These results
were constant across recording sites; there was no interaction
between site, T1 task, and SOA, Fo1. When the data from the
longest SOA condition were not taken into consideration in the
context of a separate analysis of the dual-task condition, no
difference was found in P300 amplitude between the shortest
(100ms) and intermediate (300ms) SOAs, F(1,16)5 2.2, p4.18.
Discussion
The results of Experiment 1 share a number of important
similarities with those obtained by Vogel et al. 1998, (Experiment
4). On the behavioral side, a robust AB effect was found. When
participants had to identify a T1 digit and detect a prespecified
T2 letter, performance in the task on T2 worsened as the T1-T2
SOA was decreased. When instead T1 could be ignored, and the
only task participants had to carry out on a trial was T2
detection, performance in the task on T2 showed a general
improvement and, more importantly, was not affected by the
systematic manipulation of the T1-T2 SOA. The behavioral
results were complemented by electrophysiological results
indicating that the P300 component time-locked to T2 onset
was preserved at all T1-T2 SOAs when T1 could be ignored,
whereas a progressive suppression of the P300 component was
observed as the T1-T2 SOAwas decreased when the T1 digit had
to be processed. The parallel results between the P300
component amplitude and accuracy in the task on T2 converge
nicely with the results reported by Vogel et al. (1998).
The present results and those obtained by Vogel et al. (1998)
are different from each other in one critical aspect. As can be
noted in the behavioral pattern of results reported in Figure 1 and
in the electrophysiological results reported in Figure 2 and in
Figure 3 participants’ performance in the detection task on T2 at
the shortest SOA (100ms) was as impaired as the performance at
the intermediate SOA (300ms). Namely, the present results do
not show evidence of the lag-1 sparing effect that was clearly
manifest in Vogel et al.’s behavioral and electrophysiological
results. Lag-1 sparing is defined as the attenuation (in some cases,
elimination) of theAB effect when the SOAbetweenT1 andT2 is
equal to or shorter than 100ms (e.g., Chun & Potter, 1995;
Potter, Chun, Banks, &Muckenhoupt, 1998). In fact, the results
of Vogel et al.’s Experiment 4 revealed that performance in T2
detection at the shortest SOA (83ms) was as good as the
performance in the task on T2 at the longest SOA (581ms), with
the AB affecting T2 performance at the intermediate SOA
(249ms) only. Consistent with the behavioral data, the P300
component amplitude was suppressed at the intermediate SOA,
and preserved at the shortest and longest SOAs. Visser, Bischof,
and Di Lollo (1999) reviewed the AB literature to determine the
conditions under which lag-1 sparing is found. According to the
results of their meta-analysis, lag-1 sparing is most likely
observed when the perceptual and spatial sets defining T1 and
T2 are particularly homogeneous, and when the criteria defining
the responses to T1 and T2 are identical. In this perspective, the
lag-1 sparing effect found by Vogel et al. in most of their
experiments is somewhat surprising. The paradigmused byVogel
et al. in Experiment 4, like the paradigm used in the present
Experiment 1, represents a case in which all conditions
highlighted by Visser et al. are concomitantly violated. T1 was
a white digit and T2 was a black letter. These two stimuli differ
not only perceptually, but also semantically. Furthermore, the
task on T1 required identification of the digit for the final odd/
even categorization (i.e., a two-alternative forced choice task) of
632 R. Dell’Acqua et al.
0 200 400 600 800 1000
T1-T2 SOA (ms)
0.5
0.6
0.7
0.8
0.9
T2
prop
ortio
n co
rrec
t
Auditory-Visual (speeded) AB
0 200 400 600 800 1000
T1-T2 SOA (ms)
0.5
0.6
0.7
0.8
0.9T
2 pr
opor
tion
corr
ect
Visual-Visual (unspeeded) AB
Single-Task
Dual-Task
Dual-Task
Single-Task
Figure 1. Behavioral results in Experiment 1 (upper panel) and in
Experiment 2 (lower panel).
2A Huynh–Feldt correction was used for the estimation of F statisticsassociated with more the one degree of freedom in the numerator.

the digit identity, whereas the task on T2 required detection of a
prespecified target letter (i.e., a go/no-go task).
A partial reconciliation between the present results and those
of Vogel et al. (1998) may be attempted by considering some
notable exceptions to the regularities concerning the lag-1
sparing effect outlined by Visser et al. (1999). Potter, Staub,
and O’Connor (2002), for instance, have recently observed lag-1
sparing effects under conditions in which T1 and T2 were words
presented in different spatial locations (i.e., above and below a
central fixation point) and the SOA between T1 and T2 was
decreased to reach durations shorter than 100ms. These results
were unexpected from the point of view of Visser et al. Potter et
al.’s (2002) results are suggestive of the critical role of time, as
opposed to the similarity in perceptual and/or response sets
between T1 and T2, in generating lag-1 sparing effects in AB
designs. Lag-1 sparing, in Potter’s view, would more likely be
Attentional blink and electrophysiology 633
-200 0 200 400 600 800 1000
Time (ms) from T2 onset
-10
-5
5
10
mic
roV
Lag-1
Lag-3
Lag-9
Single-Task (Cz)
-10
-5
5
10
mic
roV
Lag-1
Lag-3
Lag-9
Single-Task (Fz)
-10
-5
5
10
Lag-1
Lag-3
Lag-9
Dual-Task (Pz)
-10
-5
5
10
Lag-1
Lag-3
Lag-9
Dual-Task (Cz)
-10
-5
5
10
Lag-1
Lag-3
Lag-9
Dual-Task (Fz)
-10
-5
5
10
mic
roV
Lag-1
Lag-3
Lag-9
Single-Task (Pz)
-200 0 200 400 600 800 1000
Time (ms) from T2 onset
Figure 2. Electrophysiological results in Experiment 1. Grand-average difference waveforms (T2 E � T2 random letter) recorded
under single-task conditions (left panels) and dual-task conditions (right panels).

observed when the SOA between T1 and T2 is shorter than
100ms (and independently on the number of items intervening
between T1 and T2). In this alternative perspective, it might be
that the different SOAs used in the present context than those
used in Vogel et al.’s study make it more likely to observe a lag-1
sparing effect in Vogel’s et al. study than in the present study. As
a matter of fact, the shortest SOA used by Vogel et al. (83ms)
falls in the range of durations in which Potter et al. found a lag-1
sparing effect, which was not consistent with the rules suggested
by Visser’s et al. meta-analysis.
EXPERIMENT 2
Experiment 1 provided a nice conceptual replication of the
attenuation of the P300 response to T2 during the AB reported
634 R. Dell’Acqua et al.
-200 0 200 400 600 800 1000
Time (ms) from T2 onset
-12
-8
-4
0
4
8
12
mic
roV
Enon-E
Single-Task Lag 3 (Pz)
-12
-8
-4
4
8
12
mic
roV
Enon-E
Single-Task Lag 1 (Pz)
-12
-8
-4
0
4
8
12
Enon-E
Dual-Task Lag 9 (Pz)
-12
-8
-4
4
8
12
Enon-E
Dual-Task Lag 3 (Pz)
-12
-8
-4
4
8
12
Enon-E
Dual-Task Lag 1 (Pz)
-12
-8
-4
0
4
8
12
mic
roV
Enon-E
Single-Task Lag 9 (Pz)
-200 0 200 400 600 800 1000
Time (ms) from T2 onset
Figure 3. Electrophysiological results in Experiment 1. Grand-average waveforms recorded at Pz site plotted separately for the
frequent T2 condition (T2 non-E) and the infrequent T2 condition (T2 E).

by Vogel et al. (1998). These results establish the adequacy of our
methods and provide comparison results for those of Experiment
2. In Experiment 2 we used the same stimulus presentation and
task for T2 as had been used in Experiment 1, but we replaced the
visual T1 that was used in Experiment 1 by a simple auditory
stimulus requiring a speeded choice response. Jolicoeur (1999)
found that this first task caused a significant AB effect in report
accuracy for T2.We expected to replicate this behavioral finding.
The new empirical question was whether we would also observe
an attenuated P300 response to T2 at short T1-T2 SOAs relative
to that observed at a long SOA.
Method
Seventeen observers volunteered to participate, all with normal
hearing and normal or corrected-to-normal vision. None had
participated in Experiment 1. The visual stimuli were uppercase
letters, and the sequence of visual events was the same as in
Experiment 1. The auditory stimuli were 50ms pure tones, with a
frequency of 550, 900, or 1400Hz. The tone (T1) was presented
in the position occupied by the digit in Experiment 1. The digit
was replacedwith a randomly selected letter other thanE. T2 was
either the first, third, or ninth letter following T1, corresponding
to a T1-T2 SOA of 100, 300, or 900ms, respectively. T2 was anE
on 25% of the trials, and a different letter otherwise. In five
blocks of 60 trials each, an immediate and speeded response was
required to T1. Observers rested the index, middle, and ring
fingers of the right hand on the 1, 2, and 3 keys of the numeric
keypad of the computer keyboard, and pressed one of these
buttons to indicate that the pitch was low, medium, or high,
respectively. Another key was pressed (not speeded) at the end of
the trial to indicate whether one of the letters in the RSVP stream
was an E. In another five blocks, observers ignored T1 and only
indicated whether one of the letters in the RSVP streamwas anE.
In both types of trials, when T2 was not an E, observers moved
on to the beginning of the next trial by pressing the space bar. The
order of block types (Respond-to-T1 vs. single-task) was
randomized for each observer. EEG and EOG recordings were
made as in Experiment 1.
Results
Behavior
Data associated with artifacts, incorrect responses to T1, or
reaction times to T1 (RT1s) longer than 2 s (10%) were excluded
from further analysis. Mean hit rate for T2 trials in which E was
presented can be seen in Figure 1 (lower panel) as a function of
the task on T1 (either respond-to-T1, labeled Dual-Task in the
figure, or ignore T1, labeled Single-Task in the figure), and as a
function of SOA. T2 performance was relatively stable across
SOAs in the single-task condition, whereas a progressive
decrease in T2 report accuracy was observed in the Respond-
to-T1 condition as SOA decreased. This produced a large
difference between the single-task versus the dual-task conditions
at short SOAs, but nearly identical performance at the longest
SOA. This pattern of results was reflected in the ANOVA by
significant effects of both T1 task, F(1,16)5 15.0, po.01, and by
a T1 Task� SOA interaction, F(2,32)5 5.5, po.01. In the dual-
task condition, T2 performance at the two shorter SOAs did not
differ significantly,Fo1.Mean T1 report accuracywas 0.90, and
meanRT1 was 601ms, with no effects of SOA, Fo1, in all cases.
ERP
Subtracted grand-averaged waveforms locked to T2 onset are
shown in Figure 4 as a function of the task on T1, as a function of
SOA, and as a function of recording site. Unsubtracted waves
generated from signals recorded over Pz are reported in Figure 5.
The analyses performed on subtracted waves amplitudes
revealed that the amplitude of the P300 component increased
progressively from Fz to Pz recording sites, F(2,32)5 12.5,
po.01. The P300 components elicited by T2 were comparable in
amplitude across SOAs in the single-task condition (left panels).
The P300 component was progressively reduced as SOA
decreased in the Respond-to-T1 condition (right panels). A
significant T1 Task� SOA interaction, F(2,32)5 7.3, po.01,
was found.No interactionwas found between T1 task, SOA, and
site, F(4,64)5 1.4, p4.22. When the data from the longest SOA
conditionwere not taken into consideration in a separate analysis
of the dual-task condition, no difference was found in P300
amplitude between the shortest (100ms) and intermediate
(300ms) SOAs, F(1,16)5 2.0, p4.17.
Discussion
The behavioral results in Experiment 1 and Experiment 2 were
very similar. We found large AB effects affecting the report of a
visual T2 both when T1 was also a visual stimulus to be reported
at the end of the trial, and when T1 was an auditory stimulus
associated with an immediate choice reaction time (CRT) task.
These results were much as expected based on several previous
demonstrations that an AB effect can be generated by T1 tasks
that produce PRP effects manifest as SOA-dependent RT
lengthening in speeded T2 tasks (e.g., Jolicoeur, 1998, 1999).
The results suggest strongly that the short-term consolidation
of T2 (Jolicoeur & Dell’Acqua, 1998) is susceptible to
interference from both concurrent consolidation of a stimulus
in the same modality or from concurrent processing required
for a speeded choice response to a stimulus in a different sensory
modality.
The crucial findings are the electrophysiological results
obtained in the present study. The electrophysiological con-
sequences on a key indicator of T2 performance were also very
similar in Experiment 1 and Experiment 2. More specifically, the
P300 component of the ERP time-locked to T2 onset was
attenuated during the AB critical interval in both experiments,
suggesting that interference on T2 processingmust have occurred
at or before the mechanisms that are responsible for the
generation of the P300 response. There is a general consensus
that the P300 response represents electrophysiological evidence
for the successful update of information in WM (Donchin &
Coles, 1988). More appropriately for the present context of
investigation, we reviewed evidence that suggests that the P300 is
an indicator of consolidation of new information in a VWM
(Vogel, Luck, & Shapiro, 1998). The reduction in P300
amplitude found in both the present experiments suggests that
the typical AB, in which both targets are masked visual stimuli,
and the AB caused by a cross-modal speeded choice task are both
reflections of interference at an encoding stage involved in T2
processing. In other words, the present results provide electro-
physiological evidence that T2 does not reach the status of a
representation in VWM, both in a classical unimodal RSVP
paradigm and in the cross-modal paradigm originally designed
by Jolicoeur (1999), in which the visual T1 associated with a
Attentional blink and electrophysiology 635

delayed report task was replaced with a pure tone requiring a
speeded choice response.
General Discussion
A number of models of the AB effect are based on the hypothesis
that the AB effect occurs when transferring information out of
VWM (e.g., Shapiro, Raymond, & Arnell, 1994; see also Isaak,
Shapiro, & Martin, 1999; Maki, Couture, Frigen, & Lien, 1997,
for analogous proposals). These models assume that the AB
effect is due to retrieval competition between T1 and T2 (and
distractors immediately following T1 and T2 in the RSVP stream
of stimuli) when T1 and T2 have already been encoded as WM
representations. Much of the support for these models has come
from results indicating that incorrect responses to T2 at short lags
tend to be nonrandom, that is, subjects tend to report distractors
636 R. Dell’Acqua et al.
-200 0 200 400 600 800 1000
Time (ms) from T2 onset
-10
-5
5
10
mic
roV
Lag-1
Lag-3
Lag-9
Single-Task (Cz)
-10
-5
5
10
mic
roV
Lag-1
Lag-3
Lag-9
Single-Task (Fz)
-10
-5
5
10
Lag-1
Lag-3
Lag-9
Dual-Task (Pz)
-10
-5
5
10
Lag-1
Lag-3
Lag-9
Dual-Task (Cz)
-10
-5
5
10
Lag-1
Lag-3
Lag-9
Dual-Task (Fz)
-10
-5
5
10
mic
roV
Lag-1
Lag-3
Lag-9
Single-Task (Pz)
-200 0 200 400 600 800 1000
Time (ms) from T2 onset
Figure 4. Electrophysiological results in Experiment 2. Grand-average difference waveforms (T2 E � T2 random letter) recorded
under single-task conditions (left panels) and dual-task conditions (right panels).

immediately following T2. This approach cannot account for the
present results in a number of ways. One way is related to the
physical format of the stimuli used in Experiment 2. In
Experiment 2, T1 was a pure tone and the task on T1 was a
speeded pitch-discrimination task. Consequently, there is no
reason to expect that any representation of T1 would enter
VWM, and hence there should be no competing representations
in VWM that would interfere with the report of a visually
presented T2. Furthermore, these models cannot easily account
for the electrophysiological aspects of the present findings. As is
clear, had T2 existed as VWM representation some time after its
presentation in the present experiments, the P300 amplitude
would not have been affected by the SOA manipulation. On the
other hand, nonrandom errors are not in contrast with the
alternative class of models that we have considered in the present
context, that is, models of the AB as an encoding deficit. Models
Attentional blink and electrophysiology 637
-200 0 200 400 600 800 1000
Time (ms) from T2 onset
-12
-8
-4
0
4
8
12
mic
roV
Enon-E
Single-Task Lag 3 (Pz)
-12
-8
-4
4
8
12
mic
roV
Enon-E
Single-Task Lag 1 (Pz)
-12
-8
-4
0
4
8
12
Enon-E
Dual-Task Lag 9 (Pz)
-12
-8
-4
4
8
12
Enon-E
Dual-Task Lag 3 (Pz)
-12
-8
-4
4
8
12
Enon-E
Dual-Task Lag 1 (Pz)
-12
-8
-4
0
4
8
12
mic
roV
Enon-E
Single-Task Lag 9 (Pz)
-200 0 200 400 600 800 1000
Time (ms) from T2 onset
Figure 5. Electrophysiological results in Experiment 2. Grand-average waveforms recorded at Pz site plotted separately for the
frequent T2 condition (T2 non-E) and the infrequent T2 condition (T2 E).

in this class share the assumption that a short-lived conceptual
representation is generated for all items embedded in a RSVP
stream following a high-capacity first stage of processing.
Nonrandom errors in this perspective are explained as reflections
of the competition between concurrently active items at this first
stage when attempting to select T2 for entry in VWM via a
consolidation stage of processing (Chun & Potter, 1995; see also
Jiang & Chun, 2001).
In previous work, we argued that part of the processing
required to generate a representation for T2 that can provide the
basis for an overt report (Duncan, 1980) is subject to central
capacity limitations (Jolicoeur & Dell’Acqua, 1998, 1999). The
present results provide additional support for the view that the
AB deficits observed by Jolicoeur (1999), using mixed PRP/AB
designs, belong to the same class of deficits as observed in AB
experiments using uni-modal RSVP paradigms. In the same vein,
we argue that the most parsimonious explanation of the present
findings is that consolidation and response selection are both
operations that require central resources that cannot be shared
easily across tasks (Arnell & Jolicoeur, 1999). When such
operations are required for the execution of temporally over-
lapping tasks, mutual postponement or some other form of
mutual interference of one or both operations results in slower
and/or more error-prone performance, particularly for the
second target stimulus. The results of Experiment 1 and
Experiment 2 are, in this framework, analogous manifestations
of interference on the short-term consolidation (Jolicoeur &
Dell’Acqua, 1998) of T2 mediated, respectively, by concurrent
consolidation of T1 and by concurrent response selection for the
speeded task on T1. Both of these manifestations were clearly
reflected in the lower T2 report accuracy and attenuated P300
responses in the ERP time-locked to T2 onset.
Distinct aspects of the present study are congruent with
results of recent ERP investigations in the attentional domain.
Vogel and Luck (in press) have found evidence of onset latency
delays of the P300 time-locked to T2 at short T1-T2 lags in a
paradigm in which T2 was always the last item in each RSVP
stream (i.e., T2 was not masked). Under these conditions, there
was no AB, presumably because T2 was not masked (Giesbrecht
& Di Lollo, 1998). When T2 is not masked, some representation
of T2 is assumed to persist and remain available for later
consolidation despite a period of waiting while the short-term
consolidation of T1 takes place. However, if the consolidation of
T2 is delayed while the consolidation of T1 takes place, one
would expect to see a delayed, but otherwise normal (i.e., normal
amplitude) P300 response to T2. The delay of the P300 response
should only occur at short T1-T2 lags, when contention for the
consolidation bottleneck would be more likely to occur. At
longer lags, the consolidation of T1 would already be complete
by the time T2 was presented, and no delay should be observed.
This is essentially what was observed by Vogel and Luck. The
present findings suggest an important generalization of this
specific proposal to experimental designs in which T1 task and
modality are changed to be congruent with what is generally
implemented in PRP designs, that is, a speeded response to an
auditory stimulus. The absence of the P300 component at short
T1-T2 lags in the present Experiment 1 and Experiment 2 is
conversely explained by the fact that T2 was masked, such that
T2 was no longer available for consolidation because trailing
stimuli presented during the period of postponement degraded or
replaced the representation of T2. The similarity of the results
across Experiments 1 and 2 suggest that the consolidation of T2
can be delayed at short T1-T2 lags either by the ongoing
consolidation of T1 (Experiment 1) or by response selection for
T1 (Experiment 2).
Arnell, Helion, Hurdelbrink, and Pasieka (in press) used a
paradigm in which a masked visual T1 associated with delayed
report was followed by an auditory T2 requiring a speeded two-
alternative forced choice response, much in the same way as
Jolicoeur and Dell’Acqua (1998) did in several published
experiments (see also Dell’Acqua & Jolicoeur, 2000; Jolicoeur
& Dell’Acqua, 1999). As expected based on these previous
demonstrations, Arnell et al. observed a progressive response
time (RT) lengthening to T2 as the T1-T2 SOA was decreased.
Interestingly, Arnell et al. also focused on the P300 component
time-locked to T2 onset, and found an SOA-dependent P300
onset latency delay of an extent equivalent to the RT delay. On
the assumption that consolidation and response selection are
both operations requiring central resources, and on the assump-
tion that either operation is postponed under overlapping task
conditions in mixed PRP/AB designs, this pattern of results
converges with the results obtained in the present study.
Specifically, given that central mechanisms were likely to be first
allocated to T1 consolidation in the design used by Arnell et al.,
central mechanisms were unavailable to carry out response
selection for T2 under short T1-T2 SOA conditions. Central
processing for the task on T2 was therefore temporarily
postponed, and this was reflected in postponement of the onset
of the P300 component time-locked to T2 onset. Furthermore, as
expected based on the present proposal, the overall extent of the
SOA-dependent interference on T2 processing (142ms; i.e., RT
to T2 at the longest SOA minus RT to T2 at the shortest SOA)
was equivalent to the overall delay in P300 onset observed from
the longest SOA to the shortest SOA (122ms).
It is still unclear what a P300 component reflects in the context
of speeded tasks carried out on unmasked stimuli. Some evidence
suggests that P300 cannot be mapped onto processing occurring
at a response selection stage. Specifically, using a classical PRP
design and a subtraction method similar to the method used in
the present context, Luck (1998) focused on the latency of the
P300 time-locked to T2 onset. Luck found that the P300 latency
was only modestly delayed as SOA was shortened, despite a
substantial PRP effect on T2 RT. This suggests that the
functional locus of the RT delay in PRP designs (likely, response
selection; see Pashler, 1994) is after the stage of processing whose
activity is reflected in the P300 component. This would obviously
be in conflict with our proposal of a central processing limitation
as a common (and possibly unique) cause for the entire family of
AB deficits, PRP deficits, and mixed PRP/AB deficits. Although
we believe that more work is required to exactly disentangle this
apparent conflict, we are prone to notice some details in Luck’s
work that might help avoid perfunctory conclusions based on
this study. In our view, it may be critical to note that, although
the delay in P300 onset amounted to only 25% of the RT delay
manifest in the PRP effect, Luck’s analyses of the electrophy-
siological results revealed a statistically significant and substan-
tial reduction of the P300 amplitude at the shortest SOA
compared to the P300 of normal amplitude found at the longest
SOA, suggesting a possible trade-off of these two electrophysio-
logical quantifications of the P300wave.Whether instead both of
these aspects (onset delay and partial suppression of the P300
component) are to be taken into account when extrapolating the
logical implications of Luck’s elegant study is presently a matter
of investigation in our labs.
638 R. Dell’Acqua et al.

REFERENCES
Arnell, K. M., Helion, A. M., Hurdelbrink, J. A., & Pasieka, B. (inpress). Dissociating sources of dual-task interference using humanelectrophysiology. Psychonomic Bulletin & Review.
Arnell, K. M., & Jolicoeur, P. (1999). The attentional blink acrossstimulus modalities: Evidence for central processing limitations.Journal of Experimental Psychology: Human Perception and Perfor-mance, 25, 630–648.
Brehaut, J. C., Enns, J. T., & Di Lollo, V. (1999). Visual masking playstwo roles in the attentional blink. Perception & Psychophysics, 61,1436–1448.
Chun, M. M., & Potter, M. C. (1995). A two-stage model for multipletarget detection in rapid serial visual presentation. Journal ofExperimental Psychology: Human Perception and Performance, 21,109–127.
Crebolder, J. M., Jolicoeur, P., &McIlwaine, J. D. (2002). Loci of signalprobability effects and of the attentional blink bottleneck. Journal ofExperimental Psychology: Human Perception and Performance, 28,695–716.
Dell’Acqua, R., & Jolicoeur, P. (2000). Visual encoding of patterns issubject to dual-task interference. Memory & Cognition, 28, 183–191.
Dell’Acqua, R., Turatto, M., & Jolicoeur, P. (2001). Cross-modaldeficits in processing tactile stimulation. Perception & Psychophysics,63, 777–789.
Donchin, E. (1981). Surprise!y Surprise? Psychophysiology, 18,493–513.
Donchin, E., & Coles, M. G. H. (1988). Is the P300 component amanifestation of context updating? Behavioral and Brain Sciences, 11,357–374.
Duncan, J. (1980). The locus of interference in the perception ofsimultaneous stimuli. Psychological Review, 87, 272–300.
Giesbrecht, B. L., & Di Lollo, V. (1998). Beyond the attentional blink:Visual masking by item substitution. Journal of ExperimentalPsychology: Human Perception and Performance, 24, 1454–1466.
Isaak, M. I., Shapiro, K. L., & Martin, J. (1999). The attentional blinkreflects retrieval competition among multiple rapid serial visualpresentation items: Tests of an interference model. Journal ofExperimental Psychology: Human Perception and Performance, 25,1774–1792.
Jasper, H. H. (1958). The ten-twenty electrode system in the Interna-tional Federation. Electroencephalography and Clinical Neurophysiol-ogy, 10, 371–375.
Jiang, Y., & Chun, M. (2001). The influence of temporal selection onspatial selection and distractor interference: An attentional blinkstudy. Journal of Experimental Psychology: Human Perception andPerformance, 27, 664–679.
Johnson, R. (1986). A triarchic model of P300 amplitude. Psychophy-siology, 23, 367–383.
Jolicoeur, P. (1998). Modulation of the attentional blink by on-lineresponse selection: Evidence from speeded and unspeeded Task1decisions. Memory & Cognition, 26, 1014–1032.
Jolicoeur, P. (1999). Dual-task interference and visual encoding. Journalof Experimental Psychology: Human Perception and Performance, 25,596–616.
Jolicoeur, P., & Dell’Acqua, R. (1998). The demonstration of short-termconsolidation. Cognitive Psychology, 36, 138–202.
Jolicoeur, P., & Dell’Acqua, R. (1999). Attentional and structuralconstraints on visual encoding. Psychological Research, 62, 154–164.
Jolicoeur, P., & Dell’Acqua, R. (2000). Selective influence of secondtarget exposure duration and task1 load effects in the attentional blinkphenomenon. Psychonomic Bulletin & Review, 7, 472–479.
Jolicoeur, P., Dell’Acqua, R., & Crebolder, J. (2000). Multitaskingperformance deficits: Forging links between the attentional blink andthe psychological refractory period. In S. Monsell & J. Driver (Eds.),Attention & performance XVIII (pp. 309–330). Cambridge, MA: TheMIT Press.
Jolicoeur, P., Dell’Acqua, R., & Crebolder, J. (2001). The attentionalblink bottleneck. In K. L. Shapiro (Ed.), The limits of attention (pp.82–99). New York: Oxford University Press.
Luck, S. J. (1998). Sources of dual-task interference: Evidence fromhuman electrophysiology. Psychological Science, 9, 223–227.
Luck, S. J., & Hillyard, S. A. (1995). The role of attention in featuredetection and conjunction discrimination: An electrophysiologicalanalysis. International Journal of Neuroscience, 80, 281–297.
Luck, S. J., & Vogel, E. K. (2001). Multiple sources of interference indual-task performance: The case of the attentional blink and thepsychological refractory period. In K. L. Shapiro (Ed.), The limits ofattention (pp. 124–140). New York: Oxford University Press.
Luck, S., Vogel, E. K., & Shapiro, K. L. (1996). Word meanings can beaccessed but not reported during the attentional blink. Nature, 383,616–618.
Maki, W. S., Couture, T., Frigen, K., & Lien, D. (1997). Sources of theattentional blink during rapid serial visual presentation: Perceptualinterference and retrieval competition. Journal of ExperimentalPsychology: Human Perception and Performance, 23, 1393–1411.
Maki, W. S., Frigen, K., & Paulson, K. (1997). Associative priming bytargets and distractors during rapid serial visual presentation: Doesword meanings survive the attentional blink? Journal of ExperimentalPsychology: Human Perception and Performance, 23, 1014–1034.
Pashler, H. (1994). Dual-task interference in simple tasks: Data andtheory. Psychological Bulletin, 116, 220–244.
Pashler, H., & Johnston, J. C. (1989). Chronometric evidence for centralpostponement in temporally overlapping tasks. Quarterly Journal ofExperimental Psychology, 41A, 19–45.
Potter, M. C., Chun, M. M., Banks, B. S., & Muckenhoupt, M. (1998).Two attentional deficits in serial target search: The attentional blinkand an amodal task-switch deficit. Journal of Experimental Psychol-ogy: Learning, Memory, and Cognition, 24, 979–992.
Potter, M. C., Staub, A., & O’Connor, D. H. (2002). The time course ofcompetition for attention: Attention is initially labile. Journal ofExperimental Psychology: Human Perception and Performance, 28,1149–1162.
Raymond, J. E., Shapiro, K. L., & Arnell, K. M. (1992). Temporarysuppression of visual processing in an RSVP task: An attentionalblink. Journal of Experimental Psychology: Human Perception andPerformance, 18, 839–860.
Raymond, J. E., Shapiro, K. L., & Arnell, K. M. (1995). Similaritydetermines the attentional blink. Journal of Experimental Psychology:Human Perception and Performance, 21, 653–662.
Ruthruff, E., & Pashler, H. E. (2001). Perceptual and central interferencein dual-task performance. In K. L. Shapiro (Ed.), The limits ofattention (pp. 100–123). New York: Oxford University Press.
Shapiro, K. L., Raymond, J. E., & Arnell, K. M. (1994). Attention tovisual pattern information produces the attentional blink in rapidserial visual presentation. Journal of Experimental Psychology:Human Perception and Performance, 20, 357–371.
Verleger, R. (1988). Event-related potentials and cognition: A critique ofthe context updating hypothesis and an alternative interpretation ofthe P3. Behavioral and Brain Sciences, 11, 343–427.
Visser, T. A. W., Bischof, W. F., & Di Lollo, V. (1999). Attentionalswitching in spatial and nonspatial domains: Evidence from theattentional blink. Psychological Bulletin, 125, 458–469.
Vogel, E. K., & Luck, S. J. (in press). Delayed working memoryconsolidation during the attentional blink. Psychonomic Bulletin &Review.
Vogel, E. K., Luck, S. J., & Shapiro, K. L. (1998). Electrophysiologicalevidence for a postperceptual locus of suppression during theattentional blink. Journal of Experimental Psychology: HumanPerception and Performance, 24, 1656–1674.
Ward, R., Duncan, J., & Shapiro, K. L. (1996). The slow time-course ofvisual attention. Cognitive Psychology, 30, 79–109.
Wong, K. F. E. (2002). The relationship between attentional blink andpsychological refractory period. Journal of Experimental Psychology:Human Perception and Performance, 28, 54–71.
(Received August 1, 2002; Accepted January 20, 2003)
Attentional blink and electrophysiology 639
Copyright © 2022 FDOKUMEN