Electrophysiological indexes of illusory contours perception in humans
In the previous paper the locations and basic response properties ofN200 and other face-specific event-related potentials (ERPs) weredescribed. In this paper responsiveness of N200 and related ERPs tothe perceptual features of faces and other images was assessed.N200 amplitude did not vary substantially, whether evoked bycolored or grayscale faces; normal, blurred or line-drawing faces; orby faces of different sizes. Human hands evoked small N200s atface-specific sites, but evoked hand-specific ERPs at other sites. Catand dog faces evoked N200s that were 73% as large as to humanfaces. Hemifield stimulation demonstrated that the right hemisphereis better at processing information about upright faces andtransferring it to the left hemisphere, whereas the left hemisphere isbetter at processing information about inverted faces and trans-ferring it to the right hemisphere. N200 amplitude was largest to fullfaces and decreased progressively to eyes, face contours, lips andnoses viewed in isolation. A region just lateral to face-specific N200sites was more responsive to internal face parts than to faces, andsome sites in ventral occipitotemporal cortex were face-part-specific. Faces with eyes averted or closed evoked larger N200sthan those evoked by faces with eyes forward. N200 amplitude andlatency were affected by the joint effects of eye and head position inthe right but not in the left hemisphere. Full and three-quarter viewsof faces evoked larger N200s than did profile views. The results arediscussed in relation to behavioral studies in humans and single-cellrecordings in monkeys.
IntroductionIn the previous paper we described the locations and some
response properties of several types of face-specific event-
related potentials (ERPs) (Allison et al.,1999). This activity
occurs in three different regions of occipitotemporal cortex,
ranges in latency over several hundred milliseconds, and
probably ref lects different portions of the neural operations
involved in perceiving and identifying faces.
In this paper we focus on N200 and N700 ERPs recorded from
ventral and lateral face-specific sites in order to further describe
the response properties of this neuronal activity. These experi-
ments were based on behavioral studies in humans and on
recordings from face-specific cells in monkey STS/IT cortex, and
sought to determine whether this activity is: (i) sensitive to face
color or size; (ii) affected by removing the high-frequency or low-
frequency portions of the face image; (iii) responsive to animal
faces; (iv) affected by face inversion; (v) responsive to internal
and external face parts; (vi) sensitive to changes in head and eye
position; (vii) responsive to human hands. Rather than reviewing
their rationale here, the Results section will provide for each
experiment a brief review of prior work and the predictions to
be tested. Preliminary results of some of these experiments have
been reported (Allison et al., 1994b, 1996a,b).
Materials and MethodsPatients and recording methods were as described previously (Allison et
al., 1999). Standard image size (8.4° × 8.4° of visual angle) and luminance
(29 ± 4 cd/m2) were as described previously except in the following
experiments. (i) Normal and blurred faces had a luminance of 41 ± 7
cd/m2, and line-drawing faces had a luminance of 15 ± 2 cd/m2; these
images were 11.1° wide × 13.5° high. (ii) Small, medium, and large faces
and gratings were of standard luminance and subtended 2.7° × 2.7°, 8.4°
× 8.4° and 15.2° × 15.2° of visual angle respectively (the images were 2.8
× 2.8, 8.8 × 8.8 and 16 × 16 cm respectively). (iii) Upright and inverted
faces were of standard size and luminance. Faces presented in the
hemifields were offset by 6.1° from the central fixation point, thus
the inside edge of the images was offset 1.9° from the fixation point.
Stimulus duration was 150 ms in order to preclude eye movements
toward the hemifield stimuli (Leehey et al., 1978). All targets were
presented centrally to minimize the occurrence of eye movements,
which patients were instructed to avoid. In addition, one of the experi-
menters sat by the patient’s bedside and watched for eye movements away
from the fixation point. (iv) In experiments using faces, face parts, and
varying head and eye position the luminance of the images was 51 ± 5
cd/m2, and they were 11.1° wide × 13.5° high.
The individual experiments were initiated at different times during
the 6 year duration of this study, hence the number of face-specific ERP
sites encountered in each experiment differed. Face-specific electrode
sites were first identified using the screening tasks described in the
preceding paper (Allison et al., 1999) and ERPs at these sites were then
measured in the experiments described here. While this strategy
maintained independence between the definition of face-specific sites
and their measurement, it could result in ignoring sites specific for other
stimulus categories. A second analysis was therefore constructed to
search for sites that were specific for categories other than full faces. In
these exploratory analyses, presumptive category-specific ERPs had to be
at least 50 µV in amplitude and twice the amplitude evoked by other
stimulus categories.
Results
Colored and Grayscale Faces
Single-cell, imaging and lesion studies in monkeys suggest that
STS/IT cortex plays an important role in color discrimination
[reviewed by Komatsu (Komatsu, 1998)]. The ventral face area
probably receives input from the color-sensitive human homolog
of area V4, which appears on the basis of anatomical (Clarke and
Miklossy, 1990), ERP (Allison et al., 1993) and imaging (Lueck et
al., 1989; Sakai et al., 1995; Kleinschmidt et al., 1996) studies to
be located in the posterior portion of the fusiform gyrus and
adjacent collateral sulcus and inferior lingual gyrus. A region that
may be anterior to human V4, area V8 (Hadjikhani et al., 1998),
is also color sensitive. Although humans can recognize faces well
in the absence of color (e.g. in grayscale photographs), face color
provides useful information when categorizing the sex or ethni-
city of faces (Hill et al., 1995). For these reasons we predicted
that ventral face-specific N200 amplitude would be larger to
Cerebral Cortex July/Aug 1999;9:431–444; 1047–3211/99/$4.00
Electrophysiological Studies of HumanFace Perception. II: Response Propertiesof Face-specific Potentials Generated inOccipitotemporal Cortex
Gregory McCarthy1, Aina Puce2, Aysenil Belger and
Truett Allison
Neuropsychology Laboratory, VA Medical Center, West Haven,
CT 06516 and Departments of Neurosurgery, Neurology and
Psychiatry, Yale University School of Medicine, New Haven,
CT 06510 USA1Current address: Brain Imaging and Analysis Center, Box
3808, Duke University Medical Center, Durham, NC 27710, USA2Current address: Brain Sciences Institute, Swinburne
University of Technology, PO Box 218, Hawthorn, Victoria
3122, Australia
© Oxford University Press 1999

faces photographed in normal color than to equiluminant
grayscale versions of the same faces.
There were 21 ventral face-specific N200 sites, 12 in the right
and 9 in the left hemisphere. P150 latency, and N200 and P290
amplitude and latency, were not significantly different in colored
versus grayscale faces. P150 amplitude was significantly larger
[F(df 1,20) = 6.56, P < 0.02] to colored than to grayscale faces.
N700 AUC was marginally (P < 0.05) larger to grayscale than to
colored faces. At three lateral face-specific N200 sites P150,
N200 and P290 amplitude and latency were not different to
colored and grayscale faces. These results demonstrate that
ventral and lateral face-specific N200s were not preferentially
sensitive to colored faces.
Blurred and Line-drawing Faces
Humans can recognize faces when the high-frequency portion of
the image is removed (blurred faces) or when low-frequency
information is removed (‘line-drawing’ faces). Fiorentini et al.
(Fiorentini et al., 1983) found that spatial frequencies above or
below 8 cycles/face width (c/fw) provide sufficient information
to recognize individual faces. In monkeys Rolls (Rolls, 1985)
found that face-selective cells responded well to blurred or
line-drawing versions of the same faces. We asked whether
face-specific N200s and related ERPs were sensitive to these
manipulations. Line-drawing faces were created by applying an
edge (Sobel) filter to the original faces. Blurred faces were
created by applying a smoothing (average) filter using a kernel of
9 × 9 pixels. In both instances, the mean intensity of the resultant
image was set equal to the original. The blurred and line-drawing
faces approximately correspond respectively to the low-pass
(<12 c/fw) and high-pass (>12 c/fw) filtered faces of Fiorentini et
al. (Fiorentini et al., 1983).
There were 18 ventral face-specific N200 sites, 6 in the right
and 12 in the left hemisphere. Representative recordings are
shown in Figure 1A,B. Results for the right and left hemisphere
were similar and are combined in Figure 1C–E. The overall
ANOVA for N200 amplitude was significant [F(df 2,26) = 5.96,
P < 0.007]. N200 amplitude to blurred or line-drawing faces was
not significantly different than to normal faces, but N200
amplitude to blurred faces was marginally larger than to line-
drawing faces (P < 0.05). The overall ANOVA for N200 latency
was significant [F(df 2,26) = 155, P < 0.0001]. N200 latency
increased progressively and significantly in the order normal,
blurred and line-drawing faces (P < 0.001 in each case). The
overall ANOVA for N700 AUC was significant (P < 0.02). N700 to
line-drawing faces was significantly smaller than to normal and
blurred faces (P < 0.05 in each case), which did not differ
significantly between themselves. Similar results (not shown)
were obtained at three lateral face-specific N200 sites. These
results demonstrate that removing the high- or low-frequency
components of faces had only moderate effects on N200
amplitude, but line-drawing faces evoked ventral and lateral
N200s that were markedly later (34 ms on average) than those
evoked by normal faces.
Face Size
Face-specific cells in monkey STS/IT cortex respond well to faces
viewed over a range of sizes (Desimone et al., 1984; Rolls and
Baylis, 1986; Perrett et al., 1992), suggesting that these cells
generalize across face size. To determine the responsiveness of
face-specific N200 and related ERPs to face size, patients viewed
small, medium and large faces that varied in area by a factor of
32. Non-face stimuli were radial gratings of the same sizes.
There were nine ventral face-specific N200 sites, three in
the right and six in the left hemisphere. Representative record-
ings are shown in Figure 2A,B. Results for the right and left
hemisphere were similar and are combined in Figure 2C–E. A
two-way ANOVA for N200 amplitude (stimulus type × stimulus
size) showed a significant main effect of stimulus type [F(df 1,7)
= 8.06, P < 0.03]; faces evoked significantly larger N200s than
Figure 1. ERPs at ventral face-specific N200 sites to normal, blurred and line-drawingfaces. (A,B) Examples of recordings. (C–E) Summaries of amplitude, latency and N700AUC. Plotting conventions as described in Allison et al. [(Allison et al., 1999) Fig. 2].
432 Human Face Perception II • McCarthy et al.
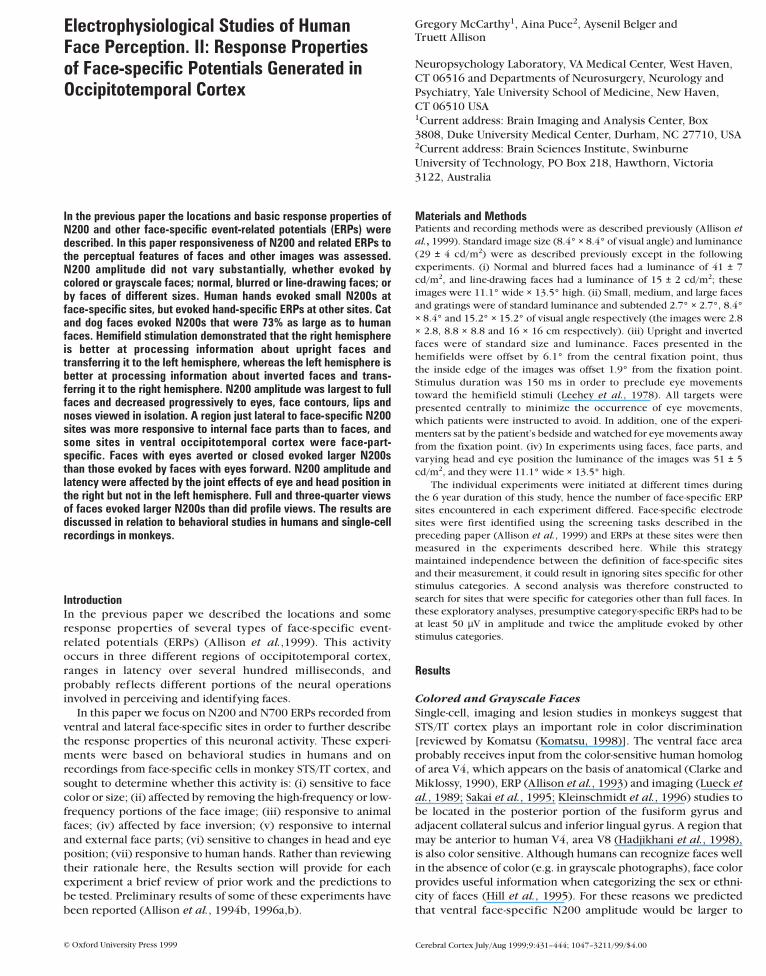
gratings (P < 0.02 in each case). The main effect of size was not
significant, but the stimulus type × stimulus size interaction was
significant (P < 0.04); N200 amplitude showed a marginally
significant effect of face size due to the fact that large faces
evoked a significantly larger N200 than did small faces (P < 0.03).
N200 amplitude to large or small faces was not significantly
different than to medium faces. A two-way ANOVA for N700
AUC showed a significant main effect of stimulus size [F(df 2,14)
= 6.52, P < 0.01] and a significant stimulus type × stimulus size
interaction (P < 0.03). N700 AUC was significantly larger to large
faces than to medium and small faces (P < 0.04 in each case),
which did not differ significantly from the N700 evoked by
gratings. These results indicate that N200 amplitude was
relatively invariant to face size, and that even small faces that
were not easily discernible evoked N200s that were significantly
larger than those evoked by gratings.
Cat and Dog Faces
Cat and dog faces are commonly viewed faces that have the same
component parts as human faces, but with differences in the
shape and arrangement of the parts. If face-specific N200 is
tuned to the configuration of a prototypical human face,
deviations from this arrangement should lead to a reduction of
N200 amplitude. On the other hand, it is possible that N200 is
responsive to the semantic category faces regardless of their
Figure 2. ERPs at ventral face-specific N200 sites to large, medium and small facesand radial gratings. (A,B) Examples of recordings. (C–E) Summaries of amplitude,latency and N700 AUC.
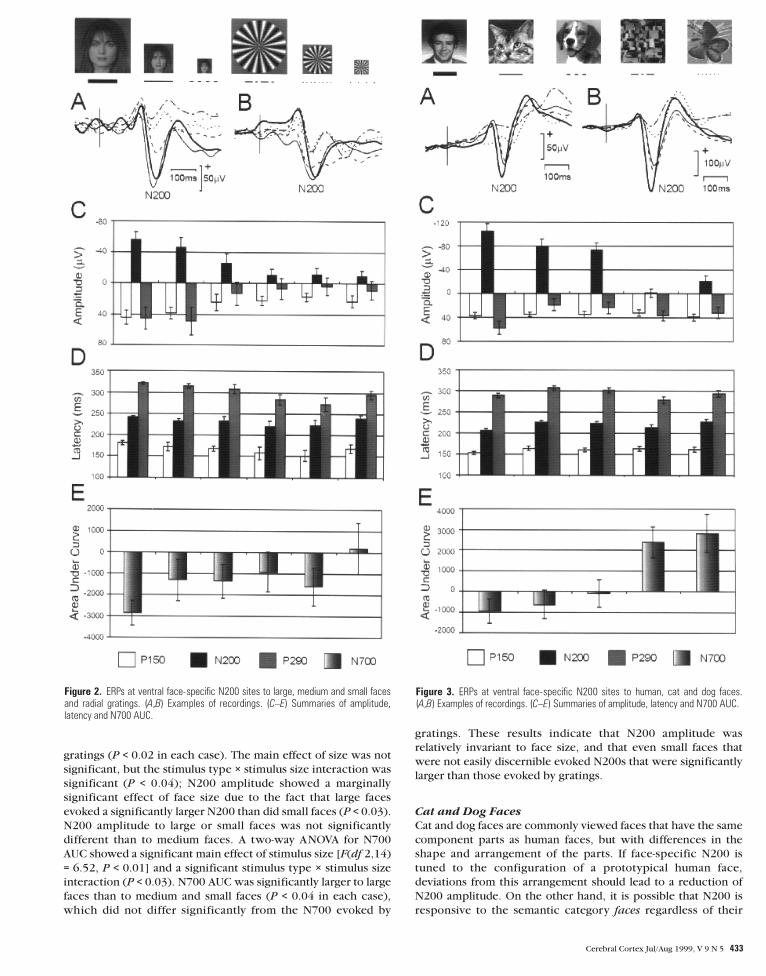
Figure 3. ERPs at ventral face-specific N200 sites to human, cat and dog faces.(A,B) Examples of recordings. (C–E) Summaries of amplitude, latency and N700 AUC.
Cerebral Cortex Jul/Aug 1999, V 9 N 5 433

configuration, in which case animal and human faces should
evoke N200s of similar amplitude and latency. Patients viewed
equiluminant human, cat and dog faces, scrambled human faces
and (target) butterf lies.
There were 28 face-specific sites, 15 in the right and 13 in the
left hemisphere. Representative recordings are shown in Figure
3A,B. Results for the right and left hemisphere were similar and
are combined in Figure 3C–E. The overall ANOVA for N200
amplitude was significant [F(df 4,108) = 42.5, P < 0.0001]. N200
amplitude to human faces was significantly larger than to cat or
dog faces (P < 0.003 in each case), which did not differ signi-
ficantly between themselves. N200 amplitude to cat or dog faces
was significantly larger than to scrambled faces or targets (P <
0.0001 in each case). The overall ANOVA for N200 latency was
significant (P < 0.001). N200 latency was significantly earlier to
human faces than to cat or dog faces (P < 0.0002 in each case),
which did not differ significantly between themselves. The
overall ANOVA for N700 AUC was significant (P < 0.0001). N700
AUC did not differ significantly between human, cat or dog
faces, but all face categories evoked significantly larger N700
AUCs than did scrambled faces or targets (P < 0.0001 in each
case). There were four lateral face-specific N200 sites. N200
amplitude to cat and dog faces combined was 75% as large and
14 ms later than to human faces, results similar to those obtained
at ventral sites. These results demonstrate that at ventral and
lateral face-specific N200 sites, cat and dog faces evoked smaller
and later N200s than did human faces.
Upright and Inverted Faces
It is well known that faces are more difficult to recognize when
viewed upside down. The mechanisms responsible for the face
inversion effect have been reviewed (Valentine, 1988; Rhodes et
al., 1993; Farah et al., 1995). Discussion is usually framed in
terms of ‘holistic’ as opposed to ‘parts-based’ or ‘feature’ modes
of processing. Holistic processing refers to configurational
processing in which the individual parts of the object are not
separately processed (Bruce and Humphreys, 1994; Farah et al.,
1995). Because faces are such a homogeneous category of
object, holistic processing is thought to be especially important
for upright faces [reviewed by Rhodes (Rhodes, 1993) and
Moscovitch et al. (Moscovitch et al., 1997)]. By contrast, parts-
based processing supposes that a complex object is broken
down into its constituent parts. Evidence suggests that the right
hemisphere is specialized for holistic processing, whereas
the left hemisphere is specialized for parts-based processing
(Bradshaw and Sherlock, 1981; Corballis, 1991; Rhodes, 1993).
We therefore predicted that face inversion would have different
effects on N200 and related ERPs recorded from the right and left
hemisphere, and that the right hemisphere would be more sensi-
tive to face inversion than the left hemisphere. Patients viewed
upright and inverted faces presented centrally and in the left and
right hemifields. There were 24 face-specific N200 sites, 13 in
the right and 11 in the left hemisphere. The results of this
experiment are best appreciated as plots of N200 amplitude and
latency. Results for P150, P290 and N700 were not additionally
informative and will not be described.
To central stimulation, right and left hemisphere N200
amplitude (Fig. 4A) was slightly but not significantly larger to
upright than to inverted faces. In both hemispheres N200
latency (Fig. 4B) was significantly later (by 11 ms on average) to
inverted than to upright faces (P < 0.02 in each case). While
inverted faces evoked N200s that were later than those evoked
by upright faces, the differences were approximately equal in
both hemispheres and hence did not support the hypothesis that
the right hemisphere is more sensitive to face inversion than is
the left hemisphere.
Hemifield stimulation provides a more sensitive measure of
processing performed in each hemisphere. Stimulation of the
contralateral hemifield provides a measure of the amount (N200
amplitude) and rapidity (N200 latency) of processing of direct
geniculocortical input. N200 amplitude was significantly larger
(P < 0.01) to upright than to inverted faces in the right but not in
the left hemisphere (Fig. 4C); the face-orientation × hemisphere
interaction was significant [F(df 1,22) = 16.9, P < 0.0005]. N200
latency in the right hemisphere was shorter to upright than to
inverted faces, whereas in the left hemisphere the opposite
pattern was seen (Fig. 4D); the face-orientation × hemisphere
interaction was significant [F(df 1,22) = 22.9, P < 0.0001].
In primates the responsiveness of visual cortex to stimulation
of the ipsilateral hemifield is due entirely to interhemispheric
transfer via the corpus callosum and anterior commissure (Zeki,
1973; Gross et al., 1977). Thus stimulation of the ipsilateral
hemifield provides a measure of the amount and rapidity of
interhemispheric transfer of information from the directly
Figure 4. N200 amplitude (A,C,E) and latency (B,D,F) at ventral face-specific sites toupright and inverted faces presented in the central visual field (A,B), the contralateralvisual field (C,D) and the ipsilateral visual field (E,F).
434 Human Face Perception II • McCarthy et al.

activated hemisphere. N200 amplitude in the right hemisphere
appeared to be larger to inverted than to upright faces, whereas
in the left hemisphere the opposite pattern was seen (Fig. 4E);
however, the face-orientation × hemisphere interaction only
approached significance (P < 0.08). N200 latency in the right
hemisphere was longer to upright than to inverted faces,
whereas in the left hemisphere there was no difference (Fig. 4F);
however, the face-orientation × hemisphere interaction was not
significant. This pattern of interaction was different than that
obtained to stimulation of the contralateral hemifield (cf. Fig.
4D and F).
In the right hemisphere, upright faces presented in the
contralateral hemifield evoked a larger N200 than did inverted
faces, whereas inverted faces presented in the ipsilateral
hemifield evoked a larger N200 than did upright faces; the face-
orientation × hemifield interaction was marginally significant
(P < 0.06). This pattern was not seen in the left hemisphere.
The hemifield latency changes were small relative to between-
patient differences. To eliminate this source of variance we
analyzed the subset of data of patients who had face-specific
N200 sites in both the right and left hemisphere (Fig. 5). N200
latency effects were similar to those shown in Figure 4D,F but
reveal more clearly the effects of face inversion on hemispheric
responsiveness. To stimulation of the contralateral hemifield,
N200 latency in the right hemisphere was shorter to upright
than to inverted faces, whereas in the left hemisphere the
opposite effect was seen; the face-orientation × hemisphere
interaction was significant [F(df 1,9) = 18.2, P < 0.002]. To stimu-
lation of the ipsilateral hemifield the opposite pattern was seen.
N200 latency in the right hemisphere was shorter to inverted
than to upright faces, whereas in the left hemisphere it was
shorter to upright than to inverted faces; the face-orientation ×
hemisphere interaction was significant (P < 0.001).
The difference in N200 latency to ipsilateral compared to
contralateral stimulation yields a measure of interhemispheric
transfer time (ITT). The longest ITT was 24.0 ms, ref lecting the
difference in the right hemisphere between N200 latency to
upright faces presented contralaterally (195 ms) and ipsilaterally
(219 ms); this difference was significant (P < 0.0001). The next
longest ITT was 17.5 ms, ref lecting the difference in the left
hemisphere between N200 latency to inverted faces presented
contralaterally (198.5 ms) and ipsilaterally (216 ms); this differ-
ence was significant (P < 0.01). The shortest ITT was 7.7 ms,
ref lecting the difference in the right hemisphere between N200
latency to inverted faces presented contralaterally (202.5 ms)
and ipsilaterally (210.2 ms); this difference was significant
(P < 0.01).
The results of hemifield stimulation can be summarized
by saying that the right hemisphere responded more rapidly
to upright faces and transferred such information rapidly to
the left hemisphere, whereas the left hemisphere responded
more rapidly to inverted faces and transferred such information
rapidly to the right hemisphere. In addition, the right hemi-
sphere responded with greater N200 amplitude to contralateral
upright than inverted faces, an effect not apparent in the left
hemisphere.
In both hemispheres, and to upright and inverted faces, N200
was significantly larger to faces presented centrally than to faces
presented in either hemifield (P < 0.03 in each case) and was
significantly larger to faces presented in the contralateral than in
the ipsilateral hemifield (P < 0.04 in each case).
Face Parts
There are three reasons why it would be useful to know how
face-specific and other sites respond to the component parts of a
face. First, some theories of object recognition (Marr and
Nishihara, 1978; Hoffman and Richards 1985; Biederman, 1987)
assume that the visual system breaks down complex objects into
simpler component parts. These primitive parts — ‘geons’ in the
model of Biederman, for example — then provide the inputs for
later stages of object processing. If face components are thought
of as being analogous to primitive parts, they should activate the
face perception system prior to activation by the full face.
Second, some face cells in monkey STS/IT cortex respond well to
face parts (Perrett et al., 1982; Leonard et al., 1985), and in the
models of Perrett et al. (Perrett et al., 1987) and Tovée and
Cohen-Tovée (Tovée and Cohen-Tovée, 1993) face-parts process-
ing provides the input to later stages of face processing. Third,
recordings from the posterior temporal scalp showed that eyes
viewed in isolation evoked an N170 that was larger than that
evoked by a full face (Bentin et al., 1996; Taylor et al., 1997;
Puce et al., 1999), raising the possibility that N200 may respond
preferentially to eyes or other face parts. ERPs were recorded in
experiments that included faces; eyes, lips and noses viewed in
isolation; and (target) butterf lies or f lowers.
There were 45 ventral face-specific N200 sites, 26 in the right
and 19 in the left hemisphere. Representative recordings are
shown in Figure 6A,B. Results for the right and left hemisphere
were similar and are combined in Figure 6C–E. The overall
ANOVA for N200 amplitude was significant [F(df 4,140) = 33.4,
P < 0.0001]. N200 amplitude was significantly larger to faces
than to face parts or targets (P < 0.004 in each case). N200
amplitude decreased progressively and significantly in the order
eyes, lips, noses and targets (P < 0.008 in each case). Thus all face
parts evoked an N200 that was significantly smaller than to faces
but significantly larger than to non-face targets. The overall
ANOVA for N200 latency was significant [F(df 4,140) = 39.3, P <
0.0001]. N200 latency was significantly earlier to faces than to
face parts (P < 0.0001 in each case). N200 latency increased
progressively and significantly in the order faces, eyes, lips and
noses (P < 0.006 in each case). The overall ANOVA for N700
AUC was significant [F(df 4,140) = 10.3, P < 0.0001]. N700 was
significantly larger to faces than to any other stimulus category
(P < 0.01 in each case) and was significantly larger to eyes than
to noses or targets (P < 0.02 in each case). There were six lateral
face-specific N200 sites. The responsiveness of N200 and related
Figure 5. N200 at ventral face-specific N200 sites to upright and inverted facespresented in the contralateral and ipsilateral visual fields. (A,B) Summaries of amplitudeand latency.
Cerebral Cortex Jul/Aug 1999, V 9 N 5 435

ERPs (not shown) at these sites was similar to that seen at ventral
face-specific N200 sites.
In another version of this experiment patients viewed faces
and internal face parts and also viewed face contours (i.e. faces
with the internal face parts removed). Contours consist of two
parts, the hair and the shape of the face, both of which are useful
in identifying faces (Shepherd et al., 1981). There were 16
ventral face-specific N200 sites, 9 in the right and 7 in the left
hemisphere. Results for the right and left hemisphere were
similar and were combined for statistical analysis. The overall
ANOVA for N200 amplitude was significant [F(df 6,90) = 16.0,
P < 0.0001]. N200 amplitudes and latencies to faces and internal
face parts were similar to those described above. N200 ampli-
tude to contours was significantly smaller than to faces and eyes
(P < 0.04 in each case), was not significantly different than to
lips, and was significantly larger than to noses and targets (P <
0.04 in each case). The overall ANOVA for N200 latency was
significant [F(df 6,90) = 26.5, P < 0.0001]. N200 latency to
contours was significantly later than to faces (P < 0.0001), was
not significantly different than to eyes, and was significantly
earlier than to lips and noses (P < 0.0001 in each case). The
overall ANOVA for N700 AUC was significant [F(df 6,90) = 3.24,
P < 0.006]. N700 was significantly larger to faces than to noses
(P < 0.004) but not to the other face parts.
At sites lateral to ventral face-specific N200 sites, internal face
Figure 6. ERPs at ventral face-specific N200 sites to faces, eyes, lips and noses. (A,B)Examples of recordings. (C–E) Summaries of amplitude, latency and N700 AUC.
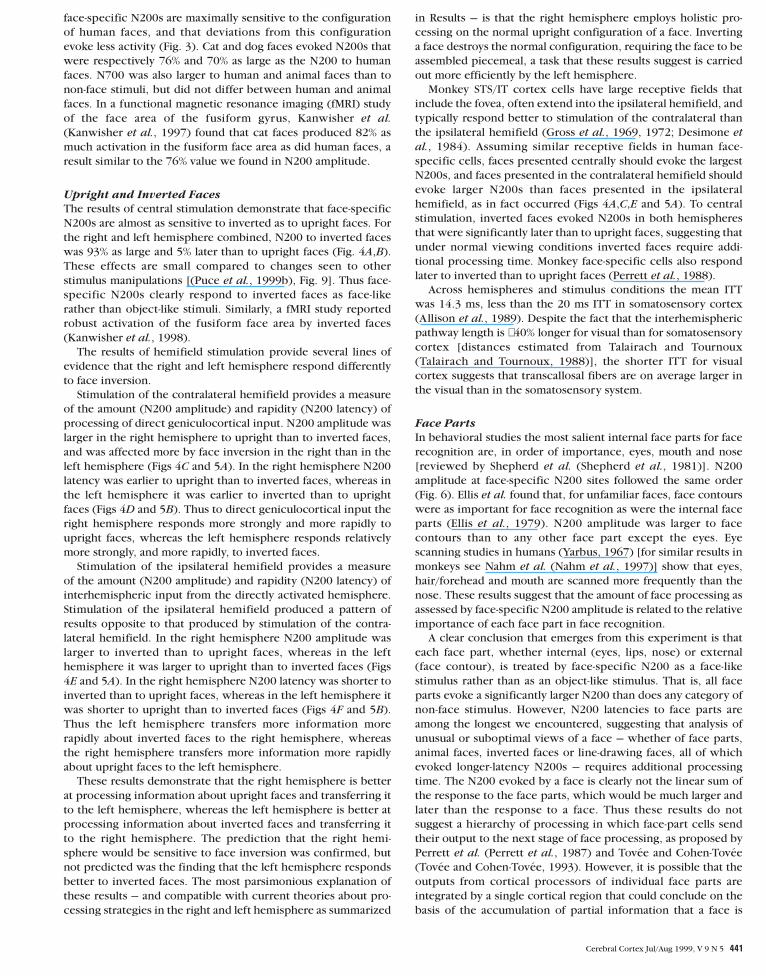
Figure 7. ERPs to faces and internal face parts at sites 1 cm lateral to ventralface-specific N200 sites. Recording from a ventral face-specific N200 site (A) and asite 1 cm lateral to it (B). (C–E) Summaries of amplitude, latency and N700 AUC.
436 Human Face Perception II • McCarthy et al.
parts evoked a relatively larger N200 than was evoked by faces.
We analyzed the responsiveness of 57 sites, 31 in the right and 26
in the left hemisphere, 1 cm lateral to face-specific N200 sites. A
recording is shown for a face-specific site in Figure 7A and for a
site 1 cm lateral to it in Figure 7B. Results for the right and left
hemisphere were similar and are combined for the ventrolateral
sites in Figure 7C–E. N200 amplitude at the ventrolateral sites
was significantly larger to all internal face parts than to faces and
non-face targets (P < 0.05 in each case). This pattern of results is
the opposite of that at face-specific N200 sites (cf. Figs 6C and
7C), as verified by a two-way ANOVA in which N200 amplitude
to faces was compared to the average N200 amplitude to all face
parts combined. The stimulus type × location interaction was
significant [F(df 1,31) = 52.1, P < 0.0001], i.e. N200 amplitude
was larger to face parts than to faces at the ventrolateral sites,
whereas it was larger to faces than to face parts at face-specific
N200 sites. At ventrolateral sites, like ventral sites, N200 latency
was significantly later to all face parts than to faces (P < 0.01 in
each case). There was no N700 at the ventrolateral sites (Fig. 7E).
The centroids of the ventrolateral sites are listed in Table 1.
Analysis of 29 sites 1 cm medial to face-specific N200 sites
revealed that mean amplitudes were small (<30 µV) and that
N200 amplitude to faces and combined face parts was not
significantly different. That is, responsiveness at medial sites was
minimal and non-specific. These results can be summarized by
saying that N200 amplitude to internal face parts decreased
rapidly medial to face-specific N200 sites but decreased less
rapidly lateral to such sites.
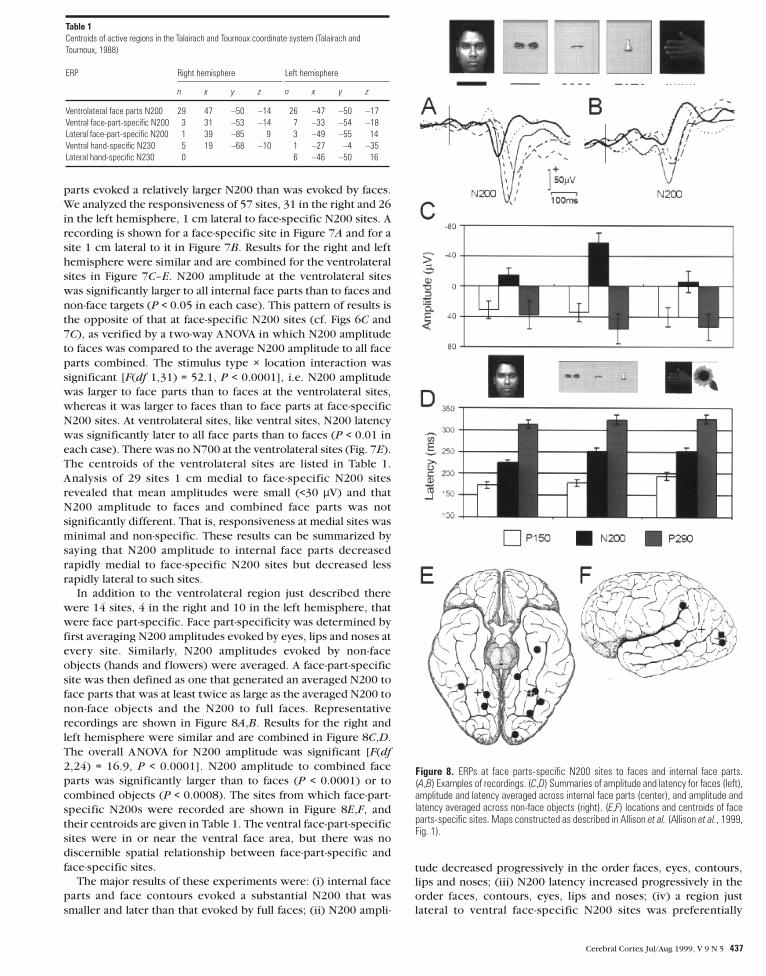
In addition to the ventrolateral region just described there
were 14 sites, 4 in the right and 10 in the left hemisphere, that
were face part-specific. Face part-specificity was determined by
first averaging N200 amplitudes evoked by eyes, lips and noses at
every site. Similarly, N200 amplitudes evoked by non-face
objects (hands and f lowers) were averaged. A face-part-specific
site was then defined as one that generated an averaged N200 to
face parts that was at least twice as large as the averaged N200 to
non-face objects and the N200 to full faces. Representative
recordings are shown in Figure 8A,B. Results for the right and
left hemisphere were similar and are combined in Figure 8C,D.
The overall ANOVA for N200 amplitude was significant [F(df
2,24) = 16.9, P < 0.0001]. N200 amplitude to combined face
parts was significantly larger than to faces (P < 0.0001) or to
combined objects (P < 0.0008). The sites from which face-part-
specific N200s were recorded are shown in Figure 8E,F, and
their centroids are given in Table 1. The ventral face-part-specific
sites were in or near the ventral face area, but there was no
discernible spatial relationship between face-part-specific and
face-specific sites.
The major results of these experiments were: (i) internal face
parts and face contours evoked a substantial N200 that was
smaller and later than that evoked by full faces; (ii) N200 ampli-
tude decreased progressively in the order faces, eyes, contours,
lips and noses; (iii) N200 latency increased progressively in the
order faces, contours, eyes, lips and noses; (iv) a region just
lateral to ventral face-specific N200 sites was preferentially
Figure 8. ERPs at face parts-specific N200 sites to faces and internal face parts.(A,B) Examples of recordings. (C,D) Summaries of amplitude and latency for faces (left),amplitude and latency averaged across internal face parts (center), and amplitude andlatency averaged across non-face objects (right). (E,F) locations and centroids of faceparts-specific sites. Maps constructed as described in Allison et al. (Allison et al., 1999,Fig. 1).
Table 1Centroids of active regions in the Talairach and Tournoux coordinate system (Talairach andTournoux, 1988)
ERP Right hemisphere Left hemisphere
n x y z n x y z
Ventrolateral face parts N200 29 47 –50 –14 26 –47 –50 –17Ventral face-part-specific N200 3 31 –53 –14 7 –33 –54 –18Lateral face-part-specific N200 1 39 –85 9 3 –49 –55 14Ventral hand-specific N230 5 19 –68 –10 1 –27 –4 –35Lateral hand-specific N230 0 6 –46 –50 16
Cerebral Cortex Jul/Aug 1999, V 9 N 5 437

responsive to internal face parts; (v) face-part-specific N200s
were found at ventral and lateral sites.
Direction of Gaze and Head View
This set of experiments assessed the responsiveness of face-
specific N200 and related ERPs to manipulations of head and/or
eye position that have been shown in previous studies to affect
human face recognition or the responsiveness of monkey
face-specific cells. Patients viewed photographs, acquired for
seven head and eye conditions, of 60 individuals of both sexes.
Individuals were instructed to maintain the same neutral
expression for each photograph. Targets were black and white
checkerboards. There were 17 ventral face-specific N200 sites, 8
in the right and 9 in the left hemisphere. Because the stimuli
varied along several dimensions it will be useful to make three
sets of comparisons.
Direction of Gaze
In scalp recordings N170 was marginally larger when the eyes
were averted than when the eyes looked directly at the viewer,
suggesting that this activity was involved in the perception of
cues related to social attention (Allison et al., 1996a). Here we
Figure 9. ERPs at ventral face-specific N200 sites to faces with eyes directed to theviewer, averted to the left, averted upward and closed. (A,B) Examples of recordings.(C–E) Summaries of amplitude, latency and N700 AUC.
Figure 10. ERPs at ventral face-specific N200 sites to full-face, three-quarter andprofile views. (A,B) Examples of recordings. (C–E) Summaries of amplitude, latency andN700 AUC.
438 Human Face Perception II • McCarthy et al.

used the same set of stimuli during intracranial recordings.
Patients viewed faces in which the eyes were looking at the
viewer or were averted to the left, averted upward or closed.
Representative recordings are shown in Figure 9A,B. Results for
the right and left hemisphere were similar and are combined in
Figure 9C–E. Overall ANOVAs for N200 amplitude and latency
were not significant. All conditions in which the eyes were not
looking at the viewer (either because they were averted or
closed) evoked N200s that were larger than the N200 evoked
when the eyes were directed to the viewer (Fig. 9C). Although
this effect was consistent across conditions and hemispheres,
N200 amplitude was not significantly larger (P < 0.08) for the
averted conditions combined compared to the eyes directed at
the viewer. The overall ANOVA for N700 AUC was not sig-
nificant.
Head and Eye Position
Results of the combined effects of head and eye position are
summarized in Table 2. In the right hemisphere there was a
significant main effect of head position; N200 was larger (P <
0.05) and earlier (P < 0.002) when the head faced the viewer
regardless of eye position. There was also a significant main
effect of eye position; N200 was earlier (P < 0.02) when the eyes
looked at the viewer than when they were averted regardless of
head position. Head and eye aversion evoked the smallest N200,
whereas N200 was largest when the head was directed to the
viewer but the eyes were averted; this difference was significant
(P < 0.02 ). By contrast, in the left hemisphere changes in head
and eye position had no significant effects on N200 amplitude
and latency. Thus N200 was sensitive to head and eye position
only in the right hemisphere.
Head Views
Consider three views of a face and head: the head and eyes
directly face the viewer, are at a 45° angle to the viewer, or are
at a 90° angle to the viewer. These will be referred to as ‘full-
face’, ‘three-quarter’ and ‘profile’ views respectively. Some
behavioral studies found that the three-quarter view results in
better recognition of unfamiliar faces than the full-face or profile
views (Bruce et al., 1987; Logie et al., 1987), while others did
not (Harries et al., 1991; Troje and Bülthoff, 1996). We asked
whether face-specific N200 and related ERPs were sensitive to
head view.
Representative recordings are shown in Figure 10A,B. Results
for the right and left hemisphere were similar and are combined
in Figure 10C–E. The overall ANOVA for N200 amplitude was
significant [F(df 3,39) = 23.1, P < 0.0001]. N200 amplitude was
not significantly different for the full-face and three-quarter
views, but both were significantly larger than for the profile view
(P < 0.01 in each case). N200 amplitude to any head view
was significantly larger than to checkerboards (P < 0.001 in
each case). Checkerboards contained many high-contrast edges
but evoked minimal N200s at face-specific sites (Fig. 10A–C),
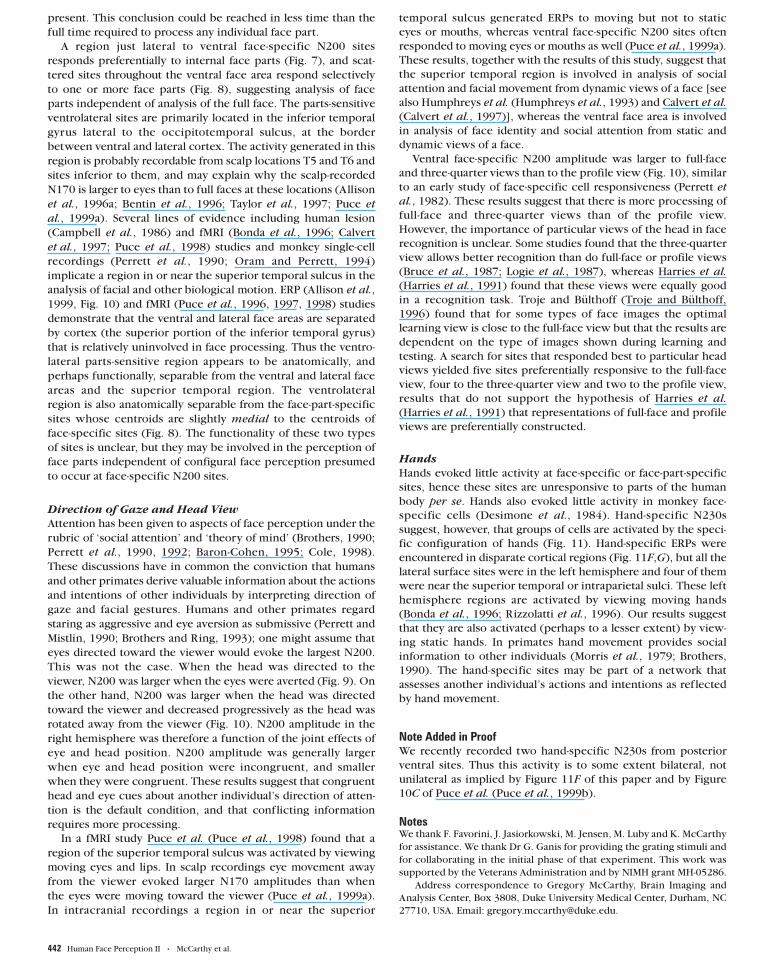
Figure 11. ERPs at hand-specific N230 sites. (A,B) Examples of recordings. (C–E)Summaries of amplitude, latency and N700 AUC. (F,G) Locations and centroids ofhand-specific sites.
Table 2N200 amplitude and latency (± SEM) at face-specific sites as a function of head and eye position
Eyes Right hemisphere Left hemisphere
Forward 126 ± 25 111 ± 19 94 ± 18 93 ± 14(202 ± 7) (213 ± 6) (207 ± 8) (206 ± 7)
Averted 138 ± 25 102 ± 19 97 ± 18 96 ± 15(206 ± 6) (214 ± 6) (206 ± 8) (207 ± 7)
Amplitudes are in µV, latencies (in parentheses) in ms.
Cerebral Cortex Jul/Aug 1999, V 9 N 5 439

whereas such stimuli strongly activated striate and peristriate
cortex (Allison et al., 1999, Figs 2 and 3). The overall ANOVA for
N200 latency was significant [F(df 2,32) = 17.4, P < 0.0001].
N200 latency increased progressively and significantly in the
order full-face, three-quarter and profile views (P < 0.02 in each
case). The overall ANOVA for N700 AUC was not significant.
There were four lateral face-specific N200 sites. The respon-
siveness of lateral N200s (not shown) was similar to that of
ventral N200s. Thus at ventral and lateral sites profile views
evoked the smallest and latest N200s.
Harries et al. (Harries et al., 1991) found that subjects, while
learning to recognize model three-dimensional heads, did not
distribute their time evenly between head views but tended to
focus on full-face and profile views. They suggested that the
three-quarter view is most efficiently recognized because it
activates the representations of both the full-face and profile
views. Ullman (Ullman, 1996) has made a similar argument on
theoretical grounds. If this inference is correct we would predict
that the largest N200s would be evoked by the three-quarter
view; at face-specific N200 sites this prediction was not con-
firmed (Fig. 10C). Alternatively it might be predicted that more
sites would respond best to full-face or profile views than to
three-quarter views. We searched for locations that were view
specific; none were found. We also searched for sites that
responded at least 50% better to any view than to the average of
the other two views; five such sites were found for the full-face
view, four for the three-quarter view and two for the profile
view.
Hands
The first hint that the primate temporal lobe contains cells
responsive to complex objects was a cell that responded best to
a monkey hand (Gross et al., 1969; [see also Desimone
(Desimone, 1991) and Gross (Gross, 1994)]. We included hands
as stimuli to determine whether hand-specific ERPs could be
recorded. In addition, it is possible that sites that appeared to
respond selectively to faces or face parts were in fact responsive
to any commonly viewed human body part. Patients viewed
photographs of the upper side of hands in experiments that also
included faces and objects (cars or f lowers).
There were 25 ventral face-specific N200 sites, 16 in the right
and 9 in the left hemisphere. Results for the right and left
hemisphere were similar and were combined for statistical
analysis. The overall ANOVA for N200 amplitude was significant
[F(df 2,46) = 41.0, P < 0.0001]. N200 amplitude to faces was
significantly larger than to hands or objects (P < 0.0001 in each
case), which did not differ significantly between themselves.
N200 amplitude to hands was 26% as large as to faces. The
overall ANOVA for N700 AUC was significant [F(df 2,48) = 15.8,
P < 0.0001]. N700 was significantly larger to faces than to hands
or objects (P < 0.0001 in each case), which did not differ signi-
ficantly between themselves. Similar results were seen at four
lateral face-specific N200 sites. Hands were also used as stimuli
at six face-part-specific sites. The overall ANOVA was significant
[F(df 3,15) = 7.18, P < 0.003]. N200 amplitude to combined face
parts was significantly larger than to hands (P < 0.05). N200
amplitude to hands, faces and objects did not differ significantly.
Hand-specific ERPs were recorded from 12 sites, 5 in the right
and 7 in the left hemisphere. Examples are shown in Figure
11A,B. Hand-specific waveforms consisted of P165, N230 and
P310 ERPs. Results for the right and left hemisphere were similar
and are combined in Figure 11C–E. The overall ANOVA for N230
amplitude was significant [F(df 2,11) = 6.30, P < 0.007]. N230
amplitude to hands was significantly larger than to faces or
objects (P < 0.03 in each case), which did not differ significantly
between themselves. The overall ANOVA for N700 AUC was
significant [F(df 2,22) = 4.53, P < 0.02]. N700 was significantly
larger to hands than to faces or objects (P < 0.03 in each case),
which did not differ significantly between themselves. Hand-
specific ERPs were recorded from disparate regions of cortex
(Fig. 11F,G); none of these sites were face-specific or face-part-
specific. Thus hands evoked little activity at face-specific or
face-part-specific N200 sites, but evoked hand-specific N230s
and related ERPs at other sites.
Discussion
Colored and Grayscale Faces
The prediction that colored faces would evoke a larger N200
than grayscale faces was not confirmed, suggesting that the
neural operations ref lected by face-specific N200s are sensitive
to the configuration of a face rather than to incidental features
such as skin color. This result is consistent with the recordings of
Perrett et al. (Perrett et al., 1984) and Mikami et al. (Mikami et
al., 1994), who reported no difference in the response of face-
specific cells to colored compared to grayscale faces. Desimone
et al. (Desimone et al., 1984) and Rolls and Baylis (Rolls and
Baylis, 1986), however, reported that some face-specific cells
responded better to colored than to grayscale monkey faces.
P150 was significantly larger to colored faces at ventral face-
specific N200 sites, suggesting that this early activity (which is
rarely face specific) provides information about color to the
ventral face area.
Blurred and Line-drawing Faces
Our results are similar to those reported for monkey face-specific
cells, which respond well to normal and blurred faces but less
well to line-drawing faces (Perrett et al., 1984). These results
agree with human behavioral results; blurred faces similar to
those we used only slightly impair face recognition, whereas
line-drawing faces similar to those we used produce a larger
impairment (Fiorentini et al., 1983). In that study the error rate
for face recognition was about three times as large for the
line-drawing (>12 c/fw) compared to blurred (<12 c/fw) faces.
N700 was significantly smaller to line-drawing than to normal or
blurred faces, suggesting that this activity is involved in (or
affected by) face recognition processes. There was a 16%
increase in N200 latency to line-drawing compared to normal
faces (Fig. 1D), among the largest we encountered [(Puce et al.,
1999b), Fig. 9], suggesting that line-drawing faces require con-
siderably more processing time.
Face Size
Small and large faces evoked N200s that were not significantly
different than the N200 evoked by medium faces (Fig. 2). Thus
N200 amplitude is relatively invariant across a wide range of face
sizes, as is also the case for monkey face-specific cells (Desimone
et al., 1984; Rolls and Baylis, 1986; Perrett et al., 1992). Large
faces, like blurred faces, evoked N200s that were larger than
those evoked by normal faces. These images are shifted toward
the low-frequency portion of the spectrum, suggesting that
N200 amplitude is preferentially sensitive to the low end of the
face frequency spectrum.
Cat and Dog Faces
The results of this experiment support the conclusion that
440 Human Face Perception II • McCarthy et al.
face-specific N200s are maximally sensitive to the configuration
of human faces, and that deviations from this configuration
evoke less activity (Fig. 3). Cat and dog faces evoked N200s that
were respectively 76% and 70% as large as the N200 to human
faces. N700 was also larger to human and animal faces than to
non-face stimuli, but did not differ between human and animal
faces. In a functional magnetic resonance imaging (fMRI) study
of the face area of the fusiform gyrus, Kanwisher et al.
(Kanwisher et al., 1997) found that cat faces produced 82% as
much activation in the fusiform face area as did human faces, a
result similar to the 76% value we found in N200 amplitude.
Upright and Inverted Faces
The results of central stimulation demonstrate that face-specific
N200s are almost as sensitive to inverted as to upright faces. For
the right and left hemisphere combined, N200 to inverted faces
was 93% as large and 5% later than to upright faces (Fig. 4A,B).
These effects are small compared to changes seen to other
stimulus manipulations [(Puce et al., 1999b), Fig. 9]. Thus face-
specific N200s clearly respond to inverted faces as face-like
rather than object-like stimuli. Similarly, a fMRI study reported
robust activation of the fusiform face area by inverted faces
(Kanwisher et al., 1998).
The results of hemifield stimulation provide several lines of
evidence that the right and left hemisphere respond differently
to face inversion.
Stimulation of the contralateral hemifield provides a measure
of the amount (N200 amplitude) and rapidity (N200 latency) of
processing of direct geniculocortical input. N200 amplitude was
larger in the right hemisphere to upright than to inverted faces,
and was affected more by face inversion in the right than in the
left hemisphere (Figs 4C and 5A). In the right hemisphere N200
latency was earlier to upright than to inverted faces, whereas in
the left hemisphere it was earlier to inverted than to upright
faces (Figs 4D and 5B). Thus to direct geniculocortical input the
right hemisphere responds more strongly and more rapidly to
upright faces, whereas the left hemisphere responds relatively
more strongly, and more rapidly, to inverted faces.
Stimulation of the ipsilateral hemifield provides a measure
of the amount (N200 amplitude) and rapidity (N200 latency) of
interhemispheric input from the directly activated hemisphere.
Stimulation of the ipsilateral hemifield produced a pattern of
results opposite to that produced by stimulation of the contra-
lateral hemifield. In the right hemisphere N200 amplitude was
larger to inverted than to upright faces, whereas in the left
hemisphere it was larger to upright than to inverted faces (Figs
4E and 5A). In the right hemisphere N200 latency was shorter to
inverted than to upright faces, whereas in the left hemisphere it
was shorter to upright than to inverted faces (Figs 4F and 5B).
Thus the left hemisphere transfers more information more
rapidly about inverted faces to the right hemisphere, whereas
the right hemisphere transfers more information more rapidly
about upright faces to the left hemisphere.
These results demonstrate that the right hemisphere is better
at processing information about upright faces and transferring it
to the left hemisphere, whereas the left hemisphere is better at
processing information about inverted faces and transferring it
to the right hemisphere. The prediction that the right hemi-
sphere would be sensitive to face inversion was confirmed, but
not predicted was the finding that the left hemisphere responds
better to inverted faces. The most parsimonious explanation of
these results — and compatible with current theories about pro-
cessing strategies in the right and left hemisphere as summarized
in Results — is that the right hemisphere employs holistic pro-
cessing on the normal upright configuration of a face. Inverting
a face destroys the normal configuration, requiring the face to be
assembled piecemeal, a task that these results suggest is carried
out more efficiently by the left hemisphere.
Monkey STS/IT cortex cells have large receptive fields that
include the fovea, often extend into the ipsilateral hemifield, and
typically respond better to stimulation of the contralateral than
the ipsilateral hemifield (Gross et al., 1969, 1972; Desimone et
al., 1984). Assuming similar receptive fields in human face-
specific cells, faces presented centrally should evoke the largest
N200s, and faces presented in the contralateral hemifield should
evoke larger N200s than faces presented in the ipsilateral
hemifield, as in fact occurred (Figs 4A,C,E and 5A). To central
stimulation, inverted faces evoked N200s in both hemispheres
that were significantly later than to upright faces, suggesting that
under normal viewing conditions inverted faces require addi-
tional processing time. Monkey face-specific cells also respond
later to inverted than to upright faces (Perrett et al., 1988).
Across hemispheres and stimulus conditions the mean ITT
was 14.3 ms, less than the 20 ms ITT in somatosensory cortex
(Allison et al., 1989). Despite the fact that the interhemispheric
pathway length is ∼40% longer for visual than for somatosensory
cortex [distances estimated from Talairach and Tournoux
(Talairach and Tournoux, 1988)], the shorter ITT for visual
cortex suggests that transcallosal fibers are on average larger in
the visual than in the somatosensory system.
Face Parts
In behavioral studies the most salient internal face parts for face
recognition are, in order of importance, eyes, mouth and nose
[reviewed by Shepherd et al. (Shepherd et al., 1981)]. N200
amplitude at face-specific N200 sites followed the same order
(Fig. 6). Ellis et al. found that, for unfamiliar faces, face contours
were as important for face recognition as were the internal face
parts (Ellis et al., 1979). N200 amplitude was larger to face
contours than to any other face part except the eyes. Eye
scanning studies in humans (Yarbus, 1967) [for similar results in
monkeys see Nahm et al. (Nahm et al., 1997)] show that eyes,
hair/forehead and mouth are scanned more frequently than the
nose. These results suggest that the amount of face processing as
assessed by face-specific N200 amplitude is related to the relative
importance of each face part in face recognition.
A clear conclusion that emerges from this experiment is that
each face part, whether internal (eyes, lips, nose) or external
(face contour), is treated by face-specific N200 as a face-like
stimulus rather than as an object-like stimulus. That is, all face
parts evoke a significantly larger N200 than does any category of
non-face stimulus. However, N200 latencies to face parts are
among the longest we encountered, suggesting that analysis of
unusual or suboptimal views of a face — whether of face parts,
animal faces, inverted faces or line-drawing faces, all of which
evoked longer-latency N200s — requires additional processing
time. The N200 evoked by a face is clearly not the linear sum of
the response to the face parts, which would be much larger and
later than the response to a face. Thus these results do not
suggest a hierarchy of processing in which face-part cells send
their output to the next stage of face processing, as proposed by
Perrett et al. (Perrett et al., 1987) and Tovée and Cohen-Tovée
(Tovée and Cohen-Tovée, 1993). However, it is possible that the
outputs from cortical processors of individual face parts are
integrated by a single cortical region that could conclude on the
basis of the accumulation of partial information that a face is
Cerebral Cortex Jul/Aug 1999, V 9 N 5 441
present. This conclusion could be reached in less time than the
full time required to process any individual face part.
A region just lateral to ventral face-specific N200 sites
responds preferentially to internal face parts (Fig. 7), and scat-
tered sites throughout the ventral face area respond selectively
to one or more face parts (Fig. 8), suggesting analysis of face
parts independent of analysis of the full face. The parts-sensitive
ventrolateral sites are primarily located in the inferior temporal
gyrus lateral to the occipitotemporal sulcus, at the border
between ventral and lateral cortex. The activity generated in this
region is probably recordable from scalp locations T5 and T6 and
sites inferior to them, and may explain why the scalp-recorded
N170 is larger to eyes than to full faces at these locations (Allison
et al., 1996a; Bentin et al., 1996; Taylor et al., 1997; Puce et
al., 1999a). Several lines of evidence including human lesion
(Campbell et al., 1986) and fMRI (Bonda et al., 1996; Calvert
et al., 1997; Puce et al., 1998) studies and monkey single-cell
recordings (Perrett et al., 1990; Oram and Perrett, 1994)
implicate a region in or near the superior temporal sulcus in the
analysis of facial and other biological motion. ERP (Allison et al.,
1999, Fig. 10) and fMRI (Puce et al., 1996, 1997, 1998) studies
demonstrate that the ventral and lateral face areas are separated
by cortex (the superior portion of the inferior temporal gyrus)
that is relatively uninvolved in face processing. Thus the ventro-
lateral parts-sensitive region appears to be anatomically, and
perhaps functionally, separable from the ventral and lateral face
areas and the superior temporal region. The ventrolateral
region is also anatomically separable from the face-part-specific
sites whose centroids are slightly medial to the centroids of
face-specific sites (Fig. 8). The functionality of these two types
of sites is unclear, but they may be involved in the perception of
face parts independent of configural face perception presumed
to occur at face-specific N200 sites.
Direction of Gaze and Head View
Attention has been given to aspects of face perception under the
rubric of ‘social attention’ and ‘theory of mind’ (Brothers, 1990;
Perrett et al., 1990, 1992; Baron-Cohen, 1995; Cole, 1998).
These discussions have in common the conviction that humans
and other primates derive valuable information about the actions
and intentions of other individuals by interpreting direction of
gaze and facial gestures. Humans and other primates regard
staring as aggressive and eye aversion as submissive (Perrett and
Mistlin, 1990; Brothers and Ring, 1993); one might assume that
eyes directed toward the viewer would evoke the largest N200.
This was not the case. When the head was directed to the
viewer, N200 was larger when the eyes were averted (Fig. 9). On
the other hand, N200 was larger when the head was directed
toward the viewer and decreased progressively as the head was
rotated away from the viewer (Fig. 10). N200 amplitude in the
right hemisphere was therefore a function of the joint effects of
eye and head position. N200 amplitude was generally larger
when eye and head position were incongruent, and smaller
when they were congruent. These results suggest that congruent
head and eye cues about another individual’s direction of atten-
tion is the default condition, and that conf licting information
requires more processing.
In a fMRI study Puce et al. (Puce et al., 1998) found that a
region of the superior temporal sulcus was activated by viewing
moving eyes and lips. In scalp recordings eye movement away
from the viewer evoked larger N170 amplitudes than when
the eyes were moving toward the viewer (Puce et al., 1999a).
In intracranial recordings a region in or near the superior
temporal sulcus generated ERPs to moving but not to static
eyes or mouths, whereas ventral face-specific N200 sites often
responded to moving eyes or mouths as well (Puce et al., 1999a).
These results, together with the results of this study, suggest that
the superior temporal region is involved in analysis of social
attention and facial movement from dynamic views of a face [see
also Humphreys et al. (Humphreys et al., 1993) and Calvert et al.
(Calvert et al., 1997)], whereas the ventral face area is involved
in analysis of face identity and social attention from static and
dynamic views of a face.
Ventral face-specific N200 amplitude was larger to full-face
and three-quarter views than to the profile view (Fig. 10), similar
to an early study of face-specific cell responsiveness (Perrett et
al., 1982). These results suggest that there is more processing of
full-face and three-quarter views than of the profile view.
However, the importance of particular views of the head in face
recognition is unclear. Some studies found that the three-quarter
view allows better recognition than do full-face or profile views
(Bruce et al., 1987; Logie et al., 1987), whereas Harries et al.
(Harries et al., 1991) found that these views were equally good
in a recognition task. Troje and Bülthoff (Troje and Bülthoff,
1996) found that for some types of face images the optimal
learning view is close to the full-face view but that the results are
dependent on the type of images shown during learning and
testing. A search for sites that responded best to particular head
views yielded five sites preferentially responsive to the full-face
view, four to the three-quarter view and two to the profile view,
results that do not support the hypothesis of Harries et al.
(Harries et al., 1991) that representations of full-face and profile
views are preferentially constructed.
Hands
Hands evoked little activity at face-specific or face-part-specific
sites, hence these sites are unresponsive to parts of the human
body per se. Hands also evoked little activity in monkey face-
specific cells (Desimone et al., 1984). Hand-specific N230s
suggest, however, that groups of cells are activated by the speci-
fic configuration of hands (Fig. 11). Hand-specific ERPs were
encountered in disparate cortical regions (Fig. 11F,G), but all the
lateral surface sites were in the left hemisphere and four of them
were near the superior temporal or intraparietal sulci. These left
hemisphere regions are activated by viewing moving hands
(Bonda et al., 1996; Rizzolatti et al., 1996). Our results suggest
that they are also activated (perhaps to a lesser extent) by view-
ing static hands. In primates hand movement provides social
information to other individuals (Morris et al., 1979; Brothers,
1990). The hand-specific sites may be part of a network that
assesses another individual’s actions and intentions as ref lected
by hand movement.
Note Added in ProofWe recently recorded two hand-specific N230s from posterior
ventral sites. Thus this activity is to some extent bilateral, not
unilateral as implied by Figure 11F of this paper and by Figure
10C of Puce et al. (Puce et al., 1999b).
NotesWe thank F. Favorini, J. Jasiorkowski, M. Jensen, M. Luby and K. McCarthy
for assistance. We thank Dr G. Ganis for providing the grating stimuli and
for collaborating in the initial phase of that experiment. This work was
supported by the Veterans Administration and by NIMH grant MH-05286.
Address correspondence to Gregory McCarthy, Brain Imaging and
Analysis Center, Box 3808, Duke University Medical Center, Durham, NC
27710, USA. Email: [email protected].
442 Human Face Perception II • McCarthy et al.

ReferencesAllison T, McCarthy G, Wood CC, Williamson PD, Spencer DD (1989)
Human cortical potentials evoked by stimulation of the median
nerve. II. Cytoarchitectonic areas generating long-latency activity. J
Neurophysiol 62:711–722.
Allison T, Begleiter A, McCarthy G, Roessler E, Nobre AC, Spencer DD
(1993) Electrophysiological studies of color processing in human
visual cortex. Electroenceph Clin Neurophysiol 88:343–355.
Allison T, McCarthy G, Belger, A, Puce A, Luby M, Spencer DD, Bentin S
(1994b) What is a face? Electrophysiological responsiveness of human
extrastriate visual cortex to human faces. Soc Neurosci Abstr 20:316.
Allison T, Lieberman D, McCarthy G (1996a) Here’s not looking at you
kid: an electrophysiological study of a region of human extrastriate
cortex sensitive to head and eye aversion. Soc Neurosci Abstr 22:400.
Allison T, Puce A, Nobre A, Spencer D, McCarthy G (1996b) Electro-
physiological evidence for anatomical segregation of regions of
extrastriate visual cortex responsive to faces, letterstrings, and colors.
NeuroImage 3:S263.
Allison T, Puce A, Spencer DD, McCarthy G (1999) Electrophysio-
logical studies of human face perception. I: Potentials generated in
occipitotemporal cortex by face and non-face stimuli. Cereb Cortex
9:415–430.
Baron-Cohen S (1995) Mindblindness: an essay on autism and theory of
mind. Cambridge, MA: MIT Press.
Bentin S, Allison T, Puce A, Perez E, McCarthy G (1996) Electrophysio-
logical studies of face perception in humans. J Cogn Neurosci
8:551–565.
Biederman I (1987) Recognition-by-components: a theory of human
image understanding. Psychol Rev 94:115–147.
Bonda E, Petrides M, Ostry D, Evans A (1996) Specific involvement of
human parietal systems and the amygdala in the perception of
biological motion. J Neurosci 16:3737–3744.
Bradshaw JL, Sherlock D (1981) Bugs and faces in the two visual fields:
the analytic/holistic processing dichotomy and task sequencing.
Cortex 18:210–225.
Brothers L (1990) The social brain: a project for integrating primate
behavior and neurophysiology in a new domain. Concepts Neurosci
1:27–51.
Brothers L, Ring B (1993) Mesial temporal neurons in the macaque
monkey with responses selective for aspects of social stimuli. Behav
Brain Res 57:53–61.
Bruce V, Valentine T, Baddeley A (1987) The basis of the 3/4 view
advantage in face recognition. Appl Cogn Psychol 1:109–120.
Bruce V, Humphreys GW (eds) (1994) Object and face recognition.
Hillsdale, NJ: Lawrence Erlbaum.
Calvert GA, Bullmore ET, Brammer MJ, Campbell R, Williams SCR,
McGuire PK, Woodruff PWR, Iversen SD, David AS (1997) Activation
of auditory cortex during silent lipreading. Science 276:593–596.
Campbell R, Landis T, Regard M (1986) Face recognition and lip-reading:
a neurological dissociation. Brain 109:509–521.
Clarke S, Miklossy J (1990) Occipital cortex in man: organization of callo-
sal connections, related myelo- and cytoarchitecture, and putative
boundaries of functional visual areas. J Comp Neurol 298:188–214.
Cole J (1998) About face. Cambridge, MA: MIT Press.
Corballis MC (1991) The lopsided ape: evolution of the generative mind.
New York: Oxford University Press.
Desimone R (1991) Face-selective cells in the temporal cortex of
monkeys. J Cogn Neurosci 3:1–8.
Ellis HD, Shepherd JW, Davies GM (1979) Identification of familiar and
unfamiliar faces from internal and external features: some impli-
cations for theories of face recognition. Perception 8:431–439.
Farah MJ, Tanaka JW, Drain HM (1995) What causes the face inversion
effect? J Exp Psychol Hum Percept Perform 21:628–634.
Fiorentini A, Maffei L, Sandini G (1983) Role of high spatial frequencies in
face perception. Perception 12:195–201.
Gross CG (1994) How inferior temporal cortex became a visual area.
Cereb Cortex 5:455–469.
Gross CG, Bender DB, Rocha-Miranda CE (1969) Visual receptive fields
of neurons in inferotemporal cortex of the monkey. Science
166:1303–1306.
Gross CG, Rocha-Miranda CE, Bender DB (1972) Visual properties of
neurons in inferior temporal cortex of the macaque. J Neurophysiol
35:96–111.
Gross CG, Bender DB, Mishkin M (1977) Contributions of the corpus
callosum and the anterior commissure to visual activation of inferior
temporal neurons. Brain Res 131:227–239.
Hadjikhani N, Liu AK, Dale AM, Cavanagh P, Tootell RBH (1998)
Retinotopy and color sensitivity in human visual cortical area V8.
Nature Neurosci 1:235–241.
Harries MH, Perrett DI, Lavender A (1991) Preferential inspection of
views of 3-D model heads. Perception 20:669–680.
Hill H, Bruce V, Akamatsu S (1995) Perceiving the sex and race of faces:
the role of shape and colour. Proc R Soc Lond B 261:367–373.
Hoffman DD, Richards WA (1985) Parts of recognition. In: Visual
cognition (Pinker S, ed.), pp. 65–96. Cambridge, MA: MIT Press.
Humphreys GW, Donnelly N, Riddoch MJ (1993) Expression is computed
separately from facial identity, and it is computed separately for
moving and static faces: neuropsychological evidence. Neuropsycho-
logia 31:173–181.
Kanwisher N, Weinrib O, Tong F, Nakayama K (1997) Response of the
fusiform face area to facelike stimuli. Soc Neurosci Abstr 23:2229.
Kanwisher N, O’Craven KM (1998) Extrastriate activity during visual
imagery is ‘stimulus’ specific. Soc Neurosci Abstr 24:530.
Kleinschmidt A, Lee BB, Requardt M, Frahm J (1996) Functional mapping
of color processing by magnetic resonance imaging of responses to
selective P- and M-pathway stimulation. Exp Brain Res 110:279–288.
Komatsu H (1998) Mechanisms of central color vision. Curr Opin
Neurobiol 8:503–508.
Leehey S, Carey S, Diamond R, Cahn A (1978) Upright and inverted faces:
the right hemisphere knows the difference. Cortex 14:411–419.
Leonard CM, Rolls ET, Wilson FAW, Baylis GC (1985) Neurons in the
amygdala of the monkey with responses selective for faces. Behav
Brain Res 15:159–176.
Logie RH, Baddeley AD, Woodhead MM (1987) Face recognition: pose
and ecological validity. Appl Cogn Psychol 1:53–69.
Lueck CJ, Zeki S, Friston KJ, Cope P, Cunningham VJ, Lammertsma AA,
Kennard C, Frackowiak RSJ (1989) The colour centre in the cerebral
cortex of man. Nature 340:386–389.
Marr D, Nishihara HK (1978) Representation and recognition of the
spatial organization of three-dimensional shapes. Proc R Soc Lond B
200:269–294.
Mikami A, Nakamura K, Kubota K (1994) Neuronal responses to photo-
graphs in the superior temporal sulcus of the rhesus monkey. Behav
Brain Res 60:1–13.
Morris D, Collett P, Marsh P, O’Shaughnessy M (1979) Gestures, their
origins and distributions. London: Jonathan Cape.
Moscovitch M, Winocur G, Behrmann M (1997) What is special about
face recognition? Nineteen experiments on a person with visual
object agnosia and dyslexia but normal face recognition. J Cogn
Neurosci 9:555–604.
Nahm FKD, Perret A, Amaral DG, Albright TD (1997) How do monkeys
look at faces? J Cogn Neurosci 9:611–623.
Oram MW, Perrett DI (1994) Responses of anterior superior temporal
polysensory (STPa) neurons to ‘biological motion’ stimuli. J Cogn
Neurosci 6:99–116.
Perrett DI, Rolls ET, Caan W (1982) Visual neurones responsive to faces in
the monkey temporal cortex. Exp Brain Res 47:329–342.
Perrett DI, Smith PAJ, Potter DD, Mistlin AJ, Head AS, Milner AD, Jeeves
MA (1984) Neurones responsive to faces in the temporal cortex:
studies of functional organization, sensitivity to identity and relation
to perception. Hum Neurobiol 3:197–208.
Perrett DI, Mitslin AJ, Chitty AJ (1987) Visual neurones responsive to
faces. Trends Neurosci 10:358–364.
Perrett DI, Mitslin AJ, Chitty AJ, Smith PAJ, Potter DD, Broennimann R,
Harries M (1988) Specialised face processing and hemispheric
asymmetry in man and monkey: evidence from single unit and
reaction time studies. Behav Brain Res 29:245–258.
Perrett DI, Harries MH, Mistlin AJ, Hietanen JK, Benson PJ, Bevan R,
Thomas S, Oram MW, Ortega J, Brierly K (1990) Social signals
analyzed at the cell level: someone is looking at me, something
touched me, something moved! Int J Comp Psychol 4:25–54.
Perrett DI, Mistlin AJ (1990) Perception of facial characteristics by
monkeys. In: Comparative perception, vol. 2: Complex signals
(Stebbins WC, Berkley MA, eds), pp. 187–215. New York: Wiley.
Perrett DI, Hietanen JK, Oram MW, Benson PJ (1992) Organization and
functions of cells responsive to faces in the temporal cortex. Phil
Trans R Soc Lond B 335:23–30.
Cerebral Cortex Jul/Aug 1999, V 9 N 5 443

Puce A, Allison T, Asgari M, Gore JC, McCarthy G (1996) Differential
sensitivity of human visual cortex to faces, letterstrings, and textures:
a functional magnetic resonance imaging study. J Neurosci 16:
5205–5215.
Puce A, Allison T, Spencer SS, Spencer DD, McCarthy G (1997)
Comparison of cortical activation evoked by faces measured by
intracranial field potentials and functional MRI: Two case studies.
Hum Brain Map 5:298–305.
Puce A, Allison T, Bentin S, Gore JC, McCarthy G (1998) Temporal cortex
activation in humans viewing eye and mouth movements. J Neurosci
18:2188–2199.
Puce A, Smith A, Allison T (1999a) ERPs evoked by viewing facial
movements. Cogn Neuropsychol (in press).
Puce A, Allison T, McCarthy G (1999b) Electrophysiological studies of
human face perception: III. Effects of top-down processing on face-
specific potentials. Cereb Cortex 9:445–458.
Rhodes G (1993) Configural coding, expertise, and the right hemisphere
advantage for face recognition. Brain Cogn 22:19–41.
Rizzolatti G, Fadiga L, Matelli M, Bettinardi V, Paulesu E, Perani D, Fazio F
(1996) Localization of grasp representations in humans by PET: 1.
Observations versus execution. Exp Brain Res 111:246–252.
Rolls ET (1985) Role of low and high spatial frequencies in the face-
selective responses of neurons in the cortex in the superior temporal
sulcus in the monkey. Vis Res 25:1021–1035.
Rolls ET, Baylis GC (1986) Size and contrast have only small effects on the
responses to faces of neurons in the cortex of the superior temporal
sulcus of the monkey. Exp Brain Res 65:38–48.
Sakai K, Watanabe E, Onodera Y, Uchida I, Kato H, Yamamoto E, Koizumi
H, Miyashita Y (1995) Functional mapping of the human colour centre
with echo-planar magnetic resonance imaging. Proc R Soc Lond B
261:89–98.
Shepherd J (1981) Social factors in face recognition. In: Perceiving and
remembering faces (Davies G, Ellis H, Shepherd J, eds), pp. 55–79.
London: Academic Press.
Talairach J, Tournoux P (1988) Co-planar stereotaxic atlas of the human
brain. New York: Thieme.
Taylor MJ, Edmonds G, Allison T, McCarthy G (1997) Neurophysiological
indices of the development of face perception. Soc Neurosci Abstr
23:2112.
Tovée MJ, Cohen-Tovée EM (1993) The neural substrates of face
processing models: a review. Cogn Neuropsychol 10:505–528.
Troje NF, Bülthoff HH (1996) Face recognition under varying poses: the
role of texture and shape. Vis Res 36:1761–1771.
Ullman S (1996) High-level vision: object recognition and visual cognition.
Cambridge, MA: MIT Press.
Valentine T (1988) Upside-down faces: a review of the effect of inversion
upon face recognition. Br J Psychol 79:471–491.
Yarbus AL (1967) Eye movements and vision. New York: Plenum.
Zeki SM (1973) Comparison of the cortical degeneration in the visual
regions of the temporal lobe of the monkey following section of the
anterior commissure and the splenium. J Comp Neurol 148:167–176.
444 Human Face Perception II • McCarthy et al.
Copyright © 2022 FDOKUMEN