Subjective exertion perception. Perceived exertion classifi cation: face scale utilization proposal
10
305 EISSN 1676-5133 Copyright© 2008 por Colégio Brasileiro de Atividade Física, Saúde e Esporte Nov/Dec 2004 Fit Perf J Rio de Janeiro 3 6 Correspondence to: Submitted: Accepted: December / 2004 Original Article doi:10.3900/fpj.3.6.305.e Octuber / 2004 Subjective exertion perception. Perceived exertion classification: face scale utilization proposal Marcelo Gomes da Costa Diretor do Curso de Educação Física da Univ. Estácio de Sá/RJ Programa de Pós-Graduação Stricto Sensu em Ciência da Motricidade Humana da Univ. Castelo Branco/RJ [email protected] Estélio Henrique Martin Dantas Bolsista 2 A de Produtividade de Pesquisa do CNPq Programa de Pós-Graduação Stricto Sensu em Ciência da Motricidade Humana da Univ. Castelo Branco/RJ [email protected] Martim Bottaro Marques Programa de Pós-Graduação Stricto Sensu em Educação Física da Univ. Católica de Brasília/DF [email protected] Jefferson da Silva Novaes Professor Adjunto da Universidade Federal do Rio de Janeiro Programa de Pós-Graduação Stricto Sensu em Ciência da Motricidade Humana da Univ. Castelo Branco/RJ [email protected] COSTA, M.G.; DANTAS, E.H.M.; MARQUES, M.B.; NOVAES, J.S. Subjective exertion perception. Perceived exertion classification: face scale utilization proposal. Fitness & Performance Journal, v.3, n.6, p.305-313, 2004 ABSTRACT: Subjective exertion perception (SEP) is an important strategy to control exercise intensity. Considering that Borg’s Ratings of Perceived Exertion (RPE) scale—a widely used instrument—is based on verbal communication. The aim of the present study was to investigate whether SEP using a scale based on non- verbal communication (i.e., the face scale) was able to provide reliable results. Therefore, our purpose (through a maximum progressive exertion) was to correlate the face scale and peak oxygen consumption (peak VO 2 ), Borg’s RPE scale and peak VO 2 , and the face scale and Borg’s RPE scale. The sample (n = 10) included young non-athletes male adults, apparently healthy. During the test performed in a cycle ergometer, PSEs (Faces and Borg’s RPE) were recorded and respiratory gases were collected, sampled and recorded. With the purpose of determining the profile of the data set, localization (mean and median) and dispersion (standard error and standard deviation) measures were estimated. The correlation between the Face Scale and Borg’s RPE scale in terms of VO 2 peak was estimated using the Contingency Coefficient (C), since the variables were in nominal scale and arranged in 8x8 tables. To test the significance of the correlation estimation, a value of α = 5.000% was defined and the classical χ 2 test was applied, using H0 rejection when -p < 0.05. The results showed a high correlation level between the Face Scale and VO 2 (C relative = 0.824; r 2 = 67,936%; p value= 0.048) and between Face Scale and Borg Scale (0.911; 82.960%; 0.010), indicating that the proposed Face Scale can be used instead of Borg’s RPE Scale, for the researched group. Keywords: Subjective Exertion Perception (PSE), Borg’s RPE Scale, Face Scale Oxygen Consumption. 305-313 Rua do Bispo, 83 Rio Comprido Rio de Janeiro – RJ – CEP 20.261-060 – Direção de Educação Física
Transcript of Subjective exertion perception. Perceived exertion classifi cation: face scale utilization proposal

305
EISSN 1676-5133
Copyright© 2008 por Colégio Brasileiro de Atividade Física, Saúde e Esporte
Nov/Dec 2004Fit Perf J Rio de Janeiro 3 6
Correspondence to:
Submitted: Accepted: December / 2004
Original Article
doi:10.3900/fpj.3.6.305.e
Octuber / 2004
Subjective exertion perception. Perceived exertion classifi cation:
face scale utilization proposal
Marcelo Gomes da CostaDiretor do Curso de Educação Física da Univ. Estácio de Sá/RJ Programa de Pós-Graduação Stricto Sensu em Ciência da Motricidade Humana da Univ. Castelo Branco/RJ [email protected]
Estélio Henrique Martin DantasBolsista 2 A de Produtividade de Pesquisa do CNPq Programa de Pós-Graduação Stricto Sensu em Ciência da Motricidade Humana da Univ. Castelo Branco/RJ [email protected]
Martim Bottaro MarquesPrograma de Pós-Graduação Stricto Sensu em Educação Física da Univ. Católica de Brasília/DF [email protected]
Jefferson da Silva NovaesProfessor Adjunto da Universidade Federal do Rio de Janeiro Programa de Pós-Graduação Stricto Sensu em Ciência da Motricidade Humana da Univ. Castelo Branco/RJ [email protected]
COSTA, M.G.; DANTAS, E.H.M.; MARQUES, M.B.; NOVAES, J.S. Subjective exertion perception. Perceived exertion classifi cation: face scale utilization proposal. Fitness & Performance Journal, v.3, n.6, p.305-313, 2004
ABSTRACT: Subjective exertion perception (SEP) is an important strategy to control exercise intensity. Considering that Borg’s Ratings of Perceived Exertion (RPE)
scale—a widely used instrument—is based on verbal communication. The aim of the present study was to investigate whether SEP using a scale based on non-
verbal communication (i.e., the face scale) was able to provide reliable results. Therefore, our purpose (through a maximum progressive exertion) was to correlate
the face scale and peak oxygen consumption (peak VO2), Borg’s RPE scale and peak VO2, and the face scale and Borg’s RPE scale. The sample (n = 10) included
young non-athletes male adults, apparently healthy. During the test performed in a cycle ergometer, PSEs (Faces and Borg’s RPE) were recorded and respiratory
gases were collected, sampled and recorded. With the purpose of determining the profile of the data set, localization (mean and median) and dispersion (standard
error and standard deviation) measures were estimated. The correlation between the Face Scale and Borg’s RPE scale in terms of VO2
peak was estimated using the
Contingency Coefficient (C), since the variables were in nominal scale and arranged in 8x8 tables. To test the significance of the correlation estimation, a value of
α = 5.000% was defined and the classical χ2test was applied, using H0 rejection when -p < 0.05. The results showed a high correlation level between the Face
Scale and VO2(Crelative
= 0.824; r2
= 67,936%; p value= 0.048) and between Face Scale and Borg Scale (0.911; 82.960%; 0.010), indicating that the proposed
Face Scale can be used instead of Borg’s RPE Scale, for the researched group.
Keywords: Subjective Exertion Perception (PSE), Borg’s RPE Scale, Face Scale Oxygen Consumption.
305-313
Rua do Bispo, 83 Rio Comprido Rio de Janeiro – RJ – CEP 20.261-060 – Direção de Educação Física

RESUMO
Percepção subjetivo do esforço. Classificação do esforço percebido: proposta de utilização da escala de faces (*)
A percepção subjetiva de esforço (PSE) apresenta-se como uma importante es-tratégia para o controle da intensidade de exercício. Considerando que a escala RPE de Borg (Ratings of Perceived Exertion), instrumento comumente utilizado, fundamenta-se na comunicação verbal, o presente estudo procurou verificar se a PSE, através de uma escala baseada na comunicação não verbal, quer seja, a escala de Faces, apresentava resultados confiáveis para sua utilização. Neste sentido, teve por objetivo verificar, através de um teste de esforço progressivo máximo, a correlação existente entre: a escala de Faces e o consumo de ox-igênio de pico (VO2pico), a escala RPE de Borg e o consumo de oxigênio de pico (VO2pico) e entre a escala de Faces e a escala RPE de BORG. A “amostra” (n = 10) limitou-se a sujeitos aparentemente saudáveis, do gênero masculino, adultos jovens e não atletas. Durante o teste, realizado em cicloergômetro, as PSEs (Faces e RPE de Borg) foram registradas e os gases respiratórios coletados, amostrados e registrados. Objetivando definir o perfil do conjunto de dados, foram estimadas as medidas de localização (média e mediana) e dispersão (erro-padrão e desvio-padrão). A correlação entre as escalas (Faces e RPE de Borg) frente ao consumo de oxigênio de pico (VO2pico) e entre si foi estimada através do Coeficiente de Contingência (C), pois as variáveis encontravam-se em escala nominal e dispostas em tabelas 8 x 8. Para testar a significância da estimativa de correlação, definiu-se α = 5,000% e procedeu o teste χ2clássico, tendo por regra de decisão a rejeição de H0 quando o valor-p < 0,05. Os re-sultados demonstraram uma alta correlação entre Faces e VO2(Crelativo = 0,824; r2 = 67,936%; Valor-p = 0,048) e entre Faces e Borg (0,911; 82,960%; 0,010), indicando que a proposta escala de Faces pode ser utilizada em substituição à escala RPE de Borg, para o grupo investigado.
Palavras-chave: Percepção Subjetiva de Esforço (PSE), Escala RPE de Borg, Escala de Faces, Consumo de Oxigênio.
RESUMEN
Percepción Subjetiva del Esfuerzo. Classificacion del esfuerzo Per-cebido: propuesta de utilización de la escala facial(*)
A percepção subjetiva de esforço (PSE) apresenta-se como uma importante es-tratégia para o controle da intensidade de exercício. Considerando que a escala RPE de Borg (Ratings of Perceived Exertion), instrumento comumente utilizado, fundamenta-se na comunicação verbal, o presente estudo procurou verificar se a PSE, através de uma escala baseada na comunicação não verbal, quer seja, a escala de Faces, apresentava resultados confiáveis para sua utilização. Neste sentido, teve por objetivo verificar, através de um teste de esforço progressivo máximo, a correlação existente entre: a escala de Faces e o consumo de ox-igênio de pico (VO2pico), a escala RPE de Borg e o consumo de oxigênio de pico (VO2pico) e entre a escala de Faces e a escala RPE de BORG. A “amostra” (n = 10) limitou-se a sujeitos aparentemente saudáveis, do gênero masculino, adultos jovens e não atletas. Durante o teste, realizado em cicloergômetro, as PSEs (Faces e RPE de Borg) foram registradas e os gases respiratórios coletados, amostrados e registrados. Objetivando definir o perfil do conjunto de dados, foram estimadas as medidas de localização (média e mediana) e dispersão (erro-padrão e desvio-padrão). A correlação entre as escalas (Faces e RPE de Borg) frente ao consumo de oxigênio de pico (VO2pico) e entre si foi estimada através do Coeficiente de Contingência (C), pois as variáveis encontravam-se em escala nominal e dispostas em tabelas 8 x 8. Para testar a significância da estimativa de correlação, definiu-se α = 5,000% e procedeu o teste χ2clássico, tendo por regra de decisão a rejeição de H0 quando o valor-p < 0,05. Os re-sultados demonstraram uma alta correlação entre Faces e VO2(Crelativo = 0,824; r2 = 67,936%; Valor-p = 0,048) e entre Faces e Borg (0,911; 82,960%; 0,010), indicando que a proposta escala de Faces pode ser utilizada em substituição à escala RPE de Borg, para o grupo investigado.
Palabras clave: Percepción Subjetiva del Esfuerzo (PSE), Escala RPE de Borg, Escala Facial, Consumo de Oxígeno.
INTRODUCTION
Nowadays, it is widely known that the practice of physical exer-cises is one of the most important variables for the promotion of health and improvement of life quality (ACSM, 1998; 1995; Sharrat and Sharrat 1994). As a pre-requisite for a safe practice, it is recommended that the users undergo clinical examinations and physical aptitude evaluation (ACSM, 2003; 1998). These procedures aim to investigate the individuals health state so that prescription and training control are performed safely, even being motivating (Aha, 2001; 2000; Dishiman, 1994; Saba, 2001; Toscano, 1998).
After the diagnostic step, during the development of training/conditioning programs, some procedures were used for the prescription and training control, which it is relevant as regards the control of exercise intensity (ACSM, 2003).
However, with the strategies used for this control, some present a certain degree of diffi culty in its applicability and/or gauge, for example, the control of heart frequency (HF) and blood pressure (PA) (AHA, 2001; 2000).
Therefore, Subjective Perception of Exertion is important for its agile and easy applicability in the prescription (Borg, 1982; Brandao et al., 1989), mainly for the modalities of aerobic exercise (NOBLE, 1982). These play an important role in prevention, control and rehabilitation of diseases and reduction of morbidity (ACSM,
1998; 1995). Such a fact is underpinned the excellent results obtained by means of the correlation with oxygen consumption (QO2), oxygen uptake (VO2) and HF (BORG, 1998; 1982).
A great number of studies give support mainly to the scale of subjective perception of exertion (SPE) which is widely used, Borg’s RPE scale (Borg, 2000) (cf. Figure 1), confi rming its applicability in adults. These studies cover athletes (Franchini et al., 1998; Lajoie, Laurencelle and Trudeau, 2000), non-athletes (Gearhart et al., 2001; GREEN, Michael and Solomon, 1999; Lagally et al., 2002; Moyna et al., 2001; Willson and Kernozek, 1999) and bearers of diseases (Guimaraes et al., 2002; Kuwahira et al., 2000; Lougheed et al., 2002; O`donnell, Chau and Webb, 1998; Meyer et al., 1997; Pires Di Lorenzo et al., 2003; Pfi ster, Berrol and Caplan, 1998; Ye et al., 2002; Whaley et al., 1997). It is also observed the initiative of studies aims at children (Lamb and Eston, 1997; Robertson et al., 2000).
Similarly, the afore-said scale, others also base their making, adopting as referential standard the verbal communication. Some exceptions are found in the studies of Burnetto, Paulin and Yama-guti (2002) and Robertson et al. (2000), with hybrid instruments, i.e., verbal communication, but supported by some criterion of non-verbal communication (color and pattern, respectively).
306 Fit Perf J, Rio de Janeiro, 3, 6, 306, Nov/Dez 2004
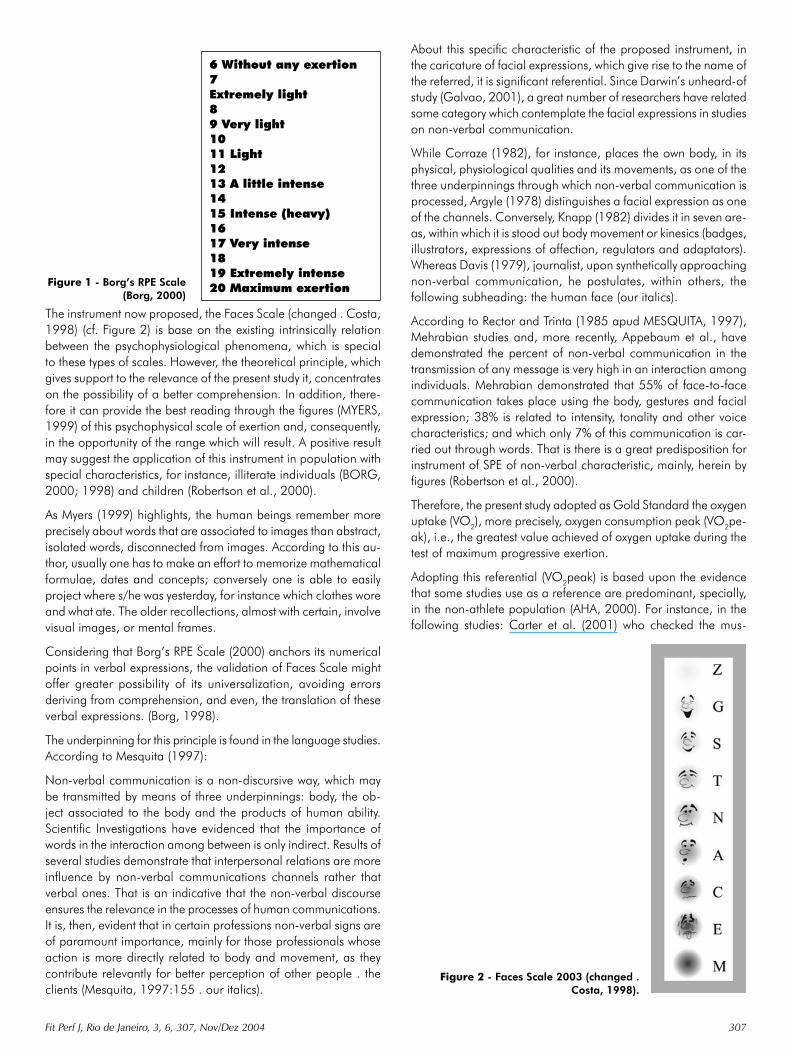
The instrument now proposed, the Faces Scale (changed . Costa, 1998) (cf. Figure 2) is base on the existing intrinsically relation between the psychophysiological phenomena, which is special to these types of scales. However, the theoretical principle, which gives support to the relevance of the present study it, concentrates on the possibility of a better comprehension. In addition, there-fore it can provide the best reading through the fi gures (MYERS, 1999) of this psychophysical scale of exertion and, consequently, in the opportunity of the range which will result. A positive result may suggest the application of this instrument in population with special characteristics, for instance, illiterate individuals (BORG, 2000; 1998) and children (Robertson et al., 2000).
As Myers (1999) highlights, the human beings remember more precisely about words that are associated to images than abstract, isolated words, disconnected from images. According to this au-thor, usually one has to make an effort to memorize mathematical formulae, dates and concepts; conversely one is able to easily project where s/he was yesterday, for instance which clothes wore and what ate. The older recollections, almost with certain, involve visual images, or mental frames.
Considering that Borg’s RPE Scale (2000) anchors its numerical points in verbal expressions, the validation of Faces Scale might offer greater possibility of its universalization, avoiding errors deriving from comprehension, and even, the translation of these verbal expressions. (Borg, 1998).
The underpinning for this principle is found in the language studies. According to Mesquita (1997):
Non-verbal communication is a non-discursive way, which may be transmitted by means of three underpinnings: body, the ob-ject associated to the body and the products of human ability. Scientifi c Investigations have evidenced that the importance of words in the interaction among between is only indirect. Results of several studies demonstrate that interpersonal relations are more infl uence by non-verbal communications channels rather that verbal ones. That is an indicative that the non-verbal discourse ensures the relevance in the processes of human communications. It is, then, evident that in certain professions non-verbal signs are of paramount importance, mainly for those professionals whose action is more directly related to body and movement, as they contribute relevantly for better perception of other people . the clients (Mesquita, 1997:155 . our italics).
About this specifi c characteristic of the proposed instrument, in the caricature of facial expressions, which give rise to the name of the referred, it is signifi cant referential. Since Darwin’s unheard-of study (Galvao, 2001), a great number of researchers have related some category which contemplate the facial expressions in studies on non-verbal communication.
While Corraze (1982), for instance, places the own body, in its physical, physiological qualities and its movements, as one of the three underpinnings through which non-verbal communication is processed, Argyle (1978) distinguishes a facial expression as one of the channels. Conversely, Knapp (1982) divides it in seven are-as, within which it is stood out body movement or kinesics (badges, illustrators, expressions of affection, regulators and adaptators). Whereas Davis (1979), journalist, upon synthetically approaching non-verbal communication, he postulates, within others, the following subheading: the human face (our italics).
According to Rector and Trinta (1985 apud MESQUITA, 1997), Mehrabian studies and, more recently, Appebaum et al., have demonstrated the percent of non-verbal communication in the transmission of any message is very high in an interaction among individuals. Mehrabian demonstrated that 55% of face-to-face communication takes place using the body, gestures and facial expression; 38% is related to intensity, tonality and other voice characteristics; and which only 7% of this communication is car-ried out through words. That is there is a great predisposition for instrument of SPE of non-verbal characteristic, mainly, herein by fi gures (Robertson et al., 2000).
Therefore, the present study adopted as Gold Standard the oxygen uptake (VO2), more precisely, oxygen consumption peak (VO2pe-ak), i.e., the greatest value achieved of oxygen uptake during the test of maximum progressive exertion.
Adopting this referential (VO2peak) is based upon the evidence that some studies use as a reference are predominant, specially, in the non-athlete population (AHA, 2000). For instance, in the following studies: Carter et al. (2001) who checked the mus-
Figure 1 - Borg’s RPE Scale (Borg, 2000)
Figure 2 - Faces Scale 2003 (changed . Costa, 1998).
6 Without any exertion 7 Extremely light 8 9 Very light 10 11 Light 12 13 A little intense 14 15 Intense (heavy) 16 17 Very intense 18 19 Extremely intense 20 Maximum exertion
Fit Perf J, Rio de Janeiro, 3, 6, 307, Nov/Dez 2004 307

culoskeletal adaptations for men and women, form resistance training; Drinkard et al. (2001) who correlated cardiorespiratory aptitude and overweight adolescents; Dunn et al. (1999) who correlated life style and cardiorespiratory aptitude; and Roy, Green and Burnett (2000) who related hydration and its consequent collateral damage in the thermical and cardiovascular stress.
The study herein sought to verify whether the SPE, through a scale based on non-verbal communication, be it Faces Scale presented reliable results for the use. In this sense, we aim to verify through a test of maximum progressive exertion, the existing correlation between: a Faces Scale and o oxygen consumption de peak (VO2peak), a scale RPE de Borg and o oxygen consumption de peak (VO2peak) and between a Faces Scale and a scale RPE and BORG.
METHODOLOGY
Study Model
As we sought to describe the intensity of physical exertion through the individual perception, the study herein is characterized as a research of descriptive nature, transversal, transversal and corre-lacional (Thomas and Nelson, 2002).
Sample Selection
The sample group was composed of students from the fi rst term, morning shift, Physical Education of the Estacio de Sa University, Reboucas Campos, located in Rua do Bispo, n.83, Rio Comprido, Rio de Janeiro, seeing that ten male apparently healthy (n = 10) and young adults aged 18-30, and were non-athletes.
Exclusion Criteria
Individuals who had been making use of medicine and/or nutri-tional ergogenic resources were excluded.
PROCEDURE FOR DATA COLLECTION
Preliminary procedures
All volunteers were informed about some specifi c guidance ne-cessary for carrying out the tests. They were also informed that they could talk to the instructor at any time or stop the test. At this moment, they signed a term of consent
Collection of variables
The experimental test of maximum progressive exertion, based on the recommendations of ACC/AHA (2000), ACSM (2003), AHA (2001; 2000) and the Brazilian Society of Cardiology (SBC, 2002), was followed by medical history or anamnesis approaching to life habits, family factor and the practice of physical exercises aiming to classify the risks through Physical Activity Readiness Questionnaire, PAR-Q. Subsequently, it was carried out the body mass, stature and skinfolds measures. Afterwards, it was estimated the BMI and body fat percentage. For this, it was used Jackson & Pollock model of three skinfolds for men (1978) with Siri equation (1961) (Fernandes Filho, 2003; Neves and Santos, 2003).
Estimate of Peak Oxygen Consumption (VO2peak)
During all tests, it was taken the measures from cycle to cycle of end-tidal fraction of oxygen (ETFo2) and end-tidal fraction of carbon dioxide (ETFco2), that is, at the of expiration and ventilation (VºE), from which it was calculated the oxygen uptake (O2 – VºO2) and a elimination de carbon dioxide (CO2 . VºCO2). Lastly, VO2 (VO2peak) was reckoned. All volunteers breathed in a tube of low resistance, connected to pneumatochometer, linked to a gas analyzer VO2000 (Inbrasport, BRA). The expiratory fractions of O2 (EFo2) and CO2 (EFCO2), and as well as the ventilation (VºE) were measured every respiratory cycle and, from them, it was possible to reckon the oxygen uptake (VºO2) and the elimination of CO2 (VºCO2). Lastly, VºO2 was reckoned as the mean value every 1 minute, and VºO2peak was attributed to the mean VoO2 at the last minute of the test.
Test protocol
Before the test, it was herein the scales faces (changed . COSTA, 1998) and Borg’s RPE (2000). Specifi c instructions on the test were also developed before it. It was explained the interpretations of scales faces and Borg’s RPE. Before beginning the test, every subject was again informed that they could at any time stop the test and/or interact with the instructor.
Pre-exercise phase of Repose
During this phase, the individuals remained seated for four minu-tes, and it was measured PA and HF of repose, being collected during the thirty fi nal second and registered in the Form of Register of all Measures for the Maximum Progressive Exertion Test. The individuals, after the presentation about the instructions related to the scales, were informed about the SPE in this stage. This stage was related to the fi rst image and/or verbal anchor of each one of the scales Faces (changed . COSTA, 1998) and Borg’s RPE (2000), respectively.
Pre-exercise phase of Warm-up
This phase aimed to adapt the individuals to the experimental test which was applied. They pedaled for 4 continuous minutes at 50-60 rpm (rpm) (ACSM, 2003; AHA, 2000; 2001), with no load in the cycleergometer (load 0W), adapting to the motor act which would be carried out in the test. In it, PA and HF and respiratory gases were, respectively, collected and sampled, registered in the last thirty minutes. They were informed about the SPE was related to the second image and/or verbal anchor of each one of the scales Face (changed . COSTA, 1998) and Borg’s RPE (2000).
Phase of Exercise
This consisted of a test of maximum progressive exertion in cycle-gometer at 50- 60 rpm (ACSM, 2003; AHA, 2000, 2001), from the power 25W, increasing at 25W every three minutes (AHA, 2001; SBC, 2002), until the test was interrupted, in general, for physical-function impairment, safety limit, signal or limiting-exertion symptom and/or the individuals f volition to stop it (ACSM, 2003; AHA, 2001). In the last 30 seconds of each phase of three minutes, it was registered the HF, PA and SPE.
The register of SPE was determined through two scales, however, at random in relation to the order of presentations. In this sense,
308 Fit Perf J, Rio de Janeiro, 3, 6, 308, Nov/Dez 2004

either the Faces Scale (changed . COSTA, 1998) was initially hereind and, later, Borg’s RPE Scale (2000), or Borg’s RPE (2000) was initially hereind, immediately after, to be hereind the Faces Scale.
Post-Exercise Phase
Its interruption, for any of the reasons herebefore, determined the post-exercise phase, or physical post-exertion. In it, the individuals maintained active repose (25W, 30rpm) for four minutes (ACSM, 2003; AHA, 2001). The PA, HF and SPE were registered in the last thirty seconds, from the 4 continuous minutes, obeying the standards sets in the previous phase.
PROCEDURE OF DATA ANALYSIS
Descriptive statistics
Aiming to defi ne the profi le of the data set, it was estimated the measurements of localization and dispersion. Relevant to the fi rst, it was calculated the mean and median (Md). For the second, it was estimated the standard error (and), coeffi cient of variation (CV) and standard deviation (s) (COSTA NETO, 1995).
The correlation between scales of Faces and Borg’s’ RPE (2000) against the other variables, and among themselves was estimated by the Coeffi cient of Contingency (C), for the variables were in the nominal scale, and squared matrix of order eight (Bunchaft and Kellner, 1999). It is important to highlight that the coeffi cient of correlation presents a maximum value different from the unity, even in the presence of perfect correlation. The maximum estimate can only be calculated when the number of lines (L) is equal to the number of columns, that is, the existence of squared matrix. In terms of this limitation and aiming to favor the interpretation of the estimate, it was defi ned the relative coeffi cient provided by the percent ration between C and Cmax, that is, Crelative = C / Cmax. To express in percent points how much the knowledge of the variable explains the variability according to the second variable, it was estimated the coeffi cient of explanation by the square Crelative (r2).
Considering that the scales of SPE may only present, for the exertion test, eight answers referring to it, for this fi rst image and/or verbal anchor of each one characterized by repose, it carried out the making of the tables of contingence 8 x 8.
From this value, it was estimated the Crelative, representative of each one of the target correlations, through the division of the value of correlation (C), normally estimated for 1.000, by the valor o Cmax. About these data, it was estimated the coeffi cient of explanation (r2), result of Crelative
2.
According to Bunchaft and Kellner (1999), the quoted estimate is suitable for the data, which respect a certain hierarchy, having continuous or discreet rating, and independently of the distribution of probability obeyed.
From these, it was estimated the maximum correlation (Cmax), which achieved the value Cmax = 0,935. For practical purposes, it is necessary to have a Crelative equal or superior to a 0.850, with respective value of R2 of 72.25%, refl ecting an error in the explanation of a variable for another one of 27.75%.
A great number of studies on SPE, which admit correlations of 0.80 as signifi cant (Dishman, Farquiar and Cureton, 1994; Lamb and Eston, 1997; Odonnell, Chau and Webb, 1998; Rittweger, Beller and Felsenberg, 2000), supports these values. Some studies have suggested some superior correlations, about 0.90. However, most of these are related to the individual results, and not the selected groups (Lamb and Eston, 1997) and/or clinical studies, which may point out some higher correlations with SPE (Birk and Birk, 1987; Eston and Thompson, 1997; Meyer et al., 1997).
Inferential statistics
The inferential analysis was developed aiming to test the signifi -cance of correlation estimate. For this, it was defi ned = 5,000% and the classic text 2 was carried out, having “rejection decision rule of H0, when the value-p < 0.05, considering the following hypotheses:
H0: Coeffi cient of correlation = 0, considering:
H01 = the faces scale will not present signifi cant correlation with the VO2peak;
H02 = the faces scale will not present signifi cant correlation with Borg’s Scale RPE (1998);
H1: Coeffi cient of correlation ‚ 0.
PRESENTATION AND DISCUSSION OS RE-SULTS
Sample selection
Such an option was based on the easiness in obtaining the sample, however, this was based on four basic on aspects:
1. Students of the fi rst term of Physical Education, for they did not have any fi rst hand experience about the procedure of verifi cation of physical exertion intensity. This fact was confi rmed when the application of the procedures;
2. Morning shift . for greater schedule availability for the tests;
3. Male gender . for the absence of signifi cant hormonal varia-tions, which may infl uence directly in the response to exertion, as for example, the menstrual cycle (Borg, 1998);
4. Young adults . aged 18-30. This age group comprises the bio-logical cycle which tends to present greater values in the curve of functional capacity for non-athlete males (AHA, 2001; 2000).
Uniformity of the Sample
It is observed in the table 1 the existence of high dispersion (CV > 20.000%) in the set of e variables of skin folds and, as a conse-quence, body fat percentage (%F). For these, the central tendency is estimated by the media. For the others, it is the mean in which lies the best estimate of central tendency. It is important to emphasize that Standard error (є ) observed in all variables is low, but for body mass. And thus, it is not expected, a priori, that there is a relevant difference from this group for the other group of volunteers. This fact is important when it is investigates de possibility of covering a certain instrument, as the study herein.
Fit Perf J, Rio de Janeiro, 3, 6, 309, Nov/Dez 2004 309

Presentation and Discussion of the collected Data
According to the Table 2, it is observed that the found Crelative between the Faces Scale and VO2peak was 0.824, quite above the values considered accepted by the literature, between 0.60 and 0.80 (Dishman, Farquiar and Cureton, 1994; Lamb and Eston, 1997; Odonnell, Chau and Webb, 1998), despite being considerably below the minimum value of 0.850 considered in this study. However, this Crelative indicates an r2 of 67,.36%, that is, insuffi cient to explaining the VO2peak from the proposal of Faces Scale, considering its minimum value (r2 = 72,25%) from the minimum required of 0.850. It is noteworthy that the diffe-rence between the limit of application (72.25%) and the found result (67.936%) is small. We can infer that, with the increase of the number of individuals, this result tends to improve, especially for the possible variability existing in this type of instrument, SPE scale (Borg, 1998).
Maybe such a result can be explained through the error estimated of the equipment (±5.000%), specially, if we bear in mind that the correlation between the RPE Scale RPE and VO2peak reached a Crelative of 0.856 with an r2 of 73.326%, very close to the value minimally accepted for this (72.25%).
However, from the observation of the relation of mean values of this parameter (VO2peak) with answer obtained by SPE (cf. Tables 3 and 4), it is identifi ed a result quite curious. While for the Faces Scales the results presented a progressive profi le of this mean value (cf. Table 3), that is, growing what is common comparatively to the maximum progressive exertion test, for Borg’s Scale RPE, it was observed some decrease in the mean value of VO2peak in the continuity of the test (cf. Table 4) (ACSM, 2003; AHA, 2000, 2001; SBC, 2002).
Such disparity maybe it derives from the group size (n = 10), in this case, a small group. Upon the analysis by category, this n was reduced may provide an error propagation negatively or positively. This error, however, when it is analyzed all the exertion evolution represented by the mean (cf. Tables 3 and 4), it is dilu-ted during the gauges, and likewise, this may occur positively or
negatively, as observed through the comparisons of mean values attained for both.
However, for its progressive characteristic, it is noticed a tendency of error smaller, or constant error, in the evolution of mean values in the Faces Scales in relation the Borg’s RPE Scale, considering VO2peak.
In the comparative analysis between the two scales, it was de-termined a Crelative = 0.911 (Value-p = 0,010, r2 = 82,960%) between the two scales (cf. Table 2). These results, quite impressi-vely, translate the high correlation and explanation between them, respectively. Borg’s RPE scale indicates that the results of a scale may replace the other one.
If, on the other hand, the Faces Scale is not presented as signi-fi cant as the Borg’s RPE Scale in correlation with VO2peak. The fact that there is a way of explaining (replacing) the other one minimizes this aspect, despite a small error margin, which it can be explained by an intrinsic error in relation to the equipment, n sample space reduced and/or, even the test protocol (ACSM, 2003; AHA, 2001, 2000).
Futhermore, the presented values for the Faces Scale are showed close to the ones estimated for Borg’s RPE scale, indicating the existence of some proximity between them. This showed that the correlation between the scales was high, despite the group size may strongly impact on the results negatively.
The fore-mentioned results points out for the use of Faces Scale instead, when necessary for the studied population.
Considering, then the studies also make use of measurement instrument of SPE based on non-verbal communication (Burnetto, Paulin and Yamaguti, 2002; Robertson et al., 2000), the results are promising. The Faces Scale showed a correlation of 0,824 between the SPE and o VO2peak, compared to the value between 0,850 and 0,940 referring to the important instrument found in Robertson et al.study (2000). This is the Scale OMN, developed for children. Alternatively the Value-p of Faces Scale was of 0,048 between SPE and VO2peak, comparing to the result of 0.32 refer-ring to the instrument of Burnetto, Paulin and Yamaguti (2002),
Table 1 - Descriptive results for the characterization of the Group of Volunteers.
Statistics Mean _ Md CV s Value-p Age (years) 23.667 1.054 23.000 13.362% 3.162 2.431 Body mass (kg) 80.722 3.463 75.200 12.871% 10.390 7.986 Stature (m) 1.779 0.022 1.770 3.765% 0.067 0.051 BMI (kg/m2) 25.418 0.627 26.050 7.399% 1.881 1.446 Pectoral (mm) 8.433 0.987 8.700 35.111% 2.961 2.276 Abdomen (mm) 21.100 2.393 22.300 34.028% 7.180 5.519 Thigh (mm) 14.311 2.155 13.300 45.171% 6.464 4.969 %F (mm) 12.475 1,463 13.053 35.178% 4.388 3.373
F = body fat percentage; _ = standard error; Md = median CV = coeffi cient of variation; s = standard deviation; Value-p (_) = signifi cance level.
Table 2 - Results of Correlation and Inference
Variables C Crelative r2 Value-p Decision
Borg x VO2peak 0.801 0.856 73.326% 0.031 It is reject the H0 Faces x VO2peak 0.771 0.824 67.936% 0.048 It is reject the H0 Borg x Faces 0.852 0.911 82.960% 0.010 It is reject the H0
Borg = Borg’s RPE scale; Faces = Faces scale; VO2peak = peak oxygen consumption de.
310 Fit Perf J, Rio de Janeiro, 3, 6, 310, Nov/Dez 2004

rameters, we can conclude that there are some valid hints for the application of this new instrument of SPE, the Faces Scale.
In this sense, considering that the Faces Scale is an instrument based on non-verbal communication, its application is more wide-ringing. Such a fact is based upon the need for literacy for the understanding and comprehension of most part of the exis-ting scales, base don verbal communication, for instance, Borg’ RPE Scale, which we used in the study as the parameter for the verifi cation of the employment of the Faces Scale. This evidence is unique, if we consider that verbal communication brings some diffi culties for specifi c groups, for example, illiterate individuals. Furthermore, from these results, we can recommend the use of Faces Scale, especially for the studied individuals: young male adults, non-athletes,apparently healthy.
From these results, for further studies, it is recommended a gre-ater sample space, aiming to provide more consistency for the generalized application of results using this specifi c population. It is also recommended that from the increase of the number of participants in the sample, it is important to verify the correlation of each answer of SPE using percentages of VO2 and HF, considering also different protocols referring to the HD. Studies of test and re-test are also recommended in order to verify whether the obtained SPE in a test of maximum progressive exertion, it is repeated a certain specifi c intensity in a test of continuous exertion.
It is advised that further studies are carried out using other types of population, such as women, athletes, elderly and clinical cases. This aims to verify the behavior of Faces Scale before the different groups. We strongly recommend the development of studies with children, illerate and semi-literate individual of different nationali-ties in order to observe the impact of non-verbal communication, intrinsically to this instrument in the SPE of these groups. This fact may be of grant relevance for practical intervention in special situations like these ones.
Figure 3: Operating Characteristic Curvethe Scale of Borg Changed Visual Analogy (EBMAV), developed for the evaluation of dyspnoea in clinical environment.
Presentation and Discussion of Tests of Statistical Hypotheses
Considering that the substantive hypothesis in the study herein (HS) anticipated that the Faces Scale may present a signifi cant corre-lation to VO2peak and to Borg’s RPE Scale (2000), its statistical hypotheses were presented in two null hypotheses. In this way, the rejection of these null hypotheses confi rms its HS. Confi rming it indicates the use of Faces Scale as an instrument of verifi cation of intensity during the accomplishment of a physical exertion, especially progressive for the studied group.
However, the use of predicted value should be more investigated, in terms of results not very satisfactory in relation to SPE until this moment for his analysis (Noble, 1982). Lagally et al. (2002), Gearhart et al. (in press) have been investigating this predicted phenomenon According to Gearhart et al., these correlations have assumed some values between 0.73 and 1.00,
however, they cannot be generalizaed yet, in term of the sample size (n = 5).
The results of the investigation herein, considering a value-p<0.05 (cf. Table 3). It is then established:
.. Faces Scale x VO2 = value-p = 0,048 = It is reject the H01.
.. Faces Scale x Borg’s RPE Scale = value-p = 0,010 = It is reject the H02.
Such considerations are ratifi ed by the operating characteristic curve observed in the Figure 3, based on which can be affi rmed that for the Error type II (β ) suitable, it may be necessary a sample of approximately thirty-fi ve participants. This was not possible in the investigation herein. However, the results are part of a strong evidence of the application of Faces Scale.
CONCLUSIONS AND RECOMMENDATIONS
As it is known, SPE is an important strategy in order to verify the quantity of applied during physical exercises, especially, upon the lack of equipments for its verifi cation and/or lack of technical expertise. From the found correlations in the investigation herein, with direct (VO2) and indirect (Borg’ RPE Scale) physiological pa-
Table 3 - Ratings for the Faces Scale related to the mean con-sumption of oxygen (VO2peak mean).
Rating VO2peak mean (l/min)
G 1.207 ± 0.270S 1.619 ± 0.415T 1.489 ± 0.934N 1.724 ± 0.724A 1.850 ± 0.825C 1.775 ± 0.974E 2.275 ± 0.877M 2.306 ± 1.396
l/min = liters per minute.
Table 4 - Ratings for Borg’s RPE Scale related to the mean con-sumption of oxygen (VO2peak mean).
Rating VO2peak mean (l/min)
Extremely light 2.047 ± 1.097Very light 1.904 ± 0.490Light 1.519 ± 0.810Little intense 1.510 ± 0.767Intense 1.747 ± 0.443Very intense 1.770 ± 0.973Extremely intense 2.064 ± 0.604Maximum 1.235 ± 0.090
l/min = liters per minute.
Fit Perf J, Rio de Janeiro, 3, 6, 311, Nov/Dez 2004 311

Acknowledgments
To the professors Jefferson da Silva Novaes (D.Sc.), Estelio Henrique Martin Dantas (D.Sc.) and Martim Bottaro Marques (D.Sc.), for their important contributions of the development and conclusion of this study.
To the Estacio de Sa University, for allowing us to put in to practice our ideas and ideals and for their insatiable search towards the professional education of excellance for their students.
To Dr. Joao Uchoa, Founder of the Estacio de Sa University, greater fomentator of Research, especially for pragmatic application.
To the professor Antonio Cesar Freire, General Director of Rebou-cas Campus for Estacio de Sa University, for his encouragement to Research, for allowing that a data collection was conducted in the Laboratory of Physiology of Exercise (LAFIEX) in the campus herein.
To professor Edil Luis Santos (D.Sc.), Coordinator of the Labora-tory of Physiology of Exercise (LAFIEX) of Reboucas Campus for Estacio de Sa University, for his support for the data collection and relevant discussions for the interpretation of Physiology in the investigation herein.
To the professor Homero Nahun da Silva Junior (D.Sc.), for all orientation and analyses of the used statistical protocols.
To the professor Celio Cordeiro Filho (M.Sc.), Coordinator of Special Project . undergraduation program for Physical Education Estacio de Sa University, and to the professor Marcia Borges de Albergaria (D.Sc.), Coordinator of the Laboratory of Physiology of Exercise (LAFIEX) - Barra-Akxe Campus, for her contributions and considerations about the study.
To the interns of LAFIEX - Reboucas Campus, Physical Education undergraduation students of Estacio de Sa University: Thiago, Bruno and Ricardo, for their great contribution for the data col-lection during the experimental trials.
REFERENCES
AMERICAN COLLEGE OF CARDIOLOGY/AMERICAN HEART ASSOCIATION (ACC/AHA). Clinical competence statement on stress testing: a report of the American College of Cardiology/American Heart Association/American College of Physicians-American Society of Internal Medicine Task Force on Clinical Competence. Circulation, v.102, p.1726-1738, 2000.
AMERICAN COLLEGE OF SPORTS MEDICINE (ACSM). Diretrizes do ACSM para os testes de esforco e sua prescricao. 6a ed. Rio de Janeiro: Guanabara Koogan, 2003.
______. The recommended quantify and qualify of exercise for developing and maintaining cardiorespiratory and muscular fi tness, and fl exibility in healthy adults. Med Sci Sports Exerc, v.30, p.975-991, 1998.
______. Physical activity and public health: a recommendation from the Centers for Disease Control and Prevention and the American College of Sports Medicine. J Amer Med Assoc, v. 273, n.5, p.402-407, 1995.
AMERICAN HEART ASSOCIATION (AHA). Exercise standards for testing and training: a statement for healthcare professionals from the American Heart Association. Circulation, v.104, p.1694-1740, 2001.
______. Assessment of functional capacity in clinical and research applications: an advisory from the committee on exercise, rehabilitation, and prevention, council on clinical cardio-logy, American Heart Association. Circulation, v.102, p.1591-1597, 2000.
ARGYLE, M. Bodily communication. London: Metheuen, 1978.
BIRK, T. e BIRK, A.C. Use of ratings of perceived exertion for exercise prescription. Med Sci Sports Exerc, v.4, n.1, p.01-08, 1987.
BORG, G. Escalas de Borg para a dor e o esforco percebido. Sao Paulo: Manole, 2000.
______. Borg’s perceived exertion and pain scales. Champaign: Human Kinetics, 1998.
______. Psycophysical bases of perceived exertion. Med Sci Sports Exerc, v.14, p. 377-381, 1982.
BRANDAO, M.R.F. et al. Percepcao do esforco: uma revisao da area. Rev Bra Cienc Mov, v.3, p.34-40, 1989.
BUNCHAFT, G. e KELLNER, S.R.O. Estatistica sem misterios. Petropolis: Vozes, 1999.
BURNETTO, A.F.; PAULIN, E.; YAMAGUTI, W.P.S. Comparacao entre a escala de Borg modifi cada e a escala de Borg modifi cada analogo visual aplicadas em pacientes com dispneia. Rev Bra Fisioter, v.6, n.1, p.41-45, 2002.
CORRAZE, J. As comunicacoes nao-verbais. Rio de Janeiro: Zahar, 1982.
COSTA, M.G. Ginastica localizada: grupos heterogeneos. Rio de Janeiro: Sprint, 1998.
COSTA NETO, P.L.O. Estatistica. Sao Paulo: Edgard Blucher, 1995.
DARWIN, C. A expressao das emocoes no homem e no animal. Sao Paulo, Companhia das Letras, 2000.
DAVIS, F. A comunicacao nao-verbal. Sao Paulo: Summus, 1979.
DISHMAN, R.K. Advances in exercise adherence. Champaign: Human Kinetcs, 1994.
______. Exercise adherence research: future directions. Am J Health Prom, v.3, p.52-56, 1988
.
DISHMAN, R.K.; FARQUHAR, R.P.; CURETON, K.J. Responses to preferred intensities of exertion in men differing in activity levels. Med Sci Sports Exerc, v.26, n.6, p.783-790, 1994.
ESTON, R.G. e THOMPSON, M. Use ratings of perceived exertion for predicting maximal work rate and prescribing exercise intensity in patients taking atenolol. Br J Sports Med, v.31, p.114-119, 1997.
FERNANDES FILHO, J. A pratica da avaliacao fi sica. Rio de Janeiro: Shape, 2003.
FRANCHINI, E. et al. Caracteristicas fi siologicas em testes laboratoriais e resposta da concentracao de lactato sanguineo em tres lutas em judocas das classes juvenil-A, junior e senior. Rev Paul Educ Fis, v.12, n.1, p.5-16, 1998.
GALVAO, I. Expressividade e emocao: ampliando o olhar sobre as interacoes sociais. Rev Paul Edu Fis. Sao Paulo, supl. 4, p.15-35, 2001.
GEARHART, R.F. et al. Ratings of perceived exertion in active muscle during high intensity and low intensity resistance exercise. J Strength Cond Res (in press).
GEARHART, R.F. et al. Standardized scaling procedures for rating perceived exertion during resistance exercise. J Strength Cond Res, v.15, n.3, p.320-325, 2001.
GREEN, J.M.; MICHAEL, T.; SOLOMON, A.H. The validity of ratings of perceived exertion for cross-modal regulation of swimming intensity. J Sports Med Phys Fitness, v.39, n.3, p.207-212, 1999.
GUIMARAES, G.V. et al. Pode o teste ergometrico de caminhada de seis minutos ser representativo das atividades habituais de pacientes com insufi ciencia cardiaca? Arq Bra Cardiol, v.78, p.553-560, 2002.
KNAPP, M.L. La comunicacion non verbal: el cuerpo y el entorno. Barcelona: Paidos Iberica, 1982.
KUWAHIRA, I. et al. Effectiveness of the fold placation method in lung volume reduction surgery. Intern Med, v.39, p.381-384, 2000.
LAGALLY, K.M. et al. Perceived exertion, electromyography, and bllod lactate during acute bouts of resistance exercise. Med Sci Sports Exerc, v.34, n.3, p.552-559, 2002.
LAJOIE, C.; LAURENCELLE, L.; TRUDEAU, F. Physiological responses to cycling for 60 minutes at maximal lactate steady state. Can J Appl Physiol, v.25, n.4, p.250-261, 2000.
LAMB, K.L. e ESTON, R.G. Effort perception in children. Int J Sports Med, v.23, n.3, p.139-148, 1997.
LOUGHEED, M.D. et al. Respiratory sensation and ventilatory mechanics during induced bronchoconstriction in spontaneously breathing low cervical quadriplegia. Am J Respir Crit Care Med, v.166, p.370-376, 2002.
MESQUITA, R.M. Comunicacao nao-verbal: relevancia na atuacao profi ssional. Rev Paul Educ Fis, Sao Paulo, v.11, n.2, p.155-163, 1997.
MEYER, K. et al. Interval training in patients with severe chronic heart failure: analysis and recommendations for exercise procedures. Med Sci Sports Exerc, v.29, p.306-312, 1997.
MOYNA, N.M. et al. Intermodal comparison of energy expenditure at exercise intensi-ties corresponding to the perceptual preference range. Med Sci Sports Exerc, v.33, n.8, p.1404-1410, 2001.
NEVES, C.E.B. e SANTOS, E.L. Avaliacao funcional. Rio de Janeiro: Sprint, 2003.
NOBLE, B.J. Clinical applications os perceived exertion. Med Sci Sports Exerc, v.14, p.406-411, 1982.
O fDONNELL, D.E.; CHAU, L.K.; WEBB, K.A. Quantitative aspects of exertional dyspnea in patients with interstitial lung disease. J Appl Physiol, v.84, p.2000-2009, 1998.
312 Fit Perf J, Rio de Janeiro, 3, 6, 312, Nov/Dez 2004

PFISTER, T.; BERROL, C.; CAPLAN, C. Effects of music on exercise and perceived symptoms in patients with chronic obstructive pulmonary disease. J Cardiopulm Rehabil, v.18, n.3, p.228-232, 1998.
PIRES Di LORENZO, V.A. et al. Efeitos do treinamento fi sico e muscular respiratorio em pacientes com doenca pulmonar obstrutiva cronica (DPOC) grave submetidos a BiPAP. Rev Bra Fisioter, v.7, p.69-76, 2003.
RECTOR, M. e TRINTA, A. A comunicacao nao-verbal: a gestualidade brasileira. Petro-polis: Vozes, 1985.
RITTWEGER, J.; BELLER, G.; FELSENBERG, D. Acute physiological effects of exhaustive whole-body vibration exercise in man. Clin Physiol, v.20, p.134-142, 2000.
ROBERTSON R.J. et al. Children fs OMNI Scale of Perceived Exertion: mixed gender and race validation. Med Sci Sports Exerc, v.32, n.3, p.452-458, 2000.
SABA, F.K.F. Aderencia a pratica do exercicio fi sico em academias. Sao Paulo: Manole, 2001.
SHARRAT, M.T. e SHARRAT, J.K. Potential health benefi ts of active living for persons with chronic conditions. Champaign: Human Kinetics, p.39-45, 1994.
SOCIEDADE BRASILEIRA DE CARDIOLOGIA (SBC). II diretrizes da Sociedade Brasileira de Cardiologia sobre teste ergometrico. Arq Bras Cardiol, v.78, supl.II, 2002.
THOMAS, J.R. e NELSON, J.K. Metodos de pesquisa em atividade fi sica. Porto Alegre:
Artmed, 2002.
TOSCANO, J.J.O; MIRANDA, L.G.A.; WANDERLEY, R.C. A pratica da musculacao na aptidao
fi sica do epiletico. Rev Bras Cien Saude, v.2, n.1/3, p.83-88, 1998.
WHALEY, M.H. et al. Validity of rating of perceived exertion during graded exercise
testing in apparently healthy adults and cardiac patients. J Cardiopulm Rehabil, v.17,
p.261-267, 1997.
WILLSON, J.D. e KERNOZEK, T.W. Plantar loading and cadence alterations with fatigue.
Med Sci Sports Exerc, v.31, n.12, p.1828-1833, 1999.
YE, Q. et al. Proportional assist ventilation: methodology and therapeutics on CPOD
patients compared with pressure support ventilation. Chin Med J, v.115, p.179-183,
2002.
Figure 1 - Borg’s RPE Scale (Borg, 2000).
Fit Perf J, Rio de Janeiro, 3, 6, 313, Nov/Dez 2004 313

314 Fit Perf J, Rio de Janeiro, 3, 6, 314, Nov/Dez 2004