HCV-Specific T-Cell Response in Relation to Viral Kinetics and Treatment Outcome (DITTO-HCV Project)
12
CLINICAL—LIVER, PANCREAS, AND BILIARY TRACT HCV-Specific T-Cell Response in Relation to Viral Kinetics and Treatment Outcome (DITTO-HCV Project) MASSIMO PILLI,* ALESSANDRO ZERBINI,* AMALIA PENNA,* ALESSANDRA ORLANDINI,* ESTHER LUKASIEWICZ, ‡ JEAN–MICHEL PAWLOTSKY, § STEFAN ZEUZEM, ¶ SOLKO W. SCHALM, # MICHAEL VON WAGNER, ¶ GEORGIOS GERMANIDIS,** YOAV LURIE, ‡‡ JUAN I. ESTEBAN, §§ BART L. HAAGMANS, # CHRISTOPHE HEZODE, § MARTIN LAGGING, ¶¶ FRANCESCO NEGRO, ## YONIT HOMBURGER, ‡ AVIDAN U. NEUMANN, ‡ CARLO FERRARI,* GABRIELE MISSALE,* for the DITTO-HCV Study Group *Azienda Ospedaliero-Universitaria Di Parma, Parma, Italy; ‡ Bar-Ilan University, Ramat-Gan, Israel; § Hopital Henri Mondor, Universite Paris XII, Creteil, France; ¶ J.W. Goethe-University Hospital, Frankfurt, Germany; # Erasmus MC Medical Center, Rotterdam, The Netherlands; **Aristotle University of Thessaloniki, Thessaloniki, Greece; ‡‡ Tel Aviv Sourasky Medical Center, Tel-Aviv, Israel; §§ Hospital General Vall d’Hebron, Barcelona, Spain; ¶¶ University of Goeteborg, Goeteborg, Sweden; and ## Hospital University of Geneve, Geneve, Switzerland Background & Aims: The second slope of viral decline induced by interferon treatment has been suggested to be influenced mainly by the hepatitis C virus (HCV)-specific T-cell response; however, this hypothesis needs to be vali- dated by results derived from experimental studies. Methods: To address this issue, the HCV-specific T-cell response of 32 genotype-1–infected patients of the 270 patients enrolled in the dynamically individualized treat- ment of hepatitis C infection and correlates of viral/host dynamics phase III, open-label, randomized, multicenter trial was studied in relation to viral kinetics and treatment outcome. Results: Greater proliferative responses by HCV-specific CD8 cells were found before treatment in patients with a fast viral decline and with a sustained viral response. However, no significant improvement of HCV- specific CD8 responses was observed in the first weeks of therapy in both rapid viral responder and non–rapid viral responder patients. A mild enhancement of proliferative T-cell responses and a partial restoration of the cytotoxic T-cell potential was expressed only late during treatment, likely favored by HCV clearance. Conclusions: Early res- toration of an efficient T-cell response does not seem to be an essential requirement for a rapid viral decline in the first weeks of treatment. However, patients presenting a better HCV-specific CD8 cell proliferative potential at baseline are more likely to present a rapid and sustained viral response. Therefore, future treatment protocols should consider the development of strategies aimed at improving HCV-specific T-cell responses. T he combination of peginterferon-alfa and ribavirin presently is the standard of care for chronic hepatitis C. Depending on the infecting genotype, response rates from 42% to 82% have been achieved in large clinical trials. 1–3 However, despite the great improvement in treatment efficacy, difficult-to-treat patients remain a large part of the population, especially outside of clinical trials, when cofactors for liver disease progression and lower patient compliance are frequent. Therefore, im- provement of treatment options and optimization of standard therapies now are expected. Mathematic modeling of viral kinetics has greatly im- proved our understanding of hepatitis C virus (HCV) replication, 4–6 allowing a faster development in the un- derstanding of the biological mechanisms regulating host-virus interactions. However, models need to be val- idated and improved by the application of results derived from experimental studies. The antiviral adaptive immune response is a key ele- ment of the host-virus interaction that could explain the different kinetics of viral decline detectable in different groups of patients undergoing antiviral therapy. A dose- dependent viral decay during the first 24 – 48 hours of interferon (IFN) therapy is followed by a second slope decay that should depend on the efficiency of the HCV- specific T-cell response, particularly CD8-mediated, in- volved in the elimination of the infected hepatocytes. Several data on the immunomodulatory activity of IFN-alfa and ribavirin are available from in vitro studies; IFN can up-regulate HLA class I expression on antigen presenting cells, interleukin-12R on T-helper cells, 7 and Abbreviations used in this paper: CTL, cytotoxic T lymphocytes; IDV, individualized treatment regimen; IFN, interferon; PBMCs, peripheral blood mononuclear cells; RVR, rapid viral responder; SI, stimulation index; STD, control group; SVR, sustained virologic response. © 2007 by the AGA Institute 0016-5085/07/$32.00 doi:10.1053/j.gastro.2007.06.059 CLINICAL–LIVER, PANCREAS, AND BILIARY TRACT GASTROENTEROLOGY 2007;133:1132–1143
-
Upload
independent -
Category
Documents
-
view
0 -
download
0
Transcript of HCV-Specific T-Cell Response in Relation to Viral Kinetics and Treatment Outcome (DITTO-HCV Project)

CT
HO
MJGMG
*GGa
BiiTdMrpmdtoHprstrTTltafibbvsi
TCf
CLIN
ICA
L–LIVER
,PA
NCREA
S,A
ND
BILIA
RY
TRA
CT
GASTROENTEROLOGY 2007;133:1132–1143
LINICAL—LIVER, PANCREAS, AND BILIARYRACT
CV-Specific T-Cell Response in Relation to Viral Kinetics and Treatmentutcome (DITTO-HCV Project)
ASSIMO PILLI,* ALESSANDRO ZERBINI,* AMALIA PENNA,* ALESSANDRA ORLANDINI,* ESTHER LUKASIEWICZ,‡
EAN–MICHEL PAWLOTSKY,§ STEFAN ZEUZEM,¶ SOLKO W. SCHALM,# MICHAEL VON WAGNER,¶
EORGIOS GERMANIDIS,** YOAV LURIE,‡‡ JUAN I. ESTEBAN,§§ BART L. HAAGMANS,# CHRISTOPHE HEZODE,§
ARTIN LAGGING,¶¶ FRANCESCO NEGRO,## YONIT HOMBURGER,‡ AVIDAN U. NEUMANN,‡ CARLO FERRARI,*ABRIELE MISSALE,* for the DITTO-HCV Study Group
Azienda Ospedaliero-Universitaria Di Parma, Parma, Italy; ‡Bar-Ilan University, Ramat-Gan, Israel; §Hopital Henri Mondor, Universite Paris XII, Creteil, France; ¶J.W.oethe-University Hospital, Frankfurt, Germany; #Erasmus MC Medical Center, Rotterdam, The Netherlands; **Aristotle University of Thessaloniki, Thessaloniki,
‡‡ §§ ¶¶
reece; Tel Aviv Sourasky Medical Center, Tel-Aviv, Israel; Hospital General Vall d’Hebron, Barcelona, Spain; University of Goeteborg, Goeteborg, Sweden;nd ##Hospital University of Geneve, Geneve, Switzerlandttltlps
prdhif
mdgdidsv
IIp
ibi
ackground & Aims: The second slope of viral declinenduced by interferon treatment has been suggested to benfluenced mainly by the hepatitis C virus (HCV)-specific-cell response; however, this hypothesis needs to be vali-ated by results derived from experimental studies.ethods: To address this issue, the HCV-specific T-cell
esponse of 32 genotype-1–infected patients of the 270atients enrolled in the dynamically individualized treat-ent of hepatitis C infection and correlates of viral/host
ynamics phase III, open-label, randomized, multicenterrial was studied in relation to viral kinetics and treatmentutcome. Results: Greater proliferative responses byCV-specific CD8 cells were found before treatment in
atients with a fast viral decline and with a sustained viralesponse. However, no significant improvement of HCV-pecific CD8 responses was observed in the first weeks ofherapy in both rapid viral responder and non–rapid viralesponder patients. A mild enhancement of proliferative-cell responses and a partial restoration of the cytotoxic-cell potential was expressed only late during treatment,
ikely favored by HCV clearance. Conclusions: Early res-oration of an efficient T-cell response does not seem to ben essential requirement for a rapid viral decline in therst weeks of treatment. However, patients presenting aetter HCV-specific CD8 cell proliferative potential ataseline are more likely to present a rapid and sustainediral response. Therefore, future treatment protocolshould consider the development of strategies aimed atmproving HCV-specific T-cell responses.
he combination of peginterferon-alfa and ribavirinpresently is the standard of care for chronic hepatitis
. Depending on the infecting genotype, response rates
rom 42% to 82% have been achieved in large clinicalrials.1–3 However, despite the great improvement inreatment efficacy, difficult-to-treat patients remain aarge part of the population, especially outside of clinicalrials, when cofactors for liver disease progression andower patient compliance are frequent. Therefore, im-rovement of treatment options and optimization oftandard therapies now are expected.
Mathematic modeling of viral kinetics has greatly im-roved our understanding of hepatitis C virus (HCV)eplication,4–6 allowing a faster development in the un-erstanding of the biological mechanisms regulatingost-virus interactions. However, models need to be val-
dated and improved by the application of results derivedrom experimental studies.
The antiviral adaptive immune response is a key ele-ent of the host-virus interaction that could explain the
ifferent kinetics of viral decline detectable in differentroups of patients undergoing antiviral therapy. A dose-ependent viral decay during the first 24 – 48 hours of
nterferon (IFN) therapy is followed by a second slopeecay that should depend on the efficiency of the HCV-pecific T-cell response, particularly CD8-mediated, in-olved in the elimination of the infected hepatocytes.
Several data on the immunomodulatory activity ofFN-alfa and ribavirin are available from in vitro studies;FN can up-regulate HLA class I expression on antigenresenting cells, interleukin-12R� on T-helper cells,7 and
Abbreviations used in this paper: CTL, cytotoxic T lymphocytes; IDV,ndividualized treatment regimen; IFN, interferon; PBMCs, peripherallood mononuclear cells; RVR, rapid viral responder; SI, stimulation
ndex; STD, control group; SVR, sustained virologic response.© 2007 by the AGA Institute
0016-5085/07/$32.00
doi:10.1053/j.gastro.2007.06.059
ctr
ritCt
Cdfpctiitetesrtmtpiristra
msaepLrstfigtc
tt
tbsrsdt1
Istr
Rdpv(4iwRmwhr((rsm
tHH
tel
HduambpaSra
CLI
NIC
AL–
LIV
ER,
PA
NCREA
S,A
ND
BIL
IARY
TRA
CT
October 2007 VIRAL KINETICS AND HCV–SPECIFIC T–CELL RESPONSE 1133
an enhance IFN-� production by CD4 T cells.8 In addi-ion, a switch from a Th2 to a Th1 cytokine profile mayesult from the immunomodulatory activity of ribavirin.9
The study of the behavior of the HCV-specific T-cellesponse during IFN and ribavirin treatment of HCVnfected patients have provided conflicting results, withhe majority of the studies analyzing the behavior of theD4 T-cell response and only few addressing the role of
he cytotoxic T-cell response.10 –17
In our study, we analyzed the kinetics of the CD4 andD8 T-cell response in 32 of 270 patients enrolled in theynamically individualized treatment of hepatitis C in-ection and correlates of viral/host dynamics (DITTO)hase III, open-label, randomized, multicenter trial.18 T-ell responses were analyzed in relation to viral kinetics toest the hypothesis that the second slope viral decline wasnfluenced by the HCV-specific T-cell response and todentify immunologic parameters associated with a sus-ained virologic response. Our results did not show annhancement of the HCV-specific T-cell response duringhe first month of treatment and no clear associationsmerged between a fast viral decline (rapid viral re-ponder [RVR]) and a restoration of the cellular immuneesponse. A mild enhancement of proliferative and cyto-oxic T-cell responses was observed later during treat-
ent. A better capacity of in vitro expansion beforereatment by HCV-specific CD8 T cells apparently wasredictive of sustained response because it was detectable
n patients with a fast viral decline and a sustainedesponse to therapy. Because treatment was individual-zed according to viral kinetics after week 6, making thetudy population heterogeneous, the predictive value ofhis parameter with respect to the outcome of therapyemains to be confirmed by larger studies and by thepplication of complementary experimental approaches.
Patients and MethodsPatientsThe DITTO phase III, open-label, randomized,
ulticenter trial was conducted by the DITTO-HCVtudy group between February 2001 and November 2003t 9 European centers. Patients who met the criteria forntry all were treated initially for 6 weeks with 180 �geginterferon �-2a once a week (Pegasys; F. Hoffmann-aRoche, Basel, Switzerland) and 1000 –1200 mg ribavi-in per day (Copegus; F. Hoffmann-LaRoche). Patientsubsequently were classified as RVRs if they showed aotal log decrease of HCV RNA of 2 or greater during therst 4 weeks and a second phase decrease of 0.09/day orreater, or classified as non-RVR18 and randomized eithero an individualized treatment regimen (IDV) or to aontrol group (STD).
Thirty-two of the 270 patients enrolled in the clinicalrial were selected among 177 genotype 1–infected pa-
ients enrolled at the different clinical centers based on the availability of sufficient numbers of viable peripherallood mononuclear cells (PBMCs) after thawing. Twenty-even patients were studied for HCV-specific HLA– class Iestricted T-cell response at 2 different time points beforetart of treatment (weeks �4 and �1), at 5 time pointsuring treatment (weeks 2, 4, 8, 12, and 36), and at oneime point during follow-up evaluation (follow-up week2) (Table 1).
Seventeen of the 27 patients studied for the HLA– classrestricted T-cell response and 5 additional patients weretudied for the HLA– class II restricted T-cell response athe same time points tested for HLA– class I restrictedesponses (Table 1).
During the first 6 weeks of therapy individual HCV-NA decreases were determined by testing HCV RNA onays 0, 1, 4, 7, 8, 15, and 29. In this time period, allatients received a standard peginterferon �-2a plus riba-irin combination therapy. Afterward, the control groupSTD) went on with the same therapy for an additional2 weeks, whereas the other patients were randomized to
ndividual treatment regimens as described in detail else-here.18 In brief, the IDV arms included RVR and non-VR patients; RVR patients underwent a shorter treat-ent (24 wk) or continued treatment for up to 48 weeksithout ribavirin. Non-RVR patients either (1) receivedistamine dihydrochloride in addition to peginterferon/ibavirin, (2) continued treatment for up to 72 weeks, or3) were treated with a high dose of peginterferon �-2a360 �g) plus ribavirin. Only patient 4009 in our cohorteceived the latter treatment regimen, but the T-cell re-ponse was tested only during the first 6 weeks of treat-
ent with the standard peginterferon-ribavirin dosage.HCV genotyping was performed by reverse hybridiza-
ion (Inno LiPA; Innogenetics, Ghent, Belgium). TheCV-RNA load was measured by COBAS MONITORCV (version 2.0; F. Hoffmann-LaRoche).Patients gave written informed consent before entering
he study and the study protocol was approved by localthical committees and conformed to the ethical guide-ines of the 1975 Declaration of Helsinki.
HCV Antigens, Peptides, and Peptide-HLAClass I TetramersFor the assessment of the functional features of
CV-specific T cells, HCV antigens and synthetic peptidesesigned on genotype 1a (HCV-1 amino acid sequence) weresed. HCV antigens E2, core, NS3, NS4, and NS5 expresseds C-terminal fusion proteins with human superoxide dis-utase in yeast (Streptomyces cerevisiae) were kindly provided
y Chiron Corporation (Emeryville, CA). Recombinant su-eroxide dismutase and yeast were used in each experiments controls for nonspecific proliferative T-cell responses.ynthetic 20-mer peptides overlapping by 10 amino acidesidues covering the entire HCV core and NS4 antigensnd 15-mer peptides overlapping by 10 residues covering
he overall genotype 1a (HCV-1 sequence) were purchased
ficdltN(H2(cp
baCamtt
adstAcsaa
io3
bcumaso
T
11661766666646664467496416476664
D NR, n
CLIN
ICA
L–LIVER
,PA
NCREA
S,A
ND
BILIA
RY
TRA
CT
1134 PILLI ET AL GASTROENTEROLOGY Vol. 133, No. 4
rom Chiron Mimotopes (Clayton, Australia). The follow-ng synthetic peptides representing widely re-ognized HLA-A2 and HLA-A3 restricted epitopes withinifferent nonstructural HCV proteins (http://hcv.
anl.gov)19 also were purchased from Chiron Mimo-opes: HLA A2-NS3 1073-1081 (CINGVCWTV), HLA A2-S3 1406-1415 (KLVALGINAV), HLA A3-NS3 1391-1399
LIFCHSKKK), HLA A2-NS4 1807-1816 (LLFNILGGWV),LA A3-NS4 1858-1867 (GVAGALVAFK), HLA A3-NS5
588-2596 (RVCEKMALY), and HLA A2-NS5 2594-2602ALYDVVTKL). Individual tetrameric peptide–HLA class Iomplexes containing all the earlier-described peptides wereurchased from Proimmune LTD (Oxford, UK).
Isolation of PBMCs and In Vitro Productionof Peptide-Specific Short-Term CD8 LinesPBMCs were isolated from fresh heparinized
lood by Ficoll-Hypaque density gradient centrifugationnd frozen in liquid nitrogen. Peptide-specific polyclonalD8 lines were generated by frozen PBMCs resuspendedt 3 � 105/well in RPMI-1640 supplemented with 25mol/L HEPES, 2 mmol/L L-glutamine, 50 mg/mL gen-
amycin, and 10% human serum (complete medium) con-
able 1. Patient Characteristics, Treatment Arms, and Immu
Patient Viral kinetics Genotype Outcome
019 RVR 1b NR023 RVR 1a NR-DC028 RVR 1 REL031 RVR 1 REL003 RVR 1b REL023 RVR 1 SVR001 RVR 1 SVR006 RVR 1 SVR008 RVR 1 SVR021 RVR 1 SVR027 RVR 1 SVR030 RVR 1 SVR034 RVR 1a SVR032 RVR 1a SVR012 RVR 1a SVR025 RVR 1b SVR013 non-RVR 1 NR028 non-RVR 1 NR035 non-RVR 1 NR021 non-RVR 1a NR009 non-RVR 1b NR014 non-RVR 1 REL003 non-RVR 1 REL029 non-RVR 1b REL021 non-RVR 1b REL029 non-RVR 1 REL-DC018 non-RVR 1 SVR022 non-RVR 1 SVR005 non-RVR 1 SVR023 non-RVR 1 SVR034 non-RVR 1 SVR005 non-RVR 1 SVR
C, discontinued treatment; —, not HLA-A2 and/or HLA-A3 positive;
aining interleukin-7 (5 ng/mL; Endogen, Woburn, MA) c
nd interleukin-12 (100 pg/mL; R&D Systems, Abing-on, UK) and stimulated with HLA-A2 and HLA-A3 re-tricted HCV peptides used at 1 �mol/L final concentra-ion. Recombinant interleukin-2 (50 U/mL; EuroCetus,msterdam, The Netherlands) was added on day 3 ofulture. After 10 days of culture the CD8 lines weretained for evaluation of tetramer-positive cell expansion,nd were tested for IFN-� production, perforin content,nd cytotoxic activity.
Proliferation AssayPBMCs were plated at 2 � 105 cells/well and
ncubated for 7 days in complete medium in the presencer absence of HCV antigens (1 �g/mL) or controls.H-TdR (0.5 �Ci/well; Amersham, UK) was added 8 hoursefore harvesting. The results are expressed as the meanounts per minute of triplicate determinations. The stim-lation index (SI) was calculated as the ratio betweenean counts per minute obtained in the presence and
bsence of antigen. An SI of 3 or greater was consideredignificant (at least 2 SDs above the mean of all SI valuesbtained with each individual HCV protein in normal
says
Arm HLA CD8 assays Proliferative T assay
IDV A2 Y NSTD A2 Y NIDV A2 Y YIDV A3 Y YIDV A2 Y NIDV A2 Y YIDV A2 Y YSTD A2 Y YIDV A2 Y YSTD A3 Y YSTD A2 Y YSTD A2 Y YSTD — N YSTD — N YIDV — N YIDV — N YIDV A3 Y NSTD A2 Y YSTD A3 Y YIDV A3 Y NIDV A2 Y NIDV A2 Y NSTD A3 Y YIDV A2 Y NIDV A2 Y NIDV A3 Y YSTD A2 Y NSTD A3 Y YSTD A2 Y YSTD A2 Y YIDV A2 Y YSTD — N Y
onresponders; REL, relapsers.
noas
ontrols).

v�twapStiDctfu
psApsb
apbsashcuLicpalcCteowvs
csile
pbHrbttPlrcp
1wtls3Hfgwdi
oTt(prmMtwPpfpePa7r2bw24p
CLI
NIC
AL–
LIV
ER,
PA
NCREA
S,A
ND
BIL
IARY
TRA
CT
October 2007 VIRAL KINETICS AND HCV–SPECIFIC T–CELL RESPONSE 1135
Ex Vivo Tetramer StainingThe frequency of HCV-specific CD8� T cells ex
ivo was evaluated using tetramer complexes. PBMCs (1106) were incubated for 20 minutes at room tempera-
ure with phycoerytrin-labeled tetramer. Cells wereashed and then incubated at 4°C for 30 min withllophycocyanin-labeled anti-CD8 and peridinin chloro-hyll protein-labeled anti-CD3 MoAb (Becton Dickinson,an Jose, CA). Analysis was performed on a 4-color mul-iparametric flow cytometer (FACS-Calibur, Becton Dick-nson) using CELLQuest software (FACS-Calibur; Becton
ickinson). Frequencies ex vivo of 0.01% or greater wereonsidered positive. This threshold was determined ashe background signal plus 3 SDs after staining PBMCsrom 5 HLA-A2–positive and 5 HLA-A3–positive healthyninfected controls.
Expansion, Perforin Content, andIntracellular IFN-� Staining of T-Cell LinesExpansion of HCV-specific CD8� T cells on
eptide stimulation was determined by the tetramertaining technique, as described earlier for PBMCs.fter expansion, cells were washed and then fixed andermeabilized with Citofix-Citoperm (Becton Dickin-on) and stained with fluorescein isothiocyanate–la-eled antiperforin (Pharmingen BD, San Diego, CA).Intracellular cytokine assessment was performed on
ntigen-specific T-cell lines. Short-term HCV-specificolyclonal cytotoxic T lymphocytes (CTL) lines obtainedy 10 days stimulation with HLA-A2 and HLA-A3–re-tricted 9-mer and 10-mer peptides were resuspended atconcentration of 2 � 106/mL in complete medium and
timulated with the same peptides at 1 �g/mL for 5ours in a humidified 5% CO2 incubator at 37°C. As aontrol, medium alone or an irrelevant peptide weresed. Brefeldin-A (10 �g/mL; Sigma Chemical Co, St.ouis, MO) was added 1 hour after stimulation. After
ncubation, cell suspensions were stained with allophy-ocyanin-labeled anti-CD8 and peridinin chlorophyllrotein-labeled anti-CD3 MoAb, fixed and permeabilizeds described earlier, and then stained with phycoerytrin-abeled anti-human IFN-� (Sigma). Intracellular perforinontent and IFN-� expression were analyzed on a FACS-alibur flow cytometer using CELLQuest software (Bec-
on Dickinson). CD8 cell responses measured by IFN-�xpression were considered positive when the frequencyf IFN-�–positive CD8 cells restimulated with peptideas at least 1.5 times the background value; background
alues of IFN-�–positive CD8 cells (range, 0%– 0.4%) wereubtracted from the values of the restimulated cells.
For the mean frequency analysis of HCV-specific CD8ells measured either by IFN-� secretion or by tetramertaining ex vivo or after in vitro expansion, all valuesncluding negative responses were computed. In particu-ar, frequencies below the limit of detection were consid-
red equal to 0. iChromium-Release AssayAfter 10 days of culture, the cytotoxic activity of
eptide-stimulated effector T cells was assessed by incu-ation with peptide pulsed or unpulsed 51Cr-labeled,LA-A2–positive and HLA-A3–positive Epstein-Barr vi-
us transformed B cells as targets, for 4 hours in round-ottomed 96-well plates. The amount of 51Cr released byarget cells (5000/well) in the supernatant was quanti-ated with a gamma-counter (TopCount NXT; Packard-erkinElmer, Boston, MA) and the percentage specific
ysis was calculated as described.20 To avoid false-positiveesults, only levels of CTL lysis greater than 10% wereonsidered significant. All chromium release assays wereerformed at an E:T ratio of 40:1.
ELISPOT AssaySix hundred one 15-mer peptides overlapping by
0 residues and covering the overall HCV-1 sequenceere pooled in 25 mixtures, each containing 20 –25 syn-
hetic peptides, whereas the sixty 20-mer peptides over-apping by 10 residues, covering core and NS4 HCV-1equence, were pooled in 19 mixtures, each containing– 4 synthetic peptides. The 20-mers and recombinantCV antigens (core, E2, NS3, NS4, and NS5) were used
or ex vivo analysis, whereas 15-mer peptides were used toenerate T-cell lines by stimulating PBMCs at 1 �g/mLith the addition of interleukin-2 (20 U/mL) at day 3. Atay 12 the T-cell lines were washed extensively and split
nto 2 wells for the ELISPOT assay.HCV-specific T-cell responses were analyzed by ELISPOT
n overnight stimulation of PBMCs (ex vivo analysis) or-cell lines (in vitro analysis) with individual peptide mix-
ures (1 �mol/L of each peptide) or recombinant antigens2.5 �g/mL). Briefly, 96-well plates (Multiscreen-IP; Milli-ore, Molsheim, France) were coated overnight at 4°C, asecommended by the manufacturer, with 5 �g/mL capture
ouse anti-human IFN-� monoclonal antibody (1 DIK;abtech, Stockholm, Sweden). Plates then were washed 4
imes with phosphate buffered saline (PBS) and blockedith RPMI 1640/10% fetal calf serum for 2 hours at 37°C.BMCs (2 � 105) or T cells (3– 4 � 104) from short-termolyclonal T-cell lines were seeded per well in duplicateor each individual peptide mixture or antigen. Thelates were incubated for 18 hours at 37°C in the pres-nce or absence of peptides. After washing 7 times withBS/0.05% Tween 20, a biotinylated secondary mousenti-human IFN-� monoclonal antibody (1 �g/mL,B6-1; Mabtech) was added. After 3 hours of incubation atoom temperature and 4 washing steps (PBS/0.05% Tween0), 100 �L of goat alkaline phosphatase–conjugated anti-iotin antibody (Vector Laboratories Inc, Burlingame, CA)ere added and the plates were incubated for an additionalhours at room temperature. Plates then were washedtimes (PBS/0.05% Tween 20), and 100 �L of alkaline
hosphatase conjugate substrate (5-bromo-4-chloro-3-
ndolyl phosphate; Bio-Rad, Hercules, CA) were added.
AsaEiIcccchwmlsb
twarnftuyfC1tvtwC
iimstmffaraPaf
Aiat
fimdtTamo
ftfTvRruapfpFiat(HsadwpAc
gauvataa(Ti
aCc
CLIN
ICA
L–LIVER
,PA
NCREA
S,A
ND
BILIA
RY
TRA
CT
1136 PILLI ET AL GASTROENTEROLOGY Vol. 133, No. 4
fter 5–10 minutes, the colorimetric reaction wastopped by washing with distilled water. Plates wereir-dried, and spots were counted using an automatedLISPOT reader (AID ELISPOT Reader System; Auto-
mmun Diagnostika GmbH, Strassberg, Germany).FN-�–producing cells were expressed as spot-formingells per well. The number of specific IFN-�–secretingells was calculated by subtracting the unstimulatedontrol value from the stimulated sample. Positiveontrols consisted of PBMCs stimulated with phyto-emagglutinin. Wells were considered positive if theyere at least twice the number of spots generated withedium alone and the difference between the stimu-
ated and nonstimulated wells was greater than 10pots for ex vivo analysis and at least 1.5 times aboveackground for analysis of T-cell lines.
Statistical AnalysisData were analyzed with nonparametric tests. Pre-
reatment values of frequencies of HCV-specific CD8 cellsere compared with each time point during treatmentnd at follow-up evaluation with Wilcoxon signed-anked tests for paired data, whereas frequencies of sig-ificant proliferative T-cell responses during treatment or
ollow-up evaluation were compared with baseline by �2
est. At each time point, group differences were testedsing the Mann–Whitney U test. Linear regression anal-sis using the Spearman correlation coefficient was per-ormed to correlate proliferative T-cell responses andD8 cell responses to the HCV-RNA slope between daysand 29 and to correlate HCV viremia before treatment
o the frequency of tetramer-positive CD8 cells after initro expansion. A 2-tailed P value of .05 or less was usedo determine statistical significance. Statistical analysesere performed using SPSS software version 9 (SPSS, Inc,hicago, IL).
ResultsCorrelation Between HCV-Specific CD4 andCD8 T-Cell Responses and Viral KineticsTo evaluate if the type of viral kinetics was
nfluenced by the behavior of the T-cell response, wenitially studied possible correlations between first-
onth viral decay and early modifications of HCV-pecific CD4 and CD8 T-cell responses induced byherapy. Because all patients received the same treat-
ent during the first 6 weeks, this analysis was per-ormed on a homogeneous study population with datarom weeks �4 and �2 before treatment and weeks 2nd 4 after the start of therapy. Proliferative T-cellesponses were analyzed in 22 and CD8 responses werenalyzed in 27 genotype-1–infected patients (Table 1).atients analyzed for HCV-specific CD8 responses werell HLA-A2 or HLA-A3 positive because peptides used
or CD8 analysis corresponded to HLA-A2 and HLA- T3–restricted epitopes. HCV-specific CD8 cells weredentified by HLA– class I tetramer staining ex vivo andfter short-term (10 days) in vitro expansion (short-erm T-cell lines).
The modifications of the T-cell response from baselinerst were analyzed in relation to the slope of viremiaeasured between days 1 and 29, which reflects the
ifferent classes of viral kinetics. No significant correla-ion was found between viral decay and proliferative-cell responses to structural and nonstructural HCVntigens or between viral decay and CD8 cell frequencieseasured ex vivo and after in vitro expansion by tetramer
r IFN-� intracellular staining (Figure 1).Proliferative T-cell responses and HCV-specific CD8
requencies detected before and during the first month ofherapy then were compared between patients with dif-erent viral kinetics to assess whether different levels of-cell response were associated with different types ofiral decline. Proliferative T-cell responses analyzed in 13VR patients were not significantly different from the
esponses detected in 9 patients who were not RVR (Fig-re 2A). In contrast, a significant difference between RVRnd non-RVR patients was observed at 2 of the 4 timeoints tested (weeks �1 and 2) for ex vivo CD8 T-cellrequency in HLA-A2 or HLA-A3–positive patients com-aring 12 RVR with 15 non-RVR patients (Table 1 andigure 2). Ex vivo frequency of CD8 cells specific for
ndividual HLA-A2 and HLA-A3–restricted epitopes waslways greater in RVR than in non-RVR, with the excep-ion of a HLA-A2 (NS5 2594-2602) and an HLA-A3NS41858-1867) epitope (data not shown). When
LA-A2 and HLA-A3–positive patients were analyzedeparately because of the different number of HLA-A2nd HLA-A3 tetramers used for their study, significantifferences between RVR and non-RVR were detected ateeks �1 (P � .02) and 2 (P � .01) among HLA-A2–ositive patients. Because of the limited number of HLA-3–positive patients, differences did not reach signifi-ance within this group.
Although HCV-specific CD8 frequencies were alwaysreater in RVR, they were not enhanced by therapy evenmong patients with rapid kinetics of viral decline (Fig-re 2B). These ex vivo results also were confirmed after initro expansion, with significant differences between RVRnd non-RVR patients at week 2 (Figure 2C). In line withhese results, a better production of IFN-� by CD8 cellsfter in vitro peptide stimulation was detected in RVR,lthough differences did not reach statistical significanceFigure 2D). Tetramer staining of PBMCs and short-term-cell lines of representative RVR and non-RVR patients
s shown in Figure 3 (upper panels).Eleven RVR patients and 10 non-RVR patients were
nalyzed for HCV-specific cytotoxic activity. CytotoxicD8 responses were detectable more frequently in RVR
ompared with non-RVR patients in whom no cytotoxic
-cell response could be detected at any time point (Fig-
uonC
dpIedwgc4tvbw
drTslotstcchr(
cT
Ftsttamdoa
CLI
NIC
AL–
LIV
ER,
PA
NCREA
S,A
ND
BIL
IARY
TRA
CT
October 2007 VIRAL KINETICS AND HCV–SPECIFIC T–CELL RESPONSE 1137
re 2E). Minimal differences, with no specific trend, werebserved by comparing patients with different viral ki-etics with respect to perforin expression by HCV-specificD8 cells after in vitro expansion (not shown).
ELISPOT Analysis of Early T-Cell ResponsesAfter Start of TherapyGiven the lack of HCV-specific T-cell restoration
uring the first month of therapy in RVR, as detected byroliferation assays and by tetramer and intracellularFN-� staining with a limited set of peptides, the possibleffect of T-cell responses on the kinetics of the early viralecline was assessed further by IFN-� ELISPOT analysisith a more comprehensive set of reagents in a selectedroup of 10 genotype-1 RVR patients for whom a suffi-ient number of frozen PBMCs were available from weeks
and 1 before treatment and weeks 2, 4, and 8 duringreatment. Six of these RVR patients were tested by exivo IFN-� ELISPOT on PBMC stimulation with recom-inant HCV proteins (core, E2, NS3, NS4, and NS5) and
igure 1. Correlation between HCV-specific proliferative or CD8-mereatment (slope of HCV-RNA decay days 1–29). For proliferative respontart of therapy were summed and the resulting value was subtractedreatment. Each value then was plotted against the corresponding valuhe steepness of the line defined by the viral load measurements betweenalyzed ex vivo or after in vitro expansion (C) and frequencies of HCVonth of treatment subtracted from the CD8 cell frequencies and IFN-ecay. Therefore, each dot represents the modification of the HCV-specf treatment. None of the linear regressions were statistically significantnd HLA-A3–restricted peptides were used for CD8 analysis.
ith panels of 20-mer peptides overlapping by 10 resi- r
ues and corresponding to the entire core and NS4egions of genotype-1. Because no detectable increase of-cell reactivity was observed ex vivo during therapy (not
hown), T-cell responses were analyzed further in 4 se-ected genotype-1 RVR patients by ELISPOT after 10 daysf in vitro expansion with wider panels of 15-mer pep-ides overlapping by 10 residues and spanning the entiretructural and nonstructural HCV sequences of geno-ype-1. Responses were dissected further by intracellularytokine staining to define CD4 and CD8 T-cell subsetontribution. Even by this additional and more compre-ensive approach no significant increase of the T-celleactivity was detected during the first month of therapyFigure 4).
Early HCV-Specific CD8 T-Cell Response inRelation to the Outcome of TherapyBecause the type of treatment applied after week 6
ould have affected the behavior of the HCV-specific-cell response, we limited the analysis of the T-cell
T-cell responses and slope of viral decay during the first month ofA), SI values obtained with recombinant proteins at weeks 2 and 4 afterthe value obtained by summing SI values of weeks �2 and �4 beforeiral decay. Viral decay was calculated by the slope formula expressings 1 and 29 of treatment. Similarly, (B) HCV-specific CD8 cell frequenciescific IFN-�–positive CD8 cells obtained in each patient during the firstponses measured before treatment (D) also were plotted against viral-cell response in relation to the decay of viral load during the first monthrman correlation coefficient). HLA class-I tetramers as well as HLA-A2
diatedses (
frome of vn day-spe� resific T(Spea
esponse according to outcome to the first month of

tvlcceartpICnwttapetussSc
flpp
acptsSHr.(in(
tptp
Fkopp(steTs tatisti
CLIN
ICA
L–LIVER
,PA
NCREA
S,A
ND
BILIA
RY
TRA
CT
1138 PILLI ET AL GASTROENTEROLOGY Vol. 133, No. 4
reatment, with the exclusion of patients with an unfa-orable outcome (nonresponders and relapsers) receivingess than the standard treatment and patients who dis-ontinued treatment. Treatment individualization alsoould affect the rate of sustained response, thereby influ-ncing the possible correlation between T-cell responsend outcome of therapy. In practice, however, the sameate of sustained virologic response (SVR) was detected inhe overall patient population of the clinical trial (270atients) comparing patients who received STD and IDV.n view of this lack of effect on outcome, HCV-specificD8 cell frequencies were compared in 12 SVR and 10on-SVR patients. Ex vivo CD8 frequencies generallyere greater in SVR rather than in non-SVR patients, but
he difference was not statistically significant because ofhe exceptionally high frequency of CD8 cells specific forn individual HLA-A2–restricted epitope in a non-SVRatient (Figure 5A). Instead, a significantly greater CD8xpansion (Figure 5B) and a better IFN-� productionhat, however, did not reach statistical significance (Fig-re 5C) were observed in the SVR on restimulation ofhort-term T-cell lines. Tetramer staining of PBMCs andhort-term T-cell lines of representative SVR and non-VR patients is shown in Figure 3 (lower panels). Signifi-
igure 2. HCV-specific proliferative and CD8-mediated T-cell responseinetics. (A) Frequency of significant (SI � 3) proliferative T-cell responsen all tests performed at each time point, (B) frequency of HCV-specifiatients), (D) frequency of IFN-�–positive CD8 cells on restimulation oositive cytotoxic T-cell responses (showing at least 10% of specific targ
62 derived from RVR and 42 from non-RVR patients) were tested. Freignificantly different (�2 analysis). □ and Œ, T-cell responses in RVRetramer-positive cells measured ex vivo at week �1 (P � .01) and weekxpansion at week 2 (P � .05) were significantly different in RVR and non-cell responses, whereas HLA class-I tetramers and HLA-A2 and HLtaining values below the cut-off level were considered equal to 0 for s
ant cytotoxic T-cell responses (target lysis � 10%), per- e
ormed in 10 SVR and in 7 non-SVR patients (78 CTLines tested, 52 derived from SVR and 26 from non-SVRatients) were positive only at week 2 of treatment in SVRatients (4% of the CTL lines tested) (not shown).To exclude any possible effect of treatment individu-
lization on treatment outcome, the analysis of the CD8ell response also was restricted to 8 SVR and 3 non-SVRatients who received the standard treatment. Even withhis more stringent selection, CD8 cell frequencies mea-ured ex vivo were greater in SVR compared with non-VR patients, and a significantly greater expansion ofCV-specific CD8 cells was observed in SVR patients on
estimulation of short-term T-cell lines (week �4, P �05; week �1, P � .005; week 2, P � .01; week 4, P � .05)data not shown). Also in this case, IFN-� production byn vitro expanded CD8 cells was greater in SVR than inon-SVR patients, but the difference was not significant
not shown).Moreover, a significant difference in the frequency of
etramer-positive CD8 cells measured after in vitro ex-ansion also was detected at the time points beforereatment (weeks �4 and �1, P � .01) among HLA-A2–ositive patients, when statistical analysis was performed
ore and during the first month of treatment in patients with different viralted in 22 patients with 4 different recombinant HCV proteins) calculated
cells ex vivo, and (C) after 10 days of in vitro expansion (tested in 27rt-term T-cell lines (tested in 27 patients), and (E) mean frequency ofis, tested in 22 patients) are illustrated. For CTL analysis, 104 CTL linescies of positive cytotoxic tests in RVR and non-RVR patients were notnts, � and �, T-cell responses in non-RVR patients. Frequencies of� .01) and frequencies of tetramer-positive cells measured after in vitropatients. Recombinant HCV proteins were used to analyze proliferative
–restricted peptides were used for CD8 analysis. Tetramer and IFN-�cal analysis (Mann–Whitney).
s befs (tesc CD8f shoet lysquenpatie2 (P
-RVRA-A3
xcluding HLA-3–restricted CD8 responses.
mt
rwtoatbai�oapfba
le
Fvst ith te
FPosEp(stito
CLI
NIC
AL–
LIV
ER,
PA
NCREA
S,A
ND
BIL
IARY
TRA
CT
October 2007 VIRAL KINETICS AND HCV–SPECIFIC T–CELL RESPONSE 1139
None of the analyzed parameters showed an improve-ent under therapy compared with the pretreatment
ime points in SVR and in non-SVR patients.
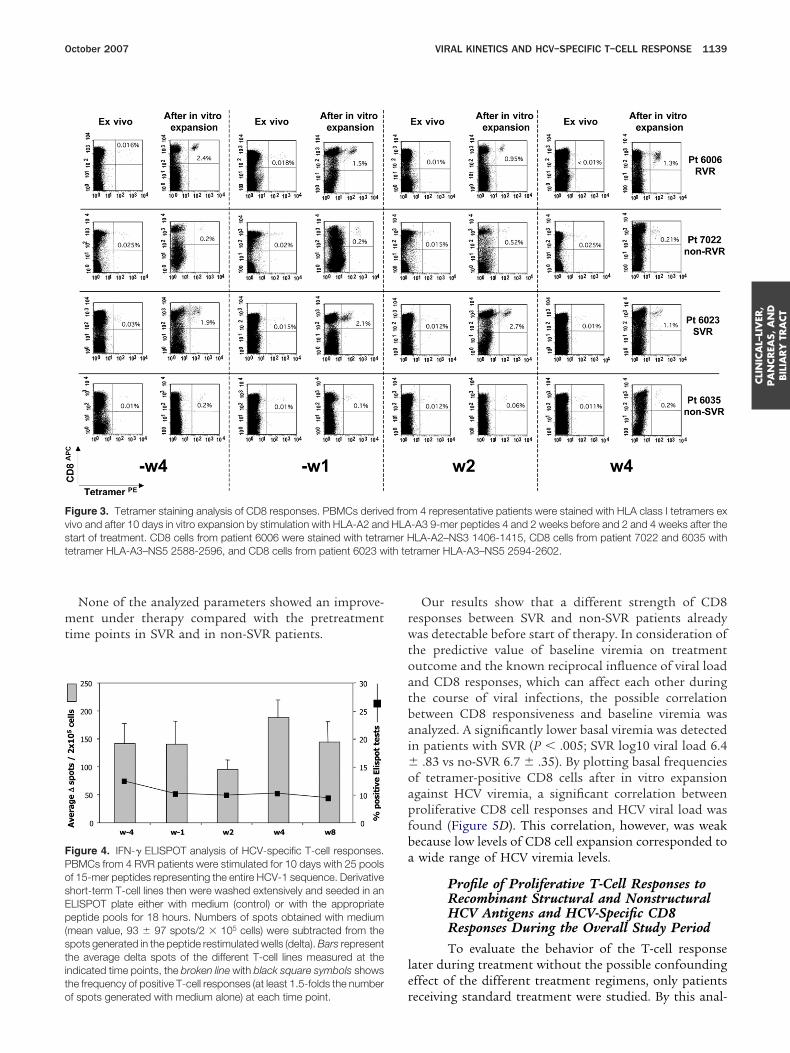
igure 3. Tetramer staining analysis of CD8 responses. PBMCs deriveivo and after 10 days in vitro expansion by stimulation with HLA-A2 andtart of treatment. CD8 cells from patient 6006 were stained with tetraetramer HLA-A3–NS5 2588-2596, and CD8 cells from patient 6023 w
igure 4. IFN-� ELISPOT analysis of HCV-specific T-cell responses.BMCs from 4 RVR patients were stimulated for 10 days with 25 poolsf 15-mer peptides representing the entire HCV-1 sequence. Derivativehort-term T-cell lines then were washed extensively and seeded in anLISPOT plate either with medium (control) or with the appropriateeptide pools for 18 hours. Numbers of spots obtained with medium
mean value, 93 � 97 spots/2 � 105 cells) were subtracted from thepots generated in the peptide restimulated wells (delta). Bars representhe average delta spots of the different T-cell lines measured at thendicated time points, the broken line with black square symbols showshe frequency of positive T-cell responses (at least 1.5-folds the number
rf spots generated with medium alone) at each time point.
Our results show that a different strength of CD8esponses between SVR and non-SVR patients alreadyas detectable before start of therapy. In consideration of
he predictive value of baseline viremia on treatmentutcome and the known reciprocal influence of viral loadnd CD8 responses, which can affect each other duringhe course of viral infections, the possible correlationetween CD8 responsiveness and baseline viremia wasnalyzed. A significantly lower basal viremia was detectedn patients with SVR (P � .005; SVR log10 viral load 6.4
.83 vs no-SVR 6.7 � .35). By plotting basal frequenciesf tetramer-positive CD8 cells after in vitro expansiongainst HCV viremia, a significant correlation betweenroliferative CD8 cell responses and HCV viral load wasound (Figure 5D). This correlation, however, was weakecause low levels of CD8 cell expansion corresponded towide range of HCV viremia levels.
Profile of Proliferative T-Cell Responses toRecombinant Structural and NonstructuralHCV Antigens and HCV-Specific CD8Responses During the Overall Study PeriodTo evaluate the behavior of the T-cell response
ater during treatment without the possible confoundingffect of the different treatment regimens, only patients
m 4 representative patients were stained with HLA class I tetramers ex-A3 9-mer peptides 4 and 2 weeks before and 2 and 4 weeks after theLA-A2–NS3 1406-1415, CD8 cells from patient 7022 and 6035 with
tramer HLA-A3–NS5 2594-2602.
d froHLA
mer H
eceiving standard treatment were studied. By this anal-

ypspactpnfctAv(sttt6aIl
lmti4
tptwCbrhttcgc
FtpF4twa re co
CLIN
ICA
L–LIVER
,PA
NCREA
S,A
ND
BILIA
RY
TRA
CT
1140 PILLI ET AL GASTROENTEROLOGY Vol. 133, No. 4
sis, 13 and 12 patients were analyzed for their profile ofroliferative T-cell responses and HCV-specific CD8 re-ponses, respectively. Because of the limited number ofatients analyzed, results are illustrated pooling togetherll patients without distinction of viral kinetics and out-ome of therapy. The frequency of significant prolifera-ive T-cell responses (SI � 3) detected at individual timeoints showed a late increase at week 36, however, it didot reach statistical significance (Figure 6A). Ex vivo
requencies of circulating HCV-specific CD8 cells did nothange significantly during the time of treatment andheir values were comparable with baseline (Figure 6B).n increase in HCV-specific CD8 cell frequencies after initro expansion instead was detected at weeks 8 and 12Figure 6C); these modifications, however, did not reachtatistical significance. Because of PBMC limitations, cy-otoxicity was tested in 9 patients who received standardreatment. The cytotoxic activity improved at the latestime point measured during treatment (week 36) (FigureD), as a possible result of a late recovery of this functionfter a sufficiently long and stable control of viremia.FN-� production on restimulation of short-term T-cell
igure 5. HCV-specific CD8 cell response measured before and durinreatment outcomes. Frequencies of HCV-specific CD8 cells measuredatients (Œ) are shown. (C) Frequencies of IFN-�–positive CD8 cells in srequencies of tetramer-positive cells measured after in vitro expansion(P � .05) were significantly different in SVR and non-SVR patients
etramer-positive CD8 cells after in vitro expansion was plotted against Here used to analyze proliferative T-cell responses, whereas HLA class-nalysis. Tetramer and IFN-� staining values below the cut-off level we
ines was not increased by treatment (Figure 6E). This h
ack of IFN-� increase on antigen-specific stimulationay be the result of an inhibitory effect of pegylated-IFN
reatment, as suggested by the reduction of IFN-�–secret-ng CD8 cells observed on mitogen stimulation at weeks, 8, 12, and 36 (Figure 6F).
DiscussionSeveral studies have been conducted to analyze
he behavior of the cell-mediated immune response inatients with chronic HCV infection undergoing IFN-alfaherapy.8 –17,21–23 Conflicting results have been reportedith respect to the effect of therapy on HCV-specificD4- and CD8-mediated responses. A close associationetween enhancement of the HCV-specific CD4 T-cellesponse, fast viral decline, and sustained viral responseas been shown in a large study of patients treated withhe pegylated form of IFN, but less clearly in patientsreated with the recombinant not pegylated IFN mole-ule.11 Although a great part of the literature10,22,23 is ineneral agreement with this study, these results were notonfirmed by another report that not only analyzed the
first month of treatment in genotype-1–infected patients with differentx vivo or on (B) short-term T-cell lines in 12 SVR (�) and 10 non-SVRterm T-cell lines derived from 11 SVR (�) and 9 non-SVR patients (Œ).eek �4 (P � .005), week �1 (P � .005), week 2 (P � .001), and weekn–Whitney U test). (D) The basal (weeks �4 and �1) frequency of
iral load measured at the same time points. Recombinant HCV proteinsmers and HLA-A2 and HLA-A3–restricted peptides were used for CD8nsidered equal to 0 for statistical analysis (Mann–Whitney).
g the(A) e
hort-at w(ManCV v
I tetra
elper but also the cytotoxic T-cell response.12 In this

sonmTitwflttdte
cIstitpr
a6tilmeifitp
datRaarEut
Ffpclrir
CLI
NIC
AL–
LIV
ER,
PA
NCREA
S,A
ND
BIL
IARY
TRA
CT
October 2007 VIRAL KINETICS AND HCV–SPECIFIC T–CELL RESPONSE 1141
tudy an enhancement of the T-cell response was shownnly in a proportion of the patients and this increase didot correlate with the virologic response. Moreover, inore recent studies16,17 an enhancement of the CD4-cell response was observed mainly in genotype non–1
nfected patients, who showed also significant prolifera-ive T-cell responses more frequently when HCV RNAas cleared more rapidly during antiviral therapy. Con-icting results also have been reported with respect to theiming of enhancement of the T-cell response duringreatment. Only in few studies10,11 was this enhancementetected within the first month of therapy, supportinghe concept that the cellular immune response can influ-nce the second slope of viral decline.
To shed further light on the possible role played by theellular immune response in HCV control induced byFN-alfa/ribavirin therapy, we first analyzed the relation-hip between first-month viral decay and T-cell responseo define to what extent the host’s immune response cannfluence viral kinetics in individual patients. To addresshis issue, HCV RNA was quantified at frequent timeoints during the first month and HCV-specific T-cell
igure 6. HCV-specific proliferative and CD8-mediated T-cell responollow-up period in patients randomized to the standard treatment. (A) Fatients. Average frequencies of tetramer-positive CD8 cells measuredells were not detected by tetramer staining, both ex vivo and after short
ysis � 10%) cytotoxic T-cell responses (analyzed on 38 in vitro expanestimulation of short-term T-cell lines are shown. (F) The effect of mitogs shown. Recombinant HCV proteins were used to analyze proliferativeestricted peptides were used for CD8 analysis.
esponses were analyzed by different parameters of CD4 d
nd CD8 reactivity. This analysis was focused on the firstweeks of therapy when all patients received the same
reatment. An additional objective was to define possiblemmunologic correlates of response to therapy by ana-yzing all parameters in relation to the outcome of treat-
ent. To avoid the possible confounding effect of differ-nt treatments applied after 6 weeks on individualmmune responses, this analysis also was limited to therst 6 weeks of therapy and was conducted not only onhe whole population but also was restricted to thoseatients receiving the standard of treatment.No significant correlation between CD4- or CD8-me-
iated responses and viral decay was observed (Figure 1),nd T-cell responses did not increase significantly afterherapy compared with the pretreatment period even inVR patients. Because the low sensitivity of the prolifer-tion assays and the limited set of peptides used for CD8nalysis may have caused underestimation of the T-celleactivity, T-cell responses also were assessed by IFN-�LISPOT both ex vivo and after T-cell expansion in vitrosing more comprehensive panels of peptides spanninghe entire HCV sequence. Also by this approach, the early
before treatment, during the whole treatment period, and during theency of significant (SI � 3) proliferative T-cell responses analyzed in 13x vivo and (C) after in vitro expansion in 12 patients. HCV-specific CD8in vitro expansion, in only 2 patients. (D) Frequency of significant (target-cell lines) and (E) average frequencies of IFN-�–positive CD8 cells ontimulation on IFN-� production by CD8 cells, performed in 11 patients,ll responses, whereas HLA class-I tetramers and HLA-A2 and HLA-A3
sesrequ(B) e-termded Ten sT-ce
ecline of viremia was not associated with a restoration
opewciArttm
hCtscoeHwetwwLflwaCtrcbTt
bTHoSpaesesHits1ib
anTsccctT
ritresrlmbbiHHstibssSTIoca
CLIN
ICA
L–LIVER
,PA
NCREA
S,A
ND
BILIA
RY
TRA
CT
1142 PILLI ET AL GASTROENTEROLOGY Vol. 133, No. 4
f HCV-specific T-cell reactivity, thereby failing to sup-ort a role for T-cell responses in determining the type ofarly HCV kinetics. A mild increase of the T-cell responseas detected only later during treatment, supporting the
oncept that recovery of the HCV-specific T-cell functions the consequence rather than the cause of viral decline.
late recovery of the CD4 and CD8 T-cell response mayepresent a factor contributing to the need for a 48-weekreatment in the majority of genotype-1–infected pa-ients, and suggests the possibility that even longer treat-
ents could be beneficial in a subset of these patients.Another interesting observation of our study was the
igher capacity of in vitro expansion of HCV-specificD8 cells in RVR and SVR patients before and during
reatment. This result suggests a minor degree of HCV-pecific T-cell dysfunction in these patients. Thus, in ourohort of genotype-1–infected patients, a higher capacityf in vitro expansion of HCV-specific CD8 cells appar-ntly was predictive of a favorable outcome of therapy.owever, because treatment was individualized aftereek 6, the predictive value of this immunologic param-
ter must be confirmed in larger studies designed withhis specific aim. Moreover, this better T-cell functionas associated with lower levels of baseline viremia,hich is known to favor a sustained response to therapy.ow rates of virus replication also may allow a better CD8unction by diminishing the effect of the negative regu-atory mechanisms responsible for T-cell dysfunction,hich include exhaustion by persistent exposure to highntigen doses, emergence of escape variants able to evadeD8 surveillance, suppression by regulatory T cells able
o block the effector function of the adaptive T-cellesponse, and impaired accessory function by dendriticells. Low rates of virus replication, however, can equallye the result, rather than the cause, of a more efficient-cell response able to keep the virus under better con-
rol.As in previous studies of this kind, our work can be
iased by several limitations. First, the HCV-specific CD8-cell response was examined with a panel of preselectedLA A2- and HLA-A3–restricted epitopes that provides
nly a partial picture of the antiviral CD8 T-cell response.econd, the antigenic peptide sequences were based on arototypic HCV-1 (genotype 1a) sequence, rather thanutologous virus in individual patients. However, thesepitopes were selected on the basis of immunogenicityhown in previous studies (http://hcv.lanl.gov),24 and allxcept 2 patients responded to at least one peptide in ourtudy. Furthermore, the results were unchanged whenCV-specific T-cell response was measured more globally
n selected patients using a panel of peptides spanninghe entire HCV sequence. Third, even if the clinical re-ults of the entire trial, which enrolled 178 genotype–infected patients, showed that the effect of treatment
ndividualization did not substantially change SVR rates
etween IDV and STD arms,18 the different regimensssigned after 6 weeks of therapy according to viral ki-etics may have influenced the outcome of the treatment.herefore, even if we observed a greater capacity of HCV-
pecific CD8 cell expansion in SVR patients, definitiveonclusions cannot be drawn on this point. Finally, weannot exclude the possibility that earlier relevanthanges of HCV-specific T-cell responses occurred withinhe liver because our study was performed on circulating
cells.In conclusion, our study was aimed at assessing the
ole of the cell-mediated immune response in determin-ng the profile of the early viral kinetics. Our data suggesthat IFN-alfa/ribavirin therapy is unable to induce aapid restoration of an efficient adaptive T-cell response,ven in RVR patients. Indeed, improvement of thetrength and the function of the HCV-specific T-cellesponse was mild and detectable late during treatment,ikely favored by HCV clearance. This lack of improve-
ent during the first 4 months of therapy compared withaseline may suggest that infected cell loss, which haseen assumed to affect the second slope of viral decline,
s caused by natural cell turnover or by noncytolyticCV-RNA clearance,25 rather than being CD8 mediated.owever, we cannot totally exclude that the better re-
ponsiveness present at baseline in RVR patients irrespec-ive of therapy may have contributed to the faster kinet-cs of viral decline and also to a favorable outcomeecause rapid viral kinetics is associated strictly with austained viral response. Finally, the finding that HCV-pecific CD8 responses are more efficient in RVR andVR patients suggests that restoration of a more efficient-cell response in nonresponder patients before starting
FN-alfa/ribavirin therapy may represent an importantbjective of future immune therapeutic strategies thatould in this way complement efficiently the effect ofntiviral drugs acting as replication inhibitors.
References
1. Manns MP, McHutchison JG, Gordon SC, et al. Peginterferonalpha-2b plus ribavirin compared with interferon alpha-2b plusribavirin for initial treatment of chronic hepatitis C: a randomisedtrial. Lancet 2001;358:958–965.
2. Fried MW, Shiffman ML, Reddy KR, et al. Peginterferon alpha-2aplus ribavirin for chronic hepatitis C virus infection. N Engl J Med2002;347:975–982.
3. Hadziyannis SJ, Sette H Jr, Morgan T, et al. Peginterferon al-pha-2a (40 kD) and ribavirin combination therapy in chronic hep-atitis C: randomized study of the effect of treatment duration andribavirin dose. Ann Intern Med 2004;140:346–355.
4. Neumann AU, Lam NP, Dahari H, et al. Hepatitis C viral dynamicsin vivo and the antiviral efficacy of interferon-alpha therapy. Sci-ence 1998;282:103–107.
5. Zeuzem S, Herrmann E, Lee JH, et al. Viral kinetics in patientswith chronic hepatitis C treated with standard or peginterferonalpha2a. Gastroenterology 2001;120:1438–1447.
6. Perelson AS, Herrmann E, Micol F, et al. New kinetic models forthe hepatitis C virus. Hepatology 2005;42:749–754.
7. Thomas H, Foster G, Platis D. Mechanisms of action of interferon
and nucleoside analogues. J Hepatol 2003;39:S93–S98.
1
1
1
1
1
1
1
1
1
1
2
2
2
2
2
2
MPf
mrcsRc
PP
CLI
NIC
AL–
LIV
ER,
PA
NCREA
S,A
ND
BIL
IARY
TRA
CT
October 2007 VIRAL KINETICS AND HCV–SPECIFIC T–CELL RESPONSE 1143
8. Brinkmann V, Geiger T, Alkan S, et al. Interferon alpha increasesthe frequency of interferon gamma-producing human CD4� T-cells. J Exp Med 1993;178:1655–1663.
9. Tam RC, Pai B, Bard J, et al. Ribavirin polarizes human T-cellresponses towards a type 1 cytokine profile. J Hepatol 1999;30:376–382.
0. Cramp ME, Rossol S, Chokshi S, et al. Hepatitis C virus-specificT-cell reactivity during interferon and ribavirin treatment in chronichepatitis C. Gastroenterology 2000;118:346–355.
1. Kamal SM, Fehr J, Roesler B, et al. Peginterferon alone or withribavirin enhances HCV-specific CD4 T-helper 1 responses inpatients with chronic hepatitis C. Gastroenterology 2002;123:1070–1083.
2. Barnes E, Harcourt G, Brown D, et al. The dynamics of T-lympho-cyte responses during combination therapy for chronic hepatitisC virus infection. Hepatology 2002;36:743–754.
3. Kamal SM, Ismail A, Graham CS, et al. Pegylated interferon atherapy in acute hepatitis C: relation to hepatitis C virus-specificT-cell response kinetics. Hepatology 2004;39:1721–1731.
4. Rahman F, Heller T, Sobao Y, et al. Effects of antiviral therapy onthe cellular immune response in acute hepatitis C. Hepatology2004;40:87–97.
5. Tang KH, Herrmann E, Cooksley H, et al. Relationship betweenearly HCV kinetics and T-cell reactivity in chronic hepatitis Cgenotype-1 during peginterferon and ribavirin therapy. J Hepatol2005;43:776–782.
6. Kaplan DE, Sugimoto K, Ikeda F, et al. T-cell response relative togenotype and ethnicity during antiviral therapy for chronic hepa-titis C. Hepatology 2005;41:1365–1375.
7. Hultgren C, Desombere I, Leroux-Roels G, et al. Evidence for arelation between the viral load and genotype and hepatitis Cvirus-specific T cell responses. J Hepatol 2004;40:971–978.
8. Zeuzem S, Pawlotsky JM, Lukasiewicz E, et al, DITTO-HCV StudyGroup. International, multicenter, randomized, controlled study com-paring dynamically individualized versus standard treatment in pa-tients with chronic hepatitis C. J Hepatol 2005;43:250–257.
9. Yusim K, Richardson R, Tao N, et al. The Los Alamos hepatitis C
immunology database. Appl Bioinformatics 2005;4:217–225. s0. Penna A, Chisari FV, Bertoletti A, et al. Cytotoxic T lymphocytesrecognize an HLA A2 restricted epitope within the hepatitis Bvirus nucleocapsid antigen. J Exp Med 1991;174:1565–1570.
1. Morishima C, Polyak SJ, Ray R, et al, Hepatitis C Antiviral Long-Term Treatment Against Cirrhosis Trial Group. Hepatitis C virus-specific immune responses and quasi-species variability at base-line are associated with nonresponse to antiviral therapy duringadvanced hepatitis C. J Infect Dis 2006;193:931–940.
2. Missale G, Cariani E, Lamonaca V, et al. Effects of interferontreatment on the antiviral T-cell response in hepatitis C virusgenotype-1b- and genotype 2c-infected patients. Hepatology1997;26:792–797.
3. Lasarte JJ, Garcia-Granero M, Lopez A, et al. Cellular immunity tohepatitis C virus core protein and the response to interferon inpatients with chronic hepatitis C. Hepatology 1998;28:815–822.
4. Yusim K, Richardson R, Tao N, et al. The Los Alamos hepatitis Cimmunology database. Appl Bioinformatics 2005;4:217–225.
5. Perelson AS, Herrmann E, Micol F, et al. New kinetic models forthe hepatitis C virus. Hepatology 2005;42:749–754.
Received September 21, 2006. Accepted June 14, 2007.Address requests for reprints to: Gabriele Missale, MD, Divisionealattie Infettive ed Epatologia, Azienda Ospedaliera e Universitaria diarma, Via Gramsci 14, 43100 Parma, Italy. e-mail: [email protected];
ax: (39) 0521-703857.Supported by the European Community (QLK2-2000-00836), Hoff-ann La-Roche, and Maxim Pharmaceuticals. J–M.P. has received
esearch grants from Roche and is an advisor of Roche; S.Z. is aonsultant for Roche and Schering-Plough; S.W.S. has received re-earch grants from Roche and Schering-Plough. A.N. is a consultant foroche, Schering-Plough, and Human Genome Sciences and has re-eived research grants from Roche and Human Genome Sciences.The authors thank Professor Giuliano Sansebastiano (University of
arma, Italy) and Dr Paolo Sgargi (Azienda Ospedaliero-Universitaria diarma, Italy) for helpful discussion regarding data elaboration and
tatistical analysis.