Insulin Resistance as a Predictor of Early Virologic Response to HCV Therapy Among Chronic HCV...
13
Journal of Medical Virology 87:428–440 (2015) Insulin Resistance as a Predictor of Early Virologic Response to HCV Therapy Among Chronic HCV Egyptian Patients Ekram W. Abd El-Wahab, 1 * Ashraf Mikheal, 1,2 Fathallah Sidkey, 3 and Hanan Z. Shatat 1 1 Tropical Health Department, High Institute of Public Health, Alexandria University, Egypt 2 Damanhour Fever Hospital, Ministry of Health and Population, Damanhour, Egypt 3 Department of Internal Medicine, Faculty of Medicine, Alexandria University, Egypt Prior assessment of insulin resistance by HOMA-IR is emerging as an important mile- stone in the treatment of patients with chronic hepatitis C. This cost-effective tool is recom- mended to individualize treatment duration, or to exclude those with low insulin sensitivity from being treated until ameliorating their state of insulin resistance (IR). The present work aims to elucidate further the effect IR state on early viral kinetic response to Chronic hepatitis C virus (HCV) therapy and the impact of HCV treatment and viral eradication on insulin sensi- tivity. Insulin sensitivity was assessed using the HOMA-IR method. All enrolled patients were treated with a dual therapy (pegylated inter- feron-alpha plus ribavirin) for 48 weeks and evaluated using qRT-PCR for early virologic response as well as the impact of treatment on insulin sensitivity throughout the early period of therapy. Of a total 392 chronic HCV cases, early virologic response was achieved by 318 (81.1%). IR was detected in 241 (61.5%) chronic HCV patient of which 73.4% responded to treatment. Early virologic response among patients with > 2.18 HOMA-IR value were significantly lower than those with HOMA-IR values 2.18 (P < 0.0001). IR was significantly associated with high baseline BMI. Steatosis and fibrosis corre- lated with IR but neither independently pre- dicted early virologic response. Pretreatment IR < 2.18, low fasting blood glucose, low and intermediate HCV viral load, normal BMI, and non-smoking were independent factors associ- ated with early virologic response. IR interferes with early virologic response to the antiviral care. Clinical application of pretreatment HOMA-IR assessment could help in predicting early treatment outcome and thus enable treat- ment regimens to be optimized and individually tailored. J. Med. Virol. 87:428–440, 2015. # 2014 Wiley Periodicals, Inc. KEY WORDS: hepatitis C; antiviral combina- tion therapy; insulin resistance INTRODUCTION Chronic hepatitis C virus (HCV) infection affects approximately 200 million people worldwide, compris- ing 3% of global population and is currently the most frequent cause for liver transplantation in the United States and Europe [Lavanchy, 2009; Tsoulfas et al., 2009; Bostan and Mahmood, 2010; World Health Organization, 2013]. HCV infection is strongly associated with the development of insulin resistance (IR) and predis- pose to the onset of type-2 diabetes irrespective of liver disease severity through interactions with different components of the insulin signaling path- way or with factors involved in its regulation. [Decock et al., 2007; Badar et al., 2012; Bugianesi et al., 2012]. Growing evidence from several studies supports the central role of IR in response failure to antiviral therapy among HCV patients [Harrison, 2006; Decock et al., 2007; Parise and Oliveira, 2007; Dai et al., 2009; Grasso et al., 2009; Khattab et al., 2010; Vachon et al., 2011; Brandman et al., 2012; Ziada et al., 2012; Ismail, 2013]. IR is strongly implicated in liver fibrosis and contributes to fibrotic liver progression, steatosis, development of complica- tions, and response to HCV therapy [D’Souza et al., 2005; Svegliati-Baroni et al., 2007; Petta et al., Conflict of interest: The authors declare no conflict of interest. Correspondence to: Ekram W. Abd El- Wahab, Tropical Health Department, High Institute of Public Health, Alexandria University, Egypt. E-mail: [email protected] Accepted 1 October 2014 DOI 10.1002/jmv.24092 Published online in Wiley Online Library (wileyonlinelibrary.com). C 2014 WILEY PERIODICALS, INC.
Transcript of Insulin Resistance as a Predictor of Early Virologic Response to HCV Therapy Among Chronic HCV...
Journal of Medical Virology 87:428–440 (2015)
Insulin Resistance as a Predictor of Early VirologicResponse to HCV Therapy Among Chronic HCVEgyptian Patients
Ekram W. Abd El-Wahab,1* Ashraf Mikheal,1,2 Fathallah Sidkey,3 and Hanan Z. Shatat1
1Tropical Health Department, High Institute of Public Health, Alexandria University, Egypt2Damanhour Fever Hospital, Ministry of Health and Population, Damanhour, Egypt3Department of Internal Medicine, Faculty of Medicine, Alexandria University, Egypt
Prior assessment of insulin resistance byHOMA-IR is emerging as an important mile-stone in the treatment of patients with chronichepatitis C. This cost-effective tool is recom-mended to individualize treatment duration, orto exclude those with low insulin sensitivityfrom being treated until ameliorating their stateof insulin resistance (IR). The present work aimsto elucidate further the effect IR state on earlyviral kinetic response to Chronic hepatitis Cvirus (HCV) therapy and the impact of HCVtreatment and viral eradication on insulin sensi-tivity. Insulin sensitivity was assessed using theHOMA-IR method. All enrolled patients weretreated with a dual therapy (pegylated inter-feron-alpha plus ribavirin) for 48 weeks andevaluated using qRT-PCR for early virologicresponse as well as the impact of treatment oninsulin sensitivity throughout the early period oftherapy. Of a total 392 chronic HCV cases, earlyvirologic response was achieved by 318 (81.1%).IR was detected in 241 (61.5%) chronic HCVpatient of which 73.4% responded to treatment.Early virologic response among patients with> 2.18 HOMA-IR value were significantly lowerthan those with HOMA-IR values �2.18(P< 0.0001). IR was significantly associated withhigh baseline BMI. Steatosis and fibrosis corre-lated with IR but neither independently pre-dicted early virologic response. PretreatmentIR< 2.18, low fasting blood glucose, low andintermediate HCV viral load, normal BMI, andnon-smoking were independent factors associ-ated with early virologic response. IR interfereswith early virologic response to the antiviralcare. Clinical application of pretreatmentHOMA-IR assessment could help in predictingearly treatment outcome and thus enable treat-ment regimens to be optimized and individuallytailored. J. Med. Virol. 87:428–440, 2015.# 2014 Wiley Periodicals, Inc.
KEY WORDS: hepatitis C; antiviral combina-tion therapy; insulin resistance
INTRODUCTION
Chronic hepatitis C virus (HCV) infection affectsapproximately 200 million people worldwide, compris-ing 3% of global population and is currently the mostfrequent cause for liver transplantation in the UnitedStates and Europe [Lavanchy, 2009; Tsoulfas et al.,2009; Bostan and Mahmood, 2010; World HealthOrganization, 2013].HCV infection is strongly associated with the
development of insulin resistance (IR) and predis-pose to the onset of type-2 diabetes irrespective ofliver disease severity through interactions withdifferent components of the insulin signaling path-way or with factors involved in its regulation.[Decock et al., 2007; Badar et al., 2012; Bugianesiet al., 2012]. Growing evidence from several studiessupports the central role of IR in response failure toantiviral therapy among HCV patients [Harrison,2006; Decock et al., 2007; Parise and Oliveira, 2007;Dai et al., 2009; Grasso et al., 2009; Khattab et al.,2010; Vachon et al., 2011; Brandman et al., 2012;Ziada et al., 2012; Ismail, 2013]. IR is stronglyimplicated in liver fibrosis and contributes to fibroticliver progression, steatosis, development of complica-tions, and response to HCV therapy [D’Souza et al.,2005; Svegliati-Baroni et al., 2007; Petta et al.,
Conflict of interest: The authors declare no conflict of interest.�Correspondence to: Ekram W. Abd El- Wahab, Tropical
Health Department, High Institute of Public Health, AlexandriaUniversity, Egypt.E-mail: [email protected]
Accepted 1 October 2014
DOI 10.1002/jmv.24092Published online in Wiley Online Library(wileyonlinelibrary.com).
�C 2014 WILEY PERIODICALS, INC.
2008]. Treatment of chronic HCV infection withPegylated-interferon alpha (PegIFN-a) and ribavirincombination therapy has favorable efficacy in geno-types 2 and 3 but a limited one among genotypes 1and 4 infected patients. The treatment is costly andinvolves severe side effects [Ghany et al., 2009]. Theprediction of non-response is thus of utmost interestfor both patient wellbeing and health care economy.A number of host-related factors have been reportedto interfere with HCV treatment response. Theseinvolve old age, male gender, ethnicity, obesity,advanced liver fibrosis or cirrhosis, high transami-nase levels, established state of diabetes, HLA class,and host genetic polymorphisms [Berg et al., 2003;Tarantino et al., 2006; Ge et al., 2009; McHutchisonet al., 2009; Suppiah et al., 2009; Alan, 2011]. Pre-treatment assessment of IR has emerged as animportant milestone in the treatment of patients.Elevated HOMA-IR was associated with a lowercure rate of patients with hepatitis C treated withPeg-IFN-a/ribavirin irrespective of the infecting gen-otype [Eslam et al., 2011]. Early virologic responseis a major determinant for identifying non-responderpatients and has a great impact on subsequent rapidand sustained virologic response, thus constitutesthe earliest treatment-stopping rule [Ghany et al.,2009].At present, no individualized treatment schedule is
tailored on the basis of any baseline predictor ofresponse. The present work aims to validate directlymeasured IR state as a pre-treatment clinical param-eter interfering with early viral kinetics in responseto HCV therapy and whether early treatment out-come could also be predicted at baseline virologic andhost characteristics. The impact of HCV treatmentand viral eradication on insulin sensitivity was alsoaddressed.
MATERIALS AND METHODS
Study Design and Patients
A prospective cross sectional study was conductedbetween October 2012 and February 2013 at theLiver Center of El-Qabbary Hospital affiliated toMinistry of Health and Population in Alexandria(Egypt). The study patients comprised chronic HCVpositive patients eligible for receiving pegyinterferon/ribavirin combination therapy. The criteria for inclu-sion were: age from 18 to 60 years, both sex, HCV-RNA positive PCR, liver biopsy showing Ishak stagefrom 1 to 4, complete blood picture within normalranges, HBV/HIV seronegative, and all eligible casesfor treatment according to international guidelines[Ghany et al., 2009]. Those with established diabetesmellitus (diagnosed according to the WHO criteria) orfemales with previous history of gestational diabetesand all cases found ineligible for the treatment wereexcluded from the study {Age under 18 or above60 years, history of major depression or psychosis,malignancy, coronary artery disease, solid organ
transplant, untreated thyroid disease, active sub-stance abuse, Wilson’s disease, hemochromatosis,a1-antitrypsin deficiency, and hepatic decompensa-tion, autoimmune hepatitis or other autoimmunedisease such as systemic lupus erythematosus, rheu-matoid arthritis, or auto immune hepatitis, uncon-trolled seizures, uncontrolled diabetes, uncontrolledhypertension, current or planned pregnancy for18 months following start of treatment, end stage renaldisease or serum creatinine greater than 1.5mg/ml,continued pattern of alcohol abuse >40g/day in thelast 6 month, WBCs< 3000/cmm, hemoglobin <10g/dl,platelet count <100,000/cmm, liver biopsy Ishak stagemore than 4/6, Retinopathy, concomitant schistosomamansoni, HIV, or HBV infection, and obese patients(Body Mass Index [BMI] >35)}.
Sample Size
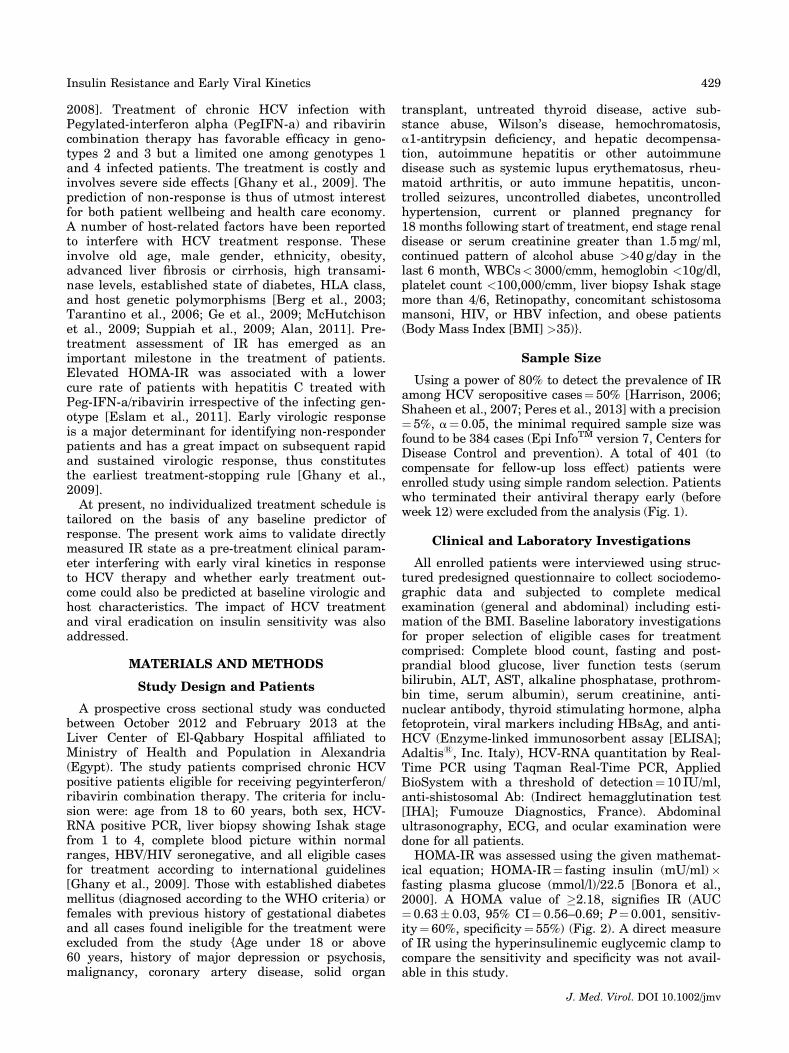
Using a power of 80% to detect the prevalence of IRamong HCV seropositive cases¼ 50% [Harrison, 2006;Shaheen et al., 2007; Peres et al., 2013] with a precision¼ 5%, a¼ 0.05, the minimal required sample size wasfound to be 384 cases (Epi InfoTM version 7, Centers forDisease Control and prevention). A total of 401 (tocompensate for fellow-up loss effect) patients wereenrolled study using simple random selection. Patientswho terminated their antiviral therapy early (beforeweek 12) were excluded from the analysis (Fig. 1).
Clinical and Laboratory Investigations
All enrolled patients were interviewed using struc-tured predesigned questionnaire to collect sociodemo-graphic data and subjected to complete medicalexamination (general and abdominal) including esti-mation of the BMI. Baseline laboratory investigationsfor proper selection of eligible cases for treatmentcomprised: Complete blood count, fasting and post-prandial blood glucose, liver function tests (serumbilirubin, ALT, AST, alkaline phosphatase, prothrom-bin time, serum albumin), serum creatinine, anti-nuclear antibody, thyroid stimulating hormone, alphafetoprotein, viral markers including HBsAg, and anti-HCV (Enzyme-linked immunosorbent assay [ELISA];Adaltis1, Inc. Italy), HCV-RNA quantitation by Real-Time PCR using Taqman Real-Time PCR, AppliedBioSystem with a threshold of detection¼ 10 IU/ml,anti-shistosomal Ab: (Indirect hemagglutination test[IHA]; Fumouze Diagnostics, France). Abdominalultrasonography, ECG, and ocular examination weredone for all patients.HOMA-IR was assessed using the given mathemat-
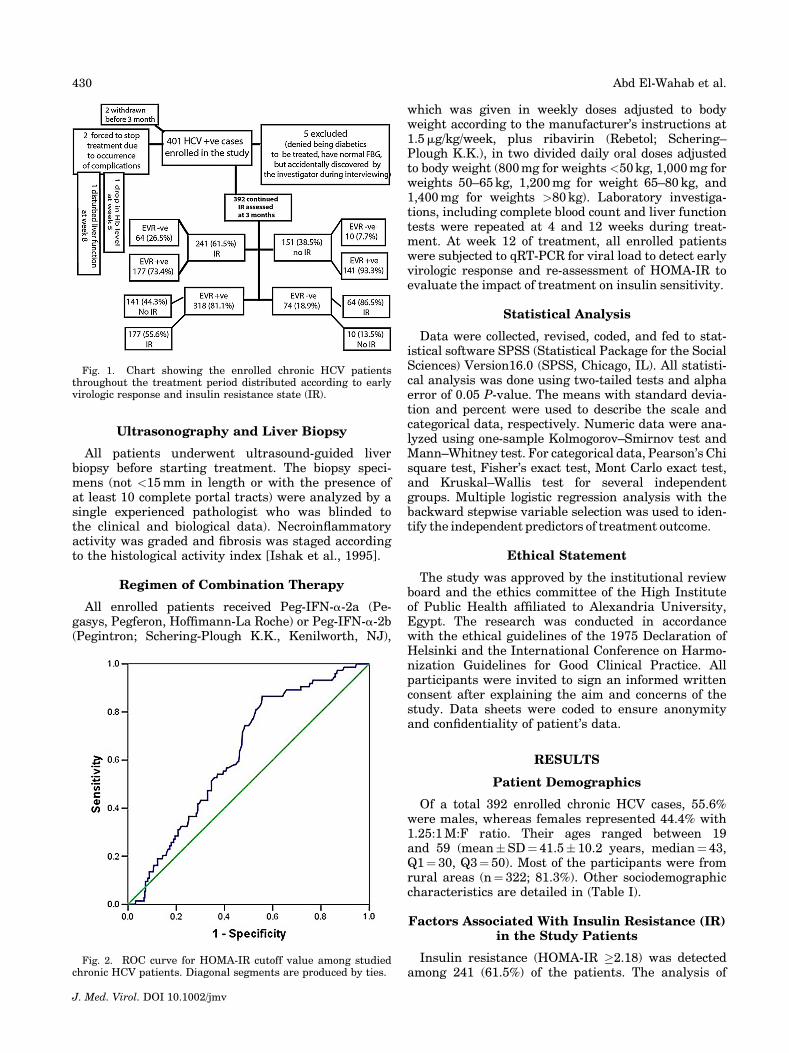
ical equation; HOMA-IR¼ fasting insulin (mU/ml)�fasting plasma glucose (mmol/l)/22.5 [Bonora et al.,2000]. A HOMA value of �2.18, signifies IR (AUC¼ 0.63� 0.03, 95% CI¼ 0.56–0.69; P¼ 0.001, sensitiv-ity¼ 60%, specificity¼ 55%) (Fig. 2). A direct measureof IR using the hyperinsulinemic euglycemic clamp tocompare the sensitivity and specificity was not avail-able in this study.
J. Med. Virol. DOI 10.1002/jmv
Insulin Resistance and Early Viral Kinetics 429
Ultrasonography and Liver Biopsy
All patients underwent ultrasound-guided liverbiopsy before starting treatment. The biopsy speci-mens (not <15mm in length or with the presence ofat least 10 complete portal tracts) were analyzed by asingle experienced pathologist who was blinded tothe clinical and biological data). Necroinflammatoryactivity was graded and fibrosis was staged accordingto the histological activity index [Ishak et al., 1995].
Regimen of Combination Therapy
All enrolled patients received Peg-IFN-a-2a (Pe-gasys, Pegferon, Hoffimann-La Roche) or Peg-IFN-a-2b(Pegintron; Schering-Plough K.K., Kenilworth, NJ),
which was given in weekly doses adjusted to bodyweight according to the manufacturer’s instructions at1.5mg/kg/week, plus ribavirin (Rebetol; Schering–Plough K.K.), in two divided daily oral doses adjustedto body weight (800mg for weights <50kg, 1,000mg forweights 50–65kg, 1,200mg for weight 65–80kg, and1,400mg for weights >80kg). Laboratory investiga-tions, including complete blood count and liver functiontests were repeated at 4 and 12 weeks during treat-ment. At week 12 of treatment, all enrolled patientswere subjected to qRT-PCR for viral load to detect earlyvirologic response and re-assessment of HOMA-IR toevaluate the impact of treatment on insulin sensitivity.
Statistical Analysis
Data were collected, revised, coded, and fed to stat-istical software SPSS (Statistical Package for the SocialSciences) Version16.0 (SPSS, Chicago, IL). All statisti-cal analysis was done using two-tailed tests and alphaerror of 0.05 P-value. The means with standard devia-tion and percent were used to describe the scale andcategorical data, respectively. Numeric data were ana-lyzed using one-sample Kolmogorov–Smirnov test andMann–Whitney test. For categorical data, Pearson’s Chisquare test, Fisher’s exact test, Mont Carlo exact test,and Kruskal–Wallis test for several independentgroups. Multiple logistic regression analysis with thebackward stepwise variable selection was used to iden-tify the independent predictors of treatment outcome.
Ethical Statement
The study was approved by the institutional reviewboard and the ethics committee of the High Instituteof Public Health affiliated to Alexandria University,Egypt. The research was conducted in accordancewith the ethical guidelines of the 1975 Declaration ofHelsinki and the International Conference on Harmo-nization Guidelines for Good Clinical Practice. Allparticipants were invited to sign an informed writtenconsent after explaining the aim and concerns of thestudy. Data sheets were coded to ensure anonymityand confidentiality of patient’s data.
RESULTS
Patient Demographics
Of a total 392 enrolled chronic HCV cases, 55.6%were males, whereas females represented 44.4% with1.25:1M:F ratio. Their ages ranged between 19and 59 (mean�SD¼ 41.5� 10.2 years, median¼ 43,Q1¼ 30, Q3¼ 50). Most of the participants were fromrural areas (n¼ 322; 81.3%). Other sociodemographiccharacteristics are detailed in (Table I).
Factors Associated With Insulin Resistance (IR)in the Study Patients
Insulin resistance (HOMA-IR �2.18) was detectedamong 241 (61.5%) of the patients. The analysis of
Fig. 2. ROC curve for HOMA-IR cutoff value among studiedchronic HCV patients. Diagonal segments are produced by ties.
Fig. 1. Chart showing the enrolled chronic HCV patientsthroughout the treatment period distributed according to earlyvirologic response and insulin resistance state (IR).
J. Med. Virol. DOI 10.1002/jmv
430 Abd El-Wahab et al.
factors associated with insulin resistance using bi-nary logistic regression revealed that old age (50–59age group); (OR 95% CI¼ 2.9 [1.2–45], P¼ 0.021), lowprothrombin activity; (OR 95% CI¼ 3.5 [1.1–15.2],P¼ 0.037), high total serum bilirubin >2mg/dl; (OR95% CI¼ 1.9 [1.2–3.1], P¼ 0.009), prediabetics (Fast-ing Blood Glucose¼ 127–130mg/dl); (OR 95% CI¼ 77[4.2–125.7], P¼ 0.0001), high alpha fetoprotein(>10ng/dl); (OR 95% CI¼ 2.6 [1.3–5.6], P¼ 0.013),steatosis; (OR 95% CI¼ 1.9 [1.2–3.2], P¼ 0.014),normal and high insulin levels; (OR 95% CI¼ 19.2[1.1–158.3], P< 0.0001) and (OR 95% CI¼ 524.3[187.1–1257.3], P< 0.0001), respectively, Ishak scoresIII and IV; (OR 95% CI¼ 19.2 [1.1–158.3], P< 0.0001)and (OR 95% CI¼ 524.3 [187.1–1257.3], P< 0.0001]respectively are significant risk factors (Table I).Nevertheless, only pretreatment fasting blood glu-cose, total serum bilirubin, and higher Ishak scoringwere detected in a stepwise regression model (TableII). The same also applies among underweight andnormal weight subjects. Interestingly, although insu-lin resistance was higher among overweight andobese patients, high BMI was not a significant riskfactor for insulin resistance (OR 95% CI¼ 5.9 [0.36–97.7], P< 0.0001) and (OR 95% CI¼ 19.6 [0.79–87.6],P< 0.0001], respectively.
Early Virologic Response and Related HostCharacteristics, Viral, and Metabolic Factors
Early virologic response (defined as undetectableHCV-RNA levels in the serum estimated at the 12thweek of treatment) was achieved by 81.1% of thecases. Older patients (50–59 years) had the lowestresponse rate. However, the mean age of EV respond-ers was not-significantly lower than that of non-early virologic responders; (41.2� 10.2 vs. 42.5� 9.8).Although males responded slightly better than fe-males (81.6% vs. 80.6%) at 12 weeks of treatment;this was not statistically significant. Neither theplace of residence, marital status, education level northe occupation had significantly affected the earlyvirologic response. Smoking and higher BMI weresignificantly associated with lack of early virologicresponse at the 12th week of treatment (P< 0.0001)(Table III).Some viral and host baseline laboratory test levels
have significantly affected the early virologic re-sponse. This was evident for low initial viral load(P< 0.0001). The median initial viral load of respond-ers was significantly lower than that of non-respond-ers; (210,000 vs. 595,000). However, initial viral loadwas not significantly related to insulin resistancestate (P¼ 0.44). Elevated base line alpha fetoproteinlevel was significantly associated with non-responseat the 12th week of treatment (P< 0.001). Baselinehaemoglobin level, total leucocytes count, plateletscount, prothrombin activity, serum albumin, serumcreatinine, AST, ALT, alkaline phosphatase, thyroidstimulating hormone, and anti-shistosomal Ab were
not significantly related to early virologic response(Table IV).
Impact of Interferon Type, Pretreatment FastingBlood Glucose, Fasting Blood Insulin, andHOMA-IR on Early Virologic Response
Either type of interferon used (Peg-IFN-a-2a[n¼ 200] or Peg-IFN-a-2b [n¼ 192]) in the conven-tional therapeutic regimens had no significantimpact on early virologic response (P¼ 0.44). Asignificant association between baseline fasting bloodglucose and early virologic response was observed;the lower the pretreatment fasting blood glucose levelthe better was the response. The mean and medianfasting blood glucose were significantly lower amongresponders than non-responders (90.3� 11.3 vs.98.2� 13.4) and (88 vs. 95.5), respectively. Likewise,the median of pretreatment fasting blood insulin wassignificantly lower among responders than non-res-ponders (9.1 vs. 9.2) (Table V).
Impact of Some Histological Criteria onEarly Virologic Response
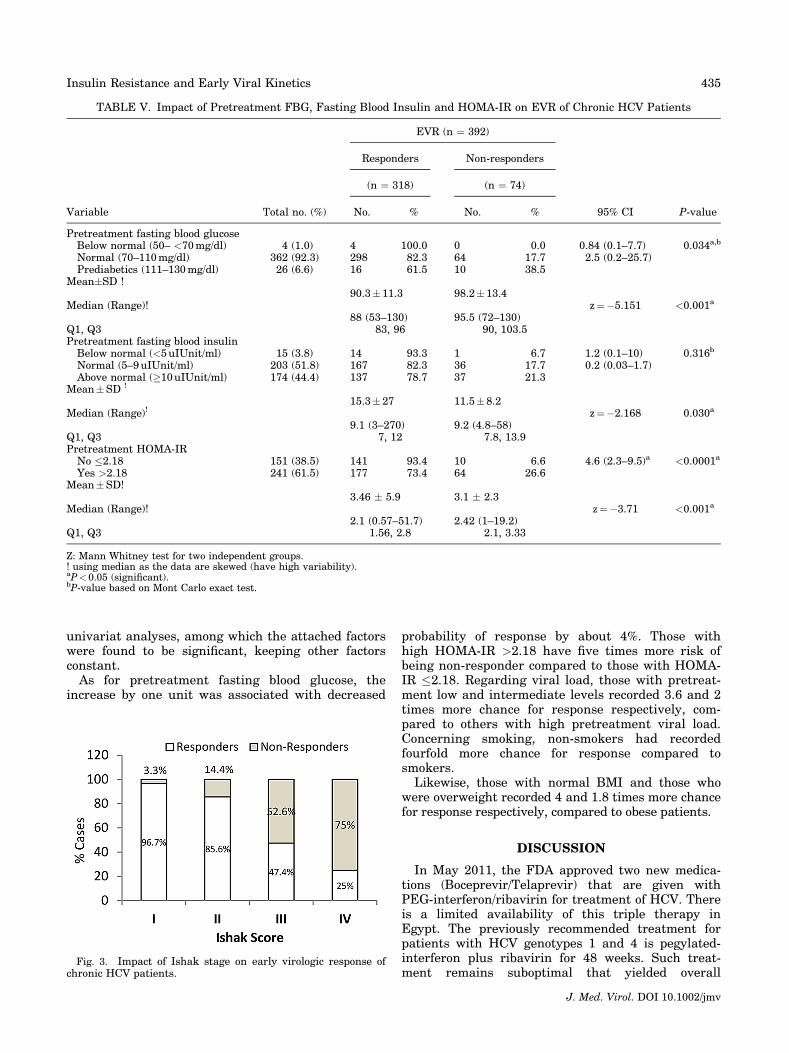
Low early virologic response was not significantlyassociated with the presence of steatosis and peri-portal fibrosis as detected by liver biopsy. On theother hand, higher stages of fibrosis in Ishakscoring were significantly associated with lack ofearly virologic response (P< 0.0001) (Table II).Stages l, ll, lll, and lV showed 96.7%, 85.6%, 47.4%,and 25% response rates, respectively (Fig. 3).Higher Ishak scoring was significantly associatedwith increasing alpha fetoprotein level (P¼ 0.003);mean�SD levels of 2.6� 1.8, 5.7� 12.1, 8.3� 9.7,8.4� 9.3 for stages l, ll, lll, and lV, respectively.High Ishak staging was also significantly associ-
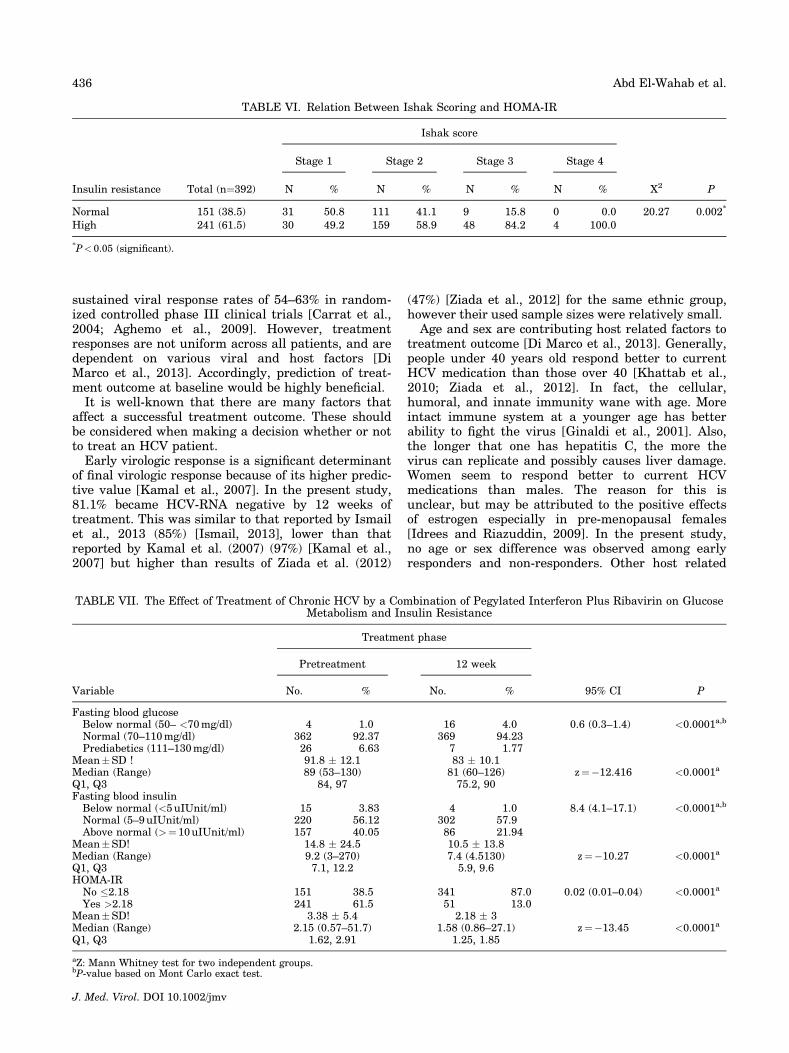
ated with insulin resistance. About 49% of Ishakstage I had insulin resistance compared with 60%,84.2%, and 100% of Ishak stages ll, lll, and lV,respectively (Table VI).
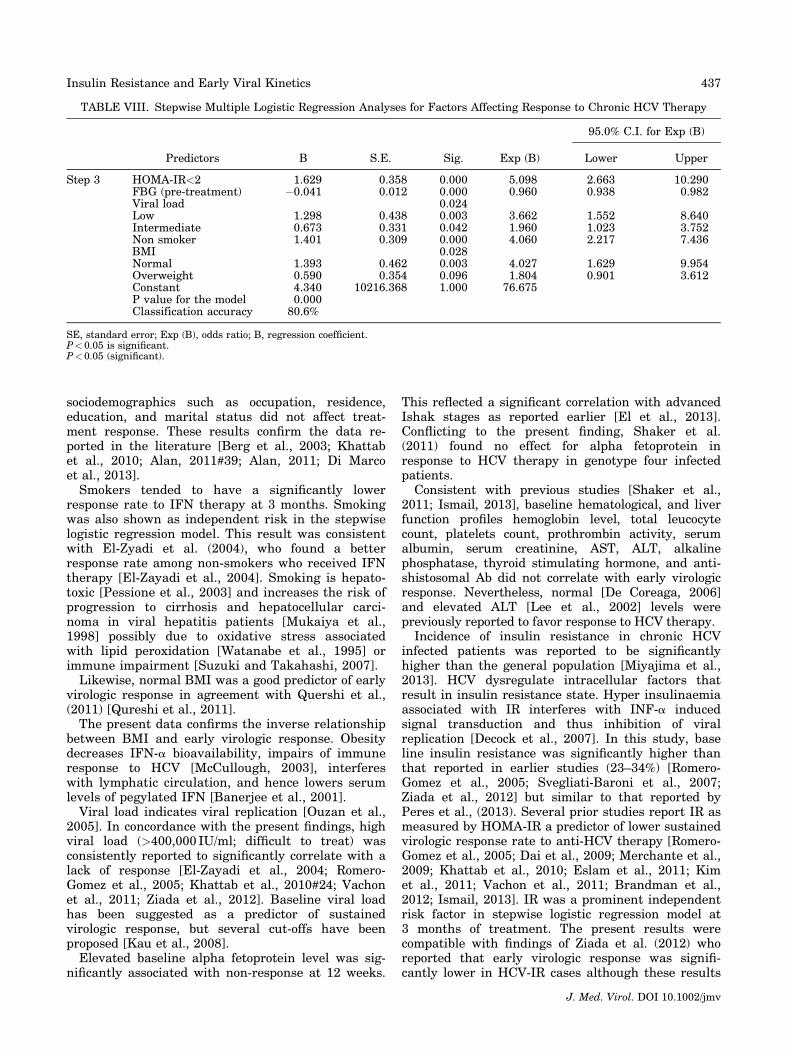
Effect of Treatment on Glucose Metabolism andInsulin Resistance
HCV therapy was significantly associated withimprovement of glucose metabolism as evidenced byan increase in the number of patients with normalglucose and insulin, and decreased number of thosewith relatively high glucose and high insulin levels.The number of patients with insulin resistance haddecreased by fivefold (from 241 [61.5%] to 51 [13%])(Table VII).
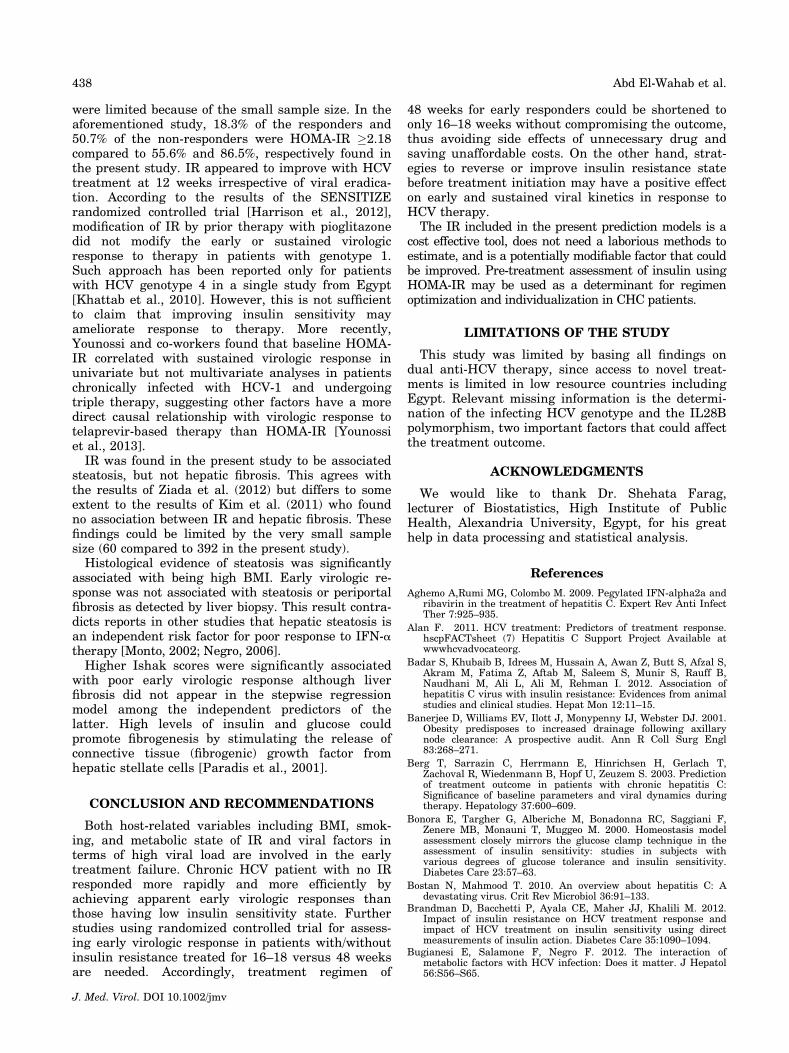
Independent Predictors ofTreatment Outcome
Table VIII shows the result of multiple stepwiselogistic regression analyses for factors affecting re-sponse to chronic HCV therapy. The model includedall risk factors that were significantly, using
J. Med. Virol. DOI 10.1002/jmv
Insulin Resistance and Early Viral Kinetics 431
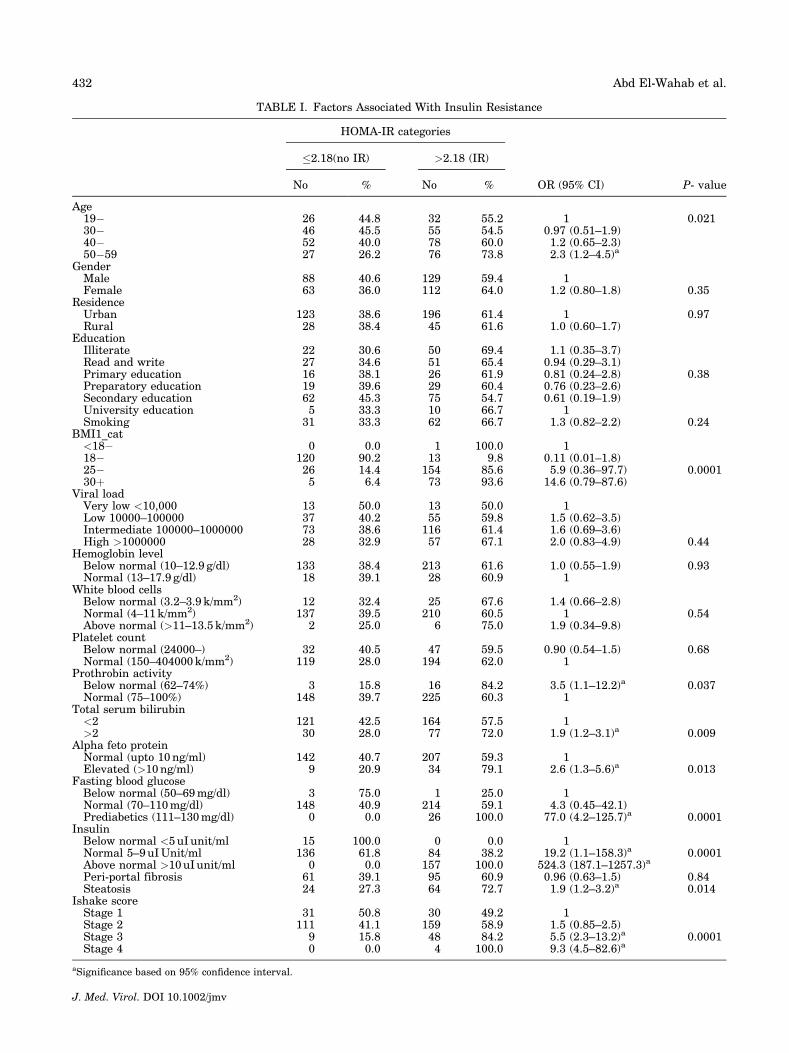
TABLE I. Factors Associated With Insulin Resistance
HOMA-IR categories
OR (95% CI) P- value
�2.18(no IR) >2.18 (IR)
No % No %
Age19� 26 44.8 32 55.2 1 0.02130� 46 45.5 55 54.5 0.97 (0.51–1.9)40� 52 40.0 78 60.0 1.2 (0.65–2.3)50�59 27 26.2 76 73.8 2.3 (1.2–4.5)a
GenderMale 88 40.6 129 59.4 1Female 63 36.0 112 64.0 1.2 (0.80–1.8) 0.35
ResidenceUrban 123 38.6 196 61.4 1 0.97Rural 28 38.4 45 61.6 1.0 (0.60–1.7)
EducationIlliterate 22 30.6 50 69.4 1.1 (0.35–3.7)Read and write 27 34.6 51 65.4 0.94 (0.29–3.1)Primary education 16 38.1 26 61.9 0.81 (0.24–2.8) 0.38Preparatory education 19 39.6 29 60.4 0.76 (0.23–2.6)Secondary education 62 45.3 75 54.7 0.61 (0.19–1.9)University education 5 33.3 10 66.7 1Smoking 31 33.3 62 66.7 1.3 (0.82–2.2) 0.24
BMI1_cat<18� 0 0.0 1 100.0 118� 120 90.2 13 9.8 0.11 (0.01–1.8)25� 26 14.4 154 85.6 5.9 (0.36–97.7) 0.000130þ 5 6.4 73 93.6 14.6 (0.79–87.6)
Viral loadVery low <10,000 13 50.0 13 50.0 1Low 10000–100000 37 40.2 55 59.8 1.5 (0.62–3.5)Intermediate 100000–1000000 73 38.6 116 61.4 1.6 (0.69–3.6)High >1000000 28 32.9 57 67.1 2.0 (0.83–4.9) 0.44
Hemoglobin levelBelow normal (10–12.9 g/dl) 133 38.4 213 61.6 1.0 (0.55–1.9) 0.93Normal (13–17.9 g/dl) 18 39.1 28 60.9 1
White blood cellsBelow normal (3.2–3.9 k/mm2) 12 32.4 25 67.6 1.4 (0.66–2.8)Normal (4–11k/mm2) 137 39.5 210 60.5 1 0.54Above normal (>11–13.5 k/mm2) 2 25.0 6 75.0 1.9 (0.34–9.8)
Platelet countBelow normal (24000–) 32 40.5 47 59.5 0.90 (0.54–1.5) 0.68Normal (150–404000k/mm2) 119 28.0 194 62.0 1
Prothrobin activityBelow normal (62–74%) 3 15.8 16 84.2 3.5 (1.1–12.2)a 0.037Normal (75–100%) 148 39.7 225 60.3 1
Total serum bilirubin<2 121 42.5 164 57.5 1>2 30 28.0 77 72.0 1.9 (1.2–3.1)a 0.009
Alpha feto proteinNormal (upto 10ng/ml) 142 40.7 207 59.3 1Elevated (>10ng/ml) 9 20.9 34 79.1 2.6 (1.3–5.6)a 0.013
Fasting blood glucoseBelow normal (50–69mg/dl) 3 75.0 1 25.0 1Normal (70–110mg/dl) 148 40.9 214 59.1 4.3 (0.45–42.1)Prediabetics (111–130mg/dl) 0 0.0 26 100.0 77.0 (4.2–125.7)a 0.0001
InsulinBelow normal <5uI unit/ml 15 100.0 0 0.0 1Normal 5–9uIUnit/ml 136 61.8 84 38.2 19.2 (1.1–158.3)a 0.0001Above normal >10uI unit/ml 0 0.0 157 100.0 524.3 (187.1–1257.3)a
Peri-portal fibrosis 61 39.1 95 60.9 0.96 (0.63–1.5) 0.84Steatosis 24 27.3 64 72.7 1.9 (1.2–3.2)a 0.014
Ishake scoreStage 1 31 50.8 30 49.2 1Stage 2 111 41.1 159 58.9 1.5 (0.85–2.5)Stage 3 9 15.8 48 84.2 5.5 (2.3–13.2)a 0.0001Stage 4 0 0.0 4 100.0 9.3 (4.5–82.6)a
aSignificance based on 95% confidence interval.
J. Med. Virol. DOI 10.1002/jmv
432 Abd El-Wahab et al.
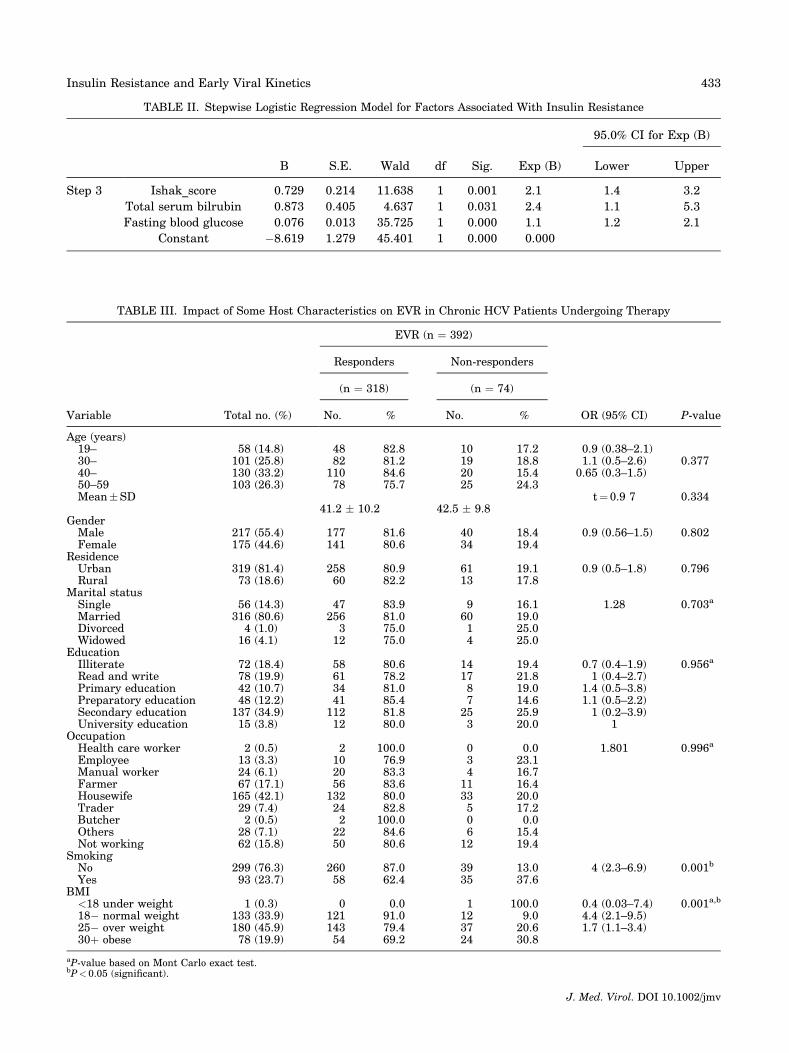
TABLE II. Stepwise Logistic Regression Model for Factors Associated With Insulin Resistance
95.0% CI for Exp (B)
B S.E. Wald df Sig. Exp (B) Lower Upper
Step 3 Ishak_score 0.729 0.214 11.638 1 0.001 2.1 1.4 3.2
Total serum bilrubin 0.873 0.405 4.637 1 0.031 2.4 1.1 5.3
Fasting blood glucose 0.076 0.013 35.725 1 0.000 1.1 1.2 2.1
Constant �8.619 1.279 45.401 1 0.000 0.000
TABLE III. Impact of Some Host Characteristics on EVR in Chronic HCV Patients Undergoing Therapy
EVR (n ¼ 392)
Responders Non-responders
(n ¼ 318) (n ¼ 74)
Variable Total no. (%) No. % No. % OR (95% CI) P-value
Age (years)19– 58 (14.8) 48 82.8 10 17.2 0.9 (0.38–2.1)30– 101 (25.8) 82 81.2 19 18.8 1.1 (0.5–2.6) 0.37740– 130 (33.2) 110 84.6 20 15.4 0.65 (0.3–1.5)50–59 103 (26.3) 78 75.7 25 24.3Mean�SD
41.2 � 10.2 42.5 � 9.8t¼0.9 7 0.334
GenderMale 217 (55.4) 177 81.6 40 18.4 0.9 (0.56–1.5) 0.802Female 175 (44.6) 141 80.6 34 19.4
ResidenceUrban 319 (81.4) 258 80.9 61 19.1 0.9 (0.5–1.8) 0.796Rural 73 (18.6) 60 82.2 13 17.8
Marital statusSingle 56 (14.3) 47 83.9 9 16.1 1.28 0.703a
Married 316 (80.6) 256 81.0 60 19.0Divorced 4 (1.0) 3 75.0 1 25.0Widowed 16 (4.1) 12 75.0 4 25.0
EducationIlliterate 72 (18.4) 58 80.6 14 19.4 0.7 (0.4–1.9) 0.956a
Read and write 78 (19.9) 61 78.2 17 21.8 1 (0.4–2.7)Primary education 42 (10.7) 34 81.0 8 19.0 1.4 (0.5–3.8)Preparatory education 48 (12.2) 41 85.4 7 14.6 1.1 (0.5–2.2)Secondary education 137 (34.9) 112 81.8 25 25.9 1 (0.2–3.9)University education 15 (3.8) 12 80.0 3 20.0 1
OccupationHealth care worker 2 (0.5) 2 100.0 0 0.0 1.801 0.996a
Employee 13 (3.3) 10 76.9 3 23.1Manual worker 24 (6.1) 20 83.3 4 16.7Farmer 67 (17.1) 56 83.6 11 16.4Housewife 165 (42.1) 132 80.0 33 20.0Trader 29 (7.4) 24 82.8 5 17.2Butcher 2 (0.5) 2 100.0 0 0.0Others 28 (7.1) 22 84.6 6 15.4Not working 62 (15.8) 50 80.6 12 19.4
SmokingNo 299 (76.3) 260 87.0 39 13.0 4 (2.3–6.9) 0.001b
Yes 93 (23.7) 58 62.4 35 37.6BMI
<18 under weight 1 (0.3) 0 0.0 1 100.0 0.4 (0.03–7.4) 0.001a,b
18� normal weight 133 (33.9) 121 91.0 12 9.0 4.4 (2.1–9.5)25� over weight 180 (45.9) 143 79.4 37 20.6 1.7 (1.1–3.4)30þ obese 78 (19.9) 54 69.2 24 30.8
aP-value based on Mont Carlo exact test.bP< 0.05 (significant).
J. Med. Virol. DOI 10.1002/jmv
Insulin Resistance and Early Viral Kinetics 433
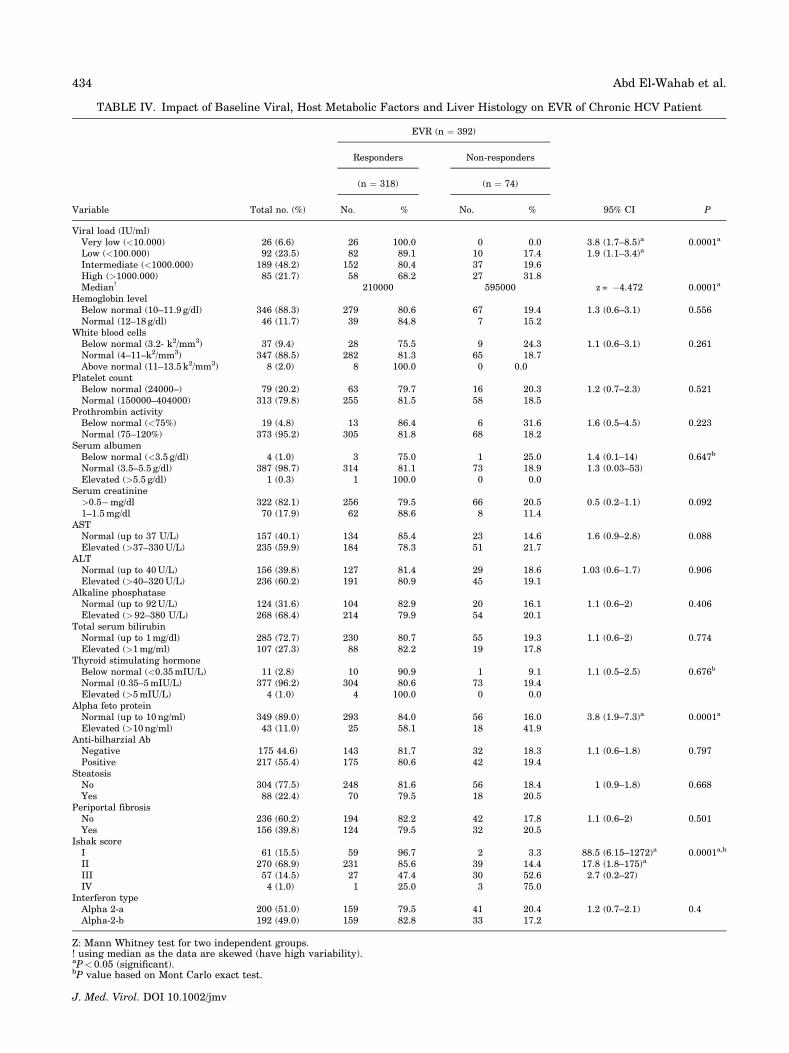
TABLE IV. Impact of Baseline Viral, Host Metabolic Factors and Liver Histology on EVR of Chronic HCV Patient
EVR (n ¼ 392)
Responders Non-responders
(n ¼ 318) (n ¼ 74)
Variable Total no. (%) No. % No. % 95% CI P
Viral load (IU/ml)Very low (<10.000) 26 (6.6) 26 100.0 0 0.0 3.8 (1.7–8.5)a 0.0001a
Low (<100.000) 92 (23.5) 82 89.1 10 17.4 1.9 (1.1–3.4)a
Intermediate (<1000.000) 189 (48.2) 152 80.4 37 19.6High (>1000.000) 85 (21.7) 58 68.2 27 31.8Median! 210000 595000 z = �4.472 0.0001a
Hemoglobin levelBelow normal (10–11.9 g/dl) 346 (88.3) 279 80.6 67 19.4 1.3 (0.6–3.1) 0.556Normal (12–18 g/dl) 46 (11.7) 39 84.8 7 15.2
White blood cellsBelow normal (3.2- k2/mm3) 37 (9.4) 28 75.5 9 24.3 1.1 (0.6–3.1) 0.261Normal (4–11–k2/mm3) 347 (88.5) 282 81.3 65 18.7Above normal (11–13.5 k2/mm3) 8 (2.0) 8 100.0 0 0.0
Platelet countBelow normal (24000–) 79 (20.2) 63 79.7 16 20.3 1.2 (0.7–2.3) 0.521Normal (150000–404000) 313 (79.8) 255 81.5 58 18.5
Prothrombin activityBelow normal (<75%) 19 (4.8) 13 86.4 6 31.6 1.6 (0.5–4.5) 0.223Normal (75–120%) 373 (95.2) 305 81.8 68 18.2
Serum albumenBelow normal (<3.5 g/dl) 4 (1.0) 3 75.0 1 25.0 1.4 (0.1–14) 0.647b
Normal (3.5–5.5 g/dl) 387 (98.7) 314 81.1 73 18.9 1.3 (0.03–53)Elevated (>5.5 g/dl) 1 (0.3) 1 100.0 0 0.0
Serum creatinine>0.5�mg/dl 322 (82.1) 256 79.5 66 20.5 0.5 (0.2–1.1) 0.0921–1.5mg/dl 70 (17.9) 62 88.6 8 11.4
ASTNormal (up to 37 U/L) 157 (40.1) 134 85.4 23 14.6 1.6 (0.9–2.8) 0.088Elevated (>37–330U/L) 235 (59.9) 184 78.3 51 21.7
ALTNormal (up to 40U/L) 156 (39.8) 127 81.4 29 18.6 1.03 (0.6–1.7) 0.906Elevated (>40–320U/L) 236 (60.2) 191 80.9 45 19.1
Alkaline phosphataseNormal (up to 92U/L) 124 (31.6) 104 82.9 20 16.1 1.1 (0.6–2) 0.406Elevated (> 92–380 U/L) 268 (68.4) 214 79.9 54 20.1
Total serum bilirubinNormal (up to 1mg/dl) 285 (72.7) 230 80.7 55 19.3 1.1 (0.6–2) 0.774Elevated (>1mg/ml) 107 (27.3) 88 82.2 19 17.8
Thyroid stimulating hormoneBelow normal (<0.35mIU/L) 11 (2.8) 10 90.9 1 9.1 1.1 (0.5–2.5) 0.676b
Normal (0.35–5mIU/L) 377 (96.2) 304 80.6 73 19.4Elevated (>5mIU/L) 4 (1.0) 4 100.0 0 0.0
Alpha feto proteinNormal (up to 10ng/ml) 349 (89.0) 293 84.0 56 16.0 3.8 (1.9–7.3)a 0.0001a
Elevated (>10ng/ml) 43 (11.0) 25 58.1 18 41.9Anti-bilharzial AbNegative 175 44.6) 143 81.7 32 18.3 1.1 (0.6–1.8) 0.797Positive 217 (55.4) 175 80.6 42 19.4
SteatosisNo 304 (77.5) 248 81.6 56 18.4 1 (0.9–1.8) 0.668Yes 88 (22.4) 70 79.5 18 20.5
Periportal fibrosisNo 236 (60.2) 194 82.2 42 17.8 1.1 (0.6–2) 0.501Yes 156 (39.8) 124 79.5 32 20.5
Ishak scoreI 61 (15.5) 59 96.7 2 3.3 88.5 (6.15–1272)a 0.0001a,b
II 270 (68.9) 231 85.6 39 14.4 17.8 (1.8–175)a
III 57 (14.5) 27 47.4 30 52.6 2.7 (0.2–27)IV 4 (1.0) 1 25.0 3 75.0
Interferon typeAlpha 2-a 200 (51.0) 159 79.5 41 20.4 1.2 (0.7–2.1) 0.4Alpha-2-b 192 (49.0) 159 82.8 33 17.2
Z: Mann Whitney test for two independent groups.! using median as the data are skewed (have high variability).aP< 0.05 (significant).bP value based on Mont Carlo exact test.
J. Med. Virol. DOI 10.1002/jmv
434 Abd El-Wahab et al.
univariat analyses, among which the attached factorswere found to be significant, keeping other factorsconstant.As for pretreatment fasting blood glucose, the
increase by one unit was associated with decreased
probability of response by about 4%. Those withhigh HOMA-IR >2.18 have five times more risk ofbeing non-responder compared to those with HOMA-IR �2.18. Regarding viral load, those with pretreat-ment low and intermediate levels recorded 3.6 and 2times more chance for response respectively, com-pared to others with high pretreatment viral load.Concerning smoking, non-smokers had recordedfourfold more chance for response compared tosmokers.Likewise, those with normal BMI and those who
were overweight recorded 4 and 1.8 times more chancefor response respectively, compared to obese patients.
DISCUSSION
In May 2011, the FDA approved two new medica-tions (Boceprevir/Telaprevir) that are given withPEG-interferon/ribavirin for treatment of HCV. Thereis a limited availability of this triple therapy inEgypt. The previously recommended treatment forpatients with HCV genotypes 1 and 4 is pegylated-interferon plus ribavirin for 48 weeks. Such treat-ment remains suboptimal that yielded overall
TABLE V. Impact of Pretreatment FBG, Fasting Blood Insulin and HOMA-IR on EVR of Chronic HCV Patients
EVR (n ¼ 392)
Responders Non-responders
(n ¼ 318) (n ¼ 74)
Variable Total no. (%) No. % No. % 95% CI P-value
Pretreatment fasting blood glucoseBelow normal (50– <70mg/dl) 4 (1.0) 4 100.0 0 0.0 0.84 (0.1–7.7) 0.034a,b
Normal (70–110mg/dl) 362 (92.3) 298 82.3 64 17.7 2.5 (0.2–25.7)Prediabetics (111–130mg/dl) 26 (6.6) 16 61.5 10 38.5
Mean�SD !90.3�11.3 98.2�13.4
Median (Range)!88 (53–130) 95.5 (72–130)
z¼�5.151 <0.001a
Q1, Q3 83, 96 90, 103.5Pretreatment fasting blood insulinBelow normal (<5uIUnit/ml) 15 (3.8) 14 93.3 1 6.7 1.2 (0.1–10) 0.316b
Normal (5–9uIUnit/ml) 203 (51.8) 167 82.3 36 17.7 0.2 (0.03–1.7)Above normal (�10uIUnit/ml) 174 (44.4) 137 78.7 37 21.3
Mean�SD !
15.3�27 11.5�8.2Median (Range)!
9.1 (3–270) 9.2 (4.8–58)z¼�2.168 0.030a
Q1, Q3 7, 12 7.8, 13.9Pretreatment HOMA-IRNo �2.18 151 (38.5) 141 93.4 10 6.6 4.6 (2.3–9.5)a <0.0001a
Yes >2.18 241 (61.5) 177 73.4 64 26.6Mean�SD!
3.46 � 5.9 3.1 � 2.3Median (Range)!
2.1 (0.57–51.7) 2.42 (1–19.2)z¼�3.71 <0.001a
Q1, Q3 1.56, 2.8 2.1, 3.33
Z: Mann Whitney test for two independent groups.! using median as the data are skewed (have high variability).aP< 0.05 (significant).bP-value based on Mont Carlo exact test.
Fig. 3. Impact of Ishak stage on early virologic response ofchronic HCV patients.
J. Med. Virol. DOI 10.1002/jmv
Insulin Resistance and Early Viral Kinetics 435
sustained viral response rates of 54–63% in random-ized controlled phase III clinical trials [Carrat et al.,2004; Aghemo et al., 2009]. However, treatmentresponses are not uniform across all patients, and aredependent on various viral and host factors [DiMarco et al., 2013]. Accordingly, prediction of treat-ment outcome at baseline would be highly beneficial.It is well-known that there are many factors that
affect a successful treatment outcome. These shouldbe considered when making a decision whether or notto treat an HCV patient.Early virologic response is a significant determinant
of final virologic response because of its higher predic-tive value [Kamal et al., 2007]. In the present study,81.1% became HCV-RNA negative by 12 weeks oftreatment. This was similar to that reported by Ismailet al., 2013 (85%) [Ismail, 2013], lower than thatreported by Kamal et al. (2007) (97%) [Kamal et al.,2007] but higher than results of Ziada et al. (2012)
(47%) [Ziada et al., 2012] for the same ethnic group,however their used sample sizes were relatively small.Age and sex are contributing host related factors to
treatment outcome [Di Marco et al., 2013]. Generally,people under 40 years old respond better to currentHCV medication than those over 40 [Khattab et al.,2010; Ziada et al., 2012]. In fact, the cellular,humoral, and innate immunity wane with age. Moreintact immune system at a younger age has betterability to fight the virus [Ginaldi et al., 2001]. Also,the longer that one has hepatitis C, the more thevirus can replicate and possibly causes liver damage.Women seem to respond better to current HCVmedications than males. The reason for this isunclear, but may be attributed to the positive effectsof estrogen especially in pre-menopausal females[Idrees and Riazuddin, 2009]. In the present study,no age or sex difference was observed among earlyresponders and non-responders. Other host related
TABLE VI. Relation Between Ishak Scoring and HOMA-IR
Ishak score
Stage 1 Stage 2 Stage 3 Stage 4
Insulin resistance Total (n¼392) N % N % N % N % X2 P
Normal 151 (38.5) 31 50.8 111 41.1 9 15.8 0 0.0 20.27 0.002*
High 241 (61.5) 30 49.2 159 58.9 48 84.2 4 100.0
*P< 0.05 (significant).
TABLE VII. The Effect of Treatment of Chronic HCV by a Combination of Pegylated Interferon Plus Ribavirin on GlucoseMetabolism and Insulin Resistance
Treatment phase
Pretreatment 12 week
Variable No. % No. % 95% CI P
Fasting blood glucoseBelow normal (50– <70mg/dl) 4 1.0 16 4.0 0.6 (0.3–1.4) <0.0001a,b
Normal (70–110mg/dl) 362 92.37 369 94.23Prediabetics (111–130mg/dl) 26 6.63 7 1.77
Mean�SD ! 91.8 � 12.1 83 � 10.1Median (Range) 89 (53–130) 81 (60–126) z¼�12.416 <0.0001a
Q1, Q3 84, 97 75.2, 90Fasting blood insulinBelow normal (<5uIUnit/ml) 15 3.83 4 1.0 8.4 (4.1–17.1) <0.0001a,b
Normal (5–9uIUnit/ml) 220 56.12 302 57.9Above normal (>¼10uIUnit/ml) 157 40.05 86 21.94
Mean�SD! 14.8 � 24.5 10.5 � 13.8Median (Range) 9.2 (3–270) 7.4 (4.5130) z¼�10.27 <0.0001a
Q1, Q3 7.1, 12.2 5.9, 9.6HOMA-IRNo �2.18 151 38.5 341 87.0 0.02 (0.01–0.04) <0.0001a
Yes >2.18 241 61.5 51 13.0Mean�SD! 3.38 � 5.4 2.18 � 3Median (Range) 2.15 (0.57–51.7) 1.58 (0.86–27.1) z¼�13.45 <0.0001a
Q1, Q3 1.62, 2.91 1.25, 1.85
aZ: Mann Whitney test for two independent groups.bP-value based on Mont Carlo exact test.
J. Med. Virol. DOI 10.1002/jmv
436 Abd El-Wahab et al.
sociodemographics such as occupation, residence,education, and marital status did not affect treat-ment response. These results confirm the data re-ported in the literature [Berg et al., 2003; Khattabet al., 2010; Alan, 2011#39; Alan, 2011; Di Marcoet al., 2013].Smokers tended to have a significantly lower
response rate to IFN therapy at 3 months. Smokingwas also shown as independent risk in the stepwiselogistic regression model. This result was consistentwith El-Zyadi et al. (2004), who found a betterresponse rate among non-smokers who received IFNtherapy [El-Zayadi et al., 2004]. Smoking is hepato-toxic [Pessione et al., 2003] and increases the risk ofprogression to cirrhosis and hepatocellular carci-noma in viral hepatitis patients [Mukaiya et al.,1998] possibly due to oxidative stress associatedwith lipid peroxidation [Watanabe et al., 1995] orimmune impairment [Suzuki and Takahashi, 2007].Likewise, normal BMI was a good predictor of early
virologic response in agreement with Quershi et al.,(2011) [Qureshi et al., 2011].The present data confirms the inverse relationship
between BMI and early virologic response. Obesitydecreases IFN-a bioavailability, impairs of immuneresponse to HCV [McCullough, 2003], interfereswith lymphatic circulation, and hence lowers serumlevels of pegylated IFN [Banerjee et al., 2001].Viral load indicates viral replication [Ouzan et al.,
2005]. In concordance with the present findings, highviral load (>400,000 IU/ml; difficult to treat) wasconsistently reported to significantly correlate with alack of response [El-Zayadi et al., 2004; Romero-Gomez et al., 2005; Khattab et al., 2010#24; Vachonet al., 2011; Ziada et al., 2012]. Baseline viral loadhas been suggested as a predictor of sustainedvirologic response, but several cut-offs have beenproposed [Kau et al., 2008].Elevated baseline alpha fetoprotein level was sig-
nificantly associated with non-response at 12 weeks.
This reflected a significant correlation with advancedIshak stages as reported earlier [El et al., 2013].Conflicting to the present finding, Shaker et al.(2011) found no effect for alpha fetoprotein inresponse to HCV therapy in genotype four infectedpatients.Consistent with previous studies [Shaker et al.,
2011; Ismail, 2013], baseline hematological, and liverfunction profiles hemoglobin level, total leucocytecount, platelets count, prothrombin activity, serumalbumin, serum creatinine, AST, ALT, alkalinephosphatase, thyroid stimulating hormone, and anti-shistosomal Ab did not correlate with early virologicresponse. Nevertheless, normal [De Coreaga, 2006]and elevated ALT [Lee et al., 2002] levels werepreviously reported to favor response to HCV therapy.Incidence of insulin resistance in chronic HCV
infected patients was reported to be significantlyhigher than the general population [Miyajima et al.,2013]. HCV dysregulate intracellular factors thatresult in insulin resistance state. Hyper insulinaemiaassociated with IR interferes with INF-a inducedsignal transduction and thus inhibition of viralreplication [Decock et al., 2007]. In this study, baseline insulin resistance was significantly higher thanthat reported in earlier studies (23–34%) [Romero-Gomez et al., 2005; Svegliati-Baroni et al., 2007;Ziada et al., 2012] but similar to that reported byPeres et al., (2013). Several prior studies report IR asmeasured by HOMA-IR a predictor of lower sustainedvirologic response rate to anti-HCV therapy [Romero-Gomez et al., 2005; Dai et al., 2009; Merchante et al.,2009; Khattab et al., 2010; Eslam et al., 2011; Kimet al., 2011; Vachon et al., 2011; Brandman et al.,2012; Ismail, 2013]. IR was a prominent independentrisk factor in stepwise logistic regression model at3 months of treatment. The present results werecompatible with findings of Ziada et al. (2012) whoreported that early virologic response was signifi-cantly lower in HCV-IR cases although these results
TABLE VIII. Stepwise Multiple Logistic Regression Analyses for Factors Affecting Response to Chronic HCV Therapy
95.0% C.I. for Exp (B)
Predictors B S.E. Sig. Exp (B) Lower Upper
Step 3 HOMA-IR<2 1.629 0.358 0.000 5.098 2.663 10.290FBG (pre-treatment) �0.041 0.012 0.000 0.960 0.938 0.982Viral load 0.024Low 1.298 0.438 0.003 3.662 1.552 8.640Intermediate 0.673 0.331 0.042 1.960 1.023 3.752Non smoker 1.401 0.309 0.000 4.060 2.217 7.436BMI 0.028Normal 1.393 0.462 0.003 4.027 1.629 9.954Overweight 0.590 0.354 0.096 1.804 0.901 3.612Constant 4.340 10216.368 1.000 76.675P value for the model 0.000Classification accuracy 80.6%
SE, standard error; Exp (B), odds ratio; B, regression coefficient.P< 0.05 is significant.P< 0.05 (significant).
J. Med. Virol. DOI 10.1002/jmv
Insulin Resistance and Early Viral Kinetics 437
were limited because of the small sample size. In theaforementioned study, 18.3% of the responders and50.7% of the non-responders were HOMA-IR �2.18compared to 55.6% and 86.5%, respectively found inthe present study. IR appeared to improve with HCVtreatment at 12 weeks irrespective of viral eradica-tion. According to the results of the SENSITIZErandomized controlled trial [Harrison et al., 2012],modification of IR by prior therapy with pioglitazonedid not modify the early or sustained virologicresponse to therapy in patients with genotype 1.Such approach has been reported only for patientswith HCV genotype 4 in a single study from Egypt[Khattab et al., 2010]. However, this is not sufficientto claim that improving insulin sensitivity mayameliorate response to therapy. More recently,Younossi and co-workers found that baseline HOMA-IR correlated with sustained virologic response inunivariate but not multivariate analyses in patientschronically infected with HCV-1 and undergoingtriple therapy, suggesting other factors have a moredirect causal relationship with virologic response totelaprevir-based therapy than HOMA-IR [Younossiet al., 2013].IR was found in the present study to be associated
steatosis, but not hepatic fibrosis. This agrees withthe results of Ziada et al. (2012) but differs to someextent to the results of Kim et al. (2011) who foundno association between IR and hepatic fibrosis. Thesefindings could be limited by the very small samplesize (60 compared to 392 in the present study).Histological evidence of steatosis was significantly
associated with being high BMI. Early virologic re-sponse was not associated with steatosis or periportalfibrosis as detected by liver biopsy. This result contra-dicts reports in other studies that hepatic steatosis isan independent risk factor for poor response to IFN-atherapy [Monto, 2002; Negro, 2006].Higher Ishak scores were significantly associated
with poor early virologic response although liverfibrosis did not appear in the stepwise regressionmodel among the independent predictors of thelatter. High levels of insulin and glucose couldpromote fibrogenesis by stimulating the release ofconnective tissue (fibrogenic) growth factor fromhepatic stellate cells [Paradis et al., 2001].
CONCLUSION AND RECOMMENDATIONS
Both host-related variables including BMI, smok-ing, and metabolic state of IR and viral factors interms of high viral load are involved in the earlytreatment failure. Chronic HCV patient with no IRresponded more rapidly and more efficiently byachieving apparent early virologic responses thanthose having low insulin sensitivity state. Furtherstudies using randomized controlled trial for assess-ing early virologic response in patients with/withoutinsulin resistance treated for 16–18 versus 48 weeksare needed. Accordingly, treatment regimen of
48 weeks for early responders could be shortened toonly 16–18 weeks without compromising the outcome,thus avoiding side effects of unnecessary drug andsaving unaffordable costs. On the other hand, strat-egies to reverse or improve insulin resistance statebefore treatment initiation may have a positive effecton early and sustained viral kinetics in response toHCV therapy.The IR included in the present prediction models is a
cost effective tool, does not need a laborious methods toestimate, and is a potentially modifiable factor that couldbe improved. Pre-treatment assessment of insulin usingHOMA-IR may be used as a determinant for regimenoptimization and individualization in CHC patients.
LIMITATIONS OF THE STUDY
This study was limited by basing all findings ondual anti-HCV therapy, since access to novel treat-ments is limited in low resource countries includingEgypt. Relevant missing information is the determi-nation of the infecting HCV genotype and the IL28Bpolymorphism, two important factors that could affectthe treatment outcome.
ACKNOWLEDGMENTS
We would like to thank Dr. Shehata Farag,lecturer of Biostatistics, High Institute of PublicHealth, Alexandria University, Egypt, for his greathelp in data processing and statistical analysis.
References
Aghemo A,Rumi MG, Colombo M. 2009. Pegylated IFN-alpha2a andribavirin in the treatment of hepatitis C. Expert Rev Anti InfectTher 7:925–935.
Alan F. 2011. HCV treatment: Predictors of treatment response.hscpFACTsheet (7) Hepatitis C Support Project Available atwwwhcvadvocateorg.
Badar S, Khubaib B, Idrees M, Hussain A, Awan Z, Butt S, Afzal S,Akram M, Fatima Z, Aftab M, Saleem S, Munir S, Rauff B,Naudhani M, Ali L, Ali M, Rehman I. 2012. Association ofhepatitis C virus with insulin resistance: Evidences from animalstudies and clinical studies. Hepat Mon 12:11–15.
Banerjee D, Williams EV, Ilott J, Monypenny IJ, Webster DJ. 2001.Obesity predisposes to increased drainage following axillarynode clearance: A prospective audit. Ann R Coll Surg Engl83:268–271.
Berg T, Sarrazin C, Herrmann E, Hinrichsen H, Gerlach T,Zachoval R, Wiedenmann B, Hopf U, Zeuzem S. 2003. Predictionof treatment outcome in patients with chronic hepatitis C:Significance of baseline parameters and viral dynamics duringtherapy. Hepatology 37:600–609.
Bonora E, Targher G, Alberiche M, Bonadonna RC, Saggiani F,Zenere MB, Monauni T, Muggeo M. 2000. Homeostasis modelassessment closely mirrors the glucose clamp technique in theassessment of insulin sensitivity: studies in subjects withvarious degrees of glucose tolerance and insulin sensitivity.Diabetes Care 23:57–63.
Bostan N, Mahmood T. 2010. An overview about hepatitis C: Adevastating virus. Crit Rev Microbiol 36:91–133.
Brandman D, Bacchetti P, Ayala CE, Maher JJ, Khalili M. 2012.Impact of insulin resistance on HCV treatment response andimpact of HCV treatment on insulin sensitivity using directmeasurements of insulin action. Diabetes Care 35:1090–1094.
Bugianesi E, Salamone F, Negro F. 2012. The interaction ofmetabolic factors with HCV infection: Does it matter. J Hepatol56:S56–S65.
J. Med. Virol. DOI 10.1002/jmv
438 Abd El-Wahab et al.
Carrat F, Bani-Sadr F, Pol S, Rosenthal E, Lunel-Fabiani F,Benzekri A, Morand P, Goujard C, Pialoux G, Piroth L, Salmon-Ceron D, Degott C, Cacoub P, Perronne C. 2004. Pegylatedinterferon alfa-2b vs standard interferon alfa-2b, plus ribavirin,for chronic hepatitis C in HIV- infected patients: A randomizedcontrolled trial. JAMA 292:2839–2848.
D’Souza R, Sabin CA, Foster GR. 2005. Insulin resistance plays asignificant role in liver fibrosis in chronic hepatitis C and in theresponse to antiviral therapy. Am J Gastroenterol 100:1509–1515.
Dai CY, Huang JF, Hsieh MY, Hou NJ, Lin ZY, Chen SC, WangLY, Chang WY, Chuang WL, Yu ML. 2009. Insulin resistancepredicts response to peginterferon-alpha/ribavirin combina-tion therapy in chronic hepatitis C patients. J Hepatol50:712–718.
De Coreaga B. 2006. Predictive factors for response to treatment ofchronic hepatitis C. Annals of Hepatology 5:24–28.
Decock S, Verslype C, Fevery J. 2007. Hepatitis C and insulinresistance: Mutual interactions. A review. Acta Clin Belg62:111–119.
Di Marco V, Covolo L, Calvaruso V, Levrero M, Puoti M, SuterF, Gaeta GB, Ferrari C, Raimondo G, Fattovich G, Santanto-nio T, Alberti A, Bruno R, Mussini C, Mondelli M, Donato F,Craxi A. 2013. Who is more likely to respond to dualtreatment with pegylated-interferon and ribavirin for chronichepatitis C? A gender-oriented analysis. J Viral Hepat20:790–800.
El-Zayadi A, Selim O, Hamdy H, El-Tawil A, Badran HM, Attia M,Saeed A. 2004. Impact of cigarette smoking on response tointerferon therapy in chronic hepatitis C Egyptian patients.World J Gastroenterol 10:2963–2966.
El Raziky, Attia M, El D, Akel W, Shaker O, Khatab H, Abdo S,Elsharkawy A, Esmat G. 2013. Hepatic fibrosis and serumalpha-fetoprotein (AFP) as predictors of response to HCV treat-ment and factors associated with serum AFP normalisation aftertreatment. Arab J Gastroenterol 14:94–98.
Eslam M, Aparcero R, Kawaguchi T, Del Campo JA, Sata M,Khattab MA, Romero- Gomez M. 2011. Meta-analysis: Insulinresistance and sustained virological response in hepatitis C.Aliment Pharmacol Ther 34:297–305.
Ge D, Fellay J, Thompson AJ, Simon JS, Shianna KV, Urban TJ,Heinzen EL, Qiu P, Bertelsen AH, Muir AJ, Sulkowski M,McHutchison JG, Goldstein DB. 2009. Genetic variation inIL28B predicts hepatitis C treatment-induced viral clearance.Nature 461:399–401.
Ghany MG, Strader DB, Thomas DL, Seeff LB. 2009. Diagnosis,management, and treatment of hepatitis C: An update. Hepatol-ogy 49:1335- 1374.
Ginaldi L, Loreto MF, Corsi MP, Modesti M, De Martinis M. 2001.Immunosenescence and infectious diseases. Microbes Infect3:851–857.
Grasso A, Malfatti F, De Leo P, Martines H, Fabris P, Toscanini F,Anselmo M, Menardo G. 2009. Insulin resistance predicts rapidvirological response in non-diabetic, non-cirrhotic genotype 1HCV patients treated with peginterferon alpha-2b plus ribavirin.J Hepatol 51:984–990.
Harrison SA. 2006. Correlation between insulin resistance andhepatitis C viral load. Hepatology 43: 1168–1169 1168; authorreply.
Harrison SA, Hamzeh FM, Han J, Pandya PK, Sheikh MY, VierlingJM. 2012. Chronic hepatitis C genotype 1 patients with insulinresistance treated with pioglitazone and peginterferon alpha-2aplus ribavirin. Hepatology 56:464–473.
Idrees M, Riazuddin S. 2009. A study of best positive predictors forsustained virologic response to interferon alpha plus ribavirintherapy in naive chronic hepatitis C patients. BMC Gastro-enterol 9:5.
Ishak K, Baptista A, Bianchi L, Callea F, De Groote J, Gudat F,Denk H, Desmet V, Korb G, MacSween RN, 1995. Histologicalgrading and staging of chronic hepatitis. J Hepatol 22:696–699.
Ismail MH. 2013. Prediction of sustained virologic responses tocombination therapy of pegylated interferon-alpha and ribavirinin patients with chronic hepatitis C infection. J Family Com-munity Med 20:35–40.
Kamal SM, El Kamary, Shardell SS, Hashem MD, Ahmed M,Muhammadi IN, Sayed M, Moustafa K, Hakem A, Ibrahiem SA,Moniem A, Mansour M, Abdelaziz H. 2007. Pegylated interferonalpha-2b plus ribavirin in patients with genotype 4 chronic
hepatitis C: The role of rapid and early virologic response.Hepatology 46:1732–1740.
Kau A, Vermehren J, Sarrazin C. 2008. Treatment predictors of asustained virologic response in hepatitis B and C. J Hepatol49:634–651.
Khattab M, Eslam M, Sharwae MA, Shatat M, Ali A, Hamdy L.2010. Insulin resistance predicts rapid virologic response topeginterferon/ribavirin combination therapy in hepatitis C geno-type 4 patients. Am J Gastroenterol 105:1970–1977.
Kim SR, Saito J, Imoto S, Komaki T, Nagata Y, Nakajima T, AndoK, Fukuda K, Otono Y, Kim KI, Ohtani A, Sugimoto K,Hasegawa Y, Fujinami A, Ohta M, Hotta H, Maekawa Y,Hayashi Y, Kudo M. 2011. Correlation between insulin resist-ance and outcome of pegylated interferon and ribavirin therapy,hepatic steatosis, hepatic fibrosis in chronic hepatitis C-1b andhigh viral load. Digestion 84:5–9.
Lavanchy D. 2009. The global burden of hepatitis C. Liver Int29:74–81.
Lee SS, Heathcote EJ, Reddy KR, Zeuzem S, Fried MW, Wright TL,Pockros PJ, Haussinger D, Smith CI, Lin A, Pappas SC. 2002.Prognostic factors and early predictability of sustained viralresponse with peginterferon alfa-2a (40KD). J Hepatol 37:500–506.
McCullough AJ. 2003. Obesity and its nurturing effect on hepatitisC. Hepatology 38:557–559.
McHutchison JG, Lawitz EJ, Shiffman ML, Muir AJ, Galler GW,McCone J, Nyberg LM, Lee WM, Ghalib RH, Schiff ER, GalatiJS, Bacon BR, Davis MN, Mukhopadhyay P, Koury K, NovielloS, Pedicone LD, Brass CA, Albrecht JK, Sulkowski MS. 2009.Peginterferon alfa-2b or alfa-2a with ribavirin for treatment ofhepatitis C infection. N Engl J Med 361:580–593.
Merchante N, de los Santos-Gil, Merino I, Gonzalez-Serrano D,Mira M, Sanz-Sanz JA, Fernandez-Fuertes J, Ruiz-Morales E,del Valle J, Macias J, Moro J, Pineda A. 2009. Insulin resistanceis not a relevant predictor of sustained virological response topegylated interferon plus ribavirin in HIV/HCV co-infectedpatients. J Hepatol 50:684–692.
Miyajima I, Kawaguchi T, Fukami A, Nagao Y, Adachi H, Sasaki S,Imaizumi T, Sata M. 2013. Chronic HCV infection was associ-ated with severe insulin resistance and mild atherosclerosis: Apopulation-based study in an HCV hyperendemic area. J Gastro-enterol 48:93–100.
Monto A. 2002. Hepatitis C and steatosis. Semin Gastrointest Dis13:40–46.
Mukaiya M, Nishi M, Miyake H, Hirata K. 1998. Chronic liverdiseases for the risk of hepatocellular carcinoma: A case-controlstudy in Japan. Etiologic association of alcohol consumption,cigarette smoking and the development of chronic liver diseases.Hepatogastroenterology 45:2328–2332.
Negro F. 2006. Insulin resistance and HCV: Will new knowledgemodify clinical management. J Hepatol 45:514–519.
Ouzan D, Khiri H, Penaranda G, Joly H, Halfon P. 2005. Kineticsof hepatitis C virus RNA load during pegylated interferon alpha-2a and ribavirin treatment in naive genotype 1 patients. CompHepatol 4:9.
Paradis V, Perlemuter G, Bonvoust F, Dargere D, Parfait B, VidaudM, Conti M, Huet S, Ba N, Buffet C, Bedossa P. 2001. Highglucose and hyperinsulinemia stimulate connective tissuegrowth factor expression: A potential mechanism involved inprogression to fibrosis in nonalcoholic steatohepatitis.Hepatology 34:738–744.
Parise ER, Oliveira AC. 2007. [Insulin resistance in chronichepatitits C]. Arq Gastroenterol 44:178–184.
Peres DP, Cheinquer H, Wolf FH, Cheinquer N, Falavigna M, PeresLD. 2013. Prevalence of insulin resistance in chronic hepatitis Cgenotype 1 and 3 patients. Ann Hepatol 12:871–875.
Pessione F, Ramond MJ, Peters L, Pham BN, Batel P, Rueff B,Valla DC. 2003. Five-year survival predictive factors in patientswith excessive alcohol intake and cirrhosis. Effect of alcoholichepatitis, smoking and abstinence. Liver Int 23:45–53.
Petta S, Camma C, Di Marco V, Alessi N, Cabibi D, Caldarella R,Licata A, Massenti F, Tarantino G, Marchesini G, Craxi A.2008. Insulin resistance and diabetes increase fibrosis in theliver of patients with genotype 1 HCV infection. Am J Gastro-enterol 103:1136–1144.
Qureshi S, Batool U, Iqbal M, Burki UF, Khan NU. 2011. Pre-treatment predictors of response for assessing outcomes to
J. Med. Virol. DOI 10.1002/jmv
Insulin Resistance and Early Viral Kinetics 439
standard treatment in infection with HCV genotype 3. J CollPhysicians Surg Pak 21:64–68.
Romero-Gomez M, Del Mar Viloria, Andrade M, Salmeron RJ,Diago J, Fernandez-Rodriguez M, Corpas CM, Cruz R, GrandeM, Vazquez L, Munoz-De-Rueda L, Lopez-Serrano P, Gila P,Gutierrez A, Perez ML, Ruiz-Extremera C, Suarez A, Castillo E.2005. Insulin resistance impairs sustained response rate topeginterferon plus ribavirin in chronic hepatitis C patients.Gastroenterology 128:636–641.
Shaheen M, Echeverry D, Oblad MG, Montoya MI, TeklehaimanotS, Akhtar AJ. 2007. Hepatitis C, metabolic syndrome, andinflammatory markers: Results from the Third National Healthand Nutrition Examination Survey [NHANES III]. Diabetes ResClin Pract 75:320–326.
Shaker OG, Eskander EF, Yahya SM, Mohamed MS, Abd-Rabou AA.2011. Genetic variation in BCL-2 and response to interferon inhepatitis C virus type 4 patients. Clin Chim Acta 412:593–598.
Suppiah V, Moldovan M, Ahlenstiel G, Berg T, Weltman M, AbateML, Bassendine M, Spengler U, Dore GJ, Powell E, Riordan S,Sheridan D, Smedile A, Fragomeli V, Muller T, Bahlo M,Stewart GJ, Booth DR, George J. 2009. IL28B is associated withresponse to chronic hepatitis C interferon-alpha and ribavirintherapy. Nat Genet 41:1100–1104.
Suzuki N, Takahashi C. 2007. [Effect of social context on middle-wayjudgments among the Japanese]. Shinrigaku Kenkyu 77:528–533.
Svegliati-Baroni G, Bugianesi E, Bouserhal T, Marini F, Ridolfi F,Tarsetti F, Ancarani F, Petrelli E, Peruzzi E, Lo Cascio, RizzettoM, Marchesini M, Benedetti G. 2007. Post-load insulin resist-ance is an independent predictor of hepatic fibrosis in virus Cchronic hepatitis and in non-alcoholic fatty liver disease. Gut56:1296–1301.
Tarantino G, Conca P, Sorrentino P, Ariello M. 2006. Metabolicfactors involved in the therapeutic response of patients withhepatitis C virus-related chronic hepatitis. J GastroenterolHepatol 21:1266–1268.
Tsoulfas G, Goulis I, Giakoustidis D, Akriviadis E, Agorastou P,Imvrios G, Papanikolaou V. 2009. Hepatitis C and liver trans-plantation. Hippokratia 13:211–215.
Vachon ML, Factor SH, Branch AD, Fiel MI, Rodriguez-Torres M,Brau N, Sterling RK, Slim J, Talal AH, Dieterich DT,Sulkowski MS. 2011. Insulin resistance predicts re-treatmentfailure in an efficacy study of peginterferon-alpha-2a andribavirin in HIV/HCV co-infected patients. J Hepatol 54:41–47.
Watanabe K, Eto K, Furuno K, Mori T, Kawasaki H, Gomita Y.1995. Effect of cigarette smoke on lipid peroxidation and liverfunction tests in rats. Acta Med Okayama 49:271–274.
.World Health Organization. Updated July 2013. Hepatitis C.Available from: http://wwwwhoint/mediacentre/factsheets/fs164/en/ Fact sheet N˚164.
Younossi Z, Negro F, Serfaty L, Pol S, Diago M, Zeuzem S,Andreone P, Lawitz EJ, Roberts S, Focaccia R, Foster GR,Horban A, Lonjon-Domanec I, Coate B, DeMasi R, Picchio G,Witek J. 2013. Homeostasis model assessment of insulinresistance does not seem to predict response to telaprevir inchronic hepatitis C in the REALIZE trial. Hepatology 58:1897–1906.
Ziada DH, El Saadany, Enaba S, Ghazy M, Hasan M. 2012. Theinteraction between insulin resistance, liver fibrosis and earlyvirological response in Egyptian patients with chronic hepatitisC. Can J Gastroenterol 26:325–329.
J. Med. Virol. DOI 10.1002/jmv
440 Abd El-Wahab et al.