ORGANIZATIONAL CULTURE AS A PREDICTOR ... - ShareOK
232
ORGANIZATIONAL CULTURE AS A PREDICTOR OF THE LEVEL OF SALESPERSONS' CUSTOMER ORIENTED BEHAVIOR BY MICHAEL ROY WILLIAMS Bachelor Business Administration University of Oklahoma Norman, Oklahoma 1968 Master of Business Administration University of Oklahoma Norman, Oklahoma 1970 Submitted to the Faculty of the Graduate College of the Oklahoma State University in partial fulfillment of the requirements for the Degree of DOCTOR OF PHILOSOPHY July, 1992
-
Upload
khangminh22 -
Category
Documents
-
view
3 -
download
0
Transcript of ORGANIZATIONAL CULTURE AS A PREDICTOR ... - ShareOK

ORGANIZATIONAL CULTURE AS A PREDICTOR OF THE
LEVEL OF SALESPERSONS' CUSTOMER
ORIENTED BEHAVIOR
BY
MICHAEL ROY WILLIAMS
Bachelor Business Administration University of Oklahoma
Norman, Oklahoma 1968
Master of Business Administration University of Oklahoma
Norman, Oklahoma 1970
Submitted to the Faculty of the Graduate College of the
Oklahoma State University in partial fulfillment of
the requirements for the Degree of
DOCTOR OF PHILOSOPHY July, 1992

/hesl? jCJq ~\ D
W7d5o
lJl~M~oiiNI SttJte Univ. lihrtJif
ORGANIZATIONAL CULTURE AS A PREDICTOR OF THE
LEVEL OF SALESPERSONS' CUSTOMER
ORIENTED BEHAVIOR
Thesis Approved:
w.· .llfl':h
ii

COPYRIGHT
By
Michael Roy Williams
July, 1992

ACKNOWLEDGEMENTS
I wish to express my sincere appreciation to Dr. Stephen Miller
for his patience, advice, and encouragement throughout my graduate ''
program and particularly in 'my writing this dissertation.. Many thanks
also go to Dr. Josh Wiener, Dr. Steve Barr, and Dr. Paul Harper for
their questions, comments, suggestions and support while serving as my
professors and committee members. I also wish to extend my gratitude to
Dr. Jerry Goolsby for his continued support and guidance and the Richard
D. Irwin Foundation for their recognition of this dis~ertation with
national honors and a financial award.
Most importantly, to my wife and best friend, Marilyn, whose love,
sacrifice, and encouragement inspires me to reach for my dreams, my love
and recognition go to you for all that you did and still do for me.
Thanks also go to my mother and father, Goldie and Roy Williams, whose
love, guidance, and devotion serve as a tremendous influence on what I
have accomplished in my life. The inspiration to question and serve
through research and teaching was instilled and nurtured early on.
I also thank my friends· for their manifest and continuing support
throughout this process. Special .thanks certainly go to my mother-in
law and father-in-law, June and Kenny Henry for the encouragement they
provide to me and assistance they lend to my family when ~y career takes
me away from home.
Finally, I recognize and thank our daughters, Aimee and Kerri, for
all their loving support, faith, and dedieation to making it all work--
even under some of the most difficult circumstances.
My degree belongs to each one of you, ·for you have all provided
invaluable support and encouragement. Each of you hold a very special
place in my life and in my career. Thank you for making it possible.
iii
Chapter
I.
TABLE OF CONTENTS
INTRODUCTION
Customer Orientation' Is Nothing New Fundamental Questions . . . . . . . . A Need To Link Two Streams of Research . . . . Organizational Environment: Climate and Culture Purpose of This Study . . . . . A Substantive Contribution An Outline of the Dissertation
II. LITERATURE REVIEW
Customer Orientation Organizational Culture . The Organizational Culture
...... and Customer
Orientation Relationship
III. RESEARCH DESIGN AND METHODOLOGY
Research Objectives .. Description of Samples Data Collection Process Scale Development . . . . . . . . Testing the Posited Relationships
Organizational Culture and Customer Orientation . . . . .
IV. RESEARCH FINDINGS: SCALE DEVELOPMENT
Description of Respondents
.... Between
Specification of Domains , . . . First Data Collection: Pre-Pilot Survey Second data Collection: Pilot Survey . . Item Reduction . . . . . . . . . . . . . Field Study . . . . . . . . . . . . . . . . Item Purification and Reliability Assessment Assessment af Validity . . . . . .
IV. RESEARCH FINDINGS: TESTS OF HYPOTHESES
Working Hypotheses Tests of Hypotheses . .
V. DISCUSSION AND IMPLICATIONS
Overview of Supporting Literature Methodology . . . . . . . . . . . Findings and Implications . . . . Limitations of Research . . . . . . Recommendations for Future Research
iv
Page
1
2 2 4 7
11 13 15
16
16 23
47
50
so 53 57 57
67
69
70 77 79 83 83
122 124 142
150
151 157
173
173 175 178 181 183
Chapter
REFERENCES
APPENDIX A INITIAL ITEM LISTINGS
APPENDIX B THE PRE-PILOT SURVEY INSTRUMENT
APPENDIX C THE PILOT SURVEY INSTRUMENT
APPENDIX D THE FIELD SURVEY INSTRUMENT
v
Page
184
195
205
209
215
LIST OF TABLES
Table
1. Selected Definitions of Organizational Culture
2.
3.
4.
Primary Management Styles . . .
Frequencies of Pre-Pilot Survey Respondents by Product Types . . . . . . . . . . . .
Frequencies of Pre-Pilot Survey Respondents by Employment Types . . . . . . . . . . .
5. Summary of Pilot Study Average Demographics by All Respondents and Sales Only Respondents .
6. Frequencies of Pilot Study Respondents by Product Type for All Respondents and Sales Only Respondents
7. Summary of Field Study Demographics by Sales Only Res~ondents . . . . . . .
8. Frequencies of Field Study Respondents by Product Type for Sales Only Respondents . . . . . . . . . .
9.
10.
Reliability Estimates Resulting from Analysis of Pre-Pilot Survey Results by Posited Components of Organizational Culture . . . . . . . . .
Revised Item Statements for Reward Component in the Pre-Pilot Survey . . . . . . . . . .
11. Pilot Test Item-to-Total Correlations and Alpha Statistics for Organizational Culture . . . .
12. Summary of Organizational Culture Factor Eigenvalues
13.
14.
15.
16.
17.
18.
Organizational Culture Factor Analysis Six Factor Solution . . . . . . . . .
Organizational Culture Factor Analysis Seven Factor Solution . . . . . . . .
Organizational Culture Factor Analysis Eight Factor Solution . . . . . .
Pairwise Correlations for Factor One Items
Factor Loadings on Reduced 23 Item Statements of Organizational Calture Scale . . . . . .
Alpha Estimates of Reliability for the Reduced 23 Item Statements of Organizational Culture Scale
vi
Page
25
45
71
71
72
73
75
76
80
82
86
91
94
95
97
100
102
103
Table
19. Non-Redtape Item-to-Total and Pairwise Correlations Items Xl2, X6, and X4 ...... .
20. Pilot Test Item-to-Total Correlations and Alpha Statistics for Customer Orientation . . . . .
21. Summary of Customer Orientation Factor Eigenvalues
22.
23.
24.
25.
26.
27.
Customer Orientation Factor Analysis Six Factor Solution . . . . . . . .
Customer Orientation Factor Analysis Five Factor Solution - Iteration 1
Customer Orientation Factor Analysis Five Factor Solution - Iteration 2
Customer Orientation Factor Analysis Five Factor Solution - Iteration 3
Customer Orientation Factor Analysis Five Factor Solution - Iteration 4
Alpha Estimates of Reliability for the Final Customer Orientation Measure
28. Organizational Culture Item Location Key from Pilot Survey to Field Survey Instrument .
Page
104
107
111
113
115
117
118
119
120
123
29. Customer Orientation Item Location Key from Pilot Survey to Field Survey Instrument . . . . . . . . . . . . . . 124
30.
31.
32.
33.
34.
35.
36.
Corrected Item-to~Total and Pairwise Correlations for PROACTIVE Dimension Items . . . . . . . . .
Corrected Item-to-Total and Pairwise Correlations for NONCOMPLEX Dimension Items . . . . . . . .
Corrected Item-to-Total and Pairwise Correlations for NON-REDTAPE Dimension Items . . . . . . . .
Alpha Estimates of Reliability for the Final Organizational Culture Measure
Confirmatory Factor Analysis for the Final Organizational Culture Measure . . . . .
Corrected Item-to-Total and Pairwise Correlations for FOLLOW-UP Dimension Items ........ .
Corrected Item-to-Total and Pairwise Correlations for DOUBLE-WIN Dimension Items . . . . .
37. Alpha Estimates of Reliability for the Customer Orientation Measure
38.
39.
Confirmatory Factor Analysis for the Customer Orientation Measure
Second Factor Analysis for the Customer Orientation Measure with Number of Factors Unrestricted . . .
vii
125
125
126
127
128
129
129
131
132
136
Table
40.
41.
42.
43.
44.
45.
46.
47.
48.
Corrected Item-to-Total and Pairwise Correlations for NEED Dimension Items . . . . . . . . . . .
Corrected Item-to~Total and Pairwise Correlations for MANIPULATE/DECEIT dimension items . . . . .
Corrected Item-to-Total and Pairwise Correlations for DOUBLE-WIN Dimension Items . . . . . . . .
Corrected Item-to-Total and Pairwise Correlations for PRESSURE Dimension !'terns . . . . . . . . . .
Corrected Item-to-Total and.Pairwise Correlations for- FOLLOW-UP Dimension Items . . . ··. . . . . .
Corrected Item-to-Total and Pairwise Correlations for REPRESENT Dimension Items . . . . . . . . .
Third Factor Analysis for the Customer Orientation Measure with Number of Factors Unrestricted
Final Factor Analysis for the Customer Orientation Measure . . . . . . . . .
Alpha Estimates of Reliability for the Final Customer Orientation Measure
49. Constructs and Methods of Measurement for the Multi-trait Multi-method Analysis of the 'scales for Organizational
Page
138
138
139
139
140
140
141
143
144
Culture, Customer, Orientation, and Job Satisfaction 144
50. Multi-trait Multi-method Analysis of the Scales for Organizational Culture, Customer Orientation, and Job Satisfaction . . . . . . . . . . . . 145
51. Pairwise Correlations of ORGCUL and CUSTOR Measures with Organizational'Commitment, Work Motivation, Ability to Help, and Long-term Relations' . . . . 148
52. Integrating the Bureaucratic and Clan Cultures with the Seven Dimensions of the ORGCUL Scale . . . 151
53. Summary Data Description
54. Regression Analysis of Organizational Culture with Customer Orientation . . . . . . . . .
55. Univariate Regression Analysis of the Individual Dimensions of Organizational Culture with Customer Orientation . . . . . . . . . . . . .
56. Forward Step-wise Multiple Regression Analysis of the Individual Dimensions of Organizational Culture with Customer Orientation . . . . . . . . . . .
57. Forced Entry Multiple Regression Analysis of the Individual Dimensions of Organizational Culture with Customer Orientation . . . . . . . . . . .
58. Pairwise Correlations between Independent Variables
viii
159
160
162
166
167'
168
Table Page
59. Tolerance and Variance Inflation Factors for the PROACTIVE, EMPOWER, and TEAM dimensions of Organizational Culture 169
60. Forced Entry Multiple Regression Analysis of the PROACTIVE, EMPOWER, and TEAM Dimensions of Organizational Culture with Customer Orientation . . . . . . . . . . . . . . . . 170
ix

LIST OF FIGURES
Figure
1. Comparison of Research Stream Focus . . . . . . . . ..
2. Determinants of Salesperson Behavior and Performance
3. The Nature of Organizational Culture
4. Group Influences on Individual Behavior
5. Cultural Infl~ences - Individual Influences
6. Organizational Culture, Customer Orientation and Performance of the Firm ...... ' ..
7. Relationship of Organizati~nal Culture Dimensions and Customer Oriented Behavior . . . . . .
8. Scree Plot of Unrestricted Factor Analysis on Organizational Culture Data . . . . . . . .
9. Scree Plot of Unrestricted Factor Analysis on Customer Orientation,Data . . . . . .
X
.
.
. .
. . .
Page
6
12
29
34
37
48
49
92
112
CHAPTER I
INTRODUCTION
Emphasizing the need to build long7term relationships with
customers, the popular idioms of "customer focus" and "marketing focus"
are once again gaining attention as an all encompassing business
objective for competing in today's ultra-competitive global marketplace.
Indeed, the short-term focus and failure of financial budgeting in
strategic planning has re-directed business strategy toward a customer
orientation with marketing and the marketing concept once again taking a
central role in the strategy of the firm (Webster 1981, 1988).
This revival of practitioner and researcher interest has sparked
considerable investigation into the domain and the implications of the
marketing concept (Webster 1981; Houston 1986; Parasuraman 1987; Webster
1988; Shapiro 1988; Deshpande and Webster 1989; Padmanabhan 1990; Kohli
and Jaworski 1990). Other researchers conceptualize and support various
relationships between a customer focus strategy and performance (Strong
1925; Levitt 1960; Peters and Waterman 1982; Saxe and Weitz 1982; Kotler
1984; Kotler and Andreason 1987; Webster 1988; Crosby and Evans 1989;
Marquardt 1989; Narver and Slater 1989), yet little progress has been
made toward ,explaining the difficulty most firms encounter in
successfully implementing the marketing concept. Scholars and
practitioners allke call for research addressing the recurring question:
Why do so many firms espouse the philosophy of customer orientation, yet
so few successfully achieve this orientation (Felton 1959; Webster 1981;
Houston 1986; Webster 1988; Parasurama~ 1987; Kohli and Jaworski 1990;
Padmanabhan 1990)? These lamentations further echo the Marketing
Science Institute (1988, 1989) in calling for research to identify and
1

explicate the antecedents for successful implementation of customer
orientation.
Customer Orientation Is Nothing New
The concept of a business enterprise maintaining a customer focus !
is certainly nothing new. Adam Smith (1776) advocated that the purpose
of a business enterprise was to serve consumption. Bell and Emory
(1971) further documented this emphasis on the customer as it is
reflected in early marketing texts. These early texts emphasized that
providing customer satisfaction is the purpose of marketing. Indeed,
Converse and Huegy (1946) state:
2
Business functions to satisfy the needs of the consumers. The first measure of the success of any business is how well it serves the customers. If an operation is not in the interest of the consumers, it is not justified, no matter how profitable it may be to its owners. He profits most who serves best.
Regardless of its early inclusion in the study of ~arketing,
little if any research or practical application of the concept was
realized until the 1950's when Drucker (1954) and McKitterick (1958)
first referenced it as an internalized philosophy of conducting
business. Keith (1960) further popularized the marketing concept and by
1965, practically all marketing introductory texts included major
references to customer orientation and the marketing concept.
Fundamental Questions
Despite over three decades of eminence within the marketing
discipline, the s,trong belief in the superiority of external market
oriented strategies has been "based solely upon intuition and casual
evidence" (Narver and Slater 1989, p. 1). Empirical investigation into
the causes and effects of market orientation have been hampered by the
lack of generalizable measures of the construct with proven reliability
and validity. This la~k of investigation has historically left several
fundamental questions unanswered:
1. What, if any, relationship exists between the market orientation of a firm and its performance?
2. What is a market orientation?
3
3. How can a market orientation be created and sustained?
The 1989 research study by Narver and Slater is the first study
possessing evidence of reliability and validity that empirically
investigates the long conceptualized relationship between market
orientation and performance. In their analysis of the relationship
between market orientation and performance, Narver and Slater infer
market orientation to be a higher level uni-dimensional ~onstruct
composed of three highly related components: (1) customer orientation,
(2) competitor orientation, and (3) inter-functional coordination. In
their investigati~n, Narver and Slater find support, at both the
construct level and component levels, for a positive relationship with
performance. That is, a statistically significant relationship with
performance was exhibited for the construct market orientation and each
of the construct's co~ponents: customer orientation, competitor
orientation, and inter-functional coordination.
This support for a positive relationship between a firm's market
orientation and its performance empha~izes the need to extend our
understanding of market orientation. How does market orientation relate
to performance? What are the antecedents of the construct? The
findings of Narver and Slater begin to answer the fundamental question
regarding the conceptualized relationship between market orientation and
performance. Nevertheless, the questions regarding what specifically
makes up market orientation remain unanswered. Furthermore, to date, no
research has been 'conducted to investigate the conditions antecedent to
the genesis of market oriented behavior.
By focusing on one single component of market orientation-
customer orientation--this study begins to address the paucity of
research into what makes up market orientation and how market
4
orientation can be created and sustained. Identifying and understanding
the elements influencing the creation and implementation of this
individual component, customer orientation, will advance our knowledge
of the larger market orientation construct.
A Need To Link Two Streams of Research
Interpersonal contact is a criti~ally important element in the
marketing mix of most firms. As discussed by Spiro and Perreault
(1979), if this contact is not effective, revenues are ~ost and
opportunity costs can be substantial. However, while sales training
costs run well over a,billion dollars annually, progress in improving
interpersonal contact skills continues to be impeded by the very limited
knowledge as to what factors play an influential part in encouraging
salespeople to initiate and maintain effective customer contact behavior
(Weitz 1981).
Marketing's Narrow External Focus
Empirical studies concerning sales performance levels have
produced very inconsistent results as to what factors affect the sales
performance and the strength of the resulting relationships (Churchill
et al. 1985). Furthermore, an all too common problem in this stream of
research from marketing scholars is an external focus upon consumer
behavior issues. This fixation upon consumer behaviar issues external
to the organization has transpired at the neglect of internal
organizational factors as determinants of salesperson performance. As
documented by Churchill et al. (1985, p. 109), the investigation of how
internal organizational factors affect the performance of salespeople
has been concentrated in only a handful of studies over the last 40
years.
Marketing scholars did turn to the behavioral sciences for
theoretical understanding on marketing issues in the late 1960's.
Nevertheless, marketing studies maintained a predominate focus toward
improved understanding of consumer behavior issues (Deshpande and
Webster 1989). Hunt (1991, p. 93) emphasizes this dominance of an
external focus in marketing as he derives and develops the four
fundamental explananda of marketing: (1) Buyer Behavior, (2) Seller
Behavior, (3) Formation of Institutions, and (4) Consequences to
5
Society. In discussing the second explananda, seller behavior, Hunt
laments the sparse research on matters influencing sellers's behavior
and cites Lutz's,(l979, p. 5) observation that it is extremely
unfortunate that examination of consumer behavior makes up the vast bulk
of theory-based behavioral research in marketing. In Parasuraman and
Deshpande's (1984) discussion of this narrow external focus of research
in marketing, these two marketing scholars call for an integration of
thought from the stream of research developed in organizational
behavior:
It seems almost trite to note that the empirical focus in marketing management has been on marketing almost to the exclusion of management. This implies an assumption that if product and market considerations are specified accurately, internal management issues will take care of themselves. Such an almost exclusively demand-side perspective ignores the fundamentals of erganizational behavior.
Added Potential From an Internal Focus
Just as the marketing discipline has been predominantly concerned
with issues external to the organization, research streams from
organizational theory and organizational behavior have been
predominantly concerned with issues internal to the organization. This
internal stream of research has been concerned with the influence of
organizational structure and job design upon job satisfaction,
motivation, and efficiency of employee performance.
The difference between the external research stream from marketing
and the internal research stream from organizational behavior is
depicted in Figure 1.

.------ MARKETING AND SALES MANAGEMENT RESEARCH -------,
PERSONAL CHARACTERISTICS IIIII ..
"INTERNAL OUTCOME"
in form of IIIII~ EMPLOYEE BEHAVIOR
"EXTERNAL OUTCOME"
in form of CONSUMER BEHAVIOR
.-------ORGANIZATIONAL BEHAVIOR RESEARCH--------,
ORGANIZATIONAL CHARACTERISTICS IIIII ~ II INTERNAL
OUTCOME" in form of
EMPLOYEE BEHAVIOR
PERSONAL IIIII~!!:=======!.! CHARACTERISTICS
.-------- PROPOSED COMBINED APPROACH ---------,
ORGANIZATIONAL CHARACTERISTICS
~============~
PERSONAL CHARACTERISTICS
IIIII~ "INTE!UfAL OUTCOME"
in form of IIIII~ EMPLOYEE BEHAVIOR
11111 .. 1.!==::::==:=!1
"EXTERNAL OUTCOME"
in form of CONSUMER BEHAVIOR
Figure 1. Comparison of Research Stream Focus
6
7
As previously discussed, marketing and sales management research
has traditionally focused upon issues external to the firm: (1) The
impact that personal characteristics (e.g., skill, aptitude, motivation,
role perceptions) have on employee behaviors as internal outcomes, and
(2) the influence employee behaviors have upon some measure of consumer
behavior--external outcomes.
On the other hand, scholars in sociology, psychology, and
organizational behavior have been concerned with issues internal to the
firm: The influence that (1) various organizational characteristics
(e.g., organizational structure, job characteristics, leadership
characteristics, and work group relationships) and (2) personal
characteristics (e.g., aptitude, skill, motivation, role perceptions)
have on employee behavior--internal outcomes.
The position taken by this study is that a more comprehensive
understanding of the total process influencing external outcomes can
only develop through a blending or fusion of these two independent
streams of research. More specifically, this paper posits the need to
investigate the orga~ization's internal environment--its culture--as a
determinant of employee behavior and in this manner an influence on the
level of customer oriented behavior of sale,speople.
Organizational Environment: Climate and Culture
Research in the area of organizational behavior has roots going
back into the literature of anthropology in the 1930's. It has since
been augmented through the disciplines of sociology and psychology. As
the field continued to mature, the amorphous conceptualizations of
organizational psychology became more sophisticated and researchers
altered their locus of attention toward the undercurrent of influence-
that is, organizational climate (Litwin and Stringer 1968).
The field of organizational research continued to flourish through
the 1970's. Ultimately, these research activities were formalized into
several sub-fields of management: organizational behavior;
organizational theory; human resources management; etc. As the fields
of organizational behavior and organizational theory continued to
mature, there was a growing frustration among many management scholars
with the inability of accepted views of the organization and
organizational climat~ to produce substantial explanations. Stemming
from this grawing frustration--around 1980~-management scholars
introduced a new construct, organizational culture, into their research
(Ott 1989).
Culture Is Different'Than Climate
A review of the literature indicates some confusion regarding the
domains of climate versus culture. Much of the confusion results from
the many definitions in use fqr each of the constructs. Further
confusion seems to come from the close kinship of the two constructs.
Although Smircich and Calas (1987) suggest culture is simply climate
reborn, most researchers recognize the two as related but different
concepts.
8
Climate is generally viewed as the popular conception of what goes
on in the organization: the routines and behaviors, policies,
practices, rewards, support and expectations that are pervasive in
everyday behavior (Schneider 1985; Deshpande and Webster 1989; Schein
1990). Characterized as such, climate is the more tangible concept,
lending itself to direct observation and measurement (Schein 1990, p.
109). However, climate is descriptive in nature rather-than evaluative
(Joyce and Slocum 1979) and is viewed as the manifestation of the
underlying culture (Schneider 19-85).
Culture refers to a deeper issue than climate: the norms,
meanings, and values that members believe underlie the climate
(Schneider 198-5; Deshpande and Webster 1989). Thus culture can be seen
to refer to the why things happen the way they do around the
organization (Deshpande and,Webster 1989). Weitz and Wensley (1990)
provide a rich explanation of the simultaneous difference and
relationship between climate and culture stating "Only a symptom
(climate) can be seen; the disease (culture) must be inferred from what
is perceived."
The organizational culture school is a radic.al departure from the
traditional systems and structural.perspectives of organization theory.
Rejecting the assumptions of the traditional schoel, organizational
culture assumes that many behaviors within the organization are
virtually predetermined by the pa·tterns of shared basic assumptions
existing in the organization. Preferences and behaviors are no longer
controlled by formal rules and authority. Rather, they are controlled
by the norms, values, beliefs, and assumptions of the culture (Ott
1989). Consequently, in order to understand or predict behavior, one
must know the patterns of basic assumptions and shared values and
beliefs--the organizational culture.
The Culture Perspective in Marketin&
9
Most of the manageme.nt research dealing wi·th organizational
culture has viewed culture from the perspective pf a dependent variable.
However, marketing scholars·· began to conceptualize the rich potential
explanatory power of organizational culture as a predictor variable ,in
the middle 1980's. Patasuraman and Deshpande (1984), Deshpande and
Parasuraman (1984), and Parasuraman (1985, 1987) fir'st conceptualized a
specific type of organizational culture that would p.ositively influence
the marketing function and thus the performance of a .firm. As
conceptualized by these marketing s~holars 1 this ideal culture for
marketing organizations would be made up by interactive cultural (norms)
and knowledge reflecting the organization's communications network.
This specific culture is envisioned to influence perfermance due to the
boundary spanning roles typically called for in selling organizations.

10
Parasuraman (1987, p. 45) further posits the characteristics of this
culture to be highly supportive of customer oriented behavior as he
asserts customer oriented culture is a prerequisite for success in the
marketplace: "In a market crowded by competitors claiming to be
concerned about customer satisfaction, the real winners will be the ones
with a truly customer oriented corporate culture." Emphasizing the
acute need for empirical study in this area, Deshpande and Parasuraman
(1984, p. 137) hypothesize that organizational culture "can account for
a substantial variance in marketing performance, especially the residual
variance that traditional independent variables cannot explain ... ".
Also conceptualizing the importance of a organizational culture in
marketing, Payne exhorts "successful development of a marketing
orientation requires a thorough understanding of the organization's
existing culture ... " (1988).
The significant potential for organizational culture in marketing
is further evidenced in recent conceptual work from o,ther marketing
scholars. Mahajan, Varadarajan, and Kerin (1987) counsel that" ... the
next phase of development of strategic market planning must involve a
formal integration of organizational culture issues." The Marketing
Science Institute further prods research in t~is area asking, "What is
the impact of corporate culture on a firm's market orientation and its
ability to implement a market oriented strategy?" (1988, p. 7).
Deshpande and Webster (1989) further take a substantial position
regarding the importance of developing an understanding of
organizational culture and its role in marketing management issues with
an emphasis on further understanding of customer orientation.
In his 1986 work, Hofstede chastises theoreticians for the dearth
of empirical work in organizational culture, stating "the message to
university and corporate research departments is, that, with regard to
organizational culture, there is a strong need for speculating less and
measuring more." Parallelling this call for moving organizational

11
culture beyond discovery and on into justification are the calls for the
need to research how a company can become customer oriented. The
Marketing Science Institute (1988, p. 7) cites an urgent need for
research on "developing and maintaining a customer and market focus."
Following his exhortation regarding the need to understand an
organization's culture in order to develop a customer orientation, Payne
(1988) professes" ... while the recognition, of this need is widespread,
there is remarkably little literature dealing with how to develop such
an orientation." The plea for research in this area continues
unanswered even today. In demonstrating market orientation's
significant effect on performance, Narver and Slater (1989, 1990) state
the most important question has become paramount: "How does one create
and sustain a market orientation?"
Pu~pose of This Study
This study specifically addresses the research question: How does
a firm create and sustain a customer orientation? In answering this
question, this study posits and investigates organizational culture as
an antecedent for the effective implementation and maintenance of
customer orientation within a sales organization. As an exploratory
investigation, this study is prima~ily concerned with the individual
salesperson's perception of the predominant organizational sub-culture
relevant to the selling organization as opposed to the culture of the
organization as a whole.
As a type of salesperson behavior (Saxe and Weitz 1982; Williams
and Wiener 1990), customer orientation bears a close correspondence to
Weitz, Sujan, and Sujari' s (1,986) construct of adaptive selling. Like
adaptive selling, customer orientation is a function of many variables,
including personal characteristics, organizational characteristics,
environmental characteristics, motivation, skill and ability, aptitude,
and role perception. This relationship among the multiple influences
I
12
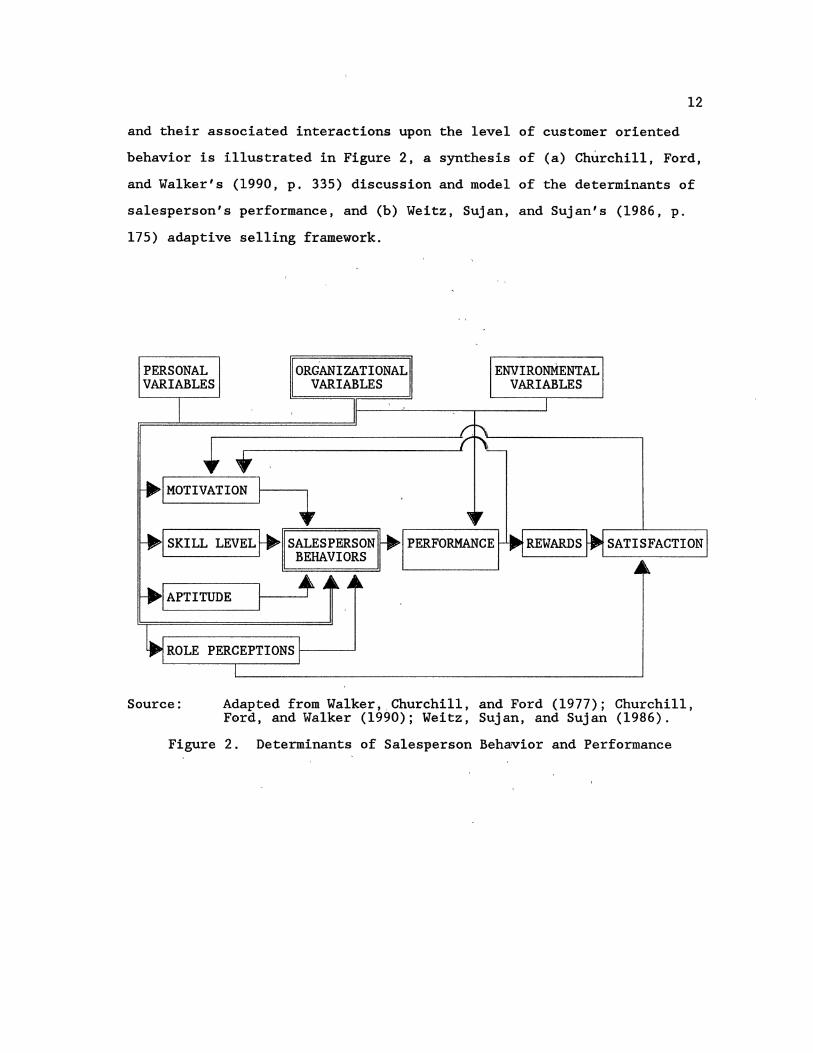
and their associated interactions upon the level of customer oriented
behavior is illustrated in Figure 2, a synthesis of (a) Churchill, Ford,
and Walker's (1990, p. 335) discussion and model of the determinants of
salesperson's performance, and (b) Weitz, Sujan, and Sujan's (1986, p.
175) adaptive selling framework.
PERSONAL VARIABLES
I MOTIVATION
ORGANIZATIONAL VARIABLES
I SKILL LEVEL~ SALESPERSON · · BEHAVIORS
I APTITUDE
ENVIRONMENTAL VARIABLES
Source: Adapted from Walker,,Churchill, and Ford (1977); Churchill, Ford, and Walker (1990); Weitz, Sujan, and Sujan (1986).
Figure 2. Determinants of Salesperson Behavior and Performance

13
Recognizing these multiple and complex influences upon customer
orientation, this study is confined to investigating the single posited
linkage between organizational variables--in the form of organizational
culture--and the level of salesperson customer oriented behavior.
Exploration of this particular linkage in the model has been neglected in
the marketing literature and its explication is required in order to
encourage further investigation of the various relationships posited in
the complete model of salesperson behavior and performance.
In investigating organizational culture as an antecedent to
customer orientation, this study first exam~nes the domain of customer
orientation. This is followed by an explication and interpretation of
the behavioral construct of organizational culture. Finally, a
hypotheses will be proposed and empirically examined linking the
construct of organizational culture to the successful implementation and
maintenance of customer oriented behavior within sales orgaRizations.
Furthermore, the particular design of this study is fashioned to increase
the understanding of the pos~ted relationship between the individual
dimensions of the organizational culture construct and the customer
orientation construct.
A Substantive Contribution
This study,makes a substantial theoretical contribution to the
field of marketing, and particul~rly the sales management literature.
Existing research is extended, conceptual relationships are empirically
investigated, an~ a major step is made in linking research from
organizational behavior to marketing management.
Customer Orientation
This study extends previous concepts of customer oriented behavior
to include a broader interpretation of the domain of this construct. A
direct result of this extension will be a scale, having proven levels of

14
reliability and validity, for measuring the customer oriented behavior of
salespeople. This scale provides a vehicle for the identification,
study, and understanding of the antecedents and determinants of customer
oriented behavior. As the customer orientation-of a firm is a direct
function of the customer. orientation of its individual employees,
identification of.conditions favorable to individual customer orientation
will bring about a richer under~tanding of,how a ~irm can better
implement customer oriented strategies and encourage customer oriented
behavior.
Organizational Cultu~e
This study borrows the concepts of organizational culture from the
organizational behavior literature to posit ·and investigate the existence
and characte,ristics of a specific· typ~ .of organizational culture that is
supportive of customer orientation. Based upon theory and investigation
from the fields of organizational behavior and organizational theory, a
scale is developed with a marketLng perspective to measure the construct
of organizational culture. The advent of this marketing based scale
brings about a better understanding of the dimensions of organizational
culture and encourages the further study of determinants and consequences
of an organization's culture on. marketing performance.
Relationships Between Organizational Culture ' '
and Customer Orientation
An investigation.is conducted across multLple industry types to
investigate the relationship between organizational culture and customer
orientation. A direct result of this investigation is the determination
and documentation of the dimensions of organizational culture and their
relationship with a firm's customer orientation. The increased
understanding resulting from this study provides answers regarding how a '
firm can better develop and maintain a customer orientation.
15
In summary, this study develops and tests a theory relating
organizational culture to the level of customer oriented behavior. This
theory suggests that a .significant amount of variance in the level of
salesperson's customer orientation is explained through the type of
organizational culture perceived to exist within the organization.
An Outline of the Dissertation
This dissertation is organized into six distinct chapters. As an
introduction to the dissertation, the first chapter reviews the scope,
nature, and purpose of this study. The second chapter explicates the
constructs of customer orientation and organizational culture. Further
discussion develops the posited theoretical linkage between customer
orientation and organizational culture. Chapter three develops the
objectives for investigation and reviews the research methodology to be
utilized in carrying out the study. The research results from the
development of measures for (a) organizational culture and (b) customer
orientation constructs' are detailed in chapter four. Having explicated
the dimensionality of the organizational culture construct throughout the
scale dev~lopment research in chapter four, chapter five specifies the
nature of the relationship between organizational culture and customer
orientation through the development of certain hypotheses. In addition
to generating the relational hypotheses, chapter five reviews the results
of testing these hypotheses. Chapter six presents the study results in
light of their marketing management implications along with limitations
of this study to be addressed in further research.
CHAPTER II
LITERATURE REVIEW
Customer Orientation
Achieving and maintaining a strong customer orientation is seen as
the central most factor in the market concept (Felton 1959; Webster
1981; Crosby and Evans 1989; Kohli and Jaworski 1990). Indeed, Narver
and Slater (1989, 1990) argue that customer orientation is one of three
behavioral components of the market orientation construct they utilize
in order to operationa1ize the construct, mB;rketing focus. The results
of their study support a significant positive relationship between
customer orientation and the performance criterion variable. As a key
component of market orientation and with empirical support for a
positive relationship between cus.tomer orientation and performance, an
imperative is given for re~earch designed to better understand this
construct.
Customer orientation is defined as a philosophy and a behavior
directed toward determining and understanding the needs of the target
customer and adapting the response in order to satisfy those needs
better than the competition, thereby creating a competitive advantage
(Saxe and Weitz 1982; Narver and Slater 1989; and Marquardt 1989).
Indeed, Crosby and Evans (1989) p:osit that: the whole of "marketing
should be viewed as an ongoing relationship between the customer and
company that strives to achieve mutual satisfaction."
Despite the pervasiveness of the customer orientation concept
throughout the marketing discipline, conceptualization and study of the
construct varies across the sub-disciplines of marketing. Most of the
16
17
research in the area of customer orientation has traditionally been
conducted by scholars in sales management. Nevertheless, rapidly
expanding streams of research in (1) quality and (2) services marketing
are providing additional insight in the area of customer orientation.
A Sales Ma~agement Perspective
Sales management literature began to emphasize the advantages of
satisfying customer needs in the early 1900's. Strong (1925) referenced
the intuitive positive influence on performance resulting from a focus
on the satisfaction segment of the "want--> solution--> action-->
satisfaction" sales paradigm. Strong's proposition was based upon three
theories of purchase behavior: (1) situation response, (2) appeals
response, and (3) the dynamic nature of man. In developing his
assertion of relationship, he emphasizes that the combined effect of the
three theories sensitizes the human mind and heightens the speed and the
level of awareness when there is an associated need or want. While
Strong laid a foundation for understanding the direction of affect in
customer oriented selling, his work did little to assist the
establishing of the overall domain of the customer oriented construct.
Reiser (1962) documents the rise of customer oriented selling from
the early 1950's. Reiser proposes customer orientation as being
composed of seven primary characteristics:
1. Focusing on customer needs rather than seller needs. 2. Tailoring product to the needs of customer. 3. Having knowledge of customer's business. 4. Communicating customer needs back to company. 5. Developing customer, product, and co~pany knowledge. 6. Utilizing "soft-sell" rather than domination. 7. Building long-term relationship.
Many of Reiser·• s items also appear in the domain definition that
is put forward by Gwinner (1968) in his discussion of sales strategies.
Gwinner sets forth six qualities of customer orientation:
1. Easy going. 2. Friendly. 3. Utilizes two-way communication. 4. Builds long-term relationships.
5. Focuses on problem solving. 6. Orients himself to customer interests.
In Effective Selling Through Psychology, Buzzotta, Lefton, and
Sherberg (1972) use dimensional analysis to break out the domain of
customer orientation. Their analysis exposed ten characteristics:
1.
2. 3. 4. 5. 6. 7. 8.
9.
10.
Inquisitive and analytic in discovering the needs of customer. Behavior is understanding rather than overpowering. Tendency to be results oriented. Actively involves the customer. Listens and understands what is said. Questions in order to derive underlying facts. Takes time to explain how product addresses need. Easily·· adapts to changing needs and demands from customers. Builds a relationship and is viewed as being trustworthy by customer. Fulfills the role of a skilled professional.
In their treatise on influence use by salespeople, Spiro and
Perreault (1979) set forth interpersonal communication as an important
18
characteristic of customer orientation versus selling orientation. This
need for interpersonal communication is also stressed by Blake and
Mouton (1980) within their nine distinctive elements of customer
orientation:
1. Has concern for customer ... is a friend. 2. Understands and responds to needs, feelings, and
interests of customer. 3. Builds a personal bond with customer. 4. Uses extensive consultation to be informed of needs. 5. Works for a sound purchase decision based on customer
benefits. 6. Flexible. i:n scheduling .time, available when needed. 7. Emphasizes service before, during and after sale. 8. Has a positive personality. 9. Actively partic~pates aad involves customer, but is
not perceived as being dominating.
Saxe and Weitz (1982) integrated these prior research findings
with a series of interviews to develop a comprehensive list of attitudes
and behaviors common in customer orientation. The information gleaned
from this combination was then factor analyzed to provide six
characteristics of c·ustomer orientation:
1. A desire to help customers make satisfactory purchase decisions.
2. Helping customers assess their needs. 3. Offering products that will satisfy those needs.

4. Describing products accurately. 5. Avoiding deceptive/manipulative influence tactics. 6. Avoiding the use of high pressure.
These dimensions posited by Saxe and Weitz (1982) were
incorporated into a scale (SOCO) measuring the customer orientation of
salespeople. Subsequent replication and usage of this scale has
provided corroboration for Saxe and Weitz' conceptualization of the
domain of customer orientation (Michaels and Day 1985; Williams and
Wiener 1990). As a result of Saxe and Weitz' (1982) incorporation of
prior conceptualizations of the customer orientation construct into
19
their rigorous scale development methodology and the ensuing support of
their conceptualization, their explication of the customer orientation
construct and the resulting scale offers researchers a strong foundation
for further invest,igation of the customer orientation construct.
A Services Quality Perspective
The very nature of services require some form of interaction with
consumers. The direct involvement of the customer in the services
experience elevates customer satisfaction in the exchange process to a
highly salient position for service marketers. Services scholars
studying customer satisfact.ion have pushed customer orientation to the
forefront as a characteristic consistently identified as being crucial
to the success of service organizations (Lovelock and Young 1979;
Gronroos 1980, 1983; Bell 1981; Parasuraman, Zeithaml, and Berry 1984,
1988; Parasuraman 1985, 1987; Schneider and Bowen 1984).
Service researchers (Fisk 1981; Gronroos 1985) discuss the service
encounter as a dyadic relationship having two facets which interact to
result in an evaluation of satisfaction/dissatisfaction:
(1) (2)
Functional -Process -
the end result or the outcome. the manner in which they are performed.
These service marketing scholars further posit that the perceived level
of "functional" satisfaction can be affected by .satisfaction with the
20
"process," but that "process" satisfaction levels cannot be influenced
by "functional" satisfaction. This influential characteristic of
"process" over "functional" satisfaction underscores the significant
role played by a firm's personnel who come into contact with the
customer and suggests that these customer contact personnel play a very
pivotal role in implementing and sustaining the customer orientation of
a firm.
Expanding the twin concept (function and process) of how a
customer evaluates a service encounter, Parasuraman, Zeithaml, and Berry
(1984, 1988) provide a richer investigation and conceptualization of the
makeup of services evaluations. This conceptualization originally
identified ten dimensions of service quality. Subsequent research by
these authors has been further supported through numerous replications
and combines these original ten dimensions into five separate dimensions
upon which consumers evaluate services:
1) Tangibles -
2) Reliability -
3) Responsiveness -
4) Assurance -
5) Empathy -
Appearance of physical facilities, equipment, personnel and communication materials.
Ability to perform the promised service dependably and accurately.
Willingness to help customers and provide prompt service.
Knowledge and courtesy of employees and their ability to convey trust and confidence.
Caring, individualized attention the firm provides its customers.
Indeed then, if (1) these dimensions are representative of the
evaluation criteria used by consumers of services, and (2) customer
oriented behavior must effectively consider and address the customer's
relevant evaluative criteria, then it seems a logical step to include
them as dimensions of customer orientation.
21
An Expanded Perspective
Despite the valuable contributions from marketing scholars toward
enumeration of ~qe domain of customer orientation, recent investigations
indicate that these prior specifications are not without limitations.
Narver and Slater (1989, 1990). assert the domain of customer orientation
to include the followi~g six components:
1. Commitment to the customer · 2. Creation of value for the customer
3. Understanding customer needs 4. Having customer.satisfaction as an objective 5. Measurement of customer satisfaction 6. Offers products based on customer needs
Despite the close similarity of these six components and prior
conceptualizations of the domain of customer orientation, Narver and
Slater's inclusion of item 5, the measurement of customer satisfaction,
represents a new addition to the domain of customer orientation.
Further potential for broadening the customer orientation domain results
from the relationship management approach in sales management
literature.
In their discussion of the important part played by interpersonal
relationship management in the personal selling process, Coppett and
Staples (1990) and Manning and Reece (1990) make a strong case for the ' ' need to make certain additions to the domain of customer orientation.
Among the service augmentation and boundary spanning roles that are not
explicitly incl~ded in prior conceptualizations of customer orientation
are:
1. Follow-up pos~-sale activities 2. Adoption of a double-win philosophy 3. Represent the customer to the company before, during,
and after the sale.
Follow-up Post~sale Activities. Post-sale service activities are
required to assure customer satisfaction.. Although these post-sale
activities certainly include Narver and Slater's component of evaluating
customer satisfaction, these activities are much broader and include
22
services provided after the sale designed to enhance customer evaluation
and satisfaction. As pointed out by Levitt (1983, p. 117-118) and
Manning and Reece (1990, p. 419), people buy expectations, not things.
Once the customer buys, the expectations increase and often place the
salesperson in a debit role as perceived by the customer. Proper action
taken by the salesperson can work to assure that the transaction meets
these increased expectations. Oftentimes a thank you call is all that
is required. However, when problems do develop, the customer oriented
salesperson accepts responsibility and works to resolve the problem-
blame is not shifted to others.
Adoption of a Double-Win Philosophy. To be successful in building
the relationships required in customer oriented selling, the salesperson
must adopt the philosophy that both the customer and the company should
win as the result of a successful sale. Customers do not want to be
sold or manipulated. They want to be understood and satisfied. When
both parties come out of the sale with a sense of satisfaction, the
stage is set for a long-term relationship (Miller and Heiman 1985, p.
60).
Represent the Customer to the Company. In explicating the unique
characteristics of the sales job, Dubinsky et al. (1986) discuss the
multiple roles oft~n played by salespeople. In the role of a boundary
spanner, the salesperson must not only represent the company, but also
the customer as well as himself. Balancing this requirement of multiple
and simultaneous representation is key to building the trust and
credibility that leads to positive relationships and customer oriented
selling behavior.
As the only scale for measuring customer orientation possessing
known levels of reliability and validity, the Saxe and Weitz (1982) SOCO
scale has certainly provided a valuable step toward improved
understanding of customer orientation. However, in light of the above
23
arguments for a broadened domain of customer orientation, examination of
Saxe and Weitz's domain of customer oriented behavior reveals an
emphasis on the transaction portion of the personal selling process.
This transaction orientation neglects the service augmentation and
relationship management required of customer oriented behavior.
Accordingly, the domain of customer oriented selling behavior as
included in the SOCO scale is understated.
The expansion and full specification of the domain of customer
orientation to include these additional elements is a requirement for
the reliability and validity of any scale purporting to measure the
customer orientation construct. Consequently, one of the objectives of
this study will be to extend the SOCO scale (Saxe and Weitz 1982) to
include the broadened domain of customer orientation.
Organizational Culture
Research in organizational culture from sociology and
organizational behavior suggests the shared value or organizational
culture concept as a potential key to the problem of successfully
implementing customer orientation. Nevertheless, little research has
been done incorporating organizational culture into the marketing
discipline (Parasurarnan 1985, 1987; Deshpande and Webster 1989).
Sporting theoretical lineage from anthropology, sociology, and
cognitive psychology, the study of organizational culture has become the
focal point of organiz~tional research (Ouchi and Wilkins 1985). Most
of the existing work is qualitative in nature. Nevertheless, as the
result of scale development work beginning in the late 1980's, empirical
analysis of organizational .culture has entered the early stages of
evolution (Cooke and Rousseau 1988). This new level of inquiry into
organizational culture-~its antecedents and its affects on perfermance-
promises to become a rich field for research in the 1990's.

24
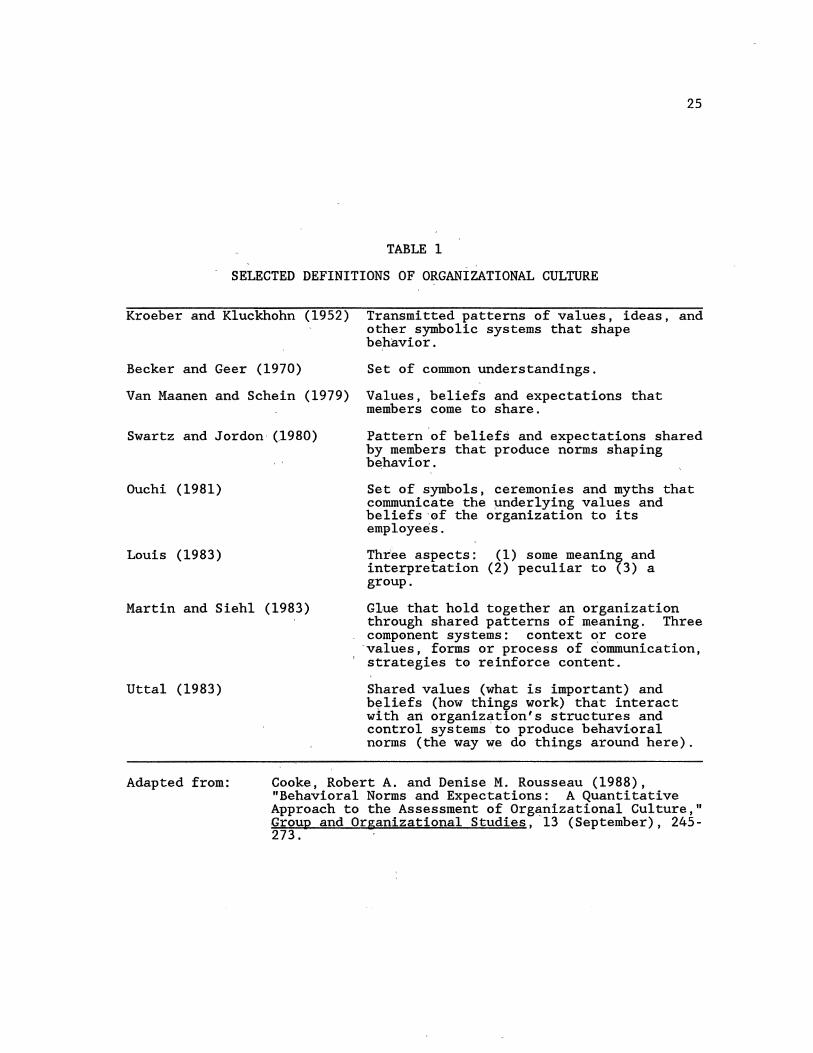
What is Organizational Culture?
Organizational culture's adolescent stage of development has been
characterized by a lack of precision and rigor (Wiener 1988). As
explicated by Cooke and Rousseau (1988), even the definition of
organizational culture has defied explicit denotation (See Table 1).
Using these (Table 1) and other proposed definitions of the
organizational culture construct, Smircich (1983, pg. 344) provides a
more comprehensive and integrative definition:
Culture is usually defined as social or normative glue that holds an organization together (Siehl and Martin 1981, Tichy 1982). It expresses the values or social ideals and the beliefs that organization members come to share (Louis 1983, Siehl and Martin 1981). These values or patterns of belief are manifested by symbolic devices such as myths (Boje, Fedor, and Rowland 1982), rituals (Deal and Kennedy 1982), stories (Mitroff and Kilmann 1976), legends (Wilkins and Martin 1980), and specialized language (Andrews and Hirsch 1983).
A common thread running through the definitions of culture is that
there is a central core of shared values that become a strong central
value system. Rokeach (1973) defines values as " ... an enduring belief
that a specific mode of conduct or end state is preferable to an
opposite or converse mode of conduct or end state of existence." As
such, values are forms of beliefs, and as they increase in their level
of sharing, they become internalized normative beliefs that act as
guides to behavior. When these normative beliefs are shared across the
organization, a central value system exists--the culture of the
organization (Wiener 1988).
Cooke and Rousseau (1988) further characterize the central value
system--the organizational culture--as having two key attributes. These
attributes are represented as direction and intensity. Direction refers
25
TABLE 1
SELECTED DEFINITIONS OF ORGANIZATIONAL CULTURE
Kroeber and Kluckhohn (1952) Transmitted patterns of values, ideas, and other symbolic systems that shape behavior.
Becker and Geer (1970) Set of common understandings.
VanMaanen and Schein (1979) Values, beliefs and expectations that members come to share.
Swartz and Jordon· (1980) Pattern of beliefs and expectations shared by members that produce norms shaping b~havior.
Ouchi (1981) Set of symbols, ceremonies and myths that communicate the underlying values and beliefs ·ef the organization to its employees.
Louis (1983) Three aspects: (1) some meaning and interpretation (2) peculiar to (3) a group.
Martin and Siehl (1983) Glue that hold together an organization through shared patterns of meaning. Three component systems: context or core
·values, forms or process of communication, ' strategies ta reinforce content.
Uttal (1983) Shared values (what is important) and beliefs (how things work) that interact with an organization's structures and control systems to produce behavi·oral norms (the way ~e do things around here).
Adapted from: Cooke, Robert A. and Denise M. Rousseau (1988), "Behavioral Norms and Expectations: A Quantitative Approach to the Assessment of Org13:nizational Culture," Group and Organizational Studies, 13 (September), 245-273.

26
to the content of the culture such as values and behavioral norms.
Intensity represents the strength of the culture and is composed of two
sub-components: (a) the degree of consensus among members concerning the
shared values and (b) the strength of linkages among expectations,
rewards, and behaviors. These sub-components are analogous to the
valence and instrumentalities of expectancy theory (Vroom 1964).
Dimensions of Organizational Culture
Scholars agree in the conceptualization of organizational culture
as a multidimensional construct. Consensus is lacking, however, as to
what and how many dimensions are to be included. The high degree of
conceptualization and lack of empirical research in the field continue
to sustain the various conceptualizations of the dimensions of
organizational culture.
As discussed earlier (pp. 7-9), a close relationship exists
between organizational climate and organizational culture, with climate
seen as the resulting manifestation~ resulting from the underlying
culture of the organization. This immediate and dependent relationship
between climate and culture would intuitively support the examination of
climate literature for clues to the dimensions of the underlying concept
of· organizational culture, that is, .the dimensions of climate should
mirror the dimensions ef culture;
In a comprehensive review of published measures of organizational
climate, Campbell et al. (1970) identify four dimensions common to all
instruments:
1. Structure of the organization 2. Individual job autonomy 3. Consideration 4. Rewards
Investigating the affect of organizational climate on
organizational effe·ctiveness, Toto (1986) conceptualized four dimensions
of organizational climate. These are as listed below:
27
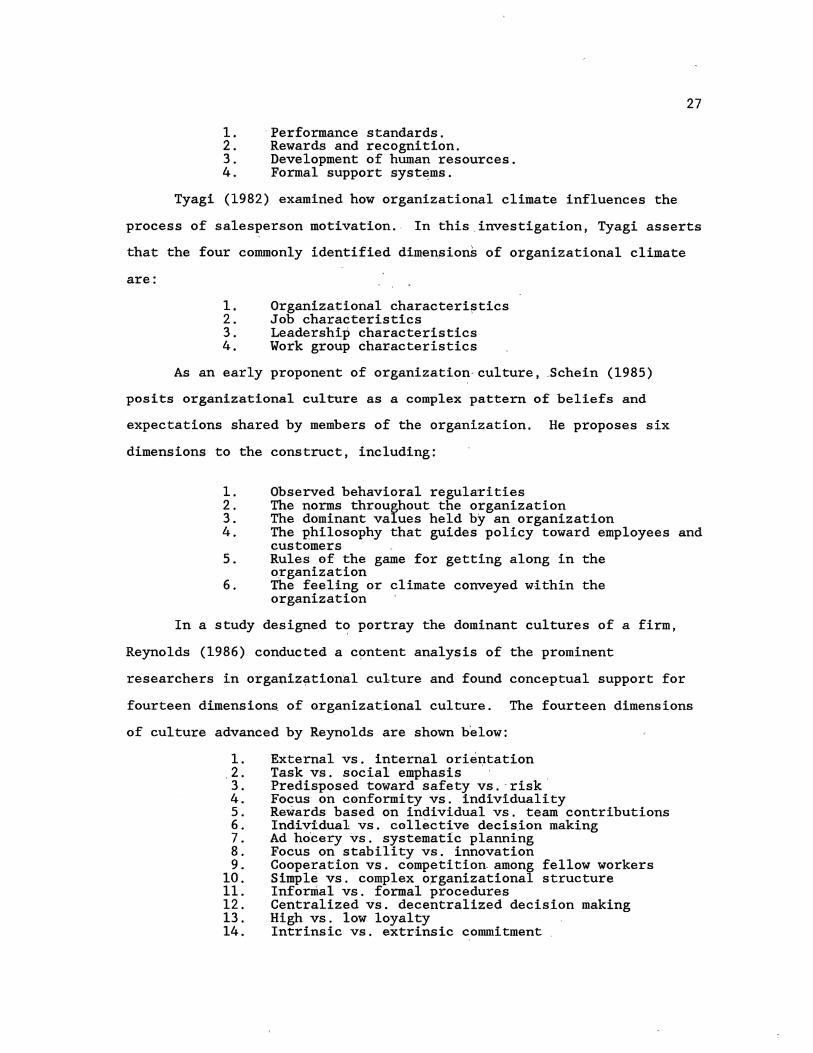
1. Performance standards. 2. Rewards and recognition. 3. Development of human resources. 4. Formal support syst~ms.
Tyagi (1982) examined how organizational climate influences the
process of salesperson motivation. In this_investigation, Tyagi asserts
that the four commonly identified dimen~ions of organizational climate
are:
1. Organizational characteristics 2. Job characteristics 3. Leadership characteristics 4. Work group characteristics
As an early proponent of organizationculture, Bchein (1985)
posits organizational culture as a complex pattern of beliefs and
expectations shared by members of the organization. He proposes six
dimensions to the construct, including:
1. 2. 3. 4.
5.
6.
Observed behavioral regularities The norms throughout the organization The dominant values held by an organization The philosophy that guides policy toward employees and customers Rules of the game for getting along in the o,rganization The feeling or climate conveyed within the organization
In a study designed t~ portray the dominant cultures of a firm,
Reynolds (1986) conducted a c~ntent analysis of the prominent
researchers in organizational culture and found conceptual support for
fourteen dimensions of organizatJQnal culture. The fourteen dimensions
of culture advanced by Reynolds are shown b'elow:
1. External vs. internal orientation 2. Task vs. social emphasis . 3. Predisposed toward safety vs. risk 4. Focus on conformity vs. individuality 5. Rewards based on individual vs. team contributions 6. Individual vs. collective decision making 7. Ad hocery vs. systematic planning 8. Focus on stability vs. innovation 9. Cooperation vs. competition among fellow workers
10. Simple vs. complex o~ganizational structure 11. Informal vs. formal procedures 12. Centralized vs. decentralized decision making 13. High vs. low loyalty 14. Intrinsic vs. extrinsic commitment
28
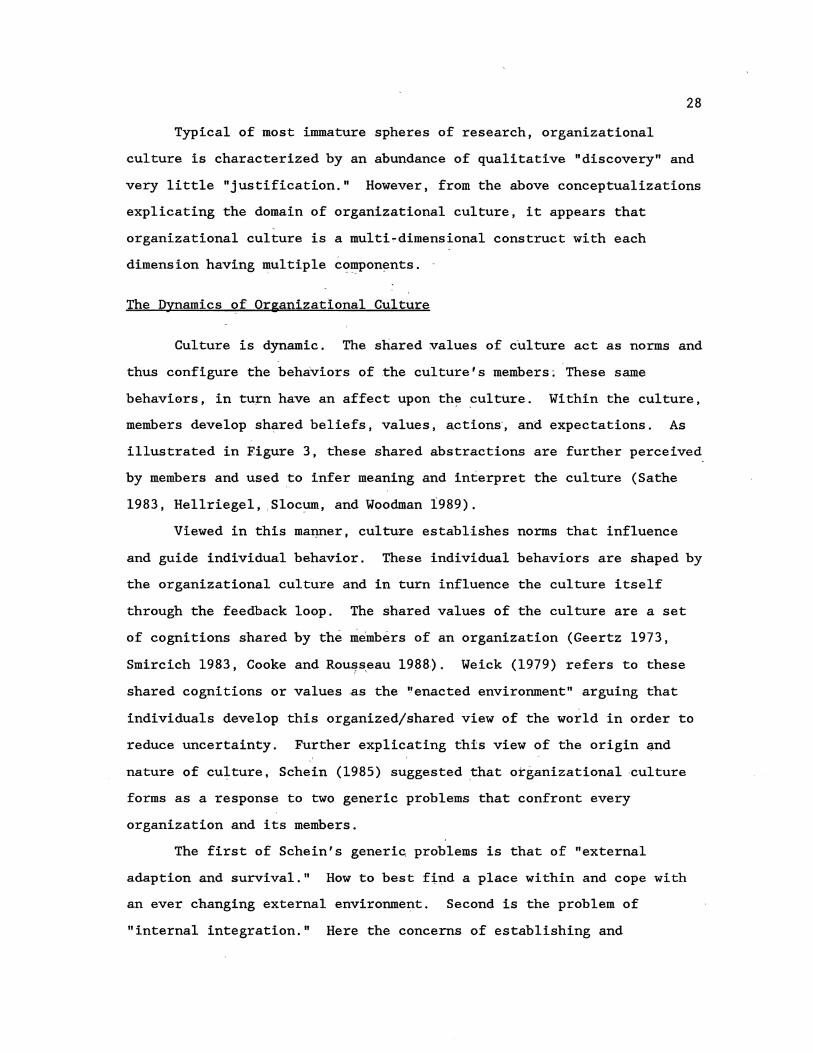
Typical of most immature spheres of research, organizational
culture is characterized by an abundance of qualitative "discovery" and
very little "justification." However, from the above conceptualizations
explicating the domain of organizatioual culture, it appears that
organizational culture is a multi-dimensional construct with each
dimension having ~ultiple compon~nts.
The Dynamics of Organizational Culture
Culture is dynamic. The shared values of culture act as norms and
thus configure the behaviors of .the culture's members; These same
behaviers, in turn have an affect upon th~ culture. Within the culture,
members develop sh~red beliefs, values, actions·, and expectations. As
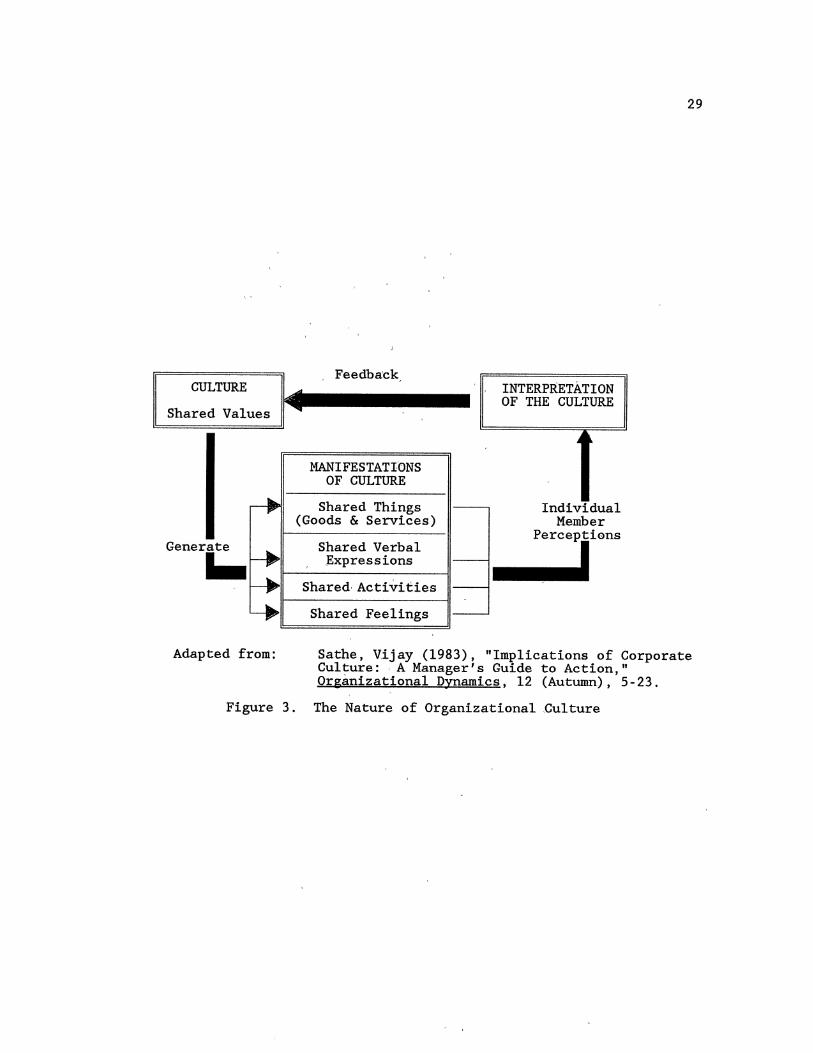
illustrated in Figure 3, these shared abstractions are further perceived
by members and used to infer meaning and interpret the culture (Sathe
1983, Hellriegel, Slocum, and Woodman 1989).
Viewed in this manner, culture establishes norms that influence
and guide individual behavior. These individual behaviors are shaped by
the organizational culture and in turn influence the culture itself
through the feedback loop. The shared values of the culture are a set
of cognitions shared by the members of an organization (Geertz 1973,
Smircich 1983, Cooke and Rousseau 1988). Weick (1979) refers to these •' '
shared cognitions or values as the 'Jenacted environment" arguing that
individuals develop this organized/shared view of the world in order to
reduce uncertainty. Further explicating this view of the origin ~nd
nature of culture, Schein (1985) suggested .that organizational culture
forms as a response to two generic problems that confront every
organization and its members.
The first of Schein's generic problems is that of "external
adaption and survival." How to best fi~d a place within and cope with
an ever changing external environment. Second is the problem of
"internal integration." Here the concerns of establishing and
CULTURE
Shared Values
Generate
1...
Feedback_
MANIFESTATibNS OF CULTURE
Shared Things (Goods & Services)
Shared Verbal Expressions
Shared Activities
Shared Feelings
INTERPRETATION OF THE CULTURE
Individual Member
Perceptions
I
29
Adapted from: Sathe, Vijay (1983), "Implications of Corporate Culture: A Manager's Guide to Action," Organizational Dynamics, 12 (Autumn), 5-23.
Figure 3. The Nature of Organizational .Culture
30
maintaining effective relationships among members of the organization.
As individual members address these two generic problems through the
sharing of knowledge and conjecture they discover methods of dealing
with the key problems. As these tactics become further validated as
effective responses and coping mechanisms for dealing with the problems,
they are passed on to new members thr<:mgh the socialization process of
the organization ... both formally and informally.
This simultaneous and mutual influence of (1) the individual's
values, beliefs, and behaviors upon the norms of the organization, and
(2) the influence of the group norms (values, beliefs, and behaviors)
upon those of the individual is further supported by group development
theory.
Group Development Theory
Researchers studying group development (Tuckman 1965·; Bales 1970;
Tuckman and Jenson 1977) assert that group development is a dynamic
process resulting from the interaction of two flows of influence. First
the individual (micro-environment) factors influence and thus account
for the group (macro-environment), and (2) that the reverse is also
true--that influence flows from the.macro-environment to the individual
level processes.
Individual to Grdup Flow of Influence
Cultural processes are the result of aggregate personal processes.
Culture and its associated \Uacro-characteristics can be explained as the
aggregated results of individual members acting according to the laws of
social psychology. Culture is something that is learned, shared, and
dynamic over time ... the result of social interactions between
individuals and other individuals, between individuals and groups, and
between groups and groups.

31
The phenomenon of personal motivation influences individuals to
join and/or stay in groups. The choice to join a work group is not
always the decision of the individual. However, the decision to stay or
leave is ultimately up to the individual. Consequently, one can argue
that membership within groups is elective. Individuals choose to join,
participate, and remain within groups according to personal level
perceptions, involvement, and motivations toward the satisfaction of
personal needs. These individual needs parallel the personal motivation
factors of security, esteem, belonging, affiliation, power, and
achievement described by Maslow and McClelland. (Hellriegel, Slocum, and
Woodman 1989).
For these reasons, the individual joins a group bringing with a
personal package of individual level phenomenon. In accordance with
- these individual motivations, personality traits, learning abilities,
experiences, beliefs an~ attitudes, the individual interacts with other
group members. Wi~hin these various interactions, one will find
information processing, cognitive learning, operant conditioning,
personal influence, and involvement at the individual level occurring as
the group process of_spcialization. Socializ-ation melds the individual
phenomenon into the group level phenomenon of norms and roles of the
group along with group personalities, expectations, motivations,
experiences, beliefs and attitud~s. As aggregations of individuals,
these groups then begin to join with apd interact with other individuals
and groups resulting in further aggregation of the phenomenon.
As a direct result of this group development,_ the personal
phenomenon of the individual becomes a macro-level phenomenon of the
group manifested within the group norms and roles. Groups think and
make decisions; groups vary in motivation, experience, and involvement
levels; furthermore, groups can be seen to posse~s other phenomenon such
as attitudes, personalities, and even self concepts. However, groups
are more than the simple sum of their parts--the process of socializ-

ation results in a certain degree of homogenization of the individual
level phenomenon as they become group phenomenon. Even so, the common
seed for these group and-'higher level macro phenomenon is the
individual.
32
Group development theory thus holds the key for understanding how
personal phenomenon influence and shape the macro-level phenomenon-
organizational culture. A number,,of writers (Tuckman 1965 and Bayles
1970) have dealt with the issue of group development and describe five
stages of group development: forming, stor~ing, norming, performing,
and adjourning. It is wi·thin these stages that personal factors begin
to influence and even form what will eventually become the group or
organizational culture.
Forming. In this initial stage, the individuals, interact in order
to size up the differing motivations and personalities coming together
and to assess the personal benefits relative to the personal costs of
being involved in the group. In this manner, learning takes place with
resultant beliefs and attitudes being formed.
Storming. Differences in personalities, motivations, beliefs and
attitudes give rise to conflicts in this stage. Things tend to get
serious as roles begin to be overtly and covertly assumed and played
out. Interpersonal attractions ai).d the varied personal mo.tivations
result in the formation of beliefs'and attitudes dealing with the
perceived importance of belonging to the group and thereby altering
these individual characteristics toward a group norm.
Norming. Cognitive learning and certain operant conditioning
principles reinforce the advantages in staying in the group. Through
interaction of individuals and personal influences growing from the
group structure, certain compromises and adjustments are made. Roles
are sorted out and cooperation becomes the dominant theme bringing about
formation of and changes in beliefs, values and attitudes in this stage.
33
As a result of the positive relations behavior exhibited in this
phase, the group begins to establish the rules by which it will operate
-norms are developed. These norms grow out of the personal motivations
and needs along with the compromises and adjustments made by the
individuals and are the seedlings of what will grow into culture as the
result of additional aggregation of. smaller groups into larger groups.
Performing. Once norms are in place, sanctions are developed to
enforce compliance and at the same time allow for the updating or
changing of norms to keep in tune with the group needs and desires.
These changes in norms are seen to occur from within as member needs
change and as new members are added.
Norms are not stable, but rather dynamic and changing. Humans are
capable of cognitive thought and planning. As time passes, situations
change, learning occurs and new beliefs and attitudes come forward.
This results in changes in the norms. Also new individuals are brought
into the group--each with his own motivations, personalities,
experiences, beliefs, and attitudes. Norms also c~ange as these new
elements are brought into the interaction of the individuals in the
group.
Adjourning. Adjourning occurs as the result of the group's
failure to adjust (in the stage above) to member needs or is absorbed
into a different group causing it to lose its identity and social
influence.
Using the schema of group influence illustrated by both Loudon
(1984) and Wilkie (1986) serial aggregation takes place along the same
five steps as developed above for group ,development. Individuals are
joined together in smaller groups. These small groups join together to
form larger groups or classes which in ~urn join to form subcultures.
Finally subcultures aggregate to form a wider overall or global culture.
All have their eommon beginning in the individual and his or her

personal factors at the micro-level. However people within each of
these groups tend to associate more with one another and less with
others (Weber 1946). In this way each group tends to exhibit its own
34
dynamic personal characteristics of motivations, personalities,
experiences, beliefs and attitudes, each of which had a common beginning
in the interactions of the personal factors of the individual group
members.
Group to Individual Flow of Influence
Macro-level phenomenon such as culture and subculture influence
and explain the personal characteristics of motivation, personality,
learning, beliefs and attitudes of the individual. This direction of
influence is illustrated in Figure 4.
CULTURE SUBCULTURE
SOCIAL CLASS REFERENCE GROUPS
FAMILY
INDIVIDUAL
Figure 4. Group Influences on Individual Behavior
The more commonly accepted and discussed nature of culture's
influence on the individual is characterized by subcultures that arise
within the overall culture due to various differ~nce factors. In turn
Social classes are stratified at a lower level and within subcultures,
followed in order by reference group? and the family. Finally, the
effect of_ culture is pa,ssed on to the individual as a result of the
influence o{ each level of these macro-environmental factors.
35
Each level of social influence (Figure 4) shares the trait of
being a group. Whether it is a reference group, a p~imary group, a
formal or even informal-group, as a group it holds specific properties
in common: norms, and roles. It is through these norms and roles that
the influence of culture passes to the individual.
Norms. Individual behaviors combine and evolve into a sharing of
information, acceptance of differ~nt opinions, and positive attempts to
reach mutually agreeable decisions toward group behavior. These become
norms--mutually accepted rules of behavior for group members--and effect
the behavior of the group and the individuals within the group. Thus it
is through the learning and adjusting process that takes place thnmgh
the enculturation of existing members and the acculturation of new
members that the macro-envir·onmental factors influence the individual
factors.
In addition to this normative influence upon the individuals
personal motivation, personality, learning, beliefs, and attitudes, the
group also influences the individual through informational influence and
value expressive influence. Informational influence comes through the
groups providing important information that influences the individual.
Value expressive influence occurs when the individual is prejudiced by
the known values and attitudes of the group.
Roles. Similar to norms, roles are the agreed upon behaviors
required by different positions in the group. Here again normative

36
pressures from the group influence and restrict the personal elements of
the individual.
The degree of attractiveness the individual has for the group acts
in combination with the degree the individual wants to be liked by the
group to determine the level of influe~ce on the individual. The higher
this perceived 'importance, then the more influence the macro-environment
will have on this individual's motivations, personality, learning ' experiences, beliefs attitudes, and behaviors.
An Interactive - Two Directional Flow
Clearly, neither of the situations presented above, could by
itself, present the true nature of the relationships between the macro
environmental elements of culture, subculture and reference groups with
the micro-level individual factors of motivation, personality, learning,
beliefs and attitudes. In reality it takes a combination of these two
prior situations to more fully explicate this relationship. The dynamic
nature of this interaction results in influence flowing in a multi
directional pattern. Within this multi-directional flow of influence,
macro-environmental phenomenon i~pact and influence the personal
phenomenon while personal phenomenon have a simultaneous impact and
influence upon the macro-environmental phenomenon. This more pragmatic
view of a dynamic and complex interaction can be illustrated by adapting
the original Peter and Olsen (1987) depiction of cultural influences on
the individual. This adaptation, as is pres~nted in Figure 5, would
exhibit the more realistic IllUlti-direc~ional flow of interaction and
influence.
Viewed from within the model of ;organizational culture (Figure 3,
p. 29), this interaction perspective from group development theory
explains (1) how the macro-environment of culture and subculture are
formed, (2) how this macro-environment changes over time due to
influences from the group and influences from the individual, and
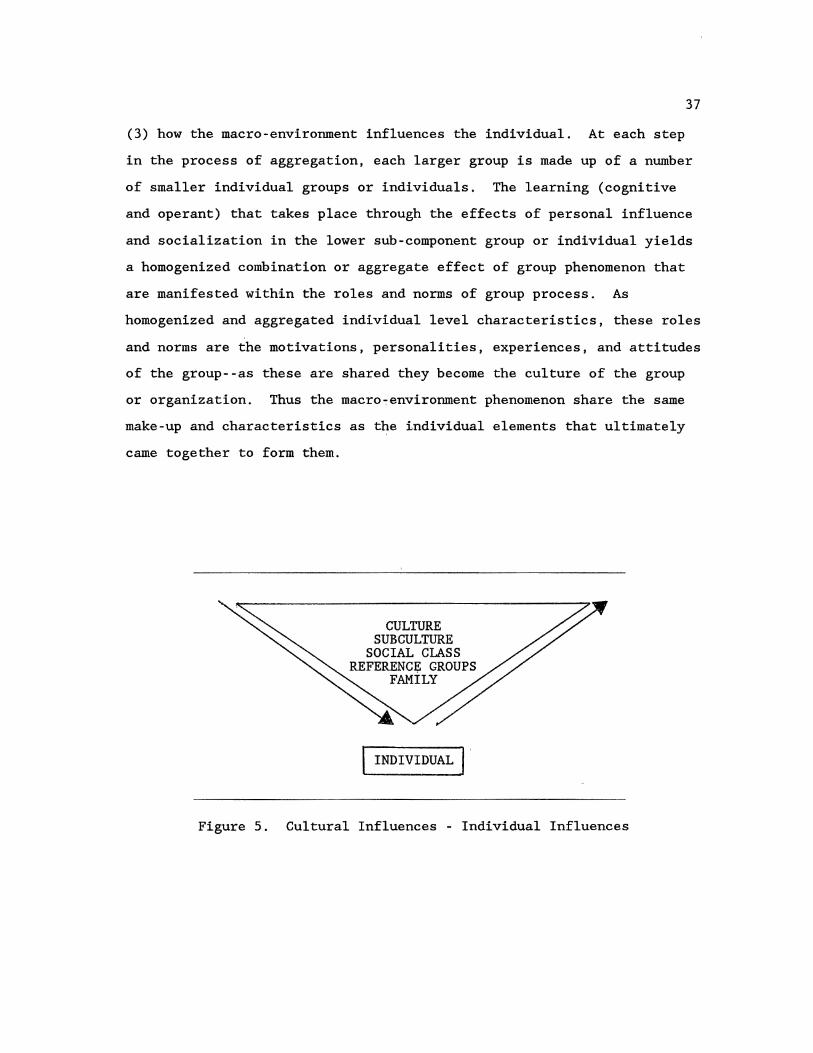
37
(3) how the macro-environment influences the individual. At each step
in the process of aggregation, each larger group is made up of a number
of smaller individual groups or individuals. The learning (cognitive
and operant) that takes place through the effects of personal influence
and socialization in the lower sub-component group or individual yields
a homogenized combination or aggregate effect of group phenomenon that
are manifested within the roles and norms of group process. As
homogenized and aggregated individual level characteristics, these roles
and norms are the motivations, personalities, experiences, and attitudes
of the group--as these are shared they become the culture of the group
or organization. Thus the macro~environment phenomenon share the same
make-up and characteristics as the individual elements that ultimately
came together to form them.
CULTURE SUBCULTURE
SOCIAL CLASS REFERENCE GROUPS
FAMILY
INDIVIDUAL I '
Figure 5. Cultural Influences - Individual Influences
38
Within the socialization process, learning is taking place through
enculturation and acculturation of members--individuals and groups. As
social influence and compliance procedures bring individual behavior in
line with norms, the influence from the macro to the micro is evidenced.
It is this influence from macro to micro that explains the role that
management can play in guiding the. development of culture.
The Role of Management in Culture
The view of culture as a dynamic and circular func~ion implicitly
includes the maintenance of the culture through _the process of
socialization. Nevertheless, the full representat~on' of culture
maintenance is more complex than this rather-simplistic process of
evolution implies. As illustrated in the earlier model of culture
(Figure 3, p. 29), there are implicit influences upon culture by
managerial actions. In addition to the implicit maintenance of
organizational cult,ure through the internal socialization and adaptation
process, organizational culture scholars assert the following six
explicit managerial methods of reinforcing the culture of the
organization (Sathe 1985; Sethia and Von Glinow 1985; Kerr and Slocum
1987; Beyer and Trice 1987; Hellriegel, Slocum and Woodman 1989):
Fit Between Individual and OrganizatioR. This reinforcement ' -
method deals with the congruence between the values of an individual and
the shared values of the organization ... the culture. Inherent in this
method is the recruitment, hiring and promotion of individuals who
possess personal values corresponding to those of the culture.
Conversely, this also concerns the acculturation or removal Qf
individuals with a poor fit. A good match between the individual's
cultural values and the org~_nizat:ional culture is seen as a key factor
in boosting the organizational culture.
39
What Managers Pay Attention To. Seen as a powerful reinforcer and
method of cultural maintenance, the things that get noticed and
commented on send strong signals to members as to what is important and
what is expected of them. Analogous to modeling or vicarious learning,
members develop patterns of behavior based on what they see is important
to supervisors. Consequently, if man.;igement wants to encourage a
specific type of behavior--customer orientation-..:managers should
purposefully take notice when ,this specific behavior occurs and make
positive and encouraging comments about the behavior. This not only
reinforces future types of pehavipr from the individual member receiving
the encouragement, but it also sends strong signals to other members who
observe the behavior of fellow members and the attention the behavior
receives from management.
Reactions to Critical Incidents. When the organization faces a
crisis, the way management approaches ~nd deals with the problem sends
strong signals regarding the culture of the organization. Management's
reaction to critical incide,nts can reinforce the existing culture or
bring about a change in the culture through the creation of new norms
and expectations. Crises repr:esent events that arise and challenge the
existing culture of the organization. When management answers this
challenge--deals with a problem--in a way predicted or called for by the '
existing culture, the c~lture becomes stronger. However, if management
reacts in a way that is outside the culture, members receive a signal
that the cu~ture has been modified. Oftentimes, management reactions
outside what is called ·for by the culture results in mixed signals that
are not readily interpreted.by members. In these cases, management
should communicate the reasons for their actions and any changes that
have occurred in the acceptable norms;
Teaching and Role Modeling. Vicarious learning occurs within the
organization as employees model the behavior ef managers, supervisors

40
and significant others. The primal role of communication is apparent as
additional culture can be passed thro~gh the inclusion of culture in
formal training and day to day direction on the job.
Allocation of Rewards. A close relationship exists between the
reward practices of an organization and its culture, with the reward
system being seen as one of the more effectual mechanisms for arousing
organizational culture. This strong relationship is posited to exist
through the rewards and punishments attached to certain behaviors.
These rewards and punishments provide salient signals ,to members
regarding priorities and values of the organization.
Organizational Ceremonies. Many of the beliefs and values of an
organization's culture are expressed and reinforced through ceremonies
and rites practiced in the organization. Extending this concept, many
of the activities ef management can become construed as rites and
ceremonies that members inte.rpret ,as part of the organizational culture.
These culture reinforcers provide a managerial perspective on
establishing, directing and maintaining the culture of the organization.
As such they illustrate ·how,the culture of an erganization is highly
interrelated to all aspects of the organization, including structure,
management style, and performance. As management uses these methods to
influence culture, the cultur~ of the organization begins t:o take on
characteristics specific ta the organizational unit. If management has
indeed taken an active part in guiding the development of the various
cultural characteristics, the culture can act as a catalyst toward the
mission and objectives of the organization. On the ether hand, if
management has neglected the development of culture, the resultant
culture may very well be counter-productive to the organization's goals,
objectives, and stra~egies.
A Single Best Culture?
While many differing views are offered regarding the concept of
organizational culture, two assumptions remain constant in the
literature: First, that every organization has a culture, and second,
that there is no one ubiquitous and best culture.
41
Bettinger (1989) echoes other researchers in organizational
theory, stating that every organization has a culture that is reflected
by the behavior patterns within the organization. These patterns
develop along both formal and informal·lines as members interact and
join together. The key for management is to recqgnize and manage the
culture so that it becomes a posit-ive force in the accomplishment of
organizational objectives. The real challenge for management is to
strategically manage the organization's culture in order to tap the
strengths of the culture. By tapping these strengths and utilizing
culture as a strategic management tool, management will better enable
the organization to achieve superior performance.
There are no good or had cultures. Strong shared values and goals
make an organization efficient. Gonsequently, a good culture can be any
form of culture th&t reinforces the missions and strategies of the
organization (Ouchi 1980; Wallach 1983; Arogyaswamy and Byles 1987). An
effective and efficient culture is the culture that is appropriate to
the needs of the business, the organization, and the employees (Wallach
1983, p. 32).
From the perspective that there are nQ specifically good or bad
cultures and true to the theory of group development (pp. 30-38), a
recent advancement posits the possibility for multiple cultures-
subcultures--to concurrently exist within the same corporation.
Although these subcultures reinforce the overall ~ission of the larger
organization, the corporation, they are idiosyncratic to smaller sub
units of the firm: i.e. operating units and divisions. This
contingency view regarding the existence of sub-cultures is important
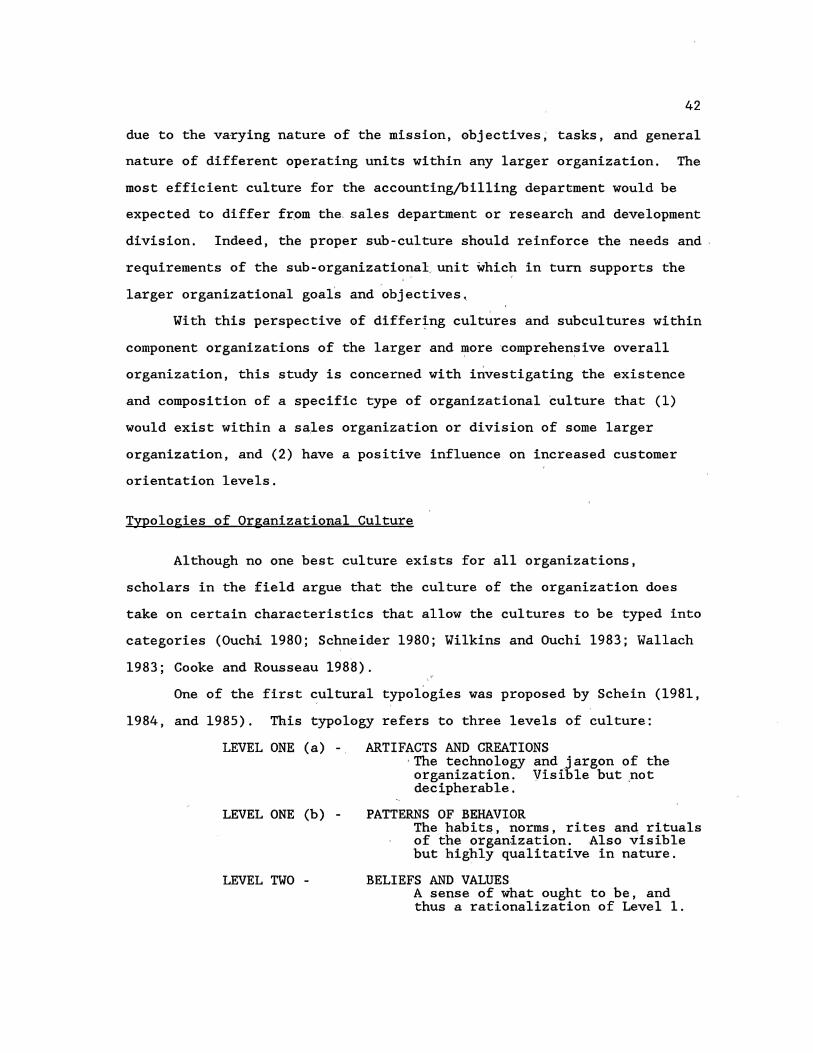
42
due to the varying nature of the mission, objectives; tasks, and general
nature of different operating units within any larger organization. The
most efficient culture for the accounting/billing department would be
expected to differ from the, sales department or research and development
division. Indeed, the proper sub-culture should reinforce the needs and
requirements of the sub-organizational, unit which in turn supports the
larger organizational goals and objectives.
With this perspective of differing cultures and subcultures within
component organizations of the larger and ~ore comprehen~ive overall
organization, this study is concerned with investigating the existence
and composition of a specific type of organizational culture that (1)
would exist within a sales organization or division of some larger
organization, and (2) have a positive influence on increased customer
orientation levels.
Typologies of Organizatiomal Culture
Although no one best culture exists for all organizations,
scholars in the field argue that the culture of the organization does
take on certain characteristics that allow the cultures to be typed into
categories (Ouchi 1980; Schneider 1980; Wilkins and Ouchi 1983; Wallach
1983; Cooke and Rousseau 1988).
One of the first cultural typologies was proposed by Schein (1981,
1984, and 1985). This typology refers to three levels of culture:
LEVEL ONE (a) -
LEVEL ONE (b) -
LEVEL TWO -
ARTIFACTS AND CREATIONS The technology and jargon of the organization. Visible but not decipherable.
PATTERNS OF BEHAVIOR The habits, norms, rites and rituals of the organization. Also visible but highly qualitative in nature.
BELIEFS AND VALUES A sense of what ought to be, and thus a rationalization of Level 1.

43
LEVEL THREE.- UNDERLYING ASSUMPTIONS Fundamental beliefs and values that are taken for granted, preconscious, and invisible.
As proposed by Schein (1981, 1984, 1985), this typology was
originally designed to further refine the distinctions between the
adaptionist and ideational views of culture. As extended by Ott (1989),
this particular typology explicates the hierarchial structure of culture
with each level being built upon the one below it. This structure
illustrates that change in upper levels (Level One or Level Two) is
dependent upon initial changes in a lower level (Level Two or Level
Three), i.e. the fundamental beliefs and values that underlay the
culture. While valuable for its illustration of the hierarchial
structure of culture, this typology also parallels group development
theory in its illustration of the importance of the individual member's
beliefs and values. It is these fundamental beliefs as perceived by the
individual member that are manifested first as Level Two beliefs and
values and then as Level Orie arti_facts and norms·. Since the perceptions
of the individual aggregate over time into the norms and shared values
making up the organizational culture, the methodology of this study will
focus upon these foundational perceptions of the individual.
Deal and Kennedy (1982, p. 107) argue that" ... the biggest single
influence on a company's culture is the broader social and business
environment in which the company operates." Using qualitative studies
of corporations and their business environments, Deal and Kennedy (1982)
present a typology based upon two· factors withi~ the marketplace: (a)
the degree of risk, and (b) the speed with which the companies get
feedback regarding the success of decisions and strategies. Using these
market based factors, the authors present their four generic cultures:
1. TOUGH-GUY, MACHO CULTURE 2. WORK HARD/PLAY HARD CULTURE 3. BET YOUR COMPANY CULTURE 4. PROCESS CULTURE.
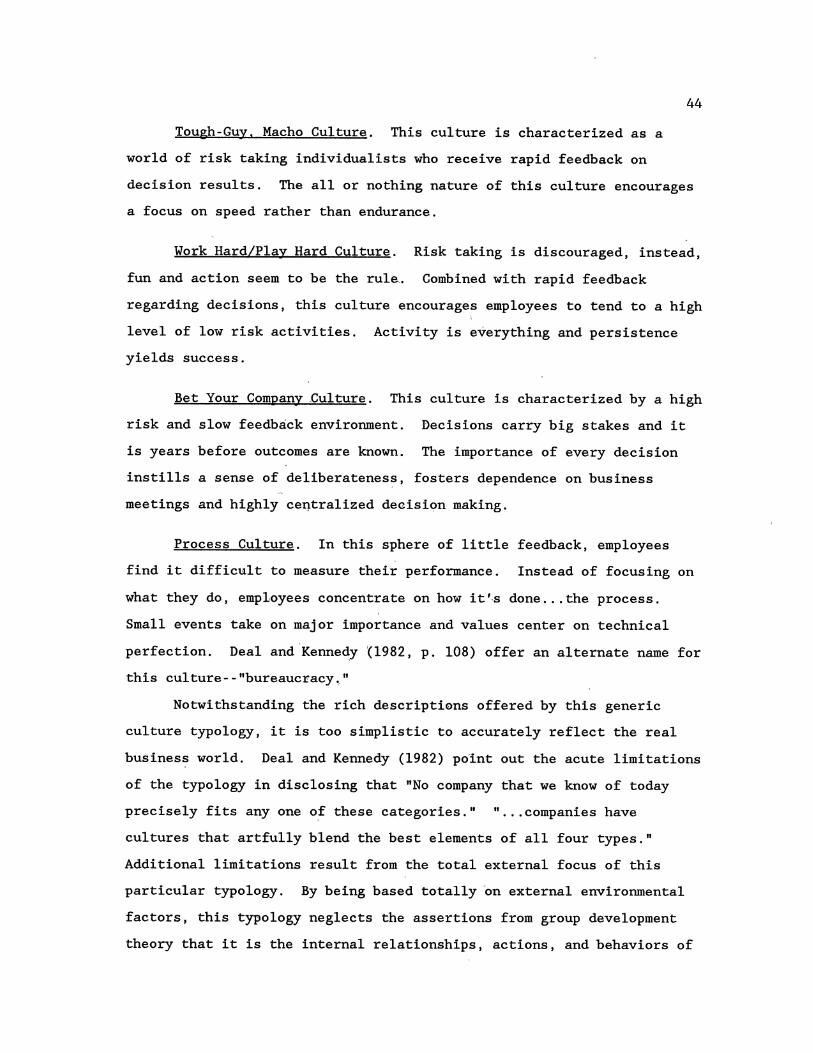
44
Tough-Guy. Macho Culture. This culture is characterized as a
world of risk taking individualists who receive rapid feedback on
decision results. The all or nothing nature of this culture encourages
a focus on speed rather than endurance.
Work Hard/Play Hard Culture. Risk taking is discouraged, instead,
fun and action seem to be the rule. Combined with rapid feedback
regarding decisions, this culture encourages employees to tend to a high
level of low risk activities. Activity is everything and persistence
yields success.
Bet Your Company £ulture. This culture is characterized by a high
risk and slow feedback environment. Decisions carry big stakes and it
is years before outcomes are known. The importance of every decision
instills a sense of deliberateness, fosters dependence on business
meetings and highly ce~tralized decisi9n making.
Process Culture. In this sphere of little feedback, employees
find it difficalt to measure their performance. Instead of focusing on
what they do, empl,oyees concentrate on how it's done ... the process.
Small events take on major importance and values center on technical
perfection. Deal and Kennedy <1982, p. 108) offer an alternate name for
this culture-- "bureaucracy.,"
Notwithstanding the rich descriptions offered by this generic
culture typology, it is too simplistic to accurately reflect the real
business world. Deal and Kennedy (1982) point out the acute limitations
of the typology in disclosing that "No company that we know of today
precisely fits any one of these categories." " ... companies have
cultures that artfully blend the best elements of all four types."
Additional limitations result from the total external focus of this
particular typology. By being based totally on external environmental
factors, this typology neglects the assertions from group development
theory that it is the internal relationships, actions, and behaviors of
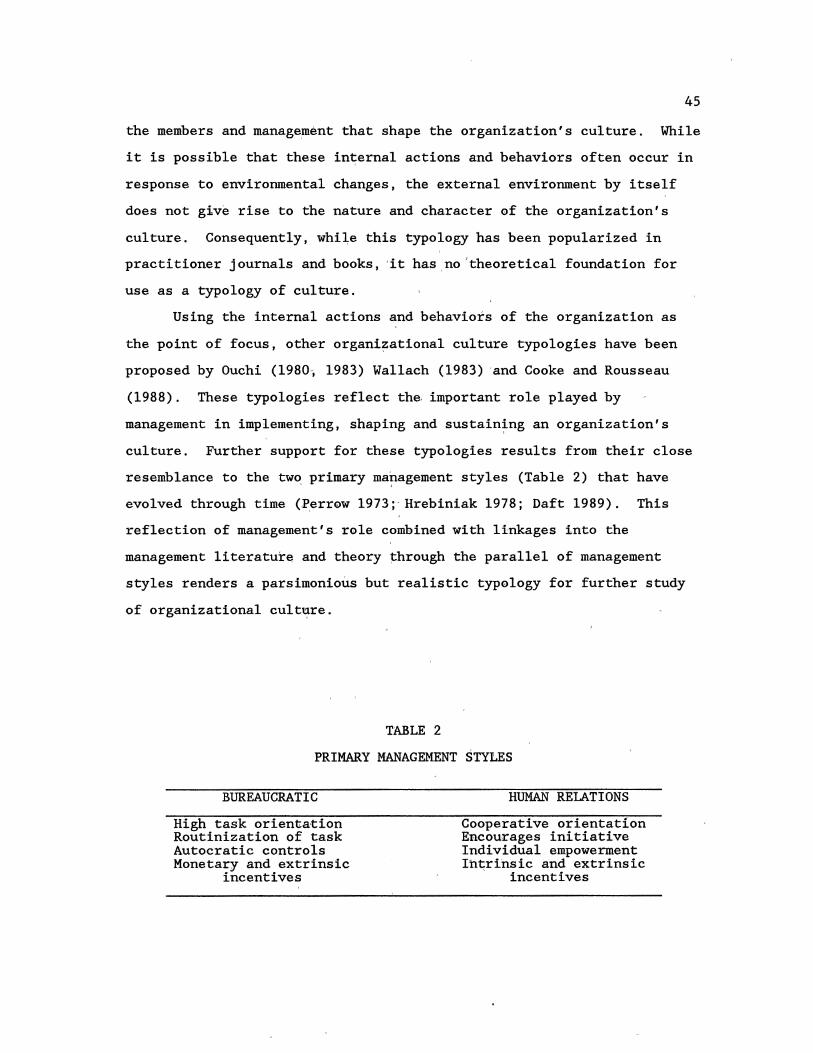
45
the members and manage~ent that shape the organization's culture. While
it is possible that these internal actions and behaviors often occur in
response to environmental changes, the external environment by itself
does not give rise to the nature and character of the organization's
culture. Consequently, while this typology has been popularized in
practitioner journals and books, it has no theoretical foundation for
use as a typology of culture.
Using the internal actions and behaviors of the organization as
the point of focus, other organizational culture typologies have been
proposed by Ouchi (1980; 1983) Wallach (1983) and Cooke and Rousseau
(1988). These typologies reflect the important role played by
management in implementing, shaping and sustaining an organization's
culture. Further support for these typologies results from their close
resemblance to the two primary management styles (Table 2) that have ' '
evolved through time (Perrc;,w 1973 ;' Hrebiniak 1978; Daft 1989). This
reflection of management's role combined with linkages into the
management literature and theory ~hrough the parallel of management
styles renders a parsimonious but realistic typology for further study
of organizational cult~re.
TABLE 2
PRIMARY MANAGEMENT STYLES
BUREAUCRATIC
High task orientation Routinization of task Autocratic controls Monetary and extrinsic
incentives
HUMAN RELATIONS
Cooperative orientation Encourages initiative Individual empowerment Intrinsic and extrinsic
incentives

Acknowledging that there are no "pure" types of cultures, Ouchi
(1981, p. 70) offers a typology of organizational culture with the
46
categories of "Type A" and "Type Z." Ouchi views the "Type A" culture
as impersonal, inflexible, and having explicit rules and control
mechanisms. While avoiding the prejoritive nature of-the term, Ouchi
labels the general "Type A" culture as a bureaucracy. Quite the
opposite, the "Type Z" culture is described as flexible, adaptive, and
controlled solely through the "mutual trust" that e~ists between
members. Within this cultu~e. the socialization of members toward a
common goal propels th~m to work for the common good. Thi.s
socialization process yields a high state of consistency in the internal
culture and results in intimate a~sociations of people. Because of this
typical characteristic of intimate association through common goals,
Ouchi adopted the label "clan" for the "Type Z" culture (Ouchi 1980,
1981, 1983). The characteristics of these generalized labels of
"bureaucracy" and "clart" closely resemble the previous typology of
managerial styles, thus readily lending themselves to use in comparing
management strategies. Reflecting the usefulness of this typology,
other researchers have embraced this descriptive terminology, of
generalized and extreme culture types originated by Ouchi. Wallach
(1983) offers a similar typology labeled "bureaucratic" and "supportive"
while Cooke and Rousseau ·(1988) use the terms "task" and "people."
The Bureaucratic Classification. The classifications of
"bureaucratic" and "task" ar~ characterized· by behavioral controls that
are based on negotiated terms of exchange, rules and legitimate
authority. Relationships are contractual i~ nature and the roles and
obligations of each party are set out (implicitly or explicitly) in
advance. Increases in performance are exchanged only for increased
rewards. Goal congruity is low with each party using the other as the
means for furthering its own goals. Rather than promoting a feeling of
membership, there is a feeling of independence and individuality in

which everyone pursues their own interests. The firm typically
minimizes the problems of goal incongruity and self interest through
close controls, monitoring, and rules.
47
The Clan Classification. The "clan," "supportive," and "people"
classifications describe control systems based upon socialization and
internalization of norms. Much like a fraternal group, members
recognize and accept an obligation that goes beyond the simple exchange
of labor for salary or other contractual obligations. There is a mutual
commitment (organization to individual and individual to organization)
that is based on mutual interests. Pressure to conform is high and
members share a strong sense of pride, goal congruence, and
identification {Ouchi 1980; Kerr and Slocum 1987). These
characteristics lend the "clan" to be the most efficient and effective
culture type under conditions of high job and/or task ambiguity (Ouchi
1980).
The Organizational Culture and Customer
Orientation Relationship
As discussed above {pp. 16-23), customer orientation is viewed as
a philosophy and behavior directed toward determining and understanding
the needs of the target customer and adapting the response in order to
satisfy those needs better than the competition. This philosophy and
behavior of customer orientation puts the salesperson, in the position of
a boundary spanner. That is, a customer oriented salesperson must
simultaneously represent, understand, and satisfy the needs of both the
organization and the customer. Marketing scholars examining the
multiple roles that are taken on by a salesperson representing the
customer as well as the firm argue that,the ensuing non-routine
situations and demands result in conditions of high job complexity and
job/task ambiguity (Walker, Churchill, and Ford 1975; Churchill, Ford
and Walker 1976; Dubinsky et al. 1986). As argued above by Ouchi (1980)
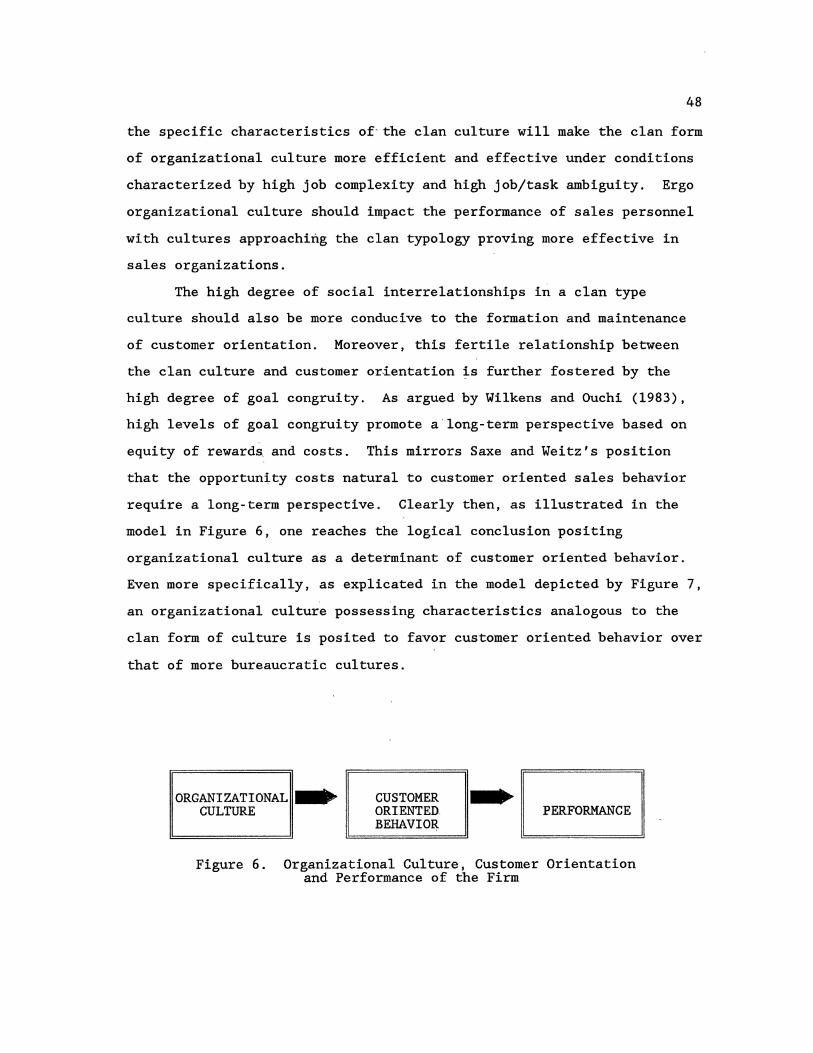
48
the specific characteristics of the clan culture will make the clan form
of organizational culture more efficient and effective under conditions
characterized by high job complexity and high job/task ambiguity. Ergo
organizational culture should impact the performance of sales personnel
with cultures approaching the clan typology proving more effective in
sales organizations.
The high degree of social interrelationships in a clan type
culture should also be more conducive to the formation and maintenance
of customer orientation. Moreover, this fertile relationship between
the clan culture and customer ori.entation is further fostered by the
high degree of goal congruity. As argued by Wilkens and Ouchi (1983),
high levels of goal congruity promote a'long-term perspective based on
equity of rewards and costs. This mirrors Saxe and Weitz's position
that the opportunity costs natural to customer oriented sales behavior
require a long-term perspective. Clearly then, as illustrated in the
model in Figure 6, one reaches the logical conclusion positing
organizational culture as a determinant of customer oriented behavior.
Even more specifically, as explicated in the model depicted by Figure 7,
an organizational culture possessing characteristics analogous to the
clan form of culture is posited to favor customer oriented behavior over
that of more bureaucratic cultures.
ORGANIZATIONAL = CULTURE
CUSTOMER ORIENTED BEHAVIO~
-- PERFORMANCE
Figure 6. Organizational Culture, Customer Orientation and Performance of the Firm
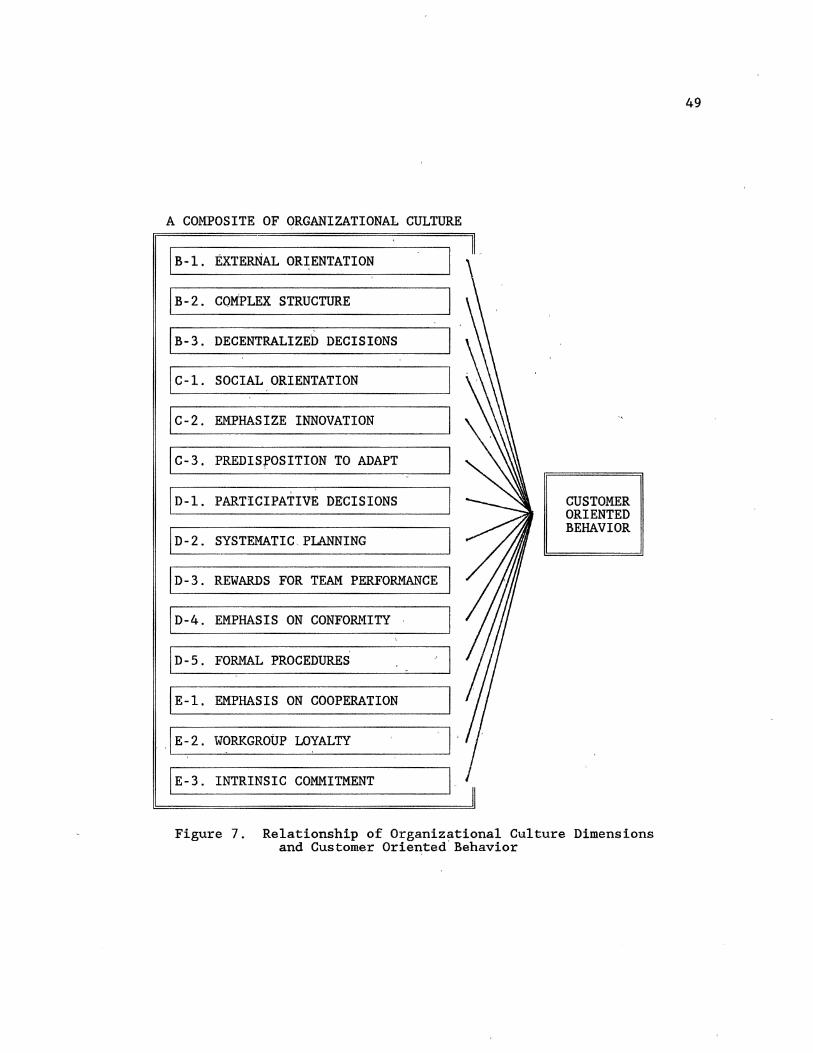
A COMPOSITE OF ORGANIZATIONAL CULTURE
IB-1. EXTERNAL ORIENTATION
IB-2. COMPLEX STRUCTURE
IB-3. DECENTRALIZED DECISIONS
I C-1. SOCIAL ORIENTATION
lc-2. EMPHASIZE INNOVATION
jc-3. PREDisrosiTION TO ADAPT
ln-1. PARTICIPATIVE DECISIONS I CUSTOMER ORIENTED
lo-2. I BEHAVIOR
SYSTEMATIC PLANNING
lo-3. REWARDS FOR TEAM PERFORMANCE I jo-4. EMPHASIS ON CONFORMITY I In-s. FORMAL PROCEDURES I I E-1. EMPHASIS ON COOPERATION
I
, .1 E-2. WORKGROUP LOYALTY I .
IE-3. INTRINSIC COMMITMENT I
Figure 7. Relationship of Organizational C~lture Dimensions and Customer Oriented'Behavior
49
CHAPTER III
RESEARCH DESIGN AND METHODOLOGY
Recent findings by Narver and Slater (1989, 1990) support the long
conceptualized positive relationship between customer orientation and
performance. This long awaited empiric~! support for the linkage
between customer orientation and performance further spotlights the
importance of advancing our knowledge and understanding of customer
orientation: What is market orientation and how does one create and
sustain such an orientation?
This stu.dy is designed to investigate the research question: How
does a firm create and sustain a customer orientation? More
specifically, this study posits and explores organizational culture as
an antecedent for the effective implementation and maintenance of
customer orientation within a sales force.
Research Ob)ectives
Investigation of the posited antecedent relationship between the
constructs of organizational cult~re and customer orientation require
suitable devices for measuring each construct.
introduces an immediate problem into the study:
This requirement
no suitable"existing
scales are avail~ble with proven reliability and validity.
As discussed previously (pp. 18-19), Saxe and Weitz's (1982) SOCO
scale provided a valuable first step Eoward the operationalization and
measurement of customer orientation as a behavior of salespeople.
Nevertheless, more recent interpretation of customer orientation
indicates that this scale might understate the domain of customer
orientation (pp. 21-23). In a similar fashion, published scales
so
51
purportedly measuring organizational culture fail to adequately address
the issues of reliability and validity. Consequently, development of
scales for the constructs of customer orientation and organizational
culture are major objectives for this study.
More specifically, the objectives of this study are threefold:
1. The study develops a scale for the purpose of measuring the organizational culture construct at the level of the individual member of ~he organization.
2. The Selling Orientation-Customer Orientation scale (Saxe and Weitz 1982) is extended to include the additional elements of the customer orientation domain (pp. 21-23).
3. Conceptualized relationships between organizational culture and cus·tomer orientation are explored.
Without some theoretical or empirical support for the much
conceptualized but untested dimensions of organizational culture,
specific hypotheses ca~not be developed. This study's development of
reliable and valid scales will reveal the dimensionality of the
constructs. This knowledge of the dimensions allows us to generate
specific hypotheses regarding the posited relationship between
organizational culture and customer orientation. In this manner, the
first two objectives of this study enable the third and final objective
to be fulfilled.
While to date, the dimensions of organizational culture are based
strictly on conjecture, the posited relationship between organizational
culture and customer orientation is theoretically based on specific ' '
characteristics of- each construct. The· customer oriented strat'egy is a
long term strategy that often requires the salesperson to take some form
of short-term opportunity cost in favor of a long term relationship in
the dyad. Saxe and Weitz (1982) discuss the additional time and effort
investment that must be made in the practice of customer oriented
behavior. Time must be spent in identifying and assessing the needs of
customers, plus more time is required in demonstrating how products
satisfy these needs. This investment of time and effort carries an

opportunity cost, as this same time could be used in selling other
customers and possibly achieving a higher level of immediate sales.
Saxe and Weitz (1982, p. 347) further posit that "the severest test of
customer orientation is faced when,salespeople must make a choice
between their customer's satisfaction and their own short-term self-
interest in closing each sale."
From this perspective, for a firm implementing or attempting to
sustain a customer orientation, the type of culture predominant within
52
the firm bec9mes a salient factor in the success of this strategy. The
characteristics qf a bureaucratic organizational culture would encourage
the salesperson to emphasize a goal of short-term gains in sales (self
interest is favored ·over the organizational goals) and thus diminish the
resulting level of customer orientation (Figure 7). This follows from
the bureaucratic culture's relationships being negotiated and
contractual in nature, thus promoting a feeling of independence. The
high levels of individu~lity promote low goal congruity as members
pursue their own -:i,nterests. Increased rewards are exchanged for
increased performance as each party attempts to use the other as a means
for furthering its owrt 0bj,ectives.
Conversely, the attributes of a clan oriented culture would
encourage a higher level of customer orientation. As documented
previously, the high degree goal congruency·a:nd social
interrelationships along with the communication natural to a clan type
culture would also be more conducive t0 the formation. and maintenance of ' '
customer orientation. Within the clan culture, members accept an
obligation going beyond the simple exchange of labor for salary or other
contractual obligations. ~igh l0ng-term goal orientation creates an
intrinsic motivation directing behavior .... a mutual commitment based on
mutual interests and equity of rewards and costs. This increased level
of customer orientation at the individual level would in turn aggregate
to an increased customer o~ientation at the level of the organizational

53
unit and ultimately the firm itself. Consequently, the clan form of
culture is posited to have a posit~ve relationship with customer
oriented behavior (Figure 8) and is analogous to.Parasuraman's (1985)
customer oriented culture. As conceptualized by Parasuraman (1985),
this customer oriented culture is (1) focused outside the firm allowing
it to gain a customer perspective; (2) gains fle,xibility in process and
response through empowerment of the member; (3) creative in generating
relevant solutions to customer problems; and (4) displays a sincere
respect for members.
Description of Samples
As it is the salesperson who directly interacts with the customer,
it is logical to view t:he customer orientation ef a firm as the
aggregate customer orientation of the firm's sales personnel.
Consequently, for the purpose of this study, customer orientation will
be operationalized as the individual behavior of sales force members and
measured at the level of the individual salesperson.
As reviewed by Jo~ce and Slocum (1984) and Glick (1985),
researchers in organizational behavior are split on the issue of what
level is appropriate for the studyof organizational culture. Tyagi
(1982) observes that the·more common view is that organizational
environment should be vieweQ.·as global perceptions held by individuals
about their objective organizational situations and interrelationships.
Schneider and Bartlett (1968)' also argue, that in measuring
organizational varlables, what is psychologically important to the
individual is his or her perception of the work environment rather than
how others choose to describe it.
In their study of employee reactions to job characteristics
Hackman and Lawler (19.71) observe that it is not the objective state
which affects the attitudes and behavior of employees, but rather how
they are perceived and experienced by the individual employee.
54
Regardless of the amount of feedback, autonomy, variety, or any other
job trait an employee objectively has in his work, it is the amount the
employee perceives he has that affects his reactions and behavior. The
objective characteristics are important as they give rise to the
perceptions and experiences of the· individual. But substantial
differences exist between the objective organizational or job
characteristics and how they a.re perc_eived by the employee.
Consequently, it is dangerous to assume identity between the objective
and perceived characteristics--as it is the perceived characteristic
that ultimately matters regarding behavior. Hackman and Lawler also
found that the employees were able to give nondistorted descriptions of
the perceived characteristics of their jobs.
This study sides with the more common view as set forth by Tyagi
(1982)· and takes the position that organizational culture should be
studied at the level of the individual. The pitfalls of improper
aggregation inherent in multilevel research is avoided by staying at the
level of the individual throughout the research design. Consequently,
both organizational culture and customer orientation are measured at the
level of the individual salesperson within his or her immediate
organizational environment (i.e. ~epartment, division, work unit).
Measuring both constructs of interest as perceptions and behaviors
of the individual salesperso~ offers two obvious benefits. First, by
measuring at this level of the individual,· the customer orientation
construct can be aggregated to any upward level of organization of
interest--SBU, division, or even company wide. Second, focusing on the
individual level allows both constructs, customer orientation and
organizational culture, to be measured simultaneously using the same
respondents. As our ultimate sample unit is to be individual
salespeople- ~not organization's or companies, cluster s·ampling will be
utilized within each participating company. These selected clusters
within the companies will be in tme form of sales offices, selling

55
departments, and sales groups. Within each of these selected clusters,
3 to 5- individual salespeople will be randomly chosen to participate in
the study.
The objectives of this study require that measures be developed
for the organizational culture and customer orientation constructs ·,
before specific relationships between the constructs can be hypothesized
and tested. In developing the measures for the two. constructs of
interest, this study will adhere to the guidelines established by
Churchill (1979) for the development of reliable, and valid measures.
The single exception being that in addition to the two data collection
and analysis steps recommended by Churchill, this study includes one
additional data gathering and analysis step.
This additional step, designated as the "pre-pilot study," is
included to provide an additional step for the reduction of item -
statements in the organizational culture scale. Research guidelines for
multivariate analysis ~ecommend 5 to 10 times as many subjects as items
(Nunnally 1978; Hair et al. 1992). Due to the large number of items
required to inclusively repr,esent the 14 components of orgaaizational
culture (pp, 69-72) posited in the literature, the number of subjects
required to meet this suggested ratio of subjects to items would have
depleted the pool of potential sales force participants, leaving too few
sales force participants for the main field su~ey. Consequently, the
design of this study utilizes an additional sample and data collection
step at the beginning. This pre-pilo~ sample is_made up of general,
non-selling e~plo:yees and utilized in initial purification and reduction
of items relative only to the organizational culture s.cale. Subsequent
to this initial item reduction step for ~rganizational culture,
sufficient numbers of subjects are available to satisfy the multivariate
analysis requirement!'~ for Churchill's two data collection and analysis
steps, referred to herein as "pilot survey" and "field survey."
56
Pre-Pilot Survey Sample
The pre-pilot study was to be used as an initial purification and
item reduction stage only for the organizational culture scale.
Consequently, in keeping with the e~hortions of Calder, Phillips, and
Tybout (1981) regarding relevant samples, participants were not required
to hold a sales position. The required characteristics in this initial
pre-pilot sample are (a) each participant must be currently employed and
working, and (b) no participant could be self-employed.
Through nine different organizations indicating a willingness to
work with our study, a convenience sample of 137 individuals satisfying
the stated requirements was selected. Ques-tionnaires were distributed
to participants by the researcher. Care was taken to use companies that
were not to be utilized in the two ensuing (:lata collection stages.
Pilot Survey Sample
The pilot survey is utilized in the purification and assessment of
reliability for both the organizational culture and the customer
orientation scales. roward the goal of obtaining a relevant sample of
participants, the participation of managers from 81 different companies
was obtained, resulting in 683 participants representing a
stratification of diff~rent selling situations. Survey instruments were
distributed directly by the primary researcher in meetings of the
participants.
Field Survey Sample
Imposing the requirement that no duplication of participants be
allowed across the three samples, the cooperation of sales managers in
59 firms was secured resulting in 394 participants for this third and
final data collection step. Questionnaires were distributed to
participating salespeople during a regular sales meeting. As in the
pilot sample, participating firms were selected so as to provide a
stratification of various selling situations.
Data Collection Process
57
To gain the cooper~tion of companies and to further encourage
individual salespeople to partic~pate and respond, this study was
conducted under the auspices of O~lahoma State University's Center for
Product and Service Quality. All writt~n material such as envelopes,
cover letters, and questionnaires displayed the LOGO and return address
of the Center for Product and Service Quality. Confidentiality was
further assured for respondents in a cover letter and an oral statement
at the time of dis,tributing the s,urveys. In addressing a potential
source of error, it is important that respondents understand that their
responses are aggregated into the study and that their individual
answers will not be divulged to anyone-~especially the company.
For control and follow-up, identification coded are used to
identify the specific sampling unit organiz'ation. 'Denoting specific
company and organizati~nal unit, the codes also provide input for
further statistical analysis.
Following Churchill's (1979) multi-step process, the
questionnaires used in each phase of this study are developed from the
refined scale items produce'~ in the prior s·'beps of development and
purification. In addition to these refined scale items, global measures
and other items are included in t~e instrument for use in scale
validation (pp. 64-67). Supplementary questions are also included to
gather demographic info.rrnation for use as possible co-variates and
grouping variables for analysis.
Scale Development
In discussing the'need for researchers to develop reliable and
valid measures, Churchill (1979) recommends a multi-step process for

58
scale development. Consistent with Churchill's multi-step process, the
scale development objectives of this study (pp. 50-51) are attained
through the following process for each construct: (1) Specification of
the domains; (2) Generation of multiple statement items sampling the
domains; (3) Conduct a pilot test as the first collection of data; (4)
Reduction of the number of items throu$h the use of statistical
techniques of item-to-total correlations and fac'tor analysis; (5)
Execute a field survey as the second collection of data; (6) Assess
scale reliability; (7) Assess scale validity; and (8) Develop norms and
relationships for the constructs of interest. In developing the norms
and relationships called for in the final step, the hypothesized
relationships between (a) the constructs of organizational culture and
customer orientati~n, and (b) the dimensions of organizational culture
and the construct customer orientation are, tested.
Specification of Domain
As discussed in chapter two, various conceptualizations exist for
the domain of both constructs, customer orientation (pp. 16-23) and
organizational culture (pp. 23-28). For the purpose of this study, the
domains of each construct are established through a two step process.
First content analysis was performed on the various conceptualizations
taken from the literature. For further verification, the results of
this content analysis were then subjected to additional qualitative
analysis including field observation and interviews.
Customer Orientat,ion
Although differing from prior conceptualizations in the literature
in both number and surface appearance, clos,er examination of customer
orientation as conceptualized in the sales management and
services/quality literature reveals parallel relationships. The
following inventory of the customer orientation domain is the direct

59
outcome from qualitative research combining (a) content analysis of
prior conceptualizations in sales management (pp. 17-19) and
services/quality (pp. 19-20) literature with (b) the expanded components
(pp. 21-23) from Narver and Slater (1989), Manning and Reece (1990), and
Coppett and Staples (1990).
1. Possesses a willingness to help customers. The salesperson is friendly and has a positive personality. He/she is responsive and desires to help customers make a satisfactory purchase decision.
2. Assesses customer needs through 2-way communication. The salesperson focuses upon problem solving by being inquisitive, listening, and understanding customer needs. Hejshe helps the customer understand their needs and how products address these needs.
3. Uses understanding rather than manipulation. The behavior of salespeople is understanding rather than overpowering or dominating. Hejshe is approachable and actively involves the customer--easy going rather than high pressure.
4. Avoids use of deceitful practices. Salesperson is competent and credible. He/she possesses the skills and knowledge to describe products accurately. Salespeople avoid deceptive tactics and are trustworthy.
5. Builds value by offering products that satisfy customer needs. Salespeople are flexible and adaptive in tailoring products to meet changing demands and needs of customers. Offers products that match customer needs.
6. Represents customer to the company. Salesperson is a source of market information by communicating the customers' needs back to the company. Hejslie assists in product and market planning and development based on knowledge of customer needs.
7. Practices the double win philosophy. Salespeople have commitment to the customer based on long-term relationships from which all parties receive mutual benefits and rewards. Hejshe build long-term relationships based on transactions in which (1) neither buyer or seller take advantage of the other party; and (2) all parties profit.
8. Evaluates customer satisfaction and provides follow-up activities. In order to better assure the continuation of longterm relationships, salespeople evaluate and measure customer satisfaction. Using this information, hejshe develop follow-up responses to address and alleviate problems.
60
Derived through qualitative research, the appropriateness of these
eight posited components of customer orientation is empirically examined
as a part of this study. The results of this analysis will provide a
superior understanding of the dimensionality of the expanded customer
orientation construct.
Organizational Culture
Researchers of organizational environment and culture posit a
multi-dimensional construct. Primarily refl,ecting the work of Reynolds
(1986) and incorporating organizational environment conceptualizations
from Campbell et al. (1970), Tyagi (1982), Toto (1986), and Schein
(1985), the domain of organizational culture is depicted below:
1. External vs. internal orientation This element assesses the amount of focus upon the external environment as opposed to attention given to internal details such as co~ittee meetings, reports, and paper work.
2. Si,mple vs complex organizational structure Concerned with the inclination an organization has toward developing elaborate structures and procedures, this element is~ relevant to both the formal complexity, ambiguity and complexity of political and informal processes within the organization.
3. Decentralized vs centralized decision making This component measures the extent to which individuals in key positions impact decisions, plans, and actions of,the organization--centralization. At the other extreme--decentralization--individuals andjor work teams are allowed te impact decisions and plans regarding their own situations.
4. Predisposed toward adaptivity and change vs. caution and safety · . When confronted with challenges and opportunities in the environment, this component considers the organizational response in terms of predisposition to be cautious and conservative in adopting different plans, products, and procedures.
5. Task vs~ social emphasis This component pertains to the amount of organizatic;mal focus placed upon work and W01.'k issues as opposed to persona~, interpersonal, and social needs of employees and customers.
61
6. Focus on stability vs innovation This element is purportedly slightly different from "A" immediately above and assesses the organizations tendency to seek new and innovative ways to do things. At one extreme would be the orientation to avoid new methods and procedures that are not well established. At the other extreme would be the organizational tendency to perpetually be searching out novel procedures and products.
7. Individual vs participative decision making This component evaluates the degree to which the organization values key individuals making decisions and proceeding with'implementation. The other extreme would be decisions and implementation being the result of collective inputs from various individuals.
8. Ad hocery vs systematic planning This particular element contrasts the organizational tendency to anticipate and plan for change as opposed to reacting in an ad hoc fashion to changes as they occur.
9. Rewards based on individual vs team contributions While all organizations provide some type of rewards to members, this element concerns the extent to which rewards are based on individual accomplishments as opposed to the performance of a work team or unit.
10. Focus on conformity vs individuality This component measures the extent that an organization tolerates or encourages members to be distinctive and idiosyncratic in their work and social activities. Some or,ganizations encourage considerable variance in dress, work activities, and social manners. Other firms encourage a high degree of homogeneity and uniformity in work activities as well as personal lives.
11. Informal vs formal procedures This component concerns the tendency of an organization to have formal mechanisms for procedures and decision making. While some firms utilize detailed r~les and written documents to justify decisions and actions, others prefer minimal formalization and reach approval on major issues through discussion.
12. Cooperation vs competition among fellow workers This component measures the degree to which members perceive their peers to be competitors or colleagues regarding resources and rewards coming from the organization. While competitors rival one another for rewards, colleagues work together to contend with outside competitors.
13. High vs low loyalty Members have multiple loyalties spread among various organizations to which they belong. This component measures the degree to which members place the organization above other groups.
62
14. Intrinsic vs extrinsic commitment Individuals become committed to organizations for a wide variety of reasons. This component refers to the basis for this commitment: financial rewards, prestige, challenge, personal relationships, and opportunities for self-fulfillment.
Support for these multiple dimensions and components of
organizational culture as conceptualized in the literature are
empirically investigated as a part of this study. These study results
explicate the dimensions of organizational culture and contribute much
needed understanding regarding the organizational culture construct.
Generation of Samples of Items
A listing of 140 item statements representing organizational
culture and 80 representing customer orientation (Appendix A) were
developed using existing literature in the field and interviews with
knowledgeable individuals. Items for measurement of both constructs are
structured as Likert scales with a bi-polar design. The use of Likert
scales yields interval scaled data required for statistical analysis
using item-to-total correlations, Cronbach's alpha, factor analysis, and
multiple regression. Both positively and negatively worded items are
also included in the design to control possible introduction of bias
from yea/nay saying. The scale measuring customer orientation is
constructed so that low scores would represent low customer orientation
and high scores depicting high customer orientation. Low scores on the
organizational culture measure describe a culture tending to be more
bureaucratic in nature while higher scores characterize a clan type of
culture.
Pre-Pilot Survey
The organizational culture items were further reduced to a total
of 74 item statements through the use of expert judges. Each of the 14
dimensions were represented with multiple items. These remaining items

63
were reproduced as a three page questionnaire (Appendix B) and
distributed to the participants making up the pre~pilot sample of
employees. Using item-to-total correlations within each dimensional set
of item statements, the list of items was further purified and reduced
for use in the pilot study.
Pilot Survey
Using the purified list of items representing organizational
culture from the pre-pilot survey and the listing of items generated for
customer orientation a four section questionnaire (Appendix C) was
constructed for use in the pilot survey. ,This pilot survey would
correspond with Churchill's (1979) "first data collection step." The
data resulting from this survey provides the input for the following
item reduction step in order to reduce the items to a more reliable and
parsimonious set.
Item Reduction
The statistical analysis techniques of item-to-total correlations,
Cronbach's Coefficient alpha, and factor analysis were utilized in this
stage of the study. Use of these statistical techniques aid in (a)
further purifying and reducing the item statements, (b) identification
of the dimensionality of both constructs, and (c) provide initial
support for the reliability of the resulting measures.
Corresponding to acceptable criteria, our goal in this stage of
analysis is to establish minimum factor loadings of .5 with a difference
in cross loadings of .2 (Mair et al., 1992, p. 239) and alphas of at
least .6 or better (Nunnally 1978; Churchill 1979).
Field Survey
Using a questionnaire consisting of the revised scales from the
immediately preceding stage of item reduction, a second collection of
data was completed using participants in the field survey sample (pp.
56-57). The instrument is included as Appendix D. Data collected in
this field survey is used for three purposes: The data is first
analyzed to confirm the reliability of the measures. Second, further
analysis is used for assessing the validity of the measures. The last
analysis of this field survey data tests the study's hypothesized
relationships between organizational culture and customer orientation.
Assess Reliability
64
Following this second collection of data, the reliability of the
reduced scale is verified with the new data from the field survey. In a
similar fashion as above, this analysis is conducted using item-to-total
correlations, Cronbach's coefficient alpha, and factor analysis.
Assess Validity
Having established support for the reliability of the measures,
validity is assessed through the use of the multi-trait multi-method
(MTMM) methodology (Campbell and Fiske 1959). The MTMM indicates
measure reliability, d~scriminant validity, convergent ~alidity and
construct validity. This assessment is accomplished through a simple
procedure consisting of a matrix of correlations between several
variables or concepts measured by several different methods (Campbell
and Fiske 1959, and Heeler and Ray 1972).
Convergent Validity
The MTMM allows assessment of convergent validity by examining the
correlations between different measures of the same construct. For , '
convergent validity of the new customer orientation measure, comparison
is made to data from the SOCO customer orientation scale (Saxe and Weitz
1982). With both scales purportedly measuring the same construct, a
high correlation supports convergent validity.
65
Convergent validity of the organizational culture scale is
evaluated using the correlation with a different methodology and measure
of organizational culture types. This second methodology, developed by
Ouchi (1983), uses two descriptions of a generic organization: one
description typifies the general characteristics of a bureaucracy, the
other exemplifying the Theory Z (clan) organizational culture.
Participants choose the description according to its semblance to their
current organization. As both methods are, posited to measure the extent
of bureaucracy and clan organizational culture characteristics,
convergent validity is denoted by a high correlation between the two
measurement methods.
Discriminant Validity
Within the MTMM, discriminant validity is examined through the
comparison of the convergent validities with:
1. correlations between different .traits measured by different methods (heteromethod-heterotrait).
2. correlations between different traits measured by the same method (monomethod-heterotrait).
Using these comparative correlations, consistently larger convergent
validities indicate discriminant validation.
As we are restricted in this study to the use of a single method
(a paper and pencil self-rating method), our ability to derive
"maximally different" methods is greatly hampered. Heeler and Ray
(1972) discuss the difficulties marketing researchers often encounter in
meeting the rigorous assumptions of maximally different measures
required under the MTMM. While these requirements are severe on the
surface, rather than be forced away from using this validation
instrument, Heeler and Ray (1972), recommend that marketers design their
research to include multiple traits and different levels of measurement
so as to meet the requirements for using MTMM. In following this
counsel, this study utilizes a separate global measure of comparative
" 66
constructs in addition to the multi-item measures of the comparative
constructs in assessing discriminant validity. The comparative
construct chosen for this evaluation of discriminant validity is job
satisfaction. The discriminant validity will be assessed through the
inclusion of both multi-item and global measures of job satisfaction.
While both organizational culture and_customer orientation should be
positively correlated with j,ob satisfaction, valid scales should
discriminate between these related constructs.
Construct Validity
Support for construct validity can be assessed by the MTMM when
the correlations between the different constructs measured thus far in
our analysis exhibit similar patterns when measured by the same (mono
method) or by different (multi-method) methods.
Nomolo~ical Validity
Having addressed these basic forms of validity successfully, the
next step in evaluating the scales is to address the issue of
nomological validity by exam~ning relationships between each of the
primary constructs of interest and other constructs to see if
conceptualized and accepted relationships hold true. If these
relationships are congruent with what is known from the literature, then
support for nomological validity is established. While not demanding
high correlations, this portion of validity assessment does require a
number of correlations consistent with the conceptualized expectations.
The nomological validity of the extended customer orientation
scale and the organizational culture scale will be assessed through the
use of (a) the ability.to help measure (Saxe and Weitz 1982), (b) the
cooperative relations measure (Saxe and Weitz 1982), (c) the
organizational commitment scale (Hrebiniak and Allutto 1972), and (d)
the work motivation measure (Hackman and Oldham 1976).
Upon support of this final transcending form of validity, the
study progresses to testing the hypotheses regarding the relationship
between organizational culture and the level of customer orientation.
Testing the Posited Relationships Between
Organizational Cult~re and
Customer Orientation
This study set out to address the question: How does a firm
create and sustain a customer orientation? As an answer to this
question, this study sets forth certain hypotheses positing specific
relationships between a firm's organizational culture and its level of
customer orientation.
67
These hypotheses are investigated through the use of univariate
and multiple regression statistical ~nalyses. The data for these
analyses consists of the survey r~sults from the field survey utilized
as a part of the scale development portion of this study {p. 63). This
additional use of this survey data is supported by Churchill's (1979)
discussion of norm development as the last step for effective scale
development.
The first test is designed to test relationships at the construct
level. In this first test, salesperson customer orientation is set as
the criterion variable using the summated s"e,ores from the extended and
revised SOCO scale as the measure. The predictor variable is
organizational culture, operationalized as summated factor scores from
the organizational culture scale.
The next step in regression analysis examines the relationships
between the individual dimensions of organizational culture and customer
orientation. In this level of analysis, the summated scores for
salesperson customer orientation again serve as the criterion variable
of interest. Scores for the individual dimensions of organizational
culture will be used as predictor ~ariables. The relative influence of

each dimension is ascertained and documented through the use of
standardized beta coefficients.
68

CHAPTER IV
RESEARCH FINDINGS: SCALE DEVELOPMENT
This chapter recounts the findings from the scale development
process called for by the first two objectives of this study. Following
the descriptions of the respondents participating in each of the three
surveys, results from the scale development process are presented in a
sequential fashion for both scales. With one exception, Churchill's
(1979) multi-step process for the development of reliable and valid
measures provided the framework for the actual data collection and
analysis in this study. Consequently, this same structure will be
utilized in organizing and presenting the findings. The single
deviation from Churchill's procedure is the inclusion of one additional
data gathering and analysis step.
This additional step, designated in the following discussion of
findings as the pre-pilot study, was included to provide an additional
step for the reduction of item statements in the organizational culture
scale. Research guidelines f~r multivariate analysis recommend 5 to 10
times as many subjects as items (Nunnally 1978; Hair et al. 1992). Due
to the large number of items required to inclusively represent the 14
components of organizational culture (pp, 69-72) posited in the
literature, the number of subjects required to meet this required ratio
of subjects to items would have depleted the available pool of potential
sales force participants, leaving too few actual salespeople
participants for the main field survey.
Reflecting the additian of this step, the scale development
findings are reported in the order of: (1) descriptions of respondents
for each of the three data collection surveys, (2) specification of
69
70
domains for each construct, (3) the generation of multiple item
statements, (4) the first data collection--the pre pilot survey, (5) the
second data collection--the pilot survey, (6) analysis for item
reduction, (7) the third data collection--field survey, (8) item
purification and reliability assessment, and (9) assessment of validity.
Description of Respondents
Pre-Pilot Survey Respondents
This step was designed to be used only as an initial purification
and item reduction procedure for the organizational culture scale.
Consequently, the requirements for using a relevant sample of
participants (Calder, Phillips, and Tybout 1981), did not restrict the
study to using salespeople in this early stage of development. The
required characteristics in this initial pre-pilot sample were (a) each
participant must be currently employed and working, and (b) no
participant could be self-employed.
Following solicitation by the researcher, nine different
organizations expressed a willingness to werk with our study. Access to
employees of the cooperating firms resulted in a convenience sample of
137 individuals satisfying the above stated requirements. Of the 137
surveys distributed, 108 completed surveys were returned, resulting in a
return rate of 79 percent.
Care was taken to use c?mpanies that were not to be utilized in
the subsequent collections of data. The selection process was designed
to include firms representing (a) consumer, (b) business-to-business,
and (c) institutional business types (Table 3). Furthermore, within
each organization, individuals were taken across different departments
so that a number of employment categories would be represented (Table
4).

TABLE 3
FREQUENCIES OF PRE-PILOT SURVEY RESPONDENTS BY PRODUCT TYPES
BUSINESS TYPE
CONSUMER BUSINESS-TO-BUSINESS INSTITUTIONAL
TABLE 4
FREQUENCY
58 33 17
FREQUENCIES OF PRE-PILOT SURVEY RESPONDENTS BY EMPLOYMENT TYPES
EMPLOYMENT TYPE
PROFESSIONAL MANAGER/SUPERVISOR OFFICE WORKER GENERAL EMPLOYEE
Pilot Survey Respondents
FREQUENCY
22 13 12 61
Data resulting from the pilot survey is utilized for the
purification and assessment of reliability for both constructs of
interest, organizational culture and customer orientation. Toward the
71
purpose of obtaining a sample of participants relevant to both
constructs, ie. salespeople, the participation of managers from a select
group of companies was solicited. These companies were selected on a
stratified basis of selling situation types (ie. need for pre-sale
assistance, need for post-sale assistance, goods vs. services, and
consumer vs. industrial). With the cooperation of 81 different
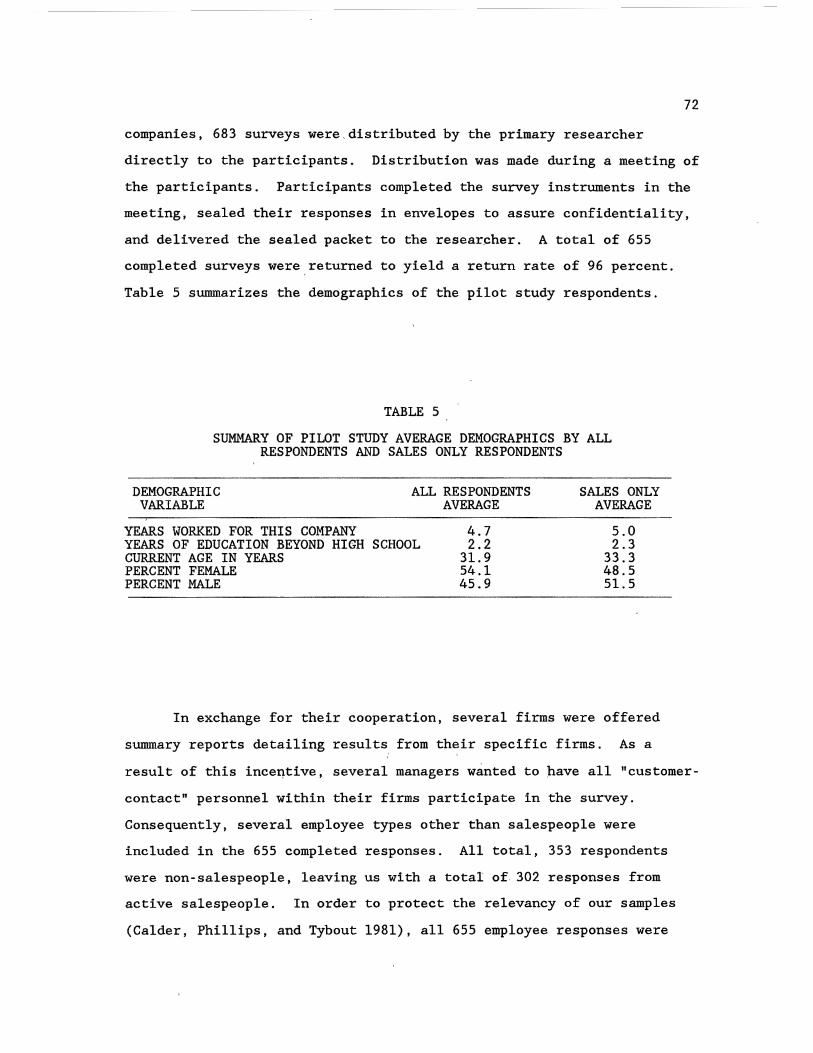
72
companies, 683 surveys were distributed by the primary researcher
directly to the participants. Distribution was made during a meeting of
the participants. Participants completed the survey instruments in the
meeting, sealed their responses in envelopes to assure confidentiality,
and delivered the sealed packet to the researcher. A total of 655
completed surveys were returned to yield a return rate of 96 percent.
Table 5 summarizes the demographics of the pilot study respondents.
TABLE 5
SUMMARY OF PILOT STUDY AVERAGE DEMOGRAPHICS BY ALL RESPONDENTS AND SALES ONLY RESPONDENTS
DEMOGRAPHIC VARIABLE
YEARS WORKED FOR THIS COMPANY
ALL RESPONDENTS AVERAGE
YEARS OF EDUCATION BEYOND HIGH SCHOOL CURRENT AGE IN YEARS
4.7 2.2
31.9 54.1 45.9
PERCENT FEMALE PERCENT MALE
SALES ONLY AVERAGE
5.0 2.3
33.3 48.5 51.5
In exchange for their cooperation, several firms were offered
summary reports detailing results from their specific firms. As a
result of this incentive, several managers wanted to have all "customer
contact" personnel within their firms participate in the survey.
Consequently, several employee types other than salespeople were
included in the 655 completed responses. All total, 353 respondents
were non-salespeople, leaving us with a total of 302 responses from
active salespeople. In order to protect the relevancy of our samples
(Calder, Phillips, and Tybout 1981), all 655 employee responses were
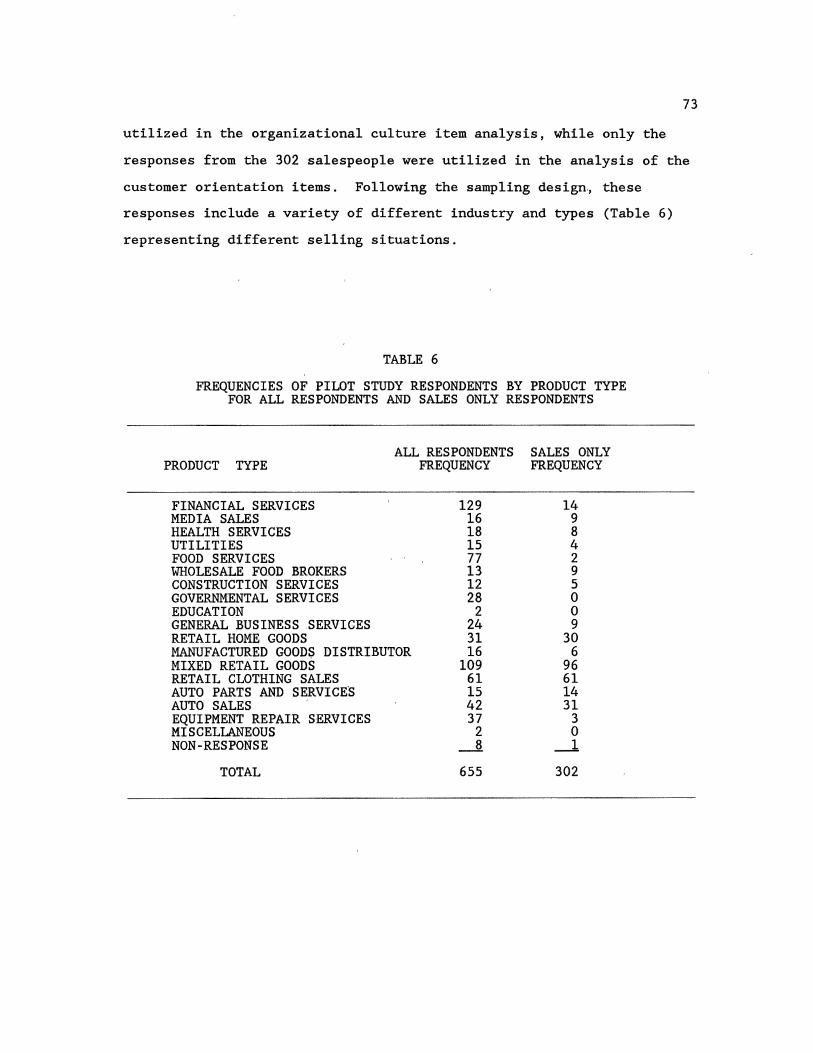
73
utilized in the organizational culture item analysis, while only the
responses from the 302 salespeople were utilized in the analysis of the
customer orientation items. Following the sampling design., these
responses include a variety of different industry and types (Table 6)
representing different selling situations.
TABLE 6
FREQUENCIES OF PILOT STUDY RESPONDENTS BY PRODUCT TYPE FOR ALL RESPONDENTS AND SALES ONLY RESPONDENTS
ALL RESPONDENTS SALES ONLY PRODUCT TYPE
FINANCIAL SERVICES MEDIA SALES HEALTH SERVICES UTILITIES FOOD SERVICES WHOLESALE FOOD BROKERS CONSTRUCTION SERVICES GOVERNMENTAL SERVICES EDUCATION GENERAL BUSINESS .SERVICES RETAIL HOME GOODS MANUFACTURED GOODS DISTRIBUTOR MIXED RETAIL GOODS RETAIL CLOTHING SALES AUTO PARTS AND SERVICES AUTO SALES ' EQUIPMENT REPAIR S·ERVICES MISCELLANEOUS NON-RESPONSE
TOTAL
FREQUENCY FREQUENCY
129 16 18 15 77 13 12 28
2 24 31 16
109 61 15 42 37
2 _8
655
14 9 8 4 2 9 5 0 0 9
30 6
96 61 14 31
3 0
_1
302
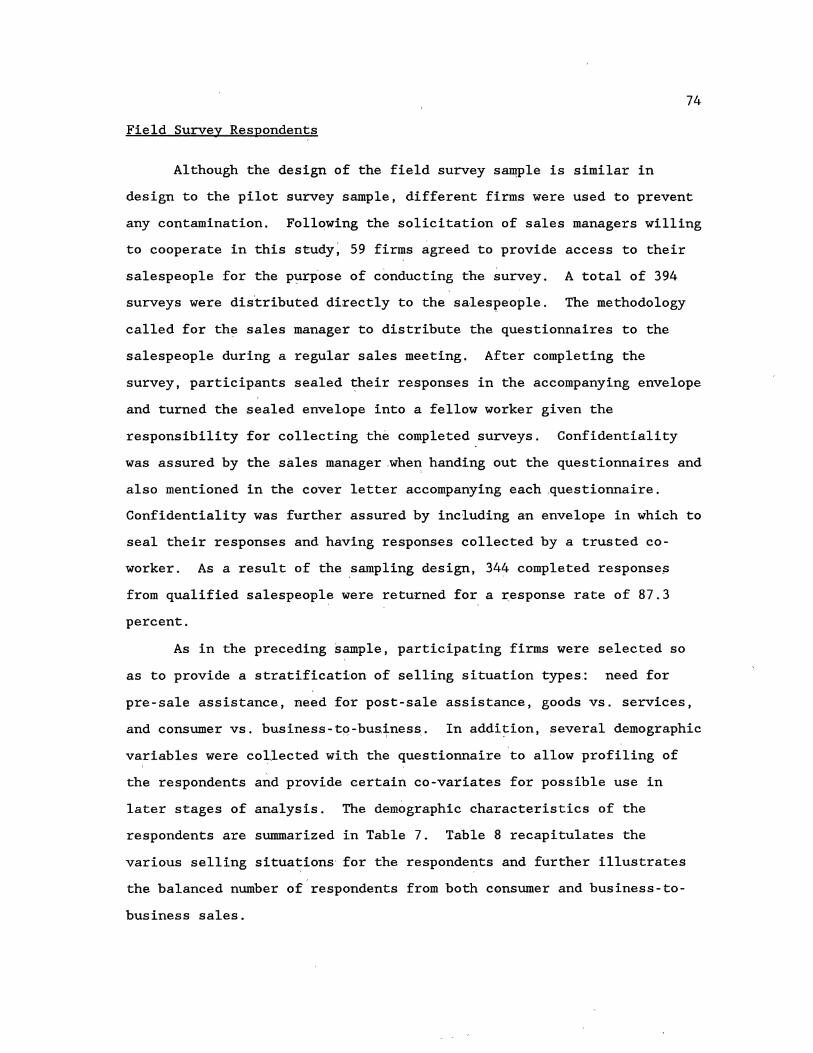
74
Field Survey Respondents
Although the design of the field survey s~ple is similar in
design to the pilot survey sample, different firms were used to prevent
any contamination. Foll~wing the solicitation of sales managers willing
to cooperate in this study, 59 firms agreed to provide access to their
salespeople for the purpose of conducting the survey. A total of 394
surveys were distributed directly to the salespeople. The methodology
called for the sales manager to distribute the questionnaires to the
salespeople during a regular sales meeting. After completing the
survey, participants sealed their responses in the accompanying envelope
and turned the sealed envelope into a fellow worker given the
responsibility for collecting the completed surveys. Confidentiality
was assured by the sales manager whe~ handing out the questionnaires and
also mentioned in the cover letter accompanying each .questionnaire.
Confidentiality was further assured by including an envelope in which to
seal their responses and having respons·es collected by a t:r;usted co
worker. As a result of the sampling design, 344 completed response~
from qualified salespeople were returned for a r_esponse rate of 87.3
percent.
As in the preceding sample, participating firms were selected so
as to provide a stratificati·on of selling situation types: need for
pre-sale assistance, need for post-sale assistance, goods vs. services,
and consumer vs. business-tq-bus.~ness,. In addition, several demographic
variables were collected with the questionnaire to allow profiling of
the respondents and provide certain co-variates for possible use in
later stages of analysis. The demographic characteristics of the
respondents are summarized in Table 7. Table 8 recapitulates the
various selling situations for thy respondents and further illustrates
the balanced number of respondents from both consumer and business-to
business sales.
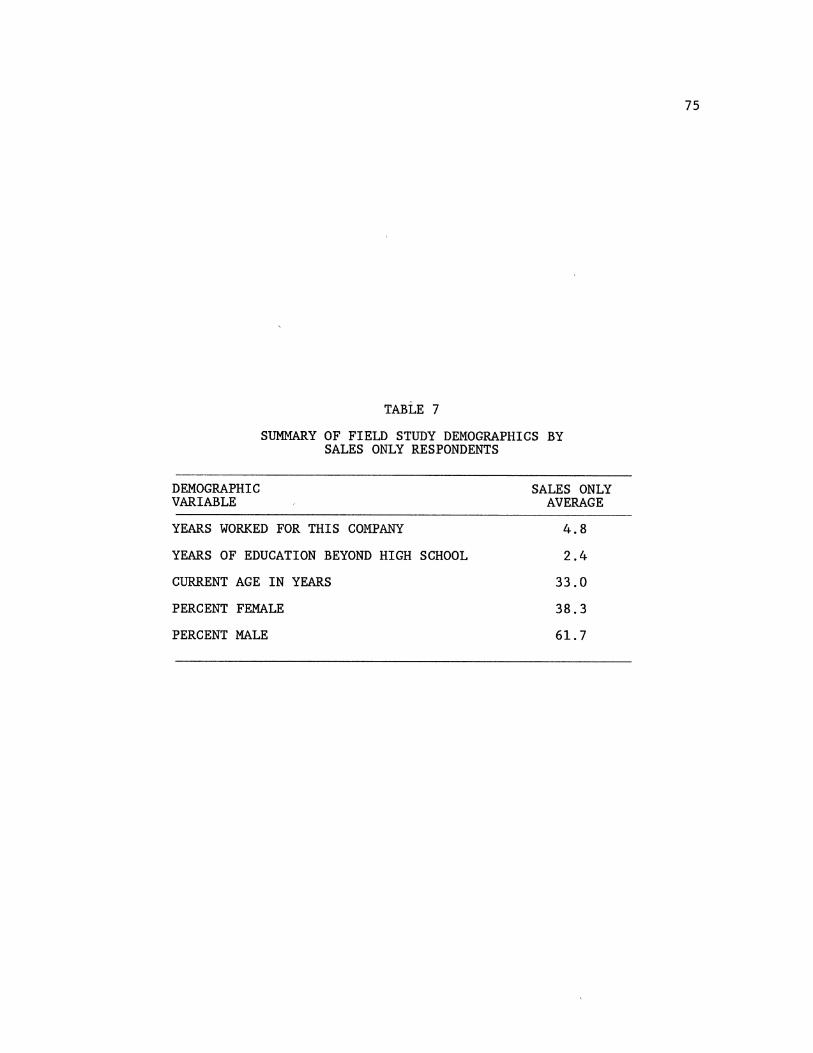
TABLE 7
SUMMARY OF FIELD STUDY DEMOGRAPHICS BY SALES ONLY RESPONDENTS
DEMOGRAPHIC VARIABLE
YEARS WORKED FOR THIS COMPANY
YEARS OF EDUCATION BEYOND HIGH SCHOOL
CURRENT AGE IN YEARS
PERCENT FEMALE
PERCENT MALE
SALES ONLY AVERAGE
4.8
2.4
33.0
38.3
61.7
75

',!:ABLE 8
FREQUENCIES OF FIELD STUDY RESPONDENTS BY PRODUCT TYPE FOR SALES ONLY RESPONDENTS
PRODUCT TYPE
BUSINESS TO BUSINESS SALES: General Business Services Media Sales Printing Office Equipment Food/Beverage·Wholesaler Oil Field Equipment Electronic ~omponents Packaged Goods Wholesaler Construction Materials Home Goods Wholesaler Oil and Gas Sales Prescription Drugs
SUB TOTAL
CONSUMER SALES: Financial Services Real Estate Electronics Sales Discount Store Clothing Sales Jewelry Sales Home Goods Food Sales Automotive Travel/Entertainment Home Maintenance Services Health Services Floral Sales General Retail
SUB TOTAL Non Response
GRAND TOTAL
SALES ONLY FREQUENCY
3 18
4 4
53 5
47 7 3 4 3 4
155
7 10
9 14 34
2 9 6
33 5 2 5 5
30
45.1%
171 49.7% 18 5.2%
344 100.0%
76
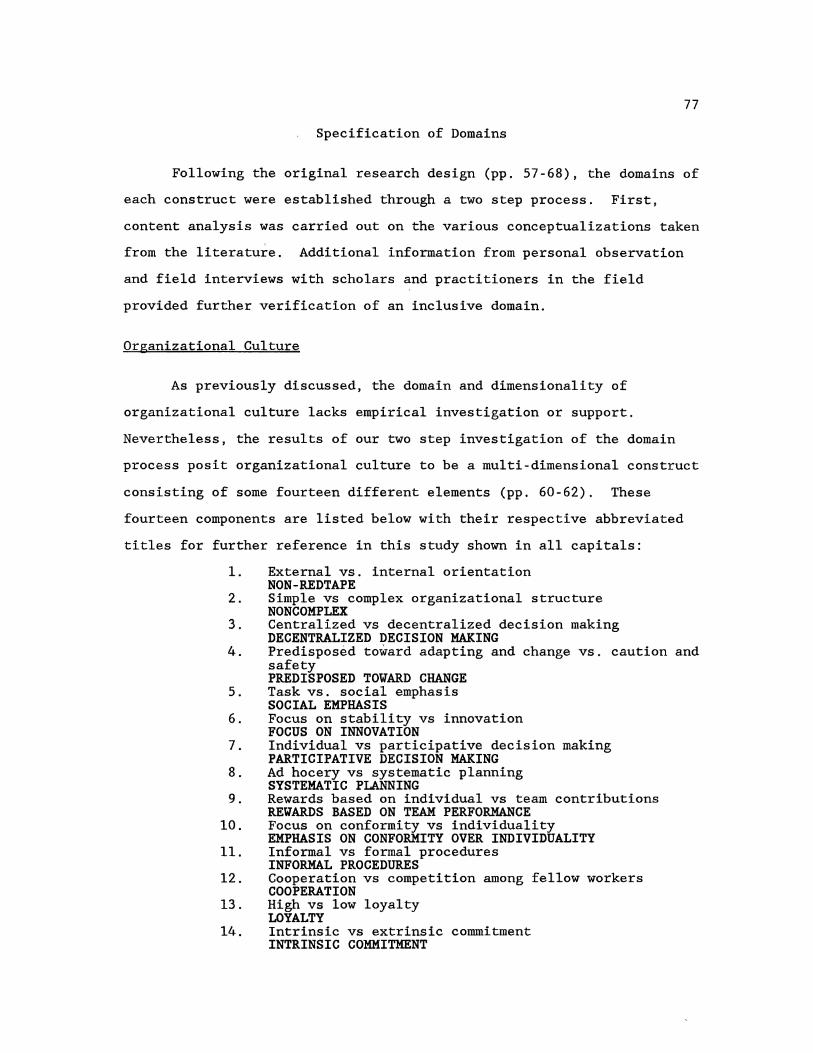
77
Specification of Domains
Following the original research design (pp. 57-68), the domains of
each construct were established through a two step process. First,
content analysis was carried out on the various conceptualizations taken
from the literature. Additional information from personal observation
and field interviews with scholars and practitioners in the field
provided further verification of an inclusive domain.
Organizational Culture
As previously discussed, the domain and dimensionality of
organizational culture lacks empirical investigation or support.
Nevertheless, the results of our two step investigation of the domain
process posit organizational culture to be a multi-dimensional construct
consisting of some fourteen different elements (pp. 60-62). These
fourteen components are listed below with their respective abbreviated
titles for further reference in this study shown in all capitals:
1. External vs. internal orientation NON-REDTAPE
2. Simple vs complex organizational structure NON COMPLEX
3. Centralized vs decentralized decision making DECENTRALIZED DECISION MAKING
4. Predisposed toward adapting and change vs. caution and safety PREDISPOSED TOWARD CHANGE
5. Task vs. social emphasis SOCIAL EMPHASIS
6. Focus on stability vs innovation FOCUS ON INNOVATION
7. Individual vs participative decision making PARTICIPATIVE DECISION MAKING
8. Ad hocery vs systematic planning SYSTEMATIC PLANNING
9. Rewards based on individual vs team contributions REWARDS BASED ON TEAM PERFORMANCE
10. Focus on conformity vs individuality EMPHASIS ON CONFORMITY OVER INDIVIDUALITY
11. Informal vs formal procedures INFORMAL PROCEDURES
12. Cooperation vs competition among fellow workers COOPERATION
13. High vs low loyalty LOYALTY
14. Intrinsic vs extrinsic commitment INTRINSIC COMMITMENT
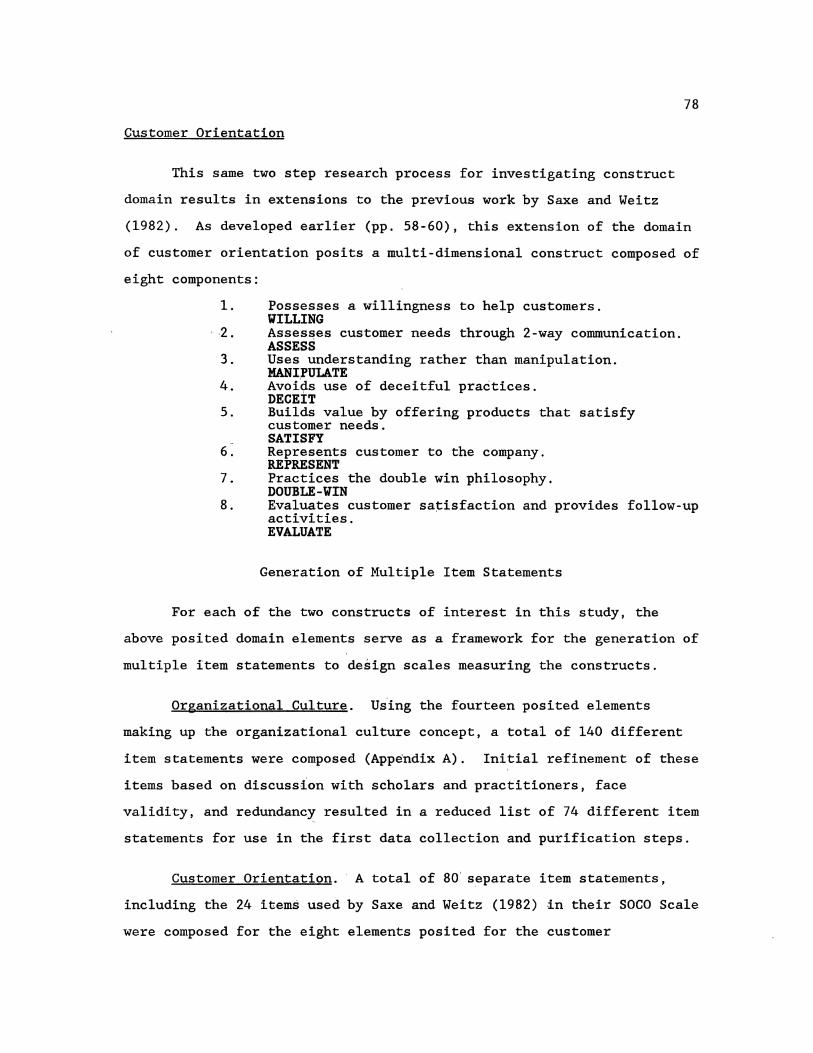
78
Customer Orientation
This same two step research process for investigating construct
domain results in extensions to the previous work by Saxe and Weitz
(1982). As developed earlier (pp. 58-60), this extension of the domain
of customer orientation posits a multi-dimensional construct composed of
eight components:
1. Possesses a willingness to help customers. WILLING
2. Assesses customer needs through 2-way communication. ASSESS
3. Uses understanding rather than manipulation. MANIPULATE
4. Avoi9-s use of deceitful practices. DECEIT
5. Builds value by offering products that satisfy customer needs. SATISFY
6. Represents customer to the company. REPRESENT
7. Practices the double win philosophy. DOUBLE-WIN
8. Evaluates customer satisfaction and provides follow-up activities. EVALUATE
Generation of Multiple Item Statements
For each of the two constructs of interest in this study, the
above posited domain elements serve as a framework for the generation of
multiple item statements to design scales measuring the constructs.
Organizational Culture. Us'ing the fourteen posited elements
making up the organizational culture concept, a total of 140 different
item statements were composed (Appendix A). Initial refinement of these
items based on discussion with scholars and practitioners, face
validity, and redundancy resulted in a reduced list of 74 different item
statements for use in the first data collection and purification steps.
Customer Orientation. A total of 80 separate item statements,
including the 24 items used by Saxe and Weitz (1982) in their SOCO Scale
were composed for the eight elements posited for the customer
79
orientation construct (Appendix A). Close examination and comparison of
these item statements allowed the redundant items to be deleted.
Further input resulting from discussion with scholars and practitioners
reduced this initial list of items to a total of 42 item statements.
All 24 of the SOCO Scale items (Saxe and Weitz 1982) are included in
this listing.
First Data Collection: P~e-Pilot Survey
This first data collection step was undertaken in order to provide
data for further reduction in the number of organizational culture item
statements. The survey instrument (Appendix B) is a three page
questionnaire consisting of the 74 organizational culture item
statements structured as seven point, bi-polar, Likert scales. Both
positive and negative phrasing are included to assist in controlling for
bias from yeajnea saying. Reverse scoring for many questions was done
such that higher scores on items reflect a Type Z or Clan type of
organizational culture and high customer orientation respectively.
Questionnaires were perso~ally distributed to the individual
participants in the pre-pilot survey sample. Of the 108 completed
surveys, 97 were returned using postage paid envelopes provided with
each questionnaire. The remaining 11 completed instruments were hand
delivered to the researcher.
Although purposefully scattered throughaut the questionnaire, the
item statements were first clustered according to the a priori item
statement groups correspanding' to the posited components of
organizational culture. Within these groups, item-to-total correlations
and Cronbach's alpha (1951) were used to identify and delete statements
not tapping the core issue of each individual component. While adhering
to a requirement of multiple items for each posited component, this
stage of analysis deleted 20 item statements, reducing the total to 54
statements addressing organizatianal culture. Additional insights
80
gleaned from the item-to-total correlations were used to make revisions
in the wording of several statements to better tap and sample the common
components.
The Cronbach alpha estimates of reliability for each element
resulting from this preliminary stage of purification are given in Table
9. With four exceptions, the reliability esti~ates exceeded .70. The
lower reliabilities for (1) DECENTRALIZED DECISION MAKING (.658), and
(2) EMPHASIS ON CONFORMITY OVER INDIVIDUALITY (.685) were dealt with
through revisions in wording. The,basic theme of each item was kept
intact, while "wordiness" was reduced and clarity in phrasing and
meaning increased.
TABLE 9
RELIABILITY ESTIMATES RESULTING FROM ANALYSIS OF PRE-PILOT SURVEY RESULTS BY POSITED COMPONENTS
OF ORGANIZATIONAL CULTURE
NO. ELEMENT ITEMS ALPHA
NON-REDTAPE 4 NONCOMPLEX 3 DECENTRALIZED DECISION MAKING 4 PREDISPOSED TOWARD CHANGE 4 SOCIAL EMPHASIS 4 FOCUS ON INNOVATION 4 PARTICIPATIVE DECISION MAKING 4 SYSTEMATIC PLANNING 3 REWARDS BASED ON TEAM PERFORMANCE 4 EMPHASIS ON CONFORMITY OVER INDIVIDUALITY 4 INFORMAL'PROCEDURES 4 COOPERATION 4 LOYALTY 4 INTRINSIC COMMITMENT 4
TOTAL REMAINING ITEM STATEMENTS 54
.716
.775
.658
.722
.703
.788
.705
.893
.055
.685
.368
.759
.716
.751

81
More serious problems were indicated in the two components: (1)
INFORMAL PROCEDURES with an alpha of .3684, and (2) REWARDS BASED ON
TEAM CONTRIBUTIONS with an alpha of -.0552. Discussiqns with both
scholars and practitioners led to major revisions in the phrasing of the
items associated with INFORMAL PROCEDURES. The basic themes were felt
to be accurate for the component being tapped. However, the statements
were too academic in phrasing for the typical employee to interpret.
The serious lack of reliability for the pqsi:ted_ component REWARDS
BASED ON TEAM CONTRIBUTIONS was more problematic·than revisions in
wording could address. Further reseatch and discussion with researchers
in this area indicated that even though the organizational behavior
literature puts forth this component as a single dimension of
organizational culture, in reality, it is perceived as two continuums
rather than the bi-polar extremes of a single continuum. The data from
this study supports the lack of mutual exclusivity for (a) individual
rewards and (b) team rewards. Furthermore, while the literature views
rewards based on individual performance as detrimental to organizational
performance and rewards 'based on team performance as a positive
influence on organizational performance, t'he data supports rewards based
on individual performance coexisting with rewards based on team
performance. Additionally, either or even both could have a positive
impact upon organizational performan~e.
This research into reward systems brings into question whether
reward systems can properly be included as an element of organizational
culture. Interviews with researchers, practitio-q.ers and e~J!.ployees
provided support for reward systems being a manifestation of the
underlying values of the organization, and thus by definition more of a
climate characteristic than culture. Additionally, if reward systems
could be properly included as a culture element, it should be from a
perceived equity perspective and not from individual performance vs.
team performance. Reward systems should be (1) equitable and evenhanded
82
in dealing with employees; (2) performance based (team and/or
individual) rather than based on non-performance criteria such as
seniority, favoritism, and position.
In order to assure that our scale includes the most inclusive
domain possible for the construct, item statements tapping this reward
element remain a part of the scale in this earliest stage of analysis.
However, the four item stat.ements representing this potential element
have been rewritten to refl~ct the revised interpreta~ion of the
component's core meaning. These revisions are givert in Table 10.
TABLK 10
REVISED ITEM STATEMENTS FOR REWARD COMPONENT IN THE PRE-PILOT SURVEY
ORIGINAL ITEM STATEMENT
The organization bases :r:ewards on the basis of overall team or organization performance.
Rewards and recognition are based on individual accomplishments. [R]
Performance is jugged primarily on results of the individual, :r::ather · than on methods by which the results are achieved. [R]
Performance evaluations focus on the immediate time frame with little consideration of long term consequences. [R]
[R] Denotes reverse score item.
REVISED ITEM STATEMENT
A major part of employee rewards and recognition is based on
· criteria other than performance (things such as seniority, favoritism, position, and etc.). [R]
A major part of employee rewards and recognition is based on that individual's performance [R].
A major component of employee rewards and recognition is based
· on the overall performance of the work group.
Appraisal criteria for rewards and recognition are equitable and evenhanded.
83
Second data Collection: Pilot Survey
This study's pilot survey corresponds to the first data collection
in Churchill's (1979) recommended scale development process. The
results of this survey are used in further reducing the total number of
scale items and assessing the reliability ~f the resulting scale.
As designed, the pilot survey uses a four section questionnaire
containing the item statements for both constructs of interest (Appendix
C). Section One includes the 54 'item statements representing
organizational culture (statement numbers 2-55) and two items (statement
numbers 56-57) measuring value congruence. The number one item was
included simply as a potential classification item. Continuing the
design from the pre-pilot survey, a seven point Likert scale was used.
Section Two is composed of 11 statements focusing on turn-over
intent and several organizational issues. These items do not relate to
this study, but are included in the survey instrument as incentives for
the firms working with us and allowing access to their salespeople.
Section Three contains the 42 item statements representing the
customer orientation construct. These 42 statements are measured as 9
point Likert scales. The 9 point scale corresponds to Saxe and Weitz's
(1982) format in their SOCO scale. Their research revealed that few,
self-reporting salespeople mark in the lower half of the scale,
resulting in a distribution highly skewed toward the high end. To
lessen these ceiling effects and lower the skewness level, Saxe and
Weitz (1982, p. 347) used the 9 point scale rather than 7 points.
Remaining true to this study's intent of extending the SOCO scale to
include the new domain components, the instrument continues to use the 9
point scale.
Item Reduction
Separate and independent analysis was performed on the results
from the pilot survey for further item reduction on both scales. This
analysis included the use of item-to-total correlations, Cronbach's
Alpha, and factor analysis (Churchill 1979).
84
Use of item-to-total correlations and alpha results in an estimate
of the proportion of variance attributable to a common factor among the
items (Cronbach 1951, p. 331). Scrutiny of the item-to-total and alpha
scores allows reduction of the number of item statements. The deletion
of items not sharing this common factor improves both the
interpretability and reliability estimate for the resulting scale. The
further deletion of redundant items is also desired. Although
lengthening the test through redundancy can increase estimates of
reliability, this redundancy carries less information than a given set
of independent items (Cronbach 1951, p. 328-331) of the same number.
Furthermore, the increased test length resulting from redundancy limits
researchers' ability to obtain separate measures of additional factors
at the same time (Cronbach 1951, p. 330). In a similar manner, the
increased test length resulting from redundancy further increases
potential bias in responses due to an increased tedium factor on the
part of participants. Jn summarizing this point, Cronbach (1951, p.
330) states that from the viewpoint of both interpretability and
efficient prediction of criteria the preferred set of scale items
"should be a set of items having a substantial alpha and not capable of
further division into discrete item clusters which themselves have high
alpha's."
Factor analysis provides additional insights into the common
factor among the a priori sets of item statements. Factor analysis is
also used as an additional purification and item reduction technique
through factoring the matrix of correlations into its basic dimensions
and further indicating those item statements best reflecting the
underlying dimensions of the construct being studied.
The use of factor analysis in this study goes beyond purification
and the development of more parsimonious measures. A major substantive
85
use of factor analysis is in exploring new domains in search for the
underlying dimensions of a construct (Rummell 1970, p. 31; Green, Tull
and Albaum 1988, p. 555). The underlying dimensionality of
organizational culture lacks empirical examination (pp. 26-28, 60-62).
Consequently, a major contribution of this study will be the
investigation and explication of the dimensions of organizational
culture. This exploration of dimensionality is also important for the
customer orientation.construct. Altho~gh previous investigation of this
construct depicts it as a uni-dimensional construct, more recent
characterizations of this construct have added dimensions concerned with
relational development and maintenance (pp. 21-23, 58-60).
Consequently, factor analysis will be utilized ~o empirically explicate
the dimensionality of this extended and more inclusive domain of
customer orientation.
Organizational Culture
With the twin objectives of (1) further reducing and purifying the
list of item statements resulting from the pre-pilot test and analysis,
and (2) improving the alpha estimates of reliability, responses to this
pilot survey were analyzed using item-to-total correlations and Cronbach
alphas.
Item-To-Total Correlation and Alpha Analysis
Table 11 indicates the results of ini~ial analysis of the proposed
14 dimensions of culture as assessed by the 54 organizational culture
items. As the result of this analysis, 19 items were deleted from the
scale. The remaining 35 items were then factor analyzed to investigate
dimensionality.
TABLE 11
PILOT TEST ITEM-TO-TOTAL CORRELATIONS AND ALPHA STATISTICS FOR ORGANIZATIONAL CULTURE
ELEMENT/Statement Item ALPHA
NON-REDTAPE .525 Xl2 Major emphasis is placed on monitoring
the external env~ronment. X51 Within ~he workgroup, a major emphasis
is on internal details (things_ such as organizational -routines, policies, paperwork, operations, and etc.). [R]
X 4 There is more concern re.garding internal details (such as meetings, quotas, paperwork, reports, and etc.). [R]
X 6 Identifying. and reacting to the external environment is a major concern.
NONCOMPLEX .·695 X37 There are many different job tit,les.· [R] X32 There are many different departments. [R] X 9 There are several levels of supe;rvisors. [R]
DECENTRALIZED DECISION MAKING X21
X27
X34
X13
Top levels of management make most of the major decisions. [R] Employees are encouraged to make routine decisions affecting their work situations. Employees are not allowed to make decisions. fR] · .. Authority for decision making is frequently delegated to lower levels of the organization.
.554
PREDISPOSED TOWARD CHANGE .629 X 8 Plans are frequently adjusted to meet
challenges and opportunities. X22 Individuals are encouraged to change
their behavior in order to meet challenges and opportunities.
X28 When presented with changing conditions, changes are made to deal with the new conditions. ·
X31 Our work group is slow to react when conditions change. [R]
SOCIAL EMPHASIS .710 X24 Personal needs of employees are
secondary to the successful completion of the job itsel.f. (R]
Xl5 Careful attention to job details is more important than personal needs of employees. [R]
XlO Management is understanding and stresses achievement of the employee's needs.
I-T-C
.398
.174
.345
.350
.635
.529
.385
.186
.423
.371
.386
.482
.369
.508
.302
.531
.492
.397
86
ALPHA IF DROP
.380
.570
.423
.422
.445
.579
.752
.587
.417
.453
.439
.502
.587
.498
.643
.626
.649
.711
TABLE 11 (Continued)
ELEMENT/Statement Item
X33 Fulfillment of job requirements is more important than employee's personal needs on the job. [R]
FOCUS ON INNOVATION Xll Innovative behaviar is encoutage,d in
response to changing needs and opportunities.
X29 Conformity to policy is favored rather than flexibility and ianovation. [R]'
X30 Employees are allowea to be creative in solving problems as they occur.
X20 Our work group is,very innovative in its approach to problems.
PARTICIPATIVE DECISION MAKING X38 Employees have input in setting standards
by which their performance is judged. X25 Supervisors consult with employees before
ALPHA
.615
.737
making decision affecting those employees. X40 Most decision are made jointly by members
of our work group .. X50 Work group members have input .regarding
major decisions affecting the organization's success.
SYSTEMATIC PLANNING .754 X55 Rather than plan ahead for change, the
organization reacts to changes after they occur. [R]
X35 Changes are ant-icipat~d and planned for. X41 Changing situations are. anticipated and
plans are made accordingly.
REWARD SYSTEMS BASED ON. TEAM PERFORMANCE .610 Xl4 A major part of employee rewards and
recognition is based on criteria other than performance (things such as seniority, favoritism, position, etc.). [R]
X23 A major part of e~ployee rewards and recognition is based on that -individual's performance. [R]
Xl6 A major component of employee rewards· and recognition is based on the overall performance of the work group.
X42 Appraisal criteria for rewards arid recognition are equitable and evenhanded.
EMPHASIS ON CONFORMITY OVER INDIVIDUALITY X39 Employees are encouraged to- produce
novel solutions to non-routine problems and situations.
X54 Employees are allowed to decide how to best perform their job.
.522
I-T-C
.576
.466
.203
.4,47
.484
.538
.476
.557
.550
.481
.641
.639
.333
.482'
.255
.524
.398
.424
87
ALPHA IF DROP
.598
.490
.678
.506
.475
.673
. 711
.662
.667
.791
.603
.612
.595
.473
.632
.442
.369
.340

TABLE 11 (Continued)
ELEMENT/Statement Item
X52
X36
Employees are required to act in conformity with work rules. [R] Employees are motivated to exercise initiative.
ALPHA
INFORMAL PROCEDURES .. 391 X26 Following formal rules and procedures
is encouraged. [R] X53 The behavior of work group members is ,
strictly regulated by formal rules and procedures. [R] .
X44 Employees' behavior is ~etermined more by co-workers than by formal rules and procedures·.
COOPERATION .793 X43 Work group members go out of their way
to help co-workers. X56 Individual employees try to make the
work group operate as a team. X45 Employees work together in order to
better deal with competition from other companies.
X46 Group members cooperate with me~bers of other work groups in the organization.
X57 Overall, my work group operates as a team. .732
LOYALTY X 7 Employees show geiJuine concern £o.r the
problems that face ~he organization. X47 Work group members w9uld b~ willing to
make sacrifices for the good of the organization.
X48 Employees £eel that the qrganization's problems are their own proble,ms ._
X49 Employees feel their first loyalty is to the organization. '
INTRINSIC COMMITMENT Xl8 Employees are motivated by the
enjoyment to be foupd in work activities.
X 5 Employees are motivated by personal commitment to goal achievements.
Xl9 Work is performed'out of the desire to gain respect of co-wor~ers.
X17 Employees are motivated by the satisfaction that~comes from just cloing a good Job.
[R] Denotes reverse scored item.
.767
.738
I-T-C
.005
._450
.298
.346
.081
.575
.562
.593
.495
.519
.615
.500
.638
.6}3
.402
.470
.590
88
ALPHA IF DROP
.664
.315
.188
.055
.592
.753
.757
.747
.777
.642
.736
.686
.747
.671
.594
.751
.710
.642
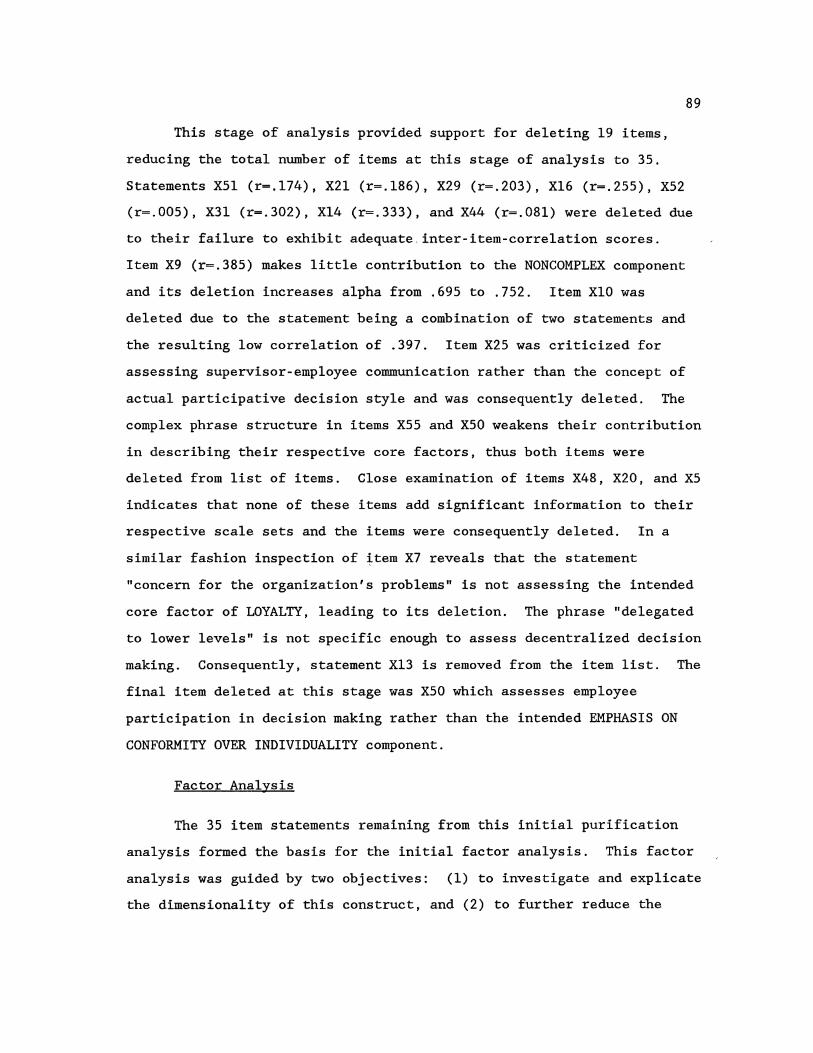
89
This stage of analysis provided support for deleting 19 items,
reducing the total number of items at this stage of analysis to 35.
Statements X51 (r=.l74), X21 (r=.l86), X29 (r=.203), Xl6 (r=.255), X52
(r=.005), X31 (r=.302), Xl4 (r=.333), and X44 (r=.08l) were deleted due
to their failure to exhibit adequate,inter-item-correlation scores.
Item X9 (r=.385) makes little contribution to the NONCOMPLEX component
and its deletion increases alpha from .695 to .752. Item XlO was
deleted due to the statement being a combination of two statements and
the resulting low correlation of .397. Item X25 was criticized for
assessing supervisor-employee communication rather than the concept of
actual participative decision style and was consequently deleted. The
complex phrase structure in items X55 and XSO weakens their contribution
in describing their respective core factors, thus both items were
deleted from list of items. Close examination of items X48, X20, and XS
indicates that none of these items add significant information to their
respective scale sets and the items were consequently deleted. In a
similar fashion inspection of item X7 reveals that the statement
"concern for the organization's problems" is not assessing the intended
core factor of LOYALTY, leading to its deletion. The phrase "delegated
to lower levels" is not specific enough to assess decentralized decision
making. Consequently, statement Xl3 is removed from the item list. The
final item deleted at this stage was XSO which assesses employee
participation in decision making rather than the intended EMPHASIS ON
CONFORMITY OVER INDIVIDUALITY component.
Factor Analysis
The 35 item statements remaining from this initial purification
analysis formed the basis for the initial factor analysis. This factor
analysis was guided by two objectives: (1) to investigate and explicate
the dimensionality of this construct, and (2) to further reduce the
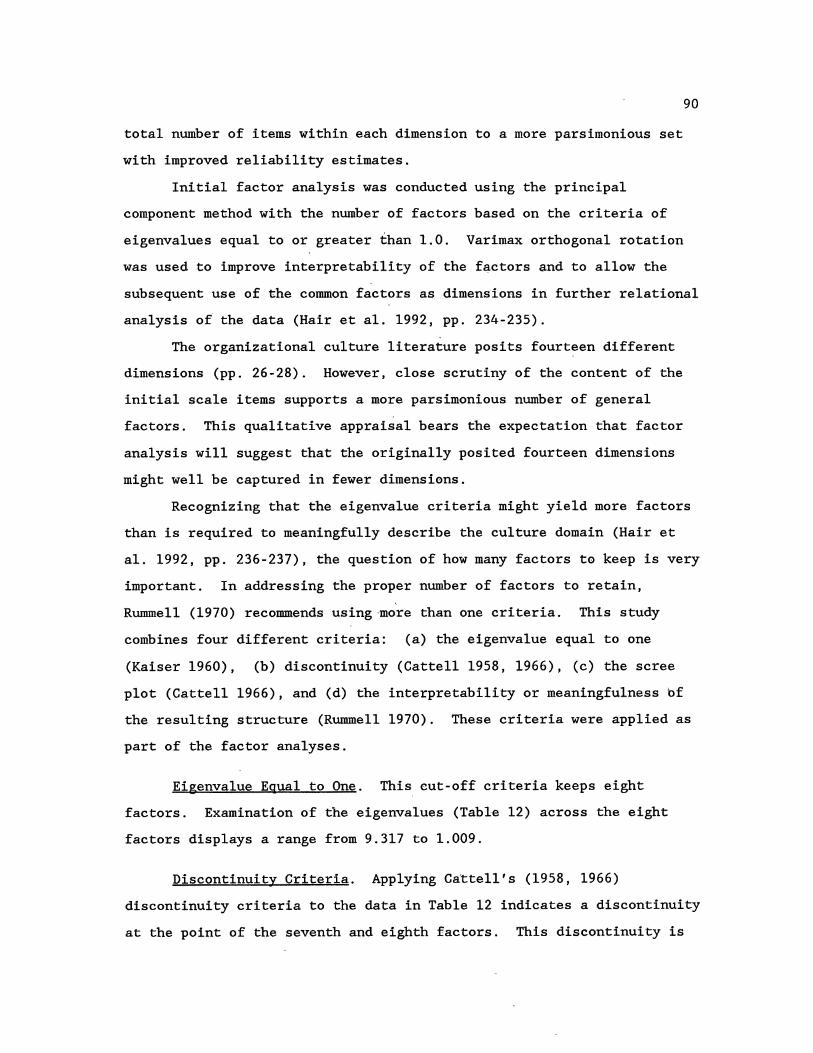
total number of items within each dimension to a more parsimonious set
with improved reliability estimates.
90
Initial factor analysis was conducted using the principal
component method with the number of factors based on the criteria of
eigenvalues equal to or greater than 1.0. Varimax orthogonal rotation
was used to improve interpretability of the factors and to allow the
subsequent use of the common factors as dimensions in further relational
analysis of the data (Hair et al. 1992, pp. 234-235).
The organizational culture literature posits fourteen different
dimensions (pp. 26-28). However, close scrutiny of the content of the
initial scale items supports a more parsimonious number of general
factors. This qualitative appraisal bears the expectation that factor
analysis will suggest that the originally posited fourteen dimensions
might well be captured in fewer dimensions.
Recognizing that the eigenvalue criteria might yield more factors
than is required to meaningfully describe the culture domain (Hair et
al. 1992, pp. 236-237), the question of how many factors to keep is very
important. In addressing the proper number of factors to retain,
Rummell (1970) recommends using-more than one criteria. This study
combines four different criteria: (a) the eigenvalue equal to one
(Kaiser 1960), (b) discontinuity (Cattell 1958, 1966), (c) the scree
plot (Cattell 1966), and (d) the interpretability or meaningfulness bf
the resulting structure (Rummell 1970). These criteria were applied as
part of the factor analyses.
Eigenvalue Equal to One. This cut-off criteria keeps eight
factors. Examination of the eigenvalues (Table 12) across the eight
factors displays a range from 9.317 to 1.009.
Discontinuity Criteria. Applying Cattell's (1958, 1966)
discontinuity criteria to the data in Table 12 indicates a discontinuity
at the point of the seventh and eighth factors. This discontinuity is

91
indicated by the change in eigenvalues rising from .05 at the 6th factor
to .17 at the 7th factor, .18 at the 8th factor and decreasing to .07 at
the 9th factor. Interpretation of this point of discontinuity would
indicate keeping either six or seven factors.
FACTOR NUMBER
1 2 3 4 5 6 7 8 9
10 11 12 13 14
TABLE 12
SUMMARY OF ORGANIZATIONAL CULTURE FACTOR EIGENVALUES
EIGENVALUE
9.317 2.759 2.019 1.501 1.393 1. 350 1.184 1.009
.. 944
.850
.808
.794
.737
.715
CHANGE IN PCT OF CHANGE IN EIGENvALUES VARIANCE % OF VAR.
6.56 .74 .52 .11 .05 .17 .18 .07 .10 .05 .02 .06 .03
26.6 7.9 5.8 4.3 4.0 3.9 3.4 2.9 2.7 2.4 2.3 2.3 2.1 2.0
18.7 2.1 1.5
. 3
.1
.5
.5
. 2
. 3
.1
.0
.2
.1
Scree Plot. Figure 8 reproduces the scree plot from this
unrestricted initial analysis. Information provided within the scree
plot echoes the borderline benefits of identifying the eighth factor.
This interpretation favors a seven factor solution.
Interpretability Criteria. The previous three criteria clearly
favor between 6 and 8 factors. Consequently, the computation and
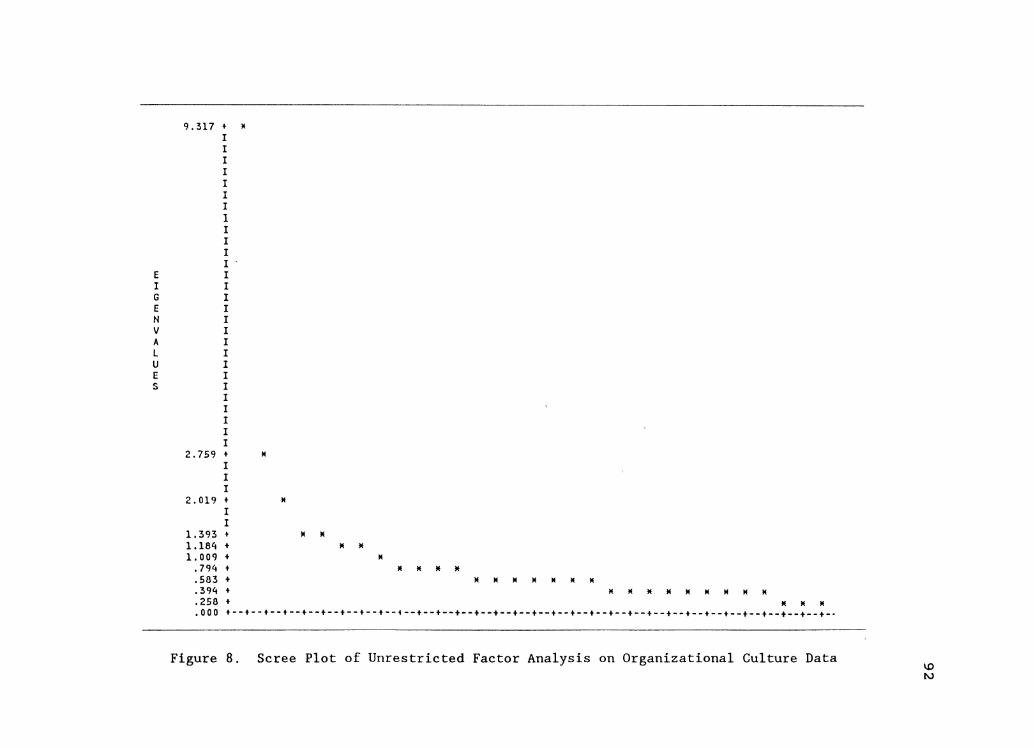
9.317 + M
I I I I I I I 1 I I I I
E I I I G I E I N I v I A I L I u I E I s I
I I I I I
2.759 + M
I I I
2.019 + M
I I
1.393 + M M 1.184 + M M 1.009 + M
.794 + M M M M
.583 + M M M M M M M
.394 + K M M M M M M M K
.258 + M K K
.000 t--+--t--+--t--t--+--+--+--i--+--+--t--t--t--t--t--+--t--+--+--+--+--t--t--t--+--t--+--t--+--t-·
Figure 8. Scree Plot of Unrestricted Factor Analysis on Organizational Culture Data
93
comparison of the interpretability or meaningfulness criteria for 6, 7,
and 8 factor solutions becomes important.
By excluding both the seventh factor (eigenvalue 1.184) and eighth
factor (eigenvalue 1.009), final statistics indicate the six factor
solution explains S2.4 percent of the total variance. Interpretability
of this solution (Table 13) is very p~or due to its collapsing the
following seven, of the originally posited 14 components into a single
factor:
DECENTRALIZED DECISION MAKING EMPHASIS ON 'CONFORMITY OVER INDIVIDUALITY REWARDS BASED ON TEAM PERFORMANCE FOCUS ON INNOVATION PREDISPOSED TOWARD CHANGE SYSTEMATIC PLANNING PARTICIPATIVE DECISION MAKING
X27, X34 X39, X36 X23, X42 X30, Xll X28, X8 X41, X35 X38, X40
Prior subjective content analysis supports that some of these
items could well contribute to the 6 dimension solution. Nevertheless,
this six factor solution forces items together that are not
generalizable across different situations. Bo·th our previous
examination and logic ,supports combining together the components of
DECENTRALIZED DECISION MAKING, ENCOURAGING INNOVATIVE BEHAVIOR, and
PARTICIPATIVE MANAGEMENT. Nevertheless, there is no theoretical or
intuitive support for bringing the components of REWARDS BASED ON
PERFORMANCE, PREDISPOSITION TOWARD CHANGE, and SYSTEMATIC PLANNING
together into this same general factor. Consequently, the six factor
solution is lacking in both interpretability and, meaningfulness.
Examination of final statistics from the seven factor solution
reveals that it explains 55.8 percent of the variance. Inspection of
the factor structure (~able 14) reveals an interpretable and meaningful
solution.
Further examination of the seven factor solution in Table 14,
illustrates that the combinations of initially proposed dimensions fit
the a priori expectations of the more general factors underlying the
data matrix. Item statements addressing the components FOCUS ON
X39 X27 X23 X30 Xll X28 X41 X36 X42 X35 X34 X38 X8 X40
X43 X57 X 56 X45 X46 X47 X49
X33 X15 X24 X 53 X26
Xl8 X17 X19
X12 X6 X4 X22
X37 X32
TABLE 13
ORGANIZATIONAL CULTURE FACTOR ANALYSIS SIX FACTOR SOLUTION
FACTOR 1 FACTOR 2 FACTOR 3 FACTOR 4
.65291 .03874 .13765 .17675
.63885 .09730 -.00048 .23297
.61108 .10867 -.05561 .07235
.60966 . 09896 .18008 .23261
.59865 .18508 .07466 .11516
.58500 .32316 -.16647 -.06354
.58313 .37072 • 09620 .00180
.58144 .25368 .21644 .26146
.55594 .34490 .13479 -.03150
.55064 .30435 .03628 -.09998
.54321 .11124 .35689 .08570
.51794 .11269 .27292 .30169
.51761 .25088 -.00067 .08029
.49567 .16873 .23438 .33656
-.00590 .76356 .05267 .14111 .21444 .69006 . 05521 .1'!827 .21117 .65334 -,00519 .11404 .24873 .60606 .03228 .2&656 .27320 .59639 -.05159 .06145 .33074 .58660 .10342 .29740 .22929 .48094 .02522 .39156
.28140 .12871 ,68200 .03473
.15812 .14084 ,68034 -.05537
.16070 • 07743 .67635 .04221 -.09299 -.21446 .57833 .00867 -.33740 -.27118 .47957 .16603
.23108 .27160 ,09837 .75267
.14643 .28302 -.01291 .68232
.11210 .14171 -.05083 .65154
.17469 .19436 .02664 .18487
.12976 .14249 .06659 .21325
.11q77 .02782 ,33890 -.16771
.40414 .08173 -.26957 .04398
-.03552 -.00279 .06727 .02914 -.00227 .03599 .14056 .04440
FACTOR 5 FACTOR 6
.07649 -.04104
.01943 .06239
.19424 -.04069 -.02357 .19876
.34284 .01282
.22711 .03281
.11643 -.13786
.10729 .01429
.09170 - .14871
.13012 -.12370
.03638 • 21152 -.08492 -.22841
.34057 ,09341 -.13913 -.11444
.02605 .01955
.17656 -.00050
.11547 .07662
.13749 -.03345 -.02745 -.00924
.13482 .01529
.17615 -.05858
-.00298 .04586 -.00102 -.05911
.03339 .01784
.13648 .23840 • 01411 .14806
.07119 .10632
.05245 .14543
.19562 -.07441
.72070 -.08281
.68936 -.09617
.48233 .20557
.40586 -.03207
-.04298 .84172 -.02594 .82890
\0 ~
TABLE 14
ORGANIZATIONAL CULTURE FACTOR ANALYSIS SEVEN FACTOR SOLUTION
FACTOR 1 FACTOR 2 FACTOR 3 FACTOR 4 FACTOR 5 FACTOR 6 fACTOR 7
X30 o70451 o16403 o06651 o08887 o10935 o05487 o15080 X39 o68597 0 08923 015792 0 08112 0 07160 o14833 -o0607b X27 o66725 o14444 019339 -o0'\575 o13638 o07996 o02045 X36 o61493 o29207 012884 o17047 o17493 017194 -001675 X3'1 o59363 o15038 o05492 0 29192 -000467 011321 o18846 X38 o54l64 011727 011692 o27633 o2'1193 -o02878 -023516 X40 o53695 017711 o10164 0 23118 0 27445. -008554 -012495
X43 -002043 o76216 o05909 0 07750 o15621 o01480 o01478 X 57 o20862 o71969 o10874 o03940 o11796 o19090 -o02795 X 56 o25502 o71367 ,06075 -o06313 .05050 .13695 o02802 X'\5 .19900 o59640 o17566 ,06998 o27169 o14228 -.03672 X46 0 16'178 o56807 o28109 o03308 o09012 -.03081 o00010 X47 .26189 .-56141 o20967 o15800 o31050 014 662 o02344
X26 0 00962 -.15416 -.65326 .22955 .02497 .06672 .08828 X 53 .22166 -.07960 -.55839 .31027 - .16059 .21762 .lb8 04 X42 .26286 .22623 .53565 .346n ,07323 .09570 -.07439 X35 .27639 .21246 .52511 .21586 -.01812 .13561 -.068b9 X23 .3b368 .02377 .51275 .10117 .13879 .20382 .00597 X28 .37179 .28763 .49703 -.06225 -. 03496. .23851 .04417 X41 .·35727 .29b75 .47323 .24b33 .05b88 .13318 -.09536 X11 . 37764 .11389 .44362 .19755 .16845 .36220 .05381 X8 .30215 .18571 .42724 .11479 .13719 .3502b .12894
X33 .21081 .05491 .04848 .75480 .07337 .040b7 .11008 X2'1 .10244 .00270 -.01259 .74233 .08928 ,06784 .08400 X15 .12566 .09228 -.03620 .71992 -.03451 .04014 -.00984
X18 .27388 .24201 .024b5 .11623 . 75296 .08219 .11514 X17 .14811 .23613 .Ob810 .03b49 .71399 .04412 .1b460 X19 .15204 .13158 .00323 -.052'12 .6472b .19277 -.07998 X49 .10229 .40999 .25131 .13971 .46101 .161b1 -. 02168
X12 ,04750 .17204 .170b5 .05088 .22177 o71617 -.07297 Xb ,03246 .12477 .11019 .07660 . 2427b .68708 -.08785 X4 .22202 .12295 -.18993 .16890 -.27197 .54052 ,_1532 0 X22 .21827 .05183 .39439 -.19307 .07843 .c.oor2 -.02526
X32 -.00271 .00327 -.04b38 .13961 . 07774 -.01969 .85744 X37 ,01098 -.00536 -.10048 .02519 ,03284 -.03384 .84894 I.D
U1
96
INNOVATION (X30), EMPHASIS ON CONFORMITY OVER INDIVIDUALITY (X39, X36),
DECENTRALIZED DECISION MAKING (X27, X34), and PARTICIPATIVE DECISION
MAKING (X38, X40) provide'a single general factor that can be
interpreted as EMPOWERMENT. The COOPERATION (X43, X57, X56, X45, X46)
and LOYALTY (X47) elements combine to reflect a cooperative relationship
and henceforth are labeled TEAM. Further matching the a priori
expectations, the original INFORMAL PROCEDURES (X26, X53), PREDISPOSED
TOWARD CHANGE (X28, X8), REWARDS BASED dN TEAM PERFORMANCE (X42, X23),
FOCUS ON INNOVATION (Xll), and SYSTEMATIC PLANNING (X35, X41) elements
are collapsed into a common factor reflecting proactive planning and
implementation and are labeled as PROACTIVE. With the deletion of the
cross loading items X22 and X49, the NON-REDTAPE (12, X6, X4), SOCIAL
EMPHASIS (X33, X24, Xl5), INTRINSIC COMMITMENT (Xl8, Xl7, 19), and
NONCOMPLEX (X32, X37) items constitute separate and distinct factors
hereafter labeled NON-REDTAPE, SOCIAL, COMMITMENT, AND NONCOMPLEX,
respectfully. These four general factors further support the a priori
dimensionality of the organizational culture construct. Although
numerous cross loadings are evident, supporting the need for additional
subsequent purification, the seven factor solution is thus supported by
three of the four different criteria used: (1) discontinuity, (2) scree
plot, and (3) interpretability and meaningfulness.
The eigenvalue criteria explains 58.7 percent of the variance, a
positive, although limited, improvement over the 55.8 percent explained
by the seven factor structure. However, close inspection of the eight
factor structure (Table 15) also brings into question the meaningfulness
of this solution. In going from 7 to 8 factors, the additional factor
is developed through separating the SYSTEMATIC PLANNING component from
the PROACTIVE general factor. This results in even more cross loadings
of item statements than the seven factor solution and goes against a
priori expectations of systematic rather than reactive, ad hoc planning

TABLE 15
ORGANIZATIONAL CULTURE FACTOR ANALYSIS EIGHT FACTOR SOLUTION
FACTOR 1 FACTOR 2 FACTOR 3 FACTOR 4 FACTOR 5 FACTOR 6 FACTOR 7 FACTOR 6
X30 . 69916 .16535 . 09259 .10922 .11684 .02814 .03858 .1ft475 X39 ,68263 ,08059 .118lt2 .0&233 .06741 .15122 .17572 -.06550 X27 .65678 .15282 .24956 -.00175 .14690 ,028'•2 .02345 .00204 X36 .60985 .28548 .09806 .16008 .17424 .1691>0 .154&9 -.00803 X34 .58175 .16784 .15722 .-36677 .01558 . 0408'2 -.09237 .15013 X38 .53250 .09619 -.00847 .22253 • 23561 .01036 .28990 -.20797 X40 .53192 .14492 -.08272 .13911 .25989 -.01335 .37655 -.07&19 X43 -.02517 .75821 .01554 • 06971 .15916 .01b41 .09853 .01564 X 56 .25100 .72874 .14452 •,'00563 .06580 ,07855 -.08364 -.00124 X 57 .20448 .72473 .12721 .06103 .12439 .16239 .0395ct -.03915 X45 ,19171 ,59173 .13477 ,06131 .27108 .13973 .15356 -.03254 X47 .25021 .55914 .17866 .16087 ,31287 ,13311' .15380 .02099 X46 .15801 .54397 .10691 -.04240 ,07501 .01762 .37996 .04039
X26 .03984 -.16807 -.65421 .17435 .01742 .14236 -.174ft 1 .11796 X22 .20128 . 09271 :~g~~ -,05474 .09936 • 2&3.33 -.20052 -.09381 X23 .33870 ,03643 .15431 .14544 . .• 13492 .14248 -.02039 X28 .35388 .30083 .53199 -.01260 -.02993 .16864 .12747 ,02254 X 53 .24700 -.07813 -.48073 .30789 -.15807 • 23922 -.25177 .17181 X8 .28833 .19028 .42457 .13178 .13355 ,31445 .17600 .124 0 5 Xll .36199 .11533 .42183 .20610 .16341 .33332 .22043 .05277 X42 .23672 .21627 .40707 .32466 .06723 .08997 .39609 -.06515
X24 .08415 .01227 .01357 .78796 .10580 .03162 -.01897 ,05094 X33 . 19220 .05543 • 01770 . 77163 ,08381 ,02487 .09719 .09340 X15 .11419 . 08727 -.09467 • 71283 -.02909 .04752 .11015 -.01401
Xl8 .26617 .23618 • 01793 .11218 .75476 ._08961 .06448 .11641 Xl7 .13911 .23290 .06776 .03910 • 71616 . 04465 .o5i27 .16228 X19 .14813 .13871 .07698 -.02055 .65346 .17060 -.07876 -.09676 X49 .08649 .41218 .24281 .15691 .46477 .13852 .11966 -.03339
X12 ,06106 ,16089 .12297 -.00666 .19442 • 758fl4 .16350 -.03413 X6 . 04615 .11581 .08022 .02579 .21851'1 .72538 .13542 -.05463 X4 .23736 .14609 -.02182 .23246 -.26375 .48653 -.27694 .12555
X3S .26526 .17644 .25958 . 09511 -.04950 .21215 .61412 -.00233 .12520 .02732 .21198 .60534 -.02922 X41 .34686 .25969 .20992
.02091 -.01515 -.13164 -. 01156 ,02255 ,00059 .01413 .87452 X37 .07829 -.02445 -.05637 .85676 1.0 X32 -.00199 .00532 -.02307 .14747
-..l
98
being required for a proactive organization. Further investigation and
purification based on the eight factor solution was conducted, and
compared to the ending structure from purification of the seven factor
solution. The final result of this analysis leaves X22 as the single
item loading on one factor, while each of the other seven factors have
the same loading patterns offered in the fin~l purified seven factor
structure. The eight factor structure offers no additional information
and lacks the interpretability and meaningfulness of the seven factor
structure. Consequently, the seven factor structure offers the best
explication of organizational culture's dimensionality.
Taken together, the criteria for determining the number of factors
generally favor the seven factor solution. The six factor solution is
only partially supported by one of the four criteria. Moreover, the
restrictions of a six factor solution artificially forces components
into a primary factor that cannot be supported by either theory or
logic. In a similar fashion, while the eight factor solution is
marginally supported by the eigenvalue equal one criteria, it presents
problems in interpretation and meaningfulness and adds little new
information through its addition of the eighth factor. The seven factor
solution is supported by the three criteria of discontinuity, scree
plot, and interpretability. Additional support for the seven factor
solution results from the borderline support for the eighth factor in
the eigenvalue equal one criteria. With this support from all four
criteria, the seven factor solution (Table 14) offers the best
illustration and explication of organizational culture's dimensionality.
Subsequent Purification and Reduction
Addressing appropriate procedures for scale development where
analysis results in the a priori com~onents collapsing into a fewer
number of dimensions, Churchill (1979, p. 69) recommends retaining the
items having the purest loadings on the new factor and computing a new
99
alpha. In following this procedure, minimum requirements for retaining
items were established. These criteria require factor loadings of .50
with a difference in any cross loadings of .2 as the minimum values for
retaining item statements (Hair et al., 1992, p. 239). New alpha's are
computed on the purified items for each dimension with the goal of
establishing alphas of .60 and better, a level sufficient for most
research applications (Nunnally 1978, Churchill 1979).
Using the loadings in the seven factor solution (Table 14), and
the criteria for loading values established above, this step of analysis
supported the deletion of eight items having loadings below the
established criteria. These deleted items not meeting the criteria are
X53, X42, X23, X28, Xll, X8, X49, and X22.
Four additional items met the minimum criteria, but were deleted
due to redundancy, phrasing problems, and/or respondent interpretation
problems. First, item X56 (.714) was judged to be redundant to other
items loading on factor two and was deleted. Second, Table 16 shows,
items X40 and X38 have low correlations with the other items tapping
this factor.
Both X40 and X38 were judged to have problems in their phrasing
that could be contributing to different respondents having different
perceptions of the items' meaning. This lack of consistency in
interpretation could prevent the subject items from being generalizable
over different work group types, consequently, both items were dele~ed
from further analysis. As the ensuing discussion details, Item X26 was
also deleted due to respondent interpretation problems.
The negative loadings posted for items X26 and X53 reflect
responses from survey participants that go in a direction opposite what
the literature indicates. Contemporary thought in management holds that
high reliance on formal rules and procedures is contrary to a proactive
organization with innovative and dynamic individuals and work groups.

100
TABLE 16
PAIRWISE CORRELATIONS FOR FACTOR ONE ITEMS
X30 X27 X39 X36 X34 X40 X38
X30 1.00
X27 .44 1.00
X39 .42 .40 1.00
X36 .49 .44 .46 1.00
X34 .46 .41 .35 .45 1.00
X40 .36 .34 .46 .40 .30 1.00
X38 .33 .31 .44 .47 .29 .44 1.00
101
Both of these items were reverse scored in order to transform low item
scores (depicting the absence of strict rules and procedures) into high
scores that would positively correspond to a dynamic and changing work
group. While this would properly reflect contemporary management
thought, the actual scores expressed by respondents indicate something
else is occurring. These responses indicate that a significan~ number
of participants are interpreting these two items in such a way that
would indicate a positive expectation of adherence to rules and
procedures--even in an innovative, changing, and proactive organization.
Several personal interviews were ~onducted with respondents to study
this anomaly in the data. Remaining true to their scores, several of
these respondents explained that while rules and procedures were
expected to change, new rules and procedures would stem from the
changes, and behavior would be expected to be governed by the new
policies. Due to this possible inconsistency in interpretation from
respondent to respondent, both X26 and X53 are deleted from the scale-
although X53 has already been deleted due to double loadings.
The above purification analysis and deletion of twelve items
results in 23 item scale. The results of a final factor analysis are
given in Table 17. Reflecting the positive effects of prior
purification steps, the results of this analysis reveals all item
statements meeting the minimum thre~hold cut off criteria: .50 on
primary loadings with at least .2 between any cross loadings. With the
exception of the NON-REDTAPE dimension, the resulting Cronbach alpha
values exceed the criteria of .60 (Table 18).
Additional Work Required
The low alpha on the NON-REDTAPE dimension is indicative of the
need for additional work required to improve the characteristics of this
sub-scale. Further difficulty follows from the measures for two
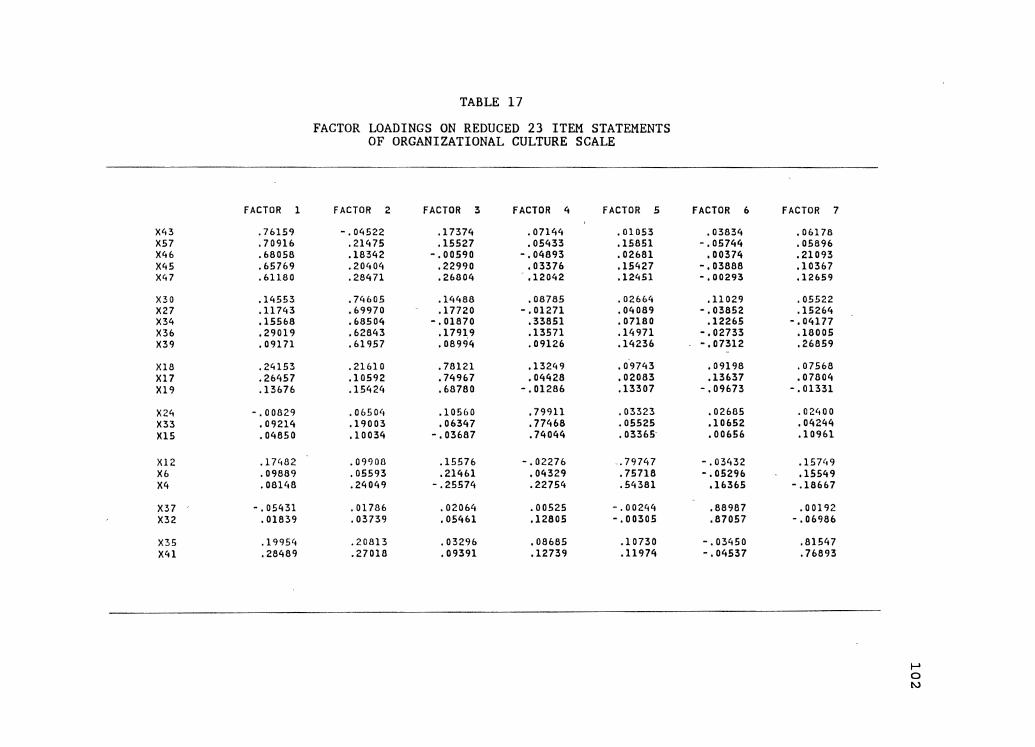
FACTOR 1
X43 .76159 X 57 .70916 X46 .68058 X45 .65769 X47 .61180
X30 .14553 X27 .11743 X34 .15568 X36 .29019 X39 .09171
X18 .24153 X17 .26457 X19 .13676
X24 -.00829 X33 . 09214 X15 .04850
X12 .17482 Xb .09889 X4 .08148
X37 -.05431 X32 .01839
X35 .19954 X41 .28489
TABLE 17
FACTOR LOADINGS ON REDUCED 23 ITEM STATEMENTS OF ORGANIZATIONAL CULTURE SCALE
FACTOR 2 FACTOR 3 FACTOR 4 FACTOR 5
-.04522 .17374 . 07144 .01053 .21475 .15527 .05433 .15851 .18342 -.00590 -.04893 .02681 .20404 .22990 .03376 .15427 .28471 .26804 .12042 .12451
.74605 .14488 ,08785 .02664
.69970 .17720 -.01271 .04089 ,£.8504 -.01870 .33851 . 07180 .62843 .17919 .13571 .14971 . 61957 ,08994 ,09126 .14236
.21610 .78121 .13249 .09743
.10592 • 74%7 .04428 .02083
.15424 .68780 -.01286 .13307
.0650tt .10560 .79911 ,03323
.19003 .06347 .77468 .05525
.10034 -.03687 .74044 .03365
.09908 .15576 -.02276 .79747
.05593 .21461 .04329 . 75718
.24049 -.25574 .22754 .54381
.01786 .02064 .00525 -.00244
.03739 .05461 .12805 -.00305
.20813 .03296 ,08685 .10730
.27018 .09391 .12739 .11974
FACTOR 6 FACTOR 7
.03834 .06178 -,05744 .05896
,00374 .21093 -,03888 .10367 -.00293 .12659
.11029 .05522 -.03852 .152£.4
.122£.5 -.04177 -.02733 .18005 -.07312 .26859
.09198 .07568
.13637 .07804 -.09673 -. 01331
. 02685 .02400
.10652 .04244 ,00656 .10961
-.03432 .15749 -.05296 .15549
.16365 -.18667
.88967 .00192
.87057 -.0£.98£.
-.03450 .81547 -.04537 .76893
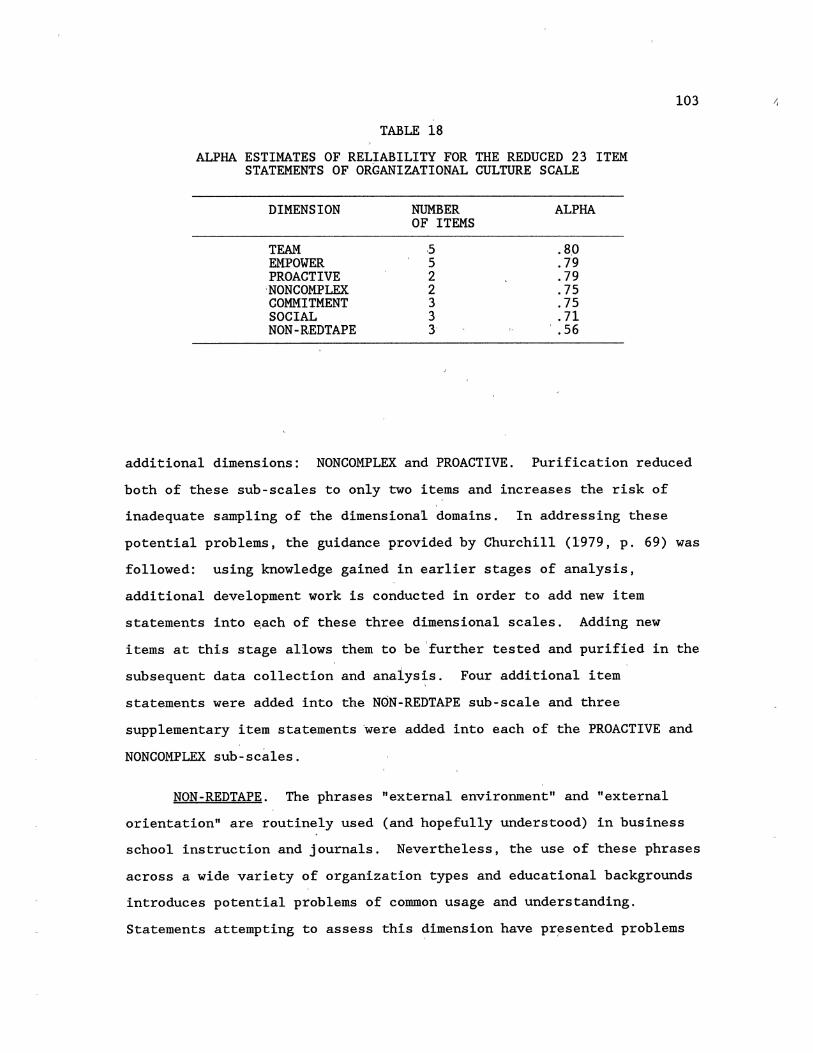
TABLE 18
ALPHA ESTIMATES OF RELIABILITY FOR THE REDUCED 23 ITEM STATEMENTS OF ORGANIZATIONAL CULTURE SCALE
DIMENSION NUMBER ALPHA OF ITEMS
TEAM 5 .8,0 EMPOWER 5 .79 PROACTIVE 2 .79
·NON COMPLEX 2 .75 COMMITMENT 3 .75 SOCIAL 3 .71 NON-REDTAPE 3 .56
103
additional dimens.ions: NONCOMPLEX and PROACTIVE. Purification reduced
both of these sub-scales to only two it~ms and increases the risk of
inadequate sampling of the dimensional domains. In addressing these
potential problems, the guidance p.rovided by Churchill (1979, p. 69) was
followed: using knowledge gained in earlier stages of analysis,
additional development work is conducted in order to add new item
statements into ~ach of these three dimensional scales. Adding new
items at this stage allows them to be 'further tested and purified in the
subsequent data collec.tion and anaiys~s. Four additional item
statements were added into the NQN-REDTAPE sub-scale and three
supplementary item statements were added into each of the PROACTIVE and
NONCOMPLEX sub-scales.
NON-REDTAPE. The phrases "external environment" and "external
orientation" are routinely used (and hopefully understood) in business
school instruction and journals. Nevertheless, the use of these phrases
across a wide variety of organization types and educational backgrounds
introduces potential problems of common usage and understanding.
Statements attempting to assess this dimension have pr~sented problems
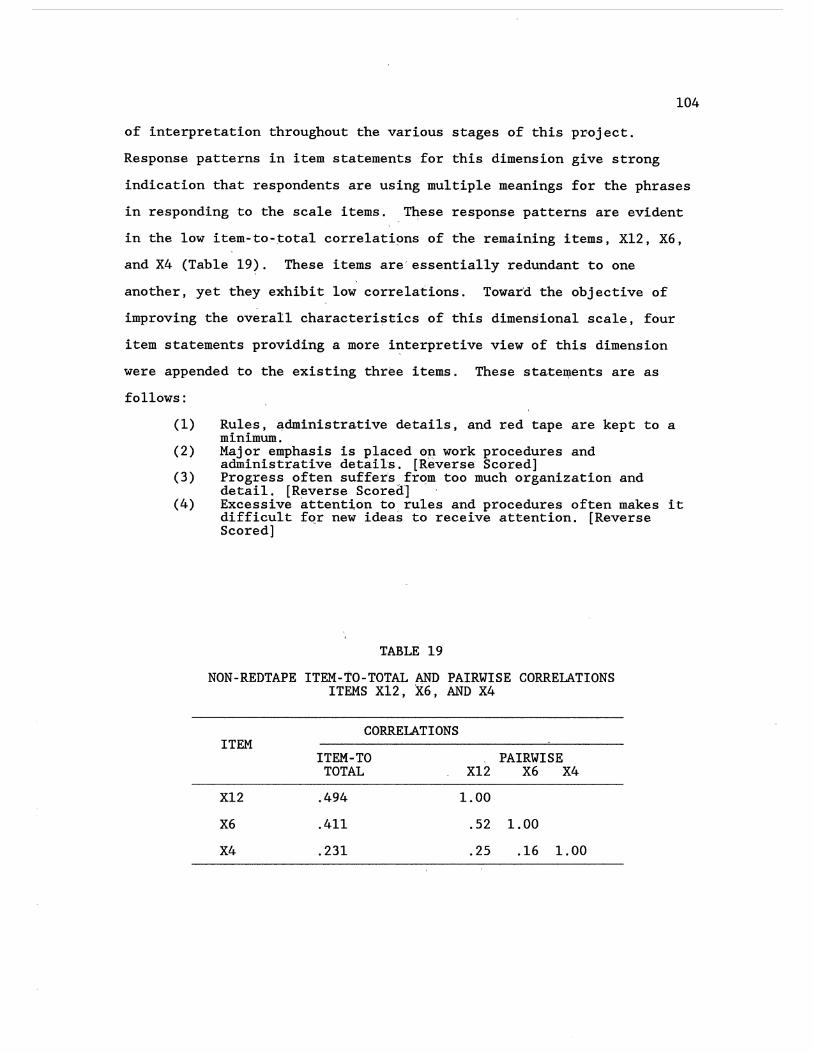
104
of interpretation throughout the various stages of this project.
Response patterns in item statements for this dimension give strong
indication that respondents are using multiple meanings for the phrases
in responding to the scale items. These response patterns are evident
in the low item-to-total correlations of the remaining items, Xl2, X6,
and X4 (Table 19). These items are' essentially redundant to one
another, yet they exhibit low correlations. Toward the objective of
improving the overall characterisuics of this dimensional scale, four
item statements providing a more interpretive view of this dimension
were appended to the existing three items. These sta,te~ents are as
follows:
(1)
(2)
(3)
(4)
Rules, administrative details, and red tape are kept to a minimum. Major emphasis is placed en work procedures and administrative details. [Reverse Scared] Progress often suffers,from too much organization and detail. [Reverse Scored'] , Excessive attention to rules and procedures often makes it difficult fqr new ideas to receive attention. [Reverse Scored]
TABLE 19
NON-REDTAPE ITEM-TO-TOTAL AND PAIRWISE CORRELATIONS ITEMS X12, X6, AND X4
ITEM
Xl2
X6
X4
CORRELATIONS
ITEM-TO TOTAL
.494
.411
.231
PAIRWISE Xl2 X6 X4
1.00
.52 1.00
.25 .16 1.00
105
PROACTIVE. Interpreting the original dimensionality analysis
depicts this dimension as a common factor reflecting the proactive
behavior within the work group. This interpretation exposes two key
elements running through this dimension: (a) the level of proactive vs.
reactive planning in,anticipation of change, and (b) the predisposition
toward change and adaptivity through the implementation of plans. The
two remaining items in this sc~le address only one of these components,
the level of systematic, proactive planning. The implementation
component is absent from the scale. To strengthen this deficiency, the
following three. item statements were added to, the scale for testing:
(1) Plans are implemented in an orderly, systematic fashion. (2) Employees act to implement changes in plans. (3) Plans are regularly revised in anticipation of changing
conditions.
NONCOMPLEX. This dimension is developed from the litera~ure as an
assessment of the level of complexity in structure and procedures. This
element should consider the complexity of (a) the politi~al and informal
processes active in the organization, in addition to (b) formal
structure and procedu~es. The two item statements remaining after
purification address only the complexity of formal structure. In order
to broaden the domain being,sa~pled in this dimension, the following
three items were added to assess political and informal processes:
(1) The physical arrangement of the work place facilitates interaction.
(2) There are many lines of authority. (3) Group members tend to act independently.
In addition' to these item additions, the item statement "There are
many different departments" was revised to read "There a're many
different sub-units."· This change was made in order to include the
existence of all o~ganizational unit types rather than only those
denoted as departments.
The addition of the above 10 item statements 'brings this
intermediate organizational culture scale to a total of 33 items
assessing the seven dimensions. This intermediate scale of 33 items
106
will be further analyzed for reliability and validity in the subsequent
data collection and analysis--the field survey.
Customer Orientation
As detailed in the earlier description of the pilot survey (pp.
71-73), analysis for the cus.tomer orientation scale was restricted to
the 302 responses from actual salespeople. Conforming to Churchill's
(1979) strictures for scale development, this first item reduction step
uses an iterative process of item-to-total correlations and alpha
computations to eliminate items not tapping the a priori core components
of customer orientation. Upon achieving satisfactory alpha scores,
factor analysis will be used to empirically investigate the
dimensionality of the extended domain of the customer orientation
construct.
Item-to-Total Correlation and Alpha Analysis
The results of the irtit.ial analysis of the 42 customer orientation
items are detailed in Table 20 and supports the removal of 8 items from
the overall scale due to low item-to-total correlations and redundancy.
Item Yll (r=.586) was redundant to other items in the scale and was
deleted. Items Y4 (r=.273), Yl7 (r=.497), Y33 (r=.234), Y31 (r=.333),
Yl5 (r=.213), Y42 (r=.346), and Y7 (r=.217) were deleted due to their
respectively low correlations. Four additional item statements, Yl2
(r=.355), Y32 (r=.l56), Y27 (r=.358), and Y25 (r=.382), also posted low
item-to-total correlations. Each of these four items were original to
Saxe and Weitz's (1982) SOCO Scale. With an objective of this study
being the extension of the existing SOCO seale to include a more
comprehensive domain of personal selling, it was decided to leave the
SOCO scale intact and none of these latter items were deleted.

TABLE 20
PILOT TEST ITEM-TO-TOTAL CORRELATIONS AND ALPHA STATISTICS FOR CUSTOMER ORIENTATION
ELEMENT/Statement Item ALPHA
WILLING .823 Yl I try to bring a customer with a probl~m
together with a product that h~lp,s him solve that problem. [S.] ' .
Y3 I behave toward customers in'a way ~hat conveys my desire to help th~ customer.
Yll I am available to customers when they need me.
Y5 A good salesperson has to have the customer's best interest in mind. [S]
ASSESS .713 Y6 I try to get customers to discuss their
needs with me. [S] Y8 I spend more time trying to persuade a
customer to buy than I do trying to discover his needs. [S,R]
YlO I try to figure out what a customer's needs are. [S] .
Yl2 I begin the sales talk for a product before exploring a customer's peeds with him. [ S ,R]
Yl4 I try to find out what kind of product would be most helpful to a customer .. [S]
SATISFY .611 Yl6 I try to help customers achieve their
goals. [S] Y4 I offer creative solutions based on
customers' needs. Yl8 I offer the product of min~ that is
best suited to the customer's problem. [S] Y20 I try to sell as much as I can rather than
to satisfy a customer. [S,R]
DECEIT .808 Y22 I imply to a customer that something is
beyond my control when it is ;~;tot. [S,,R] Y24 I pretend to agree with customers to
please them. [S,R] Y26 I try to sell a customer all I can
convince him to buy, even if I think it is more than a wise customer would buy. [S,R]
Y28 I decide what products to of~er on the basis of what I can convince customers to buy, not on the b~sis of what will satisfy them in the long run. [S,R]
Y30 I try to give customers an accurate expectation of what the p.roduct will do for them. [S,R]
Y32 I am willing to disagree with a customer in order to help him make a better decision. [S]
I-T-C
.653
.689
.586
.667
.526
.447
.579
.355
.563
.437
.273
.435
.451
.567
.466'
.641
.607
.554
.156
107
ALPHA IF DROP
.775
.758
.806
.770
.645
.677
.635
.737
.639
.519
.616
.507
.496
.781
.796
.770
.775
.788
.835
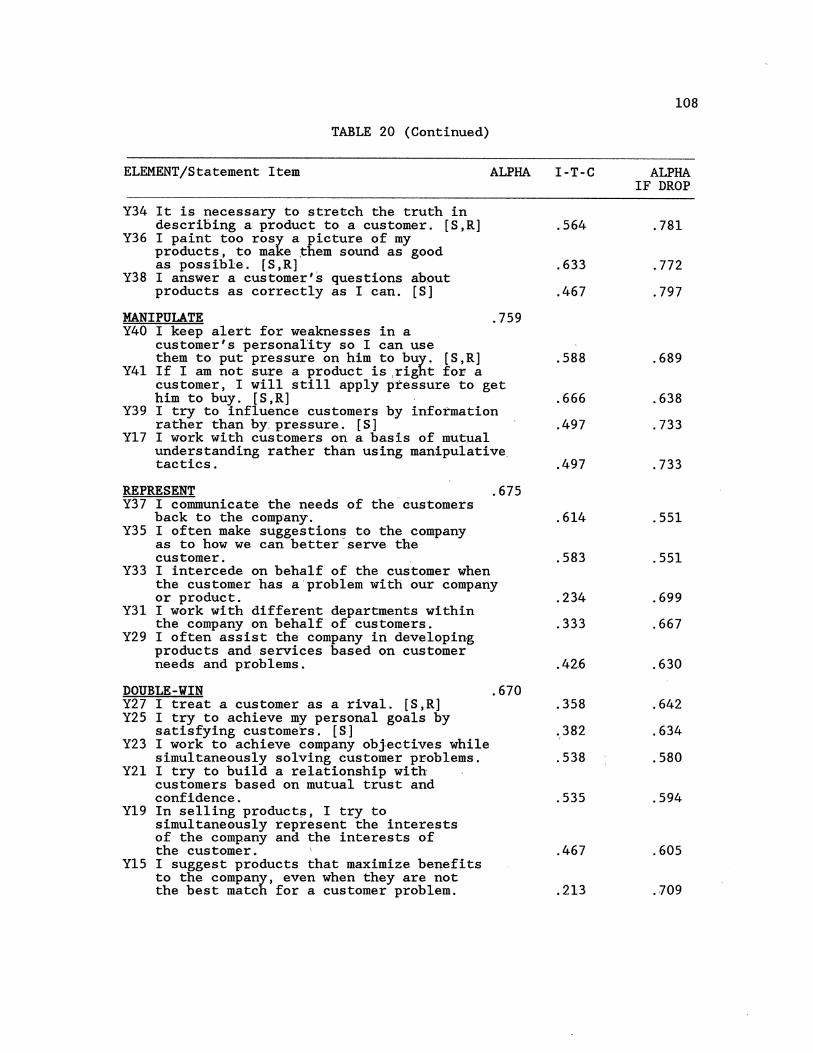
TABLE 20 (Continued)
ELEMENT/Statement Item ALPHA
Y34 It is necessary to stretch the truth in describing a product to a customer. [S,R]
Y36 I paint too rosk a picture of my products, to rna e .them sound as good as possible. [S,R]
Y38 I answer a customer's questions ab.out products as correctly as I can. [S]
MANIPULATE . 759 Y40 I keep alert for weaknesses in a
customer's personality so I can use them to put pressure on him to buy. [S,R]
Y41 If I am not sure a product is right for: a customer, I will still apply pressure to get him to buy. [S,R]
Y39 I try to influence customers by information rather than by. pressure. [S]
Yl7 I work with customers on a basis of mutual understanding rather than using manipulative tactics.
REPRESENT .675 Y37 I communicate the needs of the customers
back to the company. Y35 I often make suggestions to the company
as to how we can better serve the customer.
Y33 I intercede on behalf of the customer when the customer has a problem with our company or product.
Y31 I work with different departments within the company on behalf of customers.
Y29 I often assist the company in developing products and services based on customer needs and pr:oblems.
DOUBLE-WIN Y27 I treat a customer as a rival. [S,R] Y25 I try to achieve my personal goals by
satisfying customers. [S] Y23 I work to achieve company obJectives while
simultaneously solving customer problems. Y21 I try to build a relationship with
customers based on mutual trust and confidence.
Yl9 In selling products, I try to simultaneously represent the interests of the company and the interests of the customer. '
Yl5 I suggest products that maximize benefits to the company, even when they are not the best match for a customer problem.
.670
I-T-C
.564
.633
.467
.588
.666
.497
.497
.614
.583
.234
.333
.42.6
.358
.382
.538
.535
.467
.213
108
ALPHA IF DROP
.781
.772
.797
.689
.638
.733
.733
.551
.551
.699
.667
.630
.642
.634
.580
.594
.605
.709
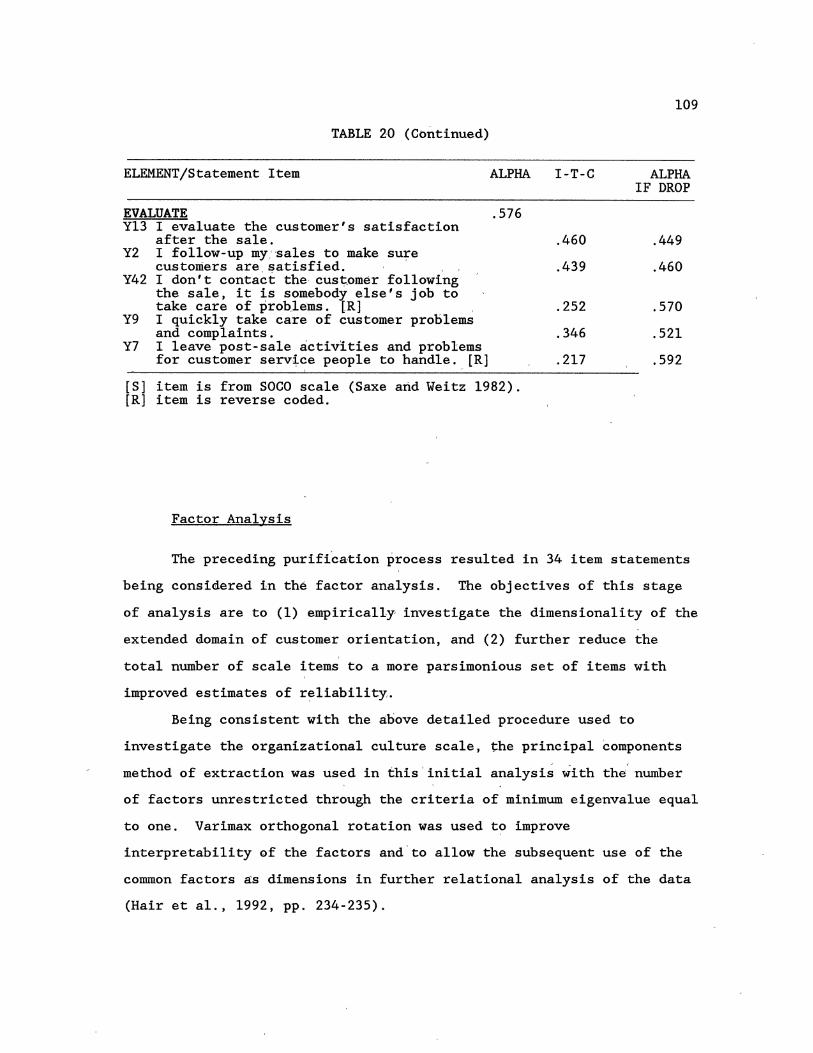
TABLE 20 (Continued)
ELEMENT/Statement Item
EVALUATE Yl3 I evaluate the customer's satisfaction
after the sale. Y2 I follow-up my.· ·sales to make sure
customers are.satisfied. , Y42 I don't contact the cussomer following
the sale, it is somebody else's job to take care of problems. LR]
Y9 I quickly take care of customer problems and complaints.
Y7 I leave post-sale activities and problems for customer service people to handle. [R]
ALPHA
.576
[S] item is from SOCO scale (Saxe and Weitz 1982). [R] item is reverse coded.
Factor Analysis
I-T-C
.460
.439
.252
.346
.217
109
ALPHA IF DROP
.449
.460
.570
.521
.592
The preceding purification process resulted in 34 item statements
being consiclered in the factor analysis. The objectives of this stage
of analysis are to (1) empirically investigate the dimensionality of the
extended clomain of customer orientation, and (2) further reduce the
total number of scale items to a more parsimonious set of items with
improved estimates of r7liability.
Being consistent with the above detailed procedure used to
investigate the organizational culture scale, the principal components
method of extraction was used in this'initial analysis with the number
of factors unrestricted through the criteria of minimum eigenvalue equal
to one. Varimax orthogonal rotation was used to improve
interpretability of the factors and to allow the subsequent use of the
common factors as dimensions in further relational analysis of the data
(Hair et al., 1992, pp. 234-235).

110
Consistent with both Rummell (1970) and the preceding
investigation of the organizational culture scale items, this study
combines four different criteria in addressing the number of factors to
keep: (a) the eigenvalue equal to one (Kaiser 1960), (b) discontinuity
Cattell (1958, 1966), (c) the scree plot (Cattell 1966), and (d) the
interpretability of the resulting structure (Rummell 1970).61
Eigenvalue Equal to One. The eigenvalue criteria keeps 6 factors.
However, examination of the eigenvalues (Table 21) displays a range from
11.352 to 1.016, indicating the sixth factor is borderline in meeting
the cut-off criteria. This marginal support for 6 factors suggests the
possibility of a 5 factor solution.
Discontinuity Criteria. Using the criteria of a discontinuity in
the changing eigenvalues (Cattell 1958, 1966), additional support is
found for a six factor solution. The discontinuity occurs at the
seventh factor where the change in eigenvalue makes a markedly sharp
increase (Table 21). This discontinuity in the seventh factor would
support a 6 factor solution (Cattell 1958, 1966; Rummell 1970).
Scree Plot. The scree plot for this unrestricted factor analysis
in shown in Figure 9. Interpretation of this information indicates that
the more trivial and random error factors begin to enter with the
seventh factor and thus supports a 6 factor solution.
Interpretability Criteria. Interpretation of previous criteria is
enigmatic, as support for both a 5 and 6 factor solution is present.
Consequently, the interpretability and meaningfullness criteria is used
to bring additional clarity into the number of factors interpretation.
While the unrestricted six factor solution explains 60.8 percent of the
variance, it also posits Y8 as the single item significantly loading.on
factor six (Table 22).
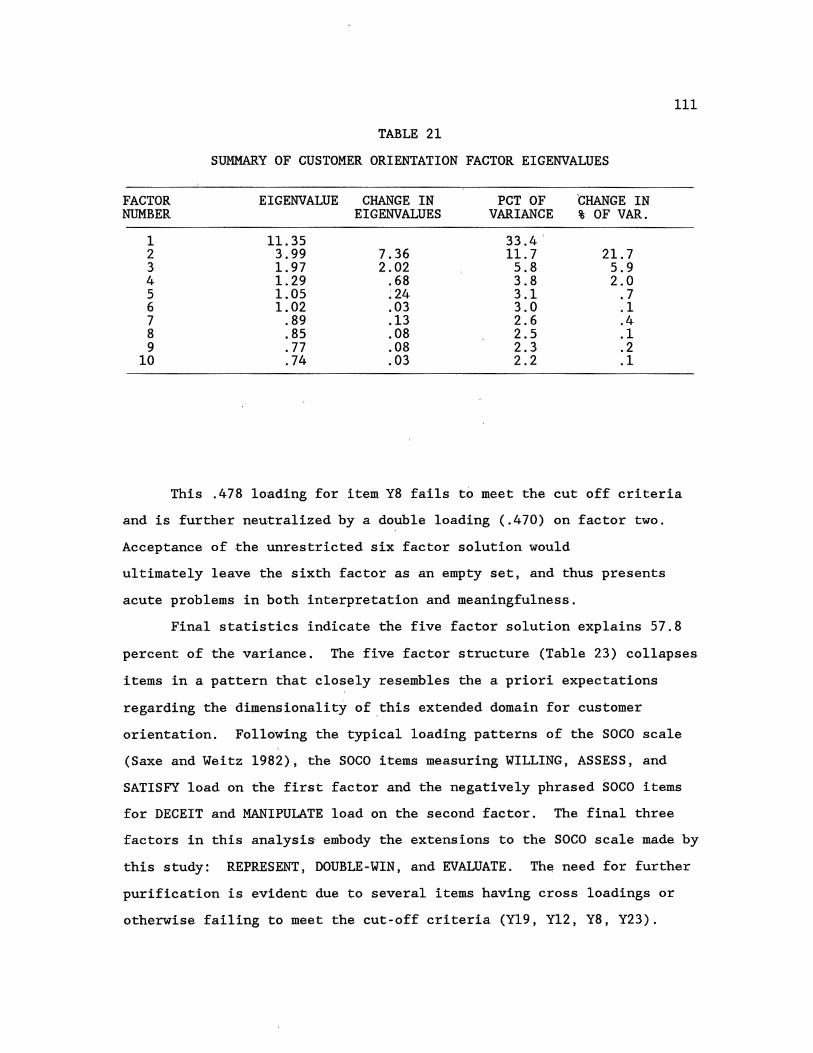
111
TABLE 21
SUMMARY OF CUSTOMER ORIENTATION FACTOR EIGENVALUES
FACTOR EIGENVALUE CHANGE IN PCT OF CHANGE IN NUMBER EIGENVALUES VARIANCE % OF VAR.
1 11.35 33.4' 2 3.99 7.36 11.7 21.7 3 1. 97 2.02 5.8 5.9 4 1.29 .68 3.8 2.0 5 1.05 ; 24 3.1 .7 6 1.02 .03 3.0 .1 7 .89 .13 2.6 .4 8 .85 .08 2.5 .1 9 .77 .08 2.3 .2
10 .74 .03 2.2 .1
This .478 loading for item Y8 fails to meet the cut off criteria
and is further neutralized by a double loading (.470) on factor two.
Acceptance of the unrestricted six factor solution would
ultimately leave the sixth factor as an empty set, and thus presents
acute problems in both interpretation and meaningfulness.
Final statistics indicate the five factor solution explains 57.8
percent of the variance. The five factor structure (Table 23) collapses
items in a pattern that closely resembles the a priori expectations
regarding the dimensionality of this extended domain for customer
orientation. Following the typical loading patterns of the SOCO scale
(Saxe and Weitz 1982), the SOCO items measuring WILLING, ASSESS, and
SATISFY load on the first factor and the negatively phrased SOCO items
for DECEIT and MANIPULATE load on the second factor. The final three
factors in this analysis embody the extensions to the SOCO scale made by
this study: REPRESENT, DOUBLE-WIN, and EVALUATE. The need for further
purification is evident due to several items having cross loadings or
otherwise failing to meet the cut-off criteria (Yl9, Yl2, Y8, Y23).
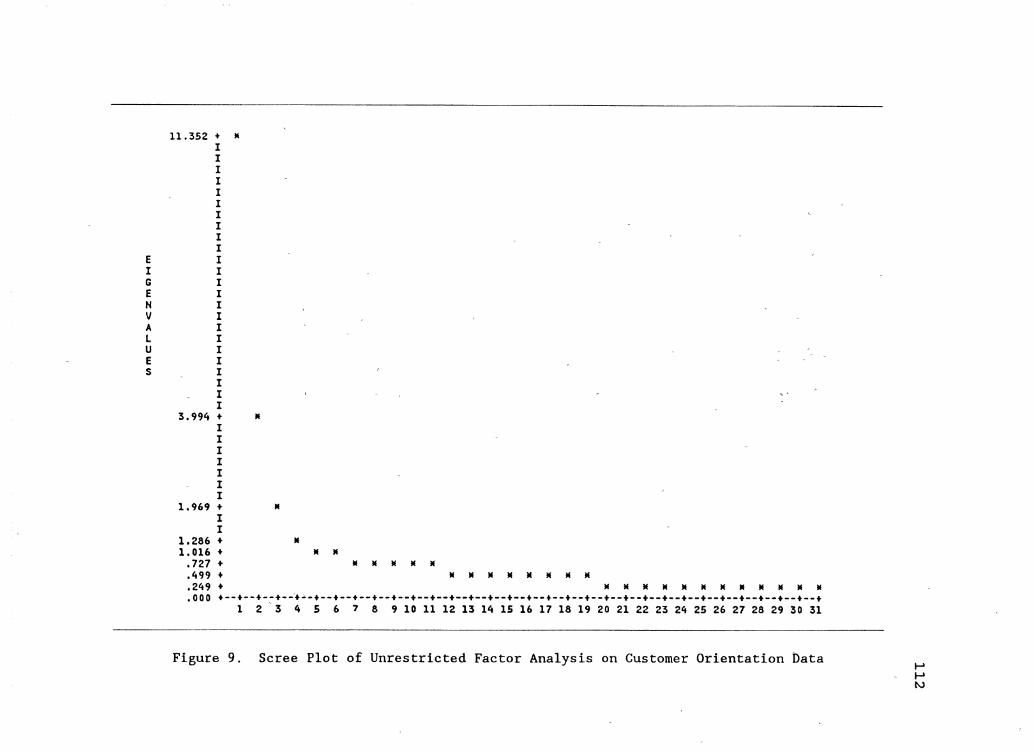
E I G E H v A L u E s
11.352 + II I I I I I I I I I I I I I I I I I I I I I I I I
3.994 + II I I I I I I I
1.969 + II I I
1.286 + II 1,016 + II II
,727 + II II II II II ,499 + II II II II II II II II , 249 + II II II II II II II II II II II II .ooo +--·--·--·-~~~-+--+--+--+--+--+--+--+--+--+--+--+--+--+--+--+--+--+--+--+--+--+--+--+-·+--+--+
1 2 '3 4 s 6 7 8 9 10 11 12 13 14 15 16 17 18 19 20 21 22 23 24 25 26 27 28 29 30 31
Figure 9. Scree Plot of Unrestricted Factor Analysis on Customer Orientation Data
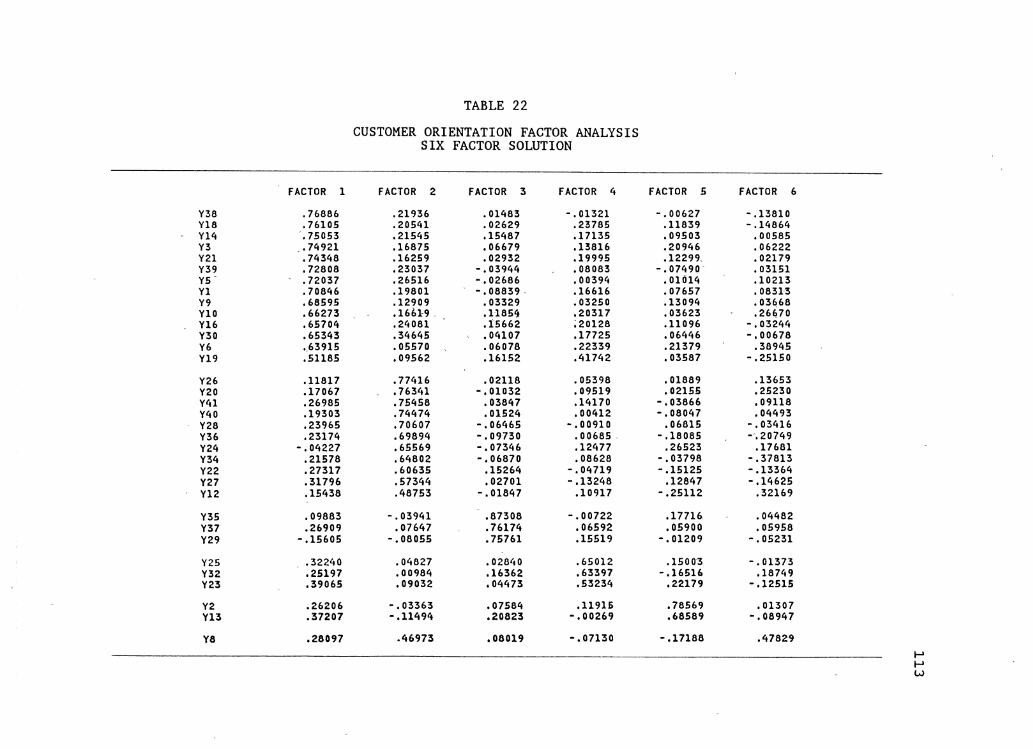
TABLE 22
CUSTOMER ORIENTATION FACTOR ANALYSIS SIX FACTOR SOLUTION
FACTOR 1 FACTOR 2 FACTOR 3 FACTOR 4 FACTOR 5 FACTOR 6
Y38 .76886 .21936 .01483 -.01321 -,00627 -.13810 Y18 .76105 .20541 .02629 .23785 .11839 -.14864 Y14 ',75053 .21545 .15487 .17135 ,09503 ,00585 Y3 .74921 .16875 .06679 .13816 .20946 .06222 Y21 .74348 .16259 .02932 .19995 .12299. .02179 Y39 • 72808 .23037 -.03944 .08083 -.07490' ,03151 Y5 .72037 .26516 -.02686 .00394 .01014 .10213 Y1 .70846 .19801 -. 08839' .16616 .07657 • 0831'3 Y9 .68595 .12909 ,03329 .03250 .13094 ,03ft68 YlO .66273 .16619' .11854 .20317 ,03623 .26670 Yl6 .65704 .24081 .15662 ;20128 .11096 -.03244 Y30 .65343 .34645 ,04107 .17725 .06446 -.00678 Y6 ._63915 .05570 .06078 .22339 .21379 .38945 Yl9 .51185 .09562 .16152 .41742 ,03587 -.25150
Y26 .11817 .77416 • 02118 .05398 .01889 .13653 Y20 .17067 .76341 -,01032 .09519 .02155 .25230 Y41 .26985 .75458 .03847 .14170 -.03866 • 09118 Y40 .19303 .74474 .01524 .00412 -.08047 .04493 Y28 .23965 .70607 -.06465 ·.00910 ,06815 -.03416 Y36 .23174 .6989Cf -.09730 • 00685 - -.18085 -', 20749 Y24 -.04227 .65569 -.07346 .12477 .26523 .17681 Y34 .21578 .64802 -,06870 .08628 -.03798 -.37813 Y22 .27317 .60635 .15264 -.04719 -.15125 -.13364 Y27 .31796 .57344 • 02701 -.13248 .12847 -.14625 Y12 .15438 .48753 -.01847 .10917 -. 25112 .32169
Y35 .09883 -.03941 .87308 -.00722 .17716, .04482 Y37 .26909 .07647 .76174 ,06592 .05900 .05958 Y29 -.15605 -.08055 .75761 .15519 -.01209 -.05231
Y25 .32240 .04827 ,02840 .65012 .1500"3 -.01373 Y32 .25197 .00984 .16362 .63397 -.16516 .18749 Y23 .3906.5 .09032 ,04473 .53234 .22179 -.12515
Y2 .26206 -.03363 .07584 .11915 .78569 .01307 Yl3 .37207 -.114911 .20823 -.00269 .68589 -.08947
Y8 .28097 .46973 ,08019 -.07130 -.17188 .47829
1-' 1-' w
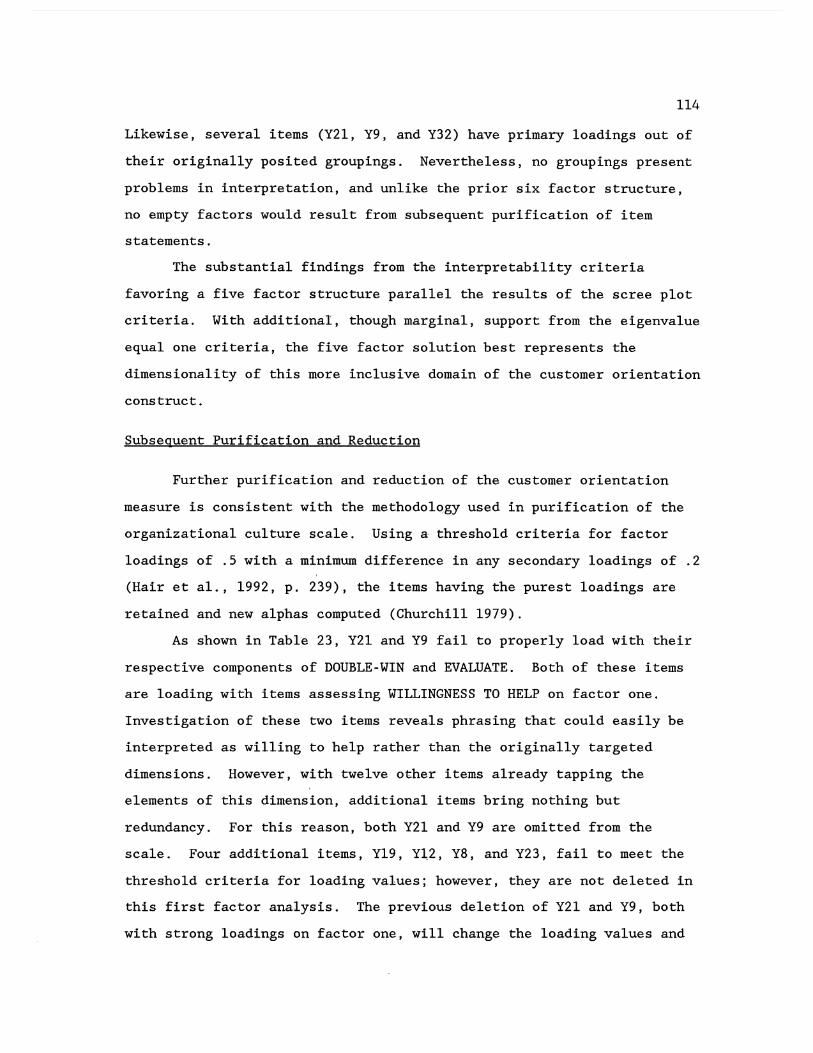
114
Likewise, several items (Y21, Y9, and Y32) have primary loadings out of
their originally posited groupings. Nevertheless, no groupings present
problems in interpretation, and unlike the prior six factor structure,
no empty factors would result from subsequent purification of item
statements.
The substantial findings from the interpretability criteria
favoring a five factor structure parallel the results of the scree plot
criteria. With additional, though marginal, support from the eigenvalue
equal one criteria, the five factor solution best represents the
dimensionality of this more inclusive domain of the customer orientation
construct.
Subsequent Purification and Reduction
Further purification and reduction of the customer orientation
measure is consistent with the methodolqgy used in purification of the
organizational culture scale. Using a threshold criteria for factor
loadings of .5 with a minimum difference in any secondary loadings of .2
(Hair et al., 1992, p. 239), the items having the purest loadings are
retained and new alphas computed (Churchill 1979).
As shown in Table 23, Y21 and Y9 fail to properly load with their
respective components of DOUBLE-WIN and EVALUATE. Both of these items
are loading with items assessing WILLINGNESS TO HELP on factor one.
Investigation of these two items reveals phrasing that could easily be
interpreted as willing to help rather than the originally targeted
dimensions. However, with twelve other items already tapping the
elements of this dimension, additional items bring nothing but
redundancy. For this reason, both Y21 and Y9 are omitted from the
scale. Four additional items, Yl9, Yl,2, Y8, and Y23, fail to meet the
threshold criteria for loading values; however, they are not deleted in
this first factor analysis. The previous deletion of Y21 and Y9, both
with strong loadings on factor one, will change the loading values and
Y3 Yl4 Y38 Yl8 Y21 Y39 Y5 Yl Y9 Y10 Y6 Y16 Y30 Yl9
Y26 Y20 Y41 Y40 Y28 Y36 Y34 Y24 Y22 Y27 Yl2 Y8
Y35 Y37 Y29
Y25 Y32 Y23
Y2 Yl3
TABLE 23
CUSTOMER ORIENTATION FACTOR ANALYSIS FIVE FACTOR SOLUTION - ITERATION 1
FACTOR 1 FACTOR 2 FACTOR 3 FACTOR
.75826 .17974 .07266 .13118 • 75165 .22549 .14693 .15746 .75096 .23217 -.01530 -.03717 .75023 .22027 -.00008 .21644 .74736 .17317 .02579 .18843 .72394 .23754 -. 04959 .06523 .72335 .27190 -.02297 -.00499 .71492 .20638 -.08395 .15821 .68932 .13882 .03343 .02355 .68570 .16793 .14353 .20389 .67941 .05741 .11090 .23657 .65598 .25083 .14603 .18771 .65116 .35548 .03363 .16471 .49541 .10783 .11893 .39198
.12238 .77210 .04303 .06063
.18529 .75935 • 02616 .10723
.26945 .75446 .04830 .14062
.18557 .74427 • 01887 .00134
.22959 • 71098 -.06432 -.01256
.19952 .70395 -.13179 -.01302
.17527 .65924 -.11932 .06104 -.02443 .65518 -.03153 .14433
.24920 .60959 .12569 -.06444
.29967 .58284 .01281 -.14252
.16996 .47716 .01213 .11707
.30957 .45816 .13277 -.05538
.11158 -.03999 .87696 -.00660
.27821 .07606 .76052 .06095 -.15371 -.08474 .74393 .15068
.33426 .05463 .02620 .• 64528
.27256 .00457 .17205 .63188
.39258 .10146 .03077 .52220
.28842 -.01785 .11046 .13613
.38567 -.09739 .22108 .00281
115
4 FACTOR 5
.16607
.08571
.05334
.17057
.10418 -.08168 -.03486
.03387
.10599 -.07724
.03411
.11478
. 05786
.14076
-.05897 -.10498 -.09038 -.10913
.05942 -.09381
.10876
.14794 -.09237
.16663 -.37465 -.36553
.15343
.03708
.01986
.14185 -.22662
.25376
.71059
.66798
patterns for subsequent variables. Pending these potential changes,
rather than delete the additional four items at this time, a second
factor analysis is conducted to verify the new structure and identify
further items for deletion.
116
The results of the second factor analysis (Table 24) confirm three
additional items not meeting the required loading criteria: Yl9, Yl2,
and Y8. Yl9 double loads on fact9rs one and four due to its phrasing
and is deleted from the scale. Items Yl2 and Y8, however, are both
original to the SOCO scale (Saxe and Weitz 1982) and not deleted. The
intent of this study is to leave the SOCO scale intact while adding the
three new domain components of DOUBLE-WIN, EVALUATE, and REPRESENT;
consequently, these items are retained in the scale'.
The 31 items retained through this second iteration of
purification and reduction, detailed in Table 24, were further evaluated
in a third factor' analysis. As illustrated in Table 25, items Y8 and
Yl2 are still below the threshold criteria. In addition, Y23's
borderline loadings in preceding analyses have now become a loading
complication. Due to their membership in the original SOCO scale, Y8
and Yl2 are retained; however, Y23 is deleted as a result of this
analysis.
The results of a dropping Y23 and running a fourth factor analysis
are reproduced below in Table 26. The omission of Y23 from the DOUBLE
WIN dimension has a positive effect on Yl2 and Y8, with both items now
recording strong loadings. Nevertheless, problems continue within the
DOUBLE-WIN dimensien, as deletion of Y23 alters the loadings for Y25
such that it no longer qualifies for retention. Y25 is, however, an
original SOCO item statement and for reasons detailed earlier, it is not
deleted from the scale. Rather, additional item statements will be
added to this DOUBLE-WIN dimension for further testing in subsequent
data collection and analysis in the main survey.
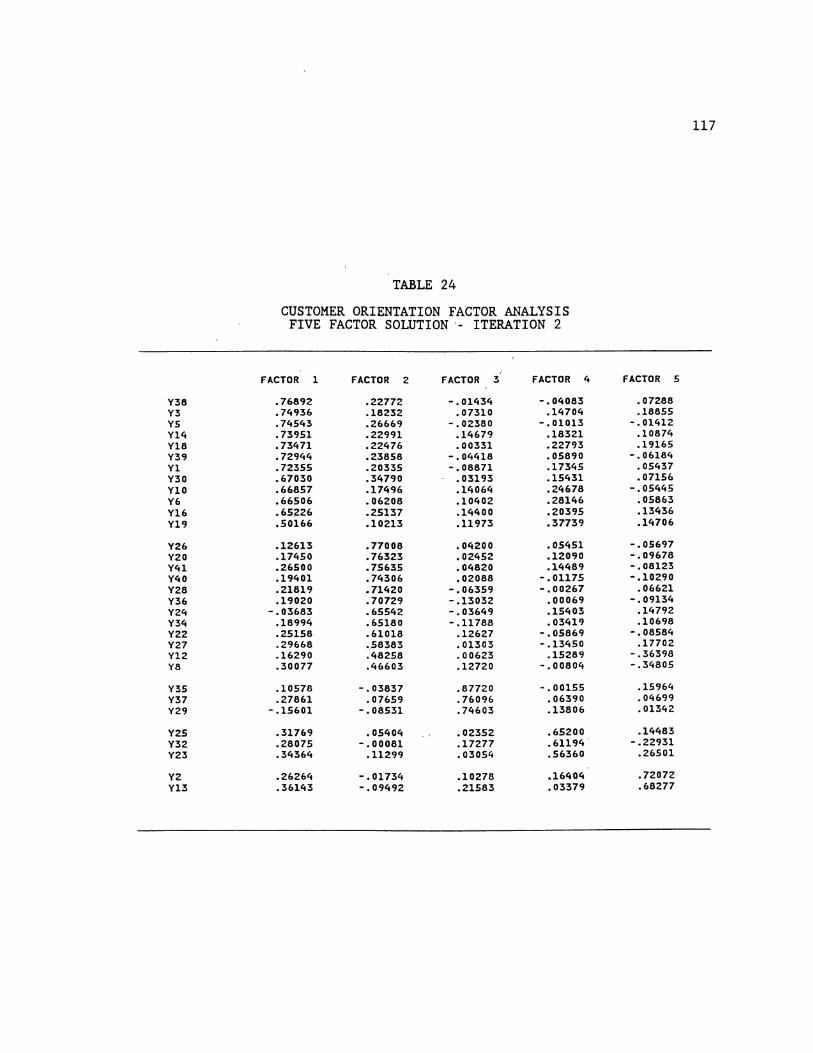
Y38 Y3 Y5 Yl4 Yl8 Y39 Y1 Y30 YlO Y6 Yl6 Y19
Y26 Y20 Y41 Y40 Y28 Y36 Y24 Y34 Y22 Y27 Y12 Y8
Y35 Y37 Y29
Y25 Y32 Y23
Y2 Y13
TABLE 24
CUSTOMER ORIENTATION FACTOR ANALYSIS FIVE FACTOR SOLUTION ·- ITERATION 2
FACTOR 1 FACTOR 2 FACTOR 3 FACTOR
.76892 .22772 -.01434 -.04083
.74936 .18232 .07310 .14704
.74543 .26669 -.02380 -.01013
.73951 .22991 .14679 .18321 • 73471 .22476 .00331 .22793 .72944 .23858 -.04418 .05890 .72355 .20335 -. 08871 .17345 .67030 .34790 .03193 .15431 .66857 .17496 .14064 .24678 .66506 .06208 .10402 .28146 • 65.226 .25137 .14400 .20395 .50166 .10213 .11973 .37739
.12613 .77008 .04200 .05451
.17450 .76323 .02452 .12090
.26500 .75635 .04820 .14489
.19401 .74306 .02088 -.01175
.21819 .71420 -.06359 -.00267
.19020 .70729 -.13032 .00069 -.03683 .65542 -.03649 .15403
.18994 .65180 -.11788 .03419
.25158 .61018 .12627 -.05869
.29668 .58383 .01303 -.13450
.16290 .48258 .00623 .15289
.30077 .46603 .12720 -.00804
.10578 -.03837 .87720 -.00155
.27861 .07659 .76096 .06390 -.15601 -.08531 .74603 .13806
.31769 .05404 .02352 .65200
4
.28075 -.00081 .17277 . 61194.
.34364 .11299 .03054 .56360
.26264 -. 01734 .10278 .16404
.36143 -.09492 .21583 .03379
117
FACTOR 5
• 07288 .18855
-.01412 .10874 .19165
-.06184 .05437 • 07156
-.05445 .05863 .13436 .14706
-.05697 -.09678 -.08123 -.10290
.06621 -.09134
.14792
.10698 -.08584
.17702 -.36398 -.34805
.15964
.04699
.01342
.14483 -.22931
.26501
.72072
.68277
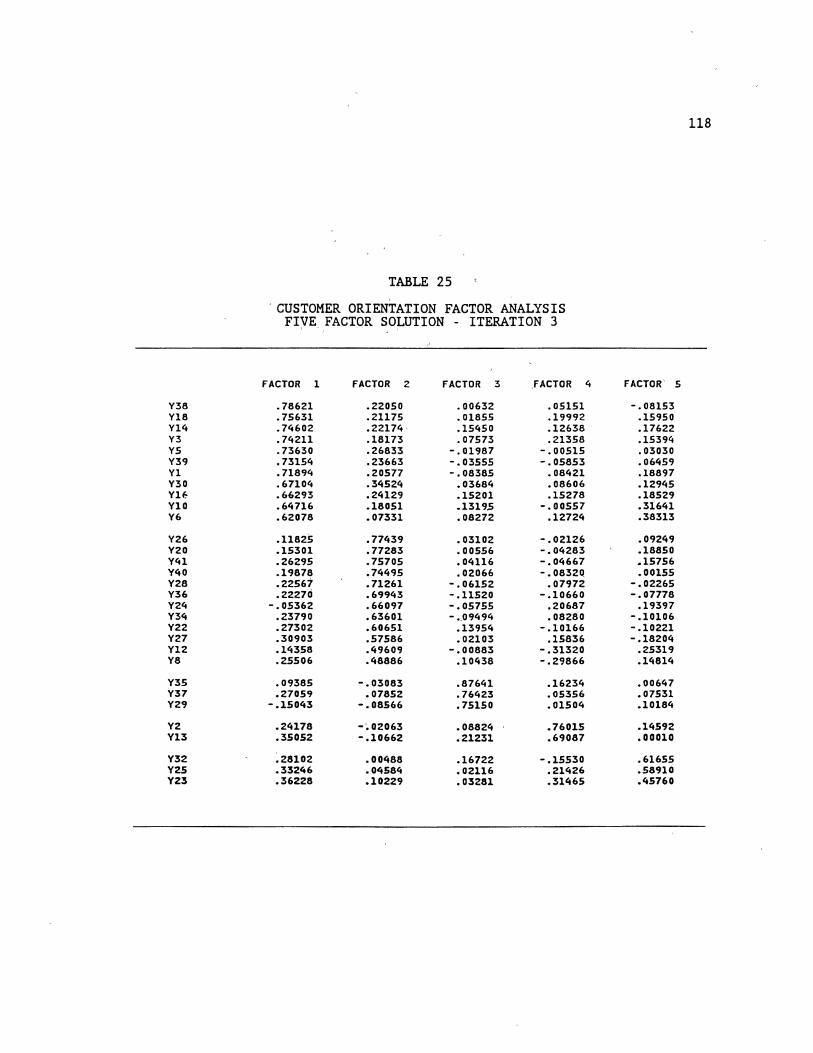
Y36 Y16 Yl4 Y3 Y5 Y39 Y1 Y30 YH Y10 Y6
Y26 Y20 Y41 Y40 Y28 Y36 Y24 Y34 Y22 Y27 Yl2 Y8
Y3.5 Y37 Y29
Y2 Yl3
Y32 Y25 Y23
TABLE 25
. CUSTOMER ORIENTATION FACTOR ANALYSIS FIVE FACTOR SOLUTION - ITERATION 3
FACTOR 1 FACTOR 2 FACTOR 3 FACTOR
.76621 .22050 .00632 .05151
.75631 .21175 .01655 .19992
.74602 .22174 .15450 .12638 • 74211 .16173 .07573 .21358 .73630 .26833 -.01987 -.00515 .73154 .23663 -.03555 -.05653 .71894 .20577 -.08385 .08421 .67104 .34524 .03684 .08606 .66293 .24129 .15201 .15278 . 64716 .18051 .13195 -.00557 .62078 .07331 .08272 .12724
.11825 .77439 .03102 -.02126
.15301 .77283 .00556 -.04283
.26295 .75705 • 04116 -.04667
.19878 .74495 .02066 -.08320
.22.567 .71261 -.06152 .07972
.22270 .69943 -.11520 -.10660 -.05362 .66097 -.057.55 .20687
.23790 .63601 -.09494 .08280
.27302 .60651 .13954 -.10166
.30903 .57586 .02103 .15836
.14358 .49609 -.00883 -.31320
.25506 .48886 .10438 -.29866
.0938.5 -.03083 .87641 .16234
.27059 .07852 .76423 .05356 -.1.5043 -.08566 .751.50 .01.504
.24178 -~02063 .08824 .76015
.3.5052 -.10662 .21231 .69087
.28102 .00488 .16722 -.1.5.530
.33246 .04584 • 02116 .21426
.36228 .10229 ,03281 .31465
118
4 FACTOR 5
-.06153 .15950 .17622 .15394 .03030 .06459 .18897 .12945 .18529 .31641 .38313
.09249
.18850 .15756 .00155
-.02265 -.07778
.19397 -.10106 -.10221 -.18204
.2.5319
.14814
.00647
.07531
.10184
.14592
.00010
.61655
.58910
.45760
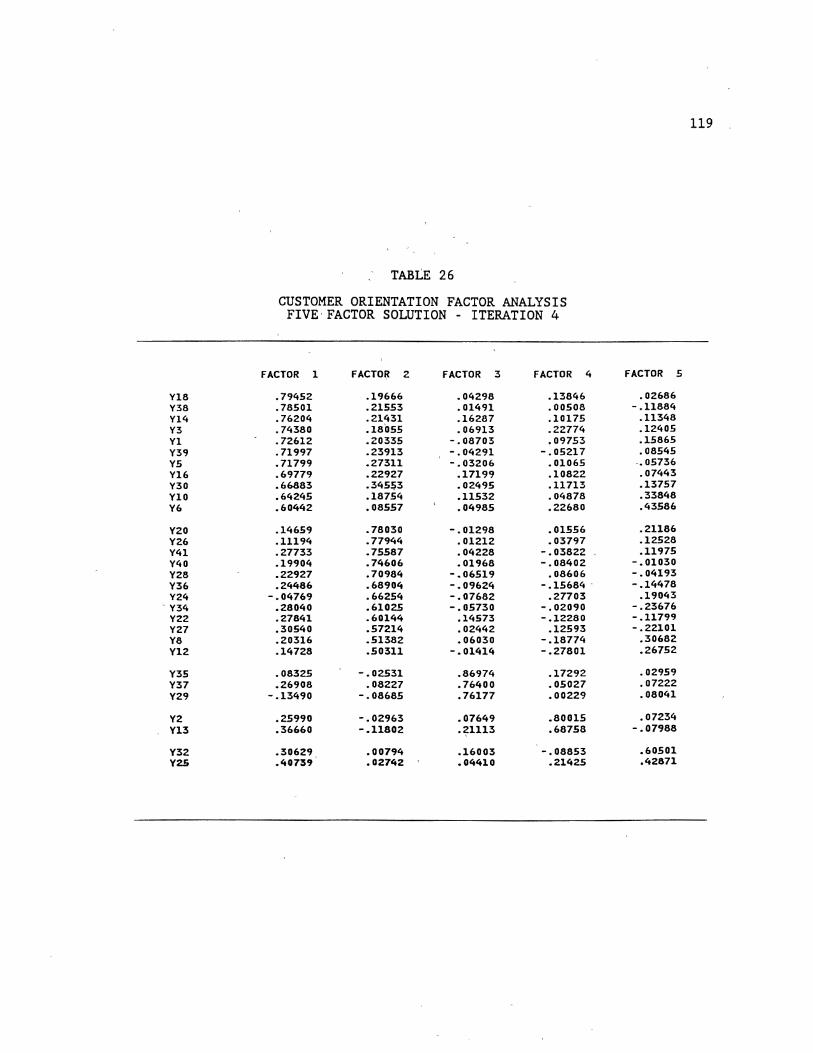
Y18 Y38 Y14 Y3 Y1 Y39 Y5 Yl6 Y30 YlO Y6
Y20 Y26 Y41 Y40 Y28 Y36 Y24
- Y34 Y22 Y27 Y8 Y12
Y35 Y37 Y29
Y2 Y13
Y32 Y2S
TABLE 26
CUSTOMER ORIENTATION FACTOR ANALYSIS FIVE FACTOR SOLUTION - ITERATION 4
FACTOR 1 FACTO~ 2 FACTOR 3 FACTOR 4
.79452 .19666 .04298 .13846
.78501 .21553 .01491 .00508
.76204 .21431 .16287 .10175
.74380 .18055 .06913 .22.774
.72612 .20335 -.08703 • 09753
. 71997 .23913 -.04291 -.05217 • 71799 .27311 -.03206 .01065 .69779 .22927 .17199 .10822. .66883 .34553 • 02495 .11713 .64245 .18754 .11532 .04878 .60442 .08557 .04985 .22680
.14659 .78030 -.01298 .01556
.11194 .77944 .01212 .03797
.27733 .75587 .04228 -.03822
.19904 .74606 .01968 -.08402
.22927 .70984 -.06519 .08606
.24486 .68904 -.09624 -.15684--.04769 .66254 -.07682 .27703
.28040 .61025 -.05730 -.02090
.27841 .60144 .14573 -.12280
.30540 .57214 .02442 .12593
.20316 .51382 .06030 -.18774
.14728 .50311 -.01414 -.27801
.08325 -.02531 .86974 .17292
.26908 .08227 .76400 .05027 -.13490 -.08685 .76177 .00229
.25990 -.02963 .07649 .80015
.36660 -.11802 -~1113 .68758
.30629 .00794 .16003 -.08853
.40739 .02742 .04410 .21425
119
FACTOR 5
.02686 -.11884
.11348
.12405
.15865
. 08545 -.05736 .07443 .13757 .33848 .43586
.21186
.12528
.11975 -.01030 -.04193 -.14478
.19043 -.23676 -.11799 -.22101
.30682
.26752
. 02959
.07222
.08041
.07234 -.07988
.60501
.42871

120
As summarized in Table 26, with the exception of Y25 discussed
above, the remaining 30 item statements exhibit high primary loadings
exceeding the criteria for retention. Analogous to this pattern of high
factor loadings, except for the DOUBLE-WIN dimension, alpha estimates of
reliability (Table 27) are in excess of the .60 criteria established for
this study and therefore suitable for further research (Nunnally 1978).
As concluded above, the DOUBLE-WIN dimension is targeted for further
development in the field study to improve its characteristics.
Both EVALUATE and DOUBLE-WIN dimensions have been reduced to only
two item statements each. In order to strengthen the domain sampling of
both these dimensions and to improve the subsequent scale reliabilities,
additional item statements are added for further purification in the
main survey.
TABLE 27
ALPHA ESTIMATES OF RELIABILITY FOR THE FINAL CUSTOMER ORIENTATION MEASURE
DIMENSION NUMBER ALPHA OF ITEMS
WILLING 11 .93 MANIPULATE/DECEIT 12 .90 REPRESENT 3 .74 EVALUATE 2 .68 DOUBLE-WIN 2 .45
121
Additional Work Required
In addressing the potential problems of undersampling the domain
of the EVALUATE and DOUBLE-WIN dimensions, the direction provided by
Churchill (1979, p. 69) was followed: using knowledge gained in earlier
stages of analysis, additional development work is conducted in order to
add new item statements into each of these two di~ensional scales.
Adding new items at this stage allows them to be further tested and
purified in the subsequent data collection and analysis. Two additional
item statements are added into each of these two sub-scales.
EVALUATE. This dimension assesses the elements of customer
orientation concerning the salesperson''s post sale service to the
customer. This measure of post sale service should include (a) the
extent to which the salesperson actually appraises customer
satisfaction, (b) does the salesperson take corrective action when
required in order to resolve customer problems, and (c) how rapidly does
the salesperson react in following-up sales to work out possible
problems. The two remaining items in this dimension, Y2 and Yl3, are
limited to evaluating the extent of salesperson post sale follow-up.
The elements of taking action and timeliness are not represented. In
addressing this potential weakness, the following two items were added
and will be tested for reliability 'and validity in the next stage of
data collection and analysis:
(1) I follow-up my sales to take care of customer problems and complaints.
(2) I handle customer complaints quickly and efficiently.
DOUBLE-WIN. Pertaining to the relationship selling perspective in
which the salesperson, the customer, and the company all receive mutual
benefits as the result of the ~elling process, this dimension requires
the salesperson to commit to actions purposefully directed so as to
achieve this shared satisfaction. As the result of purification, the
items remaining in this sub-scale, Y32 and Y25, are limited to
122
addressing only activities directed at achieving the mutual satisfaction
of the salesperson and customer. The company to customer linkage is not
represented, consequently the following two items are appended to this
sub-scale:
(1) . I t,ry to achieve my company's goals by satisfying customers. (2) My, selling efforts a~e beneficial to my company and to my
customers.
Further recognition is given·to the possibility that the problems
with this dimension could be the result of the phrasing of Y32, an item
original to the SOCO scale. This item deals with the 'salesperson" ...
disagreeing with a customer in order to help make a·better decision" and
is the strongest loading item on its common factor (Table 26). The
wording of this statement is potentially confusing and under certain
interpretations would not readily fit in the posited domain of this
dimension. It is possible that its strength in this common factor and
lack of correspondence with the domain description resulted in the
deletion of Y23 in the previous purification analysis. To prevent the
possible loss of an item that has face validity with the domain, Y23 is
added back into the scale as an additional item for further testing in
the field survey data collection and analysis. This replacement of Y23
and the addition of four new items, brings the number of items in the
intermediate customer orientation scale to a total of 35. This 35 item
scale is utilized in the field study.
Fi~ld S~udy
The purified intermediate measures for both constructs form the
basis for the survey instrument used in this additional data collection
and analysis step. The results of this field survey are analyzed in
order to (a) purify the items added for strengthening several of the
sub-scales, (b) provide support for measure reliability across samples
and testing situations, and (c) to assess the validity of the two
measures (Churchill 1979).

123
The actual survey instrument (Appendix D) is composed of three
major sections. The first section consists of the 33 organizational
culture items (statements 2-34). Item statement 1 is strictly for
classification purposes and statements 35 and 36 measure value
congruence. The 35 item composite measure of customer orientation makes
up the second section of the sur,v:~y instrument. The third section
contains the items for use in the validity a~praisal of both measures.
The location of item state~ents on the field survey instrument
differs from their specific locations on the "pilot survey instrument.,
To assist the reader in· making any desired comparisons, Tables 28 and 29
represent interpretation keys for item number locations and assigned X
and Y analysis labels cross-classifi,ed for both instruments.
TABLE 28
ORGANIZATIONAL CULTURE ITEM LOCATION KEY FROM PILOT SURVEY TO FIELD SURVEY INSTRUMENT
NON-REDTAPE PILOT STUDY Xl2 X6 X4 FIELD STUDY J?l ~/ Xl8 X)'! X1:5 X13 X33
NON COMPLEX I f
PILOT STUDY X32 X37 FIELD STUDY X21 Xl7 X2B X25 b9,
EMPOWERMENT PILOT STUDY X30 X34 X27 X36 X39 FIELD STUDY X20 X23 Xl9- X30 X27
PROACTIVE • PiiOT STUDY X41 X35 /
FIELD STUDY X24 X31 XlO X12 X!4, SOCIAL l
PILOT STUDY X33 X24 X15 FIELD STUDY X22 X4 X8
TEAM PILOT STUDY X43 X57 X43 X46 X47 FIELD, STUDY X32 X36 X34 X6 X35
COMMITMENT PILOT STUDY Xl8 Xl7 Xl9 FIELD STUDY Xl6 X9 X26
Italics denote new items added to scale for further testing

124
TABLE 29
CUSTOMER ORIENTATION ITEM LOCATION KEY FROM PILOT SURVEY TO FIELD SURVEY INSTRUMENT
WILLING PILOT STUDY Y38 Y39 YS Yl8 Yl Y3 Yl4 Y30 Yl6 YlO Y6 FIELD STUDY Y32 Y33 Y4 Yl3 Yl Y3 Yll Y24 Yl2 Y8 YS
MANIPULATE/DECEIT PILOT STUDY. Y26 Y20 Y24 Y41 Y40 Y28 Y36 Y34 Y22 Y27 Yl2 Y8 FIELD STUDY Y20 Yl4 Yl8 Y35 Y34 Y22 Y29 Y25 Yl6 Y21 Y9 Y6
REPRESENT PILOT STUDY Y35 Y37 Y29 FIELD STUDY Y27 Y30 Y23
EVALUATE PILOT STUDY Y2 Yl3 FIELD STUDY Y2 YlO Y7 Yl5
DOUBLE-WIN PILOT STUDY Y32 Y25 Y23 FIELD STUDY Y26 Yl9 Yl7 Y28 Y31
Italics denote new items added to scale for further testing
Item Purification and Reliability Assessment
Previous steps of item reduction and purification ~esulted in
several sub-scales in both composite measures having low alpha scores
and an insufficient number of i.tem statements to encompass the specific
dimensional domains. In addressing these potential weaknesses,
additional items were appended to these five sub-scales. Consequently,
these particular items are further tested using item-to-total
correlations to achieve satisfactory domain coverage and alphas
(Churchill 1979). Further analysis,of the resulting full set of final
scale items then assesses the reliability of the resulting measures and
confirms their factor structure.
Organizational Culture
The three dimensions of organizational culture amended with
additional item statements are (1) PROACTIVE, (2) NONCOMPLEX, and (3)

125
NON-REDTAPE. The item-to-total and pairwise correlations for the items
in each of these three dimensions are depicted in Tables 30, 31, and 32.
TABLE 30
CORRECTED ITEM-TO-TOTAL AND PAIRWISE CORRELATIONS FOR PROACTIVE DIMENSION ITEMS
ITEM
X24 X31 X10 X12 Xl4
CORRELATIONS
PAIRWISE ITEM-TO TOTAL X24 X31 X10 Xl2 X14
.56
.63
.43
.39
.35
1.00 .6'0 .34 .27 .32
TABLE 31
1.00 .41 .31 .35
1.00 .33 .14
1.00 . 21 1.00
CORRECTED ITEM-TO-TOTAL AND PAIRWISE CORRELATIONS FOR NONCOMPLEX DIMENSION ITEMS
ITEM
X21 X17 X28 X25 X29
CORRELATIONS
PAIRWISE ITEM-TO TOTAL X21 Xl7 X28 X25 X29
.48
.41 -.03
.40
.14
1.00 .55 .07 .45
-.14
1.00 -.05
.43 -.08
1.00 -.00 -.09
1.00 -. 06 1.00

ITEM
X7 xs Xl8 Xll XlS Xl3 X33
TABLE 32
CORRECTED ITEM-TO-TOTAL AND PAIRWISE CORRELATIONS FOR NON-REDTAPE DIMENSION ITEMS
CORRELATIONS
ITEM-TO PAIRWIS·E TOTAL X7 xs Xl8 Xll XlS Xl3
.18 1.00
.20 .53 1.00
.42 .09 .06 1.00
.31 .17 .19 .23 1.00
.12 .19 -.15 .25 .04 1..00
.3·4 .01 .02 .31 .13 .22 1.00
X33
.38 .03 .04 .32 .22 .15 .37 1.00
126
Using the above item-to-total and pairwise correlations, Xl4 is
deleted from the PROACTIVE dimensional sca'le. At the same time, X28 and
X29 are omittea from the NONCOMPL~ dimension. Close examination of the
correlations for the items composing the NON-REDTAPE dimension reveal~
the set of new items, Xl8, Xl3, and X33 as better representation of the
characteristics of this dimension than the original set comprised of X7
and XS. Consequently, X7, XS, Xll,_an~ Xl5 are deleted from the item
set for this dimension, leaving the·final measure totaling 26 items ,
sampling the seven dimensions ~f organizational culture.
The results of alpha computations for this measure (Table 33)
support the reliability~of the scale.
.60, is for the NON-REDTAPE dimension.
The ~owest dimensional alpha, '
Each of the other alphas are .70
and higher. The . 90 reliability es,timate of the overall measure is
computed using Nunnally's formula for the reliability of a linear
combination (Nunnally 1978). All ,reliabiliti,es meet or exceed the
minimum, suggested criteria for use in further research. Henceforth,
this measure of customer orientation will be referred to as ORGCUL.
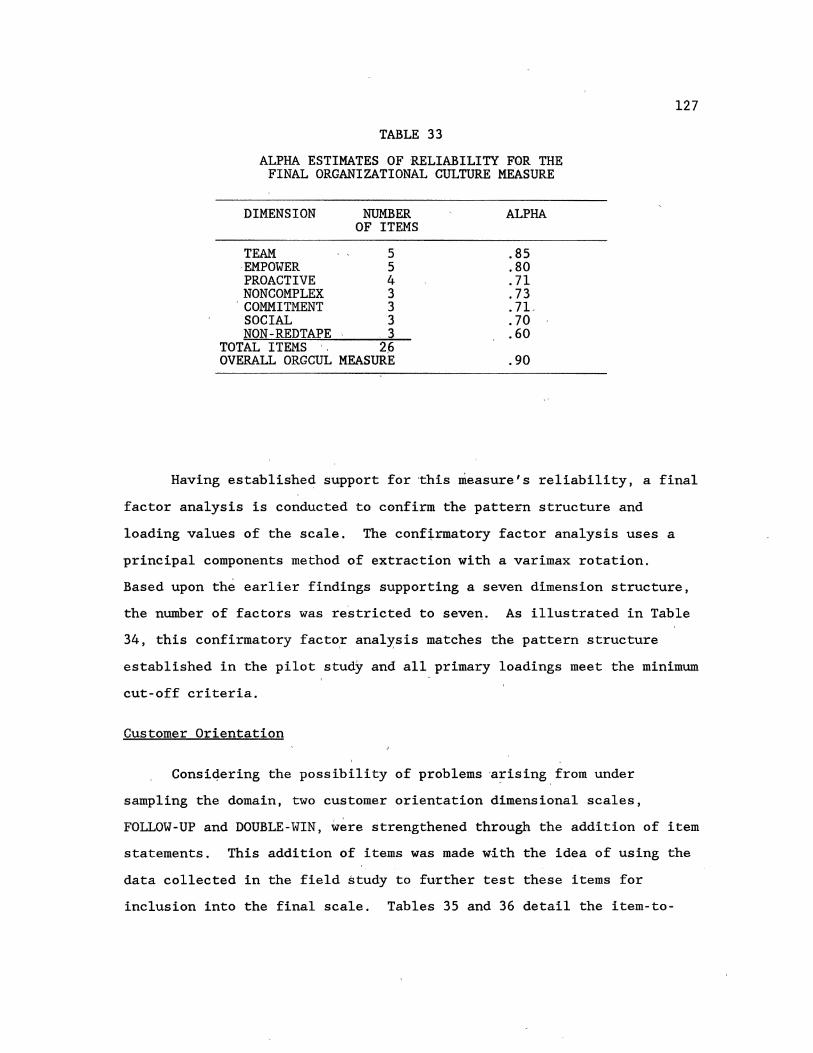
TABLE 33
ALPHA ESTIMATES OF RELIABILITY FOR THE FINAL ORGANIZATIONAL CULTURE MEASURE
DIMENSION NUMBER OF ITEMS
TEAM 5 -EMPOWER 5 PROACTIVE 4 NONCOMPLEX 3
'COMMITMENT 3 SOCIAL 3 NON- RED TAPE _ 3
TOTAL ITEMS · 2p OVERALL ORGCUL MEASURE
ALPHA
.85
.80
.71
.73
.7L
.70
.60
.90
127
Having established support for this measure's reliability, a final
factor analysis is conducted to confirm the pattern structure and
loading values of the scale. The conf~rmatory factor analysis uses a
principal components method of extraction with a varimax rotation.
Based upon the earlier findings supporting a seven dimension structure,
the number of factors was re'stricted to seven. As illustrated in Table
34, this confirmatory facto,r analysis matches the pattern structure
established in the pilot study and all primary loadings meet the minimum
cut-off criteria.
Customer Orientation
Consiqering the possibility of problems arising from under
sampling the domain, two customer orientation dimensional scales,
FOLLOW-UP and DOUBLE-WIN, were strengthened through the addition of item
statements. This addition of items was made with the idea of using the
data collected in the field study to further test these items for
inclusion into the final scale. Tables 35 and 36 detail the item-to-
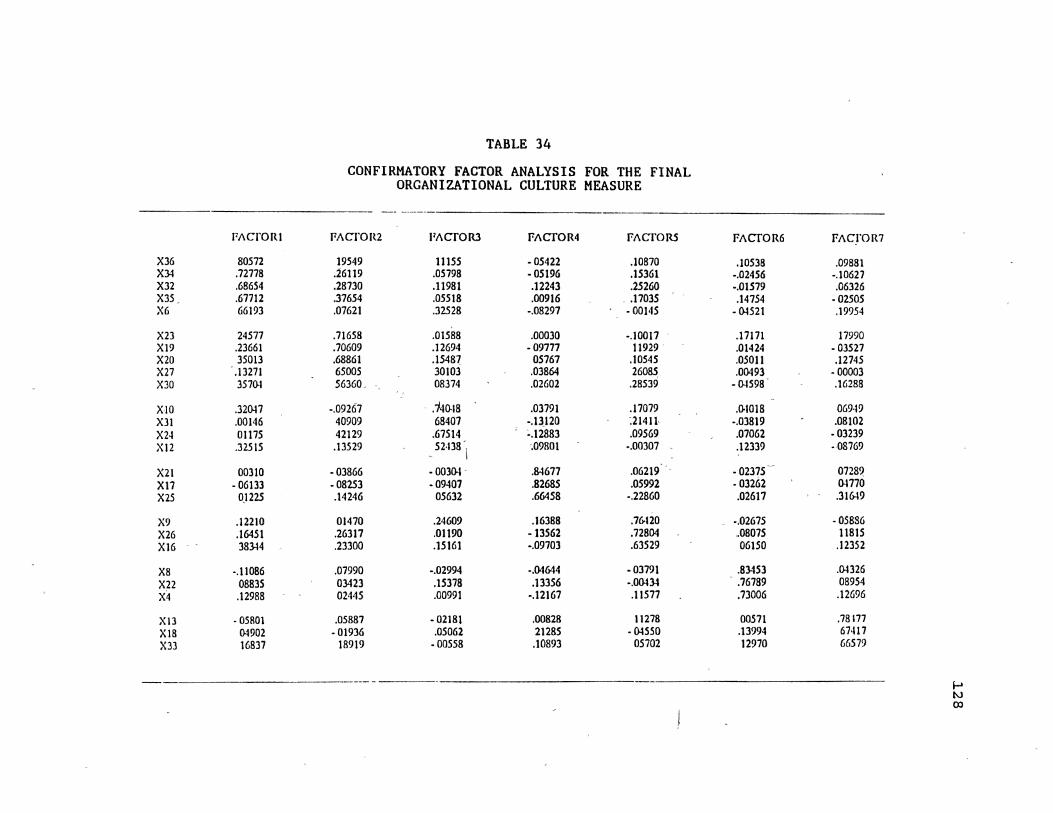
TABLE 34
CONFIRMATORY FACTOR ANALYSIS FOR THE FINAL ORGANIZATIONAL CULTURE MEASURE
- -~ -·----
FACfOR1 FACI'OR2 FACfOR3 FACfOR4 FACfORS FACfOR6 FACI'OR7
X36 80572 19549 11155 - 05422 .10870 .10538 .09881 X34 .72778 .26119 .05798 -05196 .15361 -.02456 -.10627 X32 .68654 .28730 .11981 .12243 .25260 -.01579 .06326 X35 .67712 .37654 .05518 .00916 .. .17035 .14754 -02505 X6 66193 .07621 .32528 -.08297 -00145 -Q.1521 .19954
X23 24577 .71658 .01588 .00030 -.10017 .17171 17990 X19 .23661 .70609 .12694 -09777 11929 . .01424 - 03527 X20 35013 .68861 .1548~ 05767 .10545 .05011 .12745 X27 .13271 65005 30103 .03864 26085 .00493 -00003 X30 3570.1 56360. 08374 .02602 .28539 - 04598 .16288
X·ID .32047 -.09267 .740.18 .03791 .17079 .0.1018 069·19 X31 .00146 40909 68407 -.13J20 :21411 -.03819 .08102 X2.J Oll75 42129 .67514 -.12883 .09569 .07062 -03239 X12 .32515 .13529 52·138 ·. .09801 -.00307 .12339 -·08769
I
X21 00310 -03866 -0030.1 . 8-1677 .06219 .. -02375 0728«,) X17 - 06133 -08253 -09407 .82685 .05992 -03262 0.1770 X25 01225 .14246 05632 .66458 -.22860 .02617 .316-19
X9 .12210 01470 .24609 .16388 .76-120 -.02675 -05886 X26 .16451 .26317 .01190 - 13562 .72804 .. 08075 11815 X16 383-14 .23300 .15161 -.09703 .63529 06150 .12352
X8 -.11086 .07990 -.02994 -.04644 -03791 .83453 .04326 X22 08835 03423 .15378 .13356 -.0().134 .. 76789 08954 x4 .12988 02445 .00991 -.12167 .11577 .73006 .12696
X13 - 05801 .05887 - 02181 .00828 11278 00571 .78177 X18 04902 -01936 .05062 21285 - 04550 .13994 67417 X33 16837 18919 -00558 .10893 05702 12970 66579
--------· f-> N 00
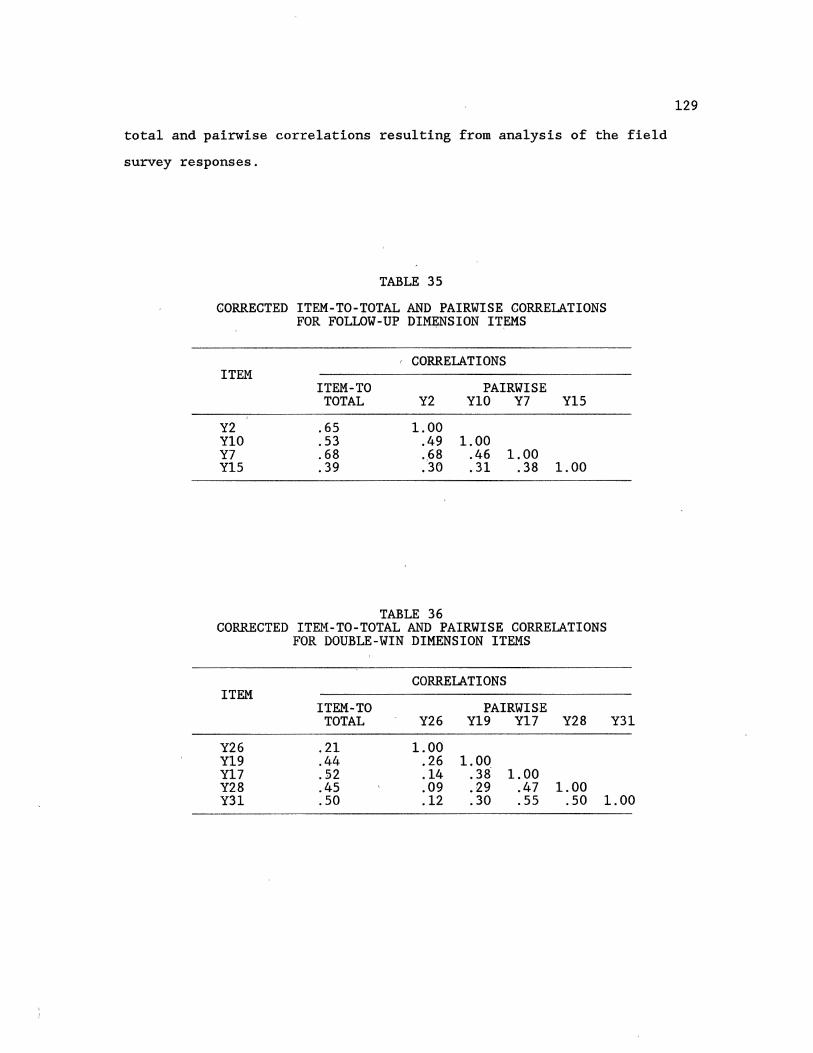
total and pairwise correlations resulting from analysis of the field
survey responses.
TABLE 35
CORRECTED ITEM-TO-TOTAL AND PAIRWISE CORRELATIONS FOR FOLLOW-UP DIM~NSION ITEMS
' CORRELATIONS ITEM
ITEM-TO PAIRWISE TOTAL Y2 YlO Y7 YlS
Y2 .65 1.00 YlO .53 .49 1.00 Y7 .68 .68 .46 1.00 YlS .39 .30 .31 .38 1.00
TABLE 36 CORRECTED ITEM-TO-TOTAL AND PAIRWISE CORRELATIONS
FOR DOUBLE-WIN DIMENSION ITEMS
CORRELATIONS ITEM
ITEM-TO PAIRWIS-E TOTAL Y26 Yl9 Yl7 Y28
.21 1.00
.44 .26 1.00
.52 .14 .38- 1.00
.45 .09 .29 .47 1.00
Y31
Y26 Yl9 Yl7 Y28 Y31 .so .12 .30 .55 .so 1.00
129

Using the above item-to-total and pairwise correlations, Yl5 is
deleted from the FOLLOW-UP dimensional scale. The deletion of YlS
results in 34 item statements remaining in the overall measure of
customer orientation.
130
Clearly, Y26 is also a strong candidate for deletion from the
DOUBLE-WIN dimension. However, examination of the actual item statement
reveals that it is an original SOCO item, and true to the study's
original intent of not modifying the existing SOCO scale, but rather to
extend it's existing domain, this item is not deleted from the scale.
It should be pointed out, that this vexatious item Y26 from the field
study corresponds to item Y32 in the pilot study questionnaire. This
finding would support the earlier judgment (p. 122) that the trouble
with the DOUBLE-WIN dimension sticking together was being caused by Y32
in the pilot study.
Using the 5 dimensions resulting from the pilot study as the basis
for analysis, alpha statistics are computed from the field study data to
assess support for scale reliability (Table 37). The lowest alphas, .66
and .64, are found in the REPRESENT and DOUBLE-WIN dimensions while each
of the other alphas are .78 and higher. These reliability estimates
exceed the minimums suggested by Nunnally (1978) and are deemed
satisfactory for use in further research.
Having support for the reliability of the extended 34 item
customer orientation measure, a final factor analysis is conducted to
confirm the pattern structure and loading values of the scale. The
confirmatory factor analysis uses a principal components method of
extraction with a varimax rotation. The number of factors is restricted
to five based upon the pilot study support for a five dimension
structure.
As illustrated in Table 38, this confirmatory factor analysis
fails to support the expected pattern structure established in the pilot
study. The results of this factor analysis result in all but one of the
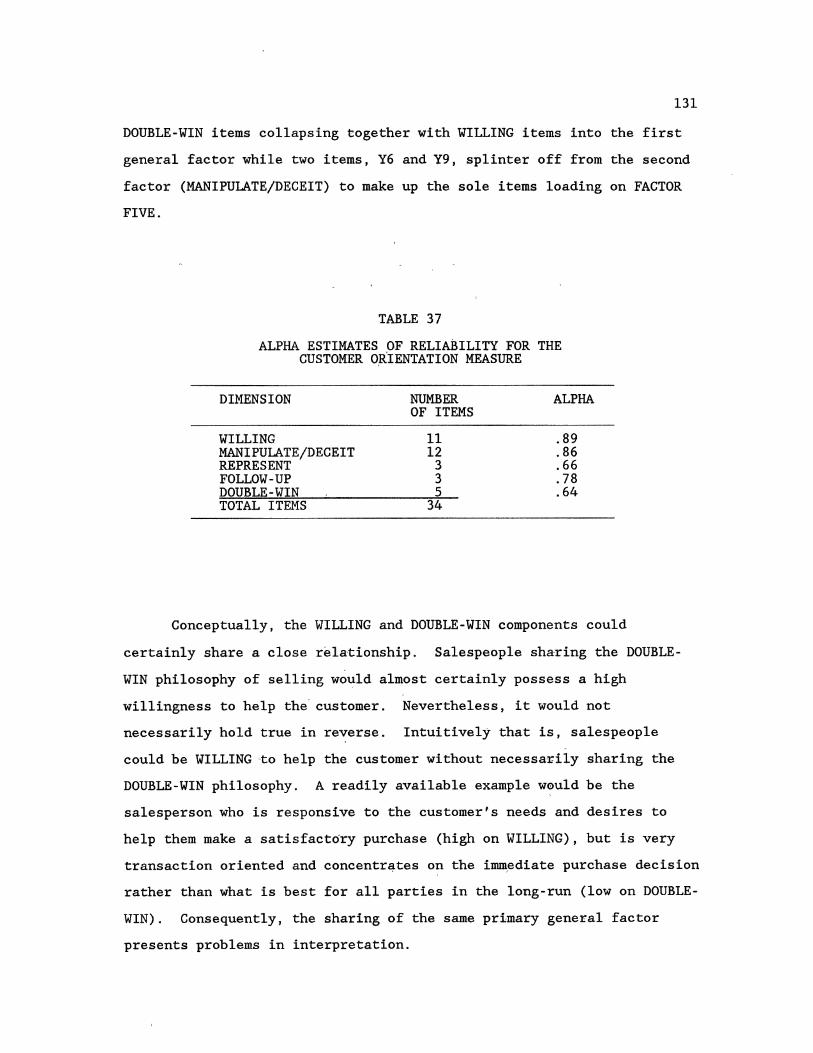
131
DOUBLE-WIN items collapsing together with WILLING items into the first
general factor while two items, Y6 and Y9, splinter off from the second
factor (MANIPULATE/DECEIT) to make up the sole items loading on FACTOR
FIVE.
TABLE 37
ALPHA ESTIMATES OF RELIABILITY FOR THE CUSTOMER ORIENTATION MEASURE
DIMENSION NUMBER ALPHA OF ITEMS
WILLING 11 .89 MANIPULATE/DECEIT 12 .86 REPRESENT 3 .66 FOLLOW-UP 3 .78 DOUBLE-WIN 5 .64 TOTAL ITEMS 34
Conceptually, the WILLING and DOUBLE-WIN components could
certainly share a close relationship. Salespeople sharing the DOUBLE
WIN philosophy of selling would almost certainly possess a high
willingness to help the- customer. Nevertheless, it would not
necessarily hold true in reverse. Intuitively that is, salespeople
could be WILLING -to help the customer without necessa~ily sharing the
DOUBLE-WIN philosophy. A readily available example would be the
salesperson who is responsive to the customer's needs and desires to
help them make a satisfactory purchase (high on WILLING), but is very
transaction oriented and concentrates on the immediate purchase decision
rather than what is best for all parties in the long-run (low on DOUBLE
WIN). Consequently, the sharing of the same primary general factor
presents problems in interpretation.

Y13 Y3 Y17 Y5 Y32 Yl2 Y24 Y28 Y11 Y4 Y8 Y1 Y31 Y33 Y19
Y34 Y3S Y20 Y29 Y22 Y14 Yl8 Y25 Yl6 Y21
Y27 Y23 Y30 Y26
Y2 Y7 YlO
Yb Y9
TABLE 38
CONFIRMATORY FACTOR ANALYSIS FOR THE CUSTOMER ORIENTATION MEASURE
FACTOR 1 FACTOR 2 FACTOR 3 FACTOR 4
.75548 . 07271 -.09024 .21822
.72399 .12753 .21551 .10971
.70055 .11>848 .273&7 -.02184
.&9955 -.002&6 • 07285, .28224
.&8457 .23541 .29072 -.12240
.bb987 .043&7 .07790 . 23577
.64720 .12821 .01401 .36827
.64&27 .18&23 .29955 -.04609 • b3775 • 02494 • 0557'1 .38125 . 63772 .24665 .05519 .04724 • 63118 .03513 • 082'16 .10624 .62807 -.00733 .02481 .18919 .60767 .18777 .34883 .07963 .56005 .17833 .08217 -.07557 .52258 .01260 .13278 .10546
.02913 .76814 ,13208 -.14726
.16341 .74969 .13686 -.15566
.01384 .74300 .09179 .09194
.05290 • 70989 .02182 .16170
.24669 .67541 -.03570 .01685
.10561 ,60691 ,03419 -.12373
.04797 .53506 ,00591 .41428
.07552 .53445 -.20609 .11398
.09222 .51747 .03631 .05861
.29527 .46781 -.27267 -.05757
.23724 • 04890. • 72710 .15027
.11479 -.05485 .67384 .12805
.39320 .12848 .59640 .03855
.08982 -.00151 .40449 .11376
.32898 • 01428 .18086 .68156
.33377 ,00292 .23742 .66974
.3355b .01980 .24329 ,65831
.17724 .43300 .11247 -.10343
.16334 .39892 .18107 -.14503
132
FACTOR 5
.15772
.00849
.03847
.14734 -.18677
.01)891
.::!2050
. 09168
.25259 -.15069
.18928
.21968 -.12946 -.30812 -.19859
.00085 -.00145
.11672 -.08643 -.12042
.41967
.17412
.20108
.17620 -.04704
.13877
.18246
. 04 766 -.12397
-.23238 -.17911
.04447
.59176
.54846
Additional interpretation problems result from Y6 and Y9 splitting
away from the second general factor. Multiple replications of the SOCO
scale have been made with this group of item statements consistently
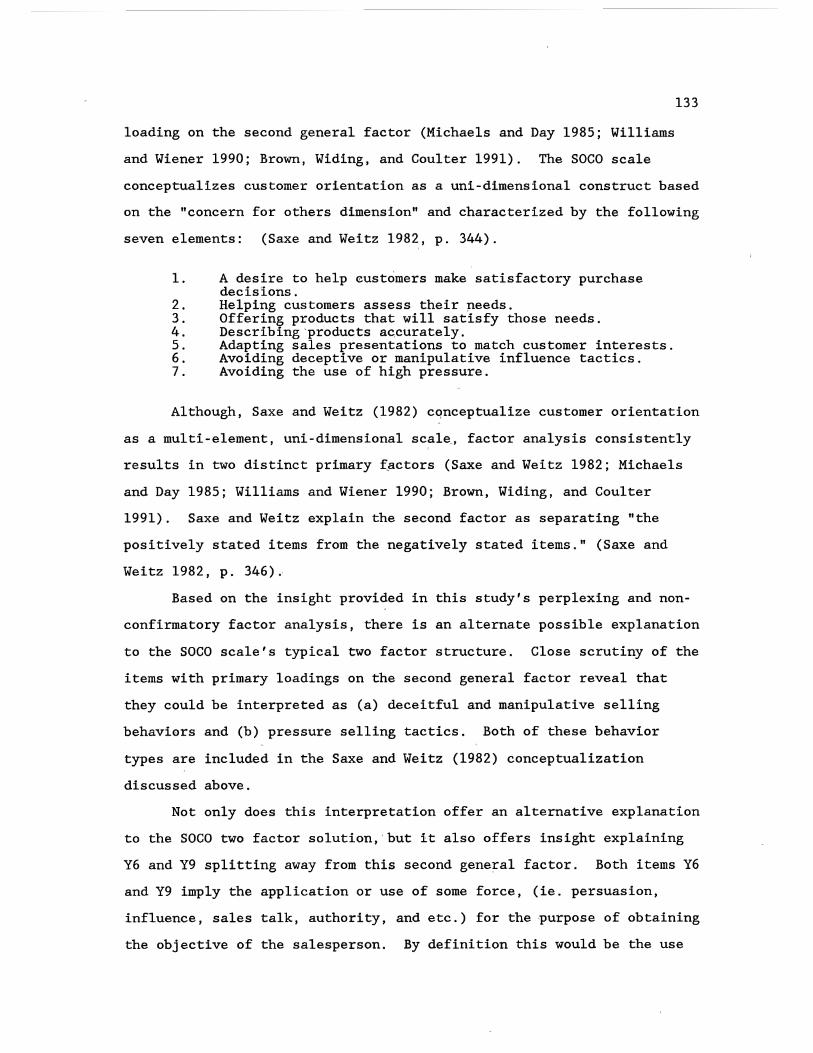
loading on the second general factor (Michaels and Day 1985; Williams
and Wiener 1990; Brown, Widing, and Coulter 1991). The SOCO scale
133
conceptualizes customer orientation as a uni-dimensional construct based
on the "concern for others dimension" and characterized by the following
seven elements: (Saxe and Weitz 1982, p. 344).
1. A desire to help customers make satisfactory purchase decisions.
2. Helping customers assess their needs. 3. Offering products that will satisfy those needs. 4. Describing products accurately. 5. Adapting sales presentations to match customer interests. 6. Avoiding deceptive or manipulative influence tactics. 7. Avoiding the use of high pressure.
Although, Saxe and Weitz (1982) conceptualize customer orientation
as a multi-element, uni-dimensional scale., factor analysis consistently
results in two distinct primary factors (Saxe and Weitz 1982; Michaels
and Day 1985; Williams and Wiener 1990; Brown, Widing, and Coulter
1991). Saxe and Weitz explain the second factor as separating "the
positively stated items from the negatively stated items." (Saxe and
Weitz 1982, p. 346).
Based on the insight provided in this study's perplexing and non
confirmatory factor analysis, there is an alternate possible explanation
to the SOCO scale's typical two factor structure. Close scrutiny of the
items with primary loadings on the second general factor reveal that
they could be interpreted as (a) deceitful and manipulative selling
behaviors and (b) pressure selling tactics. Both of these behavior
types are included in the Saxe and Weitz (1982) conceptualization
discussed above.
Not only does this interpretation offer an alternative explanation
to the SOCO two factor solution,'but it also offers insight explaining
Y6 and Y9 splitting away from this second general factor. Both items Y6
and Y9 imply the application or use of some force, (ie. persuasion,
influence, sales talk, authority, and etc.) for the purpose of obtaining
the objective of the salesperson. By definition this would be the use
134
of pressure (Merriam-Webster 1987), Saxe and Weitz's seventh component.
Items Yl6, Yl8, Y20, Y21, Y22, Y25, and Y29 infer the use of duplicity,
misinformation, falsehood, and trickery toward the salesperson's desired
outcome. Again, by simple definition (Merriam-Webster 1987), these
items depict Saxe and Weitz's sixth characteristic, deceptive influence
tactics. Items Y34 and Y35 describ7 actions designed to cleverly manage
to bring about some desired effect so as to attain one's own ends--the
definition of manipulation (Merriam-Webster 1987), a second part of Saxe
and Weitz's sixth characteristic.
As conceptualized by Saxe and Weitz, the characteristics of deceit
and manipulation would tend to have such a close correspondence that
they would certainly be expected to load ~on the same general factor.
Pressure, however, could be used in the absence of either deceit or
manipulation. An example is giveri by sales managers arguing in Saxe and
Weitz (1982, p. 344) that pressure could be exerted by salespeople to
persuade a reluctant customer to make a purchase the salesperson
recognizes as being in the customer's best interest. Thus even while
the characteristics are seen as being closely related, they are in fact
independent of one another and should discriminate be.tween one another
through primary loadings on separate general factors.
Relaxing the restrictions on the number of factors allows these
item statements to take on loadings that begin to discriminate between
the core attributes running through each of the characteristics--thus Y6
and Y9 display a tendency to splft away. This occurrence and additional
understanding combines with the marginal support for a sixth factor in
the pilot study to provide support for the inves·tigation of a possible
additional factor beyond the five originating from the pilot study.
Toward investigating the possibility of additional factors beyond
the five factor structure coming out of the pilot study, a second factor
analysis is generated with no a priori restrictions on the number of
factors. Principal components extraction with a varimax rotation is
135
utilized with the number of factors criterion set at the minimum
eigenvalue of one. This results in the seven factor structure shown in
Table 39.
The seven factor solution resulting from this unrestricted factor
analysis provides support for the earlier inference that WILLING and WIN
should be distinct factors. Fur~her support is also provided for
MANIPULATION/DECEIT and PRESSURE to be distinct and separate general
factors. However, the seventh general factor is primarily the result of
the multiple interpretations of item Y26 preventing it from loading with
any of the other facto~s. As detailed, earlier, the phrasing of this
particular item statement has caused problems throughout this study. Up
until this time, it has not been deleted from the scale due to the
desire to keep the original SOCO scale intact within the extended
measure of customer orientation. With the exception of the seventh
factor, the factor structure resulting from this analysis offers
superior interpretability of the extended customer orientation
construct.
This improved representation and the continued problems with many
of the items original to the SOCO scale led to the decision to continue
purifying the scale by removing the SOCO items not meeting the required
cut-off criteria. Because of its phrasing and interpretation problems,
Y26 was first eliminated. With this seed item out of the scale, Yl9
should load with other items from the DOUBLE-WIN dimension. This should
have the effect o·f imparting a six factor structure on the measure.
Several other items have double loadings and phrasing
characteristics not consistent with the conception of customer
orientation. Specifically, Y3 double loads on factors 1 and 3,
consequently it is deleted. Items Y4 and Y25, both original SOCO items,
have multiple loadings and are also statements of beliefs and attitudes
rather than a description of selling behavior. Saxe and Weitz (1982)
FACTOR 1
Yl3 .78574 Yll • 7041>5 Y5 .73241 Y24 • 71444 Y12 .1>8371 Y1 .1>3585 Y8 .1>2940 Y3 .53855
Y34 -.04241> Y35 .05337 Y22 .1931>3 Y2'1 ,031>52 Y20 ,00460 Y:?l .25'110 Yl8 • 07:!47 Y25 .11181
Y32 .31372 Y31 .30145 Y28 .37928 Y33 .21>841 Y17 .49880 Y4 .43848
Yb .14750 Y'l .12849 Y14 .09124 Y1b -.02402
Y2 .25536 Y7 .27501 YlO .42149
Y23 .20417 Y27 .1934 2 no .1&158
Y26 .05551 Y19 .31265
TABLE 39
SECOND FACTOR ANALYSIS FOR THE CUSTOMER ORIENTATION MEASURE WITH NUMBER OF FACTORS UNRESTRICTED
FACTOR 2 FACTOR 3 FACTOR 4 FACTOR 5 FACTOR b
.101>90 .21414 .03581 ,07873, ·.O:!b31 ,Ob8bl> ,07297 .04590 .20075 .175:!b ,03210 .19840 ,03111 .15987 .108::!8 .13525 .15771> ,08780 .24101 .104::!0 .09105 .20571> ,00722 .1221>1 .092:!8
-.02137 .22157 .10532 ,10277 .08331> .04383 ,20717 .12701 .01548 • 08955 .08538 .49b23 .11528 .15682 .10b28
,7&295 .11038 ,19901> -.13050 .11:!'t4 • 73BOL .21399 .19095 -.132'17 .llb'11 .72500 .15578 ,00722 -.02142 -.02924 .72153 .04789 .08192 .11>130 .0081b .1>8849 .03274 .::!9311, .H282 .088'75 .49839 .15117 -.01884 -.111>79 -.201!.4 .48201 -.11>237 .25633 .3'1170 .03:!3:! .41>268 .017't5 .21921 .09292 ·, O!lb'lb
.11>576 .73529 ,07600 ,04845 .0'1378
.10755 .1>51>51> .01>369 .:!3609 .20543 • 06626 ,5921>7 • 27391 .08589 .1 b358 .18023 .59087 -.1438!, .02755 - • 0 .5't 't 1 .12565 .49902 .17't42 . 029b't .14559 .23874 .45179 .03420 .10106 -.0'1485
.20952 ,06958 • 79511 -,01905 .021!87
.20375 ,07870 .72847 -.07266 .10bo9
.45494 ,00753 .1>5798 -.07311 -.05:!72
.3561>3 .2101>5 .39049 .18951 -.01497
-.01395 .21069 -.071>27 .77631 , OO't48 -.02433 .20478 -.05'123 .74841 ,088'15
.03230 .04463 -.032't5 .1>0159 .2b138
.01850 -.00432 ·.0061'1 .01511> . 77253
.05035 .23144 .06758 .14251 .7b0b0
.04092 .52904 .13605 .1bb28 .53873
.0411>2 .01585 .04543 .14479 .191'tb -.02141 .37487 - • 08862 .22813 -.1bbb9
fACTOR 7
-.00540 ·,O:!t>37
.08453 ·.110:!0
.14b43 •• O'l5b5
.12oH
.10215
.07t!80
. 03!.14 ,Ot,85b ;o220b
-.05<,05 -.17!>::!:! -.0'1:!80 ... 't't :!22
, 0Uu51 -.o5 .. :!1 ·.01b"3
.00008 , .1 'lo'l3
.209'19
-. 02087 .02~58
.10tl44 -.~8~~5
.153:!2
.12o'l2 -.003'o5
.18114
.0'18b7 -.130:!b
.70173 • 5::!4 31 1-'
w 0'1
137
conceptualize customer orientation as a behavior. Even the instructions
of the SOCO scale are designed to fit behaviors rather than beliefs and
attitudes. This lack of compatibility contributes to the double loading
problems of Y4 and Y25, consequently both of these items are also
deleted.
The deletion of these four items from the customer orientation ,_
measure results in a total of 30 item statements. These 30 items will
be submitted to further purification in order to (a) confirm the
contemplated 6 dimension structure, (b) secure primary factor loadings
consistent with the cut-off criteria for the study, and (c) achieve
satisfactory levels of alpha estimates of reliability.
Based on the structure of the preceding factor analysis, the
posited six dimensions of the customer orientation construct are as
follows:
1. NEEDS Practices consultive style of selling in identifying and addressing the needs of the customer.
2. MANIPULATE/DECEIT Behaves in a credible manner and is honest and nonmanipulative in dealing with customers.
3. DOUBLE-WIN Adopts a behaviorial style in line with the philosophy that mutual benefits should result from an exchange between customer, company and salesperson.
4. PRESSURE Is understanding and not pushy or forceful in dealing with the customer.
5. FOLLOW-UP Follows up after the sale to take care of problems and assure the ·customer's satisfaction.
6. REPRESENT Represents the customers' interests in dealing with his employer company.
Within these six posited dimensions, item-to-total correlation analysis
was performed on the remaining 30 items. The corrected item-to-total
and pairwise correlations are delineated in Tables 40 through 45.
All 30 item statements remaining in the scale have corrected item-
to-total correlations equal to or greater than .35, the cutoff criteria
suggested by McKelvey (1967). Having satisfied the cutoff criteria for
item-to-total correlations, additional factor analysis is performed to
138
test support for the posited 6 dimensions of the extended customer
orientation domain.
TABLE 40
CORRECTED ITEM-TO-TOTAL AND PAIRWISE CORRELATIONS FOR NEED .DIMENSION ITEMS
CORRELATIONS .ITEM
ITEM-TO PAIRWISE TOTAL Yl3 Yll YS Y24 Y12 Yl Y8
Y13 . 71' 1.00 Yll .69 .58 1.00 YS .65 .52 .49 1.00 Y24 .·64 .55 .57 .41 1.00 Y12 .66 .55 .53 .55 .52 1.00 Yl .58 .51 .45 .48 .39 .45 1.00 Y8 .56 .46 .49 .44 .3~ .39 .39 l.PO
TABLE 41
CORRECTED ITEM~TO-TO~~L AND PAIRWISE-CORRELATIONS FOR MANIPULATE/DECEIT DIMENSION ITEMS
CORRELATIONS ITEM
ITEM-TO PAIRWISE TOTAL, Y34 :
Y35 Y22 Y29 Y20 Y21 Y,18
Y34 .67 1.00 Y35 . 6_6 .73' 1.00 Y22 .60 .45 .46 1.00 Y29 .58 .47 .46 .47 1.00 Y20 .63 .so .47 .49 .47 1.00 Y21 .37 .26 .34 .39 .23 .26 1.00 Y18 .41 .35 .26 .25 .31 .39 .17 1.00

ITEM
Y32 Y31 Y28 Y33 Y17 Y19
TABLE 42
CORRECTED ITEM-TO-TOTAL AND PAIRWISE CORRELATIONS FOR DOUBLE-WIN DIMENSION ITEMS
CORRELATIONS
ITEM-TO PAIRWISE TOTAL Y32 Y31 Y33 Y28 Y17 Y19
.68 1.00
.62 .61 1.00
.57 .54 .so 1.00
.47 .47 .37 .33 1.00
.63 .55 .53 .46 .37 1.00
.40 .31 .30 .29 .26 .37 1.00
TABLE 43
CORRECTED ITEM-TO-TOTAL AND PAIRWISE CORRELATIONS FOR PRESSURE DIMENSION ITEMS
CORRELATIONS ITEM
ITEM-TO PAIRWISE TOTAL Y6 Y9 Y14
.61 1.00
.56 .55 1.00
.56 .52 .46 1.00
Y16
Y6 Y9 Y14 Y16 .35 .30 .25 .31 1.00
139
TABLE 44
CORRECTED ITEM-TO-TOTAL AND PAIRWISE CORRELATIONS FOR FOLLOW-UP DIMENSION ITEMS
ITEM
Y2 Y7 YlO
ITEM-TO TOTAL
.68
.67
.52
CORRELATIONS
TABLE 45
PAIRWISE Y2 Y7 YlO
1.00 . 68 1. 00 .49 .46 1. 00
CORRECTED ITEM-TO-TOTAL AND PAIRWISE CORRELATIONS FOR REPRESENT DIMENSION ITEMS
ITEM
Y23 Y27 Y30
ITEM-TO TOTAL
.44
.60
.45
CORRELATIONS
PAIRWISE Y23 Y27 Y30
1.00 .47 1. 00 .28 .51 1.00
Consistent with prior factor analyses, the principal components
140
technique was used with varimax rotation. For the purpose of assessing
dimensionality, the number of factors was unrestricted using the
eigenvalue equal one criteria. The factor pattern and loadings from
this analysis are depicted in Table 46.
TABLE 46
THIRD FACTOR ANALYSIS FOR THE CUSTOMER ORIENTATION MEASURE WITH NUMBER OF FACTORS UNRESTRICTED
I'ACfOR I'ACrOR 2 I'ACfOR 3 I'ACfOR 4 l'ACfOR 5 I'ACrOR6
Y13 78452 12856 20108 03151 08625 -00328
Y11 .76744 .10011 .06265 02865 20305 .17998 Y5 .72216 00093 .19754 06009 18372 09691 Y24 .71549 14627 .14768 08764 23992 .10710 Y12 .67950 .07576 .23843 00835 .13724 .11275 Y1 64344 - 01386 21213 .10649 09392 .05697 Y8 63017 03468 .20111 .12757 .03373 .13470
Y34 -04720 75644 09693 22797 -11594 .11023 Y35 .04943 .73508 .19707 22108 -11976 .11229 Y22 19525 .72455 .16303 02519 -00882 -.02279
Y29 02302 .70023 .07252 11034 .16666 00090
Y20 .00036 .69240 -00879 30476 09345 10698
Y21 .26575 .52897 .10503 -00873 -.12798 -20746
Y18 06254 49915 - 21208 .23499 .35568 06400
Y32 ' 32030 19137 .73283 06847 04729 13597
Y31 .30262 .14700 .62146 .04308 22133 26229 Y33 26369 20401 .59457 -12789 .04104 -00581 Y28 38520 10043 .57033 26039 07741 20826 Y17 49391 12456 50377 18050 06724 .18661 Y19 .28381 -12001 46921 .15098 31525 - 15768
Y6 .14181 21619 04374 78377 -.03409 .05834 Y9 13797 .17059 05856 .74204 -05898 .10760 Y14 09396 43754 00547 65895 -07623 - 02213 Y16 -01247 34337 .17417 42051 15376 -06322
Y2 24704 -00889 20806 - 05876 80621 .03214 Y7 26228 - 00495 .19580 -05201 75731 11101 Y10 40602 04982 -00907 - 03103 60454 30645
Y27 .18879 05201 20089 06624 13245 .76715 Y23 .18891 - 01240 01964 00268 .03855 76714 Y30 15724 07185 46118 .11674 .13644 59567
1-'
""" 1-'
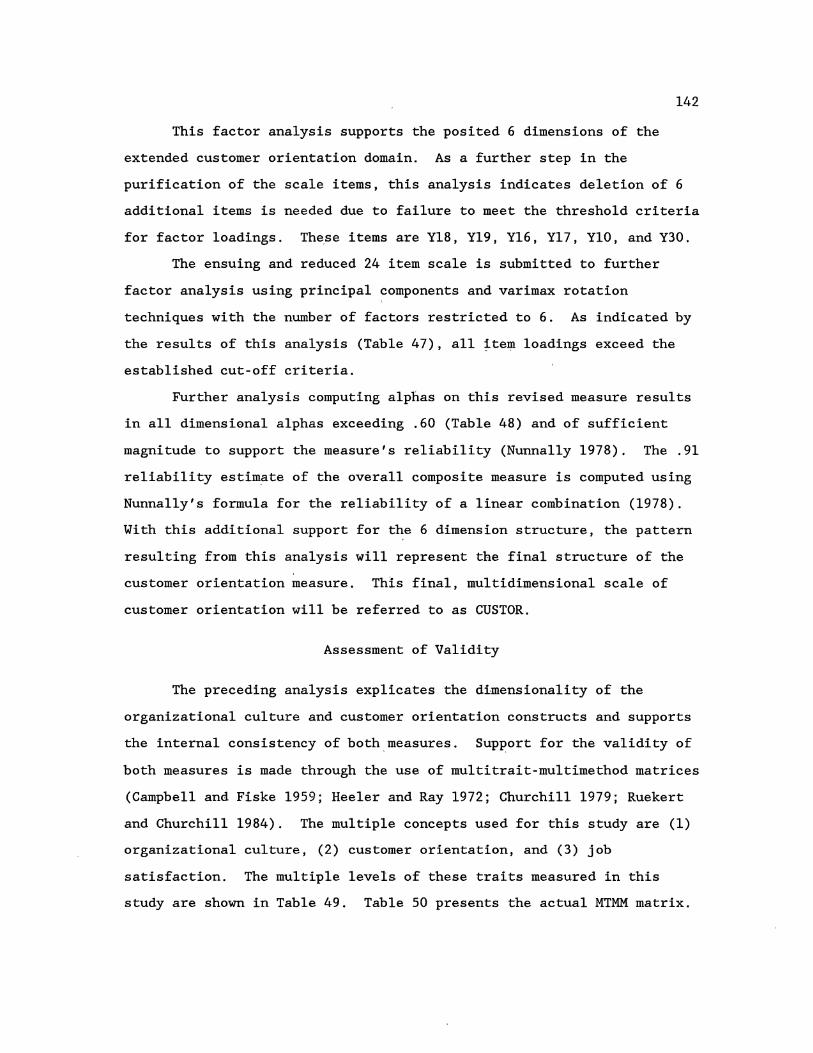
142
This factor analysis supports the posited 6 dimensions of the
extended customer orientation domain. As a further step in the
purification of the scale items, this analysis indicates deletion of 6
additional items is needed due to failure to meet the threshold criteria
for factor loadings. These items are Yl8, Yl9, Yl6, Yl7, YlO, and Y30.
The ensuing and reduced 24 item scale is submitted to further
factor analysis using principal components and varimax rotation
techniques with the number of factors restricted to 6. As indicated by
the results of this analysis (Table 47), all ~te~ loadings exceed the
established cut-off criteria.
Further analysis computing alphas on this revised measure results
in all dimensional alphas exceeding .60 (Table 48) and of sufficient
magnitude to support the measure's reliability (Nunnally 1978). The .91
reliability estimate of the overall composite measure is computed using
Nunnally's formula for the reliability of a linear combination (1978).
With this additional support for the 6 dimension structure, the pattern
resulting from this analysis will represent the final structure of the
customer orientation measure. This final, multidimensional scale of
customer orientation will be referred to as CUSTOR.
Assessment of Validity
The preceding analysis explicates the dimensionality of the
organizational culture and customer orientation constructs and supports
the internal consistency of both.measures. Sup~ort for the validity of
both measures is made through the use of multitrait-multimethod matrices
(Campbell and Fiske 1959; Heeler and Ray 1972; Churchill 1979; Ruekert
and Churchill 1984). The multiple concepts used for this study are (1)
organizational culture, (2) customer orientation, and (3) job
satisfaction. The multiple levels of these traits measured in this
study are shown in Table 49. Table 50 presents the actual MTMM matrix.
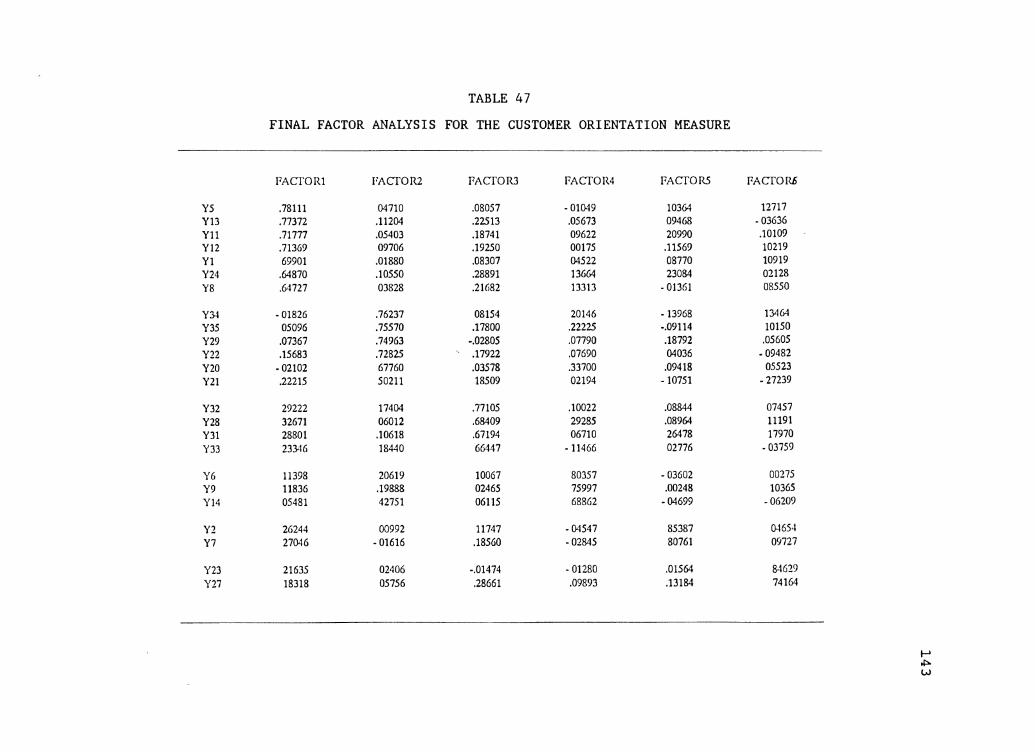
TABLE 47
FINAL FACTOR ANALYSIS FOR THE CUSTOMER ORIENTATION MEASURE
PACfOR1 FACfOR2 PACfOR3 PACfOR4 PACfOR5 PACfOR6
Y5 .78111 04710 .08057 -01049 10364 12717 Y13 .77372 .11204 .22513 .05673 09468 -03636 Yll .71777 .05403 .18741 09622 20990 .10109 Yl2 .71369 09706 .19250 00175 .11569 10219 Y1 69901 .01880 .08307 04522 08770 10919 Y24 .64870 .10550 .28891 13664 23084 02128 Y8 .64727 03828 .21682 13313 - 01361 08550
Y34 -01826 .76237 08154 20146 -13968 13464 Y35 05096 .75570 .17800 .22225 -.09114 10150 Y29 .07367 .74963 -.02805 .07790 .18792 .05605
Y22 .15683 .72825 ' .17922 .07690 04036 -09482 Y20 - 02102 67760 .03578 .33700 .09418 05523
Y21 .22215 50211 18509 02194 - 10751 -27239
Y32 29222 17404 .77105 .10022 .08844 07457 Y28 32671 06012 .68409 29285 .08964 11191 Y31 28801 .10618 .67194 06710 26478 17970 Y33 23346 18440 66447 - 11466 02776 -03759
Y6 11398 20619 10067 80357 -03602 00275 Y9 11836 .19888 02465 75997 .00248 10365 Y14 05481 42751 06115 68862 -04699 -06209
Y2 26244 00992 11747 -04547 85387 04654
Y7 27046 - 01616 .18560 -02845 80761 09727
Y23 21635 02406 -.01474 - 01280 .01564 84629 Y27 18318 05756 .28661 .09893 .13184 74164

TABLE 48
ALPHA ESTIMATES OF RELIABILITY FOR THE FINAL CUSTOMER ORIENTATION MEA$URE
DIMENSION NUMBER ALPHA OF ITEMS
NEEDS 7 .87 MANIPULATE/DECEIT 6 .82 DOUBLE-WIN 4 .76 PRESSURE 3 .76 FOLLOW-UP 2 .81 REPRESENT 2 .62 TOTAL ITEMS 24 OVERALL CUSTOR MEASURE .91
TABLE 49
CONSTRUCTS AND METHODS OF MEASUREMENT FOR THE MULTI-TRAIT MULTI-METHOD ANALYSIS OF THE SCALES FOR ORGANIZATIONAL
CULTURE, CUSTOMER ORIENTATION, AND JOB SATISFACTION
CONSTRUCT MEASUREMENT METHOD MEASUREMENT METHOD LEVEL ONE LEVEL TWO
1. ORGANIZATIONAL ORGCUL CULTYPE CULTURE
2. CUSTOMER CUSTOR SOCO ORIENTATION
3. JOB JOB ATTRIBUTES GLOBAL SATISFACTION
144
METHOD ONE:
ORGCUL
CUSTOR
JOBSATA
METHOD TWO:
CULTYPE
so co
JOBSATB
TABLE 50
MULTI-TRAIT MULTI-METHOD ANALYSIS OF THE SCALES FOR ORGANIZATIONAL CULTURE, CUSTOMER ORIENTATION, AND JOB SATISFACTION
ORGCUL
(.90)a
.33
.54
:60
.31
.54
METHOD ONE CUSTOR
(.9l)a
.24
.28
.22
JOBSATA
(.74)
.45
.20
.68
METHOD TWO CULTYPE SOCO
(--)b
.10
.45
(.87)
.17
JOBSATB
(. 85)
a The reliability for both composite measures computed using Nunnally's formula for the "reliability of linear combinations," Nunnally, J.C. (1978), Psychometric Theory, New York: McGraw-Hill Book Co.
b Denotes single item global measure.
c As an extension of the SOCO scale, ORGCUL shares 18 of 24 items with SOCO.

146
The ORGCUL measure is the final 26 item organizational culture
scale produced by this study. The CULTYPE measure is a global measure
of corporate culture adapted from the methodology used by Ouchi (1983).
As described earlier (p. 65) this·measurement method establishes two
generic scenarios with the respondents selecting the scenar~o best ' ' '
resembling their organ~zation. Correl,ations-between this categorical
measure and the other measures in the MTMM analysis are made through the
use of regression with CULTYPE entered as a dummy variable.
Furthermore, it should be noted that the CULTYPE measure is structured
to depict the po~ar extremes of the culture continuum. Consequently, in
assessing the correlation between,CULTYPE and the interval data from the
ORGCUL measu~e, ORGCUL is transformed ~o a more polar variant by using
only the lower 20 percent and upper 20 percent of responses. This
deletes the respondents in the middle, o~ the scale where a pure culture
type is non-existen~ and no correlation would be expected:
For the customer orientation construct, the CUSTOR measure is this
study's final 24 item·measu~e o£ custamer orientatian. The second
measure is Saxe and Wei~z's, (1982) 24 item SOCO measure. As ORGCUL is
an extension of the SOCO mea~ure, the scales share 18 of their 24 items
in common.
The matrix trait of job sat~sfaction is assessed through two
different levels of measures. JOBSATA is a seven item measure made at
the individual job attribute level while the JOBSATB measure consists of
three items at the more generalize~ overall level o£ job satisf~ction.
Items in both scales are ,taken from prior work by-Hackman and Oldham
(1975) and Du~insky and Skinner (1984).
Convergent Validity
Examination of the validity diagonal of the MTMM matrix (Table 50)
indicates strong convergent val~dity. The measures of organizational
culture converge with a correlation of .60; the measu~es of customer
147
orientation correlate at .94; and the two measures of job satisfaction
correlate at .68. This level of correlation lends support to the
position that they are measuring the same construct.
Discriminant Validity.
The MTMM also supports the discriminat:tt validity of the measures.
The convergent validities are consistently larger than the correlations
of different traits measured by the same and by different methods. The
correlation between both job satisfaction measures and both
organizational culture measures are in the low .SO's. Althaugh this
correlation is high, the convergent correlations in the validity
diagonal are higher. These relatively high discriminant correlations
could also be predi~ted, as the literature posits a strong relationship
between organizational culture and job satisfaction. Consequently,
these high correlation scores can be represented as depicting the close
correlation associated with these two constructs rather than clouding
the discriminant validity of the organizational culture measures.
Construct Validity.
Examination of the MTMM matrix also reveals a high level of
congruity in the pattern of correlations between the different
constructs measured by both monomethod and multimethods. This
consistency in pattern lends support for the existence of construct
validity. Having addressed these basic forms of validity successfully,
the next step in evaluating the scales is to address the issue of
nomological validity by testing the measures of the organizational
culture and customer orientation constructs with ather constructs to see
if accepted and expected relationships hold true.
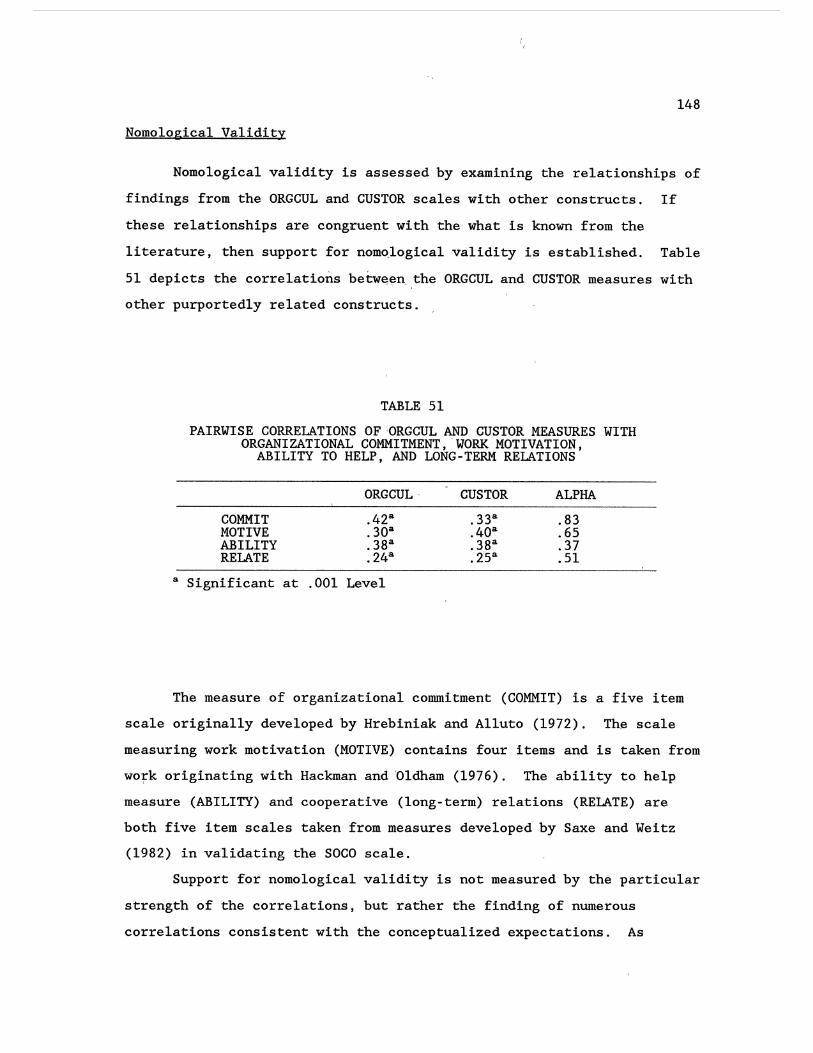
( I
148
Nomological Validity
Nomological validity is assessed by examining the relationships of
findings from the ORGCUL and CUSTOR scales with other constructs. If
these relationships are congruent with the what is known from the
literature, then support for nom~logical validity is established. Table
51 depicts the correlations betwe,~n_ ,the ORGCUL and CUSTOR measures with
other purportedly related constructs. ,
TABLE 51
PAIRWISE CORRELATIONS OF,ORGCUL AND CUSTOR MEASURES WITH ORGANIZATIONAL COMMITMENT, ·woRK MOTIVATION,
ABILITY TO HELP, AND LONG-TERM RELATIONS
ORGCUL- CUSTOR ALPHA
COMMIT .42a .33a .83 MOTIVE .3oa .40a .65 ABILITY .38a .38a .37 RELATE .24a .2'5a .51
a Significant at .001 Level
The measure of organi2:ational commitment (COMMIT) is a five item
scale originally developed by Hrebiniak and Alluto (1972). The scale
measuring work motivation (MOTIVE) contains four items and is taken from
wo~k originating with Hackman and 'Oldham (1976). The ability to help
measure (ABILITY) and cooperative (long-term) relations (RELATE) are
both five item scales taken from measures developed by Saxe and Weitz
(1982) in validating the SOCO scale.
Support for nomological validity is not measured by the particular
strength of the correlations, but rather the finding of numerous
correlations consistent with the conceptualized expectations. As
149
illustrated in Table 51, each of the posited relationships with the
organizational culture and customer orientation constructs is
statistically significant, giving support for the romological validity
of both constructs.·
Although validity can never be proven, establishing support for
the validity of a measure is seen as a cumulative process requiring
support for (1) convergent validity, ('2) discriminant validity,
(3) construct validity, and finally, (4) nomological validity. The
findings of t~is study provide p~sitive support for each progressive
stage of validity leading to the conclusion .that both measures evidence
sufficient reliability and validity for use in further research.
CHAPTER V
RESEARCH FINDINGS: TESTS OF HYPOTHESES
Beyond the development of measures for the organizational culture
construct and the extended domain of customer orientation, this study
embraces a third objective (pp. 50-53): the investigation of the
posited rela~ionship (pp. 47-49) between organizational culture and
customer orientation. Although positing a relationship between the
constructs of arganizational culture and customer orientation, this
study has not developed specific hypotheses pending the explication of
organizational culture '·s dimensionality. Having established support for
a seven dimension model of organizational culture (p. 127), this study
now proceeds to develop and test specific hypotheses describing the
posited relationship between the two constructs.
In the course of developing eight specific hypotheses delineating
the relationship between organizational culture and customer
orientation, this chapter also relates the characteristics of Ouchi's
bureaucratic and clan 'typologies of organizational culture to the seven
dimensions and measure (ORGCUL) of ~rganizational culture'developed in
the preceding chapter. The first hypothesis sets forth the construct to
construct relationship. The remaining seven hypotheses examine more
specific relationships between the individual dimensions of
organizational culture and the customer orientation canstruct.
Following the development of the eight hypo·theses, this chapter
describes the results of univariate and multiple regressian analyses
testing each of the subject hypotheses.
150
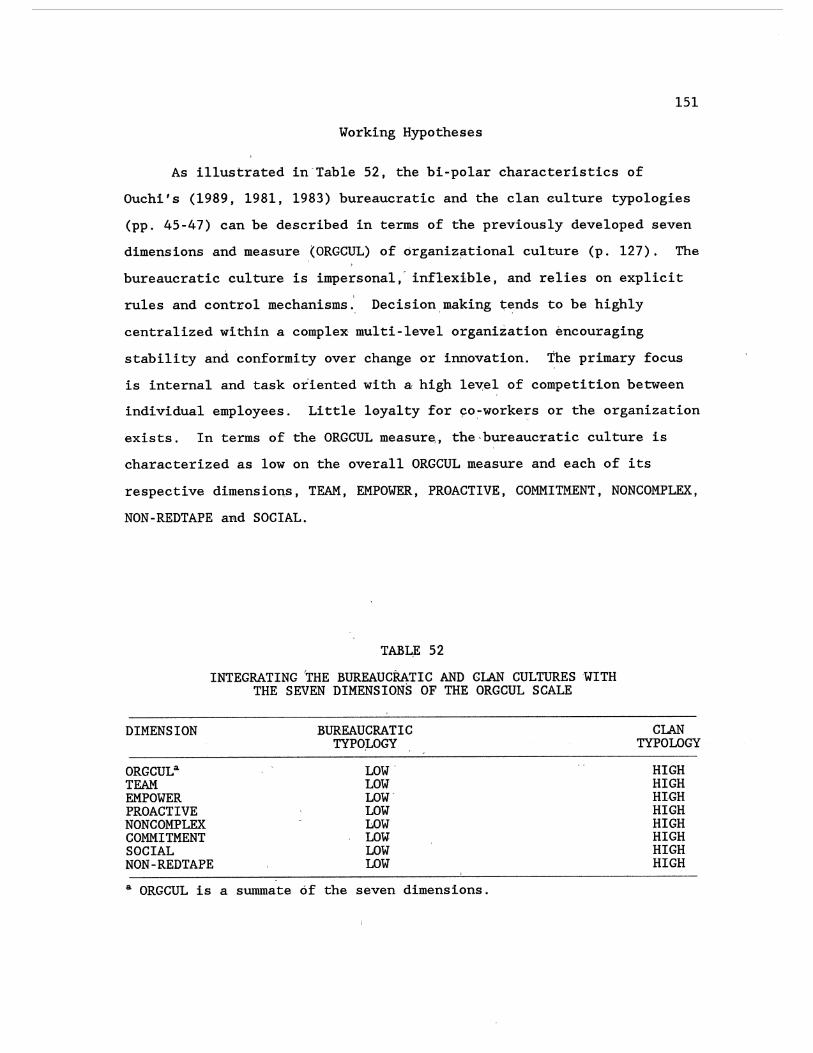
151
Working Hypotheses
As illustrated in-Table 52, the bi-polar characteristics of
Ouchi's (1989, 1981, 1983) bureaucratic and the clan eulture typologies
(pp. 45-47) can be described in terms of the previously developed seven
dimensions and measure (ORGCUL) of organiz~tional culture (p. 127). The
bureaucratic culture is impersonal,- inflexible, and relies on explicit
rules and control mechanisms.' Decision,making t;:~nds to be highly
centralized within a comple~ multi-level organization encouraging
stability and conformity over change or innovation. ~he primary focus
is internal and task oriented with a high le~el of competition between
individual employees. Little layalty for ~o.·workers or the organization
exists. In terms of the ORGCUL meas~r~, the·bureaucratic culture is
characterized as low on the overall ORGCUL measure and each of its
respective dimensions, TEAM, EMPOWER, PROACTIVE, COMMITMENT, NONCOMPLEX,
NON-REDTAPE amd SOCIAL.
TAB!$ 52
INTEGRATING 'THE BUREAUCRATIC AND GLAN CULTURES WITH THE SEVEN DIMENSIONS OF THE ORGCUL SCALE
DIMENSION
ORGCULa TEAM EMPOWER PROACTIVE NON COMPLEX COMMITMENT SOCIAL NON-REDTAPE
BUREAUCRATIC TYPO .LOGY
LOW' LOW LOw-LOW LOW LOW: LOW LOW
a ORGCUL is a summate of the seven dimensions.
CLAN TYPOLOGY
HIGH HIGH HIGH HIGH HIGH HIGH HIGH HIGH

152
At the other bi-polar extreme, the clan typology is describes as
flexible, adaptive, and controlled through the cooperation, loyalty, and
mutual trust for one another and the organization. Control systems are
based on socialization and the internalization of norms of mutual
interest. The high levels of goal congruity and informal controls
emphasize respect for the i~dividual employee over task and
organizational structures tend to be simple and efficient. An external
focus encourages innovation for adapting to changes and decision making
tends to be decentralized and participa~ive in nature. Expressed in
terms of the ORGCUL scale's seve~ dimensions, the.clan culture typology
is characterized as scoring high on the summated ORGCUL measure and each
of the individual dimensions, TEAM, EMPOWE~, PROACTIVE, COMMITMENT,
NONCOMPLEX, SOCIAL and NON-REDTAPE.
Hypothesized Construct to Construct Relationship
The posited antecedent relationship between organizational culture
and customer orientation is based on characteristics of each construct
(pp. 47-48 and 51-53). As discussed by Saxe and Weitz (1982), customer
orientation is a long-term strategy often requiring the salesperson to
forgo self-interest and sho~t-term gains in favor of building a long
term relationship based on mutual satisfaction. Organizational cultures
reflecting the bureaucratic typology (pp. 45-47) are characterized as
encouraging organizational members to emphasize self-interest over the
group or organizational goals (pp. 46 and 52). This is primarily due to
relationships within the bureaucratic culture being negotiated ,and
contractual in nature, hence promoting independence and individuality.
The resulting lpw levels of goal congruity will foster self-interest
driven behaviors. Within this culture, increased rewards are exchanged
for increased performance as each party--the in~ividual employee, the
customer, and the organization--vie to use each other as a means for
furthering their own interests. This increase in self-interest driven
153
behavior will result in a concurrent decrease in customer oriented
behavior.
The antithesis to this decrease in customer oriented behavior will
occur under the environmental influence of a culture possessing
characteristics weighted toward the clan typology (pp. 47, 48 and 52).
The high degree of social interrelationships, communication, and goal
congruity are more conducive to the creation and maintenance of customer
oriented behaviors.· The strong mutual commitment operating in the clan
culture is based on mutual interests resulting in higher levels of
intrinsic motivat,ion and longer-term behaviors direc.ted at mutual gain
and satisfaction rather than self-interest. In this manner,
organizations tending toward the clan typology will have a positive
influence on the degree of the customer oriented behavior of
salespeople. Stated in Alternative Hypo'thesis form:
Hypothesis 1: The higher the level of perceived clan organizational culture, the higher will be the level of salespersons' customer oriented behavior.
Hypothesized Relationships between Organizational
Culture Dimensions and the Customer
Orientation Construct
Having explicated the dimensions of the organizational culture and
customer orientation censtructs, further understanding of the
relationship between the constructs can be acquired through the
generation and testing of more specific hypotheses relati~g to the
influence of the individual dimensions of organizational culture on the
customer oriented behavior of salespeople. This will allow testing
Parasuraman's (1985) conceptualization of a "cus·tomer oriented culture"
and provide valuable insight, understanding, and normative guidance for
practitioners desiring to create, increase, and/or maint~in customer
oriented behavior within their sales forces.
154
Marketing scholars (Parasuraman and Deshpande 1984; Deshpande and
Parasuraman 1984; and Parasuraman 1985 and 1987) conceptualize a
specific type of organizational culture that would exhibit a positive
influence on performance of the marketing function of the organization,
As conceptualized, this "customer oriented culture" would exhibit (1) a
focus external to the firm emphasizing a common dedication to customer
satisfaction; (2) flexibility in process and response through empow
erment of the member; (3) creativity in generating relevant solutions to
customer problems; and (4) a sincere respect for employees and co
workers. These conceptualizations of a customer oriented culture's
characteristics bear a high similarity to Ouchi's (1980, 1981) clan
culture typology. Furthermore, these purported customer oriented
culture characteristics bear a close correspondence to this study's
dimensions of organizational culture.
TEAM and COMMITMENT
Customer oriented behavior is typified as being understanding
rather than as manipulative. Founded on the premise of building
increased value through discovering and satisfying customer needs,
customer oriented behavior is long term in nature and directed toward
building relationships. This style of behavior is reinforced through a
high level of goal congruity within the group and equity of rewards
based on overall accomplishments of the organizational goals. These
characteristics, and hence customer oriented behavior, will be enhanced
and supported in an environment sanctioning cooperation and loyalty
among fellow workers as opposed to competition. Furthermore, a long
term orientation and opportunity costs are inherent in customer oriented
selling behavior. Accordingly, customer oriented behavior will result
from intrinsic rather than extrinsic motivation and commitment, and an
environment supportive of intrinsic motivation and commitment will have
a positive influence upon customer oriented behavior. Rather than the
155
competitive environment resulting from a bureaucratic structure and its
extrinsic motivation, the clan culture will stimulate customer
orientation through arousing a spirit of cooperation and loyalty among
the members and increased intrinsic commitment. Stated in Alternative
Hypothesis form:
Hypothesis 2:
Hypothesis 3:
The higher the perceived emphasis on cooperation and. loyalty .within the workgroup, the higher the customer oriented behavior of the salesperson.
The higher the perceived intrinsic commitment of the workgroup, the higher the customer oriented behavior of the salesperson.
NON-REDTAPE. EMPOWER. and NONCOMPLEX
The characteristics of the b~reaucratic culture stem from the
contractual nature of the relationship--it is negotiated with terms and
specific roles set out in advance. This contractual nature may be
either explicit or implicit, nevertheless the result is a rigid set of
rules and controls that favors the predictability of a stable
environment rather than innovation. Its natural focus is on internal
details with an emphasis on output and results. This internal orienta
tion encourages centralized decision making and a complex multilevel
organization. The very nature of this bureaucratic relationship
stresses short-term results and will discourage adaptiveness and
innovation resulting in lower levels of long-term--adaptive in nature--
customer orientation.
The clan form of culture will exhibit the opposite organizational
characteristics from the bureauc~atic form. The clan relationship is
founded on mutual commitment resulting from the socialization and
norming process of the group. The orientation is external to the firm
and the tasks being performed. The resulting feeling of obligation is
more social and interpersonal resulting· in a trust that can more readily
accept and deal with change and innovation. Control is accomplished
through interrelationships, pride, and goal congruence, rather than
156
through monitoring and application of rules. Consequently there is an
evolution toward a flatter and less complex organization with
decentralized and participatory decision making. Change is anticipated
and planned for--individuals are empowered to adapt to these changing
situations by making and implementing innovative. decisions and
strategies. As customer orientation requires adaptability and change,
the levels of customer orientation levels will be higher under these
more conducive conditions. Stated in Alternative Hypothesis form:
Hypothesis 4:
Hypothesis 5:
Hypothesis 6:
The greater the perceived external orientation of the organization, .the higher the customer oriented behavior of the salesperson.
The less complex the perceived structure of the organization, the higher the customer oriented behavior of the salesperson.
The more participative and decentralized the decision making process is perceived, the higher the customer oriented behavior of the salesperson.
SOCIAL and PROACTIVE
The bureaucratic culture by nature tends to be task oriented
(emphasis is on job requirements over respect for the individual) due to
the negotiated contractual nature of the relationship. This focus on
task results, at the exclusion of process and social interaction, will
have a negative impact on the level of customer oriented behavior.
Furthermore, the bureaucratic form of culture enforces conformity and
safety through adherence to established rules and procedures, conse
quently reducing risk taking, through innovation and change. Customer
oriented behavior requires flexibility to respond to a wide assortment
of situations. Hence an emphasis on safety and stability over
innovation and change will reduce the variety of responses available to
the salesperson and is posited to lower customer oriented behavior
levels in salespeople.
On the other hand, the group characteristics of norms, roles, and
congruencies that dominate the clan form of culture will more inherently
157
encourage and translate into the social interactions and innovation
required to meet the dynamic needs characteristic of adaptive, customer
oriented strategies. The adaptive responses required to meet the
variety of situations characterizing a customer orientation require an
allowance for risk taking and empowerment of the individual to exercise
innovative and discretionary behaviors. Accordingly, cultures
characterized by (1) higher social and interpersonal orientations, and
(2) an emphasis on innovative solutions and systematic change will favor
higher levels of customer orientation and typify the customer oriented
culture. Stated in Alternative Hypothesis form:
Hypothesis 7:
Hypothesis 8:
The higher the respect for the individual member and interpersonal orientation of the organization, the higher the customer oriented behavior of the salesperson.
The higher the perceived emphasis on systematic innovation and change by the organization, the higher the customer oriented behavior of the salesperson.
Tests of Hypotheses
Hypotheses are tested using data from this study's third data
collection, the field survey (pp. 74~76), using the final measures
developed for the study of organizational culture (ORGGUL) as
independent variables and the customer orientation construct (CUSTOR) as
the dependent variable. This field survey data includes responses from
344 salespeople (pp. 74-76). The methods of analysis used in testing
the hypotheses include both univartat~ and multiple regression.
Following a descriptive summary of the, data, findings for the
tests of hypotheses are presented in three parts. First, the findings
for the univariate relationship between summated constructs (Hypothesis
1) are presented. Second, the findings for the univariate relationships
between the individual dimensions of organizational culture and the
customer orientation construct (Hypotheses 2-8) are examined. The third
section discusses the findings of the overall multiple regression
equation between the seven dimensions of organizational culture and
customer orientation.
Description of Data
158
Scores measuring the two composite scales and each of the
dimensional sub-scales are the mean"average summates of the items making
up each scale. The individual items making up each scale are first
summed together and then divided by the number of items making up that
particular scale. Scale items for the organizational culture measure
are designed with a seven anchor point design with higher values
representing higher levels of each dimension. Higher levels for the
composite scale indicate a clan oriented culture with lower levels
signifying a bure~ucratic culture. ~ollowing Saxe and Weitz's (1982)
example dealing with ceiling effects found in developing the SOCO scale,
items composing the cus·tomer orie~tation measure are formatted on a nine
anchor point design. Higher scores depict higher levels of customer
orientation with lower scores being indicative mf lower levels of
customer orientation. Table 53 summarizes number of items, means,
standard deviation, range, minim~, and maximum values for each scale.
Examination of frequency distributions for each scale evidences
that responses to organizational culture items are well distributed
across the seven scale data points and about the scale mid-point of 4.
The distribution of the responses on the customer orientation (CUSTOR)
scale, however, exhibits a skewness toward the higher level similar to
that found by ~axe and Weitz (1982) in developing the SOCO scale. This
skewness is possibly the result of fewer sales people possessing low
levels of customer orientation being included in the field sample or
perhaps a positive bias resulting from the salespeople rating
themselves. An additional ~xplanation wou~d provide support for the
study's findings being indicative of reality, as salespeople with low
levels of customer orientation would be expected to self-select out of
159
the selling profession. As a result, the remaining active salespeople
would exhibit the skewed levels of customer orientation such as that
found in both this study and the Saxe and Weitz (1982) study.
TABLE 53
SUMMARY DATA DESCRIPTION,
NO. MEAN SCALE ITEMS SCORES ST. DEV. RANGE MIN. MAX.
ORGANIZATIONAL CULTURE: ORGCUL 26 4.33 .70 3.82 2.33 6.15 TEAM 5 4.95 1.18 5.80 1.20 7.00 EMPOWER 5 5.01 1.12 6.00 1.00 7.00 PROACTIVE 4 4.64 1.05 5.75 1.25 7.00 NON COMPLEX 3 3.69 1.41 6.00 1.00 7.00 COMMITMENT 3 4.53 1.30 6.00 1.00 7.00 SOCIAL 3 3.67 1.29 6.00 1.00 7.00 NON-REDTAPE 3 3.82 1.28 6.00 1.00 7.00
CUSTOMER ORIENTATIQN: CUSTOR 24 7.00 .95 5',04 3.96 9.00 NEEDS 7 7. 72 1.10 6.57 2.43 9.00 MANIP/DEC 6 7.13 1.56 8.00 1.00 9.00 DOUBLE-WIN 4 8.07 .98 5.25 3.75 9.00 PRESSURE 3 6.19 1.93 8.00 1.00 9.00 FOLLOW-UP 2 7.15 1.69 8.00 1.00 9.00 REPRESENT 2 5.79 1.99 8.00 1.00 9.00
Construct to Consxruct Relationship
Hypothesis 1: The higher the level of perceived clan organizational cultu~e (ORGCUL), the higher will be the level of salesperson customer oriented behavior (CUSTOR).
Stated in the form of an Alternate Hypothesis, this first
hypothesis postulates that organizational cultures approximating higher
levels of characteristics common to the clan culture type will generate
160
higher levels of customer orientation. The results of the regression
analysis testing this first hypothesis are given in Table 54. The
summated measure of organizational culture, the ORGCUL scale is the
independent variable with the summate of the CUSTOR customer orientation
measure being the dependent variable, As specified earlier, higher
scores on the ORGCUL scale typify a clan culture orientation while lower
scores characterize a bureaucratic culture orientation. In a comparable
convention, higher scores on the CUSTOR scale signal higher levels of
customer orientation.
As illustrated in Table 54, this study finds support for the
conceptualized relationship between organizational culture and customer
orientation (Hypothesis 1), in that a statistically significant
relationship (F=27.99; p<.OOOO) is found between the two constructs.
The R2 value for this construct to construct equation indicates
explained variation in the customer orientation variable of 09.1
percent. Additionally, the direction of the relationship, as noted by
the sign of the correlation coefficient is positive, matching the
original conceptualization.
TABLE 54
REGRESSION ANALYSIS OF ORGANIZATIONAL CULTURE WITH CUSTOMER,ORIENTATION
CONSTANT STD. BETA F PROB. F
5.24 + .301 27.99 .0000 .091
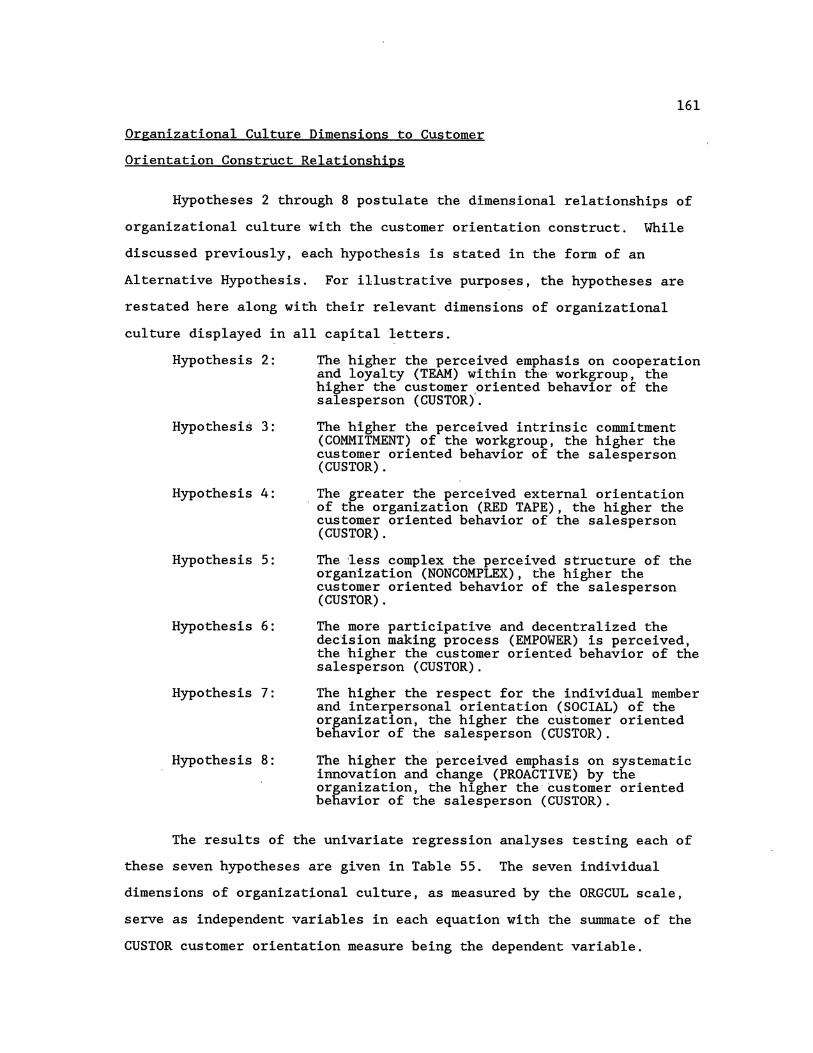
161
Organizational Culture Dimensions to Customer
Orientation Construct Relationships
Hypotheses 2 through 8 postulate the dimensional relationships of
organizational culture with the customer orientation construct. While
discussed previously, each hypothesis is stated in the form of an
Alternative Hypothesis. For illustrative purpos~s, the hypotheses are
restated here along with their relevant dimensions of organizational
culture displayed in all capital 'letters.
Hypothesis 2:
Hypothesis 3:
Hypothesis 4:
Hypothesis 5:
Hypothesis 6:
Hypothesis 7:
Hypothesis 8:
rhe higher the perceived emphasis on cooperation and loyalty (TEAM) within the· workgroup, the higher the customer ,oriented behavior of the salesperson (CUSTOR).
The higher the perceived intrinsic commitment (COMMITMENT) of the workgroup, the higher the customer oriented behavior of the salesperson (CUSTOR).
The greater the perceived external orientation of the organization (RED TAPE), the higher the customer oriented behavior of the salesperson (CUSTOR).
The ·less complex the perceived structure of the orgarrization (NONCOMPLEX), the higher the customer oriented behavior of the salesperson (CUSTOR).
The more participative and decentralized the decision making process (EMPOWER) is perceived, the higher the customer oriented behavior of the salesperson (CUSTOR).
The higher the respect for the individual member and interpersonal orientation (SOCIAL) of the organization, the higher the customer oriented behavior of the salesperson (CUSTOR).
The higher the percei¥ed emphasis on systematic innovation and change (PROACTIVE) by the organization, the higher the·customer oriented behavior of the salesperson (CUSTOR).
The results of the univariate regression analyses testing each of
these seven hypotheses are given in Table 55. The seven individual
dimensions of organizat~onal culture, as measured by the ORGCUL scale,
serve as independent variables in each equation with the summate of the
CUSTOR customer orientation measure being the dependent variable.
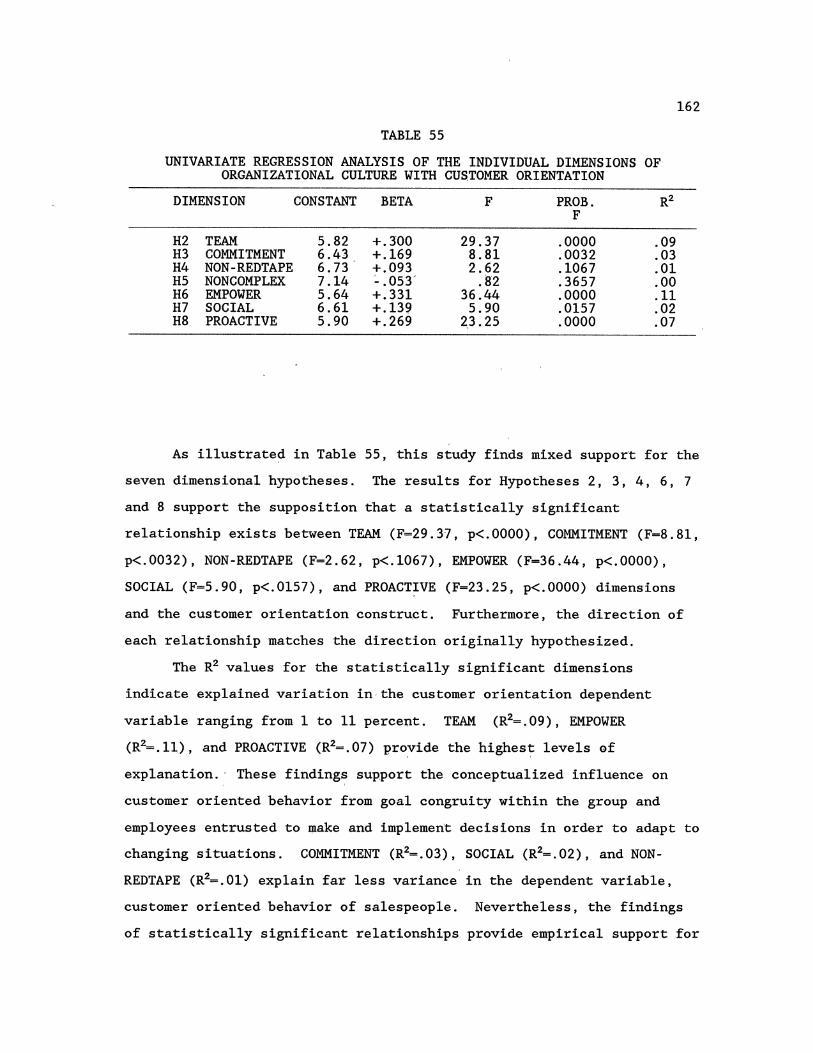
162
TABLE 55
UNIVARIATE REGRESSION ANALYSIS OF THE INDIVIDUAL DIMENSIONS OF ORGANIZATIONAL CULTURE WITH CUSTOMER ORIENTATION
DIMENSION CONSTANT BETA F PROB. R2 F
H2 TEAM 5.82 +.3'00 29.37 .0000 .09 H3 COMMITMENT 6.43 +.169 8.81 .0032 .03 H4 NON-REDTAPE 6.73 +.093 2.62 .1067 .01 H5 NON COMPLEX 7.14 :. .053' .82 .3657 .00 H6 EMPOWER 5.64 +.331 36.44 .0000 .11 H7 SOCIAL 6.61 +.139 5.90 .0157 .02 H8 PROACTIVE 5.90 +.269 2,3.25 .0000 .07
As illustrated in Table 55, this study finds mixed suppor't for the
seven dimensional hypotheses. The results for Hypotheses 2, 3, 4, 6, 7
and 8 support the supposition that a statistically significant
relationship exists between TEAM (F=29.31, p<.OOOO), COMMITMENT (F=8.81,
p<.0032), NON-REDTAPE (F=2.62, p<.l067), EMPOWER (F=36.44, p<.OOOO),
SOCIAL (F=5.90, p<.0157), and PROACT~VE (F=23.25, p<.OOOO) dimensions
and the customer orientation construct. Furthermore, the direction of
each relationship matches the direction originally hypothesized.
The R2 values for the statistically significant dimensions
indicate explained variation in·the customer orientation dependent
variable ranging from 1 to 11 percent. TEAM (R2=.09), EMPOWER
(R2=.11), and PROACTIVE (R2=.07) pro~ide the highes~ levels af
explanation. · These findings support the conc~ptualized influence on
customer oriented behavior from goal congruity within the group and
employees entrusted to ~ake and implement decisions in order to adapt to
changing situations. COMMITMENT (R2-.03), SOCIAL (R2=.02), and NON
REDTAPE (R2=.01) explafn far less variance in the dependent variable,
customer oriented behavior of salespeaple. Nevertheless, the findings
of statistically significant relationships provide empirical support for
163
the influential nature of intrinsic over extrinsic commitment to the
organization, imparting consideration and respect for the needs of the
individual over the accomplishment of the task, and maintaining an
external focus in order to monitor and change strategies in changing
environment. These characteristics translate into the social
interactions, along with the discretionary and innovative behaviors,
required to respond and adapt to the variety of si'tuations
characterizing a customer orientation. As such, these findings of
significant relationships provide management with meaningful normative
guidelines for designing, implementing, and sustaining the proper
organizational culture for high levels of customer orientation.
No support is found for Hypothesis 5 (F=0.82, p<.3657). This
hypothesis posited a relationship between the complexity of an
organization's structure and the customer oriented behavior of
salespeople. This failure to find a significant relationship between
the level of complexity of an organization's structure and the customer
oriented behavior of salespeople is most likely a direct result of the
nature of the selling job. Salespeople tend to operate out and away
from the actual organization itself. Often operating independently or
out of a small sales office, many sale,speople would have little actual
direct contact with the organizational hierarchy and thus see it as no
hinderance to their indi~idual behavior. An additional alternative
explanation could simply be that salespeople have developed their own
informal and more productive paths around any inefficiencies that might
result from multiple departments and authority. As discussed by Luthens
(1992, p. 525), tall and more complex structures can offer more
opportunity for personal contact between superiors and subordinates.
This contact is often presumed to be negative and conflicting,
nevertheless, it could also be positive and productive.
Taken together, this observation by Luthens (1992) and the initial
findings from this exploratory study raise some question regarding the
164
proper inclusion of the NONCOMPLEXITY dimension within the domain of
customer orientation. This question is further advanced by the lack of
statistically significant pairwise correlation between the measure of
the NONCOMPLEXITY dimension and the other dimensions of organizational
culture. As illustrated in Table 58, the only statistically significant
relationship for NONCOMPLEXITY is with the NON-REDTAPE dimension. This
lack of correlation results in a low corrected item-to-total correlation
with the ORGCUL measure of .044. Nevertheless, due to the support in
the literature for this dimension of organizational complexity (or
noncomplexity) being included in the domain of organizational
environment (Campbell et al. 1970; Reynolds 1986), this study continues
to include this dimension in further analysis. This remains consistent
with the literature and can only constrain this study or affect findings
in a conservative direction.
Multiple Re&ression Analysis
A third regression analysis utilizing multiple regression was
conducted for two purposes. The first. objective of this additional
analysis was to derive a better estimate of the strength of the
relationship between organizational culture and customer orientation
than was derived from the first analysis testing Hypothesis 1. The test
of the construct to censtruct relationship indicates that organizational
culture explains 09.1 percent of the variance in the level of
salespersons' level of customer'orientation. Nevertheless, the mixed
findings resulting from the univariate dimensional regression analyses
indicate that a better assessment of the relationship's nature and
strength could possibly result from using only the statistically
significant dimensions of organizational culture as independent
variables as compared to using the full summated measure. The inclusion
of marginal (ie. SOCIAL (F=5.90, p<.0157, R2=.02), COMMITMENT (F=8.81,
p<.0032, R2=.03), and NON-REDTAPE (F=2.62, p<.l067, R2=.01)) or non-
165
significant variables (ie. NONCOMPLEX [F=0.82, p<.365.7]), can result in
a biased estimate of the relationship (Schroeder, Sjoquist, and Stephan
1986, pp. 67-68). Consequently, multiple regression using only the
relevant and statistically significant dimensions of organizational
culture should provide an u~biased and thus better assessment of the
actual relationship.
The second purpose of this additional analysis directly addresses
the primary research question driving this study: "How does a firm
create and sustain a customer orientation?" (p. 11). In accomplishing
this purpose, multiple regression analysis is used to derive an overall
equation of customer orientation as explained by the relevant dimensions
of organizational culture. Use of the standardized beta coefficients
from the resulting equation will facilitate direct comparison in <,
determining the relative strength or importance of the dimensions of
organizational culture relevant to forming and maintaining customer
oriented behaviors in a sales force.
This analysis utilizes a step-wise multiple regression technique
with forward variable entry. The probability of F to enter criteria
(PIN) was set at 0.10 and the probability af F to stay in (POUT) was set
at 0.11. As evidenced by the results summarized in Table 56, this
forward, stepwise, multiple regression analysis allows only the
dimensions of EMPOWER and TEAM to enter the equation.
The results of this analysis indicate that the more parsimonious
equation consisting of only'the TEAM and EMPOWER dimensioi:J.s explains
more variance (R2=.134) in customer orientation than does the summate to
summate equation (R2=.091). The summate to summate equation includes
the nonsignificant NONCOMPLEX (F=O. 8·2, p<. 3657) dimension and.
significant, but potentially irrelevant dimensions of SOCIAL (F=5.90,
p<.0157, R2=.02), COMMITMENT (F=8.81, p<.0032, R2=.03), and NON-REDTAPE
(F=2.62, p<:l067, R2=.01)). Consequently, the trimmed equation shows a
better fit with the data. Nevertheless, the failure of the
166
statistically significant PROACTIVE dimension (F=23.25, p<.OOOO, R2=.07)
to enter the overall equation presents a need for further understanding
and analysis to investigate the PROACTIVE dimension as a potential
relevant variable.
TABLE 56
FORWARD STEP-WISE MULTIPLE REGRESSION ANALYSIS OF THE INDIVIDUAL DIMENSIONS OF ORGANIZATIONAL CULTURE
WITH CUSTOMER ORIENTATIONa
DIMENSIONS STND BETA
VARIABLES ENTERING THE EQUATION: EMPOWER +.243 TEAM +.162
CONSTANT R2 ADJ. R2
F PROB. F
5.376 .134 .128
21.6.67 .0000
a Probability of F to enter set at 0.10. Probability ofF to stay in set at 0.11
t
3.32 2.25
SIG. t
.0008
.0253
For verification of the two variable equation resulting from the
preceding stepwise, forward, multiple regression analysis, additional
multiple regression analysis was performed entering each of the seven
dimensions of organizational culture as independent variables and the
summate of customer orientation as the dependent variable. This
verification was conducted in order to check for any possible failure of
variables to enter the forward, stepwise analysis due to order of entry.
As illustrated in Table 57, this subsequent analysis supports the
findings from the earlier forward stepwise analysis with only the
EMPOWER and TEAM variables exhibiting a statistical significant
relationship with customer orientation.
TABLE 57
FORCED ENTRY MULTIPLE REGRESSION ANALYSIS OF THE INDIVIDUAL DIMENSIONS OF ORGANIZATIONAL CULTURE
WITH CUSTOMER ORIENTATIONa
DIMENSIONS STND t BETA
NON-REDTAPE +.030 .488 PROACTIVE +.088 1.303 SOCIAL +.059 1.001 NON COMPLEX -.080 -1.372 COMMITMENT -.036 - .523 TEAM +.143 1.883 EMPOWER +.209 2.674
CONSTANT 5.293 R2 .150 ADJ. R2 .128 F 6.193 PROB. F .0000
SIG. t
.6262
.1936
.3178
.1712
.6014
.0608
.0080
167
The results of this multiple regression analysis provide further
support for using the more parsimonious two variable equation as a
predictor of sale~person cus·tomer oriented beha~ior. Nonetheless, some
question remains regarding the inclusion or exclusion of PROACTIVE as a
relevant variable. PROACTIVE, along with the failure of the three
weaker relationship variables of SOCIAL, COMMITMENT, and NON-REDTAPE,
fail to enter into the multiple regression equation as statistically
significant variables. Although each of these variables exhibit a
statistically significant relationship using univariate analysis, their
failure to enter the multiple regression analysis results from
interrelationships between the independent variables (Table 58). As a
168
result of these intercorrelations, portions of the influence on CUSTOR
from PROACTIVE, SOCIAL, COMMITMENT and NON-REDTAPE is being absorbed and
accounted for by the stronger variables, EMPOWER and TEAM. Working
toward maintaining the integrity of independence between independent
variables, orthogonal factor analysis (varimax rotation) was utilized to
develop the initial construct dimensions (Hair et al., 1992, pp. 236-
237). Nonetheless, as is often the case in social science research,
statistically significant relationships remain between the independent
variables (Schroeder, Sjoquist, and Stephan 1986, pp. 71-72).
TABLE 58
PAIRWISE CORRELATIONS BETWEEN INDEPENDENT VARIABLES
1. 2. 3. 4. 5. 6. 7 . 8.
1. TEAM .1.00 2. EMPOWER .62a 1.00 3. PROACTIVE .47a .soa 1.00 4. COMMITMENT .49a .4r .43a 1.00 5. SOCIAL .13 .16b .14b .11 1.00 6. NON COMPLEX - .02 -.05 -.06 -. 01 1.00 7. NON-REDTAPE .17b .24a .08 .15b .22a .29a 1.00 8. ORGCUL .69a . na .61a .64a .45a .33a .56a 1.00
a Significant at .001 b Significant at .010
Due to the relatively strong correlations between the four
dimensions of TEAM, EMPOWER, PROACTIVE, and COMMITMENT, an examination
of potential multicollinearity was conducted through the computation of
(1) the tolerance and (2) variance inflation factor (VIF) for each of
the more highly correlated variables. In testing for multicollinearity,
Hair et al. (1992, pp. 48-49 and 73-75) identify the commonly accepted
cutoff thresholds as a tolerance level of 0.10 and VIF levels of 10.
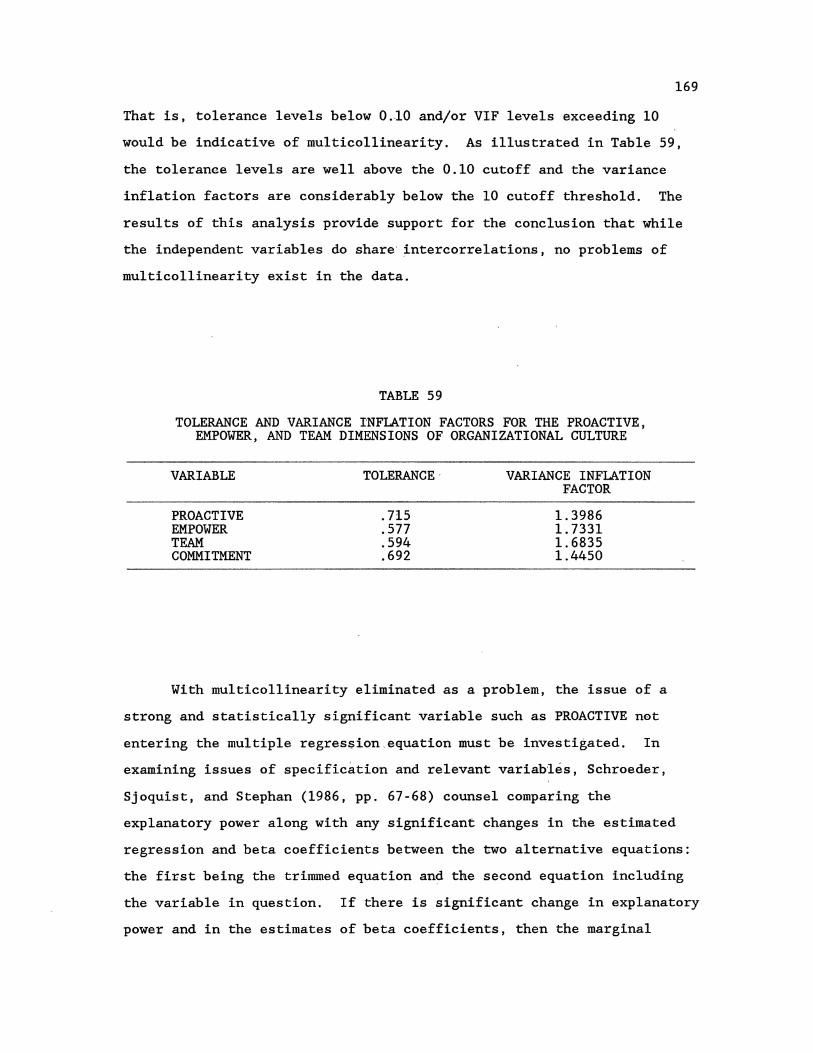
169
That is, tolerance levels below 0.-10 and/or VIF levels exceeding 10
would be indicative of multicollinearity. As illustrated in Table 59,
the tolerance levels are well above the 0.10 cutoff and the variance
inflation factors are considerably below the 10 cutoff threshold. The
results of this analysis provide sapport for the conclusion that while
the independent variables do share· intercorrelations, no problems of
multicollinearity exist in the data.
TABLE 59
TOLERANCE AND VARIANCE INFLATION FACTORS FOR THE PROACTIVE, EMPOWER, AND TEAM DIMENSIONS OF ORGANIZATIONAL CULTURE
VARIABLE TOLERANCE· VARIANCE INFLATION FACTOR
PROACTIVE .715 1.3986 EMPOWER .577 1.7331 TEAM .594 1.6835 COMMITMENT .692 1.4450
With multicollinearity eliminated as a problem, the issue of a
strong and statistically significant variable such as PROACTIVE net
entering the multiple regression,equation must be investigated. In
examining issues of specification and relevant variables, Schroeder,
Sjoquist, and Stephan (1986, pp. 67-68) counsel comparing the
explanatory power aleng with any significant changes in the estimated
regression and beta coefficients between the two alternative equations:
the first being the trimmed equation and the second equation including
the variable in question. If there is significant change in explanatory
power and in the estimates of beta coefficients, then the marginal

variable is best included. If no significant change occurs, the
variable is irrelevant and sqould be excluded.
170
For purpqses of comparison, further multiple regression analysis
was conducted in which the criteria statement forced the entry of only
the three dimensions of TEAM, EMPOWER, and PROACTIVE into the regression
equation. The results of this analysis (Table 60) reveal an R2 of .135,
a coefficient of multip~e determination of little difference from that
produced by the two variable equation.
TABLE 60
FORCED ENTRY MULTIPLE REGRESSION ANALYSIS OF THE PROACTIVE, EMPOWER, AND TEAM DIMENSIONS OF ORGANIZATIONAL CULTURE
WITH CUSTOMER ORIENTATION
DIMENSION
TEAM EMPOWER PROACTIVE
CONSTANT Rz ADJ. R2
F PROB. F
5.247 .135 .126
14.885 .0000
STND BETA
+.138 +.190 +.11,0
t
1. 90 2.59 1.68
SIG. t
.0581
.0102
.0940
For equations containing different numbers of independent
variables, it is sugges~ed that the a~justed R2 offers a more valid
comparison of two equations having a different number of variables (Hair
et al., 1992, p. 58). A comparison of the adjusted R2 ' s between the two
equations supports the two variable equation as the better specification
of the overall relationship. The trimmed two variable equation has an
adjusted R2 of .128, while the three variable equation indicates an R2
171'
of .126. Reflecting the shared variance between the three variables in
question, there is an expected change in the estimates of the beta
coefficients. The beta coefficient for TEAM goes from .162 in the two
variable equation to .138 in the three variable version. The beta
coefficient for EMPOWERMENT is reduced from .243 in the two variable
equation to .190 with three variables.
An additional comparison be,tween the two equations can be made
using the sum of the squared errors to assess the accuracy of the two
equation forms. In this comparison, the smallest squared error term
would indicate the highest accuracy between the equations (Hair et al.,
1992, p. 27). The two variable equation's SSE of 32.143 is slightly
smaller than the-33.003 associated with the three variable equation.
Both the adjusted R2 and the squared standard error criteria
indicate that the more parsimonious, two variable equation provides the
better specification of the overa~l relationship between organizational
culture and the level of sales force customer orientation. A comparison
of the beta coefficients from this two variable multiple regression
model marks the EMPOWER (b=.243) dim~nsion as having more relative
impact upon customer orientation than does the TEAM dimension (b=.l62).
Nonetheless, considering (a) their relatively high correlations among
one another and (b) the R2 values from the univariate regression
analysis (Table 55), practitioners would do well to bear in mind the
significant relationship each of these variables has on customer
orientation.
This "Study's empi_rical findings i:n support of the positive
relationship between organizational culture and customer orientation
begin to provide the practitioner with answers to the study's original
research question: "How does a firm create and sustain a customer
orientation?" Indeed, these findings ,provide the initial empirical I
evidence supporting the existence and the characteristics of Parasuraman
and Deshpande's conceptualized "customer oriented culture" (Parasuraman
and Deshpande 1984; Deshpande and Parasuraman 1984; and Parasuraman 1985
and 1987). As hypothesized, this culture has a positive influence upon
172
customer orientation. Although exploratory in nature, the results of
this study direct managers to develop and sustain a culture that (1)
empowers its employees to be creative in generating and implementing
relevant decisions and solutions (EMPOWER), (2) encourages cooperation,
mutual support, and loyalty among fellow workers (TEAM), (3) is
predisposed toward flexibility and ch~nge in a dynamic internal and
external environment (PROACTIVE), (4) stimulates an intrinsic motivation
and commitment to the qrganization (COMMITMENT), (5) focuses on external
matters and opportunities rather .than details of process and task (NON
REDTAPE), and (6) exhibits a sincere respect and interest in the
individual workers' interests over the strict accomplishment of tasks
(SOCIAL).
CHAPTER VI
DISCUSSION AND IMPLICATIONS
The discussion of this study follows in four parts. First, the
supporting literature is reviewed, followed by a discussion of the
methodology utilized in the study. Third, the research findings are
reviewed and the implications for researchers and practitioners
developed. Last, limitations of the study and recommendations for
future research are presented.
Overview of Supporting Literature
The driving force behind this study is the research question:
"How does a firm create and sustain a customer orientation?" In
answering this question, we posit and investigate the concept of
organizational culture as an antecedent for the effective implementation
and maintenance of customer orientation within a sales organization.
The potential explanatory power of organizational culture has been
conceptualized by numerous marketing scholars. Hypothesizing that
organizational culture "can account for a substantial variance in
marketing performance, especially the residual variance that traditional
independent variables cannot explain ... " Parasuraman and Deshpande
(1984), Deshpande and Parasuraman (1984), and Parasuraman (1985, 1987).
Deshpande and Parasuraman (1984, p._ 137) first conceptualized the
potential influence of organizational culture upon the marketing
function of the firm. Most recently, Payne (1988) and the Marketing
Science Institute (1989, p.7) have made inferences regarding the
possible influence of organizational culture on customer orientation.
173

174
Theoretical Justification
As critiqued by O'Rielly, Chatman, and Caldwell (1991, p. 487),
due to a lack of investigation, debate continues regarding the specific
elements and measures of organizati~nal culture. Nonetheless, there is
agreement conceptualizing culture as a factor influencing the behavior
of an individual within an organizational context (e.g., Schein 1985;
Kilmann, Saxton, and Serpa 1986). The concept of organizational culture
stems from Lewinian field theory (Lewin 1935) in which individual
behavior is posited as a function of the interaction of the person and
his immediate psychological environment. Further work by Lewin (1943)
and Schein (1965) brought Lewinian field theory into the realm of
organizational psychology, resulting in social system theory and group
development theory. These theories view individual behavior as being
shaped by the .results of a dynamic process of adaption to perceived
internal and external environments (Tuckman 1965; Bales 1970; Tuckman
and Jenson 1977; Schein 19~5). This interactive process of adaptation
results in certain shared values which, in turn, act as norms further
shaping the behaviors of individual members. As defined by scholars in
organizational behavior, these shared values result in an "enacted
environment" (Weick 1979), the culture of the organization (Kroeber and
Kluckhohn 1952; Becker and Geer 1970; VanMaanen and Schein 1979; Siehl
and Martin 1981; Tichy 1982; Uttal 1983; Smircich 1983; Louis 1983).
Viewed in this manner, the culture of an organization is composed of
norms--shared values--that influence and guide individuals' behaviors.
Customer orientation is defined as a phi,losophy attd behavior
directed toward determining and under·standing the ne.eds of the target
customer and adapting the response in order to satisfy those needs
better than the competition (Saxe and Weitz 1982; Narver and Slater
1989; Marquardt 1989). The findings of Williams and Wiener (1990)
provide further support for customer orientation of salespeople being an
adaptable behavior reflecting the orientation of the organization's
management.
175
In describing adaptive, customer oriented behaviors, marketing
scholars describe the multiple roles that are taken on by a salesperson
representing the customer as well as the firm. The ensuing non-routine
situations and demands result in conditions of high job complexity and
job/task ambiguity (Walker, Churchill, and Ford 1975; Churchill, Ford
and Walker 1976;.Dubinsky et al. 1986). Ouchi· (1980) argues that the
specific characteristics of the clan culture type will make the clan
form of organizational culture more efficient and effective under the
conditions of high job complexity and high job/task ambiguity such as is
found in selling situations. Further accentuating the influence of
organizational culture on the customer orientation of salespeople,
Parasuraman contemplates the characteristics of a customer oriented
organizational culture as: (1) a focus external to the firm emphasizing
a common dedication to customer satisfaction; (2) flexibility in process
and response through empowerment of the member; (3) creativity in
generating relevant solutions to customer problems; and (4) a sincere
respect for employees and co-workers. These characteristics bear a
close resemblance to Ouchi's (1980) clan culture.
Methodology
Investigation of the posited relationship between the constructs
of organizational culture and cus,tomer orientati,on rests on the ability
to measure each construct of interest. This requirement introduces a
significant problem: the lack of suitable scales possessing proven
reliability and validity.
Organizational Culture. Reflecting its ad~lescent stage of
development, organizational culture research is wanting for both
precision and rigor (Wiener 1988). The majority of research into
organizational culture has been descriptive and qualitative in nature
176
(e.g. Deal and Kennedy 1982; Ouchi 1983; Martinet al. 1983). Beginning
with Reynolds (1986) and Cooke and Rousseau (1988), there have been
efforts in the direction of more rigorous and empirical investigation.
Nevertheless, available and published measures fail to adequately
address the issues of reliability and va~idity.
Customer Orientation. Saxe.and Weitz's (198?) SOCO scale provided
a valuable first step toward the operationalization and measurement of
customer orientation as.a behavior of salespeople. However,
contemporary thought by numerous marketing scholars (e.g. Coppett and
Staples 1990; Anderson 1991; Manning and Reece 1992) reflects the
relationship approach to selling.and emphas~zes several additional
elements not included in the SOCO measure. These additional elements
include (1) Following-up sales to assess satisfaction and provide post
sale services, (2) Adopting and practicing the "double-win" negotiation
strategy, and (3) Being a custome~ advocate through representing the
customer to the company before, ~uri~g and after the sale. Continued
exclusion of these service augmentation and boundary spanning roles
would result in understating the clomain of customer orientation.
The lack of suitable scales for use in investigating our key
research question requires the development of scales for the constructs
of customer orientation-and, organizational culture. Consequently, in
addressing the single research question driving this study, the research
design must achieve three pr,imary objectives:
1. Develop a scale for the purpose of measuring the organizational culture construct at the level of the individual member of the organLzation.
2. Extend the Selling Orientation-Customer Orientation (SOCO) scale (Saxe and Weitz 1982) to include the additional elements of the customer orientation domain.
3. Test the hypothesized relationships betWeen organizational culture and customer orientation.
177
Scale Development
Adhering to the multi-step process advocated by Churchill (1979)
for the development of reliable and valid measures, this study utilizes
the survey format in a series of three independent stages of data
collection and analysis. The survey design samples participants across
several types of selling situations wi~hin each of the three stages. At
the same time, any overlap in respondents from stage to stage is
precluded. Survey instruments were distributed directly to the
participants along with blank envelopes in which to seal their
responses. Along with conducting each survey under the auspices of the
Oklahoma State University Center for Product and Service Quality, the
envelopes were included to further assure confidentiality of responses.
The survey instrument used in the first stage of data collection
included item statements relative only to the organizational culture
measure. From a total of 137 participants, a total of 108 responses
were received resulting in a 79 percent return rate. Data from this
first survey was analyzed using corrected item-to-total correlations and
Cronbach's coefficient alpha for the purpose of reducing the large
number of item statements generated for the organizational culture
construct.
The second data collection step involved the distribution of 683
survey instruments. A total of 655 total responses were received for a
response rate of 96 percent. Out of the total 655 responses, 302 were
full time salespeople. Data from all 655 respondents was analyzed to
purify and reduce the item statements for organizational culture using
corrected item-to-total correlations, Cronbach's coefficient alpha, and
factor analysis. Using these same analysis techniques, data from the
302 sales respondents was analyzed for the purification and reduction of
the customer orientation measure. This stage of analysis also provided
the explication of the dimensionality for both constructs. The
resulting purified measures were incorporated into a third questionnaire
to be used in collecting data for confirmation of dimensionality and
reliability along with investigation of measure validity.
178
The third stage of data collection involved a total of 394 full
time salespeople as participants. A total of 344 completed responses
were obtained for a response rate of 87.3 percent. This stage of
analysis tested several new item statements added to each measure as a
result of the previous step and further confirmed reliabilities and
dimensional structures using item--to-total correlations, Cronbach' s
coefficient alpha, and,factor analysis. The validity of each measure
was assessed in this stage using the multi-trait multi-method matrix.
Tests of Hypotheses
Tests of the hypothesized relationships between organizational
culture and customer orientation was effected through the use of
univariate regression and multiple regression. Univariate regression
was used to test the hypothesized ~elationship between (a) the two
constructs and (b) between the individual dimensions of organizational
culture and the customer orientation construct. Multiple regression was
used to simultaneously test the relationship of the organizational
culture dimensions with customer orientation. This analysis was
selected in order to obtain standardized beta coefficients revealing the
relative influence of each of the organizational culture dimensions on
customer orientation.
Findings and Implications
The findings from this study make substantial contributions to the
field of marketing, particularly sales management. Dimensions are
empirically explicated and much needed measures, possessing support for
reliability and validity, are developed for both organizational culture
and customer orientation. The highly conceptualized relationships
between the culture of an organization and the level of customer

179
orientation of its salespeople are empirically explored and supported.
Furthermore, a major step is made toward linking research from the field
of organizational behavior to marketing management.
Organizational Culture
Integrating theory and inve-stigation from organizational behavior,
social psychology, communications, and marketing, organizational culture
is empirically investigated and a measurement scale is developed with a
marketing perspective. Each of the individual dimensional sub-scales
meet or exceed Nunnally's (1978) .60 reliability criteri~ for use in
further research. Computed through the formula for linear combinations
(Nunnally 1978), the overall composite measure results in an estimated
reliability of .90. The findings from this investigation explicate the
seven dimension structure of organizational culture and bring about a
better understanding of the operating characteristJcs and consequences
of this construct. Together, this measure and increased knowledge
regarding organizational culture provide both encouragement and a
vehicle for the further study of the determinants and consequences of an
organization's culture on marketing perform~nce.
Customer Orientation
This study extends our previous understanding of customer oriented
behavior to include a broader and more contemporary interpretation of
the construct's domain. The immediate and direct results of this
extension are (1) the clarification of the multi-dimensional nature of
the construct and (2) a measure with confirmed levels of reliability and
validity. Each of the individual dimensional sub-scales meet or exceed
Nunnally's (1978) .60 reliability criteria for use in further research.
Computed through the formula for linear combinations (Nunnally 1978),
the overall composite measure results in an estimated reliability of
.91. For the researcher, this combination provides a valuable vehicle

180
for further identification, study, and unaerstanding of the antecedents
and determinants of customer oriented behaviors. For the practitioner,
this combination provides a framework for benchmarking performance,
assessing training needs, and implementing strategies encouraging
customer oriented behavior.
Relationships 'Between Organizational Culture
and Customer Orientation
The hypothesized relationships betwe~n organizational culture and
the customer orientation level of salespeople are supported by the
findings of this study. At the construct to construct level, a positive
relationship is supported (F=27.99, p<.OOOO, B= +.301) with
organizational culture explaining 09.1 percent of the variance in
customer orientation. Reflecting the design of the organizational
culture measure, this finding supports priar conceptualizations that
cultures tending more toward the clan typology would have a positive
influence on customer orientation of salespeaple.
Using univa~iate regression analysis, support for the dimensional
hypotheses is mixea. Strang support is found for the relationships
between the EMPOWER (F=36.44, p<.OOOO, B= +.331, R2=.11), TEAM (F=29.37, 2 ' p<.OOOO, B= +.300, R=.09), and PROACTIVE (F=23.25, p<.OOOO, B= +.269,
R2=.07) dimensions and the c~stomer arientation construct. At lower
levels of significance, the COMMITMENT (F=8.81, p<.0032, B= +.169,
R2=.03), SOCIAL (F=5.90, p<.OlS~, B= +.139, R2~.02) and NON-REDTAPE
(F=2.62, p<.l067, B= +.093, R2=.01) dimensions find support for
relationships with customer orientation. No support is found for the
NONCOMPLEX dimension (F=.82, p<.3657). This lack of support for
NONCOMPLEX is possibly due to most salespeople operating out-and-away
from the actual organization or that they may have developed their own
informal and more efficient communicatian paths around the bureaucracy.
An additional explanation could be that tall and more complex structures

181
offer more opportunity for personal contact and communication. Although
this conflict is often seen as negative and conflicting, it could also
be positive and productive.
Tests for multi-collinearity indicate that no problems exist.
Nonetheless, the levels of shared variance between the EMPOWER, TEAM,
and PROACTIVE dimensions result in only the EMPOWER and TEAM dimensions
entering the multiple regression equa~ion as significant when using a
probability ofF entering criteria set at .10. This inability of
PROACTIVE to enter due to EMPOWER and TEAM already accounting for most
of its effect is perhaps explained by Parasuraman (1985) as he expounds
one of the characteristics of a customer oriented culture as flexibility
in process and response through empowerment of the member. This
intimates that propensity toward change (PROACTIVE) can come about
through the empowerment of the individual employee (EMPOWER), in which
case EMPOWER would indeed have the most relevance,. The relative
importance of EMPOWER is further supported by the standardized beta
coefficients. EMPOWER receives a~coefficient of .243 compared to the
coefficient for TEAM of .162.
These findings have many implications for both researchers and
practitioners. Certainly these early results call for further research
and verification. As the first empirical study of the dimensionality
and effect of organizational culture on customer orientation, the
findings from this study equip scholars and practitioners with more than
just intuition for making and implementing strategic decisions. If
future replications produce similar findings, the message is clear--the
culture of an organization can have definite influences upon the
customer oriented behavior of salespeople.
Limitations of Research
As with any research, this study has several limitations. First
was the method of selecting the s'amples in each of the data collection
182
stages. CooperatioB was solicited from companies in order to grant
access to their salespeople. Although a variety of different company
and industry types was included to boost the generalizability of the
results, the fact that companies, and even sales managers, self-selected
to join the study has the potential to introduce bias into the study and
certainly confounds the generalizing of results to the overall
population of salespeople and sales organizations.
The possibility of interviewer bias must also- be considered.
Although a realistic cover of the Center for Product and Service Quality
was used in the surveys, it is possible that some respondents placed the
researcher as a marketing instructor and inflated th~i~ self ratings in
order to make themselves appear more consistent with-their "social
self." The issue of respondent fatigue should also be considered due to
the detail and length of the survey ins:truments. The measures for
organizational culture and customer o~ientation ~ere placed up front,
nevertheless, respondent fatigue remains as a potential consideration in
examining the results of the study.
Although the study uses different levels of measurements for the
constructs and traits of interest in the multi-trait multi-method
assessment of validity, the measures do not achieve the desired level of
being maximally different. All measures were taken on the basis of
simultaneous, self-report, pencil and paper methods. This possibly
introduces some method' artifac'ts into the validity relationships. The
ability to design and obtain obj.ective correlates in future research
would strengthen claims for validity.
An additional limitation of a s:tudy of this nature is the
inability to establish causality. Assertions of causality are best made
through experimental research. Consequently, the coBclusions of cross
sectional data such as used in this study are restricted to supporting
association rather than drawing definit'ive cause and effect conclusions.
183
Recommendations for Future Research
This study was meant to be exploratory. As such, it represents an
important first step in the areas of organizational culture and customer
orientation research. Addressing some of the limitations of this study,
replications are encouraged in order to verify the results. Central
among issues to be addressed in future research would include obtaining
a random sample of salespeople to avoid the problem of self-selection
inherent in this study's convenience sample. The design should also
include a mixture of induljltry, product, a.nd,, selling situation types to
allow generalization of findings. The inclusion of objective correlates
to use for validation would also make a meaningful contribution to
extending the findings of this study.
Future research designs could include a causal modeling approach
for analysis. This methodology would allow going beyond association and
build support for the posited antecedent and thus causal relationship
from organizational culture to customer orientation. Such a modeling
approach could also further investigate the relationship of PROACTIVE,
EMPOWER, and TEAM, providing increased understanding of the relative
importance of these dimensions.
Further extensions are -·needed to investigate the nature of the
model relating organizational cult\lre ·and customer orientation to
additional variables of interest to researchers and practitioners.
Among the v-ariables of interes-t would be organizational commitment, role
ambiguity and conflict, motivation,, and performance. Incorporating the
role of personal values and,degree of environmental fit into a model of"
this nature would also prove meaningful.
As conceptualized, organizational culture has much potential
explanatory power in marketing. It is hoped that the results of this
first exploratory research-study and ,the measures developed will
encourage more study and further understanding of this construct.

REFERENCES
Andrews, John A. Y. and Paul M. Hirsch (1983), "Ambushes, Shootouts, and Knights of the Roundtable: The Language of Corporate Takeovers," in Organizational Symbolism, Pondy, L. R., Frost, P., Morgan, G., and Dandridge, T., eds., Greenwich, CT: JAI Press.
Arogyaswamy, Bernard and Charles M. Byles (1987), "Organizational Culture: Internal and External Fits," Journal of Management, 13 (4), 647-658.
Bagozzi, Richard (1978), "Salesforce Performance and Satisfaction as a Function of Individual Difference', Interpersonal, and Situational Factors," Journal of Marketing research, 15 (November), 517-531.
(1980), "The Nature and Cause of Self-Esteem, Performance, and Satisfaction in the Sales Force: A Structural Equation Approach," Journal of Business Research, 53 (July), 315-331.
Bales, R. F. (1970), Personality and Interpersonal Behavior, New York: Holt, Rinehart, and Winston.
Barney, Jay B. (1986), "Organizational Culture: Can It Be a Source of Sustained Competitive Advantage?" Academy of Management Review, 11 (3), 656-665.
Becker, H. S. and B. Geer (1970), "Participant Observation and Interviewing: A Comparison,," in Qualitative Methodology, Filstead, W. ed., Chicago: Rand McNally, 133-142.
Bell, Martin L. and C. William Emory (1971), "The Faltering Marketing Concept," Journal of Marketing, 35 (October), 37-42.
(1981), "Tactieal Service Marketing and the Process of Remixing," in Marketing of Services, Donnelly, James H. and George, Williams R. eds., Chicago: American Marketing Association, 163-167.
Bettinger, Cass (1989), "Use Corporate Culture to Trigger High Performance," The Journal of Business Strategy, (March/April), 38-42.
Beyer, J. M. and Trice H. M. (1987), "How an Organizations Rites Reveal Its Culture," Organizational Dynamics, (Spring), 15.
Blake, R. R. and J. S. Mouton (1970), rbe Grid for Sales Excellence, New York: McGraw-Hill Book Company.
Boje, David M., Donald B. Fedor, and Kendrith M. Rowland (1982), "Myth Making: A Qualitative Step in OD Interventions," Journal of Applied Behavioral Science, 18, 17-28.
Buzotta, V. R., R. E. Lefton, and M. Sherberg (1972), Effective Selling Through Psychology, New York: John Wiley and Sons, Inc.
184

Calder, Bobby J. , Lynn W. Phillips, and Alice M. Tybout (1981), "Designing Research for Application," Journal of Consumer Research, 8, 197-207.
Campbell, Donald T., and Donald W. Fiske (1959), "Convergent and Discriminant Validation by the Multitrait-Multimethod Matrix," Psychological Bulletin, 56 (March), 100-122.
185
Campbell, J. P·., M.D. Dunnette, E. E. Lawler, and K. E. Weick, Jr. (1970), Managerial Behavior. Performance. and Effectiveness, New York: McGraw Hill. ·
Cattell, R. B. (1958), "Extracting the. Correct Number of Factors in Factor Analysis," Educational and psychological Measurement, 18, 791-831. -
(1966), "The·Scree Test for the Number of 'Factors," Multivariate Behavioral Research, 1, 245-276.
Churchill, Gilbert A. Jr., Neil M. Ford, and Orville C. Walker Jr. (1976), "Organizational Climate and Job Satisfaction in the Salesforce," Journal of Marketing Research, 13 (November), 323-332. '
Home·~rood, IL: (1990), Sales Force Management,
Rlchard D. Irwin, Inc.
(1979), "A Paradigm for Developing Better Measures of Marketing Constructs," Journal of Marketing Research, 16 (February), 64-73.
------~~· Neil M. Ford, Steven W. Hartley, and Orville C. Walker Jr. (1985), "The Determinants of Salesperson Performance: A MetaAnalysis," Journal of Marketing Research, 22 (May), 103-118.
Converse, P. D. and H. W. Huegy (1946), The Elements of Marketing, New York: Prentice Hall, Inc. as quoted in Bell, Martin L. and C. William Emory (1971), "The ·Faltering Marketing Concept," Journal of Marketing, 35 (October), 37-42.
Cooke, Robert A., and Denise M. Rousseau (1988), "Behavioral Norms and Expectations: A Quantitative Approach to the Assessment of Organizational Culture, " Gr'oup and Organizational Studies, 13 (September), 245-273.
Coppett, John I. and William A. Staples (1990), Professional Selling: A Relationship Management Process, Cincinnati: Southwestern Publishing Co. '
Cronbach, L. J. (1951), "Coefficient Alpha and the Internal Structure of Tests," Psychometrika, 16 (September), 297-334.
Crosby,, Lawrence A. and Kenneth R. Evans (.1989), "Relationship Management and Commitment to Quality," in Quality and Customer Service: The Critical Focus for a Firm, Guiry, Michael ed., Report No. 89-117, Cambridge, Massachusetts: Marketing Science Institute.
Daft, Richard L. (1989), Organization Theory and Design, St. Paul, MN: West Publishing.
Deal, Terrance E. and Allan A. K~nnedy (1982), Corporate Cultures, Reading, MA: Addison-Wesley.
186
Deshpande, Rohit and A. Parasuraman (1984), "Organizational Culture and Marketing Effectiveness," in Scientific Method in Marketing, P. F. Anderson and M. J. Ryan, eds., Chicago: American Marketing Association, 137-140.
---,...,.---=-and Frederick E. Webster (1989), "Organizational Culture and Marketing: Defining the Research Agenda," Journal of Marketing, 53 (January), 3-15. ·
Drucker, Peter F. (1954), The Practice of Management, New York: Harper and Brothers Publishers.
Dubinsky, Alan J., Roy D. Howell, Thomas N. Ingram, and Danny Bellinger (1986), "Salesforce Socialization," Journal of Marketing, 50 (October), 192-207.
and Steven J. Skinner (1984), "Impact of Job Characteristics on Retail Salespeoples' Reactions to T]:leir Jobs," Journal of Retailing, 60/2 (Summer), 35-62.
Evans, Martin G. (1974), "Extensions of a Path-Goal Theory of Motivation," Journal of Applied Psychology, 59 (2), 172-178.
Felton, Arthur P. (1959), "Making The Marketing Concept Work," Harvard Business Review, 37 (July/August), 55-65.
Fisk, Raymond P. (1981), "Toward a Consumptive/Evaluation Process Model for Services," in Marketing of Services, Donnelly James H. and William R. George, eds., Chicago: American Marketing Association, 191-195.
Geertz, C. (1973), The Interpretation of Cultures, New York: Basic Books.
Georgopoulos, Basil S., Gerald M. Mahoney, and Nyle W. Jones, Jr. (1957), "A Path-Goal ApprGaeh to Productivity," Journal of Applied Psychology, 41 (December), 345-353.
Glick, William H. (19-85) "Conceptualizing and Measuring Organizational and Psychological Climate: Pitfalls in Multilevel Research," Academy of Management Review, 10 (3), 601-616.
Green, Paul E., DonaldS. Tull, and Gerald Albaum (1988), Research for Marketing Decisions, Englewood Cliffs, New Jersey: Prentice-Hall, Inc.
Gronroos, Christian (1980), "Designing a Long Range Marketing Strategy for Services," Long Range Planning 13, 36-42.
(1983), "Innovative Marketing Strategies and Organization Structures for Service Fi:r:ms," in Emerging Perspectives on Services Marketing, Berry, Leonard L., Shostack G. Lynn, and Upah, Gregory D. eds., Chicago: American Marketing Association, 9-21.
(1985), "Internal Marketing- Theory and Practice," in Services Marketing in a Changing Environment, Bloch, T. M., G. D. Upah, and V. A. Zeithaml, eds., Chicago: American Marketing Association, 41-47.
Gwinner, Robert F. (1968), "Base Theory in the Formulation of Sales Theory," MSU Business Topics, 16 (Autwnn), 37-44.
187
Hackman, J. Richard and Edward E. Lawler (19'71), "Employee Reactions to Job Characteristics," Journal of Applied Psychology Monograph, 55 (3) (June), 259-286.
and G. R. Oldham (1975}, "Development of the Job Diagnostic Survey," Journal ,of Applied Psychology, 60 (April), 159-170.
and (1976), "Mativation Through the Design of Work: Test of a Theory," Organizational Behavior and Hwnan Performance, 16 (August), 250-279. ·
Hair, Joseph F., Rolph E. Anderson, Ronald L. Tatham, and Williams C. Black, 'Multivariate Data Analysis, New York: Macmillan Publishing Company. "
Heeler, Roger M. and Michael L. Ray (1972), "Measure Validation in Marketing," Journal of Marketing Research, 9 (November), 361-370.
Hellriegel, Don, John W. Slocum, and Richard W. Woodman (1989), Organizational Behavior, St. Paul, MN: West Publishing Co.
Hise, R. T. (1970), "Conflict in the Salesman's Role," in Sales Management: Contemporary Perspectives, J. A. Barnhill, ed., Glenview, IL: Scott Foresman and Company, 48-62.
Hofstede, Geert (1986), "The Usefulness of the Organizatipnal Culture Concept," Journal of Management Studies, 23 (May), 253-258.
House, R. J. (1971), "A Path-Goal Theory of Leadership," Administrative Science Quarterly, 16, 321-338.
and G. Dessler (1974), "The Path-Goal Theory of Leadership: Some Post Hoc and A Priori Tests," in Contingency Approaches to Leadership, J. G. Hunt and L. L. Larson, eds., Carbondale, IL: Southern Illinois University,Press, 29-55.
Houston, Franklin S. (1986), '~The Marketing Concept: What It Is and What It Is Not," Journal of Marketing, 50, (April), 81-87.
Hrebiniak, Lawrence G. (1978), Complex Organizations, St. Paul, MN: West Publishin.g.
and J. A. Alutto (1972), "Personal and Role Related Factors in the Development of Organizational Commitment," Administrative Science Quartedy, 17 (December), 555-573.
Hunt, Shelby (1991), Modern Marketing Theory: Critical Issues in the Philosophy of Marketing Science, Cincinnati: Southwestern Publishing Co.
Joyce, William F. and Jqhn W. Slocum, Jr. (1979), "Climates in Organizations," in Organizational Behavior, S. Kerr ed., Columbus, OH: Grid, 317-333.
---------:-• and (1984), "Callective Climate: Agreement as a Basis for Defining Aggregate Climates in Organizations," Academy of Management Journal, 27 (4) (December), 721-742.
188
Kaiser, H. F. (1960) "Comments on Communalities and the Number of Factors," Paper presented at an Informal Conference on the Communality Problem in Factor Analysis, St. Louis: Washington University, (May), as referenced in Rummell, R. J. (1970), Applied Factor Analysis, Evanston, Illinois: Northwestern University Press.
Keith, R. J. (1960), "The Marketing Revolution," Journal of Marketing, 24 (January), 35-38.
Kerr, Jeffrey and John W. Slocum, Jr. (1987), "Managing Corporate Culture through reward Systems," Academy of Management Executive, 1 (May),,99-108.
Kohli, Ajay K. and Bernard J. Jaworski (1990), "Market Orientation: The Construct, Research Propositions, and Managerial Implications," Journal of Marketing, 54 (April), 1-18.
Kotler, Phillip and Alan R. Andreason (1987), Strategic Marketing for Nonprofit Organizations, Englewood Cliffs, NJ: Prentice Hall, Inc.
(1988), Marketing Management, Englewood Cliffs, NJ: Prentice-Hall, Inc.
Kroeber, A. I. and C. K1uckhorn (1952), Culture: A Critical Review of Concepts and Definitions, New York: Vintage Press.
Leavitt, H. J. (1964), "Applied Organizational Change in Industry: Structural, Technical, and Human Approaches," in New Perspectives in Organization Research, Cooper, W. W., Leavitt, H. J., and Shelly, M. W., eds., New York: John Wiley and Sons.
Levitt, Theodore (1960), "Marketing Myopia," Harvard Business Review, 58, 89~91.
(1983), The Marketing Imagination, New York: Macmillan.
Lewin, K. (1935), A Dynamic Theory of Personality, New York: McGrawHill Book Go.
(1938), "The Conceptual Representation and the Measurement of Psychological Forces," in Contributions To Psychological Theory, Durham, NC: Duke University Press.
(1948), Resolving Social Cenflicts: Selected Papers on Group Dynamics. 1935-1946, New York: Harper & Row.
Litwin, G. H. and R. A. Stringer (1968), Motivation and Organizational Climate, Boston: Harvard University Graduate School of Business Administration.
Loudon, David L. and Albert J. Della Bitta (1984), Consumer Behavior: Concepts and Applications, New York: McGraw-Hill Book Company.
Louis, M. R. (1983), "Organizations as Culture-Bearing Milieux," in Organizational Symbolism, .Pendy, L. R., Frost, P., Morgan, G., and Dandridge, T. C. eds., Greenwich, CT: JAI.
Lovelock, Christopher H. and R. F. Young (1979), "Look To Consumers to Increase Productivity," Harvard Business Review, 57 (May-June), 168-178.
189
Luthens, Fred (1992), Or~anizational Behavior, New York: McGraw-Hill, Inc.
Lutz, Richard (1979), "Opening Statement," in Conceptual and Theoretical Developments in Marketin~. eds. 0. C. Ferrell, S. W. Brown, and C. W. Lamb, Chicago: American Marketing Association.
Mahajan, Vijay, P., "Rajan" Varadarajan, and Roger A. Kerin (1987), "Metamorphosis in Strategic Market Planning," in Contemporary Views on Marketing Practice, eds., Gary L. Frazier and Jagdish Sheth, Lexington, MA: Lexington Books.
Manning, Gerald L. and Barry L. Reece (1990), Selling Today: Approach, Boston: Allyn and Bacon.
A Personal
Marketing Science Institute (1988), Research Priorities 1988-1990, Cambridge Massachusetts.
(1989), Research Priorities 1989-1991, Cambridge Massachusetts.
Marquardt, In.geborg A. (1989), "The Link Between Tetal Quality Improvement and Market Orientation," in Quality and Customer Service: The Critical Focus for a Firm, Guiry, Michael ed., Report No. 89-117, Cambridge, Massachusetts: Marketing Science Institute.
Martin, J. and C. Siehl (1983), "Organizational Culture and Counterculture: An Uneasy Symbiosis," Organizational Dynamics, 12 (Autumn), 52-64.
McClelland, D. C. (1962), "Business Drive and National Achievement," Harvard Business Review, 40, 99-112.
McCracken, Grant (1986), "Culture and Consumption: A Theoretical Account of the Structure and Movement of the Cultural Meaning of Consumer Goods," Journal of Cons~er Research, 13 (June), 71-84.
McKelvey, W. (1967), "An Approach for Developing Shorter and Better Measuring Instruments," Werking Paper 76-6, Human Systems Development Study Center, Graduate School of Management, UCLA, as referenced in Saxe, Robert and Barton A. Weitz (1982), "The SOCO Scale: A Measure of 'the Customer Orientation of Salespeople," Journal of Marketing Research, 19 (August), 343-351.
McKitterick, J. B. (1958), "What is the Marketing Management Concept," in The Frontiers of Marketing Thou~ht and Science, Frank M. Bass ed., Chicago: American Marketing Association, 71-82.
McNamara, Carlton P. (1972), "The Present 'Status of the Marketing Concept," Journal of Marketing, 36 (January), 50-.\57.
Merriam-Webster (1987), ,webster's Ninth New Collegiate Dictionary, Springfield, Mass.: Merriam-Webster, Inc.
Michaels, Ronald E. and Ralph L. Day (1985), "Measuring Customer Orientation of Salespeople: A Replication With Industrial B1:1yers," Journal of Marketing Research, 22 (November), 443-446.
Miller, Robert B. and Stephen E. Heiman (1985), Strategic Selling, New York: Warner Books.

190
Mitroff, Ian I. and Ralph H. Kilmann (1976), "On Organizational Stories: An Approach to the Design and Analysis of Organizations Through Myths and Stories," in The Management of Organizational Design, Kilmann, R. H., Pondy, L. R., and Slevin, D. P., eds., New York: Elsevier-North Holland, 189-207.
Narver, John C. and Stanley F. Slater (1989), The Effect of Market Orientation on Business Profitability, Report No. 89-120, Cambridge, Massachusetts: Marketing Science Institute.
arid (1990), "Th~ Effect ofa Market Orientation on Business Profitability," Journal of Marketing, 54 (Octobe·r), 20-35. .
Nunnally, Jum C. (197·8), Psychometric Theory, New York: McGraw-Hill Book Company.. ·
Oliver, R. L. (1974'), "Expectancy Theory Predictions of Salesmen's Performance," Journal of Marketing Research, 11 (August), 243-253.
Ouchi, WilliamG. (1980), "Markets~ Bureaucracies, and Clans," Administrative Science Quarterly, 25 <March), 139-141.
(1981), Theory Z: How American Business Can Meet the Japanese Challenge, Reading, MA: Addbon:-Wesley.
(1983), "'f.heory Z: An Elab~ration of Methodology and Findings," Journal of Contemporary Business, 11, 27-41.
and Alan L. Wilkins (1985), "Organizational Culture," Annual Review of Sociology, 11, 457-483.
O'Reilly, Charles A. III, Jennifer Chatman, and David F. Caldwell (1991), "People and Organizational Culture: A Profile Comparison Approach to Assessing Person"'Organization Fit," Academy of Management Journal, 34/3 (September), 487-516.
Ott, J. Steven (1989), The Organi,za.tional Culture Perspective, Chicago: The Dorsey Press.
Padmanabhan, K. H. (1990), "Revisiting the Marketing Concept Cantroversy," in Advances 'in Marketing, Go!rgon P. J. and Kellerman B. J., eds., Cape Girardeau, MO: Southwest Missouri State University and Southwest Marketing Association.
Parasuraman,, A. and Rohit Deshpande (1984), "The Cultural Context of Marketing Management," in AMA Educators' Proceedings. Series 50, Russell W. Belk et al. eds., Chicago: American Marketing Association, 176-179. ·
___ ..,......_,(1985), "Custome'r-Oriented Organizatianal Culture: A Key To Successful S.ervices Marketing, in Creativi·ty in Services Marketing: What's New. What Works. What's Developing, Venkatesan, M. , D. Schmalens.ee, and C. 'Marshall, eds. , Chicago: American Marketing Association, 73-77.
----:::--' (1987), "Customer-Orientea Corporate Cultures are Crucial To Services Marketing Success," J.ournal of Servi.ces Marketing, 1 (Summer), 39-46.
\
------~--· Valarie A. Zeithaml, and Leonard L. Berry (1984), A Conceptual Model of Service Quality and Its Implications for Further Research, Report No. 84-108, Cambridge, MA.: Marketing Science Institute.
191
-------:---:-::--' Valarie A. Zeithaml, and Leonard L. Berry (1988), "SERVQUAL: A Multiple-Item Scale for Measuring Consumer Perceptions of Service Quality," Journal of Retailin~, 64 (Spring), 12-37.
Payne, Adrian F. (1988), "Developing a Marketing-Oriented Organization," Business Horizons, (May-June), 46-53.
Perrow, Charles (1973), "The Short and Glorious History of Organizational Theory," Or~anizatdonal Dynamics, Summer.
Peter, J·. Paul and Jerry C. Olse:n (1987), Consumer Behavior Marketin~ Strate~ Perspectives, Homewood, Illinois: Irwin.
Peters, Thomas J. and Robert H. Waterman, Jr. (1982), In Search of Excellence: Lessons From America's Best-Run Companies, New York:Harper and Row Publishers.
Reynolds, Paul D. (1986), "Organizational Culture as Related to Industry, Position, and Performan~e: A Preliminary Report," Journal of Mana~ement Studies, 23 (May), 333-345.
Rieser, Carl (1962), "The Salesman Isn't Dead-- He's Different," Fortune, 66 (November), 124-127.
Rizzo, J., R. J. House, and S. I. Lirtzman (1970), "Role Conflict and Ambiguity in Complex Organizations," Administrative Science Quarterly, 15 (June), 150-163.
Rokeach, M. (1973), The Nature of Human Values, New York: Free Press.
Sathe, Vijay (1983), Implications of Corporate Culture: A Manager's Guide to Action," Or~anizational Dynamics, 12 (Autumn), 5-23.
(1985), "How to Decipher and Change Corporate Culture," in Gainin~ Control of the Corporate Cul.ture, Kilmann, R. H., Saxton, M. J., and Serpa, R., eds., San Francisco: Jossey-Bass, 245.
Rummell, R. J. (1970), AppHed Factor Analysis, Evanston, Illinois: Northwestern University Press.
Saxe, Robert and Barton.A. Weitz (1982), "The SOCO Scale: A Measure of the Customer Orientation of Salespeople," Journal of Marketin~ Research, 19 (Au~ust), 343-351.
Schein, Edgar H. (1965), Or~anizational Psycholo~, Englewood Cliffs, NJ.: Prentice Hall.
(1971), "The Individual, Th~ Organization, and the Career: A Conceptual Scheme," Journal of Applied Behavioral Science, 7, 401-426. .
(1981), "Does Japanese Management Style Have A Message for American Managers?" Sloan Mana~ement Review, 23 (Fall), 55-68.
(1984), "Coming to a New Awareness of Organizational Culture," Sloan Mana~ement Review, 25, 3-16.
192
(1985), Organizational Culture and Leadership, San Francisco: Jossey-Bass.
(1990), "Or'ganizational Culture," American Psychologist, 45 (February), 109-119.
Schneider, Benjamin and C. J. Bartlett (1968), "Individual Differences and Organizational Climate: The Research Plan and Questionnaire Development," Personnel Psychology, 21 (Autumn), 323-333 .·
(1980), "The Service Organization: Climate· is Crucial," Organizational Dynamics, (Autumn), 52-~5.
and David E. Bowen (1984) ;. "New S'ervices Design, Development and Implementation and the Employee," in Developing New Services, George, William R. and Marshall, Claudia e¢s .· , Chicago: American Marketing Association; 82-101.
(1985), "Notes on Climate and Culture,'" in Creativity in Services Marketing·: What's New. What Works. What's Developing, M. Venkatesan, Diane M. Schmalensee, and Claudia Marshall eds., Chicago: American Marketing Association, 63-67.
Schroeder, Larry D., David L. Sjoquist, and Paula E. Stephan (1986), Understanding Regression Analysis, Newbury Park, California: SAGE Publications, Inc. ·
Sethia, N. K. and M. A. Von Glinqw 0.985), "Arriving at Four Cultures by Managing the Reward System," in Gaining Control of the Corporate Culture, Kilmann, R. H., Saxton, M. J., and Serpa, R., eds., San Francisco: Jossey-Bass, 400-420.
Shapiro, Benson P. (1.9B8), ~'What The Hell Is Market Oriented?" Harvard Business Revlew, 66 (November-December), 119-125.
Siehl, Caren and Joanne Martin (1981), "Learning Organizational Culture," Working paper, Graduate School of Bus·iness, Stanford University. ·
Sims, H. P. and A. D. Szilagy (1976), "Job Characteristic Relationships: Individual and Structural Moderators·," Organizationa Behavior and Human Performance, 17 (December), 211-230.
Smircich, Linda (1~83),. "Concepts of Culture and Organizational Analysis," Administrative Science Quarterly, 28 (September), 339-358. .
_____ , and Marta Calas (1987), ''Organiz,ational Culture: A Critical Assessment," in Handbook of Organizational Communication: An Interdisciplinary Perspective, F. Jab lin et al., ·eds. ,Newbury Park,· CA: Sage 'Publications,· Inc., 228-263.
Smith, Adam (1776), An Inquiry into the Nature and Causes of the Wealth of Nations, ed. by Edwin Cannon from the text of 5th ed'., New York: Modern Library.
Solomon, Michael R., Carol Surprenant, John A. Czepiel, and Evelyn G. Gutman (1985), A Role Theor-y Perspective on Dyadic Interactions: The Service Encounter," Journal. of Marketing, 49 (Winter), 99-111.
193
Spiro, Rosann L. and William D. Perreault, Jr. (1979), "Influence Use of Industrial Salesmen: Influence Strategy Mixes and Situational Determinants," Journal of Business, 52 (July), 435-455.
Strong, E. K. (1925), "Theories of Selling," Journal of Applied Psychology, 9 (January), 75-86.
Swartz, M. and D. Jorden (1980), Culture: An Anthropological Perspective, New York: John Wiley.
Teas, R. Kenneth (1981), "An Empirical Test of Models of Salespersons' Job ExpectB;ncy and Instrume:ntality Pe~ceptions," Journal of Marketing Resear~h, ~8 (M~y), 209~226.
Tichy, Noel M. (1982), Managing Change Strategically: The Technical, Political, and Cultural Keys," Organizational Dynamics, (Autumn), 59-80.
Tolman, E. C. (1932), Purposive Behav~or in Animals and Men, New York: Century. ·
Toto, Joseph (1986), "Eight Charact+eristics of Organizational Effectiveness," Personnel Journal, 65 (May), 35-41.
Tuckman, B. W. (1965), "Development Sequence in Small Groups," Psychological Bulletin, 63, 384~399.
and M.A. C. Jenson (1977), "Stages of Small Group Development Revisited," Group and Organization Studies, 2, 419-427.
Tyagi, Pradeep K. (1982), "Perceived Organizational Climate and .the Process of Salesperson Motivation," Journal of Marketing Research,-19 (May), 240-254.
(1985), "Relative Importance of Key Job Dimensions and Leadership Behaviors in Motivation Salesperson Wo-rk Performance," Journal of Marketing, 49 (Summer), 76-86. ·
Uttal, B. (1983), "The Corporate-Culture Vultures," Fortune, (October 17).
VanMaanen, J. and E. H. Schein (1979), "Toward c:t Theory of Organization Socialization," Researcli on Organization Behavior, 1, 209-264.
Vroom, V. H. (1964), Work. and Motivation, New Yo:r:k: John Wiley and Sans, Inc.
Walker, Orville C., Jr., Gilbert A. Churchill, Jr., and Neil M. Ford (1975), "Organizc!l.tional Determinants of the Industrial Salesman's Role Conflict and Ambiguity," Journal of Marketing,. 39 (January), 32-39.
---=---=' , and (H77), Metivation and Performance in Industrial Selling:' Present Knowledge and Needed Research, '1 Journal of Marketing Research, 14 (May), 156-168.
Wallach, Ellen J. (1983), "Individuals and Organizatiens: The Cultural Match," Training and Development Joutnal, (February), 29-36.

194
Weber, Max (1946), 11 Class, Status, and Party, .. in H. Gerth and C. W. Mills eds., From Max Weber: Essays in SocioloEy, New York: Oxford University Press.
Webster, Frederick W. (1968), "Interpersonal Communication and Selling Effectiveness, .. Journal of MarketinE, 32 (July), 7-13.
(1981), "Top Management's Concerns About Marketing Issues For The 1980's,~• Journal of MarketinE, 45 (Summel:."), 9-16.
(1988), "The Rediscovery of, the Marketing Concept, 11 Business Horizons, (May-June) 29-39.
Weick, K. (1979), "Cognitive Processes In OrganizatioRs," in Research in OrEanizational Behavior, Straw, 1h ed. , Greenwich, CT: JAI, 41-74. .
Weitz, Barton A. (1981),. 11 Effectiveness in Sales Inte.ractions: A Contingency Framework," Journal of Marketin'g, 45 (Winter), 85-103.
-----=-' Harish Sujan, and Mita Sujan (1986), "Knowledge, Motivation, and Adaptive Behavior: A framework for Improving Selling Effectiveness," Journal of Marketing, ·so (October), 174-191.
and Rol?in Wensley, "Chapter 19: Organizatianal Culture," Marketing Strategy: AdvantaEe in Action, unpublished first draft of book. ·
Wilkie, William (1986), Consumer Behavior, New York: John Wiley & Sons.
Wilkins, Alan and Joanne Martin .(1980), "Organizational Legends," Working paper, Graduate Scho·ol a,f Business, Stanford University.
and William Ouchi (1983), "Efficient Cultures: Exploring the Relationship betweeR Cultur·e and Organizational Performance," Administrative Science Quarterly, 28 (September), 468-481.
Williams, Michael R. and Joshua Wiener (1990), "Does the Selling Orientation - Customer Orientation (SOCO) Scale Measure Behavior or Disposition?" in Enhancing KnowledEe Development in MarketinE, Chicago: America~ Marketing Assocfation.
Wiener, Yoash (1988), "Farms of Value Systems; A Focus on Organizational Effecti~eness an9- Cultural Change and Maintenance," Academy of Management Re~iew, 13, 534-545.

APPENDIX A
INITIAL ITEM LISTINGS
195
196
CUSTOMER ORIENTED BEHAVIOR
A. Possesses a Wi~lingness to Help Customers
1. I try to match a customer's pr~blem with a product that helps solve ·that problem. .
2. I prefer to sell as much as I can· rath~r than working to satisfy a customer. (-)
3. I am sincerely interested in solving the problems of my customers. 4. I try to close the sale rather than take t.ime'to discover the
customer's problems. (-) 5. I desire, to help custo.mers make satisfactory purchase decisions. 6. I am never too busy to help a customer. 7. I behave toward customers in a way that conveys my desire to help
the customer. 8. I am available to customers when they need me. 9. I try to give customers individual attention.
10. I often make the sale withqut exploring the needs of the customer. (-)
B. Assesses Customer Needs throuSb 2-way Communications
1. I encourage customers to discuss their needs with me. 2. I use time to persuade a customer to buy rather than trying to
di.scove-r his needs. (-) 3. I attempt to figure out the, needs of a customer. 4. I begin se·lling a product before exploring a customer's needs. (-) 5. In order to keep from losiRg the sale to th~ competition, I will
close the customer withou~ a full understanding of his,needs. (-) 6. I actively work w~th ·customers to better understand their specific
needs. 7. I am inquisitive in exploring the customer's needs. 8. I take time to listen to the customer- in order to better
understand their problems. 9. Intense competition re,quire·s that I emphasize making the sale
rather than taking time to disco¥er the specific needs of the customer. (-)
10. I listen to the customer in order to find out what kind of product would be most helpful to them.
C. Builds Value by c:lffering ·Ero~ucts That Satisfy Customer Needs
1. I try to help customers achieve their goals. 2. 'Wh.en showing a product, I have the customer's best interest in
mind. 3. I make more sales by not attempting to match p·roducts to specific
customer needs. (-) 4. I provide caring and i.ndividualized attention t:o match the
customer's needs. , 5. I tailor the product to the particular needs of the customer. 6. I am flexible in adapting to the changing needs and demands of
different customers. 7. I am oriented to the interests of .the customer. 8. I offer the customer products based on his speeific needs.
9.
10.
D.
1.
2. 3.
4.
5.
6.
7.
8.
9.
10.
E.
1.
2.
3.
4.
5.
6. 7.
8. 9.
10.
F.
1. 2.
3.
4.
5.
I typically offer a standard product to customers rather than adapting it to meet needs of particular customers. (-)
197
I offer the product that is best suited to the customer's problem.
Avoids the Use of Deceitful Practices
I sometimes imply to a customer that something is beyond my control when it is not. (-) I pretend to agree with customers in order to please them. (-) I try to sell a customer all.! can convince them to buy, even if I think it is more than they should buy. (-) I decide what products to offer on the basis of what I can convince customers to buy, not dn the basis of what will satisfy them in the long run. (-) I attempt to give customers an accurate description of what the product or service will do for them. · I often tell the customer what I think they want to hear in order to make the sale. (-) I am willing to disagree with a customer in order to help him make a better decision. It is necessary to stretch the truth in describing a product to a customer. (-) I paint too rosy a picture of my products, to make them sound as good as possible. (-) I try to answer a customer's questions about products as correctly as I can.
Is Understanding Rather Than Manipulative in Behavior
I watch for weaknesses in a customer's personality so I can use them to put pressure on him to buy. (-) If I am not sure a product,is right for a customer I will still apply pressure to get him to buy. (-) I try to influence customers' decisions by giving the customer information rather than using pressure. If it is needed to get a sale, I use manipulative behavior to influence the customer. (-) I work with customers on a basis of mutual respect and understanding rather than manipulating them to purchase. I avoid manipulative tactics when dealing with customers. I sometimes use overpowering behavior when responding to the objections of a custemer. (-) I use the soft-sell approach to selling rather than domination. I use high pressure tactics to c.lose the sale. (-) I work with customers on a basis of mutual understanding rather than using manipulative tactics.
Represents the Customer to the Company
I communicate the needs of the customers back to the company. I often make suggestions to the company as to how we can better serve customers. · I frequently communicate with management regarding the problems of customers. I intercede en behalf of the customer when the customer has a problem with our company or product. I try to work for the best interest of the customer in dealing with my company.
6.
7. 8.
9.
10.
G.
1. 2. 3.
4.
5.
6.
7.
8.
9.
10.
H.
1. 2. 3.
4.
5. 6.
7.
8.
9.
10.
198
I work with different departments within the company on behalf of customers. -My loyalty is to the company over the customer .. (-) I work for the best interest of the company over the interests of the customer. (-) I seldom communicate with management regarding the needs or problems of customers. (-) I often assist the company in developing products and services based on customer problems.
Adopts the Double-Win Philosophy
I treat a customer as a riv,al. (-) I try to achieVE\ my pe+sonal goals by satisfying customers. I work,to achieve company objectives while simultaneously solving customer problems. · ' I try to build a relationship with customers based on mutual trust and confidence. Sound purchase decisions based on customer needs allow the company and the customer to mutually benefit from a sale. In selling products, I try to represent the interests of the company and the interests of the customer simultaneously. By understanding the needs of the company and the customer, I build long-term relationships that are mutually beneficial. I suggest products that maximize.benefits to the company, even when they are not the best match for a customer problem. (-) I find it diffic~lt to sell products that mutually solve customer problems and achieve company objectives. (-) My orientation allows me to work with the company in offering products based on customer des·ires and needs, thus both the company and the customer win benefits from the sale.
Evaluates Customer Satisfaction and Provides Follow-up Activities
I emphasize service after the sale. I measure and evaluate the customer's satisfaction after the sale. After the sale, I provide conscientious follow-up to be sure everything was handled properly. I don't contact the. customer following the sale, it is somebody else's job to take_care of problems. (-) I seek out and handle customer complaints quickly and efficiently. I present and sell products, othe+ people in our company provide follow-up service. (-) I show my sincere appreciation for the purchase at the close of each sale. I leave post-sale activ.ities and· problems for the customer- service people to handle. (-) ', · I purposely give customers every opportunity tq, disclose their true feelings and then decide what action should be taken to alleviate the problem. I follow-up my sales in different ways to tell the customer that I appreciate their business and determine if they are satisfied with their purchase.
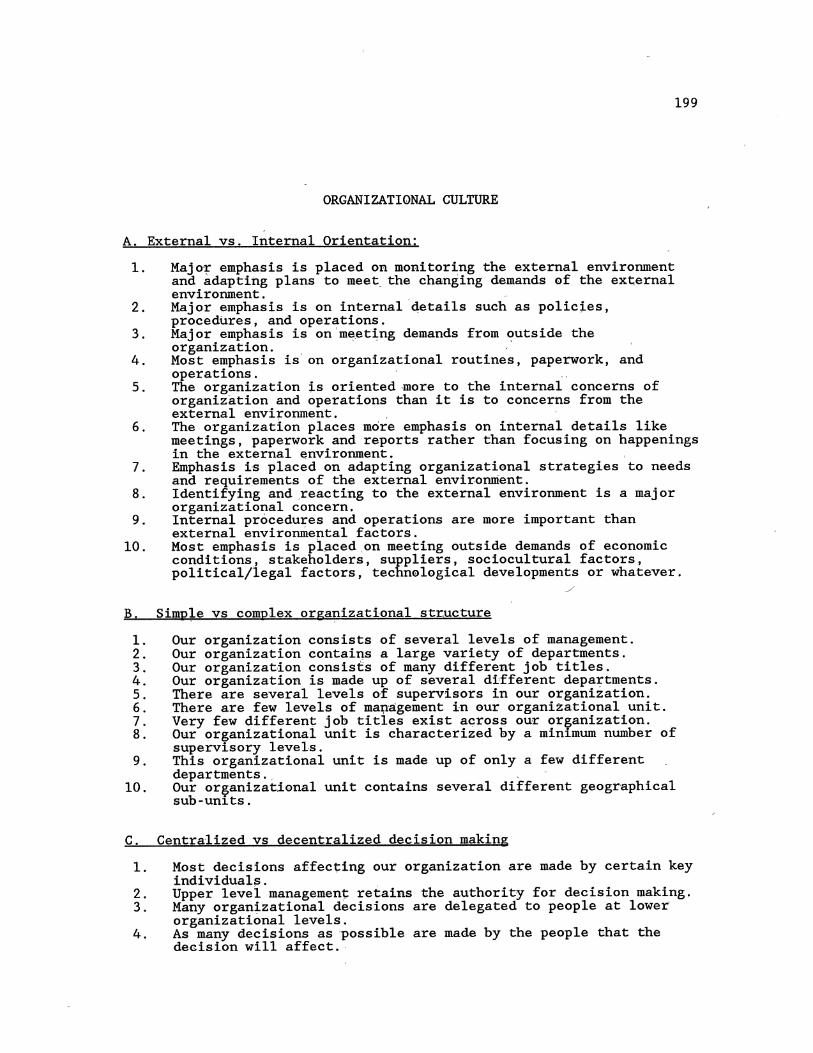
199
ORGANIZATIONAL CULTURE
A. External vs. Internal Orientation:
1.
2.
3.
4.
5.
6.
7.
8.
9.
10.
MajoT emphasis is placed on monitoring the external environment and adapting plans to meet, the changing demands of the external environment. , Major emphasis is on internal 4etails such as policies, procedures, and operations. Major emphasis is on'm~et~ng demands from ~utside the organization. Most emphasis is' on organizational routines, paperwork, and operations. _, The organization is orientedmore to the internal concerns of organization and operations than it is to concerns from the external environment. , The organization places more emphasis on internal details like meetings, paperwork and reports rather than focusing on happenings in the external ~nvironment. , Emphasis is placed on adapting organizational strategies to needs and requirements of the external envir.onment. Identifying and,reacting to the external environment is a major organizational concern. Internal procedures and operations are more important than external environmental factors. Most emphasis is pl~ced,on meeting outside demands of economic conditions, stakeholders, suppliers, sociocultural factors, political/legal factors, technological developments or whatever.
_/
B. Simp~e vs complex orga~izational str.ucture
1. Our organization consists of several levels of management. 2. Our organization contains a large variety of departments. 3. Our organizat·ion consists of many different job titles. 4. Our organization is made up of several di·fferent depa~tments. 5. There are several levels of supervisors in our organization. 6. There are few levels of ma~agement in our organizational unit. 7. Very few different job titles exist across our organization. 8. Our organizational unit is characterized by a minimum number of
supervisory leveLs. 9. This organizational unit is made up of only a few different
departments .. 10. Our organizat.ional unit contains several different geographical
sub-units.
C. Centralized vs decentralized decision making
1. Most decisions affec~ing our organization are made by certain key individuals.
2. Upper level managemen~ retains the authority for decision making. 3. Many organ~zational decisions are delegated to people at lower
organizational levels. 4. As many aecisions as ·possible are made by the people that the
decision will affect.·
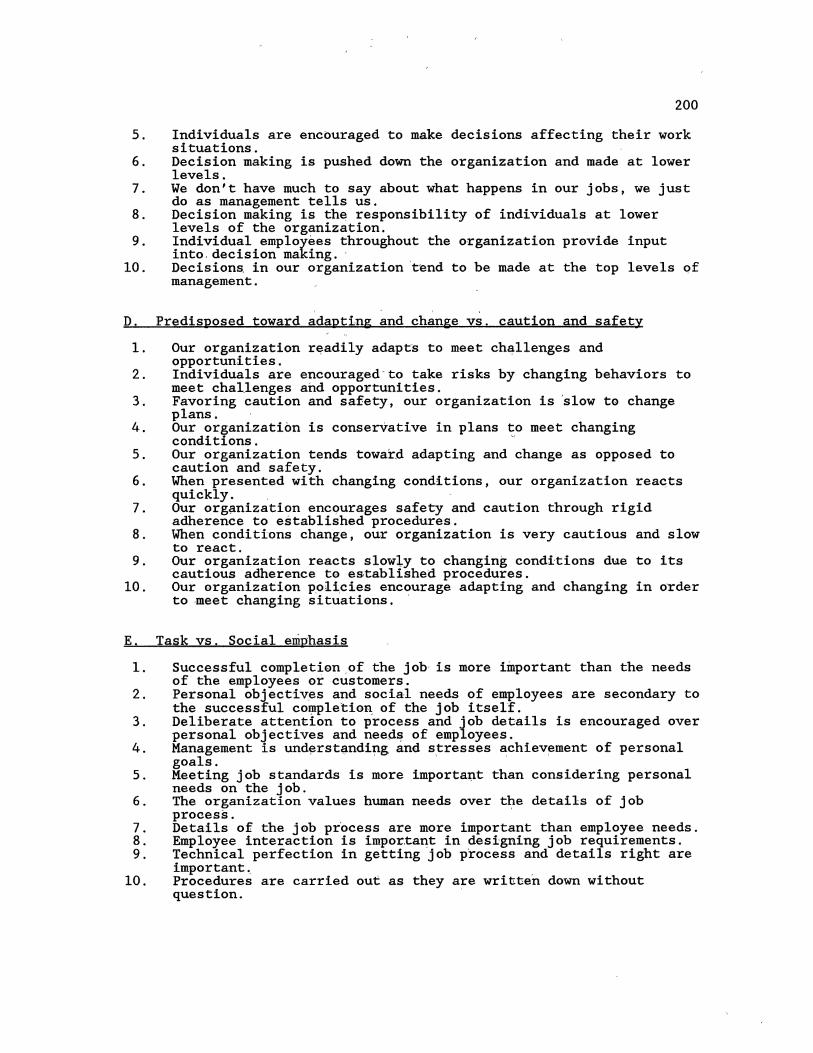
5.
6.
7.
8.
9.
10.
D.
1.
2.
3.
4.
5.
6.
7.
8.
9.
10.
E.
1.
2.
3.
4.
5.
6.
7. 8. 9.
10.
200
Individuals are encouraged to make decisions affecting their work situations. Decision making is pushed down the organization and made at lower levels. We don't have much to say about what happens in our jobs, we just do as management tells us. Decision making is th~ responsibility of individuals at lower levels of the organization. Individual employees throughout the organization provide input into decision making. , Decisions, in our organization tend to be made at the top levels of management.
Predisposed toward adapting and change vs. caution and safety
Our organization readily adapts to meet ch~llenges and opportunities. Individuals are encouraged to take risks by changing behaviors to meet challenges and opportunities. . Favoring caution and safety, our organization is slow to change plans. Our organization is conservative in plans to meet changing conditions. ' Our organization tends toward adapting and change as opposed to caution and safety. When presented with changing conditions, our organization rea~ts quickly. Our org~nization enc9urages safety and caution through rigid adherence to established procedures. When conditions change, our organization is very cautious and slow to react. Our organization reacts slowly to changing conditions due to its cautious adherence to es.tablished procedures. Our organization policies encourage adapting and changing in order to meet changing situations.
Task vs. Social emphasis
Successful completion.of the job is more important than the needs of the employees or customers. Personal objectives and social needs of employees are secondary to the successful completio~ of the job itself. Deliberate attention to process and _1 ob details is encouraged over personal objectives and need~ of employees. Management is und~rstanding, and s,tresses achiev~ment of personal goals. Meeting job standards is more important than considering personal needs on the job. The organization values human needs over the details of job process. Details of the job pr·ocess are more important than employee needs. Employee interaction is important in designing job requirements. Technical perfection in getting job process and details right are important. Procedures are carried out as they are written down without question.
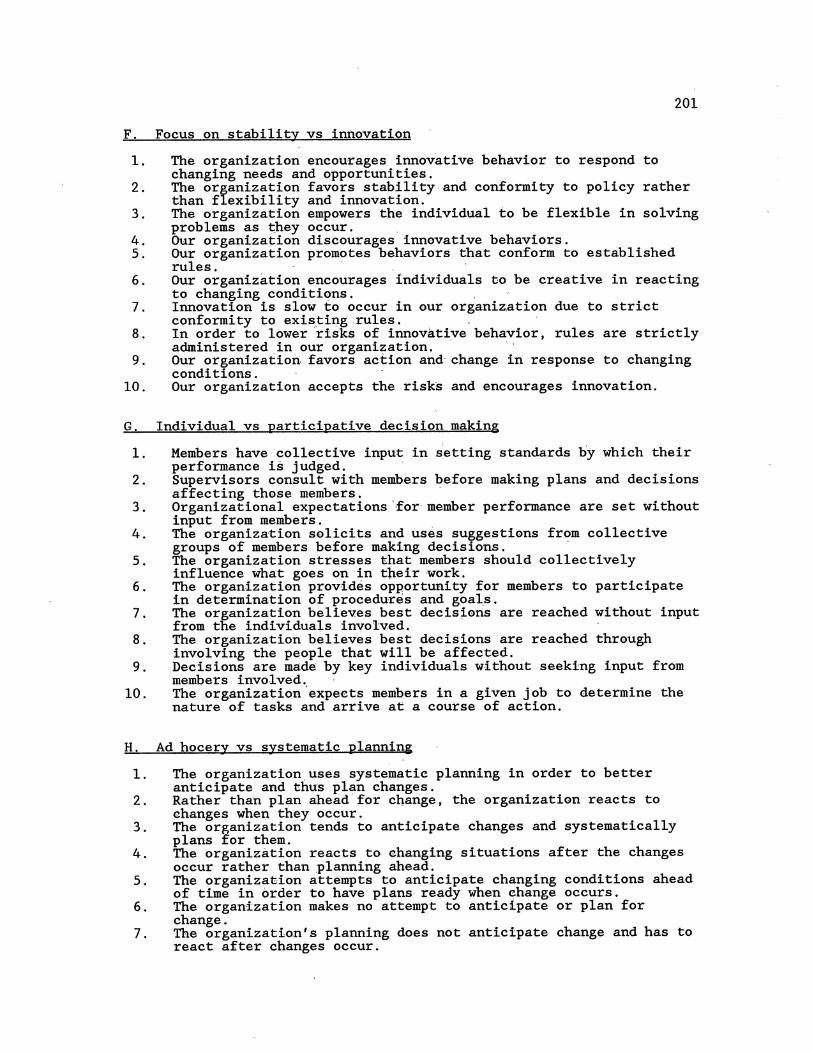
F.
1.
2.
3.
4. 5.
6.
7.
8.
9.
10.
G.
1.
2.
3.
4.
5.
6.
7.
8.
9.
10.
H.
1.
2.
3.
4.
5.
6.
7.
Focus on stability vs innovation
The organization encou~ages innovative behavior to respond to changing needs and opportunities.
201
The organization favors stahility·and conformity to policy rather than flexibility and innovation. The organization empowers the individual to be flexible in solving problems as ~hey occur. , Our organization discourages innovative behaviors. Our organization promotes behaviors that conform to established rules. · , Our organization encou~ages individuals to be creative in reacting to changing conditi~ns. . Innovation is slow to occur in our organiz,ation due to strict conformity to exi~ti~g.rules. In order to lower risks of innovatiye behavior, rules are strictly administered_in our organi~ation. Our organization favors action and-change in response to changing conditions. Our organization accepts the risks and encourages innovation.
Individual vs participative decision making
Members have collective input in s'etting standards hy which their performance is judged. · Supervisors consult with members before making plans and decisions affecting those members. -Organizational expectations '£or-member performance are set without input from members. The organization salicits and uses suggestions from collective groups of members before making decisions. -The organization stresses that members should collectively influence what goes on·in their work. The organization prov·ides op-gortunity for members to participate in determination of procedures and goals. The organization believ.es best decis~ons are reached without input from the individuals involv.ed. The organization believes best decisions are reached through involving the people that will be affected. Decisions are made by key individuals without seeking input from members involved. · The organization'expeets members in a given job to determine the nature of tasks and arrive at a course of action.
Ad hocery vs systematic planning
The organization,uses systematie planning in order to better anticipate and thus plan changes. Rather than plan ahead'for change, the organization reacts to changes when they occur. The organization tends to anticipate changes and systematically plans for them. The organization reacts to. changing situa~ions after the changes occur rather than ,planning ahead. The organizaEion attempts to anticipate changing conditions ahead of time in order to have· plans ready when ~hange occurs. The organ~zation makes no attempt to anticipate or plan for change. Tb.e organization's planning does not anticipate change and has to react after changes occur.
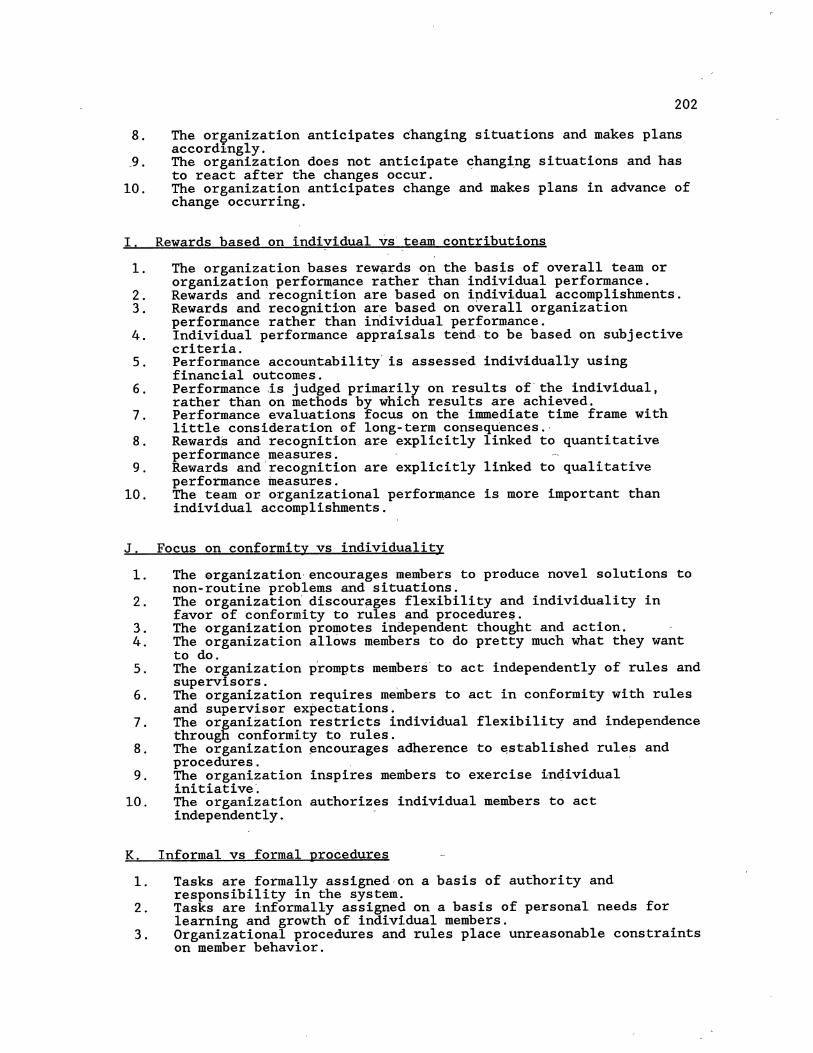
8.
9.
10.
I.
1.
2. 3.
4.
5.
6.
7.
8.
9.
10.
J.
1.
2.
3. 4.
5.
6.
7.
8.
9.
10.
K.
1.
2.
3.
202
The organization anticipates ehanging situations and makes plans accordingly. The organization does not anticipate changing situations and has to react after the changes occur. The organization anticipates change and makes plans in advance of change occurring.
Rewards based on individual vs team contributions
The organization bases rew~rds op the basis of overall team or organizatio~ performance rather than individual performance. Rewards and recognition are based on ipdividual accomplishments. Rewards and recognition are based on overall organization performance rather than individual performance. Individual performance appraisals tend to be based on subjective criteria. . Performance accountability' is assessed individually using financial outcomes. Performance is judged primarily on results of' the individual, rather than on methods by which results are achieved. Performance evaluations focus on the immediate time frame with little consideration of long-term consequences.· Rewards and recognition are explicitly linked to quantitative performance measures. Rewards and recognition are explicitly linked to qualitative performance measures. The team or organizational performance is more important than individual accomplishments.
Focus on conformity vs individuality
The organization encourages members to produce novel solutions to non-routine problems and situations. The organization discour~ges flexibility and individuality in favor of conformity to rules and procedure~. The organization promotes independent thought and action. The organization allows members to do pretty much what they want to do. The organization prompts members to act independently of rules and supervisors. . The organization requires members to act in conformity with rules and supervisor expectations. The organization restricts individual flexibility and independence through conf~rmity to rules. The organization encourages adherence to established rules and procedures. The organization inspires members to exercise individual initiative. The organization authorizes individual members to act independently.
Informal vs formal procedures
Tasks are formally assigned on a basis of authority and responsibility in the system. Tasks are informally assigned on a basis of personal needs for learning and growth of individual members. Organizational procedures and rules place unreasonable constraints on member behavior.
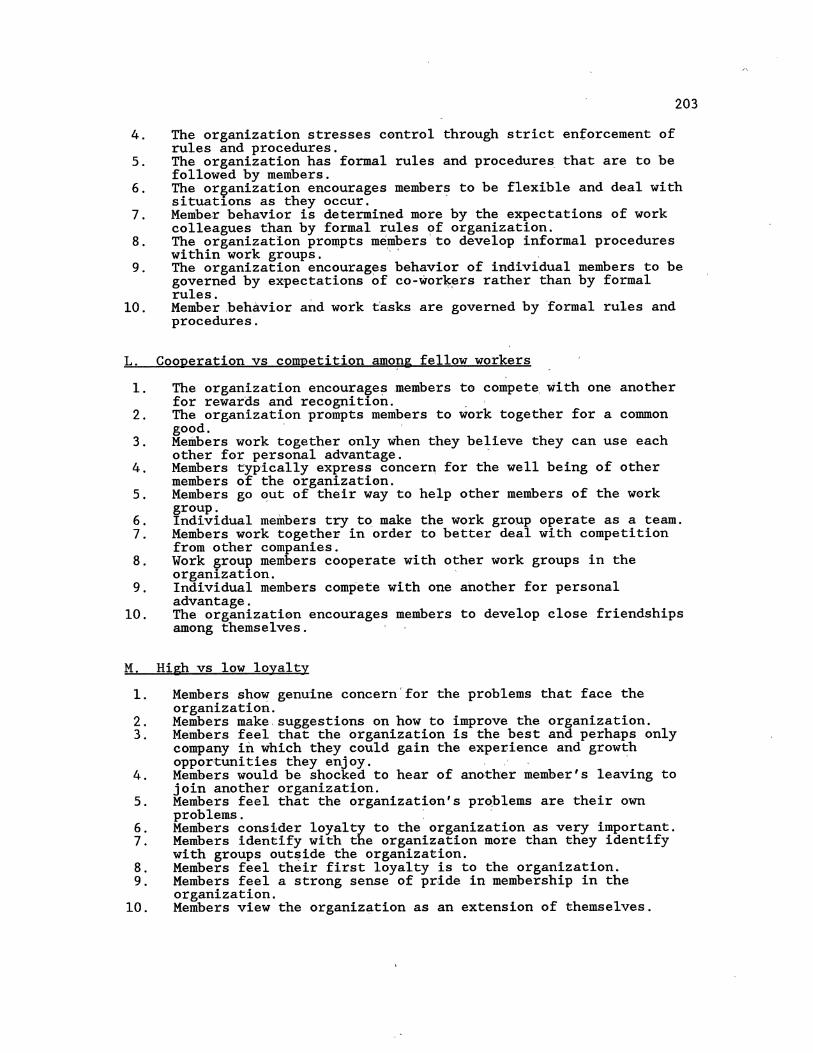
4.
5.
6.
7.
8.
9.
10.
L.
1.
2.
3.
4.
5.
6. 7.
8.
9.
10.
M.
1.
2. 3.
4.
5.
6. 7.
8. 9.
10.
The organization stresses control through strict enforcement of rules and procedures. The organization has formal rules and procedures that are to be followed by members.
203
The organization encourages members to be flexible and deal with situations as they occur. Member behavior is determined more by the expectations of work colleagues than by formal rules of organization. The organization pro~pts members'to develop informal procedures within work groups. ·· The organization encourages behavior of individual members to be governed by expectations of co-wor~~rs rather than by formal rules. Member .behavior and work t'asks are governed by formal rules and procedures.
Cooperation vs competition among fellow workers
The organization encourages members to compete with one another for rewards and recognition. The organization prompts members to work together for a common good. · Members work together only when they believe they can use each other for personal advantage. · Members typically express concern for the well being of other members of the organization. Members go out of their way to help other members of the work group. Individual members try to make the work group operate as a team. Members work togethe~ in order to better deal with competition from other companies. Work group members cooperate with other work groups in the organization. Individual members compete with one another for personal advantage. The organization encourages members to develop close friendships among themselves.
High vs low loyalty
Members show genuine concern'for the problems that face the organization. Members make. suggestions on how to improve the organization. Members feel that the organization is the best and perhaps only company in which they could gain the experience and growth oppor·tuni ties they enjoy. Members would be shocked to hear of another member's leaving to join another organization. Members feel that the organization's problems are their own problems. · Members consider loyalty to the organization as very important. Members identify with the organization more than they identify with groups out~ide the organization. Members feel their first loyalty is to the organization. Members feel a strong sense of pr·ide in membership in the organization. Members view the organization as an extension of themselves.
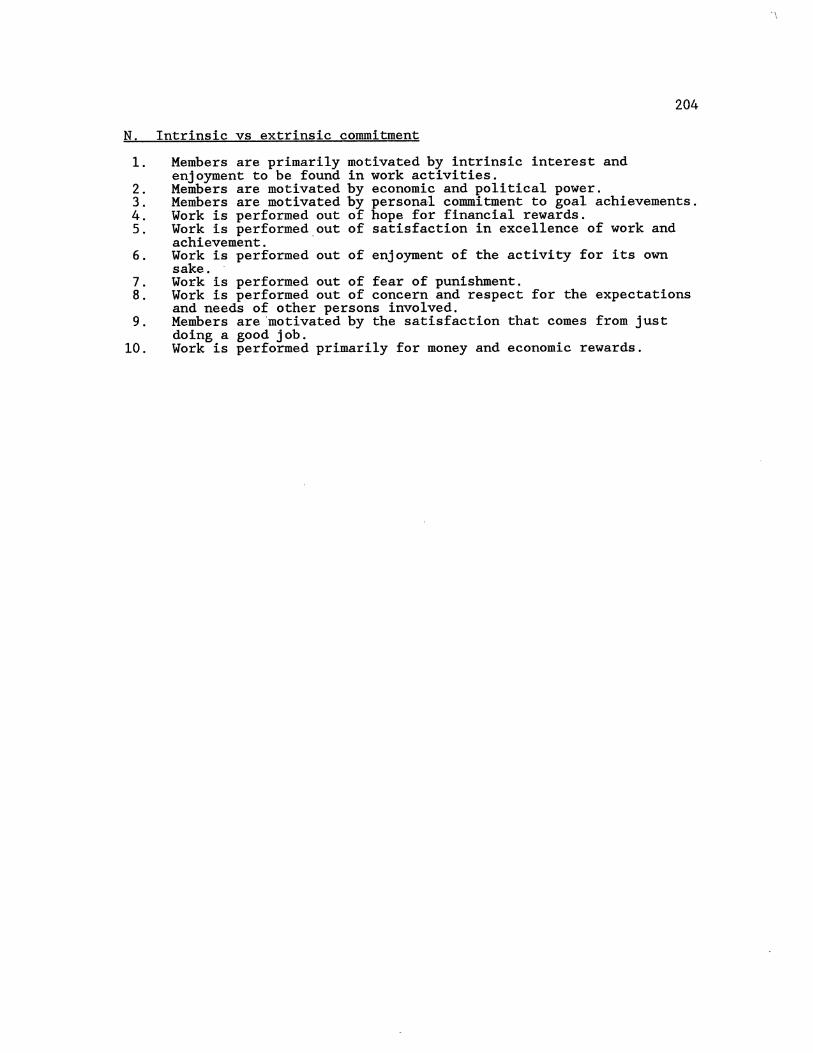
N.
1.
2. 3. 4. 5.
6.
7. 8.
9.
10.
Intrinsic vs extrinsic commitment
Members are primarily motivated by intrinsic interest and enjoyment to be found in work activities.
204
Members are motivated by economic and political power. Members are motivated by personal commitment to goal achievements. Work is performed out of hope for financial rewards. Work is performed_out of satisfaction in excellence of work and achievement. Work is performed out of enjoyment of the activity for its own sake. -Work is performed out of fear of punishment. Work is performed out of concern and respect for the expectations and needs of other persons involved. Members are 'motivated by the satisfaction that comes from just doing a good job. Work is performed primarily for money and economic rewards.
APPENDIX B
THE PRE-PILOT SURVEY INSTRUMENT
205

206
INSTROCTJONS -- SECTIOO. 1!£ This uctlon Is deslqMd to eu•lne the etwvirol"'llent within ..t.lch you work. In co~~pietlng this portion of the survey, please consider each st•teHnt AS lt r~rfers to your •or2anizational work group or unit• -- the group of people, lncludlnq supervi1ors t1nd ca-
-~-----'!!!Qr er:s,-walh __ who• you co-only tnteract ln the orCJ•nht1tlon. For exo111ple, soH people work and Interact wlth-people __ thro!Jghout the entire orqaniutlon. Consequ~rntly, thelr rel•v•nt work group or unit would be fndivldu•.ls- throughout _the_ lt1rger oro•niutlon. Other people co-nly 1110rlr with • .are specific set 'of sup~rrvisors t1nd co-worli:ers, perh•ps within t1 certt1in division or sub-unit of the org•nilt1tion. In this c•se, the indlvldu•ls fro• thls division or sub-unit would he your •oro•niutlon•l t.ork qroup.• Another type of •org•nh•tloNI NOrlc 9roup• could be co-.poslrd of sU11ervlsors t1nd co-workers fro• s~rver•l dlr hPrent operating d1 vls1ons or sub-units of the lo1rg•~ ·org•nht1tion.
As you consid~rr your organlz•lioNI NOrk 9roup, 1rxpross yOUr t1gree-ent or dts•gree .. nt with e•ch of the following st•te111enh by carclang th• nu..tler th•t best rtppresents your opinion. Ple•se respond to each st•t.-ent •s it rel•tes to your p•rttcul•r orqantzation•l work unit or qroup--the qroup of peopil' .. ath ..t1o• you co..anly work t1nd interact in your organization.
- '
Ill SIJSI.i IJSM££ 151 Sl.llillllT IlliG[[
121 II SMi11Et 161 AliRE£
Ill Sl.l511R1 tiWII££ m SlROIIIil1 16G£E
1\1 IIEITI(I AliRE£ Ill tlsat
Fer tuaple, if JH carclt4 • 5 ea the shttunl hle•,-r•• ••I~ h indicah119 lhll 1" SllliiiTU MiR[£ 1IU tht ~htunt.
STEJ IISAiiii[E
, , I 2 3
SJROIIIilY A611£E
5 ' 7
STIII!IIIil.Y IISA61EE
X I. Thtrt 1~ uu CIIICtrl r,.mli119 iniHIIII-4tbih lilt anh .. s, 4vohs, p~per•rt aNI uporls lllu 111~ hpptlllfiS 11 the trltnil tnfirtutll ••••••••••• •••••••••••••••• ••••••••••• ··"·····
X 2. INifiMII fln1~ilily •n4 lndt~~rndenu is rntrutt4 llluv9• uafor••lr lo r~ln ••••••••••••
X 3. Eapltrtts tJPIUIIy tsprns nnun ftr a.e llfll •ti .. tf '"tr tapltytts ••••••••••••••••••••
X 4. [lpltf'H ut ••••••" to 4tnltp clest friN\Jitps 1u19 lhttsrlns •••••••••••••••••••••••
X !1. Elpltrtts art Mhnttd •r ptruul coa•il~t•t h 1111 acluf'frlflls ••••••••••••••••••••••••••
X&. l~nlilf'" 11111 rtac h .. h lhr ulrn•l tlflrtAitlt Is • ujer unur11 ••••••••••••••••••••••
X7. Eapltyns shew •t••• n••un fer lbr prlillrM t111t fact lh trt•nautiu ••••••••••••••••••• . XI. MtiSI~t•h ur 111liJ19ly 11lt h lttl c•allf19ts IN tpptrt1nitlrs •••••••••••••••••• ··••••••
Xt. fhtn an ~ewrral Intis tf suptr_wJ.Jtn ••••• -.-,.;~.-~~-.:~.:.::.: •••••••••••••••••••••••••••••••
'-- _____ -XIO.--IIa~iiiiCh ~~.;;1.~~c • ..4 slmm ,ltlllfftlfll tf ptrson•l tuls ••••••••••••••••••••••
XII. l~n~nlnr hhn1tr n rnuura9H 11 rnpe1sr te clla .. 119 11r~s ~fttl opperlaaati~s •••••••••••
Xli!. IIJJtr fl!lbiSIS n pllu4 1ft tOiittriiMJ Ut e•ttrul HfiUIIItll and 1lapti19 piiH h IHI tltf C~llfl .. 4f818dS tf tf&r tlltrn•l fiYUiaetal •••••••• ••••••••••••••••••••••••••••••••••••
Xl3. (•pltJH hhfitr IN nrk lnts ue tonnd •r ftrul nles and puudaru ••••••••••••••••
XU. lttn11• 11t119 is lh rtspons"llllr tf tldi•l .. als at l,.tr Intis tf lle trtlll,utll• ••••
X'"i. llljer tlpiln11 is •• i•ttrnd ~tblls ucll n tr,tllilllitllll r"tines, pelicin, paper•rk, II'Mf tprr•l•••'··••••••••••••••••••••• •••••••••••••••••••••••••••~•••••••••••••••••••••••••••
X.,. hlihratt •ttrnli•• tt Jo• drhlh Is tnctar'9PI tYtr prn•n•l elmcliYts IM IfNI tf ,.,,.,,,, .......... ······· ................................................................. . n.US£ &D 10 lHE KElT rACE
2
2
l
l
2
l
l
l
2
l
z 2
l
2
2
3 ~ s ' 3 5 ' 3 ~ 5 ' 3 5 ' 3 5 ' 3 5 ' 3 5 '
3 5 ' 3 5 ' ] 5 ' 3 5 . '
3 5 ' 3 5 ' 3 5 ' 3 5 ' l 5 '
STEONiit.Y A&REE
1
7
7
7
1
7
1
7
7
7
7
7
7
7
1
7
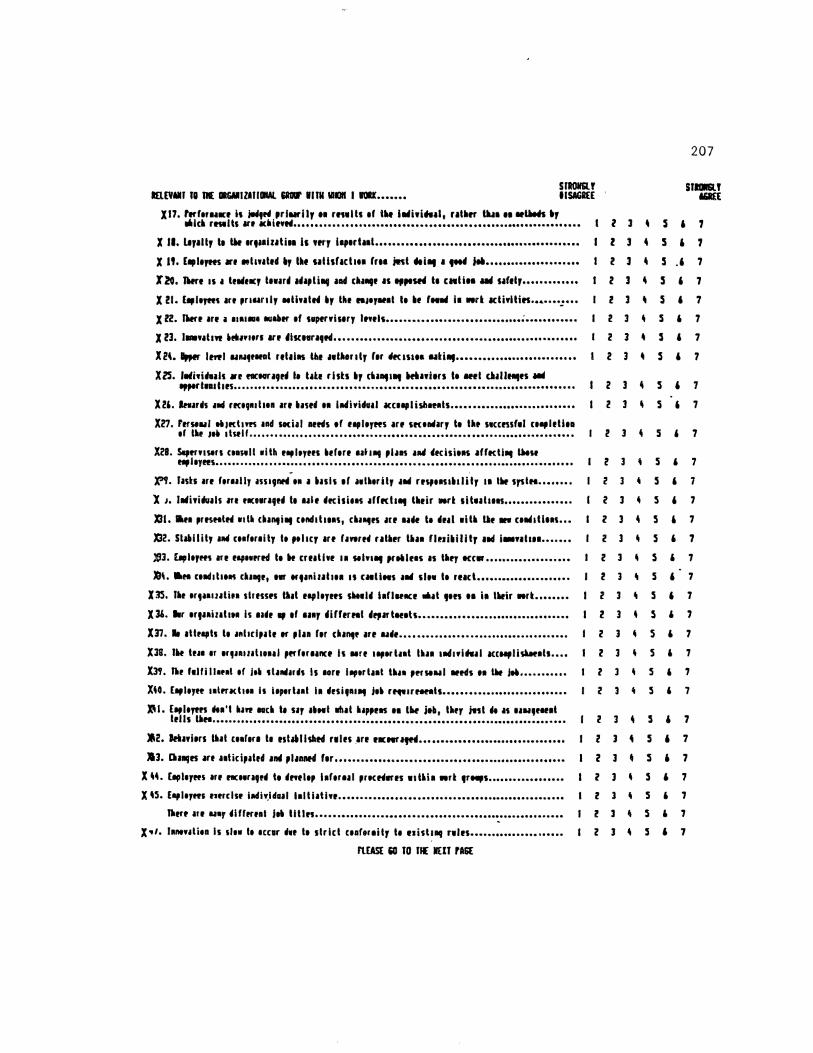
IO.£VMJ fl fll: IIIGMIZATIIIIIAI. Allll' llflllllllll I IOU ••••••• SI'RDN5l' IISAGREE
XJ7. flfftfUKf il i-4fH ,rllllfiJJ tl rtllltl tf illt J .. jyjlftlal, Utllrr tii.J1 II HtMft ., .. ,,. re~~lts 11'1 ••iewft •.•. .•..•.. ••••••••••••••••••••••••••••••••••••••••••••••••••••••• l
X 11. llr•ltr It lllr trt••iutill is nrr ieperl•al .............................................. . z X If, [lpltfMS •• •hntrd 'r llle e~llshch•• fr11 int .. i., 1 ''" ........................ . l
J zo. JHre es • trll4ucr ltt~r4 •4•pli11J •ad cii•IIJ' u .,,.~ te CHtitl 1M 11frtr ........... .. l
X 21. U,ltytts ur ,r••mlr ttllnlri •r the "'''••t te •• fleM I• 11rl Kli•ilies ........ : .. . z X R. lllrfr '" 1 •••••• IUablf tf nprrwiserr ltYfls ............................... ; ........... . 2
X Zl ...... lnt .""''" '" 11Ktlri9H ....................................................... . z X2, • ., iff'fl NutrHat rrliiiiS the ~tl•outr ftr 4ecmea uu., ........................... . 2
X25. llllli•inlls •r ncMrl9t4 t. hh rlsts •r a1 .. 1 .. HllaYien It Htl Udlfll!fl ,_. .,., 1111 tars ...••.•..•.••••••.••••••.••••••...•••••..••••••.•••••• e ••••••••••••••••••••• e •• 2
X2,. lnar~s 111d rKtt••lln ur •ntd •• INiviclul ~euaplislt•r•ls ........................... .. 2
Xl7. flfHNI HIKhYH 1ad social •reels tf tepltytts an uuiNiur te th swccndtl u.,Jrtha tf ll•f JH 1lwll .......................................................................... . 2
X28. S.,rnssen Cll>tll tith '"'''"' •rrerr ,,. • ., ,Jus IN tfteisieiiS 1fftell" IHst "''''"'·· ................................................................................ . z -
pt/. hsh Iff ftriiiJJ ISU9nH Ill I hsh d IIUtrity IN rrsptiSI.JJilr II tw SfSIH ....... . 2
X J. 114iYin•h an t11CIIrl9ttf It 11lr ~Kisi11s 1ffKIJ., tllrir ~art sltuiJ••s ............... . l
XJI. lit• prrsHtttl "" thnti .. unciJIJtas, cll•-.rs Itt uu te ~tal 11111 tile- ctMJtieas .. . l
X32. Stullitr •• c11hnitr h ,.hey •rr fntrr~ u"rr tllu rlrri•illtr ucl l••ahta ..... .. 2
)113, U,ltfHS Iff flptlfrH t1 H cruthr II Hhl .. prHitiS IS tiler ettlf ................... , 2 3
JQ\. a,. et•hhtM ell'"'' •• trtaniutua 11 u•ll•s •• sl .. te rucl ..................... . 2 ]
xn. "' ,,, ... uti .. stnsus , ... '"'''"' slt .. l~ hfllfiiCf •It ''" .. il lwir •rl ...... .. l 3
Xllt .• , trtuiuh•• Is 11~r ., tf '"'' tfifftr"t lrpututh .................................. . 2 3
X37. • 1llraph h lfthripatr ., plu hr cll•nt• 1rr Ntfr ...................................... . z X38. IH tr11 tr trt••miJOIIII plfftrunce h ttrr upertut tha JNJYinal ICt..,Jisunts ... . z 3
~. Be fllflll•••l tf Jt• shlllllutfs Is ton t.,erhal tlla• prrHNI •eels •• lilt lN .......... . l
X40. [aphrrr ••lrr~eh•• Is hptrlut h tfnitllll l•• r~srHftlls ........................... .. 2 l
l\1. £.,1•rrn tfta'l ••" •ell lt "' ''"I 111111 llappriiS 11 IN l•b, tllry iwst 41 n ""''"'•' ltlls litH .•••••.••••••••••••••••••••••••••••••••••••••••••••••••••••••••••••••••••••••••••• 2 1
lli2. IHnlers tllal u.rer1 te rsl,.llshetl rtles _lrr tiCHI'Itftl ................................. . z ]
)1]. Ota .. n •n utitipah4 ancl ,JaiiiiH ftr .................................................... . 2 l
X"· E.,Jerrts '" ncttntfll It tfnrltp laftrul ,rtettltrn wstlia •rt ,,..,,, ................ . z 3
X ,5. E.,ltrrrs rurdsr ildiY.Idaal l•lthtiYr .................................................. .. l l
Brre "' ""' ~Hfrrnl j .. lllln ........................................................ . l 3
X ~I. fanenlitn Is slt1 tt tccar ~~~ te strict uaforaitr t• 11islsaq nln ..................... . z l
FlEAS£ 50 10 Jl( liEU FA6E
3
l
3
3
l
3
3
l
3
3
' ' '
207
STIIIfliU Mil£[
' s ' 7
' 5 ' 7
' s ·' 7
' s ' 7
' 5 ' 7
s ' 7
5 ' 7
s ' 7
5 ' 7
5 ' 7
5 ' 7
5 ' 7
5 ' 7
' 5 ' 7
5 ' 7
5 ' 7
5 ' 1
5 ' 7
5 ' 7
5 ' 7
5 ' 7
5 ' 7
5 ' 7
5 ' 7
5 ' 7
5 • 7
s ' 7
s ' 7
5 ' 7
5 ' 7
5 ' 7

lllUVAIIT TO TilE ORGAIIIZATIOIIAl CROll' UITIIIIHDn I UORr ...... . STROIIGlY IISAGIIEE
) 'B. hployns h~n anpat 11 setting shnduds by 111mb then perlora•nct as Judged ............. .
J "· hphyees ue encoaugrd It pnduce aonl solultons to non·nalane ,ro&leas •nd u lu•tiens ..
X SO. Erpechlaons for upleyu perfor11nce ur set •alhoul anput In• raployrrs ................. .
X 51. Ch~ngang saludaons •n •nlacapdrd •nd phns ue •~dr ~ccordanqly ......................... .
XJC. Ferfor .. nce rvdulatns focus on the aaaeda1h her frue anlh Ialiie consadeuhon tf lenq-hr• CIASf,IJ!RCfS •• , .................... , , , • , ., ., •• , , , • , • , ., , , • •• •• ,.,,,,, •• ,,, ........ .,,.
X.53. bployus qo out of thur ••r h •rip ether repl~yrrs of the worl •ro•p .................... .
., 5'. ~:r;:~~~- ~~~~~~~~. ~ ~. ~:~~:~~~~. ~~~~- ~:. ~~~. ~~~~~~~ ~~~~. ~~. ~~~ .~~ ~ ~~~!~~~. ~~~~. ~~- ~~:~~~ .. X 55. Eaployrrs wort I•9~Uarr ae order to ~rller dell wath coapelalaon fro• other cotp.nan ...... .
X 56. llort 9roup ae•brrs noprutr wath ether •orl gnups an the org•aauhon ................... ..
X 57. lndmduil etployers nr rnuuugrd to coapelr wath one ~nother for person~ I ldv•nhqr ..... .
X5B. Eaployees would br shodrd to hr~r of 1nolhH uployrr's lrn1nq to Jotn 1nolher org1naulaon ............................................................................... .
X59. hphyers ur pra•.raly •olanted by toney 1nd rcono•ac ruuds ............................ .
X&O. hphyers feel lh1l the trglnaulaen's proble1s ue lhear own problus ..................... .
X I. Etployees adenhfy walh thr orq•nauhon •orr lh•n they ld!nhfy 11lh groups ouludr lbe org1nauhon ............................................................................... .
X£2. E•ployrrs 11011 out tf fur of punuh~tnl ................................................... .
X63. hpleyrrs fr!l thrar hut Joy1lty at to the or91n1uhon ................................. ..
X&,. Uort •~ prrf,u!d tal tf enJty~enl of the ICIIYIIy hr ah un ~•lr ........................ .
X65. hpleyrrs an • qavrn ''~ Iff rspedrd to delenalll! lhr n•lurr of luis 1nd urave •I 1 uunr of lela on ........................................................................... .
XI£. Re•Jrds ue hsed oa lh tvenll le11 er org1naulaon perfor••nce .......................... .
'IJ.7. R•lher lh•n p hnn1 nq 1hud1 rue hons to ch1ng~"9 s 1 tu1hons eccur 1fler the ch1ngrs klpprn.
'IJ.B. Th! ergn1utaon rrq~arrs reploy!rs It ut an confort1ly walh ruin 1nd superviSor nprchtaons ............................................................................... .
Xt.9. hsh ur anf,rtdly nsa,nrd on 1 hsu of prrson1l nerds for lennang 1nd growth of andJYaduil uployrr; ....................................................................... .
lOll. Uorl as per for•ed 01t tl concern 1nd nsprct for the r•prchllon~ •nd needs of co-•ortrrs .. .
XII. The orq•naulaon lilt~~ r•ployrn to do pretty IU(h 1111•1 they 11nl to do ................... .
Xl2. hlher lh1n piln 1hr1d ftr chnqr, the erguiuhen reuts to ch1nqes lftrr they occur ..... .
l03. lndandu•l uployees try to ... , lhr •ort group tper•lr a • leu .......................... .
JO\. Ovrnll, our orq•nautnul group as 1 leu ............................................... ..
75. Art you currently upiPyrd' __ YES _NO
2 3
2 3
2
2
3
208
STIIOIIGI.Y A&REE
5 ' s 5 ' 7
5 ' 7
5 ' 7
5
5 6
5 & 7
&
5 6 7
6 7
5 6
5 6
5 7
5 6
5 ' s 6 7
5 6 7
5 6 7
0 7
5 6
6
s 7
5 6
s 5 6 7
5 7
lllut n your 10b posatun aa lhas cup•ny ----------------------------77. How .. ny yens hne you 11lrlrd for thas cup•ny' _____ yrus
APPENDIX C
THE PILOT SURVEY INSTRUMENT
209
210
ORGANIZATIONAL CULTIJRE SURVEY
SECI10N L WORK GROUP Q-lARACITRlSTICS
Th1s sec:Jon IS des1~ed ro examme the enVIronment wtthm wh1ch you work. In completlng thiS pornon of the survey, ple~se cons1der eacn statement as It refers to your "orgamzanonal work grouo or umr" - the group of people, mcluamg s:..pe!"Vlsors and co-workers, wtth whom you commoruy mteracr m tne orgamzanon. For example, some people work and mrer:~cr wtth people throughout the ennre orgaruzacon. Consequendy, their relevant work groue or \Ullt would be lllO!Vlduals througnour the larger orgaruzacon. Other people cr.mmoniy work wtth a more speC".nc set of supeiV!Sor:; and cowor.-ers, pernaps wtthm a cerram dlV1S1on or sub-urur of the orgamzacon. In tlus case, the mdn'!duals from tlus diVISIOn or sl..O·unit would be your "orgaruzanonal work group." Anomer type of "orgamzanonal work group" could be composed of superVISors and co-workers from several different operarmg dlvu1ons or sub-units of the larger organ1zanon.
•.s you c:ms1der your organ=conal work group, express your agreement or dlsagreement wtth each of the foiloWl.!lg sr:ltements by circlmg the number that best re11resents your opm1on. Please respond to each statement as It relates ro your p:!.":lcular orgaruzaconal work urur or group-me group of people wuh whom you commonly worK and mrerac: m your orgamzacon. The meanmgs of the numbe.-s are:
(1) STI\CNGLY DISAGREE (5) S"uGH!l.Y AGREE
(2) DISAGREE (6) AGREE
(3) SUGHTI..Y DISAGREE (4) NEl11IER AGREE OR DISAGREE ' (7) S'ffiONGLY AGREE
For examole, If you c:rcled a 5 on the statement below, you wo~d be indlcarmg rhar you sfigfrtJv agree With the statement.
STI\ONGLY DISAGREE
S'ffiONGl.Y AGREE
:-here are several levels of mana~rement. .••........... - .............•.................. 1 2 3 4 5 6 7
.;. THE SIZE & CQI.IPOSmON OF liY ORGANfZATlONN... I\ORK GROUP:;:---------------------
Wml REGARD TO MY WORK GROUP DESCRIBED ABOVE: STI!ONGLY DISAGREE:
There IS more concern regarding mternal derails (such as meermgs quotas, paperwor'.c, reports, and ere.) than wtd1 happerungs m the exte."TI~ enVIronment. ..• - ..
E:.l!:Hoyees are :no eva ted by pe.-sonal co=tment to goa! aduevements ..•• ·-··--·-:::.;.
:aennfymg and reacrmg to the exte."'lal e.'lVU"onment IS a maJor concem .•.•... -----1. E..-:1ployees snow ge.'lume conce."TI for the problems tnat f;,ce the orgamzadon.--·····
Plan~ are frequendy adJUSted to meet challenges and opporrumces ...............•.. ----··-
T:'lere are several levels of ThperV!Sors ... -·······················-·· ································-······--· Management IS Ul'lOe.-sranamg and s~esses ac!::evement of t.'le employees' ::~ee6 .....• -
!nnovacve behaVlor IS encouraged m response to chan;r.ng neeas a...;d oppor:-:.u::es ..•
Y!aJor =pnasiS :s placed on morutonng the exte."nal e."lVJionment.. ................. - .•........
.!.u:..:or:!"J :or aeClslOn makmg IS frequently aelegared to .:ower levels of the orgLnl:;:.a.oon ...... _ ................................. _____ . _____ .............. _. ······-····················-··--········
A ;naJor parr of employee rewaras and recogrucon IS bas·!d on otena ot.'ler can pe!"fo=ance (thmgs sue.':! as se.'llonry, favon=. posmon, ana etc.) ............. ·-······-
Carl!ful :menoon ro JOb aerails IS more 11I1por.anr than personal needs of employees •.
A ::l3JOr comp~nenr of employee rewards an9 recognmon IS based on the ove!':l.J.! pe:::or.nance or me worK group .........•... ·-······-·········-····· ·································-··········
E::1ployees are mocvated by the sansfacnon .:har comes f·om JUSt domg a good JOb ..•
E..::nployees are mocvated by the f!.!lJOyme.'lr to be found 111 work ac::tVlCes ....... - •......• -
WorK IS ;:>e:formea out of the desire to gam respect of co-workers ................... ·-·········
Ou: worx group :s very :nnovacve m 1ts approach to pro )Ie=·························--····-
~ 7op levels of manageme.'lt make mosr of the maJor dec::.:aons ........................... ·-··-·····
:p
' ~ lnmVJdu:us are encouraged ro c.'lange their be!laVJor m o-aer to meet challenges and oppor..u-...:nes ............................................. --·······-···················································--····-
A :naJOr parr oi emviovee rewarcs and recognmon lS ba:; •d on that md1V1dual's ;>er:or.nance., ......... , -··· .. .. . ...................................................................................... .
PLEASE TURN AND COMPI.:::IE TI-iE FOU.OWING PAGE
1
1
1
/''-.
STRONGLY AGREE
2 ~-~'' 5 6 7
2 ,'314 5 \..,.(
6 7
6 7 2
2
2
2
2
3, 4 5
';' 4 {'', 6 7 ~0/
3 14' 5 6 7 \.J
3 4 ·5' 6 7 /
3 ,~56 7
2 3 4 5 6 7
2 3 4 5 6 7 _,.,
2 l' 4 5 6 7 .,1
2 3. 4 5 6 7
2 3 j- 5 6 7
2 3 4 5 6 7 -:"
2 3 4 5 6 7
2 3 4, 5 6 7
2 3 4) 5 6 7
2 3 '4 5 6 7 J
2345~7
2 3 4 5J 6 7
2 3 4 5) 6 7
WfTH REGARD TO MY WORK GROUP DESCRIBED ABOVE : sntONCLY 0~
-?- Person:U neec!s of err.ployees are second;uy ro the succes,ful compleoon of the job IUeJf ....... -·-······•·•····················· ············•·•••••••••••··················· .. ·-···-· .. ··--·-··•••••••···-·······-
Super'VlSO~ consult With employees before m:lk!ng deciSions aifecong those e:nployees .••. --·-····-·····························-···-·-···········-·--···---···--·--··----Followmg farm:U rules and procedures IS encour:~ged ....... ,. ____________ .••.•..• _ ..... ..
E:nployees are encouraged ro make roucne deCISIOns a!feccng theu- work sicuacons..
When presented wu.h c.hangmg ~onditions, c.'langes are made to deal w1th the new condJaons. •• --··-··-········-············-····--------···-···-------
Canfo=ry to pohcy IS favored r.ather than ae:cbillty and li'UlOYaQOil.-...----
E::nployees are allowed to be c:.reaave m solvmg problems as they occur-----
Our work g:-oup IS slow ro react when condlaons change.---··----·
There are many different depar=encs....__··-·-··----·-·----------
The fulfillment of JOb requrrements IS more unpor..=t th:an employees' personal needs on the JOD--········---············----··-·-··----------------
Employees are not allowed to make deCISIOns.-·-··--··;·
Cla."lges are ancc:pared and plar.ned for--······-·--··-······------·----E::lployees are cocvated to exerc::se mdiVldual l.lllc.acve ... __________ _
There are many differe.'lt JOb odes ... _____________________________________ _
E:noloyees have mpu: m serong standards by wn:c.'l the.tr pelio=ance is JUdged..-
E.:n?loyees are encour-ged ro proauce novel solucons rc non-routine problems and s.t"'~t::.or..s--··--········-·-·········--···---·--···-···---····-----·--·--
!vtosr dec:s:or.s are made JOintly oy me.'Ilbers of our work grcup---·-·----
C.~-:g-.. -:g :::-..::u:::ons are a:lCc:pated and plar.s are made accorr-...:.ngly •. -.-·-··------·
A;J?ra:s:l.l c:-::e.:::a for rewa.:-C:s and :ecognicon are eqmtaole and even-handed. •• __
Work group members go our of tileu- way ro help co-worke."'S-----··--
E=:ployee be.~aVlor IS dere=mea more by co-workers than by formal rules and proceaures._ .......................... - •. ···-··----·--··--··-··-·-·-·--------
E=:oloyees work roget.'ler m orde: o:o better deal WJth cot:~:ce~non from other cor::pai".ICS-----··············-············-·----···-·-··--···-···-------·-··-··--· Group :::e::::oers coope:are WJt."l ce:nbers of ot!le:' work g:-oups m the orgaruzaz::on._"
Wo.-.<: g::-oup :::e:::oe.--s would be w-.ilmg ~o make sac::-.fices !or t."le good of t.'le org.:.~::cn...--····---·············-····---········---···-····-··-------------
E:nJtoyees fed that the orgar.l::.:!con's proole= are the:r own problems .....• ___ _
E:npioyees feel the:r ti.nt loyalt:"f :s to the orgar...::uc~n····----·
'Nor 'A 6-0U:> ce:nber: .=:ave 1.:::our :egardmg :::a)or dec:s1or.s afeccng, the Of6'J.::rz.:!::on's suct:e:s ...... - •............ _ ..... - ... - ............... _ .. _ ... _. ______________ .. ., .. _____ _
Wu:r.m the wodc group, a maJor =phouls J.S an :n:ernal details (thmgs suc."l as org-aruz:Iconal rou=es, pollcie::, paperwork. operacoos, and etc:.)
Employees are reqwred ro ac: m confonmry wu:h work rules·--·-----·-·-
7'ne benaVlor of work group me:nbers IS stnc:Jy regularfd by fo=al rules and proceaures.---··········-·······················--····-·······-···-··-·-------··----
E.'Dployees are allowed to dec1de how ro best perform the:r Jobs·-·--·-·--·-·-··
R..l:her thm plan anead for d:a."lge, the orgar=coa react:~ to change after they OCC".Jr ••••••••• -·-··-·-·····························•·•·•·••••·······-·······-···-···-·-·--··---··-··--·--
lndi11':Cu:J.i c::p1oyees ':r"f to ::r.axe the work group oper<~te as a ream..·---··---·
234S67
1 2 3 4 ~- 6 7
1 2 3 4 (j) 6 7
1 2 3 4(J. 6 7
1 2 3 '4 s lo....:/
6 7
1 2 3 4) s 6 7 \,;.-/ 1 2 ;...c)5 6 7
1 2 2._)4 s 6 7
1 2 3 46·6 7
1 2 {j; 4 5 6 7 r
1 2 ~1 4 5 6 ~ . 1 2 3 4UJ6 7
1 2 3@5 6 7
1 2 3 4@ 6 7
1 2 3 4&6 7
1 2 3 8s 6 7
1 2 3 4 s 6 7 L..-
1 2 3 4 rs 6 7 ~
1 2 3 4 €- 6 7
1 2 3 4 ~) 6 7
r
1 2 (;; 4 5 6 7
1 2 3 4 '..J· 6 7
1 2 3 4 f· 6 f..,/ 7
1 2 3 4 ~· 6 7
2 3a~6 '7
1 2 I
7 3 14 1 S 6 '-,...
1 2 3 '4 5 6 7 ·-· .--
1 2 3 4 (C:./ 6 7
1 2 3 4{_~ 6 7
1 2 ~3. 4 s 6 7
1 2 3 4(! 6 7
I". 1 2 \\~ 4 s 6 7
1 2 3 {4, s 6 7 .... ...... P!..E.A.SE TIJRN AND COMPLETE 1HE FOU.OWING PAGE •••
211
WrTH REGARD TO MY WORK GROUP DESCRIBED ABO~ : STIIONGLY Pts.\Gr..a:
\ 'i My values and my work group's \":l!ues are very s1.mllar ................................................ .
- In many ways I look ar my work group as an extension of myself ...................•....•..•.....
Overall, my work group operates as a ream ................................... .
SEcnON IT. COMPANY OR ORGANIZATION a-tARACTERJSTICS
2 3
2 3
2 3
212 SillONCLY ACIU:E
4 (..5· 6 7
4 ·S I.;_
6 7
4c~ ·6 7
ThiS secoon changes focus from your orgamzaoonal work group to the overall orgamzaoon for wh1ch vou worlc. As. you consider vour overall orgaruzacon, express your agreement or aisagreement With each of the followmg sratemencs by Circ!lnl!" r..':e number th::tr best reoreserHs vour oom1on
WfTH REGARD TO MY COMPANY OR ORGAN!ZA170N: STIIONGLY Pts.\CRE:E
I am ·m good" With the "powers-that-be" ..................................................................... : •.... 1
1
2
2
3 ;4') 5 6 7 "'"'"
Overall, I consider my orgaruzacon ro be progressiVe ............. ································-···· 3 4(}J 6 7
, ..: l
There JS a hlgh !evd of trust between employees and management. ..•..••..••••..•••••• - ••••••
I would cons1der leaV!Ilg my present orgaruzaoon for an me-ease m pay .••..•.•.•.•• -···-
1 would consider leaV!Ilg my present orgaruz:mon for more sratus ................................ .
I would cons1der leaV!Ilg my present organ=oon for more freedom to be c-eacve •.••••
I wocld cons1der leaV!Ilg my present orgaruzaoon to work With people wno are fuenc:!.l!er _________ ..••..... _ ....................................... - •• ·-·-····································--·
Ove.-.ill, I am very sacsfied WJth thiS JOb ................................................................... _ .•....
0\"ei-a.ll, the organ~zacon has good commumcacons between e.'".:lployees and management. ..... _ ......... _ ................................................................................... , ...•.....••.
Overall, I believe our organiZ3con Will be comoec.cve :n ::.'le ful:'..:re .................... _ ..... ..
l::l orcer ro succeed m our organiuoon, It IS never neetssary to comprom1se one's et!liCS ............................................................... - ......................................................... _ ... _,
SECTION m. CUSTOMER COt-."TAcr C-v.RAC'r.c.RISTICS
1 2 3
1 @3 ' ......
1 '2 .' 3
1~> 1 {i' 3
1 2 3
1 2 3
1 2 3
,.-"l
·.,/ 2 3
4C) 6 7
4 5 6 7
4
4
5 6 7
5 6 7
4 5(SF
{§) 6 7 4
4 ff; 6 7
4 5l 6 7 ~~
4 5 6 7
The s::ue:nenrs below d~cr.be various ways a salesoe.""Son m1ght aG WJ::.r:. c1.:scome.i-s or prosoecrs (for convemence, the word "c.lstcmer' :s used ro refer ro oorh C'.IS~omers ana pros;:>ec:s). For eac."l scate:ner.t, please ~r.d1cate me or:ooornon of your c'.lstome!"S With whom you ac: as descl"loea by the st;;re:::ent. Do :::m :Jy c.:::!mg one of t.'le n\lmoe:-:> from 1 ro 9. The meamngs of t.'le numbe:-:. ar:e:
1 - -~e for NONE of vour custome:::3-NEV'ER. 2 - -rue for ALMOS7 NONE of your c-.JSrome..,; :! • -=-... ~ for A f'FoN or vour cusrome..""S
6 • T:".Je 'or SOMEWHAT MORE T"rli\N HAJJ' of your customers ; · ";"rue .or a LARGE MAJOIUT'f of your customers
4 • :-r e for SOMEWHAT LESS T"clAN !iAlY of your custome..,; 5 · True for AllOUT HA1J' of your customers
8 True 'or AL\fOST ~ :f9Ur C".JStOme!S 9 ·True for All. fOUr customers-ALWAYS
For examole, If your crrc!ed a 6 on the statement be!ow, :tou woulC: be mcacanng that you evaluate the sansfacnon of somewi-J2.r -rc~e rhan haif of your customers.
' NEVER A ALWAYS [ evaluate t.'Je C1.!StOr:lers S3rufac:Jon afre~ t.I-Je Sate 1 2 3 4 5(617 8 9
/J.WAYS
I r:ry to bnng a c:JStomer WJL"l a problem together Wlt.'l a pr:oauc: t."-at he!os h= solve that proolem. ......................... -···········-·········-······ ...•.....•••......•.....•..•..•....•. ·····-··--···-········--··· 1 2 3 4 5 6 7 Is 9
~......,
2. I follow-uo my sales to make sure customers are s;;nsfied ..................................................... . 1 2 3 4 5 6,.] 8 9
" 3. I behave reward C".:sromers m a way that conveys my des:re t::t nelp ::he customer ............. . 1 2 3 4 5 6 7 _8 9
4 I offer c-eacve solunons based on customers' :leeds ................................................. _ ........... . l 2 3 4 5 6 7 8 9 '- ~,
5 A good salesperson has to have tne C'.lS~ome!'s oes~ mre~est :r: ::r.1:1d .........•......••••. _ ........... . 1 2 3 4 5 6 7 sy
6 [ rr'f tO get =tamers [0 diSCUSS t.'lerr needs WJtn me .•............. -··•······•···················---·----··--·· 1 2 3 4 5 6 7 ~ 9
PU".ASE TIJRN M"D C0!'.1PL.."TE. 1HE FOU.OWING PAGE .,..,.
1

7. I leave post-sale acovmes and problems for the customer se!'Vlce people to hanale ...•...••....
a I spend more c.me trfl!lg to persuade a customer to'buy ;:han I do t::'Vl11g to dl5cover !us needs·--··-····-····--·-·············-·················-·····················-···-············-·····································-···
9. I quu:kly take care of customer proolems and complamts ..••••.•••. --··············--··-···········-····-·
10. I rry to figure out what a c..tstomer's needs are ..••. ·--··--··-·······---··································-
11. I am avallable to customers when they need me .. ·-··-····-··-····-·--·--········-··············-····-···-···-
213
Al.WIIYS
::!,3 4 5 6 7 8 9
1 ,2 3 4 5 6 7 8 9 '-'
::! 3 4 5 6
234516 .... 2 3 4 5 6
12. I begm the sales ralk for a product before explonng a customer's needs Wlth hun..--···-- /l'-2 3 4 5 6 7 8 9 ~
13. I evaluate the customer's saosfaccon after the sale--..•••••.•• -·-··-·················-····-·-··---- 1 2 3 4 S 6 7 (8 9 v 14. I rry to find our what kmd of product would be most helpful to a customer ....•.•.••.•••......• -- 1 2 3 4 5 6 7 8' 9
15. I suggest products that maxmuze benefits to the company, even when they are not the best matcn for a C'..lStomer problem ...••. ---·······--·-·--·--·--····-·-·············--·----·--
16. I rry to help customers adueve theli' goals ••.•• -·······----··-··---·--·····-··········-----·-·--
17. I work Wlth customers on a basl5 of murual undersranaing rather than usmg
marupulaove tacncs ••. --·-······----···········-··-···············--·······-···---···························-··-·-
18. I offer the product of =e that l5 best su1ted to the customer's problem ••.•••.....•••••.••• __
19. In selling products, I rry to sllilulraneous!y represent the mterests of the company and the mterests of the C"..lStomer .•.......••.•••.••.•••.••.• _ .•..... --·-···------·-················--·-·-··-··---
20. I rry to sell as much as I can rather than to saosfy a customer·-·--·······················-·--···-·-·
21. I rry to bulld a re!aoonsrup Wlth cusrome.-s based on mur-.tal trust and confidence.·-·····-·
22. I llilply to a customer that somethmg IS beyond my comroi wne!l It IS not. ........•.•.• -······-·
23. I woxk to ac.:ueve company objecnves while s=ulraneously sol'II'U-;.g customer proble:ns ..•.
24. I pre·end to agree Wlth custome."S to please t.'l.e.'ll .......... _ ..•....... _ .............•....•........••..••....... _
25. I rry to adueve my pe."Sonal goals by saosfy1.r1g c..tS::ome.-s .••••••.. -······················--·······--··-·--·
26. I rry to sell a customer all I can convmce hun to buy, even If ! tinnk lt !S more than a WlSe cusromer would buy ......•..........•••....•.......•....... ·-···-··-······································-·····-···--
27. I treat a customer as a nval ...•.•...........•..•.......................•••.••.......... --·······'········;····-·········-·-·
""' li3456789
2 3 4 5 6 7(3 9
2 3 4 56 7 1 8 9 ':~
2 3 4 56 7·8 9 ---
123456tJ89
~2 3 4 s 6 7 8 9
1 2 3 4 s 6 7~8 9 ·-1 2 3 4 s 6 7'8 9
'~ 12t4S6789
1 2 3 4 s 6 7 8 9 ..;
~
I 1 2 3 4 5 6 7 8 9
1 2 3 4 5 6 7 3 9
28. I dec:de wnat oroduC".s to offer on :he basiS of wnat I can convmce c\lStorne..-s ro buy, nor -on r: e baslS of wnar w:iil saosfy t.'lem m the long run ..•..... ······-··························-···-··-····· _} 2 3 4 5 6 7 •, 9
29. I ofr,n assiSt the company m develoomg procuc:s anc sernces base!l on cusromer needs ana ?roolems .... __ ,,_ .•...•.. - ...................................... - •..• --············-·····-···················-···-··--··
30. I tr"f to gwe c-.Jstome.-s an accurate expecuoon of wnar the proa1..ct will do for them. __
31. I wo1K Wlt.'l alfere.'lt departments 'Nlrhm t.'le cornoany on benalf of c\lStorners ..........••.. _ .•.
32. I a..-n ·.viilmg to 01Sagree With a customer ll'l oraer to help '1J1Il maKe a better declSIOD ...... .
33. I Ult(.rcede on behalf of the C'..lStomer wnen the c:Jstomer .1as a problem Wlth our com1•any or produc::. ••......•..•.• -························································--···································-·
34. It IS :1ecess:uy to srrerc.'l the trUth m des=bmg a product to a C".lStomer ··················-···-·
35. I often make suggesnons to the company as to how we call better serte custome.-s.·--·····
36. I pamt too rosy a ptcture of my products, to make t:he:n scund as good as possx[..le .......... .
37. I cor.unUillcate the needs of the c".lstomers back to the company ...................................... ..
38. I answer a rusromer's quesoons about produc:s as correc:.Jy as I com ..............•..............•... _.
••• Pl..EASE TURN AND COMPUTE 1HE FOLLOWING PAGE •••
1 2 3 4 s 6 7 3 9
2 3 4 5 6 7 8 9 ..,. •23456J89
2 3 4 s 6 7 8 9
1 2 3 4 s 6 7 8 9
2 3 4 s 6 7 8 9
1 2 3 4 s ~ 7 8 9
1,2 3 4 56 7 8 9
2 3 4 5 6 /, 0 9
2 3 4 5 6 7 s 9
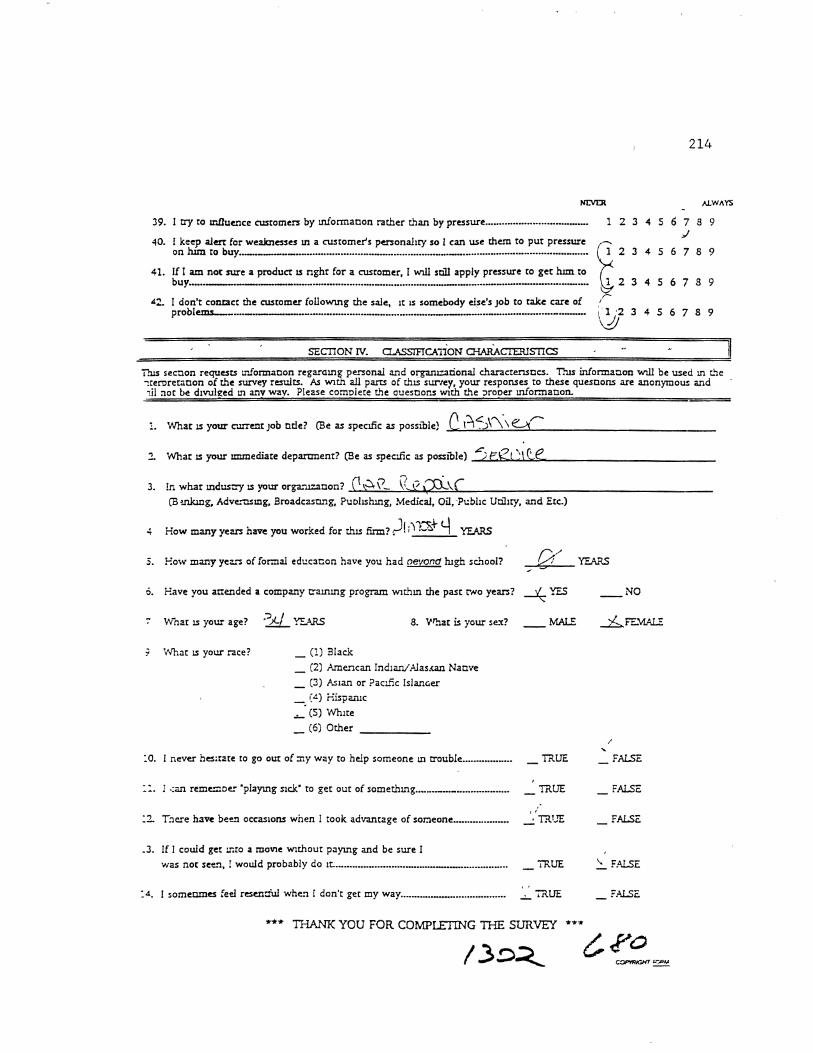
NI:VDI
39. I ay to uilluence customers by tnformanon rather than by pressure ...•.......•••.........•......• - ..•. 1 2 3 4 5 6 7
214
s 9
40. ~~hen ~:;;~~~-:~~~~--~--~--~-~~-~~-~:..~.:..~~~-~~.r::..~.~--~-~~-~~-~-~--:~.:..~.:.~~~-~~~- ~ 22
_,;
3 4 5 6 7 8 9
41. If I am nor sure a product IS nghr for a customer, I will sc11 apply pressure to get lum to
buy •••••. ---·----······················································-··-····················-···············-····· 3 4 5 6 7 8 9
42. I don't contact the customer folloWUlg the sale, 1t IS somebody else's job to rake care of ,r-problems__-····-·---··--····················-·····················---··-······-··············-·········--··· ; ' 1 •2 3 4 5 6 7 8 9
\!J ' '
SECTION IV. CLASSIFTCA110N aiARACTER.TSTICS
nus sec:~on requests 1."lformaoon regaramg personal and or:ganu:ational dJ.aractensocs. This informanon will be used m t.'le ;,ter!lreraoon of the sW"Vey results. As Wlth all parts of thiS surtey, your responses ro these quesoons are anonymous and 1il 01or be d1vuh:ed Ill anv wav. Please comolere the auesoons WJth t.'"le :lrooer tnformanon.
•. What IS your C".liTeilt JOb ode? (Be as specliic as possible) ~C......:I;_.:..~"'.)::.;\\....:...\.:..Y=.l.,-.--------------
2 What IS your II!liilediate department? (Be as speclfic as possible) _~ ... 2'-'f.....,K,.._t ...,.'-1'-'Q."'• ,e_ _____________ _
3. !n what mdus::ry IS your orga:u:anon? _.(_l_,.\~..;..;V.::-:;._\.:.f,J;,....?_.~""=·::;\:.:~(.__ __________________ _ (B mlang, Adve."!l.Smg, Broadcasnng, Puohshmg, Medical, Oil, Public Utl11ry, and Ere.)
How many years have you worked for thiS firm? ;J! 111:&+ Y YEARS
5. How many years of for:nal educanon have you had oeyond !ugh school? {}(' YEARS
6. Have you attended a company trammg program Wldun the past t'No years? --* YES NO
7 V•.rnat IS your age? ;-;;;(../ ~..AR.S 8. V'har is your se.'t?
What IS your race? _ (1) Black
_ (2) Amencan lndJa.:'l/ Alas.<an Nanve
_ (3) Asian or ?ac:.fic Is!anGer _ (.!) Eispamc
~ (5) Wh1re
_ (6) Other -----
:o. I never hes:rare to go our of :ny way co help someone m trouble.................. TltUE
I .:an reme:::oer "playmg s1ck" to gee our of somethmg ..•..... _ .. _................... TltUE
:2. T.'lc:re have been occas1ons when I rook advantage of sooeone ...... ·-··········· _:/TitUE
.3. If I could get :r.ro a moVIe WJthour paymg and be sure I
was nor see.'l, ! would probably do 1!:. .................................... -....................... tRUE
:4. I somenmes feel res~:iul when I don't get my way ....•......• _........................ ~tRUE
THANK YOU FOR COMPLETING THE SURVEY *""""
/
FALSE
FALSE
FALSE
FALSE

APPENDIX D
THE FIELD SURVEY INSTRUMENT
215
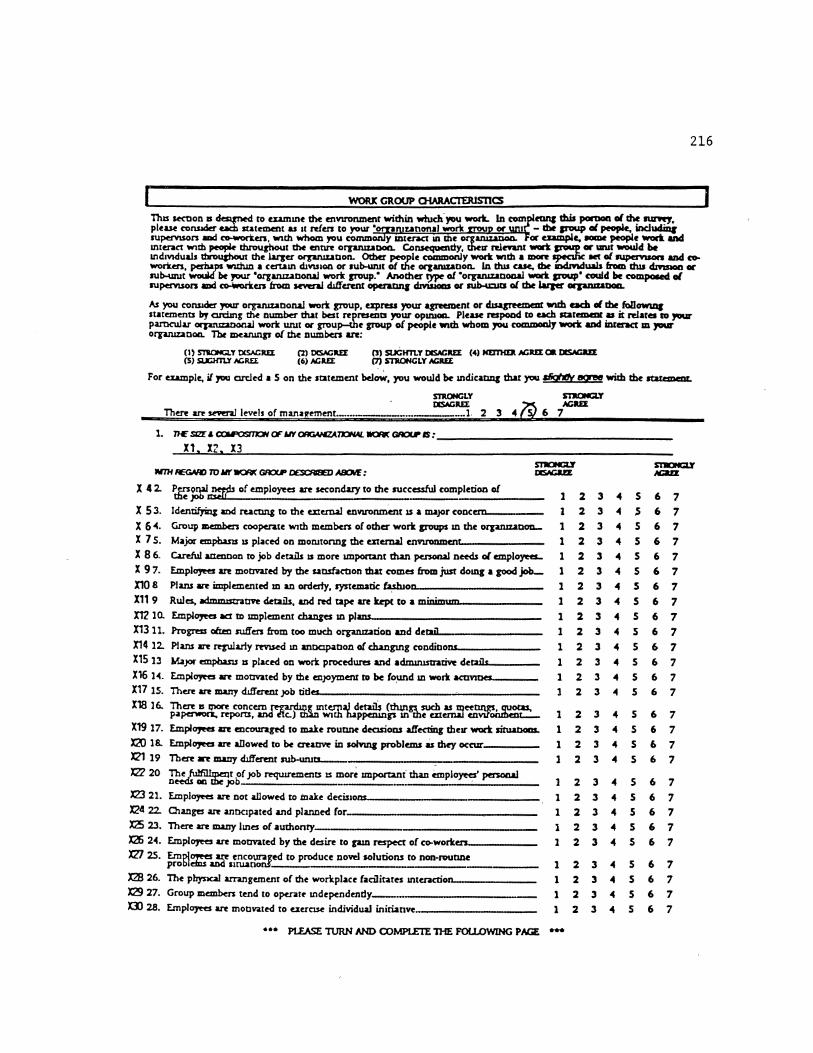
216
WORX GROUP OiARACTEJUSllCS
Th~ &Kt!OD II ~ to tnmlll~ the UIVU'OMIUI[ within wtuch you wotL In COIIl eGIII this por1JIIIl of the IUIWJ, pie~ collSIOa" uch sutement u at ~en to your • n:.anonal worlt or 1 - b p-oup of people, ind~ rupeN~SQn aDd ~en. wtth whom J'OU comm y mtuact UJ ~ orgaruzanoo. oc aample, - people wad. aOcl Interact wu:b ~ lbrou,tlout the mnn orguuzaDOG. Consequmdy, !hell' re.lnant -*: ~ or UD.It would be Jnd1VIduals drou,tlout the l&rzcr orpn.a.aoon. Other people commOilly work With a more ~ .wt ol NpCrYUon mel coworltcn, perhaps wlllun a ccrum c1Jvu1on or sub-wut of the orzuuzaoon. In dus case, b .iudlftduals from dus ~ or rub-urur Would ~ J'OW' "orgaruuooral wort Jn»up.• Another~ of "orgma.aoonal -*: p-oup• could be colllpOied of Npcmson aDd co-Wortcn from snenJ &Wl"crcnr opcraDnJ ciMsioas or ll.lb-u:ua ol the larJa' orpDIZ&DOL
As you colUlder your orguuz.aoonal work group, upress your &grftJDCilt or ~ wadl each ol the foliOWUIJ starancna 111 on:hng ~ number th.at best np~a your oplllHIC. Please respond ro uch satcme:ar u it re.lara ro Jl'l1.ll' pamc:ul.u orpru:zmorW wort urur or group-th~ group of people wath wbom ;rou commoaly -x mel iDrerxt ID 701.11' orpruz;aoon. The murungr of !he numbcn arc:
(1) snoNCLT IXSAGREE (2) DISACII!J: ('!) suCKTt.Y DISACII.EE (4) HEmiDI MOREE ca lliSAGaEE (S} SIJCHTU AGREE (6) AGilE[ (7) ST110NCLY AGREE
For cumple, if,_ crcled a S on th~ statement bel~. you would be ~ndicatlDJ thar you p;qtrtly !IQ!'1rl!! with the ltU.cmeDL
STRONGLY S'I'JICNCZ.Y
Th~ ~ sewn! levels of ma.nuemcnt ........ .. DISAGII!J: ~ MOII!J:
.... 1 2 3 • (SJ 6 7
1. »£ S1ZI & cr:»>PPS1T11N OF ll'f CliAGNoiZAn:JH41. IIIOfll( GROU' IS:------------------X1 X2 X3
X 4 2. ~~ ~ of employees arc ~ondacy to the successful completion of
X 53. Identifying and rucong to the cnun.al cnVU'Onmcnr IS a maJOr concern._ __ _
X 6 <4. Group mcmbcn coopcr.atc Wlth membcn of other work groups Ill th~ orgaruutlOil
X 7 S. Major empb.am IS placed on morutonng the aternal enVll'OrullCn:t.------X 8 6.. Careful aaennon ro job details IS mon unportant t2wl penon.al needs ol emplofHL X 9 7. Empl~ arc moovared by the uosfacuon that comes from just domg a good job_
%10 8 Plans ~n implemented m an orderly, systematic ~o'D---------X11 9 .Rules, ad.a:mustraove details, and red tape an kept to a minim•Ulm!111...-----X12 10. Empl~ act to m!plemcnt c.hange:s Ill plmu'------------X13 11. Progn:s:s ofuo suffers from too much orpruzation and detauwii-------X14 12. Plans an rqularly rnued UJ anocpaoon of clwlgmg condioo'ID..-----X15 13 Map cmpba.ns zs placed on work procedures and admuustratiw deta.....,il~s ---Xl6 H. E.mpl~ an mottvated by the enJOyment to be found m work .acavmes_ X17 15. There an m.ny dl!fcrcnt JOb titles.. _________ _._ ____ _
X18 16.. There IS 1110n concern rennim!' mtemal detJ.ib (tfunn such as meennxs, QUOQS, ~perwon. reporu, and ~c.) dW1 Wlth b.tpperungr In-the atemal cnvU'Otu!leot-..
Xl9 17. E.mpl~ an cncouragrd to make rouonc deasions affecting theJT wort sinunoas.
X20 18. Empl~ an allowed to be cnaave in soiY!ng problems as !hey oc~---
XZI 19 There 1n many dlfrermr sub-uruts---,--------:-------'122 20 ~!.z~t bof JOb ~ements IS mor~ IIIlpon;ult than employees' penoo.al
n...:Us Dll the jo -----, XZ3 21. Empl~ an not allowed to make decisJons-------------X24 22. Otanga ~ anoc1pated and plarmed for-·-------------X25 23. There an many IJnes of authonty X26 24. Em pi~ arc motiVated by t:be d~in to pm respect of c~woritcn ____ _
'1Zl 25. EmDI~ ~ encO\Ir.IJ1:cd ro produce no'ftl solutions to non-rouone prol>ldns an4 suuanons.
X2B 26. The pbysxal arnngemcnt of the workplace facilitates Ulteracrion... _____ _
X29 27. Group mcnbcn tend to opent~ JndependentiY---·----------XD 28. Empl~ arc moovated to uerase individual inirianve. ________ _
1
1
1 1
1
2 3 4 s 2 3 4 s 2 3 4 s 2 3 4 s 2 3 4 5 2 3 4 s
123<15
1 2 3 4 s 123<15
1 2 3 • s 1 2 3 • 5 1 2 3 • s 1 2 3 4 5
1 2 3 ... s 1 2 3 4 s 1 2 3 4 s 1 2 3 4 s 1 2 3 • s
1 2 3 4 s 1 2 3 • s 1 2 3 4 s l 2 3 • s 1 2 3 4 s
1 2 3 4 s 1 2 3 • 5 1 2 3 4 s 1 2 3 4 s
••• P1LASC 1URN AND COMPI.EIE TiiE FOU.OWING PAGE ....
6 7 6 7 6 7 6 7 6 7 6 7 6 7
6 7 6 7
6 7 6 7 6 7 6 7 6 7
6 7 6 7 6 7 6 7
6 7 6 7 6 7
6 7 6 7
6 7 6 7 6 7 6 7
I

217 S'l'ltONCt:r STIIONCLT
-llrCAAO ro ~~r JICA( r:JAC/(1' CIOCRI8ED NJOI£: CICW'Gala ~
D1 29. ClunCU~t uru.aooru an anOCJpatN and plazu art made accorchngly_ .. , _______ l 3 4 s 6 7 XP lQ. Wort ~"~UP II:WI~ ro out o( thtll W11Y to help co-workrn. __________ 2 3 4 s 6 7 XD 31. E.lceu- attt110on to rules and procedures ohw makes u dUfK'Uit for new !dus to
RCCI~ artHUlM..---· ·-----··---- 2 3 4 s 6 7
XJC n. ~f}oz,:;s~. tog_:~~ In order to ~ner de~ wtth compeooon from 2 3 4 s 6 7
X!i ll. Wort 1f1M.1P man~n an willmr to !!Wte ucnfices for the good of the Ol'g'Ultzmon 2 3 4 s 6 7 XJi 34. Oftnl1., rrtT work group opentes as I tum 2 J 4 s 6 7 ri1 3S. My n.Jues and my work voup's values an ftry sunilu 2 3 4 s 6 7 XE36. Ill many W11ys I look at my work rroup IS an utens•on of mys.elf. ___ 2 3 4 s 6 7
The satem~~ow d~bt vanow ,. .• vs 1 saJcspenoo m1rl!t act 'Wlth run omen or pnlS?«U (for converufi>Cr the word "cust0111u" u to l"tlu to both c:ust\)m~n and proSJ>eenJ. tor ~ach sure.:nwt, pi•~ 11ld1Cit< i:he propomon ot~ur customers 'W1 om you let as descnbe<l by the StltemcnL Do UIU by CU'C11o'1g one oi the numbcn trom 1 to 9. The 111U111Dp of r numbers arc.
I • ,._ for ~ af )<lUI' cuaOODOM-IIEVD 6 • Trur for SCW!:WHAT ~ llUJIIIAU af,...... ~ l· Trur lor .AUola>T HOH't a( - ..... _. 7 • Trur for 1 I.VtCE MA..OIUT1' al yow a.oamc:n 3 • Trur far /o. tLW af )'QUI' OISI<.nrn I • Trur far AUIIC1Sr AU.,.,..- ""'""""" • • Tnor lor SDIIa:WJ lA T lESS n 1AH I !AU' af }QII' n"'""""'" 9 • Trur for AU.,...... CURDa:n t\UII'AlS ~ · I:1.1: !t! ~ u~.r. ft.- c.~~
HEYD. ltlJIIAlS
Tl. '.!)t: to bnnt, ~ r.;;,tomu With a problem together With 1 product th.at helps lum t that p b UD..-. ·---·- ·--- l 2 3 4 s 6 7 8 9
Yl. I follow-up my sales to mar sun customers are sawfird.. 1 2 J 4 s 6 7 8 9
Y3. I behave toward customers m 1 way th<~t conveys my des!Te to help the customer_ 2 3 -4 s 6 7 8 9
T4. A~~ ulesptrsoo hu to have the customer's ~st uuercst m m1n l 2 3 4 s 6 7 8 9
YS. I tty to get customers to chs<us.s th= needs Wlth me._ .. 1 2 3 -4 s 6 7 8 9 T6. J~d ~ =~ tl')'l1lg to prnwde a customer to buy than I do trying to
ovutus n=.- 2 3 4 s 6 7 8 9
Y7. 1 follow up my sales to tU.e carr of customer problems and compl~tL. 1 2 J o4 s 6 7 8 9 Y&. I tty to figure our wh.at 1 custom u' s needs are._ 2 3 4 s 6 7 8 9
T9. I brgul tbr Ales Wk for a product bdo~ uplol"l!lg 1 customer's t:lttds WI~~ 2 3 o4 s 6 7 8 9
Y 10. l n:Liu.ate tbt customer'• s.acsf<~ctlon 'after the ulr 1 2 3 o4 s 6 7 8 9 Y1l. I tty to find our wb.a't k.md of product would ~ most helpful to a runomcr. __ 1 2 3 4 s 6 7 8 9
Tll. I tty to help customen acruew thtJr g 1 2 3 o4 s 6 7 8 9
y 13. I otfct' the product o( m.tne aut, IS best swtrd to thr customer's problem. 1 2 3 4 s 6 7 8 9
TH. I tty to sdl u much IS I can r.athu th.an to $.1oUy 1 customer 1 2 3 4 s 6 7 8 9 YlS l handle customer' compla.mu qwclt..ly and effiowdy 2 3 o4 s 6 7 8 9
Yl6. IIDlply to a customer that somr-rlung u beyond my contrOl when t% as DOL--- 2 J 4 s 6 7 8 9
Tl7. I work to ~~ company ob)KtiVes while sunultaneowly solvmg customer pro ems. 2 3 4 s 6 7 8 9
Yl&. I pretmd to lgnt With customus to plr;asr them. 2 J -4 s 6 7 8 9
T19. I tty to aclurw my ptnon<l.l ~s by uwlyU'lg customers·-·---·---- 2 3 -4 s 6 7 8 9
Y20. I ~ to srll a customtr all I can c;ygvmcr hun to buy, rvm If I thmk r: &s mo e t!un 1 wur cunomu wouJ UY--------------------- 2 3 4 s 6 7 8 9
T21. I aut a customer u :a n~ -·-------· 2 3 4 5 6 7 8 9
Y22. ~Cidt wiuJ.~~Ucts r off~ th~IS~ of wh~ I can convmcr customers to • not on 1s o wh<~l ut em m • long ru11- 2 3 4 s 6 7 8 9
T23. ~~C ::J~~.g;~-~-~y m d~~mg p~u::S~~-~~~N on c_':"~ 2 3 o4 s 6 7 8 9
T2-l ~!70~0~ custo~~~~~~~~~ wh~-~e pr~ct ~---- 2 3 4 s 6 7 8 9
Y25. It is n«css.uy to stretch the O'Uth m dcscnomg a product to 1 customer ... _, ___ 2 3 4 s 6 7 8 9
••• Pt.EASE.llJRN AND COMPLETE TiiE FOll..OWlNG PAGE ·-

Y 26. ~ ~n":f~~~~~.~-~.~~~~~ an order to help lum aWr.e
Y 27. I often mU.e suunnons to the company as to how we can ~nu serw cwtomen. Y 28 I try to acluc-ft my compmy's goals by sansfyans customen'----y 29. I paw too rosy a psct\ll'e of my products, to aWr.e them sound as good as posssble.
Y 30 I commurucare the n~ of the auromen back to the CCIIDJWIY· Y 31. My selhng dfom are beneficw ro my company and to my customen
Y 32. I answer a customers quesoons about products as correcdy as I can.----··-· Y 33 I ay to Ullluence custamen by snformaoon 1'111rher than by pnssun----··--··· YJ.C
y 35.
I k~p ale:n for wo:altnetsH m a customer's pusonahty so I an UK them to pur pressure on him to buy.·----·-··-----------· [Jn a: ~~~~.':.~~.!~.~~r.omer, I will so1l apply pressure to ~~.:_
<XlMPANY OR ORGANJZAnON OiARACTERJS'I1CS
218
1 2 3 4 5 6 7 I 9 1 2 3 4 5 6 7 • 9 1 2 3 4 5 6 7 I 9 1 2 3 4 5 6 7 • 9 1 2 3 4 5 6 7 • 9 1 2 3 4 5 6 7 I 9 1 2 3 4 5 6 7 • 9
1 2 3 4 5 6 7 I 9
2 3 4 5 6 1 a 9
1 2 3 4 5 6 1 a 9
nus secnon changes focus from your o~oonal work group to the ove1'11111 orgaruuooo for which you work. ~ )"'IU conssder yow- ovenll orgaruzaoon, uprell your AGREEMENT or DISAGREEMENT With each of the foUoWII'Ig mtemmts by archng the number that best represents your opmson. The mearungs Of the nliliibers are:
(I l STROHCLY DISAGREE (5) SIJCtm.Y ACREE
(2) DISACREI (6) AGREE
(J) SIJCtm.Y DISAGREE (4) HElTHER ACREE OR DISAGREE m STRONGLY ACII[[
Z 1. I am m good wtrh the "powen-that·~· .••••
Z 2. I would cotmder leaYII'Ig my present orgaJ:UUOon for an manse m pay-----· Z 3. I am saosfied wtrh the method by whsch my l'1lllSeS are dermmnf'd ____ _
Z 4. I am sansfied wtth the pay I recesve for my JOb------------Z S. Most mdmduals m my organJUoon feel a great deal of job secunty·----Z 6. There 11 a hlgll degne of Ultel"iilcoon between supenon and subordmatts----
Z 7. I am saosfied wtth the secunty my JOb provides me----------Z 8. I am saosfied wtth the promooon opporturuoes m dus finn'---------Z 9. I receJW the mform.aoon I need to do my JOb------------Z 10 I have to do dungs on my JOb that should be done ditrermdy·------Z 11. I haw to buck a rule or pobcy m order to carry our an asssgnmenL-----·· Z 12. I would CODSJder leaYII'Ig my present orgaruzaoon for more mr:us ___ _
Z 13. I am sansfiee Wl\h the feedback I get on my JOb performan~-----
Z 1-4 I feel cem.m about bow much authonty I haw m my selling posmon..-----Z 15. My opsruon of myself goes up when I do my JOb we:.un~...-_______ _
Z 16. I would cotmder leavmg my present organJUoon for mol"! frHdom to.~ aeaove
Z 17. I am genenlly sausfied wtth th~ lund of work I do m dus JOb-------Z 18 I haw dear. pi armed goals and ob~coves for my seUmg possoon.------·--
Z 19 I frequently dunk of qwrnng dus JOb·····----·:.. Z 20. I work for two or more groups who operate qwte dlffuendy _____ _
Z 21. !..t~o;;yths:IJn~ve_?:~d m~-~~!~~~y while perf~nnmg th~o~~~ Z 22. I know what my responsibihoes are m my sellmg possoon.__ ___ _
Z 23 I am sarufied wtth the recogruoon I rece1ve. ·---
Z 24 Most people on thu job are very sansfied wtth this JOb--------·-··--· Z 25. I feel a grur sense of personal sansfacoon when I do thu job weU ______ _
Z26
Z27.
Z28
I receM! mcompan"ble requesu from two or more people on my JOb----··--1 know euct!y whar IS expected of me in my sellmg possoon.
~';o&!n~~~d~ .. ~.~-~~~-~!:_1'~~~~~ .. ~.~~~~~~~ .. ~~~~~~~~.~-~~~-···--·-·
1
1 1
1 1
1
1
1
1
1
1
1 1
1
1
1
1
1
1
1
1
1
1
••• PLEASE iURN AND <XlMPlEll:: TiiE FOU.OWING PAGE •••
SJiibH(if .ACUZ
2 3 4
2 3 4 2 3 4
2 3 4
2 3 4 2 3 4 2 3 4
2 3 4 2 3 4 2 3 4 2 3 4
s 6 7 5 6 7
s 6 7 s 6 7 s 6 7 s 6 7 s 6 7 s 6 7 s 6 7 s 6 7 s 6 7
2 3 2 3
2 3 2 3
2 3 2 3 2 3 2 3 2 3
2 3 2 3
2 3 2 3 2 3 2
2
2
3
3
3
4 5 4 s "' s 4 s 4 s 4 5 4 5 4 s 4 s
4 s 4 s 4 s 4 s 4 s 4
4
4
5 s
s
6 7 6 7 6 7 6 7 6 7 6 7
6 7 6 7
6 7
6 7 6 7
6 7 6 7 6 7 6
6
6
7 7
7

219
STIIOIIC:LY ST1IONCU' 'MTH REGA/fD TO llr COIIPANr OR ORGANIZA'DON: llL'ii\GIIEE ACII£1!
Z29. Ove~. I am very sa1ufied WJLh th1s job ......•.••.• ·-···-·····-··· ·················---············ 2 3 "'
5 6 7 Z30. My 01011 feelmgs generally are affected a great deal by how well I do thiS JOb .......••. -. 2 3 4 5 6 7 Z31. I recetve clear explanations of what has to be done tn my selh.ng postnon.--··--······· 2 3 "' 5 6 7 Z32. I do thmgs LD my JOb that are apt to be accepted by one person and not by another .. 2 3
"' s 6 7
Z33. People on thiS JOb often thlllk of qutntng thts JOb .•...•...•••••••...•••..•.•...••.•....•.. ·-············- 2 3 4 5 6 7 Z34. I recetve asslgiU!lenu Without adequate resources to uecute them •••••..• ·--·-··-····- 2 3 4 5 6 7 Z35. ~rnRn~gee::,7;e~~~~-~~--~~.:~~~~~~~-~--~~~~~--~~~~~?:~~-~-···················· 2 3
"' 5 6 7 z 36. In my JOb, I often must woric. on unnuessary thmgs ........ ·--··················-················-· 2 3
"' 5 6 7
z 37. My orgaruumon has recently undetgone a change m leadership •..•••••.•. ---·············-- 2 3 "'
5 6 7 z 38. I feel bad and unhappy when I dtscover that I have performed poorly on t1us job.- 2 3 4 s 6 7 z 39. 1Retfi'~~~~~ ~~~o~~~o~~p~~~~·f~e~p~!~.~!.:~~-~--~~~-~:.~~~~~-~~~~:. __ 2 3 -4 5 6 7 z 40. Customers upect pressure from salespeople tn ttus bustness .....••..•.••• ·-·------- 1 2 3 4 5 6 7 z 41. I can count on company support tn reasonable efforts to look out for my customers_ 1 2 3 "' s 6 7 z <12. My customers rely on me as a source of product tnformanon ......•.••.•... ·--·-···-- 1 2 3 4 5 6 7 z 43. Most CoJStomers cooperate With my eifons to fmd what they need tn a product....- 1 2 3 "' 5 6 7 z 44. My customers aust me·-·---·-·-················---·-········-················--·-···-- 2 3 " 5 6 7 z 45. ~~~~~~ ILD~~~~~!~~tches .~:~.~~~--~~~~~--~~~-~ .• :'?.~.~:.~.~.! .. ____ 2 3 4 s 6 7 z 46. I am under pressure to produce unmed1ate rather than long-term results-····-··-- 2 3 4 5 6 7 z <17. ~fiEeb~~h~n:::~-~::_~-~~~~~~--~-~~~~ th~~.'~~~::.~.:.~.~--~~~~----- 1 2 3 -4 s 6 7 z <18. ham oft~41ll~ered tn le~~TI;stomer needs and explauung producu by not
1 2 3 6 7 avmg tcJen wne toge er customers.---·-·-·--············-····----···-- 4 5
49. How many years have you worked for thts fum? WORKYEAR YEARS
so. What ts your current JOb title? (Be as spec1fic as possible) TITLE
51. If apphcabl~. please ind1cate as a percentage, th.! level of sales quota you achieved last year. QUOTA " 52. Beyond lugh school, how many years of formal educanon have you had' ED.!!h.__ YEARS
53. What IS your age? _!g_ YEARS 54. What u your sa? MALE _ FEMAI..E SEX
55. In 10-har mdustry IS your orgaruzanon' I:.;Nc::;D _______ --',,...-----------------
56. A sales representative's performance can be measured m many ways. Companng yqurself With other sales representaoves, how do you rate yourself m tl'rms of performance on each of the followmg dlmuu1ons? Please cude the numoer best matchmg your compansor~
BElDW A1DVE J'(X)R AVOV.CE AVEJIACE AVEllloCE JJa:El.lDIT
L toW pcrlorma- :: 3 4 5 h. CUSlCIIDer rdolJOnS :: 3 .. s c. koowla:lre a( )'OUr linn's poliocs :: 3 4 5 cl knowlodre ol c:ompeu1on :: 3 4 5 e. pudua knowlodse :: 3 4 s r knowlodre d CU>I<>~~~<n :: 3 4 5 I wnc.....,.._...,,, :: 3 4 5 h .,.._ 2 3 4 s I npmsraana~t 2 3 4 s I •bdll)' 10 n:.ach quo<"' 2 3 4 5 l ldltfl1 Wlls 2 4 I """'"' •fllnudc (narur.ol •bllooy) l 4
Ul.TYPf 57. Whtch of the followmg bnef descnpuons proVldes the best ptcture of your spec:tfic organtzatlonal woric. group. Please mdtcate whtch summary best charactenzes your work group by placmg a check mart on the !me ne:rt to the lener (A) or (B). Please mark only one c/101ce.
__ (A) My orgamzanonal woric. group tends to be unpersonal and slow to change Decis1ons are made by mdividuals at1ugfier levels wtth ltnJe tf any tnput from employees Exphclt rules and control mechantsms are used to comrol employee behaVlor.
__ (B) My or.zamzanonal woric. group tends to be soc tal mterpl'rsonal, and adaptiVe as It rucu to changmg struanons Employees pamCJpare m declSton malung and behav10r ts controlled through the common goals and mutual trust tnat e:usts among employ .. es and oerween employees and management.
••• 71-WJK YOU FOR COMPLET1NG THE SURVEY ••• CI)P"YajGKT AJUIIIO. __ _
VITA
Michael Roy Williams
Candidate for the Degree of
Doctor of Philosophy
Thesis: ORGANIZATIONAL CULTURE AS A PREDICTOR OF THE LEVEL OF SALESPERSONS' CUSTOMER ORIENTED BEHAVIOR
Major Field: Business Administration
Biographical:
Personal Data: Born in Altus, Oklahoma, April,l4, 1946, the. son of Roy and Goldie Williams .. Married October 5, 1968 to Marilyn K. '(Henry) Williams. Two daughters, Aimee L. Williams and Kerri N. Williams.
Education: Graduated from Altus Senior High School, Altus, Oklahoma, in June, 1964; received Bachelor of Business Administration from University of Oklahoma, Norman, Oklahoma, in June 1968; received Master of Business Administration from University of Oklahoma, Norman, Oklahoma, in May, 1970; completed requirements for the Doctor of Philosophy degree at Oklahoma State University, Stillwater, Oklahoma, in July, 1992.
Professional Experience: Director·~f Business and Acquisition Research Department, Doric Corporation, Oklahoma City, Oklahoma, 1970 to 1971;- ·Assistant to the President, Doric Corporation, Oklahoma City, Oklahoma, 1971 to 1973; Sales Manager and Promotions Director, A & W Leasing Corporation, Lawton, Oklahoma, 1973 to.l975; Vice-President for Marketing, A & W Leasing Corporation, Lawton, Oklahoma, 1975 to 1978; President and General Manager, A & W Leasing Corporation, Lawton, Oklahoma, 1978 to 1987; Owner and Research Associate, Business Development Services, Inc., Lawton, Oklahoma, 1987 to .present; Research Associate, Center for Values Research, Dallas, Texas, 19~1 to present.
Honors and Professional Organizations: President's Leadership Class, University of Oklah~ma; Beta Gamma Sigma; Alpha Mu Alpha; Who's Who in the South and Southwest; Who's Who in American Education; American Marketing Association Doctoral Consortium Fellow; National Fellow, Richard D. Irwin Foundation; American Marketing Association; Academy of Marketing Science.