Design of a deployment rotation mechanism for microsatellite
A consensus list of microsatellite markers for olivegenotyping
Luciana Baldoni Æ Nicolo G. Cultrera Æ Roberto Mariotti Æ Claudia Ricciolini ÆSergio Arcioni Æ Giovanni G. Vendramin Æ Anna Buonamici Æ Andrea Porceddu ÆVania Sarri Æ Maria A. Ojeda Æ Isabel Trujillo Æ Luis Rallo Æ Angjelina Belaj ÆEnzo Perri Æ Amelia Salimonti Æ Innocenzo Muzzalupo Æ Alberto Casagrande ÆOrietta Lain Æ Rachele Messina Æ Raffaele Testolin
Received: 4 January 2009 / Accepted: 9 April 2009 / Published online: 13 May 2009
� Springer Science+Business Media B.V. 2009
Abstract Cultivar identification is a primary con-
cern for olive growers, breeders, and scientists. This
study was aimed at examining the SSR markers
retrieved from the literature and currently used in
olive study, in order to select those most effective
in characterizing the olive accessions and to make
possible the comparison of data obtained by
different laboratories. Olive microsatellite profiles
were assessed by four independent laboratories,
which analyzed 37 pre-selected SSR loci on a set
of 21 cultivars. These SSR markers were initially
tested for their reproducibility, power of discrimi-
nation and number of amplified loci/alleles. Inde-
pendent segregation was tested for each pair of
SSRs in a controlled cross and the allelic error rate
was quantified. Some of them were finally selected
as the most informative and reliable. Most of the
alleles were sequenced and their sizes were deter-
mined. Profiles of the reference cultivars and a list
of alleles with their sizes obtained by sequencing
are reported. Several genetic parameters have been
analysed on a larger set of cultivars allowing for a
deeper characterization of the selected loci. Results
Electronic supplementary material The online version ofthis article (doi:10.1007/s11032-009-9285-8) containssupplementary material, which is available to authorized users.
L. Baldoni (&) � N. G. Cultrera � R. Mariotti �C. Ricciolini � S. Arcioni
CNR-Istituto di Genetica Vegetale, 06128 Perugia, Italy
e-mail: [email protected]
G. G. Vendramin � A. Buonamici
CNR-Istituto di Genetica Vegetale, 50019 Sesto
Fiorentino (Firenze), Italy
A. Porceddu
DSGVA, University of Sassari, 07100 Sassari, Italy
V. Sarri
Dipartimento di Biologia Cellulare e Ambientale, Sez.
Biologia Cellulare e Molecolare, University of Perugia,
06100 Perugia, Italy
M. A. Ojeda � I. Trujillo � L. Rallo
Departamento de Agronomıa, Campus Universitario de
Rabanales, University of Cordoba, 14080 Cordoba, Spain
A. Belaj
Centro ‘‘Alameda del Obispo’’-IFAPA, 14083 Cordoba,
Spain
E. Perri � A. Salimonti � I. Muzzalupo
CRA-Centro di Ricerca per l’Olivicoltura e l’Industria
Olearia, 87036 Rende (CS), Italy
I. Muzzalupo
CRA-Centro di Ricerca per le Produzioni Foraggere e
Lattiero-Casearie, 26900 Lodi, Italy
A. Casagrande � R. Testolin
Istituto di Genomica Applicata, Parco Scientifico e
Tecnologico, 33100 Udine, Italy
O. Lain � R. Messina � R. Testolin
Dipartimento di Scienze Agrarie e Ambientali, University
of Udine, 33100 Udine, Italy
123
Mol Breeding (2009) 24:213–231
DOI 10.1007/s11032-009-9285-8

of this study provide a list of recommended
markers and protocols for olive genotyping as well
as the allelic profile of a set of reference cultivars
that would be useful for the establishment of a
universal database of olive accessions.
Keywords SSR � Fingerprinting �Cultivar characterization � Olea europaea �Repeat motif � Allelic ladder
Introduction
Fingerprinting based on SSR markers has become a
popular tool for characterizing cultivars, for similar-
ity evaluation and for paternity and kinship analyses
in crop plant species (Lacape et al. 2007).
In olive, similar to other plant species, all SSRs so
far identified carry di-nucleotide repeats, due to their
high frequency in genomes (Carriero et al. 2002;
Cipriani et al. 2002; De La Rosa et al. 2002; Dıaz
et al. 2006; Rallo et al. 2000; Sabino Gil et al. 2006;
Sefc et al. 2000). They are mainly AG/CT repeats, the
most common motif in plants (Morgante and Olivieri
1993). Genotyping with di-nucleotide microsatellites
is difficult because separation of neighbouring alleles
requires very precise and reliable protocols for allele
separation and identification to avoid allele misi-
dentification (Amos et al. 2007). Weeks et al. (2002)
reported that 83% of discrepancies among laborato-
ries in scoring di-nucleotide microsatellites were due
to erroneous length attribution during the binning
process.
The problems related to this kind of markers and
the lack of agreement on a common set of SSR loci
makes comparison of fingerprinting data among
laboratories very problematic. In several recently
published papers dealing with olive cultivar finger-
printing, different sets of SSR markers have been
chosen and significant discrepancies in allele size
assignment have also been observed when the same
loci were compared (Bandelj et al. 2002; La Mantia
et al. 2005; Montemurro et al. 2005; Muzzalupo et al.
2008; Rekik et al. 2008; Sarri et al. 2006; Stambuk
et al. 2007). These discrepancies are likely due to the
different methodologies applied for allele sizing, but
they could be the consequence of genotyping errors,
even if the occurrence of intra-cultivar variation
could not be excluded, as for example observed by
Banilas et al. (2003) analysing accessions of ‘Lado-
lia’, an ancient olive variety of Cyprus. Despite
fingerprinting protocols have become more accurate
in the long run, genotyping errors still occur, leading
to discordant microsatellite profiles for the same
genotype.
A previous work has demonstrated that the
discrimination power of a few SSR markers was
sufficiently high to distinguish more than 100 olive
genotypes (Muzzalupo et al. 2008; Sarri et al. 2006),
suggesting that the proper selection of a commonly-
accepted set of microsatellites would represent an
extremely important step in strengthening the olive
cultivars discrimination. On the contrary, the numer-
ous analyses performed by means of SSRs on
important and diffused cultivars (i.e. Leccino and
Frantoio) have not yet definitively characterized their
multi-locus genotype, because they have been
screened with different loci (Bandelj et al. 2002;
Belaj et al. 2004a) or, when common loci were used,
the alleles length have been differently sized (Bandelj
et al. 2002; Muzzalupo et al. 2008; Sarri et al. 2006).
Up to now, the high genetic diversity of the
cultivated olive, the confusion about the names given
to each genotype, the local distribution of most of
varieties and the large number of collections estab-
lished in each country represent important factors
which did not allow the development of a reliable
cultivar database of SSR profiles.
Furthermore, the olive cultivars are propagated
mostly asexually, by cuttings or grafting, thus each
olive cultivar represents several ‘‘ramets’’ belonging
to one genetically defined ‘‘genet’’. Mutations leading
to clonal variants may occur in natural and agricul-
tural conditions and the presence of clonal variation
within olive cultivars is still object of dispute and not
clarified by the use of other molecular markers (Belaj
et al. 2004b; Gemas et al. 2004). SSR markers have
demonstrated the ability to detect clonal variants in
tree species like aspen (Suvanto and Latva-Kar-
janmaa 2005) and grape (This et al. 2006), where
many microsatellite mutations have been shown to
exist in a chimeric state.
In this study, a large set of previously published
olive SSRs has been evaluated and a ranked list of
best 11-based on reproducibility, quality of scoring,
information content, independent segregation and dis-
crimination capacity has been selected. It represents
214 Mol Breeding (2009) 24:213–231
123
the first attempt to establish a consensus list of
markers to make data comparison among laboratories
feasible and to establish a common olive database.
These results should allow the alignment of the olive
genotyping protocols to those of other fruit crops,
such as peach (Aranzana et al. 2003), grape (This et al.
2004; Cipriani et al. 2008), cacao (Saunders et al.
2004), apple (Liebhard et al. 2002) and strawberry
(Govan et al. 2008), where a list of microsatellites
recommended for fingerprinting already exists,
together with a list of most common alleles and/or
reference genotype profiles.
Another goal of this work consists of the release of
information on the ability of SSR markers to
correctly assign olive cultivars to their areas of
cultivation/origin. In fact, olive oil being one of the
most adulterated food products in Europe, numerous
efforts are made in order to develop molecular tools
able to establish the oil cultivar composition (Testolin
and Lain 2005). To achieve this objective, a robust
method to track the origin of olive cultivars needs to
be developed.
Materials and methods
Plant material and DNA extraction
To get a first evaluation of the usefulness of SSRs for
cultivar fingerprinting and identification, a set of
analyses was performed considering 21 olive culti-
vars (Table 1). In order to avoid confusion about
sample identity, most of the samples are represented
by a single individual and only four were collected
from two different collections. For each accession,
fresh young leaves were collected from plants of
either the World Olive Germplasm Bank of Cordoba-
Spain (WOGB) or the olive germplasm collection of
Cosenza-Italy (Centro di Ricerca per l’Olivicoltura e
l’Industria Olearia, CRA-OLI). Independent DNA
extraction was performed by Lab 2 (CNR-Istituto di
Genetica Vegetale, Perugia, Italy) and by Lab 4
(Departamento de Agronomıa, Univ. Cordoba,
Spain), allowing evaluation of the influence of
DNA quality on the SSR profiles.
DNA was extracted in Lab 2 using the Qiagen
DNeasy Plant Mini Kit, following manufacturer’s
instructions, and in Lab 4 using the method described
by De La Rosa et al. (2002). Lab 2 has provided DNA
samples to Lab 1 (Dipartimento di Scienze Agrarie e
Ambientali, University of Udine, Italy) and Lab 3
(CRA-OLI).
Creation of a SSR ranking list
Seventy-seven SSRs were retrieved from the litera-
ture (Carriero et al. 2002; Cipriani et al. 2002; De La
Rosa et al. 2002; Sefc et al. 2000) and tested to select
a sub-set of SSR markers useful for the characteriza-
tion of olive cultivars. The most recently published
SSRs (Dıaz et al. 2006; Sabino Gil et al. 2006) were
unavailable at the time this work began and were not
included in the evaluation.
Among the available SSRs, forty were immedi-
ately discarded because in previous papers (Belaj
et al. 2003; Carriero et al. 2002; Doveri et al. 2008) or
in preliminary tests of PCR amplification and elec-
trophoretic separation, they showed poor amplifica-
tion or very low polymorphism. The remaining 37
SSRs, representing the most extensively used micro-
satellites for olive cultivar evaluation (Bandelj et al.
2002; Belaj et al. 2004a; Lopes et al. 2004; La Mantia
et al. 2005; Montemurro et al. 2005; Muzzalupo et al.
2006; Muzzalupo et al. 2008; Omrani-Sabbaghi et al.
2007; Poljuha et al. 2008; Rallo et al. 2003; Rekik
et al. 2008; Sarri et al. 2006), were processed on the
panel of 21 cultivars.
In a first step, these loci were analyzed to assess
the following parameters: (1) quality of the peak
signal, ranked as strong, medium and weak; (2)
stuttering level, scaled as low (no or low stuttering),
medium and high; (3) number of amplified loci (if
more than one); and (4) estimated frequency of null
alleles (Brookfield 1996), calculated by using Identity
1.0 software (Wagner and Sefc 1999).
To guarantee that the information carried by the
SSR markers was nearly independent, the patterns of
co-segregation of the 37 SSRs were tested on a
mapping population derived by crossing two highly
heterozygous cultivars (Baldoni, unpublished data).
This analysis was carried out by Lab 2 and indepen-
dent segregation was evaluated for each pair of SSRs.
To evaluate the concordance of the results
obtained by different labs and estimate the potential
sources of errors, which may lead to incorrect
genotyping and affect the conclusions of most
analyses (Hoffman and Amos 2005), the mean allelic
error rate (ER), defined as the ratio between the
Mol Breeding (2009) 24:213–231 215
123
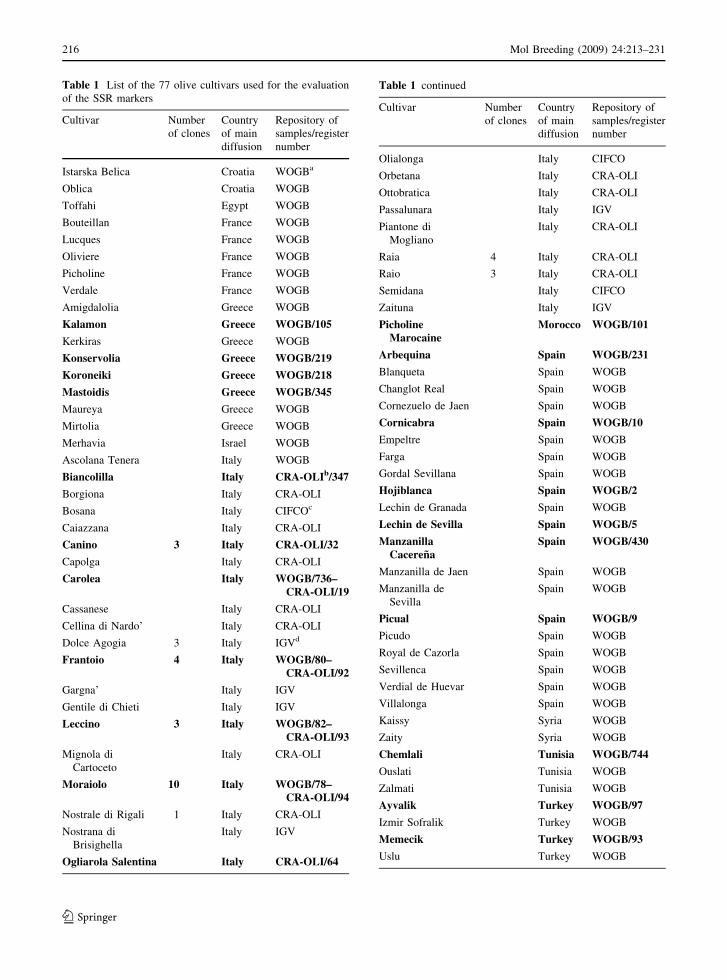
Table 1 List of the 77 olive cultivars used for the evaluation
of the SSR markers
Cultivar Number
of clones
Country
of main
diffusion
Repository of
samples/register
number
Istarska Belica Croatia WOGBa
Oblica Croatia WOGB
Toffahi Egypt WOGB
Bouteillan France WOGB
Lucques France WOGB
Oliviere France WOGB
Picholine France WOGB
Verdale France WOGB
Amigdalolia Greece WOGB
Kalamon Greece WOGB/105
Kerkiras Greece WOGB
Konservolia Greece WOGB/219
Koroneiki Greece WOGB/218
Mastoidis Greece WOGB/345
Maureya Greece WOGB
Mirtolia Greece WOGB
Merhavia Israel WOGB
Ascolana Tenera Italy WOGB
Biancolilla Italy CRA-OLIb/347
Borgiona Italy CRA-OLI
Bosana Italy CIFCOc
Caiazzana Italy CRA-OLI
Canino 3 Italy CRA-OLI/32
Capolga Italy CRA-OLI
Carolea Italy WOGB/736–CRA-OLI/19
Cassanese Italy CRA-OLI
Cellina di Nardo’ Italy CRA-OLI
Dolce Agogia 3 Italy IGVd
Frantoio 4 Italy WOGB/80–CRA-OLI/92
Gargna’ Italy IGV
Gentile di Chieti Italy IGV
Leccino 3 Italy WOGB/82–CRA-OLI/93
Mignola di
Cartoceto
Italy CRA-OLI
Moraiolo 10 Italy WOGB/78–CRA-OLI/94
Nostrale di Rigali 1 Italy CRA-OLI
Nostrana di
Brisighella
Italy IGV
Ogliarola Salentina Italy CRA-OLI/64
Table 1 continued
Cultivar Number
of clones
Country
of main
diffusion
Repository of
samples/register
number
Olialonga Italy CIFCO
Orbetana Italy CRA-OLI
Ottobratica Italy CRA-OLI
Passalunara Italy IGV
Piantone di
Mogliano
Italy CRA-OLI
Raia 4 Italy CRA-OLI
Raio 3 Italy CRA-OLI
Semidana Italy CIFCO
Zaituna Italy IGV
PicholineMarocaine
Morocco WOGB/101
Arbequina Spain WOGB/231
Blanqueta Spain WOGB
Changlot Real Spain WOGB
Cornezuelo de Jaen Spain WOGB
Cornicabra Spain WOGB/10
Empeltre Spain WOGB
Farga Spain WOGB
Gordal Sevillana Spain WOGB
Hojiblanca Spain WOGB/2
Lechin de Granada Spain WOGB
Lechin de Sevilla Spain WOGB/5
ManzanillaCacerena
Spain WOGB/430
Manzanilla de Jaen Spain WOGB
Manzanilla de
Sevilla
Spain WOGB
Picual Spain WOGB/9
Picudo Spain WOGB
Royal de Cazorla Spain WOGB
Sevillenca Spain WOGB
Verdial de Huevar Spain WOGB
Villalonga Spain WOGB
Kaissy Syria WOGB
Zaity Syria WOGB
Chemlali Tunisia WOGB/744
Ouslati Tunisia WOGB
Zalmati Tunisia WOGB
Ayvalik Turkey WOGB/97
Izmir Sofralik Turkey WOGB
Memecik Turkey WOGB/93
Uslu Turkey WOGB
216 Mol Breeding (2009) 24:213–231
123
number of allelic mismatches and 2nt, the number of
replicated alleles, in our case being nt = 4 (Pomp-
anon et al. 2005), has been quantified on the panel of
the selected SSRs.
PCR amplification and visualization
Each lab carried out independent SSR analyses on the
common set of 21 DNA samples, using different Taq
enzymes, cycling conditions, amplicon separation
and visualization methods.
In Lab 1 DNA amplification was carried out using
the following standard conditions: PCR reactions
were performed using 200 lM each dNTP, 0.3 lM
each primer (forward primer was labeled with either
FAM or HEX fluorescent dyes), 20 ng genomic DNA
and 0.3 U of HotMaster Taq polymerase (Eppen-
dorf). The thermal profile was as follows: 95�C for
2 min for 1 cycle; 94�C for 20 s, annealing temper-
atures as indicated in the original published papers
for 20 s, and 65�C for 40 s for 25 cycles; then 65�C
for 7 min. Amplified products were run on a
MegaBACE 500 capillary sequencer (GE Healthcare,
USA) using ET-ROX dye (Et400-R size standard, GE
Healthcare, USA) as internal standard. Dye-labeled
amplicons were sized using Genetic Profiler v2.0
software (GE Healthcare, USA) and then checked
manually with different controls, as reported in the
results section.
Lab 2 used the QIAGEN Multiplex PCR Kit
(QIAGEN), multiplexing three SSR loci, each carry-
ing a HEX, FAM or TAMRA label at the 50-end of
one of the primers and following the manufacturer’s
instructions. The following PCR cycle was used on a
GeneAmp PCR System 9600 Thermal Cycler
(Applied Biosystems, USA): activation at 95�C
15 min; amplification (35 cycles) at 94�C for 30 s,
57�C for 90 s, and 72�C for 60 s; final extension at
72�C for 10 min. Amplicons were visualized by a
MegaBACE 1000, 96 capillary sequencer (GE
Healthcare, USA), using ET-ROX dye (Et400-R size
standard, GE Healthcare, USA) as internal standard
and Genetic Profiler v2.0 software (GE Healthcare,
USA).
Lab 3 followed the PCR conditions reported in the
original published papers and alleles were separated
by a 2100 Bioanalyzer (Agilent Technologies, Wald-
bronn, Germany) using a DNA 500 LabChip Kit,
according to Muzzalupo et al. (2007).
Lab 4 followed the PCR conditions reported in
Belaj et al. (2004a). Allele analysis was carried out
on an automatic capillary sequencer ABI 3130
Genetic Analyzer (Applied Biosystems/HITACHI)
using the internal standard GeneScan 400 HD-Rox.
After the automatic binning and calling—indepen-
dently performed by each lab—allele lengths were
compared in order to define the allelic profiles of each
sample.
Allele sequencing
To assign the correct size to alleles and to verify the
presence of sequence polymorphisms within the
repeats or along the flanking regions, most alleles
(53 out of 85 obtained on 21 cultivars) of the selected
loci were sequenced.
PCR products were run on 3% (w/v) agarose gels
(FMC BioProducts), containing ethidium bromide
(1 lg ml-1) in TBE 19 buffer, at 100 V for 7 h.
Bands were excised from the gel and purified using the
QIAquick Gel Extraction kit (Qiagen). The amount of
recovered DNA was quantified using a 2100 Bioan-
alyzer (Agilent Technologies) on a DNA 500 Chip.
When alleles of a cultivar differed by few repeats
(thus not distinguishable on the agarose gel), ampli-
fication products were run on PAGE to get better
separation of bands. DNA recovered from band
excision was directly sequenced using the BigDye
Terminator technique (PE Applied Biosystems). PCR
reactions were run on an ABI Prism 310 Automatic
Sequencer (PE Applied Biosystems, Foster City, CA,
USA). Each allele was sequenced from different
Table 1 continued
Cultivar Number
of clones
Country
of main
diffusion
Repository of
samples/register
number
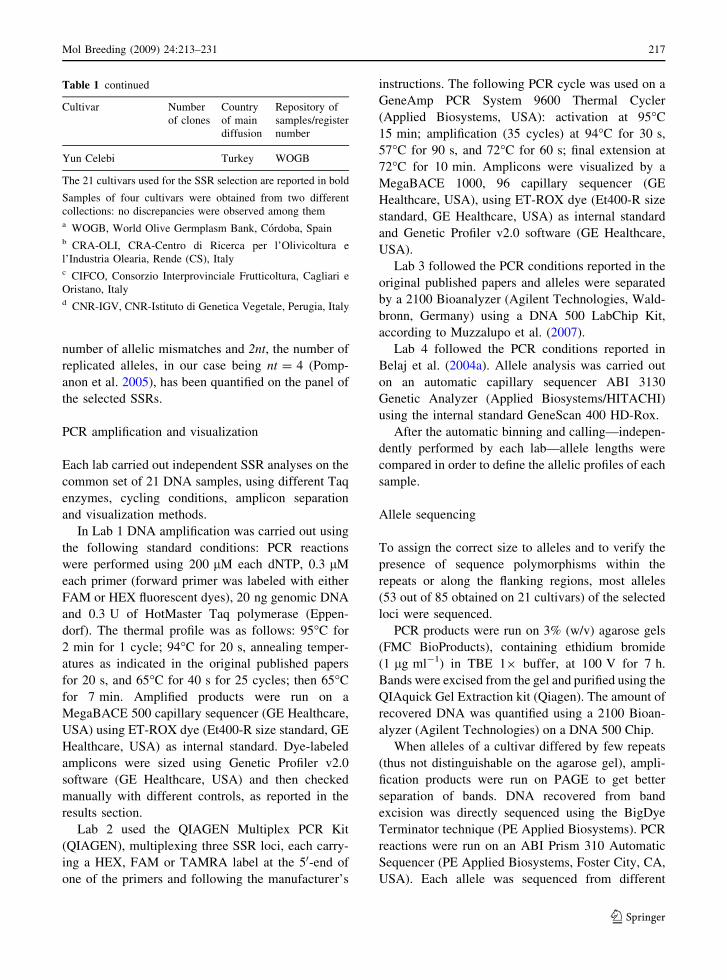
Yun Celebi Turkey WOGB
The 21 cultivars used for the SSR selection are reported in bold
Samples of four cultivars were obtained from two different
collections: no discrepancies were observed among thema WOGB, World Olive Germplasm Bank, Cordoba, Spainb CRA-OLI, CRA-Centro di Ricerca per l’Olivicoltura e
l’Industria Olearia, Rende (CS), Italyc CIFCO, Consorzio Interprovinciale Frutticoltura, Cagliari e
Oristano, Italyd CNR-IGV, CNR-Istituto di Genetica Vegetale, Perugia, Italy
Mol Breeding (2009) 24:213–231 217
123
cultivars (unless when present in a single cultivar)
from both ends at least twice and up to 9 times (3.1
on average at each locus) in the case of homoplasy or
when the allele was present in many genotypes. For
each SSR locus, allele sequence data were aligned
using BIOEDIT software.
Allelic ladder construction
Allelic ladders were constructed from a pool of
cultivars according to the following criteria: (a)
inclusion of most if not all allelic variants of the
cultivar set, and (b) each allele represented once, in
order to obtain homogeneous signals in the electro-
phoretic runs.
The software LadderFinder (http://www.applied
genomics.org/tools.php) allows to select allelic lad-
ders according to the above criteria by using the
Edmonds’s maximal matching algorithm (Edmonds
1965) on a non-bipartite graph which models the
problem.
PCRs were carried out individually for each locus
on each individual cultivar of the pool identified by
LadderFinder and the amplified products were mixed
in a variable volume ratio to uniform peak heights of
the samples when run on the sequencer.
Validation of the selected olive SSRs on a larger
set of olive cultivars
In order to evaluate the power of the selected SSR
markers to distinguish the olive cultivars, to estimate
population differentiation and to capture intra-cultivar
clonal variation, a larger set of genotypes, including 77
cultivars and 31 clonal variants belonging to eight
varieties, were then analyzed by Lab. 2 (Table 1). To
detect the highest possible polymorphism, the clonal
variants have been chosen among ancient olives (100
or more years old), recognized as belonging to known
varieties (G. Pannelli, pers. comm.).
The 77 cultivars were derived from the most
important regions of the Mediterranean basin and
originated from different gene pools (Breton et al.
2008). Most of them have been previously analyzed
with different sets of SSR markers (Belaj et al. 2004a;
Muzzalupo et al. 2008; Sarri et al. 2006).
The analysis of SSR data was carried out by Lab. 2
using the Match option implemented in GenAlEx
version 6 software (Peakall and Smouse 2005),
applying the matching at all loci and that at all but
one locus for two or more sample options. Individuals
identical at all loci or with a single mismatch were
dropped from the data set.
The power of cultivar discrimination at each locus
and for increasing loci combinations was estimated as
the Information Index implemented in GenAlEx and
calculated on a single-locus basis. To estimate overall
genetic diversity, the following measures were also
calculated for the 77 cultivars using GenAlEx:
Number of alleles per locus (Na), Effective number
of alleles (Ne); Observed heterozygosity (Ho),
Expected heterozygosity (He), Inbreeding coefficient
(Fis). AMOVA was used to estimate the degree of
genetic differentiation among populations using the
Fst estimator. The significance of the estimates per
locus was tested by permutations (9,999 replicates).
Estimated frequency of null alleles (F(null)) and
departure from Hardy–Weinberg equilibrium
(HWE) were tested with CERVUS 3.0 (Kalinowski
et al. 2007). Significance of departure from HWE was
tested applying sequential Bonferroni correction.
The spatial genetic structuring analysis was per-
formed through STRUCTURE (Pritchard et al. 2000).
The individual genome’s quote derived from different
gene pools was estimated by means of 200,000 burn-
in steps followed by 1,000,000 MCMC, according to
previous testing of the power of STRUCTURE to
identify stocked individuals (Larsen et al. 2005) and
assuming an admixture model and correlated allele
frequencies. No prior information was used to define
the clusters. The choice of the most likely number of
clusters (K) was carried out by calculating an ad hoc
statistic DK, based on the rate of change in the log
probability of data between successive K values, as
described by Evanno et al. (2005).
In order to evaluate the ability of the SSR marker
set to estimate population differentiation, the 77
cultivars were attributed to three different geograph-
ical areas of origin (West, Central and East Mediter-
ranean), according to their main cultivation regions,
taking into account previous observations on the
allocation of variability among cultivars (Belaj et al.
2003; Sarri et al. 2006) and considering the results
derived from the STRUCTURE analysis. The Wes-
tern group contains Moroccan, Portuguese and
Spanish cultivars from the Andalusia region, the
Central group comprises the Spanish varieties from
Catalonia and those from France and Central-North
218 Mol Breeding (2009) 24:213–231
123
Italy; South-Italian, Greek, Turkish and North-East-
ern African varieties were included in the Eastern
group.
AMOVA and assignment test were performed
using GenAlEx. The population assignment test was
carried out applying the ‘leave one out’ option.
Results
Microsatellite reproducibility
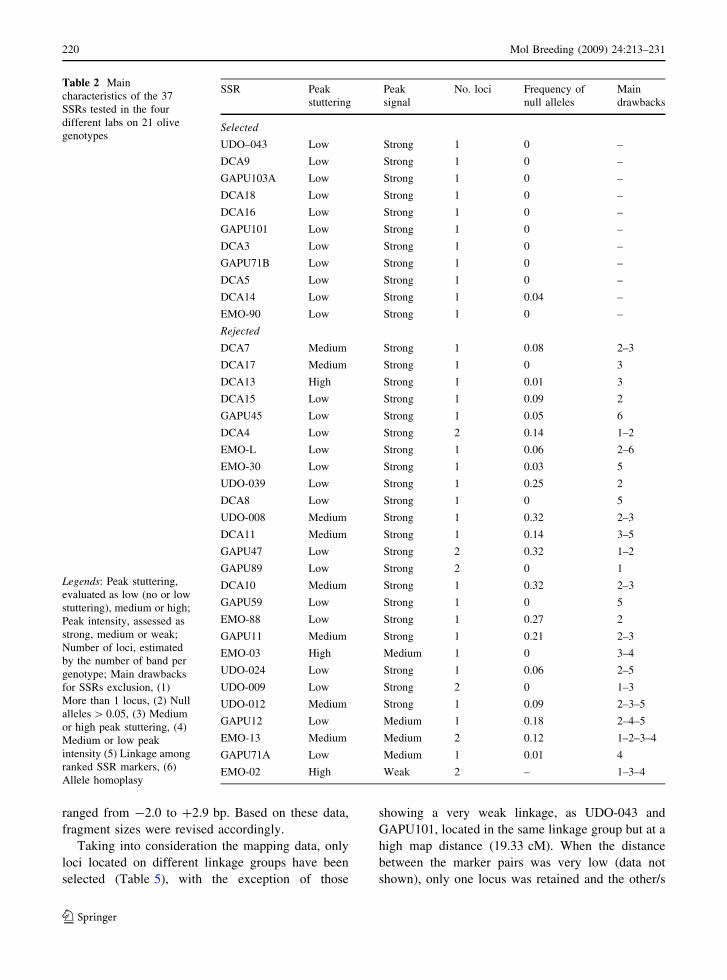
The main characteristics of the 37 microsatellite loci
are reported in Table 2. Four loci showed a medium
to weak peak signal (EMO-02, EMO-03, EMO-13,
GAPU12 and GAPU71A), 12 exhibited high to
medium peak stuttering, additional peaks and other
problems that prevented identification of the true
alleles (DCA11, EMO-02 and EMO-03). Six cases of
amplification of two or more loci, possibly overlap-
ping, were ascertained (DCA4, EMO-02, EMO-13,
GAPU47, GAPU89 and UDO-009). The estimated
frequency of null alleles ranged from 0 to 32%
(UDO-008, GAPU47 and DCA10) and 14 loci
displayed values higher than 5%. Twenty-six of the
37 SSRs, revealing one or more drawbacks, were
discarded from the panel test. It is noteworthy that the
11 SSRs included in the final list still show some
minor shortcomings, but the low number of micro-
satellites retrieved from the literature did not allow
for the application of more stringent selection criteria.
Pherogram examples of these markers are reported in
Table ESM1.
Some discrepancies in allele size estimates were
observed among labs. This variation, up to 5 bp in
length, was generally consistent among labs and
within loci. The main sources of discrepancies were
associated to the use of different sequencers and the
type of internal ladders used. These problems were
mitigated within each lab by multiple processing runs
of the same locus and by excluding aberrant runs
from the pool.
Allelic ladders
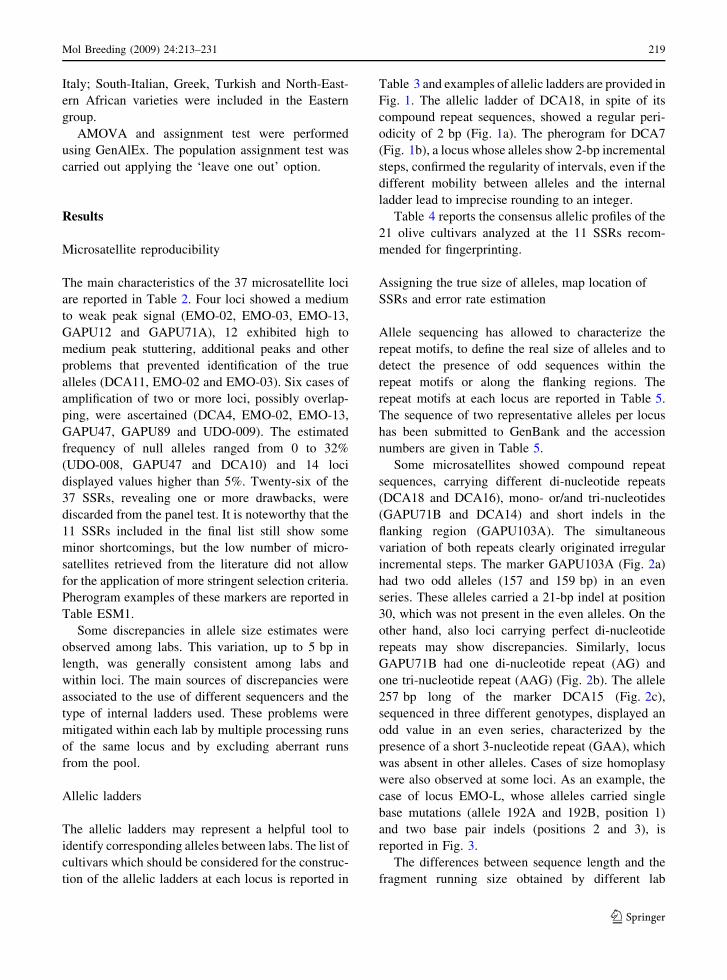
The allelic ladders may represent a helpful tool to
identify corresponding alleles between labs. The list of
cultivars which should be considered for the construc-
tion of the allelic ladders at each locus is reported in
Table 3 and examples of allelic ladders are provided in
Fig. 1. The allelic ladder of DCA18, in spite of its
compound repeat sequences, showed a regular peri-
odicity of 2 bp (Fig. 1a). The pherogram for DCA7
(Fig. 1b), a locus whose alleles show 2-bp incremental
steps, confirmed the regularity of intervals, even if the
different mobility between alleles and the internal
ladder lead to imprecise rounding to an integer.
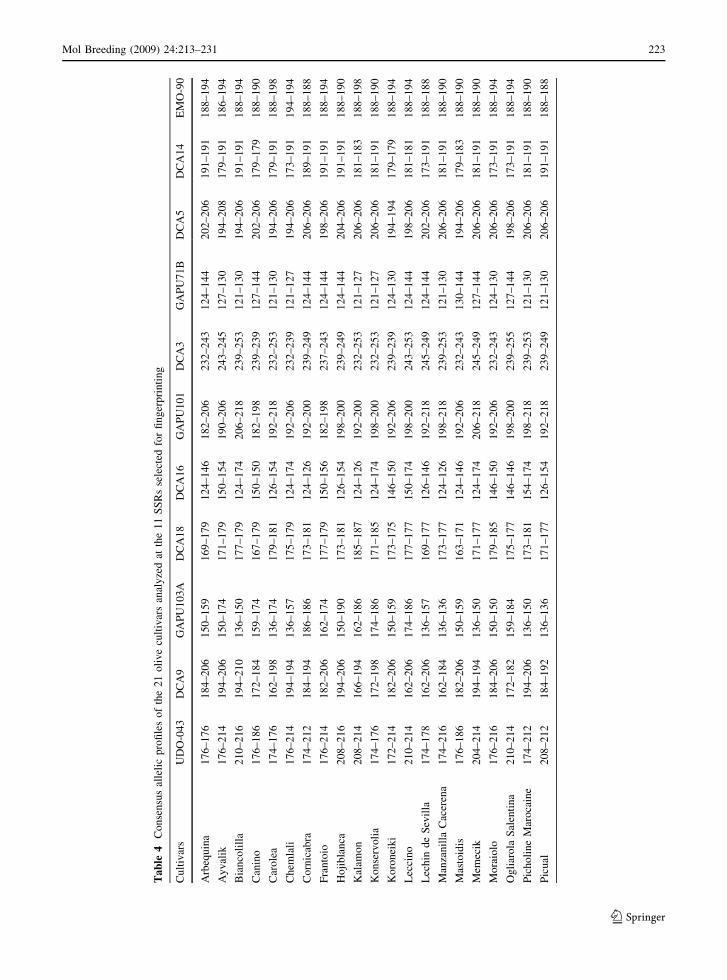
Table 4 reports the consensus allelic profiles of the
21 olive cultivars analyzed at the 11 SSRs recom-
mended for fingerprinting.
Assigning the true size of alleles, map location of
SSRs and error rate estimation
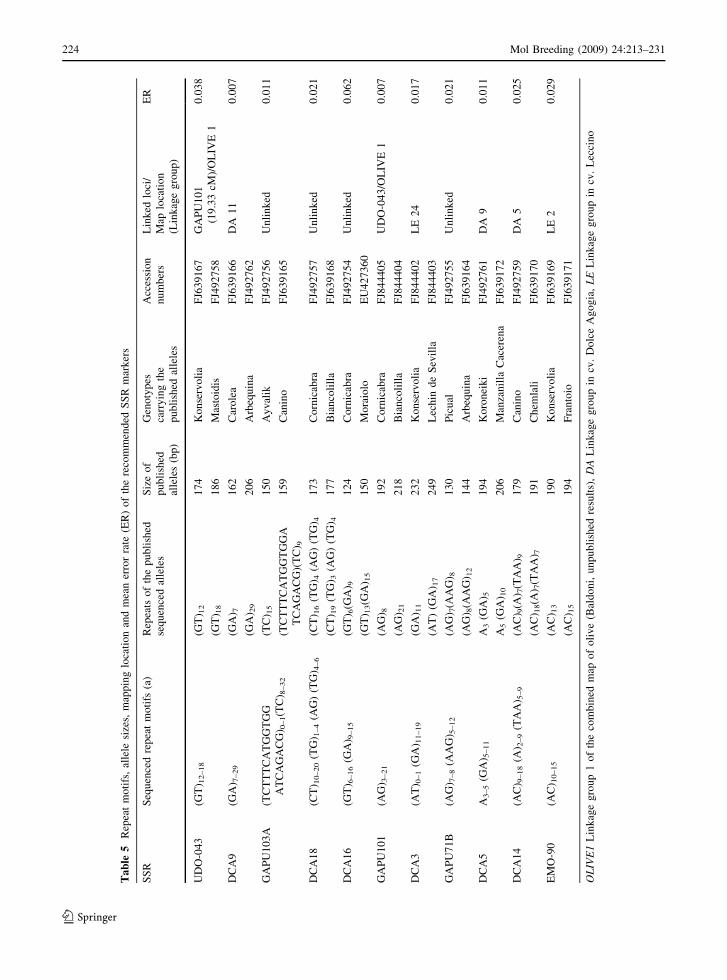
Allele sequencing has allowed to characterize the
repeat motifs, to define the real size of alleles and to
detect the presence of odd sequences within the
repeat motifs or along the flanking regions. The
repeat motifs at each locus are reported in Table 5.
The sequence of two representative alleles per locus
has been submitted to GenBank and the accession
numbers are given in Table 5.
Some microsatellites showed compound repeat
sequences, carrying different di-nucleotide repeats
(DCA18 and DCA16), mono- or/and tri-nucleotides
(GAPU71B and DCA14) and short indels in the
flanking region (GAPU103A). The simultaneous
variation of both repeats clearly originated irregular
incremental steps. The marker GAPU103A (Fig. 2a)
had two odd alleles (157 and 159 bp) in an even
series. These alleles carried a 21-bp indel at position
30, which was not present in the even alleles. On the
other hand, also loci carrying perfect di-nucleotide
repeats may show discrepancies. Similarly, locus
GAPU71B had one di-nucleotide repeat (AG) and
one tri-nucleotide repeat (AAG) (Fig. 2b). The allele
257 bp long of the marker DCA15 (Fig. 2c),
sequenced in three different genotypes, displayed an
odd value in an even series, characterized by the
presence of a short 3-nucleotide repeat (GAA), which
was absent in other alleles. Cases of size homoplasy
were also observed at some loci. As an example, the
case of locus EMO-L, whose alleles carried single
base mutations (allele 192A and 192B, position 1)
and two base pair indels (positions 2 and 3), is
reported in Fig. 3.
The differences between sequence length and the
fragment running size obtained by different lab
Mol Breeding (2009) 24:213–231 219
123
ranged from -2.0 to ?2.9 bp. Based on these data,
fragment sizes were revised accordingly.
Taking into consideration the mapping data, only
loci located on different linkage groups have been
selected (Table 5), with the exception of those
showing a very weak linkage, as UDO-043 and
GAPU101, located in the same linkage group but at a
high map distance (19.33 cM). When the distance
between the marker pairs was very low (data not
shown), only one locus was retained and the other/s
Table 2 Main
characteristics of the 37
SSRs tested in the four
different labs on 21 olive
genotypes
Legends: Peak stuttering,
evaluated as low (no or low
stuttering), medium or high;
Peak intensity, assessed as
strong, medium or weak;
Number of loci, estimated
by the number of band per
genotype; Main drawbacks
for SSRs exclusion, (1)
More than 1 locus, (2) Null
alleles [ 0.05, (3) Medium
or high peak stuttering, (4)
Medium or low peak
intensity (5) Linkage among
ranked SSR markers, (6)
Allele homoplasy
SSR Peak
stuttering
Peak
signal
No. loci Frequency of
null alleles
Main
drawbacks
Selected
UDO–043 Low Strong 1 0 –
DCA9 Low Strong 1 0 –
GAPU103A Low Strong 1 0 –
DCA18 Low Strong 1 0 –
DCA16 Low Strong 1 0 –
GAPU101 Low Strong 1 0 –
DCA3 Low Strong 1 0 –
GAPU71B Low Strong 1 0 –
DCA5 Low Strong 1 0 –
DCA14 Low Strong 1 0.04 –
EMO-90 Low Strong 1 0 –
Rejected
DCA7 Medium Strong 1 0.08 2–3
DCA17 Medium Strong 1 0 3
DCA13 High Strong 1 0.01 3
DCA15 Low Strong 1 0.09 2
GAPU45 Low Strong 1 0.05 6
DCA4 Low Strong 2 0.14 1–2
EMO-L Low Strong 1 0.06 2–6
EMO-30 Low Strong 1 0.03 5
UDO-039 Low Strong 1 0.25 2
DCA8 Low Strong 1 0 5
UDO-008 Medium Strong 1 0.32 2–3
DCA11 Medium Strong 1 0.14 3–5
GAPU47 Low Strong 2 0.32 1–2
GAPU89 Low Strong 2 0 1
DCA10 Medium Strong 1 0.32 2–3
GAPU59 Low Strong 1 0 5
EMO-88 Low Strong 1 0.27 2
GAPU11 Medium Strong 1 0.21 2–3
EMO-03 High Medium 1 0 3–4
UDO-024 Low Strong 1 0.06 2–5
UDO-009 Low Strong 2 0 1–3
UDO-012 Medium Strong 1 0.09 2–3–5
GAPU12 Low Medium 1 0.18 2–4–5
EMO-13 Medium Medium 2 0.12 1–2–3–4
GAPU71A Low Medium 1 0.01 4
EMO-02 High Weak 2 – 1–3–4
220 Mol Breeding (2009) 24:213–231
123

Table 3 Alleles at the 11 SSR loci and list of cultivars used to construct the allelic ladder at each locus
Locus Alleles Genotype (or alternative genotypes) Ladder
alleles
Missing
alleles
UDO-043 172, 174, 176, 178, 186, 204,
208, 210, 212, 214, 216
Canino (or Mastoidis) 176–186 204
Koroneiki 172–214
Biancolilla 210–216
Lechin de Sevilla 174–178
Kalamon (or Picual) 208–212
DCA9 162, 166, 172, 182, 184, 192,
194, 198, 206, 210
Manzanilla Cacerena 162–184 166, 192
Frantoio (or Koroneiki, Mastoidis) 182–206
Biancolilla 194–210
Konservolia 172–198
GAPU103A 136, 150, 157, 159, 162, 174,
184, 186, 190
Hojiblanca 150–190 184
Canino 159–174
Chemlali (or Lechin de Sevilla) 136–157
Kalamon 162–186
DCA18 163, 167, 169, 171, 173, 175,
177, 179, 181, 185, 187
Canino 167–179 175
Lechin de Sevilla 169–177
Mastoidis 163–171
Hojiblanca 173–181
Kalamon 185–187
DCA16 124, 126, 146, 150, 154, 156, 174 Lechin de Sevilla 126–146 124
Canino 150–150
Picholine Marocaine 154–174
GAPU101 182, 190, 192, 198, 200, 206, 218 Arbequina 182–206 190
Carolea (or Lechin de Sevilla, Picual) 192–218
Leccino 198–200
DCA3 232, 237, 239, 243, 245, 249,
253, 255
Carolea (or Kalamon, Konservolia) 232–253
Frantoio 237–243
Lechin de Sevilla (or Memecik) 245–249
Ogliarola Salentina 239–255
GAPU71B 121, 124, 127, 130, 144 Arbequina (or Cornicabra, Frantoio,
Hojiblanca, Leccino, Lechin de Sevilla)
124–144 121
Ayvalik 127–130
DCA5 194, 198, 202, 204, 206, 208 Frantoio (or Leccino, Ogliarola Salentina) 198–206 202, 204
Ayvalik 194–208
DCA14 173, 179, 181, 183, 189, 191 Chemlali (or Lechin de Sevilla, Moraiolo,
Ogliarola Salentina)
173–191 189
Mastoidis 179–183
Leccino 181–181
EMO-90 186, 188, 190, 194, 198 Canino 190–190 198
Cornicabra (or Lechin de Sevilla,
Ogliarola Salentina, Picual)
188–188
Ayvalik 186–194
Alleles not included in the ladders are also indicated. Sequenced alleles are reported in bold
Mol Breeding (2009) 24:213–231 221
123

was/were discarded. Similar assumptions have been
applied for the identification of human marker sets,
which include cases of markers located on the same
chromosome (Butler 2006, http://www.cstl.nist.gov/
biotech/strbase). DCA9, DCA3, DCA5 and EMO-90
were all located in distinct linkage groups, while
DCA18, GAPU103A, DCA16 and GAPU71B resul-
ted unlinked.
Values of allelic error rate were quite high and
ranged from 0.007 (DCA9 and GAPU101) to 0.062
(DCA16) (Table 5). The main causes of discrepan-
cies between labs were allele drop out (DCA15) and
binning errors, mainly for those loci where allele size
increments were of 2 bp (DCA17).
Discrimination power of the selected
microsatellites to estimate intra- and inter-cultivar
variability and population differentiation
The analysis of a larger set of genotypes has allowed
to identify new alleles at each locus, except for DCA3,
showing eight alleles in both set of samples. The allele
frequency at all loci is reported in Table ESM2. The
parameters estimated for the selected 11 loci on the set
of 77 cultivars are reported in Table 6. The Informa-
tion Index (I) showed values ranging from 2.425 for
the most discriminant UDO-043 to 1.404 for the least
discriminant EMO-90 and the best 11 SSRs were
ordered in a list ranked according to their I values.
Probability of identity for locus UDO-043 was 0.024;
when calculating PI over multiple best loci, as the
product of the individual PI’s, the following scores
were obtained: UDO-043 ? DCA9: 0.0006; UDO-
043 ? DCA9 ? GAPU103A: 2.52E-05.
All clones resulted identical to the reference
genotypes with, at the most, a single case of allele
drop out at one locus. The Match option of GenAlEx
clearly recognized all clonal variants, when one locus
mismatching was allowed. These differences may be
attributed to the mean error rate per allele (in this
case considered as the ratio between the number of
allelic mismatches and the number of replicated
alleles in all clones of each genotype) and not to real
genetic divergences. Loci showing mismatches were
DCA14 and DCA16.
A total of 135 alleles at 11 microsatellite loci were
detected across the 77 accessions analyzed. The
number of alleles per locus ranged from 7 at locus
EMO-90 to 21 at UDO-043, with a mean value of
12.2. The number of effective alleles per locus (Ne)
ranged from 3.16 for DCA14 and EMO-90 to 8.63 for
UDO-043.
A
Allele lengths correspond to sequenced alleles 163, 167, 169, 171, 173, 175, 177, 179, 181, 185, 187.
B
Allele lengths correspond to sequenced alleles 131, 133, 143, 145, 147, 149, 151, 165, 167.
SSR DCA7 Allelic ladder
0
500
1000
130.9
132.8 142.6
144.5
146.4
148.4
150.3
163.9
165.8
SSR DCA18 Allelic ladder
0
500
1000
162.1
166.2
168.3
170.4
172.3
174.2
176.4
178.5
180.7
184.8
186.5
Fig. 1 Allelic ladders produced for the microsatellites DCA18
(A) and DCA7 (B). Peaks representing true alleles are marked
with the symbol (•). Values in boxes are the sizes estimated by
the software. The correct size of alleles deduced from
sequences is reported below each graph. The inconsistency
between estimated and true allele sizes is evident in both SSRs
222 Mol Breeding (2009) 24:213–231
123
Ta
ble
4C
on
sen
sus
alle
lic
pro
file
so
fth
e2
1o
liv
ecu
ltiv
ars
anal
yze
dat
the
11
SS
Rs
sele
cted
for
fin
ger
pri
nti
ng
Cu
ltiv
ars
UD
O-0
43
DC
A9
GA
PU
10
3A
DC
A1
8D
CA
16
GA
PU
10
1D
CA
3G
AP
U7
1B
DC
A5
DC
A1
4E
MO
-90
Arb
equ
ina
17
6–
17
61
84
–2
06
15
0–
15
91
69
–1
79
12
4–
14
61
82
–2
06
23
2–
24
31
24
–1
44
20
2–
20
61
91
–1
91
18
8–
19
4
Ay
val
ik1
76
–2
14
19
4–
20
61
50
–1
74
17
1–
17
91
50
–1
54
19
0–
20
62
43
–2
45
12
7–
13
01
94
–2
08
17
9–
19
11
86
–1
94
Bia
nco
lill
a2
10
–2
16
19
4–
21
01
36
–1
50
17
7–
17
91
24
–1
74
20
6–
21
82
39
–2
53
12
1–
13
01
94
–2
06
19
1–
19
11
88
–1
94
Can
ino
17
6–
18
61
72
–1
84
15
9–
17
41
67
–1
79
15
0–
15
01
82
–1
98
23
9–
23
91
27
–1
44
20
2–
20
61
79
–1
79
18
8–
19
0
Car
ole
a1
74
–1
76
16
2–
19
81
36
–1
74
17
9–
18
11
26
–1
54
19
2–
21
82
32
–2
53
12
1–
13
01
94
–2
06
17
9–
19
11
88
–1
98
Ch
emla
li1
76
–2
14
19
4–
19
41
36
–1
57
17
5–
17
91
24
–1
74
19
2–
20
62
32
–2
39
12
1–
12
71
94
–2
06
17
3–
19
11
94
–1
94
Co
rnic
abra
17
4–
21
21
84
–1
94
18
6–
18
61
73
–1
81
12
4–
12
61
92
–2
00
23
9–
24
91
24
–1
44
20
6–
20
61
89
–1
91
18
8–
18
8
Fra
nto
io1
76
–2
14
18
2–
20
61
62
–1
74
17
7–
17
91
50
–1
56
18
2–
19
82
37
–2
43
12
4–
14
41
98
–2
06
19
1–
19
11
88
–1
94
Ho
jib
lan
ca2
08
–2
16
19
4–
20
61
50
–1
90
17
3–
18
11
26
–1
54
19
8–
20
02
39
–2
49
12
4–
14
42
04
–2
06
19
1–
19
11
88
–1
90
Kal
amo
n2
08
–2
14
16
6–
19
41
62
–1
86
18
5–
18
71
24
–1
26
19
2–
20
02
32
–2
53
12
1–
12
72
06
–2
06
18
1–
18
31
88
–1
98
Ko
nse
rvo
lia
17
4–
17
61
72
–1
98
17
4–
18
61
71
–1
85
12
4–
17
41
98
–2
00
23
2–
25
31
21
–1
27
20
6–
20
61
81
–1
91
18
8–
19
0
Ko
ron
eik
i1
72
–2
14
18
2–
20
61
50
–1
59
17
3–
17
51
46
–1
50
19
2–
20
62
39
–2
39
12
4–
13
01
94
–1
94
17
9–
17
91
88
–1
94
Lec
cin
o2
10
–2
14
16
2–
20
61
74
–1
86
17
7–
17
71
50
–1
74
19
8–
20
02
43
–2
53
12
4–
14
41
98
–2
06
18
1–
18
11
88
–1
94
Lec
hin
de
Sev
illa
17
4–
17
81
62
–2
06
13
6–
15
71
69
–1
77
12
6–
14
61
92
–2
18
24
5–
24
91
24
–1
44
20
2–
20
61
73
–1
91
18
8–
18
8
Man
zan
illa
Cac
eren
a1
74
–2
16
16
2–
18
41
36
–1
36
17
3–
17
71
24
–1
26
19
8–
21
82
39
–2
53
12
1–
13
02
06
–2
06
18
1–
19
11
88
–1
90
Mas
toid
is1
76
–1
86
18
2–
20
61
50
–1
59
16
3–
17
11
24
–1
46
19
2–
20
62
32
–2
43
13
0–
14
41
94
–2
06
17
9–
18
31
88
–1
90
Mem
ecik
20
4–
21
41
94
–1
94
13
6–
15
01
71
–1
77
12
4–
17
42
06
–2
18
24
5–
24
91
27
–1
44
20
6–
20
61
81
–1
91
18
8–
19
0
Mo
raio
lo1
76
–2
16
18
4–
20
61
50
–1
50
17
9–
18
51
46
–1
50
19
2–
20
62
32
–2
43
12
4–
13
02
06
–2
06
17
3–
19
11
88
–1
94
Og
liar
ola
Sal
enti
na
21
0–
21
41
72
–1
82
15
9–
18
41
75
–1
77
14
6–
14
61
98
–2
00
23
9–
25
51
27
–1
44
19
8–
20
61
73
–1
91
18
8–
19
4
Pic
ho
lin
eM
aro
cain
e1
74
–2
12
19
4–
20
61
36
–1
50
17
3–
18
11
54
–1
74
19
8–
21
82
39
–2
53
12
1–
13
02
06
–2
06
18
1–
19
11
88
–1
90
Pic
ual
20
8–
21
21
84
–1
92
13
6–
13
61
71
–1
77
12
6–
15
41
92
–2
18
23
9–
24
91
21
–1
30
20
6–
20
61
91
–1
91
18
8–
18
8
Mol Breeding (2009) 24:213–231 223
123
Ta
ble
5R
epea
tm
oti
fs,
alle
lesi
zes,
map
pin
glo
cati
on
and
mea
ner
ror
rate
(ER
)o
fth
ere
com
men
ded
SS
Rm
ark
ers
SS
RS
equ
ence
dre
pea
tm
oti
fs(a
)R
epea
tso
fth
ep
ub
lish
ed
seq
uen
ced
alle
les
Siz
eo
f
pu
bli
shed
alle
les
(bp
)
Gen
oty
pes
carr
yin
gth
e
pu
bli
shed
alle
les
Acc
essi
on
nu
mb
ers
Lin
ked
loci
/
Map
loca
tio
n
(Lin
kag
eg
rou
p)
ER
UD
O-0
43
(GT
) 12–18
(GT
) 12
17
4K
on
serv
oli
aF
J63
91
67
GA
PU
10
1
(19
.33
cM)/
OL
IVE
1
0.0
38
(GT
) 18
18
6M
asto
idis
FJ4
92
75
8
DC
A9
(GA
) 7–29
(GA
) 71
62
Car
ole
aF
J63
91
66
DA
11
0.0
07
(GA
) 29
20
6A
rbeq
uin
aF
J49
27
62
GA
PU
10
3A
(TC
TT
TC
AT
GG
TG
G
AT
CA
GA
CG
) 0–1(T
C) 8
–32
(TC
) 15
15
0A
yv
alik
FJ4
92
75
6U
nli
nk
ed0
.01
1
(TC
TT
TC
AT
GG
TG
GA
TC
AG
AC
G)(
TC
) 9
15
9C
anin
oF
J63
91
65
DC
A1
8(C
T) 1
0–20
(TG
) 1–4
(AG
)(T
G) 4
–6
(CT
) 16
(TG
) 4(A
G)
(TG
) 41
73
Co
rnic
abra
FJ4
92
75
7U
nli
nk
ed0
.02
1
(CT
) 19
(TG
) 3(A
G)
(TG
) 41
77
Bia
nco
lill
aF
J63
91
68
DC
A1
6(G
T) 6
–16
(GA
) 9–15
(GT
) 6(G
A) 9
12
4C
orn
icab
raF
J49
27
54
Un
lin
ked
0.0
62
(GT
) 13(G
A) 1
51
50
Mo
raio
loE
U4
27
36
0
GA
PU
10
1(A
G) 3
–21
(AG
) 81
92
Co
rnic
abra
FJ8
44
40
5U
DO
-04
3/O
LIV
E1
0.0
07
(AG
) 21
21
8B
ian
coli
lla
FJ8
44
40
4
DC
A3
(AT
) 0–1
(GA
) 11–19
(GA
) 11
23
2K
on
serv
oli
aF
J84
44
02
LE
24
0.0
17
(AT
)(G
A) 1
72
49
Lec
hin
de
Sev
illa
FJ8
44
40
3
GA
PU
71
B(A
G) 7
–8
(AA
G) 5
–12
(AG
) 7(A
AG
) 81
30
Pic
ual
FJ4
92
75
5U
nli
nk
ed0
.02
1
(AG
) 8(A
AG
) 12
14
4A
rbeq
uin
aF
J63
91
64
DC
A5
A3–5
(GA
) 5–11
A3
(GA
) 51
94
Ko
ron
eik
iF
J49
27
61
DA
90
.01
1
A5
(GA
) 10
20
6M
anza
nil
laC
acer
ena
FJ6
39
17
2
DC
A1
4(A
C) 9
–18
(A) 2
–9
(TA
A) 5
–9
(AC
) 9(A
) 7(T
AA
) 91
79
Can
ino
FJ4
92
75
9D
A5
0.0
25
(AC
) 18(A
) 7(T
AA
) 71
91
Ch
emla
liF
J63
91
70
EM
O-9
0(A
C) 1
0–15
(AC
) 13
19
0K
on
serv
oli
aF
J63
91
69
LE
20
.02
9
(AC
) 15
19
4F
ran
toio
FJ6
39
17
1
OL
IVE
1L
ink
age
gro
up
1o
fth
eco
mb
ined
map
of
oli
ve
(Bal
do
ni,
un
pu
bli
shed
resu
lts)
,D
AL
ink
age
gro
up
incv
.D
olc
eA
go
gia
,L
EL
ink
age
gro
up
incv
.L
ecci
no
224 Mol Breeding (2009) 24:213–231
123

10 20 30 40 50 60 GAPU103A allele 136 TGAATTTAAC TTTAAACCCA CACATTGTG- ---------- ---------- TCTCTCTCTCGAPU103A allele 150 TGAATTTAAC TTTAAACCCA CACATTGTG- ---------- ---------- TCTCTCTCTCGAPU103A allele 157 TGAATTTAAC TTTAAACCCA CACATTGTGT CTTTCATGGT GGATCAGACG TCTCTCTCTCGAPU103A allele 159 TGAATTTAAC TTTAAACCCA CACATTGTGT CTTTCATGGT GGATCAGACG TCTCTCTCTCGAPU103A allele 184 TGAATTTAAC TTTAAACCCA CACACAGTG- ---------- ---------- TCTCTCTCTC
70 80 90 100 110 120 GAPU103A allele 136 TCTCTC---- ---------- ---------- ---------- ---------- ----CAAACCGAPU103A allele 150 TCTCTCTCTC TCTCTCTCTC ---------- ---------- ---------- ----CAAACCGAPU103A allele 157 TCTCTC---- ---------- ---------- ---------- ---------- ----CAAACCGAPU103A allele 159 TCTCTCTC-- ---------- ---------- ---------- ---------- ----CAAACCGAPU103A allele 184 TCTCTCTCTC TCTCTCTCTC TCTCTCTCTC TCTCTCTCTC TCTCTCTCTC TCTCCAAACC
130 140 150 160 170 180 GAPU103A allele 136 AAGAATGCTA TTCATCAGTA TTCATTATGA ACAATAATGT GTGACATCAT TGCCACATTG GAPU103A allele 150 AAGAATGCTA TTCATCAGTA TTCATTATGA ACAATAATGT GTGACATCAT TGCCACATTG GAPU103A allele 157 AAGAATGCTA TTCATCAGTA TTCATTATGA ACAATAATGT GTGACATCAT TGCCACATTG GAPU103A allele 159 AAGAATGCTA TTCATCAGTA TTCATTATGA ACAATAATGT GTGACATCAT TGCCACATTG GAPU103A allele 184 AAGAATGCTA TTCATCAGTA TTCATTATGA ACAATAATGT GTGACATCAT TGCCACATTG
190 200GAPU103A allele 136 TCTAATGGAT AAAATCGAGC GATGCGAPU103A allele 150 TCTAATGGAT AAAATCGAGC GATGCGAPU103A allele 157 TCTAATGGAT AAAATCGAGC GATGCGAPU103A allele 159 TCTAATGGAT AAAATCGAGC GATGCGAPU103A allele 184 TCTAATGGAT AAAATCGAGC GATGC
10 20 30 40 50 60 GAPU71B allele 121 GATCAAAGGA AGAAGGGGAT AAAGTGGGAA GAGAGAGAGA GAG------- ----------GAPU71B allele 124 GATCAAAGGA AGAAGGGGAT AAAGTGGGAA GAGAGAGAGA GAG------- ----------GAPU71B allele 127 GATCAAAGGA AGAAGGGGAT AAACTGGGAA GAGAGAGAGA GAG------- ----------GAPU71B allele 130 GATCAAAGGA AGAAGGGGAT AAAGTGGGAA GAGAGAGAGA GAG------- -------AAGGAPU71B allele 144 GATCAAAGGA AGAAGGGGAT AAACTGGGAA GAGAGAGAGA GAGAGAAGAA GAAGAAGAAG
70 80 90 100 110 120 GAPU71B allele 121 ------AAGA AGAAGAAGAA GAAAAATGAG AATGAGAAGA GAGGGAGTGT TCGTCAAAATGAPU71B allele 124 ---AAGAAGA AGAAGAAGAA GAAAAATGAG AATGAGAAGA GAGGGAGTGT TCGTCAAAATGAPU71B allele 127 AAGAAGAAGA AGAAGAAGAA GAAAAATGAG AATGAGAAGA GAGGGAGTGT TCGTCAAAATGAPU71B allele 130 AAGAAGAAGA AGAAGAAGAA GAAAAATGAG AATGAGAAGA GAGGGAGTGT TCGTCAAAATGAPU71B allele 144 AAGAAGAAGA AGAAGAAGAA GAAAAATGAG AATGAGAAGA GAGGGAGTGT TCGTCAAAAT
130 140GAPU71B allele 121 CCCGCAAGCG TACGGATTTG TTGTGAPU71B allele 124 CCCGCAAGCG TACGGATTTG TTGTGAPU71B allele 127 CCCGCAAGCG TACGGATTTG TTGTGAPU71B allele 130 CCCGCAAGCG TACGGATTTG TTGTGAPU71B allele 144 CCCGCAAGCG TACGGATTTG TTGT
10 20 30 40 50 60 DCA15 allele 246 GATCTTGTCT GTATATCCAC ACACACACAC ---------- ---------- AAAAAGAATADCA15 allele 257 GATCTTGTCT GTATATCCAC ACACACACAC ACA------- -AAGAAGAAG AAAAAGAATADCA15 allele 266 GATCTTGTCT GTATATCCAC ACACACACAC ACACACACAC ACACACACAC ACAAAGAATA
70 80 90 100 110 120 DCA15 allele 246 GAAAAACAGA CAGAAAAAGA ATCAGAGACA ACACTATACT GAGAAATTAT ACGTCTGCTA DCA15 allele 257 GAAAAACAGA CAGAAAAAGA ATCAGAGACA ACACTATACT GAGAAATTAT ACGTCTGCTA DCA15 allele 266 GAAAAACAGA CAGAAAAAGA ATCAGAGACA ACACTATACT GAGAAATTAT ACGTCTGCTA
130 140 150 160 170 180 DCA15 allele 246 ACTACACAGG TGGGAAAAAA TTACCAGTTC TGGGGTCAAC TTCTCAGCTG ACTTTGCAGC DCA15 allele 257 ACTACACAGG TGGGAAAAAA TTACCAGTTC TGGGGTCAAC TTCTCAGCTG ACTTTGCAGC DCA15 allele 266 ACTACACAGG TGGGAAAAAA TTACCAGTTC TGGGGTCAAC TTCTCAGCTG ACTTTGCAGC
190 200 210 220 230 240 DCA15 allele 246 TGTCAAAACA TAATGCATAT TAAATTAAAA AACTAAAAGA GAAAGGCTAA TTAGAGCGAT DCA15 allele 257 TGTCAAAACA TAATGCATAT TAAATTAAAA A-CTAAAAGA GAAGGGCTAA TTAGAGCGAT DCA15 allele 266 TGTCAAAACA TAATGCATAT TAAATTAAAA AACTAAAAGA GAAAGGCTAA TTAGAGCGAT
250 260DCA15 allele 246 AAATGCGTCA AGATGGAAAA GGTATADCA15 allele 257 AAATGCGTCA AGATGGAAAA GGTATADCA15 allele 266 AAATGCGTCA AGATGGAAAA GGTATA
B
A
C
Fig. 2 Sequence alignment of alleles detected at the microsatellites GAPU103A (A), GAPU71B (B) and DCA15 (C)
Mol Breeding (2009) 24:213–231 225
123

The expected heterozygosity (He) per locus ranged
from 0.726 at locus DCA5 to 0.884 at locus UDO-
043, with an average value of 0.808. There is a
tendency of higher observed (Ho) than expected (He)
heterozygosity in most of loci, which is reflected in
the negative Fis values.
Null alleles were detected at a negligible fre-
quency only at the DCA14 locus. Fst values ranged
from 0.027 of GAPU71B to 0.053 for DCA5 and
EMO-90. The departure from Hardy–Weinberg equi-
librium resulted significant (P \ 0.01) only for
GAPU103A locus.
The STRUCTURE analysis revealed a low level of
population structure and, at the most probable K = 3,
most of the cultivars were assigned to different gene
pools (data not shown).
AMOVA revealed that a small but significant
amount (4%, P \ 0.001) of the total variance was due
to differences among the three geographic areas. Loci
displaying the highest differentiation among the three
groups were DCA5 and GAPU103A.
The assignment test showed that all cultivars of the
Western area were correctly assigned, while high
percentages of incorrect assignment were observed
Fig. 3 Example of size homoplasy at microsatellite EMO-L.
Alleles 192A and 192B have the same length but different base
composition, as shown by the nucleotides included in boxes.
Box 1 shows a SNP C/T; Box 2 represents an AA insertion at
100 bp present in the allele 192B and absent in 192A (and in
all other alleles). The difference in the repeat motif, (CT)9 in
192A and (CT)8 in 192B, as indicated in Box 3, compensates
the previous indel, thus originating length homoplasy
Table 6 Description of some genetic parameters estimated for the selected SSR markers using the profile of 77 cultivars
Rank SSR I Na Ne Ho He Fis Fst F(null) HWE
1 UDO-043 2.425 21 8.63 0.855 0.884 0.033 0.049 ?0.0149 NS
2 DCA9 2.306 18 7.95 0.870 0.874 0.005 0.030 ?0.0037 NS
4 GAPU103A 2.137 16 6.56 0.844 0.848 0.004 0.049 ?0.0005 **
3 DCA18 2.092 13 6.89 0.896 0.855 -0.048 0.048 -0.0267 NS
6 DCA16 1.983 13 6.42 0.857 0.844 -0.015 0.046 -0.0074 NS
5 GAPU101 1.929 8 6.46 0.974 0.845 -0.152 0.043 -0.0714 NS
7 DCA3 1.881 8 6.09 0.922 0.836 -0.103 0.043 -0.0493 NS
8 GAPU71B 1.725 9 5.13 0.909 0.805 -0.129 0.027 -0.0615 NS
9 DCA5 1.697 11 3.65 0.870 0.726 -0.198 0.053 -0.1204 NS
10 DCA14 1.517 11 3.16 0.635 0.683 0.071 0.037 ?0.0218 NS
11 EMO-90 1.404 7 3.16 0.714 0.684 -0.045 0.053 -0.0420 NS
Legends: I, information index; Na, number of alleles; Ne, effective number of alleles; Ho, observed heterozygosity; He: expected
heterozygosity; Fis: inbreeding coefficient; Fst, degree of gene differentiation among populations; F(null), estimated frequency of null
alleles; HWE, Hardy–Weinberg equilibrium test.(NS: Not significant, ** P \ 0.01 after Bonferroni correction)
226 Mol Breeding (2009) 24:213–231
123
for the Central and Eastern Mediterranean areas (17.8
and 42.4%, respectively). When analysing the locus
by locus ability to correctly assign cultivars, the best
performance has been obtained for GAPU101,
DCA5, DCA16, DCA18 and GAPU71B (data not
shown).
It is interesting to note that there are some
cultivars that never, or rarely, are assigned to their
area of cultivation. In particular, Arbequina, Farga,
Oliviere, Gentile di Chieti and Raio, a priori included
in the Central Mediterranean area, were attributed by
most of ten best-assigning loci to the Eastern area,
while Ogliarola Salentina, Olialonga, Ottobratica,
Zaituna, Ayvalik, Izmir Sofralik, Kerkiras and Tof-
fahi, were always assigned to the Central area instead
of the Eastern one.
Discussion
Organization and distribution of SSR loci in olive
genome
The microsatellite markers analyzed in this study have
all been selected by screening genomic libraries
enriched in di-nucleotide (GA and CA) repeats
(Carriero et al. 2002; Cipriani et al. 2002; De La Rosa
et al. 2002; Sefc et al. 2000). Allele sequencing has
provided valuable information about the mutational
mechanisms of olive microsatellites. Sequences show
more compound motifs than expected, generating the
irregular allelic series observed at several loci.
The mechanisms producing SSR variation are
complex and may depend on several factors, includ-
ing the type and number of the repeats or the
sequence of the flanking regions (Almeida and
Penha-Goncalves 2004). Loci carrying complex
motifs are generally more prone to produce allelic
series with irregular incremental steps. This was the
case, for instance, of DCA18, GAPU103A, DCA16
and DCA14 loci, where the simultaneous variation of
both/all repeats created irregular incremental steps. In
any case, the structure of the repeated motif did not
correlate with the effective number of alleles and loci
carrying perfect repeats, like UDO-043 and DCA9,
showed a higher allele number than complex micro-
satellites, like GAPU71B and DCA14.
In olive, allele size differences not in accordance
with the expected repeat variation were mainly due to
the presence of compound di- and tri-nucleotide
repeats, and, in one case, GAPU103A, to an indel in
the flanking region. Allelic homoplasy has also been
observed, as in the case of EMO-L locus, confirming
what already documented in olive by Muzzalupo
et al. (2006).
Discrepancies between expected and obtained
allele patterns made difficult the binning of alleles,
as already reported for other species. In maize, for
example, it has been shown that most of microsat-
ellites have allele size distributions that do not fit the
stepwise model, due to the presence of indels in the
flanking regions and/or interruptions of the repeat
stretches, and this largely contribute to the observed
length polymorphism (Fernandez et al. 2008; Lia
et al. 2007; Matsuoka et al. 2002). Similar patterns
have also been found in woody species like grape
(This et al. 2004). Even in apparently regular series
rounded to an integer, allele lengths caused frequent
artificial odd/even transition of integers and vice
versa. This is due to the fact that the interval between
neighboring alleles does not exactly correspond to the
repeat length. In most cases the discrepancies were
indeed due to the estimated length of the core unit
that was slightly different from the expected 2 bp of
the di-nucleotide repeats.
About 30% of 37 microsatellites displayed non
random segregation and about 22% of them were
associated in a single linkage group. The spotted
apportioning of these repetitive sequences, whose
structural origin needs further evaluation, suggests to
pay particular attention for their application, not only
for fingerprinting, but also for evolutionary and
population genetic analyses, because co-segregating
loci can drive to erroneous estimations of population
differentiation and phylogenetic inferences. For these
reasons only independent (or nearly independent)
SSRs were accepted in the final list.
SSR data comparison among labs and selection
of a common set of markers
Comparison of data obtained by different labs on a
common set of cultivars revealed cases of allele drop
out and, more frequently, discrepancies in allelic
length, mainly due to the run conditions and the use
of different internal ladders, which affected the
relative mobility estimates. In some cases, for
identical alleles, discrepancies up to five nucleotides
Mol Breeding (2009) 24:213–231 227
123
were recorded. It is noticeable that differences among
allele lengths remain constant within each locus, thus,
in case of doubts, instead of allele lengths we
recommend to give more credit to differences in bp
between adjacent alleles.
Misidentification of true peaks and allele drop out
are quite common in high throughput genotyping
assays, reaching values higher than 21% when
standard automated approaches are applied (Amos
et al. 2007). The application of new algorithms able
to ensure a most accurate allele binning and of
software that can help automating several steps of the
genotyping process (Jayashree et al. 2006) can
significantly reduce the problem of allele calling
errors.
Our data fit with those published by Doveri et al.
(2008) when considering the six genotypes and five
microsatellites in common, but the allele sizes differ
by 1 bp (DCA9) and 3 bp (DCA3 and DCA14),
confirming that length differences may occur among
labs and stressing the need to use reference profiles.
In order to make data comparison among labora-
tories feasible, we proposed a consensus list of the
most outstanding SSR markers based on their repro-
ducibility, quality of scoring, information content,
independent segregation and discrimination capacity.
Moreover to reduce the probability of mistyping
alleles we recommend the use of allelic ladders
constructed with a set of genotypes carrying true-
sized alleles confirmed by sequencing. The genera-
tion of allelic ladders using known-profiled cultivars
will allow univocal allele binning and assigning the
correct size to new alleles.
These recommendations are likely sufficient to
guarantee reliable fingerprinting in olive and to
make comparable the data produced by different
laboratories.
Discrimination capacity
The discrimination power of the selected loci is in
accordance with the results reported by published
papers. For example, UDO-043 showed the highest
PD value among a set of nine UDO loci when used to
identify 35 Spanish and Italian cultivars (Belaj et al.
2004a). Sarri et al. (2006) which included in their
work some of the 11 selected markers, but not
the most informative UDO-043, GAPU103A and
GAPU101, obtained the best discrimination scores
with DCA9, DCA16 and DCA17.
The selected SSR markers were unable to detect
polymorphisms at intra-cultivar level. If mutations
occur in very long living trees, which are asexually
propagated, it seems unlikely that such mutations
may be detected by scanning a very low portion of
the genome, as it is done with the few microsatellite
markers we propose. The SSR analysis of numerous
clones of Picholine Marocaine cultivar (Khadari et al.
2008), as well as that of natural populations of Olea
europaea subsp. laperrinei (Baali-Cherif and Besnard
2005), has led to similar results.
A low genetic differentiation among the areas of
cultivation was estimated, particularly for the Eastern
Mediterranean varieties. Several studies have argued
that phylogeographic patterns in olive are elusive
(Besnard et al. 2002; Lumaret and Ouazzani 2001;
Lumaret et al. 2004). The vegetative propagation
through cutting and grafting has favoured an intense
exchange of plant material and therefore the mixing
of genotypes of different origin and their multiple and
multidirectional diffusions. Different patterns of olive
cultivars spread have been found (Besnard et al.
2001; Breton et al. 2008) and others are possibly still
unidentified. For instance, the results obtained for the
East Mediterranean may be justified by the significant
structure within that area, particularly considering
Greek and Turkish cultivars, as previously observed
by Owen et al. (2005), other than by the relatively
low number of cultivars included in the study. These
reasons may explain the difficulty of the selected loci
to correctly assign cultivars to their area of cultiva-
tion. Thus, even using highly discriminating markers,
the problem of assigning cultivars to their area of
cultivation will be possible only for a portion of
autochthonous cultivars and in those areas where the
introduction of genetic pools from abroad has been
limited, like it seems for the extreme West Mediter-
ranean (Besnard et al. 2001).
It is interesting to note a tendency of negative Fis
values at 7/11 loci, indicating an excess of hereto-
zygosity relative to random mating. In fact, under
clonal reproduction as in olive, Fis values are
expected to be negative because clonal reproduction
enables the two alleles at each locus to independently
accumulate mutations and therefore diverge within
individuals (Halkett et al. 2005).
228 Mol Breeding (2009) 24:213–231
123
Application of a common protocol for SSR
fingerprinting in olive
Lack of agreement on the molecular markers to be
used for olive fingerprinting has made impossible, up
to now, to figure out the level and distribution of
variability. Besides the important results obtained by
several groups working independently at the charac-
terization and identification of olive cultivars, the
comparison of data among laboratories still repre-
sents a very difficult task.
The use of a common set of microsatellite markers
and the application of stringent protocols can repre-
sent a better world-wide applicable tool for olive
DNA typing, either for population genetic studies
(Breton et al. 2008) or for cultivars discrimination
(Baldoni et al. 2006; Belaj et al. 2004b).
The use of the selected SSRs, characterised by a
very high discrimination power, and the application
of a common strategy for data comparison will finally
allow data convergence, a preliminary condition for
genotype identification and certification, as well as
for data exchange and managing, useful for the
creation of an universal molecular database of olive
genetic resources.
Acknowledgments The authors are very grateful to Dr. Juan
Caballero, Dr. Carmen del Rıo and Prof. Diego Barranco,
responsible of the evaluation, maintenance and identification of
the World Olive Germplasm Bank, Cordoba, Spain, for
providing the DNA samples. A special thanks is also due to
the other sample providers. The work has been supported by the
Project RIOM-MIPAAF ‘‘Research and Innovation for Olive
growing in Italian Southern regions’’, the Project OLIBIO–
MIPAAF ‘‘Development of competitive, sustainable, traceable
and safe systems to produce high quality olive oils by organic
agriculture’’ and the Project FISR ‘‘Improving flavor and
nutritional properties of plant food after first and second
transformation’’, Activity ‘Molecular characterization of main
olive varieties’.
References
Almeida P, Penha-Goncalves C (2004) Long perfect dinucle-
otide repeats are typical of vertebrates, show motif pref-
erences and size convergence. Mol Biol Evol 21(7):1226–
1233. doi:10.1093/molbev/msh108
Amos W, Hoffman JI, Frodsham A, Zhang L, Best S, Hill VS
(2007) Automated binning of microsatellite alleles:
problems and solutions. Mol Ecol Notes 7:10–14. doi:
10.1111/j.1471-8286.2006.01560.x
Aranzana MJ, Pineda A, Cosson P, Dirlewanger E, Ascasibar J,
Cipriani G, Ryder D, Testolin R, Abbott A, King GJ,
Iezzoni AF, Arus P (2003) A set of simple-sequence
repeat (SSR) markers covering the Prunus genome. Theor
Appl Genet 106:819–825
Baali-Cherif D, Besnard G (2005) High genetic diversity and
clonal growth in relict populations of Olea europaeasubsp. laperrinei (Oleaceae) from Hoggar, Algeria. Ann
Bot (Lond) 96(5):823–830. doi:10.1093/aob/mci232
Baldoni L, Tosti N, Ricciolini C, Belaj A, Arcioni S, Pannelli
G, Germana MA, Mulas M, Porceddu A (2006) Genetic
structure of wild and cultivated olives in the central
Mediterranean basin. Ann Bot (Lond) 98:935–942. doi:
10.1093/aob/mcl178
Bandelj D, Jakse J, Javornik B (2002) DNA fingerprinting of
olive varieties by microsatellite markers. Food Technol
Biotechnol 40(3):185–190
Banilas G, Minas J, Gregoriou C, Demoliou C, Kourti A,
Hatzopoulos P (2003) Genetic diversity among accessions
of an ancient olive variety of Cyprus. Genome 46(3):370–
376. doi:10.1139/g03-011
Belaj A, Satovic Z, Cipriani G, Baldoni L, Testolin R, Rallo L,
Trujillo I (2003) Comparative study of the discriminating
capacity of RAPD, AFLP and SSR markers and of their
effectiveness in establishing genetic relationships in olive.
Theor Appl Genet 107(4):736–744. doi:10.1007/s00122-
003-1301-5
Belaj A, Cipriani G, Testolin R, Rallo L, Trujillo I (2004a)
Characterization and identification of the main Spanish
and Italian olive cultivars by simple-sequence-repeat
markers. HortScience 39(7):1557–1561
Belaj A, Rallo L, Trujillo I, Baldoni L (2004b) Using RAPD
and AFLP markers to distinguish individuals obtained by
clonal selection of ‘Arbequina’ and ‘Manzanilla de Se-
villa’ olive. HortScience 39(7):1566–1570
Besnard G, Baradat P, Berville A (2001) Genetic relationships
in the olive (Olea europaea L.) reflect multilocal selection
of cultivars. Theor Appl Genet 102(2–3):251–258. doi:
10.1007/s001220051642
Besnard G, Khadari B, Baradat P, Berville A (2002) Oleaeuropaea (Oleaceae) phylogeography based on chloro-
plast DNA polymorphism. Theor Appl Genet 104:1353–
1361. doi:10.1007/s00122-001-0832-x
Breton C, Pinatel C, Medail F, Bonhommea F, Berville A
(2008) Comparison between classical and Bayesian
methods to investigate the history of olive cultivars using
SSR-polymorphisms. Plant Sci 175:524–532. doi:
10.1016/j.plantsci.2008.05.025
Brookfield JFY (1996) A simple new method for estimating null
allele frequency from heterozygote deficiency. Mol Ecol
5:453–455. doi:10.1111/j.1365-294X.1996.tb00336.x
Butler JM (2006) Genetics and genomics of core short tandem
repeats loci used in human identity testing. J Forensic Sci
51(2):253–265. doi:10.1111/j.1556-4029.2006.00046.x
Carriero F, Fontanazza G, Cellini F, Giorio G (2002) Identi-
fication of simple sequence repeats (SSRs) in olive (Oleaeuropaea L.). Theor Appl Genet 104:301–307. doi:
10.1007/s001220100691
Cipriani G, Marrazzo MT, Marconi R, Cimato A, Testolin R
(2002) Microsatellite markers isolated in olive (Olea eu-ropaea L.) are suitable for individual fingerprinting and
Mol Breeding (2009) 24:213–231 229
123
reveal polymorphism within ancient cultivars. Theor Appl
Genet 104:223–228. doi:10.1007/s001220100685
Cipriani G, Marrazzo MT, Di Gaspero G, Pfeiffer A, Morgante
M, Testolin R (2008) A set of microsatellite markers with
long core repeat optimized for grape (Vitis spp.) geno-
typing. BMC Plant Biol 8:127. doi:10.1186/1471-2229-
8-127
De La Rosa R, James CM, Tobutt KR (2002) Isolation and
characterization of polymorphic microsatellites in olive
(Olea europaea L.) and their transferability to other
genera in the Oleaceae. Mol Ecol Notes 2:265–267. doi:
10.1046/j.1471-8286.2002.00217.x
Dıaz A, De la Rosa R, Martın A, Rallo P (2006) Development,
characterization and inheritance of new microsatellites in
olive (Olea europaea L.) and evaluation of their useful-
ness in cultivar identification and genetic relationship
studies. Tree Genet Genomes 2:165–175. doi:10.1007/
s11295-006-0041-5
Doveri S, Sabino Gil F, Dıaz A, Reale S, Busconi M, da
Camara Machado A, Martın A, Fogher C, Donini P, Lee D
(2008) Standardization of a set of microsatellite markers
for use in cultivar identification studies in olive (Oleaeuropaea L.). Sci Hortic (Amsterdam) 116:367–373. doi:
10.1016/j.scienta.2008.02.005
Edmonds J (1965) Maximum matching and polyhedron with 0,
1-vertices. J Res Natl Inst Stand B 69:125–130
Evanno G, Regnaut S, Goudet J (2005) Detecting the number
of clusters of individuals using the software STRUC-
TURE: a simulation study. Mol Ecol 14:2611–2620. doi:
10.1111/j.1365-294X.2005.02553.x
Fernandez MP, Nunez Y, Ponz F, Hernaiz S, Gallego FJ, I-
banez J (2008) Characterization of sequence polymor-
phisms from microsatellite flanking regions in Vitis spp.
Mol Breed 22:455–465. doi:10.1007/s11032-008-9189-z
Gemas VJV, Almadanim MC, Tenreiro R, Martins A, Fe-
vereiro P (2004) Genetic diversity in the Olive tree (Oleaeuropaea L. subsp. europaea) cultivated in Portugal
revealed by RAPD and ISSR markers. Genet Resour
Crop Evol 51:501–511. doi:10.1023/B:GRES.0000024152.
16021.40
Govan CL, Simpson DW, Johnson AW, Tobutt KR, Sargent DJ
(2008) A reliable multiplexed microsatellite set for
genotyping Fragaria and its use in a survey of 60 F. X
ananassa cultivars. Mol Breed 22:649–661. doi:10.1007/
s11032-008-9206-2
Halkett F, Simon JC, Balloux F (2005) Tackling the population
genetics of clonal and partially clonal organisms. Trends
Ecol Evol 20(4):194–201. doi:10.1016/j.tree.2005.01.001
Hoffman JI, Amos W (2005) Microsatellite genotyping errors:
detection approaches, common sources and consequences
for paternal exclusion. Mol Ecol 14:599–612. doi:
10.1111/j.1365-294X.2004.02419.x
Jayashree B, Reddy PT, Leeladevi Y, Crouch JH, Mahalakshmi
V, Buhariwalla HK et al (2006) Laboratory information
management software for genotyping workflows: appli-
cations in high throughput crop genotyping. BMC Bio-
informatics 7:383. doi:10.1186/1471-2105-7-383
Kalinowski ST, Taper ML, Marshall TC (2007) Revising how
the computer program CERVUS accommodates geno-
typing error increases success in paternity assignment.
Mol Ecol 16:1099–1106. doi:10.1111/j.1365-294X.2007.
03089.x
Khadari B, Charafi J, Moukhli A, Ater M (2008) Substantial
genetic diversity in cultivated Moroccan olive despite a
single major cultivar: a paradoxical situation evidenced by
the use of SSR loci. Tree Genet Genomes 4:213–221. doi:
10.1007/s11295-007-0102-4
La Mantia M, Lain O, Caruso T, Testolin R (2005) SSR-based
fingerprints reveal the great genetic diversity of Sicilian
olive (Olea europaea L.) germplasm. J Hortic Sci Bio-
technol 80(5):628–632
Lacape JM, Dessauw D, Rajab M, Noyer JL, Hau B (2007)
Microsatellite diversity in tetraploid Gossypium germ-
plasm: assembling a highly informative genotyping set of
cotton SSRs. Mol Breed 19:45–58. doi:10.1007/s11032-
006-9042-1
Larsen PF, Hansen MM, Nielsen EE, Jensen LF, Loeschcke L
(2005) Stocking impact and temporal stability of genetic
composition in a brackish northern pike population (Esoxlucius L.), assessed using microsatellite DNA analysis of
historical and contemporary samples. Heredity 95:136–
143. doi:10.1038/sj.hdy.6800671
Lia VV, Bracco M, Gottlieb AM, Poggio L, Confalonieri VA
(2007) Complex mutational patterns and size homoplasy
at maize microsatellite loci. Theor Appl Genet 115:981–
991. doi:10.1007/s00122-007-0625-y
Liebhard R, Gianfranceschi L, Koller B, Ryder CD, Tarchini
R, Van De Weg E, Gessler C (2002) Development and
characterisation of 140 new microsatellites in apple
(Malus 9 domestica Borkh.). Mol Breed 10:217–241.
doi:10.1023/A:1020525906332
Lopes MS, Mendonca D, Sefc KM, Gil FS, Machado AD
(2004) Genetic evidence of intra-cultivar variability
within Iberian olive cultivars. HortScience 39(7):1562–
1565
Lumaret R, Ouazzani N (2001) Ancient wild olives in Medi-
terranean forests. Nature 413:700. doi:10.1038/35099680
Lumaret R, Ouazzani N, Michaud H, Vivier G, Deguilloux M-
F, Di Giusto F (2004) Allozyme variation of oleaster
populations (wild olive tree) (Olea europaea L.) in the
Mediterranean Basin. Heredity 92:343–352. doi:10.1038/
sj.hdy.6800430
Matsuoka Y, Mitchell SE, Kresovich S, Goodman M, Doebley
J (2002) Microsatellite in Zea-variability, patterns of
mutations, and use for evolutionary studies. Theor Appl
Genet 104:436–450. doi:10.1007/s001220100694
Montemurro C, Simeone R, Pasqualone A, Ferrara E, Blanco A
(2005) Genetic relationships and cultivar identification
among 112 olive accessions using AFLP and SSR mark-
ers. J Hortic Sci Biotechnol 80(1):105–110
Morgante M, Olivieri AM (1993) PCR-amplified microsatel-
lites as markers in plant genetics. Plant J 3(1):175–182.
doi:10.1111/j.1365-313X.1993.tb00020.x
Muzzalupo I, Lombardo N, Musacchio A, Noce ME, Pelleg-
rino G, Perri E, Sajjad A (2006) DNA sequence analysis
of microsatellite markers enhances their efficiency for
germplasm management in an Italian olive collection. J
Am Soc Hortic Sci 131(3):352–359
Muzzalupo I, Pellegrino M, Perri E (2007) Detection of DNA
in virgin olive oils extracted from destoned fruits. Eur
230 Mol Breeding (2009) 24:213–231
123

Food Res Technol 224(4):469–475. doi:10.1007/s00217-
006-0340-y
Muzzalupo I, Lombardo N, Salimonti A, Perri E (2008)
Molecular characterization of Italian olive cultivars by
microsatellite markers. Adv Hortic Sci 22(2):142–148
Omrani-Sabbaghi A, Shahriari M, Falahati-Anbaran M, Mo-
hammadi SA, Nankali A, Mardi M, Ghareyazie B (2007)
Microsatellite markers based assessment of genetic
diversity in Iranian olive (Olea europaea L.) collections.
Sci Hortic (Amsterdam) 112(4):439–447. doi:10.1016/j.
scienta.2006.12.051
Owen CA, Bita EC, Banilas G, Hajjar SE, Sellianakis V, Ak-
soy U et al (2005) AFLP reveals structural details of
genetic diversity. Theor Appl Genet 110:1169–1176. doi:
10.1007/s00122-004-1861-z
Peakall R, Smouse PE (2005) GenAlEx 6: genetic analysis in
Excel. population genetic software for teaching and
research. Mol Ecol Notes 6(1):288–295. doi:10.1111/j.
1471-8286.2005.01155.x
Poljuha D, Sladonja B, Setic E, Milotic A, Bandelj D, Jakse J,
Javornik B (2008) DNA fingerprinting of olive varieties in
Istria (Croatia) by microsatellite markers. Sci Hortic
(Amsterdam) 115:223–230. doi:10.1016/j.scienta.2007.
08.018
Pompanon F, Bonin A, Bellemain E, Taberlet P (2005)
Genotyping errors: causes, consequences and solutions.
Nat Rev Genet 6:847–859. doi:10.1038/nrg1707
Pritchard JK, Stephens M, Donnelly P (2000) Inference of
population structure using multilocus genotype data.
Genetics 155:945–959
Rallo P, Dorado G, Martın A (2000) Development of sim-
ple sequence repeats (SSRs) in olive tree (Olea europaeaL.). Theor Appl Genet 101:984–989. doi:10.1007/
s001220051571
Rallo P, Tenzer I, Gessler C, Baldoni L, Dorado G, Martın A
(2003) Transferability of olive microsatellite loci across
the genus Olea. Theor Appl Genet 107:940–946. doi:
10.1007/s00122-003-1332-y
Rekik I, Salimonti A, Grati Kamoun N, Muzzalupo I, Perri E,
Rebai A (2008) Characterisation and identification of
Tunisian olive tree varieties by microsatellite markers.
HortScience 43(5):1371–1376
Sabino Gil F, Busconi M, Da Camara Machado A, Fogher C
(2006) Development and characterization of microsatellite
loci from Olea europaea. Mol Ecol Notes 6:1275–1277.
doi:10.1111/j.1471-8286.2006.01513.x
Sarri V, Baldoni L, Porceddu A, Cultrera NGM, Contento A,
Frediani M, Belaj A, Trujillo I, Cionini PG (2006)
Microsatellite markers are powerful tools for discrimi-
nating among olive cultivars and assigning them to geo-
graphically defined populations. Genome 49(12):1606–
1615. doi:10.1139/G06-126
Saunders JA, Mischke S, Leamy EA, Hemeida AA (2004)
Selection of international molecular standards for DNA
fingerprinting of Theobroma cacao. Theor Appl Genet
110:41–47. doi:10.1007/s00122-004-1762-1
Sefc KM, Lopes MS, Mendonca D, Rodrigues dos Santos M,
Laimer da Camara Machado M, Da Camara Machado A
(2000) Identification of microsatellite loci in olive (Oleaeuropaea) and their characterization in Italian and Iberian
olive trees. Mol Ecol 9:1171–1173. doi:10.1046/j.1365-
294x.2000.00954.x
Stambuk S, Sutlovic D, Bakaric P, Petricevic S, Andelinovic S
(2007) Forensic botany: potential usefulness of micro-
satellite-based genotyping of Croatian olive (Olea euro-paea L.) in forensic casework. Croat Med J 48:1–7
Suvanto LI, Latva-Karjanmaa TB (2005) Clone identification
and clonal structure of the European aspen (Populustremula). Mol Ecol 14(9):2851–2860. doi:10.1111/j.1365-
294X.2005.02634.x
Testolin R, Lain O (2005) Genetic traceability in olive oil:
DNA extraction and PCR amplification of microsatellite
markers. J Food Sci 70(1):108–112
This P, Jung A, Boccacci P, Borrego J, Botta R, Costantini L
et al (2004) Development of a standard set of microsat-
ellite reference alleles for identification of grape cultivars.
Theor Appl Genet 109:1448–1458. doi:10.1007/s00122-
004-1760-3
This P, Lacombe T, Thomas MR (2006) Historical origins and
genetic diversity of wine grapes. Trends Genet 22(9):511–
519. doi:10.1016/j.tig.2006.07.008
Wagner HW, Sefc KM (1999) Identity 1.0. Centre for Applied
Genetics, University of Agricultural Sciences, Vienna, 5
pp
Weeks DE, Conley YP, Ferrell RE, Mah TS, Gorin MB (2002)
A tale of two genotypes: consistency between two high-
throughput genotyping centres. Genome Res 12:430–435.
doi:10.1101/gr.211502
Mol Breeding (2009) 24:213–231 231
123
Copyright © 2022 FDOKUMEN