Chemical characterization, antioxidant, cytotoxicity, Anti ...
Upload
khangminh22Category
view
5download
0
CHEMICAL CHARACTERIZATION OF ‘HURMA’
OLIVE GROWN IN KARABURUN PENINSULA
A Thesis Submitted to
the Graduate School of Engineering and Sciences of
Izmir Institute of Technology
in Partial Fulfillment of Requirement for Degree of
MASTER OF SCIENCE
in Food Engineering
by
AyĢe Burcu AKTAġ
July 2013
ĠZMĠR

We approve this thesis of AyĢe Burcu AKTAġ
Examining committee members:
Assoc. Prof. Dr. Banu ÖZEN
Department of Food Engineering, Izmir Institute of Technology
Assist. Prof. Dr. Handan BAYSAL
Department of Food Engineering, Izmir Institute of Technology
Assist. Prof. Dr. Fahri YEMĠġÇĠOĞLU
Department of Food Engineering, Ege University
10 July 2013
Assoc. Prof. Dr. Banu ÖZEN Assoc. Prof. Dr. Figen TOKATLI
Supervisor, Co-advisor,
Department of Food Engineering Department of Food Engineering
Izmir Institute of Technology Izmir Institute of Technology
Prof. Dr.Ahmet YEMENĠCĠOĞLU Prof. Dr. R. Tuğrul ġENGER
Head of the Department of Dean of the Graduate Schools of
Food Engineering Engineering and Sciences

ACKNOWLEDGEMENTS
I wish to express my sincere gratitude to my supervisor, Assoc. Prof. Dr. Banu
ÖZEN for her supervision, guidance, support, encouragement and endless patience
during my studies.
I would like to appreciate deeply to my co-supervisor Assoc. Prof. Dr. Figen
TOKATLI,for her all kind of supports and valuable comments.
I express my special thanks to Eğlenhoca village and their kind habitants
(Karaburun-Izmir, Turkey) for providing olive samples. This study is a part of
TUBITAK project (TOVAG-110O780) and supported by The Scientific and
Technological Research Council of Turkey.
Also, technical support of IZTECH R&D Center for Environmental Studies and
Biotechnology and Bioengineering Research and Application Center in this research is
gratefully acknowledged.
I would like to thank to Specialist İlknur ŞEN for her help during my analysis.
Lastly, I offer sincere thanks to my parents for their endless support,
encouragement and love during all my education life.

iv
ABSTRACT
CHEMICAL CHARACTERIZATION OF „HURMA‟ OLIVE GROWN IN
KARABURUN PENINSULA
Olive type, mostly Erkence, grown in nearby area around Karaburun peninsula
of Izmir-Turkey, goes through a natural debittering phase on the tree during its ripening.
This olive is known by the name of Hurma and loses its bitter taste while still on the
tree and can be consumed directly at the end of this natural process.
The aim of this study is to investigate the changes in the chemical composition
of Hurma, Erkence and Gemlik olives throughout their maturation period and to
determine some chemical compositional differences between Hurma and other types of
olives to obtain more insight about the natural debittering phenomena. For this purpose,
the chemical parameters measured are pH, water activity, total fat amount, fatty acids,
sugar and organic acid amounts, total phenol content and phenol profile. All analyses
were performed for two harvest years. Data were analyzed by ANOVA and principal
component analysis (PCA) to investigate the differences regarding the olive types,
ripening period and harvest year.
Total phenol content and generally concentration of individual phenolic
compounds of Hurma olive were lower than Erkence and Gemlik olives. Both fatty acid
and phenol profiles allowed a differentiation with respect to type and also harvest year
according to PCA while organic acid and sugars provided a separation only in terms of
harvest year.

v
ÖZET
KARABURUN YARIMADASINDA YETİŞEN „HURMA‟ ZEYTİNİNİN
KİMYASAL KARAKTERİZASYONU
Karaburun yarımadasında yetişen zeytin türü, çoğunlukla Erkence, olgunlaşma
periyodu sırasında acılık kaybetme aşamasından geçer. Bu zeytin „Hurma‟ adı ile bilinir
ve bu doğal işlem sonucunda henüz ağaç üzerindeyken acılığını kaybederek doğrudan
tüketilebilir hale gelir.
Bu çalışmanın amacı olgunlaşma süreci boyunca, Hurma, Erkence ve Gemlik
zeytinlerinin kimyasal özelliklerinin belirlenmesi ve doğal olarak gerçekleşen acılık
kaybetme işlemini açıklayabilmek için Hurma zeytinin diğer zeytinlerden bazı kimyasal
içerik farklarının belirlenmesidir. Bu amaçla yapılan analizler, pH, su aktivitesi, toplam
yağ miktarı, yağ asidi profili, şeker ve organik asit miktarları, toplam fenol içeriği ve
fenol profilidir. Bütün analizler iki hasat sezonu için gerçekleştirilmiştir. Zeytin tipinin,
hasat yılının ve hasat zamanın etkisini belirlemek üzere veriler ANOVA ve Asal
Bileşenler Analizi ile çözümlenmiştir.
Hurma zeytininde toplam fenolik madde miktarı ve genel olarak bireysel fenolik
bileşen konsantrasyonları Erkence ve Gemlik zeytinlerine göre nispeten daha düşüktür.
Asal bileşenler analizine göre fenol ve yağ asidi profilleri hem hasat yılına hem de
zeytin tipine bağlı ayrıma imkân vermekte iken organik asit ve şekerler sadece hasat
yılına bağlı olarak bir ayrım sağlamaktadır.

vi
TABLE OF CONTENTS
LIST OF FIGURES ....................................................................................................... viii
LIST OF TABLES…………………………………………..........................................xii
CHAPTER 1.INTRODUCTION ...................................................................................... 1
CHAPTER 2. LITERATURE VIEW ............................................................................... 3
2.1. Description of Olive and Brief History ................................................... 3
2.1.1. Description of Olive .......................................................................... 3
2.1.2. Brief History ..................................................................................... 4
2.2. World Olive Growth and Production ...................................................... 6
2.2.1. Cultivation Conditions ...................................................................... 6
2.2.2. World Olive Production .................................................................... 6
2.3. Production of Table Olives and Its Types .............................................. 7
2.3.1. Spanish Style Green Olives .............................................................. 8
2.3.2 Natural Black Olives ........................................................................ 11
2.3.3. Black (ripe) Olives .......................................................................... 12
2.4. Composition of Olive and Olive Oil ..................................................... 14
2.4.1. Phenolic Compounds and Their Importance .................................. 14
2.4.2. Fatty Acid Content of Olive Oil ..................................................... 18
2.4.3. Sugar and Organic Acid Content of Olive ...................................... 18
2.5. Changes in Olive during Maturation Period ......................................... 20
2.6. Hurma Olive ......................................................................................... 23
CHAPTER 3.EXPERIMENTAL STUDY ..................................................................... 25
3.1. Materials .................................................................................................. 25
3.1.1. Olive Samples ................................................................................... 25
3.1.2. Chemical Agents .............................................................................. 27
3.2. Methods ................................................................................................... 27
3.2.1. Routine Analysis ............................................................................... 27

vii
3.2.2. Total Phenol Content ........................................................................ 28
3.2.3. Phenolic Compound Profile .............................................................. 28
3.2.4. Sugar-Organic Acid Analysis ........................................................... 30
3.2.5. Fatty Acid Profile………………………………………………….32
3.2.6. Statistical Analyses ........................................................................... 34
CHAPTER 4.RESULTS & DISCUSSION .................................................................... 36
4.1. Maturity Index, pH and aw of Olive Varieties .................................... 36
4.2. Sugar Composition of Olive Varieties ................................................. 42
4.3. Organic Acid Composition of Olive Varieties .................................... 49
4.4. Total Phenol Content of Olive Varieties .............................................. 55
4.5. Phenol Profile Results of Olive varieties ............................................. 57
4.6. Oil Content and Fatty Acid Profile of Olive Varieties ........................ 67
4.6.1. Oil accumulation of olive varieties ................................................ 67
4.6.2. Fatty acid profile of olive varieties ................................................ 68
4.7. PCA of Combination of Various Parameters ....................................... 79
CHAPTER 5.CONCLUSIONS…………………………………………………...........84
REFERENCES ............................................................................................................... 86
APPENDIX A. CALIBRATION GRAPHICS ............................................................... 92

viii
LIST OF FIGURES
Figure Page
Figure 2.1.Homeland of olive and its distribution ............................................................ 5
Figure 2.2. Geographical distribution of olive growing areas .......................................... 5
Figure 2.3.Process of Spanish Table Olives ..................................................................... 9
Figure 2.4. Flow scheme of ripe black olive elaboration process ................................... 12
Figure 2.5.Fruit polyphenol level and color during maturation period .......................... 20
Figure 2.6. General oil accumulation during maturation ................................................ 22
Figure 2.7.Hydrolysis of oleuropein and ligstroside ....................................................... 23
Figure 3.1. Karaburun peninsula map ............................................................................. 25
Figure 3.2. IZTECH campus area map ........................................................................... 26
Figure 4.1.pH values of Hurma, Erkence and Gemlik types of olives during eight
weeks of maturation for two harvest year .................................................... 37
Figure 4.2.awvalues of Hurma, Erkence and Gemlik types of olives during eight
weeks of maturation for two harvest years .................................................. 37
Figure 4.3. Normal probability plot of pH ..................................................................... 40
Figure 4.4.Residual plot of pH........................................................................................ 40
Figure 4.5. Normal probability plot of aw ....................................................................... 41
Figure 4.6.Residual plot of aw ......................................................................................... 42
Figure 4.7. Total sugar content of Hurma, Erkence and Gemlik olives for both harvest
years ............................................................................................................. 44
Figure 4.8.Score plot obtained with PCA for sugar concentrations of Hurma, Erkence
and Gemlik types of olives during 8 weeks of maturation for the first
harvest year .................................................................................................. 46
Figure.4.9.Loading plot for sugar concentrations of Hurma, Erkence and Gemlik
types of olives during 8 weeks of maturation for the first harvest year ....... 46
Figure 4.10. Score plot obtained with PCA for sugar concentrations of Hurma,
Erkence and Gemlik types of olives during 8 weeks of maturation for the
second harvest year ...................................................................................... 47
Figure 4.11.Score plot obtained with PCA for sugar concentrations of Hurma,
Erkence and Gemlik types of olives during 8 weeks of maturation for
both harvest years ........................................................................................ 48

ix
Figure.4.12.Loading plot for sugar concentrations of Hurma, Erkence and Gemlik
types of olives during 8 weeks of maturation for both harvest years .......... 48
Table 4.13. Total organic acid content of Hurma, Erkence, Gemlik olives for both
harvest years ................................................................................................. 50
Figure 4.14.Score plot obtained with PCA for organic acid concentrations of Hurma,
Erkence and Gemlik types of olives during 8 weeks of maturation for the
first harvest year ........................................................................................... 52
Figure 4.15.Score plot obtained with PCA for organic acid concentrations of Hurma,
Erkence and Gemlik types of olives during 8 weeks of maturation for the
second harvest year ...................................................................................... 53
Figure 4.16.Score plot obtained with PCA for organic acid concentrations of Hurma,
Erkence and Gemlik types of olives during 8 weeks of maturation for
both harvest years ........................................................................................ 54
Figure 4.17.Loading plot obtained with PCA for organic acid concentrations of
Hurma, Erkence and Gemlik types of olives during 8 weeks of maturation
for both harvest years ................................................................................... 54
Figure 4.18.Normal probability plot for total phenol content ......................................... 56
Figure 4.19.Residual plot for total phenol content ......................................................... 56
Figure 4.20.1. HPLC chromatogram of phenolics Hurma belonging to the first week
of the first harvest year ............................................................................... 57
Figure 4.20.2. HPLC chromatogram of phenolics Erkence belonging to the first week
of the first harvest year ................................................................................ 57
Figure 4.20.3. HPLC chromatogram of phenolics Gemlik belonging to the first week
of the first harvest year ................................................................................ 58
Figure 4.21.Score plot obtained with PCA for phenolics of Hurma, Erkence and
Gemlik types of olives during 8 weeks of maturation for both harvest
years ............................................................................................................. 61

x
Figure 4.22.Loading plot obtained with PCA for phenolics of Hurma, Erkence and
Gemlik types of olives during 8 weeks of maturation for both harvest
years ............................................................................................................. 61
Figure 4.23.Score plot obtained with PCA for phenolics of Hurma, Erkence and
Gemlik types of olives during 8 weeks of maturation for the first harvest
year ............................................................................................................. .63
Figure 4.24.Loading plot obtained with PCA for phenolics of Hurma, Erkence and
Gemlik types of olives during 8 weeks of maturation for the first harvest
year ............................................................................................................... 63
Figure 4.25.Score plot obtained with PCA for phenolics of Hurma, Erkence and
Gemlik types of olives during 8 weeks of maturation for the second
harvest year ...................................................................................................... 65
Figure 4.26.Loading plot obtained with PCA for phenolics of Hurma, Erkence and
Gemlik types of olives during 8 weeks of maturation for the second
harvest year .................................................................................................. 65
Figure 4.27.GC chromatogram of Hurma belonging to the first week of the first
harvest year .................................................................................................. 68
Figure 4.28.General synthesis of unsaturated fatty acids ............................................... 70
Figure 4.29.MUFA/PUFA ratio of the investigated olives ............................................. 71
Figure 4.30.Oleic acid/linoleic acid ratio of the investigated olives ............................. 71
Figure 4.31.Score plot obtained with PCA for fatty acids of Hurma, Erkence and
Gemlik types of olives during 8 weeks of maturation for both harvest
years ............................................................................................................. 72
Figure.4.32.Loading plot obtained with PCA for fatty acids of Hurma, Erkence and
Gemlik types of olives during 8 weeks of maturation for both harvest
years ............................................................................................................. 72
Figure 4.33.Score plot obtained with PCA for fatty acids of Hurma, Erkence and
Gemlik types of olives during 8 weeks of maturation for the first harvest
year ............................................................................................................... 74
Figure.4.34.Loading plot obtained with PCA for fatty acids of Hurma, Erkence and
Gemlik types of olives during 8 weeks of maturation for the first harvest
year ............................................................................................................... 74
Figure 4.35.Score plot obtained with PCA for fatty acids of Hurma, Erkence and
Gemlik types of olives during 8 weeks of maturation for the second
xi
harvest year .................................................................................................. 75
Figure.4.36.Loading plot obtained with PCA for fatty acids of Hurma, Erkence and
Gemlik types of olives during 8 weeks of maturation for the second
harvest year .................................................................................................. 76
Figure 4.37.Score plot obtained with PCA for sugar and organic acids of Hurma,
Erkence and Gemlik types of olives during 8 weeks of maturation for
both harvest years ........................................................................................ 79
Figure.4.38.Loading plot obtained with PCA for sugar and organic acid data of
Hurma, Erkence and Gemlik types of olives during 8 weeks of maturation
for both harvest years ................................................................................... 80
Figure 4.39.Score plot obtained with PCA for sugar and fatty acids of Hurma,
Erkence and Gemlik types of olives during 8 weeks of maturation for
both harvest years ........................................................................................ 81
Figure.4.40.Loading plot obtained with PCA for sugar and fatty acids of Hurma,
Erkence and Gemlik types of olives during 8 weeks of maturation for
both harvest years ........................................................................................ 81
Figure 4.41.Score plot obtained with PCA for whole data of Hurma, Erkence and
Gemlik types of olives during 8 weeks of maturation for both harvest
years ............................................................................................................. 82
Figure.4.42.Loading plot obtained with PCA for whole data of Hurma, Erkence and
Gemlik types of olives during 8 weeks of maturation for both harvest
years ............................................................................................................. 83

xii
LIST OF TABLES
Table Page
Table 2.1. Scientific Classification of Olives ................................................................... 3
Table 2.2.Production of Table Olives .............................................................................. 7
Table 2.3.Phenolic classes in plants ................................................................................ 15
Table.2.4. Amount of phenolics in table olives and derived products ............................ 16
Table 2.5.Major classes of phenolics in olive ................................................................. 17
Table 3.1.Codes of olive varieties .................................................................................. 26
Table 3.2. Chromatographic conditions for the analysis of phenolic compounds of
olive samples. ............................................................................................... 29
Table 3.2. Chromatographic conditions for the analysis of phenolic compounds of
olive samples. ............................................................................................... 29
Table 3.4.Chromatographic conditions for the analysis of sugar content of olive
samples ......................................................................................................... 31
Table 3.5. Chromatographic method for the analysis organic acid content ................... 31
Table 3.6. Chromatographic method for the analysis of fatty acid methyl esters .......... 33
Table 3.7. Factors and their levels for ANOVA ............................................................. 35
Table 4.1.pH, aw and maturity index (MI) values for Hurma, Erkence and Gemlik
olives for two harvest year ........................................................................... 38
Table 4.2. ANOVA table for pH ..................................................................................... 39
Table 4.3.ANOVA table for aw ................................................................................................................................. 41
Table 4.4. Sugar concentrations (mg/kg dw) of olive varieties for two harvest years ... 45
Table 4.5. Organic concentrations (mg/kg dw) of olive varieties for two harvest years 51
Table 4.6. ANOVA table for total phenol content .......................................................... 55
Table 4.7. MI, TPC (mg 100 g-1
) and concentration of individual phenolic compounds
(mg kg-1
) of Hurma, Erkence and Gemlik olive types during eight weeks
of maturation ................................................................................................ 59

xiii
Table 4.8. MI, TPC (mg 100 g-1
) and concentration of individual phenolic compounds
(mg kg-1
) of Hurma, Erkence and Gemlik olive types during eight week of
maturation .................................................................................................... 60
Table 4.9.Percent oil content of olive varieties for two harvest years ............................ 68
Table 4.10.Percentage of individual fatty acids of olive varieties (Hurma, Erkence,
and Gemlik) for the first harvest year .......................................................... 77
Table 4.11.Percentage of individual fatty acids of olive varieties (Hurma, Erkence,
and Gemlik) for the second harvest year ..................................................... 78

1
CHAPTER 1
INTRODUCTION
Olive is an important agricultural product for Turkey and especially for Aegean
Region. Olives, which are rich in minor components such as phenolics, outshine as one
of healthy food products which are trendy in recent years. Turkey is very rich in terms
of olive varieties. Olive type, mostly Erkence, grown in nearby area around Karaburun
peninsula of Izmir-Turkey, goes through a natural debittering phase on the tree during
its ripening. This naturally debittered olive is known by the name of Hurma. Hurma
olive, which has the characteristic sensorial properties, is a noteworthy product for both
its growers and its consumers. Hurma olive has the characteristic of losing its bitterness
throughout its maturation period; therefore, this type of olive does not require further
processing steps for debittering. It was stated that a fungus called Phoma olea is the
reason for this phenomena with the help of climactic conditions. According to a few
studies in the literature, it was reported that similar types of olives were also grown in
countries like Greece and Tunisia.
Although there are many studies related to olive oil composition and factors
affecting the compositional parameters in the literature research related with olive fruit
itself is relatively less. However, there are reports of beneficial health effects of
consuming table olives and a study claims that consuming 5-10 table olives might cover
the daily intake of polyphenols, which are associated with the prevention of
cardiovascular disease, degenerative disease protection, anti-inflammatory and anti-
carcinogenic activities (Boskou et al., 2006). Especially, current knowledge on natural
debittering of olive while still on the tree is very limited.
The studies about sweet Thasos olive which is grown in Thasos island of Greece
shows that oleuropein responsible for bitter taste is hydrolyzed to hydroxytyrosol and its
derivatives by an enzyme, β-glucosidase, which is produced by fungi and bacteria
during ripening (Zoidou et al., 2009). Same trend was also observed in a study about
Dhokar olives which are cultivated in the southern region of Tunisia (Jemai et al.,
2009). Therefore, while oleuropein concentration decreases during maturation,
2
hydroxytyrosol concentration increases. In addition to this, total phenol content and
reducing sugar concentration increase relatively (Jemai et al., 2009).
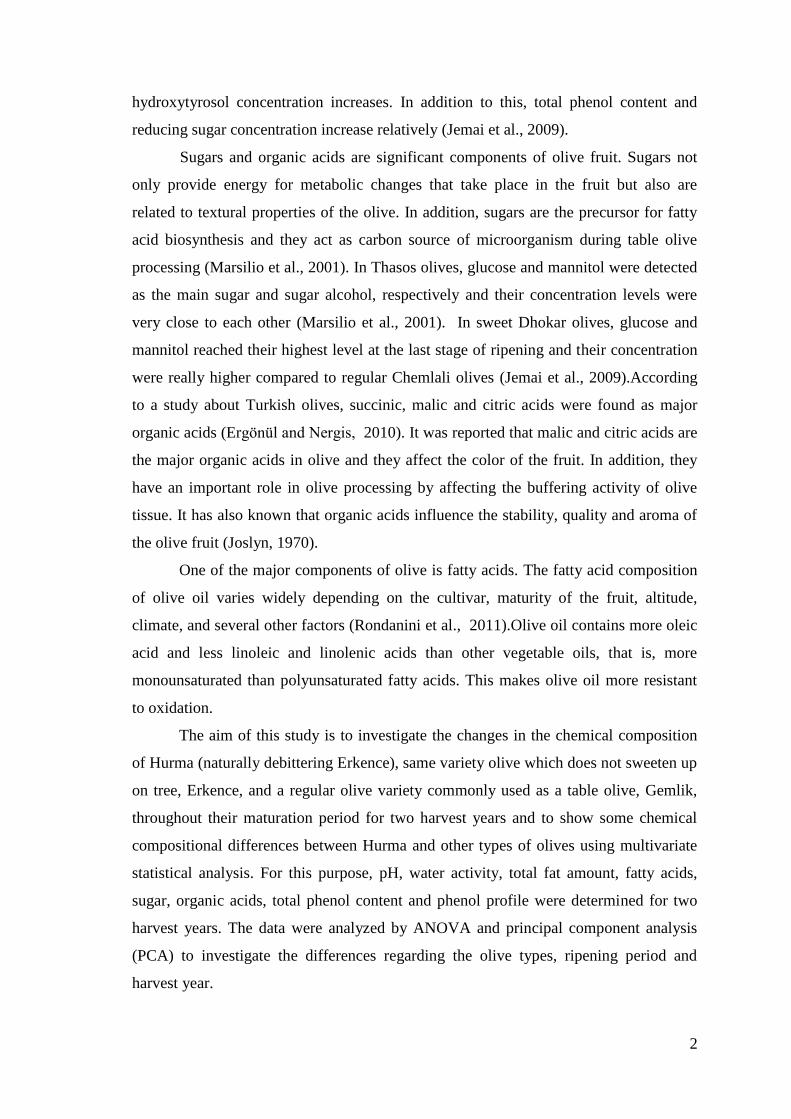
Sugars and organic acids are significant components of olive fruit. Sugars not
only provide energy for metabolic changes that take place in the fruit but also are
related to textural properties of the olive. In addition, sugars are the precursor for fatty
acid biosynthesis and they act as carbon source of microorganism during table olive
processing (Marsilio et al., 2001). In Thasos olives, glucose and mannitol were detected
as the main sugar and sugar alcohol, respectively and their concentration levels were
very close to each other (Marsilio et al., 2001). In sweet Dhokar olives, glucose and
mannitol reached their highest level at the last stage of ripening and their concentration
were really higher compared to regular Chemlali olives (Jemai et al., 2009).According
to a study about Turkish olives, succinic, malic and citric acids were found as major
organic acids (Ergönül and Nergis, 2010). It was reported that malic and citric acids are
the major organic acids in olive and they affect the color of the fruit. In addition, they
have an important role in olive processing by affecting the buffering activity of olive
tissue. It has also known that organic acids influence the stability, quality and aroma of
the olive fruit (Joslyn, 1970).
One of the major components of olive is fatty acids. The fatty acid composition
of olive oil varies widely depending on the cultivar, maturity of the fruit, altitude,
climate, and several other factors (Rondanini et al., 2011).Olive oil contains more oleic
acid and less linoleic and linolenic acids than other vegetable oils, that is, more
monounsaturated than polyunsaturated fatty acids. This makes olive oil more resistant
to oxidation.
The aim of this study is to investigate the changes in the chemical composition
of Hurma (naturally debittering Erkence), same variety olive which does not sweeten up
on tree, Erkence, and a regular olive variety commonly used as a table olive, Gemlik,
throughout their maturation period for two harvest years and to show some chemical
compositional differences between Hurma and other types of olives using multivariate
statistical analysis. For this purpose, pH, water activity, total fat amount, fatty acids,
sugar, organic acids, total phenol content and phenol profile were determined for two
harvest years. The data were analyzed by ANOVA and principal component analysis
(PCA) to investigate the differences regarding the olive types, ripening period and
harvest year.

3
CHAPTER 2
LITERATURE VIEW
2.1. Description of Olive and Brief History
2.1.1. Description of Olive
The olive tree, Olea europaea, is an evergreen tree or a shrub and natively grows
in Mediterranean, Asian and African countries. Its scientific classification is provided in
Table 2.1. It is short and squat, and rarely exceeds 8–15 meters (26–49 ft) in height. The
fruit is a small drupe 1–2.5 centimeters (0.39–0.98 in) long, thinner-fleshed and smaller
in wild plants than in orchard cultivar (Encyclopedia Wikipedia, 2013).
Table 2.1. Scientific Classification of Olives
(Source:Encyclopedia Wikipedia, 2013)
Scientific Classification
Kingdom Plantae
(unracked) Angiosperms
(unracked) Eudicots
(unracked) Asterids
Order Lamiales
Family Oleaceae
Genus Olea
Species Oleaeuropaea
Binomial Name
OleaEuropaea L.
The olive tree has been cultivated for olive oil, fine wood (2.5 times the energy
generated by burning the same amount of wood), olive leaf, and the olive fruit. Its

4
harvesting starts in the green to purple stage from early of October until the end of
December.
2.1.2. Brief History
Olive has 6,000 years long history which is documented by legends, traditions,
religious texts and archaeological discoveries. First wild olives were collected by
Neolithic people early in the 8th millennium BC. The olive tree is believed to have
originated in the Middle East and the last studies about homeland of olive indicate
Mardin, Andırın, Anamur triangle of Turkey (East Mediterranean Olive Association,
Turkey, 2011)(Figure 2.1).First, the olive spread to the Fertile Crescent area then to the
rest of the World by two different ways (Figure 2.1). First way is from Mardin- Andırın-
Anamur triangle to the west of Anatolia, Greece, the territories of Greece, Aegean
islands, the coastal area of the Balkans, Italy, Spain and Portugal (East Mediterranean
Olive Association, Turkey, 2011).The second way is from Syria, Israel and Lower
Egypt to North Africa. Due to the positive recognition of its fruit and by the favorable
environmental conditions of the Mediterranean climate, its cultivation spread out to
Morocco, Algeria, Tunisia and the oases of Libya. After the discovery of America, olive
cultivation spread southwards to Peru, Argentina, Chile and Uruguay and northwards to
the coastal regions of Mexico and the United States where it found an ideal environment
in the southern part of California (East Mediterranean Olive Association, Turkey,
2011).

5
Figure 2.1.Homeland of olive and its distribution
(Source: East Mediterranean Olive Association, 2013)
In recent times, olive trees have also been introduced in other countries without
an earlier tradition of olive oil production or consumption. As a result, nowadays this
fruit found more and more widely in countries like South Africa, Australia, New
Zealand and China. Major olive growing areas of the World is shown in Figure 2.2.
Figure 2.2. Geographical distribution of olive growing areas
(Source: International Olive Oil Council, 2010)
Major progress in olive processing started with the invention of screw press by
Greeks. Then, Romans set and disseminated the equipment. After the fall of Roman
Empire, there was a reduction in olive cultivation until middle Ages. During the 1900s,
mechanical extraction systems started to be used as a result of improvements
inpercolation and centrifugation systems. The first industrial decanter based on the
continuous centrifugation of the olive paste was used toward the end of 1960s. Despite

6
the improvement in pressing systems, old pressing system is still in use in some
countries (Aparicio and Aparicio-Ruı́z, 2000).
2.2. World Olive Growth and Production
2.2.1. Cultivation Conditions
Olive trees, Olea europaea, prefer calcareous soils, and coastal climate
conditions for the best growth. They can grow in any light soil, but in rich soils they are
prone to disease and produce poorer oil. Olives like hot weather, and temperatures
below −10 °C may injure even a mature tree. Their tolerance to drought is well because
of their sturdy and extensive root system. Olive trees can live for several centuries, and
can remain productive if pruned correctly and regularly (Encyclopedia Wikipedia,
2013).
2.2.2. World Olive Production
Olive tree finds the best growth conditions in the Mediterranean region which is
called as „the Civilization of Olive‟. According to the statistics, 98 percent of olive
production which is around 18.5 million tons produced in Spain, Italy, Greece, Turkey,
Tunisia, Syria, Portugal, France and Algeria. Major table olive producing countries and
their production numbers between 2005 and 2011 are given in Table 2.2. According to
2010 statistics, the total World olive oil production is 2,950,000 tons. Spain is in the
first rank followed by Italy and Greece in the second and third ranks, respectively.
Turkey is the fifth country in terms of tree numbers and the fourth one in terms of olive
oil production (International Olive Oil Council, 2010).
Turkey has 159,473,907 olive trees; 43,904,206 of these trees are fruitless while
115,569,647 olive trees have fruit according to 2010 statistics. Turkey produced
1,076,601 tons of olives in 2010; 305,045 tons of these are used as table olive and
771,556 tons are for olive oil production .In 2011-2012 season, Turkey had 123,375,388
olive trees which had fruit. In 2011, 1,446,171 tons olive produced and 534,376 tons of

7
these were used as table olive and 903,535 tons were for olive oil (International Olive
Oil Council, 2012).
It is expected for 2012-2013 season that with 131,263,255 olive trees which has
fruit 1,438,481 tons of olive will be produced.455, 030 tons of these olives will be used
for table olive and 983,450 tons will be utilized in olive oil production.
Table 2.2.Production of Table Olives (1.000 tones)
(Source: IOOC, 2011)
YEARS 2005 2006 2007 2008 2009 2010 2011
COUNTRIES
Algeria 85.0 75.0 100.0 95.0 220.0 250.0 200.0
Egypt 200.0 436.0 432.0 440.0 409.0 200.0 500.0
Syria 120.0 200.0 100.0 120.0 135.0 142.0 165.0
Tunisia 26.5 15.0 18.0 18.0 22.0 20.0 22.0
Turkey 280.0 240.0 200.0 300.0 390.0 330.0 450.0
Morocco 100.0 90.0 100.0 100.0 90.0 110.0 100.0
Argentina 85.0 75.0 100.0 95.0 220.0 250.0 200.0
EU 623.5 714.5 720.5 677.0 675.0 809.0 667.5
2.3. Production of Table Olives and Its Types
„Table olives are the sound fruit of varieties of the cultivated olive trees
(Olea europaea L.) that are chosen for their production of olives whose volume, shape,
flesh-to-stone ratio, fine flesh taste, firmness and ease of detachment from the stone
make them particularly suitable for processing; treated to remove its bitterness and
preserved by natural fermentation; or by heat treatment, with or without the addition of
preservatives; packed with or without covering liquid‟ (IOOC, 2004).
A complete definition of all trade preparations can be found in the „Trade
Standard Applying to Table Olives‟ by International Olive Council (IOOC, 2004). The
main commercial preparations as described by IOOC are explained below:
Treated olives.“Green olives, olives turning color or black olives that have undergone
alkaline treatment, and then taken in brine where they undergo fermentation, and

8
preserved or not by the addition of acidifying agents”. The most common preparation is
„treated green olives in brine‟ also known as „Spanish style‟ or „Seville style‟.
Natural olives. „Green olives, olives turning color or black olives are placed directly in
brine in which they undergo fermentation, preserved or not by the addition of acidifying
agents‟. The most prevalent preparation is „natural black olives‟ also known as „Greek
style‟.
Olives darkened by oxidation. „Green olives or olives turning color are preserved in
brine, fermented or not, darkened by oxidation in an alkaline medium and preserved in
hermetically sealed containers subjected to heat sterilization; they shall be a uniform
black color‟. These are also known as „ripe olives‟ or „black olives‟.
2.3.1. Spanish Style Green Olives
For this process, green olives are obtained from fully developed green fruits
during the maturation period, prior to darkening. These olives must be firm, sound,
resistant to a slight pressure between the fingers, and without marks other than natural
pigmentation. The color of the fruits may be green to yellow.
The cultivar is one of the most important criteria for green table olives and this
type of olives must have the following characteristics: good size and proper shape, high
relationship of flesh/stone, ease in releasing the pit as well as good color and texture in
the final product. The most popular cultivars used are: Sigoise (Algeria), Arauco
(Argentina), Kalamata (Greece), Gordal, Manzanilla,Hojiblanca (Spain),Ascolana
(Italy),Picholine, Marocaine (Morocco),Meski (Tunisia), and Domat (Turkey) (COI,
2000).

9
Figure 2.3.Process of Spanish Table Olives
(Source: Fernández et al., 1997)
Typical steps of a Spanish table olive processing are listed in Figure 2.3. The lye
treatment with a diluted solution of NaOH is the essential step for green olive
processing. The main purpose in this step is to eliminate the bitter taste of the fresh
fruits, which can be achieved by the chemical hydrolysis of the oleuropein.
The penetration of the lye into the flesh is considered sufficient if the chemical
reaches about 2/3 of the distance from the exterior to the pit. A homogeneous
penetration could be obtained by using the olives having similar size and maturation
degree. Lye treatment is normally achieved in 10,000 kg tanks. The diffusion coefficient
of NaOH through the skin ranges from 43.3 to 9.32x10⁻¹²
while through the flesh is 7.18
x 10-11
to 1.18 x 10⁻⁹
m2/s (García et al.,2006). Currently, it is preferred to apply the lye
treatment at a controlled temperature (18°C) to avoid peeling ( García et al., 2006) and
allow a more homogeneous lye penetration.
When the lye treatment ends, the alkaline solution is removed by covering olives
with tap water („lavado‟). The main purpose of this washing is to remove the excess of
Harvesting and transportation
Sorting (size-granding)
Lye treatment
Washing
Brine placement
Fermentation
Sorting-size grading
Stoning and stufting
Packing

10
the alkali which is penetrated into the flesh. An excessive washing is not desirable
because it may cause losses of various soluble compounds which will be later required
for fermentation (Sánchez et al., 2000).
The use of warm water does not improve removing alkali either (Sánchez,
García et al. 1995) HCl in the concentrations of up to 0.07 eq/l is used in the washing
step. This much of acid is under detection level of any sensory analysis; however, the
number of washing waters given to the alkali treated olives is increased for precaution.
With the removal of washing waters olives are immersed in a 10-11% (w/v)
brine in which olives are maintained during the fermentation and storage periods.
Normally, underground fermenters are used. Brine stabilization is fairly rapid and in a
few days NaCl concentration stabilizes at a level of 5-6%.In Tunisia, for Meski cultivar,
the best debittering conditions were established as: 2% (w/v) NaOH lye concentration
and a brine concentration of 9% (Chammem et al., 2005).
At the early stages of the brining process, the pH value of the brine is higher
than 10 units due to the alkali that is released by the fruits. The development of
microorganisms especially lactic acid bacteria causes production of different acids and
lowers the pH to around 4 units.
The fermentation is still spontaneous in most cases since the use of starter
cultures is not common. However, the use of Lactobacillus pentosus 5138 starter culture
which is resistant to alkaline pH (around 9 units) causes initiation and acceleration of
the fermentative process (Sánchez et al., 2001).
During the fermentation, there is a slow hydrolysis of the elenolic acid glycoside
with the production of elenolic acid and glucose. These hydrolysis products are used by
the microorganisms in the brine and maintain the microbial activity for a longer period
of time (Brenes and de Castro, 1998).
At the end of fermentation, the olives must have reached the proper
physicochemical characteristics for consumption. Therefore, series of complementary
operations should be applied to green fermented olives to adapt them to the different
commercial presentations.

11
2.3.2 Natural Black Olives
For this type of olives, the fruit should be harvested when it is ripe but not over-
ripe. Degrees of ripeness affect the texture and over-ripe olives don‟t get firm enough.
In this type of process, olives are placed into brine with a salt concentration between 8
and 10 % (w/v) and lower concentrations (about 6 %) can be used for colder areas. The
fermentation process takes a long time because of diffusion of fermentable compounds
through the skin. Debitterness process can be only achieved by solubilization of the
oleuropein into the brine and equilibrium is reached in 8-12 months (Fernández et al.,
1997)
During anaerobic fermentation of the olives a variable proportion of fruits with
“gas-pocket” spoilage are produced. This spoilage is characterized by the development
of blisters in the flesh of olives which may extend to the pits of the fruits. This is due to
the CO2 accumulation that is produced by the effect of olive respiration and the activity
of the responsible microorganisms during the fermentative process (Borcakli et al.,
1993).
To avoid the appearance of “gas pocket” spoilage, fermentation under aerobic
conditions is carried out. The species of gram-negative bacteria are used in the
traditional process. Yeasts are stable during the whole fermentation process with a
higher population than under anaerobic conditions. Lactic acid bacteria can grow only if
the salt concentration is below 8%.Microbial flora almost exclusively include
Leuconostoc and Pediococcus at the early stages of fermentation, but after 20 days
Lactobacillus predominate (Borcakli et al., 1993).
Fermentation under both aerobic and anaerobic conditions is influenced by the
initial pH and NaCl concentration. In order to prevent excessive growth of gram-
negative bacteria, acetic acid must be added to the brining solution to reduce pH below
4.5. If the pH is high, the population of gram-negative bacteria is excessive and
produces a great volume of CO2, which causes gas-pocket spoilage in the olives
(Fernández et al., 1997).
In the past, olives processed with this technique were not packed. They were
only sold in bulk. Glass jars or cans are rarely used for this product. In general, there are
two presentation forms: naturally black olives in brine (Greek style) and Kalamata style.
For Greek style, the most common values for commercial products are: pH about 4.0-

12
4.2 and salt concentration between 6-8%. For Kalamata style, the pH values are lower
because wine vinegar must be added; furthermore, olive oil is also included into the
formulation (Borcakli et al., 1993).
2.3.3. Black (ripe) Olives
The stages of this process are shown in Figure 2.4.Olives that will be used in this
process should be collected when the fruit has a green color as in Spanish style.
However, fruits can be directly exposed to the oxidation process without any
preservation in order to produce the ripe olives. All the fruits can‟t be processed
immediately because factories do not have the required capacity and it is not desirable
to store large amounts of canned product. In addition to this, it is possible to use green
Spanish style olives as raw material although the working conditions for obtaining a
good final product are different (Fernández et al., 1997).
Figure 2.4. Flow scheme of ripe black olive elaboration process
(Source: Fernández et al., 1997)
Harvesting
Transportation
Washing & size grading
Preservation
Sorting & Size Grading
Lye treatment& air oxidation
Neutralization
Color Fixation
Piting,Slicing,etc
Canning & sterilization

13
In Spain, the procedure for storage of naturally ripe (black) olives is used
commonly. Briefly, the olives are put into fermentation vessels in 4-6 % NaCl (w/v)
brine. This concentration is increased progressively to 8-9 % salt which is maintained
during the storage period (Fernández et al., 1997). However, this system causes serious
damage to fruits such as shriveling and gas-pocket („alambrado‟) formation which is
produced by the accumulation of respiratory gases (CO2) of the olives themselves
(García et al.,1995).In addition to this, the activities of gram negative bacteria and yeast
are responsible for this fermentation (Fernández et al., 1997).
To prevent both types of spoilage this method is modified. Calibrating the initial
pH of brines to 3.8-4.0 by acetic acid can inhibit the growth of gram-negative rod and
CO2 accumulation are prevented by aeration in a similar trend to naturally black olives
(García et al., 1995).
In the USA, combination of salt-free and acidulated water storage (lactic and
acetic acid) in anaerobic conditions is used. This method was formed to diminish the
problem of brine disposal. Sodium benzoate is also necessary for this process and
calcium chloride is usually added to the liquid to improve the olive texture (Vaughn et
al., 1969).
The industrial process of the production of ripe olives consists of successive
treatments with dilute NaOH solution (lye). Between lye treatments the fruits are placed
in water with bubbling of air. Throughout this operation, the olives get darker
progressively due to the oxidation of ortho-diphenols, hydroxytyrosol (3,4
dihydroxyphenyl ethanol) and caffeic acid (Brenes et al., 1992).The number of lye
treatments applied generally changes between 2 and 5. Penetration into the fruits must
be controlled so that NaOH of the first treatment barely passes through the skin. Other
treatments are applied so that they can penetrate to deeper part of the flesh and the final
lye treatment must reach to the stone (Fernández et al., 1997). It is possible to make
only one lye treatment but the concentration of NaOH in the lye solution should be
between 1-4 %(w/v) and the concentration depends on the ripeness of the fruit, olive
variety, preservation system, environmental temperature and the desired penetration
speed. After each NaOH treatment, water is added to complete a 24 hour cycle. To
reduce waste-water it is possible to reuse the storage liquid diluted with tap water
(Brenes and de Castro, 1998).

14
After the last lye treatment, olives are washed several times with water to
remove the most of NaOH and lower the pH in the flesh to around 8 (Fernández et al.,
1997).
The black surface color obtained from lye treatment is not stable and fades
progressively after oxidation and during the shelf life of the packed product. To prevent
this deterioration, only the use of ferrous gluconate and ferrous lactate is legally
permitted for ripe olive processing (García et al., 2006).Normally, ferrous salts were
added at a concentration of 100 ppm (parts per million) of iron in the liquid. Iron
diffusion into the flesh is complete in 10 hours, but normally, this phase is allowed to
continue about 24 hours (García et al., 2006).
The black (ripe) olives (whole, pitted, slices, quarters or paste) are packed in
cans or glass containers with a liquid that contains 2-4% of NaCl and 10-40 ppm of iron
to prevent deterioration of their black color. Ripe olives could be packed in plastic
pouches by addition of lactic o-gluconic acid, and applying pasteurization for
preservation (García et al., 1999).
2.4. Composition of Olive and Olive Oil
The major components of olive chemical structure are fatty acids (e.g. oleic,
linoleic, linolenic, stearic and palmitic acids) and phenolics (e.g. oleuropein,
verbascoside, apigenin, hydroxytyrosol and phenolic acids).Sugars (e.g. glucose,
fructose, mannitol, sucrose, mannose), organic acids (e.g. citric, succinic, acetic, lactic,
malic acids), amino acids, minerals and vitamins constitute the minor components.
2.4.1. Phenolic Compounds and Their Importance
In recent years, there has been growing interest in phenolics of olives due to
their antioxidant and antimicrobial activities, health and sensory properties. Phenolic
compounds regulate the nutritional properties, sensory characteristics and the shelf life
of olive oil. These compounds have an important effect on human health because of
their anti-inflammatory, anti-allergic, antimicrobial, anti-carcinogenic, and antiviral
activities (Yorulmaz et al., 2012).

15
Phenolic compounds are a large and a diverse group of molecules, which include
many different families of aromatic secondary metabolites in plants. These phenolics
are most abundant secondary metabolites in plants and can be classified into non-
soluble compounds such as condensed tannins, lignin, cell wall bound hydroxycinnamic
acids, and soluble compounds such as phenolic acids, phenylpropanoids, flavonoids and
quinines. Different phenolic classes that exist in plants and their chemical structures are
provided in Table 2.3. All these groups are involved in various processes in plants and
animals. One family, the flavonoids, is of special interest because of its multiple roles in
plants and its impact on human health (Harborne and Williams, 2000).
Table 2.3.Phenolic classes in plants
(Source: Naczk and Shahidi, 2004)
Phenolic classes Chemical structure
Simple phenols benzoquinones C6
Phenolic acids C6-C1
Acetophenones, phenylacetic acids,
Hydroxycinnamic,phenylpropones,
coumarins,isocoumarins,chromones
C6-C2
C6-C3
Naphthoquinones C6-C4
Xanthones C6-C1-C6
Stilbenes,anthraquinones C6-C2-C6
Flavonoids,isoflavonoids C6-C3-C6
Lignans,neolignans (C6-C3)2
Bioflavonoids (C6-C3-C6)2
Lignins (C6-C3)n
Condensed tannins (C6-C3-C6)n
Olive fruits, olive oil and derived products (table olive, olive paste) are good
sources of some phenolics with important antioxidant activities. There are large
numbers of phenolics in olive belonging to different classes such as phenolic acids,
phenolic alcohols, flavonoids, lignans and hydroxy-isocromans. In addition to these,
secoiridoids which are derivatives of oleuropein, demethyloleuropein and ligstroside are
the major phenolics that can be detected (Table 2.4) (Yorulmaz et al., 2012).

16
Table.2.4. Amount of phenolics in table olives and derived products
(Source: East Mediterranean Olive Association, 2013)
Table olive and derivatives Amount of phenolic compounds
Natural black olives 16.40 g/kg
Spanish style green olives 4.48 g/kg
Brine of black olives 0.93 g/L
Brine of green olives 1.36 g/L
Olive oil 0.1-0.8 mg/kg
Olive-mill waste water 2-10 g/kg
The previous studies about olives show that main phenolics are tyrosol,
oleuropein, p-coumaric acid, verbascoside, luteolin 7-O-glucoside, rutin, trans-cinnamic
acid, luteolin, apigenin,cyanidin 3-O-glucoside and cyanidin 3-O-rutinoside (Ryan et
al., 1999).Some phenolics always exist in all olive varieties like oleuropein, but some of
them can be detected in some varieties like demethyloleuropein and verbascoside.
Oleuropein and trans-cinnamic acid are existed in higher amounts in all olive types
(Yorulmaz et al., 2012).
Oleuropein is a heterosidic ester of β-glycosylated elenolic acid and
hydroxytyrosol. It is the major secoiridoids of olive fruit and responsible for the bitter
taste of olives. Different forms of oleuropein exist in olives such as demethyloleuropein,
ligstroside and oleuropein aglycone (Yorulmaz, et al., 2010).
Verbascoside, a hydroxycinnamic acid derivative, and its isomeric forms are
also the important phenolics of olive fruit. The (3, 4-dihydroxyphenyl) ethanol (3, 4-
DHPEA) and (p-hydroxyphenyl) ethanol (p-HPEA) are predominant phenyl alcohols
and both of them exist in olive oil and olive fruit (Yorulmaz et al., 2012).
Phenolic acids with the basic chemical structure C6-C1 (benzoic acid) and C6-C3
(cinnamic acid) was detected in polar phenol fraction of olives. Caffeic, vanillic,
syringic, p-coumaric, o-coumaric, protocatechuic, sinapic, and p-hydroxybenzoic are
the groups of phenolics which are found in very small amounts (Yorulmaz et al., 2010).
Flavonol glycosides such as luteolin-7-O-glucoside, rutin, apigenin-7-glucoside
and anthocyanins such as cyanidin-3-O-glucoside, cyanidin-3-O-rutinoside are the most
abundant flavonoids in olives (Yorulmaz et al., 2012).

17
Table 2.5.Major classes of phenolics in olive
Major classes of phenolic compounds in olive
Phenolic acids and derivatives
Vanilic acid
o-coumaric acid
p-coumaric acid
Caffeic acid
Ferulic acid
p-hydroxybenzoic acid
Protocatechuic acid
Cinnamic acid
Benzoic acid
Verbascoside
Phenyl ethyl alcohols
Hydroxytyrosol
Tyrosol
(3,4-Dihydroxyphenyl)ethanol-glycoside
Secoiridoids
3,4-DHPEA (3,4-DHPEA-EDA)
p-HPEA-EDA
(3,4-DHPEA-EA)
Ligstroside aglycone
Oleuropein
p-HPEA-derivative
Oleuropein aglycone
Ligstroside aglycone
Flavones
Apigenin
Luteolin
Rutin
Flavonol
Quercetin

18
2.4.2. Fatty Acid Content of Olive Oil
One of the major components of olive is fatty acids. The fatty acid composition
of olive oil varies widely depending on the cultivar, maturity of the fruit, altitude,
climate, and several other factors. The major fatty acids in olive oil are:
Oleic acid (C18:1), a monounsaturated omega-9 fatty acid. It makes up 55 to 83% of
olive oil.
Linoleic acid (C18:2), a polyunsaturated omega-6 fatty acid that makes up about 3.5 to
21% of olive oil.
Palmitic acid (C16:0), a saturated fatty acid that makes up 7.5 to 20% of olive oil.
Stearic acid (C18:0), a saturated fatty acid that makes up 0.5 to 5% of olive oil.
Linolenic acid (C18:3), a polyunsaturated omega-3 fatty acid that makes up 0 to 1.5%
of olive oil.
Olive oil contains more oleic acid and less linoleic and linolenic acids than other
vegetable oils, that is, more monounsaturated than polyunsaturated fatty acids. This
makes olive oil more resistant to oxidation. Greater the number of double bonds in the
fatty acids they are more unstable and easily broken down by heat, light, and other
factors. It is generally accepted that cooler areas will yield oil with higher oleic acid
than warmer climates. That means a cool region‟ olive oil may have more
monounsaturated fatty acid content than warmer region oil (IOOC, 2006).
Fatty acid composition is important for the commercial properties of oils. It has
an influence on the stability of oils due to the contribution of polyunsaturated fatty acids
to oil rancidity. In addition to this, several studies have shown that a diet rich in
monounsaturated fatty acids may result in a wide range of health benefits such as an
improvement in cholesterol levels, and, in turn, prevention of cardiovascular disorders
(Gillingham et al., 2011).
2.4.3. Sugar and Organic Acid Content of Olive
Sugars are one of the minor components of olives. Although they exist in very
low concentration, they play an important role in both maturation and processing of
table olives. Particularly, sugars provide energy for metabolic changes during

19
maturation and contribute to olive fruit texture. In addition to this, they are really good
carbon source which is necessary for the fermentation of table olives (Menz and
Vriesekoop, 2010).
Acetyl Co-A is a molecule that is needed for fatty acid synthesis in the seeds and
carbohydrates serve as a source for this compound. (Wodner et al., 1988) Glucose,
fructose and mannitol were found to be the predominant sugars in the olive fruit
(Patumi et al., 1989).In a study about the oil and sugar content during the development
and maturation of the fruit in different cultivars, it was observed that if the cultivar has
the least amount of oil, there is a parallel rise in oil and sugar levels at the beginning of
the fruit ripening period. However, if the sugar level decreases in other cultivars, they
have higher oil content (Wodner et al., 1988).
Major soluble sugars in olive fruit are glucose, fructose, sucrose, xylose
rhamnose and mannitol (López et al., 2007) . In Thassos olives, glucose and mannitol
were detected as the main sugar and sugar alcohol, respectively and their concentration
levels were very close to each other (Marsilio et al., 2001).In sweet Dhokar olives,
glucose and mannitol reached their highest level at the last stage of ripening and this
concentration are really higher compared to regular Chemlali olives (Jemai et al.,
2009).
Organic acids are the compounds that are naturally found in vegetables and
fruits. They can be formed during processes like fermentation or can be added into food
during the production process. Organic acids are another minor component of olive fruit
and their amount is approximately 1.5% of the flesh part. Organic acids which are
produced during the formation and degradation of the other components like
carbohydrates in olive play an important role in metabolic activity (Cunha et al., 2001).
According to a study about Turkish olives, succinic, malic and citric acids are
found as major organic acids in Memecik and Domat varieties (Ergönül and Nergis,
2010). Organic acids not only affect the color of the fruit but also have an important role
in olive processing due to their buffering capacity. It has also known that organic acids
influence the stability, quality and aroma of the olive fruit (Joslyn, 1970).

20
2.5. Changes in Olive during Maturation Period
During maturation period, a number of physical and chemical changes occur in
olive fruit. Many of these changes have important roles in the production of both table
olives and olive oil. These changes can be influenced by various factors such as the
cultivar, fruit ripeness, irrigation regimes, and environmental factors (geographical area,
soil quality, type of cultivation, rainfall, etc.). Changes in the composition, in turn,
affect the quality, sensorial, and nutritional properties of the fruit and the oil (Yorulmaz
et al., 2010).
Figure 2.5.Fruit polyphenol level and color during maturation period
(Source: Vossen, 1998)
The phenolic profile is considerably influenced by the type of cultivar, maturity
stage, climatic conditions, (Amiot et al., 1986) and irrigation management (Tovar et al.,
2001). Cultivar is the most important factor affecting the phenolic profile of the olive
fruit (Amiot et al., 1986). Maturation degree affects phenolic contents of the olive fruit
and olive oils as well. Figure 2.5 shows the relation between phenol content of olives
and maturation. A negative correlation between oleuropein concentration, hydrophilic
phenol amounts of oils and maturity stage of olive is reported (Garcia et al., 1996).
Climatic conditions (especially temperature and rainfall) influence the physiology of the
olive. Particularly, cumulative rainfall and temperature changes during maturation
might have a correlation with phenolic distribution of olive and olive oil (Romero et al.,
2003).

21
According to another study performed with Turkish olives, oleuropein
concentration decreases whereas hydroxytyrosol and demethyloleuropein increase
throughout maturation. In addition to this, while trans-cinnamic acid content of olive
fruits decreases, cyanidin 3-O-glucoside and cyanidin 3-O-rutinoside concentrations
increase (Yorulmaz et al., 2010).
The concentration of phenolic compounds in olive and olive oil is related to the
activity of several endogenous enzymes present in olives such as β-glucosidase,
polyphenoloxidases(PPO), peroxidases (POD) and lipoxygenase (LPO)(Yorulmaz et al.,
2010).
Maturation process is divided into three phases. First one is the growth phase in
which accumulation of oleuropein occurs. Second phase is a green maturation phase
that coincides with a reduction in the levels of chlorophyll and oleuropein
(Charoenprasert and Mitchell, 2012). Extensive lipid synthesis is observed in this phase.
Rapid reduction of oleuropein and accumulation of verbascoside is related to the second
phase (Amiot et al., 1986). The last phase is a black maturation phase that is
characterized by the appearance of anthocyanins and flavonoids and during which the
oleuropein levels continue to fall (Charoenprasert and Mitchell, 2012). Oleuropein is
the most abundant phenolic in the early stages of fruit development even in young fruits
it can reach to 14% of dw. Earlier studies showed that hydroxytyrosol increased as the
fruit matured; however, recent studies do not provide this finding (Mitchell, 2012).
Levels of oleuropein decrease in olive pulp during maturation and the glucoside forms
of flavonoids, luteolin-7-glucoside, cyanidin-3-glucoside, cyanidin-3-rutinoside and
quercetin-3-rutinoside are more abundant in the pulp of the mature olive fruit
(Charoenprasert and Mitchell, 2012).
In a study about Gordal Sevillana olives during the ripening period, the olive
size, flesh/pit ratio, and oil content all increased, while the moisture and total sugar
contents decreased (Menz and Vriesekoop, 2010). In addition, total phenolics initially
decreased and then gradually increased during maturation. Furthermore, at the optimal
maturity level maximum sugar content was detected. The olives in the onset of the
turning color phase resulted in a decrease in sugars in the fruit, which minimized the
available substrate for the subsequent fermentation of the green table olives (Menz and
Vriesekoop, 2010).
Organic acids show metabolic activity and are intermediate products resulting
from formation and degradation of other compounds (Cunha et al., 2001). The

22
maturation stage and geographical origin have an effect on the amounts and types of
organic acids in different kinds of fruits (Cámara et al., 1994). The concentrations of
organic acids in plants decrease with respect to ripening due to their usage as respiratory
substrates or their conversion to sugars (Islam et al., 1996).In addition to this, the
amount and structure of the chemical components of olive fruit show considerable
changes during growth and ripening (Boskou, 1996).
Oil synthesis and accumulation in the olive fruit begins about 10th
week and
continue to 34th
week of season (Vossen, 1998).The oil content varies with cultivar and
ripening degree, ranging from 3 to 38% on a fresh weight basis (Charoenprasert and
Mitchell, 2012). Oil synthesis increases rapidly up until fruit reaches maximum maturity
(color change and softening), then the rate of accumulation decreases, but still
continues. It seems like that there is a much larger increase in the beginning of
maturation than the late phases of ripening due to the loss of moisture in the fruit
(Figure 2.6). When the fruit gets very over-ripe, oil synthesis stops completely (Vossen,
1998).
Figure 2.6. General oil accumulation during maturation (Mid May to end of February)
(Source: Vossen, 1988)

23
2.6. Hurma Olive
Olive type, mostly Erkence, grown in nearby area around Karaburun peninsula
of Izmir-Turkey, goes through a natural debittering phase on the tree during its ripening.
This naturally debittered olive is known by the name of Hurma. At the end of this
process, olive loses its bitter taste while still on the tree and has a dark brownish color in
the inside and a wrinkled outer layer which is its differentiating appearance
characteristics from olives not going through this process. Therefore, this type of olive
does not require further processing steps for debittering.
It was stated that a fungus called Phoma olea is the reason for this phenomena
with the help of climactic conditions (Buzcu, 1969).
Figure 2.7.Hydrolysis of oleuropein and ligstroside
(Source: Charoenprasert and Mitchell, 2012)
According to several studies in literature, similar types of olives were also
reported in countries like Greece and Tunisia. The studies about sweet Thasos olive
which is grown in Thasos island of Greece show that oleuropein is responsible for bitter
taste. It is hydrolyzed to hydroxytyrosol and its derivatives by an enzyme, β-glucosidase
(Figure 2.7), which is produced by fungi and bacteria during ripening (Zoidou et al.,
2009).Same trend was also observed in a study about Dhokar olives, which are
cultivated in southern region of Tunisia (Jemai et al., 2009).Therefore, oleuropein

24
concentration decreases while hydroxytyrosol concentration increases during
maturation. In addition , total phenol content and reducing sugar concentration increase
relatively (Jemai et al., 2009).
In Thassos olives, glucose and mannitol were detected as the main sugar and
sugar alcohol, respectively and their concentration levels were very close to each other
(Marsilio et al., 2001).In sweet Dhokar olives, glucose and mannitol reached their
highest level at the last stage of ripening and these concentrations were really higher
compared to regular Chemlali olives (Jemai et al., 2009).

25
CHAPTER 3
EXPERIMENTAL STUDY
3.1. Materials
3.1.1. Olive Samples
Three different types of olives were used in the analysis. These types are
Gemlik, Erkence and Hurma olives (Table 3.1).Actually, Hurma olive is not a variety, it
is naturally debittered form of Erkence type. Hurma and Erkence olives were hand-
picked from an olive orchard (latitude: 38°54'07"N, longitude: 26°57'24"E) which is
located in Karaburun peninsula (Figure 3.1) of Izmir while Gemlik type was obtained
from another orchard located in Izmir Institute of Technology campus area (latitude:
38°19'30.84"N, longitude 26°37'48.87"E) which is 30 km south of the first orchard
(Figure 3.2).
Figure 3.1. Karaburun peninsula map
(Source: Encyclopedia Wikipedia, 2013)

26
Figure 3.2.IZTECH campus area map
(Source: Encyclopedia Wikipedia, 2013)
For the two harvest years 2011 (1st) and 2012 (2
nd), all olives were picked up
during eight weeks of maturation period from the end of October to the beginning of
December. Every week approximately half a kilogram of olives were picked up from
the all sides of three trees for each type.
After harvesting stones of olives were separated from the fruit immediately. For
the storage, olives were first immersed into liquid nitrogen, then dried with a freeze-
dryer (Labconco, The United States). All analyses were completed within a couple of
months after harvesting.
Table 3.1.Codes of olive varieties
Sample Name Sample Code
Hurma (debittered Erkence) H
Erkence E
Gemlik G
*first number after olive type represents the harvest time (1st week, second week etc.) and second
number shows the harvest years

27
3.1.2. Chemical Agents
Reagents used in chemical analysis were obtained from Riedel-de Haën
(Germany) and Sigma-Aldrich (Germany) and they are either HPLC or analytical grade.
In chromatographic analysis, 37 component fatty acid methyl esters (FAME) mixture
containing C4-C24 (2-4% relative concentration) was used as a reference standard
(Supelco # 47885-U).
Following abbreviations are used in the text: ††MI: maturity index, †††TPC: total
phenol content (averages of 3 measurements), OLE: oleuropein, HYT: Hydroxytyrosol,
TY: tyrosol, API: apigenin, VER: verbascoside, RTN:rutin, L-7-Glu:luteolin-7-
glucoside, LTLN:luteolin, QUE:quercetin-3-glucoside, o-cou:o-coumaric acid, p-cou:p-
coumaric acid, FA: ferulic acid, VA: vanillic acid, CA: caffeic acid, VN: vanillin.
Concentrations are the averages of 2 measurements.
3.2. Methods
3.2.1. Routine Analysis
Before lyophilization process, maturity index of olives was determined and pH
and aw measurements were performed with fresh olive pulp. Procedure described by
Morello et al. (2005) was used for maturity index determination. In order to calculate
maturity index, 100 olives were selected randomly, classified into seven groups
according to their color (green, black, reddish brown etc.) and olives in each group were
counted. Black olives were cut up to examine the percentage of olive flesh turning to
black or purple. Counted olive samples were multiplied with different coefficient
numbers for each class and following formula was used to determine the maturity index.
MI=Maturity index N=total number of olives
MI = 𝑐𝑜𝑒𝑓𝑓𝑖𝑐𝑖𝑒𝑛𝑡𝑛𝑢𝑚𝑏𝑒𝑟𝑜𝑓𝑔𝑟𝑜𝑢𝑝 ×𝑛𝑢𝑚𝑏𝑒𝑟𝑜𝑓𝑜𝑙𝑖𝑣𝑒𝑠
𝑁
7𝑖

28
For pH measurement, approximately 5 gram fresh olive flesh was kneaded in a
blender with the addition of approximately 5 mL pure water. pH of the samples is
measured by a pH meter (WTW 720 Series, Germany).
For water activity, same mixture was prepared without adding pure water and aw
was measured by a water activity measurement device (Hygrolab-3, Rotronic
Instruments, The United States).All measurements were repeated three times.
3.2.2. Total Phenol Content
The concentrations of total phenolic compounds of olives were determined with
the Folin–Ciocalteu assay (Bouaziz et al., 2004).0.3 gram of lyophilized olive pulp was
weighed and extracted with 5 mL methanol five times. Methanol in the extract was
evaporated at 45 0C with a rotary evaporator (Laborato 4000 Heidolph, Germany) in 20
minutes. Remaining extract was dissolved in 5 mL methanol again.100 μL of this
extract was taken into a glass tube and 2.5 mL of Folin–Ciocalteu reagent (diluted 10
times with water) was added. Then, 2 mL of Na2CO3 (75 g/L) was added within time
interval from 0.5 to 8 min. The sample was incubated at 40 0C for 15 min and then
cooled to room temperature. The absorbance of the sample was measured at 765 nm in a
UV spectrophotometer (PG Instrument, England) and distilled water was used as the
blank. Same procedure was applied to gallic acid standard solutions at different
concentrations (100-1000 ppm) and a standard curve was plotted (Appendix). Total
phenol content of the extracts was calculated using the standard curve and the results
were expressed in milligram of gallic acid per 100 g of dry matter (mg GA/100 g dw).
Each sample was analyzed three times.
3.2.3. Phenolic Compound Profile
3.2.3.1. Sample Preparation
Extraction of phenolics and HPLC analysis were performed according to a
method in literature (Bouaziz et al., 2004). First 1 gram lyophilized olive pulp was
extracted with 15 mL EtOH: water (80:20) twice. 1 mL internal standard (150 ppm 4-

29
hydroxyl acetic acid) was added and the mixture was mixed with a homogenizer
(Heidolph, Germany) at 15,000 rpm for 5 minutes. Then, the mixture was filtered
through a vacuum filtration unit with 125 mm pore size filter paper. Filtered extract was
taken to a rotary evaporator (Laborato 4000 Heidolph; Germany), and ethanol was
evaporated at 40 0C for 20 minutes under vacuum, then traces of ethanol were removed
by using a nitrogen flow. Extract was washed with 30 mL hexane twice in order to
remove the oil. Hexane, oil and extract separated from each other by the help of
separation funnel. Traces of hexane were removed by using nitrogen flow. The extract
was completed to 25 mL with water: MeOH (70:30) and filtered by 0.45μm syringe
filter into vials. Finally, it was injected to the high pressure liquid chromatography
(HPLC) equipment (Agilent 1200). Each sample was analyzed twice with HPLC.
3.2.3.2. Analytical Conditions
Chromatographic analyses were performed with an Agilent 1200 HPLC (The
United States), equipped with refractive index (RI) detector and photodiode array
detectors (DAD), a column oven, and an auto sampler. The instrumental configuration
and analytical conditions are presented in Table 3.2 and mobile phase program is
provided in Table 3.3. Some sample calibration curves for phenolic standards are
provided in Appendix.
Table 3.2. Chromatographic conditions for the analysis of phenolic compounds of olive
samples
Instrumentation
Chromatographic system Agilent 1200
Detector DAD
Automatic sampler ALS G1329A
Column SGE 8211 C18 (250*4mm,5μm)
Experimental conditions of HPLC-DAD
Injection Temperature 30 0C
Injection volume 20 μL
Flow Rate 1 mL/min
Mobile Phase A water: acetic acid (99.9:0.1)
Mobile Phase B MeOH:acetonitrile:acetic acid (A ACN: MeOH: acetic acid (50:50:0.1)
Wavelength 280 nm

30
Table 3.3. Chromatographic conditions for the analysis of phenolic compounds of olive
samples.
Time % Mobile Phase A % Mobile Phase B
0 95 5
45 45 55
55 0 100
60 0 100
65 95 5
70 95 5
Phenolic compounds used as standards in the analysis were oleuropein,
oleuropein aglycone, tyrosol, rutin, hydroxytyrosol, quercetin-3-glucoside, quercetin,
luteolin, luteolin-7-glucoside, verbascoside, vanillin, vanilic acid, ferulic acid, o-
coumaric acid, p-coumaric acid, syringic acid, caffeic acid, apigenin and apigenin-7-
glucoside.
3.2.4. Sugar-Organic Acid Analysis
3.2.4.1. Sample Preparation
Sugar and organic acid analyses of the olive samples were performed according
to a procedure in the literature (López et al., 2007). Same extracts were used for sugar
and organic acid analyses.5 gram lyophilized olive was weighed.5 mL of 1000 ppm
sorbitol solution was added to the sample as internal standard and the solution was
completed to 50 mL by adding ultra-pure water at 60 0C. The mixture was mixed for 30
minutes. Then, it was centrifuged at 9000 rpm (Sigma-2-16KC Centrifuge, The United
Kingdom) for 15 minutes. Supernatant was collected and filtered by 0.45 μ syringe filter
into vials and injected into HPLC. Each sample was analyzed twice. Sample calibration
curves for sugar standards are given in Appendix.

31
3.2.4.2. Analytical Conditions
Chromatographic analyses were performed with an HPLC (Agilent 1200),
equipped with a detector, a column oven and an auto-sampler. The instrumental
configuration and analytical conditions were presented in Table 3.4:
Table 3.4.Chromatographic conditions for the analysis of sugar content of olive samples
Instrumentation
Chromatographic System Agilent 1200
Detector RID
Automatic Sampler ALS G1329A
Column Biorad HPX-87C (300*7.8 mm ID, 9mm)
Experimental conditions of HPLC-RID
Injection Temperature 65 0C
Injection volume 50 μL
Flow Rate 0.7 mL/min
Mobile Phase 0.05M H2SO4
Sugar standards used in the analysis were glucose, fructose, lactose, mannose,
mannitol and sucrose.
For organic acid analysis same extracts were used. However, external standard
settings were done in order not to use sorbitol as internal standard. Sample calibration
standards of organic acids are shown in Appendix.
Table 3.5. Chromatographic method for the analysis organic acid content
Instrumentation
Chromatographic System Agilent 1200
Detector RID
Automatic Sampler ALS G1329A
Column Biorad HPX-87H (300*7.8 mm ID, 9mm)
Experimental conditions of HPLC-RID
Injection Temperature 65 0C
Injection volume 50 μL
Flow Rate 0.7 mL/min
Mobile Phase 0.05M H2SO4
Organic acid standards used in this analysis were lactic, acetic, malic, citric and
succinic acids.

32
3.2.5. Fatty Acid Profile
3.2.5.1. Sample Preparation
For this analysis, oil extraction was done firstly. For this purpose, 5 gram
lyophilized olive was extracted with n-hexane at 180 0C by an automatic Soxhelet
extraction unit (Gerhard Multistat, Germany).
In order to determine the fatty acid profile, fatty acid methyl esters were formed.
European Official Methods of Analysis (EEC, 1991) was performed to prepare methyl
esters. 100 mg oil was weighed into 25 mL centrifuge tubes. The samples were
dissolved in 10 mL n-hexane and saponified to their methyl esters with the addition of
methanolic potassium hydroxide solution (11.2 g in 100 mL methanol). The sample
solution was vortexed for 30 s and centrifuged at 5000 rpm for 15 min. Supernatant was
collected and filtered by 0.45 μ syringe filter into vials and injected to a gas
chromatography (GC) equipment. Each sample was analyzed at least two times with
GC.
3.2.5.2. Analytical Conditions
Chromatographic analyses were performed with an Agilent 6890 GC equipped
with Agilent 7683 auto-sampler and FID detector. The instrumental configuration and
analytical conditions were presented in Table 3.6:

33
Table 3.6. Chromatographic method for the analysis of fatty acid methyl esters
Instrumentation
Chromatographic system Agilent 6890 GC
Inlet Split/splitless
Detector FID
Automatic Sampler Agilent 7683
Column 100 m x 0.25 mm ID, 0.2 μm HP-88
(J&W112-88A7)
Liner Split liner (p/n 5183-4647)
Experimental Conditions of GC-FID
Inlet temperature 250 0C
Injection volume 1μ
Split ratio 1/50
Carrier Gases Helium
Head pressure 2 mL/min constant flow
Oven temperature 175 0C, 10 min, 30C/min, 2200C, 5 min
Detector temperature 280 0C
Detector Gases Hydrogen:40 mL/min;Air:450 mL/min;
Helium make-up gas: 30 mL/min

34
3.2.6. Statistical Analyses
3.2.6.1 .Principal Component Analysis
Use of principal component analysis (PCA) is preferred when measurements
obtained on a number of observed variables and if it is desired to develop a smaller
number of artificial variables (called principal components) that will account for the
most of the variance in the observed variables. The principal components (PCs) may
then be used as predictor or criteria on variables in subsequent analyses (Cattell,1966).
PCA can be defined as a linear combination of optimally-weighted observed
variables. To be able to show the meaning of this definition, firstly it is necessary to
describe how subject scores on a PC are computed. PCA is a powerful tool for reducing
a number of observed variables into a smaller number of artificial variables that account
for most of the variance in the data set. This statistical analysis technique is particularly
useful when a data reduction is needed (Stevens, 2012).
It is often desirable to reduce the dimensionality of large multivariate data sets.
PCA is a good technique to achieve this goal. It replaces the original variables by
smaller number of derived variables, the PCs, which are linear combinations of the
original variables. Often, it is possible to retain most of the variability in the original
variables with a smaller number of PCs. Due to its apparent simplicity, PCA has a
number of distinctions, and it has many uses and extensions (Jolliffe, 2002).
In this study, the multivariate data matrix consists of observations represented by
samples from three different olive types for two harvest years and variables represented
by the results of chemical measurements. The same analysis was also performed for
each harvest year by separating the data into two to observe the differences between
olive types more clearly. Data were auto scaled before multivariate analysis. The
multivariate analyses were performed by SIMCA-P v.11.5 (Umetrics, Umea, Sweden).
Results of PCA were visualized by scores and loading plots. Scores plots were
constructed to observe principal groupings among observations. Loadings indicate the
importances of each variable for the model so loading plots were used to interpret the
relations among variables and clusters observed in the score plots.

35
3.2.6.2. ANOVA
Analysis of variance (ANOVA) is a statistical method to analyze the differences
between group means and their associated procedures.
In this study, ANOVA was used in order to determine the effect of harvest year,
harvest time and variety on pH, aw and total phenol content with triple replicates.
General factorial design was applied by Minitab 16 (USA).
Table 3.7.Factors and their levels for ANOVA
Factors Levels of Factors
Olive Type Hurma Erkence Gemlik
Harvest year 2011/12
season
2012/13
season
Harvest time(weeks) 1 2 3 4 5 6 7 8

36
CHAPTER 4
RESULTS & DISCUSSIONS
4.1. Maturity Index, pH and aw of Olive Varieties
Results of maturity index, pH and aw values for Hurma, Erkence and Gemlik
types of olives during eight weeks of sampling for 2011/12 and 2012/13 harvest years
are provided in Table 4.1. Both in 2011/12 and 2012/13 harvest years olive samples
were obtained from the same trees in the same locations from the end of October till the
beginning of December. This time interval corresponds to the season when the
appearance of Hurma olives allowed us to differentiate them from regular Erkence
olives which did not go through debittering. Maturity index of Hurma ranged from 3.14-
5.34 in the first season while it was between 4.56 and 6.37 in the next year. Erkence had
a range of maturity index of 0.5-3.67 in 2011/12 while the range was 2.16-5.94 in
2012/13. Maturity index of Gemlik varied between 1.1-5.88 in the first harvest year and
2.19-4.16 in the second year.
Maturity index shows the ripening degree of the fruit and overall, maturity
index increased during the sampling weeks. Olive samples were collected from the all
sides of the same designated trees throughout the sampling period; however, not all
olives ripen at the same time. Depending on the position of the trees some sides ripen
earlier than the other. Therefore, maturity index had its ups and downs in some weeks.
Figure 4.1 shows pH values for olive samples throughout sampling period for
two harvest years. pH values of Hurma olives changed between 5.06-5.5 in 2011/12 and
5.6-5.67 in 2012/13 harvest years, respectively. Erkence variety has pH values of 5.12-
5.39 in the first harvest year and 5.08-5.46 in the second harvest year. pH range of
Gemlik cultivar varied between 5.05-5.29 in 2011/12 harvest year and 5.19-5.44 in
2012/13 harvest year.
In general, pH values are higher in 2011/12 harvest year than 2012/13 harvest
year for all olive types. This increase can be associated with total organic acid amount
which was in higher concentrations in the second harvest year.

37
Figure 4.1 shows aw values for olive samples throughout sampling period for
two harvest years. aw values of Hurma olives changed between 0.94-0.98 in 2011/12
and 0.92-0.94 in 2012/13 harvest years, respectively. Erkence variety has 0.92-0.97 aw
values in the first harvest year and 0.94-0.96 in the second harvest year. aw range of
Gemlik cultivar varied between 0.92-0.97 in 2011/12 harvest year and 0.94-0.96 in
2012/13 harvest year.
Figure 4.1.pH values of Hurma, Erkence and Gemlik types of olives during eight weeks
of maturation for two harvest years (Numbers after olive types refer to first
and second harvest year)
Figure 4.2.awvalues of Hurma, Erkence and Gemlik types of olives during eight weeks
of maturation for two harvest years (Numbers after olive types refer to first
and second harvest year)
4
4.5
5
5.5
6
1 2 3 4 5 6 7 8
pH
HURMA1
HURMA2
ERKENCE1
ERKENCE2
GEMLIK1
GEMLIK2
Harvest Time (weeks)
0.8
0.85
0.9
0.95
1
1 2 3 4 5 6 7 8
aw
HURMA1
HURMA2
ERKENCE1
ERKENCE2
GEMLIK1
GEMLIK2
Harvest Time (weeks)

38
Table 4.1.pH, aw and maturity index (MI) values for Hurma, Erkence and Gemlik olives for two harvest year
Olive type pH aw MI
pH aw MI
2011/12
2012/13
H11 5.35±0.03 0.96±0.006 3.9 H21 5.53±0.03 0.94±0.014 5.43
H12 5.27±0.01 0.98±0.001 4.1 H22 5.51±0.04 0.93±0.003 4.56
H13 5.45±0.15 0.97±0.004 5.34 H23 5.6±0.01 0.94±0.003 5.92
H14 5.36±0.17 0.96±0.002 4.95 H24 5.67±0.01 0.94±0.002 5.6
H15 5.50±0.01 0.95±0.005 3.74 H25 5.54±0.02 0.93±0.01 6.18
H16 5.27±0.02 0.94±0.014 4.37 H26 5.48±0.005 0.93±0.006 5.42
H17 5.06±0.03 0.95±0.007 3.99 H27 5.54±0.011 0.92±0.012 6.37
H18 5.07±0.04 0.94±0.01 3.94 H28 5.56±0.02 0.92±0.004 6
E11 5.32±0.01 0.95±0.004 0.5 E21 5.08±0.01 0.95±0.002 2.53
E12 5.19±0.02 0.97±0.004 1.27 E22 5.17±0.005 0.94±0.006 2.16
E13 5.39±0.04 0.97±0.003 2.25 E23 5.27±0 0.95±0.017 2.34
E14 5.35±0.02 0.96±0.008 1.65 E24 5.2±0.02 0.95±0.004 2.53
E15 5.27±0.03 0.95±0.009 1.69 E25 5.1±0.01 0.96±0.011 3.17
E16 5.19±0.03 0.93±0.007 3.65 E26 5.21±0.02 0.95±0.016 3.18
E17 5.16±0.005 0.94±0.01 3.56 E27 5.29±0.01 0.95±0.012 3.49
E18 5.12±0.002 0.92±0.07 3.67 E28 5.46±0.07 0.95±0.011 5.94
G12 5.2±0.03 0.96±0.002 1.1 G21 5.38±0.01 0.96±0.002 2.42
G13 5.29±0.02 0.97±0.003 1.38 G22 5.34±0.04 0.94±0.003 2.19
G14 5.13±0.01 0.97±0.011 2.41 G23 5.23±0.01 0.95±0.008 3.32
G15 5.11±0.01 0.96±0.003 2.1 G24 5.37±0.03 0.96±0.016 3.09
G16 5.05±0.005 0.94±0.007 3.65 G25 5.35±0.03 0.96±0.005 3.92
G17 5.11±0.01 0.94±0.016 4.82 G26 5.44±0.005 0.95±0.004 4.6
G18 5.12±0.01 0.92±0.006 5.88 G27 5.19±0.015 0.94±0.01 4.26
G28 5.2±0.015 0.94±0.006 3.84
38
*first number after olive type represents the harvest time (1st week, second week etc.) and second number shows the harvest years

39
In order to investigate the effect of olive variety, harvest time and year on pH
and aw statistically General Factorial Design by ANOVA was used. Factors are harvest
year (2011/12 and 2012/13), variety (Hurma, Erkence, Gemlik) and time (8 weeks of
maturation period) and responses are pH and aw with triple replicates.
Table 4.2. ANOVA table for pH
Source DF Seq SS Adj SS Adj MS F P
Variety 2 1.105276 1.105276 0.552683 304.55 0.00
Harvest Year 1 0.592900 0.592900 0.592900 326.74 0.00
Time 7 0.286100 0.286100 0.040871 22.52 0.00
Variety*harvest year 2 0.545113 0.545113 0.272556 150.20 0.00
Variety*time 14 0.275512 0.275512 0.019679 10.85 0.00
Harvest year*time 7 0.356889 0.019679 0.050984 28.10 0.00
Variety*harvest year*time 14 0.479165 0.050984 0.034226 18.86 0.00
Error 96 0.174200 0.034226 0.001815
Total 143 3.815156 0.001815
According to ANOVA (Table 4.2), all factors and their interactions are
significant for the pH model because p values are less than 10-3
and model R2
and
adjusted R2
values are 95.43% and 93.20%, respectively. It means pH values of olives
fruit change significantly with respect to year, variety and time. Normal probability and
residual plots of the model are provided in Figure 4.3 and Figure 4.4, respectively.
These plots show that there is no problem regarding the normality and there are no
outliers among the data. Since the model and all parameters are significant it can be
concluded that olive variety, harvest time and season as well as their interactions
influence the pH.

40
0,20,10,0-0,1-0,2
99,9
99
95
90
80
70
605040
30
20
10
5
1
0,1
Residual
Pe
rce
nt
Figure 4.3. Normal probability plot of pH
5,75,65,55,45,35,25,15,0
0,2
0,1
0,0
-0,1
-0,2
Fitted Value
Re
sid
ua
l
Figure 4.4.Residual plot of pH

41
Table 4.3 ANOVA table of aw
Source DF Seq SS Adj SS Adj MS F P
Variety 2 0.0016822 0.0016822 0.0008411 11.57 0.00
Harvest Year 1 0.0053900 0.0053900 0.0053900 74.14 0.00
Time 7 0.0101355 0,0101355 0.0014479 19.92 0.00
Variety*harvest year 2 0.0037776 0,0037776 0.0018888 25.98 0.00
Variety*time 14 0.0020619 0.0020619 0.0001473 2.03 0.00
Harvest year*time 7 0.0059718 0.0059718 0.0008531 11.73 0.00
Variety*harvest year*time 14 0.0015507 0.0015507 0.0001108 1.52 0.117
Error 96 0.0069793 0.0069793 0.0000727
total 143 0.037492
ANOVA results for test the effect of olive variety, harvest time and season on aw
values are listed in Table 4.3 and normal probability and Residual plots are shown in
Figure 4.5-4.6. As it can be seen from the ANOVA table (Table 4.3) all factors and their
interactions are significant except variety*harvest year*time interaction since p value is
greater than 0.05, R2 value is 91.70% and R
2 (adj) equals to 87.63%. Therefore, aw is
also affected by the olive variety, harvest time and year.
0,020,010,00-0,01-0,02
99,9
99
95
90
80
70
605040
30
20
10
5
1
0,1
Residual
Pe
rce
nt
Figure 4.5. Normal probability plot of aw

42
0,980,970,960,950,940,930,92
0,02
0,01
0,00
-0,01
-0,02
Fitted Value
Re
sid
ua
l
Figure 4.6.Residual plot of aw
4.2. Sugar Composition of Olive Varieties
Glucose, fructose, sucrose, mannose and mannitol are the sugars that are
detected in Hurma, Erkence and Gemlik varieties. Concentrations of these sugars for
different varieties with respect to harvest time and year are listed in Table 4.4.
For the first harvest year, glucose and mannitol were detected as the dominant
sugars as in sweet Dhokar olives (Jemai, Bouaziz et al. 2009). Sucrose disappeared after
the second week of sampling in Hurma olive. At the same time, fructose and glucose
concentrations increased implying a conversion of sucrose to these sugars. For all olive
types, there is an increase in the amounts of all sugars for the last three weeks of
ripening except mannitol. Mannitol was not detected after 5th
week of maturation for all
olive types.
The highest concentration of glucose was mostly detected in Hurma type and it
varied between 21,256-296,787.05 mg/kg dw in the first harvest year. While in Erkence
glucose concentration changed between the ranges of 30,700-163,449.44 mg/kg dw, in
Gemlik type it was between 39160-88883.15 mg/kg dw. For Dhokar variety, glucose
was determined as the main sugar with concentrations of 40,830 mg/kg fw followed by
fructose (45,170 mg/kg fw). These sugars were in higher concentrations compared to a
regular olive variety grown in the same region (Rigane et al., 2011).

43
The lowest concentrations of mannitol in the first harvest year were detected in
Gemlik type and its range is between 7,360-30,500 mg/kg dw. Erkence type had the
highest concentrations of mannitol and it changed between 4,386.3-18,971.63 mg/kg
dw. While in Dhokar olives mannitol reaches to 79,800 mg/kg at the end of ripening in
Hurma its level is 11,681.49 mg/kg and does not show any linear increasing trend as
opposed to Dhokar (Jemai et al., 2009).
In contrast to the first harvest year, sucrose was detected throughout the ripening
period and mannitol didn‟t disappear after 5th
week of maturation in the second year.
Olives have higher concentrations of mannose than the first harvest year.
The highest concentration of glucose in the second year was in Erkence type,
and it varied between 13,218.97-53,439.29 mg/kg dw. Similar to glucose, the highest
concentrations of fructose were found between the ranges of 11,075.2-50,872.33 mg/kg
dw in Erkence type. Gemlik type had the lowest amounts of mannitol (3,587.83-
11,853.94 mg/kg dw) as in the first harvest year.
The total sugar content of olive varieties investigated in this study is shown
graphically in Figure 4.7. The total sugar content in the first season increased
significantly in the last three weeks of harvesting. Other than that there is no significant
trend regarding the total sugar content. There are increases and decreases throughout the
sampling period. These changes are associated with the continuous synthesis of sugar
during the ripening period and its use in the fatty acid biosynthesis (Menz and
Vriesekoop 2010).Although some studies reported a decrease in total sugar content
during ripening (Menz and Vriesekoop, 2010 ; Nergiz and Engez, 2000; Ergönül and
Nergiz, 2010) an increase in reducing sugar content was observed for Chemlali and
Dhokar varieties in another study (Jemai et al., 2009).

44
Figure 4.7. Total sugar content of Hurma, Erkence and Gemlik olives for both harvest
years (Numbers after olive types refer to first and second harvest year)
In order to investigate the relation between sugar profile and the parameters of
olive variety, harvest time and year statistically, principal component analysis (PCA)
was applied. PCA was run for the sugar data of each year separately and also two
harvest years in the same data matrix.
0
50000
100000
150000
200000
250000
300000
350000
1 2 3 4 5 6 7 8
Tota
l S
ugar
(mg/k
g d
wt)
HURMA1
HURMA2
ERKENCE1
ERKENCE2
GEMLIK1
GEMLIK2
Harvest Time (weeks)

45
Table 4.4. Sugar Concentrations (mg/kg dw) of olive varieties for the two harvest years
2011/12
OLIVE
TYPE GLUCOSE FRUCTOSE SUCROSE MANNOSE MANNITOL TOTAL
2012/13
OLIVE
TYPE GLUCOSE FRUCTOSE SUCROSE MANNOSE MANNITOL TOTAL
H11 21256 nd 3371.2 nd 4227.2 28854.4 H21 8009.5 11036.1 5631.4 4997.8 8556.3 38231.2
H12 20546.1 nd 2156.9 1291.7 2942.6 26937.4 H22 18828.3 7047.2 5709.6 3361.8 3534.6 38481.7
H13 21859.1 1785.3 nd 1124.6 5770.7 30539.7 H23 23122.9 13137.2 4955.6 4411.9 14748.4 60376.5
H14 46305.5 5780.1 nd 5000.2 11681.4 68767.3 H24 12879 9475.9 5426.9 3598.3 9259.4 40639.8
H15 14399.7 2003.7 nd nd 4564.4 20967.8 H25 13378.5 7569.4 3223.6 nd 8083.4 32255
H16 296787 1723.7 nd nd nd 298510.8 H26 20619 14885.5 6177.3 2587.4 10851.1 55120.4
H17 197919.6 nd nd nd nd 197919.6 H27 14663.8 15827.6 5409.9 2333.7 10934.9 49170.1
H18 118058.6 4180.3 nd nd nd 122238.9 H28 11677.4 9690 3861.6 3682.4 7348.5 36260.1
E11 19364.4 nd 4284.4 5026.7 4386.3 33061.8 E21 13457.7 24904.3 9172.2 6530.9 9817.1 63882.5
E12 26777.4 5385.4 4573.1 2838.8 18971.6 58546.3 E22 53439.2 33284.2 8037.5 21459 22882.4 139102.5
E13 30700 5780.1 5070 1729.6 7970 51249.7 E23 33454 15464.9 16040 1278 14962.4 81199.5
E14 42440 3220 4580 2700 10990 63930 E24 13218.9 50872.3 16287.2 nd 22627.9 103006.4
E15 41400 5960 14110 5590 14110 81170 E25 23352.1 15889.8 3541.4 23714 3541.4 70038.9
E16 135115.6 7148.5 26978.6 nd nd 169242.7 E26 38161.4 31263.9 5542.1 2847.7 17594.4 95409.7
E17 163449.4 7743.52 32613.5 15953.9 nd 219760.4 E27 21440.4 11363.6 7001.1 2099.7 6545.7 51450.6
E18 153751.4 12382.1 50059.9 14654.3 nd 230847.8 E28 19500.6 11075.2 4390.9 2797.7 7680.7 45445.2
G12 35620 5740 4950 nd 8740 55050 G21 13163.6 13858.9 8365.7 nd 6058.6 43446.9
G13 39160 4351 4580 1321.8 7360 56772.8 G22 18368.6 16477.9 6061.7 6711.7 4778.4 52368.5
G14 33333.8 4530 2720 4770 9700 55053.8 G23 29216.1 16478.1 23581.6 14742 9737.2 93755.2
G15 40160 6890 nd nd 9110 49270 G24 30741.3 19786 6616.7 nd 11853.9 68998.1
G16 88883.1 15346.7 9313.7 8483 nd 122026.6 G25 8933 14465.7 4693 1970.8 4103.9 34166.5
G17 33807.8 nd 5768 nd nd 39575.9 G26 8628.5 5946.4 3575.7 2714.3 4274.3 25139.4
G18 73598.3 5624 21733.5 12260.7 nd 113216.6 G27 4701.8 6109.9 3379.2 1467.7 3587.8 19246.5
G28 11118.7 12205.6 2383 1643 4609.4 31959.9
45
*first number after olive type represents the harvest time (1st week, second week etc.) and second number shows the harvest year,nd: not detected

46
Figure 4.8.Score plot obtained with PCA for sugar concentrations of Hurma, Erkence
and Gemlik types of olives during 8 weeks of maturation for the first harvest
year(H: Hurma, E: Erkence, G:Gemlik, first number after the letter is the
harvest year and second number is the harvest week)
Figure.4.9.Loading plot for sugar concentrations of Hurma, Erkence and Gemlik types
of olives during 8 weeks of maturation for the first harvest year
PCA model for the data containing the first harvest year is made from 2
components and R2
value is 0.782 for this model. According to the score plot of the first
harvest year (Figure 4.8), first five weeks‟ samples are clustered together and there is no
differentiation with respect to olive type. However, Hurma olives of the last three weeks
are placed in the left down quartile of the plot, Gemlik olives of the same period are in
-3
-2
-1
0
1
2
3
-4 -3 -2 -1 0 1 2 3 4 5
PC
2
PC1
Ellipse: Hotelling T2 (0.95)
E1
G1
H1
E11
E12
E13E14
E15
E16
E17
E18G12G13
G14G15 G16
G17
G18
H11H12
H13
H14
H15
H16
H17
H18
SIMCA-P 10.5 - 7/9/2013 1:32:07 PM
-0,60
-0,50
-0,40
-0,30
-0,20
-0,10
0,00
0,10
0,20
0,30
0,40
0,50
0,60
0,70
-0,30 -0,20 -0,10 0,00 0,10 0,20 0,30 0,40 0,50 0,60
p[2
]
p[1]
GLU
FRUC
SUC
MANO
MANI
SIMCA-P 10.5 - 21.05.2013 00:29:17

47
the left upper part of the plot. Erkence samples of the last weeks are situated more
closely to Gemlik and separated well from Hurma olives. Loading plot (Figure 4.9)
indicates that mannitol is the sugar that separates the first five weeks‟ samples from the
rest since it was not detected after the first five weeks. Glucose is the differentiating
sugar for Hurma having the highest concentration of this sugar at 6th
week according to
loading plot. On the other hand, fructose, mannose and sucrose concentrations are
identified as the parameters separating Erkence and Gemlik from Hurma in the last
three weeks.
Figure 4.10. Score plot obtained with PCA for sugar concentrations of Hurma, Erkence
and Gemlik types of olives during 8 weeks of maturation for the second
harvest year (H:Hurma, E: Erkence, G:Gemlik, first number after the letter
is the harvest year and second number is the harvest week)
R2 value of the PCA model for the second harvest year is 0.977 and 4
components are used for constructing the model. As the score plot shows (Figure 4.10)
there is not a significant discrimination in terms of sugar concentration among varieties
in the second harvest year.
-3
-2
-1
0
1
2
3
-4 -3 -2 -1 0 1 2 3 4
PC
2
PC1
Ellipse: Hotelling T2 (0.95)
E2
G2
H2
E21
E22
E23
E24
E25
E26
E27E28
G21
G22
G23
G24G25
G26G27 G28 H21
H22H23
H24H25 H26
H27
H28
SIMCA-P 10.5 - 7/9/2013 1:33:53 PM

48
Figure 4.11.Score plot obtained with PCA for sugar concentrations of Hurma, Erkence
and Gemlik types of olives during 8 weeks of maturation for both harvest
years(H: Hurma, E: Erkence, G:Gemlik, first number after the letter is the
harvest year and second number is the harvest week)
Figure.4.12.Loading plot for sugar concentrations of Hurma, Erkence and Gemlik types
of olives during 8 weeks of maturation for both harvest years
PCA model for the data containing two harvest years is made from 2 PCs and R2
value of this model is 0.716.Score plot for this model shows that in terms of sugar
composition of olive samples there is a difference between harvest years although some
-3
-2
-1
0
1
2
3
4
5
-4 -3 -2 -1 0 1 2 3
PC
2
PC1
Ellipse: Hotelling T2 (0.95)
1
2
H12H13
H14
H15
H16
H17H18E11E12 E13E14
E15
E16
E17
E18
G12G13G14
G15
G16
G17
G18
H21H22H23 H24
H25
H26H27 H28
E21
E22
E23
E24
E25
E26
E27E28G21
G22
G23
G24 G25G26G27G28
SIMCA-P 10.5 - 7/9/2013 1:30:05 PM
-0,10
0,00
0,10
0,20
0,30
0,40
0,50
0,60
0,70
-0,60 -0,50 -0,40 -0,30 -0,20 -0,10 0,00 0,10 0,20 0,30 0,40
p[2
]
p[1]
GLU
FRUC
SUC
MANO
MANI
SIMCA-P 10.5 - 21.05.2013 00:40:30

49
samples are not placed in their category (Figure 4.11). While the first year samples are
mostly placed in the right part of the plot, second year samples are in the left part of it.
According to loading plot (Figure 4.12) sucrose and glucose are the sugars that cause
differentiation of the first year from the second year. Sucrose has lower concentration in
the first year samples and mannitol, fructose and mannose which are the differentiating
parameters in the second year have more regular distribution throughout sampling
period compared to the first year.
As a result, it can be concluded that sugar profile do not provide much
differentiation among olive varieties while the effect of harvest year is identified as an
important factor in the determination of sugar concentrations of olive varieties
investigated in this study.
4.3. Organic Acid Composition of Olive Varieties
Organic acid composition of Hurma, Erkence and Gemlik olive types during
eight weeks of maturation in 2011/12 and 2012/13 harvest years is provided in Table
4.5. For both harvest years, dominant organic acid was citric acid for all olive types.
Citric acid was detected for all olive samples during whole maturation period. In
addition, malic and succinic acids were also found in olive samples. Lactic acid was
only detected in the last weeks of the second harvest year for Gemlik olives.
Higher concentrations of citric acid were measured in Gemlik type between the
ranges of 6,907-16,412 mg/kg dw in the first harvest year. According to a study about
Turkish olives, malic acid was determined as the dominant organic acid with high
concentrations (Ergönül and Nergiz, 2010) while another study reported citric acid as
the main organic acid followed by succinic acid in olives grown in several locations of
Turkey (Arslan and Özcan, 2011) Although malic acid couldn‟t be detected until 6th
week of maturation in Hurma, after that it increased and reached the highest
concentration (6,390.7 mg/kg dwt) at the last week of the first year. Succinic acid was
not detected after 5th
week in Hurma olive. The highest amounts of succinic acid were
detected in Erkence as 47,636 mg/kg dw. In Domat and Memecik olives succinic acid
was detected at lower concentrations of 539-614 mg/100 g (Ergönül and Nergiz, 2010).
Acetic acid was detected only in Hurma samples; however, it disappeared after the 5th
week of ripening.

50
Figure 4.13.Total organic acid content of Hurma, Erkence, Gemlik olives for both
harvest years (Numbers after olive types refer to first and second harvest
year)
In the second harvest year, almost all organic acid concentrations were higher
than the first year. Similar to the first year, Gemlik had the highest amounts of citric
acid between the ranges of 26,055.9-86,098.7 mg/kg dwt. Citric acid was detected for
all varieties in higher concentrations than other Turkish olives (Ergönül and Nergiz
2010). Citric acid was between the ranges of 1,024 and 702-mg/100g dw in Memecik
and Domat, respectively (Ergönül and Nergiz, 2010). Contrary to the first year, malic
acid existed for all olive types during maturation and it was found in higher amounts in
Erkence type (4,583.79-12,935.2 mg/kg dw).Succinic acid was not found in Erkence for
the second year. In addition to this, it disappeared from Hurma after 5th
week as in the
first harvest year.
In order to investigate the organic acid results with respect to olive variety,
harvest time and year statistically, PCA analysis was used.
0
20000
40000
60000
80000
100000
120000
1 2 3 4 5 6 7 8
Tota
l org
an
ic a
cid
(m
g/k
g d
wt)
HURMA1
HURMA2
ERKENCE1
ERKENCE2
GEMLIK1
GEMLIK2
Harvest Time (weeks)

51
Table 4.5. Organic concentrations (mg/kg dwt) of olive varieties for two harvest years
2011/12
Olive
type CITRIC MALIC SUCCINIC LACTIC ACETIC TOTAL
2012/13
Olive
type CITRIC MALIC SUCCINIC LACTIC ACETIC TOTAL
H11 11546.2 nd 3644.1 690.6 743.7 16624.6 H21 34306.5 9651.3 1873 nd nd 45830.9
H12 13402 nd 103.4 nd 39.3 13544.8 H22 32140 7702.1 2223.1 nd nd 42065.2
H13 9859.4 nd 288.3 nd 59.4 10207.2 H23 46080.7 9644.5 2780 nd nd 585053.2
H14 1170.4 nd 403.6 nd nd 1574 H24 52511.7 5168.4 837.6 1989.4 2171.4 62678.6
H15 1134.8 nd 148.8 nd 462.6 1329.9 H25 27357.3 3549.5 1030.8 1850.7 1952.7 35741.1
H16 7087.4 2655.4 nd nd nd 9742.8 H26 27252.1 5088.2 nd nd nd 32340.4
H17 13145.2 6055.1 nd nd nd 19200.3 H27 41919.8 11129.5 nd nd nd 53049.3
H18 1343.9 6390.7 nd nd nd 7734.6 H28 23880.6 5519.2 373.7 nd nd 29773.6
E11 8113.6 9701.5 nd nd nd 17815.1 E21 38514.9 12935.2 nd nd nd 51450.1
E12 9715.7 7778.3 nd nd nd 17494.1 E22 34925.3 10146.7 nd nd nd 45072
E13 8644.4 nd 1300.4 nd nd 9944.9 E23 62574.9 9191.8 nd nd nd 71766.8
E14 10036 nd 1612.1 nd nd 11648.2 E24 58357.9 9424.4 nd nd nd 67782.3
E15 11872.4 nd 47636.7 nd nd 59509.2 E25 30521.5 4583.7 nd nd nd 35105.3
E16 12240.1 11077.6 nd nd nd 23317.7 E26 36880.2 7183.5 nd nd nd 44063.7
E17 10932.4 15701.1 nd nd nd 26633.6 E27 33711.4 33711.4 nd nd nd 67422.8
E18 13185.9 16432.8 nd nd nd 29618.8 E28 39251.7 4666.8 nd nd nd 43918.6
G12 7071.6 15594.1 nd nd nd 22665.6 G21 39145.1 6669.5 nd nd nd 45814.6
G13 12143.4 8996.2 nd nd nd 21139.6 G22 26055.8 8243.2 nd nd nd 34299.1
G14 10091.8 nd 2663.6 nd nd 12755.4 G23 73957.7 10667.3 nd 1931.4 nd 84625.1
G15 15489 nd 3541.3 nd nd 19030.3 G24 86098.6 9515.3 nd 1392.2 nd 97006.2
G16 9294.5 15279.3 nd nd nd 24573.9 G25 47637 7500.6 nd 1020.2 nd 56157.9
G17 1387.6 9938.1 nd nd nd 11325.7 G26 58393.2 6454.433 1424.2 2234.4 2526.6 71033
G18 16412.8 12338.8 nd nd nd 28751.7 G27 33768.1 5164803 1548.9 1182.5 nd 41664.4
G28 64755 4366.9 1837 nd nd 70958.9
51
*first number after olive type represents the harvest time (1st week, second week etc.) and second number shows the harvest year,nd: not detected

52
Figure 4.14.Score plot obtained with PCA for organic acid concentrations of Hurma,
Erkence and Gemlik types of olives during 8 weeks of maturation for the
first harvest year (H: Hurma, E: Erkence, G:Gemlik, first number after the
letter is the harvest year and second number is the harvest week)
PCA model constructed with organic acid data of the first harvest year consists
of 4 components with R2 of 0.999. As it is shown in the score plot (Figure 4.14), for the
first harvest year there was no discrimination between olive varieties in terms of organic
acids. This means that organic acid profile is not a good parameter to characterize olive
varieties for the first harvest year.
-3
-2
-1
0
1
2
3
4
-4 -3 -2 -1 0 1 2 3 4 5 6
t[2]
t[1]
Ellipse: Hotelling T2 (0,95)
E1
G1
H1
E11E12
E13E14
E15
E16
E17E18G12
G13
G14G15
G16
G17G18
H11
H12H13H14H15H16H17
H18
SIMCA-P 10.5 - 06.05.2013 13:23:49

53
Figure 4.15.Score plot obtained with PCA for organic acid concentrations of Hurma,
Erkence and Gemlik types of olives during 8 weeks of maturation for the
second harvest year(H: Hurma, E: Erkence, G:Gemlik, first number after the
letter is the harvest year and second number is the harvest week)
PCA model created with the second year organic acid profiles of three olive
varieties for eight weeks of maturation has 4 components and R2 of 0.996. According to
the score plot (Figure 4.15), there is not much differentiation regarding the olive
varieties as in the first year.
Finally, data for both harvest years were combined and PCA was performed to
see the effect of harvest year. PCA model has R2of 0.966 and 4 components. As it is
shown in the score plot (Figure 4.16) there is a good separation between harvest years in
terms of organic acids. Most of the first harvest year samples are located on the left side
of the plot. First year samples are more closely clustered while there is more spread out
in the second year samples. Another study also reported the significant effect of harvest
year on organic acid concentrations of Turkish olives (Arslan and Özcan,
2011).According to loading plot malic and succinic acid concentrations are the
differentiating parameters for the first year. Malic acid exists throughout maturation
period in the second year while in the first year it exists on and off form depending on
the variety. As a result, although organic acid profile of investigated olive varieties do
not provide separation with regard to variety organic acid is an important parameter that
cause differentiation between harvest years.
-3
-2
-1
0
1
2
3
-4 -3 -2 -1 0 1 2 3 4
t[2]
t[1]
Ellipse: Hotelling T2 (0,95)
E2
G2
H2
E21
E22
E23E24
E25
E26
E27
E28G21
G22
G23
G24
G25
G26
G27
G28
H21
H22
H23
H24
H25
H26
H27
H28
SIMCA-P 10.5 - 20.05.2013 23:13:38

54
Figure 4.16.Score plot obtained with PCA for organic acid concentrations of Hurma,
Erkence and Gemlik types of olives during 8 weeks of maturation for both
harvest years (H: Hurma, E: Erkence, G:Gemlik, first number after the letter
is the harvest year and second number is the harvest week)
Figure 4.17.Loading plot obtained with PCA for organic acid concentrations of Hurma,
Erkence and Gemlik types of olives during 8 weeks of maturation for both
harvest years
-5
-4
-3
-2
-1
0
1
2
3
-4 -3 -2 -1 0 1 2 3 4 5
PC
2
PC1
Ellipse: Hotelling T2 (0.95)
1
2
H11
H12H13H14H15H16
H17H18
E11E12
E13E14
E15
E16
E17E18
G11
G12
G13
G14G15
G16
G17
G18H21H22
H23
H24
H25
H26
H27
H28
E21E22
E23E24
E25E26
E27
E28G21G22
G23G24
G25
G26
G27
G28
SIMCA-P 10.5 - 7/9/2013 1:36:21 PM
-0,60
-0,50
-0,40
-0,30
-0,20
-0,10
0,00
0,10
0,20
0,30
0,40
0,50
0,60
0,70
-0,10 0,00 0,10 0,20 0,30 0,40 0,50 0,60
p[2
]
p[1]
CITRIC
L-MALIC
SUCCINIC
LACTIC
ACETIC
SIMCA-P 10.5 - 06.05.2013 13:54:45

55
4.4. Total Phenol Content of Olive Varieties
The total phenol contents of all three types of olives are listed in Table 4.6. TPC
of Erkence variety changed between 504.7-1,230.4 mg GAE/100g in 2011/12 and
335.9-664.8 mg GAE/100g in 2012/13 harvest years, respectively. Hurma had 337.7-
649.6 mg GAE/100g in the first and 29.2-468.2 mg GAE/100g in the second harvest
years while TPC of Gemlik varied between 416.8-701.9 mg GAE/100g in the first and
103.2-452.4 mg GAE/100g in the second year. In general, Erkence variety had the
highest TPC in both harvest years while Hurma type, although from the same variety,
had lower phenol content. This difference between these two types of olives might be
resulted from debittering stage which Hurma goes through. Dhokar, Tunisian sweet
olive variety, (Jemai et al., 2009) also had lower TPC (508-768 mg GAE/100g dw)
when compared to another olive variety, Chemlali (698-1300 mg GAE 100g-1
dw) and
researchers also attributed the lower TPC of this variety to its sweet character. (Bouaziz
et al., 2004)
During the ripening period TPC of all olive types have ups and downs. Mostly,
there is a decreasing trend after 2nd
week until 5th
week and an increase in TPC follows
this decreasing phase. This trend of increase and decrease was also observed in other
studies (Morello et al., 2004).
In the second harvest year (2012/13), all three olive types had lower TPC
compared to the first harvest year (2011/2012). Change in the phenol content depending
on the harvest year is expected and well-documented for olive oil in the literature.
However, TPC for different types has similar trend in both years; Erkence having the
highest and Hurma having the lowest average TPC content. ANOVA was used to show
the significant differences among TPC values. The p-values were found to be less than
10-3
.
Table 4.6.ANOVA table for total phenol content
Source DF Seq SS Adj SS Adj MS F P
Variety 2 1412364 1412364 706182 102.43 0.00
Harvest Year 1 2802655 2802655 2802655 406.50 0.00
Time 7 684942 684942 97849 14.19 0.00
Variety*harvest year 2 116157 116157 58079 8.42 0.00
Variety*time 14 690419 690419 49316 7.15 0.00
Harvest year*time 7 918877 918877 131268 19.04 0.00
Variety*harvest year*time 14 685990 685990 48999 7.11 0,00
Error 96 661878 661878 6895
Total 143 7973283

56
ANOVA results obtained to test the effect of olive variety, harvest time and
season on TPC values are listed in Table 4.6 and normal probability and residual plots
are shown in Figure 4.17-4.18. As it can be seen from the ANOVA table (Table 4.6) all
factors and their interactions are significant and model R2 value is 91.70% and R
2 (adj)
equals to 87.63%. Therefore, total phenol content is affected by the olive variety,
harvest time and year.
4003002001000-100-200
99,9
99
95
90
80
70
605040
30
20
10
5
1
0,1
Residual
Pe
rce
nt
Figure 4.18. Normal probability plot of total phenol content
1400120010008006004002000
400
300
200
100
0
-100
-200
Fitted Value
Re
sid
ua
l
Figure 4.19.Residual plot of total phenol content

57
4.5. Phenol Profile Results of Olive Varieties
Chromatograms of phenolic profiles of Hurma, Erkence and Gemlik olive types
are provided in Figure 20.1,2 and 3 and Table 4.7 and 4.8 show the concentration of
individual phenolics.
Figure 4.20.1. HPLC chromatogram of phenolics of Hurma belonging to the first week
of the first harvest year (1-hydroxytyrosol, 2-tyrosol, 3-ISTD (p-hydroxy
acetic acid), 4-apigenin, 5-vanilic acid, 6-p-coumaric acid, 7-
verbascoside, 8-L-7-glucoside,9-rutin,10-o-coumaric acid, 11-oleuropein,
12-quercetin, 13-luteolin)
Figure 4.20.2. HPLC chromatogram of phenolics of Erkence belonging to the first week
of the first harvest year (1-hydroxytyrosol, 2-tyrosol, 3-ISTD (p-hydroxy
acetic acid), 4-apigenin, 5-vanilic acid, 6-caffeic acid, 7- p-coumaric
acid, 8-verbascoside, 9-rutin,10-o-coumaric acid, 11-oleuropein, 12-
quercetin, 13-luteolin)

58
Figure 4.20.3. HPLC chromatogram of phenolics of Gemlik belonging to the first week
of the first harvest year (1-hydroxytyrosol, 2-tyrosol, 3-ISTD (p-hydroxy
acetic acid), 4-apigenin, 5-vanilic acid, 6-ferulic acid, 7-verbascoside,
8-rutin, 9-o- coumaric acid,10-oleuropein)
As it can be seen from the Table 4.7 quercetin-3-glucoside is the only phenol
which was detected in the first harvest year in all olive types but not in the second year.
In addition, while luteolin was observed in the first year in Hurma and Gemlik samples,
this phenolic was not measured in Hurma and Gemlik had it only on the first three
weeks of the second harvest year. To see the differences between varieties, harvest time
and harvest year a multivariate classification technique, PCA, was applied to the data
and both TPC and individual phenols were used in the data matrix. Although R2 values
of the models obtained are not very high PCA plots are still helpful in visualizing the
differences regarding the olive type, harvest season and year. Without this multivariate
analysis it would be hard to draw conclusions considering all phenolic compounds and
TPC at the same time.
For the whole data, a model with 2 principal components and R2 of 0.48 was
obtained and score plot for this model showing the classification of olive types is
provided in Figure 4.21. According to this plot, a differentiation could be observed
between the first and the second harvest year olives (except first season Hurma at 5th
weeks of maturation). First five week samples from all types of 2011/12 harvest year
are more closely positioned to 2012/13 harvest year samples. The later weeks (6th, 7th
and 8th weeks) of the first harvest year are totally separated from the rest of the samples
and are on the right side of the plot. Overall, all phenolic compounds except vanillic
acid exist in higher amounts for the samples harvested in the 2011/12 season. Therefore,
they are located on the right side of the loading plot (Figure 4.22) like the first year
olives since they are the differentiating parameters for the first year olives.

59
Table 4.7.MI, TPC (mg 100 g-1
) and concentration of individual phenolic compounds (mg kg-1
) of Hurma, Erkence and Gemlik olive types during eight weeks
of maturation for the first harvest season
Olive
type† MI†† TPC††† OLE HYT TY API VER RTN
L-7-
Glu LTLN QUE o-cou p-cou FA VA CA VN
H11 3.90 560.40 527.63 2013.44 17.49 10264.62 517.20 9.571 709.97 36.36 18.6 61.41 0.59 nd 2.16 2.4 0.79
H12 4.10 649.64 786.15 2722.70 36.90 1022.18 66.37 12.99 84.071 34.20 23.2 118.9 0.70 0.56 3.01 2.37 1.61
H13 5.34 523.26 1166.89 1424.46 18.68 297.04 54.05 10.03 128.85 nd 35.12 122.78 1.05 nd 2.06 3.87 nd
H14 4.95 412.68 87.701 3357.91 11.56 1727.42 81.92 nd 123.80 4.98 nd 126.61 nd 0.81 3.03 nd 1.88
H15 3.74 337.68 nd 827.59 nd 377.30 57.20 nd 7.49 nd nd nd 5.09 nd 3.49 4.44 nd
H16 4.37 533.97 103.71 1602.36 52.51 15502.65 519.73 9.56 189.07 72.98 35.96 16.09 1.99 231.72 5.74 1.65 4.57
H17 3.99 579.68 753.07 4104.61 73.10 8003.25 1995.76 21.21 334.76 nd 50.40 23.34 3.86 282.28 10.72 2.14 4.27
H18 3.94 644.63 241.91 3239.12 32.53 5561.70 391.08 24.88 532.48 nd 47.51 47.82 3.08 nd 9.41 nd 2.29
E11 0.50 518.43 1388.21 1001.16 14.94 3993.86 258.75 12.23 167.92 69.50 26.18 103.98 nd nd nd 2.98 nd
E12 1.27 518.02 1265.98 1627.43 24.19 1270.94 31.024 13.75 141.59 98.41 27.66 170.52 1.45 nd 4.93 3.03 nd
E13 2.25 526.22 625.70 2222.26 30.42 1391.48 39.24 59.50 63.43 nd 33.73 12.51 nd nd 11.52 2.85 nd
E14 1.65 520.95 137.99 497.86 0.94 990.58 14.52 nd 22.13 109.30 17.56 nd nd nd 3.43 1.48 nd
E15 1.69 504.69 470.90 471.66 11.03 1673.20 40.32 13.13 56.83 95.02 12.54 30.48 2.91 nd 3.63 2.11 nd
E16 3.65 900.69 329.34 2011.45 29.03 15454.53 312.87 14.99 1387.22 168.42 37.88 74.07 1.9 nd nd 1.41 2.07
E17 3.56 691.32 608.61 1281.41 19.14 9804.94 566.54 29.23 1833.21 351.19 95.63 143.82 2.3 nd 2.61 2.7 2.17
E18 3.67 1230.4 705.14 876.30 12.36 4443.14 424.94 29.53 2207.42 252.29 63.11 203.62 2.85 nd 1.5 2.12 1.74
G12 1.10 544.61 4786.76 3070.73 nd 4788.42 594.30 nd 78.70 nd nd 135.07 nd nd nd nd nd
G13 1.38 452.33 2057.32 5399.42 nd 2030.05 700.34 56.84 239.38 154.24 nd 111.69 nd 4.33 nd nd nd
G14 2.41 637.10 294.53 6596.22 nd 1835.13 66.63 24.77 133.99 171.68 nd 107.23 nd 5.63 7.95 nd 11.5
G15 2.10 416.78 nd 2277.51 nd 2704.81 35.45 0.16 85.43 167.16 nd 31.67 1.19 0.87 5.14 nd nd
G16 3.65 806.88 683.95 3803.16 17.36 24689.41 473.78 22.11 619.82 298.15 152.08 132.75 4.39 nd 3.66 nd 2.13
G17 4.82 524.48 237.300 3704.21 6.99 22139.33 689.24 19.59 957.05 128.93 30.9 112.54 3.24 nd 2.37 1.53 1.07
G18 5.88 701.84 307.42 8183.35 17.09 31838.78 1942.04 74.96 1081.14 nd nd 116.46 7.24 nd nd 9.53 nd
59
*for abbreviations look at Chapter 3.Experimental study,3.1.2. Chemical Agents
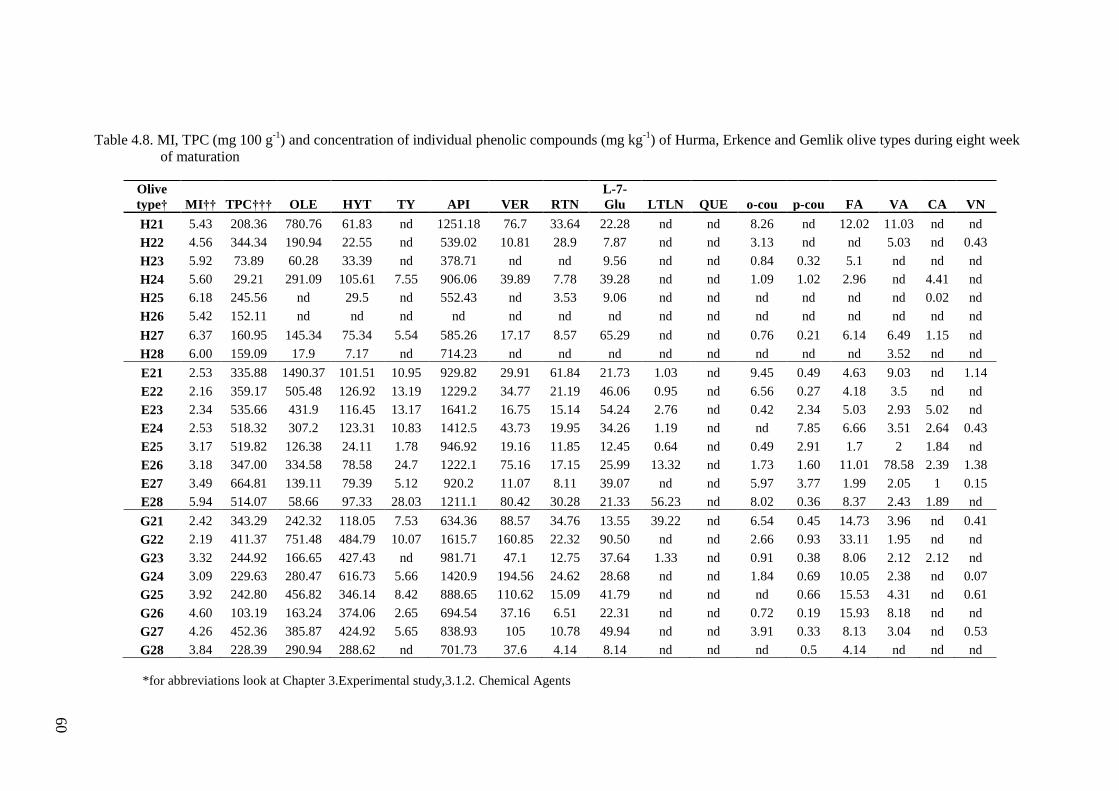
60
Table 4.8. MI, TPC (mg 100 g-1
) and concentration of individual phenolic compounds (mg kg-1
) of Hurma, Erkence and Gemlik olive types during eight week
of maturation
Olive
type† MI†† TPC††† OLE HYT TY API VER RTN
L-7-
Glu LTLN QUE o-cou p-cou FA VA CA VN
H21 5.43 208.36 780.76 61.83 nd 1251.18 76.7 33.64 22.28 nd nd 8.26 nd 12.02 11.03 nd nd
H22 4.56 344.34 190.94 22.55 nd 539.02 10.81 28.9 7.87 nd nd 3.13 nd nd 5.03 nd 0.43
H23 5.92 73.89 60.28 33.39 nd 378.71 nd nd 9.56 nd nd 0.84 0.32 5.1 nd nd nd
H24 5.60 29.21 291.09 105.61 7.55 906.06 39.89 7.78 39.28 nd nd 1.09 1.02 2.96 nd 4.41 nd
H25 6.18 245.56 nd 29.5 nd 552.43 nd 3.53 9.06 nd nd nd nd nd nd 0.02 nd
H26 5.42 152.11 nd nd nd nd nd nd nd nd nd nd nd nd nd nd nd
H27 6.37 160.95 145.34 75.34 5.54 585.26 17.17 8.57 65.29 nd nd 0.76 0.21 6.14 6.49 1.15 nd
H28 6.00 159.09 17.9 7.17 nd 714.23 nd nd nd nd nd nd nd nd 3.52 nd nd
E21 2.53 335.88 1490.37 101.51 10.95 929.82 29.91 61.84 21.73 1.03 nd 9.45 0.49 4.63 9.03 nd 1.14
E22 2.16 359.17 505.48 126.92 13.19 1229.2 34.77 21.19 46.06 0.95 nd 6.56 0.27 4.18 3.5 nd nd
E23 2.34 535.66 431.9 116.45 13.17 1641.2 16.75 15.14 54.24 2.76 nd 0.42 2.34 5.03 2.93 5.02 nd
E24 2.53 518.32 307.2 123.31 10.83 1412.5 43.73 19.95 34.26 1.19 nd nd 7.85 6.66 3.51 2.64 0.43
E25 3.17 519.82 126.38 24.11 1.78 946.92 19.16 11.85 12.45 0.64 nd 0.49 2.91 1.7 2 1.84 nd
E26 3.18 347.00 334.58 78.58 24.7 1222.1 75.16 17.15 25.99 13.32 nd 1.73 1.60 11.01 78.58 2.39 1.38
E27 3.49 664.81 139.11 79.39 5.12 920.2 11.07 8.11 39.07 nd nd 5.97 3.77 1.99 2.05 1 0.15
E28 5.94 514.07 58.66 97.33 28.03 1211.1 80.42 30.28 21.33 56.23 nd 8.02 0.36 8.37 2.43 1.89 nd
G21 2.42 343.29 242.32 118.05 7.53 634.36 88.57 34.76 13.55 39.22 nd 6.54 0.45 14.73 3.96 nd 0.41
G22 2.19 411.37 751.48 484.79 10.07 1615.7 160.85 22.32 90.50 nd nd 2.66 0.93 33.11 1.95 nd nd
G23 3.32 244.92 166.65 427.43 nd 981.71 47.1 12.75 37.64 1.33 nd 0.91 0.38 8.06 2.12 2.12 nd
G24 3.09 229.63 280.47 616.73 5.66 1420.9 194.56 24.62 28.68 nd nd 1.84 0.69 10.05 2.38 nd 0.07
G25 3.92 242.80 456.82 346.14 8.42 888.65 110.62 15.09 41.79 nd nd nd 0.66 15.53 4.31 nd 0.61
G26 4.60 103.19 163.24 374.06 2.65 694.54 37.16 6.51 22.31 nd nd 0.72 0.19 15.93 8.18 nd nd
G27 4.26 452.36 385.87 424.92 5.65 838.93 105 10.78 49.94 nd nd 3.91 0.33 8.13 3.04 nd 0.53
G28 3.84 228.39 290.94 288.62 nd 701.73 37.6 4.14 8.14 nd nd nd 0.5 4.14 nd nd nd
60
*for abbreviations look at Chapter 3.Experimental study,3.1.2. Chemical Agents

61
Figure 4.21.Score plot obtained with PCA for phenolics of Hurma, Erkence and Gemlik
types of olives during 8 weeks of maturation for the both harvest year (H:
Hurma, E: Erkence, G:Gemlik, first number after the letter is the harvest
year and second number is the harvest week)
Figure 4.22.Loading plot obtained with PCA for phenolics of Hurma, Erkence and
Gemlik types of olives during 8 weeks of maturation for both harvest years
To better understand the differences between each type of olives, PCA was run
separately for each harvest year and score and loading plots are shown in Figure 4.23
and 4.24. PCA constructed for the first harvest year consists of 2 principal components
-4
-3
-2
-1
0
1
2
3
4
5
-7 -6 -5 -4 -3 -2 -1 0 1 2 3 4 5 6 7 8
PC
2
PC1
Ellipse: Hotelling T2 (0.95)
1
2
H11H12H13
H14H15
H16
H17
H18
E11
E12
E13E14E15
E16
E17E18
G12G13
G14G15
G16
G17
G18
H21
H22H23
H24
H25H26
H27
H28
E21
E22
E23E24
E25
E26
E27
E28G21
G22
G23
G24G25G26
G27G28
SIMCA-P 10.5 - 7/9/2013 1:45:57 PM
-0,30
-0,20
-0,10
0,00
0,10
0,20
0,30
0,40
0,50
0,00 0,10 0,20 0,30
p[2
]
p[1]
TPCOLE
HYT
TY
API
VER
RTN
L-7-Glu
LTLN
QUE
o-cou
p-cou
FA
VA
CA
SA
VN
SIMCA-P 10.5 - 06.05.2013 22:04:40

62
with R2 of 0.46. Score plot (Figure 4.23) shows also that there is not much
differentiation with regard to olive type in the first 5 weeks of sampling. There is a clear
separation between the first 5 weeks‟ olives and the olives harvested in the last 3 weeks.
Actually, those last three weeks, in general, correspond to time where most of the
harvesting is done locally. According to loading plot (Figure 4.24) oleuropein and
vanillic acid are the phenols that differentiate early harvest period from the rest.
Actually, oleuropein and vanillic acid contents of early samples are higher compared to
later period (Table 4.7). When the late period is considered; however, different olive
types, especially Erkence and Hurma, could be clearly separated from each other since
Erkence is located on the lower right quartile and Hurma on the upper right quartile of
the score plot (Figure 4.23).
Gemlik variety in the last 3 weeks of harvest has high hydroxytyrosol (3,704.2-
8,183.3 mg/kg) and apigenin (22,139.3-31,838.7 mg/kg) content compared to others.
Generally, oleuropein content of Erkence (137,9-1,388.2 mg/kg) is higher compared to
Hurma (0-1,166.9 mg/kg) throughout the sampling period. According to loading plot
(Figure 4.24), luteolin, o-coumaric acid, luteolin-7-glucoside and TPC are the
differentiating parameters for Erkence. In fact, Erkence has the highest TPC (504.7-
1,230.4 mg/100g) especially in the late period of harvesting while luteolin (168.4-351.2
mg/kg) exists in high amounts in the last 3 weeks. Vanillin, ferulic acid and tyrosol
content of Hurma olives in the last 3 weeks of harvesting are the parameters that
separate out this olive from the rest (Figure 4.24).

63
Figure 4.23.Score plot obtained with PCA for phenolics of Hurma, Erkence and Gemlik
types of olives during 8 weeks of maturation for the first harvest year (H:
Hurma, E: Erkence, G: Gemlik, first number after the letter is the harvest
year and second number is the harvest week)
Figure 4.24.Loading plot obtained with PCA for phenolics of Hurma, Erkence and
Gemlik types of olives during 8 weeks of maturation for the first harvest
year
-5
-4
-3
-2
-1
0
1
2
3
4
5
-6 -5 -4 -3 -2 -1 0 1 2 3 4 5 6
PC
2
PC1
Ellipse: Hotelling T2 (0.95)
E1
G1
H1
E11E12
E13
E14E15
E16
E17
E18
G12G13
G14G15
G16
G17
G18
H11H12
H13H14
H15
H16
H17
H18
SIMCA-P 10.5 - 7/9/2013 1:39:45 PM
-0,40
-0,30
-0,20
-0,10
0,00
0,10
0,20
0,30
0,40
-0,10 0,00 0,10 0,20 0,30 0,40
p[2
]
p[1]
TPCOLE
HYT
TY
API
VER
RTN
L-7-Glu
LTLN
QUE
o-cou
p-cou
FA
VA
CA
SA
VN
SIMCA-P 10.5 - 06.05.2013 21:53:37

64
PCA model for the second harvest year has R2 of 0.63 and 3 principal
components. PCA in this case provided better classification for different olive types
although some samples are not located in their class (Figure 4.25 and 4.26). First week
Hurma (H21) and Gemlik (G21) and second week Erkence (E22) samples are close to
each other in the score plot; therefore, separation in the early harvest period is not that
clear as it was observed in the first harvest year. Other than fifth week Erkence (E25),
Erkence and Hurma are separated from each other quite well indicating that phenolic
compounds are very much affected from debittering phase during maturation.
According to loading plot (Figure 4.25), hydroxytyrosol, ferulic acid, verbascoside and
luteolin-7-glucoside are the phenolics which provide separation of Gemlik type
compared to others. Oleuropein, apigenin, rutin and o-coumaric acid are also important
phenolics in Gemlik differentiation but they also play a role in Erkence classification
since they are located close to horizontal axis. Caffeic acid, p-coumaric acid, vanillin,
tyrosol and TPC are the differentiating parameters for Erkence according to the loading
plot (Figure 4.26) and this type olive contains these phenols in higher amounts and its
TPC is the highest compared to others as in the first year. Caffeic acid is mostly present
in Erkence for the second harvest year. Tyrosol was in significant amounts throughout
ripening for Erkence while Hurma did not contain much of this phenolic as opposed to
first year. Hurma type has always lower content of every phenolic compounds and
especially its oleuropein concentration is very low after 4 weeks in the second harvest
year.

65
Figure 4.25.Score plot obtained with PCA for phenolics of Hurma, Erkence and Gemlik
types of olives during 8 weeks of maturation for the second harvest year
(H: Hurma, E: Erkence, G: Gemlik, first number after the letter is the
harvest year and second number is the harvest week)
Figure 4.26.Loading plot obtained with PCA for phenolics of Hurma, Erkence and
Gemlik types of olives during 8 weeks of maturation for the second harvest
year
-5
-4
-3
-2
-1
0
1
2
3
4
5
-6 -5 -4 -3 -2 -1 0 1 2 3 4 5 6
PC
2
PC1
Ellipse: Hotelling T2 (0.95)
E2
G2
H2
E21
E22
E23E24
E25
E26
E27E28
G21
G22
G23
G24
G25G26 G27
G28H21
H22
H23
H24
H25H26
H27
H28
SIMCA-P 10.5 - 7/9/2013 1:43:16 PM
-0,50
-0,40
-0,30
-0,20
-0,10
0,00
0,10
0,20
0,00 0,10 0,20 0,30
p[2
]
p[1]
TPC
OLE
HYT
TY
API
VER
RTN
L-7-Glu
LTLN
o-cou
p-cou
FA
VACA VN
SIMCA-P 10.5 - 06.05.2013 22:01:28

66
As it was reported in the literature, an overall decreasing trend for oleuropein
was observed although there are ups and downs depending on the harvest time. This
type of trend during maturation was also observed by other researchers (Dağdelen et al.,
2013).Increasing and decreasing trend observed for almost all phenols could be
explained by the conclusion provided by a study by Menz and Vriesekoop (2010) that is
the continuous synthesis of phenolic compounds during maturation. Since phenolic
compounds are secondary metabolites of plants and part of their defense mechanisms
they could be synthesized when they are needed depending on the environmental
conditions or the other factors.
Although a decreasing trend is not that clear for Hurma in the first year it could
still be said oleuropein is becoming less with increasing maturity for this olive type also.
According to a study performed with sweet Dhokar and regular Chemlali olives there is
a clear decrease in oleuropein content and increase in hydroxytyrosol contents of both
olives with ripening (Jemai et al., 2009; Bouaziz et al., 2004). While oleuropein content
reduced to almost zero level for Dhokar with time it stayed at a certain level for
Chemlali. Although same observation applies for oleuropein in our case, a decreasing
trend for hydroxytyrosol is not seen not only for Hurma but also for other olive types.
Studies on naturally debittered olive varieties were concentrated on the oleuropein
content of these olives since oleuropein is the phenolic compound that gives the bitter
taste of the olives. However, as it is observed in this study not only oleuropein but
almost all phenolics are affected from this debittering process. This observation is also
confirmed by the lower TPC of Hurma variety.
Erkence, Hurma and Gemlik can be differentiated from each other using their
phenolics profiles. Since Hurma is Erkence type olive which debitters on the tree, the
separation between Erkence and Hurma shows that natural debittering is related to
changes in phenolic composition and this phenomenon results in a reduction in phenolic
composition of Hurma. As it was hypothesized by other researchers these changes in
phenolic composition could be related to the activities of -glucosidase and esterase
enzymes (Jemai et al., 2009). In addition, phenolic profiles of olive types investigated in
this study depend on harvest year. Therefore, more data on phenolics content obtained
at multiple harvest years will be helpful to enlighten the natural debittering phenomena
of olives.

67
4.6. Oil Content and Fatty Acid Profile of Olive Varieties
4.6.1. Oil accumulation of olive varieties
The oil accumulation behavior observed in olive varieties are provided in
Table 4.8.The amount of oil on a dry weight basis varied with cultivar and harvest year
as well as harvest time. Higher oil contents are detected in Hurma olive, between the
ranges of 14.57- 61.71 % dw in 2011/12 harvest year. In the first harvest year, oil
content of Erkence type changed between the ranges of 17.07-65.92% dw and in
Gemlik type it was between 12.11-66.82% dw.
Generally, in the second harvest year oil accumulation was really low compared
to the first year. For the first two weeks of the maturation, oil content is higher than the
first harvest year for all olive types as in Chemlali Gafsa and Chemlali Zarsis olives
(Issaoui et al., 2008). While oil content begins to decrease after the second week in
Hurma, it decreases after third week in Gemlik and Erkence. Higher amounts of oil are
observed in Gemlik type between the ranges of 29.24-58.75% dw. In 2012/13 harvest
year, oil content of Hurma changes between the ranges of 15.25-31.04 %dwt and in
Erkence it varies between 19.63-46.65%.
It is reported that sugar concentration is proposed as a ripening index for oil
accumulation in olives. Since minimum sugar amounts correspond to maximum oil
content (Cherubini et al., 2009). In a study about Kadesh and Manzanillo olives, it is
found out that mannitol levels and oil accumulations of olives are related (Wodner et
al., 1988). However, it was not observed any relation between sugar, polyol and oil
content in this study.

68
Table 4.9. Percent oil content of olive varieties for two harvest years
HURMA % oil content ERKENCE % oil content GEMLIK % oil content
2011/12
H11 34.91 E11 28.77 G11 12.11
H12 14.57 E12 17.07 G12 48.59
H13 41.37 E13 13.68 G13 39.17
H14 43.99 E14 44.21 G14 59.49
H15 49.91 E15 37.98 G15 40.59
H16 61.52 E16 51.16 G16 66.82
H17 61.71 E17 62.61 G17 64.94
H18 47.46 E18 65.92 G18 63.94
2012/13
H21 31.04 E21 30.1 G21 39.22
H22 28.46 E22 26.53 G22 58.75
H23 27.43 E23 46.65 G23 51.91
H24 37.52 E24 21.16 G24 58.53
H25 21.64 E25 19.64 G25 40.17
H26 16.21 E26 25.79 G26 29.24
H27 15.25 E27 39.56 G27 50.98
H28 19.17 E28 28.03 G28 44.83
4.6.2. Fatty Acid Profile of Olive Varieties
Fatty acid compositions of olive varieties during two harvest years are listed in
Table 4.10.and Table 4.11.A typical GC profile of is shown in Figure 4.27.
Figure 4.27.GC chromatogram of Hurma belonging to the first week of the first harvest
year

69
For both harvest years, oleic acid is the main fatty acid for all olive types with
higher percentages as in Chemlali and Zarsis olives (Issaoui et al., 2008). In the
previous studies, as the ripening process goes on, the oleic acid content rises throughout
the maturation period (Issaoui et al., 2008). However, it was not observed a linear
increasing trend between ripening and oleic acid content of Hurma, Erkence and Gemlik
olives in this study. In addition, oleic acid content is lower than the first season for all
olive varieties in the second season. As it is shown in Table 4.9, the highest percentage
of oleic acid (66.85%) is observed in the 3th
week of the maturation for Hurma type for
the 2011/12 season and it reaches the highest level at the 6th
week of maturation
(64.95%) in 2012/13. In the first harvest year, Erkence type has the highest oleic acid
among other types and it varies between the ranges of 68.75-71.83%. However, in the
second year its range decreases to 60.5-66.82%.In Gemlik type, similar amounts of
oleic acid are detected for both harvest years and it is between the ranges of 61.86-
65.87% in the first season and 63.05-66.79% in the second season.
Palmitic acid is the other fatty acid that is detected in higher concentrations.
Palmitic acid (C16:0) is found between the ranges of 8.55-18.94% dw in Gemlik in
2011/12 season. In Erkence type, its concentration decreases from 13.81 to 11 %
throughout the ripening period. This decrease has been observed before by other
researchers during maturation (Beltran et al.,2004; Ayton et al.,2007; Manai et al.,
2007).While in Hurma, palmitic acid is observed between the ranges of 14.17-15.94%
in the first harvest year, it changes between 12.55-14.28% in the second year. There is a
decrease in palmitic acid content of Hurma olive until 7th
week of maturation after that
it increases slightly.
Higher concentrations of linoleic acids (C18:2) are observed in Hurma type in
both harvest years. In the first year, it follows an up and down trend during sampling
period. Linoleic acid content of Hurma reaches to a maximum of 17.19% in the first
year and 22.47% in the second year at the end of the maturation. In sweet Dhokar
variety also linoleic acid content (22.29%) was higher compared to other varieties
(Rigane et al., 2013). In Gemlik olives, linoleic acid increases at the last three weeks of
maturation and it reaches the highest concentration (%15.97) at the last week of
ripening in the first season. However, it increases during maturation period in the
second season (11.78-16.11%). In Erkence olives, linoleic acid content is almost the
same during the first four weeks of maturation. After that, it decreases until the end of
maturation (% 14.3-12.80) in the first harvest year. In the second harvest year, higher

70
content of linoleic acid is observed at beginning of ripening, 18.25%, and then it
decreases and reaches to the lowest level (13.56%) at the 6th
week of maturation.
Stearic acid has been observed in lower values between 1.66–4.39% for all
varieties in both harvest years. According to a study about Tunisian olives, stearic acid
is observed at values between 2.05–4.43% and its content does not depend on
maturation (Issaoui et al., 2008).
As it can be seen in Table 4.9, palmitoleic (16:1), linolenic (18:3n3), linoleadic
(C18:2n6t), behenic (22:0), arachidic (20:0), arachidonic (20:4n6), lignoceric (C24:0),
heptadecanoic (C17:0), nervoic (C24:1), cis-11-eicosanoic (C20:1) acids are also
detected for both harvest years at lower concentrations. Cis-10-heptadecanoic acid
(C17:1) is detected only in the second harvest year.
It was observed that oleic to linoleic acid ratio of Hurma olives are generally
lower compared to Erkence and Gemlik for both harvest year and Hurma has higher
linoleic acid content compared to other types for two years. (Figure 4.29). This ratio
was also lower for sweet Dhokar olive compared to another regular olive variety
(Rigane et al.,2013). Therefore, this might be an indication for increased desaturase
activity for the conversion of oleic acid to linoleic acid during debittering. Lower
MUFA/PUFA of Hurma compared to Erkence and Gemlik olives for both harvest years
also strengthen this hypothesis (Figure 4.30). Fatty acid desaturases are the enzyme
which catalyzes the formation of double bonds (Figure 4.28).
Figure 4.28. General synthesis of unsaturated fatty acids
(Source: sciencedirect.com)

71
Figure 4.29. MUFA/PUFA ratio of the investigated olives
Figure 4.30. Oleic acid/linoleic acid ratio of the investigated olives
To see the differences between varieties, harvest time and harvest year a
multivariate classification technique, PCA, was applied to the data. Although R2 values
of the models obtained are not very high PCA plots are still helpful visualizing the
differences regarding the olive type, harvest season and year.
For the whole data, a model with 4 principal components and R2 of 0.611 was
obtained and score plot for this model showing the classification of olive types is
provided in Figure 4.31. According to this plot, a differentiation could be observed
between the first and the second harvest year olives with respect to their fatty acid
profiles. First five week samples from Hurma type of 2011/12 harvest year are placed in
the left lower quartile of the plot. The later weeks (6th
, 7th
and 8th
weeks) of the first
harvest year are totally separated from the rest of the samples and are on the right upper
quartile of the plot. There is a clear separation between the first and the second year
samples. Higher concentrations of oleic acid are detected in 2011/12 season. Therefore,

72
both oleic acid and the first harvest year samples are located on the left side of the
loading plot (Figure 4.32).Gemlik type for 2012/13 season had higher concentrations of
palmitic acid. Therefore, both palmitic acid and second year Gemlik samples are located
in the right side of loading plot (Figure 4.31).
Figure 4.31.Score plot obtained with PCA for fatty acids of Hurma, Erkence and
Gemlik types of olives during 8 weeks of maturation for both harvest years
(H: Hurma, E: Erkence, G: Gemlik, first number after the letter is the
harvest year and second number is the harvest week)
Figure.4.32.Loading plot obtained with PCA for fatty acids of Hurma, Erkence and
Gemlik types of olives during 8 weeks of maturation for both harvest years
-4
-3
-2
-1
0
1
2
3
4
-5 -4 -3 -2 -1 0 1 2 3 4 5
PC
2
PC1
Ellipse: Hotelling T2 (0.95)
1
2
H11
H12
H13
H14
H15
H16
H17
H18
E11E12
E13
E14
E15
E16E17
E18
G12G13
G14G15
G16G17
G18
H21
H22
H23H24
H25
H26
H27
H28
E21
E22
E23
E24
E25
E26
E27
E28
G21G22
G23G24
G25G26
G27
G28
SIMCA-P 10.5 - 7/9/2013 2:03:33 PM
-0,40
-0,30
-0,20
-0,10
0,00
0,10
0,20
-0,30 -0,20 -0,10 0,00 0,10 0,20 0,30 0,40 0,50
p[2
]
p[1]
C16:0
C16:1
C17:0
C18:1n9c
C18:2n6c
C18:0
C18:3n3
C20:1
C20:4n6
C20:0
C24:0
C22:0
C21:0
C20:5n3
C18:2n6t
C24:1
C17:1
SIMCA-P 10.5 - 20.05.2013 13:07:30

73
To better understand the differences between each type of olives, PCA was run
separately for each harvest year and score and loading plots are shown in Fig.4.33 and
34, respectively. PCA constructed for the first harvest year consists of 3 principal
components with R2 of 0.679. Gemlik samples are mostly located around the ellipsoid
center. There is a clear separation between Hurma and Erkence and between Gemlik
and Erkence with respect to their fatty acid profiles (Figure 4.33). According to loading
plot (Figure 4.34), palmitic, palmitoleic and stearic acids are the fatty acids that caused
gathering of Gemlik samples at the center of the score plot. Actually, Gemlik type
generally have the higher concentrations of these fatty acids compared to others
throughout sampling period. Main fatty acid causing separation of Erkence from Hurma
and Gemlik is its oleic acid content (Figure 4.34). Oleic acid content of Erkence (66.38-
72.19%) is the highest among others during ripening and it increased with harvest time
and reached to the highest level at the 7th
week. Linolenic and gondoic (20:1n9c) acid
contents of Erkence are comparable and higher than Gemlik; therefore, these fatty acids
are located between Hurma and Erkence in the loading plot. First 5 week samples of
Hurma are located separately from the last 3 weeks since fatty acids such as
eicosopentaenoic (20:5n3) and heneicosanoic (21:0) acids exist in small amounts only
in Hurma in early period and disappear later. Another fatty acid that causes separation
of Hurma from the rest is linoleic acid which is observed in this olive in higher amounts
(14.79-18.45%).

74
Figure 4.33.Score plot obtained with PCA for fatty acids of Hurma, Erkence and
Gemlik types of olives during 8 weeks of maturation for the first harvest
year (H: Hurma, E: Erkence, G: Gemlik, first number after the letter is the
harvest year and second number is the harvest week)
Figure.4.34.Loading plot obtained with PCA for fatty acids of Hurma, Erkence and
Gemlik types of olives during 8 weeks of maturation for the first harvest
year
-4
-3
-2
-1
0
1
2
3
4
-7 -6 -5 -4 -3 -2 -1 0 1 2 3 4 5 6 7
PC
2
PC1
Ellipse: Hotelling T2 (0.95)
E1
G1
H1
E11E12
E13
E14
E15
E16E17E18
G12
G13
G14
G15
G16
G17G18
H11
H12
H13
H14
H15
H16
H17
H18
SIMCA-P 10.5 - 7/9/2013 1:49:12 PM
-0,50
-0,40
-0,30
-0,20
-0,10
0,00
0,10
0,20
0,30
0,40
-0,10 0,00 0,10 0,20 0,30
p[2
]
p[1]
C16:0 C16:1
C17:0
C18:1n9c
C18:2n6c
C18:0
C18:3n3
C20:1
C20:4n6
C20:0
C24:0
C22:0
C21:0
C20:5n3
C18:2n6t
C24:1
SIMCA-P 10.5 - 20.05.2013 14:10:07

75
PCA model for the second harvest year has R2 of 0.475 and 2 principal
components. PCA in this case provided better classification for Hurma and Gemlik
olive types (Figure 4.35). Other than the first week sample of Erkence, Hurma and
Erkence samples separated from each other with respect to their fatty acid profiles.
Some samples of Erkence and Gemlik types are located away from their groups but it
could be still concluded that there is a differentiation between these types of olives.
According to loading plot (Figure 4.36), palmitic and palmitoleic acids are the main
parameters causing separation of Gemlik as in the first year. Hurma can be
differentiated from other olives mainly owing to its higher content of stearic and linoleic
acid content. Hurma also had higher linoleic acid in the first harvest year. Erkence and
Gemlik have comparable levels of oleic acid in the second year; therefore this fatty acid
is located in between Erkence and Gemlik in the loading plot.
Figure 4.35.Score plot obtained with PCA for fatty acids of Hurma, Erkence and
Gemlik types of olives during 8 weeks of maturation for the second harvest
year (H: Hurma, E: Erkence, G: Gemlik, first number after the letter is the
harvest year and second number is the harvest week)
-4
-3
-2
-1
0
1
2
3
4
-6 -5 -4 -3 -2 -1 0 1 2 3 4 5 6
PC
2
PC1
Ellipse: Hotelling T2 (0.95)
E2
G2
H2
E21
E22
E23E24
E25
E26E27
E28
G21
G22
G23
G24
G25
G26 G27
G28
H21
H22H23
H24
H25
H26
H27 H28
SIMCA-P 10.5 - 7/9/2013 2:01:13 PM

76
Figure.4.36.Loading plot obtained with PCA for fatty acids of Hurma, Erkence and
Gemlik types of olives during 8 weeks of maturation for the second harvest
year
-0,50
-0,40
-0,30
-0,20
-0,10
0,00
0,10
0,20
0,30
0,40
0,50
-0,40 -0,30 -0,20 -0,10 0,00 0,10 0,20 0,30 0,40
p[2
]
p[1]
C16:0
C16:1
C17:0
C18:1n9c
C18:2n6c
C18:0
C18:3n3
C20:1
C20:4n6
C20:0
C24:0
C22:0
C17:1
C21:0
SIMCA-P 10.5 - 20.05.2013 14:33:47

77
Table 4.10.Percentage of individual fatty acids of olive varieties (Hurma, Erkence, and Gemlik) for the first harvest year
Olive
type C16:0 C16:1 C17:0 C18:0 C18:1n9c C18:2n6c C18:3n3 C18:2n6t C20:0 C20:1 C20:4n6 C20:5n3 C22:0 C24:0 C24:1
H11 14.64 0.77 0.12 2.72 62.80 17.01 0.30 0.038 0.41 0.85 0.037 0.11 nd 0.07 nd
H12 15.32 0.96 0.11 2.67 60.38 18.04 0.28 nd 0.42 0.86 0.034 0.37 0.11 0.06 0.04
H13 14.17 0.75 0.14 2.96 66.85 19.97 0.33 nd 0.47 0.87 0.042 0.43 0.25 0.06 nd
H14 13.59 0.66 0.12 3.01 64.19 16.25 0.31 0.014 0.47 0.80 0.036 0.25 0.13 0.06 nd
H15 15.9 1.19 0.13 3.01 62.80 14.78 0.27 nd 0.46 0.67 0.034 0.27 0.12 0.05 nd
H16 14.68 0.55 nd 2.62 66.53 15.038 nd nd nd 0.55 nd nd nd nd nd
H17 14.9 0.64 nd 2.85 63.63 16.97 nd nd 0.37 0.69 nd nd nd nd nd
H18 15.43 0.66 nd 3.09 62.85 17.19 nd nd nd 0.66 nd nd nd nd nd
E11 13.81 0.58 0.14 2.65 66.50 14.29 0.30 0.042 0.43 0.74 0.046 0.08 0.15 0.05 0.02
E12 13.53 0.58 0.13 2.74 66.38 14.17 0.32 nd 0.45 0.65 0.069 0.19 0.11 0.08 0.20
E13 13.89 0.55 0.16 3.07 65.78 14.37 0.29 nd 0.37 0.62 nd nd 0.10 0.07 0.45
E14 12.13 0.47 0.14 2.62 68.59 14.15 0.30 0,051 0.41 0.69 0.023 0.11 0.11 0.14 0.037
E15 12.34 0.50 0.15 2.63 69.01 13.43 0.32 0,04 0.41 0.67 0.024 0.064 0.11 0.06 0.044
E16 11.60 0.27 nd 2.66 71.82 12.80 nd nd 0.30 0.58 nd nd nd nd nd
E17 11 0.34 nd 2.86 72 13 nd nd 0.30 0.51 nd nd nd nd nd
E18 11.81 0.38 0.12 2.33 70.59 13.58 0.20 nd 0.30 0.58 nd nd 0.09 nd nd
G11 18.94 1.17 nd 2.86 62.90 12.17 nd nd 0.63 1.62 nd nd nd nd nd
G12 16.79 1.17 0.12 3.33 61.86 12.87 0.20 nd 0.48 0.59 nd nd nd nd nd
G13 16.79 1.40 0.12 2.91 63.90 13.43 0.26 nd 0.41 0.59 nd nd 0.11 nd nd
G14 15.70 1.28 0.12 2.82 65.86 12.78 0.26 nd 0.43 0.59 nd nd 0.11 0.09 nd
G15 8.55 1.17 0.11 3.16 65.33 12.79 0.25 nd 0.46 0.54 nd 0.14 0.11 nd nd
G16 15.56 0.99 0.10 3.60 64.80 13.62 0.18 nd 0.41 0.51 nd nd 0.08 0.03 nd
G17 15.88 1.24 0.09 2.27 64.59 14.57 0.23 nd 0.32 0.549 nd nd 0.08 0.03 nd
G18 15.48 0.95 0.01 2.67 63.89 15.97 0.2 nd 0.56 0.55 nd nd 0.07 0.03 nd
77

78
Table 4.11.Percentage of individual fatty acids of olive varieties (Hurma, Erkence, and Gemlik) for the second harvest year
Olive
type C16:0 C16:1 C17:0 C17:1 C18:0 C18:1n9c C18:2n6c C18:3n3 C20:0 C20:4n6 C20:1 C21:0 C22:0 C24:0
H21 14.28 0.53 0.20 0.16 4.39 61.012 17.64 0.24 0.36 0.39 0.65 nd 0.14 0.058
H22 13.84 0.55 0.21 0.22 3.7 62.82 17.24 0.23 0.31 0.16 0.56 nd 0.14 nd
H23 13.65 0.53 0.17 0.35 2.76 60.66 19.99 0.21 0.41 0.23 0.64 nd 0.38 0.063
H24 13.76 0.46 0.27 0.42 2.75 60.30 20.24 0.31 0.31 0.38 0.61 0.013 0.13 0.046
H25 12.7 0.44 0.18 0.27 2.30 63.32 18.36 0.24 0.35 0.29 0.69 0.14 nd nd
H26 12.28 0.46 0.19 0.54 3.15 64.95 16.99 0.22 0.33 0.50 0.61 0.06 nd nd
H27 12.55 0.45 0.30 0.37 2.93 62.99 18.65 0.42 0.32 0.30 0.71 0.25 nd nd
H28 13.08 0.51 0.15 0.17 2.70 62.45 22.48 0.28 0.28 0.33 0.72 nd nd nd
E21 13.68 0.49 0.21 0.20 2.46 62.50 18.28 0.21 0.32 0.38 0.57 nd nd nd
E22 15.18 0.58 0.3 0.34 5.22 60.49 16.03 0.47 0.31 0.54 0.53 nd nd nd
E23 12.59 0.57 0.31 0.38 2.69 66.81 15.02 0.23 0.33 0.29 0.6 nd 0.28 nd
E24 13.029 0.45 0.59 0.43 2.86 65.10 16.48 0.19 0.33 0.23 0.58 nd nd nd
E25 12.96 0.46 0.21 0.23 2.57 66.36 15.7 0.21 0.34 0.245 0.54 nd 0.32 nd
E26 15.29 1.24 nd nd 2.42 63.24 13.56 0.16 0.34 0.36 0.47 nd nd nd
E27 12.60 0.59 nd 0.19 2.48 64.49 16.24 0.26 0.32 0.29 0.51 nd nd nd
E28 12.57 0.489 0.19 0.36 2.48 64.17 16.10 0.21 0.32 0.33 0.51 nd 0.36 nd
G21 16.46 1.42 0.23 0.17 3.003 63.48 12.99 0.20 0.34 0.38 0.51 nd 0.79 nd
G22 16.66 1.46 0.10 0.08 2.65 64.37 12.26 0.48 0.33 0.65 0.46 nd 0.47 nd
G23 15.57 1.15 0.14 0.31 2.55 64.92 13.60 0.26 0.39 0.32 0.61 nd 0.15 nd
G24 16.24 1.35 0.12 0.22 1.67 64.30 14.34 0.28 0.32 0.36 0.62 nd 0.15 nd
G25 15.69 1.25 0.26 0.17 2.48 64.01 14.28 0.30 0.35 0.47 0.56 nd 0.14 nd
G26 12.75 0.48 0.14 0.24 2.83 66.79 15.17 0.24 0.37 0.28 0.58 nd 0.10 nd
G27 14.63 1.18 0.20 0.29 2.34 66.63 11.78 0.22 0.35 0.28 0.51 nd 0.13 nd
G28 15.42 1.10 0.12 0.21 2.39 63.05 16.10 0.21 0.35 0.32 0.54 nd 0.17 nd
78

79
As a result, it can be concluded that the fatty acid profile provides differentiation
with respect to olive varieties and harvest year. The effect of harvest year is identified
as an important factor determining fatty acid profile of olive varieties investigated in
this study.
4.7. PCA of Combination of Various Parameters
In order to better understand and explain the differentiation of olives in terms of
variety, harvest year and harvest time PCA analysis with different combinations were
conducted.
Firstly, PCA constructed with sugar and organic acid data for the both harvest
year consists of 3 principal components with R2 of 0.639. As it is seen in Figure 4.37
there is a good separation between harvest years with combined sugar and organic acid
data. Sucrose, glucose and succinic acid are the components that differentiate the
second harvest year and they are located in the right side of loading plot (Figure 4.38).In
the first harvest year, all samples of Hurma separated from other types and located in
the right lower quartile of the plot. There is no separation between Erkence and Gemlik
olives in the first harvest year using both organic acid and sugar data. In the second
harvest year, there is no clear separation between olive types (Figure 4.37).
Figure 4.37.Score plot obtained with PCA for sugar and organic acids of Hurma,
Erkence and Gemlik types of olives during 8 weeks of maturation for both
harvest years (H: Hurma, E: Erkence, G:Gemlik, first number after the letter
is the harvest year and second number is the harvest week)
-4
-3
-2
-1
0
1
2
3
4
-4 -3 -2 -1 0 1 2 3 4
PC
2
PC1
Ellipse: Hotelling T2 (0.95)
1
2
H11
H12H13
H14
H15
H16H17H18
E11E12
E13E14E15
E16
E17
E18
G12
G13
G14
G15
G16
G17
G18
H21
H22H23
H24
H25
H26
H27
H28
E21
E22
E23
E24
E25
E26
E27
E28G21
G22
G23
G24
G25
G26
G27
G28
SIMCA-P 10.5 - 7/7/2013 5:05:25 PM

80
Figure.4.38.Loading plot obtained with PCA for sugar and organic acid data of Hurma,
Erkence and Gemlik types of olives during 8 weeks of maturation for both
harvest years
PCA constructed with sugar and fatty acid data for the both harvest year consists
of 4 principal components with R2 of 0.605. As it is seen in Figure 4.39 there is a good
separation between harvest years by combining data of sugar and fatty acid. Sucrose,
glucose and oleic acid are the main components that differentiate the second harvest
year and they are located in the right side of loading plot (Figure 4.40). First five week
samples of both Hurma and Erkence are located in the right upper part of the plot. All
samples of Gemlik belong to the first year is located on the horizontal axis of the plot. It
was not observed a separation in terms of olive varieties using combined sugar and fatty
acid data in the first season. In the second season, on the other hand, Hurma olives are
mostly located on the left upper quartile of the score plot while Erkence mixed with
Gemlik are on the lower left part of the plot. Mainly, linoleic and linolenic acids are
responsible from this differentiation according to the loading plot.
-0,40
-0,30
-0,20
-0,10
0,00
0,10
0,20
0,30
0,40
0,50
-0,50 -0,40 -0,30 -0,20 -0,10 0,00 0,10 0,20 0,30 0,40
p[2
]
p[1]
GLU
FRUC
SUC
MANO
MANICITRIC
L-MALIC
SUCCINIC
LACTIC
ACETIC
SIMCA-P 10.5 - 20.05.2013 17:50:40

81
Figure 4.39.Score plot obtained with PCA for sugar and fatty acids of Hurma, Erkence
and Gemlik types of olives during 8 weeks of maturation for both harvest
years (H: Hurma, E: Erkence, G:Gemlik, first number after the letter is the
harvest year and second number is the harvest week)
Figure.4.40.Loading plot obtained with PCA for sugar and fatty acids of Hurma,
Erkence and Gemlik types of olives during 8 weeks of maturation for both
harvest years
-5
-4
-3
-2
-1
0
1
2
3
4
5
6
7
8
-6 -5 -4 -3 -2 -1 0 1 2 3 4 5 6
PC
2
PC1
Ellipse: Hotelling T2 (0.95)
1
2
H11H12
H13H14
H15
H16
H17
H18
E11
E12
E13
E14
E15
E16
E17E18
G12G13G14G15
G16G17G18
H21
H22
H23H24
H25
H26
H27H28
E21E22 E23E24E25
E26
E27E28G21G22 G23
G24G25G26
G27G28
SIMCA-P 10.5 - 7/7/2013 5:09:35 PM
-0,30
-0,20
-0,10
0,00
0,10
0,20
0,30
0,40
-0,40 -0,30 -0,20 -0,10 0,00 0,10 0,20 0,30
p[2
]
p[1]
GLU
FRUC
SUC
MANO
MANI
C16:0
C16:1
C17:0
C18:1n9c
C18:2n6c
C18:0
C18:3N6
C20:1
C20:4n6
C20:0
C14:0
C24:0C22:0
C21:0
C20:5n3
C18:2n6t
C17:1
SIMCA-P 10.5 - 20.05.2013 19:03:27

82
Lastly, PCA was conducted with whole data including sugars, organic acids,
phenolics, total phenol content, and fatty acids for both harvest years. The model
consists of 3 PCs and R2 is 0.418.All samples of Hurma type belong to the first year are
located around the horizontal axis of left side (Figure 4.41). Linolenic and linoleic
acids, mannitol and acetic acid are in the same place with Hurma in the loading plot and
these compounds differentiate this olive from the other types (Figure 4.42). Both
Gemlik and Erkence samples are in the left quartile of the plot. In the second harvest
year, last three weeks‟ samples of all types are located in the left upper part of the plot.
Remaining samples belong to all types are in the left lower quartile of the plot.
Figure 4.41.Score plot obtained with PCA for whole data of Hurma, Erkence and
Gemlik types of olives during 8 weeks of maturation for both harvest years
(H: Hurma, E: Erkence, G: Gemlik, first number after the letter is the
harvest year and second number is the harvest week)
-5
-4
-3
-2
-1
0
1
2
3
4
5
-9 -8 -7 -6 -5 -4 -3 -2 -1 0 1 2 3 4 5 6 7 8 9
t[2]
t[1]
Ellipse: Hotelling T2 (0.95)
1
2
H11
H12H13
H14
H15
H16
H17
H18
E11
E12E13
E14
E15
E16
E17E18
G12
G13G14
G15
G16
G17
G18
H21
H22H23
H24
H25
H26
H27
H28
E21
E22 E23
E24
E25
E26
E27
E28
G21G22
G23
G24
G25G26 G27G28
SIMCA-P 10.5 - 7/7/2013 5:12:14 PM

83
Figure.4.42.Loading plot obtained with PCA for whole data of Hurma, Erkence and
Gemlik types of olives during 8 weeks of maturation for both harvest years
In conclusion, PCA analysis of several combinations of chemical parameters
resulted in a differentiation based on the harvest year but not on variety.
-0,30
-0,20
-0,10
0,00
0,10
0,20
0,30
-0,20 -0,10 0,00 0,10 0,20
p[2
]
p[1]
GLU
FRUC SUC
MANO
MANI
C16:0C16:1
C17:0
C18:1n9c
C18:2n6c
C18:0
C18:3N6
C20:1
C20:4n6
C20:0
C14:0
C24:0
C22:0
C21:0
C20:5n3
C18:2n6t
C17:1
MI
TPC
OLEHYT
TY
API
VER
RTN
L-7-Glu
LTLN
QUE
o-cou
p-cou
FAVA
CA
SA
VN
CITRIC
L-MALIC
SUCCINIC
LACTIC
ACETIC
SIMCA-P 10.5 - 21.05.2013 15:18:03

84
CHAPTER 5
CONCLUSIONS
In this study changes in the chemical compositions of Hurma (naturally
debittering Erkence), Erkence and Gemlik olives throughout their maturation period
were investigated for two harvest years and some chemical compositional differences
between Hurma and other types were determined.
It is found out that olive variety, harvest time and year have significant effects
on pH and aw statistically. Total phenol content and concentration of individual phenolic
compounds of Hurma olive are lower than Erkence and Gemlik olives. PCA could
separate Hurma from Erkence and Gemlik olives with respect to phenolic content and
phenolic profile. In addition, harvest year is also an important parameter that for
differentiation of olives with respect to their phenolic profile.
Glucose and mannitol are detected as the main sugar and polyol for all olive
types. No differentiation was obtained in terms of olive type depending on the sugar
content according to PCA. However, there is some separation with respect to harvest
year when sugar profiles of olive types is analyzed statistically.
Main organic acids for the olives investigated are the citric and malic acids.
Gemlik variety has the highest citric acid content compared to other types for both
harvest years. Total organic acid composition of olives in the second harvest year is
significantly higher compared to the first year. There was no differentiation of olive
types depending on their organic acid content as in the sugars; however, organic acid
profile provided a clear separation between harvest years.
Oleic acid is identified as the main fatty acids for Hurma, Erkence and Gemlik
as expected. Hurma has higher content of linolenic acid in both harvest years compared
to other types. Fatty acid profile allowed a differentiation with respect to variety and
also harvest year according to PCA.
It was hypothesized that the changes during natural debittering of olives could
be related to the activities of -glucosidase and esterase enzymes and cause a decrease
in phenolic compounds (Jemai et al., 2009). However, as this study shows not only
phenolic compounds but also fatty acids are affected from this process since there is a

85
separation between Erkence and Hurma olives depending on their fatty acid profiles.
This difference could be associated with the esterase activity. In addition, decreased
oleic acid to linoleic acid ratio might be an indication of increased desaturase activity.
In a study about microbiological characterization of Hurma olive, it was found
out that microbial population on Hurma olive is higher compared to Erkence and
Gemlik olives (Karslı, 2013).This result can be also associated with increased activity
of enzymes that might originate from microorganisms for Hurma type. During ripening
period, microbial growth on Hurma may lead to increases in the enzyme activities
which degrade phenolic compounds and cause debittering stages of Hurma olive
In conclusion, Hurma, Erkence and Gemlik varieties could be differentiated in
terms of their fatty acid and phenolic profiles; however, sugar and organic acid content
of these olives do not provide a varietal separation. Harvest season has a significant
effect on all chemical parameters; therefore, it needs to be taken into consideration on
studies about chemical composition of olive varieties.
As the future study, activity of enzymes involved in natural debittering of
Hurma olive could be investigated during maturation period to further enlighten the
sweetening on the tree phenomena. In addition, investigations about packaging options
and changes during storage of Hurma olive will help to increase the quality and shelf-
life of this special olive.

86
REFERENCES
Amiot, M. J., A. Fleuriet and J. J. Macheix (1986). "Importance and evolution of
phenolic compounds in olive during growth and maturation." Journal of
Agricultural and Food Chemistry 34(5): 823-826.
Aparicio, R. and R . Aparicio-Ruı́z (2000). "Authentication of vegetable oils by
chromatographic techniques." Journal of Chromatography A 881(1): 93-104.
Arslan, D. and M. Özcan (2011). "Influence of growing area and harvest date on the
organic acid composition of olive fruits from Gemlik variety." Scientia
Horticulturae 130(3): 633-641.
Ayton, J., R. J. Mailer, A. Haigh, D. Tronson and D. Conlan (2007). "Quality and
oxidative stability of Australian olive oil according to harvest date and
irrigation." Journal of Food Lipids 14(2): 138-156.
Beltrán, G., C. del Río, S. Sánchez and L. Martínez (2004). "Seasonal changes in olive
fruit characteristics and oil accumulation during ripening process." Journal of
the Science of Food and Agriculture 84(13): 1783-1790.
Borcakli, M., G. Özay, I. Alperden, E. Özsan and Y. Erdek (1993). "Changes in
chemical and microbiological composition of two varieties of olive during
fermentation." Grasas y Aceites 44(4-5): 253-258.
Boskou, D. (1996). "History and characteristics of the olive tree." Olive oil, chemistry
and technology. AOCS Press, Champaign.
Boskou, G., F. N. Salta, S. Chrysostomou, A. Mylona, A. Chiou and N. K.
Andrikopoulos (2006). "Antioxidant capacity and phenolic profile of table
olives from the Greek market." Food Chemistry 94(4): 558-564.
Bouaziz, M., M. Chamkha and S. Sayadi (2004). "Comparative study on phenolic
content and antioxidant activity during maturation of the olive cultivar
Chemlali from Tunisia." Journal of agricultural and food chemistry 52(17):
5476-5481.
Brenes-Balbuena, M., P. Garcia-Garcia and A. Garrido-Fernandez (1992). "Phenolic
compounds related to the black color formed during the processing of ripe
olives." Journal of agricultural and food chemistry 40(7): 1192-1196.

87
Brenes, M. and A. de Castro (1998). "Transformation of oleuropein and its hydrolysis
products during Spanish‐style green olive processing." Journal of the Science
of Food and Agriculture 77(3): 353-358.
BUZCU, N., Karaburun Hurma Zeytinin Oluş Sebebinin Tesbiti,
http://www.zae.gov.tr/salamura/biten_detay.asp?id=17&strCatalog_NAME=KARABU
RUN+HURMA+ZEYT%DDN%DDN+OLU%DE+SEBEB%DDN%DDN+TE
SB%DDT%DD+(1969), (1969)
Cámara, M. M., C. Díez, M. E. Torija and M. P. Cano (1994). "HPLC determination of
organic acids in pineapple juices and nectars." Zeitschrift für Lebensmittel-
Untersuchung und Forschung 198(1): 52-56.
Cattell, R. B. (1966). "The scree test for the number of factors." Multivariate behavioral
research 1(2): 245-276.
Chammem, N., M. Kachouri, M. Mejri, C. Peres, A. Boudabous and M. Hamdi (2005).
"Combined effect of alkali pretreatment and sodium chloride addition on the
olive fermentation process." Bioresource technology 96(11): 1311-1316.
Charoenprasert, S. and A. Mitchell (2012). "Factors Influencing Phenolic Compounds
in Table Olives (Olea europaea)." Journal of agricultural and food chemistry
60(29): 7081-7095.
Cherubini, C., Migliorini, M., Mugelli, M., Viti, P., Berti, A., Cini, E., & Zanoni, B.
(2009). Towards a technological ripening index for olive oil fruits. Journal of
the Science of Food and Agriculture, 89(4), 671-682.
Cunha, S. C., I. M. Ferreira, J. O. Fernandes, M. A. Faria, M. Beatriz, P. Oliveira and
M. Ferreira (2001). "Determination of lactic, acetic, succinic, and citric acids in
table olives by HPLC/UV." Journal of liquid chromatography & related
technologies 24(7): 1029-1038.
Dağdelen, A., Tümen, G., Özcan, M. M., & Dündar, E. (2012). Determination of
tocopherol contents of some olive varieties harvested at different ripening
periods. Natural Product Research, 26(15), 1454-1457.
East Mediterrnean Olive Association http://www.akdenizbirlik.org.tr/ (accesed date March 2013)
Ergönül, P. and C. Nergız (2010). "Determination of organic acids in olive fruit by
HPLC." Czech Journal of Food Sciences 28(3): 202-205.

88
European Union Commission (1991) Regulation EEC 2568/91 on the Characteristics of
Olive Oil and Olive-Residue Oil and on the Relevant Methods of Analysis.
Official Journal of European Communities L248 (5 September 1991).
Fernández, A. G., M. Fernandez-Diez and M. R. Adams (1997). Table olives:
production and processing, Chapman & Hall.
Garcia, J. M., S. Seller and M. C. Perez-Camino (1996). "Influence of fruit ripening on
olive oil quality." Journal of agricultural and food chemistry 44(11): 3516-
3520.
García, P., M. Brenes, C. Romero and A. Garrido (1995). "Respiration and
physicochemical changes in harvested olive fruits." Journal of Horticultural
Science 70.
García, P., M. Brenes, C. Romero and A. Garrido (1999). "Color and texture of
acidified ripe olives in pouches." Journal of food science 64(2): 248-251.
Gillingham, L. G., S. Harris-Janz and P. J. Jones (2011). "Dietary monounsaturated
fatty acids are protective against metabolic syndrome and cardiovascular
disease risk factors." Lipids 46(3): 209-228.
Harborne, J. B. and C. A. Williams (2000). "Advances in flavonoid research since
1992." Phytochemistry 55(6): 481-504.
INTERNATIONAL OLIVE COUNCIL
http://www.internationaloliveoil.org/web/aaingles/corp/AreasActivitie/economics/Areas
Activitie.html, (2010).
Islam, S., T. Matsui and Y. Yoshida (1996). "Effect of carbon dioxide enrichment on
physico-chemical and enzymatic changes in tomato fruits at various stages of
maturity." Scientia Horticulturae 65(2): 137-149.
Issaoui, M., B. Mechri, A. Echbili, S. Dabbou, A. Yangui, H. Belguith, A. Trigui and
M. Hammami (2008). "Chemometric characterization of five Tunisian varietals
of Olea europaea L. olive fruit according to different maturation indices."
Journal of Food Lipids 15(3): 277-296.
Jemai, H., M. Bouaziz and S. Sayadi (2009). "Phenolic composition, sugar contents and
antioxidant activity of Tunisian sweet olive cultivar with regard to fruit
ripening." Journal of agricultural and food chemistry 57(7): 2961-2968.
Jolliffe, I. T. (2002). Principal component analysis, Springer verlag.

89
Joslyn, M. A. (1970). "Methods in food analysis. Physical, chemical and instrumental
methods of analysis.".(2nd edition).
López-López, A., A. Jiménez-Araujo, P. García-García and A. Garrido-Fernández
(2007). "Multivariate analysis for the evaluation of fiber, sugars, and organic
acids in commercial presentations of table olives." Journal of agricultural and
food chemistry 55(26): 10803-10811.
Manai, H., F. M. Haddada, A. Trigui, D. Daoud and M. Zarrouk (2007). "Compositional
quality of virgin olive oil from two new Tunisian cultivars obtained through
controlled crossings." Journal of the Science of Food and Agriculture 87(4):
600-606.
Marsilio, V., C. Campestre, B. Lanza and M. De Angelis (2001). "Sugar and polyol
compositions of some European olive fruit varieties (< i> Olea europaea</i>
L.) suitable for table olive purposes." Food chemistry 72(4): 485-490.
Menz, G. and F. Vriesekoop (2010). "Physical and chemical changes during the
maturation of Gordal Sevillana olives (Olea europaea L., cv. Gordal
Sevillana)." Journal of agricultural and food chemistry 58(8): 4934-4938.
Morelló, J. R., Vuorela, S., Romero, M. P., Motilva, M. J., & Heinonen, M. (2005).
Antioxidant activity of olive pulp and olive oil phenolic compounds of the
arbequina cultivar. Journal of agricultural and food chemistry, 53(6), 2002-
2008.
Naczk, M. and F. Shahidi (2004). "Extraction and analysis of phenolics in food."
Journal of Chromatography A 1054(1): 95-111.
Nergiz, C. and Y. Engez (2000). "Compositional variation of olive fruit during
ripening." Food Chemistry 69(1): 55-59.
Patumi, M., G. Fontanazza, L. Baldoni and I. Brambilla (1989). Determination of some
precursors of lipid biosynthesis in olive fruits during ripening. International
Symposium on Olive Growing 286.
Romero, M. P., M. J. Tovar, T. Ramo and M. J. Motilva (2003). "Effect of crop season
on the composition of virgin olive oil with protected designation of origin “Les
Garrigues”." Journal of the American Oil Chemists' Society 80(5): 423-430.
Rondanini, D., D. Castro, P. S. Searles and M. C. Rousseaux (2011). "Fatty acid profiles
of varietal virgin olive oils (Olea europaea L.) from mature orchards in warm
arid valleys of Northwestern Argentina (La Rioja)." grasas y aceites 62(4):
399-409.

90
Ryan, D., M. Antolovich, T. Herlt, P. D. Prenzler, S. Lavee and K. Robards (2002).
"Identification of phenolic compounds in tissues of the novel olive cultivar
hardy's mammoth." Journal of agricultural and food chemistry 50(23): 6716-
6724.
Ryan, D., K. Robards and S. Lavee (1999). "Changes in phenolic content of olive
during maturation." International journal of food science & technology 34(3):
265-274.
Sánchez, A.-H., L. Rejano, A. Montaño and A. de Castro (2001). "Utilization at high pH
of starter cultures of lactobacilli for Spanish-style green olive fermentation."
International journal of food microbiology 67(1): 115-122.
Sánchez, A., A. De Castro, L. Rejano and A. Montaño (2000). "Comparative study on
chemical changes in olive juice and brine during green olive fermentation."
Journal of agricultural and food chemistry 48(12): 5975-5980.
Sánchez, A., P. García, L. Rejano, M. Brenes and A. Garrido (1995). "The effects of
acidification and temperature during washing of Spanish‐style green olives on
the fermentation process." Journal of the Science of Food and Agriculture
68(2): 197-202.
Sánchez Gómez, A. H., P. García García and L. Rejano Navarro (2006). "Elaboration of
table olives."
ScienceDirect Scientific Database
www.sciencedirect.com
(accessed date June 2013)
Stevens, J. P. (2012). Applied multivariate statistics for the social sciences, Routledge
Academic.
Tovar, M. J., M. J. Motilva and M. P. Romero (2001). "Changes in the phenolic
composition of virgin olive oil from young trees (Olea europaea L. cv.
Arbequina) grown under linear irrigation strategies." Journal of Agricultural
and Food Chemistry 49(11): 5502-5508.
Vaughn, R., M. Martin, K. Stevenson, M. Johnson and V. Crampton (1969). "Salt-free
storage of olives and other produce for future processing." Food Technol 23(6):
124-126.
Vossen, P. (1998). "Variety and maturity the two largest influences on olive oil quality."
Project Report. Univ. California. Davis.

91
Wikipedia The Free Encyclopedia http://en.wikipedia.org/wiki/Olive (accesed date March 2013)
Wodner, M., S. Lavee and E. Epstein (1988). "Identification and seasonal changes of
glucose, fructose and mannitol in relation to oil accumulation during fruit
development in< i> Olea europaea</i>(L.)." Scientia horticulturae 36(1): 47-
54.
Yorulmaz, A., H. Erinc and A. Tekin "Changes in Olive and Olive Oil Characteristics
During Maturation." Journal of the American Oil Chemists' Society: 1-12.
Yorulmaz, A., E. S. Poyrazoglu, M. M. Ozcan and A. Tekin (2012). "Phenolic profiles
of Turkish olives and olive oils." European Journal of Lipid Science and
Technology 114(9): 1083-1093.
Zoidou, E., E. Melliou, E. Gikas, A. Tsarbopoulos, P. Magiatis and A.-L. Skaltsounis
(2009). "Identification of Throuba Thassos, a traditional Greek table olive
variety, as a nutritional rich source of oleuropein." Journal of agricultural and
food chemistry 58(1): 46-50.

92
APPENDIX A
CALIBRATION GRAPHICS
Figure A.1. Calibration curve of gallic acid
Figure A.2. Calibration curve of vanilic acid
y = 0.002x - 0.3733
R² = 0.9981
0
0.2
0.4
0.6
0.8
1
1.2
1.4
1.6
1.8
2
0 200 400 600 800 1000 1200
AB
SO
RB
AN
CE
CONCENTRATION (ppm)

93
Figure A.3. Calibration curve of oleuropein
Figure A.4 .Calibration curve of sucrose

94
Figure A.5. Calibration curve of mannitol
Figure A.6. Calibration curve of succinic acid

95
Figure A.7. Calibration curve of L-malic acid
Copyright © 2022 FDOKUMEN