Cardiac Effects of Treadmill Running at Different Intensities in ...
Upload
independentCategory
view
1download
0
Relationship between gene expression and observedintensities in DNA microarrays—a modeling studyG. A. Held*, G. Grinstein and Y. Tu
IBM TJ Watson Research Center, PO Box 218, Yorktown Heights, NY 10598, USA
Received October 28, 2005; Revised December 28, 2005; Accepted March 13, 2006
ABSTRACT
A theoretical study of the physical properties whichdetermine the variation in signal strength from probeto probe on a microarray is presented. A model whichincorporates probe-target hybridization, as well asthe subsequent dissociation which occurs duringstringent washing of the microarray, is introducedand shown to reasonably describe publicly availablespike-in experiments carried out at Affymetrix. Inparticular, this model suggests that probe-targetdissociation during the stringent wash plays a criticalrole in determining the observed hybridization inten-sities. In addition, it is demonstrated that non-specifichybridization introduces uncertainties which signifi-cantly limit the ability of any model to accuratelyquantify absolute gene expression levels while, incontrast, target folding appears to have little effecton these results. Finally, for data from target spike-inexperiments, our model is shown to compare favor-ably with an existing statistical model in determiningtarget concentration levels.
INTRODUCTION
DNA microarrays allow the measurement of the expressionlevels of thousands of genes simultaneously (1,2). Despite thewidespread use of microarrays, however, there remains muchuncertainty in the quantitative determination of expressionlevels obtained using these technologies. The raw data fromthese assays often exhibit large, unexplained fluctuations, andthe methods used to infer expression levels are typicallyempirical or statistical in nature.
The central component of all DNA microarray technologiesis an array of different oligonucleotides (each between 20 andseveral hundred bases long), called probes, deposited onto asingle substrate. A solution containing a labeled nucleic acidsample is brought into contact with the substrate, and eachtranscript in the sample hybridizes to those probes that are
complementary to it. Following hybridization, the substrateis washed, so as to remove unbound and weakly bound(i.e. mismatched) target oligonucleotides from the sample.Bound target molecules are then stained with a fluorophoreand the microarray is scanned. Detection of the fluorescentsignal allows one to quantify the presence of varioussequences, and thus the expression levels of various genes,within the sample.
One class of DNA microarrays is exemplified by AffymetrixGenechips (2,3), wherein each transcript is probed by multiple,short oligomers (typically 25mers). Typically, �16 perfectmatch (PM) probes, and an equal number of mismatch(MM) probes correspond to each transcript. Each PM probeexactly complements a short region of the transcript, referredto as the target. The corresponding MM probe is identical tothe PM probe except at its centermost base, which is non-complementary to the transcript. Experimentally, it is readilyobserved that the degree of hybridization varies significantlybetween those multiple PM probes which hybridize to differ-ent regions of a common transcript (3).
The Affymetrix Microarray Suite version 5.0 (MAS v5)algorithm for inferring quantitative transcript expression lev-els from microarray data begins by subtracting the MM inten-sity from the corresponding PM intensity (with adjustments tothe MM value if MM>PM). The expression level is then takento be a weighted average of those differences obtained from allof the pairs that probe the given transcript (4).
More recent statistical algorithms have incorporated a probebinding affinity which accounts, in part, for the observed varia-tion in intensity between the different probes which aredesigned to bind to different regions of a particular transcript(5–7). In addition, there have been efforts to quantify observedprobe intensities through physical modeling of the hybridiza-tion process (8–13). Thus far, these ‘physical’ models haveyielded expression levels with accuracies comparable with,but not significantly greater than, purely statistical models(14,15). Physical modeling is nonetheless important in thatit can provide a means of inferring absolute expression levelsmore accurately—both by providing guidance in the optimumchoice of probe sequences and in suggesting potential modi-fications to assay protocols and data analysis. Furthermore, a
*To whom correspondence should be addressed. Tel: +1 914 945 2609; Fax: +1 914 945 2141; Email: [email protected]
� The Author 2006. Published by Oxford University Press. All rights reserved.
The online version of this article has been published under an open access model. Users are entitled to use, reproduce, disseminate, or display the open accessversion of this article for non-commercial purposes provided that: the original authorship is properly and fully attributed; the Journal and Oxford University Pressare attributed as the original place of publication with the correct citation details given; if an article is subsequently reproduced or disseminated not in its entirety butonly in part or as a derivative work this must be clearly indicated. For commercial re-use, please contact [email protected]
Nucleic Acids Research, 2006, Vol. 34, No. 9 e70doi:10.1093/nar/gkl122
Published online May 24, 2006 by guest on February 2, 2015
http://nar.oxfordjournals.org/D
ownloaded from

model which correctly incorporated all of the physical prop-erties which determine the observed hybridization intensitieswould, in principle, yield gene expression levels with an accu-racy limited only by noise intrinsic to the measurements(16,17).
While several physical models have addressed the effects ofhybridization energy (11,12) and probe site saturation (8,9), nomodel thus far has considered the effects of target-probe dis-sociation during the washing of the microarray which followshybridization. In this paper, we present a physical model ofmicroarray hybridization which incorporates both the bindingof target and probe during the hybridization phase of the assayand the dissociation of target and probe during the washingstep. We demonstrate that variations in the saturation intensityof different probes are a central feature of microarray behaviorand show that these variations can largely be explained by thevarying degrees of dissociation which occur during the wash-ing of the microarray.
We find that much of the uncertainty in determining expres-sion levels is a consequence of the uncertainties in backgroundsignal—uncertainties which result from the non-specific bind-ing of probes to oligonucleotides other than their intendedtargets (18–21). In addition, we present evidence that probeand target folding do not significantly affect the observedhybridization intensities. Finally, we demonstrate that ourmodel compares favorably with MAS v5 in determining targetexpression levels.
EXPERIMENTS AND DATA
All of the data shown and analyzed in this paper are takenfrom the publicly available results of experiments carriedout at Affymetrix [www.affymetrix.com/analysis/download_center2.affx, (22)]. In particular, the data are the results ofa series of controlled, ‘spike-in’ experiments, in which atranscript group comprised of known concentrations (eachbetween 0 and 1024 pM), of 14 human genes is spikedinto a background consisting of a mixture of mRNA froma human pancreatic tissue source. (None of the spike-in geneswas expressed in the tissue source.) This mixture is thenlabeled and hybridized onto Affymetrix U95A Genechipsfollowing the manufacturers protocols (23) (T. A. Webster,personal communication). Fourteen different transcriptgroups, each containing different concentrations of the vari-ous spike-in genes (following an experimental design knownas a Latin Square), are then each hybridized onto a genechip.The net result is that each of the genes is spiked into one ofthe transcript groups at each of the following concentrations:0, 0.25, 0.5, 1, 2, 4, . . . , 1024 pM; i.e. data are collected for all14 genes, each at 14 different concentrations. Sixteen distinctPM/MM probe pairs interrogate each transcript. Finally, eachof the measurements for a given gene at a given concentrationwas replicated between 2 and 12 times. The raw data providedby Affymetrix contain intensities for each PM and MM probe(the intensities provided corresponding to the 75th percentileof the intensity of the scanned pixels associated with theprobe site). We performed no normalization of this dataprior to the analysis discussed below. In addition, we consideronly the PM probes in our analysis. Note that throughout thispaper we use Affymetrix notation to identify genes.
MODELS OF HYBRIDIZATION
During hybridization, the formation of bound target-probeduplexes is governed by the equation:
½single-strand probe�þ ½single-strand target� Ð ½target-probe duplex�:
1
Assuming kðhÞf and k
ðhÞb are the forward and backward rate
constants for this reaction under hybridization conditions,and the concentrations [single-strand probe], [single-strandtarget] and [target-probe duplex] are given by (nprobe � nB)/Vprobe, (n0 � nB)/Vtotal and nB/Vprobe, where nprobe, n0, Vprobe
and Vtotal are equal to the number of probe molecules at thegiven probe site, the number of transcript molecules in thetarget solution, the volume of the probe site and the volume ofthe target solution, respectively, then the number of boundtarget-probe pairs, nB, is determined by the rate equation asfollows.
@nB
@t¼ k
ðhÞf ðnprobe � nBÞð
n0 � nB
NAVtotal
Þ � kðhÞb nB: 2
NA is Avogadro’s number and Vprobe is defined as the area ofa probe site multiplied by the average probe height. Note thatsince Vprobe does not appear in Equation 2, the precise defini-tion of the average probe height is not critical. Assuming thatthe system achieves equilibrium (24), and that nprobe << n0
[nprobe 107 (2,24) and n0 2 · 108 for a 0.25 pM targetsolution (23)], it follows that
nB;equilibrium ¼ nprobe
c
ðKd þ cÞ ‚ 3
where Kd � kðhÞb =k
ðhÞf and c � ðn0=NAÞ=Vtotal is the target con-
centration in moles/liter. It follows from thermodynamics thatthe dissociation constant, Kd satisfies the following equation:
Kd ¼ eDGhyb=RT‚ 4
where DGhyb is the change in free energy associated withthe target-probe hybridization (25) and the units of Kd
are moles/liter. Note that in earlier work (9) we referred toKd as ne. Note too that when the system approachesequilibrium (24), the concentrations of the target moleculesin solution become spatially uniform, whereupon diffusionof the targets ceases to play a role, and the simple formEquation 2 of the rate equation for hybridization is justified(26,27).
Target hybridization is followed by washing of the probearray, a process wherein the array is flushed with a non-stringent wash buffer ([Na+] ¼ 1 M), followed by a stringentwash buffer ([Na+] ¼ 0.1 M), followed in turn by a secondnon-stringent wash buffer (23). In the course of this washing,unbound and weakly bound (i.e. mismatched) target moleculesare removed from the genechip. In addition, some comple-mentary bound target molecules will also dissociate; the num-ber of bound target molecules at a given probe site will bereduced by a factor of exp ð � k
ðwÞb tÞ, where k
ðwÞb is the
backwards rate constant for Equation 1 under the conditionsof the stringent wash, t is the time duration of the string-ent wash and we have assumed that the dissociation ofcomplementary bound targets occurs primarily during the
e70 Nucleic Acids Research, 2006, Vol. 34, No. 9 PAGE 2 OF 15
by guest on February 2, 2015http://nar.oxfordjournals.org/
Dow
nloaded from
stringent wash. Note that in the course of this wash, the washbuffer is repeatedly replaced (23), whereupon theconcentration of dissociated target molecules in the washingfluid is so small that one may assume they are all removedfrom the system. Therefore, one need not worry about thediffusive process that carries the newly released targetsaway, but only about the fraction of such targets, which iscontrolled by k
ðwÞb .
The rate constant kðwÞb may be expressed as
kðwÞb ¼ k
ðwÞf exp ðDGwash=RTÞ, where k
ðwÞf is the forward
rate for Equation 1 under the stringent washing conditionsand DGwash is the change in free energy associated with duplexformation under stringent wash buffer conditions. The rateconstant k
ðwÞf is observed to be relatively independent of
oligonucleotide sequence both in solution (28) and on micro-spheres (29), whereas k
ðwÞb can vary by many orders of
magnitude (28).Following washing, the bound target molecules are stained
with a fluorophore and the microarray is scanned. Combiningthe probe-target dissociation resultant from washing withEquation 3, and recasting the result to yield observed intensity,I, as a function of concentration, c, we obtain the followingequation:
I ¼ Anprobee�kðwÞb
tc
ðKd þ cÞ þ bge‚ 5
where we have added a sequence dependent background termbge to account for the hybridization of probes to nucleic acidsother than their intended targets, and the proportionality con-stant A in Equation 5 relates nB to the corresponding fluores-cence intensity.
For oligomers in solution, the change in free energyassociated with hybridization is well described by a nearest-neighbor (nn) stacking energy model (28,30,31). In nnmodels, the hybridization free energy of any base pairdepends not only on whether that pair is a C–G or an A–T,but also on which base pairs occupy the neighboringpositions along the strand. To calculate the hybridizationfree energy for any sequence, one sums the contributionsfor each of these stacked pairs along the chain, and thenadds a correction for the base pairs terminating the sequenceat each end. For DNA/RNA duplexes (such as those present onhybridized Affymetrix microarrays) there are 16 independentstackings of 2 base pairs along an oligonucleotide chain,e(b1,b2), where b1,2 ¼ A, C, G, T. Thus, the free energy ofhybridization of a 25mer DNA/RNA duplex in solution maybe written as follows.
X24
i¼1
eðbi‚biþ1Þ‚ 6
where we assume that the corrections for the base pairsterminating the sequence at each end may be neglected.
In the microarray geometry, one expects sequence indepen-dent factors such as changes in the electrostatic energy (32–36)of the system to contribute to the free energy of hybridiza-tion. For this reason, we define ~eeðb1‚b2Þ � eðb1‚b2ÞþðDghybrid=24Þ, where Dghybrid is a sequence independentchange in free energy associated with hybridization. As ourmodel does not allow us to independently determine the 16e(b1,b2) and Dghybrid (see Discussion), we have chosen to
incorporate a fraction Dghybrid=24 into each of the nn energyterms.
Hybridization on a microarray differs from hybridization insolution in that the contributions of paired nucleotides to theenergy of hybridization are position dependent. In solution,each of the hybridized base pairs contributes equally to theenergy of hybridization, as in Equation 6. However, it has beenshown that, in a microarray geometry, those bases closest tothe center of the oligonucleotide chain contribute most sig-nificantly to the energy of hybridization; the contributions ofthe other pairs to the energy of hybridization falls off roughlyparabolically relative to the contribution of the centermostnucleotides (11,12). Incorporating both a sequence indepen-dent term and positional weighting into our model of hybrid-ization, we find
DGhyb ¼X24
i¼1
wi½~eeðbi‚biþ1Þ�: 7
In the models which follow, we consider both weighting fac-tors wi which are constant along the oligonucleotide (i.e. wi ¼1 for all i) and ones which are parabolically weighted andcentered at the middle of the probe oligonucleotide. Forthis second case, we express the weighting factors as afunction of a, the curvature of the parabola:
wi ¼aði � 12:5Þ2
2þ 1 8
As noted earlier, the change in free energy DGhyb, associatedwith the formation of a given duplex under the hybridizationconditions differs from the free energy associated with thesame reaction under the stringent washing conditions, DGwash.However, nn stacking energy models of hybridization in solu-tion predict that the change in free energy of hybridizationresulting from a change in salt concentration should besequence independent (30). In addition, the change in freeenergy associated with electrostatic interactions at the surfaceof a microarray are also expected to be sequence independent(32,35). Given these observations, we assume the relationship
DGwash ¼ DGhyb þ G‚ 9
where G is independent of oligonucleotide sequence. Note thatone effect of sequence-specific probe folding would be torender the surface electrostatic interactions probe-sequencedependent. However, given that the average spacing betweenprobe molecules is only of order 25 s (24,37,38), we assumethat the effects of probe folding are minimal.
Given Equations 7–9, we can rewrite Equation 5 as follows:
I ¼ Ipc
ðKd þ cÞ þ bge‚ 10
where the factor Ip, defined as
Ip ¼ Anprobee�kðwÞf
t exp ððGþDGhybÞ=RTÞ 11
is a function of probe sequence. The dependence of intensityon concentration in Equation 10 is known as a Langmuirisotherm (25), a function which describes the adsorption ofneutral adsorbates at a surface comprising a finite number ofsites, each capable of accommodating but a single adsorbate.
PAGE 3 OF 15 Nucleic Acids Research, 2006, Vol. 34, No. 9 e70
by guest on February 2, 2015http://nar.oxfordjournals.org/
Dow
nloaded from

Note that in a model which considers neither the disassociationof target molecules during the stringent wash nor othersequence dependent effects such as self-hybridization ofprobes, one would expect Ip to be a constant independent ofprobe sequence (8,9). Note also that the intensity I defined byEquation 10 is the total intensity from a given probe spot. Ifone wanted to apply this model to microarrays with variablespot sizes, it would be necessary to express this equation interms of average intensity, by dividing I, Ip and bge by the areaof each probe site. For the case of the Affymetrix Genechipstreated here, all of the probe sites are the same size, so such aconversion is not necessary.
MODELING OF PROBE INTENSITY DATA
General considerations
At low concentrations of target molecules, the Langmuir iso-therm (Equation 10) is characterized by a linear dependence ofhybridization fraction (and, thus, observed intensity) on targetconcentration, while at higher target concentrations the num-ber of bound target molecules saturates at a constant value. InFigure 1a is plotted the experimentally observed fluorescentintensity from bound target molecules as a function of targetconcentration for a single probe (gene 37777_at, probe 16),with each data point corresponding to an average of the inten-sities obtained from between 2 and 12 replicate measurements.(The intensities of the individual replicate measurements areshown in Figure 1b.) The data in this figure are well describedby Equation 10, the solid line being a best-fit to this equation,where Ip and Kd are adjustable parameters and bge is fixed atthe average value of the zero concentration spike-in measure-ments for this probe.
We begin our analysis of the data by noting that, givenaccurate values of Ip and Kd for a sufficient number of
probe sequences, one can perform a least squares fit tothese values of Ip and Kd using Equations 4 and 11 (withthe free energies defined by Equations 7–9). In doing thesefits, one obtains best-fit values for the 16 nn energy parameterse(b1,b2), as well as for Iprobe � Anprobe, G and a. From thesebest-fit values, one may then predict values of Ip and Kd (usingEquations 4, 7–9 and 11) for any given probe sequence.Finally, from these results one may, in turn, generate fromEquation 10 model-based predictions of intensity as a functionof probe sequence and target concentration.
To obtain reliable values of Ip and Kd for a broad range ofprobe sequences, we begin by plotting intensity as a functionof target concentration for each probe in the Latin Square data.This yields 224 (14 genes each with 16 probes) plots equiva-lent to Figure 1a. Next, we identify those plots from which wecan obtain reliable estimates of both Ip and Kd. We set as ourfirst criterion that the relationship between intensity and targetconcentration approximately follow a Langmuir isotherm.This results in the exclusion of data from defective probespots [such as those identified by Affymetrix (www.affymetrix.com/analysis/download_center2.affx) becausethey exhibited weak fluorescence with no discernible correla-tion between target spike-in concentration and spot intensity].We fit the remaining data to Equation 10, with the backgroundbge for each probe spot fixed at the experimentally observedvalue (i.e. the average of all of the zero concentration spike-inreplicates for that probe). We then limit our consideration tothose probes for which the best-fit value of Ip is <1.1 timesgreater than the experimentally observed intensity at 1024 pM.This criterion is necessary because it is not possible to accu-rately estimate the saturation value Ip from data which is notclose to saturation at the highest measured target concentra-tions. In total, we find that 95 probes satisfy the above criteria,and it is these probes which we use in the subsequent analysis.Supplementary Figure 1 comprises plots of intensity as a
Figure 1. Observed hybridization intensity as a function of spike-in target concentration of PM probe 16 of gene 37777_at. The solid line is a best-fit of the datato Equation 10 with Ip and Kd as adjustable parameters and bge set at the experimentally observed average signal for data taken at zero spike-in concentration. In(a) each data point shown is the average of all of the replicate measurements taken at a given spike-in concentration. Each of the replicate measurements is shownas a separate data point in (b).
e70 Nucleic Acids Research, 2006, Vol. 34, No. 9 PAGE 4 OF 15
by guest on February 2, 2015http://nar.oxfordjournals.org/
Dow
nloaded from

function of target concentration for these 95 probes. The blackline in each plot is a best-fit of the data to Equation 10.
In Figure 2 are shown plots of intensity as a function oftarget concentration for two probes (gene 1597_at, probe 3 andgene 37777_at, probe 15). The best-fit value of the saturationintensity Ip for the data in Figure 2a is 1942, a factor of 10.2smaller than that for the data shown for a different probe inFigure 1a. Likewise, the best-fit value of 28.5 · 10�12 mol/lobtained for Kd from the data in Figure 2b is 8.3 times smallerthan that observed in Figure 1a. In Figure 3a and b we plothistograms of the values of Ip and Kd obtained by fitting thedata for the 95 probes in Supplementary Figure 1 to Equation10. The data in Figures 1–3 clearly demonstrate that anyphysical model which purports to explain the observed geneexpression data must be able to account for significant probe toprobe variations in both Kd and the saturation intensity Ip.
Physical model
We now introduce and study a physical model for fitting thegene expression data. In addition, we explore the importanceof the various elements of this model by considering variantsof it wherein a particular element is modified. Comparisonof the results of the original model with those of thevariants provides insight into the significance of the modifiedelements.
Model I. As our main model, hereafter referred to as Model I,we simultaneously fit the values of Kd and Ip obtained for the95 good probes to Equations 4 and 11, respectively, using thesixteen ~eeðb1‚b2Þ, Iprobe � Anprobe, G and a as adjustableparameters. The best-fit values for the energies ~eeðb1‚b2Þ areplotted in Figure 4, while the best-fit values for Iprobe, G and aare 79 410, 1.95 kcal/mol and �0.0116, respectively. It may beseen in Figure 4 that the best-fit values of complementaryenergy terms [e.g. ~eeðA‚GÞ and ~eeðC‚TÞ] are not equal. Suchdifferences are found for DNA/RNA hybridization in solution(31), and so are not unexpected for hybridization of the DNA
probe to the RNA target. These differences may also be due inpart to the fact that on the target RNA only pyrimidinenucleotides are biotinylated (and subsequently fluorescentlylabeled); similar differences between the hybridization ener-gies associated with complementary nucleotides have beenattributed to this fact in previous studies (11,39).
In performing these fits, we have assumed a value of106 (mol/l)�1 s�1 for k
ðwÞf (28) and set t to the experimental
value of 600 s (23). The precise value assumed for kðwÞf does
not alter the quality of the fit, the effect of a different assumedvalue for k
ðwÞf being to change the best-fit value of G accord-
ingly. We have chosen not to allow kðwÞf to vary with probe
sequence because experimental evidence suggests that it var-ies far less than k
ðwÞb (28,29). In addition, it is unclear precisely
how one would model the dependence of kðwÞf on probe
sequence without rendering the fitting process intractable.Note that in simultaneously fitting Kd and Ip it is necessary
Figure 2. Observed hybridization intensity as a function of spike-in target concentration of (a) PM probe 9 of gene 1597_at and (b) PM probe 15 of gene 37777_at.The solid lines are best-fits of the data to Equation 10 with Ip and Kd as adjustable parameters and bge set at the experimentally observed average signal for data taken atzero spike-in concentration. Each data point shown is the average of all of the replicate measurements taken at a given spike-in concentration.
Figure 3. Histograms of the values of (a) Ip and (b) Kd obtained by fitting thehybridization intensity as a function of spike-in concentration for 95 selectedPM probes (see text) to Equation 10 with Ip and Kd as adjustable parameters andbge set at the experimentally observed average signal for data taken at zerospike-in concentration. Units of Kd are mol/l.
PAGE 5 OF 15 Nucleic Acids Research, 2006, Vol. 34, No. 9 e70
by guest on February 2, 2015http://nar.oxfordjournals.org/
Dow
nloaded from

to choose an arbitrary proportionality constant to weight theimportance of a unit of least square error in Kd relative to a unitof least square error in Ip. We have chosen this factor to be 60,as for this value the quality of the fits to Kd and Ip appearqualitatively comparable.
To determine the accuracy of Model I, we use our best-fitvalues of ~eeðb1‚b2Þ, Iprobe, G and a to calculate DGhyb andDGwash from Equations 7–9 for each of the 95 good probesequences. From these, we then calculate predicted values ofKd and Ip from Equations 4 and 11, respectively. Finally, weincorporate these predicted values of Ip and Kd with the experi-mentally observed values for bge into Equation 10 and obtainpredicted intensities for each probe at each experimentallyobserved concentration between 0.25 and 1024 pM. Thesepredicted intensities are shown as solid blue lines inFigure 5 for one probe (gene 37777_at probe 16) and inSupplementary Figure 1 for all of the 95 probes used in theanalysis.
We quantify the difference between these predicted inten-sities and the experimentally observed intensities by calculat-ing a normalized sum log difference square lds defined asfollows.
lds � 1
N
X95
i¼1
X1024pM
c¼0:25
½log ðIpredictedði‚cÞÞ � log ðIobservedði‚cÞÞ�2‚
12
where Ipredicted(i,c) and Iobserved(i,c) are the predicted andexperimentally observed intensities for probe i and spike-intarget concentration c, and N � 95 · 13 ¼ 1235 normalizes ldswith respect to the number of predicted intensities included inthe double sum. We calculate the difference between the natu-ral logarithms of the intensities, as opposed to the linear dif-ference, so as to give equal weight to errors of equal magnitudeat all of the measured target concentrations. As a second mea-sure of the accuracy of our model, we calculate the Pearsoncorrelation coefficient between all of the values of
log(Iobserved) and log(Ipredicted). The values of the lds and cor-relation coefficient for this model are given in the first row ofTable 1. We use these measures below to compare the accu-racy of this model with several variants of the model which arebased on different physical assumptions. In doing so, we areable to identify those attributes of the model which contrib-ute most significantly to agreement between model andexperiment.
The normalized sum lds represents the typical value of[log(Ipredicted/Iobserved)]2 for a given probe at a given concen-tration. The quantities exp ðpldsÞ and exp ð � p
ldsÞ thereforeprovide a rough measure of the range over which the ratio ofpredicted to observed intensities, Ipredicted/Iobserved, can beexpected to vary. For Model I, where lds ¼ 0.17, e.g. thisratio should range between 0.67 and 1.5.
The extent to which our model captures the experimentallyobserved variations in Ip and Kd may be seen in Figure 6aand b, in which the values of Ip and Kd (as obtained by fittingthe experimental data) are plotted as a function of DGhyb,where this free energy of hybridization is determined fromEquation 7 and the best-fit values of ~eeðb1‚b2Þ and a obtainedfrom Model I. The predicted dependencies of Ip and Kd onDGhyb (from Equations 11 and 4, respectively), are shown assolid red lines in these figures. Note that in Figure 6 we haveassigned error bars to the experimentally observed values of Ip
and Kd. These error bars are defined to be the greater of twoestimates of uncertainty. The first is simply the statisticaluncertainty (1 SD) of the best-fit values of Ip and Kd obtainedby fitting the replicate averaged data of Figure 1a and Sup-plementary Figure 1 to Equation 10. The second estimate is thestandard deviation of the set of values for Ip and Kd obtained bydividing the set of replicate data for each probe into threegroups—each one corresponding to the replicate measure-ments taken from the genechips grown on a specific wafer
Figure 5. Observed hybridization intensity, averaged over all replicate mea-surements, as a function of spike-in target concentration of PM probe 16 of gene37777_at, plotted on a log–log scale. The zero concentration (leftmost) datapoint is plotted at 0.05 pM. The black line is a best-fit of the data to Equation 10with Ip and Kd as adjustable parameters and bge set at the experimentallyobserved intensity at zero spike-in concentration. The blue and red lines areplots of Equation 10 with Ip and Kd calculated from the probe sequence usingModel I, discussed in the text, and bge set at the experimentally observedintensity at zero spike-in concentration (blue line), or determined by Equation13 (red line).
Figure 4. Best-fit values of the energies ~eeðb1‚b2Þ for b1,2 ¼ A,C,G,T obtainedby simultaneously fitting the values of Ip and Kd for 95 selected PM probes toEquations 4, 7–9 and 11 using the 16 ~eeðb1‚b2Þ, Iprobe, a and G as adjustableparameters (see text).
e70 Nucleic Acids Research, 2006, Vol. 34, No. 9 PAGE 6 OF 15
by guest on February 2, 2015http://nar.oxfordjournals.org/
Dow
nloaded from
(www.affymetrix.com/analysis/download_center2.affx)—andfitting each group separately to Equation 10. These error barsare intended to provide a qualitative sense of the degree ofuncertainly associated with the fitted values for Ip and Kd; theyare not defined in a statistically rigorous fashion. For thisreason, we do not utilize them in determining our best-fitvalues of the various adjustable parameters. Nonetheless,the magnitude of these error bars does capture the extent towhich variability between replicate measurements (17) (suchas that shown in Figure 1b) limits the ability of any model toprecisely describe the data.
We now calculate the Pearson correlation function and ldsbetween the predicted and observed probe intensities for sev-eral variants of Model I. By observing the effect that modi-fying the model has on the reliability with which it predicts theobserved data, we are able to identify those physical processeswhich are most important to incorporate into a model ofmicroarray hybridization. We emphasize that there is no apriori reason for making these modifications, which are stud-ied simply to provide insight into the practical significance ofthe various elements of Model I.
Variant 1 of Model I. In this first variant of Model I, we takethe contribution of nucleotides to the energy of hybridizationto be independent of position along the probe, i.e. we fix thevalues of all the weights wi in Equation 7 to unity. This changeincreases the lds from 0.17 to 0.204—indicating that, asreported previously (11,12), weighting the energetic contribu-tions of base pairs in the center of the probe more highly thanthose at the ends of the probe does indeed improve the accu-racy of the model. In Figure 6c and d we plot Ip and Kd as afunction of the values of hybridization energy DGhyb calcu-lated from the best-fit parameters obtained for Variant 1.
Variant 2 of Model I. This second variant of Model I addressesthe importance of allowing the dissociation constant k
ðwÞb , and,
thus, Ip, to vary with probe sequence. We do this by allowingthe parameters ~eeðb1‚b2Þ and the curvature a to be determinedby a least squares fit of only the values of Kd of the 95 probes toEquations 4, 7 and 8. The probe intensities are then determinedusing Equation 10, where Ip is fixed at a constant value
independent of probe sequence. The value of Ip is chosenso as to minimize the value of lds. This model results in anlds value of 0.321—approximately twice that observed whenone allows Ip to vary with probe sequence. This result demon-strates the importance of incorporating into any model aphysical mechanism through which Ip can vary with probesequence. In Figure 6e and f we plot Ip and Kd as functionsof the values of hybridization energy DGhyb calculated fromthe best-fit parameters obtained using Variant 2. As may beseen in Figure 6e, the values of Ip are not correlated withDGhyb, as expected given that they were not utilized in obtain-ing these values of the free energy. The blue line in Figure 6e isthe best-fit value of Ip (10 700) while the green line is theaverage of the 95 Ip values obtained by fitting the data for eachprobe individually to Equation 10 (12 065).
In earlier work (9), we modeled the same set of spike-in datausing a fixed value of Ip (as in Variant 2). However, rather thanfitting the nn stacked base pair energies, we used experimentalvalues obtained from measurements of hybridization in solu-tion (30). We found that in order to obtain a reasonable fit ofthe data to Equation 10, it was necessary to introduce a phe-nomenological constant multiplying DGhyb in the expressionfor Kd (Equation 4) as an extra fitting parameter. This under-scores the difficulty of accounting for the data without anyad hoc assumptions unless one considers processes, such aswashing, which allow for variations in Ip from probe to probe.
Variant 3 of Model I. Next we investigate the importance ofallowing Kd to vary with probe sequence, by considering avariant—Variant 3—wherein the parameters ~eeðb1‚b2Þ, a, Iprobe
and G are derived from a best-fit of only the values of Ip of the95 probes to Equations 7–9 and 11, while a probe sequenceindependent Kd is chosen so as to minimize the value of lds.This amounts to ignoring the probe sequence-dependence ofthe hybridization process, but including the sequence depen-dence of the dissociation during microarray washing. In thiscase, the value of lds is 0.148, smaller than that for a modelwhich uses the same probe dependent energy for duplexformation during both the hybridization and washing pro-cesses. While taking Kd to be independent of probe sequenceseems a rather drastic approximation, the low value of lds
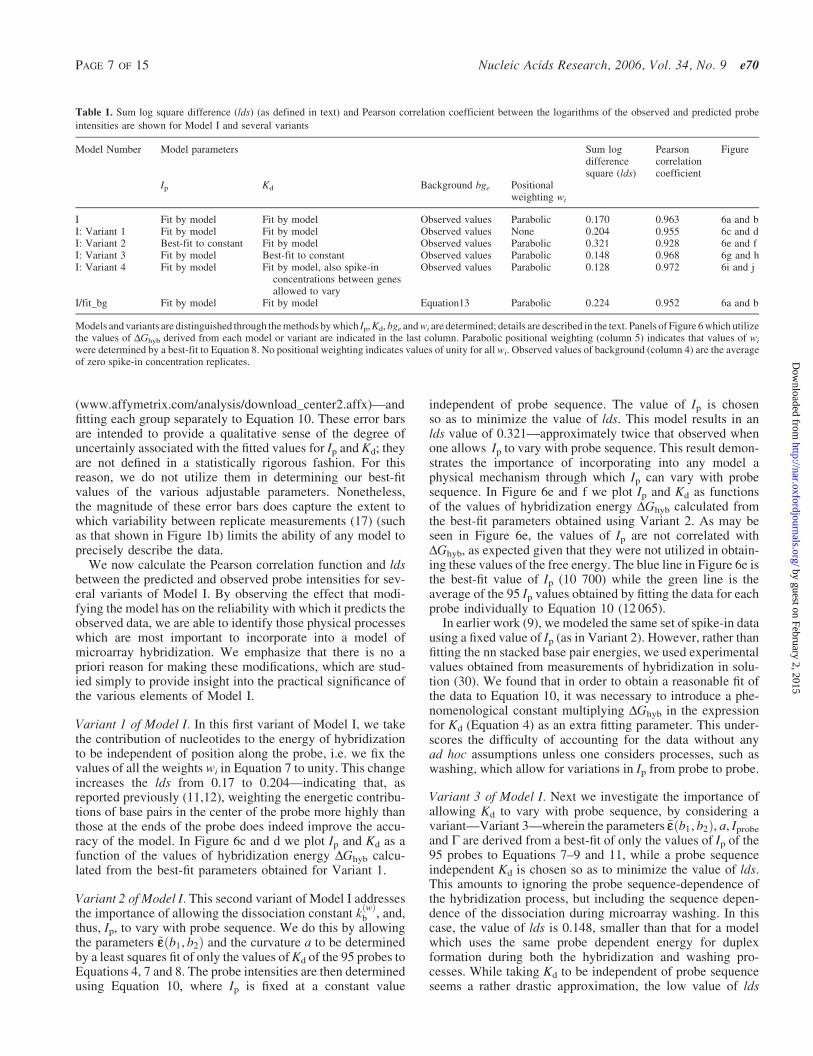
Table 1. Sum log square difference (lds) (as defined in text) and Pearson correlation coefficient between the logarithms of the observed and predicted probe
intensities are shown for Model I and several variants
Model Number Model parameters Sum logdifferencesquare (lds)
Pearsoncorrelationcoefficient
Figure
Ip Kd Background bge Positionalweighting wi
I Fit by model Fit by model Observed values Parabolic 0.170 0.963 6a and bI: Variant 1 Fit by model Fit by model Observed values None 0.204 0.955 6c and dI: Variant 2 Best-fit to constant Fit by model Observed values Parabolic 0.321 0.928 6e and fI: Variant 3 Fit by model Best-fit to constant Observed values Parabolic 0.148 0.968 6g and hI: Variant 4 Fit by model Fit by model, also spike-in
concentrations between genesallowed to vary
Observed values Parabolic 0.128 0.972 6i and j
I/fit_bg Fit by model Fit by model Equation13 Parabolic 0.224 0.952 6a and b
Models and variants are distinguished through the methods by which Ip, Kd, bge and wi are determined; details are described in the text. Panels of Figure 6 which utilizethe values of DGhyb derived from each model or variant are indicated in the last column. Parabolic positional weighting (column 5) indicates that values of wi
were determined by a best-fit to Equation 8. No positional weighting indicates values of unity for all wi. Observed values of background (column 4) are the averageof zero spike-in concentration replicates.
PAGE 7 OF 15 Nucleic Acids Research, 2006, Vol. 34, No. 9 e70
by guest on February 2, 2015http://nar.oxfordjournals.org/
Dow
nloaded from
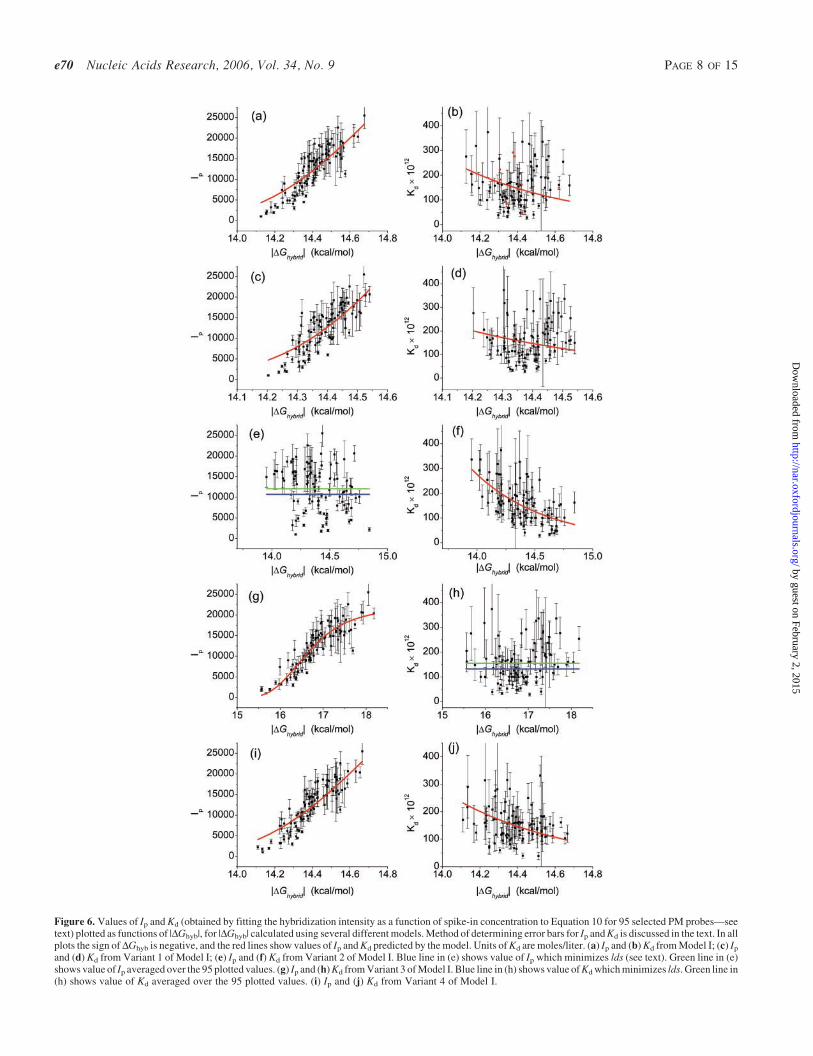
Figure 6. Values of Ip and Kd (obtained by fitting the hybridization intensity as a function of spike-in concentration to Equation 10 for 95 selected PM probes—seetext) plotted as functions of |DGhyb|, for |DGhyb| calculated using several different models. Method of determining error bars for Ip and Kd is discussed in the text. In allplots the sign of DGhyb is negative, and the red lines show values of Ip and Kd predicted by the model. Units of Kd are moles/liter. (a) Ip and (b) Kd from Model I; (c) Ip
and (d) Kd from Variant 1 of Model I; (e) Ip and (f) Kd from Variant 2 of Model I. Blue line in (e) shows value of Ip which minimizes lds (see text). Green line in (e)shows value of Ip averaged over the 95 plotted values. (g) Ip and (h) Kd from Variant 3 of Model I. Blue line in (h) shows value of Kd which minimizes lds. Green line in(h) shows value of Kd averaged over the 95 plotted values. (i) Ip and (j) Kd from Variant 4 of Model I.
e70 Nucleic Acids Research, 2006, Vol. 34, No. 9 PAGE 8 OF 15
by guest on February 2, 2015http://nar.oxfordjournals.org/
Dow
nloaded from

obtained with this model shows that the experimentallyobserved variations in fluorescent intensity with probesequence owe more to the varying degrees of target disso-ciation during the washing process than to hybridization. Thisis not unexpected, as the values of Ip for the various probeshave a double exponential dependence on DGhyb (Equation11), whereas the values of Kd are related to DGhyb by asimple exponential dependence (Equation 4). In Figure 6gand h we plot Ip and Kd as functions of the values of hybrid-ization energy DGhyb calculated from the best-fit parametersobtained using Variant 3. In this case, the values of Kd
(Figure 6h) are not correlated with DGhyb, as they werenot utilized in obtaining the values of DGhyb. The bluesolid line in Figure 6h is the best-fit constant value of Kd
(1.32 · 10�10 mol/l) while the green solid line is the averageof the 95 Kd values obtained by fitting the data for each probeindividually to Equation 10 (1.55 · 10�10 mol/l); the redsolid line in Figure 6g shows the dependence of Ip on DGhyb
predicted by the model.Although it is tempting to use the comparative results for
lds and the Pearson correlation coefficient in Table 1 to rankthe efficacy of Model I and its variants, our goal here is toconstruct a model motivated entirely by hybridization, wash-ing and other physical processes. From this viewpoint, there isno justification for incorporating the hybridization energydependence of Ip in Equation 10 while ignoring the energydependence of Kd (Equation 4), as in Variant 3. We do not,therefore, use the results in Table 1 to promote Variant 3 assuperior to Model I, e.g. but rather to understand how stronglythe various physical processes affect measured intensities. Forexample, the results for Variants 2 and 3 imply that sequencedependent differences in Ip due to washing play a much moresignificant role in determining intensities than do the sequencedependent differences in Kd.
Variant 4 of Model I. Thus far, we have assumed that theactual concentrations of all of the spiked-in genes are equalto their nominal (i.e. reported) values. In fact, it is difficult todetermine the exact concentration of one gene relative toanother; the absolute concentration of each gene is quanti-fied by measuring optical density using a spectrophotomer(T. A. Webster, personal communication). On the otherhand, all of the spiked-in concentrations of a single gene aredetermined by serial dilution of a common sample and thus,relative to one another, are well controlled (T. A. Webster,personal communication). With this in mind, we constructa variant—Variant 4—in which the nominal relative concen-trations (i.e. 1/4:1/2:1: . . . :1024), of each spiked-in gene areassumed correct but the actual concentrations of two genes,both with the same nominal spike-in concentration, may differ.This model therefore requires 13 adjustable scale factors toreflect the relative differences in actual spike-in concentrationfor the 14 genes used in the analysis. The best-fit values ofthese scale factors range from 0.5 to 2.5. Plots of Ip and Kd as afunction of the calculated free energy DGhyb for Variant 4 areshown in Figure 6i and j. The values of lds and the Pearsoncorrelation coefficient are given in Table 1. While this variantdescribes the data more accurately than any of the others, it isimpossible to attach significance to this improvement giventhe large number of adjustable parameters relative to Model Iand the other variants.
Model I/fit_bg. Neither Model I nor its variants are truly pre-dictive, because we have used experimentally determined val-ues for the background; i.e. we have used the average (acrossall replicate measurements) of the zero concentration spike-indata for each probe as the value for bge in Equation 10. Inpractice, one would expect that those probes which hybridizemost strongly with their complementary targets would alsohybridize most strongly with background targets that arenot fully complementary. Hence, assuming that bge resultsfrom probe molecules binding to oligonucleotides otherthan their specific targets and, further, assuming that all pos-sible sequences are represented roughly equally within thesenon-specific target oligonucleotides, one could reasonablyexpect those probes with the largest values of jDGhybj toexhibit the strongest background signals.
In Figure 7a, the experimentally observed background foreach of the 95 probes studied is plotted as a function of DGhyb,as calculated from Model I. The same data are plotted inFigure 7b, after first being binned into nine energy bins.While the unbinned data do not show a well defined trendas a function of hybridization free energy, the binned data arewell described by the sum of a constant and a term whichscales exponentially with DGhyb. Specifically,
bge ¼ 1015e6DGhyb=RT þ 58:5: 13
This best fit is shown as a solid line in Figure 7a and b. Thedeviations of the individual probes from this simple modelsuggest that, in fact, all sequences are not equally representedwithin the non-specific (i.e. background) target oligonu-cleotides and, thus, the observed values of bge are stronglyaffected by cross-hybridization (19) to certain backgroundtarget molecules which are present at anomalously high con-centrations. In other words, the unknown, non-uniform com-position of the background solution makes it impossible topredict accurate values of bge from a physical model.
The background signal produced by cross-hybridizationpresents a fundamental limit for any predictive model of abso-lute gene expression. No model can predict hybridizationintensities more accurately than it can predict backgroundintensities due to cross-hybridization. In Figure 5 and Supple-mentary Figure 1 we plot, as solid red lines, results fromModel I/fit_bg, i.e. Equation 10 with values of Ip and Kd
derived from Model I and values of bge derived fromEquation 13. As expected, these lines fit the data significantlyworse at low concentrations than do plots of Equation 10 whichuse the same values for Ip and Kd but use the experimentallyobserved signal at zero spike-in concentration for bge (i.e. theblue solid lines). This is seen quantitatively in the value of lds;using Equation 13 to model bge results in an lds of 0.224–33%higher than the equivalent model (Model I) which incorporatesthe ‘true’ background. Model I/fit_bg, which uses threeparameters to fit the background data, has three more fittingparameters than Model I, but uses 95 fewer experimental num-bers, since Model I directly incorporates the 95 measuredbackground intensities. Of course, in realistic microarray appli-cations, separate background data will not be available and,thus, in the absence of information concerning the presence ofparticular cross-hybridizing target molecules (19) one must, ofnecessity, use phenomenological expressions such as Equation13 to approximate the sequence dependence of bge.
PAGE 9 OF 15 Nucleic Acids Research, 2006, Vol. 34, No. 9 e70
by guest on February 2, 2015http://nar.oxfordjournals.org/
Dow
nloaded from

One method for estimating bge which would be less phe-nomenological and based more directly on the physics ofhybridization makes use of the 16 fitted nn energy parameters,~eeðb1‚b2Þ, to calculate the energy of hybridization for anyfragment of a background molecule with a string of basescomplementary to some subsequence of a given probe.Assuming that the background is ideally uniform, onecould, in principle, average the hybridization probabilityover all such fragments, producing an estimate for the overallprobability that the probe cross-hybridizes to the backgroundand, hence, an estimate for the intensity. An approach alongthese lines was taken by Zhang et al. (12), although theseauthors introduced a second set of nn-binding energies asadjustable parameters to model the observed non-specificbinding. It is difficult to physically justify the need for aseparate set of binding energies to describe the binding ofnon-specifically bound oligonucleotides and, thus, we havechosen to model the non-specific binding contributions interms of DGhyb through Equation 13. The consequences ofthis decision are not great because, in practice, the non-uniformity of the background would, as we saw above,limit the accuracy of any such estimate (19). In addition,one might consider modeling the MM probe intensities as ameans of reducing the uncertainty introduced by cross-hybridization. We have not pursued this approach becauseit would require another full set of nn energy parameters todescribe the mismatch hybridization energy. Further, previouswork (19) has shown that non-specific binding to the MMprobes is sufficiently different from equivalent binding toPM probes so as to make this method of estimating cross-hybridization ineffective.
CALCULATION OF GENE EXPRESSION LEVELS
Our analysis thus far has dealt with the ability of variousphysical models to accurately predict probe intensities as a
function of target concentration. However, the true utility ofany model lies in the accuracy with which it can utilize mea-sured probe intensities to predict gene expression levels. Todetermine the concentration, c, of a given transcript from thedata obtained from a series of replicate measurements, webegin by averaging the PM probe intensities across all ofthe replicates. We next plot these averaged intensities forall probes corresponding to the transcript in question as afunction of calculated probe hybridization free energyDGhyb. We then perform a least squares fit of this data toEquation 10, where the values of Ip, Kd and bge are heldconstant and c, the only adjustable parameter, is constrainedto lie between 0 and 2048 pM. The means by which the valuesof Ip, Kd and bge are determined is discussed below. For a fit ofthis type to be meaningful, one needs intensity measurementsfrom multiple probes for a given gene. Only 8 of the 14spiked-in genes have 8 or more probes included among the95 good probes studied in Modeling of Probe Intensity Data.In the analysis which follows, we limit our consideration toseven of these eight spiked-in genes [we discard one ofthese eight genes, 407_at, which was identified by Affymetrixas having defective probes (www.affymetrix.com/analysis/download_center2.affx)].
To insure unbiased results, it is important that the probesassociated with the gene being assayed are not included in the‘training set’ from which the parameters Ip, Kd and bge used toassay that gene are derived. Thus, for each of the seven geneswhich we assay, we calculate a unique set of values for theseparameters. That is, for each of the seven genes, we perform aleast squares analysis to calculate best-fit values of ~eeðb1‚b2Þ,Iprobe, G and a using Model I and only those probes (from theset of 95 good probes) which are not associated with thatparticular gene. We then use that particular set of parametersto calculate values of Ip and Kd for each probe fromEquations 11 and 4, respectively. In addition, for eachgene, we calculate a function (of the form of Equation 13)for bge derived using only zero concentration spike-in data for
Figure 7. (a) Experimentally observed background (i.e. average zero concentration spike-in signal) for selected 95 PM probes plotted as a function of |DGhyb|, whereDGhyb is determined by simultaneously fitting Ip and Kd to Equations 4, 7–9 and 11. Values of DGhyb for data plotted are negative. (b) Same data as (a), binned intonine energy bins. Solid lines in (a) and (b) follow Equation 13.
e70 Nucleic Acids Research, 2006, Vol. 34, No. 9 PAGE 10 OF 15
by guest on February 2, 2015http://nar.oxfordjournals.org/
Dow
nloaded from

probes not associated with that gene. The seven sets of valuesfor the parameters ~eeðb1‚b2Þ are plotted in Figure 8. Ideally, allof these sets should be identical. While we observe somevariation from set to set, it is clear from this figure that allof the sets do indeed follow a common overall trend. In car-rying out this procedure, we have effectively constructedseven sets of parameters for Model I/fit_bg from seven dif-ferent ‘training sets.’ We do not follow a similar procedure forany of the variants of Model I because Variants 1–3 do notrepresent physical models, while the large number of addi-tional parameters included in Variant 4 prevent a meaningfulcomparison to other models. That is, Model I/fit_bg representsour basic physical model and, as such, it is the only modelwhose predictive power we wish to compare with AffymetrixMAS v5 software.
The above procedure for calculating target concentrationsfrom probe intensities is illustrated in Figure 9 with data takenfor gene 36085_at at a nominal spike-in concentration of 1024pM. The observed intensities of nine PM probes for this tran-script are plotted as a function of the calculated DGhyb. Theblack line is a best-fit of this data to Equation 10. The best-fitvalue of c is 759 pM. Similar fits for all of the seven genesanalyzed in this fashion, carried out at all concentrationsbetween 0.25 and 1024 pM, are shown in SupplementaryFigure 2.
A comparison between nominal spike-in concentration,concentration as determined using the above procedure, andconcentration determined using MAS v5 is shown in Figure 10for all seven genes and all concentrations between 0.25 and1024 pM. The results from the MAS v5 analysis have beennormalized by a multiplicative factor chosen so as to minimizethe sum of the squares of the differences between the calcu-lated and nominal concentrations. In general, we find that ourmethod yields results closer to the nominal concentrations thandoes MAS v5. Specifically, the sum of the squares of thedifferences between the logarithms of the calculated and nomi-nal concentrations, normalized by the number of genes andconcentrations calculated, for our algorithm is 1.09 while forMAS v5 it is 2.1. Note that in calculating these values, it wasnecessary to exclude those data points for which either ourmodel or MAS v5 predicted a concentration of zero.
To improve our analysis, it is desirable to identify thoseprobe intensities which are either anomalously high or low (9).Such points can be identified by their large distance from thebest-fit curve of the model just described and illustrated inFigure 9. In particular, we calculate the mean and the standarddeviation of the distances from each of the probe data pointsfor a given transcript to the best-fit curve. Discarding all datapoints whose distance from the best-fit exceeds the mean dis-tance by at least 1 SD we then refit the remaining data. Theserefit curves are shown as red lines in Figure 9 and Supple-mentary Figure 2. The data points which were excluded fromthese fits are shown in red. When the data in Figure 9 are refitwithout these points, the best-fit value for c is 881 pM, closerto the known spike-in value of 1024 pM. However, when wecalculate the normalized sum (over all seven genes consid-ered) of the squares of the differences between the logarithmsof the nominal concentrations and the concentrations calcu-lated in this manner, the result is 1.25—not an improvementfrom the value, 1.09, resultant from fitting all of the probes.Note that the probes which are identified as outliers for
measurements at one concentration tend consistently to beoutliers at other concentrations. For example, note in Supple-mentary Figure 2 that the same two data points are identified asoutliers for gene 36085_at data at all spike-in concentrationsbetween 128 and 1024 pM. This suggests that the deviations ofindividual probe intensities from fits to our model are notsimply the result of measurement errors and, therefore, thatthe model could potentially be improved by incorporatingadditional physical features.
Figure 8. Seven sets of best-fit values of the energies ~eeðb1‚b2Þ for b1,2 ¼A,C,G,T obtained by simultaneously fitting values of Ip and Kd to Equations4, 7–9 and 11. These sets were derived using the same data and method as inFigure 4, except that each set was derived after excluding data from one of thefollowing genes: 37777_at, 36311_at, 1024_at, 36202_at, 36085_at, 40322_atand 1708_at. The similarity between sets illustrates the extent to which theenergy values are independent of the datasets used to derive them.
Figure 9. Observed hybridization intensity as a function of calculated |DGhyb|for those PM probes of gene 36085_at which are included in the 95 selectedprobes (see text). Each data point is the average of all replicate measurementstaken for a given probe at target spike-in concentration 1024 pM. The black lineis a best-fit of the data to Equation 10, with concentration c the only adjustableparameter; the best-fit c is 759 pM. The red line is a best-fit to only the black datapoints, the red ones having been identified as statistical outliers (see text); thebest-fit c in his case is 881 pM, closer to the known spike-in value of 1024 pM.
PAGE 11 OF 15 Nucleic Acids Research, 2006, Vol. 34, No. 9 e70
by guest on February 2, 2015http://nar.oxfordjournals.org/
Dow
nloaded from

TARGET FOLDING
One factor not included in our analysis is the effect of targetfolding in solution (40). Typically, hybridization of the targetand probe is a thermally activated process. Helix initiationrequires the formation of a ‘nucleus’ of several base pairs(5 ± 1 bp for oligomers containing only AU pairs and2 ± 1 bp for oligomers containing at least two CG pairs),following which complete hybridization becomes energeti-cally favorable (28). The secondary structure of most targetsin solution results in many of the bases of the target beingbound to other bases on the target. Before a target canhybridize to a probe, we hypothesize that there must be atleast four bases on the target (in the region complementaryto the probe) which are not bound to other target bases.
Prior to the hybridization process, each transcript in asample is digested such that the typical length of a target is50 bases (3). We make the approximation that 26 differentsequenced target molecules are available to bind to eachprobe—these targets each being 50-mer regions of the tran-script, each beginning at a different location relative to theprobe. The assumed target molecules have starting points suchthat the region complementary to the 25mer probe ranges fromthe extreme 30 end of the 50mer target to the extreme 50 end ofthe target. We assume that all 26 targets which complement agiven probe are present in equal concentration.
For each of these 26 targets associated with a given probe,we use the program ‘m-fold’ to calculate the most stable sec-ondary structure (41); we then ask whether this structureincludes four contiguous unpaired nucleotides in the 25merregion of the target complementary to the probe. We thendefine the ‘target concentration scale factor,’ SF, as the fractionof the 50mer targets which possess such a region of contiguous
unbound bases. The product of SF and the actual concentrationof the target represents the effective concentration, ceff, oftarget molecules present in the solution which are readilyable to hybridize to bound probe molecules. In cases wherea given 50mer target has multiple stable secondary structures(within 5% of the folding energy of the most stable config-uration), we assume all of these configurations to be present inequal fractions and weight the contribution of that 50mer to SF
accordingly. Given these definitions, we find that 86 of the 95probes used in our analysis have SF ¼ 1 (i.e. all of the stablesecondary structures for all 26 of the 50mer target moleculesassociated with that probe molecule have regions of at leastfour unbound bases complementary to the probe). Of theremaining nine probes, five have SF > 0.9, while the remainingfour have SF > 0.74. Thus, using four contiguous unpairednucleotides as the criterion for availability of a folded target,we conclude that folding does not significantly limit the avail-ability of targets for hybridization with corresponding probes.
If we instead assume that the secondary structure of thetarget molecules must have five unbound nucleotides in theregion complementary to the appropriate probe molecule, wefind that 10 of the 95 probes used in our analysis have SF < 0.5.In Figure 6b the values of Kd obtained for these probes areplotted in red. If the values of ceff (as calculated by requiringfive contiguous unbound nucleotides on each target molecule)did indeed reflect the concentration of target molecules avail-able to bind to a given probe, then one would expect intensityas a function of concentration to follow Equation 10, with Kd
replaced by Kd/SF. If this were the case, one would expect thebest-fit values of Kd for the 10 probes with SF < 0.5 to all behigher than the corresponding predicted values by factors of atleast 2. As can be seen from the positions of the red points inFigure 6b, the best-fit values of Kd for these 10 probes aredistributed both above and below the solid line correspondingto the predicted values for Kd. This suggests that the require-ment that a target molecule have five contiguous unboundbases which can bind to the probe molecule is too stringent.Assuming, then, that four contiguous bases are sufficient, weconclude that the evidence for folding playing a significantrole in determining hybridization intensities is weak. Ofcourse, a more complete analysis would include a detailedpicture of how partially folded targets hybridize with theircomplementary probes. However, given that such a detailedpicture is not readily available, it is difficult to formulate amore rigorous assessment of the role of target folding onhybridization intensity.
DISCUSSION AND CONCLUSIONS
In the course of modeling probe intensities, we have foundbest-fit values for the energy terms ~eeðb1‚b2Þ and G. The aver-age of the 16 energy terms ~eeðb1‚b2Þ in Figure 4 is �0.55 kcal/mol, whereas, based on measurements of DNA/RNA duplexdissociation in solution, one expects that at 318 K [the hybrid-ization temperature in the Affymetrix protocol (23)] and a saltconcentration of 1 M the average such energy term would be�1.46kcal/mol (insolutionunder theseconditions,Dghybrid0)(31). This indicates that the energy of hybridization is signifi-cantly smaller for substrate bound duplexes than it is forduplexes in solution. If we assume that this difference results
Figure 10. Comparison of best-fit values of concentration of spike-in probes asdetermined using Model I/fit_bg, as discussed in text (red squares), and MASv5 (blue squares). Black squares are at nominal spike-in concentrations; devia-tions from the nominal concentrations appear as deviations from these points.The abscissa indicates the gene fitted as well as the spike-in concentration; foreach gene, the nominal spike-in concentration for each data point is twice thatof the preceding point. The lowest concentrations shown for genes 37777_at,36311_at, 1024_at, 36202_at, 36085_at, 40322_at and 1708_at are 0.25, 1, 8, 1,1, 0.25 and 0.25 pM, respectively. Lower spike-in concentrations are not shownbecause either our model or MAS v5 predicted a value of zero concentration.Note that the results from the MAS v5 analysis have been normalized by amultiplicative factor chosen so as to minimize the sum of the squares of thedifferences between the calculated and nominal concentrations.
e70 Nucleic Acids Research, 2006, Vol. 34, No. 9 PAGE 12 OF 15
by guest on February 2, 2015http://nar.oxfordjournals.org/
Dow
nloaded from
largely from sequence independent destabilizing factors,then it follows that Dghybrid/24 0.91 kcal/mol, i.e. Dghybrid 22 kcal/mol.
One factor which is expected to destabilize hybridizationconfined to a substrate is the increase in the electrostaticenergy which results from localization of the charged oligonu-cleotides at the substrate surface (32–36). In the limit in whichsalt cations are the principle source of charge screening (as isthe case for a 1 M salt concentration such as that used in thehybridization process) this term may be approximated by
Dgel‚ hybrid
RT¼ 8pNslB
r2D
H‚ 14
where s is the number charge density per unit area, H is theaverage height of the probe molecules, N is the average chargenumber of the probe molecules, lB ¼ e2=ekBT is the Bjerrumlength (7 s for water at room temperature) and the Debyelength rD ¼ ð8plBjsÞ
�1=2is �3 s for a 1 M salt solution
(24,32). Assuming an areal probe density of 27 pM/cm2
and an average probe length of nine bases (24,37,38)(i.e. assuming a 10% termination probability at each basealong the probes during probe fabrication), one finds fromEquation 14 that, for a fully hybridized probe, Dgel,hybrid,which we define as the electrostatic contribution to Dghybrid,is equal to 8.6 kcal/mol, <40% of the experimentally observedvalue. This suggests that additional factors may be signifi-cantly weakening the binding between target and probe inthe bound probe microarray geometry. Denoting the sum ofall these additional factors by Dga,hybrid, we conclude thatDga,hybrid 13.4 kcal/mol. In addition, we note that the SDof the 16 nn stacking energies e(b1,b2) measured for boundduplexes in solution is 0.74 kcal/mol (31), whereas the cor-responding result for the ~eeðb1‚b2Þ plotted in Figure 4 is 0.07kcal/mol, suggesting that the effect of differences in nn pairsalong hybridized oligonucleotides is reduced in the anchoredprobe geometry of microarrays relative to equivalent oligonu-cleotides in solution.
We note that Dgel,hybrid depends on hybridization fraction(through the resultant change in s) and, thus, correctly incorp-orating it into Equations 4 and 7 would result in Equation 10no longer describing a simple Langmuir isotherm. Rather,Equation 10 would become a transcendental equation, whereinthe intensity cannot be expressed as a function of parametersnot including intensity itself (32). To avoid this difficulty, weassume an average surface charge which we use to estimateDgel,hybrid independent of the fraction of bound probe mole-cules. This approximation is justified by the observation thateven in the limit of complete hybridization [itself an overes-timate, as probes less than six bases long would probably notbe hybridized at 318 K (24)], Dgel,hybrid is <40% of the totalvalue of Dghybrid.
During the stringent wash (for which the salt concentrationis 0.1 M and rD is �10 s) the nucleotides themselves providethe principle source of screening and Dgel,wash is approximatedas follows:
Dgel‚ wash
RT¼ N lnð8ps0lBr2
D
HÞ þ 1
� �þ N lnð1 þ xÞ‚ 15
where x is the fraction of probes which are hybridized, s0 is thenumber of charges per unit area when x is zero (32), and
Dgel,wash and Dga,wash are the electrostatic and additional con-tributions to the total Dgwash, respectively: Dgwash ¼ Dgel,wash +Dga,wash. From Equation 15 it follows that Dgel,wash rangesfrom 17.9 to 21.8 kcal/mol as x varies from zero to unity.Considering the limit of complete probe hybridization, thedifference between Dgel,wash and Dgel,hybrid is 13.2 kcal/mol,significantly greater than our best-fit value of 1.95 kcal/mol forG, which is defined as the difference in free energies of duplexformation during the hybridization and stringent wash stagesof sample processing, i.e. G ¼ Dgwash � Dghybrid. SinceDghybrid 22 kcal/mol, this yields Dgwash 24 kcal/mol,which, given Dgel,wash 21.8 kcal/mol, implies Dga,wash 2.2 kcal/mol. Thus, under stringent wash conditions, Dgwash,which quantifies the reduction in stability of hybridized probeson a DNA microarray relative to hybridized probes in solution,can be accounted for almost entirely by the electrostatic con-tribution, Dgel,wash. The electrostatic contribution, Dgel,hybrid,to the reduction in stability during the hybridization processitself, i.e. to Dghybrid, is more modest.
As noted earlier, the incorporation of additional physicalprocesses could result in more accurate predictions of probeintensity as a function of target concentration. One factorwhich we have not addressed here is the distribution of thelengths of the probe molecules at a given probe site. Thepresence of such a distribution on Affymetrix microarrayshas been reported and the effects of this distribution ontarget-probe duplex melting temperatures (24), as well ason the reliability of single mismatch detection (42) hasbeen reported. For the experiments analyzed here, however,a simple estimate shows that the hybridization is dominated bythe contributions from the full-length 25mers. This dominanceis a consequence of the longest probes having the highestaffinity for binding to their complementary targets, and occur-ring more abundantly than all but the shortest truncatedprobes, whose binding affinity is very low.
To see this, recall from Equation 3 that the contribution tothe intensity due to the hybridization of a probe n bases inlength is proportional to n
ðnÞprobec=ðKðnÞ
d þ cÞ, where nðnÞprobe and
KðnÞd are, respectively, the number of probes of length n, and the
equilibrium constant for those probes. The 10% truncationprobability (24) as each base is added to the probeduring fabrication implies that n
ðnÞprobe ¼ f nnprobe, where
f n � 0:9n�1=10 is the fraction of probes that are truncatedat length n (for 1 � n � 24), and nprobe is of course thetotal number of probes on a spot. That leavesf 25 ¼ 1 �
P24m¼1 f m, i.e. f 25 0:08, as the fraction of probes
with the full 25-base length.As for K
ðnÞd : Since K
ðnÞd ¼ exp ðDGn=RTÞ, where DGn is the
hybridization energy of an n-base probe, and since DGn can beapproximated by ðn � 1ÞDg, with Dg a typical stacking energyfor nearest-neighbor base pairs, then K
ðnÞd bn�1, with
b � exp ðDg=RTÞ. For the experiments studied here, the quan-tity b can be estimated from the average of our fitted values ofKd (which equals K
ð25Þd ) through the relation Kd b24. Since
the average value of Kd is roughly 150 · 10�12 mol/l(Figure 6), one finds that b 0:39, or b�1 2.57.
In the limit c << KðnÞd , which holds for all but the few longest
probes and highest concentrations in the experimentsstudied here, c=ðKðnÞ
d þ cÞ cðKðnÞd Þ�1
, whereupon thetotal contribution to the intensity from all hybridizedprobes with lengths n from 1 to 24 inclusive is proportional
PAGE 13 OF 15 Nucleic Acids Research, 2006, Vol. 34, No. 9 e70
by guest on February 2, 2015http://nar.oxfordjournals.org/
Dow
nloaded from

to X1�24 P24
n¼1 ð0:9b�1Þn�1=10 or, �(0.9b�1)24/13.1.The contribution, X25, from hybridized probes of fulllength 25 is X25 0:08b�24, whereupon the ratio is X25=X1�24 13:1. Thus the full-length probes account for�93% of the observed intensity. For the highest concentrationtargets, where c ¼ 1024 · 10�12 mol/l and the approximationc << K
ðnÞd does not hold for the largest values of n, this
percentage drops to just below 80%, so the full length probesstill account for most of the observed signal. Thus, while asystematic treatment of the truncated probes is obviouslydesirable, such a treatment seems unlikely to produce signi-ficant changes in our results. This conclusion is consistent withthe results of our earlier work on fitting the Affymetrix data,Ref. (9), Supplementary Data.
In conclusion, we have demonstrated that it is possible tomodel gene expression data using a model-based entirely onthe physical processes underlying hybridization and washingin DNA microarrays, with the resulting best-fit parameters ingood agreement with physically reasonable values. We findthat dissociation of probe and target during the washing phaseof microarray processing provides a reasonable explanationfor the large observed variations in intensity among the probesfor a given gene and target concentration. Finally, we haveshown that our physical model can be used to quantify geneexpression levels fairly accurately, and that fluctuations in thebackground intensity due to cross-hybridization limit the accu-racy attainable. We note that by varying the time and strin-gency of the wash, it should be possible to experimentallyverify the role which washing plays in determining probeintensity. It is hoped that experimental work along theselines will be forthcoming.
SUPPLEMENTARY DATA
Supplementary Data are available at NAR Online.
ACKNOWLEDGEMENT
Funding to pay the Open Access publication charges for thisarticle was provided by IBM.
Conflict of interest statement. None declared.
REFERENCES
1. Brown,P.O. and Botstein,D. (1999) Exploring the new world of thegenome with DNA microarrays. Nature Genet., 21, 33–37.
2. Lipshutz,R.J., Fodor,S.P.A., Gingeras,T.R. and Lockhart,D.J. (1999)High density synthetic oligonucleotide arrays. Nature Genet., 21, 20–24.
3. Lockhart,D.J., Dong,H.L., Byrne,M.C., Follettie,M.T., Gallo,M.V.,Chee,M.S., Mittmann,M., Wang,C.W., Kobayashi,M., Horton,H. et al.(1996) Expression monitoring by hybridization to high-densityoligonucleotide arrays. Nat. Biotechnol., 14, 1675–1680.
4. Statistical Algorithms Reference Guide. Affymetrix Technical Note.5. Irizarry,R.A., Bolstad,B.M., Collin,F., Cope,L.M., Hobbs,B. and
Speed,T.P. (2003) Summaries of affymetrix GeneChip probe level data.Nucleic Acids Res., 31, e15.
6. Irizarry,R.A., Hobbs,B., Collin,F., Beazer-Barclay,Y.D.,Antonellis,K.J., Scherf,U. and Speed,T.P. (2003) Exploration,normalization, and summaries of high density oligonucleotide arrayprobe level data. Biostatistics, 4, 249–264.
7. Li,C. and Wong,W.H. (2001) Model-based analysis of oligonucleotidearrays: Expression index computation and outlier detection. Proc. NatlAcad. Sci. USA, 98, 31–36.
8. Hekstra,D., Taussig,A.R., Magnasco,M. and Naef,F. (2003) AbsolutemRNA concentrations from sequence-specific calibration ofoligonucleotide arrays. Nucleic Acids Res., 31, 1962–1968.
9. Held,G.A., Grinstein,G. and Tu,Y. (2003) Modeling of DNA microarraydata by using physical properties of hybridization. Proc. Natl Acad. Sci.USA, 100, 7575–7580.
10. Levicky,R. and Horgan,A. (2005) Physicochemical perspectives onDNA microarray and biosensor technologies. Trends Biotechnol.,23, 143–149.
11. Mei,R., Hubbell,E., Bekiranov,S., Mittmann,M., Christians,F.C.,Shen,M.M., Lu,G., Fang,J., Liu,W.M., Ryder,T. et al. (2003) Probeselection for high-density oligonucleotide arrays. Proc. Natl Acad. Sci.USA, 100, 11237–11242.
12. Zhang,L., Miles,M.F. and Aldape,K.D. (2003) A model of molecularinteractions on short oligonucleotide microarrays. Nat. Biotechnol.,21, 818–821.
13. Binder,H., Kirsten,T., Loeffler,M. and Stadller,P.F. (2004) Sensitivity ofmicroarray oligonucleotide probes: variability and effect of basecomposition. J. Phys. Chem. B, 108, 18003–18014.
14. Wu,Z.J. and Irizarry,R.A. (2004) Preprocessing of oligonucleotide arraydata. Nat. Biotechnol., 22, 656–658.
15. Zhang,L., Wu,C.L., Carta,R., Baggerly,K. and Coombes,K.R. (2004)Preprocessing of oligonucleotide array data—response. Nat.Biotechnol., 22, 658–658.
16. Naef,F., Hacker,C.R., Patil,N. and Magnasco,M. (2002) Empiricalcharacterization of the expression ratio noise structure in high-densityoligonucleotide arrays. Genome Biol., 3, RESEARCH0018.
17. Tu,Y., Stolovitzky,G. and Klein,U. (2002) Quantitative noise analysisfor gene expression microarray experiments. Proc. Natl Acad. Sci. USA,99, 14031–14036.
18. Dai,H.Y., Meyer,M., Stepaniants,S., Ziman,M. and Stoughton,R. (2002)Use of hybridization kinetics for differentiating specific fromnon-specific binding to oligonucleotide microarrays. Nucleic Acids Res.,30, e86.
19. Wu,C.L., Carta,R. and Zhang,L. (2005) Sequence dependence ofcross-hybridization on short oligo microarrays. Nucleic Acids Res.,33, e84.
20. Wu,Z.J., Irizarry,R.A., Gentleman,R., Martinez-Murillo,F. andSpencer,F. (2004) A model-based background adjustment foroligonucleotide expression arrays. J. Am. Stat. Assoc., 99, 909–917.
21. Binder,H. and Preibisch,S. (2005) Specific and nonspecifichybridization of oligonucleotide probes on microarrays. Biophys. J., 89,337–352.
22. (2001) New Statistical Algorithms for Monitoring Gene Expression onGeneChip Probe Arrays. Affymetrix Technical Note.
23. (2004) GeneChip Expression Analysis Technical Manual. AffymetrixTechnical Manual.
24. Forman,J.E., Walton,I.D., Stern,D., Rava,R.P. and Trulson,M.O. (1998)Thermodynamics of duplex formation and mismatch diserimination onphotolithographically synthesized oligonucleotide arrays. ACS Symp.Ser., 682, 206–228.
25. Atkins,P. (1994) Physical Chemistry, 5th edn. W. H. Freeman, NY.26. Erickson,D., Li,D.Q. and Krull,U.J. (2003) Modeling of DNA
hybridization kinetics for spatially resolved biochips. Anal. Biochem.,317, 186–200.
27. Gadgil,C., Yeckel,A., Derby,J.J. and Hu,W.S. (2004) Adiffusion-reaction model for DNA microarray assays. J. Biotechnol.,114, 31–45.
28. Turner,D.H. (2000) Conformational changes. In Bloomfield,V.A.,Crothers,D.M. and Tinoco,J.I. (eds), Nucleic Acids: Structures,Properties, and Functions. University Science Books, Sausalito,pp. 259–334.
29. Sekar,M.M.A., Bloch,W. and St John,P.M. (2005) Comparative study ofsequence-dependent hybridization kinetics in solution and onmicrospheres. Nucleic Acids Res., 33, 366–375.
30. SantaLucia,J. (1998) A unified view of polymer, dumbbell, andoligonucleotide DNA nearest-neighbor thermodynamics. Proc. NatlAcad. Sci. USA, 95, 1460–1465.
31. Sugimoto,N., Nakano,S., Katoh,M., Matsumura,A., Nakamuta,H.,Ohmichi,T., Yoneyama,M. and Sasaki,M. (1995) Thermodynamicparameters to predict stability of RNA/DNA hybrid duplexes.Biochemistry, 34, 11211–11216.
32. Halperin,A., Buhot,A. and Zhulina,E.B. (2004) Sensitivity, specificity,and the hybridization isotherms of DNA chips. Biophy. J., 86, 718–730.
e70 Nucleic Acids Research, 2006, Vol. 34, No. 9 PAGE 14 OF 15
by guest on February 2, 2015http://nar.oxfordjournals.org/
Dow
nloaded from

33. Peterson,A.W., Heaton,R.J. and Georgiadis,R.M. (2001) The effect ofsurface probe density on DNA hybridization. Nucleic Acids Res., 29,5163–5168.
34. Peterson,A.W., Wolf,L.K. and Georgiadis,R.M. (2002) Hybridization ofmismatched or partially matched DNA at surfaces. J. Am. Chem. Soc.,124, 14601–14607.
35. Vainrub,A. and Pettitt,B.M. (2003) Surface electrostatic effects inoligonucleotide microarrays: control and optimization of bindingthermodynamics. Biopolymers, 68, 265–270.
36. Vainrub,A. and Pettitt,B.M. (2000) Thermodynamics of association to amolecule immobilized in an electric double layer. Chem. Phys. Lett.,323, 160–166.
37. Fodor,S.P.A., Read,J.L., Pirrung,M.C., Stryer,L., Lu,A.T. and Solas,D.(1991) Light-directed, spatially addressable parallel chemical synthesis.Science, 251, 767–773.
38. Pease,A.C., Solas,D., Sullivan,E.J., Cronin,M.T., Holmes,C.P. andFodor,S.P.A. (1994) Light-generated oligonucleotide arrays for rapidDNA-sequence analysis. Proc. Natl Acad. Sci. USA, 91, 5022–5026.
39. Naef,F. and Magnasco,M.O. (2003) Solving the riddle of thebright mismatches: labeling and effective binding in oligonucleotidearrays. Phys. Rev. E Stat. Nonlin. Soft Matter Phys., 68,011906.
40. Mir,K.U. and Southern,E.M. (1999) Determining the influence ofstructure on hybridization using oligonucleotide arrays. Nat.Biotechnol., 17, 788–792.
41. Zuker,M. (2003) Mfold web server for nucleic acid folding andhybridization prediction. Nucleic Acids Res., 31, 3406–3415.
42. Jobs,M., Fredriksson,S., Brookes,A.J. and Landegren,U. (2002) Effectof oligonucleotide truncation on single-nucleotide distinction bysolid-phase hybridization. Anal. Chem., 74, 199–202.
PAGE 15 OF 15 Nucleic Acids Research, 2006, Vol. 34, No. 9 e70
by guest on February 2, 2015http://nar.oxfordjournals.org/
Dow
nloaded from
Copyright © 2022 FDOKUMEN