THE OBSERVED DISRUPTION OF INTENSE RUNAWAY ...
151
THE OBSERVED DISRUPTION OF INTENSE RUNAWAY ELECTRON STREAMS IN A PLASMA BETATRON A Thesis Submitted to the Faculty of Graduate Studies in Partial Fulfilment of the Requirements for the Degree of Doctor of Philosophy in the Deprrtment of Physics University of Saskatchewan by Lloyd Ihomas Shepherd Saskatoon, Saskatchewan AJpril, 1962 The University of Saskatchewan claims copyright in conjunction with the author. Use shall not be made of the contained herein with- out proper acknowlledgement. 223051
-
Upload
khangminh22 -
Category
Documents
-
view
2 -
download
0
Transcript of THE OBSERVED DISRUPTION OF INTENSE RUNAWAY ...

dUftl319S~
THE OBSERVED DISRUPTION
OF INTENSE RUNAWAY ELECTRON STREAMS
IN A PLASMA BETATRON
A Thesis
Submitted to the Faculty of Graduate Studies
in Partial Fulfilment of the Requirements
for the Degree of
Doctor of Philosophy
in the Deprrtment of Physics
University of Saskatchewan
by
Lloyd Ihomas Shepherd
Saskatoon, Saskatchewan
AJpril, 1962
The University of Saskatchewan claims copyright in conjunction with the author. Use shall not be made of the mat~rial contained herein without proper acknowlledgement.
223051

UNIVERSITY OF SASKATCHEWAN
College of Graduate Studies
SUMMARY OF THE DISSERTATION
Submitted in Partial Satisfaction
of the Requirements for the
DEGREE OF DOCTOR OF PHILOSOPHY
by
LLOYD THOMAS SHEPHERD
B.Sc. (Elect. Eng.) 1956 (University of Alberta) M. Sc. (Physics) 1960 (University of Saskatchewan)
DEPARTMENT OF PHYSICS
April 1963
Committee in Charge: Prof. R.N. H. Haslam (Chairman) Prof. H. M. Skarsgard (Supervisor) Prof. L. Katz Prof. 0. R. Skinner Prof. R.W.C. Cobbold Dean B. W. Currie
External Examiner: Prof. F. L. Curzon, Department of Physics, University of
British Columbia, Vancouver.

BIOGRAPHICAL
1935 Born at lv\ed i cine Hat, AI be rta 0
1952 Senior matriculation, Lethbridge Collegiate Institute, Lethbridge, AI berta 0
1956 B. Sc o in Electrical Engineering, University of AI berta, Edmonton, AI berta.
1956-57 Engineer, Defence Research Board, Valcartier, Quebec 0
1957-58 Engineer, Alberta Government Telephones, Edmonton, Alberta 0
1960 MoSco !n Physics, University of Saskatchewan, Saskatoon, Saskatchewan 0
il
THESIS
THE OBSERVED DISRUPTION OF INTENSE RUNAWAY ELECTRON STREAMS IN A PLASMA BETATRON
An experiment has been conducted in an attempt to produce and study the behaviour of an intense stream of energetic electrons. A betatron electric field was used to accelerate electrons within a plasma contained in a doughnut vacuum chamber o The plasma was formed initially by striking a radiofrequency discharge in argon gas at a pressure of about 3 x 10-~ mm Hgo Accelerating electric fields up to 808 x 103 volts/m were used o In addition to the betatron field, a steady azimuthal magnetic filed of 0. 1 w/m2was employed. During the betatron acceleration the current flowing around the doughnut was observed; x-rays emitted from the walls of the vacuum chamber were also studied --by means of techniques especially developed for this work.
Intense streams of accelerated electrons were observed. However, the streams were disrupted soon after their formation. X-rays produced during the disruption showed that the electrons striking the walls of the chamber had considerably less energy than that corresponding to normally accelerated electrons.
This behaviour cannot be explained in terms of interactions between the streaming particles and known electromagnetic fields associated with the stream itself or provided by the experimental system. Furthermore, ordinary binary colI is ions between the streaming electrons and other charged or neutral particles cannot account for the results observed. It is concluded that the disruption of the electron stream is due to an unidentified collective interaction or instability. Some consideration has been given to some types of collective interaction which may be involved.

PUBLICATIONS
Shepherd, LoT o and Skarsgard 1 HoMo Radio-Frequency Breakdown Controlled by Drift of Electrons in an Inhomogeneous Magnetic Field o Can o J o Phys o 39, 983, 1961.
Shepherd, L. T 0 and Skarsgard, H. M. Observed Disruption of Intense Runaway Electron Streams o Phys. Rev 0 Letters _!Q, 1211 1963 o

ACKNOWLEDGEMENTS
The author wishes to gratefully acknowledge the
assistance and supervision of Dr. H. M. Skarsgard
over the past four years. The author is also indebt
ed to the students, especially Mr. J. V. Gore and Mr.
0. D. Olson, who have been associated with plasma
physics during this time.
Financial aid from the Atomic Energy Control Board
of Canada is gratefully acknowledged.

ABSTRACT
This thesis describes an investigation of the prob
lem of producing an intense stream of runaway electrons.
With an argon plasma (density from 4 x 10¹⁰ to 4 x 10¹¹
cm-3 ) in an azimuthal magnetic field of 0.1 webers/m2,
accelerating fields from 8.8 x 10² to 8.8 x 10³ volts/m
were used. Refined Rogowski-coil and scintillation
detector diagnostic techniques were used to study the be
havior of the system. Intense runaway electron streams
were observed. Disruption of the stream occurred approx-
imately 0.4psec after its formation. X radiation was
observed during the disruption. The energy of the elec
trons producing the x rays (approximately 100 kev), is
less than would have been observed if they were acceler-
ated freely from the moment of application of the accel
erating field. It is concluded that the disruption of
the streaming motion is due to an instability.

CONTENTS Page
CHAPTER 1 INTRODUCTION 1 1.1 The Problem 1 1. 2 An outline of the thesis 2-1.3 An historical sketch ~ 1.4 A description of the experiment o
CHAPTER 2 THEORY OF .THE PLAS~~ BETATRON WITH AN AZTI~UTHAL MAGNETIC FIELD, 1. BASIC THEORY 17
2.1 Introduction 17 2.2 Coordinates, §ymbols, and units 19 2.3 Elementary Plasma theory 23 2.4 Runaway electrons in a plasma 27 2.5 Plasma betatron theory 30 2.6 Summary of important results 44
CHAPTER 3 THEORY OF THE PLASMA BETATRON WITH AN AZJPIUTHAL MAGNETIC FIELD, 11. STABIL-ITY THEORY 46 3el Introduction 46 3.2 Five instabilities 4& 3.3 The two-stream instability 53
CHAPTER 4 DIAGNOSTIC TECHNIQUES 62 4.1 Rogowski coil 62 4.2 Scintillation detectors 66
CHAPTER 5 RESULTS AND DISCUSSION 97 5.1 Introduction 97 5.2 Sample results and method o£
data reduction 97 5.3 Experimental results 104 5.4 An interpretation of results 108 5.5 Conclusions 112 5.6 Discussion 113
CHAPTER 6 S~~ARY 122
APPENDIX A THE EFFECT OF A DEVIATION FROM THE BETATRON CONDITION 125
APPENDIX B PHOTOELECTRIC AND COMPTON ATTENUA-TION COEFFICIENTS FOR THE SCINTIL-LATION CRYSTAL AND PYREX GLASS 129
APPENDIX C THE CALCULATION OF EFFECTIVE AND AVERAGE ELECTRON ENERGY CORRESPOND-ING TO CERTAIN X-RAY SPECTRA 133
APPENDIX D The ACCELERATING FIELD WAVEFO~l
REFERENCES
135
138

Table
I
II
III
IV
v
VI
VII
VIII
IX
X
XI
XII
LIST OF TABLES
Summary of calculations on three assumed x-ray spectra
Summary of x-ray transmission and absorption calculations
Sources of error in the measurement of Vt
Results showing effect of variati~ns in V (Peak accelerating field 4.4 x 10 volts/m)
Results showing effect of variati~ns in V (Peak accelerating field 8.8 x 10 volts/m)
Results showing effect of variations in accelerating field
Results showing effect of variations in gas pressure
Characteristic parameters of the CERN and U of S plasma betatrons
Characteristic parameters of two USSR accelerators and the U of S plasma betatron
Composition of pyrex glass
Photoelectric attenuation coefficients for pyrex glass
Tabulation of calculations on certain x-ray spectra
Page
84
90
95
104
105
105
106
114
116
131
131
133

Figure
1
2
3
4
5
6
7
8
9
10
11
12,
13
14
15
LIST OF FIGURES
Photograph of the plasma betatron.
Photograph of the plasma betatron with the upper micarta disc removed.
Diagramatic. __ . representation of the important features of the plasma betatron experiment.
A block diagram of the electronics for the plasma betatron system.
The betatron circuit diagram.
The coordinate system used in this thesis.
Diagramatic · representation of the perturbations of the transverse instabilities.
The solution of the dispersion relation for the two-stream instability.
Curves showing the time of beam disruption due to, or the time that stability ~s secured against the two-stream instability in the plasma betatron.
Photog~ph of the Rogowski coil removed from its shield. _
.....
The circuit diagram for the calibration of the Rogowski coil.
Curves of v/ (1 + )\v ) vs J used in the determination of v by the Rogowski-coil technique.
Photograph of the scintillation detectors with power supplies.
Circuit diagram for the scintillat~?n detectors. ' '
Diagramatical representation of the angular distribution of bremsstrahlung radiation from thick targets.
Page
9
10
11
12
13
20
52
55
58
64
65
67
69
70
75

16 Curve of the efficiency of the NE 102 plastic phosphor as a function of photon energy. 78
17 Curves of transmission coefficients as a function of photon energy for several materials in the plasma betatron experiment. 80
18 Diagram showing the division of the torus into quadrants for the purpose of calculating the re-sultant transmission coefficients. 81
19 Curves showing the resultant transmission coefficients for the apparatus as a function of photon energy. 83
20 The three assumed x-ray spectra with the cor-responding electron energy distributions. 85
21 The 120-kev 'A' spectrum as produced, as de-posited (unfiltered) in the crystal, and as deposited (filtered) in the crystal. 87
22 The maximum and average electron energy for the three assumed distributions as a function of the observed ratio of unfiltered to filtered x-ray energy deposited in the crystals. 88
23 The term V1l/Pd for tbe three assumed distributions as a function of the observed ratio of unfiltered to filtered x-ray energy deposited in the crystals. 89
24 Calibration curves for the scintillation de-tectors. 93
25 Retouched photograph of representative oscillograms obtained during the plasma betatron experiment. 98
26 Diagram showing some of the steps involved in analysis of the oscillograms obtained in the plasma betatron experiment. 100
27 Magnetic field and vector potential profiles for the plasma betatron. 127
28 Photoelectric and Compton attenuation coef-ficients for the NE 102 plastic phosphor as a function of photon energy. 130
29 Photoelectric and Compton attenuation coef-ficients for pyrex glass as a function of photon energy. 132

30
31
The subdivision of the 'B' and 'C 1 spectra into five Kramer spectra.
The accelerating field and current waveforms due to the nonzero rise time of the accelerating field.
134
136

1.1 The Problem
CHAPTER 1 INTRODUCTION
This thesis concerns a plasma betatron experiment in
progress in the Physics Department, University of Saskat
chewan. The experiment was conducted for the purpose of
studying the production and disruption of an intense stream
of runaway electrons, electrons which are accelerated rapidly
to high energies without suffering significant momentum trans
fer due to collisions with the positive ions or neutral gas
molecules.
Interest in producing such a beam of electrons was stim
ulated by Budker (1) in 1956 with the suggestion that in a
relativistic pinched beam of electrons an equilibrium condition
should exist in which the energy gained from an accelerating
field is dissipated by radiation. In 1957-58, a group at CERN,
Geneva (2) constructed two plasma betatrons in an attempt to
reach the so-called 'Budker condition'. They used the plasma
betatron in order to overcome the space-charge limitation on
the current in conventional betatrons.
The experiment reported in this thesis is similar to the
ones carried out by the CERN group - a betatron accelerating
field is applied to a plasma in the presence of a steady
azimuthal magnetic field. The major differences between the
two experiments are that in the experiment reported in this
thesis, the accelerating fields are higher, and the diagnostic
techniques are more refined. Furthermore, the theory of the
plasma betatron has been extended. It will be seen that due
to these factors a clearer understanding emerges of the

- 2 -
processes involved in the plasma betatron.
1.2 An outline of the thesis.
In addition to the experimental work, some theoretical
analyses were carried out. These comprise an investigation of
the problem of the acceleration of electrons in a plasma betat
ron with an azimuthal magnetic field (Chapter 2), and an analysis
of some instabilities (Chapter 3).
In Chapter 2 it is found that:-
(1) Under a wide range of conditions encountered in this
experiment, the forces on the electrons due to the self-field of
the beam current (the pinch forces) are the dominant focusing
forces. There is, however, no constriction of the beam because
of the azimuthal magnetic field.
(2) The self-field of the electron beam produces a distort
ion in the betatron field, as do errors in the current distrib
ution in the betatron winding. It is found, however, that almost
normal acceleration should be possible for the first half micro
second of the acceleration period.
( 3-) Small plasma inhomogeneities may inhibit many electrons
from being accelerated.
In the investigation of instabilities (Chapter 3) most
attention was given to the two-stream instability due to long
itudinal electrostatic oscillations. Under idealized conditions
it is found that the two-stream instability could possibly cause
the disruption of the electron beam in the plasma betatron.
The experimental investigation of the behaviour of the
plasma betatron was carried out as follows. For a range of

- 3 -
plasma densities and accelerating fields, the beam current was
observed using a Rogowski coil which provided information on the
number of electrons being accelerated and the time at which
disruption of the beam occurs. The x rays produced when some
of the electrons strike the walls of the torus are observed
with a pair of scintillation detectors. A technique has been
developed whereby information may readily be obtained on the
number and energy of the electrons producing the x rays. A
description of the Rogowski coil and the scintillation detectors
is the subject of Chapter 4.
The results of the experimental investigation are given
in Chapter 5. The important results are as follows:
(1) An intense beam of electrons is produced in the plasma
betatron. The beam is disrupted because of an instability and
subsequently x-rays are produced in the walls of the torus.
(2) Of the available electrons, not more than half are
accelerated as runaway electrons and not more than a few per
cent are involved in the production of x-rays.
(3) The upper limit on the average energy of the elect
rons producing the x rays is approximately one quarter to two
thirds of the energy of normally-accelerated runaway electrons.
(4} The time of disruption of the beam is found to vary
inversely as the square root of the accelerating field but to
be independent of the plasma density over a wide range of
values.
1.3 An historical sketch
l.J.l Plasma physics.- \'J'hile the activity in the field of
plasma physics has been most intense in the last decade, its

- 4 -
beginnings were much earlier. W. Crookes in 1879 realized
that the phenomenon in discharge tubes may represent a fourth
state of matter. It is interesting to note that several Greek
philosophers, including Aristotle, held that the material
universe was built of the four 'roots'; earth, water, air and
fire. This could be compared to the modern terminology of
solid, liquid, gas, and plasma.
At the beginning of this century the importance of ionized
matter in the processes of outer space was realized by astro
physicists. From their ranks came much of the early contrib
utions to plasma physics.
It was Langmuir, however, about forty years ago, who
developed the basic theory of ionized gases and first named the
ionized gas a plasma. It was the tendency of the ionized gas
to oscillate as a jelly-like substance which suggested the
name plasma. The term protoplasma had been used by biologists
to describe the jelly-like component of cells.
At the time when the thermonuclear reaction was being
exploited in the production of the hydrogen bomb, there was
increased interest in the possibility of setting up a control
led thermonuclear reaction. The interest in controlled therm
onuclear research and space exploration are mainly responsible
for the intense activity in plasma physics at this time.
Most of the effort in controlled thermonuclear research
has been directed through three basic approaches toward the
problem of confinement and heating of a plasma. These approach
es are: (l) The pinch devices in which the confinement is to
be achieved through the self-magnetic field of the current.

- 5 -
(2) The mirror-like devices in which charged particles are
confined by suitably shaped magnetic fields. (3) The Stell
arator which is topologically a torus with a special magnetic
field designed to minimize particle losses peculiar to systems
with nonending geometry.
1.3.2 Relativistic plasma devices.- Devices which involve
relativistic electrons in a plasma have received relatively
little attention. Proposals have been made which concern both
the field of controlled thermonuclear research and that of high
energy accelerators.
One proposal for the use of relativistic electrons in
controlled thermonuclear research has come from Christofilos (3)
with his proposal for the Astron. The Astron is related to the
magnetic mirror machines. It is suggested that a cylindrical
sheet of relativistic electrons circulating in a magnetic mirror
geometry can both confine and heat a plasma.
Another proposal, due to Linhart and Schoch (4), involves
the confinement and heating of a plasma by the use of a beam of
relativistic electrons. It is proposed that the formation of a
pinched beam of relativistic electrons should produce a potent
ial well in which ions are both confined and heated.
In 1956 Budker proposed the use of a pinched beam of
relativistic electrons to provide strong focusing in a particle
accelerator. For highly relativistic beams a steady state
could be expected to be set up in which the dissipative processes
in the electron beam were compensated for by the application
of a steady field. Budkerts analysis showed that radiation
would be an important dissipative mechanism in a highly-pinched

- 6 -
beam. The 'Budker condition' describing the steady state of
a relativistic beam of electrons is expressed as
(Electron energy) in Mev
x (Current) = 17,000. in amps
1.1
If a stable, intense beam of relativistic electrons could
be produced in a betatron, for example, there are many possible
applications. The beam could be used as a guide field for a
thermonuclear reactor or for a high-energy accelerator of small
dimensions. The beam could also be used for producing a very
intense photon flux from bremsstrahlung. Generation of electro
magnetic radiation in the millimeter and sub-millimeter range is
also a possibility.
There are several experiments in various stages of com--
pletion in which the object is the forrnation and study of relat-
ivistic electron beams.
(1) Budker and Naumov (5) reported experiments carried out
at the USSR Academy of Sciences, Moscow. Using a conventional
betatron a 10-amp beam current of 3-Mev electrons was obtained.
(2) Reynolds and Skarsgard (2) reported on the results
obtained from two plasma betatrons constructed at CERN, Geneva,
in 1957~58. Runaway electrons were observed corresponding to
a stable current of 1 amp~re at the full energy of the machine
(2 Mev). Larger currents of runaway electrons could be pro
duced (up to 20 amps) but the electrons struck the chamber
walls after they had gained relatively little energy (about 100
kev).
(3) Finkelstein (6) proposed the construction of the
megatron (short for ~lliGAgauss betaTRON) which is a small-

- 7 -
diameter (10 em) accelerator designed to produce particu
larly strong accelerating fields (up to about 105 volts/m).
Experiments on this device are now underway at the Stevens
Institute of Technology, Hoboken, New Jersey.
(4) de Packh (7) predicted theoretically that the
'Budker condition' may not be required for useful applicat
ions of relativistic electrons in the particle-accelerator
field. Experimental work to investigate these ideas was
proposed.
(5) Miyamoto and colleagues (8) have stated their
intention of carrying out some plasma betatron experiments-
at the University of Tokyo, Japan.
(6) The plasma betatron experiment, currently under
way at the University of Saskatchewan has yielded prelim
inary results. These have been reported briefly by
Shepherd and Skarsgard (9}. A more complete discussion of
the results of this work is the subject of this thesis.
(7) Stephanovski (10) recently reported results of
some experiments on the acceleration of electrons in a
plasma carried out at the Institute of Nuclear Physics,
Moscow. Under similar conditions to those of the experiment
reported in this thesis the electron beam was found to be
unstable.
The results of the experiments of Reynolds and Skars
gard and those of Stephanovski will be discussed at greater
- g -
length in conjunction with the results of the investigation
forming the subject of this thesis.
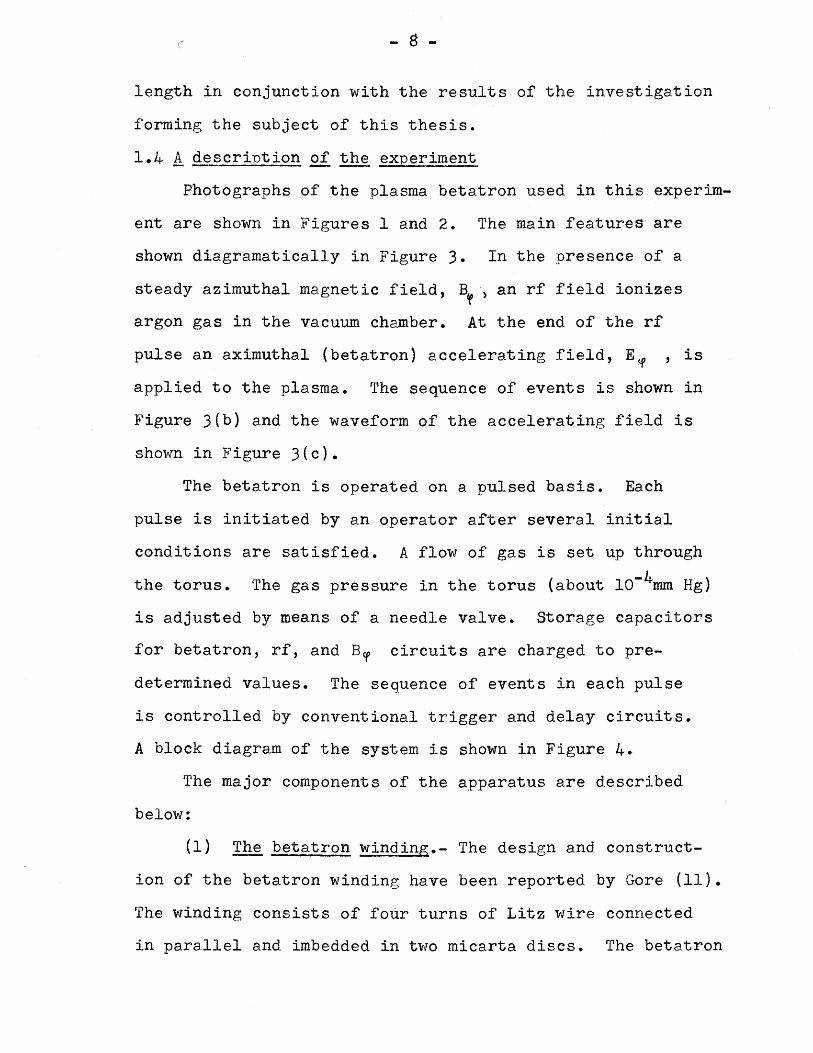
1.4 A description of the experiment
Photographs of the plasma betatron used in this experirn-
ent are shown in lt""igures 1 and 2. The main features are
shown diagramatically in Figure 3. In the presence of a
steady azimuthal magnetic field, Blf ,> an rf field ionizes
argon gas in the vacuum chamber. At the end of the rf
pulse an aximuthal (betatron) accelerating field, Ef , is
applied to the plasma. The sequence of events is shown in
Figure 3(b) and the waveform of the accelerating field is
shown in Figure 3(c).
The betatron is operated on a pulsed basis. Each
pulse is initiated by an operator after several initial
conditions are satisfied. A flow of gas is set up through
the torus. The gas pressure in the torus (about 10-4mm Hg)
is adjusted by means of a needle valve. Storage capacitors
for betatron, rf, and B~ circuits are charged to pre
determined values. The sequence of events in each pulse
is controlled by conventional trigger and delay circuits.
A block diagram of the system is shown in Figure 4.
The major components of the apparatus are described
below:
(1) The betatron winding.- The design and construct
ion of the betatron winding have been reported by Gore (11).
The winding consists of four turns of Litz wire connected
in parallel and imbedded in two micarta discs. The betatron

- 9 -
Figure 1. Photograph of the plasma betatron.

- 10 -
Figure 2. Photograph of the plasma betatron with the upper micarta disc removed.

- 11 -
J Gas inlet
(a)
19cm ~
i To pump
1
Plasma formation
begins
1 E
Plasma formation ends Acceleration begins
(c)
0 I t (psec)
Figure 3. Diagramatic.· . representation of the important features of the plasma betatron experiment.

PUSH BUTTON AZIMUTHAL IGNIT:B.ON -
START CKT HAGNETIC FIELD
DELAY CKT 00\ HIGH VOLTAGE ....__ r-- RF FIELD
0-2 NSEC cff PULSE GENERATOR r-
DELAY CKT VACUUN BETATRON '-- -- -
0-1 MSEC St.JITCHES FIELD
Figure 4. A block diagram of electronics for the plasma betatron system.

- 13 -
100 K lOOK
Figure 5. The betatron circuit diagram.

- 14 -
winding is connected through vacuum switches to two
5-ff capacitor banks. As indicated in the circuit
diagram in Figure 5, the capacitors are charged in parallel
and discharged in series. The betatron circuit rings at
116 kc. Only the first quarter cycle is of interest in
this experiment. The design peak accelerating field is
1.77 x 10⁴ volt/m. Accelerating fields up to half this
value have so far been used.
(2) The switches.- The vacuum switches used to close
the betatron circuit were developed in this laboratory
and have been described by Gore and also Eikel and Skars
gard (12). The switches were triggered simultaneously by
a Bostick plasma gun located in each switch.
(3} The torus.- The torus was custom made of pyrex
glass. The major diameter is approximately 0.38 meters,
the minor diameter approximately 0.06 meters. There are
six ports located on the torus for the purpose of making
gas inlet and outlet connections and for inserting probes
and gauges etc.
The interior of the torus is coated with a layer of
graphite. This was achieved by momentarily filling the
torus with Aquadag--a colloidal graphite solution and
pouring off the residue. The metal rings - forming elect-
rodes used in the production of the plasma- were placed
in contact with the graphite coating at diametrically
opposite points in the torus. Provision was made for the
electrical connection to these rings from outside the torus.

- 15 -
The resistance between the two metallic rings is approx-
imately lOOK.
The torus is connected to a mercury diffusion pump
with a liquid-nitrogen vapor trap. The ultimate vacuum is
in the neighborhood of 10-5mm Hg.
(lr-) 1'he azimuthal magnetic field.- Encircling the
body of .the torus and recessed into the micarta discs are
eighteen coils which provide the azimuthal magnetic field,
B~ • ~hese eighty-turn coils are connected in parallel
through an ignitron switch to an electrolytic condenser
bank. Storage capacity under normal operating conditions
is 400 joules. Peak magnetic fields from 0.01 to 0.15
webers/m2 were generated.
(5) The rf rack.- The plasma is formed in the
torus mainly by means of an rf pulse inductively coupled
into the torus. Weak preionization is achieved by connect
ing the rf pulse directly across the two ring electrodes
·in contact with the graphite coating. Construction of this
apparatus and an investigation of the problem of plasma
formation was reported previously (13) (14).
The rf was either 8 or 15 Me in this experiment. The
amplitude of the rf field decreases with time during the
pulse. It is found that the density of the plasma depends
on the amplitude of the rf. Control of the duration of the
rf pulse therefore provides a convenient control on the
plasma density.
{6) The control circuits.- The control circuits were
constructed by the author and described in his M.Sc. thesis

- ;.-- J_O -
(l3). They consist of pulse_and variable delay circuits
so that the sequence and timing of Bcp , rf, and betatron
acceleration can be controlled.
(7) Diagnostic apparatus.- The apparatus used to
determine the behaviour dT the plasma consists of a pair
of' scintillation detectors and a Rogowski coil. The signals
from the scintillation detectors and the Rogowski coil are
displayed and photographed using a double-beam Tektronix
551 oscilloscope. The diagnostic techniques are described
in detail in Chapter 4.

- 17 -
CHAPTER 2
THEORY OF THE PLASMA BETATRON WITH AN AZIMUTHAL MAGNETIC FIELD
I. BASIC THEORY
2.1 Introduction
The theoretical treatment of a plasma can take many
forms. The approximations which can be made depend on
quantities like the density and temperature of the plasma,
time and length scales, and the magnitude of the electro
magnetic fields. For the case in which the interaction be
tween particles can be neglected in comparison to the par
ticle interaction with the electromagnetic fields, a single-
particle model may be used. Using this model it is assumed
that each particle is acted on individually by the electro
magnetic field. The single-particle model, when applicable,
has the advantage of being simple and the processes are more
readily visualized.
It will be shown that in this experiment the interaction
between particles of the plasma is small compared to the in
teraction with the electromagnetic fields so that the single
particle model is expected to be appropriate. It should be
pointed out however that if this model is to be used the .
electromagnetic fields considered should include the fields
produced within the plasma due to collective particle motions
as well as the externally-applied fields.

- 18 -
In the plasma betatron experiment the plasma experi
ences many electromagnetic fields - accelerating and fo
cusing fields of the betatron, self-fields due to the cir
culating electron current, electrostatic fields due to
charge separation and the applied azimuthal magnetic field.
A description of the resultant behaviour of the plasma is
the object of this chapter. The question of stability will
be considered in the next chapter.
After the coordinates, symbols, and units are defined
some elementary plasma theory is presented as a foundation
for the analysis which follows. This elementary theory in
cludes the equations of motion and the equations for parti
cle drifts which form the basis of single-particle theory.
Two aspects of a plasma are then discussed briefly; the
tendency for a plasma to maintain charge neutrality and col
lision phenomena in a plasma. The elementary plasma theory
is given in many texts - for example those by Spitzer (15),
Chandrasekhar (16), Rose and Clark (17), and Glasstone and
Loveberg (18) - and therefore the derivation of the equations
is not included in this thesis.
The production of runaway electrons in a plasma is the
first question of interest in this experiment. A simple de
scription of the runaway process for a uniform plasma is
given in Section 2.4.1. This is followed by a crude descrip
tion - original to this thesis - of the effect on runaway of
inhomogeneities in the plasma density.

- 19 -
The expected behaviour of the system during the early
stag~s of the betatron acceleration is given in Section 2.5.
A description and comparison is given of the forces on the
electrons due to the betatron field, the forces due to be
self-fields of the circulating current, and possible elec-
trostatic forces. A discrepency in the literature regardcu.rrent
ing the beamAlimitation of plasma betatrons is pointed out
and resolved. Time-dependent equations are presented de
scribing the drifts of electrons in the azimuthal magnetic
field. These include time-dependent solutions of the radi
al motion of the plasma due to the disturbing effects of
large beam currents and possible defects in the betatron
field. These time-dependent solutions are original to this
thesis.
2.2 Coordinates, symbols, and units
The coordinate system used in this thesis is a combina
tion of cylindrical and toroidal coordinates. Normally cy
lindrical coordinates z, !'' and f are used for quantities
which exist both inside and outside the beam and the toroid-
al coordinates r, ~ and f for quantities inside the beam.
Often it is convenient to neglect the finite curvature of
the beam and picture the beam as a cylinder of infinite ex
tent. The coordinate system is illustrated in Figure 6.
Unless noted otherwise in the text, the symbols used in
this thesis are defined as follows:

- 20 -
z
Figure 6. The coordinate system used in this thesis.

-21-
a acceleration
A magnetic vector potential
b electron beam minor radius
B magnetic field
~ velocity of light
C arbitrary constant
d width or thickness
e charge on the proton
E electric or accelerating field
f =m/M + :ft
:f' ratio of the number o:f electrons at rest to the
number of runaway electrons
F force
G geometrical factor (see Section 4.2.1)
h Debye shielding distance
i,I current
j lb.minous intensity
k wave number
K constant
t mean free path
L inductance
m rest mass of electron
M mass of ion
n number density
N number of turns
p radiation energy

- 22 -
q charge
~o = e 2/4ITE0 mc2 ; the classical radius of the electron
s distance
S angular distribution shape factor (see Section 4.2.2)
t transmission
T a factor related to transmission (see Sections 4.2.1 and 4.2.5)
U electron temperature in electron volts
v velocity
V voltage
w drift velocity
W energy
Z atomic number
~ imaginary component of w
~ ratio of electron velocity to that of light
[ a small displacement
r = (1 - ,6 2>-t
EG Permittivity of free space
€ error in current ratio in betatron winding
yt efficiency
~ a factor related to efficiency (see Sections 4.2.1 and 4.2.5)
A geometrical factor related to inductance (see Section 2.5.3)
1\ ratio of maximum to minimum impact parameter
fo permeability of free space
v number of electrons in a slice of beam of thicknes·s /l0
•
(The slice is contained between two planes which are perpendicular to the beam axis)

- 23 -
fb equilibrium orbit of the betatron
tS Jcross section
lattenuation coeffiecient for Compt~on effect
r [exponent for plasma oscillation amplification
lattenuation coefficient for photoelectric effect
P magnetic flux
w angular frequency
GJpe. = (ne2 /m €0 )~
Wpi. = (ne2 /M €0)~ the electron plasma frequency
the ion plasma frequency
Rationalized MKS units are used in this thesis unless
otherwise stated.
2.3 ~lementary plasma theory
2.3.1 Eguations Qf motion.- The basic equation of motion
of a particle with electric charge q and mass m in an elec
tric and magnetic field is ...lo ~
m d~/dt = q(E + ~ x B). 2.1
If there is no electric field the particle will execute a
helical motion with angular frequency
We.= qB/m. 2.2
The angular frequency, ~c. , is called the cyclotron fre-
quency or gyromagnetic frequency or sometimes the Larmor
frequency.
2.3.2 Particle drifts.- The solution of equation 2.1 is
best described in terms of a circular motion and the motion
of the instantaneous center of gyration (called the guiding

- 24 -
center). The motion of the guiding center perpendicular
to the magnetic field is called the drift of the particle
in the magnetic field. For the case of a constant elec
tric and magnetic field the steady-state drift velocity
is 2.3
This equation is valid so long as wd <c. The direction
of drift is the same for particles with either positive
or negative charge.
The cross-field drift described above will also re-
sult from other external forces. The equations will ap-
ply if the force is expressed in terms of an equivalent
electric field,
F/q. 2.4
2.3.3 Electrical neutrality.- A basic property of a plas-
rna is its strong tendency toward neutrality. If, over a
large volume of plasma, the number of electrons differ ap-
preciably from the corresponding number of ions large
electrostatic forces tend to restore neutrality.
Under normal conditions the distance over which a
plasma may not be neutral is given by the Debye shielding
distance,
h = ( 2 € o U I 3ne) ~. 2.5
The Debye length also represents the approximate distance
over which the coulomb field of a particle is effective
in a plasma and gives the approximate thickness of the
sheath formed between a plasma and the walls of its con-

- 25 -
tainer.
In the plasma betatron experiment it is often convenient to express the plasma density in terms of the dimensionless quantity v , the number of electrons in a slice of the beam one classical electron radius in thickness. (The slice is contained between two planes which are perpendicular to the beam axis). If all the electrons are in a uniform beam of minor radius b, then
2.6
From equations 2.5 and 2.6, for a charge-neutralized beam of radius O.D2 m in which the electrons have a random energy of 10 ev,
h = ).6 X 10-5 V-~. 2.7
2.3.4 Collision phenomena in ~ plasma.- It is found that the coulomb field of the particles in a plasma are of such a long-range nature that each particle is influenced by many other particles simultaneously. As a particle moves through a plasma it will suffer many small deflections but there will be a net scattering effect similar to the classical large angle scattering. A collision cross section for scattering through 90° can be determined (18).
c:r =~ e4ln /\/2 rr to 2m2v4
= e2ln A /BTT Eo 2u2
= 8rr IT.o 21n 11 c4 /v4
2.8
where f\ =maximum impact parameter (taken to be h) divided by the minimum impact parameter. For plasmas of interest in this experiment, lnA is about 10. The cross

- 26 -
section decreases rapidly with increasing electron energy.
For 10-ev electrons, the cross section is approximately
1.3 x l0-18 m2/ion.
From these results a mean free path may be calculated.
For 10-ev electrons
fL=l/na
~ 4/v. J 2.9
It is understood that this mean free path is the length of
path an average electron would traverse while being scat
tered through 90°.
The time taken for a particle to traverse its mean
free path is called the 'relaxation time', t~. It is a
measure of the time taken for appreciable change in momen
tum of the particles and so indicates the rate at which a
nonequilibrium state returns through collisions to an equi
librium state.
tr = 1/ncr v. 2.10
It is found that for electron-electron encounters and elec-
tron-ion encounters, tr is approximately the same. For
10-ev electrons
- -6;,) tr - 2.3 x 10 v . 2.11
Comparing tr for 10-ev electrons with the cyclotron
period it is evident that for magnetic fields (0.1 webers/
. m2) and beam densities ( ')) = lo-3 to 1) of interest in this
experiment, the electrons make many revolutions in the mag-
netic field between 'collisions'. The single-particle ap-

- 27 -
proach is then justified provided collective interactions
are treated explicitly. Note that tr increases as the
energy of the electrons increases - through a betatron
acceleration for example - but that even for the 10-ev
electrons tr is longer than the total acceleration period
for ).) values encountered in this experiment.
2.4 Runaway electrons ill ~ plasma
2.4.1 The runaway effect in~ uniform plasma.- When a
particle moving in a plasma gains momentum continuously
from an applied field it is said to be 'runaway'. Sever
al workers, including Dreicer (19) and Harrison (20)(21),
have investigated the conditions under which electrons in
a plasma may be accelerated continuously and become de
coupled from the positive ion background. Dreicer's treat
ment is the most rigorous one which has been carried out.
Dreicer, neglecting collective effects, designates elec
trons with drift velocity several times the mean thermal
velocity as runaway electrons. Harrison would call these
'suprathermal' while reserving the term runaway for those
which gain energy continuously in spite of collective ef
fects. In this thesis Dreicer's definition will be used
as collective effects will be considered as part of the
larger question of instabilities.
In the treatments of the workers referred to above,
the dynamical friction force was evaluated using the Boltz
mann equation. The electric field required to overcome

- 28 -
this friction force - and hence produce runaway - was
then determined. While Dreicer's work should be referred
to for the most accurate description of the runaway pro
cess, a simpler treatment due to Linhart (22) is adequate
for the purposes of this thesis. This 'mean-free-path'
approach is given below.
Under a constant accelerating field, E, the drift
velocity of the electrons is
v = eEt/m
while the distance traversed by the electrons is
s = eEt2/2m.
2.12
2.13
From equations 2.8, 2.~and 2.13 the mean free path of an
electron in the plasma is found to be
2.14
Since the mean free path varies as t4 while the distance
travelled varies only as t2, if an average particle does
not suffer a 'collision' before 1/s reaches unity it will
not be involved in a collision thereafter. The critical
electric field, Ec, for the free acceleration of all elec
trons may be found by setting J/s equal to unity after a
time equal to the average collision time, tr· Ec = ne 2lnl\ /(128)
1/3 77 c0
2UJ
~ 60-J/u. -2.15
The value of Ec calculated here is three times greater
than that computed by Dreicer.

- 29 -
2.4.2 The runaway effect in~ inhomogeneous plasma.- If
an accelerating field is applied to an inhomogeneous plas
ma there will be electrostatic fields set up due to the
separation of electrons and ions in an inhomogeneity. If
the accelerating field is not sufficiently strong to sep
arate completely the electrons and ions in the inhomoge
neity a potential barrier is erected which may trap some
of the electrons.
The potential, although possibly due to a small in
homogeneity, could trap many electrons if the electrons
did not initially have sufficient energy or did not re
ceive enough energy from the accelerating field to pass
over the potential. The fate of the electrons would be de
termined in a time comparable to the time taken for an elec
tron to move one wavelength. In an experiment of the kind
described here the time involved would probably be less than
10-8 sec - shorter than the time taken for the accelerating
field to reach its maximum value. It would appear that the
initial velocity distribution of the electrons is more sig
nificant in determining how many electrons escape the in
homogeneity than the maximum value of the accelerating field
or the magnitude of the inhomogeneity.
Of course under certain conditions all electrons could
be accelerated in spite of a density inhomogeneity. The
field required to decouple the electrons and ions from an

- 30 -
inhomogeneity of density An and wave number k is
2.16
The field Ec can be regarded as a critical electric field
for the acceleration of all electrons over an inhomogeneity.
In the plasma betatron, if the inhomogeneity is associated
with the spacing of the coils producing the azimuthal mag
netic field, for a beam of radius 0.02 m
Ec = 5 x 10⁵ ).) volts/m. 2.17
The analysis given above is little more than qualita
tive. No estimate about the number of electrons which will
be accelerated normally can be made at this point. The
tendency for the fields to smooth out the inhomogeneity
may release some of the electrons subsequent to the initial
trapping.
2.5 Plasma betatron theory
2.5.1 Introduction.- The purpose of this section is to
describe the forces acting on the electrons in the plasma
betatron and determine if possible the effect of these
forces. The betatron field provides the acceleration to
the electrons as well as a focusing force. The magnetic
fields due to the circulating beam current produce the well
known pinch forces along with a radial force tending to move
the beam to the axis of the betatron. The effect of the
azimuthal magnetic field will be considered.

- 31 -
Several approximations will be made in the theory set
down here. In addition all equations neglect relativistic
effects. The equations therefore apply to the initial
stages of the acceleration only. It will be seen that this
is not a serious limitation.
2.5.2 The force equation.- The net unbalanced radial force
on an electron in the plasma betatron may be written
F = -ev tf Bz + mv <f 2 I {J . 2.18
The velocity of the electron may be written in terms of the
magnetic vector potential A~(23),
Vcp = eA lf I m. 2 • 1 9
In the cylindrical geometry of the plasma betatron Aq is a
function of ~ and is given simply by
f I2Trf ]
= ( J B., f' d(> ) I fl . 2.20
It is assumed in calculating the various forces that
the electrons are 'frozen' to the lines of azimuthal mag-
netic field and do not move in a radial direction. It will
be shown in Section 2.5.5 that the electrons actually ro-
tate about the equilibrium orbit so that the velocity given
by equation 2.19 will be in error. However since the ro-
tation near the beginning of the acceleration is slow and
since in the plasma betatron the variation of A~ withf'
is slight, the error introduced will be small.
The magnetic vector potential, A~ , is made up of con
tributions from the betatron field, Ab, and the self-field

- 32 -
of the beam, As,--both functions of~ •
Acr = Ab + As. 2.21
The magnetic field Bz is made up of a z component, Bb,
from the betatron field and two z components from the
self-field, Bt and B~.
Bz = Bb + B~ + B~. 2.22 s
The component of self-field, B1, is the magnetic field s that would be produced if the beam were straight and B2
is the component of magnetic field due to the curvature
of the beam.
Substitution in equation 2.18 shows the resultant
radial force on an electron to be 2.23
F= -e2Ay (Bb-Ab/? )/m- e2Atp Bl/m- e2Atf (B~-As/p)/m.
The first term in the above equation is the betatron
focusing force and the second term is the self-focusing
(pinch) force. The third term is a radial force due to
the self-fields of the circulating current. The part in
volving B~ represents a force tending to expand the orbit.
The part involving Aslf represents a self-inductance ef
fect whereby the electrons have a reduced energy which
tends to reduce the orbit. It will be shown that for a
betatron of the type described in this thesis the third
term represents a net force directed radially inward.
2.5.3 Reduction of accelerating field~ !Q ~~-field.
It is convenient now to consider the effect of the self-field
on the accelerating field and the energy of the accelerated

- 33 -
electrons. If Y represents the runaway electrons then the
beam current will be
I 2.24
where A~ is the average vector potential over the beam
cross section. Since the electric field induced by the
beam current is the time derivative of the vector potential
(24), one may write
2.25
The inductance, L, of the beam is dependent on the geom-
etry and is given by
L = l0-72rrf>;}
where (25)
~ = 0.66 + 2 ln (f>lb).
2.26
2.27
The magnetic vector potential due to the beam current
is found from the above equations to be
2.28
From equations 2.21 and 2.28 the resultant vector potential
i s x"' = A b 1 < 1 + r. v ) . 2 • 2 9
The above equation shows that the accelerating field
is reduced by a factor (1 + AV) in the nonrelativistic re-
gion. From the above equations and using the relation be-
tween vector potential and accelerating field,
di I d t = 1 0 7 E b v I ( 1 + A ')) ) • 2.30
It is convenient in this experiment to refer to Eb as the

- 34 -
accelerating field rather than the actual accelerating
field which is smaller by the factor (1 + ./\ V ) . It is
evident that for any given accelerating field there is an
upper limit to the beam current.
2.5.4 The forces in the plasma betatron.- (1) ~
betatron focusing force.- In cylindrical geometry
B b = A b If> + d-Ab to-f> 2.31
hence the term for betatron focusing in Equation 2.23 be-
comes
2.32
Data on the betatron in this experiment (11) indicates
that in the region of interest
2.33
This holds up to r ~ 0.02 m where oAbldp reaches a max-
imum:~: The betatron focusing force may now be written
(assuming A'l ~ Aq )
Fb = 15e2Ac,o Abrlm. 2.34
The force is roughly independent of the coordinate 8 and
is directed toward the equilibrium orbit.
(2) The pinch force.- The self-magnetic field, Bf, depends on the beam current and the distribution of the
current in the beam. For an electron beam with a uniform
distribution over a circular cross section of radius b,
the magnetic field Bt within the beam may be written
Bl = ,?o i.. I 2 7T r 2. 35
" b/ . .. ~ ()A ~f' :ts co1n•.ected tll tbe field :i.nc1e:;~, n, :tcb. 'To.r~1es fro:":. 0. 3 to 0., over tbo ::.~esloD. of 5.:r:_ teres t. 11;e index is indepe~~2nt of t~~e.

- 35 -
where r is the distance from the center of the beam and i
is the current within the circle of radius r. The current
is given by 7 ) - 2 i = -10 YAo/ (r/b) . 2.36
Using the equations 2.35 and 2.36 the term for the pinch
force in equation 2.23 may be written (assuming Alf ~A.ff)
FP = 2e 2Acp 2 Y r/mb2 • 2. 37
The pinch force is independent of 9 and acts toward the
center of the beam.
(3) The radial force ~ !Q the ~-field.- An ex
pression for the component of self-magnetic field, B~, has
been derived by Reynolds and Skarsgard (2).
B~ = -A, J(2 + /\ )/2{J
where ~ is the coordinate of the center of the beam.
ing equations 2.28 and 2.38 the radial force due to the
self-magnetic field may be obtained from equation 2.23
(assuming Ay ~ Ar )
2.38
Us-
F s = -e 2 A<f 2 V ( A -2) /2m~ • 2 • 3 9
For the electro.m beams encountered in this experiment A> 2
so that Fs is a force directed toward the center of the
betatron.
(4) Electrostatic forces.- It was noted in Section
2.3.3 that plasmas have a strong tendency to neutrality.
There are at least two situations which may produce strong
electrostatic forces in the plasma betatron experiment.

- 36 -
(a) Separation of the electron and ion streams.
The force on an electron in a beam due to a separation
S of the centers of the electron and ion beams is giv
en by (26)
2.40
where b is again the radius of the beam.
(b) Excess loss of electrons.- Under some condi
tions electrons may be lost from the beam and strike the
walls of the chamber. The electrostatic fields set up
would tend to reduce further loss of electrons and to ac
celerate the ions toward the wall. The force on the
electrons--a focusing force--is readily calculated from
Gauss' Law. For the uniform loss of electrons from a
beam of radius b,
Fe 2 ~ mc 2r/b2 2.41
where YL corresponds to the electrons lost from the
beam.
2.5.5 The Comparison Qf the Forces ill the Plasma Betatron.-
(1) Comparison of the betatron and pinch focusing
forces. From equations 2.29, 2.34, and 2.37 the relative
magnitude of the betatron and pinch forces may be deter
mined.
2.42
For b = 0.02 m
Fp /Fb = 3. 3 X 10² -J I (1 + ~V). 2.43

- 37
It is evident that for v ::?J x 10-3 the pinch forces dom-
inate over the betatron focusing forces.
f2) Comparison of the betatron focusing force and the
radial force due to the self-field.- The self-field effect
will tend to move the electron beam toward the center of
the betatron. Such a movement would be opposed by the
betatron focusing force. It is interesting to determine
under what conditions the two forces balance. From Equations
2.29, 2.37, and 2.39, the two forces would be in equilibrium
when
_ 2P -: ··b
A
2.44
The betatron field configuration and the value of ~ are
fixed; consequently there is a max~um value of v for which
an equilibrium orbit will exist within the betatron chamber.
Taking b = 0 •. 02 m for the betatron in this experiment, the b/' . value of A. is approximately 5. Calculating (' o A ~f }max
from data given by Gore then indicates that
V max = 0.032. 2.45
The result (2.44) is essentially the same as that given
by Maisonnier and Finkelstein ( 27) for Jt....V ~~ 1. More
recently Schmidt (23) has obtained a different result based
on a self-consistent theory. However he has neglected the
forces tending to expand the beam. His result for Vmax is
therefore too low. The equation 2.44 is believed to be the
correct self-consistent equation. The vmax calculated in
this way is larger than that calculated by the Maisonnier
and Finkelstein equation.

- 38 -
(3) Comparison Qf electrostatic forces !Q other
forces.- The electrostatic force due to the separation
of the electron and ion beams may readily be compared to
the radial force due to the self-field. With the two
forces equal the separation of the axes of the electron
and ion beams is found from equations 2.39 and 2.40. Ex-
pressed as a ratio of separation to beam radius,
&/b 2.46
For 100-kev electrons in a beam 0.02 meters in diameter
Sjb = 0.035. 2.47
This indicates that the radial force due to the self-field
discussed in Section 2.5.3 would not produce large move
ments in the electron beam without moving the ion beam as
well.
The force on an electron due to the electrostatic
field set up by the loss of electrons from the beam may
usefully be compared to the pinch forces. By equations
2.37 and 2.41 one finds that for this electrostatic force
to be larger than the pinch force,
Y.,.lv 7 f2. 2.48
For example, this indicates that if 10% of the electrons
were lost from the beam the electrostatic forces would be
stronger than the pinch forces until the electrons reached
an energy of about 28 kev.

- 39 -
2.5.6 Particle motions ill~ plasma betatron.- In ad
dition to the motion of the electrons in the azimuthal
direction, it is of interest to examine the motions in
the p-z plane due to the various forces described in
Section 2.5.4.
(1) Electron drifts due 1Q the focusing forces.
The focusing forces will produce an equivalent E/B drift
in the azimuthal magnetic field. The drift is in the 8
direction and so produces a rotation of the beam about
the beam axis. In most normal circumstances encountered
in the plasma betatron of this experiment the pinch force
is the dominant focusing force.
For the steady-state equations of crossed-field drifts
to apply, two conditions must be satisfied. (1) The time
scale for changes in the magnitude of the forces must be
small compared with the cyclotron period of the particle
in the magnetic field; and (2) the calculated drift veloc
ity must be less than the velocity of light. In this ex-
periment the focusing force increases with time according
to t 2 • For an azimuthal magnetic field of 0.1 webers/m2
-8 and after a time greater than 10 seconds, an electron
completes one cyclotron orbit in the magnetic field while
the focusing force increases by less than 10%. The cal
culated crossed-field drift is normally much smaller than
c. The equations in Section 2.3.2 are therefore accurate
enough for the purposes of this thesis.

- 40 -
The angular frequency of rotation is found from equa-
tions 2.3 and 2.37.
-2 -) 2 We = 2eACf v /mB1 b . 2.49
The total angle through which the beam has rotated is giv
en by
2.50
For a beam with b = 0.02 m; Bf = 0.1 weber/m2; Eb =
4.4 X 10³ VOlt/m, the maximum rate of rotation is for Y~
0.2. It is found that under these conditions the beam
completes one radian of rotation by time t = 0.07 psec at
which time the energy of a normally accelerated electron
is 2 kev. The rate of rotation increases rapidly after
this however.
A comparison between the frequency of rotation in the
e direction and the frequency of circulation in the f di
rection may readily be obtained.
2 Y Acr r> /B'f b2 J ~ 16 f3 y .
2.51
For Y = 0.2, wefw'f would be unity when the electrons
had an energy of 27 kev.
In the above equations the centrifugal force due to
the rotation in the e direction has been neglected. For
high values of We this becomes important and the equa
tions no longer hold. It can be shown that the centrifug
al force becomes important only when uJe is comparable to
When the centrifugal force is taken into account

- 41 -
the angular frequency of rotation is limited to a maximum
value given by
2.52
Note that this value is independent of the azimuthal mag
netic field - so long as the cyclotron radius is small
compared to the beam radius.
The drifts which are produced in the beam have the
result that no contraction of the beam can take place.
The pinch forces are transformed away by the electron
drifts in the azimuthal magnetic field.
(2) Motion Qf ~ beam due !Q the radial force ~
the self-field.- Often in the course of this experiment
actual y ·values are encountered which exceed the vmax
as given by equation 2.45. In these circumstances it is
important to estimate the time required for the radial
force due to the self-field to have a significant effect
on the beam.
Chandrasekhar (16) has shown that-if a plasma is sur
rounded by nonconducting walls and experiences a net force
perpendicular to the magnetic field it is accelerated in
the direction of the force. The acceleration is dependent
only on the total force and the total mass and is given
simply by Newton's Second Law. This somewhat idealized
model will be employed here in calculating the expected mo
tion of the beam in the plasma betatron experiment due to a
force in the radial direction. In any case this accelera-

- 42 -
tion will be an upper limit to the correct value.
The upper limit on the acceleration of the beam due
to the radial force associated with the self-field is
a Fs/M
e2.A~ .Y ( /\ - 2) /2mMp. } 2.53
Substituting for Af and integrating, the displacement of
the beam from its initial position is
e2 y ( /l 2 4 ;)v) 2. s 2)Eb t I 24rriM ~ (1 + 2.54
For ~ 5; b E = 4.4 X 10³ volt/m and singly ionized ar-
gon the time taken for a displacement of 0.02 m is given
.. 2.5 X 10-l 1 1
by t' <1 + /)Y )~ v--t;. 2.55
The time required for this displacement therefore is a
slowly varying function of ~. The minimum value of t'
under the stated conditions occurs for about V= 0.2 and
has the value of 0.54 psec.
The value oft' is indicative of the time taken for
the beam to reach the equilibrium position (in the sense
of equation 2.44), or, if J exceeds the value for which
an equilibrium exists, t' is indicative of the time taken
for the beam to reach the wall of the chamber.
(3) Motion of the beam ~ !Q errors ill ~ betatron
guide field.- An estimate of the magnitude of the radial
force on an electron resulting from an incorrect current
distribution in the betatron winding is given in Appendix
A. The result is in terms of E, the fractional error in
the ratio of currents in the inner and outer turns. The

- 43 -
result is a net outward force if the current in the inner
turns is too large and a net inward force if the current
in the inner turns is too small. This radial force is
given by
Fe = 0.6Ee2~ Ab/mp. 2.56
As was the case for the force due to the self-field,
a force Fe will tend to move the beam towards a wall of
the chamber. The upper limit on the magnitude of the ac-
celeration is given by Newton's Second Law. The displace
ment of the beam in the radial direction will be
s = 0 • 6 € e 2 E b 2
t 4 /12rnM ;0 ( 1 + 71 V) • 2 • 57
With an accelerating field of 4.4 x 10³ volt/m, an error
in the current ratio of 10% will cause a beam of electrons
of low Y value and singly ionized argon ions to move 0.02m
in approximately 0.55 psec. The time required would be
somewhat longer for a beam of high Y value.
Incidentally one may estimate the maximum value of E
which will still yield an equilibrium orbit within the
betatron chamber. By equating the radial force due to the
error in the current distribution to the betatron focusing
force at r = 0.02 m (where it is a maximum), one obtains
from equations 2.34 and 2.56 that
E = 0.095. max 2.58
The above results show that an error of 9% or more in
the ratio of the currents in the inner and outer turns
causes serious changes in the betatron guide field. Errors

- 44 -
of this magnitude however will not cause significant move
ment of the beam until approximately one half microsecond
after the beginning of the acceleration.
2.6 Summary of important results
The theory presented in this chapter predicts the
following:
(l) Only moderate accelerating fields are required
to produce large numbers of runaway electrons. Acceler
ating fields in excess of 10 volts/m should, in the ab
sence of inhomogeneities in the plasma, decouple the elec
trons from the .ions under the conditions of this experiment.
Small inhomogeneities in the plasma may however trap large
numbers of electrons.
(2) One effect of the self-field of the circulating
electrons is to reduce the accelerating field. The accel
erating field - and hence the electron energy - is reduced
by a factor (1 + ~V ). This becomes important in this ex
periment for Y> 0.05 and leads to a current limitation in
the plasma betatron.
(3) For V >3 x 10⁻³ the pinch forces are stronger
than the betatron focusing forces but no constriction of the
beam occurs due to the presence of the azimuthal magnetic
field.
(4) An error of about 9.5% in the ratio of the cur-
rents in the inner and outer turns of the betatron winding

- 45 -
will destroy the betatron condition.
(5) There is an upper limit to the number of elec
trons which may be accelerated in an equilibrium orbit in
the plasma betatron. This limit - represented by Ymax
0.032- is due to the self-fields of the beam current.
(6) Even if the betatron condition is not realized
and the number of electrons exceeds the limit noted above,
normal acceleration should result during the first half
microsecond of the acceleration period. The disturbing
effects noted in (4) and (5) above are most serious for
~v equal to unity - that is for v ~ 0.2 in this experi
ment.

- 46 -
CHAPTER 3
THEORY OF THE PLASMA BETATRON WITH AN
AZIMUTHAL MAGNETIC FIELD
II. STABILITY THEORY
3.1 Introduction
In the analysis of the operation of the plasma
betatron given in the previous chapter the effects of in
stabilities were ignored. A short discussion of several
potential instabilities is given in this chapter. Un
fortunately the instability analysis is often quite com
plex and a great deal of theoretical work is still re
quired on this problem. The contribution of this thesis
in this regard is small - amounting to little more than an
estimation of the time when disruption of the beam could
occur through the two-stream instability.
The total energy content of a plasma is made up of
four components:
(1) the thermal energy or energy of random motion,
(2) the kinetic energy of ordered motion,
(3) the stored energy of electric fields, and
(4) the stored energy of magnetic fields.
These four energy components are mutually coupled through
the motion and distribution of the plasma particles and by
their electromagnetic fields. This coupling can give
rise to an oscillatory or unidirectional exchange of en-

- 47 -
ergy between the energy components. The runaway effect,
sometimes classed as an instability, is an example of the
unidirectional exchange of energy from an electric field
to kinetic energy of ordered motion.
The usual method in stabLlity analysis is to begin
with an equilibrium plasma configuration and then test the
stability of the configuration under different types of
perturbation. If a perturbation is found to grow indefi
nitely the system is said to be unstable. If the per
turbation does not grow or decays then the system is said
to be stable.with respect to that perturbation. All pos
sible types of instabilities must be considered before a
plasma configuration can be said to be stable.
If a system is found to be unstable with respect to
some perturbation then the question of rate of growth of
the instability is of practical importance. For systems
which operate on a pulsed basis a slowly growing instabil
ity may be tolerable.
In this chapter the stability of one particular equi
librium configuration is investigated - that of a circu
lating beam of electrons frozen to an azimuthal magnetic
field and in a background of positive ions.
Finkelstein and Sturrock (26) have shown that for mag-
netohydrodynamic theory to apply to a system like the
betatron the following inequality must hold;
3.1

- 48 -
This inequality does not hold for the conditions of in
terest in this experiment. For this reason the consider
able work done on magnetohydrodynamic instabilities is of
little help here.
Six proposed instability mechanisms will be considered.
They are:
(1) The negative-mass instability
(2) The ion-wave instability
(3) The screw instability
(4) The transverse instabilities (two)
(5) The two-stream instability.
The first five will be considered briefly but the two-stream
instability will be dealt with at somewhat greater length.
It should be noted that the above list may be incomplete.
3.2 ~instabilities
3.2.1 The negative mass instability.~ This instability,
first investigated by Nielson (28) should be considered
where circulating currents of (energetic) electrons are in
volved. In a normal betatron, for example, with no azimuth
al magnetic field a force on an electron tending to increase
its energy will decrease its revolution frequency by moving
it to a larger orbit where it will lag in phase. This re
sults in a negative term involving the mass in the disper
sion relation - hence the name negative mass instability.
The effect of an azimuthal magnetic field on this mechanism

- 49 -
has not been investigated yet. However it seams clear
that a strong azimuthal magnetic field will greatly re
duce the coupling between longitudinal and transverse de
grees of freedom necessary for the manifestation of this
instability.
3.2.2 The ion-~ instability.- This instability (29),
proposed to explain the anomalous diffusion in the stel
larator, involves the energy exchange between the kinetic
energy of the ions and the electromagnetic fields. Since
the period of the ion oscillation is not short compared to
the acceleration time this instability is not expected to
be serious.
3.2.3 The screw instability.- Not to be confused with the
kink instability, the screw instability was proposed by
Kadomtsev and Nedospasov (30) and extended by Hoh (31) and
others. The theory has had a measure of success in pre
dicting the critical magnetic field for the onset of anom
alous diffusion observed in some experimental systems.
The instability may occur where there is a longitudin
al electric field applied to a plasma column in a longitu
dinal magnetic field. If there is a helical density per
turbation the longitudinal electric field will produce a
separation of the electron and ion 'screws' with the result
that electric fields perpendicular to the magnetic fields
are produced. Under some conditions the E/B drifts will in
crease the perturbation and the system is unstable. The un-

- 50 -
stable condition destroys the currents set up by the lon
gitudinal electric field and increases the loss of the
plasma across the magnetic field.
Major modifications must be made to the existing the-
ory if it is to be applied to the plasma betatron. The
high mobility of the electrons along the azimuthal mag
netic field and the tendency of the electrons to move along
the magnetic lines of force must be taken into account. In
addition, predictions of growth rates - not included in ex
isting theory - are necessary if verification is to be made
using results of the plasma betatron experiment.
The required modifications to the theory have not yet
been successfully carried out and therefore little can be
said regarding the severity of this instability mechanism
in the plasma betatron. It would appear however that if the
system were susceptible to this instability the growth rate
would not be strongly dependent on the plasma density.
3.2.4 The transverse instabilities.- While the system un
der study here is different from the simple magnetohydro
dynamic pinch, the perturbations which lead to instability
in the simple pinch should be investigated.
tion in question is of the form exp i(k?of
The perturba
± me + wt)
where k is the wave number of the perturbation and m is an
integer. Them= 0 mode is called the 'varicose' or 'sau
sage' type instability due to the form of the perturbed beam
and them= 1 mode is called the 'sinuous' or 'kink' insta-

- 51 -
bility due to the screw-like deformation of the beam.
The two perturbations, including the azimuthal magnetic
field, are shown in Figure 7.
(1) The varicose (m = O) instability.- The addi-
tion of an azimuthal magnetic field to the plasma
betatron should stabilize the beam against perturbations
of this kind. The stability is achieved through the re-
moval of the driving force tending to increase the per
turbations. As was noted in Section 2.5.6 any force tend
ing to change the radius of the beam would be transformed
away by a rotation of the plasma in the azimuthal magnetic
field.
(2) The kink (m = 1) instability.- Finkelstein and
Sturrock have analysed a case in which the kinetic energy
of the beam is larger than the magnetic energy - as in pro
posed relativistic beams. In the absence of an azimuthal
magnetic field, a region of stability is found when the
stabilizing effect of the electrostatic attraction between
the electron and ion streams is taken into account. In
terms of parameters for the experiment described in this
thesis, stability is predicted for
Y < 3b2 / (>o 2 • 3 • 2
For a beam of radius 0.02 m the predicted maximum J for
stability for this model is then 0.03.
In this experiment the beam kinetic energy is ex-
pected to be larger than the magnetic energy except at the

- 52 -
(a) The varicose instability
(b) The kink instability
Figure 7. Diagramatic,': representation of the perturbations of the transverse instabilities.

- 53 -
high Y values ( > 0. 2). However the stabilizing effect
of the azimuthal magnetic field is expected to extend
the range of stability considerably. The azimuthal mag
netic field is a stabilizing effect because a growth of
the perturbation would involve a distortion of the azi
muthal magnetic field which is frozen in the beam.
3.3 The ~-stream instability
3.3.1 Introduction.- A collective effect of potential im
portance in the plasma betatron experiment is the two
stream instability. It is due to longitudinal plasma os
cillations which can occur in a plasma. With contrastream
ing charged particles longitudinal plasma oscillations can
grow rapidly under certain conditions, transforming the
directed energy of the particles into fluctuation energy
of the oscillations.
Buneman (32) has calculated the initial energy of the
thermodynamically 'free' plasma oscillations in an infinite
plasma and described the amplification of this energy to
levels where the electron drift energy is converted to tur
bulence. The growth mechanism is a velocity and density
modulation of the particles as they pass over ·the potential
waves. Certain wavelength groups are amplified strongly
until disruption of the drift motion is complete. Skarsgard
(33) has shown that for the plasma betatron growth of the
oscillations is restricted in some cases. This results from
the fact that in a finite plasma there is limited amplifica-

- 54 -
tion of a limited range of wave lengths.
The essentials of the two-stream instability are giv
en here with certain predictions about the stability prop-
erties of the plasma betatron under somewhat idealized as-
sumptions for the velocity distributions of the electrons
and ions. The theory set down in this section is non-
relativistic.
3.3.2 The dispersion relation.- The dispersion relation
for the case of a two-component plasma with stationary ions
and streaming electrons is (32) 2 2
Wpe. I ( K" - w ) = 1 . 3.3
In this equation k is the wave number of the perturbation,
v the mean electron velocity and wfe and Wpi. are the
electron and ion plasma frequencies. The dispersion rela-
tion for a special case of a three component plasma includ
ing a number of electrons at rest is (33)
( cJp~2 + f'w,.;) 1w 2 + w,H? I (k.v - c..J) 2
= 1. 3.4
In this equation GJpe is the plasma frequency correspond
ing to the number of electrons at the mean streaming ve
locity, v, and f' is the ratio of the number of electrons
at rest to the number in the stream.
The solution of the two preceding equations - pub
lished by Buneman - is reproduced in Figure 8 in terms of
f, where f is given by
f = miM + f'. 3.5

- 55 -
W = wr + L 0(
t--------- ----
-2.0 0 0.5 1.0
( kv- wpe)
Scales are in units of './) f w,.c.
Figure 8. The solution of the dispersion relation for the two-stream instability.
1.5

- 56 -
The curves show the real part and the imaginary part of
~. A positive imaginary component,~, leads to an ex-
ponentially growing wave, - hence an unstable condition.
3.3.3 Growth Qf ~plasma oscillations.- Buneman has
shown that in a uniform plasma there are 'free' (undamped)
plasma oscillations. The free plasma oscillations are
those which have phase velocities too great to be affected
by Landau damping. The growth of these oscillations in
the presence of a constant accelerating field is of inter
est here.
With the electron beam being accelerated from rest,
at first oscillations with very short wavelengths will be
amplified. As the drift velocity increases: longer wave
lengths will be 'in resonance' and amplified strongly.
The growth of the plasma oscillations is at the expense of
the drift energy of the electrons.
The solution of the dispersion relation is approxi
mated by a square topped function as indicated in Figure 8.
Amplification of a given wave number k lasts only as long
as vis within a band of width 3f1 / 3 ~re/k around the val
ue ~,~/k. Since the acceleration under a constant elec
tric field is eE/m the duration of amplification is there
fore
'duration' m Av/eE } 1/3
= 3f m ~pe/eEk. 3.6

- 57-
The energy amplification of the oscillation of wave num
ber k is then given by expL; where
'C = 2 0(~ x 'duration' J 4.12 f 213 m Wpe.
2 /eEk. 3.7
3.3.4 Disruption of ~beam.- The total amplified fluc
tuation energy is found by integrating over the range of
wave numbers which have passed through 'resonance'. Al
ternatively the integration can be performed over the cor
responding range of ~values. Equation 3.7 shows that
the amplification of the smallest wavenumbers (longest
wavelengths) are the most serious. It is found that beam
disruption can be expected to occur if the range of
values extends up to a critical value 17 . For a wide
range of conditions L1 ~ 40 for this experiment (33).
If k1 is the wavenumber undergoing amplification at
the time of disruption t1 then for the case of a constant
electric field (see FiQlre R)
eEt1 /m = cJ pe /k1
and Squation 3.7 becomes
~ = 4.12 f 2/ 3 Wpe
3.8
3.9
Setting ~ = 40 and expressing wr~ in terms of the beam
parameters, for a beam of radius 0.02 m,
t1
= 3.24 X 10-lO f- 213 Y -~. 3.10
This equation is plotted as solid lines in Figure 9. The
portion where relativistic effects are significant is

I I
I I
I
- 58 -
}j
I
' ,. \ , ,, ,.,
disruption
stability
IOi~~----------L-------------L-----------~ .01 0.1 10
Time (~sec)
Figure 9. Curves showing the time of beam disruption -due to, or the time that stability is secured against the two-stream instability in the plasma betatron.

-59-
shown dotted.
3.3.5 P~rsistence of the beam.- Skarsgard has taken into
consideration the fact that the longest wavelength which
could be involved in any instability of this kind in the
plasma betatron is limited by the geometry of the system.
the minimum wave number which can undergo significant
amplification in this system is approximately 1/b.
Clearly from the solution of the dispersion relation
(Figure 8) if an electron drift velocity can be established
such that
v 7(1 + 1.5 :rl/3) w,.e /k . r mJ..n 3.11
there will be no further amplification of longitudinal
oscillations.
Using equation 3.8, a critical time tc may be found
when the smallest (and most dangerous) wave number ceases
to be amplified. If the fraction of electrons at rest is
small
t c == w,.~ m/eEkmin. 3.12
In the plasma betatron E =- Eb / ('l + A. v} and kmin is taken
be b-l. Th to · e critical time is then given by
tc =-~ 2mcW (1 + ~v) /i eE. 3.13
If the beam has not been destroyed by this time its sta
bility with respect to the electrostatic oscillations is
secured. Equation 3.13 is plotted for three values of ac
celerating field as dashed lines in Figure 9. Again the
part of the curves where relativistic effects may be sig-

- 60 -
nificant are shown dotted.
3.3.6 Discussion.- The stability characteristics of the
plasma betatron with respect to the two-stream instabil
ity may be inferred from Figure 9. Under specified con
ditions of ~, f, and E, if the dashed line crosses the
given ) value at an earlier time than the solid line,
the system should be stable. If the solid line crosses
first the system is predicted to be unstable. Figure 9
also indicates the time during the acceleration period at
which disruption of the beam should occur or the time at
which stability is secured.
The curves in Figure 9 indicate the strong depend
ence of the growth of the instability on the beam density
and the fraction of electrons at rest; only a small change
in the number of electrons at rest changes the stability
situation considerably. The assumptions made about the
electron velocity distribution are probably unrealistic
and it is not known how the results are affected by these
assumptions.
The situation with regard to an inhomogeneous plasma
(as discussed in Section 2.4.2) may be somewhat different.
The initial plasma oscillations may be of much higher am
plitude but would be expected to have a characteristic wave
number kT - associated with the spacing of the coils pro
ducing the azimuthal magnetic field for example. In this
case if disruption of the beam were due to amplification

- 61 -
of these oscillations it should occur when the drift ve
locity had the value ulpe/k'.

- 62-
CHAPTER 4
DIAGNOSTIC TECHNIQUES
4.1 The Rogowski coil
4.1.1 Description or the £211.- The Rogowski coil is a
device for measuring current. It consists or a toroidal
winding which encircles the current to be measured. A
signal is produced in the coil which is proportional to
di/dt. For an N-turn coil on a toroidal former of rect
angular cross section it is easily shown that the volt
age induced in the coil is given by
v = -~ x 10-7Nd ln{r2/r1 ) di/dt
where d is the width of the coil and r 1 and r 2 are the
inside and outside radii of the coil. This voltage may
be integrated electronically with respect to time and
the integrated signal, which is proportional to the current
being measured) displayed on an oscilloscope.
The sensitivity of the coil depends on the dimensions
of the coil and the number of turns. If a large number of
turns is used a ringing circuit is formed by the inductance
and distributed capacitance of the winding unless special
measures are taken. In the Rogowski coil used in this ex
periment a satisfactory sensitivity (3.6 x 10⁻⁷ volt-sec/
amp) was achieved without ringing being produced by winding
the coil with resistance wire. The 1.3K resistance of the
winding was sufficient to damp any oscillations and still

-63
had negligible effect on the integration of the signal.
The integration is performed by a simple RC cir
cuit with C consisting of the capacitance of a coaxial
cable plus the input capacitance of the oscilloscope.
The time constant of the RC circuit is approximately 20
psec.
In order to place the coil around the torus the
coil was constructed in two sections. It was found nee-
essary to enclose the coil in a brass shield because
noise from the vacuum switches was excessive. A photo
graph of the coil and shield is shown in Figure 10. The
coil is shown in its place in the plasma betatron in
Figures 1 and 2.
4.1.2 Rogowski coil calibration.- The integrated signal
from the Rogowski coil is proportional to the current be
ing measured. A calibration of the system was made using
a transient current of duration approximately the same as
is observed in the plasma betatron experiment. Thus it
was possible to check the frequency response of the Rogowski
coil. The circuit used is shown in Figure 11. The calib
ration in terms of voltage deflection on the oscilloscope is
I = 110 V.
This calibration is estimated to be correct to within 20%.
Calculation of v .- It will be shown in Chapter 5
that the oscilloscope traces from the Rogowski coil in
dicate that there is a period near the beginning of the
betatron acceleration during which the current rises lin-

- 64 -
Figure 10. Photograph of the Rogowski coil removed from its shield.

400" 10 K
.01 )Jf
10.3
- 65 -
Oscilloscope
Oscilloscope
The Rogowski coil winding has
a resistance of 1.3 k and an
i nducta nee of 40 ph.
Figure 11. The circuit diagram for the calibration of the Rogowski coil.

- 66 -
early. If it is assumed that this current is due to run
away electrons, a calculation of ) can be made if the
accelerating field is known. The validity of this assump
tion is discussed in Section 5.5.1 in the light of the re-
sults of the experiment.
From equation 2.30 the rate of change of current is
given by
di I d t = 1 0 7
E b y I ( 1 + ~ v ) . Using equation 4.2 one obtains
-5 1.1 X 10 Eb 1 + ~j) rJY.
dt
where dV/dt is the slope of the linear portion of the
Rogowski coil trace in volts/second.
4.3
4.4
For ?\).) <<.1 the right side of equation 4. 4 yields 'J directly. For large Y the curves in Figure 12 may be used
to estimate Y. The value of ~ is not known accurately
but is approximately 5 for this experiment. Note that the
accuracy of this method of determining :J decreases at high
values of Y. 4.2 Scintillation detectors
4.2.1 Introduction.- Evidence of runaway electrons can be
obtained by detecting x rays emitted from the apparatus.
Knowledge of the intensity and quality of the x rays can
lead to information about the number and energy of the elec-
trans producing the x rays.
In this experiment bremsstrahlung radiation is produced

...........
~ «
.i\ =6
0.1
0.01~----~--~--~~~~~~----~--~~~~~~~~------~--~~~~~~~
0.01 0.1 10
Figure 12. Curves of v/(1 + AV) vs ).) used. in the determination of "}) by the Rogowski-coil technique.

- 68 -
by electrons striking the walls of the chamber. A pair
of photomultipliers with plastic phosphor crystals pro-
vide simultaneous detection of the x rays. One unit de
tects radiation coming directly from the apparatus while
the other detects radiation which has been filtered by a
thin sheet of lead.
A photograph of the x ray detecting system is shown
in Figure 13. A part of the energy of the x radiation
reaching the crystal is converted to fluorescent radia-
tion which is detected by the photomultiplier tube. As
indicated in the circuit diagram of Figure 14, the signal
from the photomultiplier goes to a cathode follower and
through a coaxial cable to a double beam oscilloscope.
Electrons of energy W striking the wall of the torus
will produce bremsstrahlung radiation with total energy
4.5
where Y~ is the number of electrons lost from a slice of
beam one classical electron radius thick and f7t is the
efficiency of bremsstrahlung production. The energy de
posited in the crystal will be
4.6
where G is a geometrical factor equal to the fractional
solid angle subtended by the scintillation crystal at the
center of the betatron donut (G = 1.77 x 10⁻⁵ for the
measurements reported in this thesis), T accounts for the

- 69 -
Figure 13. Photograph of the scintillation detectors with power supplies.

- 70 -
.005
.005
22M
22M
+ 250 volts
Out 0
Excep.t as noted, resistors are
in kilohms and capacitors in
microfarads.
Figure 14. Circuit diagram for the scintillation detectors.

- 71 -
transmission through the apparatus and ~ accounts for
the crystal efficiency.
The evaluation of some of the terms in these equa
tions depend on the spectrum of the bremsstrahlung ra
diation and the absorbing properties of several materi
als. Since the electrons striking the walls of the to
rus may not be monoenergetic the x-ray spectrum may not
be known. The procedure followed is to assume that the
electrons striking the wall of the chamber have one of
three types of energy distribution. For each type the
resulting x-ray spectra is approximated and calculations
are made for the amount of the x-ray energy which would
be deposited in a crystal. Calculations are also made of
the x-ray energy which would be deposited in a crystal
after it had passed a thin lead filter. The calculations
are repeated over a range of electron energies and curves
are produced which reveal that the ratio of unfiltered to
filtered energy deposited in the crystal is indicative of
the energy of the electrons. The amounts of radiation
energy deposited in the crystals of course would be in
dicative of the number of electrons producing the radia
tion.
In the next section a discussion of the bremsstrah
lung radiation from a thick target is given. Following
this, consideration is given to the interaction of x rays
with various materials for the purpose of evaluating crys-

- 72 -
tali efficiency and the transmission of radiation through
the apparatus as a function of photon energy. The three
types of x-ray spectra used in the calculations are given
in Section 4.2.4. Curves for the calculation of W and v1
are then produced from appropriate calculations. A Section
on the calibration of the system is fd[cwed by a discuss
ion of probable errors. A s1mmary of the information
which ean be obtained from this diagnostic technique con
cludes this chapter.
Kany assumptions and s~nplifications are made in the
course of the calculations. The results are, however,ac
curate enough to yield useful information on the events
taking place in the plasma betatron.
4.2.2 Bremsstrahlung radiation from~ thick-target.- The
three pertinent features of ·che bremsstrahlung radiation
from thick targets are the target efficiency, the spectral
distribution and the angular distribution. Reviews of data
for thick targets have been presented by Stephenson (34) and
by Koch and Mtrtz ( 35).
(1) Target effieiency •. -When electrons with energy
of interest in this work_penetrate _matter, most of the
kinetic energy is given up in the production of heat but
a small amount goes into the production of bremmstrahlung
radiation. The efficiency, ~t , of x ray production depends on
the atomic number, Z, of the target nucleus and the energy,
W, of the electrons.
'1t =KZW

- 73 -
where K is a proportionality constant. Compton and Al
lison (36) in a review of measurements of the constant
K estimate that to within 20% the value of K is 1.1 x
lo-6 if the electron energy is in kev. The effective
atomic number of pyrex glass was calculated in Appendix
B to be 9 •. 59.
(2) Spectral distribution.- Kramer (37), in a theo
retical treatment of x rays, concluded that for thick
targets, the continuous spectrum integrated over all angles
should have the simple form
.fw ==- C(Y - W) max
where Jw is the intensity of photons at energy W, and
Wmax is the photon energy corresponding to the energy of
the bombarding electrons.
It is assumed for the purposes of these calculations
that the spectral distribution is of the form indicated
by equation 4.8 and is independent of the direction of the.
emitted radiation. Early measurements of the spectrum made
by Kulenkamp.ff (38) as well as several more recent measure
ments (39) (40), are in reaso;nable agreement with the theo
retical spectrum of equation 4.8 for electron energies up
to several hundred kev at least.
Superimposed on the continuous spectrum is a character-

- 74 -
istic spectrum. For the relatively light elements of the
target used in this experiment the characteristic radia
tion is in the region of a few kev. It will be shown that
essentially all radiation produced in this region is ab
sorbed in the target material and therefore the character-
istic radiation from the target may be neglected.
(3) Angular distribution.- Information on the angu
lar distribution of bremsstrahlung radiation from thick
targets is scarce. One would expect however that in ·a
thick target, since most electrons suffer several colli
sions in the process of giving up the kinetic energy, the
bremsstrahlung radiation would tend to be isotropic. The
effect of different angular distributions can, to a certain
extent, be taken into account.
For the calculations in this chapter it is assumed
that the angular distribution of bremsstrahlung radiation
may be represented by the intensities $, , ~o and fn1D in
four quadrants as illustrated in Figure 15. The average
intensity is defined by
4n~v = 27T(0.293fo + 1.414~0 + 0.293 t 80 ). 4.9
The calculations are made in terms of a shape factor, S,
defined by
S = ( io + .fflo ) / 2fgo • 4.10
The average intensity may be written in terms of the in
tensity at 90° to the incident electron beam and the shape
factor.
!I/ = J9D ( 0 • 7 0 7 + 0 • 2 9 3 s ) • 4.11

- 75 -
Direction of electrons
Figure 15. Diagramatical representation of the angu-lar distribution of bremsstrahlung radi~tion from thick targets.

- 76 -
For an isotropic distribution S = 1. If the dis-
tribution has a maximum in the forward direction S may be
greater than 1. The few measurements available (41) in-
dicate that for electron energies of interest in this ex-
periment the intensity may be greatest in the quadrant at
right angles to the bombarding electron beam making S less
than 1.
4.2.3 The interaction of~ rays with~ apparatus.-
(1) Efficiency of the crystal.- By crystal efficiency
is meant the percentage of energy incident on the crystal
which is deposited in the crystal. Most of the energy de
posited appears as electron kinetic energy which is par
tially converted to fluorescent radiation through excita-
tion and ionization of atoms of the crystal. A description
of the crystal and the calculation of the photoelectric and
Compton attenuation coefficients appear in Appendix B.
The intensity of radiation which is absorbed directly
by the crystal is given by
.f..= (~:~)1D- e.-.p- {-c+..-Jd] 4.12
where 5 crystal,
is the incident intensity, d is the depth of the
"C' (em -l) the attenuation coefficient for the
photoelectric effect and a- (cm-1 ) is the total Compton at-
tenuation coefficient. The Compton attenuation coefficient
has two components
4.13

- 77 -
where ~ corresponds to absorbed energy and ~ cor-
responds to scattered energy. Note that the symbols
used to denote attenuation coefficients here are nor-
mally used to denote cross sections.
The radiation which is scattered through the Comp
ton effect -
f.s = {=c:'<r) j [1- e:v.p-(-c +dd] 4.14 ~:..n order to oscape.
must also pass through the crystal materialA If the ef-
fective absorbing thickness for the scattered radiation
is taken as d/2 then there is an additional amount of en-
ergy absorbed. ~'"
t 1 = (_-err._) (/ [! _ a \~-r<:r Js
=(:c:-~J J ... [1 -
e:Jtp -(~+ tr)d lz.] }
e:Jlp -(--c-rtr) c/lz.]. 4.15
Neglecting additional small terms, the efficiency of the
crystal at a given wavelength is approximately
4.16
Using the attenuation coefficients determined in Appen
dix B, 1~ was determined as a function of photon energy
and is shown in Figure 16.
Ignored in this calculation is the possible escape
from the crystal of the photoelectrons before their en
ergy is transferred to the atoms. It is found however
that the range of 100 kev electrons in the crystal is ap
proximately 10-2 em and therefore in this experiment the
~::- rf.'re c.ttel'1_1:flt:'Lon coefflc:i.e:r_:_ts for the SCe.ttored l.,G.diation .., • t •
r ~-cLJ. o... -c :Lon •

~ 0
~ 0 c: .! 0 .... .... Q)
0 -(/)
~
"-u
- 78 -
Dimensions of crystal: 5.0 em long 3.5 em in diameter
1 1~0------~--~--~~~~~1~0-0------~--~~--~~~~10~00
Photon energy (k ev)
Figure 16. Curve of the efficiency of the NE 102 plastic phosphor as a function of photon energy.

- 79 -
loss of electrons from the crystal is negligible.
(2) Transmission coefficients.- The transmission
of photons through several materials is required to eval
uate the equations 4.5 and 4.6. Specifically, trans
missions are required for 0.3 and 0.6 em of pyrex glass,
0.38 em copper (the effective thickness of the coils used
to produce the azimuthal magnetic field or the Rogowski
coil shield), and 0.05 em lead.
Equations 4.12 and 4.15 may be used to calculate the
transmission coefficients at a given wavelength;
t = 1 - < J,. + .1.' ) If . 4. 17
The appropriate calculations were made using the atten
uation coefficients in Appendix B and other published
data (42) (43). The results are plotted in Figure 17.
(3) Transmission through the apparatus.- The radi
ation received at the detectors will have originated from
many areas of the torus and will have passed various
amounts of absorbing material. To estimate the overall
transmission it is convenient to divide the torus into
four quadrants as indicated in Figure 18.
In terms of Figure 15, the radiation directed at the
detectors and originating in quadrants 1 and 3 will have
intensity j,. while that from quadrant 2 will have in
tensity jlfJI) and from quadrant 4 intensity jo . It is
estimated that the radiation reaching the detectors from

en -c: .~ 0 ... ... Q)
0 ()
c: 0 U) U)
E (J)
c
- 80 -
0.1
~ 0.01 ._.
0.0 011'"""0-~----4-----J---'-...I....---J---l..-...J.._J.......j_l_..O_O ___ .J..___-1---JI--...L.-...L.-J.......J.-lluOOO
Photon energy { kev}
Figure 17. Curves of transmission coefficients as a function of photon energy for several materials in the plasma betatron experiment.

- 81 -
Quadrant 3
2
l To detectors
Figure 18. Diagram showing the division of the torus into quadrants for the purpose of calculating the resultant transmission coefficients.

- 82 -
quadrant 1 passes through 0.3 em of glass, from quadrants :
2 and 4 the :thickness of glass is estimated at 0.6 em
while that from quadrant S is approximately 0.9 em. It
is estimated that 14% of the radiation from quadrant 1,
43% from quadrant 3 and 30% from quadrants 2 and 4 must al-
so pass through 0.38 em of copper. Defining t 1 by the
equation
t' = (Intensity transmitted to detectors)/1.v , 4.18
equations 4.10 and 4.11 may be used to obtain
where
t'
X
y
0.25(X + 2SY)/(0.707 + 0.2938)
.86t1 + .14t1tc + .57tlt2 + .43t1t2tc
.7ot2 + .3ot2tc
4.19
4.20
and t1 is the transmission of 0.3 em glass, t 2 is the
transmission of 0.6 em of glass and tc is the transmission
of 0.38 em of copper.
The calculations were made for three values of S rep-
resenting a wide variation in angular distribution. The
results are plotted in Figure 19. The indication is that
an assumption of an isotropic angular distribution would
not introduce an error in t 1 in excess of 30%.
4.2.4 The assumed~ ray spectra.- Since the electrons
striking the wall of the torus may not be monoenergetic it
was decided that calculations would be made for several
different cases. The x-ray spectrum resulting from a bom
bardment by electrons with a distribution of electron en-

c CD 0 -"t-6
Q)
0 0
c 0 (I)
(I)
(I)
c 0 ~
c 0
~ (I)
- 83 -
;. 0.01
0.001~------~--~~~~~~~~------~--~--~~~~~
10 100 100 Photon energy ( k ev)
Figure 19. Curves showing the resultant transmdssion coefficients for the apparatus as a function of photon energy.

- 84 -
ergy may be approximated by superimposing appropriate
Kramer distributions. Figure 20 illustrates the three
cases chosen.
The quantity of interest here is ~ , representing
the number of electrons producing the x rays. If the
electron stream in question is expressed as a sum of mono-
energetic electron streams with electron energies Wi, then
from equations 4.5 and 4.7 2 J4 = ~ v, = C Z p. /W-.
t i ~ ~ 4.21
An 'effective' electron energy We££ for any electron en
ergy distribution may be defined by the equation 2
){ = CPt/Weff; 4.22
From equations 4.21 and 4.22 2 2 w f f = pt I 2:. p . /W. . 4 . 2 3 e ~· ~ ~
Calculations for We££ for the three cases considered here
are tabulated in Appendix C and summarized in Table I.
TABLE I
SUMMARY OF CALCULATIONS ON THREE ASSUMED X RAY SPECTRA
Spectrum We££ Wav type
A l.OOOWmax 1. ooowmax
B 0.612Wmax 0. 560Wmax
c 0.428Wmax 0.387Wmax

>. -(/.)
c Q) -c
-c Q) ..... ..... :3
(..)
(/.)
c Q) -c
>. 0 ..... I
A
w Electron energy
X ~--------------~
Photon energy
- 85 -
B c
w., \Veff w, ... x •v
Electron energy Electron energy
Photon energy Photon energy
Figure 20. The three assumed x-ray spectra with the corresponding electron energy distributions.
wl'1 .....

- 86 -
An average electron energy Wav may also be calculated
for the various electron energy distributions by the equa-
tion
4.24
The calculations for Wav are also tabulated in Appendix C
and summarized in Table I.
4.2.5 The calculation Qi ~final curves.- Calculations
may now be made to find the ratio of unfiltered to filtered
energy deposited in the crystal. At the same time the fac
tor (THc) may be evaluated. The calculations are made for
each spectrum type for maximum photon energies of 60, 90,
120, 240 and 480 kev. Each spectrum is operated on by the t'
appropriate values of transmission_,AJand crystal efficiency_, f/,,
to determine the fraction of radiation produced at each en-
ergy which is deposited in the crystal. The case of the
120-kev 'A' spectrum is illustrated in Figure 21.
The area under the intensity curves is proportional to
the total energy. The ratio of area II to area III is the
ratio of unfiltered to filtered energy deposited in the crys
tal. The ratio of area II to area I is (T H, ) • Using equa
tions 4.5 and 4.6, 1i/Pd may be evaluated. The areas were
measured with a planimeter and the calculations summarized
in Table II.
The results in Table II are plotted in Figures 22 and 23.

c ::J
..0 '-
2. 5
(/)
c Q)
c::
~
0 '-
- 87 -
Photon energy (kev)
X- roy spectrum produced
X-ray spectrum deposited in crystal (unfiltered)
X- roy spectrum deposited
in crystal (filtered)
Figure 21. The 120-kev 'A' spectrum as produced, as deposited (unfiltered) in the crystal, and as deposited (filtered) in the crystal.

>. Ol "Q) c Q) 100
c: 0 "--0 Q)
w
w .. v
W ( •A1
spectrum)
( l I
Wma.x B spectrum)
wt'Y)O.)( ('c' spectrum)
I I ) Wa.v (C spectrum
10~------~--~--~~~~~~--------~--~--~~~~~~------~~--~~~~~~~~
I 10 100 1000 Ratio of unfiltered to filtered x-ray energy deposited in the crystals
Figure 22. The maximum and average electron energy for the three assumed distributions as a function of the observed ratio of unfiltered to filtered x-ray energy deposited in the crystals.
co co

'-> Q)
~
- 89 -
Ratio of unfiltered to filtered x-ray energy deposited in the crystals
Figure 23. The term V~/Pd for the three assumed distributions as a function of the observed ratio of unfiltered to filtered x-ray energy deposited in the crystals.

- 90 -
Using Figure 22, a measurement of the ratio of unfiltered
to filtered energy deposited in the crystals yields an
indication of the energy of the electrons producing the
x rays. The ratio of unfiltered to filtered energy de-
posited in the crystals, along with an absolute measure-
ment of the unfiltered energy deposited in the crystal can
be used with Figure 23 to estimate ~ representing the
number of electrons producing the x rays.
TABLE II
SUMMARY OF X-RAY TRANSMISSION AND ABSORPTION CALCULATIONS
Spectrum Wmax ,r.
(T H,) Weff Y.,./Pd Ratio~' Wav type kev % kev kev (Mev)-1
A 480 1.97 8.25 480 480 6.70 X 10⁻⁷ B 2. 52 7.53 268 294 1.95 X 10⁻⁶ c 3.15 6.95 186 205 4.30 X 10⁻⁶
A 240 3.96 7.15 240 240 3.08 x 10⁻⁶ B 6.04 6.62 134 147 8.88 X 10-~ c 8.05 6.09 93 103 1.97 X 10⁻⁵
A 120 8.37 5.93 120 120 1.49 X 10⁻⁵ B 14.2 5.27 67 73 4.45 X 10⁻⁵ c 27.1 4. 54 46 51 1.05 X 10⁻⁴
A 90 16.0 5.29 90 90 2.97 X 10⁻⁵ B 37.5 4.51 50 55 9.27 X lo-5 c 81.1 3.75 35 38 2.26 x lo-4
A 60 137 4.63 60 60 7.63 X 10⁻⁵ B 281 3.56 34 37 2.67 X lo-4 c 1810 2.63 23 26 7.26 X lo-4
.,_ "The ratio of unfiltered to filtered energy deposited in the crystals.

- 91 -
Lead is a particularly suitable material for the
filter in this experiment. The fact that the K edge in
the photoelectric effect is located at 88 kev increases
the range of photon energies over which there is useful
variation in the transmission through the filter. The
result is that in the electron energy range of interest,
the curves in Figures 22 and 23 are of more constant slope
than would be the case, for example, if an absorbing ma
terial like copper or aluminum were used.
4.2.6 The calibration of~ scintillation detectors.- To
obtain quantitative figures for ~ it is necessary to
calibrate the scintillation detectors. This is achieved
by using a source of photons of known energy and observing
the response of the system.
The signal, as displayed on the oscilloscope result
ing from the absorption of a single photon in the crystal,
is roughly a triangular pulse with a base of 0.2 psec.
The area of the pulse is a measure of the energy deposited
in the crystal. A Co60 source (gamma emission at 1.17 and
1.33 Mev) was used to calibrate each detector over a range
of anode supply voltages. Two pairs of photomultiplier
crystal units were used. One pair, designated A and B,
had the crystal directly in contact with the end of the
photomultiplier tube; the other pair, designated A' and B',
had the sensitivity reduced by a paper filter placed be
tween the crystal and the photomultiplier tube. The cali-

- 92 -
bration curves are shown in Figure 24.
4.2.7 An estimate Qf errors.-
(1) The measurement Qf electron energy.- The deter
mination of electron energy is made through a measurement
of the ratio of unfiltered to filtered x-ray energy de
posited in the crystal and the use of the curves in Figure
22.
The measurement of this ratio is subject to several
errors. The radiation absorbed in the lead filter through
the photoelectric effect has a high fluorescent yield and
hence some of the energy absorbed photoelectrically will
be emitted again. The fluorescent radiation is isotropic
and therefore the amount of this radiation reaching the
detectors depends on the geometry of the system. With the
filter set 25 em from the detector the fluorescent radia
tion reaching the detector is approximately 0.1% of the
radiation absorbed photoelectrically. The important
measured ratios of unfiltered to filtered radiation depos
ited in the crystals is approximately 10 and therefore the
error due to fluorescence is less than 1%. Also affecting
the measurement of the ratio is the error in the calibra
tion of the detectors and errors in the measurements made
on the oscilloscope trace. The probable error from these
sources is estimated to be 10%.
In the calculations leading to the curves of Figure
22 there are also several sources of error. The greatest

> (l)
~ ....... 0 Q) CJ)
:::1.. I -
0 >
(l)
"" c:: 0 Q. CJ)
Q)
0::
1o·'
10-2.
10-3
- 93 -
Anode supply voltage (volts)
Figure 24. Calibration curves for the scintillation detectors.

- 94 -
of these is believed to be due to the uncertainty in the
transmission curves in Figure 19. Because the greatest
intensity radiation and the maximum crystal efficiency
is at low energies an accurate knowledge of the transmis
sion through the apparatus at low energies is important.
Expected errors in the transmission curves should not af
fect the calculated ratio of unfiltered to filtered energy
by more than 10%.
Taking into account the slope of the curves of Figure
22 in the region of interest, the combined effect of the
three errors would produce an error of approximately 10%
in the value of electron energy assuming the electron en
ergy distribution were known.
(2) The measurement Qf ~· The evaluation of V~
involves the measurement of the ratio of unfiltered to
filtered radiation and the measured magnitude of the un
filtered radiation along with the curves of Figure 23.
The uncertainties involved - especially in the calculation
of the curves - introduce appreciable errors. Some dis
cussion of the errors has been given as the various fac
tors were considered. A table of the sources of error with
the estimated resulting percentage error in the calculation
of ~ is given below.

- 95 -
TABLE III
SOURCES OF ERROR IN THE MEASUREMENT &~
Source Percent error
Target efficiency 20 Geometrical factor 30 Atomic number of target 10 Radius of torus 10 Spectral distribution 20 Angular distribution 30 Transmission coefficients 10 Crystal efficiency 10 Calibration error 10 Measurement of trace 10
Combining the components of error through a root
sum-square calculation the probable error in l{ is 57%
if the electron energy distribution is known.
4.2.8 Summary of information obtainable using~ scintil
lation detectors.- (1) This diagnostic technique enables
one to determine whether or not the electrons producing the
x rays are monoenergetic with the energy of normally ac-
celerated runaway electrons. In case the indication is
that the electrons producing the x rays are not normally
accelerated electrons there is doubt as to the energy dis
tribution of the electrons.
(2) Even without a knowledge of the electron energy
distribution an upper limit on the average energy of the
electrons producing the x rays may be determined. The up-

- 96 -
per limit on the average energy of the electrons is ob
tained by using curve A (corresponding to a monoenergetic
beam) of Figure 22.
(3) Even if the electron energy distribution is not
known a lower limit on the number of electrons producing
the x rays may be obtained. This lower limit is obtained
by using curve A (corresponding to a monoenergetic beam)
of Figure 23.

- 97 -
CHAPTER 5
RESULTS AND DISCUSSION
5.1 Introduction
In this chapter some data is presented describing
the characteristics of the plasma betatron. The diag
nostic techniques described in the preceding chapter
were used for this purpose.
It is found that the betatron acceleration produces
an intense stream of runaway electrons but that disrup
tion of the streaming occurs shortly after the beginning
of the acceleration. It is concluded that the disrup
tion of the electron stream is due to an instability.
5.2 Sample results and method Qf data reduction
For any given set of initial conditions two pulsed
operations of the plasma betatron are required if com
plete information from both diagnostic techniques is to
be obtained. Figure 25 shows three representative pairs
of (retouched) oscillograms obtained during the course
of the experiment. In each case the upper oscillogram
shows the signal from the Rogowski coil along with the
signal from the scintillation detector monitoring the un
filtered x radiation. The lower oscillograms show the
signal from both scintillation detectors - one monitoring
the unfiltered x radiation and the other the x r diation
coming through a 0.05 - em thick lead filter. S nee an
unfiltered x-ray signal is recorded on both osci lograms,

(a) Upper
Lower
(b) Upper
Lower
(c) Upper
Lower
- 98 -
(a) (b) (c)
Accelerating field, 4.4 x 10³ volts/m. Azimuthal magnetic field, 0.1 webers/m2. Sweep speed, 0.2 Msec/cm. All x-ray signals, 0.5 volts/em.
oscillogram: Upper trace - Rogowski coil (2.0 v/cm) Lower trace -unfiltered x rays (H.T. = 850v)
oscillogram: Upper trace - filtered x rays (H.T. = 1150 v) Lower trace - unfiltered x rays (H. T. = 800v)
oscillogram: Upper trace - Rogowski coil (1.0 v/cm) Lower trace - unfiltered x rays (H.T.= 855v)
oscillogram: Upper trace - filtered x rays (H.T. =1150v) Lower trace - unfiltered x rays (H.T. = 855v)
oscillogram: Upper trace - Rogowski coil (0.1 v/cm) Lower trace - unfiltered x rays (H.T. = ll90v)
oscillogram: Upper trace -filtered x rays (H.T. = l330v) Lower trace -unfiltered x rays (H.T. = ll50v)
Figure 25. Retouched photograph of representative oscillograms obtained during the plasma betatron experiment.

- 99 -
the consistency of behaviour can be checked.
The trace from the_Rogowski coil corresponds to the
current flowing in the torus. There is a region near
the beginning in which the current rise is approximately
linear. The linear part is followed by a region where
the current increase is less rapid, a peak is reached and
then the current rapidly decreases.
The signal resulting from the detection of the un
filtered x radiation begins somewhat later than the be
ginning of the Rogowski-coil signal. The signal is char
acterized by a rapid rise to a peak followed by a less
rapid decrease. There are often one or more small peaks
following the first peak.
The signal resulting from the detection of the fil
tered radiation is similar to that for the unfiltered
radiation except that the amplitude is smaller and the
decrease after the first peak is less rapid. Some x rays
are observed over the entire acceleration period.
The analysis of the traces from the scintillation
detectors begins with the subdivision of each trace into
triangular segments with a base of 0.2 microsecond as
indicated in Figure 26. The triangular segment repre
sents the response of the detectors to a single burst of
radiation (see Section 4.2.6), hence the first step in
effect arbitrarily divides the radiation falling on the

- 100 -
Rogowski- coil signal
Unfiltered x-ray signal
0 2 Time (psec)
Filtered x-ray signal
0 .2 ._4 .6 Time tpsec)
Figure 26. Diagram showing some of the steps involved in analysis of the oscillograms obtained in the plasma betatron experiment.

- 101 -
detectors into separate 'pulses' 0.1 microsecond apart.
Applying the appropriate scaling and calibration
factors the amount of radiation energy represented in
each pulse may be calculated. The ratio of unfiltered
to filtered energy so calculated could be used to de
termine the energy of the electrons producing the radia
tion if the type of energy distribution was known. If
normal acceleration took place the electrons involved
in x ray production would have calculable energy de
pendent on the accelerating field and the time of ap
pearance of the x rays. It is found, however, that the
x rays do not come from normally accelerated electrons;
hence the electron energy distribution is not known.
Since the electron energy distribution is not known, the
A curve of Figure 22 is used in all cases. The value of
energy calculated in this way, designated W', is an upper
limit on the average electron energy whatever the elec
tron energy distribution.
The energy represented in the unfiltered pulses is
the energy Pd of equation 4.6. With the value of Pd known,
along with the ratio of unfiltered to filtered energy
above, a calculation for Y~ could be made using the
curves of Figure 23 if the type of electron energy dis
tribution were known. Again since the electron energy
distribution is not known the A curve of Figure 23 is used.
The value of ~L calculated in this way represents a lower

- 102 -
limit to the true value of JJ... This value of l{ will
also represent - within a factor two - the electrons
striking the wall of the torus with energies above 40
or 50 kev.
In every case where an analysis of this type was
made it was found that by far the majority of electrons
striking the walls of the torus are represented in the
first two segments of the subdivided oscilloscope trace.
The successive segments represent only a few higher en
ergy electrons. In this thesis the ~ calculated for
each segment will be added together and a suitably
weighted value of electron energy calculated so that the
result from the analysis of a whole trace may be repre
sented by single numbers for ~ and W'.
A figure for the beam parameter V is calculated
from the slope of the linear part of the Rogowski-coil
trace. As stated in Section 4.1.3, for this calculation
it is assumed that the current is composed of runaway
electrons only, that is, electrons which are being ac
celerated freely. If all the electrons are not accel
erated freely the calculated value of Y would then be
too low. This point is discussed in more detail later.
The oscillograms are also used to establish the
times at which certain events occur. They are:
(1) The time t1marking the end of the linearly
rising portion of the current trace.

- 103 -
(2) The time tx at which most of the energetic
electrons strike the wall of the torus.
(3) The time t 2 indicating the point where the
current has decreased to practically zero on the Rogow
ski-coil trace. The reference point for the measure
ment of these times is the intersection of the extended
linear portion of the Rogowski coil trace with the axis.
Calculations of the energy, W~, which an electron
would have if accelerated wi hout hindrance in the
betatron field can also be m de. In order to compare
the observed electron energy to the appropriate calculated
value one must consider the onzero closing time of the
switch in the betatron circu·t and the reference point
for measuring the time tx. A simple solution to the
problem is given in Appendix D.
For the higher Y values the reduction in the accel
erating field due to the beam current must also be taken
into account in the calculation of W~ • In this experi
ment the calculation is complicated somewhat by the fact
that the current has normally passed its peak value by
the time the x rays are produced. The theoretical energy
that an electron would have depends on the instantaneous
value of the vector potential Acr • The contribution to
A 1 from the beam current itself of course depends on the
instantaneous value of the beam current. The equation
2.29 may be used to find the effective accelerating field

- 104 -
if the value of Y is obtained from the equation (similar
to equation 4.4) ,) -5
~--1/-- = 1.1 X 10 VX 1 + :AV Eb t
X
5.1
where Vx is the voltage deflection of the Rogowski coil
trace at time tx.
5.3 Experimental results
5.3.1 The effect of changes ill beam density.- Adjustment
of the duration of the rf pulse resulted in a variation
of J values from approximately 0.002 to 1 as calculated
from the Rogowski coil data. Table IV shows the results
obtained with a peak accelerating field of 4.4 x 10³
volts/m and an azimuthal magnetic field of 0.1 webers/m2
in argon at 0.3 microns Hg pressure. All observations
were made Aug. 3, 1962 except the one at J = 0. 0016
which was made Aug. 6, 1962.
v
0.5 .14 .044 .012 .0086 .0016
TABLE IV
RESULTS SHOWING EFFECT OF VARIATIONS IN Y (Peak accelerating field 4.4 x 10³ volts/m)
tl tx t2 W' V.L Wp ~lv psec psec psec kev kev
0.08 0.35 0.37 90 0.009 175 0.02 .12 .34 .38 110 .0009 165 .01 .18 .38 .39 120 .0004 200 .01 .18 .36 .38 120 .0003 185 .03 .16 .36 .42 120 .0002 185 .02 .20 .25 .32 <70 "?.0001 95 .>.06
W' /W11
0.51 .67 .60 .65 .65
<.74

- 105 -
Table V shows the results obtained on Aug. 30,
1962 with an accelerating field of 8.8 x 10³ volts/m
and an azimuthal magnetic field of 0.1 webers/m2 in
argon at 0.2 microns Hg pressure.
1 0.061
• 044 .019 .007
TABLE V
RESULTS SHOWING EFFECT OF VARIATIONS IN Y (Peak accelerating field 8.8 x 10³ volts/m)
tx W' psec kev
0.26 105 .26 115 .30 115 .16 110 .16 100
0.007 . 007 . .003 .002 .0005
W,s kev
340 340 430 150 150
0.01 .09 .06 .09 .07
W' /W~
0.31 .34 . 27 .73 .67
5.3.2 The effect of changes in accelerating field.- Re-
sults of measurements taken to determine the effects of
variations in the accelerating field are tabulated in
Table VI. The azimuthal magnetic field was 0.1 webers/m2.
Date (1962)
Aug 7 Aug 7 Aug 7 Aug 7 Aug 6
TABLE VI
RESULTS SHOWING EFFECT OF VARIATIONS IN ACCELERATING FIELD
Peak Field y tl tx (x 103 volts/m) psec psec
.9 0.0016 0.36 0.86 1.8 .0016 .34 .62 2.6 .0022 . 25 .47 3.5 .0022 .23 .40 4.4 .0016 .20 . 25
Aug 30 8.8 .007 .16.
t2 psec
0.80 .72 .57 .46 .32

- 106 -
5.3.3 The effect of changes in~ pressure.- To deter-
mine the extent of the interference by neutral atoms in
the acceleration of the electrons, the data in Table VII
was obtained on July 25, 1962. The accelerating field
was 4.4 x 10³ volts/m and the azimuthal magnetic field
was 0.1 webers/m2 .
TABLE VII
RESULTS SHOWING EFFECT OF VARIATIONS IN GAS PRESSURE
Pressure v tl tx t2 (microns Hg) usee usee usee
0.10 0.11 0.18 0.36 0.47 .15 .13 .18 .39 .48 .28 .14 . 21 .40 .65 .62 .13 • 22 . 36- - .1.12 .
5.3.4 Probe measurements ~ Olson.- In addition to the
data presented above, density measurements by Olson (44)
are pertinent to this experiment. Using a double probe
technique (4S), Olson measured the plasma density in the
plasma betatron during the rf pulse. From these measure-
ments an estimate of the total number of electrons in the
plasma was made. The corresponding value for the number
of electrons in the accelerated beam determined by the
Rogowski-coil technique were lower than the value deter-
mined from Olson's measurements. The ratio of the two
values was found to vary from approximately one half in

- 107 -
the high density (and high rf field) region to approxi
mately one tenth in the low density (and low rf field)
region.
5.3.5 Summary Qf observations.- (1) When the betatron
accelerating field is applied to the plasma a transient
current is observed corresponding to the production and
disruption of an electron stream.
(2) The amplitude of the current depends on the
accelerating field and the plasma density.
(3) X radiation is observed at the time of the beam
disruption. The energy of the electrons producing the
x rays is roughly 100 kev.
(4) While the number of electrons producing the
observed x rays varies over a wide range, they represent
roughly 1% of the available electrons. It is found that
the fraction of electrons involved in x ray production
increases considerably with increasing accelerating fields.
(5) It is found that the electrons producing the
x rays do DQ! correspond to electrons accelerated freely
from the beginning of the acceleration period; the upper
limit on the average energy is approximately one quarter
to two thirds the 'theoretical' runaway energy.
(6) The current observed during the initial phase
of the betatron acceleration ~ llQt correspond to all
the electrons in the plasma being accelerated freely as
runaway electrons.

- 108 -
(7) There is no discernible dependence of the time
of beam disruption on the plasma density over the region
investigated. The range of plasma densities investigated-
as indicated by Olson's measurements - cover more than an
order of magnitude, from less than 4 x 1010 cm-3 to approx
imately 3.5 x 1011 cm-3 • The range of ) values investi
gated - as determined by the Rogowski-coil technique -
cover more than two orders of magnitude, from 2 x 10⁻³ to
approximately 1.
(8) The time of disruption of the beam depends on
the accelerating field. Indications are that the time of
disruption varies approximately as the accelerating field
to the power minus one half.
(9) The initial phase of the acceleration and the
time of appearance of the x rays is not dependent on the
initial argon gas pressure - at least for pressures up to
0.62 microns.
5.4 An interpretation of results
The observed disruption of the streaming motion is
attributed to a collective effect (instability). Before
this is discussed further, two other effects are consid-
ered - the effect of imperfections in the apparatus and
the interfering effect of neutral gas molecules.
Imperfections in the apparatus are of several types.
Recent measurements by Strilchuk (46) indicate the current
distribution in the betatron winding may, at the time of

- 109 -
the measurements, have deviated by as much as 5% from
the design values. Other perturbations in the ac
celerating field can be expected to have arisen from
magnetic materials near the torus and electrostatic
fields from the betatron circuit. The azirnuthal mag
netic field has two types of inhomogeneity - radial,
due to the geometry and azimuthal, due to the separa-
tion of the coils used to provide the magnetic field.
These perturbations could conceivably cause large-scale
movement of both ions and electrons across the azimuthal
magnetic field. However it was shown in Chapter 2 that
even under the influence of serious perturbations, nor
mal acceleration should still occur - in the absence of
instabilities - for at least half a microsecond. The ob
served disruption of the beam occurs at an earlier time
than this. In addition, and of greater significance, if
the beam were composed of runaway electrons (as it is ex
pected to be if there are no hindering collective effects),
and this beam were forced to the wall by the defects noted
above, the intensity of x radiation would be much larger
and its quality much. harder than is observed. It is con
cluded therefore that except for the possible role of
these perturbations in the excitation of instabilities the
perturbations are not a significant factor in the disrup
tion of the beam.
The possibility that neutral particles in some way

- 110 -
impede the acceleration of the electrons was considered.
Estimates of the effect of collisions with neutral par
ticles made using the small amount of information avail
able (47) indicated that the effect of these collisions
at gas pressures used in this experiment was small. As
an experimental check on this conclusion the observations
reported in Table VII were made. The data indicate that
the neutral particles are not involved witl1 the runaway
process or the growth of the instability. The depend
ence of t2'on the gas pressure would indicate, however,
that neutral particles are involved in the final stages
of the disruption of the beam. The apparer1t persistence
of the beam at higher pressure could be due to ionization.
The results of this experiment may be interpreted in
at least two ways. Two models are discussed here, each
one involving collective effects.
(1) The fraction&l-stream model.- In this model, it
is supposed that with the application of the accelerating
field a certain fraction (from about one half to one tenth
in this case) of the electrons are decoupled from the ions
and are accelerated as runaway electrons while the remain
der are trapped, for example, through a der1sity inhomoge
neity in the plasma. This mechanism was discussed in Sec
tion 2.4.2. At some time after the beginning of the ac
celeration (typically 0.2 psec in this experiment) an~ in-

- 111 -
stability slows down the electrons within the plasma
and disrupts the beam. A few of the more energetic
electrons strike the walls of the chamber and produce
x radiation. The electrons in the runaway electron
beam lo:se approximately 100 kev per electron within
the plasma.
In this interpretation the variation in the frac
tion of electrons which are accelerated could be ex
plained if the temperature of the electrons was lower
at the lower plasma densities. Such a temperature var
iation would indeed be expected to arise from the fact
that the rf field is smaller at the low plasma densities.
If the fractional-stream model is substantially cor
rect then the assumption of a normally accelerated stream
(initially) - implicit in the technique for measuring V
with the Rogowski coil - is valid.
(2) ~he whole-stream model.- In this model it is
supposed that all the electrons in the plasma are involved
in the observed current but that the average streaming
velocity is considerably less than that corresponding to
normally accelerated runaway electrons. This behaviour
must be attributed to an unidentified collective effect
operating from the beginning of the acceleration. The
collective effect (possibly associated with density in
homogeneities or other imperfections in the apparatus)

- 112 -
could also cause the disruption of the s~aming motion.
Again a few of the more energetic electrons strike the
walls of the chamber and produce x radiation.
In this case the value of V determined by the
Rogowski-coil technique would be too low. There is no
evidence to indicate whether the streaming energy, in
this interpretation, is given up within the plasma or is
transferred to the walls of the chamber. Most of the x
radiation which would be produced if the entire streaming
energy were transferred to the chamber walls would ··be so
soft that it would be absorbed in the chamber walls.
5.5 Conclusions
While there is much that remains unknown about the
processes involved in the plasma betatron, certain con
clusions may be made in the light of the experimental re
sults and the preceding discussion.
(1) It is concluded that an intense stream of run
away electrons is produced. Even if the electrons which
produce the x rays are the only runaway electrons, they
still represent an intense stream since if they were ac
celerated to near the velocity of light, currents as high
as 150 amperes would result. If, however, the fractional
stream model is substantially correct, then the intensity
of runaway electrons is much larger.
(2) It is concluded that the disruption of the.
streaming motion is due to a collective effect (instability)

- 113 -
regardless of which of the proposed models is closest
to reality. The collective effect can not, at this
point, be identified.
(3) If the fractional-stream model is substan
tially correct then the energy of the streaming motion
(approximately 100 kev per runaway electron) is given
up within the plasma. If the whole-stream model is sub
stantially correct the energy of streaming motion (be
tween 1 and 25 kev per electron) maY be given up within
the plasma.
5.6 Discussion
5.6.1 a comparison of the results ~those Qf ~ ~
betatron experiments.- The first plasma betatron experi
ments were conducted at CERN, Geneva, in 1957-58 by
Reynolds and Skarsgard (2). Two air-core plasma betatrons
- designated Mk I and Mk II - were constructed. Table
VIII summarizes some of the quantities describing these
two devices along with the plasma betatron - designated
US - described in this experiment.
The diagnostic techniques described in this thesis,
although basically the same, are more highly developed
than those used in the CERN experiments.
In the operation of the CERN Mk I machine, the Rogow
ski-coil signal showed a large transient current. Asso
ciated with the decline of the current was the emission
of x rays. Estimates of the energy of the electrons pro-

- 114 -
ducing the x rays were in the 100 to 120 kev range. The
possibility was not considered that the electrons pro
ducing the x rays were anything but normally-accelerated
electrons which prematurely struck the walls of the cham-
ber. The transient current was described as a conduction
current (many electrons with a slow drift velocity),
rather than a runaway current which encountered an insta-
bility.
TABLE VIII
CHARACTERISTIC PARAMETERS OF THE CERN AND U OF S
PLASMA BETATRONS
Parameter Mki Mk II
Peak acce~erating field (x 10 volts/m) .67 1.77
Length of accelerating period ~sec) 24 7.8 Theoretical maximum electron energy
(Mev) 2.6 2.0 Maximum azimu~hal magnetic field
(webers/m ) .15 .15 Mean orbit diameter (meters) . 52 .52 Chamber bore diameter (meters) • 05 .05
us
8. 87
'"
2.2 ..J~
3. 4 ~'
.15
.38
.06
*These figures refer to the maximum values for the experiment reported in this thesis. Design values are 17.7 and 6.75 respectively.
In the operation of the CERN Mk II machine higher
accelerating fields were used. Under conditions similar
to those used in the Mk I betatron, a similar transient
current was observed. In addition to the x rays produced
during the decline in the transient current, x rays were

- 115 -
produced over much of the remainder of the acceleration
period. For sufficiently low plasma densities (corre
sponding to v~ 10-4), the indications were that a
larger proportion (perhaps 100%) of the electrons remain
in the betatron until the end of the betatron accelera-
tion. This low density region has not yet been investi
gated in the experiment described in this thesis.
In summary, the observations made in the CERN ex
periments and the U of S experiment are consistent. The
refinements in the diagnostic techniques in this experi
ment have, however, produced more precise data on which
a new interpretation of the results is based. Most sig
nificantly, it has been found that the observed x rays
are produced by electrons which have an energy consider
ably lower than that corresponding to normally acceler
ated electrons.
5.6.2 A comparison £1 the results ~those 2f ~ ~
experiments reported Qy Stephanovski.- Stephanovski has
recently reported (10) some results of an experiment in
the USSR which is similar to the one described in this
thesis. Two devices were constructed to accelerate elec-
trons in a plasma. One was a betatron - designated
OBF-400/80 - and the other - designated OF-400/80 - was
built around an identical torus but used induced image
currents in adjacent conductors to keep the beam from
striking the wall of the chamber. In each case an azi-

- 116 -
muthal magnetic field was provided and plasma formation
was accomplished by using a spiraling electron beam (48).
Table IX summarizes some of the quantities describing
these two devices along with the plasma betatron - desig-
nated US - described in this experiment.
TABLE IX
CHARACTERISTIC PARAMETERS OF TWO USSR ACCELERATORS
AND THE U OF S PLASMA BETATRON
Parameter
Peak accelerating field (x 103 volts/m)
OBF
7.0 4.5
OF us
15 8.8 2 2.2
*
Length of accelerating period (psec) Theoretical maximum electron energy
(Mev) 5.5 5.2 3. 4 -ic
Maximum azimu2hal magnetic field (webers/m )
Mean orbit diameter (meters) Chamber bore diameter (meters) Initial plasma density (x 1011 cm-3)
. 25
.40
.08 .2-.3
.35 .15
.40 .38
.08 .06 .2-.3 .4-4
*These figures refer to the maximum values for the experiment reported in this thesis. Design values are 17.7 and 6.75 respectively.
Operation of the OBF-400/80 betatron resulted in some
electrons reaching the full energy of the machine. These
electrons produced a maximum of 1-ampere of current. A
transient "conduction" current was observed during the
first 0.3 - 0.7 psec.
In the operation of the OF-400/80 machine, no elec-
trons were observed to reach the maximum energy of the

- 117 -
machine. A transient ttconductionn current was observed,
however. With azimuthal magnetic fields from 0.25 to
0.35 webers/m2 , x rays were observed along with the cur
rent. The energy of the electrons producing the x rays
is estimated to be half the energy of normally acceler
ated electrons. Observations on electromagnetic radia
tion from the plasma indicated radiation at the electron
cyclotron frequency and the electron plasma frequency.
The result that the energy of the electrons produc
ing the x rays is smaller than the corresponding theo
retical energy is similar to one of the important results
obtained independently in the experiment described in
this thesis.
If the oscillogram of the Rogowski-coil signal given
by Stephanovski is analysed in a similar manner to that
used in this experiment, an interesting result is found.
The value of V calculated in this way is 0. 015. However,
additional data reported by Stephanovski implies that the
initial plasma density corresponds to V = 0.24. On the
basis of an interpretation in terms of the fractional
stream model the indication is, therefore, that only one
fifteenth of the electrons are accelerated. The corre
sponding fraction for the experiment described in this
thesis is from one half to one tenth.
This result is in qualitative agreement with the

- 118 -
theory and discussion set down in Section 2.4 where it
is suggested that an inhomogeneity in the plasma density
may trap large numbers of electrons. In the USSR experi
ment the plasma was formed by a spiraling beam of elec
trons rather than an rf field. The plasma formed in
this way is likely to be at a lower temperature and there
is a probability of an inhomogeneity in the density near
the point of electron injection. The wavelength of this
inhomogeneity is longer than that associated with the
spacing of the coils which produce the azimuthal magnetic
field. Because of both the lower plasma temperature and
the longer wavelength inhomogeneity, more electrons could
be trapped in the USSR experiments.
5.6.3 The experimental. results and the ~-stream ill
stability.- If all the electrons are accelerated normally,
the two-stream instability theory predicts stability for
all but the highest Y values encountered in this experi
ment. However, it has been found that not all electrons
are accelerated normally and therefore this ideal two
stream theory does not apply. At least it does not apply
for time intervals as long as 0.2 psec - the duration of
the initial phase of the acceleration on which the ex
perimental determination of the nature of the acceleration
is based.
It was also shown in Chapter 3 that the presence of a
small number of slow electrons would cause the undamped

- 119 -
plasma oscillations to grow much faster and that dis
ruption of the beam could be expected through the two
stream instability for the entire range of ) values
investigated. It was suggested also that large ampli
tude oscillations associated with density inhomogene
ities could be amplified and cause disruption of the
beam.
Any theory which is to explain the observed dis
ruption of the electron beam must account for the failure
of the electrons to gain or maintain large streaming ve
locities. The two-stream instability theory satisfies
this requirement.
The evidence that the time of disruption of the beam
is earlier at the higher accelerating fields, is in qual
itative agreement with the theoretical investigation of
the amplification of plasma oscillations associated with
plasma density inhomogeneities. In this case the wave
number of the inhomogeneity would be 'in resonance' at
an earlier time for a higher accelerating field.
A feature of the evidence which is not explained by
the theory is the apparent independence of the instabil
ity mechanism on the value of ~. The theory predicts,
for example, a rather strong dependence of the time of
disruption on the value of v . It shou~d be noted how
ever that the observed time of disruption of the beam may
bear a somewhat indirect relation to the instability mech-

- 120 -
anism. Consequently the apparent discrepancy can not
at present be interpreted as a definite disagreement
between theory and experiment.
The two-stream instability theory - modified to
take account of the presence of a small number of slow
electrons - is based on a rather idealized electron ve
locity distribution. It is not known if a more realis
tic electron velocity distribution would bring the pre
dictions of the theory into agreement with the observa
tions. A conclusion regarding the identity of the in
stability in the plasma betatron can not be made at this
time.
5.6.4 The instability~~ possible plasma heating
mechanism.- As was discussed in Section 5.4, the energy
of streaming motion - at least 25 kev per electron at the
higher ~ values - which the electrons lose during dis
ruption of the beam may be given up within the plasma.
If so it must appear in some other forrn(s) - oscillations
of ions and electrons, random motion of ions and elec
trons, etc. Of possible interest for controlled thermo
nuclear research is the energy which goes into random ion
motion. If the collective interaction which takes place
in the plasma betatron involves the efficient transfer of
energy to the ions, interesting plasma temperatures may
result.
Smullin and Getty (49) have conducted an experiment

- 121 -
in which a 1-ampere, 10-kev electron beam was injected
into a plasma. The collective interaction between the
electron beam and the plasma was found to heat the ions
up to a kinetic temperature of a few electron volts.
Temperatures about 1000 times higher are needed to pro
duce a significant cross section for thermonuclear fu
sion reactions. While there are important differences
between an externally injected beam-plasma experiment
and a runaway electron experiment, the beam disruption
reported in this thesis is similar in some respects to
that observed by Smullin and Getty. Since, however, the
beam currents and electron energies are orders of mag
nitude higher in the plasma betatron experiment than in
the experiments of Smullin and Getty, it is possible
that more interesting ion temperatures are also produced.
An investigation of ion temperatures in this experiment
is being planned.

- 122 -
CHAPTER 6
SUMMARY.
(1) Diagnostic techniques •. - Several improvements
in two diagnostic techniques are described in this thesis.
The Rogowski coil has been adapted for the measurement
of low-level currents of short duration by winding the
coil with resistance wire and enclosing the coil in an elect
rostatic shield. The observed current leads to estimates
for the line density of the accelerated electrons.
The diagnostic technique involving the scintillation
detectors has been considerably extended for this work. A
pair of scintillation detectors are used. One of them detects
the x rays coming directly from the torus while the other detects
x rays which have been also passed through a thin sheet of lead.
An analysis was made (including the effects of different electron
energy distributions) so that quantitative information on the
number and energy of the electrons producing the x rays could
readily be obtained from one oscillogram. Consideration was
given to the effects on the results of the uncertainty in the
angular distribution of bremsstrahlung radiation produced in thick targets.
(2) Plasma betatron theory.- It is found that in the absence
of collective interactions, moderate accelerating fields applied
to a plasma should produce an intense stream of runaway electrons.
Two collective effects were considered in this thesis, density
inhomogeneities and the two-stream instability. In a practical
system where density inhomogeneities may occur, a majority of the
electrons may be trapped due to the inhomogeneities and prevented
from being accelerated freely. The two-stream instability was

- 123 -
found to be serious under some conditions.
The effect of the azimuthal magnetic field was consider
ed. It is found that because of the azimuthal magnetic
field no constriction of the beam can occur. Instead, the
pinch forces cause the electron beam to rotate about its axis.
Two disturbing effects were investigated - the self-field
of the beam current and defects in the betatron field. In
the absence of instabilities it was found that over a wide
range of conditions normal acceleration should be possible
for at least a half microsecond.
In addition to the two-stream instability, several other
possible instability me.chanisms were considered briefly. It
was found that adequate instability theory does not exist in
some cases.
(3) Exoerimental results.- When the betatron accelerat
ing field is applied to an argon plasma in an azimuthal mag
netic field, a transient current is observed corresponding
to the production and disruption of an electron stream.
Associated with the disruption of the stream is the emission
of x rays. Measurements reveal that the upper limit on the
average energy of the electrons producing the x rays (represent
ing approximately 1% of all electrons) is from one quarter
to two thirds of the "theoreticaln runaway energy. It is
found that not all the electrons are accelerated freely as
runaway electrons.
The time of disruption of the electron stream is
found to be independent of the beam density and gas pres-

- 124 -
sure (up to 0.62 microns Hg) but varies approximately
as the accelerating field to the power minus one half.
(4) Conclusions.- The observed experimental data
are consistent with those of similar experiments previ
ously conducted. The use of refined diagnostic tech-
niques has resulted, however, in more definitive inform
ation on the behavior of the plasma betatron over a larger
range of conditions than was the case in previous experim
ents. The major new conclusion arising from the experiment
is that the disruption of the beam is due to an unidentified
collective interaction.

- 125 -
APPENDIX A
THE EFFECT OF A DEVIATION FROM THE
BETATRON CONDITION
The purpose of this Appendix is to estimate the
effect of an error in the betatron field. The analysis
is carried out in terms of a deviation from the design
values of the currents flowing in the betatron winding.
The unbalanced force on an electron in the plane
of the equilibrium orbit due to the betatron field is
found from equation 2.23.
Fb = -e2Ar (Bb - Ab/~ )/m. A.l
In this case the betatron field is provided by a pair
of 'inner' and a pair of 'outer' turns. Since the equi-
librium orbit is in the plane of symmetry, the contribu
tion to the betatron field from both inner turns may be
considered together as may the contribution from the out
er turns. The superscript, 1, is adopted for the inner
turns and 2 for the outer turns. The magnetic field and
vector potential may be written
Bb = Bl + B2 ] A.2
Ab = Al + A2. A.3
If €' is the fraction of the design current for the in-
ner pair of turns which is diverted from one pair of turns
to the other, then
Bl B~ + €~Bl ] 0 A.4 B2 = B2 1.29f'B~ 0
where the subscript, o, refers to design values.

- 126 -
The factor 1.29 arises from the fact that the de-
sign ratio of current in the inner turns to that in the
outer turns is approximately 1.29. A positive E' in-
dicates an increase in the current in the inner turns
over the design value. Substituting equation A.4 into
equation A.2 one obtains for the magnetic field due to
the currents in the betatron winding.
Bb = Bg + E'(B~ - 1.29B~) • A.5
The magnetic field profiles in the plane of the equi-
librium orbit for in inner and outer turns are repro-
duced from Gore's M. A. Thesis (Ll) in Figure 27(a).
From this Figure it is found that for the betatron
B~ ~ -0. 23B~ J A.6
in the region of interest. From equations A.6 and A.5
B b = Bg ( 1 - 1 • 8 2 € I). A. 7
In a similar manner the magnetic vector potential
may be written
A1 = A~ + €'A1
J 0 A.8
Az = A2 - 1. 29E'A2 0 0 •
The components of magnetic vector potential may be cal-
culated by a numerical integration using the data in
Figure 27(a). The results of such a calculation are
shown in Figure 27(b). In the region of interest it
found that Al 0 ~ (?·I~ )312(A~)f•
is
A2 ( fl If' b) 3 I 2 (A~ )f. J A. 9
~ 0

r "'0 Q) -0 -Q) c: 0'1 0
~
1
-~ -c: Q) -0 a.
""" 0 -0 Q)
>
-~ -Q) c: 0' 0 ~
0
- 127 -
~ (meters)
.10 .15"
(meters)
Figure 27. Magnetic field and vector potential profiles for the plasma betatron.

- 128 -
and that
(A~~p = 0. 368 (Ag)f'.,
] A.lO (A6} .. 0. 632(Ag~ ..
From equations A.3, A.8, A.9, and A.lO, it is found that
b b b I I. 3/2 3/2] A ~ A0 + (A0 ~. E L0.368(f, /f) - 0.815(/ '/·) A.il
Near the equilibrium orbit, equation A.ll reduces to
Ab ~ Ag - 0.45 E' (A~~<> A.l2
From equations A.l, A.7, and A.l2, the force on an
electron is given by
Fb ~ -(e2A,/m) [<B~ - A~/f) - t'(l.82B~ - 0.45(~),.. •. t/jJ )]
A.l3
The force on an electron due to the betatron field is the
force due to the design betatron field plus a radial force
due to any error in the current distribution. It is con-
venient to express the error in the current distribution
in terms of€, the error in the ratio of currents in the
inner and outer turns.
f ~2.3E' A.l4
From equations A.l3, A.l4, and 2.29, the net radial force
on an electron at the design equilibrium orbit due to an
error in the current distribution in the betatron winding
is
A.l5
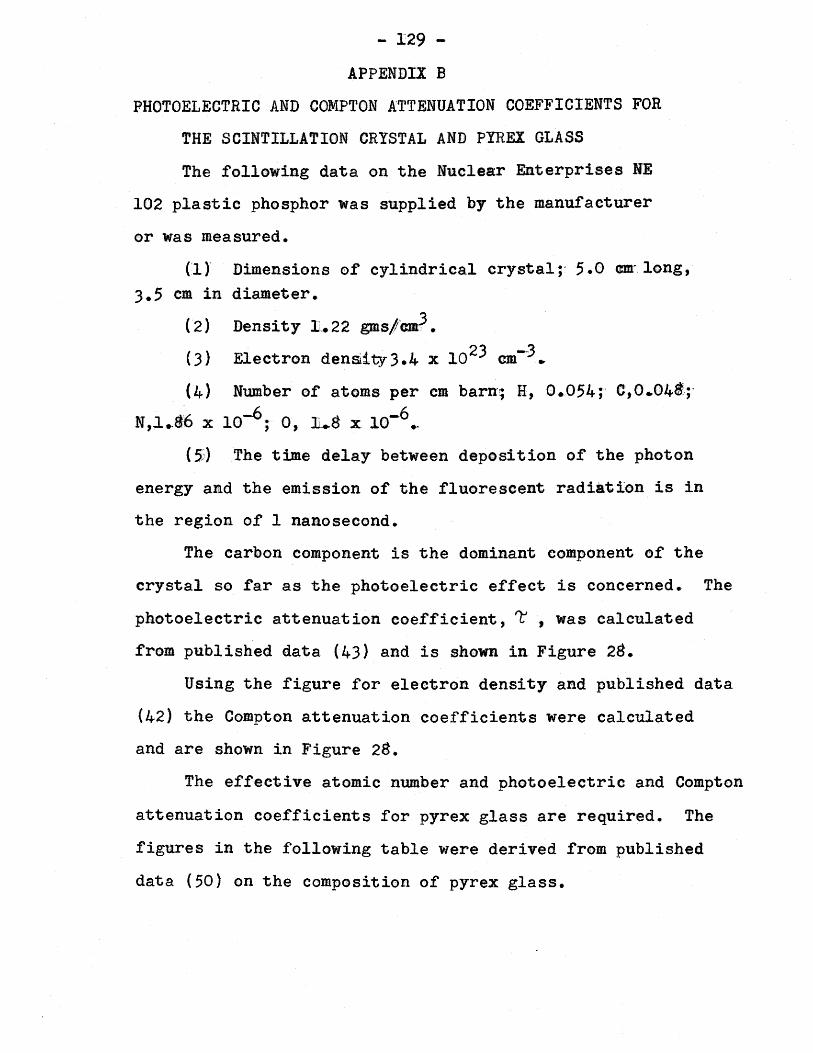
- 129 -
APPENDIX B
PHOTOELECTRIC AND COMPTON ATTENUATION COEFFICIENTS FOR
THE SCINTILLATION CRYSTAL AND PYREX GLASS
The following data on the Nuclear Enterprises NE
102 plastic phosphor was supplied by the manufacturer
or was measured.
('ll Dimensions of cylindrical crystal;· 5.0 cmr. long, 3.5 em in diameter.
(2) Density 1 .• 22 gms/lcm3.
(3) Electron densi1ty3.4 x 102.3 cm--.3 ..
(4) Nwnber of atoms per em barn; H, 0.054; C,0 .. 041r d'6 -6 - g -6 N,~.G X 10 ; o, li. X 10 ."
(5_:) The time delay between deposition of the photon
energy and the emission of the fluorescent radiation is in
the region of 1 nanosecond.
The carbon component is the dominant component of the
crystal so far as the photoelectric effect is concerned. The
photoelectric attenuation coefficient, ~ , was calculated
from published data (43) and is shown in Figure 28.
Using the figure for electron density and published data
(42) the Compton attenuation coefficients were calculated
and are shown in Figure 28.
The effective atomic number and photoelectric and Compton
attenuation coefficients for pyrex glass are required. The
figures in the following table were derived from published
data (50) on the composition of pyrex glass.

'E 2
(/) -c: Q)
0 --Q)
0 0
c: 0
0 :::J c: Q) --<(
- 130 -
~ Photoelectric attenuation coefficient
o- Compton attenuation coefficient
0.1
0.0110 100
Photon energy {kev)
Figure 28. Photoelectric and Compton attenuation coefficients for the NE 102 plastic phosphor as a function of photon energy.

Element
0 Si B Na Fe Al As Ca K
- 131 -
TABLE X
COMPOSITION OF PYREX GLASS
Atomic Atomic Abundance Density Atoms Number Weight in Pyrex gms/cc per cc
% (x 1021)
8 16.0 53.3 1.24 46.2 14 28.1 37.8 .876 18.8
5 10.8 3.73 .087 4.85 11 23.0 3.04 . 071 1.86 26 55.8 . 95 .022 .238 13 27.0 .45 .010 .223 33 74.9 .26 .006 .048 20 40.1 .21 .005 .075 19 39.1 .08 .002 .031
Totals 2.32 72.3
Electrons per ~~
(x 10 )
37.3 26.3
2.42 2.05
.619
.280
.158
.150 • 059
69.3
From the above totals the effective atomic number is
taken to be 9.59.
The significant contributions to the photoelectric
attenuation coefficients are tabulated below.
TABLE XI
PHOTOELECTRIC ATTENUATION COEFFICIENTS FOR PYREX GLASS
Element gms/cc ~Energy
ev) 10 -c (em) 20 40 100
0 1.24 6.82 .719 .072 .0033 Si .876 29.7 3.64 .402 .0208 Na .071 1.09 .125 . 013 .0006 Fe .022 3.91 .565 .073 .0045 As .006 1.33 .202 .027 .0018
42.8 5.25 .587 .0310
The Compton and photoelectric attenuation coefficients
for pyrex glass are shown in Figure 29.

I
'E B
(J) -c: Q)
0 --Q) 0 0
c 0
0 ~
c Q)
- 132 -
"C Photoelectric attenuation coefficient
a- Compton attenuation coefficient
~ 0.1
0.01~----~----L-~~~~-L~--~--~--~--~~~~~~ 10 100
Photon energy (kev)
Figure 29. Photoelectric and Compton attenuation coefficients for pyrex glass as a function of photon energy.

- 133 -
APPENDIX C
THE CALCULATION OF EFFECTIVE AND AVERAGE ELECTRON
ENERGY CORRESPONDING TO CERTAIN x...:RAY SPECTRA
In this appendix calculations are made for the ef-
fective and average electron energy corresponding to the
B and C x-ray spectra described in Section 4.2.4. Each
spectrum is subdivided into five Kramer distributions as
shown in Figure 30. Equations 4.23 and 4.24 are then
used to calculate W ff and W . The calculations are e av
tabulated in Table XII. The x-ray energy, Pi, is in ar-
bitrary units.
TABLE XII
TABULATION OF CALCULATIONS ON CERTAIN x...:RAY SPECTRA
Spectrum Kramer ...Hi.. p. Wi Wj 2 1 type distribution Wmax {Wi7Wmax) {Wi7Wmax)
B 1 1.00 0.50 0.50 0,. 50 2 0.90 0.90 1.00 1.11 3 0.75 1.13 1.51 2.01 4 0.52 o. 52 1.00 2.00 5 0.30 .Q.:.lQ hQ.Q .h.ll
Totals 3.35 5.01 8.95
c 1 0.90 0.45 0.50 0.55 2 o. 70 0.35 0.50 0.72 3 0.55 0.55 1.00 1.82 4 0.40 0.40 1.00 2.50 5 0.25 Q:.1l ~ 6.00 --·--=
Totals 2.12 4.48 11.59
From the above totals the data in Table I is readily
obtained.

en -c: ::)
>. "-0 "-
.c "-0
>.
en c Q) -c
>. 0 ~
I X
1./) -c ::J
>-. ~
0 .... -.c "-0 ->.
"iii c: 2 c
>. 0 '-I
X
8
6
4
2
0
2
0
134 -
.4 .6 W/W"~-."11
c
3
2
.2 .4 .6 .8 1.0
W/WW!A)(
Figure 30. The subdivision of the 'B' and 'C' spectra ill:to five Kramer spectra.

- 135 -
APPENDIX D
THE ACCELERATING FIELD WAVEFORM
The accelerating field in this experiment is pro-
duced by a slowly damped oscillating current in the
betatron circuit. All observations were made during
the first quarter cycle of the oscillating current.
The switches used to close the betatron circuit
have a nonzero closing time. Measurements revealed that
the closing time varied from less than 0.1 psec to about
0.2 psec. The closing time depended on the air pressure
in the switches and the degree of contamination of the
switching system. It was found, however, that the rise
in the accelerating field was approximately linear as
illustrated by the solid line in Figure 31 (a). In or-
der to calculate the energy which runaway electrons
would have, it is necessary to take into account the
switch closing time, tc.
The linear portion of the Rogowski-coil trace in-
dicates that the average acceleration of the electrons
during this time is constant, regardless of whether the
fractional-stream or whole-stream model is closest to
reality. If it is assumed that the acceleration is pro-
portional to the accelerating field, then the average
velocity
D.l

-(/J
5 E'f' :;::... '-0 '--.Q '-.s
"1:J
.~ .... 0' c
.o '-Q)
Q)
0 0 <t
- 136 -
(a}
0 tc/2 fc .5 1.0
Time (microseconds)
(b)
.5 1.0
Time (microseconds)
Figure 31. The accelerating field and current waveforms due to the nonzero rise time of the accelerating field.

- 137 -
Assume that E(t) is given by
E(t) = E'ft/tc
= Ef D.2
where Ey is the peak accelerating field. The assump
tion of a constant accelerating field after time tc is
a good approximation to the actual case for times short-
ly after tc. From equations D.l and D.2
v KE'f t2/ 2 0 ~ t ~ tc] D.3 = KEs-(t - tc/2). t? tc
It is evident that for times greater than tc the veloc-
ity is the same as if the accelerating field had been of
the form
E(t) 0 t~ tc/2 ] D.4 = ECf • t~ tc/2
The current is proportional to the average velocity
and would have the form indicated by the solid line in
Figure 31 (b). The dashed line in Figure 31 (b) indi-
cates what the current would be if the accelerating field
had the form described by equation D.4 (shown as a dashed
line in Figure 31 (a».
The practice described in Section 5.2 of measuring
times from the intersection of the linear portion of the
current trace with the axis is now justified so long as
the events of interest occur after time tc· This method
is useful because of the variability of the SwQtch closing
time and the difficulty of determining with accuracy the
beginning of the acceleration.

- 138 -REFERENCES
1. G. J. Budker, Proceedings of the CERN Symposium .Q.!! Hig~-Energy Accelerators and Pion Physics, Geneva, 195 , Vol. 1, p. 68.
2. P. Reynolds and H. M. Skarsgard, Betatron Acceleration of Electrons in 2. Plasma, 1958, CERN report, CERN, 58~19.
3. N. C. Christofilos, Proceedings of the Second United Nations International Conference on the Peaceful Uses o£ Atomic Energy, Geneva, 1958, Vol.~2-p-279.
4. J. G. Linhart and A. Schoch, Nuclear Instruments and Methods, ~' 332 {1959).
5. G. J. Budker and A. A. Naumov, Proceedings of the CERN Symposium on High-Energy Accelerators and Pion Physics, Geneva, 1956, Vol. 1, p 76.
6. D. Finke~stein, Proceedings of the Second United Nations Internat1onal Conference on the Peaceful Uses of Atomic Energi, Geneva, 1958, Vo1-.-3~p 446. ---- --
7. D. C. de Packh, Proceedings of the Third International Conferenc;_e on....1_onization Phenomena in Gases, Venice, 1957, p 23b.
8. G. ~iyamoto et a1, Proceedings of ~ Second United Nat1ons International Conference on the Peaceful Uses of Atomic Energx, Geneva, 1958, Vol. 32, p 308. ----
9. L. T. Shepherd and H. M. Skarsgard, Phys. Rev. Letters, 10, 121 (1963).
10. A. M. Stephanovski, High Energy Accelerator Papers from USSR Prepared ~ Presentation ~ 1961 Inter~ationa1 Conference. Brookhaven Nationql Laboratory, 1962, p 106.
11. J. V. Gore, M. A. Thesis, University of Saskatchewan, 1961.
12. N. 0. 0. Eikel and H. M. Skarsgard, Rev. Sci. Instr. Jl±., 299, (1963).
13. L. T. Shepherd, M. Sc. Thesis, University of Sa.skatchewan, 1960.
14. L. T. Shepherd, and H. M. Skarsgard, Can. J. Phys. 12· 983' (1961).
- 139 -
15. L. Spitzer, Jr., Physics of Fully Ionized Gases, Interscience Publishers, Inc., New York (1956).
16. S. Chandrasekhar, Plasma Physics, The University of Chicago Press, Chicago (1960).
17. D. J. Rose and M. Clark, Jr., Plasmas and~trolled Fusion, The M.I.T. Press and John Wiley & Sons, Inc., New York (1961).
18. S. Glasstone and R. H. Loveberg, Controlled Thermonuclear Reactions, D. Van Nostrand Co., Inc., Princeton, New Jersey (1960).
19. H. Dreicer, Phys. Rev. lll, 329, 343 (1960).
20. E. R. Harrison, Phil. Mag. l, 1318 (1958).
21. E. R. Harrison, J. Nuclear Energy C, i, 7 (1962).
22. J. G. Linhart, The Problem of Runaway Electrons ill Plasma, 1957, cERN-PS/JGL 2:-
23. G. Schmidt, J. Nuclear Energy C, ,1,156 (1961).
24. D. W. Kerst, Phys. Rev. 60, 47, (1941).
25. F. W. Grover, Inductance Calculations, D. Van Nostrand Co., Inc., (1946).
26. D. Finkelstein and P. A. Sturrock, Plasma Physics, Edited by James E. Drummond, McGraw-Hill Book Co., Inc. , ( 1961) •
27. Ch. Maisonnier and D. Finkelstein, ~Intensity Limitation ill Neutralized Space Charge Betatrons, 1959, CERN 59-11.
28. C. E. Nielson, et al, Proceedings £i the International Conference .Q.U High...:Energy Accelerators and Instrumentation, CERN, 1959, p 239.
29. I. B. Bernstein and R. M. Kulsrud, Phys. Fluids, ,1, 937 (1960).
30. B. B. Kadomtsev and A. V. Nedospasov, J. Nuclear Energy C, 1, 230 (1960).
31. F. C. Hoh, Phys. Fluids, 5, 22 (1962).

32.
33.
34.
35.
36.
37.
38.
39.
40.
41.
42.
44.
45.
46.
47.
48.
49.
50.
- 140-
0. Buneman, Phys. Rev. 115, 503 (1959).
H. M. Skarsgard, Can. J. Phys. ~' 450, (1963).
S. T. Stephenson, Ha.ndbuch der Physik, Vol XXX, X-Rays Spring-Verlag, Berlin, 1957 ."
H. W. Koch and J. W. Motz, Rev. ~Iod. Phys • .21, 920, (1959).
A. H. Compton and S. K. Allison, X-RayT in Theorx and Experiment, D. Van Nostrand Co., Inc. 1935).
H. A. Kramers, Phil, Mag. 46, 836 (192a).
H. Kulenkampff and 1. Schmidt, Ann. der Phys. ~· 494 (1943).
National Bureau of Standards Handbook No. ~(to be published).
D. V. Corm. ackt Trans. IX Int. Congress Radiology, p 1400' (1960 J.
H. Kulenkampff, Handbuch der Physik, Band XXIII, Quanten, Julius Springer, Berlin (192or:-
K. Siegbahn, Beta- and Gamma-Ra~ Spectroscopy North-Holland Publishing Co., Amsterdam (1955).
G. W. Grodstein, !-Ray Attenuation Coefficients from 10 keT .~o 100 Mev, National Bureau of Standards Circular 583, 1957).
0. D. Olson, M. Sc. Thesis, University of Saskatchewan, 1962.
0. D. Olson and H. M. Skarsgard, Can. J. Phys. 41, 391 (1963).
A. R. Strilchuk, Private communication.
H. S. W. Massey and E. H. S. Burhop Electronic and Ionic Impact Phenomena, Clarendon Press, Oxford
(1952).
J. G. Linehart and L.Th. M. Ornstein, Production of Plasma in ~ Toroidal Vessel Bz means of ~ Spiral Electron Beam, (1959) CERN 59-2.
L. D. Smullin and W. D. Getty, Phys. Rev. Letters, 9, 3 (1962).
F. C. Frary, C. S. Taylor, J. D. Edwards, Laboratory Glass Blowing, McGraw-Hill Book Co., Inc., (1928).