
Influence of the intensity gradient upon HHG from free electrons scattered by an intense laser beam
Upload
khangminh22Category
view
4download
0
REPORT DOCUMENTATION PAGE Ruble reporting burden for thb colection of Information Is estimated to average 1 hour per response, including the time fo Gathering and maintaining the data needed, and completing and reviewing the coBection of Information. Send comments i of information, Including suggestions for reducing this burden to Washington Headquarters Service, Directorate for Inform 1215 Jefferson Davis Highway. Suite 1204, Arington, VA 22202-4302, and to the Office of Management and Budget, Paperwork Reduction Project (0704-0188) Washington, DC 20503.
AFRL-SR-AR-TR-02-
2. REPORT DATE 3. DATES COVERED (From - To)
Final Technical Report 09-01-2001 to 02-28-2002 REPORT DATE (DD-MM-YYYY)
1—Q5r^ ?a -2002_ 4. TITLE AND SUBTITLE
Gas and Chemical Lasers and Intense Beam
Applications III
6. AUTHOR(S)
Heaven, Michael C. Davis, Steven J.
7. PERFORMING ORGANIZATION NAME(S) AND ADDRESS(ES)
Society of Photo-Optical Instrumentation
(SPIE) P0 Box 10 •Rpl 1 inorViaTn, WA QR777-0010-
9. sponsoriiTg/monitoring AGENCY NAME(S) AND ADDRESS(ES)
5b. GRANT NUMBER
F49620-01-1-0488
5c. PROGRAM ELEMENT NUMBER
(d uosJF 5d. PROJECT NUMBER
a303> 5e. TASK NUMBER
EX 5f. WORK UNIT NUMBER
Engineers
8. PERFORMING ORGANIZATION REPORT NUMBER
Volume 4631
10. SPONSOR/MONITOR'S ACRONYM(S)
Air Force Office of Scientific Research 801 N. Randolph Street, Room 732 Arlington, VA 22203-1977
12. DISTRIBUTION AVAILABILITY STATEMENT
AF0SR/NL 11. SPONSORING/MONITORING
AGENCY REPORT NUMBER
Approved for Public Release
113. SUPPLEMENTARY NOTES
ISBN 0-8194-4370-0 ___ 14. ABSTRACT
This proceedings contains papers on the following topics: Oxygen-Iodine Chemical Lasers;other chemical lasers; laser systems, modeling and interactions;
COIL technology development.
15. SUBJECT TERMS
Laser
_ |16. SECURITY CLASSIFICATION OF: 17. LIMITATION OF
ABSTRACT 18. NUMBER OF PAGES
296
19a. NAME OF RESPONSIBLE PERSON
Janice Gaines Walker a. REPORT Non-
classfiec
b. ABSTRACT c. THIS PAGE
SAR 19b. TELEPONE NUMBER {Include area code)
(360)676-3290
Standard Form 298 (Rev. 8-98) Prescribed by ANSI-Std 239-18

fa
PROCEEDINGS OF SPIE SPIE—The International Society for Optical Engineering
Gas and Chemical Lasers and Intense Beam Applications III
Steven J. Davis Michael C. Heaven Chairs/Editors
22-24 January 2002 San Jose, USA
Sponsored by SPIE—The International Society for Optical Engineering
Cosponsored by AFOSR—Air Force Office of Scientific Research (USA)
20020617 038 Volume 4631
v

PROCEEDINGS OF SPIE SPIE—The International Society for Optical Engineering
Gas and Chemical Lasers and Intense Beam Applications III
Steven J. Davis Michael C. Heaven Chairs/Editors
22-24 January 2002 San Jose, USA
Sponsored and Published by SPIE—The International Society for Optical Engineering
Cosponsored by AFOSR—Air Force Office of Scientific Research (USA)
P B PROCEEDINGS ji
SERIES H
Volume 4631
SPIE is an international technical society dedicated to advancing engineering and scientific applications of optical, photonic, imaging, electronic, and optoelectronic technologies.

The papers appearing in this book compose the proceedings of the technical conference cited on the cover and title page of this volume. They reflect the authors' opinions and are published as presented, in the interests of timely dissemination. Their inclusion in this publication does not
necessarily constitute endorsement by the editors or by SPIE. Papers were selected by the conference program committee to be presented in oral or poster format, and were subject to
review by volume editors or program committees.
Please use the following format to cite material from this book:
Author(s), "Title of paper/' in Gas and Chemical Lasers and Intense Beam Applications III, Steven J. Davis, Michael C. Heaven, Editors, Proceedings of SPIE Vol. 4631, page numbers
(2002).
ISSN 0277-786X ISBN 0-8194-4370-0
Published by SPIE—The International Society for Optical Engineering P.O. Box 10, Bellingham, Washington 98227-0010 USA Telephone 1 360/676-3290 (Pacific Time) • Fax 1 360/647-1445 http://www.spie.org/
Copyright© 2002, The Society of Photo-Optica! Instrumentation Engineers.
Copying of material in this book for internal or personal use, or for the internal or personal use of specific clients, beyond the fair use provisions granted by the U.S. Copyright Law is authorized by SPIE subject to payment of copying fees. The Transactional Reporting Service base fee for this volume is $15.00 per article (or portion thereof), which should be paid directly to the Copyright Clearance Center (CCC), 222 Rosewood Drive, Danvers, MA 01923 USA. Payment may also be made electronically through CCC Online at http://www.directory.net/copyright/. Other copying for republication, resale, advertising or promotion, or any form of systematic or multiple reproduction of any material in this book is prohibited except with permission in writing from the publisher. The CCC fee code is 0277-786X/02/$15.00.
Printed in the United States of America.

Contents
vii Conference Committee ix Introduction xi Description of first COIL demonstration, December 1977
Oxygen-iodine chemical laser, W. E. McDermott, D. J. Benard, N. R. Pchelkin, R. R. Bousek
KEYNOTE PAPER_
1 Historical perspective of COIL (Keynote Paper) [4631-01] W. E. McDermott, NASA Ames Research Ctr. (USA)
SESSION 1 THE FIRST 25 YEARS OF COIL: PART I
13 Mechanism and kinetics of iodine dissociation in COIL (Invited Paper) [4631-02] M. C. Heaven, A. V. Komissarov, V. Goncharov, Emory Univ. (USA)
23 Gain and temperature in a slit nozzle supersonic chemical oxygen-iodine laser with transonic and supersonic injection of iodine (Invited Paper) [4631-03] S. Rosenwaks, B. D. Barmashenko, E. Bruins, D. Furman, V. Rybatkin, A. Katz, Ben-Gurion Univ. of the Negev (Israel)
34 Chemical generation of atomic iodine for COIL [4631-04] 0. Spalek, V. Jirasek, Institute of Physics (Czech Republic) and Institute of Inorganic Chemistry (Czech Republic); J. Kodymova, M. Censky, Institute of Physics (Czech Republic); I. Jakubec, Institute of Inorganic Chemistry (Czech Republic)
43 Modeling of the chemical generation of atomic iodine in a chemical oxygen-iodine laser [4631-05] V. Jirasek, 0. Spalek, J. Kodymova, M. Censky, Institute of Physics (Czech Republic)
SESSION 2 THE FIRST 25 YEARS OF COIL: PART II
53 German COIL efforts: status and perspectives (Invited Paper) [4631-07] W. L. Bohn, DLR (Germany)
60 Historical perspective of COIL diagnostics (Invited Paper) [4631-08] S. J. Davis, Physical Sciences Inc. (USA)
74 Modeling of the gain, temperature, and iodine dissociation fraction in a supersonic chemical oxygen-iodine laser [4631-09] B. D. Barmashenko, E. Bruins, D. Furman, V. Rybalkin, S. Rosenwaks, Ben-Gurion Univ. of the Negev (Israel)
86 Contribution of the COIL Laboratory in Prague to the chemical oxygen-iodine laser research and development (Invited Paper) [4631-10] J. Kodymova, 0. Spalek, Institute of Physics (Czech Republic)
iii

101 COIL technology development at Boeing (Invited Paper) [4631-11]
S. C. Hurlock, The Boeing Co. (USA)
SESSION 3 2002: 25 YEARS OF COIL_
116 History of COIL development in Japan: 1982-2002 (Invited Paper) [4631-19] M. Endo, Tokai Univ. (Japan); T. Uchiyama, Keio Univ. (Japan); K. Nanri, S. Takeda,
T. Fujioka, Tokai Univ. (Japan)
128 High-power COIL and YAG laser welding [4631-20] F. Wani, T. Nakabayashi, A. Hayakawa, S. Suzuki, K. Yasuda, Kawasaki Heavy Industries,
Ltd. (Japan)
137 COIL development in Kawasaki Heavy Industries, Ltd. [4631-22]
T. Takada, F. Wani, K. Yasuda, Kawasaki Heavy Industries, Ltd. (Japan)
145 Spatially resolved temperature diagnostic for the chemical oxygen-iodine laser based on a variant of saturation spectroscopy [4631-23] G. T. Phillips, G. P. Perram, W. B. Roh, Air Force Institute of Technology (USA)
154 Diagnostic development for the ElectriCOIL flow system [4631-24] J. T. Verdeyen, D. M. King, D. L. Carroll, CU Aerospace (USA); W. C. Solomon, Univ. of
Illinois/Urbana-Champaign (USA)
161 Measurement of chemical oxygen-iodine laser singlet oxygen generator parameter using Raman spectroscopy [4631-25] W. Zhao, F. Sang, L. Duo, F. Chen, Y. Zhang, B. Fang, Dalian Institute of Chemical Physics
(China)
SESSION 4 OTHER CHEMICAL LASERS _
167 Tunable diode laser gain measurements of the HF(2-0) overtone transitions in a small-scale HF laser (Invited Paper) [4631-27] C. F. Wisniewski, G. C. Manke II, G. D. Hager, Air Force Research Lab. (USA); P. G. Crowell, Northrup Grumman Corp. (USA); C. R. Truman, Univ. of New Mexico (USA)
178 Atomic fluorine source for chemical lasers [4631-29] S. J. Davis, D. B. Oakes, M. J. Read, A. H. Gelb, Physical Sciences Inc. (USA)
184 Parametric study of NCKa^), NCKb'E) from the reaction of CI/CI2/He + HN3/He [4631-30] L. Duo, S. Tang, J. Li, X. Min, F. Sang, B. Yang, Dalian Institute of Chemical Physics (China)
192 Review of recent experiments and calculations relevant to the kinetics of the HF laser (Invited Paper) [4631-14] G. C. Manke II, G. D. Hager, Air Force Research Lab. (USA)
209 Tunable solid state laser for HF mirror metrology [4631-15] A. L. Oien, T. J. Carrig, G. J. Wagner, C. J. Urbina, Coherent Technologies, Inc. (USA); J. W. Aren'berg, TRW, Inc. (USA); J. A. Keene, Coherent Technologies, Inc. (USA)
217 Imaging spectroradiometer for HF laser studies [4631-16] W. Rawlins, D. B. Oakes, P. A. Mulhall, S. J. Davis, Physical Sciences Inc. (USA)
IV

225 Room temperature rate constant for H + F2 [4631-17] J. Han, Emory Univ. (USA); G. C. Manke il, Air Force Research Lab. (USA); M. C. Heaven, Emory Univ. (USA)
SESSION 5 LASER SYSTEMS, MODELING, AND INTERACTIONS
234 IR- and UV-laser interaction with metal surfaces (Invited Paper) [4631-31] V. F. Tarasenko, S. B. Alekseev, A. V. Fedenev, I. M. Goncharenko, N. N. Koval, K. V. Oskomov, V. M. Orlovskii, N. S. Sochugov, M. A. Shulepov, High Current Electronics
Institute (Russia)
244 Energy transfer dynamics in the A(0U+) state of Bi2 [4631-32] J. L. Cox, M. W. Dolezal, R. E. Franklin, G. P. Perram, Air Force Institute of Technology (USA)
254 Numerical testbed for laser materials processing [4631-33] M. S. Gross, 1. Black, Heriot-Watt Univ. (UK); W. H. Muller, Technische Univ. Berlin
(Germany)
264 High-power-gas-discharge- and laser-plasma-based EUV sources [4631-38] F. Flohrer, K. Gabel, D. Klopfel, P. Kohler, I. Ahmad, S. Gotze, J. Kleinschmidt, V. Korobotchko, J. Ringling, G. Schriever, U. Stamm, XTREME technologies GmbH (Germany)
POSTER SESSION
271 Pulsed COIL with volume generation of iodine atoms in electric discharge [4631-06] N. N. Yuryshev, N. P. Vagin, A. F. Konoshenko, V. S. Paziuk, P.N. Lebedev Physical Institute (Russia)
280 Observation on laser-induced lens effect in sound generation under water using high-power ultrashort-pulse laser [4631-43] H. He, Shanghai Institute of Optics and Fine Mechanics (China); S. Feng, Shanghai Acoustics Lab. (China)
284 Plasma chemical oxygen-iodine laser: problems of development [4631-46] A. A. lonin, P.N. Lebedev Physical Institute (Russia); A. P. Napartovich, Troitsk Institute for Innovation and Fusion Research (Russia); N. N. Yuryshev, P.N. Lebedev Physical Institute (Russia)
293 Addendum 295 Author Index
v

Conference Committee
Conference Chairs
Steven J. Davis, Physical Sciences Inc. (USA) Michael C. Heaven, Emory University (USA)
Program Committee
Willy L. Bohn, DLR (Germany) Ernest A. Dorko, University of New Mexico (USA) Masamori Endo, Tokai University (Japan) Gordon D. Hager, Air Force Research Laboratory (USA) Jarmila Kodymova, Institute of Physics (Czech Republic)
Session Chairs
1 The First 25 Years of COIL: Part I Steven J. Davis, Physical Sciences Inc. (USA)
2 The First 25 Years of COIL: Part II Jarmila Kodymova, Institute of Physics (Czech Republic)
3 2002: 25 Years of COIL Salman Rosenwaks, Ben-Gurion University of the Negev (Israel)
4 Other Chemical Lasers Willy L. Bohn, DLR (Germany)
5 Laser Systems, Modeling, and Interactions Steven J. Davis, Physical Sciences Inc. (USA) Michael C. Heaven, Emory University (USA)

Introduction
We were pleased to chair the third Conference on Gas and Chemical Lasers and Intense
Beam Applications at the San Jose Convention Center from 22-25 January 2002. We
had announced at the second conference in 2000 that we planned to celebrate the
25th anniversary of the invention of the Chemical Oxygen Iodine Laser (COIL) at this
conference. We were very pleased with the response to this call, and many excellent
papers were presented. Indeed the 25th anniversary of COIL was the centerpiece of this
conference.
One of our goals was to present the history of COIL from the first concepts through the
exciting research and applications of COIL. Bill McDermott, one of the four COIL
inventors, kicked-off the conference with a fascinating anecdotal history of COIL. This
plenary paper set the tone for the rest of the sessions. Researchers from several of the
leading COIL research facilities from around the world followed with descriptions of
their research, and each presented some historical perspective of their contributions to
the development of COIL.
The highlight of the conference was a special banquet held on January 22. This event
honored the four inventors of COIL, Nick Pchelkin, Ron Bousek, Dave Benard, and Bill
McDermott, shown below.
Photo Courtesy of Prof. Masamori Endo
Left to right: Nick Pchelkin, Ron Bousek, Dave Benard, and Bill McDermott at the COIL
25th anniversary banquet.

With the generous assistance of SPIE, we were able to bring the inventors to the
conference and recognize their achievements. At the banquet, Mike Berman of the Air
Force Office of Scientific Research (AFOSR) and a former COIL researcher, offered some
interesting comments on the history of COIL and the early chemical laser research
sponsored by AFOSR. Art Guenther, Chief Scientist of the Air Force Weapons Laboratory
during the time of the first COIL, delivered a brief but insightful keynote address.
Richard Hoover, President of SPIE in 2001, presented plaques to each of the inventors.
The attendees were then entertained with comments and perspectives from each of the
COIL inventors. We hope that the current COIL researchers enjoyed interacting with the
early COIL pioneers.
In addition to the photo, we have also included in the following pages a description of
the first COIL demonstration written by the four inventors in December 1977. Although
we could not locate the two figures referred to in the text, the rest of the draft is original
and serves as an appropriate introduction to this commemorative proceedings volume.
We are grateful for the efforts of the organizing committee, and we would also like to
thank all the speakers and authors for a most enjoyable conference. We would like to
thank SPIE for helping to arrange the banquet and plaques. We also gratefully
acknowledge AFOSR for support of the conference. This conference continues to grow
in its ability to attract the top laser researchers in the world and to foster collaborations.
We look forward to many more such meetings in the future.
Steven J. Davis Michael C. Heaven
OXYGEN-IODINE CHEMICAL LASER
William E. McDermott, Major, USAF
David J. Benard, GS-13, USAF
Nicholas R. Pchelkin, Captain, USAF
Ronald R. Bousek, Major, USAF
Air Force Weapons Laboratory (AFSC)
Kirtland AFB, NM 87117

INTRODUCTION
Description
The oxygen-iodine laser is the first chemical laser to operate on an electronic transition. As a result, the wavelength (1.3 microns) is shorter than that of any other chemical laser.
The laser consists of four major components: (1) A chemical reactor produces a gaseous stream of excited oxygen molecules. (2) A cyrogenic trap removes undesirable components (chlorine and water) from the oxygen flow. (3) A ’’spray bar” injects iodine vapor into the oxygen flow. Energy is transferred from excited oxygen to iodine atoms by collisions. (4) An optical resonator extracts energy from the iodine atoms, and lasing occurs at a wavelength of 1.315 microns.
Laboratory Development
The oxygen-iodine laser project was initiated at AFWL in January 1975 although preliminary experiments had been done as early as April 1973. The in-house work was supplemented with contract work through AEOSR (3 contracts), The Aerospace Corporation, Rockwell Science Center, and the Frank J. Seiler Laboratory (USAFA). The major advance - an efficient chemical source of 02(1A) - was an extension of the Seiler Laboratory's work done by the current AFWL in-house research team. On October 1977, the first generator producing adequate 02(1A) was built. Lasing was first achieved on 1 December 1977 (4 milli¬ watts). A second laser was designed and built to demonstrate effi¬ cient operation. This laser produced over 100 watts of output power in July 1978. Further work will be directed towards parameterization of the laser and understanding its operational characteristics.
Significance
The wavelength is substantially shorter than other current high energy chemical lasers, so smaller optics and better beam focusing are possible. The efficiency is promising, so device size and weight may be smaller than for other high energy lasers.

ABSTRACT
Laser action in a purely chemically-pumped atomic iodine laser was first demonstrated at the Air Force Weapons Laboratory and has been extensively studied there. In this laser a heterogeneous chemi¬ cal reaction between gaseous chlorine and a basic solution of hydrogen peroxide is used to produce a flowing stream of molecular oxygen in the excited 02(XA) electronic state. Molecular iodine is added to the flow and is dissociated into atoms by 02(tI) formed by energy pooling from 0 2( XA) . Energy is transferred rapidly from 02(1A) to the iodine atoms, and CW lasing at 1315 nanometers occurs between electronic states of atomic iodine. Since all of the energy is supplied by a chemical reaction, this is the first demonstration of a purely chemically-pumped electronic-transition laser. Because its wavelength is shorter than that of other chemical lasers under development for high energy applications, smaller optics and better beam focusing are potential advantages. The theoretical efficiency in terms of energy per unit mass of reactants appears to be good. Computer modeling of the oxygen-iodine chemical kinetics indicates that the small signal gain profile can be suitably controlled to provide efficient lasing. The results of AFWL laser experiments and computer modeling aimed at characterizing the important parameters of the oxygen-iodine chemical laser will be discussed.

The use of a chemical reaction as a pumping mechanism for a laser was first demonstrated by Kasper and Pimentel, who achieved lasing on various HC1 vibrational transitions in a flash initiated H2/CI2 mix¬ ture. The first pure chemical laser^, using no external power sources, was developed by Cool and Stephens. All such chemical lasers which have been developed to date operate on rotational-vibrational transi^ tions within a single electronic state. Kasper and Pimental reported transient lasing on atomic iodine produced by the pulsed photolysis of CF3I and CH3I.
The oxygen-iodine laser is the first example of cw laser action on a transition between two distinct electronic states which is pumped only by a chemical reaction requiring no external sources of power.
This laser operates on the 2Pi/2~2P3/2 transition of the iodine atom at 1315 nm and is pumped by the'reaction scheme
02(xA) + Og^A) -> OzC1!) + 02(SI)
O^1!) + I2 -> 02(3!) + 2I(2P3/2)
o2(1a) + I(2P3/2) + 02(3I) + I*(2Pi/2)
I*(2Pi/2) + OzOA) - 0 C1!) + (2P3/2)
The fourth step in this scheme is critical in that it guarantees total dissociation of the I2 by a "positive feedback" type of kinet¬ ics. This effect is relevant since I2 is an efficient quencher of
I*(2P 2). The use of the reaction scheme (1) as a pumping mechanism for iodine was first suggested by the work of Derwent and Thrush who found that the quenching rate of 02(1A) by ground-state iodine atoms was rapid (k = 4.6 ± 1.5 x 1013 cm3 mol 1 sec l) and galculated the equilibrium constant to be 2.9. MacKnight and Modreski noted that a 15% ratio of 02(1A) to total oxygen^w^uld support an inversion in the iodine atom. Several investigators ’ attempted to produce a laser using excited oxygen obtained via microwave discharge or by various chemical schemes. These authors also developed improved kinetic models which raised the necessary 02(1A) percentage required to about 25% and^determined the optimum I2 pressure. In the most recent expe- riments^ it was demonstrated by chemical pumping and energy transfer that inversion of the spin orbit states of atomic iodine had been achieved.
In^^jour experiments a chemical generator based on the work of Seliger was used to produce 02(XA) from the reaction of chlorine with basic H202. Figure 1 shows the generator design.
Five liters of 90% H202 and 2 liters of 6N NaOH were admitted to the reactor through the reagent feed lines at the top of the genera¬ tor. During the loading operation, N2 was continuously flowed through the bubbler to preclude liquid from entering the bubbler itself and to provide good mixing of the H202 and HaOH. The mixing of the base and peroxide is an exothermic process that can lead to a run away decompo¬ sition of the H202 if the generator temperature exceeds 60 C. To prevent this, the reagents were mixed in the generator under vacuum, so that evaporative cooling due to the pumging off of water vapor maintained an operating temperature below 30 C. This mixing process also has the advantage of concentrating the base-peroxide mixture that is used to generator the 02(1A).
The 02(1A) was generated via the reaction of Cl2 gas with the basic H202 solution. The Cl2 was admitted to the generator through the bubbler structure. Most of the Cl2 was reacted in the generator and the oxygen production was approximately stoichiometric with the Cl2 flow rate of 0.03 moles/sec. The effluent from the chemical generator was passed through a liquid nitrogen cold trap of standard reentrant design to remove water vapor and unreacted Cl2. The 02(1A) concentration was measured at the exit of the cold trap by monitoring the 1270 nanometer emission (a 1A X3I) with a narrow bandpass filter and a cooled intrisic Ge detector. Typical results were approxi¬ mately 35% 02(1A) at pressures of 1 torr in the laser cavity. The distance from the midplane of the generator to the inlet of the laser cavity was approximately 3 meters.
The laser section itself (Figure 2) consisted of a gradual expan¬ sion duct from 7.6 cm diameter glass pipe (cross sectional area = 45.6 cm2) to a 50 cm x 2.54 cm (cross sectional area = 127cm2) rectangular duct. The rectangular section was terminated into the side of a 15 cm diameter pipe that was connected to a high capacity vacuum pump. The inner surface of the stainless steel laser cavity was coated with halocarbon grease to minimize 02(XA) wall deactivation and iodine atom recombination. The laser mirrors were mounted internally to the vacuum on tubes extending from either side of the flow region. The mirrors were separated by 1.36 meters. Each mirror tube was purged with a small flow of Argon during operation of the laser.
Molecular iodine was injected with a carrier flow of Ar into the oxygen flow via an I2 bomb heated to approximately 50 C. The injector itself was a 1 cm 0D. stainless steel tube with a thin (0.25 mm) slot
xv
42 cm long milled along its length. The injector tube was centered in the rectangular flow channel approximately 6 cm upstream of the cavity axis with the slot on the downstream side. The injector tube was also resistively heated in order to prevent condensation of I2 on the interior.
The limiting aperatures in the laser cavity were the walls of the flow tube and the inside diameter of the mirror support tubes. Using a > 99.9% maximum reflectance flat back mirror and a 98.3% reflectiv¬ ity (1.7% transmitting) 5m radius of curvature front mirror the laser output was sufficient to easily burn a mode pattern into a black plastic plate in a few seconds. The mode pattern was equal in size and shape to the area of the limiting aperature (2.5 cm high x 4 cm in the flow direction) and an output power of approximately 100 watts was
measured using a Scientech disk calorimeter. Operation of the laser was dependent upon generator performance but was easily reproducable.
DISCUSSION
The extractable 02(1A) energy can be determined from the equilib¬ rium constant, K, of the pumping reaction:
02(xA) + I(2P3/2) t °2(3*) + I* (2Pi/a)
where
[i*(2Pi/2)1 [o2(3D] K = - = 2.9 (300°K)
[I(2P3/2)] [02(xA)]
and the zero gain condition on the inversion density:
1(2p1/2) —— = 0.5
I(2P3/2)

An [C^^A) ]/[02(3I) ] ratio of .17 is therefore required to maintain positive gain. Consequently, the extractable energy in the flow corresponds to the 02(1A) in excess of 17% of the total 02. Thus with 35% 02(1A), about 18% of the total 02 can contribute to laser output. For our conditions, the extractable energy was 600 watts giving a conversion efficiency in the laser itself of 15%. In these experi¬ ments the conversion efficiency was less than 100% because, as will be shown, the laser was overcoupled resulting in inadequate saturation of the lasing medium.
The rate of stimulated emission based on the measured output power aperature size, mirror transmission, and a Doppler broadened stimulated emission cross section was 1.5 x 10⁴ sec 1. The rate of loss of excess 0 02(1A),however, is given by the rate of stimulated emission times the ratio of iodine to excess oxygen. At an iodine partial pressure of 5 x 10 3 torr and the optimal lasing conditions, the rate of excess 02(XA) loss was approximately 300 sec 1 due to stimulated emission and energy transfer. The rate of loss of Og^A) due to the flow through the resonator cavity is V/L (V = 60m/sec 1, L = 4 cm) or 1500 sec 1. The expected efficiency is therefore approxi¬ mately 300/(1500 + 300) or 15%. In this analysis the energy transfer rate can be assumed to be very large in comparison to the stimulated emission rate which is then the rate limiting step. Since the forward transfer rate is approximately gas kinetic this assumption is clearly correct.
The optimum mirror outcoupling based on the estimated gain of 5% per round trip and assuming non-productive mirror losses of 0.1% is around 0.5%. Reducing the outcoupling would cause a corresponding increase in the intracavity intensity and therefore accellerate the stimulated emission rate causing greater laser output to occur as the 02/I mixture flows through the laser cavity. Alternatively, a longer resonator section would permit greater time for extraction of the 02(xA) energy and thus increase the laser output as well.
In summary, this experiment has demonstrated the feasibility of highly efficient operation of the oxygen-iodine chemical laser. The authors wish to acknowledge the technical assistance of Gary Lee, Pat Timlin, Ken and Don Maier and Charles Fry. The authors are especially indebted to our glass blower Jan Marien, who constructed the large glass traps required for this laser demonstration.
xvii

REFERENCES
1. J.V.V. Kasper and G.C. Pimentel, Phys. Rev. Lett. 14, 352 (1965).
2. T.A. Cool and R.R. Stephens, J. Chem. Phys. 51, 5175 (1969).
3. J.V.V. Kasper and G.C. Pimentel, Appl. Phys. Lett. 5, 231 (1964).
4. R.G. Derwent and B.A. Thrush, Faraday Discuss Chem. Soc. 53, 162 (1972).
5. A.K. MacKnight and P.J. Modreski (unpublished).
6. R.D. Franklin, A.K. MacKnight, and P.J. Modreski, Electronic
Transition Lasers, edited by T.I. Steinfeld (The MIT Press, Cambridge, Mass., 1976), p. 119.
7. A.K. MacKnight, R.D. Franklin, and R.L. Kerber, Electronic Tran¬ sition Lasers II, edited by L.E. Wilson, S.N. Suchard, and T.I. Steinfeld (The MIT Press, Cambridge, Mass., 1977), p. 305.
8. R.F. Heidner III (unpublished).
9. A.T. Pritt, Jr., R.D. Coombe, D. Pilipovich, R.L. Wagner, D. Benard, and C. Dymek, Appl. Phys. Lett. 31, 745 (1977).
10. H.H. Seliger, J. Chem. Phys. 40, 3133 (1964).

Keynote Paper
Historical Perspective of COIL William E. McDermott
Chief Technology Officer Directed Energy Solutions
ABSTRACT The oxygen-iodine laser was the first electronic transition chemical laser. It first lased 25 years ago at the Air Force Weapons Laboratory (now the Air Force Research Laboratory). The development started several years earlier and involved the support of many people in the laser community. I would like to describe the early thoughts, insights and even misconceptions that we had in the early days. I will also highlight the contributions of many of the people and organizations that contributed to the early development of the COIL laser.
1. A Brief Background on C^Ag) Chemical sources of 02(^9) have been known for many years. Mallet [1] first reported the red glow obtained when hypochlorite solution and hydrogen peroxide was mixed. The C^Ag) molecule was first identified by Herzberg in the spectrum of the sun in 1934. Groh [2] mentions the red chemiluminescence obtained when gaseous chlorine or bromine is added to basic hydrogen peroxide. Later, Groh & Kirriman [3] mixed gaseous chlorine with KOH and hydrogen peroxide and proposed that the red glow is from two C^Ag) molecules colliding. Later, Seliger [4] published the spectra of the hypochlorite - peroxide reaction in the red at 634 nm. For me, the seminal article on excited oxygen was Khan and Kasha [5]. Even though the chemical process that produced a metastable electronically excited species was known, the marriage of oxygen and iodine came in discharge studies.
2. Iodine and C^Ag) The reaction of iodine and discharged oxygen was first reported by Ogryzlo and his group [6]. They observed that when iodine was added to excited oxygen, a bright yellow glow was seen. This was recognized as l2 B state emission. They also observed a strong emission at 1.315 |i, the iodine atom 2Pi/2-2P3/2 transition. The excitation of the iodine was attributed to the near resonant pumping by 02(^9) . The iodine atoms were thought to be formed by the dissociation of molecular iodine by 02(1SU). This work didn’t attract the attention of the laser community until later. In 1969, Elmer Ogryzlo went on sabbatical to Brian Thrush’s laboratory in England. There he suggested the oxygen-iodine system as an interesting system for Thrush’s graduate student, R. G. Derwent. The suggestion generated several papers [7], [8], [9], [10], and [11]. In their third paper, they suggested that an inversion could be achieved on the iodine atom 2P1/2 -2P3/2 transition if a sufficient C^Ag) fraction could be produced. Using the equilibrium constant for the energy pumping reaction, They showed a flow containing about 15% C^Ag) could produce an inversion on the iodine 2Pi/2 -2P3/2 transition. It was radical to propose an equilibrium as a pumping reaction - in a two level system terminating in the ground state!
/(2P3)+02(lAg)^/(2P])+02(3I!i)+M 2 2
A£ = 279 cnr1 401.42
Keq = 0.75e T
a~af A2?,) 2.
K2p3) 2
a> 0 for
w 02('Ag)+02(3Z„)
at T = 300K
>14.5%
Gas and Chemical Lasers and Intense Beam Applications III, Steven J. Davis, Michael C. Heaven, Editors, Proceedings of SPIE Vol. 4631 (2002) ©2002 SPIE . 0277-786X702/$ 15.00 1

3. The Search for a Chemical Source of C^Ag) This paper produced a considerable amount of interest at the Air Force Weapons Laboratory (AFWL); who, like many other research organizations, had developed an interest in short wavelength chemical lasers. The first advocate was Dr. Al MacKnight who brought the Derwent and Thrush article to my attention. I had just arrived at the Air Force Academy (USAFA), where I was teaching Instrumental Analysis in the Chemistry Department. I had been selected to spend the next year as an exchange officer to the Frank J. Sieler Research Laboratory (FJSRL) - a part of the Air Force Office of Scientific Research (AFOSR) - and was looking for research projects of interest to the Air Force. I had visited the AFWL the previous year and met a number of the technical people there. In the summer of 1973, I began working on electronic transition chemical lasers. The initial funding for the effort was $10,000 provided by Dr. Don Ball, then head of AFOSR. This money went towards purchase of an S-1 photomultiplier and electronic data recording equipment. I began to look at a number of systems including the Ba-N20-C0 system, the reaction of SnH4 with N20, and various alkali metal - oxidant systems. These were experiments in which the species were burnt in a flame or mixed in the afterglow of a microwave discharge and the spectra recorded. Nothing much of interest came from these experiments. In those days, we didn’t have the Internet to browse; so I would spend hours in the library tracking down references. I was aware of the hypochlorite - peroxide method of producing 02(1Ag) since Al MacKnight was doing experiments with that system as well as microwave discharges. One day - I think it was in mid-1974 - I ran across the Khan and Kasha article. Michael Kasha was doing biomedical research on the possible role of O^Ag) in cancer. He had just gotten a new graduate student - A.U. Khan. Michael told me later that he wanted to see what this new guy could do in the lab, so he gave him the problem to record the spectrum of 02(1Ag). About a week later, he came back with the spectrum. Khan had built a small bubbler shaped somewhat like a saxophone (hence the name “Hirtzian device" - after Al Hirt, a famous New Orleans jazz musician) with a fritted disk at the end. He bubbled chlorine gas through a basic solution of hydrogen peroxide and recorded the spectra. In the article that I saw, a print of the spectrum of the emission in the 1.27p region was attached. It had been recorded on photographic film at good resolution. The text did not mention what I saw in the spectrum. It was clearly rotationally resolved! There seemed to be no continuous emission between the rotational lines. Since molecules in solution are strongly perturbed during emission by collisions, emission from molecules in solution will not show rotational structure. The emission Ahsan Khan saw was from the gas phase. At that point, I was convinced that the liquid phase reaction between chlorine and basic hydrogen peroxide could produce high yields of gaseous 02(1Ag).
4. Early Research on Chemical Sources
4.1. Air Force Weapons Laboratory (1973 - 1977) At the AFWL, Al MacKnight pursued a number of approaches to establish oxygen-iodine as a laser. First, a number of flow studies were done and several attempts were made to lase using microwave excited oxygen as a source. None of the laser experiments were successful. MacKnight also tried to react gaseous hydrogen peroxide with calcium hypochlorite to produce 02(1Ag) which was also unsuccessful. The AFWL did, however, support a number of research projects to develop a COIL laser. It also encouraged AFOSR to support additional University research such as my effort at the USAFA.
4.2. University of California, Santa Barbara (1975-1977) At the Quantum Institute at the University of California at Santa Barbara, Paul Lee and Warren Slafer attempted to build a chemical generator using bromine or chlorine condensed on a rotating dewar. The frozen halogen was then sprayed with basic hydrogen peroxide. It was reported to work adequately (-25%) and was delivered to the AFWL in early 1977. It didn’t seem to catch the interest of the researchers there at the time.
2 Proc. SPIE Vol. 4631

4.3. Rockwell Science Center (1976-1978) A more important effort was started at Rockwell Science Center by Bob Coombe and his collaborators - A. T. Pritt, I. B. Goldberg, D. Pilipovich, and R. I. Wagner. The investigation centered on the use of chlorine fluorosulfate (CI0S02F) and BHP. The effort was less important in the details of the chemical generation process and more important that it produced the first measurement of gain in a chemical pumped iodine system [12], We discovered later that chlorine fluorosulfate and BHP generates chlorine gas which then reacts with the excess BHP to produce Oj^Ag) . Ira Goldberg also recognized the value of EPR as a measurement standard for excited oxygen and used it in these studies.
4.4. Air Force Academy (1973-1976) After reading the Kasha and Khan article, I embarked on devising a way to use the reaction between chlorine and BHP to produce gaseous 02(1Ag) • 1 reasoned that the control of the gas-liquid interface was important and that the reaction would have no hope of producing a high yield of excited oxygen unless the reaction rate of chlorine with BHP was faster than the quenching rate of O^Ag) on BHP. The first experiment was to determine the rate of reaction of chlorine with BHP. Since funding was limited, we couldn’t look at the disappearance of chlorine as it reacted with BHP; so we studied the reaction of chlorine with NaOH. We could follow that reaction with a pressure gauge. Chemically, these reactions should be about equal in rate. A recording mercury manometer was devised (we couldn’t afford a capacitance manometer) to measure the pressure drop as chlorine passed over concentrated NaOH solution. John Viola, who was also teaching at USAFA, was a great help in designing and running these experiments. The apparatus is described in a note [13]. We found that the sticking coefficient of chlorine with NaOH was about 10'2. We reasoned that the quenching coefficient of 02(1Ag) on BHP would be less than 10'5, therefore it appeared that the system would work. The real question in my mind was how we could accurately measure the yield of excited oxygen relative to the ground state. I gave a seminar to the Physics Department in 1974 and mentioned the lack of a good method to measure the excited oxygen yield. At the end of the seminar, one of the Physics instructors, Dave Thomas, came up to me and suggested that gas phase electron paramagnetic resonance (EPR) could measure both ground state and excited oxygen. Even more important, there was an EPR in one of the Physics laboratories. With Dave’s help, we soon showed that we could measure both species accurately. At this point, we built a small rotating wetted wall generator that we could attach to the EPR. It is shown schematically in Figure 1.
ground glass joi
Cl2 in 02 out
BHP + Rashig rings
belt to motor drive
Figure 1 The first >15% chemical generator
Among the experiments I was able to do while at USAFA was observation on the EPR of 2P1/2 iodine atoms excited by the chemical generator. This showed that the water produced by the reaction did not stop the
Proc. SPIE Vol. 4631 3

iodine dissociation process. The performance, a yield greater than 15% at the generator, was reported at the Second Summer Colloquium on Electronic Transition Lasers [14]. By then, I had left the USAFA and was attending a one-year Air Force middle management school. I was able to attend the conference because AFOSR provided funds. The paper did not generate any interest in the community.
It was extremely important during this early period to be able to discuss the problems of chemical lasers with many of the experts in the field. AFOSR and AFWL funding gave the researchers an opportunity to interact with many of the best scientists of the 20th century. Herb Broida and Dick Zare come to mind as people who were always available to help in anyway they could. Elmer Ogryzlo and J.C. Polyani both came to the USAFA under AFOSR funding to discuss electronic transition chemical lasers with me.
5. Early COIL Work at AFWL (1977 -1981) On arriving at AFWL in late 1977, there was already a well-equipped laboratory. It contained a flow
system, laser cavity and EPR system. It had been configured to test the generator developed at RSC. I inherited the iodine laser team, which consisted of Nick Pchelkin, Dave Benard and a couple of technicians. Down the hall, I had access to one of the best experimental physicists in the world - Steve Davis. I had turned down Leroy Wilson’s offer to work on a “real, short term, high payoff system called ALFA. The first few months were occupied with two problems. The first was that the “system” model developed at AFWL predicted that more than 25% 02(1Ag) was required to achieve threshold. Any generator had to beat this new, higher standard. In fact, I was able to show that the model incorrectly calculated the equilibrium constant and that Derwent and Thrush were right after all [15]. The second problem was an article by two scientists at the Naval Research Laboratory who measured the-branching ratio between the pumping reaction and the non¬ resonant branch [16]. The experiment used photodissociation of alkyl iodides as a source of l(2Pi,2). Their value was 40%. Clearly, if that were true, there would never be a sustained inversion. I never could figure out what they did wrong. I knew their answer was inconsistent with the experiments I did at USAFA and Dave Benard’s measurement of gain at RSC. Always believe the experiment that most closely duplicates what you are trying to do.
By this time, the management was getting upset with the “slow” pace of our effort to get the CFS generator running and directed me to stop advocating the chlorine - BHP reaction and immediately install a CFS system on the test stand. Being a good soldier, I called Nick Pchelkin in and asked him how long it would take to get a chlorine line plumbed into the lab. His answer was 8 AM tomorrow morning - I told him to do it. I then had a short meeting with Nick and Dave Benard to figure out what generator to start testing with. I advocated my rotating, wetted wall device. Nick didn’t like that because it would take too long to build. I described the Khan and Kasha experiment and Nick was pretty excited because he could have a bubbler ready by the next day. I didn’t think a bubbler would work because we didn’t have a direct control of the gas- liquid interface. But you never know until you try the experiment, so I told Nick to go ahead with the bubbler. It is shown in Figure 2. We measured over 35% 02(1Ag) on the EPR the first time we turned on the device. In the experiment, I found I was able to control the gas-liquid interface by a combination of liquid depth and flow rate. In fact, the term bubbler was a misnomer. I really pumped the chlorine through the liquid at a very high rate - the flow formed conical channels and the liquid was pretty violently agitated. Chemical engineers call that a sparger.
At this point, lasing was not far off. As usual, we were still having trouble getting enough iodine into the laser, so Dave Benard redesigned the iodine source. Nick Pchelkin also rigged up a 02(1Ag) meter using a pressure tap and the photometric detector we had cross calibrated with the EPR. We were not using diluent so pressure was a measurement of total oxygen and chlorine. The “yield” was really 02(1Ag) divided by chlorine in. The detector was at the exit of the laser cavity. Dave suggested the most important diagnostic. Two IR detectors with narrow band 1.315p filters were placed on the laser cavity - one looking down the optical axis; the second on the side perpendicular to the laser axis. The latter measured spontaneous emission and the former laser emission. Nick had these fed to an X-Y recorder. As 02(1Ag) was added before the mirrors were aligned, the two signals tracked linearly. As we tweaked the mirrors, we could recognize a positive change by an increase in the end emission as the side emission stayed constant. On 1 Dec 1976, the end emission suddenly shot off scale for the first time announcing laser action. We also had an IR phosphor
4 Proc. SPIE Vol. 4631

card. It showed a distinct higher order transverse mode. It looked like the 2,6 Hermite-gaussian mode shown on page 688 of Siegman [17]. The O^Ag) meter normally oscillated between 35% and 40%; but when the laser turned on, it immediately dropped to a rock constant 15%. During the several minutes of 4 mW lasing, the mode actually jumped several times. It was a pretty exciting day [18].
10 USER
1
Figure 2 The first oxygen generator to power a laser.
That evening, Dave and Nick went out to dinner and designed the next laser on a napkin while waiting for their steak to be delivered. I scaled up the generator to match the transverse flow channel the next day. It would have been ready in a week if we had been able to get the laser built outside, but we were required to use the base model shop which took 6 months to build the laser cavity. In the meantime, Dave borrowed a small transverse flow cavity from Johns Hopkins that we used for flow studies. This was called COIL II. The second laser was called COIL III for that reason. It produced over 100 watts - a 25,000 times scale up [19].
The next few years were an exciting time. We had tremendous support from Pete Avizonis, the AFWL Chief Scientist, who became - and remains to this day - an ardent advocate of the COIL laser. Rick Heidner contributed the first systematic study of iodine dissociation [21]. The results were not always positive. Rick’s work, coupled with some ab inito calculations done by Harvey Michaels; suggested that dissociation did not occur from the 02(1S) channel, but through vibrationally excited molecular iodine. Quenching of the intermediate state could make scaling to higher pressures impossible. Steve Davis then began critical work to unravel this new dissociation mechanism [20], Bob Shea took over the computer model and continually reminded me that our understanding of the kinetics was limited - motivating me to make sure we supported as many kinetic studies as we could. He was also the first to calculate the power in the flow and identify pressure scaling problems at subsonic velocity. Verne Schlie developed a gain probe for the COIL laser - a CW photolysis laser [22], This was the first example of international cooperation - Verne spent a summer at the Max Planck Institute at Garching, Germany learning the details of photolysis lasers from the experts there. Verne also pointed out that there might be a problem with anomalous dispersion in COIL. This formed an interesting Ph.D. thesis topic for an Air Force Institute of Technology (AFIT) student named Dave Neumann. Dave and Steve Davis developed a method to measure the broadening coefficient of 2P1/2 by oxygen and show that anomalous dispersion would not be a problem. On finishing his degree; Dave joined our little; but growing, group. He was to have a major impact on COIL development.
Not all of our effort was confined to in-house work. As a matter of fact, we gave funding to almost anyone who was interested in working on COIL lasers. Rocketdyne, Garrett AirResearch, McDonnell-Douglas Research Laboratories, and Bell Aerospace all worked on developing and understanding generators. Each also tried a laser - some worked and some didn’t. We learned as much from the failures as we did from the
Proc. SPIE Vol. 4631 5
successes. Wayne Soloman ran the effort at Bell and is still active in the field at the University of Illinois. Al MacKnight was the leader at Garrett. I also felt that the McDonnell-Douglas effort (Ralph Richardson, Harvey Lilenfeld and Charlie Wiswall) provided key technical data [23]. Orv Sandall from the University of California at Santa Barbara, a consultant to Rocketdyne, gave us the first real chemical engineering analyses of the generator [24], Steve Hurlock led the experimental team at Rocketdyne providing the data. Following that round, TRW and Bell Aerospace looked at characterizing and scaling the laser. I’ve already mentioned the work of Rick Heidner at Aerospace Corporation who continued to make major contributions to COIL kinetics. Jim Hurst at the Oregon Graduate Center made the first detailed study of the liquid phase chemistry [25], He concluded that the intrinsic yield of Oz^Ag) in solution was near 100%.
At AFWL, we continued our scale-up efforts designing and building a multi-kilowatt subsonic laser. I left the AFWL just as that device was coming on line; leaving Gordan Hager who we had just hired from Rocketdyne and Doug Loverro, an ex-student of mine from USAFA, with the problem of getting it to work - which they did [26]. Gordan is still at the AFWL, although he is concentrating on his successful laser - the second electronic transition chemical laser, NCI-I. Bob Coombe also played an important role in the NCI-I discovery. During the same period, we had to face the problems of scaling subsonic devices - they would be large and probably exhibit poor beam quality. I asked Dave Neumann to head a technical group to develop a recommendation on the future course of COIL development. His recommendation to develop a supersonic COIL laser was critical to the current success of COIL. At that time it was quite a risk, a previous attempt had failed and no one had ever pushed Oz^Ag) through a supersonic nozzle. The proper place to inject the iodine and indeed the behavior of iodine dissociation at high pressures was a real unknown. Dave did succeed in demonstrating the first supersonic COIL laser about a year later [26]. About this time, Keith Truesdell also joined us from Rocketdyne. Keith remains one of the major drivers in COIL development.
6. An Explosion of Research By the early 1980’s, a number of groups began to exploit the potential of the COIL laser. Lasers were built in Russia, Israel, Japan, France, China, Germany and the Czech Republic. I have listed some of these lasers and their characteristics in Table 1. Some of the major advances were made during this time period. I've already mentioned Dave Neumann’s successful supersonic laser. Marciel Zagidullin’s invention of the jet generator was another major step [27], Sani Yoshida’s demonstration of greater than 40% laser efficiency showed COIL could be engineered to very high efficiency. Gordan Hager continued his innovative work by both frequency doubling [28]and Q-switching COIL [29]. The technical detail of COIL laser development can be found in the outstanding review by Keith Truesdell, Charlie Helms, and Gordon Hager [26], Charlie Helms also did exceptional work on laser efficiency and mixing nozzles. I would also be amiss if I didn’t mention the extraordinary work done by Mike Heaven to unravel the mystery of iodine dissociation [30], [31]. Mike will follow this address and talk in detail about his current research. We also will hear from many of the people who have contributed to COIL and I will not attempt to cover their many contributions here. I would like to highlight the importance of diagnostics - Steve Davis has been the leader in this most important effort. We will also hear about some of the commercial applications of COIL in the material processing industry. Another major application - The Airborne Laser - was reviewed yesterday by Steve Lamberson.
7. Conclusion
I would like to highlight the contributions of a few organizations whose contributions to the early development of COIL has been often overlooked. The AFOSR sponsored research in the mid-1970’s was absolutely critical to the invention of COIL. Not only did it sponsor my own first efforts to develop a chemical generator, but supported technical efforts throughout the world. The AFIT also supported development by educating many of the key scientists involved in the US COIL effort. My Ph.D. was supported through the AFIT Civilian Institute Division as was my roommate - Greg Canavan, who ran the ARPA Electronic Laser program in the late 1970’s. Graduates of the AFIT residence program included Nick Pchelkin and Dave Neumann. The
6 Proc. SPIE Vol. 4631

importance of a broad-based support for fundamental research and scientific education cannot be underestimated. As a final note, I would like to assure you that advances in electronic transition lasers will continue to occur. Gordon Hager’s session on NCI - pumped iodine is one example. At Directed Energy Solutions, I’ve been working with Dave Neumann on a new source of high pressure, high yield C^Ag). Initial experiments have produced excited oxygen concentrations in excess of an atmosphere. Such a source would reduce the weight and volume of a COIL laser by a factor of ten.
Proc. SP1E Vol. 4631 7

Year Ref ( Organization <
1
LL
CM
O Power Delta Efficiency Comments
moles/s ' watts ' w/cm2
JSA
1977 [18] i AFWL 0.004 0.004 2.00E-05 1.00E-05 ongitudinal flow, subsonic
1978 [32] AFWL 0.03 150 1.2 5% subsonic
1982 [26] AFWL 0.60 4600 4.6 8% subsonic
1984 [26] AFWL 0.15 1600 40 12% supersonic
1989 [26] AFWL 1.80 39000 172 24% supersonic, ROTOCOIL
1989 [28] AFWL frequency doubled
1990 [29] AFWL 630 magnetically Q switched
1991 [26] AFPL 0.50 10000 200 22% supersonic, RADICL
1996 [33] AFPL 0.07 1750 197 28% compact supersonic, VERTICOIL
1996 [34] AFPL mode locked COIL
1979 [23] McD 0.02 10 0.08 1% subsonic
1984 [35] McD 0.02 180 0.10 10% subsonic — -.. -- .
1985 [36] McD
1981 [26] TRW 2000 7 11% subsonic
1984 [26] TRW 0.3a 4200 84 15% supersonic
1981 [26] RD 0.05 150 0.9 3% subsonic
1985 [26] RD 0.15 1900 58 14% supersonic
1995 [37] RD 0.90 17500 400 21% supersonic, mode limited - aperture
1995 [37] RD 0.50 13716 258 30% supersonic
RUSSIA
1982 [38] VNIIEF 0.01 subsonic
1983 [38] VNIIEF 180 subsonic
1986 [38] VNIIEF 900 subsonic
1990 [38] VNIIEF 4000 subsonic
1984 [39] Lebedev, Moscow 0.001 5 subsonic, 50%o H202
1989 [40] Lebedev, Moscow photodissociation of ozone
1991 [41] Lebedev, Samara jet generator
1997 [42] Lebedev, Samara 0.01 200 22% jet generator
Israel
1982 : [43] Ben Gurion U 5 subsonic
1994 ■ [44] Ben Gurion U 9 1 supersonic
1997 ' [45] Ben Gurion U 0.01 177 18% supersonic
Japan 1983 1 [46] Nat Def Acad 10 1 subsonic
1987 ' [471 Laser Lab, Chiba 0.002 : 40 1 21% i subsonic
1985 ) [48] Laser Lab, Chiba 0.005 i 200 \ 41% i subsonic
1989 ) [49] Laser Lab, Chiba 0.07 ’ 1020 1 16% i subsonic
8 Proc. SPIE Vol. 4631

Year Ref Organization CI2 Flow Power Delta Efficiency Comments
France
1984 [50] ONERA 4 subsonic, 30% H202
1991 [51] ONERA 570
China
1988 [52] Dalian Inst Chem Phys electrical discharge, 130 mJ
1994 [53] Dalian Inst Chem Phys 0.03 178 7%
1995 [54] Dalian Inst Chem Phys 0.15 1000 7% supersonic
1996 [55] Dalian Inst Chem Phys 0.30 5000 18% supersonic
Czech Rep
1991 [56] Inst of Physics 0.01 58 5% subsonic
Germany
1997 [57] DLR 5000 generator from AFPL
Table 1 Selected COIL Laser Devices
Proc. SPIE Vol. 4631 9
in co
8. REFERENCES 1. Mallet, I., Compt. Rend., 1927.185: p. 352. 2. Groh, M.P., Presentation de reactions accompagnees de luminescence rouge. Bulletin De La Societe
Chimique De France, 1938. 5: p. 12. 3. Groh, M.P.a.A.K., Etude Spectrale d'une Reaction Luminescente. Comptes Rendus Acad. Sci., 1942.
215: p. 275. Seliger, H.H., Anal Biochem, 1960.1: p. 60. Khan, A.U.a.K., M„ J. Chem. Phys., 1963. 39: p. 2105. Arnold, S.J., Finlayson, N. and E. A. Orgryzlo, Some Novel Energy-Pooling Processes Involving
O2OAg). J. Chem. Phys., 1966. 44: p. 2529.
7. Derwent, R.G., D.R. Kearns, and B.A. Thrush, The Excitation of Iodine by Singlet Molecular Oxygen. Chem. Phys. Lett., 1970. 6(2): p. 115-116.
8. Derwent, R.G. and B.A. Thrush, Measurements on 02(1D) and 02(1S) in Discharge Flow Systems. Trans Faraday Soc, 1971. 67: p. 2036-2043.
9. Derwent, R.G. and B.A. Thrush, The Radiative Lifetime of the Metastable Iodine Atom l(52P1/2). Chem. Phys. Lett., 1971. 9(6): p. 591-592.
10. Derwent, R.G. and B.A. Thrush, Excitation of Iodine by Singlet Molecular Oxygen Part 1. - Mechanism of the 12 Chemiluminescence. Journal of the Chemical Society of London, Faraday Discussions II, 1972. 68: p. 720-728.
11. Derwent, R.G. and B.A. Thrush, Excitation of Iodine by Singlet Molecular Oxygen. Part 2. - Kinetics of the Excitation of the Iodine Atoms. Chem. Soc. Farad. Disc., 1972. 53: p. 162-171.
12. Pritt, A.T.J., R.D. Coombe, D. Pillipovich, R.l. Wagner, D. Benard, and C.T. Dymek, Appl. Phys. Letters, 1977. 31: p. 745.
13. McDermott, W.E.a.J.T.V., A Recording Mercury Manometer. Journal of Chemical Education, 1976.
14. McDermott, W.E., et al. Chemical Generation of Molecular O2OAg). in Summer Colloquium on
Electronic Transition Lasers 2.1976. Aspen, CO: MIT Press, Cambridge, MA. 15. McDermott, W.E., "On The Calculation of Thermodynamic Functions for Electronically Excited Laser
Species,". Laser Digest, 1978. 16. McDonald, J.R.a.H., J.K., I* Atom Bimolecular Quenching by O2, H2O, H2O2, and H2, in NRL
Memorandum Report. 1976, Naval research Laboratory. 17. Siegman, A.E., Lasers. 1986, Mill Valley, CA: University Science Books. 18. McDermott, W.E., et al., An Electronic Transition Chemical Laser. Appl. Phys. Lett, 1978. 32(8): p.
469-470. 19. McDermott, W.E., et al., Efficient Operation of a 100-W Transverse Flow Oxygen-Iodine Chemical
Laser. Applied Physics Letters, 1979. 34: p. 469-471. 20. van Bentham, M.H.a.S.J.D., J. Phys. Chem, 1986. 90: p. 902. 21. Heidner, R.F., Gardner, C.E., Segal, G.I., and T.M. El-Sayed, J. Phys. Chem., 1983. 87: p. 2348. 22. Schlie, L.A. and R.D. Rathge, Long Operating Time CW Atomic Iodine Probe Laser at 1.315 pm.
IEEE Journal of Quantum Electronics, 1984. 20(10): p. 1187-1196. 23. Richardson, R.J. and C.E. Wiswall, Chemically Pumped Iodine Laser. Applied Physics Letters, 1979.
35: p. 138. 24. Sandall, O.C., et al., The Solubility and Rate of Hydrolysis of Chlorine in Aqueous Sodium Hydroxide
at 0°C. AlChE Journal, 1980. 25. Hurst, J.K., Mechanism of Singlet Oxygen Generation by Chemical Reactions,. 1977, Oregon
Graduate Center, University of Oregon. 26. Truesdell, K.A., C.A. Helms, and G.D. Hager. A History of COIL Development in the USA. in Tenth
International Symposium on Gas Flow and Chemical Lasers. 1994. Friedrichshafen, Germany: SPIE.
27. Zagidullin, M.V., et al., Highly efficient Jet 02(1A) Generator. Sov. J. Quantum Electronics, 1991.
21(7): p. 747-753.
10 Proc. SPIE Vol. 4631
28. Johnson, D.E., ef al., A frequency doubled chemical oxygen iodine laser. Applied Physics B, 1989. B48: p. 339-42.
29. Highland, R., P. Crowell, and G. Hager, A 630 watt average power Q-switched chemical oxygen- iodine laser. 1990.
30. Van Marter, T„ M.C. Heaven, and D. Plummer, Measurement of the rate constant for the quenching
ofl(2P-j/2) by C>2(X) at 150K. Chemical Physics Letters, 1996. 260: p. 201-207.
31. Lawrence, W.G., et al., Inelastic collosion dynamics of vibrationally excited l2(X). Journal of Chemical
Physics, 1997.106(1): p. 127-141. 32. Benard, D.J., et al., Efficient Operation of a 100-W Transverse-Flow Oxygen-Iodine Chemical Laser.
Appl. Phys. Lett., 1979. 34(1): p. 40-41. 33. Rittenhouse, T.L., Phipps, S. P., Helms,C. A, andTruesdell, K. A., High efficiency operation of a 5
cm gain length supersonic chemical oxygen- iodine laser. 1996. 34. Phipps, S.P., Helms, C. A., Copland,R. J., Rudolph, W. and K.A.Truesdell,, Mode locking of a CW
supersonic chemical oxygen- iodine laser. IEEE Journal of Quantum Electronics, 1996. 32: p. 2045- 50.
35. Wiswall, C.E., H.V. Lilenfeld, and S.L. Bragg, Operation of an ICI Fueled Oxygen-Iodine Chemical Laser. Applied Physics Letters, 1984.45: p. 5.
36. Wiswall, C.E., et al., Moderate-Power CW Chemical Oxygen-Iodine Chemical Laser Capable of Long Duration Operation. Journal of Applied Physics, 1985. 58: p. 115.
37. McDermott, W.E., et al. Operating Experience With a High Throughput Jet Generator, in Gas and Chemical Lasers. 1997. San Jose, CA: SPIE.
38. Kalinovsky, V. V., et al., High-power oxygen- iodine laser. 1980. 39. Vagin, N.P., et al., Chemical oxygen- iodine laser utilizing low-strength hydrogen peroxide.
Kvantovaya Elektronika, Moskva, 1984.11: p. 1688-9.
40. Zolotarev, V. A., et al., Oxygen- iodine laser with a photodissociation source of excited 02(a1 Ag)
oxygen. Kvantovaya Elektronika, Moskva, 1989.16: p. 1095-7.
41. Zagidullin, M.V., et al., An oxygen- iodine laser utilizing a high-pressure Ogj1 A) generator. Kvantovaya Elektronika, Moskva, 1991.18: p. 1417-18.
42. Zagidullin, M.V., et al., Highly efficient supersonic chemical oxygen- iodine laser with a chlorine flow rate of 10 mmol/s. Kvantovaya Elektronika, Moskva, 1997. 24: p. 201-5.
43. Rosenwaks, S. and J. Bachar, An efficient, small scale chemical oxygen- iodine laser. Applied Physics Letters, 1982. 41: p. 16-18.
44. Elior, A., et al., A small scale, supersonic chemical oxygen- iodine laser,. Optics and Laser Technology, 1994. 26: p. 87-89.
45. Blayvas, I., et al., Power optimization of small-scale chemical oxygen- iodine laser with jet-type singlet oxygen generator. IEEE Journal of Quantum Electronics, 1996. 32: p. 2051-7.
46. Watanabe, K., ef al., Small-signal gain and saturation parameter of a transverse-flow CW oxygen- iodine laser. IEEE Journal of Quantum Electronics, 1983. QE: p. 1699-1703.
47. Yoshida, S., ef al., Efficient operation of a chemically pumped oxygen iodine laser utilizing dilute hydrogen peroxide. Applied Physics Letters, 1987. 51: p. 1490-2.
48. Yoshida, S., et al., Chemical oxygen iodine laser of extremely high efficiency. Journal of Applied Physics, 1989. 65: p. 870-2.
49. Fujii, H., ef al., Development of high-power chemical oxygen- iodine laser for industrial application. Journal of Applied Physics, 1990. 67: p. 3948-53.
50. Bonnet, J., et al., Experimental analysis of a chemical oxygen- iodine laser. Applied Physics Letters 1984.45: p. 1009-11.
51. Louvet, Y., et al., A high power chemical oxygen iodine laser. 1991. 52. R. Zhang, et al., A pulsed chemical oxygen- iodine laser initiated by electrical discharge. Chinese
Journal of Lasers, 1988.15: p. 455-7. 53. Zhou, D., et al., Continuous wave chemical oxygen iodine laser using extracavity power output. 1994. 54. Sang, Q.F., et al., Supersonic COIL research activities in Dalian, China. 1995. 55. Li, B., et al., Supersonic cw chemical oxygen- iodine laser. 1996.
Proc. SPIE Vol. 4631 11

56. Schmiedberger, J., et at, Experimental Study of Gain and Output Coupling Characteristics of a CW Chemical Oxygen-Iodine Laser. IEEE Journal of Quantum Electronics, 1991. 27(6). p. 1265-1270.
57. von Entress-Fursteneck, L.H., et at, Supersonic COIL operation at DLR Germany. Proceedings of the SPIE The International Society for Optical Engineering, 1997. 3092: p. 706-9.
12 Proc. SPIE Vol. 4631

Invited Paper
Mechanism and kinetics of iodine dissociation in COIL Michael C. Heaven*, Anatoly V. Komissarov and Vasiliy Goncharov,
Department of Chemistry, Emory University, Atlanta, GA 30322
ABSTRACT Dissociation of I2 by 02(a1A), with subsequent excitation of I*, was first observed by Arnold et al}
in 1966. This key discovery led to the eventual development of the chemical oxygen iodine laser (COIL).
The mechanism by which I2 is dissociated was not determined by Arnold et al} and has remained elusive,
despite many experimental attempts to unravel this question. Although the details are not known, it is
apparent that a complex interplay between vibrationally and electronically excited states of I2 is involved.
Vibrationally excited states of 02 have also been implicated. Characterization of the dissociation process is
an important issue for COIL as the efficiency is impacted by the energy cost of dissociating the iodine. In
this paper we provide a historical summary of work on the dissociation mechanism, and summarize the
current understanding of the problem.
Keywords: Chemical lasers, oxygen, iodine, reaction kinetics, energy transfer.
1. INTRODUCTION In 1966 Arnold et al} reported the key observations that led to the eventual development of the
chemical oxygen iodine laser (COIL). They found that adding I2 to a flow of excited oxygen produced
emissions from I2(B3n(0+)), I(2P1/2) (denoted as I* in the following), and 02(b1Z+). The reactions
responsible for excitation of I* and 02(b) were correctly identified as
02(a1A)+I(2P3/2)—>02(X3Z')+I(2P1/2) (1)
and 02(a)+ I(2P1/2) —>02(b)+ I(2P3/2) (2)
However, Arnold et al1 were unable to resolve the question of how I2 was initially dissociated. The energy
levels of 02,12 and I that are relevant to this problem are shown in Fig. 1. As 02(a) does not carry enough
energy to dissociate I2 in a single collision, Arnold et al.1 speculated that the first encounter could populate
an excited state of I2, and a second 02(a) molecule would dissociate this excited species. This can be
represented by the sequence
02(a)+I2^02(X)+I2t (3)
02(a)+I2t-^02(X)+I+I (4)
An alternative explanation is that 02(b) directly dissociates I2. Arnold et al} demonstrated that 02(b) could
be generated in a flow of 02(a) by the pooling reaction
02(a)+02(a) —>02(b)+02(X) (5)
The dissociation mechanism is a matter of importance for COIL as this process consumes an
appreciable amount of energy. In a flow tube study, Alsing et al.2 found that approximately six 02(a)
molecules were needed to dissociate one I2 molecule under optimized conditions. For less favorable reagent
ratios up to sixteen 02(a) molecules were needed to dissociate one I2. In addition to consuming energy, the
kinetics of the dissociation process can also influence the power extraction efficiency in a laser system. The
time scale for dissociation determines the downstream position at which the maximum concentration of I*
will occur. If dissociation takes place too slowly the maximum I* concentration will be achieved after the
gas has left the optical cavity. Conversely, if high concentrations of I* are formed before reaching the
optical cavity, energy is lost during transport (mostly due to quenching by H20 from the 02(a) generator).
This leads to a curious situation where the conditions that give maximum power from the laser do not
correspond to complete dissociation of I23,4.
Since the seminal work of Arnold et al.1 there have been several attempts to unravel the details of
the dissociation mechanism. A generally accepted model was established in 1988, and optimal values for
the most important rate constants were proposed5 6. The model was developed using data from kinetic
studies of elementary reactions and analyses of device performance characteristics. It has been used for most
* [email protected]. Phone (404) 727 6617, FAX (404) 727 6586
Gas and Chemical Lasers and Intense Beam Applications III, Steven J. Davis, Michael C. Heaven, Editors, Proceedings of SPIE Vol. 4631 (2002) © 2002 SPIE . 0277-786X/02/$15.00 13

subsequent computational studies of COIL systems. Due to the method of construction, the model does a
good job of reproducing the behavior of well-characterized devices. However, it cannot be relied upon to
predict the properties of devices running under non-standard conditions (e.g., high pressures and/or novel gas
mixing geometries). Consequently, computational predictions for untested conditions or new hardware
cannot be trusted. As we will discuss in this article, the problems stem from the fact that we still do not
have a complete understanding of the dissociation process.
2. THE FIRST QUANTITATIVE MODEL: DISSOCIATION OF I2 BY 02(b)
Derwent and Thrush7'10 used flow tube techniques to examine the oxygen-iodine system. The
kinetics were followed by monitoring emissions from I2(B) and I*. Arnold et ai 1 had assumed that I2(B)
was formed by I*+I+M recombination, but Derwent and Thrush7 were able to show that it is produced by
sequential excitation of I2. They proposed the mechanism
* I2-H0,(b)-^L(A3n(lu))+02(X) (6)
I2(A3h( lu))+02(a) ->I2(B)+02(X) (7)
but did not consider the excited states of I2 to be important in the dissociation process. Their analysis of the
kinetics led to the conclusion that I2 was dissociated by8
l2+02(b) —>2I+02(X) (8)
This reaction set, along with the pooling reactions 2 and 5, provided a satisfactory representation of the
observed emission signals. Derwent and Thrush10 also used the equilibrium between reaction 1 and the
reverse process
I*+02(X) —>I+02(a) (9)
to evaluate the radiative lifetime of I*. In considering these data they realized that reaction 1 could sustain
CW lasing on the I*—H transition. The subsequent demonstration of a chemically driven ()2(a)/I* laser1112
(as described in the preceding paper by McDermott13) stimulated further studies of 02/I2 kinetics.
3. THE CHAIN DISSOCIATION MECHANISM AND PROBLEMS WITH THE IDENTITY OF l2\
The model proposed by Derwent and Thrush7,8 required a gas kinetic rate constant (~2xlO*10 cm3 s'1)
for the removal of 02(b) by I2. Using pulsed laser excitation of O2(b,v=0), Houston and co-workers1415
made direct measurements of the removal rate constant. The value they obtained, 2x10 11 cm3 s'1, was too
small to account for the flow tube results. Consequently, Heidner et a/.16 performed a careful and systematic
reinvestigation of the l2/02(a) kinetics. Fluorescence signals from I2(B), I2(A), I*, 02(b) and 02(a) were
monitored in flowing l2/02(a) mixtures. The dependence of the I2 dissociation rate on the presence of H20
was also examined; the motivation being that H20 was present in the flow from chemical 02(a) generators,
and it was expected to have a deleterious effect on the dissociation rate. Heidner et ai16 established the most
important characteristics of the dissociation process. They found that there was a slow initiation step
followed by rapid, branched-chain dissociation of I2. I* was identified as the chain carrier. Noting that the
dissociation rate was dependent on the initial concentration of I2, they also suggested that an excited state of
I2 was the precursor to atomic iodine. The reaction scheme used to model these observations was as
follows. The slow initiation step was attributed to reaction 3. This was followed by the rapid dissociation
of V by reaction 4. I atoms liberated by this sequence are excited by reaction 1, permitting I* to carry the
chain via the reaction
I*+I2-H+ V (10)
As expected, the presence of H20 did slow the dissociation rate. It was known that both 02(b) and I* were
effectively quenched by H20, but when Heidner et ai16 modeled their results they found that these were not
the primary reactions influencing the dissociation rate. Instead, the models required gas kinetic (2xl010 cm3
s'1) deactivation of I2f by H20
I24H20->I2+H20 (11)
Heidner et ai16 attempted to define a sub-set of critical rate constants by fitting to their dissociation
rate data. Unfortunately, several of the rate constants could not be uniquely determined as they were strongly
14 Proc. SPIE Vol. 4631

correlated. Two limiting rate constant sets were offered as constraints on a yet-to-be-determined set of final
values. Three of the rate constants differed by more than an order of magnitude between the two models.
Heidner et al.16 also noted that their models were not completely satisfactory, as they could not find a single
set of parameters that could represent all of the data. They did find that the original Derwent and Thrush8
model gave acceptable results, but concluded that “the agreement with experiment is moderately good, but,
based on the direct measurements of Houston and co-workers, such agreement must be fortuitous”.
Hediner et a/.16 discussed possible assignments for I2+. Within the framework of their model there
were two plausible alternatives. Either 1/ was vibrationally excited I2(X) or the metastable electronically
excited species I2(A’3II(2U)). There were troubling difficulties with both of these choices. I2(A’) has an
excitation energy of 10,042 cm"1, so it cannot be accessed by energy transfer from 02(a) (T0=7882 cm"1).
Near-resonant transfer from 02(a) or I* would populate I2(X) vibrational levels in the range of v=40-50.
Experiments performed by Hall et al}1 showed that I* was rapidly quenched by I2 (k=3.5xlO'n cm3s"1), and
that vibrationally excited I2(X) was formed in the process. Van Bentham and Davis18 later went on to show
that vibrationally excited I2(X) was generated when I2 was added to a flow of 02(a). The problem, with regard
to assigning I2f to vibrationally excited I2(X), was that Hall et al17 reported rapid relaxation of I2(X, v=40) by
Ar. This result appeared to be at variance with Heidner et a/.’s16 observation that the dissociation rate was not
influenced by the presence of Ar. This conflict could be resolved by recognizing that several vibrational
energy transfer collisions would be needed to relax the initially formed I2(X,v~40) to levels that did not have
sufficient energy to be dissociated by a collision with 02(a) (I2(X, v<20)). Assuming that the vibrational
relaxation rate constant measured by Hall et al.11 corresponded to Av=-1 transfer, David et al}9 used kinetic
modeling to show that the vibrational cascade process would not be fast enough to impact the dissociation rate
for the conditions of Heidner et al} s16 experiments. With this insight it was concluded that I2f is the
vibrationally excited species, and Heidner et al} s16 model 1 rate constants were adopted for subsequent
simulations of COIL devices. However, lingering doubts concerning the identity of I2f remained. Lilenfeld20
compared the effects of H20, C02, and SF6 on the dissociation rate. He found that H20 and C02 were very
effective in deactivating \2y while SF6 was about 8 times less effective than C02. It was surprising to find
that SF6 was not the best deactivator, as this molecule has many vibrational modes that can accept vibrational
energy from I2. Based on these observations Lilenfeld20 favored the notion that 1/ is the electronically excited
species I2(A’). He noted that 02(a,v=l) has almost enough energy to excite I2(A’), and used EPR spectroscopy
to show that 02(a,v=l) was present in the flow from his singlet oxygen generator.
Several excited states of I2 could be involved in the process where 02(a) dissociates I2(A’). Emission
from I2(B) is seen in 02(a)/I2 flames, and it had been suggested that reaction 7 and I2(A,)+02(a)—>I2(B)+02(X),
followed by predissociation of I2(B) were the source of I atoms. Lilenfeld20 was able to eliminate these
channels by demonstrating that strong magnetic fields, which accelerate the I2(B) predissociation rate, do not
increase the overall dissociation rate.
4. IS I2f VIBRATIONALLY EXCITED I2(X)? A CLOSER LOOK.
Lilenfeld20 and Heidner et al16 had drawn attention to the puzzling characteristics of I2f deactivation.
This species was rapidly removed by H20 and C02, while collisions with He or Ar were less effective by
orders of magnitude. For example, in Heidner et al ’s16 model 1 the rate constants for deactivation of I2f are
(in units of cm3 s'1) 3x10 10 (H20), 5x10 11 (02(X)), and 4xl0'12 (Ar). These trends are more typical of
electronic quenching, rather than vibrational relaxation. Heaven and co-workers21"24 examined the viability of
equating I2f deactivation with I2(X) vibrational energy transfer by studying the relaxation process under well-
controlled conditions. Individual ro-vibrational levels of I2(X) in the range 22<v<43 were populated using a
pulsed stimulated emission pumping technique. The excited molecules were allowed to make a few collisions
with the surrounding bath gas, and then the pulses from a probe laser were used to observe the range of levels
populated by energy transfer. Fig. 2 shows results from this type of measurement. In this instance I2(X) was
excited to the v=23, J=57 level (where J is the rotational quantum number). The upper panel in Fig. 2 shows
a probe laser spectrum taken under collision free conditions. The J=57 population gives rise to just two
spectral lines that obey the AJ=±1 selection rule. The lower panels show the results of colliding I2(v=23,
J=57) with Ar and H20. Most of the lines in these traces originate from rotationally inelastic collisions
Proc. SPIE Vol. 4631 15

(Av=0 transfer). The lines marked with asterisks are the result of v=23->22 transfer. From these traces it can
be seen that the probabilities for vibrational relaxation by H20 and Ar are comparable. Modeling of these data
indicates that vibrational relaxation by H20 is about a factor of two faster than relaxation by Ar24. The rate
constants do not differ by a factor of 75, as required by the models of 1/ deactivation. The absolute
magnitudes of the vibrational relaxation rate constants also pose a problem. For relaxation by H20 the total
removal rate constant was 1.6x10 10 cm3 s'1, and this was dominated by Av=-1 transfer. This is only half of
the I2+ deactivation rate constant, without considering the damping effect of the vibrational cascade sequence.
Models of v=40—>20 relaxation24 predict an overall deactivation rate constant for H20 of 8xl0'12 cm3 s'1.
Although the vibrational relaxation rate constants were in gross disagreement with the limiting
deactivation rate constants of Heidner et a/.16, this did not mean that the identification of I2f as I2(X, v>20) had
necessarily been invalidated. Heidner et a/.16 stated that their rate constant set was not unique. Consequently,
Paschkewitz and Heaven25 explored the possibility of re-optimizing the rate constant package with the 1/
deactivation rate constants constrained to values that were compatible with the vibrational relaxation rate
constant measurements. The model was fit to Heidner et aV s16 dissociation rate data. It was found that the
value of the H20 deactivation rate constant could be reduced to a minimum value of 4.8x10 11 cm3 s'1, but this
was still too large to be consistent with vibrational relaxation. Other problems with the re-optimized model
were that it could not tolerate deactivation by Ar and the dissociation rates predicted for low concentrations of
H20 were in poor agreement with the experimental data25. The conclusion drawn from these efforts was that
I2(X, v>20) is not the immediate precursor of atomic iodine. Although I2(X, v>20) may play an important
role in the dissociation mechanism, the deactivation kinetics are governed by a different species.
5. IS V ELECTRONICALLY EXCITED I2?
Emission from I2(A3n(lu), Tra^=220 ps) is readily observed from 02(a)/I2 flames16'26, but the lowest
energy electronically excited state of I2 (A*311(2U)) is very metastable, and cannot be detected by emission
spectroscopy. Basics et al27 used laser excitation techniques to demonstrate that I2(A') was generated in
02(a)/I2 mixtures. They found that I2(A') and I2(X, v>20) were present at comparable concentration levels.
Ramault et a/.28 proposed that I2(A') was populated by the process
12(X, v« 10)+O2(a)—>I2( A * )+02(X) (12)
Support for this mechanism was provided by a study of the I2(X) vibrational population distribution in a
flowing l2/02(a) mixture. Bamault et a/.28 observed selective depletion of vibrational levels around v=10,
indicating that this population was being removed by reaction 12. The dissociation mechanism proposed by
Bamault et a/.28 was dependent upon vibrational excitation of I2(X), but the kinetics were controlled by
passage through the A' state. Additional kinetic schemes involving I2(A’) were elaborated by Bouvier et cilr*
These models could accommodate the fact that moderate pressures of Ar or He had very little influence on the
dissociation rate. Tellinghuisen and Phillips30 had reported rate constants for removal of I2(A') by He and Ar
of 0.94x10 14 and 2.8xl014 cm3 s'1, respectively. The small rate constants were consistent with removal via
collision induced dissociation. Quenching of I2(A’) by molecular collision partners that could accept energy
by E-E or E-V transfer was expected to be much more effective. Tellinghuisen and Phillips30 observed a self¬
quenching rate constant of 5.5xl0'n cm3 s'1. These trends provided some indication that I2(A") could be the
key intermediate, but data for the quenching of I2(A') by H20 and 02(X) were needed to further explore this
possibility. Komissarov et a/.31 measured these rate constants using pulsed laser pump-probe techniques.
Quenching rate constants of 6.3x1 O'12 and 3.4x10"12 cm3 s'1 were obtained for 02(X) and H20, respectively.
Clearly, these collision partners were much more effective quenchers than He or Ar, but the quenching still
appeared to be slower than that required for I2f deactivation. Furthermore, 02 was more effective in removing
I2(A’) than H20, in conflict with the ordering of the deactivation rate constants. Komissarov et a/.31 suggested
that the latter problem could be resolved if 02 quenching of I2(A') occurred by the process
I2(A>02(X)->I2(X, v~10)+O2(a) (13)
which would minimize the loss of energy and permit facile re-excitation. Conversely, it was assumed that
quenching by H20 caused irreversible deactivation to the lowest vibrational levels of I2(X). The remaining
problem was the low absolute magnitudes of the I2(A') quenching rate constants. This could be
16 Proc. SPIE Vol. 4631

accommodated in the model by reducing the rate constants for excitation and dissociation of I2(A’), thereby
allowing the deactivation processes to compete. The resulting kinetic scheme is illustrated in Fig. 3.
An attempt to derive rate constants for the revised kinetics package was made by modeling the data of
Heidner et al?6 The performance of the revised model was comparable to that of Heidner et al.Js16 limiting
case models. Once again it was found that the available data were not sufficient to define a unique set of rate
constants. Komissarov et al?l concluded that their model was capable of reproducing the dissociation rate
data, and presented one set of physically reasonable rate constants as an example. Subsequently, Bruins et
al?2 and Madden33 have modeled the performance of COIL devices using the Komissarov et al?1 rate constants.
They found poor agreement with the experimental data, primarily due to underestimation of the I2 dissociation
rate. This failure shows that the rate constant package contains errors, it does not necessarily imply that the
mechanism is incorrect. The model has sufficient flexibility that fitting the rate constants to flow tube and
COIL performance data would provide a parameterized model that would work as well as the standard model.
However, this would be an exercise of questionable value, as it cannot be used to distinguish the true
mechanism from functionally equivalent models. Further studies of the elementary reactions are needed to
assess the viability of the mechanism proposed by Komissarov et al?1
6. IS VIBRATIONALLY EXCITED 02 IMPORTANT IN THE DISSOCIATION PROCESS?
The crux of the problem with models that are dominated by the kinetics of an 1/ intermediate is the
relative ordering of the deactivation rate constants, kJ^Q ~ 6ko2 > 75k j^. The Derwent and Thrush7,8 model
was successful because H20 is the most efficient quencher of 02(b). Houston and co-workers had shown that
dissociation by 02(b, v=0) was untenably slow, but alternative mechanisms involving vibrationally excited
02(b) and 02(a) have been advanced. As noted above, Lilenfeld20 detected 02(a, v=l) in his experiments, and
suggested that I2(A’) could be directly excited by this species. More recently, Azyazov et al?4 observed 02(a,
v=l) in the flow from a jet-type singlet oxygen generator. In these experiments the evidence for the presence
of 02(a, v=l) was provided by detection of the 02(a, v=l)-02(a) —> 02(X)-02(X) dimole emission band.
Azyazov et al?4 estimated that about 2% of the 02(a) in their system was vibrationally excited. They
suggested possible roles for vibrationally excited 02 in the dissociation mechanism that included 02(a,
v>0)+I2(X) —» 02(X) + I^A’), and gas kinetic dissociation of I2(X) by 02(b, v>0). Processes that might
generate vibrationally excited 02 include
02(a) + 02(a) —» 02(b, v>0) + 02(X) (14)
02(a) +1* —» 02(b, v>0) + I (15)
02(b) + H20 —> 02(a, v>0) + H20 (16)
Models based on these reactions will no doubt be able to reproduce the flow tube and laser performance data,
once the rate constants have been empirically adjusted. As with the previous models, it will not be possible
to evaluate the reality of the model as the required rate constants and final state distribution data are not
available. Measurements of a few key rate constants should be undertaken to assess the importance of these
reactions.
7. CONCLUSION
Thirty six years ago Arnold et al? noted that “A more difficult question is how the I2 is initially
dissociated”. Their comment remains valid. Important details of the dissociation mechanism have been gleaned
from careful kinetic measurements, but this data set is still far from complete. Models of the dissociation
process have been further elaborated and refined by fitting to laser performance characteristics. Unfortunately,
the complexity of the process does not allow the mechanism to be determined by this approach. Since the
establishment of the standard reaction set and rate constant package used to model COIL devices,
investigations of specific reactions have shown that some of the critical rate constants are incorrect, and have
called the accepted mechanism into question. At this point the standard model should be regarded as an
intelligent parameterization, rather than a correct physical description.
Proc. SPIE Vol. 4631 17

The majority of the data used to establish the COIL kinetics package was recorded more than fifteen
years ago. The generation of researchers who revealed the potential of the l2/02(a) system, and mapped the
functional characteristics of the I2 dissociation process, did so through elegant application of a limited set of
diagnostic tools. Since that time advanced techniques for characterizing the key species in COIL systems have
been developed, as described in the paper by Davis35. Application of the full range of diagnostic techniques in
new studies of the dissociation mechanism will lead to a final resolution of this long-standing problem. The
development of truly predictive computational models for COIL devices will then be in reach.
ACKNOWLEDGMENT
Support provided by the Air Force Office of Scientific Research for work on the reaction kinetics
of the l2/02(a) system led to the demonstration of the first COIL system. AFOSR has sustained its
commitment to fundamental studies of reaction dynamics, which is reflected in the fact that the greater
majority of the research described in this article was sponsored by AFOSR. The authors arc grateful for the
continued support of these efforts at Emory University through AFOSR grant F49620-01-1-0070.
REFERENCES
1. S. J. Arnold, N. Finlayson, and E. A. Ogryzlo, “Some novel energy-pooling processes involving 02(a)”
J. Chem. Phys. 44, 2529 (1966).
2. P. M. Alsing, S. J. Davis, and G. L. Simmons. "Efficiency of the dissociation of I2 by
02(a)"unpublished preprint.
3. B. D. Barmashenko and S. Rosenwaks, “Power dependence of chemical oxygen-iodine lasers on iodine
dissociation,” AIAA J. 34, 2569-2574 (1996).
4. C. A. Helms, J. Shaw, G. D. Hager, “Iodine dissociation in COILs,” Proc. SPIE-Int. Soc. Opt.
Eng. 2502, 250-7 (1995).
5. G. P. Perram and G. D. Hager, "Standard chemical oxygen-iodine laser kinetics package" Air Force
Weapons Lab., Kirkland AFB, NM. 1988.
6. G. P. Perram and G. D. Hager, "Standard chemical oxygen-iodine laser kinetics package, Revision" Air
Force Weapons Lab., Kirkland AFB, NM. 1988.
7. R. G. Derwent and B. A. Thrush, “Excitation of iodine by singlet molecular oxygen. 1. Mechanism of
the iodine chemiluminescence,” J. Chem. Soc., Faraday Trans. 2 68, 720-8 (1972).
8. R. G. Derwent and B. A. Thrush, “Excitation of iodine by singlet molecular oxygen. 2. Kinetics of the
excitation of the iodine atoms,” Faraday Discuss. Chem. Soc. No. 53, 162-7 (1972).
9. R. G. Derwent, David R. Kearns, and Brian A. Thrush, “Excitation of iodine by singlet molecular
oxygen,” Chem. Phys. Lett. 6, 115-16 (1970).
10. R. G. Derwent and B. A. Thrush, “Radiative lifetime of the metastable iodine atom I(52P1/2),” Chem.
Phys. Lett. 9, 591-2 (1971).
11. D. J. Benard, W. E. McDermott, N. R. Pchelkin, and R. R. Bousek, “Efficient operation of a 100 W
transverse-flow oxygen-iodine chemical laser,” Appl. Phys. Lett. 34, 40-1 (1979).
12. W. E. McDermott, N. R. Pchelkin, D. J. Benard and R. R. Bousek, “An electronic transition chemical
laser,” Appl. Phys. Lett. 32, 469-70 (1978).
13. W. E. McDermott, “Historical Perspective of COIL,” Proc. SPIE-Int. Soc. Opt. Eng., 4631, (2002).
14. R. G. Aviles, D. F. Muller, and P. L. Houston, “Quenching of laser-excited 02(b) by carbon dioxide,
water, and diatomic iodine,” Appl. Phys. Lett. 37, 358-60 (1980).
15. D. F. Muller, R. H. Young, P. L. Houston, “Direct observation of diatomic iodine collisional
dissociation by 02(b),” Appl. Phys. Lett. 38, 404-6 (1981)
16. R. F. Heidner, III, C. E. Gardner, G. I. Segal, and T. M. El-Sayed. “Chain-reaction mechanism for
molecular iodine dissociation in the 02(a)-iodine atom laser,” J. Phys. Chem. 87, 2348-60 (1983).
17. G. E. Hall, W. J. Marinelli, and P. L. Houston, “Electronic-to-vibrational energy transfer from excited
atomic iodine (I*(52P1/2)) to molecular iodine(25<v<43),” J. Phys. Chem. 87, 2153-61 (1983).
18 Proc. SPIE Vol. 4631

18. M. H. Van Benthem and S. J. Davis, “Detection of vibrationally excited molecular iodine in the
dissociation region of chemical oxygen-iodine lasers,” J. Phys. Chem. 90, 902-5 (1986).
19. D. David, V. Joly, and Fausse, “High vibrational levels of iodine as intermediate states in the iodine
dissociation by 02(a),” Proceedings of the 7th International Symposium on Gas Flow and Chemical
Lasers, 1987.
20. H. V. Lilenfeld, "Oxygen-Iodine Laser Kinetics", Air Force Weapons Laboratory Technical Report
AFWL-TR-83-1, 1983.
21. W. G. Lawrence, T. A. Van Marter, M. L. Nowlin and M. C. Heaven, “Energy transfer processes for
I2(X) of relevance to COIL,” Proc. SPIE-Int. Soc. Opt Eng. 2702 (Gas and Chemical Lasers), 214-
225 (1996).
22. M. L. Nowlin and M. C. Heaven, “Collisional relaxation of highly excited vibrational levels of I2(X),”
J. Phys. IV 4 (C4, LASER M2P), C4/729-C4/737 (1994).
23. M. L. Nowlin and M. C. Heaven, “Energy transfer rate constants for highly excited rovibrational levels
of molecular iodine,” J. Chem. Phys. 99, 5654-60 (1993).
24. W. G. Lawrence, T. A. Van Marter, M. L. Nowlin and M. C. Heaven, “Inelastic collision dynamics of
vibrationally excited I2(X)” J. Chem. Phys. 106, 127-141 (1997).
25. J. S. Paschkewitz and M. C. Heaven, “COIL chemical kinetics package revisited: a re-analysis of
molecular iodine dissociation rate data,” Proc. SPIE-Int. Soc. Opt. Eng. 3931 (Gas, Chemical, and
Electrical Lasers and Intense Beam Control and Applications), 169-178 (2000).
26. D. Cemy, R. Bacis, A. J. Bouvier, S. Poulat, and A. Topouzkhanian. “The dissociation of molecular
iodine by metastable oxygen-I. Populations of A lu and B 0u+ iodine states through Fourier transform
spectrometry analysis,”/. Quant. Spectrosc. Radiat. Transfer47, 9-18 (1992).
27. M. Nota, A. J. Bouvier, R. Bacis, A. Bouvier, P. Crozet, S. Churassy and J. B. Koffend, “The
dissociation of iodine by singlet molecular oxygen; role of the vibrational reservoir state A’(2u)”
J. Chem. Phys. 91, 1938-40 (1989).
28. B. Bamault, A. J. Bouvier, D. Pigache and R. Bacis, “Absolute measurements of the molecular iodine
high vibrational levels in the oxygen-iodine reaction,” J. Phys. TV 1 (C7, Int. Conf. Laser M2P, 2nd,
1991), C7/647-C7/650.
29. A. J. Bouvier, R. Bacis, A. Bouvier, D. Cemy, S. Churassy, P. Crozet, and M. Nota., “The
dissociation of molecular iodine by metastable oxygen. II. Populations of reservoir states through laser
excitation spectra,”/. Quant. Spectrosc. Radiat. Transfer49, 311-23 (1993).
30. J. Tellinghuisen and L. F. Phillips, “Kinetics of I2 following photolysis at 1930 A: Temperature
dependence of A'-state quenching,” /. Phys. Chem. 90, 5108 (1986).
31. A. V. Komissarov, V. Goncharov, and M. C. Heaven, “Chemical oxygen-iodine laser (COIL) kinetics
and mechanisms,” Proc. SPIE-Int. Soc. Opt. Eng. 4184 (XIII International Symposium on Gas Row
and Chemical Lasers and High-Power Laser Conference), 7-12 (2001).
32. B. D. Barmashenko, E. Bruins, D. Furman, V. Rybalkin, and S. Rosenwaks, “Modeling of the gain,
temperature, and iodine dissociation fraction in a supersonic chemical oxygen-iodine laser, ” Proc.
SPIE-Int. Soc. Opt. Eng., 4631 2002.
33. T. J. Madden, private communication.
34. V. N. Azyazov, V. D. Nikolaev, M. I. Svistun, and N. I. Ufimtsev. “Luminescence of the oxygen
dimole at the output of a chemical singlet-oxygen generator,” Quantum Electron. 29, 767-771 (1999).
35. S. J. Davis, “History of COIL diagnostics,” Proc. SPIE-Int. Soc. Opt. Eng., 4631, 2002.
Proc. SPIE Vol. 4631 19
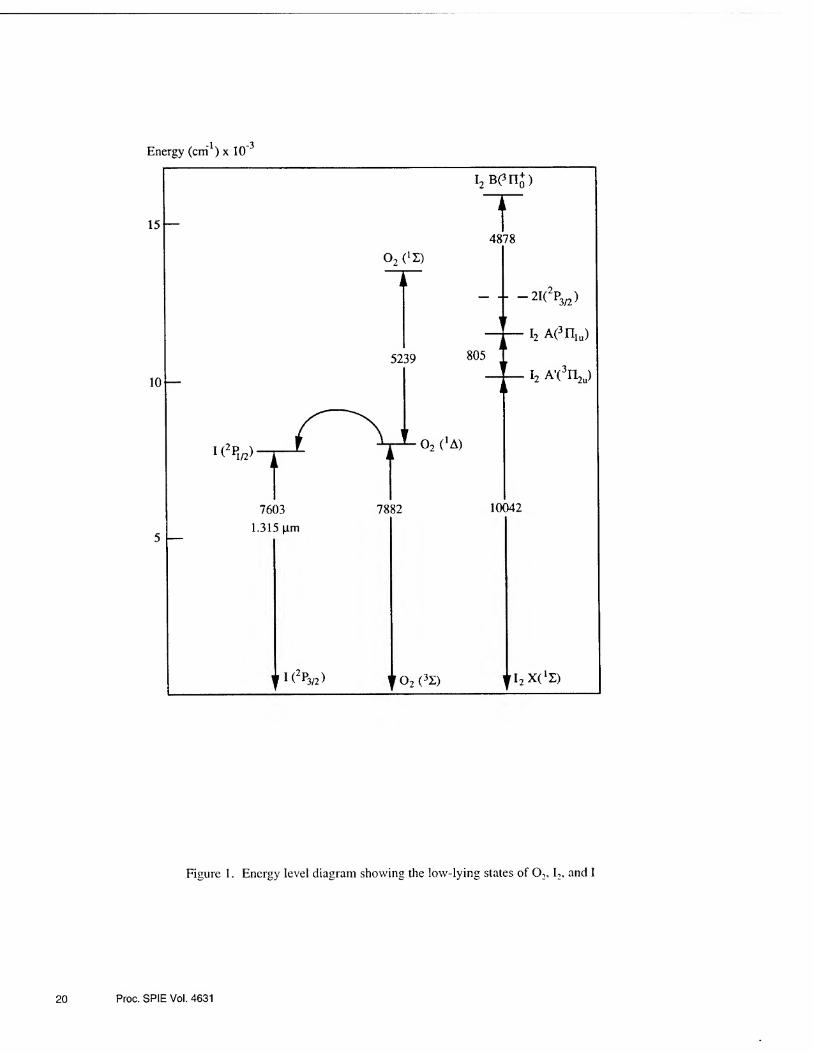
Energy (cm1) x 10"3
Figure 1. Energy level diagram showing the low-lying states of 02,I2, and I
20 Proc. SPIE Vol. 4631
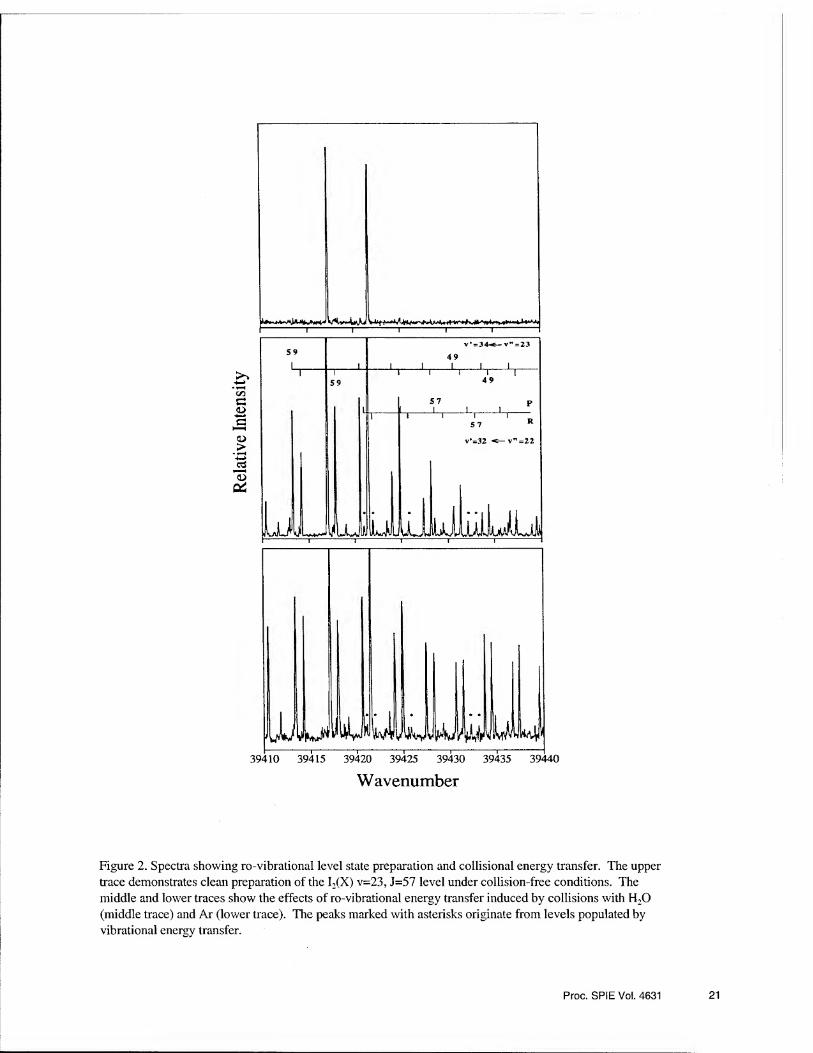
39410 39415 39420 39425 39430 39435 39440
Wavenumber
Figure 2. Spectra showing ro-vibrational level state preparation and collisional energy transfer. The upper
trace demonstrates clean preparation of the I2(X) v=23, J=57 level under collision-free conditions. The
middle and lower traces show the effects of ro-vibrational energy transfer induced by collisions with H20
(middle trace) and Ar (lower trace). The peaks marked with asterisks originate from levels populated by
vibrational energy transfer.
Proc. SPIE Voi. 4631 21


Invited Paper
Gain and temperature in a slit nozzle supersonic chemical oxygen- iodine laser with transonic and supersonic injection of iodine
S. Rosenwaks, B. D. Barmashenko, E. Bruins, D. Furman, V. Rybalkin and A. Katz Department of Physics, Ben-Gurion University of the Negev, Beer-Sheva 84105, Israel
ABSTRACT
Spatial distributions of the gain and temperature across the flow were studied for transonic and supersonic schemes of
the iodine injection in a slit nozzle supersonic chemical oxygen-iodine laser as a function of the iodine and secondary
nitrogen flow rate, jet penetration parameter and gas pumping rate. The mixing efficiency for supersonic injection of
iodine (~ 0.85) is found to be much larger than for transonic injection (~ 0.5), the maximum values of the gain being ~
0.65%/cm for both injection schemes. Measurements of the gain distribution as a function of the iodine molar flow rate
nl2 were carried out. For transonic injection the optimal value of nl2 at the flow centerline is smaller than that at the off
axis location. The temperature is distributed homogeneously across the flow, increasing only in the narrow boundary
layers near the walls. Opening a leak downstream of the cavity in order to decrease the Mach number results in a
decrease of the gain and increase of the temperature. The mixing efficiency in this case (~ 0.8) is much larger than for
closed leak.
Keywords: chemical lasers, oxygen, iodine, power lasers
1. INTRODUCTION
The chemical oxygen-iodine laser (COIL)1 emits at 1.315pm and is the shortest wavelength and the most efficient high-
power chemical laser operating to date. The laser operation is based on the transition between the spin-orbit levels of
the ground state configuration of the iodine atom, I(5p5 2P1/2) -»I(5p5 2P3/2) * where the upper level is populated by a
near resonant energy transfer from an 02(aiAg) molecule (produced in a chemical generator by the reaction of gaseous
chlorine with basic hydrogen peroxide solution):
02('A) + I(2P3/2) -> 02(3Z) + I(2Pi/2) . (1)
Mixing of the O^A) with I2 molecules results in their dissociation to iodine atoms which are subsequently excited
via reaction (1). Maximum values of lasing power were obtained for supersonic COILs where the primary gas (02(3I)
- 02(1A) - He (N2)) was brought to supersonic velocity via expansion in a converging-diverging nozzle 2, whereas the
secondary I2- He (N2) flow was injected into the primary flow at some location in the nozzle, either in the subsonic,
transonic, or supersonic section of the flow.
One of the most important parameters of the supersonic COIL is the mixing efficiency rjmix , defined as the fraction of
02(*A) mixed with iodine (see below). To achieve high lasing power P this parameter should be high. Indeed, P can be
estimated with the aid of the COIL heuristic equation3
P = 9l(kS/mole)nC\2U(Ypien - Ydiss - Yth)rjmix7jext, (2)
where 91(KJ/mole) is the energy of I*(= I(2Pi/2)), nC\2 the chlorine molar flow rate, U the chlorine utilization and Ypien
is the 02(jA) yield just upstream of the iodine injection,
Gas and Chemical Lasers and Intense Beam Applications 111, Steven J. Davis, Michael C. Heaven, Editors, Proceedings of SPIE Vol. 4631 (2002) © 2002 SP1E * 0277-786X/02/$ 15.00 23

(3) Miss = NF wl2
nCli^mix
is the 02('A) loss during iodine dissociation, rjexl the optical extraction efficiency of the resonator, F the iodine
dissociation fraction and N is the number of 02(’a) molecules lost in the region of iodine dissociation per I2 molecule.
Eqs. (2) and (3) show that P increases with increasing rjmix. To estimate rjmix it is necessary to know the spatial
distributions of the gain g and gas temperature T across the flow at the optical axis of the resonator. Both g and T can be
easily measured using diode laser based diagnostic 4, the first measurements of the gain in supersonic COILs with
subsonic injection of iodine being carried out in 5 *1. In 6 and 7 the gain distribution across the flow was monitored for
the RADICL and VertiCOIL devices, 5 kW and 1 kW class supersonic COILs, respectively, developed at the Air Force
Research Laboratory in Albuquerque, NM. These COILs use He as a buffer gas. For conditions where nitrogen buffer
gas or no primary buffer gas is used, the subsonic mixing scheme is not optimal and it is reasonable to move the mixing
point downstream to the transonic or supersonic part of the nozzle. This was done in *’9 where efficient supersonic
COILs using N2 buffer gas and applying transonic and supersonic mixing of iodine and oxygen were developed.
Recently we reported on the measurements of the gain and temperature at the flow centerline of a slit nozzle supersonic
COIL operating without primary buffer gas and using transonic and supersonic schemes of iodine injection10.
Comparison between the values of the gain at the flow centerline and at a point located lower than the flow centerline
for transonic injection showed that the gain is strongly non-uniform in a direction perpendicular to both the flow
direction and the optical axis, which means that the overall mixing is poor. To study the 02/I2 mixing in supersonic
COILs with transonic and supersonic schemes of the iodine injection, we measured in the present work the spatial
distributions of the gain and temperature as a function of the iodine and secondary nitrogen flow rate, jet penetration
parameter and gas pumping rate. Using spatial distributions of g and T and the values of Ypim , measured in the
subsonic section of the flow as described in ", we estimated the mixing efficiency r)mix. Flow conditions for good
mixing in the COIL are found.
2. EXPERIMENTAL SETUP
The experimental setup, including a jet-type singlet oxygen generator (JSOG), is similar to that used in l0. A brief
description will be given here for completeness. The oxygen produced in the generator (the same as described in l0)
flows into a diagnostic cell with a flow cross section of 1 x 5 cm2, which serves as an interface between the generator
and the iodine injectors housing. The 02('A) yield Ypien, water vapor fraction, Cl2 utilization and the temperature of the
subsonic flow are simultaneously measured in the diagnostic cell as described in
The iodine-oxygen mixing system is located downstream of the diagnostic cell and uses slit supersonic nozzle. We
study three slit nozzles (Fig. 1) with iodine injection in the transonic (nozzle No. 1) and supersonic (nozzles No. 2 and
3) sections of the nozzle. All the slit nozzles have the same critical cross sections of 2.5 cm2. In slit nozzle No. 1 iodine
is injected at the nozzle throat (Fig. 1 a) and in nozzles No. 2 and 3 - in the supersonic section of the nozzle (Fig. 1 b
and c). Nozzles 1 and 2 have two rows of injection holes in each wall (top and bottom). The first row of nozzle No. 1
has 31, 0.6-mm diameter holes and the second row 62, 0.4-mm diameter holes (this nozzle was referred to as nozzle No.
2 in ,0). The first row of nozzle No. 2 is located 3 mm downstream of the critical cross section and has 49, 0.5-mm
diameter holes. The second row has 50, 0.4-mm diameter holes (this nozzle was referred to as nozzle No. 3 in l0).
Nozzles No. 1 and No. 2 have the same total cross section of the injection holes equal to 0.32 cm2. The angle between
the directions of the primary and secondary flows is 90° and 74° for nozzles 1 and 2, respectively. In order to decrease
the effect of chocking the primary flow by the secondary stream, smaller angle (45°) between the directions of the
primary and secondary stream is used in nozzle No. 3. This nozzle has one row of 25, 1.3-mm diameter holes, located 2
mm downstream of the critical cross section, in each wall. The total cross section of the injection holes is 0.64 cm2,
i.e., larger than for nozzles No. 1 and 2. That is why this nozzle usually operates with secondary N2 flow rate larger than
the primary gas flow rate, which means that the operation conditions of the ejector COIL 12 can be tested using nozzle
No. 3.
24 Proc. SPIE Vol. 4631

The laser section starts at the nozzle exit plane (flow cross section of 5 x 1 cm ) from where the floor and the ceiling
diverge at an angle of 8°. The optical cavity is of 5 cm gain length. For the gain diagnostic system we replaced the
laser mirrors by optical windows. The gain was measured at the optical axis of the resonator, 4.5 cm downstream of the
nozzle exit plane.
The iodine diagnostic system used in the present work was developed by Physical Sciences Inc 4 and is described in
detail in 10. It is based on sensitive absorption spectroscopy by tunable near infrared diode laser monitoring the gain for
the I*(5p5 2P1/2, F=3) -» I(5p5 2P3/2, F = 4) transition at 1315 nm. The diode laser beam makes a single pass through
the gain region of the cavity (Fig. 2). To probe the gain distribution in the direction y perpendicular to both the flow
direction x and the cavity optical axis z, a collimator launching the beam from the diagnostic system into the gain region
is mounted on a linear stage moving in the y direction. The gain is monitored in 50 points uniformly distributed over the
flow height H - 1.5 cm. After passing the gain region the beam is focused onto a photodiode. The laser frequency is
scanned over the I transition, monitoring the gain profile. The temperature of the gas in the cavity is found from the
Doppler linewidth , the later being determined by fitting the Voigt function to the experimental gain profile as
described in 10.
3. RESULTS AND DISCUSSION
In what follows spatial dependencies g(y) and T(y) are presented for different values of iodine molar flow rate nl2, jet
penetration parameter (defined below), nozzle type and rate of pumping of the gas. Most of the measurements are done
for two values of Cl2 flow rates, nC12 ~ 12 and - 15 mmole/s. The mixing parameter r\mix, characterizing the quality
of mixing in the flow, is defined and found for different flow conditions.
3.1. Jet penetration parameter
As shown in 13 changes of secondary nitrogen molar flow rate (riN2)s affect the depth of penetration of the N2/I2 jets
into the primary flow. That means that the gain spatial profiles depend on the penetration parameter defined as 13
n=— (4) np\MpTpPs
where n, p and p are the molar flow rate, molecular weight and pressure, respectively, and the subscripts “p” and V’
indicate primary and secondary flow.
Fig. 3 shows g(y) dependencies for nozzle No. 1 with transonic injection of iodine, for nl2= 0.25, 0.28 and 0.36
mmole/s and 11= 0.12, 0.16 and 0.18, respectively. Just as in 6, for small II, 0.12 (underpenetrated jets), the gain
distribution across the flow has bimodal structure with two peaks corresponding to the centerline of the jets and located
higher and lower than the flow centerline. Increase of the penetration parameter results in merging of the two peaks and
the gain distribution has one peak at the flow centerline. II equal to 0.16 and 0.18 corresponds to full penetration
(when the jets injected from the opposite walls touch and the bimodal structure disappears) and overpenetration of the
jets, respectively. The gain distribution for the case of overpenetration is a little narrower than for full penetration,
which is probably due to the effect of the overlap of the overpenetrated jets. The maximum gain at the flow centerline
is achieved for overpenetrated jets.
3.2. Nozzle No. 1 with transonic injection of iodine
The g(y) distributions for nozzle No. 1 for different values of «I2are shown in Fig. 4a for overpenetrated jets (11 =
0.26, corresponding to maximum gain) and no primary N2. The gain is a non-monotonous function of nl2 and the
dependence of the gain on rcl2at the flow centerline is different from that at the off axis locations. Fig. 4b shows
dependencies of g on n\2 at^ = 0 (flow centerline) and y = 0.5 cm. It is seen that the optimal value of nl2 at the flow
Proc. SPIE Vol. 4631 25

centerline is smaller than that at the off centerline location. The reason for this behavior is that the initial I2 distribution
across the flow is strongly nonuniform, the iodine being concentrated near the flow centerline. For low values of the
iodine flow rate, the dissociation rate is proportional to the iodine density, hence at the flow centerline both dissociation
and gain increase faster with increasing n\2 than at the off axis location. For higher iodine flow rates the excited species,
02(1A), I* and I2*, are rapidly quenched by iodine molecules which results in a decrease of the gain. The quenching
rate, which is proportional to the density of I2, is higher at the flow centerline than at the off axis location, resulting in
faster decrease of the gain at the flow centerline for large iodine flow rate. Therefore the optimal n\2 at the flow
centerline is smaller than at the off axis location.
The T(y) dependencies are shown in Fig. 5a and 5b for the cases of overpenetration and underpenetration, respectively.
It is seen that the temperature is distributed homogeneously across the flow for different values of the penetration
parameter, increasing only in the narrow boundary layers near the walls. The fact that the temperature distribution is
much more homogeneous than the gain distribution, can probably be explained by the high rate of the heat transfer
across the flow. The same homogeneous temperature distributions for transonic injection are also observed for different
values of the flow parameters.
Using the dependencies g(y) and T(y) it is possible to determine the distribution of the iodine atoms molar fraction
X\(y) and to define the mixing parameter rjmix. Taking into account that the distance between the iodine injection
holes is much smaller than the flow height we can assume that both the gain and temperature are uniform along the
optical axis direction z. This assumption is confirmed by the fact that the intensity of the yellow emission of I2{b^TIq )
molecules observed in the supersonic section of the flow is uniform along the z direction. In this case the relation
between g(y), T(y), X\(y) and C^^A) yield Fis
'300 V/2_£_ (2ATe + l)r -1
T ) kTXl (Ke-l)r + l ’ (5)
where cr0 = 1-29 xlO'17 cm2 is the stimulated emission cross section at T= 300 K, p the pressure at the optical axis and
Ke = 0.75 exp (402/7) is the equilibrium constant of reaction (1). For n\2 much smaller than the optimal iodine flow
rate we can assume that on the one hand the rate of iodine dissociation is proportional to the density of I2 B, which
means that the molar fraction of I2, X\2 (f) > is proportional to Xi O0 > and on the other hand the yield F is close to Ypien ,
measured in the subsonic section of the flow. In this case x\ 00 found from Eq. (5) (with Y = Ypien) can be used to
define r/muc:
HI 2
\x\ (y)<fy
71 - ~H/2 1imix ~
Wmax#
(6)
where (zi)max^s the maximum value of X\ OO* It should be noted once again that the definition (6) (with
X\(y) calculated by (5)) makes sense only for small n\2 . Fig. 6 shows distributions of g(y)/gmax and X\(y)/(Zi)max
for the same flow conditions as in Fig. 4 at n\2 = 0.228 mmole/s which is much smaller than the optimal n\2 = 0.38
mmole/s. It is seen that for transonic injection the normalized distributions of g and Xi are very cl°se to each other,
being different only near the duct walls. The calculated value of rjmix is equal to 0.52, close values of 7jmix being found
for other primary flow parameters and in particular for the primary flow diluted by N2 buffer gas. Thus, poor mixing is
achieved for transonic injection of iodine.
To increase the mixing efficiency it is necessary to decrease the pumping rate. This is achieved by opening a leak
downstream of the cavity as explained in 10 and results in increase of the pressure and decrease of the Mach number in
26 Proc. SPIE Vol. 4631

the supersonic section of the flow. Figs. 7a and b show the g(y) distributions (at different n\2) for opened and closed
leak, respectively, and the same flow rates of Cl2 and N2. Figs. 8 a and b show T(y) for the same conditions. It is seen
that maximum values of the gain at the flow centerline for opened leak are smaller than for closed leak, the gain
distribution for opened leak being more homogeneous than for closed leak. This behavior is in agreement with the
conclusions drawn in 10 using a simple theoretical model. The temperatures for opened leak are higher than for closed
leak, which is due to weaker expansion of the gas for opened leak. Calculations of the mixing parameters using Eqs. (5)
and (6) at nl2~ 0.23 mmole/s show that rfmix is equal to 0.83 and 0.57 for opened and closed leak, respectively.
Therefore for opened leak the mixing is much better than for closed leak, which is also in agreement with conclusions
obtained in 10.
3.3. Nozzles No. 2 and 3 with supersonic injection of iodine
Figs. 9 a and b show the g(y) distributions for nozzles No. 2 and 3, respectively. The primary flow did not contain N2
buffer gas and the leak downstream of the cavity was closed. Comparison between Fig. 4a and Figs. 9 a and b shows
that the maximum values of the gain are almost the same for transonic and supersonic injection, however, for
supersonic injection the gain is distributed much more uniformly across the flow. Fig. 10 shows calculated
X\ OO / (z\ )max f°r nozz*e No. 3 at nl2= 0.39 mmole/s and the same flow conditions as in Fig. 9b. Comparison
between Figs. 6 and 10 shows that unlike transonic injection, where iodine is concentrated near the centerline, for
supersonic injection the iodine distribution across the flow is rather uniform and weakly increases near the walls. The
calculated rjmix is 0.82 and 0.86 for nozzles No. 2 and 3, respectively. Hence for any angle of injection the supersonic
injection scheme provides for much more uniform mixing than the transonic injection scheme.
4. SUMMARY
We measured spatial distributions of the gain and temperature across the flow in a slit nozzle supersonic COIL without
primary buffer gas using diode laser based diagnostic systems. This was done to estimate the oxygen/iodine mixing
efficiency of the COIL, which, in turn, strongly affects the output power. The spatial distributions of the gain and
temperature were studied for transonic and supersonic schemes of the iodine injection as a function of the iodine and
secondary nitrogen flow rate, jet penetration parameter and gas pumping rate. The mixing efficiency for supersonic
injection of iodine (~ 0.8) is found to be much larger than for transonic injection (~ 0.5), the maximum values of the
gain being - 0.65%/cm for both injection schemes. Measurements of the gain distribution as a function of the iodine
molar flow rate nl2 were carried out. For transonic injection the optimal value of nl2 at the flow centerline is smaller
than that at the off axis location. The temperature is distributed homogeneously across the flow, increasing only in the
narrow boundary layers near the walls. Opening a leak downstream of the cavity in order to decrease the Mach number
results in a decrease of the gain and increase of the temperature. The mixing efficiency in this case (~ 0.8) is much
larger than for closed leak.
REFERENCES
1. W. E. McDermott, N. R. Pchelkin, D. J. Benard, R. R. Bousek, “An electronic transition chemical laser,” Appl.
Phys. Lett., vol. 32, pp. 469-470, 1978.
2. K. A. Truesdell and S. E. Lamberson, “Phillips laboratory COIL technology overview,” SPIE, vol.1810, pp. 476 -
492, 1992.
3. J. Hon, D. N. Plummer, P. G. Crowell, J. Erkkila, G. D. Hager, C. A. Helms, K. A. Truesdell, “Heuristic Method
for Evaluating COIL Performance,” AIAA Journal, vol. 43, pp.1595-1603, 1996.
4. S. J. Davis, M. G. Allen, W. J. Kessler, K. R. McManus, M. F. Miller and P. A. Mulhall, “Diode laser-based
sensors for chemical oxygen-iodine lasers,” SPIE, vol. 2702, pp. 195 - 201,1996.
5. E. Lebiush, B. D. Barmashenko, A. Elior and S. Rosenwaks, “Parametric study of the gain in a small scale, grid
nozzle supersonic chemical oxygen-iodine laser,” IEEEJ. Quantum Electronics, vol.31, pp. 903-909, 1995.
6. R. F. Tate, B. S. Hunt, C. A. Helms, K. A. Truesdell and G. D. Hager, “Spatial gain measurements in a chemical
oxygen iodine laser (COIL),” IEEE J. Quantum Electronics, vol.31, pp. 1632 - 1636, 1995.
7. P. B. Keating, B. A. Anderson, C. A. Helms, T. L. Rittenhouse, G. D. Hager and K. A. Truesdell, “2-D spatial gain
maps in a small scale chemical oxygen-iodine laser,” in Proc. Int. Conf. Lasers '96, Portland, OR, Dec. 1996.
Proc. SPIE Vol. 4631 27

8. D. Furman, B. D. Barmashenko and S. Rosenwaks, “An efficient supersonic chemical oxygen-iodine laser
operating without buffer gas and with simple nozzle geometry,” Appl. Phys. Lett., vol. 70, pp. 2341-2343, 1997.
9. V. N. Azyazov, M. V. Zagidullin, V. D. Nikolaev and V. S. Safonov, “Chemical oxygen-iodine laser with mixing
of supersonic jets,” Quantum Electronics, vol. 27, pp. 491-494, 1997.
10. D. Furman, E. Bruins, V. Rybalkin, B. D. Barmashenko and S. Rosenwaks, “Parametric study of small signal gain
in a slit nozzle, supersonic chemical oxygen - iodine laser operating without primary buffer gas,” IEEE J. Quantum
Electronics, vol. 37, pp. 174-182,2001. 11. D. Furman, B. D. Barmashenko and S. Rosenwaks, “Diode-laser based absorption spectroscopy diagnostics of a
jet-type generator for chemical oxygen-iodine lasers,” IEEE J. Quantum Electronics, vol. 35, pp. 540-547, 1999.
12. T. T. Yang, Y. C. Hsia, L. F. Moon and R. A. Dickerson, “Advanced Mixing Nozzle Concepts for COIL,” SPIE
vol. 3931, pp. 116-130, 2000. 13. C. A. Helms, J. Shaw, G. D. Hager and K. A. Truesdell, “Iodine dissociation in COILs,” SPIE, vol. 2502, pp. 250 -
257, 1996.
45.0
Secondary flow
| Secondary flow
8.5 —i r~ Primary flow —“j 1 f
1 1 C ft .A
4.0° Optical
-45.0-
axis
Secondary flow
b
c
Fig. 1. Schematics of the slit nozzles; a) slit nozzle No. 1 with transonic injection of 12; b) and c) slit nozzles No. 2 and
3, respectively, with supersonic injection of iodine. All measures are in millimeters.
28 Proc. SPIE Vot. 4631

Secondary Flow (I2+N2)
-0.80 -0.64 -0.48 -0.32 -0.16 0.00 0.16 0.32 0.48 0.64
y, cm
Fig. 3. The gain distributions across the flow, for «I2 = 0.25, 0.28 and 0.36 mmole/s and penetration parameter n =
0.12, 0.16 and 0.18, respectively, for nozzle No. 1 (transonic injection). The chlorine and primary nitrogen flow rates
are 14.8 and 15.2 mmole/s, respectively.
Proc. SPIE Vol. 4631 29

(a) (b)
Fig. 4. (a) The gain distributions across the flow for different values of n\2 for nozzle No. 1 (transonic injection); the
chlorine, primary and secondary nitrogen flow rates are 14.4, 0 and 9.9 mmole/s, respectively, the penetration parameter
n = 0.26; (b) the gain dependencies on nl2 at the optical axis and off the optical axis for the same flow conditions as in
(a).
y»cm y, cm
(a) (b)
Fig. 5. The gain and temperature distributions across the flow for nozzle No. 1 (transonic injection), the chlorine,
primary nitrogen and iodine flow rates are 14.8, 15.2, and 0.25 mmole/s, respectively; (a) overpenetrated jets, the
penetration parameter n = 0.18 and the secondary flow rate is 12.6 mmole/s; (b) underpenetrated jets, n = 0.12; the
secondary nitrogen flow rate is 6.4 mmole/s.
30 Proc. SPIE Vol. 4631

1
0.8
0.6
0.4
0.2
0
-0.80 -0.64 -0.48 -0.32 -0.16 0.00 0.16 0.32 0.48 0.64
y, cm
Fig. 6. Normalized gain g(y)/gmax and iodine atoms molar fraction x\ (>0 / {z\ )max across the A°w for nozzle No. 1
(transonic injection) and the same flow conditions as in Fig. 4 and /7l2 = 0.23 mmole/s.
■0.75 4.60 4.45 4.30 4.15 0.00 0.15 0.30 0.45 0.60
y, cm
•0.75 -0.60 -0.45 -0.30 -0.15 0.00 0.15 0.30 0.45 0.60
y, cm
(a) (b)
Fig. 7. The gain distribution across the flow for nozzle No.l (transonic injection) with opened (a) and closed (b) leak downstream of the cavity; (a) the chlorine, primary and secondary nitrogen flow rates are 11.8, 0, and 4.1 mmole/s, respectively; (b) the chlorine, primary and secondary nitrogen flow rates are 14.3, 0, and 4.9 mmole/s, respectively. For
both opened and closed leak the penetration parameter FI is the same (0.19).
Proc. SPIE Vol. 4631 31

-0.75 -0.60 -0.45 -0.30 -0.15 0.00 0.15 0.30 0.45 0.60
V, cm y i cm
(a) (b)
Fig. 8. The temperature distribution across the flow for nozzle No.l (transonic injection) with opened (a) and closed (b) leak downstream of the cavity and the same flow conditions as in Fig. 7.
-4- nh s 0.287 mmole/s
-m~ nh = 0.334 mmotel*
-0.75 -0.60 -0.45 -0.30 -0.15 0.00 0.15 0.30 0.45 0.60
y ,cm
(a) (b)
Fig. 9. The gain distributions across the flow for different values of n\2 and closed leak for nozzles No. 2 (a) and 3 (b)
(supersonic injection); (a) the chlorine, primary and secondary nitrogen flow rates are 15.1,0 and 12.7 mmole/s, respectively; (b) the chlorine, primary and secondary nitrogen flow rates are 15, 0 and 20.2 mmole/s, respectively.
32 Proc. SPIE Vol. 4631

Fig. 10. Normalized gain g(y)/gmax and iodine atoms molar fraction x\ (y) / {%\ )max across the flow for nozzle No .3
(supersonic injection) and the same flow conditions as in Fig. 9b and n\2 - 0.39 mmole/s.
Proc. SPIE Vol. 4631 33

Chemical generation of atomic iodine for COIL
Otomar Spalek*ab, Vft Jirasek3,b, Jarmila Kodymova3, Miroslav Censky3, Ivo Jakubec*b
aInstitute of Physics, bInstitute of Inorganic Chemistry, Academy of Sciences of the Czech Rep., Czech Republic
ABSTRACT
A method of the chemical production of atomic iodine aimed for application in COIL was studied experimentally. The
method is based on chemical generation of chlorine atoms and their subsequent reaction with hydrogen iodide. Effects
of initial ratio of reactants and the way of their mixing were investigated and interpreted by means of the developed
model of the reaction system. In optimum conditions, the yield of iodine atoms, related to HI, attained 70 - 100 %.
Keywords: atomic iodine, atomic chlorine, chemical oxygen-iodine laser, COIL,
1. INTRODUCTION
In conventional COIL systems, the energy of 4-6 molecules of singlet oxygen, CL^Ag), is consumed to dissociate one
iodine molecule to iodine atoms
I2 + n 02(1Ag) —> 2 I + n 02(3Zg) n = 4 - 6 (1)
In the case of another source of atomic iodine, this energy might be utilized for laser pumping. It was estimated that a
production of atomic iodine without participation of singlet oxygen could increase a laser power by 25 %} Molecular
iodine as a precursor of iodine atoms in COIL introduces further drawbacks like a very fast quenching of excited iodine
atoms by iodine molecules
I(2P1/2) + I2 —» I(2P3/2) +12 k2= 3.5 x 10'11 cm3 s'1 (2)
or technical problems connected with evaporation of solid or liquid iodine and supplying iodine vapor into the laser
mixing region. To avoid the process (1), methods of microwave discharge pre-dissociation of iodine molecules,“ or
dissociation of alkyliodides by electrical discharge3 were investigated up to now. We proposed a method of chemical
generation of atomic iodine that fit to COIL conditions.4,5 In this paper, results of experimental investigation are
presented.
2. DESCRIPTION OF REACTION SYSTEM
The proposed method of chemical generation of atomic iodine in COIL takes advantage of the knowledge gathered
during investigation of chemical HC1 and HC1/C02 transfer lasers.6 It is based on a two-step process. In the first step,
atomic chlorine is formed by the reaction of chlorine dioxide with nitrogen oxide, in the second step chlorine atoms
react with gaseous hydrogen iodide producing atomic iodine.
* E-mail: [email protected]: phone +420 2 66052603; fax +420 2 86890527; Na Slovance 2, 182 21 Prague 8; Czech Republic;
**E-mail: [email protected]; 250 68 Rez, Czech Republic
34
Gas and Chemical Lasers and Intense Beam Applications Ilf, Steven J. Davis, Michael C. Heaven, Editors, Proceedings of SPIE Vol. 4631 (2002) ©2002 SPIE • 0277-786X702/$ 15.00

2.1 Generation of chlorine atoms
The fast exothermic reaction of gaseous chlorine dioxide with nitrogen oxide
C102+ 2 NO Cl + 2 N02 (3)
is employed to generate Cl atoms. It proceeds as a branched chain reaction consisting of the following steps
C102+ NO -4 CIO + N02 fct = 3.4xl0'13cmY' (4)
CIO + NO -4 Cl + N02 k5= 1.7xlO‘ue<120/T) cmV1 (5)
Cl + C102 -4 2 CIO k6 = S^xlO^cmY1 (6)
Reaction (6) is the chain-branching step since there is a net production of one chain carrier. The main reaction product
is atomic chlorine for the initial NO : C102 ratio equal to 2 : 1, or CIO radicals for the ratio 1:1, respectively. For a fast
and efficient course of the above process, the chain carriers Cl and CIO must not be excessively depleted by other
processes. The most important loss processes for both Cl and CIO are the termolecular reactions with nitrogen dioxide,
N02, which is an unavoidable and stable by-product of the reactions (4) and (5)6,7
Cl + NO, + He —4 C1N02 +He k-i = 7.2 x 10 31 cmV1 (7)
C1N02+C1-4C12 + N0, fc8= 3.0 x 10'u cmV1 (8)
CIO + N02 + He -4 NOjCl + He k9= 1.0 x 10'31 cmV1 (9)
2.2. Generation of iodine atoms
Iodine atoms are generated by the very fast exothermic reaction of chlorine atoms with hydrogen iodide
Cl + HI —» HC1 (HC1*) + I(2P3/2) + 132.5 kJ/mol kl0 = 1.64 x 10¹⁰ cmV (10)
In this reaction, up to 70 % of the reaction exothermicity is transferred into vibrational energy of HC1* molecules.6
In the case of atomic iodine generation in the stream of singlet oxygen, iodine atoms will be excited in the reaction
I(2Pj/2> + 02('Ag) I(2P1/2) + 0,(3Zg) ku = 7.6 x 10⁻¹¹ cm's'1 (11)
Besides this process, recombination of iodine atoms into molecules takes place in termolecular reaction with helium
fee = 3.8xlO'33 cmV1), and molecular iodine fe = 3.7xlO'30 cmV1), respectively. The most important loss process for
atomic iodine, owing to a high concentration of N02 in the reaction mixture, is the reaction with nitrogen dioxide
I + N02 + He —4 IN02 + He kn= 1.4x 10‘31cmV‘ (12)
followed by
I+INO,-4 I2 + N02 &13 = 8.3 x 10'11 cmV1 (13)
The modeling neglecting a limited mass-transfer rate showed6'7 that simultaneous injection of HI, C102 and NO is
characterized by exhausting Cl atoms from the reaction mixture by the extremely fast reaction with HI, which results in
deceleration of the chain reaction (3). Admixing of hydrogen iodide at a certain distance downstream from the mixing
point of C102 and NO was found to be more effective for atomic I production.7 A partitioning of NO flow between two
injectors was proposed because it could also diminish a loss of produced chlorine atoms6. An optimum yield of iodine
Proc. SPIE Voi. 4631 35
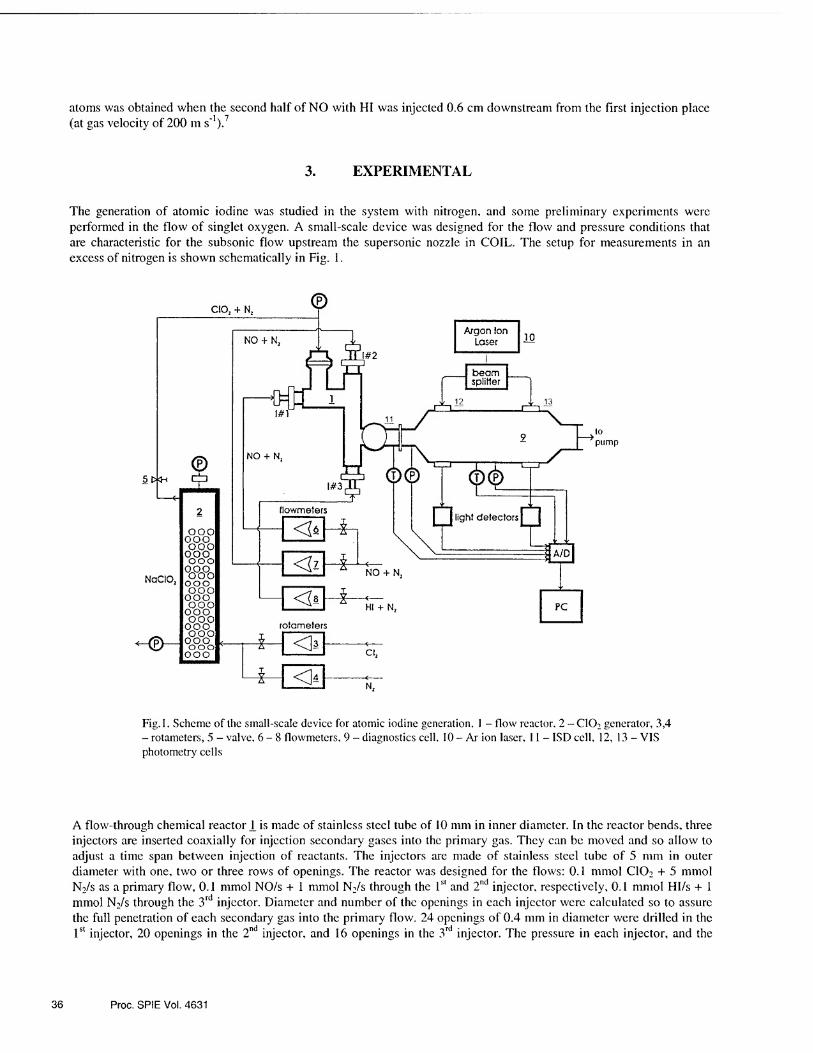
atoms was obtained when the second half of NO with HI was injected 0.6 cm downstream from the first injection place
(at gas velocity of 200 m s'1).7
3. EXPERIMENTAL
The generation of atomic iodine was studied in the system with nitrogen, and some preliminary experiments were
performed in the flow of singlet oxygen. A small-scale device was designed for the flow and pressure conditions that
are characteristic for the subsonic flow upstream the supersonic nozzle in COIL. The setup for measurements in an
excess of nitrogen is shown schematically in Fig. 1.
5t*H
NaCIO,
HEH
ooo OQO c>cIP ooo ooo ooo ooo
OOO AOO ooo ooo ooo ooo ooo oop ooo ooo ooo
rotameters
4— <]3 Cl,
4- <U N,
to pump
Fig.l. Scheme of the small-scale device for atomic iodine generation. 1 - flow reactor, 2 - C102 generator, 3,4 - rotameters, 5 - valve, 6-8 flowmeters, 9 - diagnostics cell 10 - Ar ion laser, 11 - ISD cell, 12, 13 - VIS photometry cells
A flow-through chemical reactor l is made of stainless steel tube of 10 mm in inner diameter. In the reactor bends, three
injectors are inserted coaxially for injection secondary gases into the primary gas. They can be moved and so allow to
adjust a time span between injection of reactants. The injectors are made of stainless steel tube of 5 mm in outer
diameter with one, two or three rows of openings. The reactor was designed for the flows: 0.1 mmol C102 + 5 mmol
N2/s as a primary flow, 0.1 mmol NO/s + 1 mmol N2/s through the 1st and 2nd injector, respectively, 0.1 mmol HI/s + 1
mmol N2/s through the 3rd injector. Diameter and number of the openings in each injector were calculated so to assure
the full penetration of each secondary gas into the primary flow. 24 openings of 0.4 mm in diameter were drilled in the
1st injector, 20 openings in the 2nd injector, and 16 openings in the 3rd injector. The pressure in each injector, and the
36 Proc. SPIE Vol. 4631
pressure before the measuring diaphragm of flowmeters 6-8 matched up the sonic condition in the diaphragm orifice.
The pressure in the reactor was 2-4 kPa (15 - 30 torr) and the gas velocity 140 m s'1.
The primary gas flowing into the reactor contained 4 - 10 % C102. A mixture of NO and nitrogen (10 % NO) was
introduced either through the 1st and 2nd injectors simultaneously, or through one of them only. The mixture of hydrogen
iodide and nitrogen (with 8 - 10 % HI) was mostly introduced through the 3rd injector. Flow rates of reacting gases were
up to 240 JLlmol C102/s, 600 |Llmol NO/s and 500 |Llmol HI/s.
Gaseous chlorine dioxide, the reactant for chlorine atoms formation, was produced on site by a heterogeneous reaction
between gaseous chlorine and sodium chlorite6
Cl2 + 2 NaC102 2C102 + 2NaCl (14)
This process took place in the C102 generator 2, where gaseous chlorine diluted with nitrogen (in the ratio from 1 : 20
to 1 : 50) was introduced at room temperature. The generator made of PVC tube (7 cm or 11 cm of inner diameter, 1 m
long) was filled with either powdered sodium chlorite, or water solution of this salt (40 % w/w). For safety reasons, the
partial pressure of C102 in the system should not exceed 30 torr. Flow rates of chlorine dioxide and residual chlorine
were determined by chemical analysis of the solution obtained by bubbling the exiting gas through a solution of
potassium iodide.
Gas mixture exiting the reactor 1 entered first the optical cell IT used for atomic iodine detection by the Iodine Scan
Diagnostics (ISD) with a tunable diode probe laser.8 The method is based on the sensitive absorption spectroscopy by
means of tunable near infrared diode laser that monitors the gain or absorption for the I(2Pi/2) - I(2P3/2) transition at 1315
nm. The laser frequency is scanned over the 3-4 transition in iodine atom. The probe beam passes through the optical
cell 11 (11 mm in inner diameter and 45 mm of inner length) in the double pass configuration parallel to the gas flow
direction. The optical cell was attached to the reactor without any connecting tube as the lifetime of iodine atoms in the
studied gas mixture is rather short (0.1-1 ms).7 Due to low flow rates of reactants and produced atomic iodine, and
because a sufficient absorption length was needed, the longitudinal gas flow through the cell was chosen. The gain/loss
data were processed with PC on line using a special developed software. Besides this direct method for I atoms
detection, an indirect method was used based on the measuring the concentration of I2 molecules that are formed by
recombination of generated iodine atoms at some distance downstream. The I2 concentration was determined by the VIS
photometry at 488 nm in two optical cells 12, and 13. The argon ion laser with a beam splitter, two silicon photodiodes,
and current amplifiers were used. Signals from these diodes, signals from the gas flow meters 6-8, and temperature
and pressure sensors were processed by AD converter and PC on line. The transport time of gas from the 3rd injector to
the entrance of the cell IT was about 0.2 ms, to the cell exit 0.8 ms, to the axis of the cell 12-6 ms, and to the axis of
the cell 13-93 ms, respectively. The flow rate of produced nitrogen dioxide was evaluated from the change of 488 nm
light absorption after admixing NO into the primary C102 flow (before HI admixing) using the published absorption
cross-section of 2.7 x 10'19 cm2. Gas exiting the diagnostic cell was passed through a scrubber with a bed of solid
potassium hydroxide and through a liquid nitrogen trap. The system was exhausted with a rotary pump (25 m3/h).
A generation of atomic iodine in the flow of singlet oxygen was performed using the same reactor 1, into which a
stream of singlet oxygen was introduced as the primary gas. A small-scale jet-type generator of the cross section 8 x 16
mm with liquid jets counter-flown by gaseous chlorine was described in detail in our earlier paper.9 The 02(1Ag)
concentration was evaluated from 1.27 |Llm emission in a detection cell placed at the generator exit. The gas containing
O^Ag) was introduced into the reactor I as a primary gas, the mixture C102 + N2 was injected through the 1st injector,
NO + N2 through the 2nd injector, and HI + N2 through the 3rd injector.
4. RESULTS AND DISCUSSION
4.1. C102 production A solid NaC102 (50% w/w) was used first for C102 production. The larger C102 generator was filled with 10 dm3 of
powdered chlorite, and 90 jdmol chlorine/s was passed through it. It produced 140 - 150 (Trnol C102/s with the yield of
80 - 85 %, the exiting gas contained further about 15 JLimol/s of residual chlorine. At higher chlorine flow rate, the C102
Proc. SPIE Vol. 4631 37
yield was lower. The C102 yield was also decreasing with "aging” the filler (e.g., only 40 % yield was measured after
two months of intermittent use, even if the sodium chlorite was exhausted from 12 - 15 % only). This phenomenon,
observed also by Arnold6, is probably caused by a layer of sodium chloride on the surface of chlorite crystals. This layer
obviously hinders the chlorine diffusion and slows down the C102 production. In the second arrangement, chlorine-
nitrogen mixture was bubbled through 1 dm3 of chlorite solution (32 %) providing 200 - 250 (Imol C102/s with the
yield 81 - 85 %. The production rate was very stable for about 5 hours, which corresponded to about 90 % utilization of
the chlorite. This process is substantially more effective and reproducible than the former. Some problem could
introduce water in the exiting gas due to the quenching of excited iodine atoms. This effect, however, should not be too
serious, as the contribution of this water is substantially lower than the amount produced by the singlet oxygen
generator.
4.2. Molecular iodine formation Besides molecular iodine formed by recombination of generated I atoms, some I2 molecules may be formed also by
other reactions. One of them is the reaction of residual molecular chlorine (coming from C102 generator) with hydrogen
iodide Cl2 + 2 HI = 2HC1 + I2 (15)
The rate constant of this reaction kl5 = (3.4 ± 1.7) x 10'33 cmV1 was evaluated from our earlier measurements4
performed in the described reactor at room temperature and concentration of reactants (2 + 9) x 1016 cm'3. It was found
by the modeling of the reaction system producing atomic iodine that the reaction (15) may have some effect on the I2
concentration measured in the optical cell 13, but effect of this reaction on the I2 concentration in the cell \2 is
negligible. For this reason, the overall rate of atomic iodine production was calculated from the I2 flow rate evaluated
for the cell 12.
In the next experiments the C102 - HI system was investigated. In the reactor I, the secondary flow of 90 - 340 (drnol
HI/s was injected through the 3rd injector into the primary flow of 200 - 250 (Imol C102/s. No iodine atoms were
detected in ISD cell JJ_, but molecular iodine was measured in both cells J_2 and J_3. From these measurements, the rate
constant of the reaction
C102 + 2 HI —> I2 + CIO + H20 ftl6 = 3.8 x 10 ^ cm6 s'1 (16)
was evaluated. It followed from the modeling of the reaction system C102-N0-HI that the reaction (16) may increase I2
concentration measured in the cell 12. It occurred, however, only in the case of excessive HI flow rate against the rate
of Cl atoms generation, i.e. at HI/C102 > 1, and NO/C102 < 1.
4.3. Atomic iodine generation in an excess of nitrogen
In Fig.2, an example of the time course of flow rates of HI and produced atomic iodine is shown for constant flow of
nitrogen oxide. Atomic iodine was detected both directly by ISD, and indirectly as molecular iodine. It can be seen in
this figure that the rate of generation of atomic iodine increases with increasing flow rate of hydrogen iodide. The flow
rate of atomic iodine detected by ISD corresponded to the overall atomic I flow rate, however, up to about 50 |umol/s
only. With increasing HI flow rate above this limit, the ISD signal remained constant or even fell. This can be explained
so that with increasing HI flow rate the rate of formation of atomic iodine also increases, and the rate of reactions (12),
(13) as well. The local concentration of I atoms drops markedly with the distance from the HI injection,
and the flow rate measured by ISD represents only a fraction of the overall production rate. In these conditions the
concentration gradient of atomic iodine downstream the HI injector may become steeper, and the fraction of the atomic
iodine flow rate detected in the cell J_i to the overall production rate smaller. Fig. 3 shows a calculated course of atomic
and molecular iodine flow rate downstream the HI injection. It can be seen that the average flow rate of atomic iodine in
the ISD cell is substantially lower than the maximum flow rate near the HI injector. In a real system, the concentration
gradient is probably more moderate due to a limited mass transfer rate. Results of modeling showed that the overall
production rate of atomic iodine corresponds better to a double value of the molecular iodine flow rate
38 Proc. SPIE Vol. 4631

Fig.2: Time course of HI flow rate (-), rate of formation of atomic iodine detected by ISD (—★—), and visible photometry
in the cells 12 ( o )andl3( • ), respectively. Total pressure 2.1 kPa, 245 pmol ClO/s and 2 mmol N2/s
in the primary flow, 150 pmol NO/s through the 1st injector,
150 pmol NO/s through the 2nd injector, d{ 2=38 mm,
d^ =3.7 mm, d, T =10 mm 2-3 3-ISD
Fig.3: Calculated course of atomic and molecular iodine flow rate
on the distance from the 3rd injector at gas velocity 140 m/s,
220 pmol ClOys in primary flow, 205 pmol NO/s (2nd injector)
and 220 pmol HI/s (3rd injector), d2 3= 3.7 mm, d3 ISD= 11 mm.
measured in the cell 12. It is valid, however, only in he case that the contribution of the reaction (16) to the I2
concentration can be neglected.
In the next experiments, approximately the same overall amount of NO was injected into the primary flow of chlorine
dioxide, but in a different way. Nitrogen oxide was introduced either through 1st or 2nd injector, or through both
injectors simultaneously (see Tab.I).
Table I
Effect of the way of NO injection on atomic I production measured by ISD (n/SD) and VIS photometry (n^5). Primary flow
220 pmol C102/s, distance between injectors: di.2- 30 mm, d2_3= 3.7 mm, and to ISD cell JT: d3_ISD = 20 mm.
nNo (1stinj.). ^no (2ndinj.), nm (3rd inj.). nI > TVI3 ni ,
pmol /s pmol /s pmol /s pmol /s pmol /s
320 0 100 0 18
150 150 100 50 80
0 330 100 82 98
When all NO was introduced through the 1st injector, most of Cl atoms were lost (by reactions (7) - (9)) before mixing
with HI, which resulted in a low production of atomic iodine. A medium atomic iodine production was attained when
NO was introduced through both 1st and 2nd injector simultaneously. Results of mathematical modeling of this system
show (Fig. 4) that mostly CIO radicals are formed downstream the first injector (by the reaction (4)), and Cl atoms are
generated downstream the second injector (by the non-chain mechanism). In this case, the HI injector was placed as
close to the 2nd NO injector as possible so that a very small proportion of Cl atoms sufficed to be recombined in
Proc. SPIE Vol. 4631 39

Fig.4: Calculated flow rate of reactants and products at gas
velocity 140 m/s, 200 jamol ClO^/s in primary flow,
150 pmol NO/s (1st injector), 150 pmol NO/s (2nd injector)
and 100 pmol HI/s (3rd injector), d^= 38 mm. d^ = 3.7 mm.
Fig.5 : Time course of NO flow rate through thr 2nd injector (.)
and HI flow rate through the 3rd injector (-), rate of formation
of atomic iodine detected by ISD in the cell jd (—★—) and visible photometry in the cell ]2 ( o ), respectively. Total pressure 2.1 kPa, 220 pmol ClO/s and 2 mmol N^/s
in the primary flow, d{ ,= 38 mm, d^ = 3.7 mm, d? ISD = 10 mm.
reactions (7) - (9). This figure also shows that only a small fraction of I atoms can be detected by ISD cell. In a real
system, this fraction may be higher due to a limited mass transfer rate that extends the region of iodine atoms further
downstream. It was also proved experimentally that the rate of I atoms production did not depend on the distance
between the 1st and 2nd injector (in the range of 8-21 mm). This is in accordance with the calculated high stability of
CIO radicals in this region (see Fig.4).
The highest yield of atomic iodine (measured by both methods) was achieved when all NO was injected only 3.7 mm
upstream the HI injector. It means that the time span of 27 |is between 2nd and 3rd injector, respectively, is sufficient for
an effective production of chlorine atoms formed by the chain mechanism of the reaction (3). This is in a good
agreement with the time span of 35 JLls system between the HI injection and the maximum concentration of Cl atoms
which was obtained by the modeling (see Fig. 4 in our previous paper7).
In the next series, effects of distances between injectors on atomic iodine production were studied (see Tab. II).
Table II
Effect of distance between injectors, (d), on atomic I flow rate measured by ISD (n!ISD) and VIS photometry (n^5). Primary flow 240
jamol C102/s, 1st injector: 220 jamol NO/s, 2nd injector: 220 (amol NO/s, 3rd injector: 100 (imol HI/s.
di-2* d2-3. d3.cc!! 11’ -TT5H-
nI , -“VT5
nl *
mm mm mm jamol /s jamol /s
9 23 20 5 15
37 3.7 20 20 54
37 3.7 11 40 55
This data proved that diminishing the distance, d2.3, between the second NO injector and HI injector is favorable (in
spite of the longer distance between 1st and 2nd NO injection) due to a reduced loss of chlorine atoms. A diminishing of
the distance between HI injection and ISD cell JJ_ resulted in higher concentration of I atoms measured in this cell even
40 Proc. SPIE Vol. 4631

though the overall rate of I generation remained unchanged. It can be explained by a lower loss of I atoms in reactions
(12), (13). This result can also explain a very low ISD signal of atomic iodine measured during our initial experiments,
when the ISD cell was connected with the reactor by means of a 4 cm long tube.
Another example of the measured time course of reactants and atomic iodine flow rate is shown in Fig. 5. This figure
documents effects of HI and NO flow rate, respectively, on the production of atomic iodine. In accordance with the
above results, a lower rate of I production was measured in the region a, when NO was introduced by the first and the
second injector simultaneously.
Fig. 6.: Overall flow rate of atomic iodine (in cell 12) on HI flow rate. NO flow rate: 205 pmol/s ( * ), 330 pmol/s ( o ), 440 pmol/s ( • ), 560 pmol/s ( ^ ), other conditions as in Fig.5.
In the next regions, with NO introduced through the
second injector, the overall rate of atomic iodine
production was higher at lower NO/C102 ratio. This is
more obvious from the dependence of the production
rate of I atoms on HI flow rate plotted for different NO
flow rate (see Fig.6).
For N0/C102 ratio equal to 1 or 1.5, the yield of atomic
iodine was nearly 100 % (related to HI). At higher
NO/CIO2 ratio (2 and 2.6) the yield was substantially
lower (70 and 45 %, respectively). This effect could be
explained by different mechanism of atomic chlorine
production in both experimental conditions. At
NO/CIO2 > 2, chlorine atoms are formed very fast by
the chain branching mechanism (4) - (6) and still
before mixing with HI may be partly lost by the fast
reactions with nitrogen dioxide (eqs.(7), (8)). In the
case of the ratio NO/C102= 1, more stable radicals CIO
are formed, which are in equilibrium with Cl atoms
and ClOO radicals6
CIO + CIO <=> Cl + ClOO
(17)
This equilibrium is strongly shifted to the left (/ci7 = 2.8
x 10'14 cm3s _1 and &_17 = 1.0 x 10 11 cm3s _1). In the
presence of HI, chlorine atoms are consumed in the
very fast reaction (10), and further chlorine atoms are produced by the reaction (17). Excessive ClOO radicals then also
provide Cl atoms in the reaction6
ClOO + He Cl + 02 + He kis = 1.34 x 10¹⁴ cmV1 (18)
The modeling of this system showed that the atomic chlorine production by the chain reaction (3) (at NO/C102 = 2)
followed by atomic iodine formation (eq.(10)) proceeds much faster than the non-chain process through the reactions
(4), (17), (18), and (10). In a real system, where the mixing of Cl atoms with HI occurs in a limited rate only, the second
reaction path may be more effective because of lower loss of atomic chlorine in reactions (7) and (8). These loss
processes proceed mostly in the regions with insufficient HI supply. The developed one-dimensional model (assuming
an instantaneous mixing of reactants) of the studied reaction system, however, did not confirm quantitatively the
observed effect of NO/C102 ratio on the atomic iodine production.
First experiments with atomic I generation in the flow of singlet oxygen are under way so that the preliminary results
will be presented at the conference only.
4.5. Application possibilities of the method in COIL
The method of atomic iodine generation above described is planned to be applied in COIL provided that results of the
study performed in the flow of singlet oxygen will be promising. Owing to a relatively short lifetime of iodine atoms in
the reaction mixture (0.1 - 1 ms) at pressures typical for the subsonic part of COIL (a few kPa), an application of the
proposed process is anticipated either very close to the supersonic nozzle, or with transonic mixing of reactants.
Proc. SPIE Vol. 4631 41

5. CONCLUSIONS
A method of the chemical production of atomic iodine, based on chemical generation of chlorine atoms and their
subsequent reaction with gaseous hydrogen iodide, was studied experimentally. It is aimed to be applied it in the COIL
operation. The method is.
Effects of initial ratio of reactants and the way of their mixing were studied and interpreted by means of the developed
model of this reaction system.
In optimum conditions, the yield of atomic iodine production was rather high, from 70 to 100 % (related to C102 or HI).
The proposed process of atomic I generation is assumed to be applied in the supersonic COIL either very close to a
supersonic nozzle, or with transonic mixing of reactants. It may save a significant fraction of singlet oxygen and so
increase the laser efficiency.
ACKNOWLEDGMENTS
This work was supported by the USAF European Office for Research and Development (EOARD), and the Grant
Agency of the Czech Republic. The authors thank to Dr. G. Hager from the USAFRL for his encouragement in this
work and the AFRL for lending the diode probe laser diagnostics.
REFERENCES
1. E. Endo, D.Sugimoto, H. Okamoto, K. Nanri, T. Uchiama, S. Takeda, T. Fujioka, “Output Power Enhancement of
a Chemical Oxygen-odine Laser by Predissociated Iodine Injection”, Jpn. J. Appl. Phys. 39, pp. 468-474, 2000.
2. M. Endo, M. Kawakami, S. Takeda, F. Wani, T. Fujioka, “Output Power Enhancement by the Injection of
Dissociated Iodine in Supersonic Chemical Oxygen-Iodine Laser”, Proc. SPIE} Vol. 3612, pp.56-61, 1999
3. V.S. Pazyuk, N.P. Vagin, N.N. Yurishev, “Repetitively Pulsed Chemical Oxygen-Iodine Laser with a Discharge
Generation of Atomic Iodine”, Proc. SPIE, Vol. 2767, pp. 206-208, 1995
4. O. Spalek, V. Jirasek, J. Kodymova, I. Jakubec, M. Censky, “Preliminary experimental results on chemical
generation of atomic iodine for COIL”, Proc. SPIE, Vol. 4184, pp. 111-115, 2000 5. V. Jirasek, O. Spalek, J. Kodymova, „Modeling of chemical generation of atomic iodine for chemical oxygen-
iodine laser“, Proc. SPIE, Vol. 4184, pp. 103-106, 2000 6. J. Arnold, K.D. Foster, D.R. Snelling, R.D. Suart, “A Purely Chemical HC1 Laser Employing Transverse Flow”,
IEEEJ. Quant ElectronQE-14, pp. 293-302, 1978.
7. V. Jirasek, O. Spalek,, J. Kodymova, M. Censky, “Chemical generation of atomic iodine for chemical oxygen-
iodine laser. I. Modelling of reaction systems”, Chem. Phys., 269, pp. 167-178, 2000
8. R.F. Tate, B.S. Hunt, C.A. Helms, K.A. Truesdell, G.D. Hager, “Spatial Gain Measurements in a Chemical
Oxygen Iodine Laser”, IEEE J. Quant. Electron., 31, pp. 1632-1636, 1995
9. J. Kodymova, O. Spalek, “Performance Characteristics of Jet-type Generator of Singlet Oxygen for Supersonic
Chemical Oxygen-Iodine Laser”, Jpn. J. Appl. Phys., 37, p. 117-121, 1998
42 Proc. SPIE Vol. 4631

Modeling of the chemical generation of atomic iodine in a chemical oxygen-iodine laser
Vit Jirasek*, Otomar Spalek, Jarmila Kodymova, and Miroslav Censky
ABSTRACT
The mathematical modeling of reaction systems for chemical generation of atomic iodine is presented. This process can
be applied in the chemical oxygen-iodine laser (COIL), where it can save a substantial part of energy of singlet oxygen
and so increase the laser output power. The parametric study of the production of atomic fluorine and subsequently
atomic iodine in dependence on the pressure and dilution with inert gas was made. The calculation of the interaction
between produced atomic iodine and singlet oxygen was made with four different mixing/reacting schemes.
Keywords: chemical oxygen-iodine laser, atomic iodine, modeling, gas reactions
1. INTRODUCTION
In conventional COIL systems, iodine atoms in the ground state, I(2P3/2), are formed from molecular iodine dissociated
by the energy of singlet oxygen, 02(1Ag). The using of atomic iodine instantly prepared in other way can substantially
increase the chemical efficiency of the laser. Up to now, methods of microwave discharge pre-dissociation of molecular
iodine1, and discharge dissociation of alkyliodides2 were tested to generate atomic iodine for COIL.
We proposed a method of chemical generation of atomic iodine for COIL based on the reaction of hydrogen iodide with
chemically generated atomic fluorine or chlorine.3,4 Atomic iodine produced in this way can then undergo the energy
transfer from singlet oxygen contained in the gas flow. Because the reaction of hydrogen iodide with both atomic
fluorine and chlorine is very fast, the chemical efficiency of atomic iodine production is determined by the efficiency of
the preparation of atomic fluorine (in reaction F2 + NO) or chlorine (C102 + NO). To estimate the efficiency of these
processes, a simplified one-dimensional (1-D) kinetic model was proposed and numerically solved for both reaction
systems.4 In this modeling, a constant gas velocity and constant total enthalpy were assumed, and the diffusion of
species and heat transfer along the flow were neglected. The calculations were performed for the conditions that
correspond with the subsonic channel, i.e., upstream the nozzle throat, in the supersonic COIL device operated in our
laboratory: the total pressure of 4 kPa, temperature of 300 K, velocity of 200 m/s. The results following from this
modeling showed that atomic fluorine is produced with a rate that is too slow to realize this process directly in the
subsonic channel. More promising results were obtained by the modeling of the reactions with atomic chlorine,
resulting in a sufficient production rate of atomic iodine. However, it is a disadvantage of this process, that the
produced atoms are rapidly recombinated in the presence of N02. The results of 1-D modelling of this system4 are only
in some respect in quantitative accordance with the results from the experiments.3,5
The new results of modeling of the production of atomic iodine via atomic fluorine are presented in this paper,
including the dependence on the initial pressure and dilution with the inert gas. The results of calculations of the
interaction between produced atomic iodine and singlet oxygen are also included, considering four different
mixing/reacting schemes.
Correspondence: e-mail: [email protected]; phone 420-2-66052603; fax 420-2-6880729; Department of Gas Lasers, Institute of Physics of Academy of Sciences, Na Slovance 2, 182 21 Prague 8, Czech Republic
Gas and Chemical Lasers and Intense Beam Applications ill, Steven J. Davis, Michael C. Heaven, Editors, Proceedings of SPIE Vol. 4631 (2002) © 2002 SPIE • 0277-786X/02/$15.00 43

2. DESCRIPTION OF REACTION MECHANISM
Fluorine atoms are produced by the fast exothermic reaction (A//0298 = -77 kJ/mol) of molecular fluorine with nitrogen
oxide6'8
F2 + NO —> FNO + F, kx = 7 x 10*1 V1150rrcm3 molec'1 s'1 . (1)
The yield of F atoms is substantially influenced by several consecutive reactions, mainly the termolecular reactions of F
atoms with NO and other molecules present in the reaction system (e.g., helium used as a diluent)9,10
F + NO + NO -> NOF (NOF*) + NO , fc2= 1.7 x 10'31cm6 molec'2 s'1, (2)
F + NO + He NOF (NOF*) + He , k3= LI x 1031 cm6molec'2s'1. (3)
Nitrosyl fluoride, NOF, is formed either in the ground or electronically excited state. The reactions (2) and (3) are
also very exothermic (for NOF ground state, A//°298 = -229.4 kJ/mol). The three-body recombination of F atoms
by the exothermic reaction (AH°298 = -158.3 kJ/mol)10
p + F + He F2 + He , fc4= 5.3 x 10'34 cm6molec'2 s'1, (4)
cause another loss of produced fluorine atoms. The 20-30 % efficiency of F atom production in the reaction system
including reactions (l)-(4) predicted by Helms et al.n, corresponded well with their experimental results. Hoell et ai
published the calculated F yield of 18 %.
Atomic iodine is generated by the fast reaction (Af/°298= -261.7 kJ/mol) of F atoms with hydrogen iodide13,14
F + HI HF (HF*) + I , Jfc5 = 1.51 x 10'10e^°8,3rr cm3 molec'1 s'1. (5)
The energy liberated in this process is partly stored in vibrationally excited HF molecules. The contribution of HF can
exceed 56 %, according to Jonathan et al/s study.13 The exoergicity of the reaction (5) may suffice even to form
electronically excited iodine atoms, I(2Pi/2) with the branching ratio that was theoretically estimated15 up to the value of
0.5, however the experimental value obtained by using a high resolution Fourier transform spectrometer 4 did not
exceed the value of 0.005. The resultant efficiency of I atom production is influenced (in addition to the above loss-processes of F atoms) by the
reactions which consume I atoms, the termolecular recombination of I atoms in the presence of buffer gas (He) and
molecular iodine16,17
I + I + He -> I2 + He , k6= 3.8 x 1033 cm6 molec'2 s'1, (6)
I + i + i2 2 I2, kj = 3.7 x 10~30 cm6 molec'2 s'1. (7)
The unreacted nitrogen oxide may cause the loss of I atoms by the mechanism18
I + NO + He —> INO , k$ = 5.5 x 10"33 cm6 molec'2 s'1, (8)
I + INO —> I2 + NO , k9 = 2.6 x 10'10 cm3 molec'1 s'1, (9)
while the reaction of atomic iodine with unreacted fluorine is slow
I + p2 —> IF + F, fc10= 1.9 x 10*14cm3 molec'1 s'1. (10)
Molecular iodine produced in the processes (6)-(9) can also react with F atoms to form atomic iodine17
+ IF + I, kn = 4.3 x 10'10cm3molec’1 s"1, (11)
where IF is formed in both ground and excited states.
44 Proc. SPIE Vo!. 4631

3. DESCRIPTION OF MATHEMATICAL MODEL
One-dimensional numerical model used in our previous paper4 supposed the constant velocity of gas and consequently
constant volume flowrate. However, this assumption is not valid in the case of highly exothermic reactions where
temperature significantly rises along the reaction coordinate, the mixture expands and accelerates. The species
concentrations are changing not only due to chemical reactions but also due to increase in volume flowrate.
In the presented model, the species molar flowrates were calculated according to the differential equation
dri¬ ll—-
dx V- k;
7*1,; n (12)
where u — V / A is the gas velocity, x the reaction coordinate, ri -, rik, ril are the molar flowrates of species jXU is
the rate constant of the i-th reaction, *4, vt are the exponents of the kinetic equation and A is the cross-section of the
reaction channel.
The volume flowrate V was evaluated according to the ideal gas equation of state:
s V = -1- . (13)
P
Temperature and pressure changes were calculated by the simultaneous solving of the equation for the total enthalpy
conservation
d_
dx +
1 — pmu 2
2 \
J Z(-*"+f
\dh, (14)
where C . and h® are the molar heat capacity and enthalpy of formation of species j and pm is the molar density of
mixture, and the dynamic equation
dp + Mpmudu = 0 (15)
where M is the molar weight.of the mixture.
This set of equations was numerically solved using the fourth-order Runge-Kutta routine.
4. MODELING OF F AND I ATOMS PRODUCTION. RESULTS AND DISSCUSION.
4.1 Production of F atoms The production of F atoms was modeled including the reactions (l)-(4) for several values of initial pressure, helium
dilution and initial concentration ratio [NO]:[F2]. The results are summarized in Tab. 1. It is obvious, that the
conversion of F2 molecules to F atoms rapidly decreases and the reaction path becomes shorter with increasing of the
initial pressure. The conversion substantially declines with increasing the ratio of rates of reactions (2), (3) and (1):
r2 + r3 _ J^FjNOf + k.iFjNOjHe]
n ~ kiFjNO] (16)
Proc. SPIE Vol. 4631 45

Tab. 1. Production of F atoms. 1}F - n(F)maJn(F2)0 is the maximum conversion of F2 to F, 7, p, and rare values of temperature, pressure and reaction time calculated at the place of maximum conversion.
[NO]:[F2] IB [He]:[F2] tIf T (K) p (kPa) x (ms)
2 1 23 0.70 490.6 1.44 4.0
2 2 23 0.50 514.3 2.55 1.7
2 4 18 0.41 586.7 4.64 0.6
1 4 23 0.34 517.8 4.43 3.2
2 4 23 0.35 536.6 4.48 ■M
2 4 41 0.24 442.4 4.23
2 10 23 0.20 564.9 10.27 0.2
This ratio becomes higher with increasing both, the pressure and helium dilution. The conversion is not influenced by
the initial ratio [NO]:[F2], but significant amount of NO remains unreacted at [NO]:[F2] > 1. The effect of residual
content of F2 or NO on the I* quenching is discussed in Sec. 5.
The expression (16) depends also on the temperature. The constants k2, k3 are taken as temperature independent, but kj
increases with temperature (eq.(l». Consequently, as the mixture temperature rises due to the exothermic reactions, the
production rate of F atoms increases too. The calculated increase in temperature (AT = 140 — 260£) probably results
also in the increase of the rates of reactions (2) and (3). The temperature dependence of these reactions was not
measured, but is supposed to be relatively small.9 The concentration profiles for the conditions typical for the subsonic part of the COIL (4 kPa) are shown in Fig.l.
7
time, ms
Fig. 1. Fluorine atoms production. Time development
of concentrations of different species. Initial
concentration ratio [FJ: [NO]: [He]=1:2:23,
initial pressure 4 kPa, initial temperature 300 K.
time, ins
Fig. 2. Iodine atoms production. Time development of
concentrations of different species. Initial concentration ratio [FJ:[NO]:[HI]:[He]=l :2:1:36, initial pressure 4 kPa,
initial temperature 300 K.
46 Proc. SPIE Vol. 4631

The conversion does not overcome 35 %. In accordance with the previous modeling4, it can be concluded that the
production of F atoms is too slow under these conditions. Then, assuming the gas velocity of 200 m/s, HI will have to
be introduced into the flow channel at the 20 cm distance from the F2/NO injection.
The other possibility is to produce F atoms in a separate reactor and then to introduce them together with HI into the
02(!Ag) flow, as described in Sec. 5.1.
4,2 Production of atomic iodine In recent modeling4 it was found, that simultaneous admixing of F2, NO, and HI can give promising results in atomic
iodine production efficiency. In this case, hydrogen iodide reacts instantly with formed F atoms, and reduces the rate of
the loss reactions (2) and (3). This process was modeled including the reactions (1) - (11) under the assumptions
described in Sec. 3. The results are summarized in Tab. 2.
Tab. 2. Production of I atoms, rp = n(I)mw/n(F2)o is the maximum conversion of F2 to I, T, p, and rare values of temperature, pressure and reaction time calculated at the place of maximum conversion.
[NO]:[F2] Po(kPa) [He]:[F2] m T (K) p (kPa) x(ms)
2 1 9 0,86 1373 1.00 5.5
2 1 18 0.88 976 1.00 5.8
2 1 36 0.89 692 1.00 9.9
1 1 37 0.68 611 1.00 10
2 4 36 0.84 652 4.57 1.5
2 10 36 0.64 642 10.0 0.5
The effect of helium dilution on the conversion of F2 to I atoms is very small on the contrary to the F atoms production.
The conversion is higher by 20% at the initial concentration ratio [NO]:[F2]=2:l against 1:1. The time course of
concentrations for the initial pressure of 4 kPa is shown in Fig. 2. It can be seen that the reaction time for reaching the
maximum conversion is approximately two times longer in comparison with F atom generation. It could be ascribed to
the additional process producing I atoms in reaction (11).
The degree of the conversion of F2 to F atoms (in the system F2+NO), and F2 to I atoms (in the system F2+NO+HI) in
dependence on the initial pressure is shown in Fig. 3. It follows from the comparison of the two dependencies that the
conversion to F atoms rapidly decreases with increasing pressure, while the conversion to I atoms is less pressure
dependent. This is caused by the suppression of the loss reactions (2) and (3), so the ratio (16) is much less pressure
dependent.
The calculated increase in temperature for both, the F and I atoms production is independent on the initial pressure. The
heating of the mixture is, of course, dependent on the dilution by helium. The temperature does not exceed 550 K in the
case of F atoms production and 700 K in the case of I atoms production, if there is a sufficient dilution with inert gas
(the dilution ratio [F2]:[He] = 1:30 corresponds to the amount of helium contained in the COIL primary gas).
It should be noted, that the calculations included only particles in the ground electronic state. The excited particles
NOF*, HF*, and IF are also formed and hence the reaction enthalpy is partly transformed to the excitation energy. The
resulting reaction temperature should be therefore lower then the values presented in Tables 1 and 2.
The results of the modeling of F and I atoms production were used in calculations of the I production when produced
atoms were introduced into the stream of singlet delta oxygen.
Proc. SPIE Vol. 4631 47

5. MODELING OF I* PRODUCTION
Fig. 3. Conversion of F2 to F atoms in the mixture of F^ and NO
(solid symbols) and conversion of F2 to I atoms in the mixture of
F, NO and HI (open symbols) in dependence on the initial pressure.
Helium dilution [FJ:[He] = 1:30.
5.1 Description of reaction conditions
The 1-D modeling of reactions between primary and
secondary gases in COIL_can describe the real three-
dimensional process only approximately and must
include some additional terms which make the
correction on the limited rate of gases mixing.19, 20
Nevertheless, for the first estimation of this process
they can be neglected. Our aim is to compare the
suggested mixing schemes from the kinetic point of
view with a special interest on the lifetime of I
atoms. The reactions between F, HI and CL^Ag) in
the first series and between I and 02(lAg) in the
second series are modelled. The calculations start
from the results of F or I atoms production process
including all reactants and products occurred in the
reactions (l)-(ll) (secondary gas). The initial values
for the primary gas are taken from the typical
composition of the gas exiting the singlet oxygen
generator, i.e:
[02]:[He] = 1:2, [02(1Ag)]:[ 02(3Ig)] = 3:2 and 3 %
of H20. The reactions between O^1 Ag) and I, I2 are
taken from the reference.21
The subsonic mixing conditions include the initial
pressure of 4 kPa and temperature of 300 K and the
supersonic mixing assumes the pressure of 0.5 kPa and temperature of 200 K. The results of F/I atoms production at 10
kPa are used in the case of subsonic mixing and results for F/I atoms production at 1 kPa in the case of supersonic
mixing (see Fig. 4).
The constant temperature was assumed in this modelling, with aim to save the computer time.
The initial concentration ratio of F or I atoms and 02(1Ag) was chosen according to the known optimal ratio [I2]/[02] =
1:50 for COIL operation, i.e.:
[/jo _ 2
[02(‘A)]o 50- N (17)
where N is the number of molecules of 02(]Ag) consumed for the dissociation of one I2 molecule. In the following
calculation, the value N=5 was assumed.
5.2. Results and discussion
5.2.1 F + HI + 02(1Ag) system
Time development of the concentration of iodine I(2P]/2) state at the subsonic conditions is shown in Fig. 5 (solid line).
The concentration rises up to 0.13 ms and then slowly decreases. Assuming the average gas velocity of 200 m/s, the
maximum concentration is attained at a distance of 2.6 cm. Under the supersonic conditions, the excitation rate is very
low (see Fig. 6, solid line). If the supersonic gas velocity of 1000 m/s is assumed, the maximum concentration is
attained at the distance of 1 m.
48 Proc. SPIE Vol. 4631

02|1A) r. I -} -* 0.5 kPa, 200 K
4 kPa. 300 K
I I F HI
a)
02(1A) r, I -^ } 0.5 kPa, 200 K
4 kPa, 300 K
C)
02(1 A) r, I -* -* 0.5 kPa.200 K
4 kPa,300 K
1 d)
Fig. 4.: Different mixing schemes for I* generation: a) the subsonic mixing of F, HI and 02(1Ag), b) the supersonic mixing of F, HI and 02(iAg), c) the subsonic mixing of I and 02(1Ag),
d) the supersonic mixing of I and O^1 Ag)
5.2.2 I + CK^Ag) system
Time development of the concentration of iodine I(2Pi/2) state at the subsonic conditions is shown in the Fig. 5 (dashed
line). The concentration rises up to 0.04 ms and then rapidly falls. Assuming the average gas velocity of 200 m/s, the
maximum concentration is attained at a distance of 8 mm. If the mixing delay is taken into account, the loss of excited
iodine in the subsonic channel should not be serious if the injection is placed right before the nozzle throat.
Under the supersonic conditions, the concentration rapidly rises and attains its maximum value before 0.03 ms, which
corresponds to a distance of 3 cm (see Fig. 6, dashed line). Than the concentration slowly decreases: for example, 80 %
of the maximum value is attained at a distance of 38 cm.
The calculations of the two above mentioned methods were performed with the same initial concentrations of atoms
introduced into the flow channel, F atoms in the first method and I atoms in the second one. However, the energy
transfer from singlet oxygen to atomic iodine is faster then the reaction (5). That is why the maximum concentration of
I(2Pi/2) is higher in the case of I + CS^Ag) system and, on the other hand, its subsequent decrease is faster.
The described process of the production of I atoms brings many new species into the laser mixture, that can quench
produced excited atomic iodine and singlet oxygen as well. According to the known values of rate constants for
quenching of singlet delta oxygen4, the influence of the components coming from atomic iodine production is very
small.
Proc. SPIE Voi. 4631 49
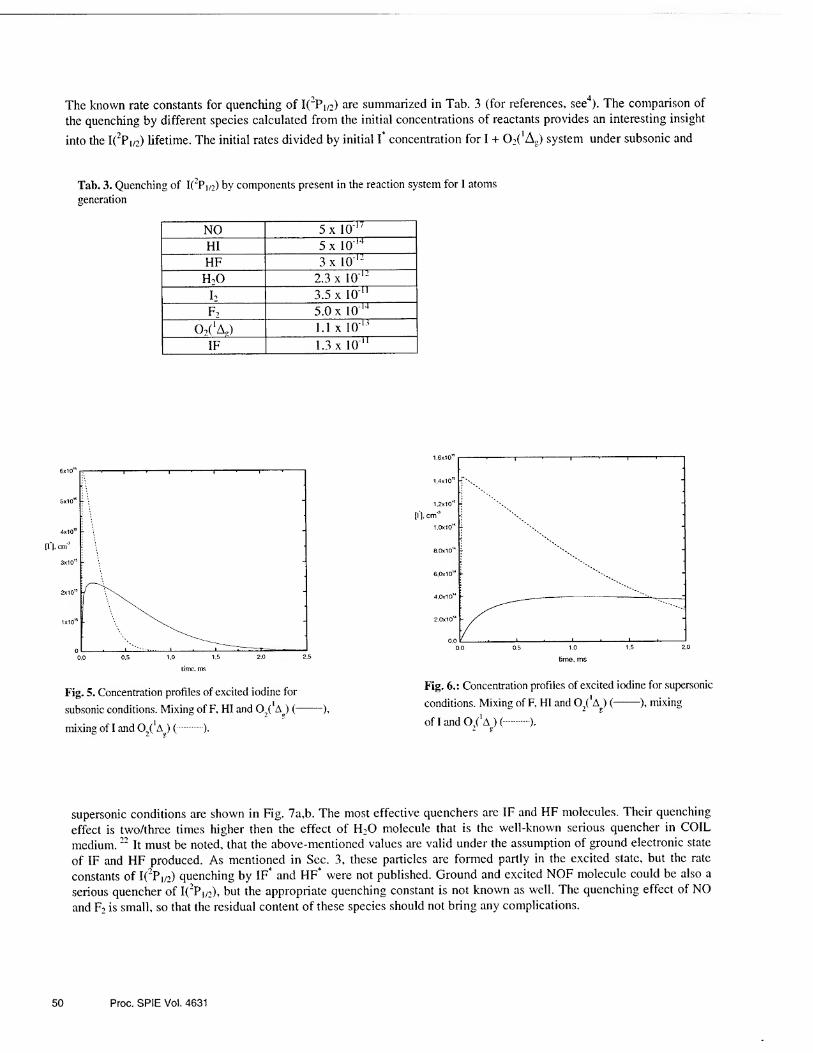
The known rate constants for quenching of I(2Pi/2) are summarized in Tab. 3 (for references, see4). The comparison of
the quenching by different species calculated from the initial concentrations of reactants provides an interesting insight
into the I(2Pi/2> lifetime. The initial rates divided by initial I* concentration for I + 02C Ag) system under subsonic and
Tab. 3. Quenching of I(2P1/2) by components present in the reaction system for I atoms generation
NO 5 x 10'n
HI 5x 10'4 HF 3 x IcF
H20 2.3 x 10
h 3.5 x 10¹¹
f2 5.0 x 10¹⁴
o/A,) 1.1 x HP
IF 1.3 x 10 11
time, ms
Fig. 5. Concentration profiles of excited iodine for
subsonic conditions. Mixing of F, HI and O 2(lA)(-),
mixing of I and O0('Ag) (.).
Fig. 6.: Concentration profiles of excited iodine for supersonic
conditions. Mixing of F, HI and O^A^) (-X mixing
of I and 0.(*A ) (-.). 2 g
supersonic conditions are shown in Fig. 7a,b. The most effective quenchers are IF and HF molecules. Their quenching
effect is two/three times higher then the effect of H20 molecule that is the well-known serious quencher in COIL
medium.22 It must be noted, that the above-mentioned values are valid under the assumption of ground electronic state
of IF and HF produced. As mentioned in Sec. 3, these particles are formed partly in the excited state, but the rate
constants of I(2Pi/2> quenching by IF* and HF* were not published. Ground and excited NOF molecule could be also a
serious quencher of I(2P1/2), but the appropriate quenching constant is not known as well. The quenching effect of NO
and F2 is small, so that the residual content of these species should not bring any complications.
50 Proc. SP1E Vol. 4631

HI NOF ?
a) b)
Fig. 7a,b. I* quenching by different molecules, a) subsonic mixing of I and C^A®),
b) supersonic mixing of I and (^(^Ag)
5. CONCLUSIONS
The detailed 1-D mathematical modeling of the chemical production of atomic fluorine and atomic iodine,
subsequently, was made. The dependencies of the conversion of F2 to F or I atoms on the initial pressure and
concentration ratios were calculated. It was confirmed that the reaction path for F or I atoms production is too long to be
realised directly in the subsonic laser part. In the newly suggested process, F or I atoms are produced in a separate
reactor and they are introduced into the stream of O^Ag). The four different mixing/reacting schemes for reaction
between F, HI and 02(! Ag) in one case and I and 02(! Ag) in the second case were modeled. The supersonic mixing of I
and C^Ag) seems to be the most advantageous process, where atomic iodine is produced separately with good
efficiency and the energy transfer from O^Ag) to atomic iodine is fast at the beginning of the supersonic nozzle. The
other possible processes are the subsonic mixing of F, HI and 02(1Ag) or I and 02(IAg). The supersonic mixing of F, HI
and 02(1 Ag) gives an insufficient rate of I* production.
ACKNOWLEDGEMENTS
This work was supported by the USAF European Office for Aerospace Research and Development (EOARD) and
Grant Agency of the Czech Republic.
REFERENCES
1. E. Endo, D. Sugimoto, H. Okamoto, K. Nanri, T. Uchiyama, S. Takeda and T. Fujioka, “Output power enhancement
of a chemical oxygen-iodine laser by predissociated iodine injection”, Jap. J. Appl. Phys. 39, pp.468-474, 2000.
2. V.S. Pazyuk, N.P. Vagin and N.N. Yury she v, “Repetitively pulsed chemical oxygen-iodine laser with a discharge
generation of atomic iodine”, Proc. SPIE Vol. 2767, pp.206-208, 1995.
3. O. Spalek, V. Jirasek, J. Kodymova, I. Jakubec, and M. Censky, “Preliminary experimental results on chemical
generation of atomic iodine for a COIL”, Proc. SPIE Vol. 4184, pp.111-115, 2000
4. V. Jirasek, O. Spalek, J. Kodymova, and M. Censky, “ Chemical generation of atomic iodine for chemical oxygen-
iodine laser. I. Modeling of reaction systems“, Chem.Phys. 269, pp. 167-178, 2001
Proc. SPIE Voi. 4631 51

5. O. Spalek, V. Jirasek, J. Kodymova, M. Censky, and I. Jakubec, “Chemical generation of atomic iodine for COIL”,
Proc. of this conference (submitted for publication)
6. S. Johnston and H. J. Bertin, “Heat of formation of nitrosyl fluoride”, J. Am. Chem. Soc. 81, p.6402, 1959.
7. C.E. Kolb, “Resonance fluorescence study of the gas phase reaction rate of nitric oxide with molecular fluorine”, J.
Chem. Phys. 64, pp.3087-3090, 1976.
8. T.L. Pollock and W.E. Jones, “Gas phase reactions of fluorine atoms”. Can. J. Chem. 51, pp.2041-2046, 1973.
9. E.G. Skolnik, S.W. Veysey, M.G. Ahmed, and W.E. Jones, “Rate constants for the reaction of fluorine atoms with
nitric oxide in the presence of various third bodies”, Can. J. Chem. 53, p.3188-3193, 1975.
10. P. Kim, D.I.MacLean and W.G. Valance, Abstr. 164th National Meeting Am. Chem. Sc>c.,pp.3188-3193, N.Y., 1972.
11. C.A. Helms, L. Hanko, K. Healey, G. Hager and G.P. Perram, “Generation of high-number densities of iodine
monofluoride in a supersonic flow”, J. Appl. Phys. 66, pp.6093-6097, 1989.
12. J.M. Hoell, F. Allario, O. Jarrett, and R.K. Seals, “Measurements of F2, NO, and ONF Raman cross sections and
depolarisation ratios for diagnostics in chemical lasers”, J. Chem. Phys. 38, pp.2896-2901, 1973.
13. N. Jonathan, C.M. Melliar-Smith, S. Okuda, D.H. Slater and D. Timlin, “Initial vibrational energy level
distributions determined by infrared chemiluminiscence. II. The reaction of fluorine atoms with hydrogen halides”,
Mol. Phys. 22, pp.561-547, 1971.
14. J.P. Sung and D.W. Setzer, “Electronic and vibrational energy disposal in the reactions of fluorine atoms, with
hydrogen bromide and hydrogen iodide”, Chem. Phys. Lett. 48, pp.413-419, 1977.
15. U. Dinur, R. Kosloff, and R.D. Levine, “Analysis of electronically nonadiabatic chemical reactions: An information
theoretic approach”, Chem. Phys. Lett. 34, pp. 199-205, 1975.
16. T.T. Yang, D.A. Copeland, A.H. Bauer, V. Quan, W.E. McDermott, R.A. Cover and D.M. Smith, AIAA 97-2384,
pp.1-28, 1997. 17. P.P. Bemand, M.A.A. Clyne, and R.T. Watson, J.C.S. Faraday Trans. I 69, p.1356, 1973.
18. H.van den Bergh and J. Troe, “Kinetic and thermodynamic properties of INO and IN02 intermediate complexes in
iodine recombination”, J. Chem. Phys. 64, p.736, 1976. 19. B.D. Barmashenko, A. Elior, E. Leibush, S. Rosenwaks, “Modeling of mixing in chemical oxygen-iodine lasers:
Analytic and numerical solutions and comparison with experiments”, J. Appl. Phys. 75, pp.7653-7664, 1994.
20. J. Beranek, K. Rohlena, J. Kodymova, O. Spalek, “A ID kinetic model of COIL applied to experimental data“,
SPIE Vol. 3092, pp.569-572, 1996 21. J. Paschkewitz, J. Shang, J. Miller, T. Madden, “An assessment of COIL physical property and chemical kinetic
modeling methodologies”,, AIAA 2000-2574, pp. 1-16, 2000
22. D. H. Burde and R.A. McFarlane, J. Chem. Phys. 64, p.1850, 1976
52 Proc. SPIE Vol. 4631

Invited Paper
German COIL Efforts: Status and Perspectives
Willy L. Bohn*
DLR Institute of Technical Physics, D-70569 Stuttgart, Germany
ABSTRACT
Historically, COIL research in Germany has started with microwave excitation of an oxygen flow. But soon all efforts
have been devoted to the chemical generation of excited singlet oxygen and have eventually given rise to a supersonic
10 kW class rotating disk driven device. A diode based diagnostic provides data of small signal gain and cavity
temperature which emphasize the role of iodine injection for different penetration conditions. Heat release can lead to
substantially higher temperatures as expected from adiabatic expansion. Power extraction is found to be in good
agreement with theoretical predictions. Alternatively, small scale liquid jet generator experiments show encouraging
60 % efficiency. Besides air defense related applications and a study on space debris removal, results are given which
are pertinent to the decommissioning of nuclear installations. In particular, laser cutting of concrete at 1.3 [im is
demonstrated and theoretically scaled up to relevant power levels.
Keywords: chemical lasers, oxygen, iodine, power extraction, decommissioning
1. INTRODUCTION
Historically, it all started in 1987 with a helium and oxygen gas mixture flowing thru a 2.45 GHz microwave discharge.
At that time the laboratory was heavily involved in different types of electrically excited lasers with special emphasis on
C02 and CO lasers. Therefore, it seemed quite natural to investigate the possibility to electrically excite the oxygen
molecule; an idea that has become very popular, recently. The historic device is shown in Fig. 1. At that time the
efficiency of electrically generating O^A) was so low that no further attempt was undertaken to start real laser
experiments. Encouraged by the results obtained with the chemical excitation
of 02(1A) in the U.S. the decision was taken in Germany to redirect the
research to the chemical excitation as well and to abandon the electric
discharge scheme. From there on all major efforts have been aimed at the
investigation of a 10 kW rotation disk driven device. Major achievements on
that road will be reviewed in chapter 2.1. More recently growing interest has
been given to the liquid jet oxygen generator and its scaling potential as
compared to the rotating disk concept. The second part of this paper addresses
present and future applications. Since most applications require high beam
quality this particular issue will be discussed in chapter 3.1. Subsequently,
three different application areas will be described: the tactical air defense, the
laser supported space debris removal, and the laser decommissioning of Fig. 1. Historic microwave discharge nuclear installations. This also includes a comparison of investment and
in oxygen. . t . , running costs of COIL as compared to its major laser competitors.
2. COIL LASER RESEARCH AND DEVELOPMENT
2.1 Review of German 10 kW class COIL investigations
Most of the work has been concentrated on a rotating disk driven device using a nozzle bank with 20 elements and
subsonic iodine injection1. For base line conditions the laser is operated with a chlorine mass flow of typically 0.5 mol/s
and a He:Cl2 ratio of 3. The Mach number after the supersonic expansion is close to 2. As shown in Fig. 2 the 02H'
molarity and rotation speed of the disk pack have been varied over a wide range and the utilization approaches typically
contact thru: Tel.: 449 711 6862 772; Fax: 449 711 6862 788; E-mail: [email protected]
Gas and Chemical Lasers and Intense Beam Applications III, Steven J. Davis, Michael C. Heaven, Editors, Proceedings of SPIE Vol. 4631 (2002) © 2002 SP1E • 0277-786X/02/$15.00 53

Fig. 2: Utilization as a function of 02H' and rpm (left) and compared to diffusion and reaction limits (right).
90% for optimum operating conditions. On the right
part of Fig. 2 a collection of data points demonstrates
the transition from a diffusion limited to a reaction
limited model as a function of the CbH' molarity in the
BHP. For power optimization one of the most
important issues is the influence of iodine penetration:
the latter basically reflects the ratio of the momentum
of the iodine flow to the main flow. As can be seen in
Fig. 3 the maximum laser output power is obtained
within a narrow range of penetration values at high
singlet oxygen flow rates. This behavior is much more
relaxed at lower singlet oxygen flow rates. The nozzle
bank used in all those experiments is shown on the
right hand side of Fig. 3.
H 1 ii ■ ,1 CIT OjfA) _
♦ 120 mmols E 4k 9 ■ % 1 ■ 160 mmol’S
A 200 mmols —
* 220 mmols R 1 1 i R R ii ■ ■1 1 3 H ■ II 1 ■■
♦
■“ft :: >♦
■ ■ ■ ■ a ■ ■1 n ■ ■■ 13 5 7
penetration
Fig. 3: Laser power as a function of penetration (left); nozzle bank (right).
0 10 20 30 40
flow axis z (mm) flow axis z (mm)
Fig. 4: a) Small signal gain, and b) cavity temperature in flow direction with L = const.
1.3 1.2
1.1
~ 1
10.9
Jo.s ^0.7
°V6 0.5
0.4
0.3
0 10 20 30 40
flow axis z (mm)
0 10 20 30 40
flow axis z (mm)
Fig. 5: a) Small signal gain, and b) cavity temperature in flow direction with He/L = const.
A considerable step in COIL research and
understanding occurred with the advent of more
sophisticated diagnostic tools, in particular the diode
based optical diagnostics as provided by the PSI
Corporation . An appropriate example is given by the
measurements of small signal gain and temperature
along the flow axis. The major goal was to investigate
the impact of the secondary flow by excursion of
parameters with respect to optimum lasing conditions
which will be represented by a full line in the
following figures.
In the first case, we keep the iodine concentration
constant and vary the helium flow rate. Increasing the
latter accelerates the flow and leads to a very
substantial entrainment of the dissociation, and
accordingly, to the small signal gain along the flow
axis as shown in Fig. 4a. On the other hand, decreasing the helium flow rate decelerates the flow
and the small signal gain readily starts with a high
value at the nozzle exit plane but early deactivation
occurs and thus the small single gain decreases
monotonically. Fig. 4b shows how this behavior
translates to the cavity temperature: whereas the fast
flow exhibits a small heat release the slow flow is
governed by a quite substantial heat release and thus
the cavity temperature increases dramatically along
the flow axis and exceeds 230 K 25 cm after the
nozzle exit plane.
In the second case we keep the He/L ratio constant
while changing the iodine flow rate. Increasing the
iodine flow rate leads to a fast dissociation and thus
the small signal gain exhibits highest values at the
nozzle exit plane but sharply decreases thereafter due
to deactivation. This situation reflects a high iodine
penetration. Decreasing the iodine flow rate limits the
small signal gain to rather low values and
characterizes a low penetration situation (Fig. 5a).
54 Proc. SPIE Vol. 4631

18 20 22 24
Water vapor in transport duct and cavity (upper traces); H20 losses (bottom trace).
Fig. 7: Beam pattern for different outcoupling configurations.
Fig. 8: Schematic of outcoupling geometries.
J —calculated results, I Pmax= 10.1 kW !
Accordingly, great heat release occurs for high penetration and
100 E small heat release with temperatures ranging between 190 K
f and 200 K is found for low penetration, as shown in Fig. 5b. « ■o c
~ Another example relates to the water vapor measurement.
| Using the PSI diagnostic water vapor concentration is
| measured in the transport duct prior to the nozzle bank and in
j§ the cavity: the upper curve in Fig. 6 corresponds to the duct
S measurement and the lower curve which is characterized by
g substantial fluctuations corresponds to the cavity measurement.
The fluctuations arise because of the lower signal to noise ratio
obtained in the cavity measurement. At the bottom of Fig. 6 the
d cavity (upper total water vapor losses between duct and cavity positions is
shown as a function of time: they range from about 20 % to
5 % within the measured time interval. This measurement strongly suggests that
water condensation is not negligible during the expansion of the laser active gas.
Power extraction has been studied4 using a variable slit aperture in front of the outcoupling mirror. Fig. 7 shows a two-dimensional burn pattern for three different resonator outcoupling configurations: for a small aperture resonator optically centered at 5 mm from the nozzle exit plane, for a fully opened resonator centered at 17 mm, and for a resonator centered at 29 mm but limited by the downstream cavity structure. A more detailed measurement of the power extraction is obtained by either varying the width of the slit aperture or by translating a constant aperture slit along the 11 ————-———r——1 flow axis. The i.o-- ——-... ■ ■ corresponding geometry 0 9 ■ ;-'1- is schematically shown § ^1_ in Fig. 8. Increasing the f °0l\ZZ. L..-J.'_ ,L„„Li
width of the slit in front
of the outcoupling
mirror leads, as
expected (and shown in
Fig. 9), to a higher
fraction of the
normalized laser output
power: for a slit width
of 30 mm the maximum
Flow ch >kes \
/ /< k / 4
O
/ 0
Output power fraction -12:77 mmol/s ■ Hager model with constant pressure - Hager model with variable pressure
Power fraction into translation
15 20 25
Resonator Width (mm)
Fig. 9: Laser power fraction as a function of resonator width.
J • 2 a 17 mm / open, jo z — 9mm/a = 10tr
-j * z - 25 mm f a = 10 n
= 9.7 kW
l,P... = 6.0 kW
I 03--1—.I —hi ^ 0-2 Lasing Conditions : |"o
0-1 1-RjRj = 0.4 -» ft, s 1.3 mr|~ 0.01 .I 1 1 I*
0 0.1 0.2 0.3
Fig. 10: Rigrod plot for a) an open resonator, and b) an obscured resonator aperture.
available output power has already been
reached. For smaller widths the power
fraction decreases down to 40 %. At that
point the laser operation is discontinued
and the flow in the cavity chokes: all the
remaining power is converted into
translational energy as shown by the open
dots. This experimental situation is
supported by a saturated gain model first
derived by Hager5 of the AFRL: whereas
the dotted line reflects the model with
constant pressure the full line corresponds
to the same model but with variable
pressure. Its validity is, of course, limited
Proc. SPIE Vo!. 4631 55

to the point where the laser active flow chokes. In general. Fig. 9 demonstrates a rather good agreement between theory
and experimental data.
Rigrod analysis is another way to investigate power extraction properties. Fig. 10a exhibits an experimental and
theoretical Rigrod plot obtained with an open resonator optically centered at 17 mm downstream of the nozzle exit
plane. For a laser power of about 10 kW a fairly good agreement is obtained between experimental dots and the
calculated solid line. In order to interrogate the active flow with respect to possible gradients, a 10 mm wide slit has
been positioned at 9, 17 mm and 25 mm downstream of the nozzle exit plane, respectively. Results are compared with
the fully opened resonator (open circles) and, since no significant deviations are found this leads to the conclusion that
the flow conditions are fairly constant within the optical cavity.
2.2 Liquid jet singlet oxygen generator
In recent years considerable effort has been devoted to the
investigation and development of so-called jet-type oxygen
generators invented by Russian researchers at the Samara Branch
of the Lebedev Institute. In order to derive a figure of merit for
the jet generator the efficiency of all published devices has been
plotted in Fig. 11 as a function of the reaction time of the BHP
jets with the chlorine gas. However, 22 different data points do
not really exhibit any characteristic behavior. In conclusion, the
reaction time is not the expected figure of merit; thus this
unanswered question remains to be considered in all the efforts
dedicated to the development of jet generators. In Germany, a
small scale generator with 49 liquid jets of 0.5 mm 0 and a
typical length between
10 cm and 15 cm has been
investigated. A picture of the
experimental device is
shown in Fig. 12.
Utilization, yield, and
generator efficiency have
been plotted in Fig. 13 as a
function of distance from the
exit of the generator. At a
total pressure of 90 mbar for
a helium/oxygen mixture,
efficiencies of up to 60%
have been demonstrated at
the generator exit. Further
investigations with special
emphasis on scaling Fig. 12: Jet generator device. properties are under way.
§ 2 5 %
---1-- i •
80 ■ 9 ■ 17 ▲ 2
A 23 m ■ 6
! 60 4 • 2*11 ■1. ■ 7*12 □ 16 ■ 15l> 21
A* 1-5, 23 DLR
40 6 Pragu* 7 l*TMl
▲ 5 1 l.dMign 1 8 Samara v*rt
20
■
▲ 4 16 theory 1 9+21 Tokay
11+22 Rockatriyn*
0 . . . . .
12-20 Samara
0 2 4 6 8 10 12 14
Reaction Time (ms)
Fig. 11: Survey of jet generator efficiency.
■ ■ i m i i i i i
' • He Na
. * * ■ Utilization . • # • Yield
A m A Efficiency A •
A *
i 3 mmol/s Cl2 ft
■ He/N2:Cl2=4:1
■ - * - * 20 40 60 80 100 120 140 160
Distance from Generator (cm)
Fig. 13: Performance data of jet generator.
3. PRESENT AND FUTURE APPLICATIONS
3.1 Beam quality issue Since most of the laser applications require high beam quality a survey is given in Fig. 14 of the beam quality factor,
M2, related to either commercially available lasers (full symbols) or laboratory devices (open symbols). The data
collection covers C02 gas lasers, lamp and diode pumped solid state lasers, fiber lasers, and a novel thin disk solid state
laser. As the output power increases only C02 lasers keep a beam quality better than 10 times the diffraction limit. For
comparison two COIL beam quality values have been added: one has been reported by the Dalian Group in China and
the other one has been advertised (but never officially published) by the AFRL in the U.S. Fig. 14 very clearly shows
the lack of brightness property of present solid state lasers and the huge brightness potential suggested by COIL
technology. In order to overcome the problem of small signal gain in moderate sized COIL devices we currently
56 Proc. SPIE Vol. 4631
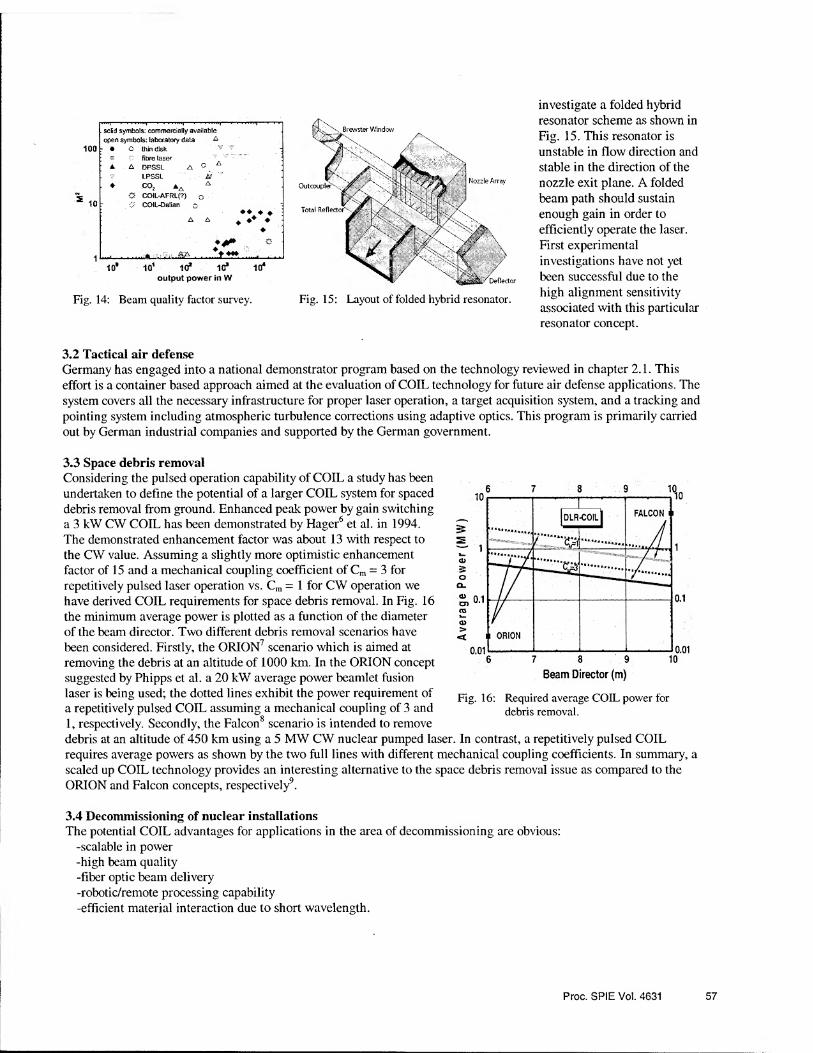
Fig. 14: Beam quality factor survey. Fig. 15: Layout of folded hybrid resonator.
investigate a folded hybrid
resonator scheme as shown in
Fig. 15. This resonator is
unstable in flow direction and
stable in the direction of the
nozzle exit plane. A folded
beam path should sustain
enough gain in order to
efficiently operate the laser.
First experimental
investigations have not yet
been successful due to the
high alignment sensitivity
associated with this particular
resonator concept.
3.2 Tactical air defense
Germany has engaged into a national demonstrator program based on the technology reviewed in chapter 2.1. This
effort is a container based approach aimed at the evaluation of COIL technology for future air defense applications. The
system covers all the necessary infrastructure for proper laser operation, a target acquisition system, and a tracking and
pointing system including atmospheric turbulence corrections using adaptive optics. This program is primarily carried
out by German industrial companies and supported by the German government.
3.3 Space debris removal
Considering the pulsed operation capability of COIL a study has been
undertaken to define the potential of a larger COIL system for spaced
debris removal from ground. Enhanced peak power by gain switching
a 3 kW CW COIL has been demonstrated by Hager6 et al. in 1994.
The demonstrated enhancement factor was about 13 with respect to
the CW value. Assuming a slightly more optimistic enhancement
factor of 15 and a mechanical coupling coefficient of Cm = 3 for
repetitively pulsed laser operation vs. Cm = 1 for CW operation we
have derived COIL requirements for space debris removal. In Fig. 16
the minimum average power is plotted as a function of the diameter
of the beam director. Two different debris removal scenarios have
been considered. Firstly, the ORION7 scenario which is aimed at
removing the debris at an altitude of 1000 km. In the ORION concept
suggested by Phipps et al. a 20 kW average power beamlet fusion
laser is being used; the dotted lines exhibit the power requirement of
a repetitively pulsed COIL assuming a mechanical coupling of 3 and
1, respectively. Secondly, the Falcon8 scenario is intended to remove
debris at an altitude of 450 km using a 5 MW CW nuclear pumped laser. In contrast, a repetitively pulsed COIL
requires average powers as shown by the two full lines with different mechanical coupling coefficients. In summary, a
scaled up COIL technology provides an interesting alternative to the space debris removal issue as compared to the
ORION and Falcon concepts, respectively9.
3.4 Decommissioning of nuclear installations
The potential COIL advantages for applications in the area of decommissioning are obvious:
-scalable in power
-high beam quality
-fiber optic beam delivery
-robotic/remote processing capability
-efficient material interaction due to short wavelength.
Proc. SPIE Vol. 4631 57

E
I f & I a 5
Fig. 17: Cutting concrete at 1.3 \im
Translation Sp*«d (m/min)
Fig. 18: Modeling of cutting speed for different materials.
Whereas the three last positions are valid for present solid state lasers, the two first positions may only be matched by COIL technology in the near future. First experiments have been undertaken with the 10 kW DLR COIL in order to demonstrate its capability of cutting
concrete. A sample is shown in Fig. 17 with a cutting depths of about 5 cm. Using available models we have tried to predict COIL cutting performance in materials relevant to decommissioning applications. Since no data base is available for those materials we have derived our calculations by anchoring the model to our experimental points. As deduced from Fig. 18 a 70 kW COIL would be capable of cutting 30 cm of concrete at a speed of 0.4 m/min. In order to further assess the future industrial potential of COIL in the area of decommissioning a comparison of costs with respect to other industrial laser candidates has been undertaken. A brief summary of the results is highlighted in Fig. 19. Although the C02 laser appears to be the most attractive low
cost candidate it should be mentioned that its wavelength is not suited for fiber optic beam delivery and, thus, he is not a candidate to be seriously considered for the application discussed here. The lamp pumped Nd:YAG laser is still cheaper than COIL but its scalability to high power levels has yet to be demonstrated.
laser
C02
Nd’.YAG (lamp)
Nd:YAG (diode)
COIL
Investment Costs
1000 €/kW
60
125
1000
170
Running Costs
(incl. Depredation)
€/ kWh
10
20
110
50
Fig. 19: Figures for the marketplace.
4. CONCLUSIONS AND OUTLOOK
Successful operation and understanding of COIL at relevant power levels has been achieved. COIL technology has matured to the point that it basically can support an effort aimed at the development of an air defense demonstrator. Furthermore, COIL technology is being considered for future civilian applications, as well.
However, some fundamental issues are presently still unresolved: the iodine dissociation is satisfactorily described in the existing devices but no universal nor scalable model is presently available. Although high beam quality is generally anticipated it needs to be demonstrated along with efficient laser operation. And finally the question arises if the high brightness leading edge of COIL will prevail over the considerable improvements that may occur in solid state laser research for the years to come.
ACKNOWLEDGEMENTS
The author thanks F.Duschek, K.Gruenewald, J.Handke, W.O.Schall, C.Schreiber and F.Waiblinger for providing all the experimental material and H.-A.Eckel for his support by editing this paper.
REFERENCES
1. J. Handke, A. Werner, W.L. Bohn, W.O. Schall, "Multikilowatt Supersonic Oxygen Iodine Laser44, Proc. GCL 10th International Symposium, SPIE Vol:2502 (1994), p.266
2. S.J. Davis, W.J. Kessler, M. Bachmann, "Collisional broadening of absorption lines in water vapor and atomic iodine relevant to COIL diagnostics". Gas and Chemical Lasers and Intense BeamApplications II, Vol 3612, pp. 157-166, San Jose, 1999
58 Proc. SPIE Vol. 4631

3. J. Handke, K. Gruenewald, F. Duschek, ’’Comparative studies on small signal gain and output power for COIL systems44, Proc. XHI International Symposium on Gas Flow and Chemical Lasers and High Power Laser Conference, SPIE Vol. 4184 (2001) p. 45
4. J. Handke, K. Gruenewald, W.O. Schall, ’’Power extraction investigations for a 10 kW-class supersonic COIL”, 12th GCL/HPL St. Petersburg (1998), SPIE Vol. 3574 p. 309
5. G.D. Hager, C.A. Helms and K.A. Truesdell, D. Plummer, J. Erkkila and P.Crowell, 44A Simplified Analytic Model for Gain Saturation and Power Extraction in the Rowing Chemical Oxygen Iodine Laser”, IEEE Journal of Quantum Electronics, Vol.32 No.9, Sept. 1996, p.1525
6. G.D. Hager and D. Kopf, ’’The repetitively pulsed chemical oxygen iodine laser44, 25th AIAA Plasmadynamics and Laser Conference, June 20-23 (1994), Colorado Springs, CO
7. C.R. Phipps, G. Albrecht, H. Friedmann, D. Gavel, E.V. George, J. Murray, C. Ho, W. Priedhorsky, M.M. Michaelis and J.P. Reilly, ’’ORION. Clearing near earth debris”, Laser and Particle Beams (1996), Vol. 14 No 1 p. 1
8. D.K. Monroe, ’’Space debris removal using a high-power ground-based laser” in Laser Power Beaming, SPIE Vol. 2121 (1994), p.276
9. W.L. Bohn, ’’High power supersonic chemical oxygen iodine laser”, Proc. of the Conference on High-Power Laser Ablation, Santa Fe, NM (1998), SPIE Vol. 3343 p. 119
Proc. SPIE Vol. 4631 59

Invited Paper
Historical perspective of COIL diagnostics
Steven J. Davis*
Physical Sciences Inc.
ABSTRACT
In this paper, I present a history of the development of diagnostic techniques for the chemical oxygen iodine laser
(COIL). Several established optically based techniques have been applied to COIL including: visible and near infrared
chemiluminescence, resonance absorption, and laser induced fluorescence. I trace the history of these developments
using the diagnostic methods as the overall theme. In many cases a variant of an established diagnostic was used to
probe for some key kinetic rate or mechanism. Indeed, the goal of developing the now well established COIL kinetic
rate package was responsible for the introduction of new diagnostic methods. I discuss diagnostics both before and after
the demonstration of the first COIL device.
Keywords: Chemical Oxygen Iodine Laser, optical diagnostics, development history
1. INTRODUCTION
During this commemorative session on the 25th anniversary of the invention of COIL, we are recounting the history of
the development of this unique laser system.1'3 The excellent reviews of the laser development and COIL kinetics by
Bill McDermott4 and Mike Heaven5 earlier in this volume provide ample motivation for a discussion of diagnostics.
In the following pages I have described some of the developments that led to the present diagnostic toolbox now
available to COIL researchers. Before launching into a detailed discussion of COIL diagnostics it is important to at least
mention the important species and parameters relevant to COIL development. I will be brief here since others have
already covered much of this earlier in these proceedings.
Although numerous diagnostic methods have been developed and applied to COIL, it is important to emphasize that this
has not been an isolated journey. In many cases, some kinetic rate or elucidation of a reactive mechanism was needed.
This led either to a variation of an existing diagnostic or the development of a new method. Most frequently it was the
former, and this is entirely reasonable; application of a well-proven technique to a new problem is often a prudent
approach.
In this brief overview, I will attempt to trace the highlights of COIL diagnostic development. I have been privileged to
be part of this area during and after the demonstration of the first COIL. While I have tried to provide a historical
background, the reader will note that my review is not entirely chronological. Rather, I chose to frame the review
around several general, optical and even non-optical techniques. I hope that this does not trouble the reader, but it is
how I mentally categorized the history of COIL diagnostics.
There now exists a fairly extensive toolbox of diagnostics available to the COIL developer, and these are listed in
Table l. In the following survey, I will highlight the development of several of these "tools".
* [email protected]; phone 1 978 689 0003; fax 1 978 689 3232; http://www.psicorp.com; Physical Sciences Inc.,
20 New England Business Center, Andover, MA, USA 01810-1077
60
Gas and Chemical Lasers and Intense Beam Applications III, Steven J. Davis, Michael C. Heaven, Editors, Proceedings of SPIE Vol. 4631 (2002) © 2002 SPIE • 0277-786X/02/$15.00

Table 1. "Toolbox" of diagnostics that have been applied to COIL
Proc. SPIE Vol. 4631 61

The history of when these various diagnostic tools were developed and/or applied to COIL related research is
summarized in Fig. 1. This figure is only intended to be a rough guide.
Diode Laser Absorption; [X] Temperature Raman; [02]
Gain Probes, Mixing LIF
ESR, Resonance Absorption
Chemiluminescence 02(a), 02(b), 0*4, I*, l*2
I960 1970 1980 1990 2000
Fig. 1: History of COIL diagnostic development.
The overall COIL kinetics are well documented and we only present the essential features here. In brief the system is
described by Eqs. (I) through (3).
I + 02(1A)z>I* + 02(3X) (1) kr
02(1A) + 02(1A)^02(1X)02(3Z) (2)
I * + hv —> I + 2hv (3)
The equilibrium condition for inversion of the atomic iodine in COIL is given by Eq. (4)
Keq =LL = o.75 exp (402/T) (4) kr
At room temperature, the atomic iodine lasant species can be inverted with about 18% of the oxygen in the 02(!A) state.
The fraction of the oxygen required to invert the iodine is less at lower temperatures. This means that any additional
singlet delta oxygen can be used to derive output power from the COIL device.
The reader will note that I have neglected the dissociation process in the reactions listed above. This was discussed in
detail in Mike Heaven's paper earlier in this volume.5 From the above, we can deduce that knowledge of the
concentrations of 02(1A), 02(5Z), I(2Pi/2), ICP3/2X and temperature are crucial. In addition, monitors for 02(]Z) and H20
were target species early in COIL development because of their potential roles in the molecular iodine dissociation.
Water vapor is a known quencher of the upper laser level I(2Pi/2) in COIL.
62 Proc. SPIE Vo!. 4631
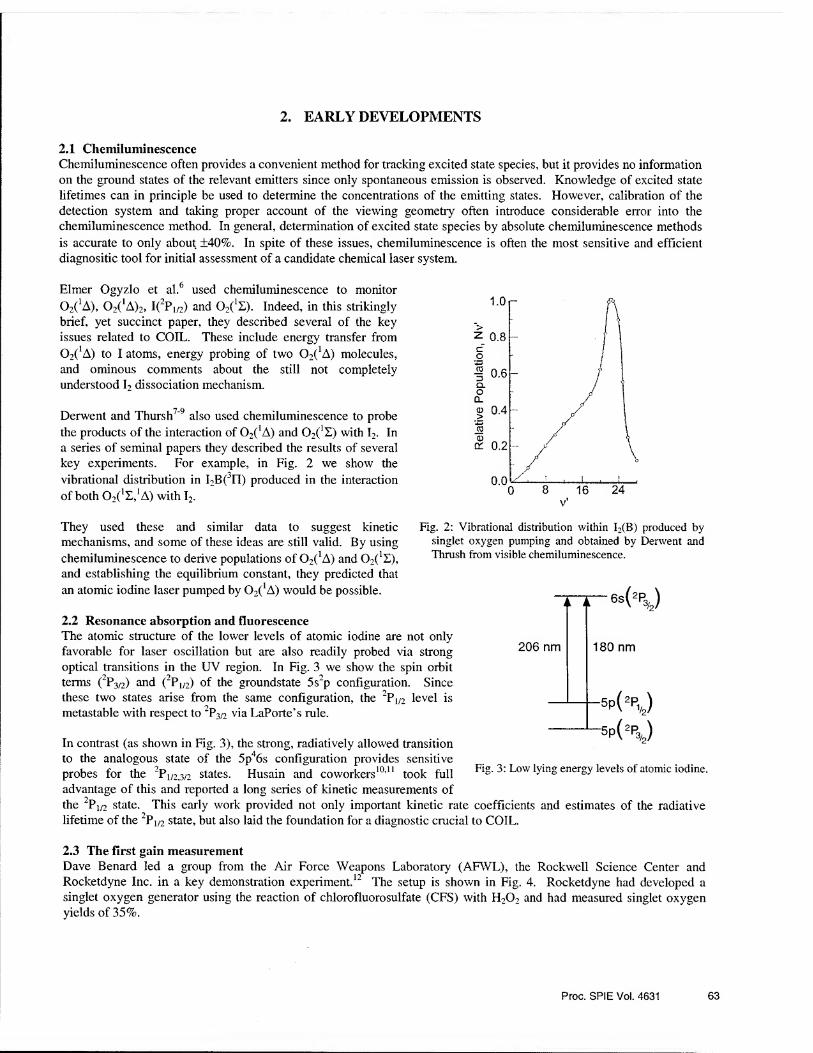
2. EARLY DEVELOPMENTS
2.1 Chemiluminescence Chemiluminescence often provides a convenient method for tracking excited state species, but it provides no information
on the ground states of the relevant emitters since only spontaneous emission is observed. Knowledge of excited state
lifetimes can in principle be used to determine the concentrations of the emitting states. However, calibration of the
detection system and taking proper account of the viewing geometry often introduce considerable error into the
chemiluminescence method. In general, determination of excited state species by absolute chemiluminescence methods
is accurate to only about ±40%. In spite of these issues, chemiluminescence is often the most sensitive and efficient
diagnostic tool for initial assessment of a candidate chemical laser system.
Elmer Ogyzlo et al.6 used chemiluminescence to monitor
02(1A), 02(1A)2, I(2Pi/2) and 02(1S). Indeed, in this strikingly
brief, yet succinct paper, they described several of the key
issues related to COIL. These include energy transfer from
02(1A) to I atoms, energy probing of two 02(XA) molecules,
and ominous comments about the still not completely
understood I2 dissociation mechanism.
Derwent and Thursh7'9 also used chemiluminescence to probe
the products of the interaction of 02(1A) and 02(1Z) with I2. In
a series of seminal papers they described the results of several
key experiments. For example, in Fig. 2 we show the
vibrational distribution in I2B(3I1) produced in the interaction
of both 02(1Z,1A) with I2.
They used these and similar data to suggest kinetic
mechanisms, and some of these ideas are still valid. By using
chemiluminescence to derive populations of 02(1A) and 02(!Z),
and establishing the equilibrium constant, they predicted that
an atomic iodine laser pumped by 02(1A) would be possible.
Fig. 2: Vibrational distribution within I2(B) produced by singlet oxygen pumping and obtained by Derwent and Thrush from visible chemiluminescence.
206 nm 180 nm
2.2 Resonance absorption and fluorescence The atomic structure of the lower levels of atomic iodine are not only
favorable for laser oscillation but are also readily probed via strong
optical transitions in the UV region. In Fig. 3 we show the spin orbit
terms (2P3/2) and (2Pi/2) of the groundstate 5s2p configuration. Since
these two states arise from the same configuration, the 2Pi/2 level is
metastable with respect to 2P3/2 via LaPorte’s rule.
In contrast (as shown in Fig. 3), the strong, radiatively allowed transition
to the analogous state of the 5p46s configuration provides sensitive probes for the 2P1/2.3/2 states. Husain and coworkers10’11 took full Fig- 3: Iw lying energy levels of atomic iodine.
advantage of this and reported a long series of kinetic measurements of
the 2Pi/2 state. This early work provided not only important kinetic rate coefficients and estimates of the radiative
lifetime of the 2Pi/2 state, but also laid the foundation for a diagnostic crucial to COIL.
M‘%)
2.3 The first gain measurement Dave Benard led a group from the Air Force Weapons Laboratory (AFWL), the Rockwell Science Center and
Rocketdyne Inc. in a key demonstration experiment.12 The setup is shown in Fig. 4. Rocketdyne had developed a
singlet oxygen generator using the reaction of chlorofluorosulfate (CFS) with H202 and had measured singlet oxygen
yields of 35%.
Proc. SPIE Vol. 4631 63

o2
Fig. 4: Experimental arrangement for the first gain measurement in COIL.
The idea behind the diagnostic was to saturate the I(2P1/2 <- ^3/2) transition with a strong pulse from an I atom photolysis
laser. If the 2PI/2 state is inverted with respect to the “P3/2 then the saturation pulse will drive population down from the
2P1/2 state to the 2P3/2 state. The relative population of the 2Pi/2 and 2P3/2 states was monitored with a resonance lamp
operating at 206 nm (see Fig. 4). Using this sensitive double resonance approach, Benard and coworkers12 were able to
demonstrate weak, but certain positive gain in a singlet oxygen pumped iodine atom flow system. This provided the
crucial data needed to maintain the focus and the program to produce a chemically pumped short wavelength laser.
2.4 "First light” Recognition of the fundamental differences in the spatial and directional distributions between spontaneous and
stimulated emission led to the key optical diagnostic that guided the first successful COIL laser demonstration. The
basic idea is shown in Fig. 5. Two Ge detectors were positioned next to the longitudinal flow cavity region. Detector A
probed along the optical axis and detector B examined the light emitted normal to the optical axis. Consequently,
detector A was sensitive to stimulated emission directed along the resonator axis, and detector B detected spontaneous
emission emitted normal to the optical axis. The approach to laser oscillation in any laser includes a buildup of
stimulated emission intensity along the resonator axis. Thus one expects that the end detector A will show a faster rise
than the side viewing detector B. This is exactly what was seen on the first COIL. The end detector initially became
noisier than the side detector as the intensity along the optical axis grew due to stimulated emission. Finally, as laser
threshold was reached, the end detector "pegged.” A power meter showed 4 mW output. Transverse mode structure was
observed on an IR sensitive card, confirming laser oscillation.1
Fig. 5: Experimental arrangement for the first COIL gain measurement.
64 Proc. SPIE Vol. 4631

3, POST LASER DEMONSTRATION DIAGNOSTICS
3.1 Introduction
The laser demonstration1 of 1 December 1977 was a defining moment in the history of COIL diagnostics. In general, the
diagnostics prior to December 1, 1977 were developed to support this key milestone. Subsequent to the laser event, it
was clear that the COIL kinetic mechanisms and rates needed serious development. This led to a renaissance of kinetics
studies that has not been equaled since that time. Premier federal, industrial, and academic laboratories were focused on
this system for a period of about 5 years.
3.2 Chemiluminescence
Soon after the first demonstration of COIL, the group at Aerospace Corp headed by Rick Heidner began a systematic
and detailed series of experiments to determine key kinetic mechanisms and rate coefficients.13’14 Using a microwave
source for excited oxygen and a temperature controlled flow reactor, they produced kinetic data that are used to this day.
From these data they developed possible mechanisms for the molecular iodine dissociation that were discussed earlier by
Mike Heaven.5 These data have withstood the test of time for nearly two decades and comparisons continue to be made
between new models for the dissociation to the data-base produced by this excellent work.
At AFWL (now the Air Force Research Laboratory), my research group was involved with an active program to
examine candidates for short wavelength chemical lasers. We were already involved in developing diagnostics for
COIL. These diagnostics included both passive (chemiluminescence) and active (resonance absorption and fluorescence)
techniques. Before describing some of the active techniques, I want to discuss some of the interesting results that we
obtained from the chemiluminescence work.
The dissociation of molecular iodine had been an elusive problem
for many years. Using a small flow tube and a microwave
discharge to produce singlet oxygen, we made some initial probes
into the efficiency of the dissociation process by monitoring the
number of singlet oxygen molecules consumed to dissociate one
iodine molecule.15 The experiment was relatively simple: measure
the consumption of singlet oxygen as a function of the added I2
We used an optically based mass flow meter to measure the iodine
mass flow. In Fig. 6 we show results from that experiment that
imply that the dissociation efficiency increased as the molecular
iodine was increased. While not defining a mechanism or
producing kinetic rates, this early experiment did imply that iodine
itself might be active in the dissociation process.
We also developed a Fabry-Perot interferometer to examine the
collisional broadening of the hyperfine components of the
I (2Pi/2 —> 2P3/2) transition, again using chemiluminescence.16 A
microwave production source produced 02(1A), and this flow was
added to a small flow tube reactor that also mixed in I2. We
spectroscopically examined the hyperfine components of the
atomic iodine chemiluminescence emission as shown in Fig. 7.
Examination of these spectra as a function of added oxygen yielded the first broadening data under COIL conditions and
demonstrated that the prior concerns about an anomalously large oxygen broadening of the COIL laser transition were
unfounded. We concluded that under COIL conditions, the reduction in the line center gain on the (3,4) transition
caused by oxygen collisional broadening would be minimal.
There are several possible methods for determining the flow temperature. Thermocouples can be used, but the
metastable oxygen leads to errors in thermocouple measurements due to deactivation of the excited oxygen on the
thermocouples. In addition, thermocouple measurements are notoriously inaccurate in rarified, supersonic gas flows
18
16
14
12
10 N
8
6
4
2
0 1.1 1.3 1.5 1.7 1.9 2.1 2.3 2.5 2.7
[l2] (mtorr)
Fig 6: Plot of the number of singlet oxygen molecules required to dissociate an I2 as a function of the I2 concentration.
Proc. SPIE Vot. 4631 65

°2
MICROWAVE CAVITY
FABRY-PEROT INTERFEROMETER
A.
lens —n—m
0 D LENS
:l2
-02
M TO VACUUM
3-4
(c»-'>
Fig. 7: Partially resolved hyperfine structure from atomic iodine produced by the interaction of molecular iodine with singlet oxygen and recorded with a Fabry-Perot interferometer.
such as in COIL. Other potential methods include measurement of the rotational temperature of species in the flow such
as the rotational manifold of oxygen. Van Benthem and Davis17 demonstrated a variant of this approach by monitoring
the rotationally resolved emission on the 02 (b X) system produced in chemical oxygen generators used in COIL. We
determined the temperature T = 310 K over a large sparger singlet oxygen generator on the AFWL COIL IV. While
potentially useful, one must be assured that the rotational manifold of the electronically excited 02(b) state is at the
translational flow temperature, and this may not be true at typical low pressure COIL conditions.
3.3 Resonance absorption Most "active" diagnostics developed for COIL during this period used resonance absorption and fluorescence.
Interestingly, several diagnostics that we developed used the optical (B <— X) transition in I2. Indeed, at least four
diagnostics were based on this absorption band:
• I atom probe laser
• I2 dissociation fraction
• I2 mass flow meter
• Laser induced fluorescence for flow mixing.
The relevant energy levels of the I2(B-X) system are shown in Fig. 8. The B state correlates to one excited and one
ground state atom. For excitation wavelengths longer than about 501 nm, strong, visible fluorescence is produced. In
contrast, when excited by optical wavelengths less than 500 nm. the visible fluorescence is dramatically reduced.
However, strong emission from the excited I(2Pi/:) is produced. We used this selective process to produce the first
I atom laser based upon photolysis of I2.18 This has distinct advantages over photolysis of alkyl-iodides such as CF-,1,
because I2 regenerates itself from I atom recombination. We used this simple, dye laser pumped I atom laser to probe for
gain on COIL IV, and it identified a chemically induced coating problem on the COIL cavity mirrors.
Len Hanko and I developed an iodine mass flow meter based on the continuum absorption near 490 nm from the ground
state of I2.19 The concentration of molecular iodine in a cell can be determined directly from such a measurement. If the
cell is in line with the iodine delivery system in a COIL, then one can use this approach to determine the mass flow of
the iodine. One needs to measure the mass flow rate and pressure of the carrier gas in the same cell, but these
parameters can be readily measured with a mass flow meter and capacitance manometer respectively.
66 Proc. SPIE Vol. 4631
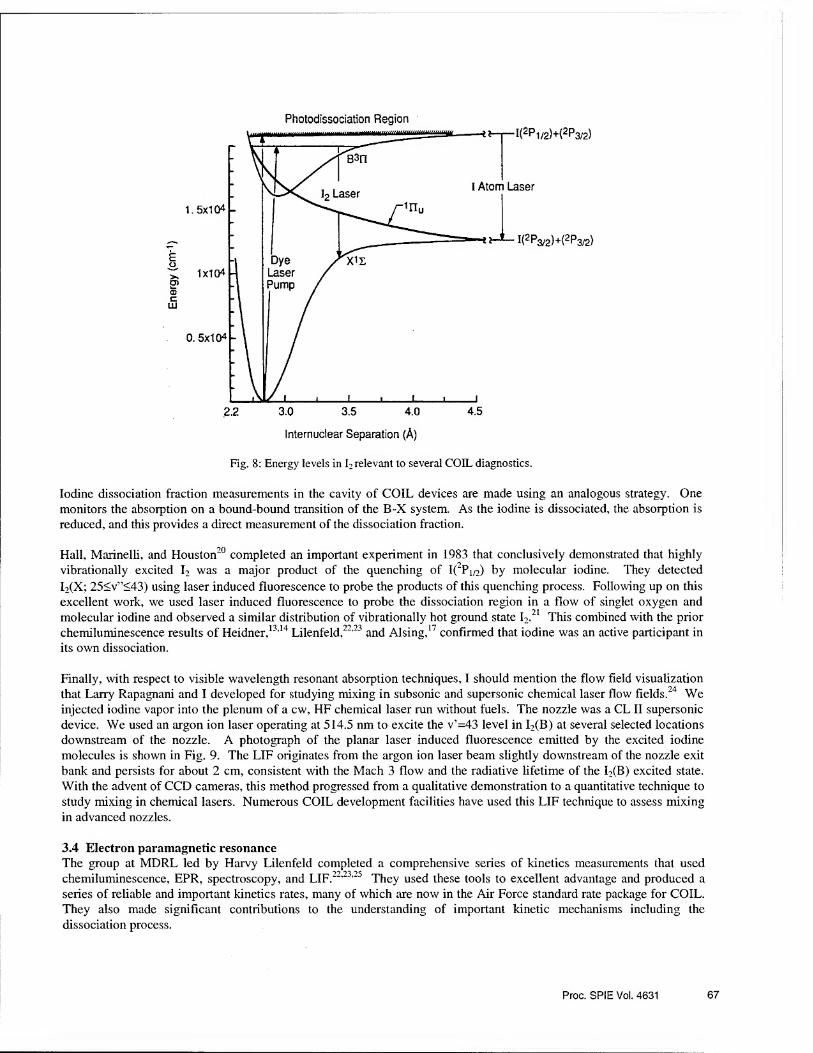
Photodissociation Region
Internuclear Separation (A)
Fig. 8: Energy levels in I2relevant to several COIL diagnostics.
Iodine dissociation fraction measurements in the cavity of COIL devices are made using an analogous strategy. One
monitors the absorption on a bound-bound transition of the B-X system. As the iodine is dissociated, the absorption is
reduced, and this provides a direct measurement of the dissociation fraction.
Hall, Marinelli, and Houston20 completed an important experiment in 1983 that conclusively demonstrated that highly
vibrationally excited I2 was a major product of the quenching of I(2Pi/2) by molecular iodine. They detected
I2(X; 25<v”<43) using laser induced fluorescence to probe the products of this quenching process. Following up on this
excellent work, we used laser induced fluorescence to probe the dissociation region in a flow of singlet oxygen and
molecular iodine and observed a similar distribution of vibrationally hot ground state I2.21 This combined with the prior
chemiluminescence results of Heidner,13,14 Lilenfeld,22,23 and Alsing,17 confirmed that iodine was an active participant in
its own dissociation.
Finally, with respect to visible wavelength resonant absorption techniques, I should mention the flow field visualization
that Larry Rapagnani and I developed for studying mixing in subsonic and supersonic chemical laser flow fields.24 We
injected iodine vapor into the plenum of a cw, HF chemical laser run without fuels. The nozzle was a CL II supersonic
device. We used an argon ion laser operating at 514.5 nm to excite the v’=43 level in I2(B) at several selected locations
downstream of the nozzle. A photograph of the planar laser induced fluorescence emitted by the excited iodine
molecules is shown in Fig. 9. The LIF originates from the argon ion laser beam slightly downstream of the nozzle exit
bank and persists for about 2 cm, consistent with the Mach 3 flow and the radiative lifetime of the I2(B) excited state.
With the advent of CCD cameras, this method progressed from a qualitative demonstration to a quantitative technique to
study mixing in chemical lasers. Numerous COIL development facilities have used this LIF technique to assess mixing
in advanced nozzles.
3.4 Electron paramagnetic resonance
The group at MDRL led by Harvy Lilenfeld completed a comprehensive series of kinetics measurements that used
chemiluminescence, EPR, spectroscopy, and LIF.22,23,25 They used these tools to excellent advantage and produced a
series of reliable and important kinetics rates, many of which are now in the Air Force standard rate package for COIL.
They also made significant contributions to the understanding of important kinetic mechanisms including the
dissociation process.
Proc. SPIE Vol. 4631 67

Fig. 9: LIF image of nozzle effluent pattern in a Mach 3 chemical laser flowfield. The image is from laser excited molecular iodine. Flow is down in the picture.
3.5 Diode laser sensors With the advent of reliable, near IR laser diodes, a new class of diagnostics based on resonance absorption became
feasible. The telecommunications industry was the main catalyst for the development of these new lasers that are now
used as sources for wavelength division multiplexing (WDM) and dense wavelength division multiplexing (DWDM)
applications. Low loss and low dispersion fiber optics in the 1.3 to 1.65 pm spectral region led to the development of
superior lasers in this spectral window for telecommunications. Narrow and controllable wavelengths from the diode
lasers is crucial for DWDM, and distributed feedback (DFB) lasers were developed for this purpose. At Physical
Sciences Inc. (PSI) we recognized that this could lead to a new class of sensitive diagnostics for COIL including singlet
oxygen yield, water vapor, iodine atoms, and translational temperature. In 1991, we began to investigate room
temperature diode lasers as sensors for numerous gases, and have demonstrated monitors for over 30 gases since that
time. Some of these were relevant to COIL, and we developed modules26,27 for three important species:
• Ground state oxygen
• Water vapor
• Iodine atoms.
The DFB lasers developed for telecommunications offer several advantages for rugged, fieldable COIL diagnostics.
First, they produce narrow band (5 to 30 MHz), output that is rapidly (kHz rates) tunable over isolated rovibrational or
rovibronic lines of the target species. Secondly, these lasers can be directly coupled to single mode fiber optic cables.
This greatly simplifies the interface to COIL systems. Finally, as we discuss below, since the diode laser can scan an
entire lineshape, the measurement becomes independent of both pressure and, to a large extent, temperature in the
measurement volume.
The typical diode laser based sensor contains the diode laser, fiber optic delivery system, a room temperature solid state
detector such as Si or InGaAs, and a PC controlled data acquisition and analysis system. A standard installation on a
COIL device is shown in Fig. 10. Use of a fiber splitter allows us to produce several output fiber legs that can probe
different regions of the COIL flow simultaneously.
68 Proc. SPIE Vol. 4631
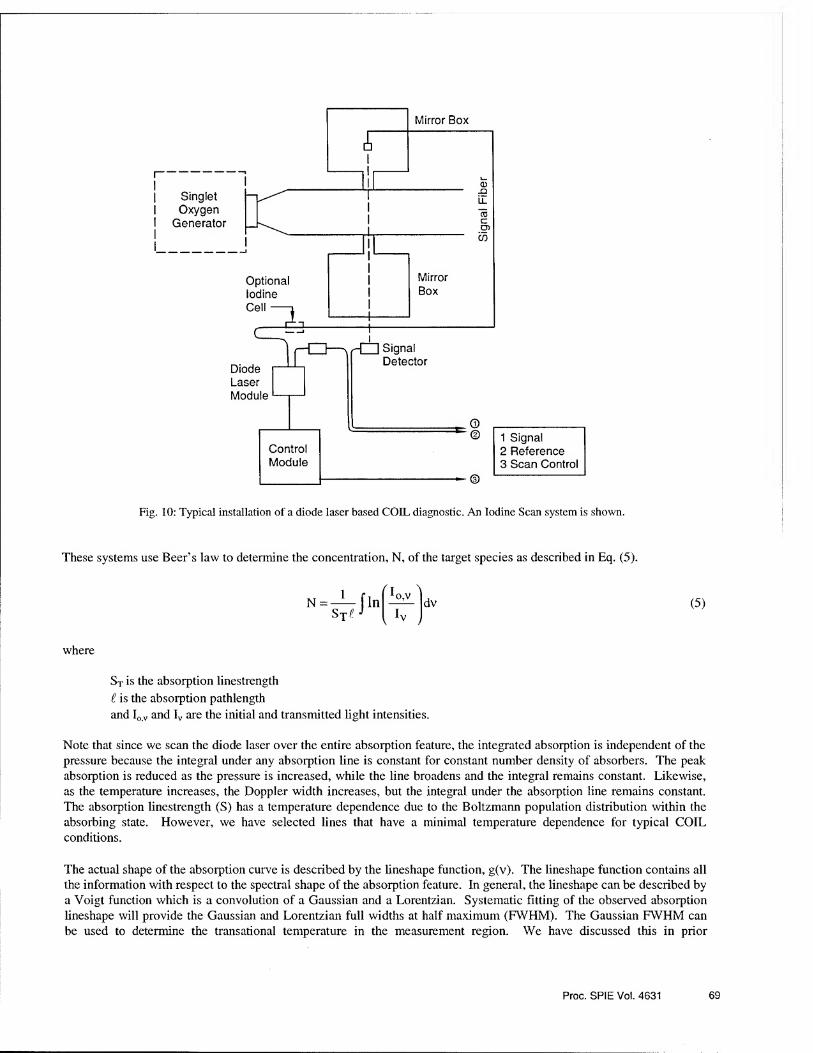
Fig. 10: Typical installation of a diode laser based COIL diagnostic. An Iodine Scan system is shown.
These systems use Beer’s law to determine the concentration, N, of the target species as described in Eq. (5).
N = — fi St£ J
n \
dv
j
(5)
where
ST is the absorption linestrength
l is the absorption pathlength
and I^y and Iv are the initial and transmitted light intensities.
Note that since we scan the diode laser over the entire absorption feature, the integrated absorption is independent of the
pressure because the integral under any absorption line is constant for constant number density of absorbers. The peak
absorption is reduced as the pressure is increased, while the line broadens and the integral remains constant. Likewise,
as the temperature increases, the Doppler width increases, but the integral under the absorption line remains constant.
The absorption linestrength (S) has a temperature dependence due to the Boltzmann population distribution within the
absorbing state. However, we have selected lines that have a minimal temperature dependence for typical COIL
conditions.
The actual shape of the absorption curve is described by the lineshape function, g(v). The lineshape function contains all
the information with respect to the spectral shape of the absorption feature. In general, the lineshape can be described by
a Voigt function which is a convolution of a Gaussian and a Lorentzian. Systematic fitting of the observed absorption
lineshape will provide the Gaussian and Lorentzian full widths at half maximum (FWHM). The Gaussian FWHM can
be used to determine the transational temperature in the measurement region. We have discussed this in prior
Proc. SPIE Vol. 4631 69

presentations and do not repeat it here.28 30 Several papers in this conference discuss temperature measurements using
this approach.
In order to increase the accuracy of temperature measurements by this method, it is best to know the Lorentzian
component of the linewidth. One can then deconvolve the Lorentzian to obtain the Gaussian component. To assist in
this goal, we have made a series of detailed measurements of the collisional broadening coefficients28'30 of relevant
absorption lines in oxygen, water vapor, and atomic iodine. Note that we define our measured broadening coefficients in
terms of full width at half maximum (FWHM); i.e., (MHzATorr). These are provided in Tables 2 through 4 below.
Table 2. Broadening coefficients for selected 02(b<— X) lines used in the Oxygen Scan diagnostic
Bath Gas Oxygen Transition
Broadening Coefficient
(MHz/Torr)
Line Shift Coefficient
(MHz/Torr)
Oxygen P5P5 4.2 0.21
Oxygen P19P19 3.3 0.23
Helium P5 P5 3.1 0.04
Neon P5P5 3.2 0.12
Argon P5P5 3.7 0.31
Nitrogen P5P5 4.1 0.29
Carbon dioxide P5P5 4.7 0.17
Chlorine P5 P5 5.2 0.34
Water vapor P9Q8 5.0 —
Table 3. Broadening coefficients for the 1.3925 jam water vapor line used in the Water Scan diagnostic
Collision Partner
Broadening Coefficient
(MHz/Torr)
H-,0 31.2
C02 14.8
NH, 23.8
He 1.8 Ar 3.7
o2 4.8
n2 8.8 Air 7.6
Propane (C3H8) 10.2 Ethane (C2H6) 8.9
Ethane (C2H4) 13.8
Proplene (C3H6) 7.4
Methane (CH4) 7.6
Table 4. Broadening coefficients for several relevant gases on the (3,4) hyperfme line of atomic iodine
Bath Gas
Broadening Coefficient
(MHz)
He 3.2
N2 5.5
O: 5.0
70 Proc. SPIE Vol. 4631

We have also measured the temperature dependence of the collisional linebroadening of the (3,4) hyperfine line in
atomic iodine for both He and 02 over the temperature range 300 to 775K. These values are:
(Av/APHe)T = (3.2±0.3) x (296/T)0,36
and
(Av/AP02)t = (5.5 ± 0.6) x (296/T)0'70
These values can be used in the data reduction of absorption lineshapes including those in the cavity region where the
temperatures are considerably lower than 300 K.
3.6 Raman spectroscopy Gylys and Rabin31 have recently reported a complementary method for measuring the yield of singlet oxygen using
Raman scattering. This method provides a direct measurement of the concentrations of both 02(! A) and 02(3X) since the
Raman cross sections for both these species are known. The typical set up is shown in Fig. 11. Since the Raman cross
section is low, the method requires a high power laser and sensitive, wavelength dispersing optical detectors. Despite
these potential drawbacks, Gylys and Rabin have demonstrated impressive results. There also a paper in this meeting
that discussed Raman as an oxygen diagnostic for COIL.32
Fig. 11: Experimental setup for Raman imaging in COIL.
4. SUMMARY AND CONCLUSIONS
In this brief survey of the history of COIL diagnostics, I have attempted to provide a perspective of progress and recent
developments. It is clear that we have all come a long way in developing tools to help investigate key aspects of COIL.
We have seen a progression from the earliest chemiluminescence probes that led to the discovery of COIL to approaches
that allow probing of ground state species, small signal gain, temperature, and spatially resolved parameters. These
diagnostics, whatever flavor, will continue to aid the further development of advanced and more efficient COIL devices.
Until the present time, most sensitive COIL diagnostics have been used to gain a better understanding of how this system
operates, i.e. kinetic mechanisms and rates. Chemiluminescence-based diagnostics have been used for many years on
active COIL devices as system “health” monitors. I suggest, that a fruitful path for future work in the diagnostics area
would be to incorporate both passive and active diagnostics as part of a suite of open- and closed- loop feed back control
systems to enhance the stability and reliability of COIL. Of course, this will require considerable engineering, but that is
consistent with the high level of maturity that COIL has attained.
Proc. SPIE Vol. 4631 71

I would be remiss if I did not at least mention that advanced diagnostics might someday assist in the eventual resolution
of the molecular iodine dissociation mystery. We may yet have some science to discuss at the 50th anniversary of COIL!
ACKNOWLEDGMENTS
I have had the privilege of working with many talented researchers in the field of COIL diagnostics and kinetics. I have
already mentioned several in the body of the paper. In addition to them I would like to acknowledge Bob Shea and Dave
Neumann, who were actively involved in some of the early diagnostics development work at AFWL. I would also like
to mention Art Guenther and Pete Avizonis who recognized the value of advanced diagnostics and were very supportive.
Don Ball, former director of AFOSR Chemical and Molecular Sciences, deserves a special thanks for generous and
continual support during much of the period discussed. Gordon Hager of AFRL also has been very supportive of the
diode laser diagnostics development. Finally, I would also like to thank my many colleagues at PSI including Bill
Kessler, Phil Mulhall, Phil Keating, and Mark Allen for assisting in the development of the diode laser sensors.
REFERENCES
1. W.E. McDermott, N.R. Pchelkin, D.J. Benard, and R.R. Bousek, “An Electronic Transition Chemical Laser’", Appi.
Phys. Lett. 32, 469, 1978.
2. D.J. Benard, W.E. MeDermott, N.R. Pchelkin, and R.R. Bousek, “Efficient Operation of a 100-W Transverse Flow
Oxygen Iodine Chemical Laser”, Appi Phys. Lett. 34, 40, 1979.
3. R.J. Richardson and C.E. Wiswall, “Chemically Pumped Iodine Laser”, Appi Phys. Lett. 35, 138, 1979.
4. W.E. McDermott, “Historical Perspective of COIL”, SPIE Paper 4631-01, Gas and Chemical Lasers and Intense
Beam Applications IV, San Jose, CA, January 2002.
5. M.C. Heaven, A.V. Komissarov, and V. Goncharov, “Mechanism and Kinetics of Iodine Dissociation in COIL”,
SPIE Paper 4631-02, Gas and Chemical Lasers and Intense Beam Applications IV, San Jose, CA, January 2002.
6. S.J. Arnold, N. Finlay son, and E.A. Ogryzlo, “Some Novel Energy-Pooling Processes Involving O^Ag)”, J. Client.
Phys. 44, 2529, 1966.
7. R.G. Derwent and B.A. Thrush, “Excitation of Iodine by Singlet Molecular Oxygen”, Part I, Mechanism of the I2
Chemiluminescence”, J.C.S. Faraday II68, 720, 1972.
8. R.G. Derwent and B.A. Thrush, “Excitation of Iodine by Singlet Molecular Oxygen”, Part II, Kinetics of the
Excitation of Iodine Atoms”, Discs. Faraday Soc. 53, 162, 1972.
9. R.G. Derwent and B.A. Thrush, “Measurements of 02(1Ag) and 02(1Sg) in Discharge Flow Systems”, Trans.
Faraday Soc. 67, 2036, 1971.
10. R.J. Donovan, F.G.M. Hathom, and D. Husain, “Study of Electronically Excited Atoms, I(5T1/2) in the Presence of
Alkyl Iodides”, Trans. Faraday Soc. 64, 1, 1968.
11. J.J. Deakin and D. Husain, “Temperature Dependence of Collisionally induced Spin Orbit Relaxation of
Electronically Excited Iodine Atoms, I(5p5 2Pi/2)’\ J.C.S. Faraday 77, 68, 1603, 1972.
12. A.T. Pritt, R.D. Coombe, D. Pilipovich, R. Wagner, D. Benard, and C. Dymek, “Chemical Generation of a
Population Inversion Between the Spin Orbit States of Atomic Iodine”, Appi. Phys. Lett. 31, 746, 1977.
13. R.F. Heidner, C.E. Gardner, G.I. Segal, and T.M. El-Sayed, “Chain Reaction Mechanism for I2 Dissociation in the
02(!A) I-atom Laser”, J. Phys. Chcm. 87, 2348, 1983.
14. R.F. Heidner, C.E. Gardner, T.M. El-Sayed, and G.I. Segal, ’’Temperature Dependence of OoC’A) + 02(]A) and
I(2P1/2) + 02(1A) Energy Pooling,” J. Chem. Phys. 74, 5618, 1981.
15. P.M. Alsing, G. Simmons, and S.J. Davis, “Observations Concerning the Efficiency of the I2 Dissociation by
02(1A)”, Laser Digest, AFWL TR- 82-88, 1982.
16. D.K. Neumann, P.K. Clark, R.F. Shea, and S.J. Davis, “02 Pressure Broadening of the Iodine 2Pi/2 —> 2P3/2
Transition”, J. Chem. Phys. 19, 4680, 1983.
17. S.J. Davis and M.H. VanBenthem, “A Temperature Measurement Technique for COIL-IV”, Laser Digest, AFWL
TR-84-76, 1985.
18. S.J. Davis, “Dye Laser Pumped Atomic Iodine Laser”, Appi Phys. Lett. 32, 656, 1978.
19. S.J. Davis and L. Hanko, “An I2 Row Rate Diagnostic for the Oxygen Iodine Laser”, Laser Digest, AFWL-TR-79-
104, 1979.
72 Proc. SPIE Vol. 4631

20. G.E. Hall, W.J. Marinelli, and P.L. Houston, "Electronic to Vibrational Transfer from I*(52P1/2) to I2(25<V<43)",
J. Phys. Chem. 87, 2153,1983.
21. S.J. Davis and M. VanBenthem, "Detection of Vibrationally Excited I2 in the Iodine Dissociation Region of
Chemical Oxygen-Iodine Chemical Lasers”, J. Phys. Chem. 90, 902, 1986.
22. H.V. Lilenfeld, “Oxygen Iodine Laser Kinetics”, AFWL TR-83-01, Kirtland AFB, NM, 1983.
23. H.V. Lilenfeld, G.R. Bradbum, and F.E. Hovis, “Oxygen Iodine Laser Kinetics”, AFWL-TR-84, 1984.
24. N.L. Rapagnani and S.J. Davis, “Laser Induced Fluorescence Measurements in a Chemical Laser Flowfield”, AIAA
Joum. 17, 1402, 1979.
25. H.V. Lilenfeld and R.J. Richardson, “The ESR Spectrum and Linewidth Measurements of Atomic Iodine”, J.Chem.
Phys. 70, 3859, 1979.
26. M.G. Allen, K.L. Carleton, S.J. Davis, W J. Kessler, and K.R. McManus, AIAA 25th Plasmadynamics and Lasers
Conference, Colorado Springs, CO, June 1994.
27. S.J. Davis, M.G. Allen, W.J. Kessler, K.R. McManus, M.F. Miller and P.A. Mulhall, “Diode Laser-based Sensors
for Chemical Oxygen Iodine Chemical Lasers”, SPIE paper 2702-17, OE-Lase Conference, San Jose, CA, 1996.
28. S.J. Davis, W.J. Kessler, , and M. Bachmann, “Collisional Broadening of Absorption Lines in Water Vapor and
Atomic Iodine Relevant to COIL Diagnostics,” SPIE Paper No. 3612-25, The International Society for Optical
Engineering, San Jose CA, 1999.
29. S.J. Davis, W.J. Kessler, M. Bachmann, P.A. Mulhall, "Collisional Broadening Coefficients for Oxygen and Water
Absorption Lines Used in COIL Diagnostics," SPIE Paper 3268-80, Gas and Chemical Lasers and Intense Beam
Applications, San Jose, CA, 1998.
30. S.J. Davis, W.J. Kessler, and P.K. Keating, “Progress in the Development of Sensors for COIL Devices”, Paper
3931-24, SPIE Gas Phase and Chemical Lasers and Intense Beam Interactions, San Jose, CA, 2000.
31. V.T. Gylys and L.F. Rubin, “Direct Measurement of 02(a1A) and 02(X3Z) in Chemical Oxygen Iodine Lasers with
use of Spontaneous Raman Imaging”, Appl Opt. 37, 1026,1998.
32. W. Zhao, F. Sang, and L. Duo, “Measurement of Chemical Oxygen Iodine Laser Singlet Oxygen Generator
Parameter using Raman Spectroscopy”, Paper 4631-25, Gas and Chemical Lasers and Intense Beam Applications
IV, San Jose, CA, January 2002.
Proc. SPIE Vol. 4631 73

Modeling of the gain, temperature, and iodine dissociation fraction in a supersonic chemical oxygen-iodine laser
B. D. Barmashenko, E. Bruins, D. Furman, V. Rybalkin and S. Rosenwaks Department of Physics, Ben-Gurion University of the Negev, Beer-Sheva 84105, Israel
ABSTRACT
We report on a simple one-dimensional model developed for the fluid dynamics and chemical kinetics in the chemical
oxygen iodine laser (COIL). Two different I2 dissociation mechanisms are tested against the performance of a COIL
device in our laboratory. The two dissociation mechanisms chosen are the celebrated mechanism of Heidner and the
newly suggested mechanism of Heaven. The gain calculated using Heaven’s dissociation mechanism is much lower
than the measured one. Employing Heidner’s mechanism, a surprisingly good agreement is obtained between the
measured and calculated gain and temperature over a wide range of the flow parameters. Other predictions of the
model (larger mixing efficiency and higher temperature with a leak opened downstream of the resonator and gain
decrease along the flow) are also in agreement with the experimental observations.
Keywords: chemical lasers, oxygen, iodine, power lasers
1. INTRODUCTION
The chemically driven oxygen iodine laser (COIL) 1 is the only known example of a high power chemically driven
electronic transition laser. The laser transition, at 1.315 microns, takes place between the spin-orbit levels of the ground
state configuration of the iodine atom, I(5p5 2Pi/2) -> I(5p5 2P3/2). The iodine atoms are pumped by a near resonant
energy transfer from oxygen molecules in the excited singlet-delta state, 02(a!Ag)
02(1A) + I(2P3/2)->02(3S) + I(2P1/2). (1)
02(1A) is produced in a chemical generator by the reaction of gaseous chlorine with a basic hydrogen peroxide solution
(BHP). Mixing of die O^A) with I2 molecules results in their dissociation to iodine atoms which are subsequently
excited via reaction (1).
To understand the kinetic and mixing processes in COILs and optimize the output power it is necessary to have reliable
models describing the COIL operation and, in particular, the small signal gain, iodine dissociation fraction and gas
temperature in the resonator. One and quasi-two-dimensional models of supersonic COILs accounting for both chemical
reactions and mixing processes were developed in 2"6. The calculated values of the power and gain are in reasonable
agreement with experimental measurements performed for a small scale supersonic COIL developed in our laboratory 3’
7 and for the RADICL device, a 5 kW class supersonic COIL, developed at the Air Force Research Laboratory in
Albuquerque, NM 8’9. More sophisticated three-dimensional (3-D) computational fluid dynamics (CFD) models were
developed in 10-13 to take into account non-uniform distribution of the gain and temperature across the flow and, in
particular, the three-dimensional horseshoe structure of the jets injected into the cross flow, shocks and turbulence that
can not be directly modeled using the one and quasi-two-dimensional approaches. These 3-D models, however, are
complex, need very long computation time and to the best of our knowledge are often inapplicable to parametric studies
of the COIL when input parameters are changed continuously over a wide range. At the same time it appears that one-
and quasi-two-dimensional models are able to reproduce most of the essential features of the chemical kinetics, mixing
and hydrodynamics in the active medium of the COIL 5’6. Although these models give distributions of the small signal
gain, temperature and density of 02(!A) only in the flow direction, the computation time is very short and it is possible
to quickly predict performance over a wide range of input parameters (chemical flow rates, position of the mixing point
and stagnation temperature). Since the values of some of the input parameters (the 02(!A) yield, flow rates of the
74
Gas and Chemical Lasers and Intense Beam Applications III, Steven J. Davis, Michael C. Heaven, Editors, Proceedings of SPIE Vol. 4631 (2002) © 2002 SPIE . 0277-786X702/$ 15.00

chlorine and water, stagnation temperature in the subsonic section of the flow and mixing efficiency) were previously
known with very low accuracy it was very difficult to compare the results predicted by the aforementioned one¬
dimensional models with experimental data.
Recently we reported on diagnostic measurements in a slit nozzle supersonic COIL with transonic mixing, operating
without primary buffer gas and with secondary N2 14. Using diode laser based diagnostics we measured the gain and
temperature in the resonator, the 02(!A) yield and water vapor fraction in the subsonic section of the flow. In addition,
the chlorine utilization and gas temperature at the generator exit were measured. In the present paper a simple one¬
dimensional model of the supersonic COIL with transonic injection of iodine is developed and used to simulate the
experimental results obtained in u. This model is similar to the leaky stream tube model developed in 3. The input
parameters of the model were taken from the aforementioned measurements u. The objective of the present modeling
is to provide for accurate calculations of chemical kinetics processes, rather than gas dynamics in the COIL. That is
why most of the gas dynamics properties of the flow such as spatial distributions of the static pressure, static
temperatures in the “cold” runs without chemical reactions, mixing efficiencies and stagnation pressures and
temperatures, were also taken from the experiment. Calculations of the gain, temperature and iodine dissociation
fraction along the flow as a function of the iodine flow rate, the most important parameter affecting both the gain and
dissociation fraction, were carried out. The changes in iodine flow mainly affect the rates of chemical reactions and gas
temperature and have only weak, indirect (via temperature changes) effect on the flow hydrodynamics. In particular,
the iodine jets penetration into the primary flow (proportional to the momentum of the jet at the sonic injection hole and
hence to the stagnation pressure of the secondary flow) is changed by less than 10-15% (depending on the iodine
injector geometry) over the characteristic range of the iodine flow (0 - 0.4 mmole/s), which means that the iodine flow
has a weak influence on the penetration. Our recent measurements 15 of the gain distribution across the flow also
confirm that the penetration is almost unaffected by the iodine flow. Indeed, for small values of the penetration
parameter the gain distribution has bimodal structure with two peaks located higher and lower than the flow centerline
and corresponding to the centerlines of the iodine jets. We observed that the peak positions and hence the iodine
penetration, are almost independent of the iodine flow rate.
Comparison between the calculated and experimental dependencies of the gain and temperature on the iodine flow rate
permits to determine which of the proposed kinetic schemes and sets of rate constants for I2 dissociation, 16 or 17, fits
better to the experimental results. The model was run for different flow rates of chlorine and secondary nitrogen and
different positions of the optical axis along the flow and compared with the experimental results 14.
2. OUTLINE OF THE MODEL
2.1 General assumptions of the model
The model considers a typical configuration of a supersonic COIL 14 in which I2 premixed with nitrogen (secondary
flow) is injected perpendicularly into the main flow (primary flow) composed of 02 [partially excited to C^^a)], H20
and Cl2 (see Fig. 1). The injection occurs in the transonic part of the supersonic slit nozzle through injection holes in
each side (top and bottom). After the injection the gas is brought to supersonic velocity via expansion in the nozzle and
flows through the duct with the floor and the ceiling diverging at an angle of 8° towards the optical resonator. As shown
in 2 the perpendicular injection of the jets into the primary flow results in jets bending, merging of each series of single
jets (injected from the same wall) to form a thin plane jet and jet-induced entrainment of some fraction of the primary
gas into the jets. However, unlike our previous models 2l 3 the present model does not deal with the form and trajectory
of the I2/N2 jets. Instead, just as in 4 and 6, an approach based on description of the injection and penetration processes
by parallel streams is used. It is assumed that after the jets’ bending is completed the two parallel streams are formed in
the critical cross section of the nozzle, the 02 primary stream and the mixed stream containing the entire I2/N2
secondary flow and fraction a p of the primary flow instantly mixed with the secondary flow (see Fig. 2). In what
follows this initial stage of mixing will be referred to as “premixing”. Then the streams undergo supersonic expansion
accompanied by chemical reactions in the mixed stream and gradual entrainment of the primary flow into the mixed
stream (due to diffusion process). This process continues towards the optical resonator where the fraction of the primary
flow entrained into the secondary stream due to diffusion process is indicated as Pp. The total mixing at the optical
Proc. SPIE Vol. 4631 75

axis is defined as the sum of ap and f3p, determined below using the experimentally measured gain spatial profile
across the flow. The model is divided into two main parts:
1. The first part of the model calculates the initial conditions in the primary and mixed streams at the critical cross
section of the flow. The primary stream parameters before mixing with the secondary stream are equal to the critical
flow parameters for Mach number equal to unity, the critical pressure of the primary flow being calculated from the
measured stagnation pressure in the subsonic part of the flow. The stagnation pressure of the secondary flow before
injection holes is found from the given flow rates of the iodine, «I2, nitrogen, wN2, and the stagnation temperature Ts0 of
the secondary flow, taking into account the injection holes discharge coefficient, CV~ 0.7 - 0.8 18. The expansion of the
jets is assumed to be adiabatic, but non-isentropic due to shock waves and viscosity. Due to irreversible effects, the
stagnation pressure drops whereas the stagnation temperature remains unchanged for an adiabatic flow, the stagnation
pressure losses P0L1 being 0.75- 0.9 18. The exact value of P0M in this range has a very small effect on the calculated
values of the gain and temperature. Parameters of the secondary stream before the “premixing” (temperature, velocity
and cross section) are found from the given secondary flow rates, nl2 and «N2, and the stagnation pressure (corrected by
the loss factor P0L}) and temperature of the secondary flow assuming equal static pressures in the primary and
secondary streams. The secondary stream before the “premixing” is, as mentioned above, assumed to be parallel to the
primary stream.
Flow parameters of the primary and mixed streams just after the “premixing” (see Fig. 1) are found from mass,
momentum and energy conservation conditions assuming that the static pressure after premixing is equal to that before
the “premixing”. The constant static pressure approximation during “premixing” is inaccurate since the pressure in the
supersonic expansion changes rapidly away from the sonic line at the nozzle throat. However, this approximation has a
very small effect on the calculations of the gain and temperature in the supersonic section of the flow because most of
the chemical reactions start downstream of the throat.
2. In the second part of the model the mass flow rates of species Z, the temperature Tm(p) and the velocity
Um(p) (the sub indexes “m” and “p” indicate mixed and primary streams, respectively) are calculated by solving the
conservation differential equations, considering the supersonic expansion of the primary and mixed streams, the
entrainment of the primary gas into the mixed layer and the chemical reactions occurring in the mixed layer. The final
conditions of the primary and mixed streams after the “premixing”, as calculated in the first part of the model, serve as
the initial conditions for the differential equations. In order to calculate the dynamical and chemical conditions at every
point until the optical resonator, we assume a spatial dependence of the pressure along the flow. This dependence is
based on the pressures measured at three points in the supersonic section of the flow and the critical pressure, calculated
by the first part of the model. We assume the pressure to change linearly between successive points. In order to take
into account non isentropic effects during the expansion in the slit nozzle (shock waves and boundary layers) we
assumed that, just as for the jet expansion described in the first part of the model, the stagnation pressure in both the
primary and secondary streams drops in the diverging section of the nozzle (from our calculations an exact position of
the pressure drop location has a negligibly small effect on the calculated parameters). Like the loss factor POu, the
stagnation pressure loss factor P0L2 is 0.75- 0.9. It should be noted that with P0U(2) equal to unity the calculated values
of Tmc are smaller than the measured temperatures.
The above-mentioned first-order differential equations are solved numerically using “ode 15s” Matlab computer
program for stiff differential equations with relative error tolerance of 10'3. The output of the program contains the
values of the specific densities, temperature (Tm) and the flow parameters along the flow. The gain g and iodine
dissociation fraction F are given by 19
g=^^([I(2A/2)]m-°.5[I(2/,3/2)U, (2)
and
76 Proc. SPIE Vol. 4631

F = l-®m(l2)/®m0(I2)> (3)
respectively, where cr= 1.29 xl0 17(300/Jm)1/2 cm2 is the stimulated emission cross section for the strongest transition F
— 3 —> F- 4 between the hyperfine sublevels of the iodine atom and ^0(^2) ls initial mass flow rate of I2 before
injection. Since the pressures at the optical axis are smaller than 2 Torr, Doppler approximation for the gain profile is
used in Eq. (2). Running the program with different values of the input parameters gives the dependence of the gain,
temperature and iodine dissociation fraction on these parameters.
2.2 Chemical reaction schemes
The model uses two different sets of chemical reactions suggested in 16,17. The first set of reactions is based on the
mechanism of iodine dissociation suggested by Heidner et al. 16. This set of reactions was adopted in the standard
kinetics package 20, 21 which is used for most computational simulations of COIL devices. Heidner’s mechanism
assumes that vibrationally excited I2(X) is the immediate precursor to atomic iodine in COIL systems and hence that the
dissociation is a two step process requiring at least two 02(!A) molecules to dissociate one I2 .
Recent kinetic measurements and modeling studies carried out by Heaven et al. 17 indicate that these assumptions are
invalid, and that electronically excited I2(A’) is the I atom precursor. Heaven et al. 17 suggested a new model of iodine
dissociation where both I2(A’) and vibrationally excited I2(X) are significant dissociation intermediates. This model
requires at least three 02(1A) molecules to dissociate one I2. The second set of reactions used in our calculations is based
on Heaven’s mechanism of iodine dissociation.
3. CALCULATED RESULTS AND COMPARISON WITH EXPERIMENTAL MEASUREMENTS
3.1 Input parameters of the model
The input parameters of the model were measured in the experiment described in 14. Those parameters are the flow rates
of the different species of primary and secondary flows, the temperature and pressure of both flows in the subsonic part
and the pressure at three different points downstream of the supersonic nozzle exit plane. The cross-sections of the
primary flow in the subsonic part (5 cm2) and of the secondary flow in the sonic part (0.2 cm2 and 0.34 cm2 for
transonic injectors No. 1 and 2, respectively, described in detail in 14), are fixed parameters.
There are three unknown parameters (explained in section 2.1) of the model: (1) the mixing parameter, ap, or the total
mixing efficiency T]mix = ap + pp, (2) the losses in stagnation pressure of the secondary flow when injected into the
primary flow, P0Lh and (3) the losses in stagnation pressure of the flows during the supersonic expansion, P0h. The
values of P0U and P0L2 are established in the following way: (a) the temperature of the gas mixture at the optical axis in
the “cold runs”, i. e., in the absence of iodine flow, is found by extrapolating the measured temperatures to nl2
corresponding to zero gain as described in 14; (b) then, values for P0L1 and P0L2 are selected by which the calculated
temperature of the mixed flow at the optical axis, for zero wl2, is equal to the extrapolated temperature. The previous
procedure is based on the assumption that the iodine flow rate, which is very small compared to the total flow rate, does
not affect the flow dynamics but has a strong effect on the chemical kinetics and hence the pressure losses for any nl2
are the same as in the “cold runs”. The parameter ap is chosen to give the best fit to the experimental results. In
section 3.3 we estimate the parameter ap from experimental measurements of the gain spatial profile across the flow
and compare it to the result obtained for ap from the model. The input parameters of the model are shown in Table 1.
Proc. SPIE Vol. 4631 77

3.2 Comparison of calculated and experimental results
Figs. 3 and 4 show calculated dependencies of g, Tm and F on n\2 for Heidner’s and Heaven’s mechanisms of iodine
dissociation, respectively, for run 1 (Table 1) with nCU = 20 mmole/s and the first position of the optical axis located 5
cm downstream of the injection point. The same figures show experimental dependencies of g and Tm on n\2 obtained in
14. It should be mentioned that F is not measured during the experiment and therefore only the calculated results for F
are presented. It is seen (Fig. 3) that a good agreement is obtained between the calculated and experimental results for
the dissociation mechanism of Heidner. For the model including the dissociation mechanism of Heaven (Fig. 4) the gain
obtained is much smaller than that measured in the same run. The reason for that is that the calculated values of F for
Heaven’s model are much smaller than for Heidner’s model, e. g., for nl2 = 0.33 mmole/s, corresponding to the
maximum measured gain, the values of F are 0.4 and 0.76, for these models, respectively. Calculations show that good
fit between the experimental and calculated results for Heaven’s dissociation mechanism could not be obtained for other
values (between 0 and 1) of the unknown input parameters of the model. In the remainder of this section we will use
only the model which includes Heidner’s mechanism.
In Fig. 3 the dashed lines are the gain and temperature calculated for large diffusion and as can be seen there is only a
slight difference from the results calculated for small diffusion, the total mixing efficiency rjmix being the same for both
cases. Therefore, from now on we will restrict ourselves to the case of small diffusion, which gives a slightly better fit.
Fig. 5 shows the gain and temperature as calculated for the second position of the optical axis, 9 cm downstream of the
injection point, for the same conditions as in Figs. 3 and 4. As there are no sufficient experimental results for these
conditions, only the calculated results are shown. Comparison between Fig. 5 and 3 shows that the gain decreases as the
optical axis is moved downstream from the first position and the temperatures increase due to higher losses. This trend
is also observed experimentally in 14.
Figs. 6 and 7 show that there is a good agreement between the calculated and experimental results for smaller values of
nC 12 (runs 2 and 3, Table 1). Fig. 8 shows the calculated and experimental results for an opened leak downstream of the
cavity. As explained in 15, opening of the leak results in smaller pumping rate and Mach number in the cavity. It should
be noted that to reach an agreement between the calculated and measured values of the gain we assumed (see Table 1)
that the mixing efficiency rjmix for opened leak (~ 0.8) is larger than for closed leak (~ 0.5). This assumption is in good
agreement with both estimates of rjmix using experimental measurements of the gain spatial profile across the flow
presented below in section 3.3 and the conclusions of Ref. 14. The reason for larger mixing for opened leak is that the
Mach number is smaller in this case, resulting in a larger time for mixing. It is worth noting that the values of the static
pressure for opened leak are about 1.5 times larger than for closed leak due to higher back pressure introduced by the
leak. Measurements of the pressure in the supersonic section of the flow show that the pressure decreases
monotonically along the flow which means that there are no jumps in pressure caused by strong shock waves and only
weak oblique shock waves may be present in the flow. These shock waves are therefore not taken into account in our
one-dimensional model. Comparison between Fig. 8 and 3, 6 and 7 shows that the values of Tm and F for opened leak
are higher than for closed leak, which is due to longer residence time of the flow between the injection point and the
optical axis.
3.3 Estimate of the mixing parameter
To estimate the value of rjmix, experiments were carried out where the gain was measured as a function of the height y
perpendicular to the direction of flow 15. Fig. 9 shows the dependencies g(y) for the cases of closed and opened leak
and the same flow conditions as in runs 1 and 4 (Table 1), respectively. It is seen that for the opened leak the gain is
distributed more homogeneously along y than for closed leak.
r}mix can be defined as
78 Proc. SP1E Vol. 4631

(4) Imix =
H
\gdy
_0_
SmaxT^
where H is the height of the flow duct and gmax is the maximum value of the gain. Expression (4) does not take into
account that the gain decreases near the walls not only because of the incomplete mixing but also due to increase in the
gas temperature as a result of the heat transfer from the walls and wall deactivation of I*. The later two processes occur
in the thin boundary layers near the walls, hence Eq. (4) is a good approximation for r]mix 15. The values of rjmix
estimated using Eq. (4) are 0.46 and 0.73 for closed and opened leak, respectively. These values are in excellent
agreement with the values of rjmix used in the model, 0.48 (run 1) and 0.76 (run 4) for closed and opened leak,
respectively.
4. SUMMARY
We tested the one-dimensional model presented in this paper against the performance of the COIL device in our
laboratory. The celebrated Heidner’s mechanism of iodine dissociation gives good agreement between the experimental
and calculated results. The gain calculated using the newly suggested Heaven’s dissociation mechanism is much lower
than measured experimentally. It is shown that the rate of* I2 dissociation for Heaven’s mechanism is smaller than that
calculated using Heidner’s mechanism. A possible reason is that the rate constants for Heaven’s mechanism, obtained in
17 by fitting the calculated to the experimentally measured times of iodine dissociation, are not accurate enough. It is
worth noting that the set of rate constants given in 17 are suggested to model the flow tube results of Heidner et al. 16.
This set, as noted in 17, is not unique and may not model conditions of experiments with the supersonic COIL, lying
outside the range of the data for which it was derived. Although good results are obtained for Heidner’s mechanism, it
suffers from inconsistencies, as discussed in 17. It is very important therefore to measure experimentally the iodine
dissociation fraction in order to decide which dissociation mechanism is closer to reality. But this is not an easy task as
the absorption of I2 molecules in the supersonic portion of the flow is very small, in particular when the gain length is
short, as in our laser (5 cm).
The agreement obtained between the measured and calculated results over a wide range of the flow parameters is
surprisingly good. Other predictions of the model (larger mixing efficiency and higher temperature with a leak opened
downstream of the resonator and gain decrease along the flow) are also in agreement with the experimental
observations.
REFERENCES
1. W. E. McDermott, N. R. Pchelkin, D. J. Benard and R. R. Bousek, “An electronic transition chemical laser,” Appl.
Phys. Lett., vol. 32, pp. 469-470, 1978. 2. B. D. Barmashenko, A. Elior, E. Lebiush and S. Rosenwaks, “Modeling of mixing in chemical oxygen-iodine
lasers: Analytic and numerical solutions and comparison with experiments,” J. Appl. Phys., vol. 75, pp. 7653-7655,
1994.
3. A. Elior, B. D. Barmashenko, E. Lebiush, and S. Rosenwaks, “Experiment and modeling of a small-scale,
supersonic chemical oxygen-iodine laser,” Appl Phys. B, vol 61, pp. 37 - 47, 1995.
4. D. L. Carroll, “Modeling high-pressure chemical oxygen-iodine lasers,” AIAA Journal, vol. 33, pp. 1454-1462,
1995.
5. B. D. Barmashenko and S. Rosenwaks, “Power dependence of chemical oxygen-iodine lasers on iodine
dissociation,” AIAA J., vol. 34, pp. 2569-2574, 1996.
6. T. T. Yang, D. A. Copeland, A. H. Bauer, V. Quan, W. E. McDermott, R. A. Cover, D. M. Smith, “Chemical
Oxygen-Iodine Laser Performance Modeling,” in AIAA 28th Plasmadynamics and Lasers Conf., Atlanta, GA, June
23-25, 1997, paper 97-2384.
Proc. SPIE Vol. 4631 79
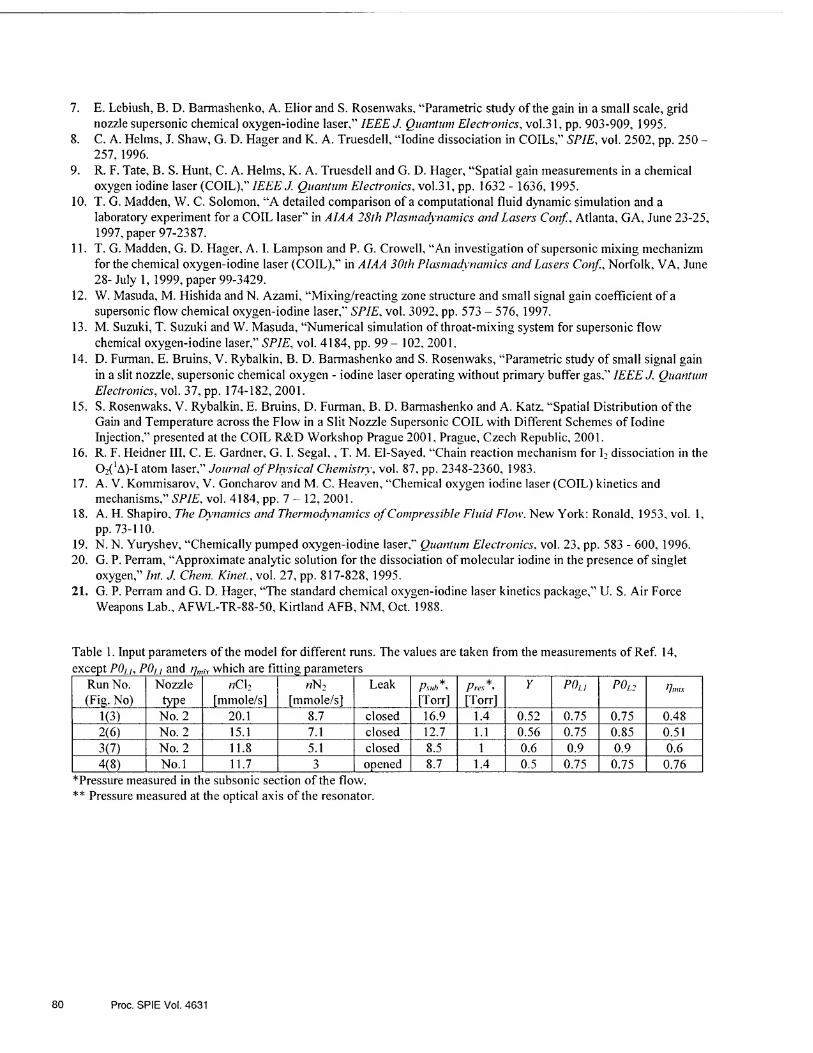
7. E. Lebiush, B. D. Barmashenko, A. Elior and S. Rosenwaks, “Parametric study of the gain in a small scale, grid
nozzle supersonic chemical oxygen-iodine laser,” IEEE J. Quantum Electronics, vol.31, pp. 903-909, 1995.
8. C. A. Helms, J. Shaw, G. D. Hager and K. A. Truesdell, “Iodine dissociation in COILs,” SPIE, vol. 2502, pp. 250 -
257, 1996.
9. R. F. Tate, B. S. Hunt, C. A. Helms, K. A. Truesdell and G. D. Hager, “Spatial gain measurements in a chemical
oxygen iodine laser (COIL),” IEEE J. Quantum Electronics, vol.31, pp. 1632 - 1636, 1995.
10. T. G. Madden, W. C. Solomon, “A detailed comparison of a computational fluid dynamic simulation and a
laboratory experiment for a COIL laser” in AIAA 28th Plasmadynamics and Lasers Conf ', Atlanta, GA, June 23-25,
1997, paper 97-2387.
11. T. G. Madden, G. D. Hager, A. I. Lampson and P. G. Crowell, “An investigation of supersonic mixing mechanizm
for the chemical oxygen-iodine laser (COIL),” in AIAA 30th Plasmadynamics and Lasers Conf., Norfolk, VA, June
28- July 1, 1999, paper 99-3429.
12. W. Masuda, M. Hishida and N. Azami, “Mixing/reacting zone structure and small signal gain coefficient of a
supersonic flow chemical oxygen-iodine laser,” SPIE, vol. 3092, pp. 573 - 576, 1997.
13. M. Suzuki, T. Suzuki and W. Masuda, “Numerical simulation of throat-mixing system for supersonic flow
chemical oxygen-iodine laser,” SPIE, vol. 4184, pp. 99 - 102, 2001.
14. D. Furman, E. Bruins, V. Rybalkin, B. D. Barmashenko and S. Rosenwaks, “Parametric study of small signal gain
in a slit nozzle, supersonic chemical oxygen - iodine laser operating without primary buffer gas,” IEEE J. Quantum
Electronics, vol. 37, pp. 174-182,2001.
15. S. Rosenwaks, V. Rybalkin, E. Bruins, D. Furman, B. D. Barmashenko and A. Katz, “Spatial Distribution of the
Gain and Temperature across the Flow in a Slit Nozzle Supersonic COIL with Different Schemes of Iodine
Injection,” presented at the COIL R&D Workshop Prague 2001, Prague, Czech Republic, 2001.
16. R. F. Heidner ID, C. E. Gardner, G. I. Segal,, T. M. El-Sayed, “Chain reaction mechanism for I2 dissociation in the
02(!A)-I atom laser,” Journal of Physical Chemistry, vol. 87, pp. 2348-2360, 1983.
17. A. V. Kommisarov, V. Goncharov and M. C. Heaven, “Chemical oxygen iodine laser (COIL) kinetics and
mechanisms,” SPIE, vol. 4184, pp. 7- 12, 2001.
18. A. H. Shapiro, The Dynamics and Thermodynamics of Compressible Fluid Flow. New York: Ronald, 1953, vol. 1,
pp. 73-110.
19. N. N. Yuryshev, “Chemically pumped oxygen-iodine laser,” Quantum Electronics, vol. 23, pp. 583 - 600, 1996.
20. G. P. Perram, “Approximate analytic solution for the dissociation of molecular iodine in the presence of singlet
oxygen,” Int J. Chem. Kinet., vol. 27, pp. 817-828, 1995.
21. G. P. Perram and G. D. Hager, “The standard chemical oxygen-iodine laser kinetics package,” U. S. Air Force
Weapons Lab., AFWL-TR-88-50, Kirtland AFB, NM, Oct. 1988.
Table 1. Input parameters of the model for different runs. The values are taken from the measurements of Ref. 14,
except P0U, POu and Omy which are fitting parameters______i_
Run No.
(Fig. No)
Nozzle
..type ....
«C12
[mmole/s]
«n2
[mmole/s]
Leak
183 ■1X231 H P0U P0L2 tjmix
1(3) No. 2 20.1 8.7 closed T<OI 1.4 0.52 0.75 0.75
■n No. 2 15.1 7.1 closed 12.7 1.1 0.56 0.75 0.85
3(7) No. 2 11.8 5.1 closed 8.5 1 0.6 0.9 0.9 0.6
/-S
oo sr No.l 11.7 3 8.7 1.4 0.5 0.75 0.75 0.76
*Pressure measured in the subsonic section of the flow.
** Pressure measured at the optical axis of the resonator.
80 Proc. SPIE Vol. 4631

m, m Secondary floi
Fig. 1 Schematic of the supersonic nozzle with transonic injection of I2 (measures are in millimeters).
Transonic injection point I I
Pre-mixing Diffusion
Flow direction
Fig. 2 Schematic of the mixing concept in the model, a^is the fraction of the primary flow “premixed” with the
secondary flow; f}p is the fraction of the primary flow at the optical axis obtained due to gradual mixing with the
secondary flow during the supersonic expansion.
Proc. SP1E Vol. 4631 81

<u (H
Fig. 3 Calculated (using Heidner’s model) and measured gain g, temperature Tm and iodine dissociation fraction F at the
first position of the cavity optical axis (5 cm downstream of the injection point) as a function of the iodine flow rate.
The chlorine and secondary nitrogen flow rates are 11.7 and 8.7 mmole/s, respectively, the leak downstream of the
cavity is closed (run No. 1, Table 1). Calculated gains and temperatures indicated by 1 (solid line) and 2 (dashed line)
correspond to the slow and fast diffusion, respectively, the total mixing efficiency rjmix being the same for both cases.
Fig. 4 Calculated (using Heaven’s model) and measured gain g, temperature Tm and iodine dissociation fraction F for
the same conditions as in Fig. 3 (run No. 1, Table 1)
82 Proc. SP1E Vol. 4631

s *
<L> CL
E Q>
CO c o cn 0)
CC
Fig. 5 Calculated (using Heidner’s model) gain g, temperature Tm and iodine dissociation fraction F at the second
position of the cavity optical axis (9 cm downstream of the injection point) for the same conditions as in Fig. 3 (run No.
1, Tablet)
<u
3 to i_ a> Q. E <D
CO c o </> Q)
Iodine flow rate [mmole/s]
Fig. 6 Calculated (using Heidner’s model) and measured gain g, temperature Tm and iodine dissociation fraction F at the
first position of the cavity optical axis (5 cm downstream of the injection point) as a function of the iodine flowrate.
The chlorine and secondary nitrogen flow rates are 15.1 and 7.1 mmole/s, respectively, the leak downstream of the
cavity is closed (run No. 2, Table 1)
Proc. SPIE Vof. 4631 83

2 3 i— 0) CL
E a>
kj c o </) 0) tt:
Fig. 7 Calculated (using Heidner’s model) and measured gain g, temperature Tm and iodine dissociation fraction F at the first position of the cavity optical axis (5 cm downstream of the injection point) as a function of the iodine flow rate. The chlorine and secondary nitrogen flow rates are 11.8 and 5.1 mmole/s, respectively, the leak downstream of the cavity is closed (run No. 3, Table 1)
2! 3 E 0) CL
E <D
C3 C o V) <D a:
Fig. 8 Calculated (using Heidner’s model) and measured gain g, temperature Tm and iodine dissociation fraction F at the first position of the cavity optical axis (5 cm downstream of the injection point) as a function of the iodine flow rate. The chlorine and secondary nitrogen flow rates are 11.7 and 3 mmole/s, respectively, the leak downstream of the cavity is opened (run No. 4, Table 1).
84 Proc. SPIE Vo!. 4631

Nor
mal
ized
gai
n [%
/cm
]
Fig. 9 Measured gain distribution in thoy direction across the flow for closed and opened leak.
Proc. SPIE Vol. 4631 85
Invited Paper
A contribution of COIL Laboratory in Prague to the Chemical Oxygen-Iodine Laser research and development
Jarmila Kodymova* and Otomar Spalek
Department of Gas Lasers, Institute of Physics of Academy of Sciences
Prague, Czech Republic
ABSTRACT
The key results gathered in the COIL Laboratory of the Institute of Physics AS in the Czech Republic since 1985 to date on the experimental and theoretical investigation of Chemical Oxygen-Iodine Laser (COIL), and related problems are reviewed in a certain context of historical perspective of the COIL research and development.
Keywords: chemical lasers, oxygen-iodine laser, singlet oxygen, atomic iodine
1. INTRODUCTION
Laser emission at 1.315 pm from magnetic-dipole transition between spin-orbit levels of the ground state configuration of iodine atom
I(Vi/2)(F=3)^I(V3/2)(F=4) (1)
was first observed during flash photolysis of alkyliodides, and since its discovery by Kasper and Pimentel1 in 1964, the iodine photodissociation laser has been developed into systems capable of very high energies. The Prague Asterix Laser System (PALS) is currently one of the largest such facilities in the world, delivering on the target a focud power density up to 1016 W/cm2 in 400 ps (at the fundamental wavelength).2 Lasing mechanism of the Chemical Oxygen-Iodine Laser (COIL) follows the same physical principle, only the lPm upper level is pumped via the energy of singlet delta state of molecular oxygen, 02(1Ag). Unique physical and chemical properties of this metastable species3 that is able to transfer its energy to iodine atom in a near-resonant process, and can be generated chemically with very high efficiency have brought about the exceptional position of COIL among other chemical lasers. The pumping mechanism discovered by Derwent et alA in the seventies, is represented by the reverse reaction process with temperature dependent equilibrium constant
I(2P3/2) + 02('Ag) I(2P1/2) + 02(3Lg) Keq= kjk = 0.75 exp(401.4/T) (2)
Twenty-five years have passed in 2002 since McDermott and his colleagues5 from the Air Force Weapons Laboratory (the Air Force Research Laboratory nowadays) demonstrated the first COIL generation on the miliwatt level. A multihundred-kilowatt version of the COIL facility has been developed and tested for the Airborne Laser program6 since that time. In the meantime, a tremendous theoretical and experimental work has been devoted to understand comprehensively this laser system to bring it to the present technological level. The Prague laboratory joined this investigation in 1985. Theoretical and experimental efforts have been focused on partial problems in the COIL
operation that have concerned, for example, the 02(]Ag) generation for both subsonic and supersonic COIL, the chemical generation of atomic iodine for a COIL, laser performance characteristics in CW and pulsed regime, etc. A brief cross-section through results of this investigation is presented below.
*
Correspondence: Na Slovance 2, 182 21 Prague 8, Czech Republic
Email: [email protected]; Tel: +420 2 66052699; Fax: +420 2 86890527
86 Gas and Chemical Lasers and Intense Beam Applications III, Steven J. Davis, Michael C. Heaven,
Editors, Proceedings of SPIE Vol. 4631 (2002) ©2002 SPIE . 0277-786X702/$ 15.00

2. SINGLET OXYGEN GENERATION
2.1. Mechanism of O^Ag) loss in a low-pressure chemical generator The 25th commemorative COIL session permits mentioning the interesting result following from our “pioneer” work
done on the 02(1Ag) generation by the reaction7
Cl2 + HO/ -> O^'Ag) + H+ + 2C1' fe = 10n cm3morls*1 , (3)
and the mechanism of 02(1A) loss in a low-pressure bubbler-type (sparger) generators8-10 employed for driving the COIL in subsonic flow regime. The 02(1Ag) formed in the liquid film surrounding the bubbled chlorine through the BHP has to diffuse into the gas bubble during the time that the bubble is moving up through the head of liquid (basic solution of hydrogen peroxide, BHP). The gas pressure (consisting of reacting chlorine and formed singlet oxygen) within the two-phase (g-1) bubbling mixture in the reactor column is substantially increased due to a hydrostatic pressure of the liquid column than in the gas space above the liquid head. For example, if the 02 pressure in the generator plenum is 1 Torr, then the 8 cm liquid head provides the hydrostatic pressure of 8 Torr on gas bubbles at the reactor bottom. By this effect, the loss of 02(1Ag) in gas bubbles at the bottom is 64times higher. A mathematical model for estimation of these loss-processes in sparger-type generators was developed considering a variation in the volumetric fraction of gas in g-1 mixture with a distance from reactor bottom, as well as the effect of water vapour
pressure in gas bubbles on the 02(!Ag) loss.9 This simplified model is based on the mass balance for 02(*Ag) over a differential layer dy of the g-1 mixture following from the relation
-NAndrj=r4pSdy (4)
Na - the Avogadro constant, n - molar flow rate of chlorine or oxygen, tj - 02(lAg) yield from layer dy (y - vertical coordinate specifying the distance from reactor bottom), S - reactor cross section, r4 - rate constant of reaction (5).11
O^Ag) + 02(lAg) O^Lg) + 02(3Eg) k5 = (2.7±0.4)xl0-17 cmWV1 (5)
The p factor is the volumetric fraction of gas in the g-1 mixture evaluated from the height of two-phase (foamy) mixture (h) and a liquid height without gas in the reactor (ho), P - 1 - holh. There are two main 02(!Ag) deactivation processes in these generators. First, the 02(*Ag) in the bubble diffuses back to the liquid surrounding it, is attached and deactivated. Secondly, a deactivation/pooling 02(1Ag) self-quenching process occurs in the gas phase (bubble) itself by the reaction (5). This process is pressure dependent (quadratic in 02(]Ag) concentration), and consequently strongly accelerated within g-1 mixture due to the hydrostatic pressure of liquid (in the above given example, by two orders of magnitude). Contrariwise, if the bubble residence time in BHP is too short, not all Cl2 is converted into 02(]Ag) and generator yield is also low. The results of this research are remembered in Fig. 1.
Fig. 1. 02(1Ag) yield as a function of BHP height in reactor. 1- experimental curve, 2 - calculated curve including 02(! A) loss by reaction (5), 3 - calculated curve including another 02(!A) losses (in liquid phase, quenching on reactor wall, transport in duct)
Proc. SPIE Vol. 4631 87

It is evident that this type of singlet oxygen generator can operate at moderate/low pressure, and only way to achieve high mass flow is to increase the generator surface area resulting in a larger 02 collection plenum. This finding was afterwards considered in designs of sparer-type generators.
2.2. Generation of 02(‘Ag) in a high-pressure jet SOG Development of the supersonic COIL during early ninetieth called for a high-pressure 02('Ag) generators. We concentrated on the investigation of the jet-type SOG that was set up first in the Samara COIL laboratory.12 A large surface area of liquid in the form of liquid jets for performing the reaction (3) allowed a substantial reduction of the
generator volume (dimensions), and consequently the 02(’Ag) loss in the gas phase. Velocity of liquid jets is very high (5-20 m/s), which ensures a fast renovation of the gas-liquid boundary, and so minimizes H02' ions depletion from the surface layer. It contributes to lowering the 02('Ag) loss also in the liquid phase. Our effort in the investigation of this generator was focused on some problems in operation of this generator.131*’Experimental results obtained on the small- scale pilot device concerned, for example, the influence of different configurations and diameters of holes (0.3,0.5, and 0.8 mm) in the BHP injector on the jets stability, and a detailed investigation of water vapour estimation in gas exiting the generator. We searched for conditions, at which the water vapour content was minimized.
Water formed during 02(1Ag) generation causes together with peroxide vapor a significant problem in the COIL operation because it quenches the excited state of atomic iodine in very fast processes17
H20 + I(2P1/2) -> H20 + \<?Pyi) kf, = (2.3±0.3)xl0‘12 cmV (6)
H202 + I(2P1/2) -> H202 +1(2Pm) k~j = (1.0±0.2)xl0"n cmV1 (7)
In a supersonic laser, water can cause also undesirable fluid-dynamic effects due to its condensation during the gas expansion cooling.18 Water vapor concentration in gas was estimated by the relation (8) derived from the mass balance
of 02(1Eg) state.19 CH20 = ^4 CA2/ k$ C£ (8)
This species is formed in the pooling reaction (5), and is very efficiently quenched by water molecule.20
02(llg) + H20 02(lAg) + H20 ft* * 6.7xl0'12 cmV1 (9)
Water partial pressure was evaluated from the emissions of O^Eg) and O^'Ag) states for different BHP composition, BHP jets temperature, varying Cl2 flow rate, and different BHP injector configurations. The experimentally obtained data were compared with calculated values of the saturated water vapour pressure above the BHP (for given BHP compositions and temperatures). The both values were nearly the same. The relative water vapour content was well decreasing on increasing the generator pressure. It was the experimental proof that employing the high-pressure jet SOG in the COIL operation reduces a detrimental effect of water.
23. The Einstein coefficient for 02(,Ag) fundamental emission Work on the development of high-pressure jet-type chemical generator of 02(lAg) and the above-described parametric investigations, and simultaneously in the literature opened discussions on the right value of the Einstein coefficient for 02(*Ag) emission at 1.27 pm (^-coefficient) triggered our interest in verification of this coefficient. Mlynczak and Nesbit21 challenged the Badger et a/’s22 value of 2.58 x 10*4 s'1 when they reported a new value of 1.47 x 10⁻⁴ s'1. The
radiative lifetime of O^Ag), xj9*, ~65 min (a half-lifetime -45 min) considered so far in the COIL, increased to ~113 min. A detailed insight into this problem revealed that published values of the Einstein ^-coefficient evaluated by
means of various theoretical approaches and experimental techniques varied in a wide range resulting in xArad from ~53
to —151 min.23’24 This fact could make the evaluation of 02([Ag) concentration in COIL questionable.
To verify a rightness or faultiness of the A-value used so far, the way of employing two independent experimental techniques simultaneously was chosen.25 The electron paramagnetic resonance (EPR) spectroscopy was one method, and the optical emission spectroscopy was the second one supplemented with the mathematical model developed for the
88 Proc. SPIE Vol. 4631
evaluation of C^Ag) concentration from the emission measurements. In this model, we assumed that 02(lAg) molecules are distributed uniformly in the optical cell emitting photons in all directions with a rate, r,
r = AAcA^ = AAPA/RT (10)
Aa~ Einstein coefficient for spontaneous emission of 02(lAg), PA- O^Ag) partial pressure.
The Oa^Ag) concentration, c^, was evaluated from the measured signal of the fundamental emission at 1.27 pm and
declared sensitivity of the photodiode, and the calculated ratio of the 02(1 Ag) emission detected by the photodiode and
the emission of all 02(1Ag) molecules present in the detection cell. The proposed mathematical model was used to evaluated this ratio, in which a photocurrent of the photodiode was directly proportional to a value of the Einstein A-
coefficient substituted into relation (10).25 A quantitative evaluation of the 02(1Ag) concentration by means of the EPR spectroscopy was based on the “double integral method” of EPR spectra processing by the relation25
oo B caEPR= kAW yA dBdB (11)
-00-00
By comparison of the 02(*Ag) concentrations obtained contemporary by both experimental methods and supplemented by the mathematical model, a new value of the Einstein ^-coefficient of (2.24 ± 0.4) x W4 s'1 was obtained. The corresponding 02(lAg) radiative lifetime is - 74 min. Shortly after our first reporting this result, Newman et al.26 published the value of (2.19 ± 0.07) x 10*4 s*1 giving the rAad ~ 76 min.
2.4. Generation of 02(1Ag) in a discharge plasma The theoreticians of our department performed during the eightieth the fundamental investigation on the physical kinetics of high-frequency (hf) glow discharge in oxygen with respect to generation of the a*Ag state for pumping the iodine laser. Coming out from the properties of the electron gas described by solution of the Boltzmann equation for the electron distribution function, the 02(lAg) concentration in the plasma was calculated with precondition that population of this electronic level is driven by electron collisions only. The upper concentration limit of 02(*Ag) achievable in this reaction system was evaluated from the statistical balance between the production and loss processes. The calculated relative population of a1 Ag state, XJN, is shown in Fig. 2 as a function of the hf field parameters N and co {Eeff- effective value of hf field, N - concentration of neutral molecules, co - frequency). It can bee seen that the yield of 02(lAg) in hf discharge plasma in pure oxygen can hardly exceed 15% in the chosen range of parameters. Moreover, it is the maximum 02(*Ag) concentration that might be still reduced by collisions with negative ions present in the plasma, e.g.27
02(*Ag) + O' -> 03 + e kxl~ 3xlO'10 cm3 s*1 (12)
Outside the region of active discharge, the relative 02(*Ag) concentration is even lower (only 3 to 10% in the pressure range of 1-10 Torr). According to this studies, the hf discharge unlikely might produce the a*Ag state in the amount sufficient to sustain the operation of iodine laser pumped by the energy of such generated singlet oxygen. This conclusion was supported by a subsequently performed analysis by Swift28 of the kinetic processes that accompany the
02(!Ag) generation in microwave discharge plasma in pressure range of 1-10 Torr. By these calculations, a maximum attainable relative concentration of 02(!Ag) was 10%.
A current experimental research on plasma discharge generation of 02(1Ag) for pumping the iodine laser (Discharge Oxygen-Iodine Laser, DOIL) is performed by our colleague J. Schmiedberger in his long-time co-operation with Japanese Institutes. The last results were obtained with the generation of radio-frequency plasma of 02+N2+N0 mixture in the hollow electrode jet generator.29 The generator is schematically shown in Fig. 3. The plasma jet was extra chilled reactively with transversely injected mixture of Ar+N02. Adding NO to oxygen enhanced the 02(1Ag) production up to 20% through the energy transfer from electronically excited state of NO molecule to 02. Another increase was achieved when N02 was injected into the reaction system, which caused via certain kinetic processes a lowering in a content of O
Proc. SP1E Vol. 4631 89

and 03 species in the gas mixture. The 02(1Ag) with 32% yield was generated at pressure of 0.43 Torr. In combination of
this rf plasma generator with a transversally injected molecular iodine, atomic iodine emission at 1.315 pm was detected at the laser output mirror by the spectrum analyser. This emission was recalculated to the output power of
-3 nW.29
TO LASER
Fig. 2. Calculated relative concentration of the 02(1Ag) as Fig. 3. Radio-frequency plasma jet generator of C^Ag)
a function of E^N for several values of the parameter co/N: l-2.65xl0'8; 2 -4.7x10‘8; 3-9.4xl0'8; 4-1.33xl0'7; 5 - 1.88x1 O'7; 6 - 2.65x1 O'7 [cmV].
3. ATOMIC IODINE GENERATION
A generation of atomic iodine in the ground state, I(2p3/2), directly in the COIL medium to replace its conventional production from dissociated molecular iodine by 02(!A) opens up a way for potential improvement of the COIL performance. The first is the removal of the 02(*A), energy to dissociate I2, allowing this energy to be extracted as power. The second is the decrease in the molecular weight of the injectant, allowing for faster diffusive mixing, and avoiding negative effect of I2 on the I(2Pi/2) quenching. Also the technical problems induced by special treatment of I2 vapour could be diminished.
With these needs in mind, our efforts has been focused currently on the gas phase chemical method of atomic iodine generation employing a principal reaction
X + HI —» I + HX X = F or Cl (13)
The reaction (13) represents in fact a multiple gas phase chemical processes that occur in the overall reaction system. It involves initially the generation of F and Cl atoms, respectively, in the reaction of molecular fluorine, F2, or chlorine dioxide, C102, with nitrogen oxide, NO. Additionally, each of these processes is composed of multiple individual chemical reactions describing production and loss processes, including species contained in the COIL medium. And finally, this set of processes occurs within a flowing gas with the exothermicity of the reactions, which brings into the system a complication with coupling the chemical kinetics to the fluid dynamics.
The goals of our work on this problem are: 1/ to provide an overview of the current theoretical understanding of the two complex reaction systems, and to fit them to experimental conditions characteristic for a COIL, 2/ to test experimentally the both reaction systems in a flow reactor (a pilot small-scale device) to prove their suitability for a realistic COIL, and 3/ to test prospectively the developed method of atomic iodine generation directly on an adapted supersonic COIL device built in our laboratory. Work towards the first goal has involved, to date, a model based on the generalized one-
90 Proc. SPIE Vol. 4631
dimensional (1-D) flow development, exploring the chemical processes within the reaction systems. The calculations have been performed for physical conditions (pressure, temperature, and flow rates) applicable to a subsonic region (i.e., upstream of the nozzle throat) of the lkW-class supersonic COIL operated in our laboratory. The effects of initial concentration ratio of reactants and different configuration of reactants injection were considered. A rate of I atoms
generation has been investigated in a flow of nitrogen (as a buffer gas), and a reactive stream containing 02(lA). A reaction mechanism for the kinetics of I atoms generation in the (C1+HI+02(1A)) and (F+HI+02(*A)), respectively, system has been developed and sensitivities to key processes in this mechanism have been considered. The modeling provided the concentration profiles of all relevant reaction components and the temperature profile along the reaction path. The results of this relatively rough estimation showed that I atoms can be generated via F atoms with the yield of up to 70%, however, on a rather long reaction path (20-40 cm). The reaction system via Cl atoms provided by these calculations I atom yield 80% on substantially shorter reaction path (-4 cm). For this reason, the later system would meet better the COIL mixing conditions. Atomic iodine could be generated near the critical nozzle plane of the supersonic COIL or during the transonic mixing. The chemical kinetics of fluorine system is however simpler, and all reactants are commercially available in gas cylinders. A detailed description of results on the 1-D modeling of both reaction paths for chemical generation of atomic iodine, and their interpretation were partly published3031, and some advanced results can be found in the paper of this Proceedings.32 A more sophisticated estimation of optimal conditions for I atoms generation needs the 2-D or 3-D modeling, involving also the fluid dynamics effects. This work is planned for a near future.
Work towards the second goal above has involved to date the experimental investigation of I atoms generation via Cl reaction system. A design of the small-scale flow reactor, and the experimental conditions were developed on the basis of the results of the above-mentioned modeling. Preliminary experiments provided atomic iodine with the molar flow rate up to 160 pmol/s, and I yield over 70% (in nitrogen).33 Effects of initial ratio of reactants, and the way of their mixing were studied during the following on investigation. The yields of atomic iodine in the range of 70-100% (related to HI or C102 flow rates) were attained. Some advanced results can be found in the paper of this Proceedings.34 The
experiments on atomic iodine generation in the 02(lA) stream are under way.
4. REPETITIVELY PULSED SUBSONIC COIL
A period of the early ninetieth signified one of the meaningful millstones in the COIL R&D - a demonstration of ability to operate a COIL in the pulsed regime. A prestige of COIL among other laser systems, particularly technological ones, so has increased. The magnetic gain modulation in a COIL could make possible, e.g., a more efficient non-linear conversion of the wavelength 1.315 pm to the second and higher harmonics. A slow (non-pulsed) control of 3-4 gain could be utilized for a continuous regulation of CW power (within 0-100% of the maximum value) without any change of flow or other operation parameters. Further, it could be employed as a method of the output power stabilization by means of the negative feedback controlling the magnetic field intensity in the gain region.
Besides previously investigated pulsed methods applicable to the COIL, like a pulsed UV photolysis of alkyl iodides in gas containing singlet oxygen*’8’ , and electric discharge initiation of I atoms production from alkyl iodides*'8*36, a Q- switching technique either mechanical37 or magneto-optical38 was also applied to a COIL. The optical switching utilizes the phenomenon of suppressing the gain on the basic of the Zeeman effect.39 Owing to a low gain, low output coupling, and near threshold generation in a COIL, the ^-switching showed a disadvantage due to an increase in intracavity losses.
The pulsed technique investigated in our laboratory is also based on principle of the magnetic suppression (modulation) of gain, but the Zeeman effect is induced by externally applied magnetic field on the gain region.40 The small signal gain on the strongest spectral line 3-4 observed in the laser generation in zero magnetic filed is weakened in growing magnetic field, and due to above-mentioned physical characteristics of COIL, rather low magnetic fields are needed to quench the laser generation at 1.315 pm. Such a threshold or under-threshold condition can be expressed by the relation41
(2gM(B)L)f(S0+S')<\ (14)
Proc. SPIE Vol. 4631 91

gu{B) - small-signal gain at magnetic field £, L - gain length, S0 - intracavity losses, Sc - resonator output coupling. Peak power enhancement over cw power can be achieved in the pulsed mode when pulsed power extraction times are short compared to the time that it takes to fill the outcoupled gain volume with fresh “fiiel” (in a subsonic system usually -10'3 s). Energy of the single pulse is given by the average CW power (with zero magnetic field), and the optimal repetition rate. A pulsed length and its enhancement over CW power depend also on a switching off rate of the magnetic field. The gain volume, from which power can be extracted, is limited by deactivation rate of both the singlet oxygen and excited atomic iodine. Provided that this rate is fixed for a particular temperature in the cavity region, the way to increase this volume and thus increase the peak power enhancement is to increase the velocity of the flowing
laser gases, and so to increase the concentrations of 02(1Ag) or atomic iodine or both. Experimental verification of the proposed pulsed technique was performed on the small-scale subsonic COIL device generating the CW output power up to several tenth watts. It was modified to apply magnetic field to the gain cavity from two rectangular coils attached to the laser body made of Plexiglas (see Fig. 4).
Fig. 4. Scheme of set up for magnetic pulsed regime of COIL
A typical oscillogram of the periodically pulsed COIL is shown in Fig. 5 that was recorded for 15 W of the average CW power. The peak enhancement corresponded to the power of 48 W, i.e., the enhancement ratio was 3.2. A length of
single pulse was -200 ps at the rate of magnetic filed pulsing of 0.5 G/ps.4! A maximum peak power enhancement achieved on this experimental configuration was -3.5 only with the repetition rate of -1 kHz. It was given by the relatively long switching off time of the used magnetic field generator. Consequently, extraction of the pulse power could not be fully developed.
Fig. 5. Oscillogram of the repetitively pulsed COIL, upper trace - pulsed magnetic filed (1 ms/div, peak current 250 A); lower trace - laser pulsed power (CW power 15 W, pulsed power 48 W)
92 Proc. SPIE Vol. 4631

Concurrently with our work, the magnetic field nullified-switched gain technique was developed at the AFRL by Hager et ahA1 This technique works on principle of the gain suppressing below the lasing threshold by a static magnetic field that is followed by applying a fast rising current pulse to cancel the cavity magnetic field. A switching off the magnetic
field was very fast in this way (--0.5 ps) resulting in the laser pulse extraction with duration less than 20 ps, and a peak- CW power enhancement ratio of 12.7.
Experimental data on estimation of the “3-4 gain quenching” magnetic field intensity, called a threshold magnetic field, were also collected during this investigation. It is defined as g{Bth) = g,/,((2?=0).43 The magnetic field was continuously increased up to level when the output laser power quenched. The values of g{Bth) evaluated in dependence on iodine molar flow rate in the cavity, and for several values of output coupling parameter are plotted in Fig. 6. This dependence showed a linear character in the overall tested parameters, even though the dependence of laser power, as well as output coupling, on iodine molar flow rate, showed generally maximum for a certain value of iodine concentration in the cavity.
Fig. 6. Dependence of threshold magnetic field on iodine molar flow rate for different output couplings
It can be concluded from these results that a certain value of threshold magnetic field is affected by a set of physical and operation parameters together, particularly by iodine molar flow rates, small signal gain, threshold gain, and output couplings. In spite of the fact that a mutual relation among these parameters is rather complex, we proposed using a dimensionless parameter, the normalized gain defined as the ratio of threshold and small-signal gain (g,/,/g), to evaluate from the experimental data the threshold magnetic field for given conditions. The threshold gain includes the effect of output coupling, intra-resonator losses, and gain length. Iodine flow rate, Doppler and pressure broadening of the laser transition, and also mixing efficiency affect the small signal gain. The dependence of normalized gain on the threshold magnetic field is shown in Fig 7.
Fig. 7. Normalized gain (gtfjg0) in relation to threshold magnetic field
Proc. SPIE Vol. 4631 93
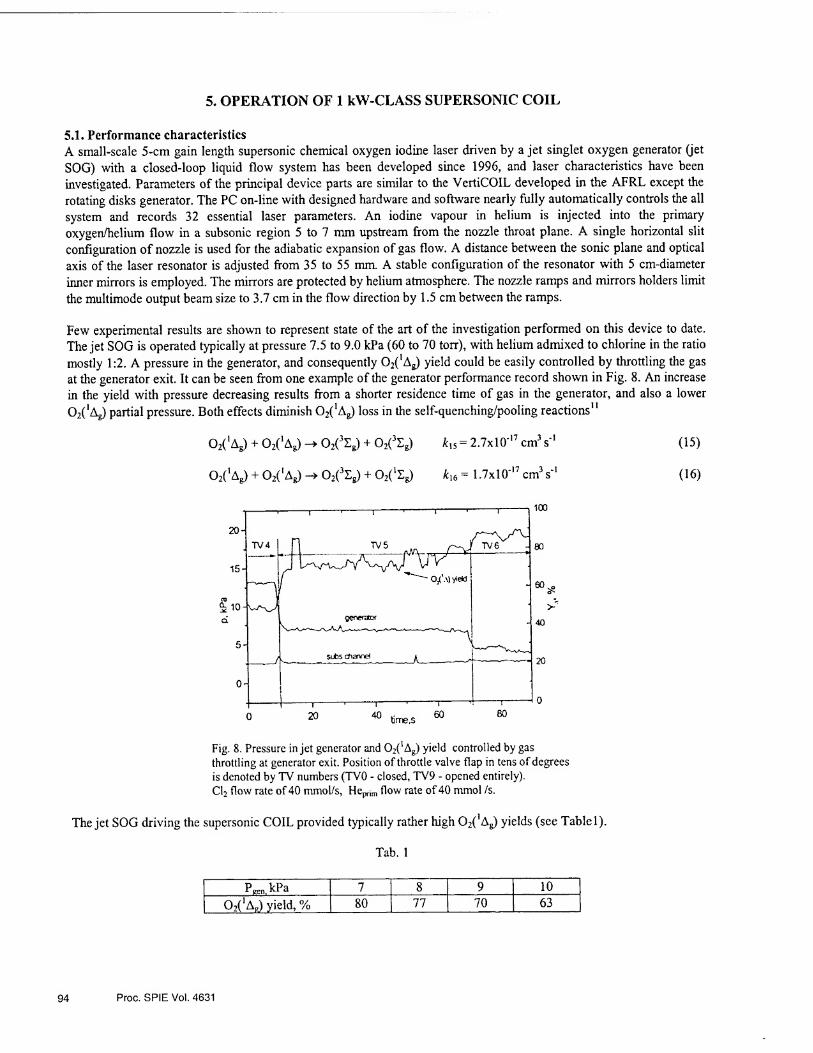
5. OPERATION OF 1 kW-CLASS SUPERSONIC COIL
5.1. Performance characteristics A small-scale 5-cm gain length supersonic chemical oxygen iodine laser driven by a jet singlet oxygen generator (jet SOG) with a closed-loop liquid flow system has been developed since 1996, and laser characteristics have been investigated. Parameters of the principal device parts are similar to the VertiCOIL developed in the AFRL except the rotating disks generator. The PC on-line with designed hardware and software nearly fully automatically controls the all system and records 32 essential laser parameters. An iodine vapour in helium is injected into the primary oxygen/helium flow in a subsonic region 5 to 7 mm upstream from the nozzle throat plane. A single horizontal slit configuration of nozzle is used for the adiabatic expansion of gas flow. A distance between the sonic plane and optical axis of the laser resonator is adjusted from 35 to 55 mm. A stable configuration of the resonator with 5 cm-diameter inner mirrors is employed. The mirrors are protected by helium atmosphere. The nozzle ramps and mirrors holders limit
the multimode output beam size to 3.7 cm in the flow direction by 1.5 cm between the ramps.
Few experimental results are shown to represent state of the art of the investigation performed on this device to date. The jet SOG is operated typically at pressure 7.5 to 9.0 kPa (60 to 70 torr), with helium admixed to chlorine in the ratio
mostly 1:2. A pressure in the generator, and consequently 02(1Ag) yield could be easily controlled by throttling the gas at the generator exit. It can be seen from one example of the generator performance record shown in Fig. 8. An increase in the yield with pressure decreasing results from a shorter residence time of gas in the generator, and also a lower
02(*Ag) partial pressure. Both effects diminish 02(1Ag) loss in the self-quenching/pooling reactions11
Ozt'Ag) + O^'Ag) -»02(3Sg) + O^Eg) *15=2.7xlO ,7cmV (15)
02(1Ag) + OzC'Ag) ->• 02(3Sg) + 02(‘Sg) ki6 = 1.7xl0'17 cm3s' (16)
Fig. 8. Pressure in jet generator and 02(IAg) yield controlled by gas throttling at generator exit. Position of throttle valve flap in tens of degrees is denoted by TV numbers (TVO - closed, TV9 - opened entirely). Cl2 flow rate of 40 mmol/s, Hep™ flow rate of 40 mmol is.
The jet SOG driving the supersonic COIL provided typically rather high 02(,Ag) yields (see Table 1).
Tab. 1
PEen.kPa 7 8 9 10
0,('ac) yield, % 80 77 70 63
94 Proc. SPIE Vol. 4631

Gas dynamic conditions in the whole laser system were tested during a „cold flow run“, i.e., with gaseous nitrogen instead of chlorine was introduced into the primary flow. The average Mach number, Mi, for a subsonic flow ahead of the sonic throat, and the supersonic flow in the resonator region, M2, were evaluated from pressure (Pi,2) in the respective regions of the device, gas molar flow rates, (w), physical properties of the flowing gas (molecular weight, MW, and adiabatic constant, k), stagnation temperature, and the flow cross section.44 The local Mach number, M2\ in the supersonic region was evaluated from the pressure ratio Psta/Ppit (Pstat - static pressure measured at the cavity wall, Ppit - stagnation pressure measured by the Pitot tube in the cavity centreline placed 55 mm from sonic throat)45 The
results are summarized in Table 2. Tab. 2
^N2>
mmol/s «He,
mmol/s Pi, Pa
Pi, Pa
^Pit,
Pa MW,
kg/mol K M, M2 M*
21 90 2055 174 1457 8.6x1 O’3 1.57 0.41 1.94 237
Laser output power was investigated at various iodine flow rates and output couplings. One example of such dependence is shown in Fig. 9. A simplified Rigrod theory46 for saturation intensity was employed to estimate the small signal gain and saturation intensity from these experimental data. The gain of 1.29 x 10'2 cm'1, and the saturation intensity of 5.4 kW/cm2 were evaluated.
The effect of titration ratio [l2]/[02(1Ag)] on laser power was searched also for different output couplings. Fig. 10 illustrates it for two values of generator pressure. The highest power was mostly achieved for [I2]/[02(IAg)] = (5±1)%. The optimum value of 1.7% obtained on the VertiCOIL system47 was significantly lower, however this discrepancy diminishes to 3.1% when the titration ratio is recalculated by dividing the total [02] in VertiCOIL with 02(1Ag) yield (0.55).
r^rrmoi/s
Fig. 9. Laser power as a function of iodine flow rate.
Output coupling 2.83% (Tj+T2), 40 mmol Cl2/s,
80 mmol Heprim/s, 40 mmol Hescc/s.
Fig. 10. Laser power as a function of titration ratio
[I2]/[ C^Ag)] at two pressures in generator
The optimum dilution ratio, [Hesec]/[I2], at maximum attainable laser power was found in the range from 1:30 to 1:70. These measurements were directed to get efficient mixing of the primary gas flow, 02(1Ag)+HePriin, and the secondary gas flow, I2+Hesec. It was estimated by means of the relative penetration factor, ^1= n/7c^\\, The penetration parameters, ;rand ^n, describing the mixing both gas flows are evaluated from their physical properties, and hardware parameters of the device.48
Proc. SPIE Vol. 4631 95

(17) *= («s/«P) [(MsTsPp) / (MpTpPs)]V2
^a=(dAs)/5DAP (18)
n - flow rate, M - molecular weight of gas mixture, T - temperature, P - pressure, d - height of primary flow channel, A - flow cross-section, D - orifice diameter of secondary flow (index p - primary flow, index s - secondary flow). The best mixing conditions resulting in the maximum output power were at the values of between 0.8-1.0.
State of the art of the performance characteristics of the COIL device operated in our laboratory are summarized in Table 3. The laser operation has not been assessed as enough efficient yet. The reason for a rather low chemical efficiency (measured output power) is most probably a bad quality of the resonator mirrors used so far in this laser
system. Tab. 3.
Laser power 430 W
Running time 1.5 min
Chlorine flowrate 37.8 mmol/s
Primary helium diluent 80 mmol/s
Generator pressure 8 kPa (60 Torr)
Chlorine utilization 0.97
Starting BHP molarity 6.7 M H02'
02(1AE) measured yield 0.72
Pressure upstream the nozzle 3.8 kPa (28.5 Torr)
Laser cavity pressure 380 Pa (2.8 Torr)
12 /02 flow rate ratio 0.029
Mirrors reflectivity 0.9995/0.981
Mode length 3.7 cm
Small signal gain (Rigrod) 0.013 cm'1
Saturation intensity 5.4 kW/cm2
Chemical efficiency 0.12
5.2. Small signal gain distribution and cavity temperature evaluation A spatial distribution of the small signal gain, and evaluation of cavity temperature was investigated by means of the Iodine Scan Diode Probe diagnostics developed for a COIL at the PSI , and used first at the AFRL.50 The line-shape of the COIL gain profile was scanned in frequency by a diode laser of narrow line width operating in the region of the COIL transition frequency. The small signal gain, g(v0), was determined using the equation47
I(v0) = Io(v0) exp(g(v0) L) (19)
I^Vo) - line-center probe laser intensity entering the gain region, I(v0) - line-center intensity after amplification through the gain region, L - gain length.
The temperature in terms of the Doppler full width at half-maximum, Avd, was evaluated from the relation47
Avd (7) = 2 v0 / c {In 2 (2 kT/M)}1/2 (20)
v0 - central frequency, c - light velocity within medium, k - the Boltzmann’s constant, M - mass of medium species.
Performed mapping of the gain distribution through the gain region was aimed at the inspection of mixing conditions in the cavity at different experimental conditions, and bearing out our guess at the reason of rather low chemical efficiency of this device (mirrors quality). The results presented below were gathered for the primary gas flow of 40 mmol Cl2/s
96 Proc. SPIE Vol. 4631

and 80 mmol Heprim/s, the secondary gas flow of 40-80 Hesec mmol/s and 1-2 mmol I2/s. The plenum pressure was 3.4 - 4 kPa (25-30 Torr), the cavity pressure measured at the upper wall in the location of the resonator axis was 300-390 Pa (2.2-2.8 torr). The 2.5 mm i.d.-beam of the probe laser was passed through the gain medium parallel to the optical axis. A two-pass configuration of the probe beam was chosen for the data extraction. The probe beam emitter/detector unit and the mirror system for beam alignment were mounted on an assembly of the motorized linear positioning equipment that allowed fast and precise movements either in horizontal direction (x axis) along the gas flow or vertical direction (y axis) perpendicular to the gas flow. The grid of measuring positions is presented in Fig. 11.
Fig. 11. Scheme of probe beam scanning in vertical and horizontal position
Duration of each scan was 13.3 seconds, and the gain data were recorded within 60-100 seconds’ hot runs. One example of the gain distribution curves cross the gain region in the vertical direction measured at three values of 12 flow rate is illustrated in Fig. 12. A parabolic shape of the gain distribution curve indicates that the gas flow velocity across the gain region was inhomogeneous resulting in a slower gas flow at boundary layers (0.5 to 1.5 mm thick) along the cavity walls. In these layers, a remarkable quenching of excited I atoms occurred. Molecular iodine may be also present in these layers which may consume 02(lAg) in its dissociation. The maximum gain was attained at the iodine flow rate of 1.5 mmol I2/s. Similar parabolic distribution of gain was obtained for different distance from the nozzle, but the maximum gain values were attained at different iodine flow rates under constant other conditions. An insufficient mixing of primary and secondary flows (inefficient penetration) could be easily detected by this diagnostics (see Fig. 13). The gain distribution record in this case (40 mmol Hesec/s only) showed two peaks and minimum located in the cavity center, which can be explained by a shortage of iodine is in the center of the cavity.
distance from center, cm distance from center, cm
Fig. 12. Gain distribution in vertical direction, 5.5 cm downstream nozzle throat (resonator axis); for three I2 flow rates; 80 mmol Hesec/s.
Fig. 13. Gain distribution in vertical direction, 5.5 cm downstream nozzle throat (resonator axis); 1.5 mmol Vs, 40 mmol Hesec/s.
A plot of measured gain on evaluated relative penetration factor is shown in Fig. 14. The small signal gain of ~l%/cm was typical for the supersonic COIL device operated in our laboratory at optimal mixing conditions. Comparing it, for
Proc. SPIE Vol. 4631 97

example, with the gain attainable on the RADICL device (~1,2 %/cm), and considering also twice higher cavity pressure in this laser system (5.8 Torr), there is a prospect to enhance the gain of our COIL driven by jet SOG when the
cavity pressure is increased.
Fig. 14. Gain in the cavity center in relation to calculated relative penetration factor; 5.5 cm from the nozzle throat (resonator axis), 1.5 mmol I2/s, 80 mmol Hscc/s.
The gas temperature calculated from these measurements was not homogeneous across the whole cavity. In the boundary layers when the probe beam recorded weak emission or even absorption, the gas temperature was much higher (>350 K) than in the cavity center (175 - 205 K). A low gas velocity and high rate of exothermic processes per unit length in the boundary layers near the walls to the cavity center can explain it.
6. SUMMARY
The above-presented results have been extracted from a number of publications and reports that have come out from the COIL Laboratory in Prague. We hope that our current and future research on COIL related problems contributes and will contribute to the advanced COIL technology.
ACKNOWLEDGMENTS
The authors wish to recognize all colleagues who played significant roles in the presented research over the years. This work was partly done as a research program within the contracts with the USAF EOARD, partly in the framework of the Research Laser Centre at the Institute of Physics supported by the Ministry of Education (project LN00A100 and
ME442).
REFERENCES
1. J.V.V. Kasper and G.C. Pimentel, “Atomic iodine photodissociation laser”, Appl. Phys. Lett. 5, pp. 231-233, 1964.
2. K. Rohlena, B. Rus, L. Juha, J. Skdla, B. Kralikovd, K. Jungwirth, J. Ullschmied, K.J. Witte, H. Baumhacker, “Prague Asterix Laser System (PALS) and its upgrade”, Proc. SPIE 4184, pp. 132-136, 2000.
3. D.R. Kearns, “Physical and chemical properties of singlet molecular oxygen”, Chem. Review 71, pp. 395-427, 1971.
4. R.G. Derwent, D.R. Kearns, and B.A. Thrush, “The excitation of iodine by singlet molecular oxygen”, Chem. Phys.
Lett. 6, pp. 115-116, 1970. 5. W.E. McDermott, N.R. Pchelkin, D.J. Benard, and R.R. Bousek, “An electronic transition chemical laser”, Appl.
Phys. Lett. 32, pp. 469-470, 1978.
98 Proc. SPIE Vol. 4631

6. S.E. Lamberson, “The Airborne Laser”, Proc. SPIE 4184, pp. 1-6,2000. 7. R.J. Richardson, J.D. Kelley, and C.E. Wiswall, “C^1 Ag) generation mechanism in the chemically pumped iodine
laser”, J. Appl. Phys. 52, pp. 1066-1071,1981 8. O. Spalek, J. Kodymovd, and A. Hir§l, influence of hydrostatic pressure on C^'Ag) yield in a bubbler-type
chemical generator11, J. Appl. Phys. 62,2208-2211,1987. 9. O. Spalek, J. Kodymovd, and A. HirSl, “Theoretical modelling of singlet oxygen bubbled generator for
chemical oxygen-iodine laser”, Proc. SPIE 1031, pp. 319-323, 1988. 10. J. Kodymovd, O.Spalek, and A. HirSl, „02('Ag) loss-mechanism in bubbler-type chemical generators11, Proc. bit.
Worshop on Iodine Lasers, BechynS, Czech Republic, pp. 230-235,1986. 11. A.I. Didjukov, Yu. A. Kulagin, L.A. Shelepin, and V.N. Yarygina, “Analysis of processes rate in presence of singlet
oxygen molecule” (in Russian), Quantum Electronics 16, pp. 892-904,1989. 12. N.F. Balan, R.M. Gizadullin, M.V. Zagidullin, A.Yu. Kurov, V.D. Nikolaev, V.M. Pitchkasov, and M.I. Svistun,
Quantum Electron, 16, pp. 2197-2200,1989. 13. O. Spalek and J. Kodymovd, “Influence of arrangement of liquid jets on operation of jet singlet oxygen generator”,
Proc. SPIE 2767, pp. 237-244,1995. 14. O. Spalek and J. Kodymovd “Optimization of jet singlet oxygen generator”, Proc. SPIE 3092, pp. 565-568,1996. 15. O. Spalek and J. Kodymov6,“Singlet oxygen generator for a supersonic chemical oxygen-iodine laser. Parametric
study of recovery of chemicals”, Proc. SPIE 2987, pp. 131-136,1996. 16. J. Kodymovd and O. Spalek, “Performance characteristics of jet-type generator of singlet oxygen for supersonic
chemical oxygen-iodine laser”, Jpn. J. Appl. Phys. 37, pp. 117-121,1998. 17. D.H. Burde and R.A.. McFarlane, “Collisional quenching of excited iodine atoms I(5Pi/2) by selected molecules”,
J. Chem. Phys. 64, pp. 1850-1851, 1976. 18. R. Dickerson, J. Hon and J. Blauer, “Modeling the rotating disk generators”, AIAA 92-3007, pp. 1-13,1992. 19. J. Bonnet, D. David, E. Georges, B. Laporcq, and C. Verdier, “Experimental analysis of chemical oxygen-iodine
lasers11, Appl. Phys. Let. 45, pp. 1009-1011,1984. 20. R.G. Aviles, D.F. Muller, and P.L. Houson, “Quenching of laser-excited 02(bx2,g) by C02, H20, and I2”, Appl.
Phys. Lett. 37, pp. 358-360,1980. 21. M. G. Mlynczak and D.J. Nesbitt, “The Einstein coefficient for spontaneous emission of the 02('Ag) state”,
Geophys. Res. Lett. 22, pp. 1381-1384,1995. 22. R.B. Badger, A.C. Wright, and R.T. Whitloch, “Absolute intensities of the discrete and continuous absorption
bands of oxygen gas at 1.26 and 1.065 p and the radiative lifetime of the 'Ag state of oxygen”, J. Chem. Phys. 43, pp. 43454350,1965.
23. O. Spalek, J. Kodymovd, V. Bdlek, P. Stopka, and I. MiCek, “Attempt to verify experimentally Einstein A- coefflcient used for (^(’Ag) determination in COIL, Proc. SPIE 3574, pp. 550-559,1998.
24. J. Kodymovd and O. Spalek, 1102(,Ag) radiative lifetime: Contribution to discussion on the Einstein ^-coefficient used in COIL for 02('Ag) determination from fundamental emission”, Proc. SPIE, 3612, pp. 92-99,1999.
25. O. Spalek, J. Kodymovd, P. Stopka, and I. MiCek, “Experimental verification of the Einstein A-coefficient used for evaluation of 02(lAg) concentration in the chemical oxygen-iodine laser”, J. Phys. B: At. Mol. Opt. 32, pp. 1885- 1892,1999.
26. S. M. Newman, I.C. Lane, A. J. Orr-Ewing, D.A. Newnham and J. Ballard, “Integrated absorption intensity and Einstein coefficients for the 02 a1 Ag - X3Sg‘ 0,0 transition: A comparison of cavity ringdown and high resolution Fourier transform spectroscopy with a long-path absorption cell”, J. Chem. Phys. 110, pp. 10749-10757,1999.
27. K. MaSek and K.Rohlena, “Physical kinetics of a hf glow discharge in oxygen. Generation of the a'Ag state for pumping in an iodine laser”, Czech J. Phys. B34, pp. 1227-1234,1984.
28. K. Swift, “Microwave excitation of oxygen C>2(lA) for an oxygen-iodine laser11, Forschungbericht, DFVLR Institute fur Technische Physik, Stuttgart, 89-23, pp. 1-39, 1989.
29. J. Schmiedberger and H. Fujii, “Radio-frequency plasma jet generator of singlet delta oxygen with high yield”, Appl. Phys. Lett. 78, pp. 2649-2651,2001.
30. V. Jirdsek, O. Spalek, J. Kodymovd, “Modelling of chemical generation of atomic iodine for chemical oxygen- iodine laser”, Proc. SPIE 4184, pp. 103-106, 2000.
31. V. Jirdsek, O. Spalek, J. Kodymovd, and M. Censky, ’’Chemical generation of atomic iodine for chemical oxygen- iodine laser. I. Modelling of reaction systems.”, Chem. Physics 269, pp. 167-178,2001.
Proc. SPIE Vol. 4631 99
32. V. Jirdsek, O. Spalek, J. Kodymovd, and M. Censky, “Modeling of the chemical generation of atomic iodine in a chemical oxygen-iodine laser”, Proc. SPIE of this conference (submitted for publication).
33. O. Spalek, V. Jirdsek, J. Kodymovd, I. Jakubec, and M. Censky, “Preliminary experimental results on chemical generation of atomic iodine for a COIL”, Proc. SPIE 4184, pp. 111-115,2000.
34. O. Spalek, V. Jir&sek,, M. Censky, J. Kodymovd, and I. Jakubec, “Chemical generation of atomic iodine for COIL”, Proc. SPIE of this conference (submitted for publication).
35. N.G. Basov, N.P. Vagin, P.G. Kryukov, D.Kh. Nurligareev, V.S. Pazyuk, and N.N. Yuryshev, “CH3I and n-C3F7I as donors of iodine atoms for a pulsed oxygen-iodine chemical laser”, (in Russian), Quantum electronics 11, pp. 1893-1894,1984.
36. R. Zhang, F. Chen, X. Song, Q. Xu, C. Huan, Q. Zhuang, and C. Zhang, “Photolysis/electrical discharge initiated pulsed chemical oxygen-iodine lasers using alkyliodides as the iodine source”, Proc. SPIE 1031, pp. 308-3111, 1988.
37. F. Matsuzaka, T. Ohga, M. Imachi, and T. Uchyiama, “^-switching operation of chemical oxygen-iodine laser”, Proc. Ifh Int. Conference on Laser Applications, New Orleans, LA, pp. 223-227,1989.
38. R. Highland, P. Crowell, and G. Hager,”A 630 watt average power ^-switched chemical oxygen-iodine laser”, Proc. 12th Int. Conference on Laser Applications, New Orleans, LA, pp. 228-236,1989.
39. I.M. Belousova, B.D. Bobrov, V.M. Kiselev, V. N. Kurzenkov, and P.l. Krepostnov, “I127 atom in a magnetic field” Optika i Spekroskopia 21, pp. 38-47,1974.
40. J. Schmiedberger, J. Kodymovd, J. Kovdf, O.Spalek, and P. Trenda, “Modulation of oxygen-iodine laser”, Patent No. 276690,1990 (Czech Republic), Patent No. 5,199,041,1993 (USA).
41. J. Schmiedberger, J. Kodymovd, J. Kovdf, O.Spalek, and P. Trenda, “Magnetic modulation of gain in a chemical oxygen-iodine laser",IEEEJ. Quant. Electron. 27,1262-1264,1991.
42. G.D. Hager, D. Kopf, D. Plummer, T. Salsich, and P. Crowell, “Demonstration of a repetitively pulsed magnetically gain switched chemical oxygen-iodine laser11, Proc. SPIE 1810, pp. 509-551,1992.
43. J. Schmiedberger, O. Spalek, J. Kodymovd, and J. Kovdf, “Experimental study of magnetic quenching of laser generation in COIL”, Proc. SPIE 1810, pp. 521-524,1992.
44. A.H. Shapiro, The Dynamics and Thermodynamics of Compressible Fluids Flow, Vol. I. p. 82, 1953. 45. L. Horwath, Modern Development in Fluid Dynamics High Speed Flow, (in Russian) Vol. II, 1956. 46. W.W. Rigrod, “Gain saturation and output power of optical masers” J. Appl. Phys. 14, pp. 2602-2609,1963. 47. T.L. Rittenhouse, S.P. Phipps, and Ch.A. Helms, “Performance of a high-efficiency 5-cm gain length supersonic
chemical oxygen-iodine laser”, IEEE J. Quant. Electronics 35, pp. 857-866,1999. 48. J.E. Scott, J.L.R. Shaw, K.A. Truesdell, G.D. Hager, C.A. Helms, “Design considerations for the chemical oxygen-
iodine supersonic mixing nozzle” AIAA paper 94-2436, pp. 1-7, 1994. 49. S.J. Davis, M.G. Allen, W.J. Kessler, K.R. McManus, M.F. Miller, and P.A. Mulhall, “Diode laser-based sensors
for chemical oxygen-iodine lasers”, Proc. SPIE 2702, pp. 195-201, 1996. 50. R.F. Tate, B.S. Hunt, C.A. Helms, K.A. Truesdell, and G.D. Hager: “Spatial Gain measurements in a Chemical
Oxygen Iodine laser (COIL) ”, IEEEJ. Quant. Electronics 31, pp. 1632-1636, 1995.
100 Proc. SPIE Vol. 4631

Invited Paper
COIL technology development at Boeing
Stephen C. Hurlock*, The Boeing Company, Canoga Park, CA
ABSTRACT
The historical COIL contributions at the McDonnell Douglas Research Laboratory, the Rocketdyne Division of Rockwell International and Boeing’s Laser and Electro-Optic Systems organization are briefly described. The latter organization now contains the capabilities of the two heritage organizations. Boeing’s new high pressure sealed COIL is also described.
1. INTRODUCTION AND HISTORICAL BACKGROUND
Two industrial organizations participating in the early COIL developments were the McDonnell Douglas Research Laboratory and the Rocketdyne Division of Rockwell International. Both of these are now part of The Boeing Company and their laser and electro-optics capabilities have been incorporated into Boeing’s Laser and Electro-Optic Systems organization. MDRL was the first industrial organization (and second only to the Air Force weapons Laboratory ‘) to report a successful COIL 2. Rocketdyne was the first industrial organization to win a competitive award for COIL development3, This heritage has continued unbroken over the intervening years and many contributions to COIL technology have been made by the individual and combined organizations. Boeing continues to be a major force in the COIL community, advancing the technology both incrementally and discontinuously through experiments, testing, and analysis sponsored by U.S. Government contracts and by Company discretionary resources. This paper gives a brief account of that historical background, provides a summary of the highlights of some of Boeing’s contributions, and then proceeds to describe Boeing’s recent work, which has resulted in the development and demonstration of a new type of COIL laser system.
2. HIGHLIGHTS OF TECHNOLOGY DEVELOPMENT AT BOEING
Over the years since 1978, the organizations and individuals belonging to what is now Boeing’s Laser and Electro-Optic Systems organization have explored and developed a huge number of concepts for advancing COIL technology in virtually every aspect of the laser and a broad range of applications. The paragraphs below present a brief sampling of this activity.
2.1 Oxygen Generators
Both at MDRL and Rocketdyne, just about every conceivable type of gas-liquid contact device was explored for 02(lA) generators, from spargers, through wetted wall devices, aerosols, and jets, with many variants along the way. Novel chemistry as well as detailed parametric characterization of BHP-CI2 chemistry was examined. A recent innovation eliminates the solids formation in BHP, which has plagued many researchers4.
The first O^A) generator developed at Boeing used a refrigerated rotating surface as a support for the gas-liquid contact surface. Similar to the modem rotating disk generators, this device had a scraper to remove spent liquid from the rotating surface 3. Another wetted wall generator configuration which was very successful in the early years employed static commercial mixers with relatively high surface area wetted by flowing BHP, with co-flow or counter-flow Cl2, with or without diluent. These were scaled by over lOOOx in Cl2 flow and achieved 90% Cl2 utilization and > 70% BHP utilization in a single pass. A small-scale version of one of these devices, with N2 diluent added at the exit, was the first to report 02(‘A) yields in excess of 70%. Boeing also explored a variety of aerosol configurations, coupled to a variety of separators. More recently, the full gamut of high-pressure jet generators with He diluent was explored, with counter¬ flow configurations being the must successful 5. The generator used in our new laser is a diluent-free cross-flow jet generator which delivers - 20 Torr of 02 at - 65% yield, ~ 90% Cl2 utilization, and - 1 Torr of H20. The gas-liquid separation allows only ~ 2% of the gas to exit with the liquid, while the gas product is effectively liquid-free.
Gas and Chemical Lasers and Intense Beam Applications 111, Steven J. Davis, Michael C. Heaven, Editors, Proceedings of SPIE Vol. 4631 (2002) © 2002 SPIE • 0277-786X/02/$ 15.00 101

2.2 Nozzles
Over the past 25 years, COIL nozzle development has not seen as much attention as 02(!A) generator development. The “Classical COIL Nozzle” was developed at Boeing in 1981-83 and has been the standard for helium-diluted COILs. It remains in use virtually unchanged today. The nozzle which we developed for our new laser is a totally different approach, designed for use with heavier diluents, where it can lead to significant improvements in system pressure recovery performance. The two approaches and their differences are illustrated later in this paper.
2.3 Pressure recovery
Conventional and advanced pressure recovery technologies have been developed and used at Boeing over the years. Bank blowers at the outboard ends of the nozzle is a technology that has been successfully adapted to COILs from Gas Dynamic Laser (GDL) and HF/DF chemical laser technology. Likewise, conventional diffusers, with and without sidewall energizers, have been adapted to COIL. Boeing successfully developed an advanced normal shock diffuser technology and applied it to COIL 6‘7. All of these approaches were applied to COILs using helium diluent. With our new laser, the pressure recovery potential of the cavity exit flow is at least 100 Torr, using conventional diffuser
technology.
2.4 Exhaust management
Boeing has used mechanical pumps and ejectors for much of the laboratory development work with COILs. More recently, a large, evacuated catch vessel has proved effective and convenient, and works especially well with a laser like ours, which has a relatively high diffuser exit pressure. In the early years, chemical pump technology based on a variety of reactive materials was explored. Our new laser includes a sealed exhaust system in which cryogenically cooled zeolite is used to adsorb the laser exhaust8’9.
3. HIGH PRESSURE SEALED COIL
3.1 Introduction
We refer here to the conventional or classical approach to COIL as that in which the CI2 in the generator is diluted by He at significant levels and the I2 is injected into the generator effluent in the subsonic region of slit nozzles. The injection is accomplished via an array of penetrating jets of I2 diluted and carried by He. Mixing occurs in the subsonic, transonic and supersonic regions of the nozzle and cavity flow, with much of the mixing completed by the nozzle exit plane. Nozzle expansion typically leads to velocities near Mach 2 in this technology ,0. This approach was developed first at Boeing in the early ‘80s under company and then U.S. Air Force sponsorship. It has been the basis of most supersonic COIL work until recently. A schematic of a typical COIL based on this technology is shown in Figure 1, where it is described as low pressure COIL technology, based on the diffuser exit pressure of 10-20 Torr.
In contrast, the newer technology described here, developed at Boeing in 1997-99, uses an 02(!A) generator with no diluent. The generator effluent is expanded to approximately Mach 1 as it enters the laser cavity. There, I2 is introduced along with N2 as a diluent in a supersonic nozzle, which expands the flow to Mach 5 under our typical conditions. This flow, in addition to introducing the I2, mixes with and transfers momentum to the Mach 1 generator flow and accelerates it, resulting in a mixed Mach number of 3 - 3.5 at the cavity exit. A schematic of a typical COIL based on this technology is shown in Figure 2, where the diffuser exit pressure is shown as 100-200 Torr, leading to the designation of high pressure COIL technology. In addition to the obvious advantages of much higher recovery pressure, this technology also results in a significantly lower static temperature in the cavity, providing kinetic and threshold
enhancements to power extraction.
3.2 CFD analysis of nozzle mixing
Although this new technology appears very attractive, it presents a real challenge in achieving good mixing in the short times (and thus short flow distances) required by COIL kinetics. Our approach to developing a solution to this challenge has been to define conceptual nozzle designs and then use iterative CFD analysis and other analyses to determine the best configuration. Slit nozzles were selected to minimize boundary layer losses. Our design goal was to have a nozzle that achieved reasonably good mixing within 8-10 cm of flow length and essentially complete mixing by 20 cm, which was a
102 Proc. SPIE Vol. 4631

nominal power extraction distance. Figure 3 shows the parameters of the selected design in terms of upstream and downstream flows as well as the framework of the calculations.
In order to meet the stringent mixing length target, mixing aids were needed, and their dimensionality was varied to achieve the goal. The nozzle which was designed using this approach is shown in Figure 4. A CFD result for this nozzle is shown in Figure 5, where it is seen that the goal of good mixing by 8-10 cm was achieved. Using flow composition parameters from Figure 3, complete mixing would be represented when the N2 fraction is 0.83. More detailed discussion of the design analysis has been reported previously u.
3.3 Cold flow testing of selected nozzle
As a design validation, a test article was fabricated and tested in cold flow. The nozzle bank, shown in Figure 6, contained three ejector nozzles of the same length, spacing, and manufacturing methods as the full laser nozzle. The oxygen generator was represented by a plenum upstream of the nozzle bank. The bank included two full and two half oxygen nozzles to feed the downstream cavity, which was a rectangular duct with no divergence, followed by a diffuser section with straight sidewalls and 6° divergence top and bottom. Pitot probe scans were made in the horizontal direction at three downstream locations. Vertical scans were also made. Some horizontal scan data are included in Figure 6, and show high peak pressures and significant structure at the upstream location (3.2 cm downstream of the nozzle exit plane), while the structure has been largely removed at the most downstream (20.7 cm) location. Elimination of spatial variation in the Pitot pressure is interpreted as indicative of completeness of mixing. This work has been described in more detail previously 12.
In addition to the Pitot scans to evaluate mixing, experiments were conducted to evaluate pressure recovery potential. In these experiments, the valve connecting the experiment to the facility vacuum system was gradually closed while monitoring the pressure at the diffuser exit and the pressure in the straight-walled duct representing the laser cavity. Results are presented in Figure 7, where the cavity pressure is seen to remain constant at about 10 Torr until the diffuser breaks back and the cavity unstarts, which occurs at back pressures between 90 and 100 Torr for the two test cycles shown. This indicates a pressure recovery of 100 Torr, achieved with very conventional diffuser technology. This work has also been reported previously n.
3.4 Laser system description
Incorporating the selected nozzle design, a hypersonic COIL laser test bed was designed, fabricated, installed and tested 13. The device, seen in Figure 8, was designated as the 1 mole laser, because the target generator flow was 1 gmol/s of Cl2, with no diluent. Testing results led to 0.9 gmol/s as the optimum flow for this device. Because the new nozzle concept requires a high pressure iodine source, a new high pressure I2 vaporizer was developed under contract by General Atomics. This system, capable of delivering I2 at 100 psia and higher is shown in Figure 9. The exhaust from this new laser contains only 02 and N2, with small amounts of H20, Cl2 and I2. This composition, unlike that from the low pressure technology, which contains large amounts of helium, can be adsorbed by commercial adsorbents. Boeing exploited this feature by adding an adsorber bed to the system, resulting in a sealed laser with no exhaust. The adsorber selected was cryogenically cooled zeolite, also referred to as molecular sieve material. The sealed exhaust system may be seen in Figure 10.
3.5 Laser system testing
The system was highly instrumented, including a large number of pressure and temperature measurements to measure the reactant and diluent flows as well as to characterize the gas and liquid flow through the generator, nozzle, cavity, diffuser and exhaust management system. Flow visualization employed video cameras. A suite of chemical diagnostics helped to characterize the flow composition. Another suite of optical diagnostics was used to measure the outcoupled beam characteristics.
Measurements at the generator exit included P, T, [02(IA)], [02(!E)], [Cl2], and [H20], which allowed chlorine utilization and 02(*A) yield to be determined. Another measurement in the BHP effluent allowed its gas content to be determined. Optical emissions at the generator exit and in the laser cavity were collected using the fiber bundle arrangement shown in
Figure 11, which allowed simultaneous recording of filtered emission (in-band emission) for 02(‘A) - 02(3£), 02(*Z) - 02(3Z), as well as resolved emission using visible and infrared optical multichannel analyzers (OMAs). Some spectra
Proc. SPIE Vol. 4631 103
from these OMAs are shown in Figure 12. The performance of the oxygen generator, averaged over all of the 0.9 gmol/s
tests, is summarized in Figure 13.
Optical bundles were also positioned to collect emission from the cavity and an example visible wavelength OMA spectral record with time evolution is shown in Figure 14. Early in the test, the same 02 emission features as shown in Figure 13 are evident. As the I2 is turned on and its flow ramped up, the I2(B)-I2(X) emission dominates this spectral
region, but the influence of pooling on [0^‘Z)] can be seen.
The diagnostic suite to outcouple a beam and to characterize the beam included a resonator, a calorimeter, a fast flux monitor, and a mode footprint monitor. These may be seen in the layout of Figure 15 and the photographs of Figure 16. The laser resonator was a half-symmetrical stable resonator with a partially transparent dielectric on a transparent flat substrate and a high reflectivity dielectric on a transparent spherical substrate. Total energy in the high power beam was measured using a full-beam, full-power calorimeter. A full-beam sample of the power leaking through the high reflectivity mirror was measured by a fast flux monitor, whose signal was converted to power by normalization of the integrated signal to the energy measured by the calorimeter. The mode footprint (beam footprint) was recorded using an infrared video camera viewing a diffuse scatter plate located behind the high reflectivity resonator mirror.
Representative power vs. time records for four tests are shown in Figure 17. Three of the tests involved increasing the I2 flow and show attendant power increases. In the fourth, the I2 flow was constant and the sealed exhaust system was operating. In some of the power records, transient events are seen. These were determined to be transient increases in extracted power and indicate that significantly more power is available in the flow than we were able to extract in a steady-state fashion. Comparisons of the new laser performance with helium diluent results for other lasers are shown in Figure 18, where chemical efficiency is plotted against the well-known P»x parameter. The steady-state performance is comparable with the best of the helium data base, while the transient results, if they could be achieved in steady state,
would represent a significant improvement.
Finally, the new laser, because of the I2 delivery and injection method, results in mixing within the supersonic cavity flow, in contrast to the conventional low-pressure helium diluent technology, where the flow enters the cavity in a nearly premixed state. This latter condition has required developers to deal with the well known sugar-scoop intensity problem. The mode footprint images, shown in Figure 19, reveal that the new laser has a uniform beam intensity and does not exhibit a sugar-scoop effect.
4, SUMMARY
Boeing’s Laser and Electro-Optical Systems organization, and its predecessor Rockwell International and McDonnell Douglas organizations, have been contributing to COIL technology advancements for only slightly less than the 25 years being commemorated by this session. These contributions have come in nearly every aspect of the technologies needed to bring this laser from the laboratory to useful application in a variety of areas. A few of these contributions in the oxygen generator, nozzle, pressure recovery and exhaust management areas were highlighted at the beginning of this paper. The conventional low-pressure subsonic-injection nozzle is probably the most enduring of these earlier
contributions.
The ejector nozzle, recently developed for the high pressure sealed COIL, represents both a continuation of Boeing’s legacy as the leader in COIL nozzle development as well as a departure from the past, enabling COIL applications that would not have been possible with the earlier technologies. At the same time, Boeing’s high pressure sealed COIL represents integration and demonstration of a COIL system incorporating a very advanced high pressure, high
performance 02(1A) generator; the new nozzle; and a sealed exhaust system. The result is an operating laser system test bed that is new from end to end. The performance of this laser, measured by chemical efficiency, is competitive with the best of the low-pressure helium-based technology, and indications are that significantly more power is available.
* Stephen Hurlock is retired from Boeing and can be reached at (805) 527-8865
REFERENCES
1. W. E. McDermott, N. R. Pchelkin, D. J. Benard, R. R. Bousek, Appl. Phys. Lett 32,469-470 (1978).
104 Proc. SPIE Vol. 4631

2. R. J. Richardson, C. E. Wiswall, Appl. Phys. Lett. 35, 138-139 (1979). 3. S. C. Hurlock, H. 0. Laeger, R. I. Wagner, “Chemically Pumped Iodine Laser” AFWL-TR-79-52 (Rocketdyne
Division, Rockwell International, 1979). 4. D. Stelman, U.S. Patent 6,224,786, May 1,2001. 5. W. E. McDermott, J. C. Stephens, J. Vetrovec, R. A. Dickerson, "Operating experience with high throughput jet
generator", SPIE Proc. Vol. 2987, SPIE (SPIE, 1997). 6. J. A. Davis, L. F. Moon, U.S. Patent 4,487,366, December 11, 1984. 7. S. E. Rodriguez, J. P. Maddox, R. J. Netzer, A. Z. Ullman, U.S. Patent 5,735,469, April 7,1998. 8. J. Vetrovec, U.S. Patent 6,154,478, November 28,2000. 9. J. Vetrovec, Chemical Oxygen-Iodine Laser with a Cryosorption Vacuum Pump, Photonics West Conference, San
Jose (SPIE, 2000). 10. J. Hon, et al., AlAA Journal 34,1595-1603 (1996). 11. T. T. Yang, Y. C. Hsia, L. F. Moon, R. A. Dickerson, Advanced Mixing Nozzle Concepts for COIL, Gas and
Chemical Lasers and Intense Beam Applications III, 2000, San Jose CA (SPIE, 2000). 12. T. T. Yang, R. A. Dickerson, L. F. Moon, Y. C. Hsia, AIAA 2000-2425 High Mach Number, High Pressure
Recovery COIL Nozzle Aerodynamic Experiments, 30th Plasmadynamics and Lasers Conference, Denver, CO
(AIAA, 2000). 13. T. T. Yang, S. C. Hurlock, R. A. Dickerson, L. F. Moon, Y. C. Hsia, High Efficiency, High Pressure Recovery,
High Mach Number Nitrogen Based Chemical Oxygen Iodine Laser, International Conference on Lasers LASERS 2000, Albuquerque, NM (STS Press, McLean VA, 2000).
FIGURES
l2+ 1 gmol/sec He
P0= 7.7 psla M = 1
02 + He = 1 + 5 gmol/sec P = 10 + 50 = 60 Torr T = 260K
rUm>25%
Cavity
Gain
Sp¬ ill
N = 7 gmol/sec M = 2.0->1.5 T = 210K
Diffuser } N = 7 gmol/sec M = 0.1 Pp = 18Torr
Waste or Reuse
Figure 1. Laser System Based on Low Pressure COIL Technology
Proc. SPIE Vol. 4631 105

BHP
Waste or Reuse
Figure 2. Laser System Based on Next Generation COIL High Pressure Technology
Figure 3. Supersonic Shear Layer Mixing in High Pressure N2 Diluent COIL
Proc. SPIE Vol. 4631

Mixing-Aid labs (16/Nozzle)

Horizontal Pitot Scans
Downstream
of Nozzle Exit Plane
i
02 & N2 Exit Side
Figure 6. Cold Flow Testing of 3 Blade Test Article Confirms CFD Mixing Results
0.32 SECONDS/DATA POINT
DUCT EXIT BACK PRESSURE
Figure 7. Diffuser Unstart Tests Show = 100 Torr Pressure Recovery

JET OXYGEN GENERATOR MACH 5 IODINE INJECTION NOZZLE
PARALLEL WALL OPTICAL CAVITY
TRANSITION DUCT
DIFFUSER 95 TORR RECOVERY
OPTICAL TUNNEL (2) ^
Figure 8. Boeing’s New High-Pressure, High Mach Number COIL
OPTICAL ISOLATION VALVE (2)
Vaporizer (Outside) Vaporizer (Inside)
Figure 9, High Pressure Iodine Supply System, Developed for Boeing by General Atomics
Proc. SPIE Vol. 4631 109
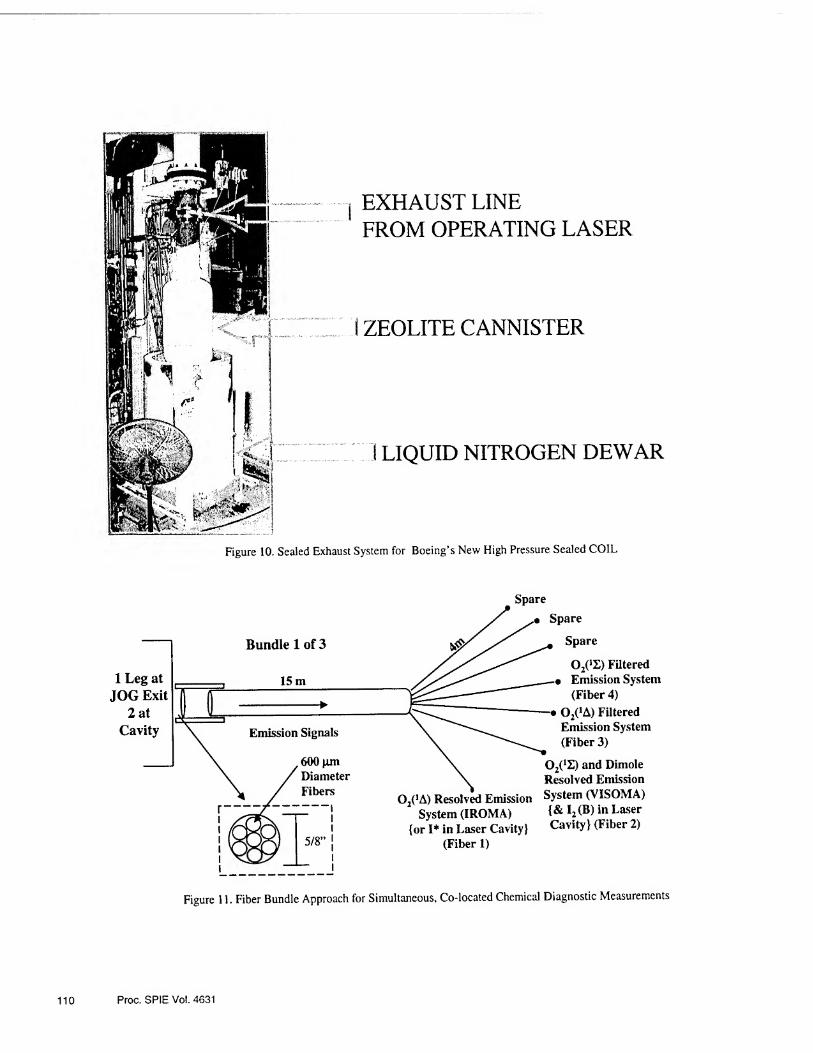
EXHAUST LINE FROM OPERATING LASER
I ZEOLITE CANNISTER
J LIQUID NITROGEN DEWAR
Figure 10. Sealed Exhaust System for Boeing’s New High Pressure Sealed COIL
Spare
1 Leg at JOG Exit
2 at Cavity
Bundle 1 of 3
15 m
Emission Signals
600 pm Diameter
Fibers \ 02(1A) Resolved Emission
— J System (IROMA) 1 {or I* in Laser Cavity}
5/8” | (Fiber 1)
02m Filtered Emission System
(Fiber 4)
• 02(1A) Filtered Emission System
(Fiber 3)
02(1Z) and Dimole Resolved Emission
System (VISOMA)
{& I2(B) in Laser
Cavity} (Fiber 2)
Figure 11. Fiber Bundle Approach for Simultaneous, Co-located Chemical Diagnostic Measurements
110 Proc. SPIE Vo!. 4631
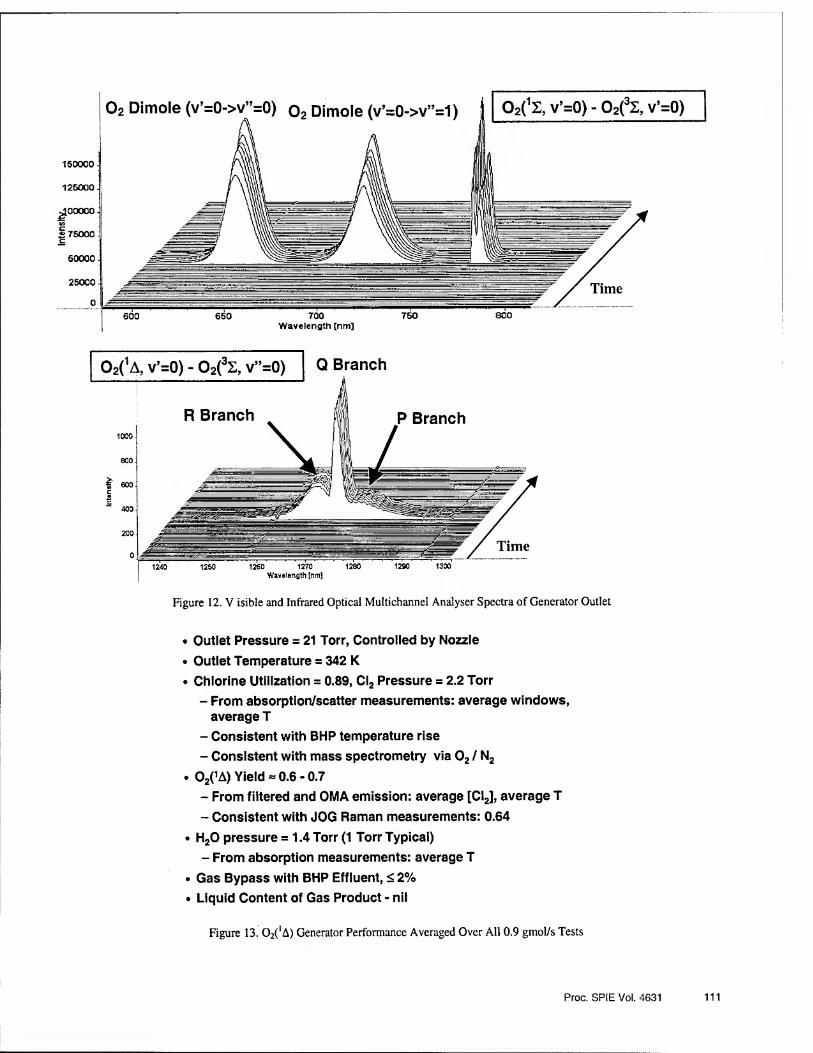
160000
126000
25000
0
Figure 12. V isible and Infrared Optical Multichannel Analyser Spectra of Generator Outlet
• Outlet Pressure = 21 Torr, Controlled by Nozzle
• Outlet Temperature = 342 K
• Chlorine Utilization = 0.89, Cl2 Pressure = 2.2 Torr
- From absorption/scatter measurements: average windows, average T
- Consistent with BHP temperature rise
- Consistent with mass spectrometry via 02 / N2
. O20A) Yield = 0.6-0.7
- From filtered and OMA emission: average [Cl2], average T
- Consistent with JOG Raman measurements: 0.64
• H20 pressure = 1.4 Torr (1 Torr Typical)
- From absorption measurements: average T
• Gas Bypass with BHP Effluent, <, 2%
• Liquid Content of Gas Product - nil
Figure 13. Generator Performance Averaged Over All 0.9 gmol/s Tests
Proc. SPIE Vol. 4631 111

Inte
nse
Broadband l2(B->X)
02 Dimole (v’=0->v”=0) °* Dimole (v’=0->v”=1)
Figure 14. Cavity Visible Emission Spectra
112 Proc. SP1E Vol. 4631

High Energy OPTICAL RESONATOR I Low Power Mode Footprint Cameras
Calorimeter Flat (outcoupler); Sphere (Feedback) 1 Meter Hamamatsu « COHU V /
COLOR KEY
I mmm Intracavity Beam
Output Beam
\mmm Low Power Beam
\mmm Alignment Beam
HR-Rear-View
Camera (COHU) /
-"--* ■ •Alignment j
'Telescope, j
Figure 15. Layout of Optical Diagnostics System, Including Resonator
SMALL OPTICAL BOX
LARGE OPTICAL BOX
Figure 16. Interior of Optical Boxes, Showing Optical Diagnistics
Proc. SPIE Vol. 4631 113

CO
IL C
HE
MIC
AL
Saconda
i 16
TEST 99049
TTCCT OOAT'l 73 • i>w —-
1 Iju Jl
—1-. . “
—
s' '' _- ! ._ _________ ;
:{■-J ■-
-.—q. -:: “
4 -.-r-t..,..-r--,-M
BO 62 64 66 66 70 72
Saconda
TEST 99048 i-
—-
— . — --
—
Z“j
=j
■— | -i_—-
64 66 66 70 72 74
Figure 17. Some Typical Power vs. Time Scans from the Fast Flux Monitor
PTAU = P 02*RESIDENCE TIME, TORR-SEC
Figure 18. New N2 Laser Performance is Comparable with Helium Diluent Chemical Efficiency
114 Proc. SPIE Vol. 4631

Corrected for view angle

Invited Paper
History of COIL development in Japan: 1982-2002
Masamori Endo*A, Taro Uchiyama8, Kenzo NanriA, Shuzaburo Takedac and Tomoo FujiokaA
ADepartment of Physics, Tokai University, 1117 Kita-Kaname, Hiratsuka City, 259-1292, Japan.
BDepartment of System Design Engineering, Keio University, 3-14-1, Hiyoshi, Kohoku-ku, Yokohama, 223-8522, Japan.
cDepartment of Electro-Photo Optics, Tokai University
ABSTRACT
A twenty-years of COIL researches and developments in Japan are reviewed. The researches of four major sites, namely, Keio University, Industrial Research Institute, Kawasaki Heavy Industries and Tokai University are presented in order of time. Epoch-making works are highlighted, and the significance of those works in the industrial COIL development is discussed. Finally, current status of COIL researches in Japan is introduced.
Keywords: iodine laser, COIL, Japan, history
1. INTRODUCTION
Chemical oxygen-iodine laser (COIL) is a continuous-wave chemical laser operating at 1.3|Lim. The principle of COIL is briefly described as follows. Hydrogen peroxide is mixed with some alkali (normally KOH or NaOH) and prepared in a vessel. The solution is called a BHP (basic hydrogen peroxide). CL gas is provided in it to produce singlet oxygen 02(1A) by the following reaction,
H2Oz + 2MOH + CL — 2H20 + 2KC1 +02(! A). (1)
Water vapor is released from BHP together with 02(*A) and should be removed since it is a strong quencher of the lasing species, I(2Pi/2). Singlet oxygen is then mixed with iodine molecule vapor. Iodine is dissociated by the collisional
energy transfer from 02(iA). The iodine atom is then excited to the first electronically excited state by the subsequent collision with 02(1A), and lasing is obtained between (2Pi/2) - (2P3/2) levels of iodine. The I2/02 ratio of typical COIL is a few percent and an iodine atom is excited many times in the laser cavity. The reactions are summarized as follows,
n02( ‘A) +12 — n02( 3I) + 2I(2P3/2)
02(* A) + I(2P3/2) <-> 02(3Z) + I(2Pl/2)
I(~P 1/2) ICP3/2) + hv.
Chemical efficiency is defined by the following formula,
[LaserOutpul(W)]//, v xm
,c [Cljmolflowdnol/s)]^
* Correspondence: Email: [email protected]; Telephone: +81-463-58-1211 Ext. 3721;
(2)
(3)
(4)
(5)
116
Gas and Chemical Lasers and Intense Beam Applications III, Steven J. Davis, Michael C. Heaven, Editors, Proceedings of SPIE Vol. 4631 (2002) ©2002 SPIE • 0277-786X/02/$15.00

In principle, a Cl2 molecule produces an Oo^A) (eq.l) and that excites an iodine atom (eq. 3), then it produces a laser photon (eq. 4). Therefore, chemical efficiency is the quantum yield of the comprehensive chemical processes involved in COIL. It is very often used to measure the performance of a COIL device.
2. BEGINNING - EARLY 1980’S
The Faculty of Science and Technology, Department of Electric Engineering, Keio University has a long history of research in gas lasers that goes back to 1960’s. At the time when the laser laboratory was led by Fujioka, one of his interests was the phtolytic iodine laser. Therefore, it was a natural consequence that he started the research of COIL shortly after the first demonstration of lasing by the United States Air Force.1
Although the COIL was considered as a candidate of directive energy weapons (and is going to be realized soon), Fujioka was aware of its usefulness as an industrial laser from the very beginning of the COIL history. At the same time, Watanabe, who was a graduate student of Keio University Laser Laboratory, started his career at the National Defense Academy in Japan with the research of COIL, too. Japanese COIL history started with a race between a teacher and his student.
The student reached the finish line first. The first oscillation of COIL was obtained by Watanabe et al? in 1982. Shortly after, Keio University also succeeded in lasing by Serizawa, Uchiyama and Fujioka et al? Figure 1 shows the singlet oxygen generator (SOG), water vapor trap, and optical cavity of the Watanabe’s apparatus. The constructions of the both COILs were so-called Bachar-Rosenwaks type,4 which was the typical design in the early 80’s. According to the Watanabe’s first report, the output power was 12W and chemical efficiency was 4.4%. Watanabe measured the property of the laser medium by the variable-loss optical cavity.5
Keio group’s interests were oriented to the industrial applications from the very beginning of their studies. It must be emphasized on that in the early 80’s, the use of COIL as an industrial laser was not widely accepted and Keio University pioneered the industrial COIL development. They have already demonstrated the optical fiber transmission of COIL output in 1983.6 To say the chemical efficiency, their early apparatus obtained 16.8% at an output of 105W from a 25x1 cm2 flow duct.7
3. KHI & IRI - LATE 1980’S
There was a remarkable movement in Japanese COIL history in 1986. Fujioka resigned Keio University and started-up a laser research center at Industrial Research Institute (the institute renamed itself as Institute of Research and Innovation in 1989). One of the objectives of the IRI Laser Laboratory was to offer the research site for national research programs of high-power industrial lasers. The well-known 20kW CO laser for decommissioning and dismantlement of nuclear power plants (D&D)8 was originated here. A five-year project of industrial COIL development also started up at the IRI Laser Laboratory, and the program was shared with Kawasaki Heavy Industries
Proc. SP1E Vol. 4631 117

(KHI). The goal of the project was the development of the
world's first industrial COIL at lkW output, all-day-long
operation capability.
Initially, the research program was led by Yoshida.
Yoshida modified the bubbler type SOG to improve the
performance of the SOG that used dilute hydrogen
peroxide. Although eq. (1) produces singlet oxygen at an
efficiency of 100%, not all the oxygen is yielded in the
(!A) state because of the quenching reactions in the liquid
phase. It was believed that dense (>60%) H2O2 should be
used for the efficient yield of 02^).
The use of dilute hydrogen peroxide is crucial for
industrial applications. In Japan, the hydrogen peroxide of
equal to or less than 35wt% was much less restricted for
usage, storage, and conveyance. Figure 2 shows the IRI's Fig. 2: CRTs first COIL: the origin of the commercial COIL.
first COIL apparatus. Dense array of bubbler tubes close to the BHP surface is seen. Finally, Yoshida claimed (and not
widely believed) that a 40% of chemical efficiency was obtained at an output power of 200W, using a 35wt% hydrogen
peroxide.10
The IRI COIL apparatus was scaled up to a lkW device,11 then the know-how was transferred to KHI to make a
commercial COIL device. The COIL research at IRI Laser Laboratory ceased in 1991.
4. KEIO UNIVERSITY - 1990’S
SYSTEM
Fig. 3: Porous pipe SOG and COIL without a water vapor trap13
the porous pipe SOG and COIL without a water vapor trap.
An output power of 87W with a chemical efficiency of
7.8% was obtained.13,14
The unique porous-pipe SOG led Uchiyama to another
application: pulsed high-pressure SOG. The principle of the
pulsed SOG is as follows; first, the surface of the porous
pipe is kept wet with BHP in a closed chamber. Then CL
gas is injected to the inside of the porous pipe at a blast.
The CL gas penetrates to the surface, react with the BHP at
the surface of the pipe, and fill the chamber instantaneously
with 02(!A). In this way, a 35Torr 02(!A) pressure was
It can be said that Keio group rather stepped aside the
main stream of the industrial COIL development in
1990's. Nevertheless, a number of unique works have
been done during this decade.
In the early COIL devices, the unwanted byproduct of the SOG, water vapor, was removed by the cold trap (see
Figs. 1 and 2). Uchiyama considered that the necessity of
the water vapor trap inevitably prevents long-term
operation of COIL, and should be removed. Uchiyama's
strategy was the deep cooling of BHP (close to -30°C),
and use of a porous pipe SOG12 that was effective at very
low BHP temperature. Figure 3 shows the schematic of
Fig. 4: Pulsed COIL.16 l:CL tank 2Porous pipe 3Perforated inner tube 4:Solution (H2O2+KOH) 5:Air filter 6:Iodione injectors 7:Maniofold 8:Prechamber 9:Ge photodiode 10:Si photodiode 11 Pressure gauge
118 Proc. SPIE Vol. 4631

observed in a very short period.15 The world’s first pulsed COIL was developed using this SOG.16 An ambitious study,
observation of lasing from O2OA) directly, was tried using this pulsed SOG.17 According to the theoretical calculation, a 6-m active volume length should produce a realistic positive gain even 02(!A) to 02(3L) is a strictly prohibited transition. However, the experiment resulted in unsuccessful.
Q-switching18 and magnetic gain switching19 were studied at Keio University. Because COIL is an energy transfer laser, the lasing species has only a few percent of the extractable energy. Therefore, those switching methods do not work as efficient as say, C02 laser. Nevertheless, an 11 times enhancement in Q-switching regime, and a 3.3 times enhancement in magnetic gain switching were obtained respectively.
Intracavity second harmonic generation was studied at Keio University. The objective of this study was to get the more valuable visible light than infrared at an efficiency of 100%. The idea of the intracavity SHG is to place a SHG crystal inside the laser cavity and use dichroic mirrors (total reflector for fundamental and transparent to the second harmonic) for optical cavity. Because only the converted light can escape from the optical cavity, the SHG crystal acts as an output coupler. Therefore, 100% conversion efficiency is expected. The obtained output
Gas flow
r = 250mm Dichroic mirror
r=760mm or r=1000mm Dichroic mirror
Beam splitter Ti=93% R2=99.9%>
1 Chopper
0 0 Lens Ge detector
Power meter
Singlet oxygen generator
Fig. 5: Intracavity SHG of COIL21
power was 16.1W in TEMoo mode,20,21 and the conversion efficiency was estimated to be nearly 100%. It means that the second harmonic output was the same as the fundamental output in which an optimized partial reflector was used and the SHG crystal was removed.
Iodine predissociation was studied at Keio University. In the first step of the oxygen-iodine reactions (see eq. 2), approximately 10% of the 02( 1A), that have the capability of pumping iodine, is used merely to dissociate iodine molecules to atoms. Therefore, substituting the dissociation with external energy enhances the output power of COIL because more 02( !A) survives to the laser cavity than conventional COIL. The point is that the theoretical limit of enhancement is not limited to 10% because there is an oscillation threshold of 02( lA) yield in COIL same as the other lasers. The extractable power Pext from the singlet oxygen flow can be expressed as
Pext=mErjq(Y-Yth-Ydis), (6)
where m is the oxygen flow rate [mol/s], E is the energy of singlet oxygen per unit quantity [J/mol], r/q is the quantum efficiency of the energy transfer (0.97), Y is the yield of the oxygen, Yth is the lasing threshold yield, and Ydis is the part of the singlet oxygen necessary for iodine dissociation. Y is 0.4 to 0.6 for the typical SOGs. We assume Y to be 0.5, Yth
to be 0.2 (for subsonic COIL), and Ydis to be 0.1. In this case, the extractable power comes to Pext = 02mE?]q. If we
completely substitute the dissociation energy with the external source, Ydis is no longer subtracted and the extractable
power becomes Pext = 03mEr/q. Therefore, approximately 50% of output power enhancement is expected by the
external iodine dissociation.
Uchiyama used an RF discharge to dissociate iodine and applied the technique to their subsonic COIL. As a result, chemical efficiency was improved from 4% to 12%.22
5. KHI-1990’S
KHI started the development of industrial COIL with IRI in the late 80’s.23,24 The national project delivered the world's first commercial COIL in 1992.25 The device was sold to the Applied Laser Engineering Center (ALEC), and it is still available for value. The remarkable capability of the device was the eight hours of long-term operation at a stable
Proc. SPIE Vol. 4631 119
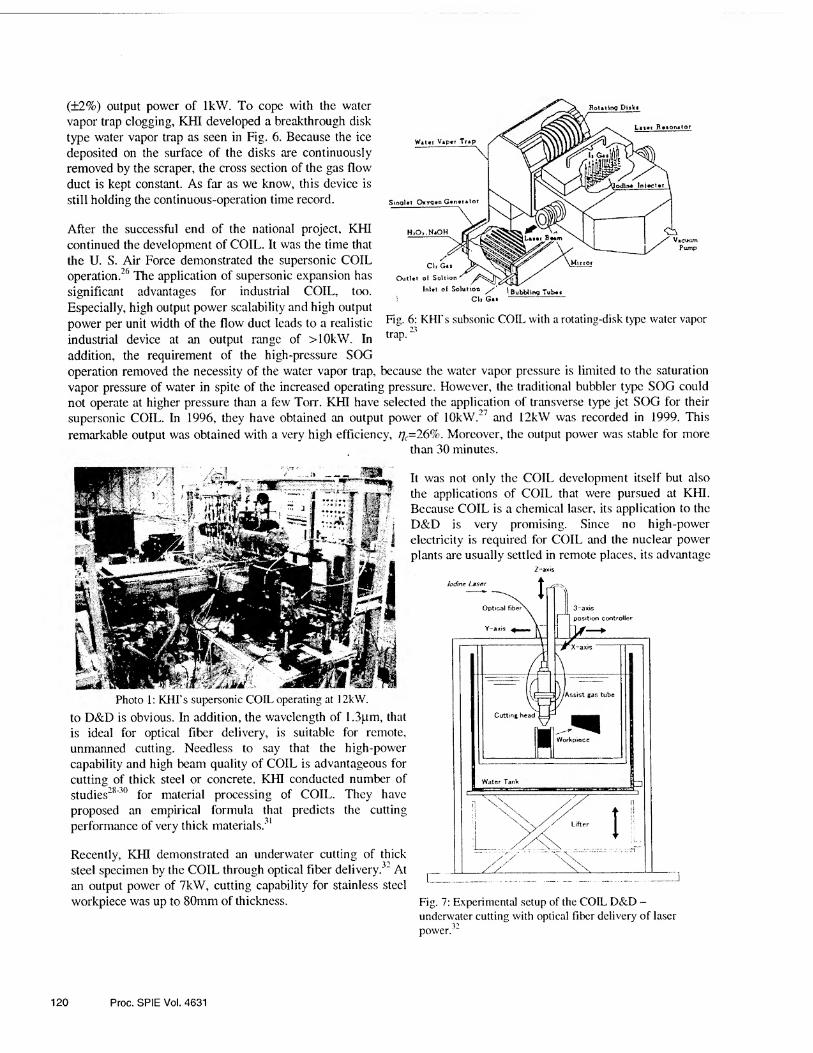
Routing Di»k»
Low Rttomot
W4»«r V>p«t Tup
(±2%) output power of lkW. To cope with the water vapor trap clogging, KHI developed a breakthrough disk type water vapor trap as seen in Fig. 6. Because the ice deposited on the surface of the disks are continuously removed by the scraper, the cross section of the gas flow duct is kept constant. As far as we know, this device is still holding the continuous-operation time record.
After the successful end of the national project, KHI continued the development of COIL. It was the time that the U. S. Air Force demonstrated the supersonic COIL operation.26 The application of supersonic expansion has significant advantages for industrial COIL, too. Especially, high output power scalability and high output power per unit width of the flow duct leads to a realistic industrial device at an output range of >10kW. In addition, the requirement of the high-pressure SOG operation removed the necessity of the water vapor trap, because the water vapor pressure is limited to the saturation vapor pressure of water in spite of the increased operating pressure. However, the traditional bubbler type SOG could not operate at higher pressure than a few Torr. KHI have selected the application of transverse type jet SOG for their supersonic COIL. In 1996, they have obtained an output power of 10kW.27 and 12kW was recorded in 1999. This
remarkable output was obtained with a very high efficiency, rjc-26%. Moreover, the output power was stable for more than 30 minutes.
Sinqln OxY<3»n G«ntr*to>
H,Q>.N«OH
Outlet oi Soli ion
tnUl of Solution
; Cl» G«> \ Bubbling Tube*
Fig. 6: KHI's subsonic COIL with a rotating-disk type water vapor
trap.
Photo 1: KHI's supersonic COIL operating at 12kW.
to D&D is obvious. In addition, the wavelength of 1.3|im, that is ideal for optical fiber delivery, is suitable for remote, unmanned cutting. Needless to say that the high-power capability and high beam quality of COIL is advantageous for cutting of thick steel or concrete. KHI conducted number of studies28'30 for material processing of COIL. They have proposed an empirical formula that predicts the cutting performance of very thick materials.31
Recently, KHI demonstrated an underwater cutting of thick steel specimen by the COIL through optical fiber delivery.32 At an output power of 7kW, cutting capability for stainless steel workpiece was up to 80mm of thickness.
It was not only the COIL development itself but also the applications of COIL that were pursued at KHI. Because COIL is a chemical laser, its application to the D&D is very promising. Since no high-power electricity is required for COIL and the nuclear power plants are usually settled in remote places, its advantage
Fig. 7: Experimental setup of the COIL D&D - underwater cutting with optical fiber delivery of laser power.32
120 Proc. SP1E Vol. 4631

6. TOKAI UNIVERSITY -1996-
The history of COIL research at Tokai University began in 1996, shortly after Fujioka moved to Tokai University and started up a laser research laboratory. Tokai University COIL research group took up a research program sponsored by NEDO (New Energy and Industrial Technology Development Organization) together with KHI. The goal of the program was to show the feasibility of the “Optical Power System”33 (See Fig. 8). The name implies the use of laser power like today’s electricity. High-efficiency operation of supersonic COIL, output power enhancement by using microwave discharge, output power control, optical fiber transmission, high beam quality resonator, and reuse of BHP were studied.
To start up COIL research at Tokai University, Zagidullin was invited and their counter-flow jet type SOG technology34 was transferred. It was soon after the start-up of the project that the very high chemical efficiency (23.4%) of the supersonic COIL using nitrogen as buffer gas was obtained.35 At that time, supersonic COILs were operated using helium as buffer gas to obtain supersonic expansion. The result showed that
inexpensive nitrogen could be also used for supersonic COIL and that could dramatically reduce the operation cost. Figure 9 shows the first version of Tokai University’s COIL apparatus.
Sugimoto demonstrated the output power stabilization and modulation of COIL for the first time using Zeeman effect. Figure 10 shows the schematic. The laser power is monitored by a photodetector, whose output signal is compared to a reference signal to produce an actuating error signal. The actuating error signal is then fed into the control unit of the variable dc power supply connected to the electromagnet, to change the magnetic field intensity.
Fig. 9: SOG, iodine injector and supersonic nozzle of the Tokai University's first COIL.35
In this manner, the feedback system attempts to reduce the actuating error signal in order for the output power to follow the reference signal.
Ge Detector
Fig. 10: Output power stabilizing system of COIL.36
Time [msec]
Fig. 11: Output power stabilization of COIL .Top: Fluctuated output by the added vibration. Bottom: Stabilized output.36
Proc. SPIE Vol. 4631 121
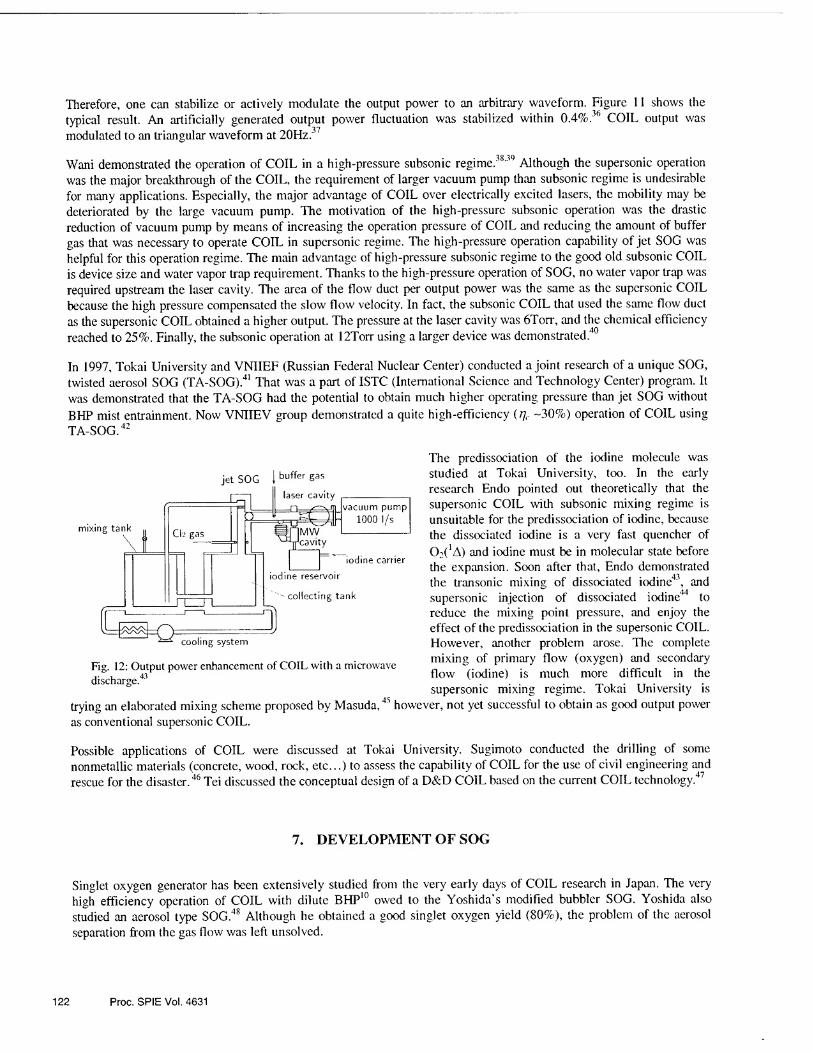
Therefore, one can stabilize or actively modulate the output power to an arbitrary waveform. Figure 11 shows the typical result. An artificially generated output power fluctuation was stabilized within 0.4%,36 COIL output was modulated to an triangular waveform at 20Uz37
Wani demonstrated the operation of COIL in a high-pressure subsonic regime.38'34 Although the supersonic operation was the major breakthrough of the COIL, the requirement of larger vacuum pump than subsonic regime is undesirable for many applications. Especially, the major advantage of COIL over electrically excited lasers, the mobility may be deteriorated by the large vacuum pump. The motivation of the high-pressure subsonic operation was the drastic reduction of vacuum pump by means of increasing the operation pressure of COIL and reducing the amount of buffer gas that was necessary to operate COIL in supersonic regime. The high-pressure operation capability of jet SOG was helpful for this operation regime. The main advantage of high-pressure subsonic regime to the good old subsonic COIL is device size and water vapor trap requirement. Thanks to the high-pressure operation of SOG, no water vapor trap was required upstream the laser cavity. The area of the flow duct per output power was the same as the supersonic COIL because the high pressure compensated the slow flow velocity. In fact, the subsonic COIL that used the same flow duct as the supersonic COIL obtained a higher output. The pressure at the laser cavity was 6Torr, and the chemical efficiency reached to 25%. Finally, the subsonic operation at 12Torr using a larger device was demonstrated.40
In 1997, Tokai University and VNIIEF (Russian Federal Nuclear Center) conducted a joint research of a unique SOG, twisted aerosol SOG (TA-SOG).41 That was a part of ISTC (International Science and Technology Center) program. It was demonstrated that the TA-SOG had the potential to obtain much higher operating pressure than jet SOG without
BHP mist entrainment. Now VNIIEV group demonstrated a quite high-efficiency (tjc -30%) operation of COIL using
TA-SOG.42
jet SOG i buffer §as
Fig. 12: Output power enhancement of COIL with a microwave discharge.43
trying an elaborated mixing scheme proposed by Masuda,45 as conventional supersonic COIL.
The predissociation of the iodine molecule was studied at Tokai University, too. In the early research Endo pointed out theoretically that the supersonic COIL with subsonic mixing regime is unsuitable for the predissociation of iodine, because the dissociated iodine is a very fast quencher of
02(lA) and iodine must be in molecular state before the expansion. Soon after that, Endo demonstrated the transonic mixing of dissociated iodine43, and supersonic injection of dissociated iodine44 to reduce the mixing point pressure, and enjoy the effect of the predissociation in the supersonic COIL. However, another problem arose. The complete mixing of primary flow (oxygen) and secondary flow (iodine) is much more difficult in the supersonic mixing regime. Tokai University is
however, not yet successful to obtain as good output power
Possible applications of COIL were discussed at Tokai University. Sugimoto conducted the drilling of some nonmetallic materials (concrete, wood, rock, etc...) to assess the capability of COIL for the use of civil engineering and rescue for the disaster.46 Tei discussed the conceptual design of a D&D COIL based on the current COIL technology.47
7. DEVELOPMENT OF SOG
Singlet oxygen generator has been extensively studied from the very early days of COIL research in Japan. The very high efficiency operation of COIL with dilute BHP10 owed to the Yoshida's modified bubbler SOG. Yoshida also studied an aerosol type SOG.48 Although he obtained a good singlet oxygen yield (80%), the problem of the aerosol separation from the gas flow was left unsolved.
122 Proc. SPIE Vol. 4631

BHP nozzle Takehisa (Keio Univ.) developed the unique porous pipe SOG.13 The successful operation of COIL without a water vapor trap greatly owed to the porous pipe SOG. The porous pipe SOG technology was applied to the realization of the pulsed SOG, which generated a 35Torr of singlet oxygen.15 Currently, Keio University group is studying some jet SOG variation. One of the ideas was the jet SOG with guide plates.49
KHTs COIL development started with the modified bubbler SOG that was developed in IRI, and the world’s first commercial COIL25 utilized it. Soon after that they developed the transverse-flow jet SOG for supersonic COIL. The property of their transverse jet SOG is the extraordinary stability; it can operate stably for more than an hour. It should be noted that the long-term operation of jet SOG is still an up-to-date topic of COIL development. Tokai University started COIL researches with the jet SOG that was transferred by Nikolaev and Zagidullin34 in 1997. Since then, Tokai University’s jet SOGs are Fig.13: Schematic chawing of the mist following Zagidullin’s design criteria. In 1997, VNIIEF's original SOG, TA- SOG reaction zone.
SOG was tested at Tokai University, and its high performance was demonstrated 41 Now Tokai University is developing a new type of SOG, mist SOG.50 (Fig. 13). The goal of the mist SOG development is the stoichiometric usage of BHP at a single pass of the reaction zone. The unique counter-flow concept is the key technology to separate the BHP mist from the gas flow.
Fujii’s group at Anan National College of Technology is studying a completely different SOG, discharge type SOG.51 Now the yield of the singlet oxygen is very close to the oscillation threshold. Table I shows the timetable of SOG development in Japan.
Table I: SOG developments in Japan.
Year 1986 1988 1990 1992 1994 1996 1998 2000 2002
IRI
Aeroso^o^jfj^ bubbler
Keio University ^Porous pipe (pulse) ^ Jet variation
Porous pipe (continuous) Jailed buttle.
KHI _ Cross-flow jet
Modified bubbler -4-►
Tokai University Modified bubbler Mist ^^ ^- ^ Counter-flow jet
4TA-SOG
Anan College ^ Discharge
8. THEORETICAL WORKS
Numerical simulation of COIL was mainly conducted at the Nagaoka University of Technology. A three-dimensional, Navier-Stokes code including chemical reactions was developed by Masuda. The problem of supersonic COIL attracted him because it is a unique problem from the viewpoint of fluid dynamics, since the Reynolds Number is much lower than the well-studied supersonic flows. Their studies began with the diagnostics of the duct flow52, and followed by the
Proc. SPIE Vol. 4631 123

discussion of the chemical reactions at the mixing nozzles53*54. The results were fed back to the KHI-COIL. The role of the water vapor condensation and heat release to the laser medium property was theoretically discussed.55,56 The optical resonator was modeled using a one-dimensional wave optics, and the result was compared with a geometric optics model.57 The Q-switch operation of COIL was discussed from the viewpoint of fluid dynamics.58,59
The possibility of the nuclear fusion driver using pulsed COIL was theoretically discussed by Endo60,61 and he predicted a new energy extraction regime, “quasi-cw energy extraction” with a 10ns pulse in the very high-pressure oxygen- iodine laser medium.
Endo discussed the possibility of the direct lasing from 02( 1A).17 The point-source model included the estimation of the transition probability from each rotational level based on the Holn-London factor, time-dependent 02( *A) number density of each rotational level, and pressure dependent line broadening. According to the calculations, the highest gain
was obtained at the qQ(9) transition (9—>9,9), and the expected small signal gain from a 30Torr SOG was 3xl0“6cm_1.
At Tokai University, Endo developed a numerical code that did not include the numerical fluid dynamics. The rather simple code was however very helpful to assess the behavior of the laser medium of the iodine predissociation,44 magnetic gain switching, and high-pressure subsonic operation.39
9. NOW AND FUTURE - 2000-
The fruits of NEDO project conducted by Tokai University and KHI are now taken over to a private company, Miki- pulley. The company is known for the power transmission equipments, electric crutches, brakes, and so on. Their demand for a new product in their new business plan matched Fujioka's passion of industrial COIL development, and a five-year research project funded by JST (Japan Science and Technology Corporation) had started from FY2000. The goal of the program is the development of the first commercial supersonic COIL whose output is 5kW. A prototype is very close to the first light at the end of 2001. Tokai University participated in the program as a technical advisor.
In the last few years, KHI concentrated their studies on the applications of COIL. One of their research programs is a part of the national project, “Photon Project”. High-speed welding of very thick aluminum alloy was demonstrated. The results of the KHI's latest work is presented elsewhere.62
10. SUMMARY
A twenty-years of researches and developments of COIL in Japan were reviewed. The history of COIL in Japan originated at Fujioka's laboratory in Keio University. The first oscillation was recorded at National Defense Academy in Japan, and Keio University obtained lasing shortly after that. In 1986, IRI (Industrial Research Institute) and KHI (Kawasaki Heavy Industries) received a national project for development of the world's first commercial COIL. Now the product is working at ALEC (Applied Laser Engineering Center). Through the 90's, Keio University conducted number of unique COIL studies such as COIL without water vapor trap, porous pipe SOG, Q-switching, magnetic gain switching, intracavity second harmonic generation, pulsed operation, and so on. Tokai University COIL group started in 1996, founded by Fujioka. They obtained a high-efficiency (23.4%) operation of supersonic COIL with nitrogen as buffer gas, high-pressure subsonic operation, output power stabilization, and output power enhancement by the predissociation of iodine. Now the hottest COIL research program is conducted at Miki-Pulley. The goal of the project is the development of a commercial supersonic COIL at 5kW output.
REFERENCES
1. W. E. McDermott, N. R. Pchelkin, D. J. Benard and R. R. Bousek, “An Electronic Transition Chemical Laser”, Appl. Phys. Lett. 32, pp. 469-470, 1978.
124 Proc. SPIE Vol. 4631
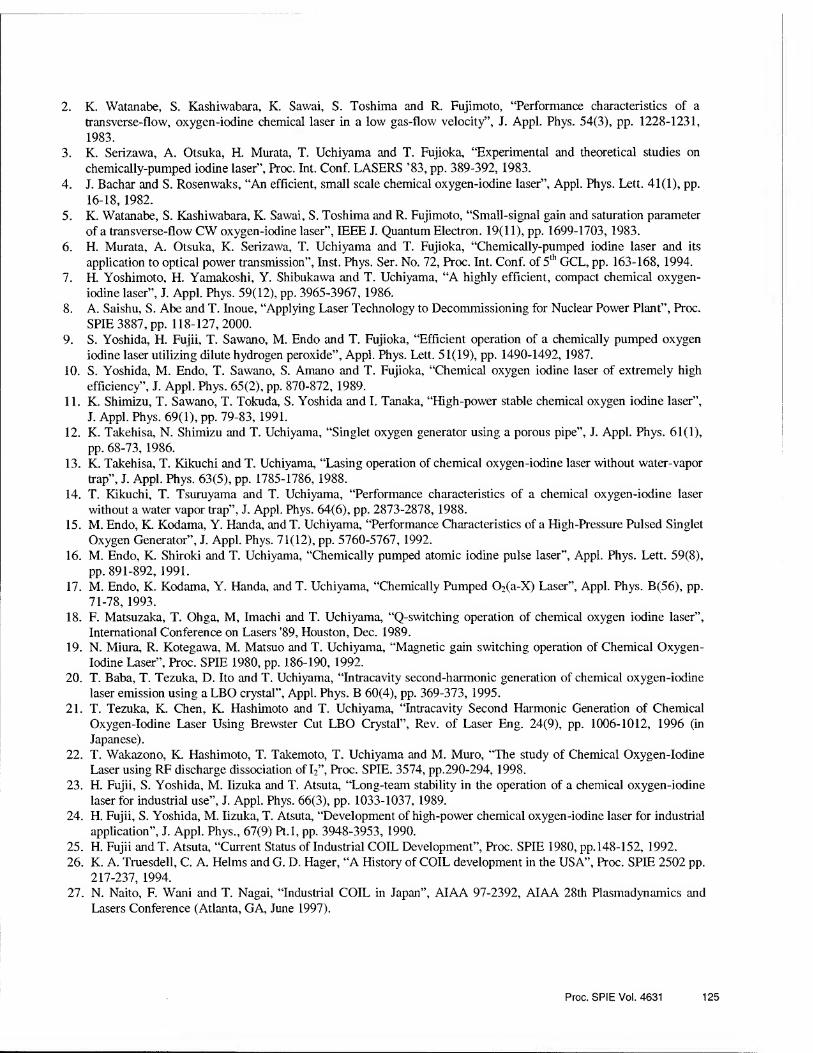
2. K. Watanabe, S. Kashiwabara, K. Sawai, S. Toshima and R. Fujimoto, “Performance characteristics of a transverse-flow, oxygen-iodine chemical laser in a low gas-flow velocity”, J. Appl. Phys. 54(3), pp. 1228-1231, 1983.
3. K. Serizawa, A. Otsuka, H. Murata, T. Uchiyama and T. Fujioka, “Experimental and theoretical studies on chemically-pumped iodine laser”, Proc. Int. Conf. LASERS ’83, pp. 389-392, 1983.
4. J. Bachar and S. Rosenwaks, “An efficient, small scale chemical oxygen-iodine laser”, Appl. Phys. Lett. 41(1), pp. 16-18,1982.
5. K. Watanabe, S. Kashiwabara, K. Sawai, S. Toshima and R. Fujimoto, “Small-signal gain and saturation parameter of a transverse-flow CW oxygen-iodine laser”, IEEE J. Quantum Electron. 19(11), pp. 1699-1703, 1983.
6. H. Murata, A. Otsuka, K. Serizawa, T. Uchiyama and T. Fujioka, “Chemically-pumped iodine laser and its application to optical power transmission”, Inst. Phys. Ser. No. 72, Proc. Int. Conf. of 5th GCL, pp. 163-168, 1994.
7. H. Yoshimoto, H. Yamakoshi, Y. Shibukawa and T. Uchiyama, “A highly efficient, compact chemical oxygen- iodine laser”, J. Appl. Phys. 59(12), pp. 3965-3967, 1986.
8. A. Saishu, S. Abe and T. Inoue, “Applying Laser Technology to Decommissioning for Nuclear Power Plant”, Proc. SPIE 3887, pp. 118-127, 2000.
9. S. Yoshida, H. Fujii, T. Sawano, M. Endo and T. Fujioka, “Efficient operation of a chemically pumped oxygen iodine laser utilizing dilute hydrogen peroxide”, Appl. Phys. Lett. 51(19), pp. 1490-1492, 1987.
10. S. Yoshida, M. Endo, T. Sawano, S. Amano and T. Fujioka, “Chemical oxygen iodine laser of extremely high efficiency”, J. Appl. Phys. 65(2), pp. 870-872, 1989.
11. K. Shimizu, T. Sawano, T. Tokuda, S. Yoshida and I. Tanaka, “High-power stable chemical oxygen iodine laser”, J. Appl. Phys. 69(1), pp. 79-83, 1991.
12. K. Takehisa, N. Shimizu and T. Uchiyama, “Singlet oxygen generator using a porous pipe”, J. Appl. Phys. 61(1), pp. 68-73, 1986.
13. K. Takehisa, T. Kikuchi and T. Uchiyama, “Lasing operation of chemical oxygen-iodine laser without water-vapor trap”, J. Appl. Phys. 63(5), pp. 1785-1786, 1988.
14. T. Kikuchi, T. Tsuruyama and T. Uchiyama, “Performance characteristics of a chemical oxygen-iodine laser without a water vapor trap”, J. Appl. Phys. 64(6), pp. 2873-2878, 1988.
15. M. Endo, K. Kodama, Y. Handa, and T. Uchiyama, “Performance Characteristics of a High-Pressure Pulsed Singlet Oxygen Generator”, J. Appl. Phys. 71(12), pp. 5760-5767, 1992.
16. M. Endo, K. Shiroki and T. Uchiyama, “Chemically pumped atomic iodine pulse laser”, Appl. Phys. Lett. 59(8), pp. 891-892, 1991.
17. M. Endo, K. Kodama, Y. Handa, and T. Uchiyama, “Chemically Pumped 02(a-X) Laser”, Appl. Phys. B(56), pp. 71-78, 1993.
18. F. Matsuzaka, T. Ohga, M, Imachi and T. Uchiyama, “Q-switching operation of chemical oxygen iodine laser”, International Conference on Lasers '89, Houston, Dec. 1989.
19. N. Miura, R. Kotegawa, M. Matsuo and T. Uchiyama, “Magnetic gain switching operation of Chemical Oxygen- Iodine Laser”, Proc. SPIE 1980, pp. 186-190, 1992.
20. T. Baba, T. Tezuka, D. Ito and T. Uchiyama, “Intracavity second-harmonic generation of chemical oxygen-iodine laser emission using a LBO crystal”, Appl. Phys. B 60(4), pp. 369-373, 1995.
21. T. Tezuka, K. Chen, K. Hashimoto and T. Uchiyama, “Intracavity Second Harmonic Generation of Chemical Oxygen-Iodine Laser Using Brewster Cut LBO Crystal”, Rev. of Laser Eng. 24(9), pp. 1006-1012, 1996 (in Japanese).
22. T. Wakazono, K. Hashimoto, T. Takemoto, T. Uchiyama and M. Muro, “The study of Chemical Oxygen-Iodine Laser using RF discharge dissociation of I2”, Proc. SPIE. 3574, pp.290-294, 1998.
23. H. Fujii, S. Yoshida, M. Iizuka and T. Atsuta, “Long-team stability in the operation of a chemical oxygen-iodine laser for industrial use”, J. Appl. Phys. 66(3), pp. 1033-1037, 1989.
24. H. Fujii, S. Yoshida, M. Iizuka, T. Atsuta, “Development of high-power chemical oxygen-iodine laser for industrial application”, J. Appl. Phys., 67(9) Pt.l, pp. 3948-3953, 1990.
25. H. Fujii and T. Atsuta, “Current Status of Industrial COIL Development”, Proc. SPIE 1980, pp. 148-152, 1992. 26. K. A. Truesdell, C. A. Helms and G. D. Hager, “A History of COIL development in the USA”, Proc. SPIE 2502 pp.
217-237, 1994. 27. N. Naito, F. Wani and T. Nagai, “Industrial COIL in Japan”, AIAA 97-2392, AIAA 28th Plasmadynamics and
Lasers Conference (Atlanta, GA, June 1997).
Proc. SPIE Vol. 4631 125

28. K. Yasuda, T. Atsuta, T. Sakurai, H. Okado, A. Hayakawa and J. Adachi, “Study on material processing of Chemical Iodine Laser’’, Proc. of 3rd JSME/ASME Joint Int. Conf. On Nuclear Eng. (April 23-27, 1995, Kyoto,
Japan). 29. T. Sakurai, K. Yasuda, T. Osaki, E. Tada, K. Koizumi and M. Nakahira, “Study on Material Processing and Fiber
Transmittance of COIL’’, Proc. of ICALEO, p.28,1996. 30. K. Tsurumaki, H. Miyao, H. Tomioka, J Adachi, K. Yasuda, H. Okado, A. Hayakawa and S. Yoshizawa,
“Development of remote dismantling of components in nuclear reactor with laser transmitted through optical fiber”, Proc. of ICON 5, (May 26-30, 1997, Niece, France).
31. J. Adachi, N. Takasaki, K. Yasuda and T. Atsuta, “Application of Chemical Oxygen-Iodine Laser (COIL) for Dismantling of Nuclear Facilities”, Progress in Nuclear Energy 32, pp.517-522, 1998.
32. H. Okado, T. Sakurai, J. Adachi, H. Miyao and K. Hara, “Underwater cutting of stainless steel with the laser transmitted through optical fiber”, Proc. SPIE 3887, pp. 152-160, 2000.
33. M. Endo, S. Takeda, F. Wani, D. Sugimoto and T. Fujioka, “Chemical Oxygen-Iodine Laser for Industrial Applications” 32nd ISATA, 99NM025 (Vienna, Austria, June 1999).
34. M. Zagidullin, V. D. Nikolaev, M. I. Svistun, V. S. Safonov and N. I. Ufimtsev, ‘The Study of Buffer Gas Mixing with Active Gas on Chemical Oxygen-Iodine Laser Performance with Jet Type SOG”, Proc. SPIE 2702, pp. 310-
319,1996. 35. M. Endo, S. Nagatomo, S. Takeda, M. V. Zagidullin, V. D. Nikolaev, H. Fujii, F. Wani, D. Sugimoto, K. Sunako,
K. Nanri and T. Fujioka, “High-Efficiency Operation of Chemical Oxygen-Iodine Laser Using Nitrogen as Buffer Gas” J. IEEE J. Quantum Electron. 34(3), pp.393-398, 1998.
36. D. Sugimoto, M. Endo, K. Nanri, S. Takeda and T. Fujioka, “Output Power Stabilization of a Chemical Oxygen- Iodine Laser with an External Magnetic Field” IEEE J. Quantum Electron. 34(9), pp. 1526-1532, 1998.
37. D. Sugimoto, T. Kawano, M. Endo, S. Takeda and T. Fujioka, “Waveform Shaping of a Chemical Oxygen-Iodine Laser Utilizing the Zeeman Effect” Jpn. J. Appl. Phys. 38(9A), pp.5105-5108, 1999.
38. F. Wani, M. Endo and T. Fujioka, “High-Pressure, high-efficiency operation of a chemical oxygen-iodine laser” Appl. Phys. Lett. 75(20), pp.3081-3085, 1999.
39. F. Wani, M. Endo and T. Fujioka, “High-Pressure Subsonic Mode Operation of Chemical Oxygen-Iodine Laser” Appl. Phys. B 70(2), pp.225-230, 2000.
40. M. Endo, K. Tei, D. Sugimoto, S. Takeda, K. Nanri, T. Uchiyama and T. Fujioka, “Development of a prototype COIL for decommissioning and dismantlement”, Proc. SPIE 4181, pp.23-26, 2000.
41. F. Wani, M. Endo, B. Vyskubenko, S. Ilyn, I. Krukovsky, S. Takeda and T. Fujioka, “Parametric Study of a Twisted Aerosol-Type Singlet Oxygen Generator” IEEE J. Quantum Electron. 34(11), pp.2130- 2137, 1998.
42. B. A. Vyskubenko, A. A. Adamenkov, Yu. N. Deryugin, S. P. Ilyin, Yu. V. Kolobyanin, I. M. Krukovsky and E. A. Kudryashov, “High Pressure Oxygen Iodine Laser Driven by Twisted Flow Singlet Oxygen Generator”, AIAA- 2001-3009, AIAA 32nd Plasmadynamics and Lasers Conference (Anaheim, CA, June 2001).
43. M. Endo, D. Sugimoto, H. Okamoto, K. Nanri, T. Uchiyama, S. Takeda and T. Fujioka, “Output Power Enhancement of a Chemical Oxygen-Iodine Laser by Predissociated Iodine Injection”, Jpn. J. Appl. Phys. 39(2A),
pp. 468-474, 2000. 44. H. Okamoto, T. Hirata, K. Shinoda, D. Sugimoto, M. Endo, T. Fujioka and S. Takeda, “Supersonic Chemical
Oxygen-Iodine Laser with Microwave Predissociation of Iodine”, AIAA-2000-2492, AIAA 31st Plasmadynamics and Lasers Conference (Denver, CO, June 2000).
45. W. Masuda, M. Hishida and Y. Abe, “Mixing and Reacting Zone Structure in a Supersonic Mixing Chemical Oxygen-Iodine Laser with Ramp Nozzle Array”, JSME Int. J. Ser B (Jpn Soc Mech. Eng.) 42(3), pp. 362-368,
1999. 46. D. Sugimoto, M. Endo, K. Sunako, K. Nanri and T. Fujioka, “Cutting and Drilling of Inorganic Materials for Civil
Engineering using a Chemical Oxygen-Iodine Laser”, Rev. Laser Eng. 28(3), pp.171-175, 2000. 47. K. Tei, D. Sugimoto, M. Endo, S. Takeda and T. Fujioka, “Chemical oxygen-iodine laser for decommissioning and
dismantlement of nuclear facilities”, Proc. SPIE 3887, pp. 162-169, 1999. 48. S. Yoshida, H. Saito, T. Fujioka, “New singlet oxygen generator for chemical oxygen-iodine lasers”, Appl. Phys.
Lett, 49( 18), pp. 1143-1144, 1986. 49. S. Shinoda and T. Uchiyama, “Study of Multi-Guideplate Singlet Oxygen Generator”, Proc. SPIE 4184, pp. 87-90,
2000. 50. S. Muto, T. Kawano, M. Endo, K. Nanri, S. Takeda and T. Fujioka, “Parametric study of a mist singlet oxygen
generator”, Proc. SPIE. 4181, pp.91-94, 2000.
126 Proc. SPIE Vol. 4631

51. T. Kobayashi, N. Satoh, M. Ishibashi and N. Fujii, “An Efficient Excitation of Iodine Atoms by Mixing of Two Microwave Discharged Rows of I2 and Oxygen Containing Singlet Oxygen”, Jpn J. Appl. Phys. Part 1 36(1)A, pp. 354-355,1997.
52. M. Inoue, M. Masuda, M. Furukawa and M. Muraishit, “Diagnosis of three-dimensional transonic flow fields with laser-induced iodine fluorescence”, SME FED (Am Soc Mech. Eng. Ruids Eng. Div.) 218, pp. 163-170, 1995.
53. W. Masuda, M. Hishida, S. Hirooka and N. Azami, ‘Three-Dimensional Mixing/Reacting Zone Structure in a Supersonic Row Chemical Oxygen-Iodine Laser”, JSME Int. J. Ser B (Jpn Soc Mech. Eng.) 40(2), pp. 209-215, 1997.
54. W. Masuda, M. Hishida and N. Azami, “Effects of Wall Catalysis on the Reacting Zone Structure of a Supersonic Row Chemical Oxygen-Iodine Laser”, JSME Int. J. Ser B (Jpn Soc Mech. Eng.) 41(3), pp. 674-679, 1998.
55. W. Masuda, M. Satoh, “Effects of Water Vapor Condensation on the Performance of Supersonic Row Chemical Oxygen-Iodine Laser”, JSME Int. J. Ser B (Jpn Soc Mech. Eng.) 39(2), pp. 273-279, 1996.
56. W. Masuda and M. Satoh, “Numerical Simulation of a Supersonic Row Chemical Oxygen-Iodine Laser Solving Navier-Stokes Equations”, JSME Int. J. Ser B (Jpn Soc Mech. Eng.) 40(1), pp. 87-92, 1997.
57. W. Masuda, M. Hishida and K. Iwamoto, “Characteristics of Radiation from a Supersonic Row Chemical Oxygen- Iodine Laser”, JSME Int. J. Ser B (Jpn Soc Mech. Eng.) 41(4), pp. 966-974, 1998.
58. M. Hishida, K. Kominato, W. Masuda and J. Schmiedberger, “Numerical Simulation of Q-switched Operation in a Supersonic flow Chemical Oxygen-Iodine Laser”, Pap. Am. Inst. Aeronaut. Astronaut., pp. 12, 1999.
59. W. Masuda, M. Hishida, K. Kominato, “Characteristics of Radiation from a Q-Switched Supersonic Row Chemical Oxygen-Iodine Laser”, JSME Int. J. Ser B (Jpn Soc Mech. Eng.) 43(1), pp. 36-45, 2000.
60. M. Endo, K. Kodama, Y. Handa and T. Uchiyama, “Theoretical Study of a Large Scale Chemically Pumped Pulsed Iodine Laser Amplifier”, Proc. SPIE 1810, pp. 532-535, 1992.
61. M. Endo, K. Kodama, Y. Handa and T. Uchiyama, “Theoretical Study of a New Energy Extraction Scheme of a Chemically Pumped Pulsed Iodine Laser Amplifier”, Appl. Phys. B, 56(6), pp. 379-384, 1993.
62. F. Wani, T. Nakabayashi, A. Hayakawa, S. Suzuki and K. Yasuda, “High-power COIL and YAG welding”, Proc. SPIE 4631, to be published.
Proc. SPIE Vol. 4631 127

High-power COIL and YAG laser welding
Fumio Wani, Tokuhiro Nakabayashi, Akiyoshi Hayakawa, Sachio Suzuki, and Kozo Yasuda Technical Institute, Kawasaki Heavy Industries, Ltd.
ABSTRACT
We have constructed a laser welding system, which enabled high-power laser welding by combining three laser
beams of 1 jam wavelength. Its wavelength enables optical silica fibers transmission and the flexible system. The heart of this system consists of a 4 kW and a 6 kW Nd:YAG lasers and a 10 kW Chemical Oxygen-Iodine Laser (COIL). The average power of the combined beam is up to over 20 kW. The effects of various welding parameters were investigated, such as the laser power, pulse modulation, and so on. The 10 kW COIL has a very good beam quality which is 64 mnrmrad. The beam spot diameter is 0.48 mm at the focal point. On the contrary the beam quality of Nd:YAG laser is worse, but it has the function of pulse modulation which the COIL dose not have. As a result of the welding test with the 6 kW Nd:YAG laser, it was clarified that the pulse wave (PW) has good efficiency of deeper penetration at low welding speed. When the combined beam with CW COIL and PW Nd:YAG laser was used, 20 mm penetration on the stainless steel could be achieved at a welding speed of 1 m/min.
Keywords: Laser welding, thick plate welding, COIL, YAG, combined laser beam
1. INTRODUCTION
Laser welding has come into general use in various manufacturing processes because laser welding has many beneficial features such as deep penetration, low distortion and low thermal damage in material processing due to the
small beam spot with high-power density1*2. In addition, the laser, whose wavelength is located in 1 pm region, enables flexible optical silica fiber transmission of the output power. This attribute brings substantial production advantages over the other industrial lasers, especially C02 laser. In particular, this flexibility weighs with the heavy industry in which the products are made of thick and large metal parts. The technological innovations of the lamp-pumped Nd:YAG laser had raised the possibility several years ago, but as it was difficult because of the expensive running cost and unreliability. Therefore, the Japanese national R&D project “Advanced Photon Processing and Measurement Technologies” was started in 1997. In this project, the technologies of laser diode (LD) pumped 10 kW Nd:YAG laser and also the advanced processing which will use it are being developed. We secured a contract for the development of the advanced laser processing, namely, “Macroscopic processing technology”, and had started the development of highly reliable laser welding technology. The goal of this contract is to establish the technology for laser welding of 30 mm thick steel plates and 20 mm thick aluminum alloy plates at a welding speed of higher than 1 m/min, providing high aspect ratio and equivalent or better strength than the base material. In order to realize it, we developed the laser welding system composed of abeam combining system, in-process monitoring sensors, Nd:YAG lasers and a COIL and many beneficial findings were obtained3’4,5. In this paper, we report the high-power laser welding results with this system.
2. EXPERIMENTAL APPARATUS
The schematic diagram of our laser welding system is shown in Fig. 1. The heart of this system consists of a 4 kW and a 6 kW Nd:YAG lasers and a 10 kW class supersonic COIL. This system is equipped with in-process monitoring sensors, photo diodes and CCD cameras. It makes defect free welding by controlling welding parameters based on monitoring information from the sensors. This series of experiments were conducted by using the 6 kW Nd:YAG laser and the 10 kW COIL mostly. The photographs and specifications of both lasers are shown in Fig. 2. The maximum
128
Gas and Chemical Lasers and Intense Beam Applications III, Steven J. Davis, Michael C. Heaven, Editors, Proceedings of SPIE Vol. 4631 (2002) © 2002 SPIE . 0277-786X/02/$15.00

output power of COIL is 12 kW. On the other hand, the Nd:YAG laser has a function of pulse modulation which the COIL dose not have. The peak power is 12 kW at a pulse duty of 50 % and the pulse frequency is CW or 40-500 Hz.
Figure 3 shows the welding apparatus of the flat position welding. The COIL beam was delivered by a bending mirror and focused by using a 200 mm focal length lens. The shielding gas, N2, Ar or He gas, was flowed through a coaxial nozzle whose diameter was 8 mm. A standoff height of the nozzle was set up in 8 mm. When the laser output power were 7.5 kW and 11 kW, the measured beam diameters at the focal point were 0.3 mm and 0.36 mm, respectively.
Figure 4 shows the welding apparatus of the horizontal position welding. The COIL beam and the Nd:YAG laser beam were delivered by bending mirrors into a beam combining system. The beam combining system contained two focal lenses, whose focal lengths were 300 mm for each beam, and one dichroic mirror. The system was assembled on an optical table; this setup gives an easiness to maintain the optical parts. In the beam combining system, laser beams were focused and
Beam combining system
Processing controller
Signal controller
Welding torch
0-
CCD cameral' Photodiode
| Photodiode TCCD camera
a— Welding torch
Beam oscillator
Alarm signal
Fig. 1: Schematic diagram of the developed laser welding system
Laser beam Specification
Laser power : MAX. 12 kW Wave Form : CW
Wavelength : 1.315 jam Pump method : Chemical
Specification Average power : MAX. 6 kW
Pulse frequency: CW, 40-500 Hz Peak power : 12 kW (pulse duty 50 %)
: 18 kW (pulse duty 33 %) Wavelength : 1.064 pm Pump method : lamp
Fig. 2: Photographs and specifications of the 6 kW Nd:YAG laser and the 10 kW class COIL
Proc. SPIE Vol. 4631 129

Overview of welding apparatus
Fig. 3: Welding apparatus of the flat position welding
Fig. 4: Welding apparatus of the horizontal position welding
130 Proc. SP1E Vol. 4631
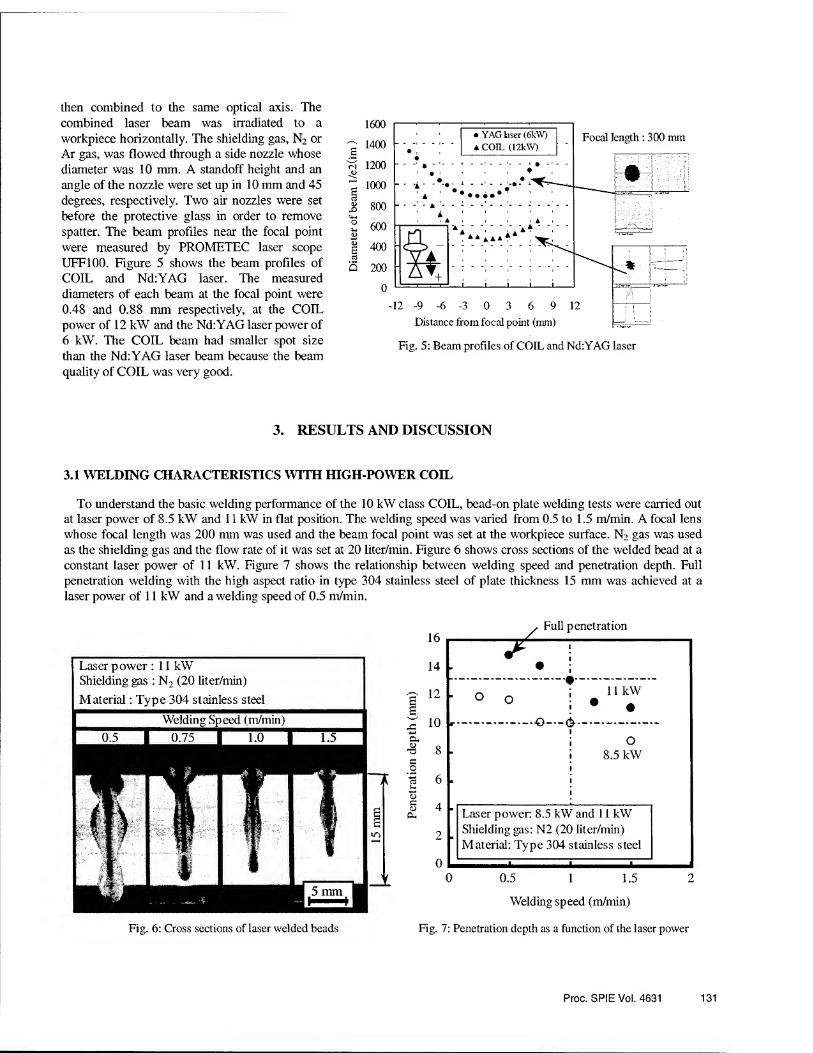
then combined to the same optical axis. The combined laser beam was irradiated to a workpiece horizontally. The shielding gas, N2 or Ar gas, was flowed through a side nozzle whose diameter was 10 mm. A standoff height and an angle of the nozzle were set up in 10 mm and 45 degrees, respectively. Two air nozzles were set before the protective glass in order to remove spatter. The beam profiles near the focal point were measured by PROMETEC laser scope UFF100. Figure 5 shows the beam profiles of COIL and Nd:YAG laser. The measured diameters of each beam at the focal point were 0.48 and 0.88 mm respectively, at the COIL power of 12 kW and the Nd:YAG laser power of 6 kW. The COIL beam had smaller spot size than the Nd:YAG laser beam because the beam quality of COIL was very good.
3. RESULTS AND DISCUSSION
3.1 WELDING CHARACTERISTICS WITH HIGH-POWER COIL
To understand the basic welding performance of the 10 kW class COIL, bead-on plate welding tests were carried out at laser power of 8.5 kW and 11 kW in flat position. The welding speed was varied from 0.5 to 1.5 m/min. A focal lens whose focal length was 200 mm was used and the beam focal point was set at the workpiece surface. N2 gas was used as the shielding gas and the flow rate of it was set at 20 liter/min. Figure 6 shows cross sections of the welded bead at a constant laser power of 11 kW. Figure 7 shows the relationship between welding speed and penetration depth. Full penetration welding with the high aspect ratio in type 304 stainless steel of plate thickness 15 mm was achieved at a laser power of 11 kW and a welding speed of 0.5 m/min.
Fig. 6: Cross sections of laser welded beads Fig. 7: Penetration depth as a function of the laser power
Fig. 5: Beam profiles of COIL and Nd:YAG laser
Proc. SPIE Vol. 4631 131
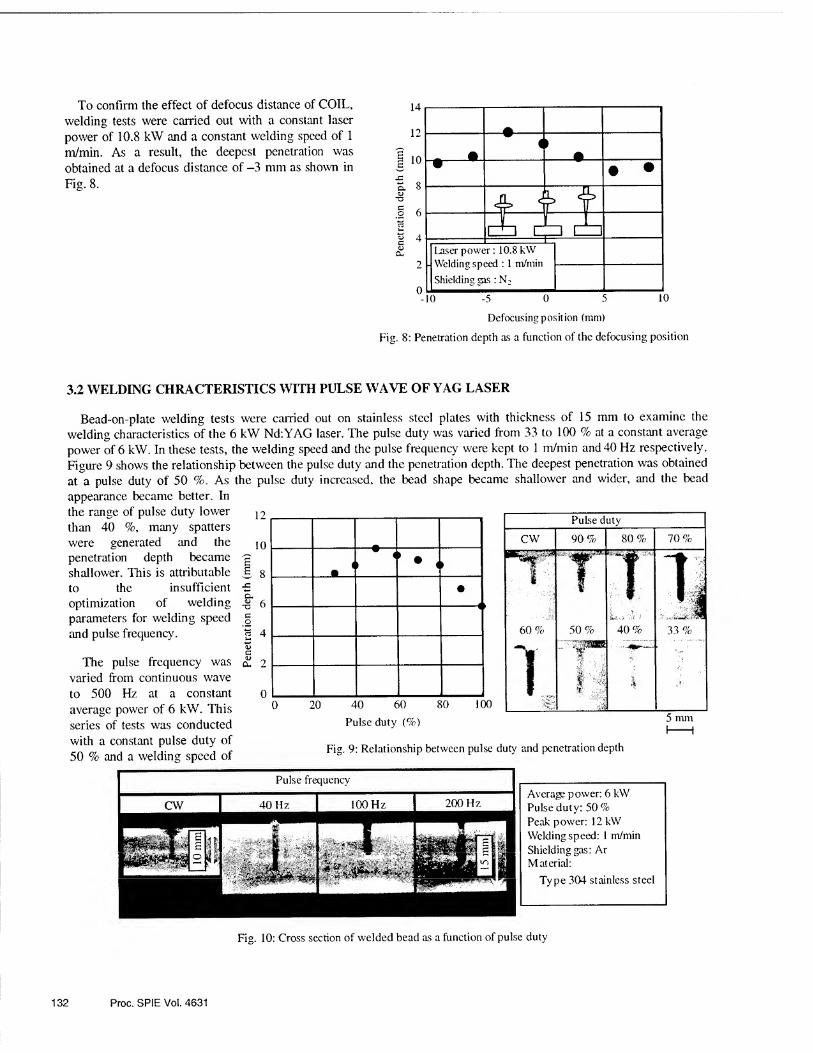
To confirm the effect of defocus distance of COIL, welding tests were carried out with a constant laser power of 10.8 kW and a constant welding speed of 1 m/min. As a result, the deepest penetration was obtained at a defocus distance of -3 mm as shown in Fig. 8.
14
12
10
JS
K. T3
0
* * 4 ►
• • u Laser powe t: 10.8 kW
Shielding gas : N2
-10 10 -5 0 5
Defocusingposition (mm)
Fig. 8: Penetration depth as a function of the defocusing position
3.2 WELDING CHRACTERISTICS WITH PULSE WAVE OF YAG LASER
Bead-on-plate welding tests were carried out on stainless steel plates with thickness of 15 mm to examine the welding characteristics of the 6 kW Nd:YAG laser. The pulse duty was varied from 33 to 100 % at a constant average power of 6 kW. In these tests, the welding speed and the pulse frequency were kept to 1 m/min and 40 Hz respectively. Figure 9 shows the relationship between the pulse duty and the penetration depth. The deepest penetration was obtained at a pulse duty of 50 %. As the pulse duty increased, the bead shape became shallower and wider, and the bead appearance became better. In the range of pulse duty lower than 40 %, many spatters were generated and the penetration depth became shallower. This is attributable to the insufficient optimization of welding parameters for welding speed and pulse frequency.
The pulse frequency was varied from continuous wave to 500 Hz at a constant average power of 6 kW. This series of tests was conducted with a constant pulse duty of 50 % and a welding speed of
12
10
, 8
T3 e o
£ 2
20 40 60
Pulse duty (%)
80 100
Pulse duty j
CW 90% 80% 70%
60%
i . ..
50%
1 i yJt
T L.vS-j '
40%
:
i
TJ 33%
5 mm
Fig. 9: Relationship between pulse duty and penetration depth
Average power: 6 kW Pulse duty: 50 % Peak power: 12 kW Welding speed: 1 m/min Shielding gas: Ar Material:
Type 304 stainless steel
Fig. 10: Cross section of welded bead as a function of pulse duty
132 Proc. SPIE Vol. 4631

1 m/min. Figure 10 shows the cross section of welded
bead. The bead shapes of pulse wave conditions were
deeper and narrower than of a continuous wave
condition. The spatters of molten metal increased as the
pulse frequency increased. In the range of higher pulse
frequency, underfills appeared in the weld bead surface
and penetration depth fluctuated on one bead. As a
result, the best frequency condition was 40 Hz.
The defocusing distance was varied from -15 to +10
mm at a constant average power of 6 kW. The series of
tests was conducted with a constant pulse frequency of
40 Hz and a welding speed of 1 m/min; waveform
conditions were a pulse duty of 50 % and continuous.
Figure 11 shows the relationships between defocusing
distance and penetration depth. The deepest penetration
was obtained at defocusing distance -6 mm in both
cases.
Welding speed: 1 m/min. Average power: 6 kW
Shielding gas: N2_
Defocusing distance (mm)
__ . ^ . ... Fig. 11: Penetration depth as a function of the defocusing position The welding speed was varied from 0.2 to 3 m/nun
under the best welding condition: the average power of 6
kW, the pulse duty of 50 %, the pulse frequency of 40 Hz, the welding speed of 1 m/min and the defocus distance of -6
mm. To compare the welding characteristics with those of continuous wave, a series of welding tests was also carried
out with continuous wave. Figure 12 shows the relationship between welding speed and penetration depth. As welding
speed became lower, the penetration depth with pulse wave became deeper than that with continuous wave. The values
of penetration depth with pulse wave were 1.5 and 2 times as deep as those of continuous wave at welding speed 1 and
0.2 m/min, respectively. From this result, the deeper penetration with pulse wave at low welding speed can be explained
by the high peak power and the high cooling effect of the pulse wave.
25
120 B
1 c a 15
-8 .2 10 | e 5 a>
cu
(C)
Avarage power : 6 kW
• CW
A PW (40Hz, 50%)
+4
JL -L.
1 2 3 Welding speed (m/min)
PW
Peak: 12 kW
Pulse condition :
40 Hz, 50 <
Welding speed :
1 m/min
(a) Welding speed : 1 m/min
PW
Peak: 12 kW
Pulse condition :
40 Hz, 50 % l~4
CW
(b)
10 mm < >
PW
Peak: 12 kW
Pulse condition :
40 Hz, 50 %
Welding speed : 1 m/min
M
CW
Welding speed : 0.2 m/min
ii
^ 20 mm *
JOmmJ K-
Fig. 12: Relationship between welding speed and penetration depth
Proc. SPIE Vol. 4631 133

3.3 LASER WELDING CHRACTERISTICS WITH HIGH-POWER COMBINED BEAM
Bead-on-plate welding tests were carried out with combining beam. Relationships between penetration depth and welding speed for various laser beam parameters are summarized in Fig. 13. As welding speed was decreased, bead shape was deeper and wider. It is confirmed that the penetration depth at combining beam of continuous wave is nearly equal to additional value of those at each single beam.
Figure 14 shows the comparison of bead shape between pulse modulation and continuous wave. At combining beam of continuous and welding speed 0.5 m/min, 20 mm penetration depth was obtained, but the heat effect was so large that welded metal was dropped. On the other hand, by using combined beam with the pulse modulation of Nd:YAG laser, 20mm penetration depth was achieved in high aspect ratio at a welding speed of 1 m/min. It was confirmed that pulse modulation was effective for deeper penetration.
In addition, welding tests for square groove butt joint were conducted with the combined beam. Figure 15 shows the results of butt joint welding in type 304 stainless steel of plate thickness 20 mm. One-side and double-side welding was conducted, then defect-free and full-penetration welding was obtained in the both cases, as shown in Fig. 15. Butt joint welding tests for 30 mm thickness stainless steel plates were also carried out. Defect-free and full- penetration welding was also obtained in the cases of both side welding at a welding speed of 1 m/min. The cross section of welded plate is shown in Fig. 16.
We also conducted various welding experiments in aluminum alloy to realize the defect-free welding in aluminum alloy of plate thickness 20 mm. It was difficult
134 Proc. SPIE Vol. 4631

to obtain the defect-free welding in aluminum alloy compared to steel because of the vaporization of volatile alloying additions such as magnesium. To clarify the optimum welding conditions in aluminum alloy, bead-on-plate welding tests were conducted with combined beam and single COIL beam. The defocusing distances of both beams were varied individually. The typical cross sections of welded aluminum alloy (A5083) plates are shown in Fig. 17. A penetration depth of 11.6 mm was attained with the combined beam, whose total laser power was 10 kW (COIL) + 6 kW (CW, Nd:YAG), at a welding speed of 1 m/min. In the COIL single beam welding, a penetration depth of 9.1 mm was obtained with the laser power of 10 kW at same welding speed. Now we are trying to achieve the full penetration welding with good welding quality in aluminum alloy (A5083) of plate thickness 20 mm.
One-side welding
Power : 10 kW COIL + 6 kW YAG YAG Pulse condition : 40 Hz, 50 % Welding speed : 0.8 m/min
Front side
- 4 '*! . f - : j|| ; >1
Reverse side
Radiograph
Double-side welding
Front side Power : 10 kW COIL + 6 kW YAG YAG Pulse condition : 40 Hz, 50 %
Reverse side
Power : 6 kW YAG YAG Pulse condition : 40 Hz, 80 %
Welding speed : 1.5 m/min
Front side
Reverse side M‘TM)ill'illl 1 III f Radiograph . %< ■■ \
10mm h—i
5 mm i—i
Fig. 15: Welding results in type 304 stainless steel butt joints of plates thickness 20 mm
Double-side welding
Laser power:
8 kW (COIL) + 6 kW (PW, YAG)
Welding speed : 1 m/min
Material:
Type 304 stainless steel
Fig. 16: Welding results in type 304 stainless steel
butt joints of plates thickness 30 mm
Welding speed: 1 m/min, Shie lding gas: Ar gas , 20 liter/min
111 n COIL+ Nd:YAG laser
Laser power 10 kW+ 6 kW Defocusing distance: 18 mm, 8 mm
COIL
Laser power 10 kW Defocusing distance : 8 mm
Fig. 17: Welding results in A5083 of plates thickness 20 mm
Proc. SPIE Vol. 4631 135

CONCLUSION
We are developing the highly reliable laser welding technology with high-power lasers whose wavelengths are
located in 1 pm region. To establish the technologies for the thick plate laser welding, we carried out various welding experiments and obtained following results.
The beam combining system with beams of 6 kW Nd:YAG laser and 10 kW-class COIL was developed. By using this system, abundance of valuable results about high-power laser welding were obtained. Full penetration welding with good welding quality in type 304 stainless steel of plates thickness 20 mm (one-side welding) and 30 mm (double-side welding) was achieved at a welding speed of 1 m/min.
ACKNOWLEDGMENTS
This work was partially conducted in the program “Advanced Photon Processing and Measurement Technologies” of the National Institute of Advanced Industrial Science and Technology, the Ministry of Economy, Trade and Industry, consigned to the R&D Institute for Photonics Engineering from the New Energy and Industrial Technology Development Organization (NEDO).
REFERENCES
1. K. Minamida, “High-power laser application in Nippon Steel Corporation”, Proc. SPIE 3888, pp. 533-542, 1999. 2. T. Ishide, S. Tsubota, M. Nayama, S. Yoshiaki, T. Nagashima, and K. Okimura, “10-kW-class YAG laser
application for heavy components”, Proc. SPIE 3888, pp. 543-550, 2000. 3. T. Nakabayashi and M. Muro, “High power chemical oxygen-iodine laser welding”, Proc. SPIE 3887, pp. 359-366,
2000. 4. T. Nakabayashi, F. Wani, H. Okado, A. Hayakawa, S. Suzuki, and K. Yasuda, “Laser welding characteristics with
high power combining beam”, Proc. ICALEO 2001, Section A-302, 2001. 5. H. Okado, T. Nakabayashi, F. Wani, A. Hayakawa, S. Suzuki, and K. Yasuda, “Beam operation for thick plate laser
welding”, Proc. the 7th bit. Symp., pp. 491-496, 2001.
136 Proc. SPIE Vol. 4631

COIL development in Kawasaki Heavy Industries, Ltd.
Tomohito Takada*3, Fumio Wani b, Kozo Yasuda b aAerospace Company, Kawasaki Heavy Industries, Ltd.; technical Institute, Kawasaki Heavy Industries, Ltd.
ABSTRACT
The Chemical Oxygen-Iodine Laser (COIL) has been studied for military use because it has many excellent features.
These features count with not only the military but also the industry. The wavelength of COIL 1.315 pm, is a significant features of the industrial laser because it is located in a minimum loss transmission region for optical silica fibers. Therefore, we started the COIL development for industrial use in 1986. In the first stage, we developed a subsonic type. In 1992, the first 1 kW class commercial COIL was delivered. This system was successfully operated for several hours, and its output beam was delivered through the optical silica fiber of 0.3 mm core diameter. But the subsonic COIL has the disadvantage that the device size is relatively large. To solve this problem, the supersonic COIL has been introduced and developed. In 1994, 1 kW supersonic output power was attained. On the basis of this technology, we constructed a 10 kW class in 1996. This system achieved over 12 kW output power and chemical efficiency of 26 %.
Keywords: COIL, iodine laser, chemical laser, gas laser, chemical efficiency
1. INTRODUCTION
The first COIL lasing was demonstrated at the U.S. Air Force Weapons Laboratory in 19771. The attractive characteristics of the COIL, the short wavelength, narrow emission line, etc., motivated many researchers to develop the military COIL. On the other hand, in Japan, the COIL drew a great deal of interest to the industrial application because of its following excellent features. The wavelength of COIL is 1.315 pm and its absorption on the surfaces of material is higher than that of CO2 laser. The optical silica fiber transmission loss of COIL is very low as same as that of Nd: YAG laser. The beam quality of COIL is very good as same as that of C02 laser because the laser medium is low pressure gas. The COIL can be called the laser having merits of C02 and Nd:YAG lasers. The COIL research in Japan was started in 1982 on basic experiment and theoretical studies at Keio Univ. The extensive studies of Keio Univ.2 accelerated the study of industrial COIL and led to the joint research program of Industrial Research Institute (IRI) and us.
We have started the development of the industrial COIL in 1986. In the first stage of our COIL research, a subsonic type was studied and developed. After the joint research with IRI for several years, we have completed a 1 kW class proto-type subsonic COIL3. On the basis of this technology, the first lkW class commercial COIL for material processing was delivered to the Applied Laser Engineering Center in Japan4,5. It was successfully operated for several hours and proved the possibility of the industrial COIL. But the subsonic COIL has the disadvantage that the device size is relatively large compared with the laser power. The gain length of the 1 kW commercial COIL was about 1 m. In the early 1990's, our study of COIL has shifted to the supersonic type. And the target laser power has been pulled up to compete against the other industrial laser, especially Nd:YAG laser. In 1994, 1 kW supersonic output power was attained6'7. We have constructed the 5 kW class supersonic COIL in 19958 and the 10 kW class supersonic COIL in 19969,10 by use of this base supersonic COIL technology. We could get gratifying COIL performance and conducted a lot of laser processing tests by use of them. A historical overview of our researches for these past 16 years about the COIL devices and its applications are discussed.
* takada [email protected]; phone 81 583 82-8129; fax 81 583 82-4269; http://www.khi.co.jp; Kawasaki Heavy Industries, Ltd, 1 Kawasaki-cho Kakamigahara, Gifu, 504-8710 Japan; ** wani [email protected]; phone 81 471 24-0269; fax 81 471 24-5917; http://www.khi.co.jp; Kawasaki Heavy Industries, Ltd, 118 Futatsuzuka, Noda, Chiba, 278-8585 Japan
Gas and Chemical Lasers and Intense Beam Applications III, Steven J. Davis, Michael C. Heaven, Editors, Proceedings of SPIE Vol. 4631 (2002) © 2002 SPIE * 0277-786X/02/$15.00 137

2. DEVELOPMENT OF SUBSONIC COIL DEVICE
The early sturdy of the subsonic COIL from 1986 was conducted with IRI for several years. In this joint study, we constructed a couple of small-scale systems to study efficient operation11, and long term continuous operation1^. In Ref. 11, we demonstrated a maximum chemical efficiency of 40 %. In Ref. 12, we succeeded in operating a 100 W class system for over 3 hrs by continuously replenishing the Basic Hydrogen Peroxide (BHP). In addition to those small-scale devices, we constructed a high-power version prototype and succeeded in achieving an output power of 1 kW. The 2nd version prototype, equipped with a fuel replenishing system, was constructed on the basis of these results in succession. The maximum output power of 1.1 kW, and a continuous operation time of more than 2 hr with a power of over 500 W were achieved by this system3. Based on this long-standing effort, we brought the first lkW class commercial COIL for material processing to completion4,5.
Figure 1 shows the photograph of the 1 kW commercial COIL system. The major specifications of this system are summarized in Table 1. The laser beam of the COIL can be delivered by mirror optics or an optical silica fiber. By using this system, the use of 0.3 mm core diameter optical silica fiber of 200 m length was succeeded to transmit the 1 kW output power COIL beam with low transmission loss of about 4.6 dB/km in 200 m distance8.
Figure 2 shows the schematic diagram of the main construction. This COIL system has some specific facilities for long time stable oscillation, such as the fuel recirculation system, pressure control system at the laser cavity, the iodine evaporator with the halogen lamp heater for coping with quickly to the laser power variation, and the water vapor trap of rotating disk type. In the fuel recirculation system, the composition and temperature of BHP are controlled automatically for stabilizing the excited oxygen generation. And the waste solution of after reaction is utilized to melt the ice which scraped off from the disk surfaces of the water vapor trap. This molten water is continuously discharged to outside the vacuum line by means of the ice discharge pump. Thus the operation could be continued stably for long time. The performance of this COIL system is over 1 kW
Cl, Gas
Fig. 2: The main construction of 1 kW commercial COIL
138 Proc. SPIE Vol. 4631

output power within ±2 % power fluctuation with 30 % chemical efficiency. This system is in good running order to date.
3. DEVELOPMENT OF SUPERSONIC COIL DEVICE
In the early 1990’s, kW class NdiYAG laser had been brought to the market. The target range of COIL output power was gradually shifted to high-power to maintain its competitive edge by using the easy output power scalability of COIL’s as leverage. In order to realize the high-power and compact industrial COIL, our study of COIL has shifted to the supersonic type. In 1994, 1 kW supersonic output power was attained as a result of several years research1 6,7
On the basis of this research, we have constructed the 5 kW class supersonic COIL, shown in Fig. 3, in 19958. The major specifications of this 5 kW class COIL are summarized in Table 1. This system mainly consists of a jet-type singlet oxygen generator (J-SOG), a water vapor trap and others. The design specification was cleared, successfully, and it was used for quite a number of material processing tests. However, this system has a serious issue which is the short run length, because it is difficult to operate the water vapor trap continuously for a long stretch of time in the supersonic operation mode owing to the high gas pressure.
Fig. 3: 5 kW class supersonic COIL
The important factor in the industrialization of COIL is long term operation, not to mention cost. The long term operation is difficult for the former supersonic COIL, since there are two factors which are the water vapor trap and maintaining the BHP composition. We had solved these problems by further studies, and so the 10 kW class supersonic COIL had been completed in 19969’10. The main construction and the outside view of this 10 kW system are shown in Fig. 4 and 5, respectively. The major specifications of this system arc summarized in Table 1.
This COIL mainly consists of a J-SOG, a supersonic cavity and a BHP circulation system. The schematic diagram of the main construction is shown in Fig. 6. In the J-SOG, singlet oxygen is generated by the chemical reaction between gaseous chlorine and BHP which is produced by mixing KOH with H202. A mixture chlorine is introduced transversely to the BHP jet flow. The supersonic cavity is divided into three parts: iodine injectors, supersonic nozzles and a resonator. To obtain good mixing of the iodine with the primary flow of the mixture gas, the iodine is injected transversely and diagonally by the iodine injectors in the subsonic region just up stream of the supersonic nozzle throat.
Fig. 4: The main construction of 10 kW COIL Fig. 5: The outside view of 10 kW COIL
Proc. SP1E Vol. 4631 139

Iodine Injectors
Supersonic Nozzles
BHP
Then the laser gas, which is composed of the mixture gas and the iodine, is expanded and accelerated to a laser gas velocity of about Mach 2 through the supersonic nozzle. The supersonic nozzle is made up of many small nozzles with vertical nozzle blades, and the area ratio of the nozzle throat to the nozzle exit plain is 1 to 2.3. To attain high efficiency and good beam quality, a Z- folded resonator configuration was adopted to this system, which makes maximum 3 paths through the gain region and the total cavity length was 5.2 m at that setting. The maximum gain length was 3.2 m per a round trip. The BHP circulation system is made up of a BHP circulation pump, a heat exchanger and a chiller. The heat generated by the chemical reaction between gaseous chlorine and BHP is continuously removed from the BHP solution and the BHP inlet temperature is maintained at 255 K to minimize the generation of water vapor, which promises long-term operation over 30 minutes.
The experimental results with helium diluent gas about the dependence of the laser power on the mirror transmission are shown in Fig. 7. In the folded resonator configuration (2 paths), about 11 kW output was attained, and its beam shapes was 25 mm by 17 mm. The operation was conducted over a chlorine flow rate of 0.67 mol/s, a primary helium flow rate of 1.5 mol/s and a secondary helium flow rate of 0.75 mol/s. The upstream beam path in the gain medium was set in the distance of 30 mm from the supersonic nozzle outlet. The downstream beam path was set in the distance of 120 mm from the nozzle outlet. The typical measured values of the 10 kW COIL small signal gain are shown in Fig. 8. We made certain of the enough gain, 60 % of the upstream one, at the downstream side. This 10 kW COIL system can be also operated with nitrogen diluent gas instead of helium gas to curb the running cost because helium gas is very expensive, more than 5 times as expensive as nitrogen, in Japan. The output power of 5.3 kW was attained at a chlorine flow rate of 0.37 mol/s, a primary nitrogen flow rate of 0.97 mol/s and a secondary nitrogen flow rate of 0.57 mol/s. But the output
14
12 h
10
<D £ O
CL -M 3 Q. 4—* 3 o
8 V
6 h
2 h
10 15
Transmission (%)
20 25
Fig. 7: Dependence of output power on mirror transmission
140 Proc. SPIE Vol. 4631

laser power with nitrogen diluent gas is limited to about a half of that with helium diluent to maintain the same total pressure with helium diluent gas in the J-SOG. By further studies, iodine injection technique etc., we obtained a maximum output power of 12 kW and a maximum chemical efficiency of 26 % at 3 paths configuration with helium diluent gas in 1999. This 10 kW system is operated 1 -2 days a week for the laser processing at the present day.
0.8
0.7
5 06 T—f
I 05 3
13 04 c 00 t/j 0.3
S 0.2 CO
0.1
n
■
i i ■ m
►..
> > -|
■ > i >
. . 1 >
-
0 2 4 6 8 10 12 14
Distance from the supersonic nozzle outlet (cm)
Fig. 8: Measured results of the 10 kW COIL small signal gain
Table 1: The major specifications of KHTs COILs
1 kW (ALEC) 5 kW class 10 kW class
Operation mode Subsonic Supersonic Supersonic
SOG type Bubbler Jet Jet
Output power (kW) 1-2 -5 -12
Water vapor trap type Rotating disk Fin Non
Chemical efficiency (%) 30 15 20-26
Cavity length (m) 2.2 (1 path) 5.1 (3 paths) 5.2 (3 paths)
Beam quality (mm*mrad) 86 60-80 60-80
Focused beam spot diameter at 1/e2 (pm) 280 300 220
Focal length of the focusing lens (mm) 77 84 82
Delivered fiber core diameter (mm) 0.3 0.6-0.8 0.6-0.8
Proc. SPIE Vol. 4631 141

4. STUDY OF COIL APPLICATIONS
The above-mentioned excellent COIL characteristics enable us to apply the laser processing to wide application fields. To examine the feasibility of the promising COIL application, we conducted various laser welding and cutting tests by using a fiber-transmitted high-power COIL beam. Especially, we conducted the study bent upon the laser remote dismantling system and the laser welding system for thick plates.
The COIL is of great advantage to application to the dismantling of the nuclear facilities, considering low transmission loss in radiation-proof optical silica fibers, high beam quality, high-power, and large energy absorption on the material surface. Figure 9 shows the concept of this COIL dismantling system. In dismantling of nuclear facilities, components of many different materials, shapes, dimensions or places need to be cut in the high radiation field so as to minimize secondary rad-wastes produced by cutting. Therefore, the cutting system for it is desired to be multipurpose, flexible, radiation-proof and easy in treatment. The laser cutting method can minimize the secondary rad- wastes because of a small beam size compared with other thermal cutting ones, and the treatment of the laser cutting devices is easy since the laser cutting head is smaller than the mechanical ones. The remote cutting system with a laser, especially COIL, transmitted through an optical silica fiber is promising for dismantling of activated in-vessel components and pressure vessels. Therefore, we conducted the empirical study of the remote laser dismantling system from 1994 to 200013,14. The laser cutting tests were conducted under the water because the operation has the matter of preventing radioactive contamination. This series of tests was carried out by use of the 1 kW subsonic commercial COIL, the 5 kW and 10 kW class supersonic COILs.
We also conducted the laser welding study with COIL, energetically. Especially, the study of high-power laser welding has been accelerated under the Japanese national R&D project “Advanced Photon Processing and Measurement Technologies” since 1997. The aims of this project are to develop the technologies for generating high-power, high- quality lasers of high efficiency and low cost and also the advanced processing and measurement technologies which will use them. We secured a contract for the development of the advanced laser processing, namely, “Macroscopic processing technology”, and had
142 Proc. SPIE Vol. 4631

started the development of highly reliable laser welding technology. The goal of this contract is to establish the technology for laser welding of 30 mm thick steel plates and 20 mm thick aluminum alloy plates at a welding speed of higher than 1 m/min, providing high aspect ratio and equivalent or better strength than the base material. The laser processing machine and a cross section of the welded stainless steel are shown in Fig. 10. This study is carrying out with high-power lasers, 4 kW and 6 kW Nd:YAG lasers and the 10 kW class COIL, and many beneficial findings are obtained15,16,17. The detail discussion of this study is yielded to another paper of ours18.
CONCLUSION
In this paper, we have reviewed our study of the industrial COIL from 1986 to date. As a result of long-standing study of the industrial COIL for the last 16 years, we have successfully completed the 10 kW COIL system. This system is used for the investigation of the various laser processing fields which are difficult to study by use of the conventional industrial lasers, and produces a lot of exciting results.
In the United States, the practical application of COIL is coming out true as the airborne laser (ABL). To realize a practical application in Japan, too, we will step up efforts toward the development of COIL. We hope that the brilliant features of COIL and the strenuous efforts of its researchers throughout the world will work out the broad application fields of it in the early 21st century.
ACKNOWLEDGMENTS
The development of highly reliable laser welding technology was partially conducted in the program “Advanced Photon Processing and Measurement Technologies” of the national Institute of Advanced Industrial Science and Technology, the Ministry of Economy, Trade and Industry, consigned to the R&D Institute for Photonics Engineering from the New Energy and Industrial Technology Development Organization (NEDO).
REFERENCES
1. W. E. McDermott, N. R. Pchelkin, D. J. Benard, and R. R. Bousek, “An electric transition chemical laser”, Appl. Phys. Lett. 32, pp. 469-470, 1978.
2. H. Yoshimoto, H. Yamakoshi, Y. Shibukawa, and T. Uchiyama, “A highly efficient, compact chemical oxygen- iodine laser”, J. Appl Phys. 59, pp. 3965-3967, 1986.
3. H. Fujii, S. Yoshida, M. Iizuka, and T. Atsuta, “Development of high-power chemical oxygen-iodine laser for industrial application”, J. Appl. Phys. 67, pp. 3948-3953, 1990.
4. F. Wani, N. Naito, T. Nagai, M. Iizuka, H. Tsuji, and H. Fujii, “Development of 1 kW CW Iodine Laser for Industrial Use”, Proc. Laser Advanced Material Processing (LAMP’92), pp. 127-132,1992.
5. H. Fujii, “COIL Development in Japan”, Proc. ALAA 94-2419, 1994. 6. N. Naito, F. Wani, T. Nagai, T. Nakabayashi, and H. Fujii, “High power COIL development”, Proc. CLEO/Pacific
Rim’95, pp. 160,1995. 7. F. Wani, T. Nakabayashi, and H. Fujii, “High-pressure singlet oxygen production using a jet-type generator”, Proc.
CLEO/Pacific Rim'95, pp. 160, 1995. 8. T. Sakurai, K. Yasuda, T. Osaki, E. Tada, K. Koizumi, and M. Nakahira, “Study on material processing and fiber
transmittance of COIL”, Proc. ICALEO 1996, Section E, pp. 28-37, 1996. 9. F. Wani, N. Naito, T. Nagai, and H. Fujii, “Achievement of 10 kW oscillation of the industrial chemical oxygen
iodine laser”, Proc. CLEO/Pacific Rim '97, pp. 99,1997. 10. N. Naito, F. Wani, T. Nagai, and H. Fujii, “Industrial COIL in Japan”, Proc. AIAA 97-2392, 1997.
Proc. SPIE Vo!. 4631 143

11. s. Yoshida, M. Endo, T. Sawano, S. Amano, H. Fujii, and T. Fujioka, “Chemical oxygen iodine laser of extremely high efficiency”, J. Appl. Phys. 65, pp. 870-872, 1989.
12. H. Fujii, S. Yoshida, M. Iizuka, and T. Atsuta, “Long-term stability in the operation of chemical oxygen-iodine laser for industrial use”, J. Appl Phys. 66, pp. 1033-1037, 1989.
13 ^ Tsurumaki, H. Miyao, H. Tomioka, J. Adachi, K. Yasuda, H. Okado, A. Hayakawa, and S. Yoshizawa, “Development of remote dismantling of components in nuclear reactor with laser transmitted through optical fiber”, Proc. ICONE 5-2074, 1997.
14. H. Okado, T. Sakurai, J. Adachi, H. Miyao, and K. Hara, “Underwarter cutting of stainless steel with the laser transmitted through optical fiber”, Proc. SPIE 3887, pp. 152-160, 2000.
15. T. Nakabayashi and M. Muro, “High power chemical oxygen-iodine laser welding”, Proc. SPIE 3887, pp. 359-366,
2000. 16. T. Nakabayashi, F. Wani, H. Okado, A. Hayakawa, S. Suzuki, and K. Yasuda, “Laser welding characteristics with
high power combining beam”, Proc. ICALEO 2001, Section A-302, 2001. 17. H. Okado, T. Nakabayashi, F. Wani, A. Hayakawa, S. Suzuki, and K. Yasuda, “Beam operation for thick plate laser
welding”, Proc. the 7th Int. Syrup., pp. 491-496, 2001. 18. F. Wani, T. Nakabayashi, A. Hayakawa, S. Suzuki, and K. Kozo, “High-power COIL and YAG laser welding”,
Proc. SPIE 4631, 2002, to be published.
144 Proc. SPIE Vol. 4631

Spatially-resolved temperature diagnostic for the chemical oxygen- iodine laser based on a variant of saturation spectroscopy
Grady T. Phillips, Glen P. Perram, and Won B. Roh
Air Force Institute of Technology
ABSTRACT
The Chemical Oxygen-Iodine Laser (COIL) depends upon a supersonic mixing nozzle to produce optical gain on the
2P1/2 - 2P3/2 atomic iodine transition at X = L315 pm. The translational temperature in the gain generator is particularly important, as the yield of singlet oxygen required to reach lasing threshold decreases from 17% at room temperature to 6% at T=150K. We have demonstrated an optical technique for measuring the gas temperature in the COIL supersonic expansion region with a spatial resolution of less than 12 mm3 using a novel variant of saturated laser spectroscopy. The
sub-Doppler hyperfme spectrum of the visible I2 X1£g+—> B3II(0u+) transition exhibits 15 or 21 transitions and has been recorded using laser saturation spectroscopy with a resolution of about 10 MHz. Pressure broadening of the hyperfme components and cross-relaxation effects have been studied and depend significantly on rotational level. By altering the saturation spectroscopy apparatus so that the pump and probe beams are nearly co-propagating, a Doppler profile, limited to the iodine sample in the volume of the overlapped beams, is obtained. Temperature, as derived from the Doppler profile, is spatially resolved and used to examine the flow from a small supersonic nozzle assembly.
Keywords: saturation spectroscopy, iodine, hyperfme spectrum, line width, pressure broadening, temperature diagnostic, Chemical Oxygen-Iodine Laser (COIL),cross-relaxation, velocity-changing collisions
1. INTRODUCTION
Since the first demonstration of a Chemical Oxygen-Iodine Laser (COIL) in 1978,1 the technology has advanced significantly to supersonic laser devices with high output power and excellent beam quality.2"4 The Chemical Oxygen- Iodine Laser operates on the hyperfme components of the 52P1/2-52P3/2 transition in atomic iodine and is chemically pumped through energy transfer from the metastable 02(a1A). The 02(a1A) and I(2Pi/2) states are nearly resonant with an energy defect of only 279 cm"1. Several excellent reviews of the laser hardware, chemistry, laser physics, and fluid dynamics of these devices are available.2"4
The COIL device employs a supersonic mixing nozzle to: (1) inject, mix and dissociate molecular iodine to produce the lasant, atomic iodine, (2) produce a spatially uniform gain and a region of uniform index of refraction for good beam quality, (3) increase the laser power for a given flow cross- sectional area, and (4) reduce the gas temperature in the gain cavity. The translational temperature is particularly important for COIL, as the yield of
. . , 11* It , M 21 HOLES (42/JUDE.), M^DIA singlet oxygen required to reach lasmg threshold decreases from 17% at room temperature to 6% at T=150K.2 Figure 1. RotoCOIL mixing nozzles
Spatial distributions of the small signal gain and cavity temperature at the exit of the supersonic mixing nozzle of Chemical Oxygen-Iodine Lasers (COIL) have been measured previously by diode laser spectroscopy on the 2P1/2(F’=3) -
i; phone 1 937 255 3636 x 4504; Fax 1 937 255 2921: http://www.afit.edu; Air Force Institute of Technology/ENP, 2950 P Street, Wright-Patterson AFB, OH 45433-7765
Gas and Chemical Lasers and Intense Beam Applications III, Steven J. Davis, Michael C. Heaven, Editors, Proceedings of SPIE Vol. 4631 (2002) © 2002 SPIE • 0277-786X/02/$15.00 145

2P3/2(F=4) transition in atomic iodine.5 The resulting cavity temperatures of about 200 K is significantly higher than the predicted temperature of the supersonic expansion of about 150 K. The technique is limited to measuring an average temperature along the direction of the diode laser beam propagation and may be biased due to the directed flow resulting from symmetrical turbulent vortices, as illustrated in Figure 1. An optical technique for measuring the three- dimensional temperature flow field at the exit plane of the supersonic nozzle is required to fully assess nozzle efficiency and chemical heat release during I2 dissociation. The focus of the present work is to exploit a novel variant of laser saturation spectroscopy to develop a temperature diagnostic with spatial resolution of less than 12 mm3.
2. EXPERIMENT
Laser saturation spectroscopy is a well established technique for obtaining sub-Doppler resolution in gas phase spectroscopy.6 The technique depends on the selection of a subgroup of molecules with a small range of velocities near v=0 using a narrow linewidth laser source.6 In particular, saturation spectroscopy is based on the selective saturation of an inhomogeneously broadened transition. A laser source ’’bums a hole" into the population distribution of the absorbing state by exciting a corresponding peak in the same velocity component in the upper state. Such a hole can be detected by frequency scanning a second laser source through resonance with the first source and monitoring the attenuation of the transmitted beam.
If the output from a single laser is split into two beams which are arranged to counter- propagate in the same media (see Figure 2), then two holes will be burned symmetrically about the line center. The two beams interact with the same velocity groups only when the laser is tuned to line center. The absorption of one of the beams (probe beam) will diminish at line center if the intensity of the second beam (pump beam) is sufficiently intense (near saturation) to alter the population distribution in the absorbing state. This dip in the probe beam absorption at line center due to the counter-propagating pump beam is termed the Lamb Dip. One technique for using this Lamb Dip to perform sub- Doppler spectroscopy involves modulating the amplitude of the pump beam and monitoring the modulated portion of the transmitted probe beam. A non-zero signal is obtained only when the two beams interact with the same velocity group (v=0) in the region where the two beams are overlapped. The observed linewidth is reduced to the homogeneous (Lorentzian) limit. Such sub-Doppler spectroscopy has been demonstrated for molecular iodine,7 and other atomic and molecular species.6
In the current paper we demonstrate a novel variant of the laser saturation spectroscopy which retains the Doppler- limited lineshape, but provides spatial resolution. A schematic diagram for these experiments in shown in Figure 3. By arranging the pump and probe beam to cross each other with a small, but finite angle, the two beams can be made to simultaneously interact only with a small volume of gas. Since the two beams propagate in the same direction, they always interact with the same velocity group, and the full Doppler profile is retained. The Doppler profile can then be utilized to determine the translational temperature for the absorbing medium in the crossing volume. The width, AvD, (FWHM) for a single Doppler broadened line is related to the temperature, T, according to the relationship:
146 Proc. SPIE Vol. 4631

AvZ) = y SkT In 2
Me2 (1)
where v0 is the line center and M is the mass of the absorbing atom or molecule. By fitting the theoretical spectrum to the experimental spectra, using the temperature as the fitting parameter, one can determine the local temperature of the absorbing medium.
Molecular iodine, I2, is a convenient candidate for laser saturation spectroscopy in the COIL device. The saturation intensity is low and many ro-vibrational transitions of the B-X system are accessible in the red portion of the visible spectrum. The near coincidence of several rotational features, possible from different vibrational levels may aid in temperature determination, as the intensities of the rotational features are given by the statistical distribution:
__ hcB\
l KT )
where Bv is the rotational constant and J is the rotational quantum number.
In the present study, a Coherent model 899 ring dye laser pumped by a Spectra Physics Model 2080 Ar+ laser at 514.5 nm was used as the laser excitation source. Exciton Rhodamine 590 dye was used to cover the spectral region 16260.16- 18083.18 cm'1. The intensity of the transmitted probe beam was monitored with a Hamamatsu S2281 silicon photodiode. The side fluorescence was detected with a Burle Photomultiplier Tube model C31034A02. The laser beam was amplitude modulated with a Model SR540 mechanical chopper at 0 - 4000 Hz and the phase sensitive detection was accomplished using a Stanford Research Systems model SR850 lock-in amplifier. A static glass cell (41.5 cm long) was evacuated to < 16 mTorr using a Alcatel 2015 C2 rotary vane pump. Iodine and added buffer gas pressures were monitored with MKS pressure transducers: MKS Model 390HA for < 1 Torr and a MKS Model 690A for 1 to 1000 Torr; both utilizing a MKS Type 270 signal conditioner.
(2 J + l)e -J(J+\)hcBv/kT (2)
3. RESULTS
3.1 Hyperfine Spectrum
The sub-Doppler laser saturation spectrum of the isolated (171) P(70) line of the 12 Xllg+ - B3n(0u+) transition at v=l7339.8187 cm'1 is shown in Figure 4. The spectrum is composed of a set of either 15 or 21 hyperfine spectral components, depending on the parity of the rotational state. The hyperfine components are labeled according to value of F-J, as discussed below.
The Hamiltonian for the nuclear electric quadrupole interaction is:
r
H NEQ ~ ~~eQcl
3(7,-J)2+|(7rJ)-|7,|2|J|2
2(2.7+ 3)(2.7-1)7, (27, -1)
3(72J)2+|(72J)-|72|2|J|2"
2(2 J + 3)(2 J -1)72 (272 -1)
V J
(3)
Proc. SPIE Vol, 4631 147

where Q is the electric quadrupole moment, q( is the average E-field gradient along the J direction, e is the electron
charge, J is the sum of the spin and orbital angular momentum of the molecule, and Ii=I2=5/2 is the atomic iodine
nuclear spin angular momentum. The Hamiltonian for the nuclear magnetic dipole interaction is
nm=My{7,-J) (4) 71
where pG/I] is the spin rotation coupling constant. Finding energy eigenvalue solutions to the Hamiltonian involves the
diagonalization of a nontrivial matrix. However, approximate solutions can be found for J»1 of the form:8
E - Eneo + Em
eQq -NEQ =
8/i(2/i-l) {(M? + Ml) -Ms M,(M, +!)-/,(/, +1) + - + — M-,
J ' "2 /,(/,+!)} (5)
M
Table I provides an evaluation of equation (5) for v’=21, J’—116 line using the
values eQq=-2900 MHz and G/Ij =0.049 MHz. For I1=I2= 5/2 , the possible
values from the projection along the intemuclear axis are -5/2 < Mh M2 < +5/2.
The Pauli exclusion principle requires the total wave function of a homonuclear
diatomic molecule with a half integer nuclear spin remain antisymmetric under an
exchange of the nuclei. As a consequence the M] = M2 combinations are forbidden
for J’=odd, but included for J’=even. The relative line positions for v’=21 for a
broad range of rotational states based on the approximate solution of equation (5)
is provided in Figure 5.
Figure 5. Predicted hyperfine splitting within v'=21.
Table I Hyperfine splitting for v'=21, T=T 16.
Mi m2 F-J F ENEQ+Em 2.5 2.5 5 122 755.989 2.5 1.5 4 121 307.820 2.5 0.5 3 120 87.375 2.5 -0.5 2 119 89.078 2.5 -1.5 1 118 307.352 2.5 -2.5 0 117 736.619 1.5 1.5 3 120 -140.349 1.5 0.5 2 119 -360.794 1.5 -0.5 1 118 -359.091 1.5 -1.5 0 117 -140.817 1.5 -2.5 -1 116 288.450 0.5 0.5 1 118 -581.238 0.5 -0.5 0 117 -579.535 0.5 -1.5 -1 116 -361.262 0.5 -2.5 -2 115 68.005
-0.5 -0.5 -1 116 -577.832 -0.5 -1.5 -2 115 -359.559 -0.5 -2.5 -3 114 69.708 -1.5 -1.5 -3 114 -141.286 -1.5 -2.5 -4 113 287.981 -2.5 -2.5 -5 112 219.592
3.2 Pressure Broadening
The hyperfine components are well represented by pressure dependent Lorentzian lineshapes. In Figure 6, the hyperfine
spectrum is shown for two argon buffer gas pressures. Significant broadening is evident for low pressures. A set of
Lorentizan lineshapes with common widths have been fit to the type of hyperfine data of Figure 6 for a variety of argon
buffer gas pressures where the 12 pressure was fixed at .1635 Torr. The resulting linewidths arc shown in Figure 7. The
fit includes a Gaussian baseline, which is described below in the velocity cross-relaxation discussion.
The intercept in Figure 7 indicates a zero-pressure broadening of 9.40 ±0.16 MHz, which corresponds to natural
broadening with a lifetime of 0.67|ns. The coll is ion less lifetime (l/x0 =l/trad + l/Tnr ) for this state is T0= 1.08-1.14
148 Proc. SPIE Vot. 4631

The slope in Figure 7 provides a pressure broadening rate of 8.14 ± 0.30 MHz/Torr. This result is somewhat higher than the value of 6.6 MHz/Torr reported from Doppler limited absorption studies,10 and significantly larger than the (v,J) dependent rates of 0.31 - 2.96 MHz/Torr reported from fluorescence depolarization studies.11 Further studies are in progress to examine the pressure broadening rates for a wide variety of collision partners.
it Pressure: .1615 T^xf Pressure: J4I4 Torr
Figure 6. Pressure broadened hyperfme spectrum for the (17,1) P(70) line.
0.0 0.2 0.4 0.6 0.8 1.0
Ar Pressure (Torr)
Figure 7. Pressure broadening rate for (17,1) P(70) line with argon collision partner.
Pressure broadening at higher pressures can be obtained from the laser excitation spectra. Figure 8 illustrates the side fluorescence intensity as a function of laser frequency and represents the convolution of 15 Voigt broadened hyperfine levels. To extract the pressure broadening rates, a fit of the hyperfme lines is performed. The spectrum of Figure 8 is fit to the convolved lineshape function:
15or21 15^£,21 -c ZYoigt(v;Ihvoi>AvdMl)
gr(v) = L Voigt(y;Ii,voi,AvD,AvL)e « +a+bv (6) i=\
where a and b represent the background baseline, c is required to model the self absorption of the pump beam by the I2 gas, the relative intensities of the hyperfme components, Ii? are constrained by their statistical weights, 2F+1, voi is the
Proc. SPIE Vol. 4631 149

hyperfine component line center positions as determined from the sub-Doppler spectrum, AvD is the common Doppler
width (FWHM), and AvL is the common Lorentzian width (FWHM). The fit shown in Figure 8 was performed with the Doppler width constrained by the known sample temperature at T=292.6 K, and the Lorentzian width defined by the
intercept in Figure 7 and the self broadening rate of yI2= 8 MHz/Torr.12 A complete analysis of these laser excitation spectra lineshapes at high pressure for a wide variety of collision partners is in progress. A fit to the I2 side fluorescence broadened by Ar buffer gas is shown in Figure 9 where the Doppler width is constrained as mentioned and the Lorentzian is defined additionally by the Ar pressure broadening rate from Fig. 7.
Figure 9. Laser excitation spectrum of (17,1) P(70) line at 163.5 mTorr I2 and 3.1 Torr Ar.
3.3 Velocity Cross-Relaxation
The sub-Doppler laser saturation spectra exhibit a broader feature upon which the hyperfine structure is superimposed. The amplitude of this feature depends on rotational level, J, pressure, and modulation frequency, as shown in Figure 10. Two, closely spaced rotational lines with significantly different rotational states are overlapped in these 2 GHz scans. The broader feature is much more intense for the lower rotational level. The intensity of the broad feature relative to the intensity of the hyperfine resolved components decreases with modulation frequency (as shown in Figure 10b) and total pressure. Similar affects have been observed previously and attributed to velocity cross-relaxation dynamics.7
150 Proc. SP1E Vol. 4631

To further illustrate these collisional dynamics, consider the following example. An I2 non-zero velocity group, vg, interacts with the pump beam and then suffers a collision that converts the velocity group to - vg. The probe beam is then in resonance with the new velocity group, and as long as the collision occurs during the same modulation cycle, a the probe laser intensity is correlated with chopping frequency. Since such collisions can occur for any velocity group, vg, a broad feature with Gaussian shape is obtained. At higher pressures and lower modulation rates, more collisions occur and contribute to a more intense feature. Apparently, the dynamics are dominated by rotationally inelastic collisions, yielding a strong dependence on rotational state. Multiple collisions would be required for R-T events, to return the population to the initial state and contribute to the observed lineshape.
Figure 10 Upper spectrum taken at a chopping frequency of 1000 Hz. Lower spectrum taken at a chopping frequency of 3754 Hz.
3.3 Spatially-Resolved Temperature Diagnostic
The Doppler limited laser saturation spectrum for the (17,1) P(70) line using the apparatus described in Figure 3 is shown in Figure 11.13 For these studies, a static I2 cell with differential heating was employed. The hot end of the cell was maintained at T = 523 K. The pump and probe beams were co-propagated with a small crossing angle of 3.8 degrees, resulting in a crossing volume of 12 mm3. Three spectra were recorded; near the hot end, in the center and near the colder end of the 0.5” diameter by 6” length cell. The width of the observed lineshapes increases with increasing cell temperature, establishing the feasibility of extracting spatially resolved temperatures. The lineshape studies discussed above are essential to extracting accurate temperatures.
Figure 12 predicts the lineshapes for temperatures in increments of 50 K from 50 - 400K. The sensitivity of the diagnostic is improved at lower temperatures, and we are pursuing the application of the technique in a supersonic
Proc. SPIE Vol. 4631 151

expansion as discussed below. The uncertainty in extracted temperatures may be further enhanced by using several closely spaced lines associated with different rotational levels as shown in Figure 10. The rotational Boltzmann distribution of equation (2) can be used to further constrain the temperature.
17340.0 17340.47 17340.49 17)40 J1 17340J3 17)10 33 173 40 J7 17340.19
Figure 11. Doppler-limited saturation spectra at three locations in a differentially heated cell.
Figure 12. Predicted Doppler-limited saturation spectra at T=50 - 400 K in 50K increments.
A Laval nozzle designed by the Air Force Research Laboratory will be used to simulate the conditions in a COIL supersonic nozzle. The Laval nozzle produces a flow at the exit with constant Mach number.14 A schematic of the nozzle is shown in Figure 12. A diffuser is located after the gas inlet to establish a near-zero net hydrodynamic velocity. After the diffuser, there is a convergent section where the flow begins to accelerate and then passes through the throat, to reach its maximum velocity. The Mach number at any point in the along the nozzle can be obtained from the expression for the area ratio:14
M f-q U+u
k+1 (
1 + V
k — 1
~T
2(A-1)
J
(7)
where A* is the cross-sectional area of the throat, k=Cp/cv is the ratio of the heat capacity at constant pressure to the heat capacity at constant volume, and M is the Mach number. At the throat, the Mach number is 1. Assuming the flow is accelerated to a uniform Mach number, the drop in temperature and pressure can be computed from:14
I°- = \ +LAm2, (8) T 2
k~\ (9)
where T0, and p0 are the temperature and pressure in the pre-expansion stagnation region. Assuming the stagnation
temperature T0=298.15 K, the temperature at the point where the nozzle widens to 0.7 cm is T= 183 K .
4. CONCLUSIONS
A novel variant of laser saturation spectroscopy to diagnose the temperature in the supersonic nozzle of a Chemical Oxygen-Iodine Laser has been demonstrated. Accurate temperature measurements require high signal-to-noise spectral lineshapes and detailed characterization of hyperfine line positions, pressure broadening rates, and self-absorption. Initial studies of the sub-Doppler lineshapes have been reported. The sub-Doppler spectra exhibit features related to
152 Proc. SP1E Vol. 4631

velocity cross-relaxation which may be used to study rotationally inelastic collisions. The extension of this technique to supersonic flows is in progress.
T hr oft f <0.5 an) Raised LASER Path
Figure 13. Laval nozzle for demonstration of spatially resolved temperature measurement at low temperatures.
REFERENCES
1. McDermott, W.E., N.R. Pchelkin, DJ. Benard, and R.R. Bousek, "An Electronic Transition Chemical Laser," App.
Phys. Lett. 32 469(1978). 2. N. Bloembergen and C.K.N. Patel (Co-chairs, APS Study Group), Rev. Mod. Phys. 59, SI (1987). 3. K.A. Truesdell, S.E. Lamberson, and G.D. Hager, AIAA 92, 3003 (1992). 4. P.V. Avizonis, G. Hasen, and K.A. Truesdell, SPIE 1225, 448 (1990). 5. P.B. Keating, C.A. Helms, B.T. Anderson, T.L. Rittenhouse, K.A. Truesdell, and G.D. Hager, "Two-Dimensional Gain and Cavity Temperature Maps of a Small-Scale Supersonic COIL," in Proceedings of the International
Conference on Lasers ’96, Ed. Pp 194-201, V.J. Corcoran and T.A. Goldman, editors, STS Press, McLean, VA, 1997. 6. Demtroder, Wolfgang. Laser Spectroscopy, Berlin: Springer, 1998. 7. Morinaga, A. "Cross-relaxation Effects on the Saturation of the Visible Absorption Lines of the Iodine Molecule," J.
Opt. Soc. Am. B, 4 (6): 906-909 (June 1987). 8. Levenson, M. D., and A.L. Schawlow, “Hyperfine Interactions in Molecular Iodine,” Physical Review A, 6 10-20 (July 1972).
9. Capelle, Gene A., and H.P. Broida, “Lifetimes and Quenching Cross Sections of I2(B3n0u +)*,M The Journal of Chemical Physics, 58 4212-4222 (15 May 1973). 10. S.V. Kireev, S.L. Shnyrev, and Yu.P. Zaspa, Optics and Spectroscopy, 78 550 (1995). 11. M. Berjot, L. Bernard, and T. Theophanides, Can J Spectrosc 18 128 (1973). 12. Sorem, M.S., and A.L. Schawlow, “Saturation Spectroscopy in Molecular Iodine by Intermodulated Fluorescence,” Optics Communications, 5 148-151 (1972). 13. Myers Jr., James W. Spatially Resolved Temperature Determination in I2 Gas Using Doppler-Limited Saturation
Spectroscopy. MS Thesis, AFIT/GAP/ENP/00M-03. Graduate School Engineering and Management, Air Force Institute of Technology (AU), Wright-Patterson AFB OH, March 2000. 14. Shapiro, Ascher H. The Dynamics and Thermodynamics of Compressible Fluid Flow, Vol. I. New York: John Wiley & Sons, 1953, p.86.
Proc. SPIE Vol. 4631 153

Diagnostic development for the ElectriCOIL flow system
J. T. Verdeyen*3, D. M. King*3, D. L. Carroll*3 and W. C. Solomon**b
3CU Aerospace; bUniversity of Illinois at Urbana-Champaign
ABSTRACT Detailed studies of mechanisms for producing electrically initiated COIL lasers were previously presented. Results of those studies along with more recent experimental results show that electric excitation is a very complex process that must be investigated with advanced diagnostics. Theoretical studies indicate that fractions of O^'A) may be produced in
the discharge that will permit lasing of an ElectriCOIL system. Recent kinetic studies indicate a range of useful operating parameters for ElectriCOIL that are analogous to those achieved in the all-chemical device. This can be accomplished at E/N’s in the range of 10'16 Volt-cm. An experimental test bed has been built up to allow detailed diagnostic measurements of the discharge efficiencies and other experimental parameters. Results of early experiments
are presented.
Keywords: chemical oxygen-iodine laser, COIL, ElectriCOIL, RF excitation of oxygen, singlet-delta oxygen
1. INTRODUCTION Researchers at CU Aerospace (CUA) and University of Illinois at Urbana-Champaign (UIUC) have been operating clemical lasers (HF/DF, Overtone HF, and COIL) for a number of years. The classical chemical oxygen-iodine laser (COIL) [McDermott, 1978] operates on the electronic transition of the iodine atom at 1315 nm, I*(2Pi/2) —> I(2P3/2) + hv. The population inversion is maintained by the near resonant energy transfer between the excited singlet oxygen 02('A) molecule and the I atom ground state I(2P3/2) as follows: 02('A) + I(2P3/2) -» 02(3I) + I(2Pi/2). Traditionally, this pumping reaction has been fed by a liquid chemistry singlet oxygen generator (SOG). Workers at CUA and UIUC are now addressing the engineering issues associated with an electrical COIL system (ElectriCOIL) [Carroll, 2001; King, 2001].
AFRL demonstrated that significant quantities of excited iodine atoms can be produced using an all gas phase generator. The excited species which transfers its energy to Iodine atoms, in this case NCl('A), can be produced without a liquid phase and has provided a recent lasing demonstration (AGIL) [Henshaw, 2000]. We believe that it is possible to construct a highly efficient electric generation scheme to provide the precursor energy donor species 02('A) and that the
ElectriCOIL concept can subsequently be realized.
Workers in Japan [Itami, 1999], Russia [Ivanov, 1999], and in the U.S. [King, 2001] have shown that flowing discharge tubes containing ground state oxygen can produce significant quantities of the desired, 02(*A) precursor molecules. We believe this work suggests that one can transform such research into a practical laser system. Atomic iodine injection rather than molecular iodine injection will give added benefit to the ElectriCOIL laser. Figure 1 illustrates the limitations of existing COIL technology as well as the possible improvement from the implementation of ElectriCOIL technology. An electronically produced 02('A) generator could be even more effective if implemented simultaneously
with atomic iodine injection.
Fujii [Fujii, 1994] reported good success, 17% yield of 02('A), with a small RF generator. More recently, workers in Japan [Itami, 1999] from Fujisaki Electric provided some evidence that they could produce 21% 02('A) in a microwave discharge. The experiments were carried out in subsonic axial flow at 2 Torr in a 30 cm long tube with window attachments for observation. Hill [Hill, 2001] reported a value of 16%. Schmiedberger [Schmiedberger, 2001] reported a 32% yield under low-pressure conditions (0.43 Torr) with an RF discharge. We have recently obtained an O^'A) yield of=16% in our flowing RF discharge experiments at a pressure of 2 Torr and =15% of 3.6 Torr.
We choose chemical efficiency as a way of relating classic COIL performance to our ElectriCOIL concept. Even an ElectriCOIL that provides 20% chemical efficiency (shown in Fig. 1) is an enormous improvement to the classic COIL
*[email protected]; phone 1-217-333-8274; fax 1-217-244-7757; http://cuaerospace.com; CU Aerospace, 2004 S. Wright St. Ext., Urbana, 1L, 61801; **[email protected]; phone 1-217-244-7646; fax 1-217-244-0720; http://www.aae.uiuc.edu;
Univ. of Illinois, 306 Talbot Lab, 104 S. Wright St., Urbana, IL 61801.
154
Gas and Chemical Lasers and Intense Beam Applications III, Steven J. Davis, Michael C. Heaven, Editors, Proceedings of SPIE Vol. 4631 (2002) © 2002 SPIE • 0277-786X/02/$ 15.00

design because it will lead to a significant reduction of weight on a large weapons class laser, simpler operation procedures, and reduce the overall risk.
Chemical Efficiency vs. Plenum Yield Classic COIL vs. ElectriCOIL
0 0.1 0.2 03 0.4 03 0.6 0.7 Plenum Yield
Fig. 1. A comparison between classic COIL
technology and the performance possibilities for an
ElectriCOIL device are illustrated here. Results based
upon a heuristic equation [Hon, 1996].
Calculations using the Blaze II chemical laser model [Sentman, 1977; Carroll, 1995] support the qualitative conclusions drawn from a heuristic equation [Hon, 1996], Figs. 1 and 2. The advantage of the ElectriCOIL concept is immediately realized when examining the gain curve with and without molecular iodine pre-dissociation, Fig. 3. The gain curve, with a 20% yield and no pre-dissociation, is very low and would not make an efficient laser. However, when the molecular iodine is completely pre-dissociated, then the gain curve, even with a 20% yield, compares very favorably with the classic COIL type gain curve having a 67% yield.
Chemical Efficiency vs. Plenum Yield Classic COIL vs. ElectriCOIL (Blaze II Predictions)
'i—t—r-ri-r,"T-T"T_
—.- Classic COIL . ......... ElecuiCOIL w/ complete 12 Dissociation
i
Ad Elec
vanced triCOIL
...y ...
/
Classic COIL -
***'*’
0 0.1 0.2 0.3 0.4 0.5 0.6 0.7
Plenum Yield
Figure 2. Blaze predictions comparing classic COIL technology and the performance possibilities for an ElectriCOIL device are illustrated. While ElectriCOIL may not be able to match the plenum yield of today’s COIL system, significantly smaller yields are capable of matching current chemical efficiencies.
Average Gain vs Distance from Iodine Injection Classic COIL vs. ElectriCOIL (Blaze II Predictions)
0 2 4 6 8 10 12 14 16
X (cm)
Fig. 3. Blaze predictions of the average gain as a function of distance from the iodine injection position for classic COIL with a yield of 0.67, ElectriCOIL with and without molecular iodine pre-dissociation. Helium diluent was used for these calculations.
Proc. SPIE Vol. 4631 155
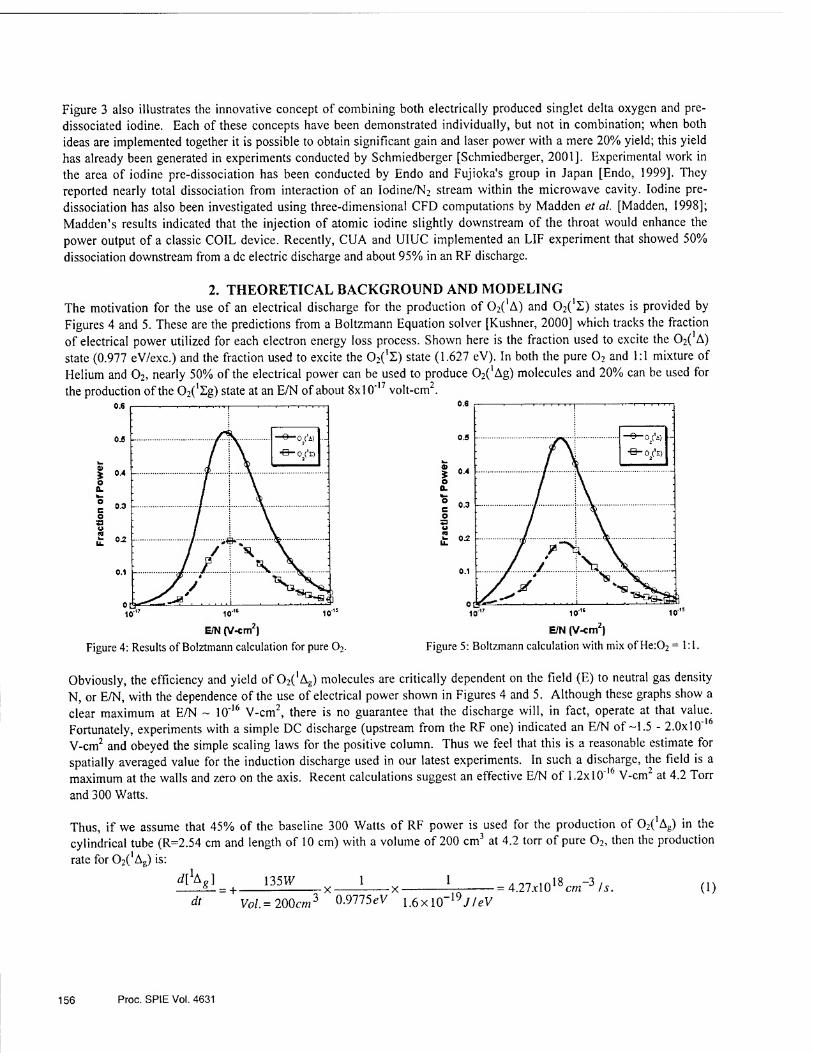
Figure 3 also illustrates the innovative concept of combining both electrically produced singlet delta oxygen and pre¬ dissociated iodine. Each of these concepts have been demonstrated individually, but not in combination; when both ideas are implemented together it is possible to obtain significant gain and laser power with a mere 20% yield; this yield has already been generated in experiments conducted by Schmiedberger [Schmiedberger, 2001]. Experimental work in the area of iodine pre-dissociation has been conducted by Endo and Fujioka's group in Japan [Endo, 1999]. They reported nearly total dissociation from interaction of an Iodine/N2 stream within the microwave cavity. Iodine pre¬ dissociation has also been investigated using three-dimensional CFD computations by Madden et ai [Madden, 1998]; Madden’s results indicated that the injection of atomic iodine slightly downstream of the throat would enhance the power output of a classic COIL device. Recently, CUA and UIUC implemented an LIF experiment that showed 50%
dissociation downstream from a dc electric discharge and about 95% in an RF discharge.
2. THEORETICAL BACKGROUND AND MODELING The motivation for the use of an electrical discharge for the production of 02(IA) and 02(1£) states is provided by Figures 4 and 5. These are the predictions from a Boltzmann Equation solver [Kushner, 2000] which tracks the fraction
of electrical power utilized for each electron energy loss process. Shown here is the fraction used to excite the 02(1A)
state (0.977 eV/exc.) and the fraction used to excite the 02(1S) state (1.627 eV). In both the pure 02 and 1:1 mixture of Helium and 02, nearly 50% of the electrical power can be used to produce 02(!Ag) molecules and 20% can be used for
the production of the 02(!lg) state at an E/N of about 8xl0‘17 volt-cm2.
Figure 4: Results of Bolztmann calculation for pure 02. Figure 5: Boltzmann calculation with mix of He:02 =1:1.
Obviously, the efficiency and yield of O^Ag) molecules are critically dependent on the field (E) to neutral gas density N, or E/N, with the dependence of the use of electrical power shown in Figures 4 and 5. Although these graphs show a clear maximum at E/N - 10'16 V-cm2, there is no guarantee that the discharge will, in fact, operate at that value. Fortunately, experiments with a simple DC discharge (upstream from the RF one) indicated an E/N of-1.5 - 2.0x10’ V-cm2 and obeyed the simple scaling laws for the positive column. Thus we feel that this is a reasonable estimate for spatially averaged value for the induction discharge used in our latest experiments. In such a discharge, the field is a maximum at the walls and zero on the axis. Recent calculations suggest an effective E/N of 1.2x10 16 V-cm2 at 4.2 Torr
and 300 Watts.
Thus, if we assume that 45% of the baseline 300 Watts of RF power is used for the production of O^Ag) in the cylindrical tube (R=2.54 cm and length of 10 cm) with a volume of 200 cm3 at 4.2 torr of pure 02, then the production
rate for 02(lAg) is:
^Ag] _ 135W 1
dt Vol. = 200cm3 0.9775eV --= 4.27x1018 cm-3 /5. 1.6x10 ~l9J/eV
(1)
156 Proc. SPIE Vol. 4631

For the conditions used in Fig. 10, the flow velocity is approximately 2xl03cm/s and thus the lifetime of the molecules in the discharge region is 5 ms. Thus, this simple theory would predict an exit density of C^^Ag) of 2.13xl016 cm'3 or a yield of 16.4%. Given the simplicity of the theory, it is in reasonable agreement with our measured yields of-15-16% (see Section 3).
A similar calculation can be done for the C^1^) density, and it yields a smaller density by about a factor of 3x1.66 = 4.98. The factor of 3 arises because of using only -15% of the power (as opposed to 45% for a1 Ag) and the factor of 1.66 because it costs 1.627 eV to produce b!Zg state as opposed to 0.9775 eV for the a]Ag state. The origin of the factor of 3-4 (in Figs. 4 and 5) is a consequence of the fact that the cross-section for electron impact production of is at least 4 times that for b^g for virtually all electron energies of significance. This ratio is in close agreement with current experimental results.
More detailed theoretical calculations of an inductive discharge utilizing Maxwell’s equations (not presented for brevity) were also made. These calculations indicate that the effective E/N for typical flow conditions in our laboratory setup (10 mmol/s of pure oxygen, corresponding to a number density of 1.3xl017 cm'3) should be approximately 1.2xl0’16 V-cm2 at a RF coil current of 30 amps (rms); note that this is very close to optimum, Fig. 4.
3. RECENT EXPERIMENTAL RESULTS CUA and UIUC are currently developing the ElectriCOIL device. A two-inch flow tube experiment was constructed to demonstrate generation of C^^A) and C^1^) by electrical means [King, 2001]. Key flow and electrical parameters were varied to characterize the system performance. Figure 6 depicts a block diagram of the experimental setup. RF power is transferred to the flow through a “Pi” matching network driven by a 1-kW ENI OEM-12A RF power amplifier at 13.56 MHz. Diagnostics play a critical role in developing an understanding the ElectriCOIL system; as such, a great deal of care has been taken to implement high quality diagnostics for evaluating the flow properties emerging from the discharge region.
One of the primary measurements on the ElectriCOIL experiment is a spectrographic determination of [02(1S)] from its emission at 760 nm. Studies were performed to investigate the effect of oxygen and diluent flow rates, diluent type, system pressure, RF power levels, and axial flow position. The results of some of the parametric studies are presented in Fig. 7. Axial distance is measured from the end of the discharge section. Differing diluent species yielded considerably
Proc. SPIE Vol. 4631 157
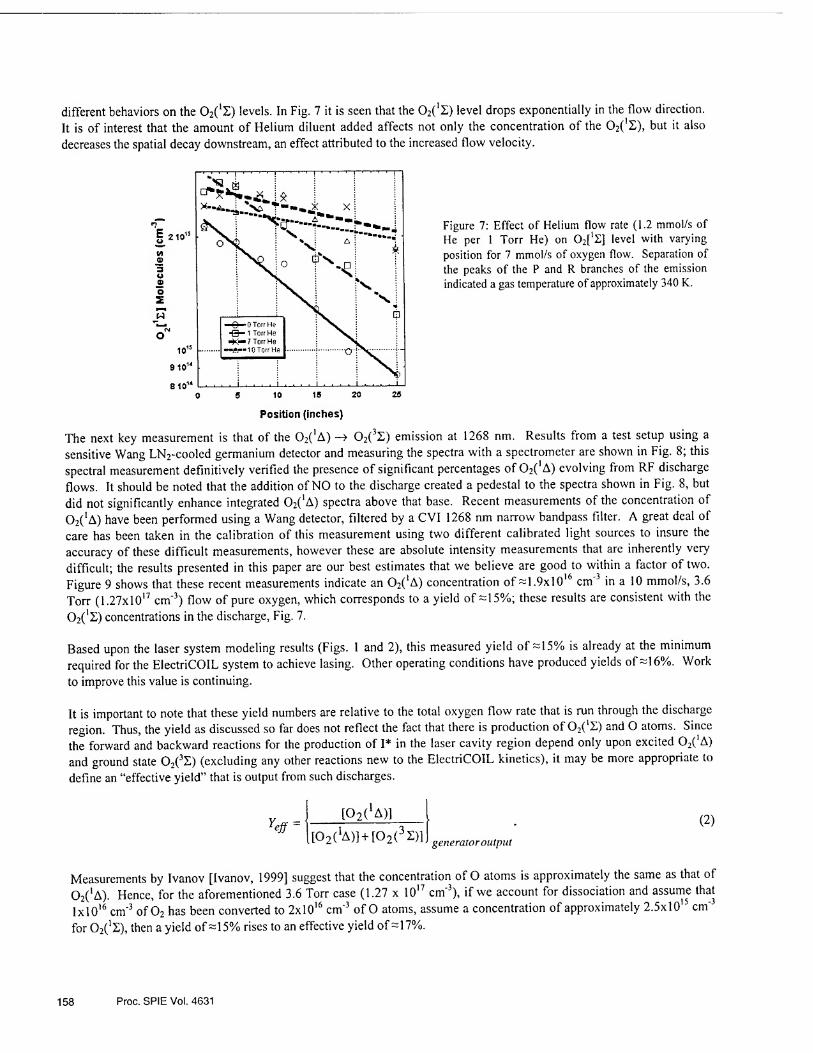
different behaviors on the 02(lZ) levels. In Fig. 7 it is seen that the O2(1X) level drops exponentially in the flow direction.
It is of interest that the amount of Helium diluent added affects not only the concentration of the 02(1S), but it also
decreases the spatial decay downstream, an effect attributed to the increased flow velocity.
Figure 7: Effect of Helium flow rate (1.2 mmol/s of He per 1 Torr He) on 02[1S] level with varying
position for 7 mmol/s of oxygen flow. Separation of the peaks of the P and R branches of the emission indicated a gas temperature of approximately 340 K.
O S 10 15 20 25
Position (inches)
The next key measurement is that of the O^'A) —* 02(3X) emission at 1268 nm. Results from a test setup using a
sensitive Wang LN2-cooled germanium detector and measuring the spectra with a spectrometer are shown in Fig. 8; this
spectral measurement definitively verified the presence of significant percentages of 02(*A) evolving from RF discharge
flows. It should be noted that the addition of NO to the discharge created a pedestal to the spectra shown in Fig. 8, but
did not significantly enhance integrated 02(‘A) spectra above that base. Recent measurements of the concentration of
O^'A) have been performed using a Wang detector, filtered by a CVI 1268 nm narrow bandpass filter. A great deal of
care has been taken in the calibration of this measurement using two different calibrated light sources to insure the
accuracy of these difficult measurements, however these are absolute intensity measurements that are inherently very
difficult; the results presented in this paper are our best estimates that we believe are good to within a factor of two.
Figure 9 shows that these recent measurements indicate an 02('A) concentration of=1.9xl016 cm'3 in a 10 mmol/s, 3.6
Torr (1.27xl017 cm'3) flow of pure oxygen, which corresponds to a yield of=15%; these results are consistent with the
02('Z) concentrations in the discharge, Fig. 7.
Based upon the laser system modeling results (Figs. 1 and 2), this measured yield of =15% is already at the minimum
required for the ElectriCOIL system to achieve lasing. Other operating conditions have produced yields of=16%. Work
to improve this value is continuing.
It is important to note that these yield numbers are relative to the total oxygen flow rate that is run through the discharge
region. Thus, the yield as discussed so far does not reflect the fact that there is production of 02('Z) and O atoms. Since
the forward and backward reactions for the production of I* in the laser cavity region depend only upon excited 02('A)
and ground state 02(3£) (excluding any other reactions new to the ElectriCOIL kinetics), it may be more appropriate to
define an “effective yield” that is output from such discharges.
% = [02(1A)]
[02(1A)] + [02(3X)1 generator output
(2)
Measurements by Ivanov [Ivanov, 1999] suggest that the concentration of O atoms is approximately the same as that of
02('A). Hence, for the aforementioned 3.6 Torr case (1.27 x 1017 cm'3), if we account for dissociation and assume that
lxlO16 cm'3 of 02 has been converted to 2xl016 cm'3 of O atoms, assume a concentration of approximately 2.5xl015 cm
for 02('l), then a yield of=15% rises to an effective yield of=17%.
158 Proc. SPIE Vol. 4631

Wavelength
Figure 8. 02(1A) spectra taken from the ElectriCOIL RF-
pumped system.
Figure 9. 02(lA) concentration data taken from the
ElectriCOIL RF-pumped system at a flow rate of 10 mmol/s of pure oxygen.
Further very promising results from this research were obtained when molecular iodine was injected into the flow tube
downstream of the oxygen discharge section. Two experiments were run. The flow rate of molecular iodine was
approximately 0.006 mmol/s. The first had a simple 1/8" tube that was partially inserted into the flow to inject a single
crossflow jet into the primary oxygen flow, Fig. 10. The second test utilized a 1/8" tube with 6 small holes drilled in the
side; molecular iodine was injected in a direction parallel to the primary oxygen flow, Fig. 11. In both cases, the yellow
glow from the I2(B) —» I2(x) transition was immediately observed. The yellow glow is definitive evidence of the
presence of significant concentrations of 02[] A],
Figure 10. Single jet iodine injection. Figure 11. Multi-jet iodine injection.
4. SUMMARY Advanced chemical iodine laser technology will logically include novel all gas phase generation techniques for an iodine
energy donor and the injection of atomic rather than molecular iodine. A candidate method, RF excitation, has been
Proc. SP1E Voi. 4631 159

investigated in this paper. It is seen that both the singlet-sigma 02('X) and singlet-delta 02('A) excited states of the oxygen molecule may be readily created via electrical excitation in the laboratory. Generally an RF discharge alone is sufficient to bring about this excitation. However, at higher flow rates (>15 mmol/s) it has been found that both an ac discharge used in tandem with the RF discharge is important to achieve high levels of excitation [King, 2001]. We believe that it may be possible to successfully supplant the two-phase elements (liquid BHP and a chlorine/helium/nitrogen gas mixture) of the classical COIL SOG using the ElectriCOIL prototype system.
Diagnostics play a critical role in developing an understanding the ElectriCOIL system; as such a great deal of care has been taken to implement high quality diagnostics for evaluating the flow properties emerging from the discharge region. Recent measurements indicate an O^’A) concentration of approximately 2xl016 cm'3 in a 10 mmol/s, 3.6 Torr (1.3x10
cm'3) flow of pure oxygen, which corresponds to a yield of =T5%; these results are consistent with measured 02('l) levels of 2.5xl015 cm'3 in the discharge and theoretical estimates. Other operating conditions have produced yields of =:16%. We are planning to conduct experiments with additional advanced diagnostics in the near future.
ElectriCOIL will reduce weight and simplify both military and commercial chemical iodine laser systems. Potential cost and weight savings are also envisioned as the massive quantities of liquid chemicals will be completely eliminated from the device operation. Difficulty will certainly be encountered when searching for a yardstick to predict ElectriCOIL performance. Typical measures such as chemical efficiency must be redefined (or eliminated) to account for changes in the chemistry and parameters like the electrical power absorbed by the flow from the RF discharge. Sets of diagnostics and analysis are planned to take advantage of the recent progress in our laboratories.
ACKNOWLEDGEMENTS This work was supported by the Air Force Research Laboratory’s Directed Energy Directorate SBIR contract
F29601-01-C-0007. We would also like to thank M. Kushner for the Boltzmann calculations, J. Laystrom, M. Sexauer,
L. Skorski, B. Woodard and S. Zimmer for their assistance in the lab.
REFERENCES Carroll, D. (1995). AIM Journal, 33, 8, 1454. Carroll, D.L., and Solomon, W.C. (2001) SPIE 4184 40. Endo, M., Sugimoto, D., Okamoto, H., Takeda, S., and Fujioka, T. (1999). "Performance characteristics of the
microwave assisted chemical Iodine oxygen laser", AHPLA’99 SPIE conference, Osaka, November 1999. Fujii, H. (1994). “COIL in Japan,” AIAA Paper 94-2419, Colorado Springs, CO, June 1994. Henshaw, T.L., Madden, T.J., Manke, G.C., Anderson, B.T., Tate, R.F., Berman, M.R., and Hager, G.D. (2000). AIAA
Paper 2000-2424. Hill, A.E (2001). Proc. of the International Conf. on Lasers 2000, STS Press, McClean, VA, 249. Hon, J., Hager, G., Helms, C., and Truesdell, K. (1996). AIAA Journal, 34, 8,1595. Itami, S., Nakamura, Y., Nakamura, A., Shinagawa, K., Okamura M., and Fujii, H. (1999). AHPLA ’99, Osaka, Nov
1999. Ivanov, V.V., Klopovsky, K..S., Lopaev, D.V., Rakhimov, A.T., and Rakhimova, T.T. (1999). IEEE Trans, on Plasma
Science, 27, p. 1279. King, D.M., Carroll, D.L. Carroll, and Laystrom J. K., Verdeyen, J.T., Sexauer, M. S., and Solomon, W.C. (2001).
Proceedings of the International Conf. on Lasers 2000, STS Press, McClean, VA, 265.
Kushner, M.J. (2000). Private communication. Madden, T., Hager, G., Lampson, A., and Crowell, P. (1998). Proceedings of the International Conf. on Lasers 1998,
STS Press, McClean, VA, 287. McDermott, W., Pchelkin, N., Benard, D., and Bousek, R. (1978). Appl. Phys. Lett. 32, 8,469. Schmiedberger, J., Hirahara, S., Ichinoche, Y., Suzuki, M., Masuda, W., Kihara, Y., Yoshitani, E., and Fujii, H. (2001).
SPIE 4184 32. Sentman, L., Subbiah, M., and Zelazny, S. (1977). “Blaze II: A Chemical Laser Simulation Computer Program,” Bell
Aerospace Textron, Buffalo, NY, T.R. H-CR-77-8.
160 Proc. SPIE Vol. 4631
Measurement of chemical oxygen-iodine laser singlet oxygen
generator parameter using Raman spectroscopy
Weili Zhao, Fengting Sang, Liping Duo, Fang Chen, Yuelong Zhang and Benjie Fang
Dalian Institute of Chemical Physics, the Chinese Academy of Sciences, PO Box 110, Dalian
116023, China
ABSTRACT
Using a doubled Nd: YAG laser as a spontaneous vibrational Raman scattering source, and a single intensified
CCD array at the exit of an imaging monochromator, the Raman scattering system is used to directly measure the
concentrations of the 02 (a1 A) and the 02 (X3 2) in the chemical oxygen-iodine laser singlet oxygen generator in real
time. We present the results from the tests that conducted on a 0.1-mol singlet oxygen-iodine generator. With the current
reported uncertainty of the Raman cross-section, the error in the yield measurement is calculated to be less than 8%.
Keywords: chemical oxygen-iodine laser, singlet oxygen generator, Raman spectrum, yield
1. INTRODUCTION
The chemical oxygen-iodine laser is the first chemical laser based on the electronic transitions. It emits at 1315nm
on the transition between the spin-orbit levels of the ground state configuration of the iodine atom. The upper level is
populated by a near-resonant energy transfer from an 02 (a1 A) molecule to an atomic iodine atom1'3.
02(a1 A) + I(2P3/2) - 02(X32) + I*(2P 1/2) (1)
The output power of this laser strongly depends on the yield of 02(a’ A) in singlet oxygen generator4,5.
v [Oja1 A)] Y =-7^-:- (2)
[O^MO^X3!)]
To predict the COIL performance, it is very important to measure the exact values of the yield of 02 (a1 A) at the exit of
the singlet oxygen generator. Usually, the 02 (a1 A) density is measured by monitoring the 02 (a1 A) emission at
1270nm with a calibrated detector6,7. However, the detector is difficult to calibrate and the results exhibit low absolute
accuracy in the yield.
Recently, the spontaneous Raman scattering technique has been developed that it can be used to directly monitor
the singlet oxygen generator by measurement both the concentrations of the O? (a1 A) and 02 (X3 2) simultaneously
using spontaneous Raman imaging8. It has several advantages over other methods because it allows one to monitor both
the 02 (a1 A) and 02 (X3 2) simultaneously in the same measurement volume. Because common experimental problems
such as dirty windows, fluctuations in laser power, and aerosol scattering can be ratioed out, this technique greatly
Gas and Chemical Lasers and Intense Beam Applications 111, Steven J. Davis, Michael C. Heaven, Editors, Proceedings of SPIE Vol. 4631 (2002) © 2002 SPIE • 0277-786X/02/$15.00 161

simplifies modeling and data reduction.
A Raman scattering experimental system was set up. We used it to measure the species in air and in a singlet
oxygen generator. In this paper, we report the result of air and the application of Raman spectrum to measure the 02(ai
A) yield at the exit of a jet-type singlet oxygen generator for COIL. The results are from the tests that conducted on a
0.1-mol singlet oxygen generator.
2. EXPERIMENT
We used the experimental setup shown in Fig. 1. A doubled Nd: YAG laser (Spectra Physics, Quanta-Ray)
was used to be laser pump with a 10Hz pulse repetition rate and a 20ns pulse duration. And each pulse had a pulse
energy of 400-500mJ. The output laser was elliptically polarized, and the line width was less than 1. 0cm The laser
beam has been focused into the flow cell of singlet oxygen generator through a coated quartz window by an f/6.7 lens.
The Raman scattering light which was collected perpendicularly to the propagation of the laser beam was focused
throughout a Kaiser Inc. holographic 532 nm notch-filter onto the slits of an f/6.5 Acton Spectrapro 500
spectrograph by a coated f/1.6 lens. The scattered Raman light was dispersed by a 1200-grooves/mm and BLZ=500nm
grating and focused onto a 256 x 1024 ICCD array, the size of each pixel was 23pm x 23pm. The ICCD chip was cooled
162 Proc. SPIE Vol. 4631
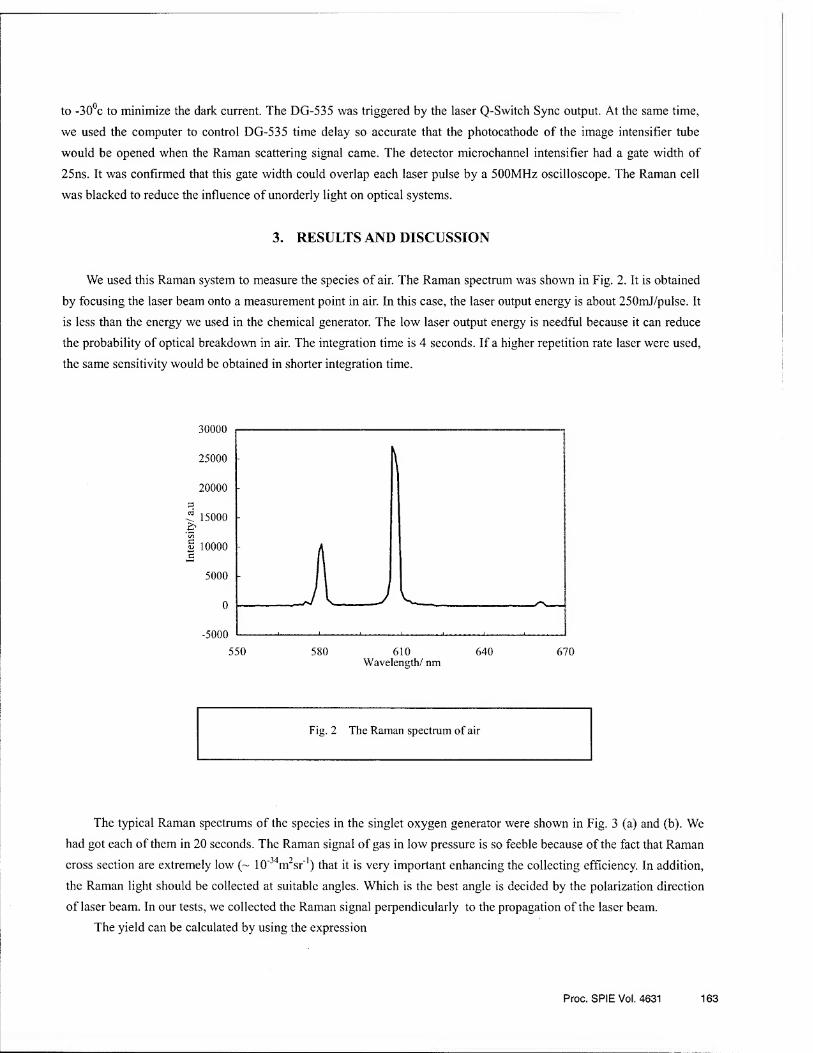
to -30°c to minimize the dark current. The DG-535 was triggered by the laser Q-Switch Sync output. At the same time,
we used the computer to control DG-535 time delay so accurate that the photocathode of the image intensifier tube
would be opened when the Raman scattering signal came. The detector microchannel intensifier had a gate width of
25ns. It was confirmed that this gate width could overlap each laser pulse by a 500MHz oscilloscope. The Raman cell
was blacked to reduce the influence of unorderly light on optical systems.
3. RESULTS AND DISCUSSION
We used this Raman system to measure the species of air. The Raman spectrum was shown in Fig. 2. It is obtained
by focusing the laser beam onto a measurement point in air. In this case, the laser output energy is about 250mJ/pulse. It
is less than the energy we used in the chemical generator. The low laser output energy is needful because it can reduce
the probability of optical breakdown in air. The integration time is 4 seconds. If a higher repetition rate laser were used,
the same sensitivity would be obtained in shorter integration time.
Wavelength/ nm
Fig. 2 The Raman spectrum of air
The typical Raman spectrums of the species in the singlet oxygen generator were shown in Fig. 3 (a) and (b). We
had got each of them in 20 seconds. The Raman signal of gas in low pressure is so feeble because of the fact that Raman
cross section are extremely low (~ 10'34m2sr_1) that it is very important enhancing the collecting efficiency. In addition,
the Raman light should be collected at suitable angles. Which is the best angle is decided by the polarization direction
of laser beam. In our tests, we collected the Raman signal perpendicularly to the propagation of the laser beam.
The yield can be calculated by using the expression
Proc. SPIE Vol. 4631 163

(3)
Y [02(a1*)] [02(alA)] + [02(X3Z)]
_ O-Sfl X)l <y02{a)
02 (a A) / cr02(a) + 02 £) / &oi(x)
_ _Q2(q'A)_
02 (a'A) + 02 (X3I)(<702(a) / crG2(X))
where 02 (a1 A) and 02 (X3 2) are the area under respective peaks of the 02 (a1 A) and 02 (X3 2) Raman spectrum, o is
the Raman cross-section. (X02(a) / <J02(X), the Raman cross-section ratio of the 02 (a' A ) and 02 (X3 2) was
determined by a series of experiments9 to be 0.45.
(a) N2: C12= 0: 106, 30Torr(b)N2: Cl2= 117: 110, 18Torr
Fie. 3 The Raman spectrum of a spareer flow
164 Proc. SPIE Vol. 4631

The results from the tests that conducted on a 0.1-mol singlet oxygen-iodine generator had been obtained. A table
of the values of a series of experiments is presented in Table 1. The differences of the optical components at the 02 (a1 A)
and 02(X3£) wavelengths, such as grating, detector, and notch-filter, were ignored because of the closeness of the
Stokes shifts (1508 and 1580 cm'1, respectively). The accuracy of the area under peak is mainly due to the signal-noise
ratio. However, the yield of the 02 (a1 A) is in the 50% range.
Table 1 The values of a series of experiments
No. Pressure (Torr) n2 Cl2 Y (%)
1 30 0 106 39
2 35 117 106 42
3 25 117 106 45
4 25 117 106 46
5 18 117 110 54
6 9 117 104 59
It is obvious that the yield is increasing via the reducing of generator pressure in the experimental range at fixing
flux, and advisable gas is desirable to be the carrier. So we should keep the singlet oxygen generator pressure lower for
the sake of obtaining higher 02(a] A) yield at suitable flux. The result of experiment No. 6 is the best in Table 1. The
yield is approximately 60%. With the current reported uncertainty of the Raman cross-section, the error is calculated to
be less than 8%.
The sources of error in the yield measurement is as follows:
the error in the grating calibration 0.6%
the error in determining the area under the peak 2%
the error in the cross section 5%
So the total error in the yield measurement is less than 8%.
4. SUMMARY
Using a doubled Nd: YAG laser as a spontaneous vibrational Raman scattering source, and a single intensified
CCD array at the exit of an imaging monochromator, the spontaneous Raman spectroscopy can be used to directly
measure the singlet oxygen generator parameter of chemical oxygen-iodine lasers. The yield of 02 (a1 A ) is in the 50%
range when the flux of N2 and Cl2 is approximately 1:1. With the current reported uncertainty of the Raman
cross-section, the error is calculated to be less than 8%. It is the most important sources of error in the yield
measurement that the ratio of signal to noise is lower. It should be improved by enhancing the repetition rate,
lengthening the pulse duration, improving the polarization of the laser. Reducing the unorderly light is better method to
improve the ratio of signal to noise. Increased sensitivity and accuracy can be obtained with further work.
Proc. SPIE Vol. 4631 165

5. ACKNOWLEDGEMENTS
The authors would like to thank Ms. Yongxiang Song , Mr. Qingguo Li and Mr. Xiangde Min for their contributions
to this work.
6. REFERENCES
1. W. E. McDemott, N. R. Pchelkin, D. J. Benard, and R. R. Bousek, “An electronic transition chemical laser,” Appl.
Phys. Lett., Vol. 32, p469-470 (1978).
2. K. A. Truesdell and S. E. Lamberson, “Philips Laboratory COIL technology overview” Proc. SPIE, Vol. 1810,
p476-492 (1992).
3. P. V. Avizonis, “Chemical pumped electronic transition lasers,” in Gas and Chemical Lasers, M. Onorato, ed. (Plenum,
New York), pi (1982).
4. B. D. Barmashenko, A. Elior, E. Lebiush, and S. Rosenwaks, “Modeling of mixing in chemical oxygen-iodine lasers:
Analytic and numerical solutions and comparison with experiments,” J. Appl. Phys., Vol. 75, p7653-7655 (1994).
5. N. N. Yuryshev, “Chemically pumped oxygen-iodine laser,” Quantum Electron., Vol. 23, p583-600 (1996).
6. A. Elior, B. D. Barmashenko, E. Lebiush, and S. Rosenwaks, “Experiment and modeling of a small-scale, supersonic
chemical oxygen-iodine laser,” Appl. Phys. B, Vol. 61, p37-47(1995).
7. L. P. Duo, T. J. Cui, Z. Q. Wang, W. W. Chen, and F. T. Shang, “Obsolute 02(a] A) concentration measurement in
singlet oxygen generator using the piston source method,” High power laser and particle beams, Vol. 12(s0), p25-30
(2000). (in Chinese)
8. V. T. Gylys and L. F. Rubin, “Direct measurement of 02 (a1 A) and 02 (X3 2) in chemical oxygen-iodine lasers with
use of spontaneous Raman imaging,” Appl. Optics, Vol. 37, pi 026-1031(1998).
9. L. F. Rubin and V. T. Gylys, “Measurement of the Raman cross section of 02 (a1 A g),” Optics Lett., Vol. 22,
pi347-1349 (1997).
166 Proc. SPIE Vol. 4631

Invited Paper
Tunable Diode Laser Gain Measurements of the HF(2-0) Overtone Transitions in a Small Scale HF Laser
Charles F. Wisniewski3, Gerald C. Manke II*3, Gordon D. Hager3, Peter G. Crowellb, and C. Randall Truman0.
3Air Force Research Laboratory, Directed Energy Directorate; ^gicon/Northrup Grumman; department of Mechanical Engineering, University of New Mexico.
ABSTRACT A tunable diode laser was used to probe the overtone gain medium of a small-scale HF laser. Two-dimensional,
spatially resolved small signal gain and temperature maps were generated for the P(3) ro-vibrational transition in the first
HF overtone band.
1. INTRODUCTION The fundamental HF laser was invented in the mid to late 1960’s1"5. While the first HF lasers were pulse
initiated2"5, continuous wave HF lasers were also demonstrated prior to 19706"8. Over the last 30 years, HF laser
technology has advanced to the point where megawatt class lasers can be constructed. It is widely recognized that the
fundamental HF laser, which operates from 2.7 - 3.0 pun, has limited utility for low altitude, long-range propagation
applications due to strong absorptions in the atmosphere. Subsonic demonstrations of HF overtone lasers, which operate
at a wavelength that is more amenable to long-range, low-altitude applications, were first reported in the mid-1970’s by
Hon9 and Bashkin10. However, the demonstrations were not particularly impressive due to poor efficiency. A more
modem and scalable concept for an HF overtone laser was demonstrated in 1984 by Jeffers11. This demonstration was
especially notable because of the significantly enhanced efficiency; the overtone power was 20 - 30% of the
fundamental. Improved mirrors and combustion driven HF laser technology were the keys to demonstrations of multi-
kW HF overtone lasers in the mid- to late-1980's12"14. In general, the small signal gain of an HF overtone laser is
approximately 2 orders of magnitude smaller than the fundamental HF laser. The development and scaling of the HF
overtone lasers (i.e. Av = -2) has been limited by the availability of mirror coatings which simultaneously suppress
fundamental lasing and enable overtone oscillation. As the ability to produce such optics has improved, so too have the
prospects of high-power HF overtone lasers. Another impediment to the development of HF overtone lasers has been the lack of high fidelity small signal
gain probes that can be used to directly measure the small signal gain of individual HF ro-vibrational lines with full
spectral and spatial resolution. While it is possible to use a commercial Helios arc-driven HF laser as a probe, this
device can be difficult and expensive to operate. In most cases, the Helios laser cavity is stabilized and locked to the line
center of one of a limited number of HF overtone lines. Alternatively, a plot of extracted laser power vs. mirror
reflectivity can be used to determine the threshold gain (gih) according to the equation
So = 8th = “~ln^l^2 [*]
where R* and R2 are the mirror reflectivities and L is the path length. As the outcoupling mirror reflectivity decreases
and the outcoupled power approaches zero the small signal gain (go) equals the threshold gain. However, this technique
cannot generate spatially resolved gain or temperature maps. Since the efficiency of an HF laser is usually dominated by
the rate of mixing, the need for spatial resolution is acute. Furthermore, this method cannot be used to measure gain on
individual ro-vibrational lines because the measured threshold gain is only associated with the strongest line in the multi-
line overtone spectrum. Finally, neither of these techniques can provide information about the gas temperature or any
other data related to the spectral lineshape of the transition.
In principle, the lack of precise lineshape information may lead to ambiguous or deceptive answers when
making comparisons with computational fluid dynamics calculations. In particular, while the gain of a laser may be
directly measured, extraction of the inversion density requires knowledge of the spectral lineshape function. The
definition of gain is
gain(cm *) = lnf /(Vo)\ 1 =cr«/m(vo) Uo(vo)J
N.. 8u
Sl N, [2]
Gas and Chemical Lasers and Intense Beam Applications III, Steven J. Davis, Michael C. Heaven, Editors, Proceedings of SPIE Vol. 4631 (2002) ©2002 SPIE • 0277-786X/02/$15.00 167

where z is the optical path length and Nu, Nj, gu, and gj are the upper and lower state number densities and degeneracies, respectively. The stimulated emission cross section is given by
^tim(Vo) = /(v0) [31
where A, is the center wavelength, A(v, J) is the Einstein emission coefficient, and f(v0) is the lineshape function. If the lineshape is assumed to be Gaussian, and is actually a Voigt or some other more complex function, the calculated value
for the inversion density may be significantly in error. Pressure broadening coefficients (2y) for HF15,16 range from 0.75 MHz Torr'1 for HF + He to 53.05 MHz Torr'1 for HF + HF. Under most HF supersonic laser conditions (low pressure, mostly He), pressure broadening is not an issue, but an explicit check for it would be prudent.
Because of their narrow linewidth and tunability. External Cavity Diode Lasers (ECDLs) are ideal tools for measuring small signal gain. These devices have previously been implemented for measuring the gain in the Chemical Oxygen Iodine Laser (COIL)17 and the All Gas-phase Iodine Laser (AGIL)18. In fact, the same commercially available (New Focus, model 6300) 1.3-micron diode laser used for AGIL and COIL was also used to measure gain on our HF overtone laser test bed. As we have done in the past17, l8, we have generated spatially resolved, small signal gain and temperature maps of the active medium for comparison with CFD modeling results19.
2. EXPERIMENTAL METHODS A small-scale HF laser was constructed to generate an inversion on the first overtone of HF at 1.27 - 1.40 pm.
The laser consisted of a 5 cm wide supersonic slit nozzle, where F atoms generated by a Helios discharge tube reacted with molecular hydrogen to generate vibrationally excited HF20. Our nozzle design and experimental conditions are very similar to those of Sentman and co-workers21,22. The two most important differences are that we used a slit nozzle rather than a nozzle bank, and our discharge used 20% Fi in helium rather than SF6 + O2 as the F atom source. Schematic representations of our experimental apparatus are shown in Figure la-b. Figure lb shows the view from the downstream end of the nozzle looking into the plenum region. Helium is added through the first row of injection holes, while the second row was used for the addition of H2. The injected helium acts as a shield for the injected H2, with the goal of preventing reaction prior to the nozzle exit plane. A pair of He shroud flows were placed at the nozzle exit plane (NEP) to reduce recirculation of the laser media and a pair of bank blowers were located on either side of the active medium to reduce expansion of the corrosive gas flow into the mirror tunnels. The 0.9 cm long slit nozzle expands from the 3 mm throat with a 20 degree angle (relative to the center line) to 0.9 cm at the NEP. The nozzle design also provides for area relief via a large 1 cm step (top and bottom) at the NEP. A small base purge flow of He could be added to prevent recirculation in the base region.
A Helios DC discharge tube was used to generate a flow of fluorine atoms from molecular fluorine (20% in He, Matheson) diluted in helium. High purity H2(99.99%, Matheson) and He (Air Products) were added without additional purification. Table 1 lists the typical range of reagent flow rates, device pressures and thermocouple temperatures. The plenum pressure was typically 24 Torr and the static pressure (measured at the wall 3 cm downstream of the NEP) was -2 Torr. A series of pitot tube measurements established the Mach number and total pressure, -2.5 and 20 Torr, respectively.
The diode laser used to probe the absorption/gain on the HF(v = 0) -> HF(v = 2) vibrational transition has been described previously18,23,24. In this case, the laser was tuned to individual HF ro-vibrational lines instead of the I(2P3/2) - I*(2P1/2) spin-orbit transition. The frequency of the laser was repetitively scanned over approximately 6GHz at a 50Hz rate. The I/Io signal was averaged for approximately 1 second (i.e. 50 scans) to improve the signal to noise ratio.
Spatially resolved emission spectra were generated with a 0.3 m Acton monochromator and a Near Infrared Optical Multi-channel Analyzer (NIR OMA) (Roper Scientific, OMA V). The 512 pixel array of InGaAs detectors generates the spectra with resolution well suited for our application. Fiber optic bundles were used to deliver the chemiluminescence to the monochromator. The small solid angle viewed by lens attached to the fiber optic bundle allows for spatially resolved emission spectra. While the lens - flow reactor separation used in these experiments does not allow resolution of the vertical profile, we can easily resolve the streamwise profile in 2 - 3 cm steps.
3. RESULTS AND DISCUSSION A typical HF overtone gain measurement is shown in Figure 2. The HF(2-0) P(3) line was chosen because it
should have the highest gain at our experimental conditions (H2 = 27 mmols sec1, F2, = 1 mmols sec'1, P(static) = 1.5 Torr, and T - 200 K). For the sake of clarity, only every other data point is shown. The peak gain is 0.07 % cm'1 and
168 Proc. SPIE Vol. 4631

the peak width (FWHM) = 515 MHz. Also shown in Figure 2 is the Gaussian lineshape function fit to the data. The residuals for the Gaussian fit are shown in the lower panel. Note that the residuals plot has no structure, indicating that no pressure-related line broadening or narrowing effects are evident15,16. The spectral linewidth corresponds to T = 198 K.
Figures 3a - 3c show spatially resolved small signal gain measurements. The data were generated by moving the diode laser along the vertical (y) and streamwise (x) axes of the reactor. To reduce the number of experiments, we assumed symmetry across the centerline. Hence, the data points below the centerline are identical to the measured values from above the centerline. Each panel corresponds to one of three positions along the x-axis (1, 5, and 9 cm downstream, relative to the NEP) and the three sets of data in each panel correspond to one of three H2 flow rates (5,10, or 27 mmols sec'1). The solid vertical lines in each panel indicate where the top and bottom base purge regions begin. For x = 1 cm downstream of the NEP, the gain peaks at approximately the same position (relative to the centerline) as the H2 injectors. This strongly suggests that molecular hydrogen has not penetrated into the center of the flow stream. The double peaked profile is less pronounced but still persists 5 cm downstream of the NEP. At x = 9 cm, the peak gain is along the centerline of the flow, demonstrating that, albeit somewhat slowly, the H2 does eventually penetrate into the center of the flow. The vertical profiles at 1 and 5 cm downstream show significant expansion of the flow into the base purge regions.
The highest observed small signal gain was ~0.1 % cm1. This result compares well with the results of Sentman and coworkers’ Parallel Slit Nozzle (PSN)25'27 and HYSIM lasers21,22. It is important to note, however, that in both cases they did not directly measure the small signal gain. Rather, they report the product go!*, (where Le is the effective path length) based on plots of the outcoupled power vs. mirror reflectivity. In the case of the PSN device, if an effective path length of 14.9 cm is assumed for the PSN device (i.e. the path length predicted by CFD calculations of the size of the active medium), then the small signal gain is 0.085 % cm'1. If, on the other hand, the geometric path length (30 cm) is used, the small signal gain is a factor of 2 smaller. Our result (which assumes L = 5 cm for our slit nozzle) is more consistent with Sentman if we adopt the assumption that Le = 14.9 cm. Considering the strong similarties between our hardware and Sentman’s, the apparent agreement with our result is not surprising.
Figure 4 shows the corresponding spatial temperature measurements. The uncertainty of the temperature in most cases is substantial because the signal to noise ratio is poor, and the lineshape is ill defined. In such cases where a reliable linewidth is not possible, only the small signal gain (which depends on the spectral area) is reported. In general, the temperature varies approximately 100 K from the centerline to the middle of the base purge region, peaking where the gain is highest.
The small signal gain was probed for several lines in addition to P(3). Figure 5 shows a few examples for HF(2-0) P(2) and P(4). While chemiluminescent spectra indicate that positive gain may also exist on several HF(3-1) lines, we could not directly probe these transitions due to the limited frequency range of the diode laser. Emission spectra of the flow at z = 1 -12 cm are shown in Figure 6. According to the Boltzmann equation.
In lA(vyJ)*g(J)
-gv*[y *(/+!)] kT
[3]
(where Bv is the rotational constant) a plot of the left hand side vs. J(J+1) is linear if rotational equilibrium exists, and the slope is equal to By/kT. A linear plot was obtained for each vibrational level, and the temperatures are indicated in panels a-e. The vibrational distribution is also indicated. The relative vibrational population is calculated from equations [4]
P(v) = HyJ)
[4]
and [5] _ g(J)*exy(-Bv*[j*(J+\)]/kT)
Qrot [5]
where Qrot is the rotational partition function. The rotational temperatures are slightly higher than, but not inconsistent with the spectroscopically determined translational temperatures. Both types of temperature tend to increase slightly as the flow progresses downstream. Finally, we note that the vibrational distribution for P2 - P5 also relaxes along the length of the reactor.
Proc. SPIE Vol. 4631 169

4. CONCLUSIONS A tunable diode laser has been used to measure the small signal gain of a small-scale supersonic HF overtone
laser. Unlike previous measurements of the overtone gain, our technique is direct, and can be both spatially and spectrally resolved. This data is complemented by spatially resolved overtone emission spectra that confirm that each vibrational state is in rotational equilibrium. These data are ideal for 2D and 3D computational fluid dynamics (CFD) calculations. When combined with the results of the CFD calculations19, this experiment should represent the most comprehensive characterization and analysis of an HF overtone laser reported to date.
5. ACKNOWLEDGMENTS The authors wish to acknowledge helpful discussions with Prof. L. H. Sentman regarding the construction and operation of the HYSIM nozzle, Prof. R. K. Hanson (Stanford University) for advice on HF overtone lineshape analysis. Dr. D. L. Carroll (CU Aerospace, LLC) regarding advice on preliminary CFD calculations, and Applied Research Associates, Inc. for computer time used to perform the preliminary CFD calculations. We are especially grateful to Brian Anderson (AFRL/DE) for assistance with the diode laser.
6. REFERENCES 1. Rolf W. F. Gross and Jerry F. Bott, Handbook of chemical lasers, Wiley, New York, 1976. 2. K. L. Kompa and G. C. Pimentel, J. Chem. Phys., 47,857,1967. 3. T. F. Deutsch, Appl. Phys. Lett., 10,234, 1967. 4. O. M. Batovskii, G. K. Vasil’ev, E. F. Makarov and V. L Tal’rose, JETP Lett., 9,200,1969. 5. N. G. Basov, L. V. Kulakov, E. P. Markin, A. I. Nikitin and A. N. Oraevsky, JETP Lett., 9,375,1969. 6. R. W. F. Gross, R. R. Giedt and T. A. Jacobs, J. Chem. Phys., 51, 1250,1969. 7. J. R. Airey and S. F. McKay, Appl. Phys. Lett., 15,401,1969. 8. D. J. Spencer, T. A. Jacobs, H. Mirels and R. W. F. Gross, Int. J. Chem. Kinet., 1,493,1969. 9. J. F. Hon and J. R. Novak, "Chemically pumped hydrogen fluoride overtone laser", IEEE J. Quant. Elect., QE-11, 698-699,1975. 10. A. S. Bashkin, V. I. Igoshin, Yu. S. Leonov, A. N. Oraevskii and O. E. Porodinkov, "An investigation of a chemical laser emitting due to an overtone of the HF molecule", Sov. J. Quantum Electron., 7,626 - 627,1977. 11. W. Q. Jeffers, "Short Wavelength Chemical Lasers”, AlAA Journal, 27,64 - 66,1988. 12. W. Duncan, S. Patterson, B. Graves and M. Holloman, "Recent Progress in Hydrogen Fluoride Overtone Chemical Lasers", AIAA-91-1480,1991. 13. W. Duncan, M. Holloman, B. Rogers and S. Patterson, "Hydrogen Fluoride Overtone Chemical Laser Technology", AIAA-89-1903,1989. 14. W. A. Duncan, S. P. Patterson, M. E. Holloman and J. L. Sollee, Progress in Hydrogen Fluoride Overtone Chemical Lasers, 1990 15. S. I. Chou, D. S. Baer and R. K. Hanson, "Diode laser measurements of He-, Ar-, and N2-broadened HF iineshapes in the first overtone band", J. Mol. Spectrosc., 196,70-76, 1999. 16. S. I. Chou, D. S. Baer and R. K. Hanson, "Spectral Intensity and lineshape measurements in the first overtone band of HF using tunable diode lasers", J. Mol. Spectrosc., 195,123-131,1999. 17. R. F. Tate, B. S. Hunt, C. A. Helms, K. A. Truesdell and G. D. Hager, "Spatial Gain Measurements in a Chemical Oxygen Iodine User (COIL)", IEEE J. Quant. Elect., 31, 1632 - 1636, 1995. 18. J. M. Herbelin, T. L. Henshaw, B. D. Rafferty, B. T. Anderson, R. F. Tate, T. J. Madden, G. C. Manke and G. D. Hager, "The measurement of gain on the 1.315 nm transition of atomic iodine in a subsonic flow of chemically generated NCl(a'A)", Chem. Phys. Lett., 299,583-588, 1999. 19. C. F. Wisniewski, G. C. Manke II, G. D. Hager, C. R. Truman and P. F. Crowell, "in preparation", 2002. 20. G. C. Manke II and G. D. Hager, "A Review of Recent Experiments and Calculations Relevant to the Kinetics of the HF Laser", J. Phys. Chem. Ref. Data, 30, 713 - 733, 2001. 21. L. H. Sentman, A. J. Eyre, J. T. Cassibry and B. P. Wootton, "Studies of cw HF Chemical Laser Performance", AAE TR 99-01, UILU ENG 99-0501, 1999. 22. L. H. Sentman, A. J. Eyre, B. P. Wootton and J. T. Cassibry, "Comparison of cw HF Laser Performance for Several Nozzles", AIAA 99-3469, 1999. 23. G. C. Manke II, T. L. Henshaw, T. J. Madden, J. M. Herbelin, B. D. Rafferty and G. D. Hager, "Characterizing fluorine and chlorine atom flow rates using iodine atom spectrometry", AIAA Journal, 39,447 - 454, 2001.
170 Proc. SPIE Vol. 4631

24. Thomas L. Henshaw, Gerald C. Manke II, Timothy J. Madden, Michael R. Berman and Gordon D. Hager, "A new
energy transfer chemical laser at 1.315 pm”, Chem. Phys. Lett., 325,537 - 544,2000. 25. L. H. Sentman, P. T. Theodoropoulos, T. Nguyen, D. L. Carroll and R. E. Waldo, "An Economical Supersonic cw HF Laser Testbed", AIAA Paper 89-1898,1989. 26. D. L. Carroll, L. H. Sentman, P. T. Theodoropoulos, R. E. Waldo and S. J. Gordon, "Experimental Study of Continuous Wave Hydrogen-Fluoride Chemical Laser Overtone Performance", AIAA Journal, 31,693 - 700,1993. 27. D. L. Carroll, L. H. Sentman, P. T. Theodoropoulos, R. E. Waldo, S. J. Gordon and J. W. Otto, "Experimental and Theoretical Study of cw HF Chemical Laser Overtone Performance", AAE TR 92-02, UILU ENG 92-0502,1992.
Proc. SPIE Vol. 4631 171

Table 1: Typical Experimental Conditions Parameter Range
[ Flow Rates
f2 1 mmols sec'1
h2 0 - 30 mmols sec"1 He(primary) 90 mmols sec'1 He( secondary) 15 mmols sec"1 He(base purge) 15 mmols sec"1
Cavity Pressure, Temperature Pressure (static) 1.5 -2.0Torr Pressure (total) -20 Torr Temperature (plenum / cavity wall) 370/290K Mach# 2.1-2.4
Figures la & lb. HYSIM slit nozzle configuration, (a). A construction diagram for the HYSIM slit nozzle is shown. Fluorine atoms are generated by the DC discharge and enter the plenum region before passing through the 3 mm high slit nozzle. Laser mirrors or glass windows can be mounted along the sides of the reactor to accommodate laser demonstrations or gain measurements, respectively, (b). Downstream view of the supersonic slit nozzle. The first two rows of injectors just downstream of the slit are for secondary (trip jet) He and H2 injection, respectively. A 1 cm step (top and bottom) occurs at the Nozzle Exit Plane (NEP), 0.9 cm downstream of the nozzle throat. Additional He is added to purge this region and prevent recirculation.
172 Proc. SP1E Vol. 4631

0.08
<0 0.04 o> 15 c O) ‘w
0.00 1
0.003 -
0.002 -
3 0.001 -
3 *o ‘35
0.000 -
£ -0.001 -
-0.002 -
-0.003 -
1000 2000 3000
Frequency (MHz)
4000
Figure 2. Small signal gain on HF(2-0) P(3). A sample HF overtone small signal gain spectrum is shown. The experimental conditions for the upper panel are F2 = 1 mmol sec1, H2 = 27 mmols sec , P - 2 Torr, x = 5 cm downstream of the NEP, and y = 0.25 cm above the centerline. For purposes of clarity, only every other data point is shown. The spectrum is fit by a Gaussian function which gives area = 39.6, width(FWHM) = 515.2 MHz, and peak gain = 0.072 % cm'1. The linewidth corresponds to T = 198 K. A residual plot is shown in the lower panel, demonstrating that the Gaussian line function adequately fits the entire lineshape. If pressure broadening had been present, the residual plot would have non-random structure.
Proc. SP1E Vol. 4631 173
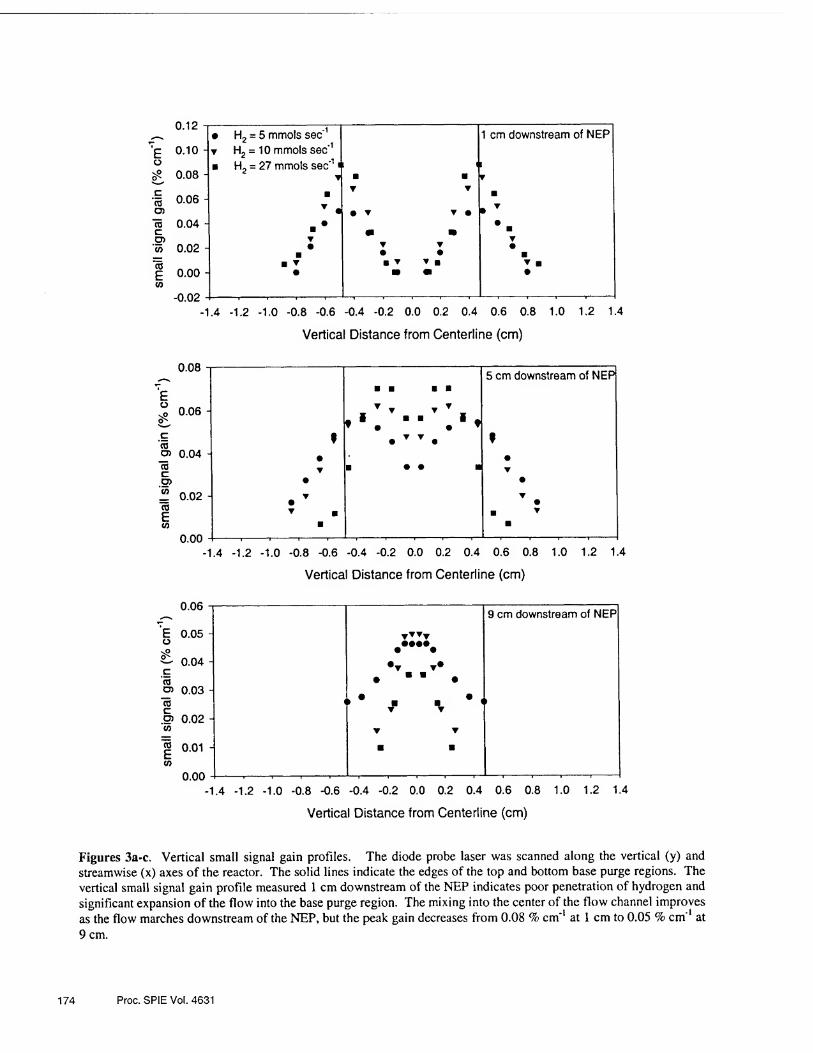
E o vO
C
O) m c D)
*C0
76 E
0.12 i
0.10 -
• H2 = 5 mmols sec'1 ▼ H2 = 10 mmols sec'1
1 cm downstream of NEP
0.08 -
0.06 -
0.04 -
■ hL = 27 mmols sec*1 * i 2
¥
■
T «
▼
■ ■ ▼ ▼
m m
¥
m
• f
T 0.02 - •
■ ■ ▼
▼ ▼ • • ■ ▼ ▼ ■
• ■ ▼ ■
0.00 -
-0.02 -
• m m •
-1.4 -1.2 -1.0 -0.8 -0.6 -0.4 -0.2 0.0 0.2 0.4 0.6 0.8 1.0 1.2 1.4
Vertical Distance from Centerline (cm)
0.08
‘e S 0.06
C CO o> 0.04 CO c O) ” 0.02 CO
E CO
0.00 -1.4 -1.2 -1.0 -0.8 -0.6 -0.4 -0.2 0.0 0.2 0.4 0.6 0.8 1.0 1.2 1.4
Vertical Distance from Centerline (cm)
0.06
E 0.05 o nP
2- 0.04 c CO O) 0.03 CO
.05 0.02 w
"I 0.01 CO
0.00 -1.4 -1.2 -1.0 -0.8 -0.6 -0.4 -0.2 0.0 0.2 0.4 0.6 0.8 1.0 1.2 1.4
Vertical Distance from Centerline (cm)
9 cm downstream of NEP
-
▼▼▼▼ ••••••
• V ^ •
▼ ▼
■ ■
Figures 3a-c. Vertical small signal gain profiles. The diode probe laser was scanned along the vertical (y) and stream wise (x) axes of the reactor. The solid lines indicate the edges of the top and bottom base purge regions. The vertical small signal gain profile measured 1 cm downstream of the NEP indicates poor penetration of hydrogen and significant expansion of the flow into the base purge region. The mixing into the center of the flow channel improves as the flow marches downstream of the NEP, but the peak gain decreases from 0.08 % cm'1 at 1 cm to 0.05 % cm'1 at 9 cm.
174 Proc. SPIE Vol. 4631

400
g £ 3 300 2 Q> CL
I 200
100 -1.4 -1.2 -1.0 -0.8 -0.6 -0.4 -0.2 0.0 0.2 0.4 0.6 0.8 1.0 1.2 1.4
• H2 = 5 mmols sec'1 1 cm downstream of NEP
▼ H2 = 10 mmols sec'1
■ H2 as 27 mmols sec'1
■ ■ ■ ■
▼ ■ ■ ▼ X V •
i f • v * •
Vertical Distance from Centerline (cm)
350
_ 300 *
250 H £ 3
2 &. 200 E £
150
100
5 cm downstream of NEP
▼
T ♦
-1.4 -1.2 -1.0 -0.8 -0.6 -0.4 -0.2 0.0 0.2 0.4 0.6 0.8 1.0 1.2 1.4
Vertical Distance from Centerline (cm)
250
* 225
¥ 3 $3 200 ^ 0) Q. E £ 175
150
9 cm downstream of NEP
▼ ▼
vv • » 1 •
-1.4 -1.2 -1.0 -0.8 -0.6 -0.4 -0.2 0.0 0.2 0.4 0.6 0.8 1.0 1.2 1.4
Vertical Distance from Centerline (cm)
Figures 4 a - c. Vertical temperature profiles. The diode probe laser was scanned along the vertical (y) and streamwise (x) axes of the reactor. The uncertainty of the temperature in some cases is substantial because the signal to noise ratio is poor and a reliable peak width could not be determined. Hence, fewer data points appear than in Figures 3 a-c. The temperature varies approximately 100 K from the centerline to the middle of the base purge region, peaking where the gain is highest.
Proc. SPIE Vol. 4631 175

Figures 5 a - b. Small signal gain for HF(2-0) P(2) and P(4). In addition to measuring the small signal gain on HF(2-0) P(3), the diode laser can scan across several other overtone ro-vibrational lines. The HF(2-0) P(2) and P(4) lines are shown in the upper and lower panels, respectively. The experimental conditions for the upper panel are F2 = 1 mmol sec'1, H2 = 27 mmols sec'1, P - 2 Torr, x = 5 cm downstream of the NEP, and y = 0.25 cm above the centerline. The Gaussian function fit to P(2) spectrum corresponds to area = 33.4, linewidth(FWHM) = 490.3 MHz, and peak gain = 0.064 % cm'1. The experimental conditions for the lower panel are F2 = 1 mmol sec'1, H2 = 27 mmols sec'1, P ~ 2 Torr, x = 1 cm downstream of the NEP, and y = 0.4 cm above the centerline. The Gaussian function fit to P(4) spectrum corresponds to area = 20.8, linewidth(FWHM) = 523.8 MHz, and peak gain = 0.037 % cm'1
176 Proc. SPIE Vol. 4631

1250 1300 1350 1400 1450 1500
Wavelength (nm)
Figures 6a - e. HF overtone emission spectra. A Near Infrared Optical Multi-channel Analyzer (NIR OMA) was used to collect the HF overtone spectra shown above. Using fiber optic delivery to the monochromator, spatially resolved emission spectra can be generated. A Boltzmann analysis of the overtone spectra (see text) shows that rotational equilibrium has been achieved, that the rotational temperature increases slightly and the vibrational distribution relaxes as the flow progresses downstream. The experimental conditions for all panels are F2 = 1 mmol sec'1, H2 = 27 mmols sec'1, and P - 2 Torn Although the fiber optic lens collects chemiluminescence from a small solid angle, it was positioned such that the entire vertical profile is observed simultaneously (y = centerline ± 0.5 cm).
Proc. SPIE Vol. 4631 177

Atomic fluorine source for chemical lasers
S.J. Davis*, D.B. Oakes, M.E. Read, and A.H. Gelb Physical Sciences Inc.
ABSTRACT
We present results from the early development of an F atom source appropriate for HF and AGIL chemical laser research. The system uses high power microwaves to produce a high enthalpy plasma that thermally dissociates molecular species such as SF6 and F2. Results of the characterization of the flow are presented.
Keywords: hydrogen fluoride lasers, combustors, halogen atom sources, microwave discharges
1. INTRODUCTION
Chemical lasers offer the obvious advantage that the population inversion is produced by selective chemical reactions, e.g., HF lasers1 or energy transfer from chemically produced metastable species such as the Chemical Oxygen Iodine Laser (COIL)2 and All Gas-Phase Iodine Laser (AGIL).3*6 Often, however, one must supply energy sources to obtain the chemical species required for the selective reactions to occur. For example the reactants that produce the HF laser are F and H2. Consequently, production of F atoms is a-key element in HF chemical lasers. Several methods for F atom production have been used: DC electric discharge, photolyis, electrical arc heating, and chemical combustors. Large, high power HF lasers use chemical combustors to produce the enthalpy necessary to thermally dissociate either F2 or NF3. The combustors can be driven by the reaction of H2 and F2. For small, laboratory-sc ale HF lasers DC electric discharge is often used.
In this paper we discuss a new, alternate dissociation source for F atom production that may be suitable for HF and other chemical lasers that require F atoms such as HF and the new AGIL system. Our source is based on a device called the
Microwave Induced Plasma Jet (MIDJet™). The MIDJet™ device can be considered to be a thermal dissociation source of atomic species. In effect, it is an efficient electrical combustor. The MIDJet™ is shown schematically in Fig. 1. It consists of a coaxial microwave line feeding a TM0i microwave cavity formed by an outer cylinder and an inner
*[email protected]; phone 1 978 689-0003; fax 1 978 689 3232; http://www.psicorp.com; Physical Sciences Inc., 20 New England Business Center, Andover, MA, USA 01810-1077
178 Gas and Chemical Lasers and Intense Beam Applications III, Steven J. Davis, Michael C. Heaven,
Editors, Proceedings of SPIE Vol. 4631 (2002) © 2002 SPIE • 0277-786X/02/$15.00

conductor. Microwave power is injected via a coaxial line. The inner conductor is continued into the cavity, forming a coaxial structure that allows the diameter to be significantly smaller than would be possible with an open cavity. A discharge is produced on axis, where the RF electric field is locally maximum. The input gas is introduced via nozzles in the outer wall, with nozzles angled to produce an azimuthal (vortex) flow. This flow produces a radial acceleration that results in hot gas being pushed inward. The discharge produced by the high RF electric field on axis is thus confined to a small cylindrical volume. The gas exits through a nozzle. The output flow can be subsonic, sonic, or supersonic, depending on the pressure difference between the torch and the ambient environment, and the design of the nozzle. The MID Jet™ can be operated with internal pressures from slightly sub-atmosphere to more than 10 atm, producing supersonic and subsonic flows even into the atmosphere.
2. EXPERIMENT
We assembled the apparatus shown in Fig. 2 to test the MIDJet™ as an F-atom source appropriate for chemical laser research. The MIDJet™ head was connected to a chamber with three pumping stages. The chamber was a six port cross with each port 20 cm in diameter. As indicated in Fig. 2, for some tests we used a mass spectrometer to analyze the
effluents from the MIDJet™ head to measure the dissociation fraction of the molecular fluorine. This spectrometer can make measurements up to 300 amu with 1 amu resolution. Two stages of differential pumping are used to handle the high mass flow rates of the MIDJet™. Greater than 99% of the flow is pumped from the first stage by a 400 cfm Roots Blower. A 0.5 mm diameter graphite skimmer is used to separate the first pumping stage from the second. This skimmer is well downstream of the Mach disk which forms about 2 cm from the MIDJet™ exit nozzle. Beyond the Mach disk the flow is subsonic. A second skimmer separates the second differential chamber from the first and provides the entrance path for gas to be analyzed by the mass spectrometer.
Fig. 2: Schematic of the apparatus used for the beam composition measurements.
The beam composition is measured by monitoring the mass 19 (F atom) and 38 (F2) signals. To convert the raw signals into values that are proportional to the concentration of F and F2 in the flow we must take into account the following: 1) F signal resulting from F2 cracking in the mass spectrometer ionizer, 2) the relative ionization cross section by electron beam impact for F and F2, and 3) the transmission function (sensitivity versus mass) of the mass spectrometer. For the fluorine beam the atomic content of the fluorine component of the beam (%F, neglecting the helium diluent) is given by Eq. (1).
Proc. SPIE Vol. 4631 179
(1) % F atoms = Nf
(Nf + NF2) x 100%
where:
Nf = (sf “ Sp" ) TpCp1 ^
Nf2 = SF2Tp2Cp2
and:
Nf = Value proportional to # of F atoms in beam
NF2 = Value proportional to # of F2 molecules in beam
SF = The m/e = 19 signal (Volts)
SF2 = The m/e = 38 signal (Volts)
S/2 = The contribution to the m/e =19 signal due to the cracking of F2
TF = The transmission function for m/e = 18
Tp2 = The transmission function for m/e = 38
CF = The relative ionization cross section for atomic fluorine
CF2 = The relative ionization cross section for F2.
We obtained references reporting measurements of the absolute cross section for ionization of F and F2 by electron impact at 70 eV (our electron energy).7'8 We also measured the relative transmission function for the mass spectrometer from mass (m/e) 20 to 40. The relative Ar+ (m/e = 40) and Ar++ (m/e = 20) signals in our mass spectrometer formed by electron impact of argon were compared to the published cross section for the formation of Ar+ and Ar++ by electron impact of argon. This comparison led to values of the relative transmission function between mass 19 and 38. Finally the contribution of F2 cracking to the F signal was measured by turning the MIDJet™ plasma off and measuring the relative m/e = 38 to 19 signals for the cold flow. A summary of all the parameters necessary for the calculation of the atomic composition of the fluorine beam is presented in Table 1.
Table 1: Summary of the Parameters Used to Determine the Fluorine Beam Composition
Beam
Transmission Function
(Relative)
Ionization Cross Section
(x 10 16 cm2) Fraction of Parent Signal that
Contributes to Atom Signal Atom Parent Atom Parent
Fluorine 1.00 0.763 0.87 1.10 0.210
3. RESULTS
MIDJet™ beams were made from the 5%F2/Helium mixture with discharge powers ranging from 1860 to 3610 W. The results of the beam composition analysis are plotted as % F2 dissociation versus Power/Flow ratio in Fig. 3.
Fig. 3 shows that the maximum F atom content of the fluorine flow obtained in these experiments was 81%. Equilibrium calculations predict that the fluorine in the 5% F2/He beam will be essentially fully dissociated for Power/Flow ratios greater than 40 W/slm. We are therefore observing less dissociation than expected based upon the equilibrium prediction. However, as expected, at a fixed discharge power the data does show a correlation between F atom content and increasing Power/Flow ratio.
180 Proc. SP1E Vol. 4631

80;; 5 70;; o cl 60;;
° 50” s? -- E 40!T *30;; u- 20-.
10+ 0;
1 2200 W nominal k 2812 W ► 3609 W
3 -I-1-1-1-1-1-1-1-1-1 1-1-1-1-1— 25 30 35 40 45 50 55 60
Power/Flow (W/sIm) 65
Fig. 3: F atom % of the flow versus Power/Flow (W/slm) ratio for the beams formed from the 5% F2/helium mixture.
We estimated that the effects of gas phase recombination in the chamber are negligible. However, recirculation flows which result in background gas reaching and passing through the first skimmer would have a high recombination fraction due to substantial interaction with the chamber walls. A summary of a few composition measurements are shown in Table 2.
Table 2: Summary of the Conditions and Results for Three of the Composition Experiments Included in Fig. 3
Coupled
Discharge
Power (W)
Power/Flow
(W/slm)
Formation
Chamber
Pressure (Torr)
Atomic F % of
Flow
F Atom
Fluence
(/s)
F Atom
Fluence
(mmoles/s)
1880 42.5 2.80 68.2 1.02 x 10²¹ 1.8
2810 40.9 4.05 74.2 1.82 x 10²¹ 3.0
3610 61.2 3.67 80.7 1.79 x 10h 3.0
Since the MIDJet™ device can operate at pressures of an atmosphere or greater, it is appropriate to consider it as a driver for a subsonic or supersonic chemical laser nozzle. One could consider the downstream side of the device as a plenum. The gases would then flow through a mixing nozzle as indicated in Fig. 4.
Fig. 4: Concept for a MIDJet™ driven chemical laser.
3.1 Scaled Midjet™ We have designed and are building a scaled device that will deliver 25 kW of microwave power to the flow. Equilibrium calculations indicate that such as system will be able to produce nearly 50 mmoles of F atoms. For example, in Figs. 5 and 6 we show results from an equilibrium calculation for a flow of 16 mmoles/s of F2 and NF3 in a flow of 700 mmoles of He. The equilibrium calculations use the heat capacities of the gases and predict dissociation fractions as a function of temperature. Fig. 5 indicates that 25 kW of absorbed power will dissociate greater than 95% of the F2 in the flow. For NF3 (see Fig. 6), greater than 90% of the NF3 will be dissociated into F atoms.
The expected dissociation products from NF3 are indicated in Fig. 7.
Proc. SP1E Vol. 4631 181

Abs
orbe
d P
ower
(kW
) A
bsor
bed
Pow
er (
kW)
Mass flow rates: [F2] = 0.016 moles/s
[fte] = 0.70 moles/s
Fig. 5: Equilibrium code predictions of dissociation fraction of F2 for a mix of F2/H<
Fig. 6: Equilibrium code prediction of dissociation fraction of NF3 for a mix of NF3/He.
Proc. SP1E Vol. 4631
Frac
tion
NF
, Dis
soci
ated
”5
' F
ract
ion
F2D
isso
ciat
ed

3
25
g 15 1.5 rtf**
as
NF3 F2
/ y/ / / \
N2
500 10GO 1500
Temperature (C)
2QGQ
Fig. 7: Equilibrium calculation for NF3 at 1 atm.
4. SUMMARY
We have described a novel, electrically based source for halogen atoms that may be a convenient source of F atoms for
HF chemical laser research. We have characterized a device that delivers up to 3.5 kW to the gas flow and have
demonstrated F atom fluences of 3 mmoles/s for a 5% mix of F2 in He. A scaled device is under construction.
ACKNOWLEDGMENT OF SUPPORT AND DISCLAIMER
This material is based upon work supported by the United States Air Force Research Laboratory, Directed Energy
Directorate, Contract No. F29601-00-C-0053. We gratefully acknowledge this support.
REFERENCES
1. R.W.F. Gross and J.F. Bott, Handbook of Chemical Lasers, John Wiley & Sons, New York, 1976.
2. W.E. McDermott, N.R. Pchelkin, D.J. Benard, and R.R. Bousek, "An Electronic Transition Chemical Laser," Appl. Phys. Lett, 32,469, 1978.
3. J.M. Herbelin, T.L. Henshaw, B.D. Rafferty, B.T. Anderson, R.F. Tate, T J. Madden, G.C. Manke II, and G.D.
Hager, "The Measurement of Gain on the 1.315 pm Transition in Atomic Iodine in a Subsonic Flow of Chemically
Generated NCl^A)," Chem. Phys. Lett.,. 299, 583, 1999.
4. T.T. Yang, V.T. Gylys, R.D. Bower, and L.F. Rubin, "Population Inversion Between I(2P1/2) and I(2P3/2) of Atomic
Iodine Generated by Excitation Transfer from NCl^A) to I(2P3/2)," SPIE, 1871, 1993.
5. A.J. Ray and R.D. Coombe, "Energy Transfer from NCl^A) to Iodine Atoms,", J. Phys. Chem., 97, 3475, 1993.
6. A.J. Ray and R.D. Coombe, "An T Laser Pumped with NCl^A)," J. Phys. Chem., 99, 7849, 1995.
7. T.R. Hayes, R.C. Wetzel, and R.S. Freund, "Absolute Electron-Impact-Ionization Measurements of the Halogen
Atoms," Phys. Rev. A, 35(2), 578, 1987.
8. F.A. Stevie and M.J. Vasile, "Electron Impact Ionization Cross Sections of F^ and CL," J. Chem. Phys., 74(9), 5106, 1981.
Proc. SPIE Vol. 4631 183

Parametric Study of NCI(a’A), NCI(b'S) from the reaction of
Cl/Cl2/He + HNj/He
Liping Duo, Shukai Tang, Jian Li, Xiangde Min, Fengting Sang, Bailing Yang
Short Wavelength Chemical Laser Laboratory, Dalian Institute of Chemical Physics
Chinese Academy of Sciences, Dalian 116023, China
ABSTRACT
By means of Microwave generator chlorine diluted by helium is dissociated to chlorine atoms that subsequently react
with hydrogen azide to produce excited states of NCl(a'A) and NCl(b'S). In this paper, the intensity of NCl(a'A) and
NCl(b'S) emission dependent on the flow rates of different gases is studied. Moreover, the production of NCl(a'A)
and NCl(b'S) along the reaction tube is also investigated. By using a simple titration method, we obtain the
dissociation efficiency of molecular chlorine up to 100% at the flow rates of chlorine no more than lmmol/s. We also
achieve the quenching rate of NCl(a'A) by Cl2 is about 4*1 O'13 cm3/secmolec with excess flow rates of chlorine.
Finally, the optimum parameters for NCl(a'A) and NCl(b'S) production are summarized.
Key words: NCl(a'A) and NCl(b'S), Cl/Cl2/He + HN3/He
1. INTRODUCTION
Being the shortest wavelength chemical laser and the only laser based on electronic transition, the chemical
oxygen-iodine laser (COIL) is of great interest owing to its potential applications in both industrial and military
fields11]. As the energy source of the laser, 02(a'A) is produced by the reaction of gaseous chlorine with liquid basic
hydrogen peroxide (BHP) in the singlet oxygen generator (SOG) which is a main part of the COIL and occupy the
most of COIL in size and weight , so power-volume or power-weight efficiency is limited by the gaseous-liquid
reaction. Moreover, there are the strong quenchers for excited atomic iodine, for example, water vapor and hydrogen
peroxide produced in singlet oxygen generator (SOG). Consequently, it is necessary to look for metestable particles
instead of 02(a'A) to pump iodine atoms.
Bower and Yang121 reported the nearly resonant energy transfer from metestable NCl(a'A) to atomic iodine in 1990
and obtained the reactive rate of >lxlO'10cmY' which is much faster than that of 02(a'A) to atomic iodine. The
concept of NCl(a'A)/I as a newly possible laser system is becoming a hot point. Many papers13'71 about NCl(a'A)
energy transfer and quenching kinetics were reported. T.L.Henshaw181 and his group at Air Force Research
Laboratory measured the gain on the 1315nm transition of atomic iodine in a subsonic flow of chemically generated
NCl(a'A) in 1999 and subsequently showed an output power of 180mW from a new energy transfer chemical iodine
laser pumped by NCl(a'A) at 1315nm in 2000191.
The mechanism of the system for a chemical atomic iodine laser pumped by NCl(a'A) is general as following:
Production ofNCl(a'A)
184
Gas and Chemical Lasers and Intense Beam Applications III, Steven J. Davis, Michael C. Heaven, Editors, Proceedings of SPIE Vol. 4631 (2002) ©2002 SPIE • 0277-786X/02/$15.00

Cl + HN3 -» HCl + N3 8.9 xlO"13 (1)
Cl+ N3^> NCl(a' A) + N2 2.8 ± 0.4 x 10"10 (2)
Production of atomic iodine
Cl + HI —> HCl + / 1.0 xlO"10 (3)
Cl + I2-+ICl + I 2.0x1 O'10 (4)
OT a+ici -+ci2+1 8.0x10⁻¹²
Production of excited atomic iodine
NCl(alA) + I->I(2PU2) + NCl(X3'L)
1.8x10'"
The above reactive rates are in units of cm3/sec molec..
Lasing
I(2PV2) + hv^I{2PV2) + lhv 7.8s'1
(5)
(6)
(7)
In addition, there is a sharp increase of NCl(b'S) emission upon iodine being injected into the system of
NCl(a1A)/Cl/He/Cl2/H’N3, that is, a potential chemical laser at visible1101 is based on
Ara(A-,2) + /(,^,I)-> Va(olA) + /(2/>„2) ,, (o)
1.0x10"2
NCI (a1 A) + 7(2 PV2) NCl(blY) +1(2 PV2)
1.0 xlO"12 (9)
In this paper, the intensity of NCl(a’A) and NCl(b’E) emission dependent on the flow rates of different gases was
studied. Moreover, the production of NCl(a'A) and NCl(b’Z) along the reaction tube was also investigated. The
results were presented and discussed and the quenching rate of NCl^A) by Cl2 is obtained. The optimum parameters
for NCl(alA) and NCliVX) production were given finally.
2. EXPERIMENTAL
The diagram of the setup we used was shown in Figure 1. The reaction tube that was made of silica glass and had a
length of 1.2m, the Microwave generator of 1000W, the gas supply system, OMA4 and the pumping system were
indicated. The mixture of chlorine measured by a flow meter and helium measured by a flow meter flowed through
the MW generator to produce chlorine atoms that then mixed and reacted with the mixture of hydrogen azide and
helium at the ratio of 1:10. The chlorine and helium we used have a purity of 99.99%. HN3 was produced by the
method described in reference [2] and stored in an 180L steel container in which helium was input till the ratio of
Proc. SPIE Vof. 4631 185
He/HN3 at 10:1. The pressure of the reaction tube was about 10 Torr and the linear velocity of the gases in the tube
was around lOOm/s. NCl(a'A) and NCl(b'Z) emission was collected by OMA4 and processed by a computer.
3. RESULTS AND DISCUSSION
3.1 Spectrum of NCl(a'A) and NCl(b'S) emission
Upon HN3/He being injected into Cl/Cl2/He, the red fluorescence can be seen immediately. Spectra of NCl(a'A) and
NCl(b'S) emission recorded by OMA4 are shown in Figure 2. The peaks of NCl(a'A) emission around 1077nm and
NCl(b'S) emission around 665nm are the same with the results in the reference [11].
The OMA4 was calibrated by a standard tungsten lamp at 665nm and 1077nm and the coefficients were 5.73x10V
Counts'1 and 2.99xl08 s'1 Counts'1, respectively. By means of Einstein emission coefficients, the solid angle and the
collected volume, we obtained that the densities of NCl(a'A) and NCl(b'S) at the experimental parameters were in the
range of 101011 cm'3 and 107~8cm'3, respectively. The ratio of densities of KClfa'A) and NCl(b'S) was about 103
which is well accordant with the results of 6500 in reference [10]. However, it is the fact that the intensity counts of
NCl(b’S) emission looks like much stronger than that of NCl(a’A) emission (reference Figure2). This is completely
due to that the Einstein emission coefficient of NCl(b'E) is much larger than that of NCl(a'A) and the sensitivity of
OMA4 is more sensitive at visible than IR range.
3.2 NCl(a*A) and NCl(b’S) emission along the reaction tube
The intensity of NCl(a'A) and NCl(b'S) emission along the reaction tube is shown in Figure 3. It can be seen that
there is a maximum at the range of 4-5cm along the reaction tube at the experimental conditions of the helium flow
rate of 19.7SLM, chlorine of 0.42SLM, HN3/He mixture of 1.6SLM and the pressure of the reactor at lOTorr. This is
easily understood because the production of NCl(a'A) and NCl(b'l) increases with the mixing which is better and
better with the distance and on the other hand the quantity of NCl(a'A) and NCl(b'S) decreases with the distance
owing to the quenching by many particles, for example, NCl(a*A) quenched by the following particles.
NCl(a) + M NCl(X) + M (10)
M = Cl2 1.8±0.3xKTn
He IA
X
o 1 <-r\
(11)
Cl lxlO”12 (12)
Considering reaction formulas of (1), (10), (11), (12) and denoting [Cl2], [He], [Cl] as [M], we can obtained the
following kinetics equation,
d[NCl(a'A)] = [Ci][HN j
dt ' 3 (13)
-lkm[M][NCl(a^)]
Input the linear velocity of the gas (denoted as u), the equation can be written as a function of the distance
186 Proc. SPIE Vol. 4631
(denoted as x).
4MVAM.1 dx u 1 (14)
-ajWA)]}
Assuming [HN3], [M] and the reactive rates of ki and km as constants, and integrating the above equation as
follows,
[NCK,a' A)] =4.(1-<■-*■) (15) B
Where, A =-(kl[HN3]0[Cl]), B = -(Zkm[M]) u u
If only considering the dominant reaction step (1), we can obtain that [Cl] goes down with the distance
according to the reaction kinetics equation,
dx u So,
[Cl] = [Cl\e~a (16)
Where c = —kl [HN3 ]0 u
So equation (15) becomes
[NCl(alA)] = A. e-« . (1- eBx) (17) B
Where A0 =--((IP3]0[CI]0) u
The maximum of NCl^A) along the distance can be easily obtained based on making the differential equation of
formula (17) equal zero.
Also, both profiles have almost the same trend and the emission of NCl(alA) and NCKb1^) spreads all over the tube
inside according to spectrum measurements as well as sights. In the following we studied the relationship of intensity
ofNCKb1!) emission and parameters of gaseous flow rates since NCl^A) has the same trend with NCl^L) and the
OMA4 has a higher signal-noise ratio at the visible.
3.3 NCl(a1A) and NCKb1^) emission dependent on ratio of He and Cl2
The intensity of NCIO?1!) emission dependent on the ratios of He and Cl2 was studied at the position of 5cm and
indicated in Figure 4. The ratio of He and Cl2 was changed by adjusting the flow rates of chlorine at a fixed flow rate
of helium. The intensity of NCl(b!I) emission is almost completely stronger at the ratios of He and Cl2 more than
30:1 in several flow rates of helium cases. In more detail, it also can be seen that the ratio of He and Cl2 for the
maximum intensity of NCUVl) emission increases with the flow rates of He. Even so, the ratio of helium and
Proc. SPIE Vol. 4631 187

chlorine at 30 is enough to protect atomic chlorine since it is not easy to charge for more diluent helium by means of
the microwave generator.
3.4 NCl(a!A) and NCKb1^) emission dependent on Cl2
The intensity of NC^b1!) emission dependent on the flow rates of Cl2 is shown in Figure 5 in which the maximum
intensity of NC^b'S) emission was in the range of 0.25—0.4SLM for the flow rate of chlorine. More or less chlorine
can cause to decrease the production of NCl(a*A) and NCl(blI) because less chlorine only produces less chlorine
atoms and consequently produces less excited particles, in contrast, excessive chlorine can quench the excited
particles of NCl(a!A) and NCl(b!Z). The relationship of the density of NCl(a*A) and the density of Cl2 is display in
Figure 6. Now we only consider the quenching by Cl2 since kHe is much less than kCi2 and the atomic chlorine is much
less, the kinetics equation can be written as,
d[NCl{a'&)]
dx u
t i ~ 1^21
[NCl(a'A)] = -[NCl(a'A)]0-e " (18)
1 , ,6 Fitting the experimental data in Figure 6, the exponential coefficient of — ka X is simulated as 2x10 . Based on
u 2 the linear velocity of ca. lOOOOcm/s and the collecting position of 5cm, the quenching rate of NC^a'A) by chlorine
(denoted as kci2) is around 4x 10"13 cm3/sec molec which is in good agreement with the result in reference [4].
3.5 NCi(a*A) and NCl(blE) emission dependent on HNa/He
The intensity of NCl(bl£) emission dependent on the flow rate of HN3/He at different flow rates of helium and
chlorine is shown in Figure 7 in which it can be seen that the maximum NClfl^Z) was produced at the flow rate of
2.5—3.5SLM ofHN3/He. Excess or less HN3/He can cause the decrease of the production of NCl(a*A) and NCKb1^)
because less hydrogen azide only produces limited excited particles and extra hydrogen azide similarly quench the
excited particles of NCl(a!A) and NC^b1!) though the reaction rate ofNCl(a!A) quenched by FTN3 is unknown to us
so far.
NCl(a' A) + HN3 -> NCl(X*Z) + HN3
kx=l
flatVA)] dt
kx[HN3][NCl(a'X)} + km[M}[NCl{a^)}
Recently, we have done a series of experiments about changing the ratios of hydrogen azide over chlorine in another
reactive device, the results are shown in Figure 8. If assuming the mixing efficiency is unity, we can obtain that the
dissociation efficiency of chlorine based on the maximum flow rate of hydrogen azide,
188 Proc. SPIE Vol. 4631
In summary, the optimum operating parameters for the present setup are listed in Table 1.
4. CONCLUSION
Through the parametric study of NCl^A) and NC^b1!) emission, it can be seen that the branch ratio of NCl(a! A)
and NCl(bl£) is about 103~4 in the reaction system of Cl/Cl2/He + HN3/He. The ratio of helium and chlorine about 30
is enough to protect atomic chlorine since it is not easy to charge for more diluent helium by means of the microwave
generator. Also, we obtained that the optimum parameters for the production of NC^a1 A) and NCl(bl£) were the flow
rates of chlorine in the range of 0.25—0.4SLM, hydrogen azide in the range of 0.25—0.35SLM, helium in the range
of 11—14SLM and the pressure of the reaction tube at about lOTorr in our presently experimental conditions. More,
the quenching rate of NCl^A) by Cl2 is about 4*10'13 cm3/sec molec. The dissociation efficiency of molecular
chlorine can be up to 100% at the flow rates of chlorine no more than 1 mmol/s.
REFERENCES
[1] Zhuang Q.; Sang F.; Zhou D., “Short wavelength Chemical Laser”, The Publishing House of the National
Defense and Industry, 1st ed., June 1997 (in Chinese)
[2] Yang T.T.; and Bower R.D. SPIE proceeding 1990, Vol.1225, 430
[3] Henshaw T.L.; Herrera S.D.; and Schlie L.A., ‘Temperature Dependence of the NCl(a)+I(2P3/2) Reaction from 300 to 482K”,
J. Phvs. Chem. A 1998, 102, 6239
[4] .Mankell G.C and Setser D.W., “Kinetics of NCl(a and b) Generation: The Cl+N3 Rate Constant, the NCl(a) Product
Branching Fraction, and Quenching of NCl(a) by F and Cl Atoms”. J. Phvs. Chem. A 1998, 102, 7257
[5] Henshaw T.L.; Herrera S.D.; Haggquist G.W.; and Schlie L.A., “Kinetics of NCl(a) via Photodissociation of C1N3”, J. Phvs.
Chem.. A 1997. 101,4048
[6] Hewett K.J.; Manke II G.C.; Setser D.W.; and Brewood G., “Quenching rate constants of NCl(a) at room temperature”, I
Phvs. Chem. .A 2000, 104, 539
[7] Mankell G.C.; Henshaw T.L.; Madden T.J.; Hager G.D., ‘Temperature Dependence of the C1+HN3 Reaction from 300 to
480K”. SPIE proceeding 2000, Vol.3931,A-12
[8] Henshaw, T.L.; Madden, T.J.; Herbelin, J.M.; Mankell, G.C.; Anderson, B.T.; Tate, R.F.; and Hager, G.D., “Meaurement of
gain on the 1.31 Sum transition of atomic iodine produced from the NCl(a)+I energy transfer reaction”, SPIE proceeding
1999, Vol.3612, 147
[9] Henshaw, T.L.; Mankell, G.C.; Madden, T.J.; Berman, M.R.; Hager, G.D. Chem. Phvs. Lett. 2000, 325, 537
[10] Yang T.T. SPIE proceeding 1994, Vol.2119, 122
[11] Pritt, A.T.; and Coombe, R.D. Int. J. Chem. Kinetics 1980. Vol.XII, 741
Correspondence: Email: [email protected] Tel: 86-411-4671991 ext.843 Fax: 86-411-4679766
Postal address: P.O.Box 110, Dalian, 116023,China

NC
I(b)
inte
nsi
ty <
a.u.
) In
tensi
ty(a
.u)
Figure 1 The schematic of the experimental setup
Figure 2 Spectra of NCl(a*A) and NC^b’S) emission
Distance from the injection of HN (cm)
Figure 3 The intensity of NCl(a*A) and NC^b'S)
emission along the reaction tube
700 - 1 ▼
600 - , 4
* 500 - " T
• ■ B
400 - • D • • F
300 - ▼ ▼ H
L
200 - 4 N •
20 40 60 SO 100 120 140 160 ISO 20 0 2 20 24 0 260
Ratio of He/Cl
Figure 4 The intensity of NC^b1!) emission dependent on
the ratios of He and Cl2,
B: He:4.8SLM;HN3/He(l:!0):0.5SLM; D;He:8.1SLM ;HN3/He(l: 10): 1SLM;
F: He:18.6SLM;HN3/He(l:10):2.5SLM; H: He:24.2SLM;HN3/He(l: 10): 1SLM;
L: He:30SLM;HN3/He(l:10):lSLM;N: He:39.2SLM;HN3/He(l: 10):2SLM
190 Proc. SPIE Vol. 4631

900 -i
=? 600- ra, >> ^ 500 • w c 0) c 400
O 300
z
100
-i—«—r~ 0.0 0.2
■ Flow rate of helium 18.6SLM
m • Flow rate of helium 8.1 SLM
—i—*—i-1-1-*-1---1— -r- 0.4 0.6 0.8 1.0 1.2 1.4
Flow rate of chlorine (SLM)
0 2E+15 4E+15 6E+15 8E+15 1E+16
Density of chlorine (/cc)
Figure 5 The intensity of NC^b1^) emission
dependent on the flow rates of Cl2 Figure 6 The dependence of density of NCl(a!A)
on the density of Cl2
800-4
600-1
& I v
400 -I
200-4
He/Cl =17 Flowrate ofCl2:0.5SLM
~t-'-1-»-j-■-1---1-'-r 0 1 2 3 4 5
Flow rate of HN/SLM)
2500 n
2000-1
2“ 1500-
£
1 1000-
0'
0.0
■ a2 0.5-2.OSLM, HN31.0SLM, He 21 SLM
• Cl2 0.9SLM, HN3 0.7-1.6SLM. He 4.5SLM
A Cla 0.5SLM. HN3 0.2-0.7SLM, He 4.2SLM
“1-*-1-'-j—
1.0 1.5 2.0
HN3/Q2 ratio
2.5
Figure 7 The intensity of NC^b1!) emission Figure 8 The relationship of the emission intensity
dependent on the flow rate of HN3/He of NC^b1!) and the ratio of HN3/C12
Table 1 the optimum operating parameters for the present setup
HN3 flow rate (SLM) 0.25—0.35
Cl2 flow rate (SLM) 0.25—0.4
He flow rate (SLM) 11—14
Pressure (Pa) 1330
Diameter of the tube (cm) 2
Cl2 dissociation efficiency (%) 60—100
Linear velocity (m/s) 100
Proc. SPIE Vol. 4631 191

Invited Paper
A review of recent experiments and calculations relevant to the kinetics of the HF laser
Gerald C. Manke II* and Gordon D. Hager Air Force Research Laboratory
Directed Energy Directorate Kirtland AFB, NM 87117
ABSTRACT An abbreviated review of rate coefficients relevant to HF laser kinetics modeling is presented. The literature has been
surveyed from the last published review in 1983 to the present. Updated HF Einstein emission coefficients are tabulated. This brief summary of a more detailed review addresses rate coefficients relevant to HF generation, reactive quenching, self-relaxation, and vibrational relaxation by a selection of atoms and molecules. In addition, a review of recent experiments and theoretical calculations relevant to the role of rotational non-equilibrium in HF lasers is presented. A list of recommended temperature dependent expressions for critical reaction rate coefficients is given.
1. INTRODUCTION Since its invention in the mid-1960’s, the HF laser system has been extensively studied and developed to the point
where megawatt-class devices can be built. In fact, most of the research in the recent past has focused on large-scale laser technology demonstrations. Despite the enormous effort expended to accomplish this, a complete understanding of all facets of HF laser performance is still evolving and is not complete. For example, research continues into the role of reagent mixing and heat transfer between the fluids and the construction material of the device. Combustor instabilities and other complex, transient, fluid dynamical features also impede our understanding of the laser’s performance.
The only way to achieve insight into the details of the HF laser is to employ computational fluid dynamical (CFD) codes that can integrate the complex fluid properties with the myriad chemical reactions that occur in the laser cavity. Unfortunately (although perhaps not surprisingly considering the complexity of the problem), CFD codes have had limited success at accurately modeling real HF laser systems. As a result, both the laser performance data and the reaction rate constants used to baseline the models have come under increased scrutiny in recent years. This scrutiny has uncovered serious questions about the kinetics package that have yet to be answered conclusively. These questions include the importance of rotational nonequilibrium, the magnitude of various quenching processes, the role of three body and heterogeneous fluorine atom recombination, and other fundamental properties such as Einstein coefficients.
The main topics of this report (in order of their presentation) are Einstein coefficients and relevant kinetic measurements. It is not within the scope of this document to discuss fluid dynamics issues, such as recently developed 3 dimensional computational fluid dynamics (CFD) codes or new algorithms to model mixing or optical resonators.
2. EXPERIMENTS AND CALCULATIONS RELEVANT TO HF LASER MODELING 2.1 Einstein Coefficients
The Einstein coefficients used by most HF CFD codes are based on the values found in the Handbook of Chemical Lasersl(which are in turn, based on the empirical calculations of Herbelin and Emanuel2), and have not been updated in over 25 years. Table 1 gives a representative sample of the Handbook's HF vibration-rotational Einstein emission coefficients as well as the more recent (and preferred) results of Setser and co-workers3, see below. While the agreement is generally good for the first 3 vibrational levels, large differences are apparent as the vibrational quantum number increases. In 1991, Zemke4 and co-workers published a potential surface based on the spectroscopically determined potential of Coxon and Hajigeorgiou5, adjusted to reproduce the proper long-range behavior by including both dispersion and exchange effects6. In the same publication, Zemke and co-workers provided an ab initio dipole moment function that spanned the same range of internuclear distances as the complete potential energy curve. The resulting Einstein coefficients should be the most reliable theoretical values. Shortly after the publication of Zemke's results, Setser and co-workers produced an extensive set of vibration-rotational Einstein A coefficients for HF/DF and HC1/DC13. Their calculations used an RKR potential and the ab initio dipole moment function of Ogilvie7. Their results are in excellent agreement with Zemke.
192 Gas and Chemical Lasers and Intense Beam Applications III, Steven J. Davis, Michael C. Heaven,
Editors, Proceedings of SPIE Vol. 4631 (2002) ©2002 SPIE ■ 0277-786X702/$ 15.00

Considering the importance of the Einstein A coefficients in calculating the stimulated emission cross section and the gain, the most accurate values available should be employed. Unfortunately, Zemke and co-workers calculations were only for a limited number of rotational quantum numbers. We recommend that the HF CFD codes be updated with the results of Arunan, Setser, and Ogilvie3.
2.2 HF Kinetics Most modern day HF CFD codes have kinetics packages that are based on a 1976 Aerospace Corporation technical
report by N. Cohen & J. Bott8. This report and its 1977 supplement9 contained a thorough review of contemporary literature results up to 1977 and recommendations for rate constants related to the HF laser. An update was published 5 years later in 198210, and a few relevant reactions were reviewed again in 1983 by Cohen & Westberg11. Beyond these reports, there have only been a handful of critical evaluations of kinetic data relevant to the HF laser. A 1982 review article by Leone summarizes hydrogen halide vibrational energy transfer and contains rate coefficients relevant to the HF laser system12. In 1983, George Hart of the Naval Research Laboratory reviewed the pulsed DF chemical laser codes and the corresponding kinetic database13. Although his report was specifically for DF, it contains a wide variety of relevant and helpful evaluations for the HF laser. The following paragraphs summarize the most recent and reliable calculations and experiments relevant to HF generation and quenching. 2.2.7 HF Generation - H + F2 and F + H2
The generation of HF(v) in the HF laser can proceed via one of two reactions, H + F2 or F + H2, which have significantly different product vibrational distributions. The reaction of atomic hydrogen with molecular fluorine (often referred to as the "hot" HF generation reaction) produces highly vibrationally excited HF, while F + H2 (the "cold” HF generation reaction) produces only moderate vibrational excitation, see below. The vibrational distribution for H + F2 peaks at v = 6 and extends up to v =9. Table 3 summarizes the vibrational distributions recommended by the Cohen and Bott8-11 reviews as well as the measured distributions from a variety of experiments. Most experimental measurements, particularly those of Polanyi14, Jonathan15, and Tardy16 analyzed their data using Einstein coefficients that have since been shown to be inaccurate2,17,18. Hence, corrected distributions using the recommended set of A coefficients3 are shown in parentheses in Table 3.
In general, the available experimental results are in reasonable agreement for the HF(v) distribution. The only
uncertainty concerns the nascent population of v > 8. On the low end, the fast flow reactor studies of Setser19 and Kaufman20 found no Pg - Pjo, while on the high end the pressure-pulse chemiluminescence mapping experiments of Tardy16 found substantial populations for v = 8 - 9. The presence of at least some Pg - Pi0 is supported by the infrared chemiluminescence studies of Polanyi and Jonathan, who reported minor P8 - P10. The nascent vibrational populations from recent theoretical calculations21 are in satisfactory agreement with experiment but have slightly narrower distributions with small but nonzero population of v = 8 - 10.
Surprisingly, the Cohen and Bott reviews recommend no initial population of v = 0 - 2, even though all of the experimental measurements (most of which were available at the time) indicate small, but nonzero ?\ and P2. Clearly, some initial population of v = 1 - 2 is indicated by the experimental evidence, and in light of this, we recommend the distribution given in the final column of Table 2. This distribution attempts to encompass the general observation that v = 8 . - 9 is present but at lower populations than suggested by Tardy. The recommended values for v = i - 6 are simply the average and one standard deviation from the 5 experimental measurements. Recommendations for v = 0, v = 7 - 10 are estimates based on the experimental values and have significantly larger error bars (± 50 % or more). Our distribution is similar in shape to the DF(v) distribution generated by the D + F2 reaction16,22, which falls off rapidly beyond the peak at v = 9-10.
The total rate constant for H + F2 has not been firmly established. The 1982 Cohen & Bott review10 gives k(T) = 5.0 x 10"i5 T1,5exp(-845/T) cm3 molecule'1 s'1 and the 1983 Cohen & Westberg recommendation11 is essentially the same, 4.8 x Iq-15 ji.4 eXp(_667/T) cm3 molecules'1 s'\ In both cases, the recommended value was based on the experiments of Homann and co-workers23 and unpublished transition state theory calculations of Westberg and Cohen24. The 1981 Baulch kinetic25 database recommends k = 1.46 x 10'10 exp(-I210fT) cm3 molecule'1 s'1 for T = 290 - 570 K and points out that Homann's result is significantly smaller (approximately a factor of 2 at 300 K) than previous results by Rabideau26, Vasil’ev27, and Goldberg . A new measurement of the total H atom removal rate constant and the nascent HF distribution was performed recently by Heaven and co-workers29. They report k = 2.4 ± 0.4 (2a) x 10'12 cm3 molecule'1 s'1.
The F + H2 reaction is a prototypical system for fundamental reaction dynamics, and as such, has been a favorite subject for both theoretical and experimental state-to-state reactive scattering studies. The reaction is particularly amenable to molecular beam studies and vibrationally state resolved differential cross sections have been measured30 36.
Proc. SPIE Vol. 4631 193

Corresponding high level ab initio calculations and simulations37- 38 have achieved very good agreement with experiment. The vibrational distribution remains unchanged from the 1982 Cohen & Bott report10,0.00:0.15 :0.55 :0.30 for v = 0 - 3.
A recent review by Persky & Komweitz39 has refined the overall rate constant for the F + H2 reaction. Following a
detailed examination of relevant publications they recommend k(T) = 1.1 ± 0.1 x 10'10 exp(-(450 ± 50)/T) cm3 molecule'1 s'
1 over the 190 - 376 K temperature range, and 2.43 ± 0.15 x 10'" cm3 molecule'1 s'1 at 298 K. This compares reasonably well with literature reviews published in 1983*1 (k(T) = 4.5 x 10'12 T0,5 exp(-319/T) and k298 = 2.66 x 1011 cm3 molecule1 s '), 199240, and 199741 (k(T) = 1.4 x IO10 exp(-(500 ± 200)/T) and k298 = 2.6 ± 0.6 x 10 " cm3 molecule'1 s '), as well as the Cohen & Bott reviews of 19779 (k(T) = 2.7 x 10'10 exp(-805/T) and k298 = 1.8 x 10‘" cm3 molecule'1 s'1) and 198210 (k(T) = 4.32 x 10'12 T0'5 exp(-307/T) and k29g = 2.7 x 1011 cm3 molecule'1 s'1). The most recent review by the IUPAC Subcommittee on Gas Kinetic C>ata Evaluation for Atmospheric Chemistry42adopted the Persky recommendation39. Unfortunately, the limited temperature range of the Persky expression is problematic for HF laser modeling, since the laser typically operates at substantially higher temperatures. To date, there has been only one experiment that has measured k(F + H2) above 376 K. Heidner and co-workers43 monitored the time-resolved infrared emission of product HF following multi-photon dissociation of SF6 in the presence of H2 over the 295 - 765 K temperature range. The resulting Arrhenius
expression for k(F + H2) is 2.2 ± 0.4 x 10'10 exp(-(595 ± 50)/T) cm3 molecule'1 s ’, just 7 % smaller than Persky's at room temperature but 40% larger if Persky's expression is extrapolated to 765 K. Persky & Komweitz39 considered Heidner’s results "problematic with regard to the calculated kinetic isotope effect." Indeed, the Heidner experiment gave a temperature independent kinetic isotope effect while the accepted value is
kF+D, = 1.04 ± 0.02 exp((186 ± 5)/T).
39
[1]
for the 190 - 376 K In lieu of more data for T > 376, we recommend the conclusions of Persky and Komweitz temperature range and the expression of Heidner and co-workers43 for T > 376 K.
Some CFD codes44 include F atom reactions with vibrationally excited H2 even though this process was not included in the original Cohen and Bott compilations. There have been no specific experimental measurements to support or refute this assumption and we do not recommend inclusion of reactive processes that involve vibrationally hot H2. In any case, it is unlikely that inclusion of these reactions will have any effect on the overall performance of the laser because [H2(v > 0)]
should be extremely small. 2.2.2 Reactive Quenching
Vibrationally excited HF can be removed by hydrogen atoms by V-R,T inelastic collisions or by chemical reaction to give molecular hydrogen and an F atom:
H + HF(v) -> H2 + F. [2] In principle, microreversibility enables one to calculate the rate constant for [2] from the extensive data available for
the well-studied F + H2 reaction. In fact, numerous theoretical studies have attempted to do this using the F + H2 potential energy surface45"49. According to these calculations the barrier to F atom transfer is large, - 33 kcal mol*1, and reaction [2] should be slow for v < 350-52. This is consistent with the experimental results of Heidner and co-workers53*55 who measured HF(v) deactivation by H atoms directly using HF laser induced fluorescence, and the flow tube measurements of Kwok & Wilkins56. These experiments report a large change in the HF(v) removal rate constant for v = 1-2 vs. 3. This change is
generally attributed to the opening of the reactive channel for v > 3, However, according to Heidner54,55 only a fraction of the total H + HF(3) encounters that result in removal of HF(3) proceed via chemical reaction and the upper limit for reactive quenching, k(H + HF(3) -> H2 + F), is 5.0 x 10*u cm3 molecule1 s'1.
The 1981 Baulch kinetics database25 makes no recommendation for k2 because the experimental evidence available at the time was inconsistent with the data for the well established forward reaction, F + H2. While there have been no new experiments (for thermal collisions) since the work of Heidner and Bott53*55, the available theoretical calculations support
their slower reaction rate constants8,57.
2.2.3 HF Self-Relaxation One of the most active areas of HF kinetics research in the past 15 years has been in the study of HF self-relaxation and
vibrational energy transfer. The importance of these processes is acute because this is the dominant relaxation pathway in the HF laser. Unfortunately, a consensus regarding the magnitude of the rate constants had not been reached prior to 1982. For example, the 1977 Cohen and Bott9 compilation contains moderate to large rate constants for single- and multi¬ quantum V-R,T deactivation of HF by ground state HF
HF(v) + HF HF(v’) + HF, [3]
194 Proc. SP1E Vol. 4631

while the 1982 Cohen and Bott package10 includes only single quantum deactivations. Significant differences also exist for the HF V-V energy transfer reactions such as
HF(v) + HF(0) 4 HF(v-l) + HF(1). [4] Implicitly included in reaction [3] are the V-R redistribution processes that produce highly rotationally excited HF:
HF(v, J) + HF -> HF(v-l, T > 10) + HF. [5] As will be discussed in detail below, this quenching process is of special interest because it has the potential to contribute significantly to rotational nonequilibrium.
Shortly after the publication of the 1982 review10, the Crim group at the University of Wisconsin58'62 and the Kaufman group at the University of Pittsburgh20,63-66 undertook a major effort to characterize the total self-relaxation rate constants and the mechanism for HF self^relaxation. Crim's group used a double resonance type of experiment where the vibrationally excited HF molecules were prepared in discrete ro-vibrational states by a pulsed laser. The time resolved fluorescence and/or Av = 1 absorption signals were analyzed to determine total quenching rates and relaxation mechanisms. Kaufman, on the other hand, prepared vibrationally excited HF in a flow reactor where dilute flows of H or F atoms (generated by a microwave discharge) were reacted with a variety of F or H atom donors. The IR emission was collected with an InSb detector and circularly variable filter. A modified Stem-Volmer analysis was applied to the quenching data. Table 3 compares the experimentally determined rate constants for HF self-relaxation with a variety of other experiments67' 78, relevant calculations79'83, and the standard kinetics packages8'11. The agreement for v = 1-7 is, in general, excellent and k3 is well established. The experimental relaxation rates scale as v2'9 and are independent of the initial rotational quantum number.
In addition to total quenching rate constants, the Crim and Kaufman laboratories also determined the relaxation mechanism. Kaufman's group argued strongly for a V-T,R mechanism (rather than V-V energy transfer) based on Lambert-Salter plots20,63-66 and the magnitude of the rate constants. In particular, they pointed out that if the predominant mechanism were V-V energy transfer, (eg. HF(7) + HF(0) -> HF(6) + HF(1)) then the rate constant for the exothermic reverse process would be 100 times greater than the gas kinetic limit. Crim's double resonance experiments were able to quantify the role of V-V energy transfer. They found that the fraction of inelastic HF(v) + HF(0) room temperature encounters thatproceed via V-T,R relaxation, is 1.0, 0.41 ± 0.10,0.56 ± 0.05,0.84 ± 0.05, and 0.98 ± 0.19 for v = 1 - 5, respectively59, ’62. For v > 3, vibrational energy transfer to the ground state collision partner plays a relatively minor role in the relaxation process. Both Crim and Kaufman agree that multi-quantum relaxation is unimportant62,63 even though work by Pimentel and Thompson (see below) suggested the possibility of multi-quantum V-R transfer with Av as large as 5. Crim probed the role of multi-quantum deactivations directly and found that 0.98 ± 0.19 and 0.87 ± 0.21 of the relaxed HF(4) and HF(5) molecules, respectively, appear in the next lower vibrational level62. It is important to note that Crim and co-workers' results are based on the assumption that V-T,R processes that produce metastable high rotational states (which would not be detected in their experiment) can be neglected. The invariance of the vibrational relaxation rate constant with initial rotational quantum number and the work of Leone (see below) tend to validate this assumption.
Finally, Crim and co-workers found that the rate constants for HF self-relaxation are inversely dependent on temperature59,61. Crim and co-workers interpret their temperature dependent data in terms of relaxation probabilities. The functional form of the fitting function suggests that long-range forces dominate the relaxation process:
Pv(T) = AT~m [6]
where Pv = kjkc (kc is the gas kinetic rate constant for a collision diameter of 0.25 nm) and A and m are fitting parameters. Strangely, the A values determined by our fits (where m = 1.3 was fixed) vary significantly from Crim's analysis61: A(Crim) = 22, 370, 880, and 1850 for v = 1, 3,4, and 5 respectively, while A(this work) = 12, 315, 764, and 1610 for the same v levels. Nonetheless, considering the overall agreement in the literature for v = 1 - 7 and the accuracy of double resonance technique, we recommend Crim's HF self-quenching rate constants61. The temperature dependence of v > 6 has not been measured. If the temperature dependence found for v = 1 - 5 (i.e. kv = Pv*kc = kc*A*T1’3) is applied, then A(6) = 3107 and A(7) = 4339 are calculated from the measured room temperature values20.
2.2.4 HF Relaxation and V-V Energy Transfer with H2 There have been several studies of HF(v) relaxation by a variety of molecular quenchers. Table 4 summarizes the
results for Q = H2, which are the most relevant to HF laser kinetics20,7I*75,84’87. With the exception of the work by Poole and Smith75, the agreement for the total quenching rate constants is good for v = 3 - 5. The mechanism for the quenching is generally believed to be V-T,R for v = 3 - 5 for two important reasons. First, V-V energy transfer from HF(v) to H2 is endothermic for all single vibrational quantum changes in HF:
Proc. SPIE Vol. 4631 195

HF(v) + H2(0) + AE > 200 cm'1-* HF(v-l) + H2(l) [7] In fact, due to the anhamonicity of HF, the energy gap between HF(Av = -1) and H2(0-I) increases with vibrational
quantum number (AEV-v = -198 cm'1 for HF(1) and -1171 cm'1 for HF(7)). Secondly, if the endothermic V-V process were the dominant mechanism, then the exothermic reverse process
HF(v-1) + H2(1)-»HF(v) + H2(0) [8] would be several times larger than the gas kinetic limit. Only for HF(1) does a V-V process seem possible, and indeed, vibrational energy transfer is the most likely mechanism for v = 1. For v > 1, however, the V-TJR process
HF(v) + H2-»HF(v-1) +H2 [9] should be the dominant mechanism.
The 1982 Cohen and Bott review10 contains temperature and vibration dependent expressions for reactions [13] and [15] even though there is no convincing evidence for a temperature dependent quenching process85.
k-j(ref. 1 l)=2.4xl010 v0'35 7-0'5 cm3mo/_15_1 [10]
lcq(refAl) = v2-7(o.6xl012r_1 +1.0cl04r2-28)cmW“1s"1 [11]
For example, in 1973 Cohen & Bott measured the temperature dependence71 (T = 295,450 - 1000 K), of HF(1) deactivation by H2and found that the total deactivation (k7 +k9) rate was independent of temperature (see Figure 4 of ref71). A year later Bott re-measured the temperature dependent quenching of HF(1) from 440 - 690 K and the data showed considerable scatter and only a weak temperature dependence84. Finally, in 1980 Bott and Heidner measured HF(1) and HF(3) quenching by H2 at 295 and 200 K and found deactivation rate coefficients that were constant vs. T within their experimental error85. Clearly, there is not sufficient evidence to support a T dependent quenching rate constant.
Cohen & Bott’s expression9 for k9 significantly underestimates the measured values at room temperature, see Table 4.
In fact, the 1982 package10 eliminates the energy transfer reactions from H2(2) and H2(3) as well as the Av > 1 exchanges contained in the 1977 Cohen and Bott package because there is no specific experimental justification for them. We recommend the rate constant values listed in Table 4 for the V-T,R quenching of HF by H2 and assign a T° temperature dependence. The HF(v) + H2(v') V-V energy transfer reactions (reaction [8]) are calculated from detailed balance.
2*3 Rotational Non-equilibrium The question of rotational non-equilibrium for the HF laser system has been the subject of considerable controversy for
many years88,89. The presence of rotational non-equilibrium in the HF laser was first suggested by pulse initiated HF laser experiments by Pimentel and co-workers90*93 which generated lasing on HF rotational transitions with J as high as 33 in the v = 1 manifold and J = 29 in the v = 0 manifold. The observation of rotational laser emission is an extremely sensitive method for studying rotational occupancies because the population inversions needed to produce the laser emission are 100 times lower than for ro-vibrational transitions93. Pimentel's analysis of the transient behavior of the laser emission suggested that collisional V-T,R energy transfer reactions that populate the high rotational states were responsible for the observed positive gain, rather than direct pumping by the initiating reaction. A remarkably similar phenomenon was observed by Robinson and co-workers in their work with HF94, OH95, and NH%. Further experimental observations of emission from high J states following HF(v) quenching by CO, C02, and HCN97*98 as well as quasiclassical trajectory calculations99,100 also support the assertion that high rotational states are produced in the V-T,R relaxation process.
The evidence is clear that the principal HF(v) relaxation mechanism in the HF laser environment is HF self-relaxation, and that the relaxation proceeds via V-T,R energy transfer. There are two important questions, however, that remain:
1) What are the specific products of the V-T,R process? Figure 1 summarizes the possible relaxation / energy transfer routes for HF(v = 2). The possible mechanisms include "true" V-T,R relaxation (the solid arrow) where the loss of a vibrational quantum results in some small amount of rotational and translational energy transfer to the HF(v = 0) quencher or near-resonant V-R redistribution(the broken arrows), where the quenched HF molecule relaxes to a lower vibrational state with a high rotational quantum number and very little energy is transferred to the quencher.
2) Are the high-J HF molecules produced by the self -relaxation process MmetastableM? In general, rotational relaxation rate constants (k ~ 10*10 - 10*9 cm3 molecule*1 s*1) are 10 - 100 times larger than vibrational deactivation rate constants (k ~ 10*12 - 10’10 cm3 molecule*1 s*1). However, because the separation between HF rotational levels is large, it is possible that
kR.R,T = ky-R.T for sufficiently high J levels. If so, the vibrational relaxation process could significantly perturb the equilibrium rotational distribution and considerable errors could be realized when attempting to model real HF laser devices. 2.3.1 Relevant Experimental Studies
As was discussed above, the self-relaxation measurements of Crim62, Kaufman63, and Moore77 all concluded that multi¬ quantum deactivations were not important. In particular, Crim determined that 0.98 ± 0.19 and 0.87 ± 0.21 of the relaxed
196 Proc. SP1E Vol. 4631
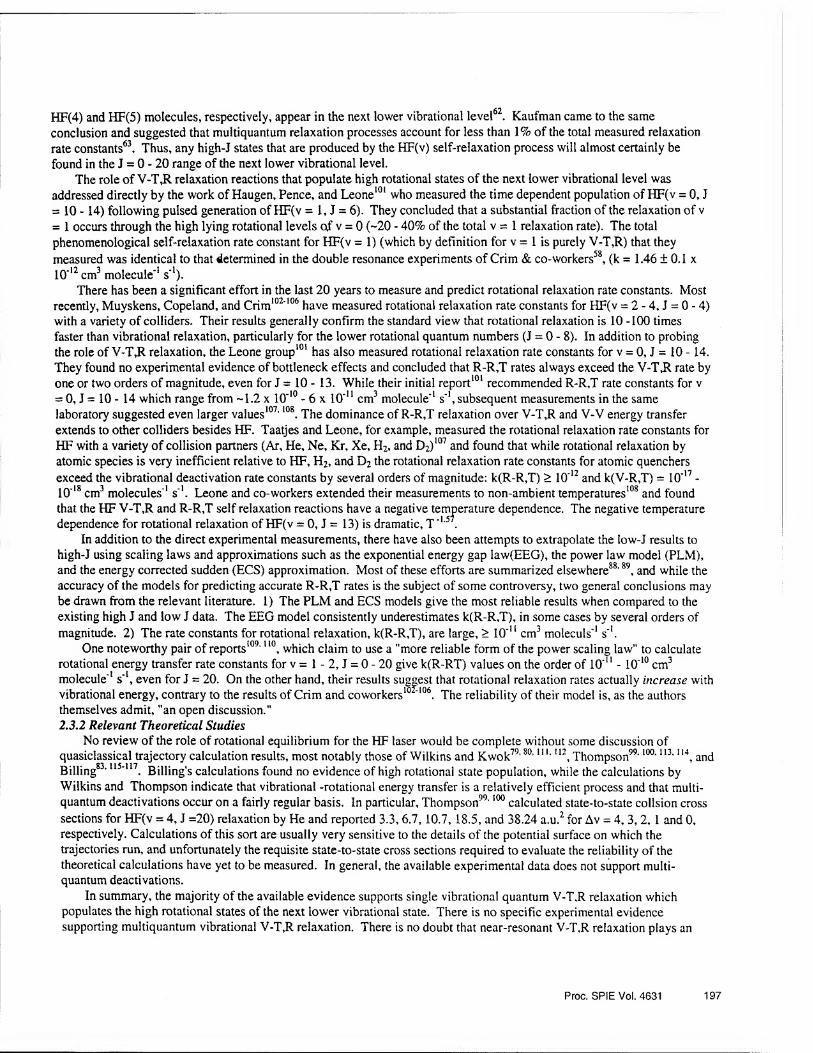
HF(4) and HF(5) molecules, respectively, appear in the next lower vibrational level62. Kaufman came to the same conclusion and suggested that multiquantum relaxation processes account for less than 1% of the total measured relaxation rate constants63. Thus, any high-J states that are produced by the HF(v) self-relaxation process will almost certainly be found in the J = 0 - 20 range of the next lower vibrational level.
The role of V-TJR. relaxation reactions that populate high rotational states of the next lower vibrational level was addressed directly by the work of Haugen, Pence, and Leone101 who measured the time dependent population of HF(v = 0, J = 10 -14) following pulsed generation of HF(v = 1, J = 6). They concluded that a substantial fraction of the relaxation of v = 1 occurs through the high lying rotational levels of v = 0 (-20 - 40% of the total v = 1 relaxation rate). The total phenomenological self-relaxation rate constant for HF(v = 1) (which by definition for v = 1 is purely V-T,R) that they
measured was identical to that determined in the double resonance experiments of Crim & co-workers58, (k = 1.46 ± 0.1 x 10*12 cm3 molecule*1 s’1).
There has been a significant effort in the last 20 years to measure and predict rotational relaxation rate constants. Most recently, Muyskens, Copeland, and Crim102 106 have measured rotational relaxation rate constants for HF(v = 2 - 4, J = 0 - 4) with a variety of colliders. Their results generally confirm the standard view that rotational relaxation is 10 -100 times faster than vibrational relaxation, particularly for the lower rotational quantum numbers (J = 0 - 8). In addition to probing the role of V-T,R relaxation, the Leone group101 has also measured rotational relaxation rate constants for v = 0, J = 10 -14. They found no experimental evidence of bottleneck effects and concluded that R-R,T rates always exceed the V-T»R rate by one or two orders of magnitude, even for J = 10 - 13. While their initial report101 recommended R-R,T rate constants for v ss 0, J = 10 - 14 which range from -1.2 x 10*10 - 6 x 10*11 cm3 molecule*1 s*1, subsequent measurements in the same laboratory suggested even larger values107,108. The dominance of R-R,T relaxation over V-TJR and V-V energy transfer extends to other colliders besides HF. Taatjes and Leone, for example, measured the rotational relaxation rate constants for HF with a variety of collision partners (Ar, He, Ne, Kr, Xe, H2, and D2)107 and found that while rotational relaxation by atomic species is very inefficient relative to HF, H2, and D2 the rotational relaxation rate constants for atomic quenchers exceed the vibrational deactivation rate constants by several orders of magnitude: k(R-R,T) > 10‘12 and k(V-R,T) = 10*17 - 10*18 cm3 molecules*1 s*1. Leone and co-workers extended their measurements to non-ambient temperatures108 and found that the HF V-T,R and R-R,T self relaxation reactions have a negative temperature dependence. The negative temperature dependence for rotational relaxation of HF(v = 0, J = 13) is dramatic, T 15 .
In addition to the direct experimental measurements, there have also been attempts to extrapolate the low-J results to high-J using scaling laws and approximations such as the exponential energy gap law(EEG), the power law model (PLM), and the energy corrected sudden (ECS) approximation. Most of these efforts are summarized elsewhere88,89, and while the accuracy of the models for predicting accurate R-R,T rates is the subject of some controversy, two general conclusions may be drawn from the relevant literature. 1) The PLM and ECS models give the most reliable results when compared to the existing high J and low J data. The EEG model consistently underestimates k(R-R,T), in some cases by several orders of magnitude. 2) The rate constants for rotational relaxation, k(R-R,T), are large, > 10'11 cm3 moleculs’1 s*1.
One noteworthy pair of reports109, uo, which claim to use a "more reliable form of the power scaling law" to calculate rotational energy transfer rate constants for v = 1 - 2, J = 0 - 20 give k(R-RT) values on the order of 10*11 - 10*10 cm3 molecule*1 s‘l, even for J = 20. On the other hand, their results suggest that rotational relaxation rates actually increase with vibrational energy, contrary to the results of Crim and coworkers10 *106. The reliability of their model is, as the authors themselves admit, "an open discussion." 2.3,2 Relevant Theoretical Studies
No review of the role of rotational equilibrium for the HF laser would be complete without some discussion of quasiclassical trajectory calculation results, most notably those of Wilkins and Kwok79,80, m*112, Thompson99,100,113, n\ and Billing83, l15'117. Billing’s calculations found no evidence of high rotational state population, while the calculations by Wilkins and Thompson indicate that vibrational -rotational energy transfer is a relatively efficient process and that multi¬ quantum deactivations occur on a fairly regular basis. In particular, Thompson99,100 calculated state-to-state collsion cross sections for HF(v = 4, J =20) relaxation by He and reported 3.3, 6.7, 10.7, 18.5, and 38.24 a.u.2 for Av = 4, 3, 2, 1 and 0, respectively. Calculations of this sort are usually very sensitive to the details of the potential surface on which the trajectories run, and unfortunately the requisite state-to-state cross sections required to evaluate the reliability of the theoretical calculations have yet to be measured. In general, the available experimental data does not support multi¬ quantum deactivations.
In summary, the majority of the available evidence supports single vibrational quantum V-T,R relaxation which populates the high rotational states of the next lower vibrational state. There is no specific experimental evidence supporting multiquantum vibrational V-T,R relaxation. There is no doubt that near-resonant V-T,R relaxation plays an
Proc. SP1E Vol. 4631 197

important role in the HF chemical laser system and successful quantitative modeling depends on its inclusion. However, the available experimental evidence clearly shows that k(V-TJR)« k(R-R,T), and in light of this, it is doubtful that high J states can act as "reservoirs" for near-resonant lasing levels. It seems more likely that the V-T.R process simply reduces the gain of the (1-0) and (2-1) transitions by reducing the population of the upper state while simultaneously increasing the
population of the lower state. 3. CONCLUSIONS
Table 5 summarizes the recommendations of this report. Overall, many of the expressions found in the 1982 review by Cohen & Bott10 remain valid today, in particular, the elimination of multi-quantum deactivation reactions that were a key feature of the 1977 kinetics package. These kinds of relaxation processes have been demonstrated to be very slow and can be safely neglected. Other areqf of agreement include the total HF generation rate constants and the relaxation rate constants for collisions with molecular and atomic quenchers. A new measurement of the H atom removal rate constant for
the "hot" reaction, H + F2, would be particularly useful. The major changes that we suggest occur in the Einstein coefficients, HF self-relaxation, and the nascent distribution
for H + F2. While in many cases these changes are minor, they may ultimately have significant effects to CFD calculation
results due to enormous complexity of the HF laser system. Clearly, there are some aspects of the HF kinetics package that should be re-examined experimentally. For example, in
the case of HF(v) + F, H, Ar, and He, the recommended expressions are based on only a handful of measurements at a narrow range of temperatures. While the role of multi-quantum deactivations is very small according to the available experimental data, some believe44 that the v19 scaling law for the HF self-relaxation process may be indicative of open multi-quantum deactivation relaxation pathways, particularly for high v. Direct measurements for the Treanor pumping (reaction [14]) rate constants are also needed, particularly for HF(v > 1) + HF(v > 1), for which no data currently exists. Clarification of these issues would undoubtedly significantly enhance our understanding of the HF laser.
4. ACKNOWLEDGMENTS GCM wishes to acknowledge the National Research Council for support. The authors are grateful for productive
discussions with S. R. Leone, F. F. Crim, M. C. Heaven, M. H. Alexander, M. A. Kwok, D. Lyman, and D. W. Setser, as well as helpful comments from the reviewers.
198 Proc. SPIE Vol. 4631


Table 2: Experimentally determined nascent vibrational distributions for H + F2
CFD Kinetics Experimental Measurements'
0 0.00 0.00 <0.04 (<0.03) <0.10 (<0.08) 0.00 (0.00) 0.00 0.00 0.04 ± 0.04
1 0.00 0.00 0.09 (0.06) 0.12(0.07) 0.15 (0.14) 0.07 0.06 0.08 1 0.03
2 0.00 0.00 0.11(0.08) 0.13(0.10) 0.13(0.12) 0.17 0.12 0.13 ±0.03
3 0.18 0.21 0.13 (0.10) 0.25 (0.20) 0.27 (0.26) 0.28 0.17 0.2010.07
4 0.30 0.39 0.45 (0.36) 0.35 (0.30) 0.41 (0.40) 0.59 0.37 0.40 ±0.11
5 0.80 0.70 0.89 (0.83) 0.78 (0.70) 0.72 (0.70) 0.93 0.76 0.7810.10
6 1.00 1.00 1.00(1.00) 1.00(1.00) 1.00(1.00) 1.00 1.00 1.00
7 0.00 0.45 0.45 (0.43) 0.40 (0.48) 0.76 (0.80) 0.52 0.62 0.5010.25
8 0.00 0.36 0.20(0.19) 0.26 (0.37) 0.46 (0.49) 0.00 0.00 0.3010.15
9 0.00 0.00 <0.04 (<0.01) 0.16(0.12) 0.41 (0.43) 0.00 0.00 0.1510.15
10 0.00 0.00 <0.04 (<0.01) 0.00 (0.00) 0.00 (0.00) 0.00 0.00 0.0110.01
a The values in parentheses for Jonathan, Polanyi and Tardy are corrected for the Einstein coefficients of Setser3. b The corrected values shown were calculated from the distributions reported by Kaufman20 which were corrected for
the Einstein coefficients of Sileo & Cool118. c Tardy16 originally used the Einstein coefficients of Meredith and Smith17. d See text for details
200 Proc. SPIE Vol. 4631

Table 3: HF total self relaxation rate constants Reference k3oo(HF(v) + HF) products, (10*1Z cm'5 molecules'1 s'1)
v = 1 v = 2 v = 3 v = 4 v = 5 v = 6 WB3MI Experiments 1
Bott & Cohen'1 1.8 ±0.3
Hinchen & Hobbs69 1.8 ±0.2
Bina & Jones70 2.3 ±0.3 5 ± 2
Kwok & Wilkins72 1.6 ±0.6 16 ±5 26 ±9 27 ±10 (58)a (loiy
Osgood, et al.76 1.7 25 ±7 49 ± 15 43 ± 18
Airey & Smith73 16 17 >44 >65
Poole & Smith74’75 13 19 32 46 52 -43 77 Douglas & Moore 28 ±4 72 ±5
Lampert et al.78 32 ±6 88 ±11 wr - 20,63-66 Kaufman 1.8 19 31 73 140 290 450
Copeland, et al. 1.46 ±0.1 19.8 ± 1.0
Jursich & Crim62 30.2 ± 3.0 72.8 ± 2.7 151 ±8
Calculations |
Wilkins & Kwok/y’80 1.7 22 29 33 42 51
Coltrin & Marcus81,82 0.2 ±0.1 19 ±3 28 ±4 53 ±10 69 ± 10 156 ±11 455 ±49
Billing & Poulsen83 0.81 6.2 ±2.2 10 ±4 19 ±7 27 ±10 43 ± 15 82 ±29
Standard Kinetics Packages5 1 Cohen & Bott 1977* ■SUB 6.62 9.94 4.97 16.6 23.2 82.8
Cohen & Bott 198210 ■£9 10.0 28.8 60.9 108.8 174.7 260.9
1 1M. A. Kwok and N. Cohen, personal communication reported in M. j b only single quantum deactivation rate constants are listed.
Table 4: Room Temperature Quenching Rate Constants for HF + H2 Reference k100(HF(v) + H2-> HF(v-l) + H2 (10'u cm5 molecules1 s1)
v = l v = 2 v = 3 v = 4 v = 5 v = 6 v = 7
Bott & Cohen7*’84 Poole & Smith75
86 Douglas and Moore Bott & Heidner85
Kaufman20 87 Jursich, et al.
0.52 ± 0.03 0.21 0.15 0.21 0.49 0.99 1.6
0.31 ±.06 0.47 ±.12 0.52 ±0.05 0.35 ±.04
1.7 ±0.5 3.5 ±1 9.1 ±2.7 0.38 ± 0.25 0.67 ± 0.10 1.64 ± 0.19
KSGKESSiflHi 0.01 0.07 0.21 0.45 0.83 1.35
Recommended 0.52 ± 0.04 0.20 ± 0.04 0.35 ±0.04 0.50 ±0.2 1.6 ±0.3 3.5 ±1 9.1 ±2.7
Proc. SPIE Vol. 4631 201

Tab
le 5
: R
ecom
men
ded
Rat
e C
onst
ants
for
the
HF
las
er s
yst
em
^ O f 00 1 ^ cn o n p © © o O O n n n n ii
y—N y-’v CO N VO
✓ v v \ cS '•*—y CD 00 bo oo 00
8* id <N CN QO v} o cs P © © o © ©
It.
§ s s § 00 00 'oo 'do &0
u-i to o o ll II in
y^N y—S •«!
9.-. „ tO 'O 'w' y y—s 00 00 OJ tn II s 6 S' 60
II sd Q 00
O o ^ > <N H cn II II || II
\*> "h 'to p5o5fe =
< < <
+1 +| ro o t" 1
II ^ e S H < EC ^5
s
.2 co o so 2 a • f*- _ 3 O * * qov ^ a 1
W T o H ° " +i +' H _ cs
’« « -i H r? 2
1 ® o b fa u
7 -* x x * ° 2 "" b > *t * O Al -
II G- -* ° ^ II r. z *
! ^ r
\ I-* 2 2 » i oa ao
Mg 8 o 8 b c*~> —1 m —* « * X « - X VO ov to
II (N || ^ > >
X + N
a: s ^ a + £
£"" fa >t X
B Is <t V
r* fS B B + +
y—s y—s > >
'w' v fa fa S X
202 Proc. SPIE Vol. 4631

Figure 1: Detailed V-T»R relaxation pathways. The distinction between "true" V-T,R energy transfer and V-R redistribution is shown by the solid and broken lines, respectively. Numerous combinations of HF(1, J) and HF(0, J) states can be populated by HF V-T,R energy transfer. Because of the presence of near-resonant energy levels in v = 1 and 0, V-R redistribution can populate high rotational states of v = 0 and 1. For example, the near resonant V-R redistribution pathways shown in the figure have energy defects of -46.9, 519.6, and 273.7 cm'1, for relaxation to (1,15), (1,14) and (0,20), respectively. On the other hand, if HF(2, 6) is relaxed to HF(1, 6) by HF(0, J), up to 8 quanta of rotational energy can be transferred to the HF(v = 0) molecule.
5. REFERENCES 1. G. Emanuel, ’’Numerical Modeling of Chemical Lasers", John Wiley & Sons, New York, 1976. 2. J. M. Herbelin and G. Emanuel, "Einstein coefficients for diatomic molecules", J. Chem. Phys., 60, 689 - 696, 1974. 3. E. Arunan, D. W. Setser and J. F. Ogilvie, "Vibration-rotational Einstein coefficients for HF/DF and HC1/DC1", 7.
Chem. Phys., 97, 1734 - 1741,1992. 4. W. T. Zemke, W. C. Stwalley, S. R. Langhoff, G. L. Valderrama and M. J. Berry, "Radiative transition probabilities
for all vibrational levels in the X1S+ state of HF", J. Chem. Phys., 95,7846 - 7853, 1991. 5. J. A. Coxon and P. G. Hajigeorgiou, "Isotopic dependence of Bom-Oppenheimer breakdown effects in diatomic
hydrides: The B1S+ and X1S+ states of HF and DF", J. Mol. Spectrosc., 142, 254 - 278, 1990. 6. W. T. Zemke, W. C. Stwalley, J. A. Coxon and P. G. Hajigeorgiou, "Improved potential energy curves and
dissociation energies for HF, DF, and TF", Chem. Phys. Lett., Ill, 412 - 418, 1991. 7. J. F. Ogilvie, "The electric dipole moment function of HF", J. Phys. B, 21, 1663 - 1674, 1988. 8. N. Cohen and J. F. Bott, "A Review of Rate Coefficients in the H2-F2 Chemical Laser System", SAMSO-TR-76-
82, 1976. 9. N. Cohen, "A Review of Rate Coefficients in the H2-F2 Chemical Laser System - Supplement (1977)", SAMSO-
TR-78-41, 1978. 10. N. Cohen and J. F. Bott, "Review of Rate Data for Reactions of Interest in HF and DF Lasers", SD-TR-82-86,
1982. 11. N. Cohen and K. R. Westberg, "Chemical Kinetic Data Sheets for High Temperature Chemical Reactions", J.
Phys. Chem. Ref. Data, 12, 531-590, 1983. 12. S. R. Leone, "Rate coefficients for vibrational energy transfer involving the hydrogen halides", J. Phys. Chem. Ref.
Data, 11,953 -996, 1982.
Proc. SPIE Vol. 4631 203
13. G. A. Hart Jr., "DF Pulsed Chemical Laser Rotational Nonequilibrium Computer Model (PULSDF) and Data
Base”, NRL Memorandum Report 5051,1983. 14. J. C. Polanyi and J. J. Sloan, "Energy distribution among reaction products. VII. H + F2", J. Chem. Phys., 57,4988
-4998,1972. 15. N. Jonathan, S. Okuda and D. Timlin, "Initial vibrational energy distributions determined by infra-red
chemiluminescence”, Mol. Phys., 24,1143-1164,1972. 16. D. C. Tardy and L. L. Feezel, "Chemiluminescence mapping: Pressure-pulse results for H(D) + F2 --> HF(DF) +
F", Chem. Phys., 119, 89 - 93, 1988. 17. R. E. Meredith and F. G. Smith, "Computation of Electric Dipole Matrix Elements for Hydrogen Fluoride", J.
Quant. Spectrosc. Radiat. Transfer, 13, 89-114, 1973. 18. J. K. Cashion, J. Chem. Phys., 39, 1872, 1963. 19. J. P. Sung, R. J. Malins and D. W. Setser, "Comparison of rate Constants for reactions of hydrogen atoms with
chlorine, fluorine, iodine chloride, and chlorine fluoride", J. Phys. Chem., 83, 1007 - 1013,1979. 20. L. S. Dzelzkalns and F. Kaufman, "Vibrational relaxation of highly excited diatomics. III. HF(v = 5,6,7) + H2,
D2, N2, HF, C02, N20, CH4, and C2H6", J. Chem. Phys., 77,3508 - 3515,1982. 21. X. Gimenez, J. M. Lucas, A. Aguilar and A. Lagana, "Calculated versus measured vibrational state specific
reactivity of H + F2", J. Phys. Chem., 97,1993. 22. S. Bittenson, D. C. Tardy and J. Wanna, "Chemiluminescence mapping. I. Experimental method and initial
measurements on the D + F2 and F + D2 reactions", Chem. Phys., 58, 313-323, 1981. 23. K. H. Homann, H. Schweinfurth and J. Wamatz, "Rate measurements for the reaction of H atoms with F2", Ber.
Bunsenges. Phys. Chem., 81,724 - 728, 1977. 24. N. Cohen, note that Refs 10 and 12 list numerous references to " Westberg and Cohen, Int. J. Chem. Kinet. (to be
published)." According to a private communication with N. Cohen (The Aerospace Corp., retired) these transition state theory calculations were, in fact, never published.
25. D. L. Baulch, J. Duxbury, S. J. Grant and D. C. Montague, "Homogeneous gas phase reactions of halogen- and cyanide- containing species", J. Phys. Chem. Ref. Data, 10, 1981.
26. S. W. Rabideau, H. G. Hecht and W. B. Lewis, "A study of the kinetics of the reaction between H2 and F2 by EPR methods", J. Magn. Resonance, 6, 384, 1972.
27. G. K. Vasil'ev, E. F. Makarov and Y. A. Chernyshev, "Measurement of the chain propogation and termination rate constants for the reaction F2 + H2(D2) inhibited by 02", Kinetics and Catalysis, 16,272 - 275, 1975.
28. I. B. Goldberg and G. R. Schneider, "Kinetic study of the reaction of H with H2 and CF3H by ESR methods", J.
Chem. Phys., 65, 147 - 153, 1976. 29. J. Han, M. C. Heaven and G. C. Manke II, "Hydrogen Atom Reactions with Molecular Halogens: The Rate
Constants for H + F2 and H + C12 at 298K", J. Phys. Chem. A, submitted, 2002. 30. D. M. Neumark, A. M. Wodtke, G. N. Robinson, C. C. Hayden, K Shobatake, R. K. Sparks, T. P. Schafer and Y.
T. Lee, "Molecular beam studies of the F + D2 and F + HD reactions", J. Chem. Phys., 82, 3067 - 3077, 1985. 31. D. M. Neumark, A. M. Wodtke, G. N. Robinson, C. C. Hayden and Y. T. Lee, "Molecular beam studies of the F +
H2 reaction", J. Chem. Phys., 82, 3045 - 3066, 1985. 32. F. Dong, S. H. Lee and K. Liu, "Reactive excitation functions for F + p-H2/n-H2/D2 and the vibrational branching
for F + HD", J. Chem. Phys., 113,3633 - 3640,2000. 33. W. B. Chapman, B. W. Blackmon and D. J. Nesbitt, "State-to-state reactive scattering of F + H2 in supersonic jets:
Nascent rovibrational HF(v,J) distribution via direct IR laser absorption", J. Chem. Phys., 107, 8193 - 8196, 1997. 34. S. A. Nizkorodov, W. W. Harper, W. B. Chapman, B. W. Blackmon and D. J. Nesbitt, "Energy-dependent cross
sections and nonadiabatic reaction dynamics in F(2P3/2,2P1/2) + n-H2 —> HF(v,J) + H", J. Chem. Phys., Ill, 8404 - 8416,
1999. 35. M. Faubel, L. Y. Rusin, S. Schlemmer, F. Sondermann, U. Tappe and J. P. Toennies, J. Chem. Soc. Faraday
Trans., 89, 1475, 1993. 36. M. Faubel, L. Y. Rusin, S. Schlemmer, F. Sondermann, U. Tappe and J. P. Toennies, J. Chem. Phys., 101,2106,
1994. 37. F. J. Aoiz, L. Banares, B. Martinez-Haya, J. F. Castillo, D. E. Manolopoulos, K. Stark and H. J. Werner, "Ab initio
simulation of molecular beam experiments for the F + H2 —> HF + H reaction", J. Phys. Chem. A, 101, 6403 - 6414,1997. 38. V. M. Azriel, G. D. Billing, L. Yu. Rusin and M. B. Sevryuk, "A test of the semiclassical Wigner method for the
reaction F+ H2 -> H + HF", Chem. Phys., 195,243 - 258,1995.
204 Proc. SPIE Vol. 4631

39. A. Persky and H. Komweitz, "The kinetics of the Reaction F + H2 --> HF + H. A critical review of literature data", Int. J. Chem. Kinet., 29,67 - 71,1997.
40. R. Atkinson, D. L. Baulch, R. A. Cox, Jr. R. F. Hampson, J. A. Kerr, M J. Rossi and J. Troe, J. Phys. Chem. Ref. Data, 21,1125,1992.
41. R. Atkinson, D. L. Baulch, R. A. Cox, Jr. R. F. Hampson, J. A. Kerr, M J. Rossi and J. Troe, J. Phys. Chem. Ref. Dam, 26,521,1997.
42. R. Atkinson, D. L. Baulch, R. A. Cox, Jr. R. F. Hampson, J. A. Kerr, M J. Rossi and J. Troe, "Evaluated kinetic and photochemical data for atmospheric chemistry: Supplement VIII, Halogen species. IUPAC subcommittee on gas kinetic data evaluation for atmospheric chemistry", J. Phys. Chem. Ref. Data, 29, 167 - 266,2000.
43. R. F. Heidner m, J. F.Bott, C. E. Gardner and J. E. Melzer, "Absolute rate coefficients for F + H2 and F + D2 at T = 295 - 765", J. Chem. Phys., 72,4815 - 4820,1980.
44. M. A. Kwok, private communication, 2000 45. D. L. Thompson, "Monte Carlo classical trajectory calculation of te rates of H- and D- Atom vibrational relaxation
of HF and DF", J. Chem. Phys., 57,4170 - 4173,1972. 46. R. L. Wilkins, "Monte Carlo calculations of reaction rates and energy distribution among reaction products. II. H
+ HF(v) -> H2(v') + F and H + HF(v) ~> HF(v') + H*", J. Chem. Phys., 47,3038 - 3046, 1973. 47. M. Baer, "A coplanar quantum mechanical study of the exchange reaction HF + H", J. Chem. Phys., 65,493 - 495,
1976. 48. G. C. Schatz and A. Kuppermann, "Vibrational deactivation on chemically reactive potential surfaces: An exact
quantum study of a low barrier collinear model of H + FH, D + FD, H + FD, and D + FH", J. Chem. Phys., 72,2737 - 2743, 1980.
49. G. C. Schatz, "A quasiclassical trajectory study of final state distributions in collisions of fast H(D) atoms with HF(DF)", J. Chem. Phys., 86,6738 - 6744,1987.
50. C. F. Bender, B. J. Garrison and H. F. Schaefer III, "A critical test of semiempirical FH2 potential energy surfaces: The barrier height for H + FH --> HF + H", J. Chem. Phys., 62,1188 - 1190,1975.
51. P. Botschwina and W. Meyer, "PNO-CEPA calculation of collinear potential energy barriers for thermoneutral exchange reactions", Chem. Phys., 20,43 - 52,1977.
52. W. R. Wadt and N. W. Winter, "Accurate characterization of the tranisiton state geometry for the HF+ H’ --> H + H'F reaction", J. Chem. Phys., 67,3068 - 3073,1977.
53. R. F. Heidner III and J. F. Bott, "Vibrational deactivation of HF(v = 1) and DF(v= 1) by H and D atoms", J. Chem. Phys., 63,1810 - 1817,1975.
54. J. F. Bott and R. F. Heidner III, "The vibrational deactivation of HF(v = 3) and HF(v = 2) by H atoms", J. Chem. Phys., 66,2878 - 2882,1977.
55. J. F. Bott and R. F. Heidner III, "Kinetic study of H + HF(v = 3): Kinetic isotope effect and temperature dependence",/. Chem. Phys.,68,1708 - 1714,1978.
56. M. A. Kwok and R. L. Wilkins, "Flow tube measurements of H + HF(v) deactivation rates”, /. Chem. Phys., 60, 2189 - 2190,1974.
57. N. Cohen and J. F. Bott, It should be noted that the text of Ref. 10 contains k(HF(3) + H H2 + F but the table at the end does not. See pp. 40-42 of Ref. 10.
58. R. A. Copeland, D. J. Pearson, J. M. Robinson and F. F. Crim, "Laser double resonance measurements of vibrational energy transfer rates and mechanisms in HF(v = 2)", J. Chem. Phys., 77,3974 - 3982, 1982.
59. J. M. Robinson, D. J. Pearson, R. A. Copeland and F. F. Crim, "Rates and Pathways of Vibrational Self-Relaxation of Hf(V=2) between 300-K and 700-K", J. Chem. Phys., 82,780-788, 1985.
60. J. M. Robinson, K. J. Rensberger and F. F. Crim, "A Direct Determination of the Role of Vibration-to-Vibration Energy-Transfer in Hf(V=3 ;4) Self-Relaxation", /. Chem. Phys., 84,220-226, 1986.
61. T. J. Foster and F. F. Crim, "Vibrational relaxation of HF(v = 3,4,5) between 300 and 700 K", J. Chem. Ph\s„ 75, 3871 -3875,1981.
62. G. M. Jursich and F. F. Crim, "Vibrational relaxation of HF(v = 3,4,5)",/. Chem. Phys., 74,4455 - 4464,1981. 63. L. S. Dzelzkalns and F. Kaufman, "Vibrational relaxation of highly excited diatomics. IV. HF(v = 1 - 7) + C02,
N20, and HF", /. Chem. Phys., 79,3836 - 3844,1983. 64. L. S. Dzelzkalns and F. Kaufman, "Vibrational relaxation of highly excited diatomics. V. The V-V channel in
HF(v) + HF(0) collisions”, /. Chem. Phys., 79,3363 - 3366, 1983.
Proc. SPIE Vol. 4631 205

65. L. S. Dzelzkalns and F. Kaufman, "Vibrational relaxation of highly excited diatomics. VI. DF(9<=v<=12) + N2, CO, C02, and N20 and HF(v = 5 - 7) + CO", J. Chem. Phys., 80,6114 - 6121,1984.
66. L. S. Dzelzkalns and F. Kaufman, "Vibrational relaxation of highly excited diatomics. VII. DF(v = 9-12) and HF(v = 5 - 7) + HF(v = 0), DF(v = 0) in all combinations", J. Chem. Phys., 81,4975 - 4978, 1984.
67. J. F. Bott, "Gas-dynamic corrections applied to laser-induced fluorescence measurements of HF(v = 1) and DF(v
=1) deactivation", J. Chem. Phys., 61, 3414 - 3416, 1974. 68. J. J. Hinchen, "Vibrational relaxation of hydrogen and deuterium fluorides", J. Chem. Phys., 59,233 - 240,1973. 69. J. J. Hinchen and R. H. Hobbs, "Rotational relaxation studies of HF using ER double resonance", J. Chem. Phys.,
65,2732 - 2739, 1976. 70. M. J. Bina and C. R. Jpnes, "Use of direct overtone excitation in the measurement of the HF(v = 2) deactivation
rate", Appl. Phys. Lett., 22,44 - 45,1973. 71. J. F. Bott and N. Cohen, "Temperature dependence of V-V and V-R,T energy transfer measurements in mixtures
containing HF*”, J. Chem. Phys., 58,4539 - 4549,1973. 72. M. A. Kwok and R. L. Wilkins, "Flow-tube studies of vibrational energy transfer in HF(v) + HF, DF(v) + HF, and
DF(v) + D2 systems", J. Chem. Phys., 63,2453 - 2460,1975. 73. J. R. Airey and I. W. M. Smith, "Quenching of infrared chemiluminsescence: Rates of energy transfer from HF(v
<= 5) to C02 and HF, and from DF(v <= 3) to C02 and HF*", J. Chem. Phys., 57,1669 - 1676,1972. 74. P. R. Poole and I. W. M. Smith, "Quenching of infrared chemiluminescence. Part 7. Rates of energy transfer from
HF(v = 2-7) and DF (v = 3 - 5) to a wide range of collision partners", J. Chem. Soc. Faraday Trans. 2,73,1447 - 1458,
1977. 75. P. R. Poole and I. W. M. Smith, "Quenching of infrared chemiluminescence. Part 6. Rates of energy transfer from
HF(v = 2 - 7) to HF(v = 0), H2, D2, and HD, and from DF(v = 3 - 5) to HF(v = 0)", J. Chem. Soc. Faraday Trans. 2,73,
1434 - 1446,1977. 76. R. M. Osgood Jr., P. B. Sackett and A. Javan, "Measurement of vibrational-vibrational exchange rates for excited
vibrational levesl (2 <= v <= 4) in hydrogen fluoride gas”, J. Chem. Phys., 60, 1464 - 1480, 1974. 77. D. J. Douglas and C. B. Moore, "Vibrational Relaxation of HF(v = 3,4)", Chem. Phys. Lett., 57,485,1978. 78. J. K. Lampert, G. M. Jursich and F. F. Crim, "Collisional relaxation of HF(v = 3,4) by HF, CH4, and CD4",
Chem. Phys. Lett., 71,258 - 263,1980. 79. R. L. Wilkins, "Mechanisms of energy transfer in hydrogen fluoride systems", J. Chem. Phys., 67,5838 - 5854,
1977. 80. R. L. Wilkins and M. A. Kwok, "Temperature dependence of vibrational relaxation from the upper vibrational
levels of HF and DF”, J. Chem. Phys., 73, 3198 - 3204, 1980. 81. M. E. Coltrin and R. A. Marcus, "Cross-correlation trajectory study of vibrational relaxation of DF(v = 1 - 7 ) by
DF(v = 0) and of HF by HF”, J. Chem. Phys., 76,2379 - 2383, 1982. 82. M. E. Coltrin and R. A. Marcus, "Cross correlation trajectory study of vibrational relaxation of HF(v = 1 - 7) by
HF(v = 0)", J. Chem. Phys., 73,4390 - 4396, 1980. 83. G. D. Billing and L. L. Poulsen, "Theory of V-V and V-T/R energy transfer for HF(v = 1 - 7) + HF(0)", J. Chem.
Phys., 68,5128 -5138,1978. 84. J. F. Bott, "Vibrational relaxation of HF(v = 1) and DF(v = 1) by H2 and D2", J. Chem. Phys., 61, 2530 - 2535,
1974. 85. J. F. Bott and R. F. Heidner III, "Vibrational relaxation of HF(v = 1 and 3) in H2, N2, and D2 at 200 and 295 K",
J. Chem. Phys., 72, 3211 - 3215, 1980. 86. D. J. Douglas and C. B. Moore, "Vibrational relaxation of HF(v = 3,4) by H2, D2, and C02", J. Chem. Phys., 70,
1769 - 1773, 1979. 87. G. M. Jursich, D. R. Ritter and F. F. Crim, "Vibrational relaxation of HF(v = 3,4, and 5) by H2, D2, CH4, CD4,
and C02", J. Chem. Phys., 80,4097 - 4104, 1984. 88. N. Cohen, J. F. Bott, M. A. Kwok and R. L. Wilkins, "The status of rotational nonequilibrium in HF chemical
lasers", SD-TR-86-26, 1986. 89. M. A. Kwok, R. L. Wilkins, G. I. Segal, E. F. Cross, R. H. Ueunten and K. L. Foster, "In search of high J states in
the HF(v,J) system", SD-TR-85-21, 1985. 90. E. Cuellar and G. C. Pimentel, "Rotational laser emission by HF in the C1F-H2 chemical laser", J. Chem. Pliys.,
71, 1385 - 1391, 1979.
206 Proc. SPIE Vol. 4631

91. E. R. Sirkin and G. C. Pimentel, "HF rotational laser emission through photoelimination from vinyl fluoride and 1,1-difluoroethene”, J. Chem. Phys., 75,604 - 612,1981.
92. E. R. Sirkin and G. C. Pimentel, "HF rotational lasers: Enhancement of V--> R multiquantum energy transfer by CO and C02", J. Chem. Phys., 77,1314 - 1322,1982.
93. G. L. Richmond and G. C. Pimentel, "HF rotational laser emission from C1F/H2 reaction: Time evolution of the gain", J. Chem. Phys., 80,1162 - 1170,1984.
94. J. H. Smith and D. W. Robinson, "Chemical pumping of pure rotational HF lasers", J. Chem. Phys., 74,5111- 5115,1981.
95. J. H. Smith and D. W. Robinson, "The OH and OD laser: Collision-induced energy transfer pumping", J. Chem. Phys., 68,5474 - 5480,1978. %
96. J. H. Smith and D. W. Robinson, "Pure rotational lasing in four electronic states of NH: Impulsive to adiabatic collisional pumping", J. Chem. Phys., 71,271 - 280,1979.
97. E. Arunan, D. Raybone and D. W. Setser, "Vibrational relaxation rate constants for HF(v = 1 - 4) by CO, C02, and HCN with product identification by infrared emission", J. Chem. Phys., 97,6348 - 6362,1992.
98. D. Raybone, S. J. Wategaonkar and D. W. Setser, "Near resonant V-R,T energy transfer in the relaxation of vibrationally excited HF by CO", J. Chem. Phys., 89, 3384 - 3386,1988.
99. D. L. Thompson, "A Monte Carlo quasiclassical trajectory study of energy transfer in Ar + HF collisions", J. Chem. Phys., 76,5947 - 5967,1982.
100. D. L. Thompson, "Vibrational-rotational energy transfer in collisions of HF(v = 4, J = 20) with rare gases", J. Chem. Phys., 78,1763 - 1766,1983.
101. H. K. Haugen, W. H. Pence and S. R. Leone, "Infrared double resonance spectroscopy of V-T,R relaxation of HF(v = 1): Direct measurement of high-J populations", J. Chem. Phys., 80,1839 - 1852,1984.
102. M. A. Muyskens, Ph.D. Thesis, University of Wisconsin, Madison, 1989. 103. R. A. Copeland, D. J. Pearson and F. F. Crim, "Laser double resonance measurements of rotational energy
transfer rates in HF(v = 2)", Chem. Phys. Lett., 81,541 - 546,1981. 104. R. A. Copeland and F. F. Crim, "Rotational energy transfer in HF(v = 2): Double resonance measurements and
fitting law analysis", J. Chem. Phys., 78,5551 - 5563,1983. 105. R. A. Copeland and F. F. Crim, "Rotational energy transfer in HF(v = 2): Energy corrected sudden
approximation scaling relations applied to double resonance measurements", J. Chem. Phys., 81,5819 - 5829,1984. 106. R. A. Copeland, Ph.D. Thesis, University of Wisconsin, Madison, 1982. 107. C. A. Taatjes and S. R. Leone, "Laser double-resonance measurements of rotational relaxation rates of HF(J =13)
with rare gases, H2, and D2", J. Chem. Phys., 89, 302 - 308, 1988. 108. C. A. Taatjes and S. R. Leone, "Laser double-resonance studies of low-temperature rotational and vibrational
relaxation of HF: Rates for HF(J = 13) + HF from 225 to 298 K and detection of HF(v = 1) deactivation by HF clusters at 210 - 240 K", J. Phys. Chem., 95,5870 - 5877,1991.
109. L. A. Bollati, G. A. Arguello and E. H. Staricco, "Dependence on vibrational excitation of energy transfer processes for HF(vJ) + HF(v = 0)”, J. Chem. Phys., 83,6050 - 6052,1985.
110. L. A. Bollati, G. A. Arguello and E. H. Staricco, ”HF autorelaxation in v = 1 and v = 2”, J. Chem. Soc. Faraday Trans. 2,84,599 - 609,1988.
111. R. L. Wilkins and M. A. Kwok, "Rotational energy tranfer in HF", J. Chem. Phys., 78, 7153 - 7158, 1983. 112. R. L. Wilkins and M. A. Kwok, "Temperature dependence of HF(v = 1) + HF (v = 2) vibrational relaxation", J.
Chem. Phys., 70,1705 - 1710,1979. 113. D. L. Thompson, N. C. Blais and D. G. Truhlar, "Rotational energy transfer in collisions of internally excited
molecules. Effect of initial conditions and potential energy surface", J. Chem. Phys., 78,1335 - 1338,1983. 114. D. L. Thompson, "Vibrational and rotational energy tranfer in Ar + HF", Chem. Phys. Lett., 84, 397 - 400, 1981. 115. G. D. Billing, "Cross-sections for rotational/vibrational transitions in HF-HF collisions: Effect of initial state”,
Chem. Phys., 112,95 - 104,1986. 116. G. D. Billing, "Semiclassical calculation of cross sections for vibration-rotation energy transfer in HF-HF
collisions", J. Chem. Phys., 84,2593 - 2603, 1986. 117. L. L. Poulsen and G. D. Billing, "A classical trajectory study of the fate of vibrational energy released in HF",
Chem. Phys., 53,389 - 401,1980. 118. R. N. Sileo and T. A. Cool, "Overtone emission spectroscopy of HF and DF: Vibrational matrix elements and
dipole moment function", J. Chem. Phys., 65, 117 - 133, 1976.
Proc.SPIEVol.4631 207

119. G. P. Quigley and G. J. Wolga, "The deactivation of HF(v = 1) and DF(v = 1) by O, Cl, and F atoms”, J. Chem.
Phys., 63,5263 - 5268,1975. 120. J. A. Blauer and W. C. Solomon, "Deactivation of vibrationally excited hydrogen fluoride (v = 2 and v = 1) by
atomic fluorine", Int. J. Chem. Kinet., 5,553 - 558,1973. 121. J. F. Bott and N. Cohen, "HF vibrational relaxation by F atoms", J. Chem. Phys., 55,5124 - 5125,1971.
122. J. F. Bott, "Vibrational relaxation of DF by He and Ar", J.-Chem. Phys., 63,2253 - 2254,1975.
123. A. A. Vasiliev, V. N. Bezmelnitsyn, V. F. Sinianski and B. B. Chaivanov, "Rate constant for heterogeneous
dissociation of fluorine in a temperature range of 700 - 900 K on a nickel surface", J. Fluorine Chem., 95, 153 - 159,1999.
124. C. J. Ultee, "The homogeneous recombination rate constant of F atoms at room temperature", Chem. Phys. Lett.,
46, 366 - 367, 1977.
208 Proc. SPIE Vol. 4631

Tunable, Solid State Laser for HF Mirror Metrology
AnnMarie L. Oien*\ Timothy J. Carrig8, Gregory J. Wagner8, Chris J. Urbina8, Jonathan W. Arenberg**b, Jennifer A. Keene8
Coherent Technologies, Inc; bTRW Space & Technology Division
ABSTRACT
HF mirror metrology is currently costly and time consuming, requiring laser component delivery to an HF laser site, and operation of another HF laser to reach relevant wavelengths. Coherent Technologies, Inc (CTI) has developed a solid state Cr:ZnSe laser pumped by a Tm:YALO laser that provides up to 1.1 W of output power with 1. lnm linewidth at 2.64pm, an HF laser line. The laser can also tune to other HF laser lines in the wavelength range of 2.64pm to 2.8pm. The Cr:ZnSe laser was used to measure the reflectivity of HF mirror samples provided by TRW. Examples of other possible applications of this source include beam train alignment and preliminary testing of diagnostic subsystems that measure HF laser output power, wavefronts, and beam profiles. Such a direct laser source is simple and can potentially achieve high intensity stability, allowing for a robust and compact HF laser surrogate. Moreover, power scaling is straightforward. Keywords: Tunable; infrared; Cr:ZnSe lasers; HF lasers; metrology
1. Cr2+ DOPED CHALCOGENIDE LASERS
Three significant advantages of CrrZnSe are that (1) the material has an extremely broad absorption band (allows it to be pumped by a variety of sources), (2) the laser has an extremely large emission cross-section (high gain) and (3) the laser material has a near-unity fluorescence quantum efficiency at room temperature (high temperature operation possible). An absorption curve is shown in Figure 1. It is apparent that pump sources in the 1.5 pm to 2.0 pm wavelength region can be used to excite the Cr2+ ion in the ZnSe host. CTI has demonstrated CW operation of Cr:ZnSe lasers using a NaCF.OH' color center laser operating at 1.58pm, a 1.8pm diode laser, and a TmtYALO laser operating at 1.94pm as pump sources. For most laser geometries, the optimal pump wavelength is expected to be around 1.8 pm. However, the broad absorption band provides a means of varying the heat load per unit length in the laser crystal without varying the active ion concentration (i.e. provides another design “knob” to tweak).
Figure 1. The CrrZnSe absorption spectrum. The sample was prepared by diffusion doping. It is apparent that any pump
wavelength in the 1.5 to 2.0 pm range is suitable.
The Cr2* ion has essentially two electronic states since transitions to higher levels (which coincide with the material’s bandgap) are spin-forbidden and, presumably, very weak. In this respect the laser is similar to the Ti:sapphire laser that
Gas and Chemical Lasers and Intense Beam Applications III, Steven J. Davis, Michael C. Heaven, Editors, Proceedings of SPIE Vol. 4631 (2002) © 2002 SPIE • 0277-786X/02/$15.00 209

has proven to be highly commercially successful. An advantage is the expected absence of loss mechanisms, such as upconversion and excited-state-absorption, that plague many other SWIR and MWIR laser materials. Some advantages of the Cr:ZnSe laser system are listed below.
• Broad tunability (lasing from 2.1-3.lpm demonstrated) • Broad absorption bands (relaxed pump wavelength constraints) • Ability to directly diode pump using strained-layer InGaAsP/InP diode lasers (demonstrated by multiple
groups) • Large gain cross section (oemjs ~ 9 x 10'19 cm2) • Minimal problem of excited state absorption (no spin-allowed excited state transitions from the upper laser
level) • Near unity fluorescence quantum efficiency at 300 K (enables efficient room temperature operation)
• Can produce material by several techniques (diffusion doping and modified Bridgman growth)
• High thermal conductivity - better than YAG (18 W/m»K in ZnSe versus 13 W/m*K in YAG).1
• High IR (0.6-20 pm) transparency • Readily available host material (polycrystalline window material works fine)
The main disadvantage of CriZnSe is a higher temperature dependence of refractive index (8n/5T) than other solid-state
laser materials, such as YAG. A high 8n/5T (61 x 1 O’6 at 300 K in ZnSe compared to 7.3 x 10 6 in YAG) means that thermal lensing will be more of a concern in high power ZnSe lasers than in YAG lasers. This problem can be addressed by appropriate laser design (for instance disk, slab, and waveguide designs where thermal lensing is inherently mitigated).
2. CnZnSe LASER TEST RESULTS
CTI has conducted work with Cr.ZnSe lasers concentrating on CW operation, modelocking, and power scaling.2 To meet HF laser surrogate requirements, however, CTI concentrated on line narrowing and tuning of a Watt-level CriZnSe laser. The following points summarize achievements to date on this program:
• Constructed a 6W continuous wave (CW) and 3W average power Q-Switched Tnv.YALO laser • Constructed a tunable Cr.ZnSe laser that tunes 0.75 microns Q-Switched and 0.63 microns CW • Measured emission spectra of the materials Cr:ZnSe, Cr:CdSe, and Cr:CdxZni.xTe, and concluded that CriZnSe
was the best thermal candidate and Cr:CdSe may be the best spectral candidate for possible future work
Each of these highlights are described in more detail below.
The laser resonator design for the Tnv.YALO laser is shown schematically in Figure 2.
Figure 2: Plan view of the Tm:YALO laser used in the Phase I program’s laboratory demonstration.
210 Proc. SPIE Vol. 4631

Since the 3-level Tm: YALO laser increases in efficiency with cooling, the laser head mount incorporates 4 thermo¬ electric coolers (TEC’s). For this work, the laser was run at room temperature and produced sufficient performance for reflectivity survey demonstrations. A copper rod mount is thermally contacted via indium foil to the TmiYALO rod. A 45 degree incidence dichroic mirror placed in front of the rod reflects the 1940nm Tm:YALO light but passes the 795nm diode pumping light, allowing diode laser end-pumping into the Tm:YALO rod. The TmiYALO laser can provide up to 6W of power, of which 5 W is incident upon the CriZnSe laser after passing through an optical isolator.
The CW CriZnSe laser resonator is shown in Figure 3. It is a folded linear resonator with a waist midway between the two curved mirrors to counteract thermal lensing in the pumped CriZnSe rod. A Brewster plate, prism and two etalons have been used to successfully line narrow and tune the laser. The etalons are 150 and 300 microns thick, and are uncoated fused silica.
Figure 3: Resonator schematic of the CriZnSe tunable laser, which produced up to 1.4W output power at 2500nm,
The CriZnSe laser rod was 6mm long and absorbed 3W of the 5W maximum pump power incident on the rod. The output power vs wavelength at 5W TmiYALO pump power is shown in the plot below, Figure 4. The laser had over 600nm continuous-wave tuning range and over 1W output power at the peak of the tuning curve.
Proc. SPIE Vol. 4631 211

Cr:ZnSe Laser Tuning with Brewster Prism 10% OC, Linear Resonator, 6 mm Rod
Wavelength (nm)
Figure 4: Plot of the output power versus wavelength for the CW Cr:ZnSe laser.
The spectral width of the laser with two etalons and a Brewster prism tuned to one of the HF 1-0 band lines, 2640nm, was measured. The full width half maximum is 1.1 nm. The power output at this wavelength is 1.09W. The wavelength tuning range extending only to 2760nm, which is a shorter wavelength than reported by others; for example, CW Cr:ZnSe lasers have been tuned from 2000-3 lOOnm, with appropriate laser design.3 It is therefore possible that longer wavlength tuning is currently limited by cavity optics, crystal coatings, or atmospheric absorption. CTI has found that the emission spectrum of pumped Cr:ZnSe shows a significant increase in power when the long path of the monochromator is purged with dry nitrogen in the 2600 to 2900nm range. The original detector was replaced with a PbSe detector, which has a flatter spectral response that extends further into the infrared.
The purged and unpurged emission spectrum of the Cr:ZnSe rod which is pumped by Tm: YALO is shown below in Figure 5. The emission spectrum was taken using a PbSe detector, which has a known flat response throughout the 2 to 4 micron wavelength range. This measurement confirmed that the emission is severely affected by atmospheric absorption in the wavelength region of 2.6 to 2.9 microns.
212 Proc. SPIE Vo!. 4631

Figure 5 The emission spectrum of Cr:ZnSe with a flat response PbSe detector. Lasing in the 2.6 to 2.8 micron region would be
particularly affected by atmospheric absorption lines.
Note that the purging for these emission spectra were not complete and that the path from the pumped crystal to the monochromator (the interior of which is purged with dry nitrogen) remains exposed to air and any residual atmospheric absorption. Therefore this result should be viewed as qualitative.
To investigate pump threshold effects on laser tuning, CTI measured the tuning range of a gain-switched Cr.ZnSe laser, using a 1kHz repetition rate, 3W average power Q-Switched TmiYALO laser as the pump source. Given the much higher intensities of the TmiYALO laser, the gain-switched CriZnSe laser was expected to operate much further above threshold, yielding a tuning range that extends further into the infrared. The CW and gain-switched CriZnSe lasers had very similar tuning ranges, indicating that our tuning limitation is probably related to a “non-gain” cause such as optical coatings or atmospheric absorption - both of which can be improved. The cavity used for the measurement is shown in Figure 6.
Figure 6: Layout schematic of the grating tuned CriZnSe laser, pumped by a Q-Switched Tm: YALO laser.
The gain-switched laser, which was grating-tuned in the first order Littrow configuration, produced a tuning range of 750nm, which is the largest tuning range demonstrated at CTI. The resonator was tuned by rotating the grating, which changed the wavelength that was diffracted back into the resonator as feedback. The system tuned from 2050nm to 2800nm, and showed an output power that was strongly dependent on the grating diffraction efficiency with wavelength. This result is significant because it showed that the laser can indeed tune further into the infrared, but may still be limited by atmospheric absorption and optical coatings.
The Q-Switched TmiYALO pump laser increased the gain remarkably, and it is interesting to note that the tuning range in the short range extended well into the region where CriZnSe is absorbant - note that others have used the wavelength of 2013nm to PUMP a CriZnSe laser4. Therefore, it is expected that with improvements beyond the scope of the current work, such as a higher power pump laser, improved optical coatings, and reduced cavity loss due to background atmospheric absorption, the tuning range of the CW output format CriZnSe laser can be extended.
Proc. SPIE Vol. 4631 213

3. HF AXICON CONE MIRROR REFLECTIVITY SURVEY RESULTS
HF laser mirrors for metrology experiments were supplied by TRW. Specifically, an aluminum substrate waxicon cone coated with ThF4 and ZnSe was used, which is a typical mirror shape for an unstable HF laser resonator. CTI has conducted a reflectivity survey of the cone at 2640nm wavelength for comparison to previous TRW measurements, which used a white light source. 2640nm was chosen as it is the wavelength of the Pl(4) HF laser line, and the Cr:ZnSe laser could tune to it and provide over 1W output power. The setup used to measure the reflectivity is shown in Figure
8.
Figure 8: Setup to measure the reflectivity at 2640nm of the HF mirror cone. Two mirrors act as a vertically translatable periscope to
send the beam at scanned heights onto the cone. The cone is marked and rotated within locating pins after each vertical scan.
Throughout the axicon cone survey the laser produced 1092mW±2.5% intensity at 2640nm over the four hour scan. After each reflectivity measurement the incident intensity was measured. The two detectors for incident and reflected intensity were cross-checked for response. The transmission of the laser from the incident intensity detector past the two periscope mirrors was found to be 93.7%, which was used to correct the data.
Figure 9 shows CTFs measurement in the plot format equivalent to that done in the past, except at the HF laser wavelength 2640nm. Only the average reflectivity of the cone as a function of height above the base is shown. The cone was visibly damaged, showing flaking and patchy discoloration, so it was expected that the reflection would not be 100%. No trend in reflectivity is seen with height, but that was not expected given that the measurements were done on the lower 50mm height of the cone, where the reflectivity remained fairly constant in the white-light scan. It was difficult to measure the reflectivity nearer the tip due to the severe curvature of the cone - the tip had a radius of
curvature of ~0.5cm.
214 Proc. SPiE Vol. 4631

Figure 9: Plot of the average reflectivity around the cone with height.
The reflectivity of the cone as a function of both azimuthal angle and height above the cone base is shown below in Figure 10. The local drops in reflectivity could be quite severe, going to 50% in localized areas, which appeared to visibly correlate to the flaking parts of the cone.
Figure 10: Plot of the measured reflectivity in percent with azimuthal angle and height in mm above the base of the HF mirror cone.
These measurements showed that mirror metrology with extensive spectral and spatial resolution could be conducted with the current Cr:ZnSe laser.
Several attempts were made to detect absorption in the HF mirrors with a focussed CriZnSe laser beam and a coincident green HeNe laser beam. Despite scanning the visible laser beam repeatedly over the area illuminated by the CriZnSe laser, and looking for deflection at a distance calculated to be more than sufficient to see deflection movement, no absorption by deflection was observed.
Proc. SPIE Vol. 4631 215

4. CONCLUSIONS
In conclusion, the results of the Cr:ZnSe laser reflectivity mapping show that the laser is sufficient to conduct spectrally and spatially accurate mirror metrology surveys. As a solid-state laser source it can significantly reduce the cost and time needed to verify a newly-developed mirror’s optical properties, accelerating HF laser development. Moreover, for maintenance, beam alignment and diagnostic checking, the laser can be built on a smaller or larger scale, and be used to streamline HF laser operation and preparation procedures. In short, a Cr2+ chalcogenide laser is well matched to multiple HF laser surrogate requirements.
ACKNOWLEDEMENTS We thank the Air Force Research Laboratory, Dr. Gordon Hager, AFRL/DELC, for funding this work under the Phase I Small Business Innovative Research (SBIR) contract # F29601-01-C-0098.
REFERENCES 1. Material properties of ZnSe are listed in Optical Crystal Handbook, Optovac, N. Brookfield, MA. Properties of YAG are given by W. Koechner in Solid-State Laser Engineering, third edition, vol. 1. in Springer series in Optical Sciences, Springer-Verlag, Berlin, 1992.
2. See, for example, G. J. Wagner and T. J. Carrig, “Power scaling of Cr2+:ZnSe lasers,” paper WB1, presented at Advanced Solid-State Lasers '01, Seattle, WA, January 31, 2001. Published in the ASSL’01 Proceedings, and T. J. Carrig, G. J. Wagner and A. Burger, “Broadly Tunable Cr^ZnSe laser,” paper SBIR-48, 2001 NSF Design, Service and
Manufacturing Grantees and Research Conference, Tampa, FL, January 9, 2001.
3. Private communication, Dr. I. Sorokina, Technische Universitat, Wien, Austria, (submitted to journal 2001).
4. A.V.Podlipensky, V.G. Shcherbitsky, N.V. Kuleshov, V.I.Levchenko, V.N. Yakimovich, A. Diening, M. Mond, S. Kck, and G. Huber, Advanced Solid-State Lasers, OS A TOPS Vol. 34, 201, (2000).
* [email protected], phone +1 303 604 2000; fax +1 303 604 2500; Coherent Technologies, Inc, 655 Aspen Ridge Drive, Lafayette, CO 80026 ** [email protected]; phone +1 310 813 2567; fax +1 310 813 0447; TRW Space & Technology Division, One Space Park, Redondo Beach, CA 90278

Imaging spectroradiometer for HF laser studies
W.T. Rawlins, D.B. Oakes, P.A.Mulhall, and S.J.Davis*
Physical Sciences Inc.
ABSTRACT
We discuss a non-intrusive diagnostic for mixing, species concentration, and optical gain for HF chemical lasers. The instrument is based on hyperspectral imaging using a low order Fabry-Perot interferometer. The basic theory behind this technology is described and several applications to a chemically reacting flowfield are presented
Keywords: chemical laser diagnostics, hyperspectral imaging, reactive flows
1. INTRODUCTION
Certain gas phase chemical reactions form product states that have inverted population distributions. For example, the F + H2 reaction produces H + HF(v,J) where partial inversions exist between many rovibrational levels. Mixing of the reacting gas streams in a chemical laser is a key parameter for producing efficient devices.13 This was recognized soon after the first laser demonstrations, but effective diagnostics did not exist that could survive corrosive environments or did not perturb the flows. Measurements of mixing, vibrational and rotational temperatures, small signal gain, and spectral output were difficult and often inaccurate. Even though the HF chemical laser concept is more than 30 years old, there are still important scaling parameters for which there are no effective diagnostics. In 1978 Rapagnani and Davis demonstrated that laser induced fluorescence could be used as a diagnostic for mixing in chemical laser nozzles, and they later developed methods for studying both hot flow and cold flow mixing.4,5 In this paper we discuss a new diagnostic for reactive mixing in chemical lasers. Using a device we call the Adaptive Infrared Imaging Spectroradiometer (AIRIS) we have developed methods for examining mixing of F and H2 flows and for determining spatially resolved maps of population inversions between selected HF rovibrational levels.
1.1 Background The AIRIS technology was developed at Physical Sciences Inc. (PSI) to address the need for a moderate resolution, rapidly tuned imaging spectrometer for a variety of applications. Our technology is based on Fabry-Perot (F-P) interferometry. Fabry-Perot devices rely upon multiple beam interference between two highly reflecting mirrors to produce an interference pattern that contains spectral information about the light source being probed. If the light source is collimated with a lens, then the resulting interference pattern is usually a series of concentric rings, each representing a different order of the interference. This is illustrated in Fig. 1.
Fig. 1: Typical arrangement for F-P interferometers.
* [email protected]; phone 1 978 689-0003; fax 1 978 689 3232; http://www.psicorp.com; Physical Sciences Inc., 20 New England Business Center, Andover, MA, USA 01810-1077
Gas and Chemical Lasers and Intense Beam Applications III, Steven J. Davis, Michael C. Heaven, Editors, Proceedings of SPIE Vol. 4631 (2002) ©2002 SP1E • 0277-786X/02/$ 15.00 217

Jacquinot6 described an important application of the F-P with the introduction of the center spot technique. He showed
that if one placed a pinhole in front of a detector that restricted the detector to view only a small portion of the center
spot of the interference pattern, then one could use the F-P as a spectrometer by recording the transmitted light as a
function of the distance between the F-P mirrors. Davis and co-workers7 used this approach to obtain the first measure¬
ments of the collisional broadening coefficient for oxygen on the atomic iodine laser line, crucial data for COIL. This
type of spectrometer offers several advantages including: high throughput, high spectral resolution, and compact size.
1.1.1 Basic concepts The AIRIS instrument comprises an IR focal plane array (FPA) coupled to a Fabry-Perot interferometer through imaging
optics. In this configuration the interferometer operates as a tunable interference filter, selecting the wavelength viewed
by the FPA. In this section we describe the theoretical basis for the development of the interferometer as well as the
consequences and advantages of low-order operation.
In a Fabry-Perot interferometer light is selectively transmitted by constructive interference through the faces of two
partially-reflecting parallel mirrors. Light is transmitted for wavelengths which satisfy the expression:
V Xt = — cos0 (1)
m
where
i = mirror spacing
m = order of interference
0 = incidence angle
Xt = transmitted wavelength.
A range of mirror spacings, incidence angles, and orders will all lead to the transmission of a single wavelength. The
free spectral range, A^FSR, determines the range of wavelengths transmitted between successive orders of interference:
AX FSR
X max
^ max + 1 (2)
where rnmax is the order in which )v,Ilax is transmitted for paraxial rays.
The finesse, F, determines the spectral resoluti on of the interferometer, which is always a fraction of the free spectral
range:
A \ (3) F
The elements which define the finesse of the interferometer arise from the reflectivities of the mirrors as well as
"defects" in their configuration, such as mirror flatness and parallelism. The total finesse of the interferometer is
obtained from the inverse root mean square sum of each finesse component. For practical operation in the infrared, the
defect finesse is the limiting factor in determining total finesse. The total finesse can seldom be greater than
approximately 30 to 50 due to these limitations.
The interferometer field of view (focal length and detector element size) determines the range of angles incident and
detected by the system. Equation (1) shows that a range of incidence angles and interference orders will allow
transmission of a common wavelength through the interferometer for a single mirror spacing. The aperture finesse
defines the degradation in spectral resolution within a single order due to this effect:
218 Proc. SPIE Vol. 4631

2 (4)
A m(A0)2
As a consequence of Eq. (4), the field of view over which an acceptable finesse can be obtained increases as the interferometer is operated in lower orders. When using IR focal plane arrays, system instantaneous fields-of-view ranging from 6 to 15 deg are generally consistent with an overall finesse of 35.
The short wavelength AIRIS used in this work contains two, custom mirrors with high reflectivity in the 2.0 to 3 micron spectral region. The 38 mm diameter mirrors were fitted with specialized gold pads that form four capacitors that are used to measure and monitor the separation and alignment of the two mirrors in the Fabry-Perot configuration. A photo of the short wavelength AIRIS head is shown in Fig. 2.
Fig. 2: Photo of AIRIS device used to probe HF(v,J) emission.
2. EXPERIMENTS
2.1 Calibrations Initial testing of the AIRIS system was conducted using a Fourier Transform Infrared (FTIR) spectrometer. The AIRIS head was positioned inside the FTIR, and the FTIR provides a tunable, narrow spectral band of light that can be used as an essentially monochromatic source for AIRIS calibrations. This quasi-monochromatic beam (0.5 to 2 cm'1) passed through the AIRIS and the transmitted intensity was monitored as a function of the wavelength of the source and the mirror separation in AIRIS. Recall that in a Fabry-Perot interferometer the wavelength of the transmitted light is a function of the mirror separation. We performed initial calibration of the AIRIS by systematically setting the mirror separation while recording the transmitted intensity as the wavelength of the light passed by the FTIR was scanned. As the wavelength of the light incident on the AIRIS passed through cavity resonances, transmission peaks of the consecutive orders were observed. A typical spectrum is shown in Fig. 3.
2.2 Chemical HF(vJ) production We used a high power Microwave Driven Jet (MIDJet™) device to produce the F atoms. MIDJet™ is an electrodeless discharge so that corrosion is not an issue. It has been applied to numerous feedstock gases including SF6, 02, He, Cl2, NF3, and air. The source gas and diluent are fed into the discharge region of MIDJet™ through a series of sonic injection nozzles. The design of these injectors stabilizes the discharge along the axis of the MIDJet™ chamber and enables the device to operate over a large range of pressures and flow rates. Both sonic and subsonic exit nozzles can be used to cover a wide range of exit conditions. The supersonic exit nozzle isolates the conditions inside the MIDJet™ chamber for flow conditions downstream of the nozzle.
Proc. SPiE Vol. 4631 219

1.7 1.8 1.9 2 2.1 2.2 2.3 2.4 2.5 2.6 2.7 2.8 2.9 3 3.1 3.2 3.3 3.4 3.5 3.6
Wavelength (pm)
Fig. 3: AIRIS transmission as a function of the wavelength of incident light for a mirror separation of 17.67 ± 0.16 pm. The interference order is also indicated. Spectral resolution is 2 cm1.
The injector was mounted in the MIDJet™ source as indicated in Fig. 4. The HF mixing nozzle for production of HF(vJ) from the F + H2 reaction was a 6 mm diameter stainless tube with four holes (0.5 mm diameter) spaced 1.5 cm apart. Hydrogen and He dilutent were injected through this arrangement. The four holes produced supersonic flows of H2 from the exit plane to approximately 2 mm downstream of the holes. Fluorine atoms were produced with a 5 kW
MIDJet™ discharge device using SF^ as the feedstock gas. Details of the water-cooled injector tube are shown in Fig. 5.
He/F2
Fig. 4: Block diagram showing injector mounted in MIDJet™ device.
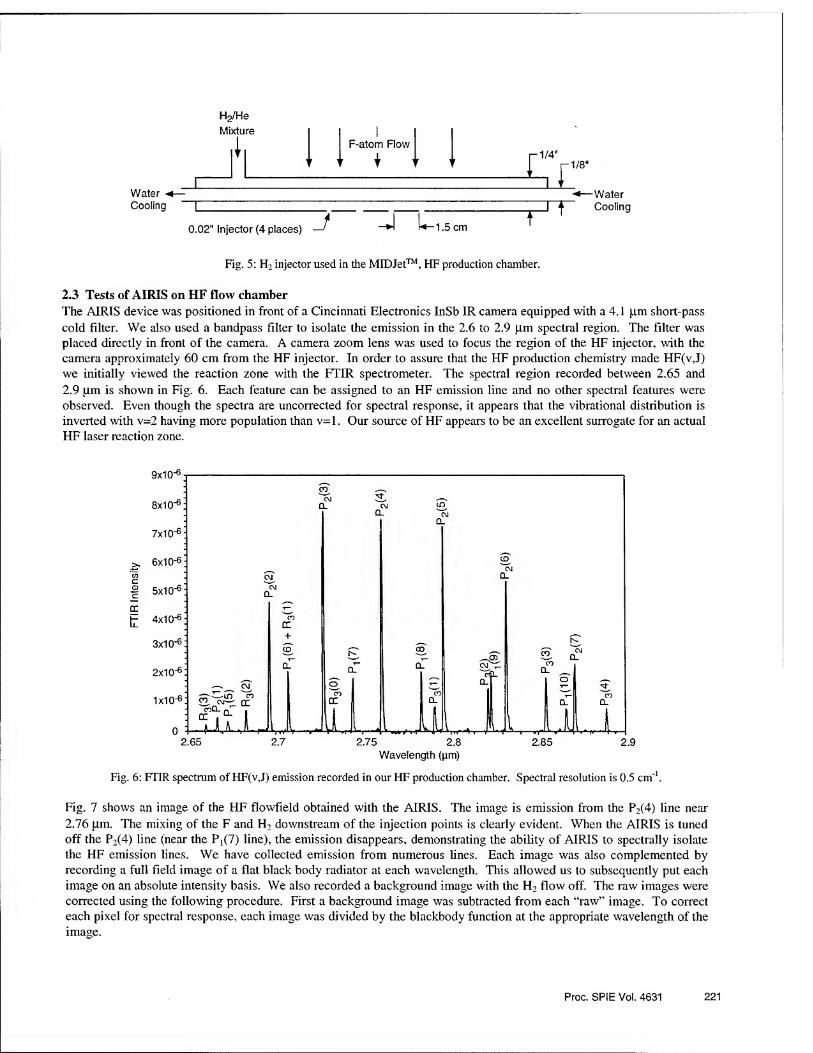
H2/He
Mixture ■I. Water - Cooling I -
0.02" Injector (4 places) J L- t.5 cm
Water Cooling
Fig. 5: H2 injector used in the MED Jet™, HF production chamber.
2.3 Tests of AIRIS on HF flow chamber The AIRIS device was positioned in front of a Cincinnati Electronics InSb IR camera equipped with a 4.1 pm short-pass cold filter. We also used a bandpass filter to isolate the emission in the 2.6 to 2.9 pm spectral region. The filter was placed directly in front of the camera. A camera zoom lens was used to focus the region of the HF injector, with the camera approximately 60 cm from the HF injector. In order to assure that the HF production chemistry made HF(v,J) we initially viewed the reaction zone with the FTIR spectrometer. The spectral region recorded between 2.65 and
2.9 pm is shown in Fig. 6. Each feature can be assigned to an HF emission line and no other spectral features were observed. Even though the spectra are uncorrected for spectral response, it appears that the vibrational distribution is inverted with v=2 having more population than v=l. Our source of HF appears to be an excellent surrogate for an actual HF laser reaction zone.
Wavelength (pm)
Fig. 6: FTIR spectrum of HF(v,J) emission recorded in our HF production chamber. Spectral resolution is 0.5 cm'1.
Fig. 7 shows an image of the HF flowfield obtained with the AIRIS. The image is emission from the P2(4) line near 2.76 pm. The mixing of the F and H2 downstream of the injection points is clearly evident. When the AIRIS is tuned off the P2(4) line (near the Pi(7) line), the emission disappears, demonstrating the ability of AIRIS to spectrally isolate the HF emission lines. We have collected emission from numerous lines. Each image was also complemented by recording a full field image of a flat black body radiator at each wavelength. This allowed us to subsequently put each image on an absolute intensity basis. We also recorded a background image with the H2 flow off. The raw images were corrected using the following procedure. First a background image was subtracted from each “raw” image. To correct each pixel for spectral response, each image was divided by the blackbody function at the appropriate wavelength of the image.
Proc. SPIE Vol. 4631 221

Fig. 7: AIRIS image of P2(4) emission from chemically produced HF.
To further demonstrate that AIRIS can be used to study mixing phenomena in an HF laser, we performed an additional analysis on the flow field images. In Fig. 8 we show a section of the mixing region just downstream of the hydrogen injectors. Four planes: A,B,C, and D are shown. In Fig. 9 we show contours of these four planes and the progression of the mixing is evident as the flow progresses from A to D.
We also developed a strategy to image the population inversion in the flow field. When placed on an absolute scale, one can subtract images of the same scene recorded on sequential emission transitions to obtain these population inversion images. The method is outlined in Fig. 10. We used this approach to produce images of the inversion density of the flow field. Fig. 11 shows an image of the spatially resolved population inversion between the HF(v,J) = (2,4) and (1,5) levels. This key demonstration shows that AIRIS can be used to interrogate the small signal gain, a key parameter in HF
lasers.
Fig. 8: HF emission from P2(5) line. Analysis slices are indicated. Flow direction is down.
222 Proc. SPIE Vol. 4631
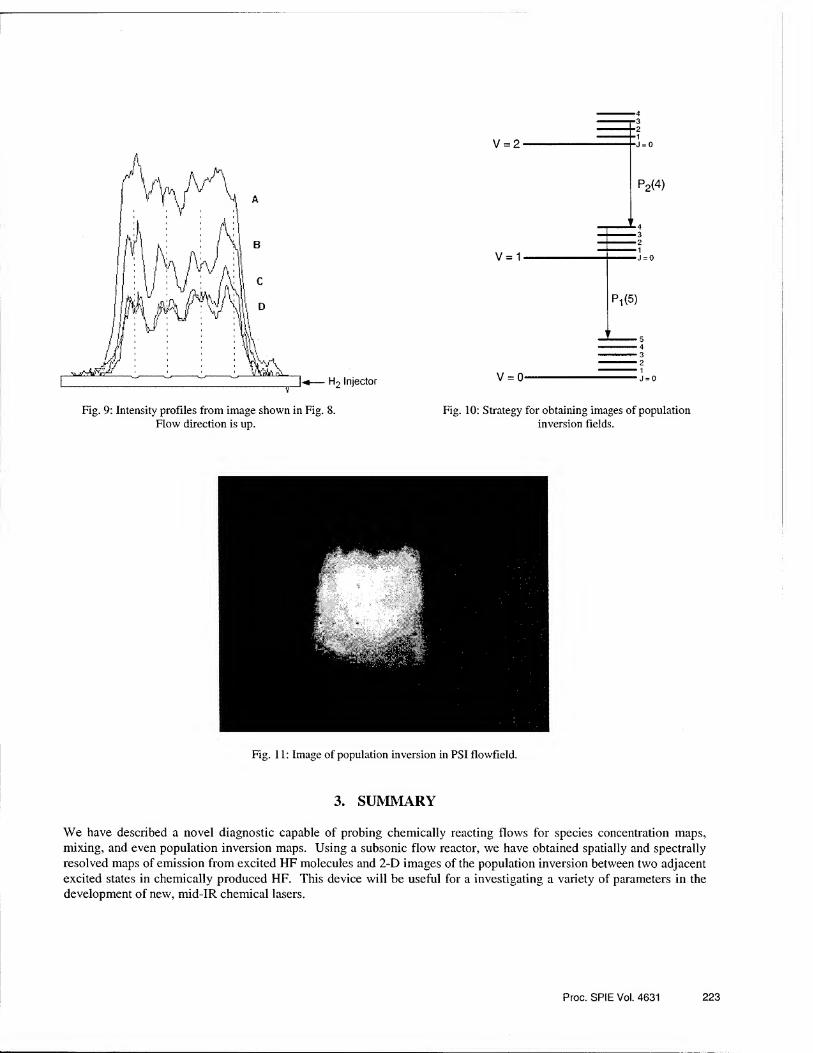
V = 2
H2 Injector
*4
. 3 — 2
V = 0-j = o
Fig. 9: Intensity profiles from image shown in Fig. 8. Flow direction is up.
Fig. 10: Strategy for obtaining images of population inversion fields.
Fig. 11: Image of population inversion in PSI flowfield.
3. SUMMARY
We have described a novel diagnostic capable of probing chemically reacting flows for species concentration maps, mixing, and even population inversion maps. Using a subsonic flow reactor, we have obtained spatially and spectrally resolved maps of emission from excited HF molecules and 2-D images of the population inversion between two adjacent excited states in chemically produced HF. This device will be useful for a investigating a variety of parameters in the development of new, mid-IR chemical lasers.
Proc. SPIE Vol. 4631 223

ACKNOWLEDGMENTS
The authors would like to thank Katie Boates for her assistance in the image data reduction. We also gratefully acknowledge the Air Force Research Laboratory Directed Energy Directorate, Kirtland AFB, NM for support of the effort under Contract #F29601-01-C-0091.
REFERENCES
1. Gross, R.W.F. and Bott, J.F., Handbook of Chemical Lasers, John Wiley & Sons, New York, 1976. 2. Kwok, M.A., “Measurement and Analysis of the HF Radiation form a Reacting Supersonic Jet”, Technical Report
TR-0074(4530)-3, The Aerospace Corporation, Los Angeles, CA (1973). 3. Sentman, L.H, "Mechanisms of HF Laser Performance," XIII International Symposium on Gas Flow and Chemical
Lasers and High-Power Laser Conference, Vol. 4184, Invited paper, Proceedings, SPIE, Florence, Italy
(September 2000). 4. Rapagnani, N.L. and Davis, S.J., “Laser Induced Fluorescence Measurements in a Chemical Laser Flowfield”, AIAA
Journ. 17, p. 1402, 1979. 5. Rapagnani, N.L. and Davis, S.J., “Laser Induced Fluorescence: A Diagnostic for Fluid Mechanics ” Lasers and
Applications” IW5, 127 (1985). 6. Jacquinot, P. and Dufour, C., CRMS J.Resh. 61, p. 91, 1948. 7. Neumann, D.K., Clark, P.K., Shea, R.F., and Davis, S.J., “02 Pressure Broadening of the Iodine 2P]/2...2P3/2
Transition”, J.Chem. Phys. 79, p. 4680, 1983.
224 Proc. SPIE Vol. 4631

Room Temperature Rate Constant For H + F2
Jiande Hana, Gerald C. Manke nb, and Michael C. Heaven1* aDepartment of Chemistry, Emory University, Atlanta, GA 30322
bAir Force Research Laboratory, Directed Energy Directorate, Kirtland AFB, NM 87117
ABSTRACT The rate constants for H atom reactions with Cl2 and F2 have been measured by monitoring the loss rate of hydrogen
atoms in the presence of excess [Cl2] and [F2] via time-resolved, laser-induced Lyman-a fluorescence. The rate constants for H + F2 and H + Cl2 were found to be 2.4 ± 0.4 (2a) x 10~12 and 2.52 ± 0.18 (2a) x 10'11 cm3 molecules'1 s'1, respectively. The result for H + F2 is consistent with the recommendation of Baulch et. al. (J. Phys. Chem. Ref. Data 10 (suppl. 1) (1981)) and our k(H + Cl2) value is consistent with the majority of previous measurements.
1. INTRODUCTION A chemical HF laser can be used to produce a high power 2.7 |iim beam. Vibrationally excited HF is generated
primarily by the F atom reaction with molecular hydrogen F + H2-» HF(v = 0-3) + H. [1]
or via the secondary reaction H + F2^HF(v = 0-9) + F. [2]
The rate constant1,2 and nascent HF(v) distribution3,4 for reaction [1] are well established, k^T) = 1.1 ± 0.1 x 10'10 exp(- (450±50)/T) cm3 molecules'1 s'1 and 0.0 : 0.15 : 0.55 : 0.30 for P0:Pi:P2:P3. The detailed dynamics of reaction [1] have been exhaustively studied, both theoretically5,6 and experimentally7'12 by numerous investigators.
Surprisingly, the same cannot be said for reaction [2]. The 1981 kinetics review by Baulch et. al.13 lists only 8 previous measurements of the rate constant (compared to 22 for reaction [1]) and recommends k2(T)= 1.46 x 10‘10 exp(- 1210/T) cm3 molecules'1 s'1 and k2(298 K) = 2.5 x 10"12 cm3 molecules'1 s'1. A 1983 review by Cohen & Westberg14 evaluated the same ensemble of measurements and selected k2(T) = 4.8 x 10¹⁵ T14 exp(-667/T) cm3 molecules"1 s'1 and k2(298 K) = 1.5 x 10"12 cm3 molecules"1 s'1. Both recommendations are based primarily on mass-spectrometric experiments by Dodonov and co-workers.15,16 (k2(T) = 2.0 ± 0.2 x 10'10 exp((-1210 ± 100)/T) cm3 molecules"1 s'1 for T = 294 - 565 K) and Homann, et. al.17 (k2(T) = 6.6 ± 1.7 x 10"11 exp((-l 110 ± 50)/T) for T = 224 - 493 K). The activation energies of both expressions are essentially the same but the pre-exponential factors differ by a factor of 3. Additional measurements by Levy & Copeland18, Rabideau et al.19, and Sung, et al. 20 have also been reported. Levy and Copeland18 measured F2 consumption following UV irradiation of a H2, F2, N2 and 02 mixture. They did not measure k2 directly; rather, they report the rate constant ratio between reaction [2] and H + 02 + M -> H02 + M. Using the accepted value for the reference reaction13, their result corresponds to k2(298 K) = 1.0 x 10'12 cm3 molecules"1 s'1. Rabideau, et. al. added molecular fluorine to a fast-flowing mixture of H and H2 diluted in He, while monitoring the concentration of F and H atoms via EPR. The room temperature rate constants for reactions [1] and [2] were determined to be 6.6 ± 1.7 x 10'12 and 4.2 ± 0.3 x 10'12 cm3 molecules'1 s'1, respectively. Their result for ki is approximately a factor of 4 lower than the recommended value of Baulch13. Sung et al.20 measured the infrared chemiluminescence from HCl(v) and HF(v) products generated by H atom reactions with Cl2, F2, C1F, and IC1. Although they "make no strong claim on the reliability of the H + F2 rate constant," they report a ratio of k2 / k3 = 0.053, where k3 is the rate constant for
H + Cl2 HCl(v = 0 - 4) + Cl. [3] If the recommended value for k3 is used (1.9 x 10"11 cm3 molecules'1 s'1 at 298 K)13, k2 = 1.0 x 10'12 cm3 molecules'1 s'1. Considering the importance of reaction [2], and the scarcity of experimental data, a new direct measurement of k2 seems timely.
In addition to reaction [2], we have also re-examined the rate constant for reaction [3] which is an important source of HCl(v) in the HC1 chemical laser system. Reaction [3] was also used as a reference for competitive H atom
OH 91 a 99 A
reaction studies" . Dobis and Benson ~ recently applied their very low-pressure reactor (YLPR) technique to this reaction and measured k3(298 K) = 0.96 ± 0.04 x 10"11 cm3 molecules'1 s'1. This result is a factor of 2 smaller than the generally accepted value given by Baulch, et. al. as k3(T)= 1.4 x 10"i0 exp(-590/T) for T = 250 - 730 K and k3(298 K) = 1.9 x 10 11 cm3 molecules"1 s'1. Even though Baulch assigns the uncertainty for reaction [3] at ± 50%, Dobis and
Gas and Chemical Lasers and Intense Beam Applications III, Steven J. Davis, Michael C. Heaven, Editors, Proceedings of SPIE Vol. 4631 (2002) © 2002 SPIE • 0277-786X702/$ 15.00 225

Benson's value seems anomalously small relative to numerous previous measurements, and another measurement of k3
seems appropriate. We report the direct measurement of the rate constants for the reaction of H atoms with molecular fluorine and
chlorine. We generate low concentrations of H atoms via photolysis of H2S in the presence of a large excess of F2 or Cl2
and monitor the loss rate of [H] by laser induced fluorescence of the Lyman a transition. Typically, the initial pool of H atoms is consumed in 100 - 200 microseconds or less, and complications related to secondary reactions with products of the primary reaction and wall losses are avoided. Our ability to produce H atoms without H2 is particularly important for the measurement of k2. All previous measurements have used molecular hydrogen as their H atom source. In some cases a discharge is applied to the H2 directly, while in others a discharge based F atom source and F + H2 pre-reactor are used to generate a known flow of H atoms. Undissociated H2 rapidly reacts with atomic fluorine to regenerate H atoms. This not only complicates the analysis, but also ties the accuracy of the measurement to some assumption about the rate constants for the secondary reactions. Our method eliminates these considerations and simple pseudo first-order kinetics
can be applied. 2. EXPERIMENTAL METHODS
Ground state hydrogen atoms were generated by pulsed photolysis of H2S. To observe the reaction with F2 or Cl2, the H2S was present as a minor constituent (approximately 6.5 x 10¹⁴ moleclues cm3 or less) of H2S/F2 or Cl2 (in He)/Ar mixtures. Various partial pressures of the halogen/He mixtures were used. Pseudo first-order conditions were achieved by adding 0.5 - 6.0 Torr of a 5% CL in He mixture (Matheson) or 0.5 - 1.75 Torr of a 10% F2 in He mixture (Matheson). The main carrier gas was Ar and the total reactor pressure was typically 100 Torr. The flow rates of H2S and Ar were controlled by needle valves while a mass flow controller was used for F2 or Cl2 addition.
Hydrogen sulfide was photolyzed at 193 nm by a Lumonics TE-860-4 excimer laser operating at 10 Hz. The laser emission (~60 mJ/pulse) was focused by a 50 cm focal length lens, providing a power density that was sufficient to dissociate all of the H2S in the focal region. Photodissociation at 193nm produces translationally hot H and SH fragments23 24. The high pressure of Ar buffer gas was used to thermalize the H atoms and limit their diffusion out of the detection region. Both F2 and CL have very weak absorption cross-sections at 193 nm, and were not photodissociated to
any significant degree. LIF detection of H atoms was accomplished by two-photon excitation of the 2s- Is transition of atomic
hydrogen. Collisions with Ar rapidly quench the 2s state to 2/?, which then emits Lyman a radiation as it relaxes back to the ground state. A tunable dye laser (Lambda-Physik EMG-203/FL3002 system) was used to generate 486 nm light. This was frequency doubled using a BBO crystal. A short (20 cm) focal length lens was used to focus the UV in the center of the photolysis cell. The photolysis and LIF lasers were arranged in an overlapping, counter-propagating configuration, see Figure 1. The delays between the photolysis and probe laser pulses were controlled with a precision pulse delay generator (SRS model DG535). A Hammamatsu R6835 solar blind photomultiplier tube and narrow band interference filter (121 nm, 10 nm FWHM) combination was used to detect the vacuum ultraviolet fluorescence while discriminating against scattered UV light from the photolysis and probe lasers. The probe laser was scanned across the
Lyman-a spectrum to measure the line width, 1.2 cm1, confirming a thermal H atom translational distribution. Some difficulty was encountered in finding appropriate conditions for the H + F2 reaction. Early on, it was
discovered that H2S and F2 could not be mixed too far upstream of the photolysis region due to a slow pre-reaction between F2 and H2S (k < 6.4 x 10'16 cm3 molecules'1 s'1)25. This problem was manifested by a total loss of the H atom LIF signal at high [F2]. To limit the consumption of [H2S], the reaction time was minimized by mixing the reagents just prior to their injection into the photolysis reactor. A second and more troublesome complication for the collection of reliable H + F2 data was then discovered. For moderate to high [F2] and long delays between the photolysis and probe laser pulses, the LIF signal deviated significantly from single exponential decay. Vibrationally excited HF is produced by H + F2. The bond strength of HF is 136.3 kcal mol'1 and a single 243 nm photon can photolyze HF(v > 2). The deviation from single exponential decay was associated with the regeneration of H atoms from probe laser photolysis of
vibrationally excited HF. This problem was minimized by considering only the first 50- 100 (is of the decay curve and
keeping [F2] relatively low. Measurements for the H+C12 system were straightforward. We did not see any evidence of a pre-reaction
between HoS and CL, and the H atom decay curves were single exponentials for all of the conditions investigated.
3. RESULTS AND DISCUSSION 3.1. H + F2
A pair of representative H atom decay curves are shown in the upper panel of Figure 2. For our conditions, the
slow decay in the absence of added F2 (r~2700 s'1) was dominated by diffusion out of the small volume sampled by the
226 Proc. SPIE Vol. 4631

probe laser. The addition of [F2] = 2.5 x 10¹⁵ molecules cm'3 clearly increased the H atom loss rate. Within the 0 - 100
ps range the decay curves were single exponential and the rate constant was extracted by fitting the data to the expression
y = y0 + Ae~bt [a]
where
b = k2[F2] + T. [b]
and T^is the loss rate when [F2] is not present. The baseline intensity, yo, was determined from the pre-photolysis pulse signal level. For the case shown in Figure 2, an exponential fit gives b = 8927 s'1. The decay rate vs. [F2] data are summarized in Table 1 and plotted in Figure 3. The slope of Figure 3 gives the rate constant, k2 = 2.4 ± 0.4 (2a) x 10‘12 cm3 molecules'1 s'1.
Table 2 summarizes the results from the 8 previous reports of k2. Our result compares well with the recommended value of Baulch et al.13 and the experimental results of Dodonov et al.15. The agreement with Homann et al.9 is marginal (just inside the combined error bars), and we are in poor agreement with Sung et al.20. Levy and Copeland18, and Rabideau et al.19. Interestingly, Baulch et al.13 chose a k2 value that lies halfway between the results of
Homann et al.9 (k2(298 K) = 1.6 ± 0.4 x 10'12 cm3 molecules1 s'1) and Dodonov et al.7,8 (k2(298 K) = 3.0 ± 0.4 x 10'12 cm3 molecules'1 s'1). Although Dodonov et al.'s method has been criticized for its poor definition of the reaction time and the unknown role of mixing17, the results appear to be accurate not only for the H + F2 reaction but also for H + Cl2, see Table 4 and the discussion below. 3.2. H + Cl2
We tested the reliability of our method by applying it to the well-studied H + Cl2 reaction. As the rate constant
for H atom removal is large, this system should be less sensitive to variations in r, the baseline decay rate. Representative temporal profiles of the [H] dependent VUV fluorescence signal with and without added Cl2 are shown in the upper panel of Figure 4. The addition of [Cl2] (-50 mTorr) dramatically increased the H atom decay rate and the entire time history was consistent with a single exponential decay. Clearly, the reaction does not yield products that, on photolysis by the probe laser, produce H atoms.
A sample exponential fit is shown in the lower panel of Figure 4. For the sake of comparison, a simulated curve for k3 = 9.6 x 10'12 cm3 molecules'1 s'1 is also shown. Figure 5 and Table 3 summarize the conditions and results for reaction [3]. The slope of the plot in Figure 5 gives k3 = 2.52 ± 0.18 (2g) x 10'11 cm3 molecules'1 s'1 and the intercept is consistent with the measured decay rate in the absence of Cl2.
Our result is in good agreement (i.e. within the combined error bars) with the recommended value of Baulch et. al.13, and other previous measurements, see Table 4. The difference between Dobis and Benson's22 value and ours is outside of the combined uncertainty.
Table 4 shows that the results from previous measurements of k3 can be roughly separated into two groups. A majority of the previous studies report k3 = 2 ± 1 x 10'11 cm3 molecules'1 s'1, while a smaller number give k3 < 1 x 1011 cm3 molecules1 s'1. A more detailed examination of this second group of experiments shows that nearly all were performed under conditions where secondary reactions were important and the primary data must be carefully processed to extract k3. For example, the experiments of Klein and Wolfsberg26 and Armstrong and co-workers27,28 provided estimates for the ratio of the rate constants for reactions [3] and [4]
H + HC1 -> Cl + H2 [4] by measuring the yield of H2 following long-term irradiation (i.e. many minutes of reaction time) of a variety of gaseous mixtures containing HC1. Their results26,28 range from k4/k3 = 1.07 ± 0.15 x 10'2 to 8.8 ± 0.5 x 10"3. If the Baulch et al.13 recommendation for k4 is adopted (1^(298 K) = 4.25 x 10'14 cm3 molecules'1 s'1), then k3 ranges from 4.1 ± 0.6 x 10" 12 12 3 11 " to 4.8 ± 0.3 x 10* cm molecules' s' . Because of the long reaction times and the chemical complexity of the system, a complicated mechanism must be deconvoluted to extract the ratio k^. In addition, the role of wall reactions could not be determined and considerable error can occur if the model is not complete.
The present result is also in disagreement with the k3 value reported by Whytock and co-workers29,30 (k3(298) = 0.7 ± 0.22 x 10'11 cm3 molecules'1 s'1). The accuracy of this measurement has been examined on several occasions22,31,32. Most attribute the disagreement with their results to the lack of pseudo first-order conditions in Whytock's experiments and the fact that Whytock was working in an extremely difficult H atom detection regime for his electron spin resonance instrument.
Proc. SPIE Vof. 4631 227

The most recent measurement of k3 by Dobis and Benson~~ gives k3 = 0.96 ± 0.04 x 10 11 cm3 molecules 1 s \ In their experiment, a phosphoric acid coated discharge tube was used to create a small [HI (~1010 atoms cm'3) to which Cl2 was added. Mass spectrometry was used to monitor [Cl2], [Cl], and [HC1]. Dobis and Benson attribute the difference between their result and the larger k3 values listed in Table 4 to un-accounted for wall reactions that remove H atoms. The difference between our result, which is unaffected by wall effects, and Dobis and Benson's is not entirely clear. We note that Dobis & Benson’s33,34 application of their VLPR apparatus to the Cl + HBr reaction also resulted in a rate constant that was a factor of two smaller than the majority of previous results35*37.
4. SUMMARY The H+F2 and H+C12 reactions were examined under pseudo first order conditions. Pulsed photolysis of low
concentrations of H2S was used to generate H atoms. The subsequent removal of H atoms was monitored by two-photon
laser induced fluorescence. For H+C12, simple exponential decay curves were observed, and a rate constant of 2.52 ±
0.18 (2g) x 10*11 cm3 molecules*1 s*1 was obtained. This value was in good agreement with several earlier
determinations. Study of the reaction H+F2 was complicated by the production of vibrationally excited HF, which could be
photodissociated by the probe laser. Measurements were made under conditions that minimized the influence of this
secondary process. The initial H atom decay rate as a function of [F2] defined a rate constant of 2.4 ± 0.4 (20) x 10 cm3 molecules*1 s*1. This result is in good agreement with the value obtained by Baulch et al.13 from a critical review of previous determinations. We recommend continued use of the Baulch et al.13 Arrhenius parameters in computational
models of HF chemical lasers. 5. ACKNOWLEDGMENTS
We gratefully acknowledge support of this work by AFOSR under grant F49620-01-1-0070. 6. REFERENCES
(1) A. Persky and H. Komweitz, Int. J. Chan. Kinet. 1997, 29, 67. (2) G. C. Manke II and G. D. Hager, J. Phys. Chem. Ref. Data 2001, 50, 713 (3) M. J. Berry, J. Chem. Phys. 1973, 59, 6229. (4) D. S. Perry and J. C. Polanyi, Chem. Phys. 1976, 72, 419. (5) F. J. Aoiz, L. Banares, B. Martinez-Haya, J. F. Castillo, D. E. Manolopoulos, K. Stark, and H. J.
Werner. J. Phys. Chem. A 1997, 707, 6403. (6) V. M. Azriel, G. D. Billing, L. Yu. Rusin, and M. B. Sevryuk. Chem. Phys. 1995, 795, 243. (7) D. M. Neumark, A. M. Wodtke, G. N. Robinson, C. C. Hayden, and Y. T. Lee. J. Chem. Phys. 1985,
82, 3045. (8) F. Dong, S. H. Lee, and K. Liu. J. Chem. Phys. 2000, 773, 3633. (9) W. B. Chapman, B. W. Blackmon, and D. J. Nesbitt. J. Chem. Phys. 1997, 707, 8193. (10) S. A. Nizkorodov, W. W. Harper, W. B. Chapman, B. W. Blackmon, and D. J. Nesbitt. J. Chem. Phys.
1999,777,8404. (11) M. Faubel, L. Yu. Rusin, S. Schlemmer, F. Sondermann. U. Tappe, and J. P. Toennies. J. Chem. Phys.
1994, 707, 2106. (12) M. Faubel, L. Yu. Rusin, S. Schlemmer, F. Sondermann, U. Tappe, and J. P. Toennies. J. Chem. Soc.
Faraday Trans. 1993, 89, 1475. (13) D. L. Baulch, J. Duxbury, S. J. Grant, and D. C. Montague. J. Phys. Chem. Ref. Data 1981, 70 (Suppl.
1). (14) N. Cohen and K. R. Westberg, J. Phys. Chem. Ref. Data 1983, 72, 531. (15) R. G. Albright, A. F. Dodonov, G. K. Lavrovskaya, 1.1. Morosov, and V. L. Tal'roze. J. Chem. Phys.
1969,50,3632. (16) A. F. Dodonov, G. K. Lavrovskaya, 1.1. Morozov, R. T. Ulbright, V. L. Tal'roze, and A. K.
Lyubimova. Kinetics and Catalysis 1970, 77, 677. (17) K. H. Homann, H. Schweinfurth, and J. Wamatz. Ber. Bunsenges. Phys. Chem. 1977, 87, 724. (18) J. B. Levy and B. K. W. Copeland, J. Phys. Chem. 1968, 72, 3168. (19) S. W. Rabideau, H. G. Hecht, and W. B. Lewis. J. Magn. Resonance 1972, 6, 384. (20) J. P. Sung, R. J. Malins, and D. W. Setser. J. Phys. Chem. 1979, 83, 1007. (21) G. C. Manke II and D. W. Setser, J. Phys. Chem. A 2000, 704, 11013. (22) O. Dobis and S. W. Benson, J. Phys. Chem. A 2000, 704, 111.
(23) W. G. Hawkins and P. L. Houston, J. Chem. Phys. 1980, 73, 297.
228 Proc. SPIE Vol. 4631

(24) P. A. Berg and J. J. Sloan, J. Chem. Phys. 1994,100,1075. (25) A. A. Tumipseed, and. J. W. Birks, J. Phys. Chem. 1991, 95, 6569. (26) F. S. Klein and M. Wolfsberg, J. Chem. Phys. 1961, 34, 1494. (27) D. K. Jardine, N. M. Ballash, and D. A. Armstrong. Can. J. Chem. 1973,51, 656. (28) D. S. Davidow, R. A. Lee, and D. A. Armstrong. J. Chem. Phys. 1966, 45, 3364. (29) P. F. Ambidge, J. N. Bradley, and D. A. Whytock. J. Chem. Soc. Faraday Trans. 1 1976, 72, 1157. (30) P. F. Ambidge, J. N. Bradley, and D. A. Whytock. J. Chem. Soc. Faraday Trans. 1 1976, 72, 2143. (31) P. P. Bemand and M. A. A. Clyne, J. Chem. Soc. Faraday Trans. 2 1977, 73, 394. (32) H. G. Wagner, U. Welzbacher, and R. Zellner. Ber. Bunsenges. Phys. Chem. 1976, 80, 902. (33) O. Dobis and S. W. Benson, J. Phys. Chem. A 1997,101, 1305. (34) O. Dobis and S. W. Benson, J. Phys. Chem. 1995, 99, 4986. (35) C. C. Moore, and C. B. Moore, J. Chem. Phys. 1977, 67, 3636. (36) D. A. Dolson and S. R. Leone, J. Phys. Chem. 1987, 91, 3543 (37) R. Rubin and A. Persky, J. Chem. Phys. 1983, 79, 4310. (38) D. H. Stedman, D. Steffenson, and H. Niki. Chem. Phys. Lett. 1970, 7, 173. (39) J. V. Michael and J. H. Lee, Chem. Phys. Lett. 1977, 51, 303. (40) S. Jaffe and M. A. A. Clyne, J. Chem. Soc. Faraday Trans. 2 1981, 77,531. (41) D. Kita and D. H. Stedman, J. Chem. Soc. Faraday Trans. 2 1982, 78, 1249. (42) J. V. Seely, J. T. Jayne, M. J. Molina. Int. J. Chem. Kinet. 1993,25,571.
Table 1; Conditions and Results for H + F2 measurements
[F2] 1015 molec cm"3
H atom decay ratea 105 s’1
m 1015 molec cm'3
H atom decay rate 105 s'1
1.063 0.044 3.928 0.114 1.578 0.070 3.928 0.117 1.578 0.038 3.928 0.119 2.318 0.067 4.540 0.141 2.415 0.088 4.991 0.164 2.512 0.074 5.120 0.189 2.512 0.089 5.152 0.150 3.252 0.092 5.571 0.145 3.928 0.084
These are the raw observed decay rates, uncorrected for the decay rate (T) in the absence of F2
Table 2: Comparison of measured rate constants for H+F2 at 298 K
Reference k,(298 K) (x 1012 cm3 molecules"1 s"1)
Experiments Homann, et. al.17 1.6+ 0.4 Albright, et. al.15,16 3.0 ±0.4 Sung, et. al.20 1.0a Levy & Copeland 18 1.0±0.15b Rabideau, et. al.19 4.2 ±0.3 This work 2.4 ±0.4
Reviews
Baulch, et. al. 1 2.5C a authors reported k2/ k3 = 0.053, absolute value calculated using k3 = 1.9 x 10‘u from ref. 13. b authors reported k2/ k(H+02+M)[M] = 4.6 ± 0.7, absolute value calculated using k(H+02+M)[M] from ref. 13.c recommendation based on literature review.
Proc. SP1E Vol. 4631 229

Table 3; Conditions and Results for H + Cl2 measurements3
[C12] 1015 molec cm'3
Fluorescence decay rate 105 s_I
[Cl2] 1015 molec cm'3
Fluorescence decay rate 105 s’1
0.74 0.32 4.81 1.27
1.66 0.40 5.02 1.11
1.66 0.50 5.23 1.56
1.98 0.56 5.47 1.53
2.11 0.60 5.55 1.67
2.11 0.64 5.59 1.50
2.13 0.59 6.44 1.83
2.29 0.79 6.50 1.77
2.83 0.71 7.12 2.06
2.83 0.88 7.28 1.74
3.22 0.90 7.53 1.56
3.27 0.89 7.63 1.98
3.75 0.64 8.60 2.47
4.06 1.28 8.63 2.22
4.31 1.32 9.05 2.34
4.35 1.15 10.55 2.79
4.73 0.87
a These are the raw observed decay rates, uncorrected for the decay rate <T) in the absence of CL
Table 4: Comparison of measured rate constants for H+C12 at 298 K
Reference k,(298 K) (1011 cm3 molecules'1 s'1)
Klein & Wolfsberg26 0.46 ± 0.19ab Davidow, Lee, & Armstrong28 0.49 ± 0.03bc Jardine, B allash, & Armstrong27 0.43 ± 0.04b d Ambidge, Bradley, & Whytock29 0.70 + 0.14 Dobis & Benson22 0.96 ± 0.04
Dodonov, et. al.15,16 2.97 + 0.89 Stedman, Steffenson, and Niki38 3.5 + 1.2 Wagner, Welzbacher and Zellner9,32 1.91 ±0.25
Bemand & Clyne31 2.19 + 0.32
Michael & Lee39 1.6 ±0.1
Jaffe and Clyne40 2.13 ±0.78
Kita and Stedman41 1.7 ±0.26
Seeley, Jayne, and Molina42 1.8 ± 0.5e
This work 2.52 ± 0.18
a authors reported k* / k-* = 0.143 ± 0.033 exp(-(1540 ± 130)/RT).
b k}(298 K) calculated from k*(298 K)13 = 4.25 x 10'14 cm3 molecules'1 s'1.
c authors reported k* / k^ = 0.0088 ± 0.0005 at 298 K.
d authors reported k* / k3 = 0.01 ± 0.001 at 298 K. e authors do not give a numerical result, value in table is estimated from Figure 16 of reference 42.
230 Proc. SPIE Vol. 4631
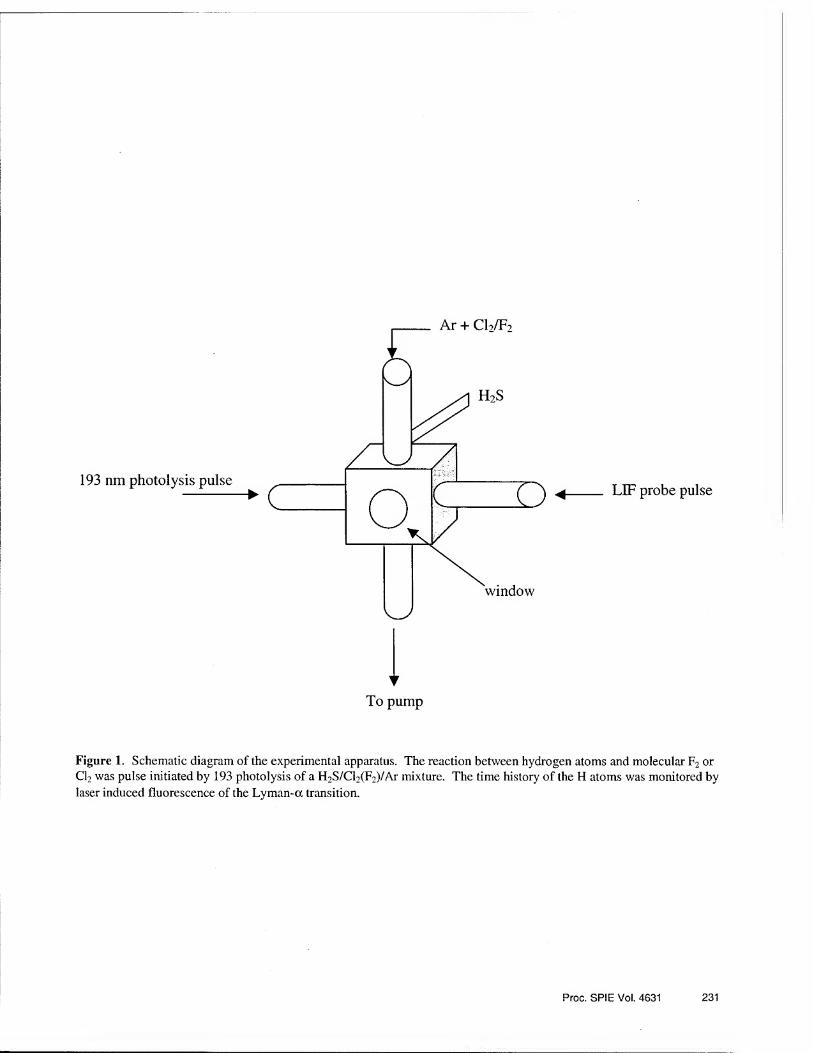
LIF probe pulse
* To pump
Figure 1. Schematic diagram of the experimental apparatus. The reaction between hydrogen atoms and molecular F2 or Cl2 was pulse initiated by 193 photolysis of a H2S/Cl2(F2)/Ar mixture. The time history of the H atoms was monitored by laser induced fluorescence of the Lyman-a transition.
Proc. SPIE Vol. 4631 231

Figure 2. Representative H + F2 data is shown. The slow decay in the absence of F2 in the upper panel is attributed to diffusion and H atom loss via reactions with photoproducts. The lower panel demonstrates the quality of the fit to a single exponential decay. The best
least squares fit gives k2 = 2.47 ± 0.11 cm3 molecules'1 s'1. For the sake of comparison, the background-corrected decay curve for k2 = 1.0 x 1012 cm3 molecules'1 s'1 is shown.
0 20 40 60 80 100
time (jis)
Figure 3. H atom decay rate vs. [F2]. The rate constant for reaction [2] is given by the
slope, k: = 2.4±0.4 (2c) x 10‘12 crn molecules"1 s'1. This result agrees with the previous measurements by Dodonov and co-workers1516 and the recommended value of Baulch, et. al13. The broken line represents k2 = 1.0 x 10’12 cm3 molecules'1 s'1.
0 1 2 3 4 5 6
[F2] (1015 molecules cm'3)
232 Proc. SP1E Vol. 4631

Inte
nsit
y (a
rb.
unit
s)
Inte
nsit
y (a
rb.
unit
s)
5
time (|xs)
Figure 4. Representative H + CI2 data is shown. The slow
decay in the absence of Cl2 in
the upper panel is attributed
mainly to diffusion out of the
observation zone with a minor
amount of H atom loss via
reactions with photoproducts.
The lower panel demonstrates
the quality of the fit to a single
exponential decay. The
corresponding rate constant is
2.47 ± 0.04 cm3 molecules'1 s'1.
Figure 5 H atom decay rate vs.
[Cl2]. The rate constant for
reaction [3] is given by the slope,
k3 = 2.52 ±0.18 (2a) x 10'11 cm3
molecules'1 s'1. This result agrees
with many previous measurements
and the recommended value of
Baulch, et. al1. Our result does not
agree with the recent result of
Dobis and Benson22, who reported
k3 = 0.96 ± 0.04 x 10'12 cm3
molecules1 s 1
Proc. SPIE Vol. 4631 233

Invited Paper
Study on IR and UV - lasers interaction with metal surfaces
Victor F. Tarasenko*, Sergey B. Alekseev, Audrey V. Fedenev, Igor’ M. Goncharenko, Nikolay N. Koval’, Konstantin V. Oskomov, Victor M. Orlovskii,
Nikolay S. Sochugov, Mikhail A. Shulepov
High Current Electronics Institute, Siberian Division of the Russian Academy of Sciences
(HCEI SB RAS)
ABSTRACT
The complex of experimental installations for studying of laser radiation interaction with surface of metals has been established. At titanium surface irradiating depending on the accumulated laser radiation energy, the surface color might be changed from bright yellow to red and deep-blue colors. The presented results testify to the possibility to use the change of titanium surface color at heating by laser irradiation in the open air to obtain dot raster images (even colored ones). Presently, from the world data available on interaction of laser radiation with metal and dielectric surfaces and development of experimental diagnostics techniques by itself it is allowed to raise a reverse question, i.e., restoration of laser radiation energy spatial distribution through surface imprint. Using imprints, it is also possible to make an express diagnostics of multi-layer surface coatings. With this in mind, we have made the detailed morphology of imprint of the pulsed HF-laser interaction with carbon steel surface through atomic force
microscope.
Keywords: titanium oxide, laser treatment, laser interaction with surface
1. INTRODUCTION
The harnessing of laser irradiation for surface treatment has been practically made at once as the first lasers were developed. Both the gas discharge IR lasers on C02 molecule transitions and solid-state Nd:YAG lasers have gained major application in this field1. C02-based laser with high efficiency and specific output parameters has a comparatively big wavelength and limited gas mixture lifetime. The Nd:YAG laser also has a high efficiency and it provides operation both in continuous and pulsed repetition modes (up to 100 kHz), but active medium scaling is rather poor. In this paper, preliminary results on lasers interaction with metal surfaces for recently developed lasers, i.e. non-chain gas discharge HF laser and Xe laser pumped by e-beam preionized electric discharge are presented. As objects for study, thin titanium foils and carbon steel samples (0.4% C, 0.8 — 1.0 % Cr, 4140(USA)) were taken.
Titanium oxide coatings attract particular interest in a row of applications such as optical coatings, decorative coatings, catalysts, medical implantates and gas sensors. A good technique to produce such coatings is laser irradiation of metallic titanium surface in reactive atmosphere. As it is presented by authors2, at titanium plate surface melting depending on the accumulated laser radiation energy, the surface color might be changed from bright yellow to red and deep-blue colors. In the paper2, the data on titanium surface oxidation in atmospheric pressure air at pulsed Nd:YAG lasing are presented. The laser operated at the wavelength of 1,064 nm, average radiation output of 60 W at 30 kHz. Several samples were treated by accumulation of different laser pulses per unit of square. The experiments were carried out at accumulated laser energy from 54 up to 294 J/cm2. The characteristics of the treated samples and different colors appeared were studied using various measurement techniques. Morphology analysis by scanning electron microscopy has revealed that melting and second solidification occurs during laser beam action in the whole range of exposure values. Moreover, at more high values of the accumulated fluxes the craters are forming. Measurements of spectral reflection allowed to determine chromatic coordinates corresponding to different
' [email protected]: phone: (+7 382-2) 258685; fax: (+7 382-2) 259410; http:// www.hcei.tsc.ru: High Current Electronics Institute, 4, Akademichesky Ave., Tomsk 634055, Russia
234
Gas and Chemical Lasers and Intense Beam Applications III, Steven J. Davis, Michael C. Heaven, Editors, Proceedings of SPIE Vol. 4631 (2002) ©2002 SPIE • 0277-786X/02/$15.00

colors observed on the samples. X-ray diffractometry has shown that at low exposure values no oxidation occurs but crystallites orientation change to the characteristic of powders distribution takes place. Difffactorgams at higher accumulated fluences reveal the formation of basically Ti20 and TiO crystalline phases among the oxides, which show a monotonic increase in their content with increase of irradiation rate. Other phases such as Ti02 either in rutile or anatase crystalline structures, or Ti203 were identified through Raman spectroscopy. The low Raman signal levels and absence of those phases in most of the dif&actograms points to that their contents is essentially smaller than that of Ti20 and TiO. Besides that, the change of signal levels as a function of the accumulated laser fluence is non¬ monotone. The comparison of the compositional analyses with color distribution observed shows that there is some correlation between the onset of the different colors and changes in the composition of samples2.
The above presented results testify to the possibility to use the change of titanium surface color at heating by laser irradiation in the open air to obtain dot raster images (even colored ones). For this, as an image carrier either a thin titanium layer (silver color) or titanium dioxide (white) at the paper surface can be used. From this reasoning, we have carried out experiments on determination of color change conditions for thin titanium foils irradiated by pulsed IR laser.
Presently, from the world data available on interaction of laser radiation with metal and dielectric surfaces and development of experimental diagnostics techniques by itself it is allowed to raise a reverse question, i.e., restoration of laser radiation energy spatial distribution through surface imprint. Using imprints, it is also possible to make an express diagnostics of multi-layer surface coatings. With this in mind, we have made the detailed morphology of imprint of the pulsed HF-laser interaction with carbon steel surface through atomic force microscope.
2. EXPERIMENTAL EQUIPMENT AND TECHNIQUES
Based on the developed at the HCEI e-beam accelerators and powerful electrical schemes, a succession of lasers based on high pressure gases was created3'8. For the experiments on laser radiation interaction with matter from the point of view of high power, high energy and high efficiency, the XeCf, C02 and HF molecules based lasers and lasers on atomic transitions of Xe were chosen. Radially convergent and planar e-beam based accelerators and set¬ ups with self-sustained discharge and e-beam-initiated discharge were used as excitation sources. Maximal radiation output energy in UV spectral range of up to 2 kJ has been obtained at X=308 nm for 600-1 e-beam pumped XeCl- laser6,7. Using the same experimental set-up but with Ar-Xe (>,=1.73 pm) and He-Ar-Xe (X=2.03 pm) mixtures, the output lasing as 100 and 50 J, correspondingly, has been achieved. Laser radiation output energy of 110 J at X=308 nm and of 90 J at X=249 nm were demonstrated using the set-up with a radially convergent e-beam and active volume of 30 liters and laser radiation aperture of 20 cm3. Choice of radially convergent e-beam pumping appeared to be successful for excitation of non-chain HF laser. The output energy of generation up to 200 J with efficiency up to 10 % in reference to the loaded into the gas e-beam energy has been obtained at the HF molecule transition at X~ 2.8 pm3,4. The average output laser radiation up to 1 kW was realized using C02 - laser pumped by e-beam preionized discharge at pulsed repetition rate (p.r.r.) of 50 Hz7. The use of inductive energy storage for pumping of non-chain discharge HF laser allowed to obtain lasing with the efficiency up to 5.5 % in reference to the input energy in gas, and use of zeolite absorber allowed to increase the gas mixture lifetime up to 1000 pulses7,8. Use of the generator based on inductive energy storage in order to form a prepulse in the gas discharge XeCl laser allowed to form a high homogeneity discharge and to increase duration of oscillation up to 450 ns at output energy up to 1.1 J and total efficiency of 2.2 %. The main parameters of the experimental laser set-ups are presented in the Table 1.
In our experiments we used two laser set-ups. The set-up Jfe 1 was based on the e-beam preionized discharge laser7. Active gas volume of 72-3*2,4 cm3 was bounded by a copper electrode and a steel mesh protecting the electron accelerator exit foil window. The e-beam parameters were as follows: duration of 4 ns, total current behind the foil of 6 kA, and average energy of electrons behind the foil was of ~ 150 keV. The bank of capacitors with total capacitance of 0.2 pF was situated directly in the gas chamber being charged up to 10-12 kV. The resonator consisted of a flat mirror with aluminum coating and a parallel-plane plate KRS-5 as output window. The parallel- plane resonator provided laser radiation divergence of about 1,6 mrad. Water cooling systems of the output foil window and operating mixture circulation at flow velocity of about 10 m/s allowed operation at p.r.r. of up to 50 Hz. The mixture Ar:Xe=100:l at pressure of 1 atm was used. The main part of laser energy was radiated at X = 1.73 pm.
Proc. SPIE Vol. 4631 235
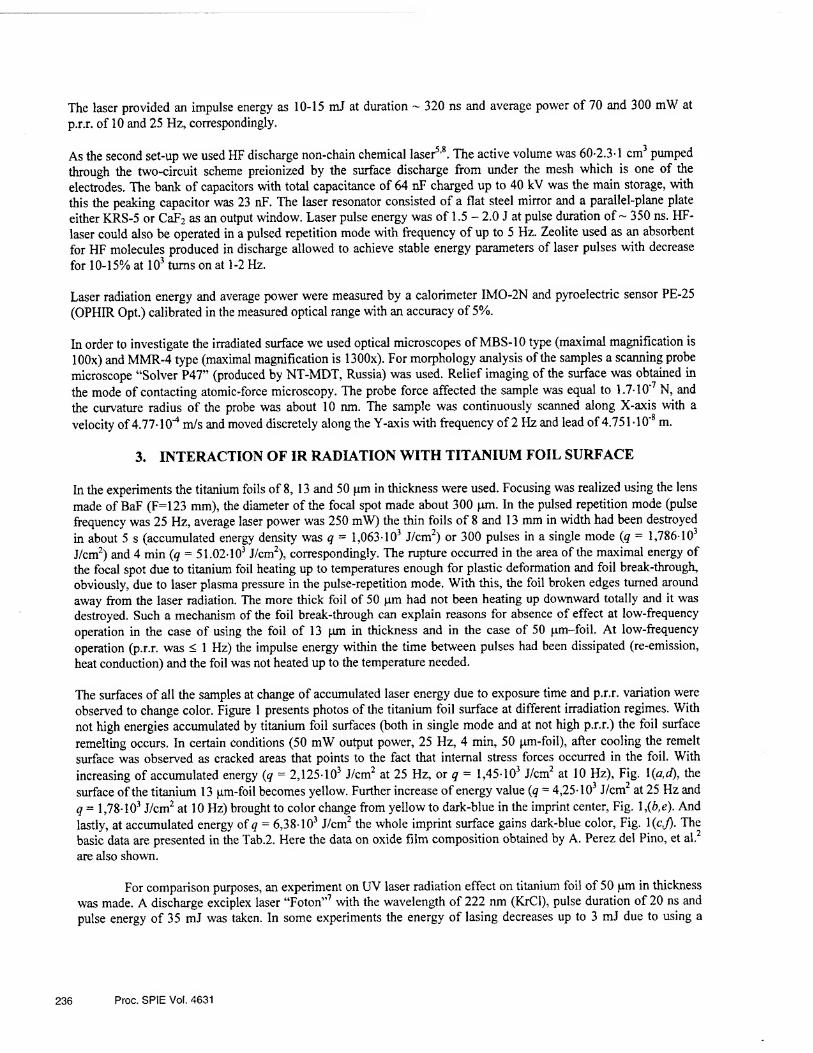
The laser provided an impulse energy as 10-15 mJ at duration ~ 320 ns and average power of 70 and 300 mW at
p.r.r. of 10 and 25 Hz, correspondingly.
As the second set-up we used HF discharge non-chain chemical laser5,8. The active volume was 60-2.3-1 cm3 pumped through the two-circuit scheme preionized by the surface discharge from under the mesh which is one of the electrodes. The bank of capacitors with total capacitance of 64 nF charged up to 40 kV was the main storage, with this the peaking capacitor was 23 nF. The laser resonator consisted of a flat steel mirror and a parallel-plane plate either KRS-5 or CaF2 as an output window. Laser pulse energy was of 1.5 - 2.0 J at pulse duration of ~ 350 ns. HF- laser could also be operated in a pulsed repetition mode with frequency of up to 5 Hz. Zeolite used as an absorbent for HF molecules produced in discharge allowed to achieve stable energy parameters of laser pulses with decrease
for 10-15% at 103 turns on at 1-2 Hz.
Laser radiation energy and average power were measured by a calorimeter IMO-2N and pyroelectric sensor PE-25 (OPHIR Opt.) calibrated in the measured optical range with an accuracy of 5%.
In order to investigate the irradiated surface we used optical microscopes of MBS-10 type (maximal magnification is lOOx) and MMR-4 type (maximal magnification is 1300x). For morphology analysis of the samples a scanning probe microscope “Solver P47” (produced by NT-MDT, Russia) was used. Relief imaging of the surface was obtained in
the mode of contacting atomic-force microscopy. The probe force affected the sample was equal to 1.7-1 O'7 N, and the curvature radius of the probe was about 10 nm. The sample was continuously scanned along X-axis with a
velocity of 4.77-10-4 m/s and moved discretely along the Y-axis with frequency of 2 Hz and lead of 4.751 -10'8 m.
3. INTERACTION OF IR RADIATION WITH TITANIUM FOIL SURFACE
In the experiments the titanium foils of 8,13 and 50 pm in thickness were used. Focusing was realized using the lens made of BaF (F=123 mm), the diameter of the focal spot made about 300 pm. In the pulsed repetition mode (pulse frequency was 25 Hz, average laser power was 250 mW) the thin foils of 8 and 13 mm in width had been destroyed in about 5 s (accumulated energy density was q = 1,063-103 J/cm2) or 300 pulses in a single mode (q = 1,786-103 J/cm2) and 4 min (q - 51.02 103 J/cm2), correspondingly. The rupture occurred in the area of the maximal energy of the focal spot due to titanium foil heating up to temperatures enough for plastic deformation and foil break-through, obviously, due to laser plasma pressure in the pulse-repetition mode. With this, the foil broken edges turned around away from the laser radiation. The more thick foil of 50 pm had not been heating up downward totally and it was destroyed. Such a mechanism of the foil break-through can explain reasons for absence of effect at low-frequency operation in the case of using the foil of 13 pm in thickness and in the case of 50 pm—foil. At low-frequency operation (p.r.r. was < 1 Hz) the impulse energy within the time between pulses had been dissipated (re-emission, heat conduction) and the foil was not heated up to the temperature needed.
The surfaces of all the samples at change of accumulated laser energy due to exposure time and p.r.r. variation were observed to change color. Figure 1 presents photos of the titanium foil surface at different irradiation regimes. With not high energies accumulated by titanium foil surfaces (both in single mode and at not high p.r.r.) the foil surface remelting occurs. In certain conditions (50 mW output power, 25 Hz, 4 min, 50 pm-foil), after cooling the remelt surface was observed as cracked areas that points to the fact that internal stress forces occurred in the foil. With
increasing of accumulated energy (q = 2,125-103 J/cm2 at 25 Hz, or q = 1,45-103 J/cm2 at 10 Hz), Fig. 1 (a,d), the surface of the titanium 13 pm-foil becomes yellow. Further increase of energy value (q = 4,25-103 J/cm2 at 25 Hz and q - 1,78-103 J/cm2 at 10 Hz) brought to color change from yellow to dark-blue in the imprint center. Fig. 1 ,(/>,<?). And lastly, at accumulated energy of q = 6,38-103 J/cm2 the whole imprint surface gains dark-blue color, Fig. 1 (c,f). The basic data are presented in the Tab.2. Here the data on oxide film composition obtained by A. Perez del Pino, et al.2
are also shown.
For comparison purposes, an experiment on LTV laser radiation effect on titanium foil of 50 pm in thickness was made. A discharge exciplex laser “Foton”7 with the wavelength of 222 nm (KrCl), pulse duration of 20 ns and pulse energy of 35 mJ was taken. In some experiments the energy of lasing decreases up to 3 mJ due to using a
236 Proc. SPIE Vol. 4631

diaphragm. The laser could operate in a single pulse regime or at p.r.r. of 1 Hz. The radiation focusing was realized using quartz lens with focal distance of 10 cm. In those regimes tried (single pulse regime, pulsed repetition regime with frequency of 1 Hz) there was a crater followed after on the titanium foil surface with melt bottom of the silver color. At multiple irradiation (over 5 pulses) there the bands of yellow-orange and blue colors appeared around the crater. The melt surface of the crater represented by itself a wavy structure, most clearly expressed at multiple laser action (10-15 pulses). The colored bands around the crater are probably determined by deposition of titanium oxides, having been evaporated by laser radiation from the crater and reacted with oxygen from air. It must be noted that those colored bands repeated in shape the areas radiated by the part of UV radiation with greater divergence.
4. TOPOLOGY OF STEEL SURFACE AFTER INTERACTION WITH POWERFUL IR LASER RADIATION
The carbon steel sample 4140 was placed in the focal plane of lens (F = 123 mm). After irradiation by 10 pulses from HF-laser (p.r.r. is 0.5 Hz) a crater with the area of 1x0.5 mm2 formed on the steel surface (see Fig. 2). Figure 2 also presents the photos made using optical microscope of the 5 separate crater zones differed in surface topology. Surfaces of the far zones Xa 4 and 5 represent by itself solidified metal splashes carried away from the central zones melt by laser irradiation. The splashes are directed outward the center of crater, their sizes being decreased as moving away from the center. Measurements were carried out by reweighing of the sample, which had many not overlapping single pulse imprints. It was shown that within a single laser impulse about 4*104 g/cm2 of metal was removed from the sample surface. Zones >fe2 and 3 are situated closer to the crater center and present by itself the areas of solidified metal with wavy surface. Figure 3(a,b) shows the scanning results obtained in those areas using atomic force microscope. Heights of irregularities (waves and drops of solidified metal) in zone J4h3 made up to 650 nm that is the most high value for all the crater areas. There are separate drops seen which have transversal sizes of 2-3 pm. In zone Xe2, irregularities height does not exceed 250-300 nm and separate drops are practically absent. Besides, on the image obtained by scanning the surface in zone N°2 using atomic force microscope there is a fine grain structure, see Fig. 3(b), Transversal sizes of grains are 400-800 nm, they vary above the metal surface by 15-30 nm. In the central crater zone, i.e, zone Jfe 1, irregularities also do not exceed the height of 300 nm and the grain structure is observed. Differed from zone J62, these grains are somewhat smaller in size (transversal size is 200-500 nm, the height above the surface is 10-15 nm). Big grains are also observed, see Fig. 3(c). Figure 4 presents a surface profilogramme of zone Nsl showing a part of coarse grains. Height of the coarse grain decreases from the center to edges for about 40 nm overlaying metal surface totally for 100-120 nm. Cross-section size of such a coarse grain is well seen in Fig. 4 (zone Mel) and makes 50 - 60 pm.
5. DISCUSSION AND CONCLUSION
While comparing our results obtained for thin foils with experimental results obtained for 1-mm width plates2, the following conclusions may be done. Effect of titanium surface modification is determined by temperature and is dependent on supply heating rate and the heat dissipation rate of the sample. The values of the specific laser energy accumulated by surface at which modification occurs in our experiments exceed by several orders the values reported by A. Perez del Pino, et al.2. It may be explained that in the experiments2, at high p.r.r. (30 kHz) the surface temperature becomes increased with each following impulse, and though the major thickness of the sample as compared with foil provides a high heat removal rate, the heating up occurs more efficiently. Other fact was that the reflection factor of laser radiation by the metal surface becomes lower with increase of temperature of the sample. Moreover, in our experiments, the laser radiation pulse energy exceeded the value taken by A. Perez del Pino, et al. by 3-5 factors that leaded to much higher absorption of laser radiation in the plume of laser plasma and evaporated target matter.
In order to produce colored oxide film on a thin titanium foil through one laser radiation impulse we need to have longer pulse duration, such as, to have (at energy enough) the surface heating up to necessary temperatures and keeping such temperature within a certain time needed for chemical reactions to take place. For determination optimal parameters of laser impulse it is necessary to carry out additional experiments and calculations.
Proc. SPIE Vol. 4631 237

Surface structure formation in zone N°2 occurs following two mechanisms: 1) melting and solidification of the metal resided in the given zone directly; 2) cooling and solidification of the metal removed under influence of hydrodynamic forces from zone Nel due to intensive boiling. In distinction to zones N®3 and N®4, where the melt metal removed out the crater center is being cooled down at a comparatively cold surface, in zone N®2 the initial surface temperature and evaporated metal correlate, owing to which much slower metal cooling down occurs
resulting in fine grained structure formation. The similar fine-grained structures identified as grains of y-iron were obtained at carbon steel surface melting by pulsed high-energy electron beam9. In zone N®1, the surface temperature during a laser radiation pulse is the highest one and the main processes occurred are intensive boiling and metal evaporation. In this case an initial ferropearlite structure develops with a characteristic morphology of solidification for each phase. It is supposed that the large smooth grain in the Fig. 2(a) is a ferrite one. There are other pearlite grains possessing typical fine-grained structure resided around it.
A more accurate identification of the structures formed on the carbon steel surface affected by laser radiation pulse demand further additional experiments.
ACKNOWLEDGEMENTS
The work has been fulfilled being supported by ISTC, the Project No 1206.
REFERENCES
1. V.S. Kovalenko, Lazernaja tekhnika i tekhnologija. — K.: Vishcha shkola. Golovnoje izdatel’stvo, 280 p., 1989
(in Russian). 2. A. Perez del Pino, P. Serra, J.L. Morenza, “Oxidation of titanium through Nd:YAG laser irradiation”. Abstracts
of the 6-th Inern. Conf. on Laser Ablation COLA'Ol, October 1-5, 2001, Tsukuba, Japan, p. 228. 3. E.N. Abdullin, A.M. Efremov, B.M. Koval’chuk, V.M. Orlovskii, A.N. Panchenko, V.V. Ryzhov, E.A. Sosnin,
V.F. Tarasenko, I.Yu. Turchanovskii, “Laser based on an SF6-H2 mixture pumped by a radially converging electron beam”. Quantum Electronics. 24, Nb9, pp. 761-765,1997.
4. E.N. Abdullin, A.M. Efremov, B.M. Koval’chuk, V.M. Orlovskii, A.N. Panchenko, E.A. Sosnin, V.F. Tarasenko, A.V. Fedenev, “Powerful HF laser pumped by e-beam initiated non-chain chemical reaction”. Pis ’ma v JTF, 23, Ns 5, pp.58-64,1997 (in Russian).
5. V.F. Tarasenko, S.B. Alekseev, M.V. Erofeev, V.M. Orlovskii, Proc. of the Int. Conf LASERS 2000, Ed. By V.J. Corcoran and T.A. Corcoran, STS Press, McLean, VA, pp.317-322,2001.
6. E.N. Abdullin, S.P. Bugaev, A.M. Efremov, V.B. Zorin, B.M. Koval’chuk, V.V. Kremnev, S.V. Loginov, G.A. Mesyats, V.S. Tolkachev, P.M. Shanin, “Electron accelerators based on Marx generator with vacuum insulation”, Pribori i Tekhnika Eksperimenta, Ns 5, pp.138-141,1993 (in Russian).
7. V.F. Tarasenko, E.H Baksht, A.V. Fedenev, V.M. Orlovskii, A.N. Panchenko, V.S. Skakun, E.A. Sosnin, “Ultraviolet and infrared lasers with high efficiency”, Proc. of the Int. Conf. High Power Laser Ablation, SPIE Vol. 3343, pp.715-724,1998.
8. V.F. Tarasenko, S.B. Alekseev, M.V. Erofeev, V.M. Orlovskii, “Electrodischarge HF-lasers on H2-SF6 mixture”, Proc. of the Intern. Conf. LASERS-2000, Albuquerque, New Mexico, Dec. 4-8, 2000, STS Press, McLEAN, VA,
pp. 317-323,2001. 9. V.B. Markov, V.P. Rotshtein, “Thermal and strain-wave mechanism of hardening of carbon steel at effect of
high-energy high-current e-beam”, Fizika i Khimija Obrabotki Materialov, 6, pp. 37-41, 1997 (in Russian).
238 Proc. SPIE Vol. 4631
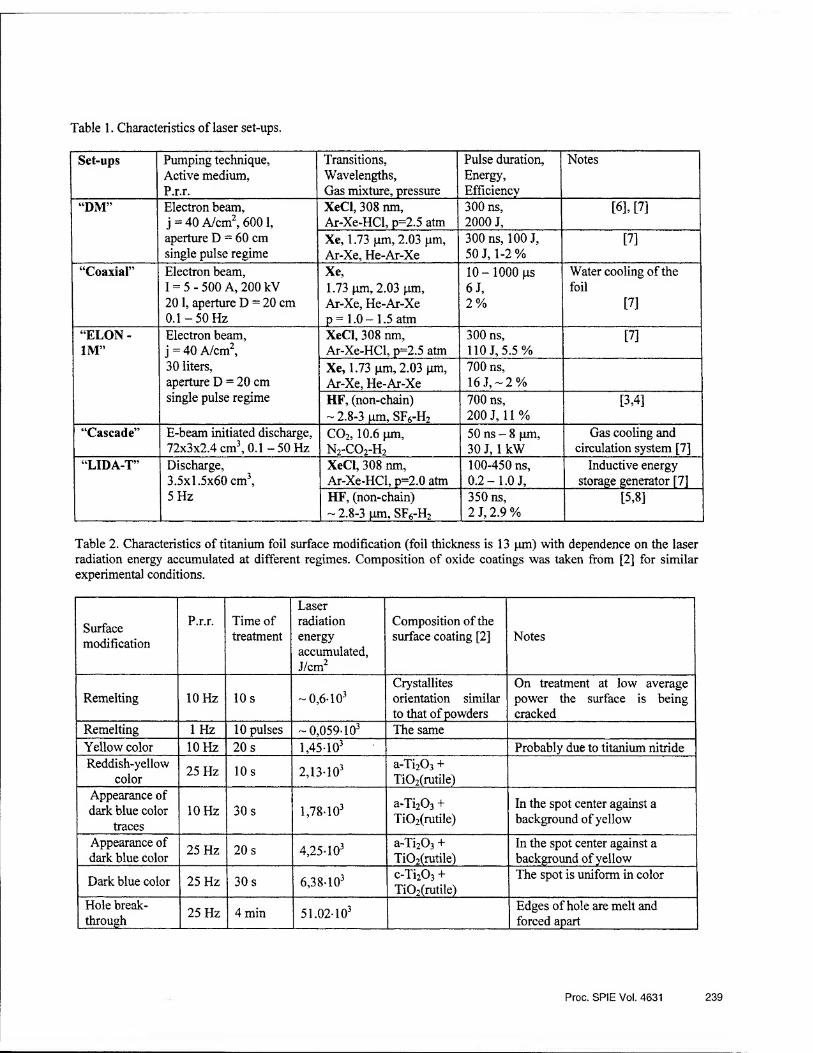
Table 1. Characteristics of laser set-ups.
Set-ups Pumping technique, Active medium, P.r.r.
Transitions, Wavelengths, Gas mixture, pressure
Pulse duration, Energy, Efficiency
Notes
“DM” Electron beam, j = 40 A/cm2,6001, aperture D = 60 cm single pulse regime
XeCl, 308 nm, Ar-Xe-HCl, p=2.5 atm
300 ns, 2000 J,
[6], [7]
Xe, 1.73 pm, 2.03 pm, Ar-Xe, He-Ar-Xe
300 ns, 100 J, 50 J, 1-2%
[7]
“Coaxial” Electron beam, I = 5 - 500 A, 200 kV 201, aperture D = 20 cm 0.1-50 Hz
Xe, 1.73 pm, 2.03 pm, Ar-Xe, He-Ar-Xe p= 1.0-1.5 atm
10-1000 ps 6 J, 2%
Water cooling of the foil
[7]
“ELON - 1M”
Electron beam, j = 40 A/cm2, 30 liters, aperture D = 20 cm single pulse regime
XeCl, 308 nm, Ar-Xe-HCl, p=2.5 atm
300 ns, 110 J, 5.5 %
[7]
Xe, 1.73 pm, 2.03 pm, Ar-Xe, He-Ar-Xe
700 ns, 16 J, ~2%
HF, (non-chain)
~ 2.8-3 pm, SF6-H2
700 ns, 200 J, 11%
[3,4]
“Cascade” E-beam initiated discharge, 72x3x2.4 cm3,0.1-50 Hz
CO2,10.6 pm, N2-CO2-H2
50 ns - 8 pm, 30 J, 1 kW
Gas cooling and circulation system [7]
“LIDA-T” Discharge, 3.5x1.5x60 cm3, 5 Hz
XeCl, 308 nm, Ar-Xe-HCl, p=2.0 atm
100-450 ns, 0.2-1.0 J,
Inductive energy storage generator [7]
HF, (non-chain) ~ 2.8-3 pm, SF6-H2
350 ns, 2 J, 2.9 %
[5,8]
Table 2. Characteristics of titanium foil surface modification (foil thickness is 13 pm) with dependence on the laser radiation energy accumulated at different regimes. Composition of oxide coatings was taken from [2] for similar experimental conditions.
Surface modification
P.r.r. Time of treatment
Laser radiation energy accumulated, J/cm2
Composition of the surface coating [2] Notes
Remelting 10 Hz 10 s ~0,6103 Crystallites orientation similar to that of powders
On treatment at low average power the surface is being cracked
Remelting 1 Hz 10 pulses ~ 0,059-103 The same
Yellow color 10 Hz 20 s 1.45-103 Probably due to titanium nitride Reddish-yellow
color 25 Hz 10 s 2,13-103
a-Ti203 + Ti02(rutile)
Appearance of dark blue color
traces 10 Hz 30 s 1,78-103
a-Ti203 + TiC>2(rutile)
In the spot center against a background of yellow
Appearance of dark blue color
25 Hz 20 s 4,25-103 a-Ti203 + Ti02(rutile)
In the spot center against a background of yellow
Dark blue color 25 Hz 30 s 6,38-103 c-Ti203 + Ti02(rutile)
The spot is uniform in color
Hole break¬ through
25 Hz 4 min 51.02-103 Edges of hole are melt and forced apart
Proc. SPiE Vol. 4631 239

d f
Fig.l. Photo of the titanium foil surface (thickness of foil is 13 jam) after irradiation by Ar-Xe laser. (a,b,c) - an average power of 250 mW at p.r.r. of 25 Hz, (d,ej) - an average power of 70 mW at p.r.r. of 10 Hz. Time of treatment is 10 s {a,d),
20 s (b>e\ 30 s (cj). The side of the grid square is equal to 140 pm.
240 Proc. SPIE Vol. 4631

Fig.2. HF-laser print on the 4140-steel surface (10 pulses) and magnified images of distinguished zones.
Proc. SPIE Vol. 4631
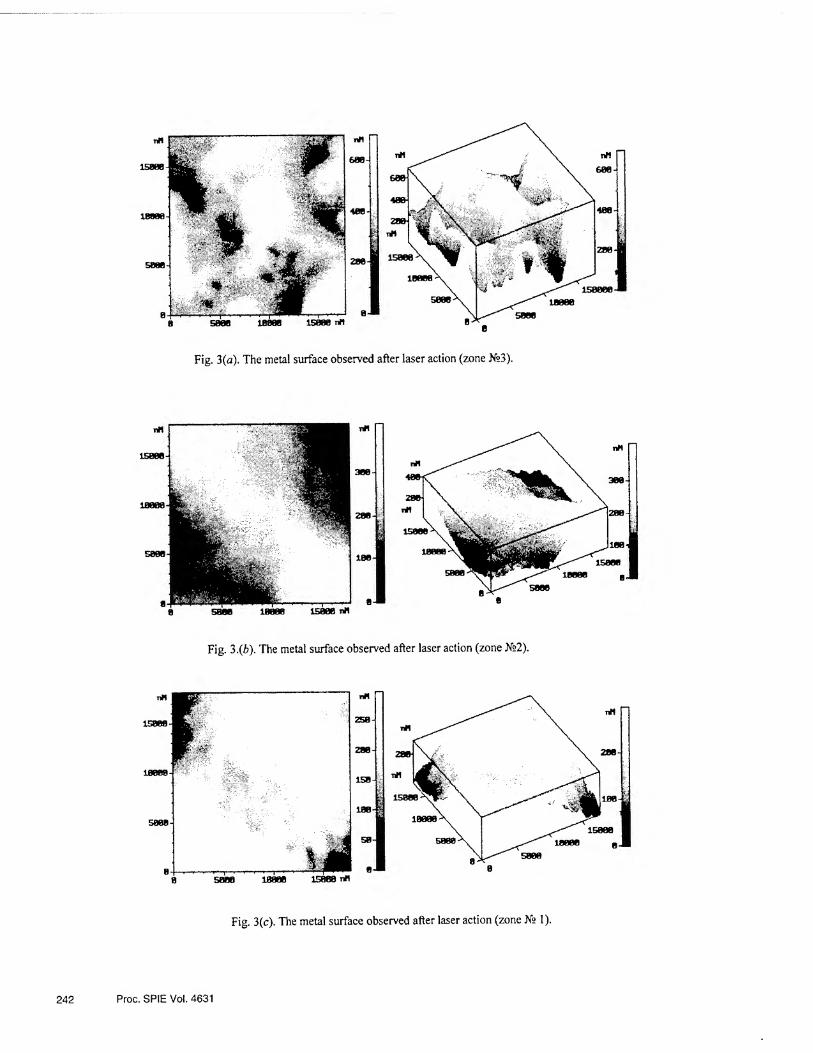
Fig. 3(a). The metal surface observed after laser action (zone >fs3).
mm 10000 15000 nH
Fig. 3.(6). The metal surface observed after laser action (zone Xs2).
15808 t*
Fig. 3(c). The metal surface observed after laser action (zone 1).

243

Energy transfer dynamics in the A(0U+) state of Bi2
Joseph L. Cox,1 Michael W. Dolezal,2 Robert E. Franklin,3 and Glen P. Perram4
Air Force Institute of Technology
ABSTRACT
Laser induced fluorescence, pulsed and CW, techniques have been used to study energy transfer within the A(0U+) state
ofBb. In particular, electronic quenching in the vibrational levels near predissociation, v’= 18-25, have been examined
for rare gas and nitrogen collision partners. The quenching from non-predissociated levels is independent of vibrational
state and are rather rapid, 2.3 - 8.5 x 10'" cm3/molecule-s for v’=22. The quenching from the first significantly
predissociated level, v’=23, is even faster with rate coefficients ranging from 7.4 - 15.7 x 10 11 cm3/molecule-s.
Heterogeneous predissociation is very rapid for 21< v’ <39, with rates, T= kpd(v’) J (J+l), of kpd as large as 1.5 x 10⁵ s '.
Vibrational-to-translational energy transfer probabilities for the lowest vibrational levels, v’=0-4, range from 0.75 -
1.75% per collision, considerably lower than would be anticipated for these highly non-adiabatic collisions. Spectrally
resolved emissions from collisionally populated rotational levels of Bi2(A,v’=l) were observed for helium, neon and
argon collision partners after laser excitation of the high rotational levels J’= 171, 201, and 231. Total rotational removal
rates from the initially prepared state range from 2.8 - 8.9 x 1010 cm3/molecule-s. Collisional population of rotational
states with I Aj| < 56 was observed at pressures of 0.09 - 1.4 torr. The state-to-state rates are adequately modeled by the
energy based statistical power gap law.
Keywords: bismuth dimmer, spectroscopy, predissociation, quenching, vibrational energy transfer, rotational energy
transfer, laser induced fluorescence
1. INTRODUCTION
Several optically pumped Bi2 (A-X) lasers were demonstrated in the late 1970’s and early 1980’s with photon
efficiencies approaching 20%.’~2 Bismuth dimers also play an important role in the NF(a‘A) - BiF laser system.3 The
current work reports on the collisional dynamics of the Bi2 A(0U+) state from a scries of laser induced fluorescence
experiments.4'6
The bismuth dimer is the heaviest stable diatom and offers a unique opportunity to study the collisional dynamics of
states with high angular momentum, as well as vibrational energy transfer in strongly coupled systems. The vibrational
frequency is low, (oe' - 132 cm'1, and the Bi2 - He collision involves a high relative speed at room temperature, yielding
a ratio of collision time to the vibrational period of ~ 0.06. The very low rotational constant for Bi2 offers significant
populations in rotational states above J=200 even at modest temperatures (T-300 K).
The spectroscopy of the Bi2 A(0U+) - X(0g+) system is well characterized, particularly for the low lying vibrational
levels.7'9 The radiative lifetime of Bi2(A) is 272 - 595 ns for v’<20, and a strong predissociation is observed near
v’=27.ih'" However, the collisional dynamics ofBi2(A) is less studied. The radiative rates,510'11 quenching from a few
(v\ J’) levels," and vibrational energy transfer in the lowest vibrational levels12 have previously been reported. In
addition, several Bi2(A-X) lasers have been demonstrated.1'2
‘iosenh.coxfa'egl in.af.mil; phone 1 850 8821724 x 117; Fax 1 850 882 1717; Into:,7www.afrl.af.mil; Air Force Research
Laboratory/MNGS, 101 West Eglin Blvd Suite 287, Eglin AFB, FL 32542-6810 2michacl.dolczal7i':aftac.patrickJaf niil;
phone 321 494-9610; httn;//w w w.aftac.no v; Air Force Technical Applications Ccnter/TAT-A, 1030 S Highway A1 A,
Patrick AFB, FL 32925;3robcrt.franklin(7 vvpatb.af.mil; phone 937 674 8035x3903; https:7www.asc.wpa(b,afmi]/asc/;
Aeronautical Systems Center/GRI, 2145 Monahan Way, Wright-Patterson AFB, OH 45433; 4glcn.pcrram(7;afit.cdu;
phone 1 937 255 3636 x 4504; Fax 1 937 255 2921; http://www.afit.edu; Air Force Institute of Tcchnology/ENP, 2950 P
Street, Wright-Patterson AFB, OH 45433-7765
244
Gas and Chemical Lasers and Intense Beam Applications III, Steven J. Davis, Michael C. Heaven, Editors, Proceedings of SPIE Vol. 4631 (2002) © 2002 SPIE • 0277-786X702/$ 15.00

2. EXPERMENT
The steady-state laser induced fluorescence apparatus is depicted in Figure 1. A Coherent model 899-29 ring dye laser
with Rhodamine 590 dye was used to selectively excite the A(0U+) state. Laser excitation spectra were recorded,4’8
indicating the excitation of a pure (v’,J’) state. The dye laser was operated with a power of 0.3 - 0.9 mW and the laser
linewidth was less than 100 MHz. A McPherson 1.3m monochromator with a Princeton Instruments model 1024 SR/B
optical multichannel analyzer (OMA) was used to resolve the laser induce fluorescence with a resolution of 0.5 cm'1 and
a bandwidth of 225 cm'1. The spectral response of the OMA was calibrated with a blackbody source at 1266 K.4
The bismuth dimer was generated by heating a small
sample of granular bismuth (Mallinckrodt, 99.8%) in
a 1 cm aluminum oxide crucible and tungsten basket
heater to 900 - 1000 K. Such an apparatus typically
produces about 33% atomic bismuth and 66%
bismuth dimer.11 The fluorescence cell consisted of a
6-way (3.8 cm diameter x 20 cm length) stainless
steel cross with quartz windows along the laser axis
and for viewing the laser induced fluorescence. The
fluorescence cell could be evacuated to 8 x 10'6 Torr
via an oil diffusion pump, and exhibited a room
temperature leak rate of less than 3 mTorr/hour.
Typically, the cell was operated with 0.1 -12.0 Torr
of rare gases (99.996%) added to induce energy
transfer. The rate of out-gassing with the basket
heater on was 1-2 mTorr/min. The cell pressure was
monitored with MKS model 390 10 Torr and model
122A 100 Torr capacitance manometers.
For the pulsed laser induced fluorescence experiments, a Nd:YAG pumped dye laser using Coumarin 460, 480 and 500
dyes with typical pulses energies of 10-25 mJ was used to excite Bi2(A) in a similar vacuum apparatus. The side
fluorescence was detected with an RCA C30134 photomultiplier tube and recorded on a LeCroy 940 350 MHz digital
oscilloscope.
3. RESULTS
The experiments are grouped into four sections: (1) pulsed Laser Induced Fluorescence (LIF) lifetimes to study
predissociation, (2) electronic quenching rates from time-resolved emission profiles, (3) CW LIF studies of vibrational
energy transfer, and (4) CW LIF rotational energy transfer for high J within v’=l.
Figure 1. CW laser induced fluorescence apparatus.
3.1 Predissociation
The laser excitation spectrum from 18,725 to
21,950 cm'1 was recorded with aNdrYAG
pumped dye laser at 0.3 cm'1 spectral
resolution. A segment of the spectrum is
provided in Figure 2. The sudden onset of
predissociation is seen for v’ > 22 as a
dramatic decrease in the extent of the
rotational distribution. The red shaded bands
are reduced to narrow features near the band
head. In fact, for most of the predissociated
levels, no resolved rotational structure can be
identified.
DZDO ZD *00 ZDSDD 20SQD Z10ES 21 ZOO
Waut nmt>« r (cm *')
Figure 2. Pulsed laser excitation spectrum with (v\ v”) band heads indicated.
Proc. SPIE Vol. 4631 245

The fluorescence intensity as a function of time for v’=21-22 decays exponentially, as shown in Figure 3. The
logarithmic plot illustrates single exponential behavior for at least 6 e-folds. By examining the dependence of the decay
rates on pressure, the collisionless decay rates were determined. A plot of these collisionless decay rates as a function of
rotational state is shown in Figure 4. The transition rates for heterogeneous predissociation are given by ro= l/xr +
kpd(v’)J(J+l), where xr is the radiative lifetime and kpd(v) is a measure of the strength of the predissociation and is
dependent on vibrational level.
Figure 3. Decay lifetime for v’=21, J’=50 at 100 mTorr. Figure 4. Rotational dependence to predissociation in v,=21.
For v’>22, the predissociation is sufficiently strong that only rotational states near the band head have significant
emission intensity, and these rotational levels cannot be isolated by the pump laser. To extract predissociation rates, kpd,
for theses states, we have employed a spectral
simulation.5 Briefly, the intensity of each rotational line is
modeled, including the effects of predissociation , and
convolved using the laser linewidth to simulated the laser
excitation spectra. By comparing the synthetic and
observed spectra, a best estimate for the predissociation
rate is determined. A summary of the resulting
predissociation rates is provided in Figure 5.
The predissociation in Bi2(A) is very strong, exhibits a
broad dependence of vibrational level and yields no
stable vibrational levels above v’=22.
3.2 Electronic Quenching Figure 5. Predissociation rate constant, kpd, as a function of vibrational level.
The pressure dependence of the total fluorescence decay rates establish the electronic quenching rates,
r=r0 + kq [M], where [M] is the concentration of the added buffer gas. For the vibrational levels below the onset of
predissociation, v’= 18-22, the electronic quenching rates for helium are independent of vibrational level, as shown in the
Stem-Volmer plot of Figure 6. The probability for quenching, defined as the ratio of the observed quenching rate to the
gas kinetic rate, depends linearly on reduced mass of the collision pair, as shown in Figure 7.
246 Proc. SPIE Vol. 4631
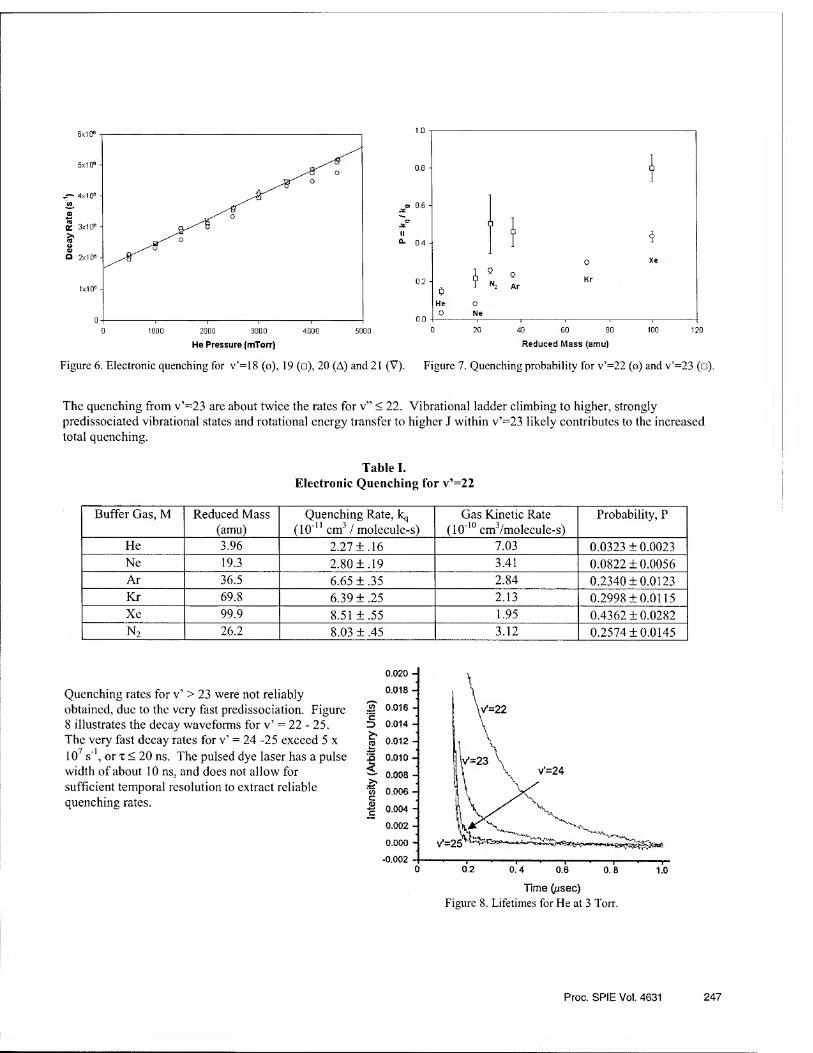
He Pressure (mTorr)
Figure 6. Electronic quenching for v*=18 (o), 19 (□), 20 (A) and 21 (V). Figure 7. Quenching probability for v’=22 (o) and v’=23 (□).
The quenching from v’=23 are about twice the rates for v” < 22. Vibrational ladder climbing to higher, strongly
predissociated vibrational states and rotational energy transfer to higher J within v’=23 likely contributes to the increased
total quenching.
Table I. Electronic Quenching for v,=22
Buffer Gas, M Reduced Mass
(amu)
Quenching Rate, kq
(10*n cm3 / molecule-s)
Gas Kinetic Rate
(10-10 cm3/molecule-s)
Probability, P
He 3.96 2.27 ±.16 7.03 0.0323 + 0.0023
Ne 19.3 2.80+ .19 3.41 0.0822 ±0.0056
Ar 36.5 6.65 ± .35 2.84 0.2340 + 0.0123
Kr 69.8 6.39+ .25 2.13 0.2998 ±0.0115
Xe 99.9 8.51 ±.55 1.95 0.4362 ±0.0282
n2 26.2 8.03 ± .45 3.12 0.2574 ±0.0145
Quenching rates for v’ > 23 were not reliably
obtained, due to the very fast predissociation. Figure
8 illustrates the decay waveforms for v* = 22 - 25.
The very fast decay rates for v’ = 24 -25 exceed 5 x
107 s'1, or x < 20 ns. The pulsed dye laser has a pulse
width of about 10 ns, and does not allow for
sufficient temporal resolution to extract reliable
quenching rates.
Time (/isec)
Figure 8. Lifetimes for He at 3 Torr.
Proc. SPIE Vo!. 4631 247
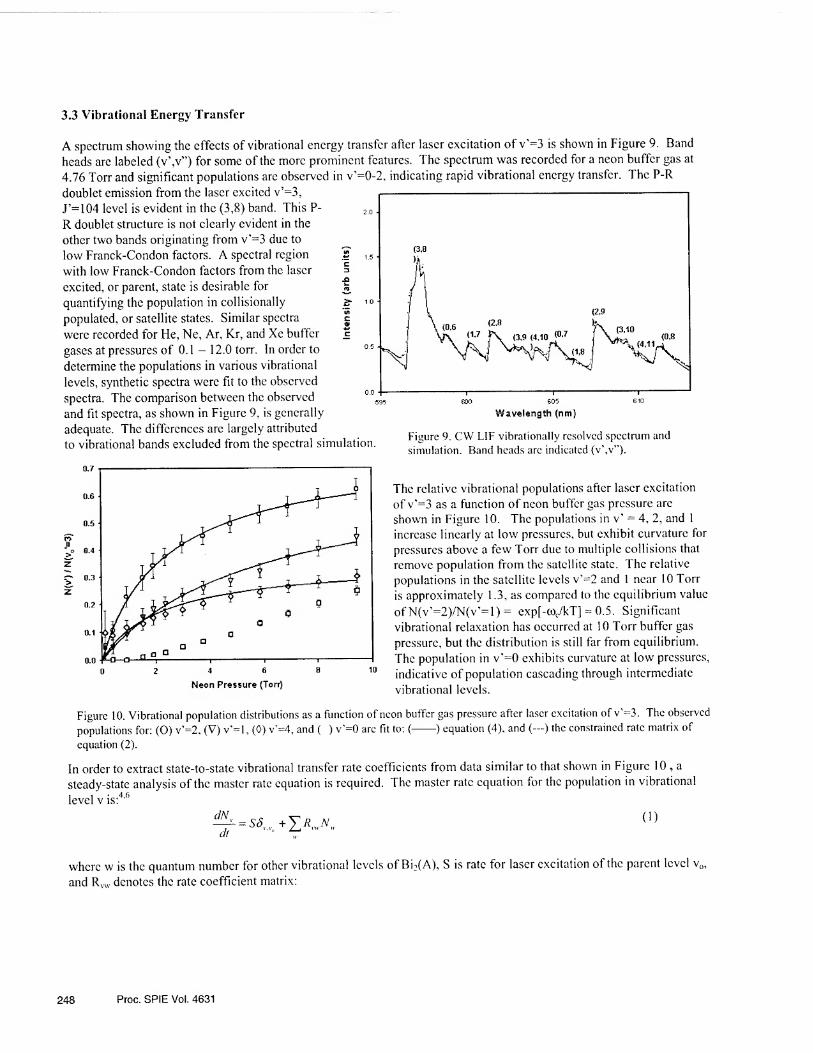
3.3 Vibrational Energy Transfer
A spectrum showing the effects of vibrational energy transfer after laser excitation of v'=3 is shown in Figure 9. Band
heads are labeled (v\v”) for some of the more prominent features. The spectrum was recorded for a neon buffer gas at
4.76 Torr and significant populations are observed in v’=0-2, indicating rapid vibrational energy transfer. The P-R
doublet emission from the laser excited v’=3,
J’=104 level is evident in the (3,8) band. This P-
R doublet structure is not clearly evident in the
other two bands originating from v’=3 due to
low Franck-Condon factors. A spectral region
with low Franck-Condon factors from the laser
excited, or parent, state is desirable for
quantifying the population in collisionally
populated, or satellite states. Similar spectra
were recorded for He, Ne, Ar, Kr, and Xe buffer
gases at pressures of 0.1 - 12.0 torr. In order to
determine the populations in various vibrational
levels, synthetic spectra were fit to the observed
spectra. The comparison between the observed
and fit spectra, as shown in Figure 9, is generally
adequate. The differences are largely attributed Figure 9. CW LIF vibrationally resolved spectrum and to vibrational bands excluded from the spectral simulation. si*ulation. Band heads arc indicatcd {v>n.
The relative vibrational populations after laser excitation
of v,=3 as a function of neon buffer gas pressure arc
shown in Figure 10. The populations in v" = 4, 2, and 1
increase linearly at low pressures, but exhibit curvature for
pressures above a few Torr due to multiple collisions that
remove population from the satellite state. The relative
populations in the satellite levels v,=2 and 1 near 10 Torr
is approximately 1.3, as compared to the equilibrium value
ofN(v’=2)/N(v’=l) = exp[-coc/kT] ~ 0.5. Significant
vibrational relaxation has occurred at 10 Torr buffer gas
pressure, but the distribution is still far from equilibrium.
The population in v’=0 exhibits curvature at low pressures,
indicative of population cascading through intermediate
vibrational levels.
Figure 10. Vibrational population distributions as a function of neon buffer gas pressure after laser excitation of v’=3. The observed populations for: (O) v’=2, (V) v =1, (0) v’=4, and ( ) v’=0 arc fit to: (-) equation (4), and (—) the constrained rate matrix of
equation (2).
In order to extract state-to-state vibrational transfer rate coefficients from data similar to that shown in Figure 10, a
steady-state analysis of the master rate equation is required. The master rate equation for the population in vibrational
level v is:4,6
dNv
dt = SSVV + (1)
where w is the quantum number for other vibrational levels of Bi2(A), S is rate for laser excitation of the parent level v0,
and Rvw denotes the rate coefficient matrix:
248 Proc. SPIE Vol. 4631

=kVT(w-+ v)[M] - sir, + kg(v)[M] - (2)
The goal of this work was to extract the rate coefficients for vibrational transfer from state w to state v, kvr(w-»v), from
the rate matrix, R™. The radiative decay rate for Bi2(A, v’$3) is Fr = 1.6 — 2.3 x 10⁶ s'1.11 For a given rate matrix, Rw,
the relative steady-state populations can easily be determined as:
JL knjyp —»v>[A/]/rr
l + [kQ(v)[M] + 2>,t(v w)][M]/rr W
K Nv
[M]/Tr
(3)
The third term in the denominator of equation (3) represents multiple collisions that populate the observed vibrational
level. In general, this term possesses a complicated pressure dependence. However, at moderate pressures where
multiple collisions are not dominant, equation (3) reduces to the form:
Nv _ Ax (4) \ + Bx
where a = k,T(v)IT,,B = (kQ{v) + '£kn(v w))IT, ,and X = [M]. W
Figure 10 illustrates a least-square fit of equation (4) to the data, providing an initial estimate of the state-to-state V-T
rate coefficients, as reported for neon in Table II. The data for v’ = 0 can not be adequately represented by equation (4),
since single collision transfer involving Av = -3 is insignificant. Similar data were recorded for laser excited states v’ =
1-4 and for He, Ne, Ar, Kr, and Xe buffer gases.
Table II. Vibrational transfer rate coefficients for neon.
(10"12 cm3/molecule-s)
V kvTNe(v—»v-l) (from fit to equation (4))
kvrNe(v—^v-1) (from rate matrix model)
keq f
1 6.3±0.7 6.210.7 <0.9 0.16
2 9.610.7 9.610.7 <2.9 0.10
3 15.1 11.4 14.111.4 <3.3 0.12
4 19.613.5 19.213.5 <3.3 0.05
In order to refine the determination of the vibrational transfer rate coefficients, the full rate matrix of equation (2) is
utilized. To reduce the number of independent matrix elements, detailed balancing is used to specify transitions that
increase vibrational energy, linear scaling of the vibrational transfer rate coefficients with vibrational quantum number
as predicted for harmonic oscillators is applied, transfer involving multi-quanta is assumed to be a fixed fraction, f, of
the Av = -1 rate, and the rates for |Av| > 3 are neglected. The electronic quenching and radiative rates are assumed
independent of vibrational level. By varying the quantities kVi(v->v-l), kq and f, a single rate matrix which best
represents the full set of spectrally-resolved laser induced fluorescence data can be established. The corresponding
predictions for v’=4,2, and 1 are quite similar to the fits from equation (4). The resulting rate parameters for neon
collisions are provided in Table I. Collisions with the remaining rare gases were studied in somewhat less detail. The
vibrational levels examined and resulting rate coefficients are reported in Table III.
Proc. SPIE Vol. 4631 249

Table III. Fundamental vibrational transfer rate coefficients for rare gases.
(10'12 cm3/molecule-s)
Gas V0’ kvj(v-^v-l) kVT( 1 —>0) ov( 1,0) / ac
He 2 10.6 ± 1.5 5.3 ±0.7 0.0075
Ne 1-4 (see Table I) 4.8 ±0.9 0.0142
Ar 3 7.6 ±1.2 2.5 ±0.4 0.0089
Kr 2 4.8 ±0.7 2.4 ±0.4 0.0112
Xe 2 6.8 ± 1.3 3.4 ±0.7 0.0175
The Schwartz, Slawsky, and Herzfeld (SSH) theory13 successfully predicts the probability for vibrational transfer (V-T),
particularly the scaling with mass and vibrational frequency, under a wide range of conditions.14 The SSH theory
depends on the first-order Bom approximation, models a harmonic oscillator perturbed by an exponential interaction
potential, and assumes a relatively non-impulsive, or near adiabatic, collision. The SSH theory predicts the probability
for vibrational transfer as:14
where
P(1,0)= <*1,0)
■=M| — 0
-3/2
2mA2mBmc
(mB + mc)(mA + mB)2//
//^collision pair reduced mass=mA(mB -{-mc)/(mA + mB + mc)
2 L2 {27tc(oe)2 // / kT
0-hc^/kT
coe-fundamental vibrational frequency (cm-1)
£=potential well depth
L=potential interaction length
(jg=gas kinetic or hard sphere cross-section
(5)
Surveying the existing database of V-T transfer for the diatomic halogens indicates a deficiency of the SSH theory for
highly impulsive collisions.15 By converting the observed V-T transfer rate coefficients to a transition probability, using
the specified masses, vibrational frequency, and translational temperature, and assuming a small well depth, e/kT ~ 0, the
interaction lengths, L, required to satisfy equation (5) are specified displayed in Figure 11. For adiabaticity,
^=ccoeL(7i|a/8kT/)1/2 > 0.5, the interaction lengths are in the range L = 0.25-0.10, which is typical for V-T transfer.14
However, the most impulsive collisions, particularly the Bi2(A) - He interaction, require unreasonably large interaction
lengths. In other words, the SSH theory over-predicts the probability for V-T transfer involving highly impulsive
conditions. A large interaction length artificially reduces the prediction to generate agreement with the observed rates.
There are several approximations made in the SSH theory that depend on near adiabatic conditions: (1) the first-order
Bom approximation is used to compute the transition probability, (2) the matrix elements for the exponential interaction
potential are approximated by a first-order Taylor series, and (3) when averaging over the velocity distribution, the
approximation csch2(27tX(OcL/v) « 4 exp(-4K2ccoeL/v) is employed. The latter two approximations can be improved,16-17
but the differences are not sufficiently large to account for the interaction lengths computed in Figure 7. The large
interaction lengths for the most impulsive collisions (£ < 0.3) appear to result from the failure of the first-order Bom
approximation.
250 Proc. SPIE Vol. 4631

0.7
0.6 4 •
0.5
I 0.4 -i
■B m £0
□ « & ®°n
D g A V A A
Figure 11. The interaction length derived using the SSH theory of equation (15) from V-T rate coefficients observed for: (•) Bi2(A) (present work), (O) Br2(B) (ref 21), ( £BrCl(B) (ref 18), (A) BrF(B)
(ref 21), and (V) IF(B) (ref 19). To evaluate the adiabaticity, a constant value for the interaction length was chosen, L = 0.02 nm.
0.0 4-1-T-.-,-T-1
0.0 0.2 0.4 0.6 0.8 1.0 1.2
Adiabticity, £
3.4 Rotational Energy Transfer
Similar experiments have been performed with
rotational state resolution. The spectrally resolved
emission from the v’=l v”=5 band after excitation
of v’=l, J’=171 in the presence of 0.855 torrof
helium is shown in Figure 12. The strong P-R
doublet emission from the laser populated state is
clearly evident. The weaker satellite transitions are
from the collisionally populated rotational states.
Emission is observed only from even rotational levels
because the nuclear spin is not readily altered by
collisions.22 For J’< 140, a near coincidence of the
P(J) and R(J+14) lines precludes complete spectral
isolation. The rotational transfer rates are quite rapid,
with significant population in the satellite states even at
low buffer gas pressures. Figure 12. Spectrally resolved Bi2(A-X) laser induced fluorescence from the v’=l to v’-5 band in the presence of 855 mTorr of helium buffer gas after laser excitation of v’=l, J=171.
A plot of the population in the satellite level J’=T65 relative to the population in the parent level, J’=171, is shown as a
function of helium buffer gas pressure in Figure 13. The error bounds indicated in Figure 13 are obtained from the
uncertainties in the amplitudes from the spectral fits.
Similar data were obtained for initially pumped states
J0’=171, 201 and 231 and satellite states -56 < AJ <
+44. This data was analyzed with a steady-state
analysis similar to that described above for
vibrational energy transfer and typical rate constants
are provided in Figure 14.
Figure 13. Plot of the population of the satellite J-165 rotational level relative to the parent state (J-171) for collisions with helium buffer. The solid line is a least- squares fit to the data using an analysis similar to equation (4).4
0.0 0.2 0.4 0.6 0.8 1.0
Helium Pressure (Torr)
>, 0 .15
Proc. SPIE Vol. 4631 251

Figure 14. State-to-state rotational energy transfer rate constants for Ne after laser excitation of v’=l, J’=201. Three scaling law
fits are also shown: (—■) SPG1, (....) SPG2 and (—) EGLl.
Several empirical relationships have been
proposed to describe the scaling of the state-to-
state rotational energy transfer rate constants with
rotational quantum number.23'24 A variety of these
fitting laws have been applied to the current data in
an attempt to evaluate those which adequately
represent the data. In Figure 14, a fit of the SPG1,
SPG2 and EGLl fitting laws are shown.4 The
exponential gap law fails for all the initially
prepared J0 levels and buffer gas studies observed in the present work. The EGLl and EGL2 fitting laws can be made to
represent either the rotational levels near the pumped state, or for larger AJ, but not both. The statistical power gap laws
do provide an adequate representation of the data for all J0 and all three collision partners. The Mj conserving form of
the statistical factor f(J) (SPG1) provides a fit standard error of 20-50% less than the completely randomized factor
(SPG2) and in all cases provides a better fit. Fit parameters for the statistical power gap law (SPG1) are summarized for
each of the collision partners in Table II.
Table II.
Fit parameters for the statistical power gap scaling law, SPG1.
Collision Partner (vW) B (10 s cm3/rnolecule-s) _1_ He (1.171) 5.45+1.17 0.944 ±0.030
He (1.201) 3.85 + 0.59 0.902 ±0.021
He (1.231) 2.79 ±0.50 0.834 ±0.025
Ne (1,201) 5.00+ 1.23 0.968 ± 0.034
Ar (1,201) 1.25 ±0.50 0.786 ±0.042
4. CONCLUSIONS
A systematic study of predissociation in Bi2(A) has been completed, indicating a curve crossing at v’=23. The
predissociation is very strong, exhibits a broad dependence of vibrational level and yields no stable vibrational levels
above v’=22. Electronic quenching is rapid, with rates 0.03 - 0.8 time the limiting gas kinetic value. Quenching is
independent of vibrational level to the predissociation limit, but increase significantly at v’=23. Vibrational energy
transfer in the lowest vibrational levels of Bi2(A) is rapid, although somewhat less than predicted by the SSH theory.
The Bi2(A) potential is nearly harmonic, leading to a linear scaling of the vibrational transfer rates with vibrational
quantum number and a low probability for multi-quantum transfer. Interaction lengths for bismuth dimer - rare gas
collisions are consistent with those derived for the diatomic halogens when the collision pair exhibits the same
adiabaticity. Rotational energy transfer within Bi2(A) is rapid, constrained to AJ = even by parity conservation, and best
represented by the statistical power gap scaling law with Mj conservation. Single collision population of rotational
levels with | AJ | < 52, AE > 300 cm'1, is readily apparent. Even for these very high rotational states, with large angular
momentum, the energy based scaling laws appear to provide a better representation of the rates than the energy corrected
sudden with a power law for the angular momentum scaling.
252 Proc. SPIE Vol. 4631

REFERENCES
1. W.P. West and H.P. Broida Chem. Phys. Lett. 56 283 (1978).
2. S. Drosch and G. Gerber J. Chem. Phys. 77 123 (1982).
3. D.J. Benard J. Appl. Phys. 74 2900 (1993).
4. R.E. Franklin “Spectroscopic and Kinetic Studies of Bismuth Dimers ”, PhD Dissertation, Air Force Institute of
Technology, AFIT/DS/ENP/97-04 (1997).
5. Michael W. Dolezal Spectroscopic Constant, Lifetimes and Predissociation Rates for Bi2 A(0f), Ph.D. Dissertation,
Air Force Institute of Technology, AFIT/DS/ENP/01-01 (2001).
6. Joseph L. Cox, Electronic Quenching of the A(0f) State ofBi2, M.S. Thesis, Air Force Institute of Technology,
AFIT/GAP/ENP/01M-02 (2001).
7. 10. R.F. Barrow, F. Taher, J.D. Incani, C. Effantin, AJ. Ross, A. Topovzkhanian, G. Wannous, and J. Verges,
Molecular Physics 87 725 (1996).
8. R.E. Franklin and G.P. Perram, J. Molec. Spectrosc. 194 1 (1999).
9. G. Gerber, Honinger, and J. James Chem. Phys. Lett. 85 415 (1982).
10. J.M. Blondeau, G. Gandara, P. Carette and J. Messelyn Chem. Phys. Lett. 71 246 (1980).
11. G. Ehret and G. Gerber Chem. Phys. 66 27 (1982).
12. Robert E. Franklin and Glen P. Perram, “Collisional Dynamics of Bi2 A (Of). I. Quantum-
Resolved Vibrational Energy Transfer for v’=0-4”, Journal of Chemical Physics, 111, 5757 (1999).
13. R.N. Schwartz, Z.I. Slawsky, and K.F. Herzfeld, J. Chem. Phys. 20 1591 (1952). 14 j ,p Yardley Introduction to Molecular Energy Transfer (Academic, New York, 1980).
15. C.D. Holmberg, G.S. Williams, and G.P. Perram J. Chem. Phys. 102 6481 (1995).
16. J. Keck and G. Carrier J. Chem. Phys. 43 2284 (1965).
17. D. Rapp and T.E. Sharp J. Chem. Phys. 38 2641 (1963).
18. G.P. Perram and S.J. Davis J. Chem. Phys. 98 373 (1993).
19. P.J. Wolf and S.J. Davis J. Chem. Phys. 87 3492 (1987).
20. J.I. Steinfeld J. Chem. Phys. 46 4550 (1967).
21. G.P. Perram, D.W. Melton, T.L. Thompson, and W.B. RohJ. Chem. Phys. 97 3258
22. C.W. McCurdy and W.H. Miller, J. Chem. Phys., 67 463 (1977).
23. T.A. Brunner and D. Pritchard, “Fitting Laws for Rotationally Inelastic Collisions” in Advances in Chemical
Physics, Volume 50: Dynamics of the Excited State, edited by K.P. Lawley (John Wiley and Sons, 1982)
24. J.I. Steinfeld, P. Ruttenberg, G. Millot, G. Fanjoux, and B. Lavorel, J. Phys. Chem. 95, 9638 (1991).
Proc. SPIE Voi. 4631 253

Numerical testbed for laser materials processing
M.S. Gross®, I. Black® and W.H. Miiller6
aHeriot-Watt University,
Department of Mechanical and Chemical Engineering,
Riccarton Campus,
Edinburgh, UK, EH14 4AS
^TU-Berlin, Institut fiir Mechanik,
Fachgebiet Kontinuumsmechanik und Materialtheorie,
Sekr. MS 2, Einsteinufer 5, Berlin. Germany, 10587
ABSTRACT
Current numerical simulations of laser materials processing usually simplify any process model to a great
extent in order to allow for short computation times. This significantly decreases their flexibility and ability to
simulate the great variation of today’s processes with their subtle but important differences. The simulation
presented in this paper can be said to be truly three dimensional as opposed to other reported work that uses
symmetric boundary conditions. This enables the investigators to simulate real laser beams. In contrast to the
(well-documented) Marangoni flow profile, the authors will show results that do not use the usual simplifying
assumptions of flat surfaces. Preliminary output from the simulation deals with the transient coupled velocity
and pressure profile and temperature distribution and hence the heat affected zone (HAZ). From this, conclusions
can be drawn with regard to improving process efficiency, especially in laser cutting. It will be shown that the
traditional perception of equating higher processing speeds with better processing efficiency does not hold in all
cases. In fact, the opposite may well hold true. However, to demonstrate this the actual process of producing a
part needs to be fully understood. A process may influence the workpiece material properties beneficially when
it is performed at reduced speeds (material hardening or softening). The investigators contend that numerical
modeling of the above can only be achieved credibly using high performance computing methods.
Keywords: laser materials processing, laser sources, numerical simulation, numerical modeling, fluid flow,
Marangoni, free surfaces
1. INTRODUCTION
Laser machine tools have found a secure place for a variety of materials processing techniques such as drilling,
cutting, welding, heat-treating and alloying. Their unique capacities can also give rise to novel manufacturing
approaches.1 The application of lasers spans such diverse fields of engineering as welding of parts, heat
treatment, surface coating, cutting and drilling and even medical applications like surgical cutting, welding of
wounds, modification of tissue and many more. The range of materials to which the laser can be applied to is
similarly diverse including ceramics, plastic, metals, biological tissue and wood.
2. NUMERICAL TESTBED - A DEFINITION
Materials processing by the means of lasers is a complex field. The vast amount of literature available concerned
with the modeling of laser materials processing highlights the need for unbiased predictive tools. However,
Sargent et al2 point out that:
“many projects, while successful in their own narrow areas, never produce general, useful results.”
Further author information: (Send correspondence to M.S.Gross)
E-mail: m.s.gross^)liw.ac.uk
254
Gas and Chemical Lasers and Intense Beam Applications III, Steven J. Davis, Michael C. Heaven, Editors, Proceedings of SPIE Vol. 4631 (2002) © 2002 SP1E • 0277-786X/02/$15.00

This is the main motivation for building a simulation framework which addresses exactly this shortcoming. A
testbed has to be versatile and the amount of pre-analysis assumption has to be reduced to the maximum extent
possible. With respect to laser materials processing, this holds for the laser source as well as the assumptions
made concerning the workpiece. It would be of little use for the practician, who is confronted with a decision to
be made about the quality of the laser source to be used in practice, if the numerical model assumed a perfect
source. With regard to the model of the workpiece, it would be equally disadvantageous if the experimentalist
had to decide a priori if the melt flow is of significance or not, or even if the velocities within the melt are
above or below a certain threshold value for which the simulation is understood to be valid or not. Obviously,
in order to achieve a simulation that addresses these issues, certain simplifications have to be made. The main
challenge is to reduce these to an acceptable minimum. In order to fully appreciate the need for a numerical
testbed, the main features of laser material processing are outlined as follows.
2.1. Process features
Copley et al3 presented the topography of regions melted by a continuous wave (cw) CO2 laser beam and
developed a theory to explain phenomena due to convective processes related to epitaxial regrowth and surface
relief in laser melted regions. At the point of impingement of the laser beam, the temperature increases and,
because the temperature coefficient of the surface tension is positive for most materials, the surface tension
increases along a line from the impingement point to the edge of the melt pool. Thus any volume element of
the surface experiences a net force parallel to the surface causing it to move from the center to the edge of the
melt pool. In the case of a moving melt pool the convection pattern becomes unsymmetrical. In Figure 1 the
origin of ripples and other topographical features associated with travelling melt pools (such as laser melted
regions) is illustrated. Similar effects have been reported by Moore et al4 and the striking resemblance of laser
surface melts to welds is pointed out. The most dominant feature is the chevron pattern formed by the isolines
of temperature and hence the melt pool. Laser surface melts often exhibit a central crest which runs the length
of the melt and which is flanked on each side by a trough as shown in Figure 2. The resulting surface roughness
due to the ripples is reported to be between 5-15 pm. In laser welding these can easily add up to 0.01 times the
width of the weld.5
Figure 1. Mechanism of ripple formation: (a) laser translational velocity equals zero; (b) and (d) velocity not equal to zero; projected area of back side of pool (c) less than that at front edge of pool (e); (f) and (g) ripples without back flow; (h) and (i) ripples with back flow3
The appearance of humps on the surface of the weld bed is usually referred to as humping phenomena. A
sketch of a typical shape of the cross section is shown in Figure 3. The deep depression of the material at
the former solid-liquid interface, called undercut, is experimentally found to be associated with the humping
phenomenon. In general, these humps occur periodically along the weld bead.6 The undercut phenomena
Proc. SP1E Vol. 4631 255

□ Base Material
Direction of
Beam Motion
□ Molten Material
ABC
Melted and
B Resolidified
Metal
ABC
AA BB CC
Figure 2. Schematic diagram of the laser surface melting process showing a top view (top), lengthwise cross section
(middle), and various transverse cross sections (bottom)4
Figure 3: Humping phenomena in laser welding. Sketch of the weld bead based on a microscopic study. 6
shown in the Figure 3 may lead to stress risers during service life of the manufactured part and is addressed in
Atwa et aL7 Additionally these authors point towards problems concerning lack of penetration, root undercut,
inclusions and burn-through in the context of premature failure of pipelines.
2.1.1. Laser cutting
Salient features of the laser cutting process are depicted in Figure 4. Process parameters can be adjusted and
tuned to provide the quality of cut desired, but this procedure consumes exhaustive amounts of time and effort,
without the optimal cutting conditions being found. If a different type of material is to be cut, then this
procedure has to be repeated. This has been recognized as a major shortcoming in laser machining set-up.9
Furthermore the optimum process parameter may well be a transient set of parameters, depending on the path
of cut (may be three dimensional), the material (composition) or the cutting condition (cutting speed, sheet
thickness, etc.). The effects of melt flow over an edge (refer to Figure 5) have been studied in an extensive
manner by Brown and Davis10 but so far no generic simulation includes these factors.
Regular spaced ripples or “striations” along the cut edge as shown in Figure 6 can be observed during laser
cutting. In thin sections these may be clear and regular from the top of the cut edge to the bottom. However,
on thicker sections, the striations may be clear towards the top of the edge but are replaced towards the bottom
by more random ripples associated with the flow of liquid out of the cut zone.11 Di Pietro and Yao9 comment
thoroughly on the state of the knowledge concerning the formation of striations:
"... the mechanisms affecting the forming of stria are not well understood. Striations will result to
som,e extent due to the non-steady nature of laser cutting. “
256 Proc. SPIE Vol. 4631

I
Figure 5. A schematic of the cut zone. The high surface tension of the melt and its adhesion to the workpiece results in dross adhering to the lower edge of the cut.11
A similar scatter of theories and the limited predictive capabilities of current simulations prevails in context
with other features in laser materials processing such as humping, rippling and dross formation.
The ambiguity in process parameters becomes obvious in the following example reported by Klocke et al.12
For a 3 mm thick sheet PRMMC (particle reinforced metal matrix composites) - such as SiC-Al with 20% SiC,
a cutting speed of 600 mm/min can be achieved. Increasing the laser power or decreasing the cutting speed
can increase the cut width. When cutting pure aluminum a smaller width of cut is achieved. The dross for
pure aluminum with similar cutting parameters is shorter and the cut face squareness is larger with a reduced
cutting speed. Usually the surface roughness is reduced by increasing the cutting speed or laser power. The
reverse is true for pure aluminum. A relationship between HAZ and dross has been reported.
Laser cutting of ceramics is still a problem due to their low thermal shock resistance. Sometimes the cutting
performance with ceramics is increased when the focal spot is above the material surface. This results in a wider
cut and the shield gas can be used more effectively for melt removal. For 10mm thick Zr02 an optimum focal
Proc. SPIE Vol. 4631 257

(b) Micrograph11
Figure 6: Striations in laser cutting
spot position is 5mm above the surface, and cutting speeds of up to 500 mm/min in cw mode are reported.12 When cutting A1203 an optimum speed of 50 mm/min has been reported12 and attributed to the smaller amount of melt generated. An occurrence of macroscopic crevice formation was observed due to the high brittleness of the material. Improvement was reported when using a Nd:YAG as supposed to a C02 laser. Cutting without cracking was achieved, and this was attributed to the smaller focal spot and higher intensity. All the prevoius examples highlight the need for a versatile and precise simulation.
3. MODELING STRATEGY
This paper will not provide a detailed discussion of the physical/mathematical modeling strategies used by the authors. The underlying physical model and its mathematical modeling will be published elsewhere. Here the authors wish to focus on the main principle, rather than the implementation. From the definition of a numerical testbed given above, two main features are immediately apparent. The model has to be three-dimensional in the spatial discretization, and the flow of the molten material must be included in the model. The first feature is due to the fact that a symmetry assumption would a) infer a perfect source and b) reduce the applicability to straight lines, which in practice represent only a fraction of the work to be performed. The fluid flow is important, because we can only discard it sensibly if the simulation clearly shows that it is of no significance. Doing so beforehand involves a sound complex physical reasoning which is extremely difficult, especially as today the scientific community as a whole is not in agreement on the explanation of certain phenomena as dross, stria and ripples. From studying the literature available it becomes obvious that modeling the physics involved is extremely complex and indeed justifies a separate numerical analysis. For example Chen et aiM modeled oxidation effects in laser cutting, the assist gas flow in a kerf was studied by Vicanek et al14 and Kar et allb developed a gas-dynamical model in order to describe the the plasma formation, velocity and particle size distributions in the plasma during laser ablation. On their own though, as mentioned before, the published work does not contribute significantly towards a comprehensive simulation of the process itself. Rather, it has to be incorporated on a phenomenological basis into a numerical testbed. This will be done in this paper and in future work. The main strategy is depicted in Figure 7 and shall be outlined below in the example of the
incorporation of the stagnation pressure of a shield (or shroud) gas into the current testbed.
A unique set of unrestricted parameters is input to the numerical testbed. No restrictions that would result from previous assumptions in the model itself (e.g. neglecting the fluid flow) are present in the testbed. Certain phenomena can, at present, only be incorporated on a knowledge basis. This means that the explicit treatment in terms of discrete differential equations would increase the computational effort beyond current capabilities. Rather, these phenomena are studied beforehand parametrically, and by identifying the respective parameters during the simulation in the testbed, the output knowledge of prior simulations can be retrieved. In other words, for the example of the shroud gas stagnation pressure, a large quantity of simulations of the stagnation pressure field would be performed beforehand on varying surface profiles. For certain surface profiles
258 Proc. SPIE Vol. 4631
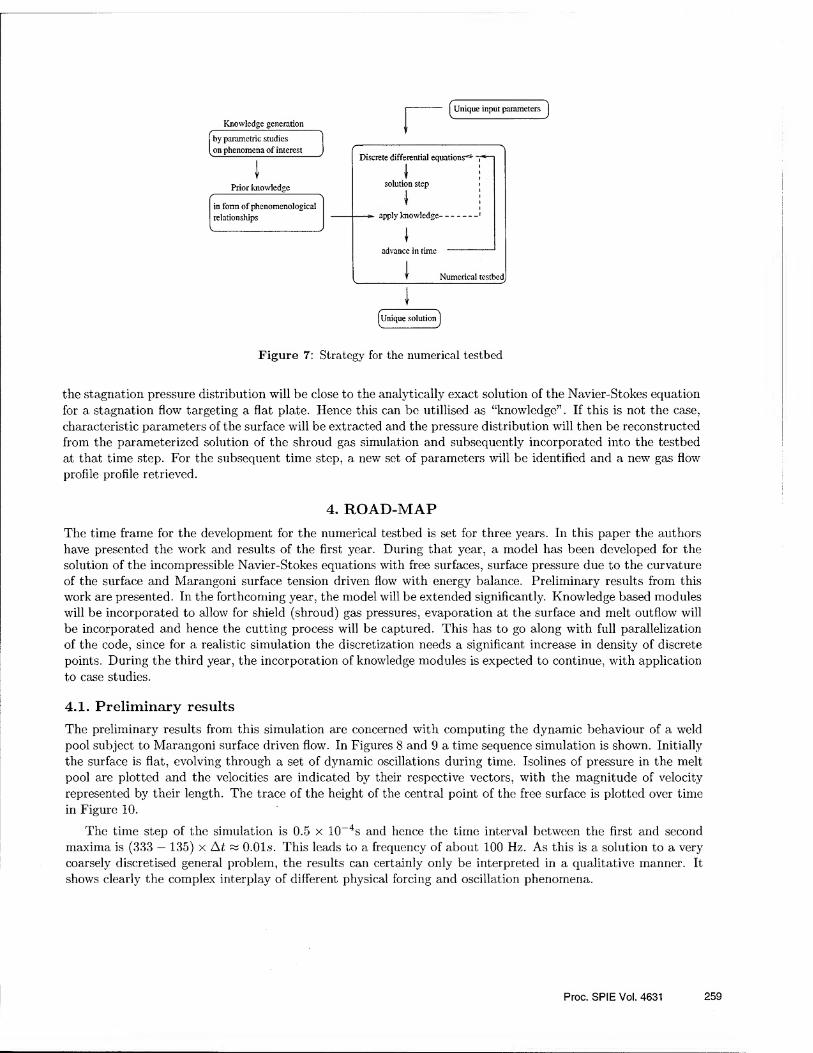
Knowledge generation
Unique input parameters
by parametric studies
on phenomena of interest
I Prior knowledge
in form of phenomenological
relationships
Discrete differential equations^-
j i solution step »
I i I
—apply knowledge-1
I advance in time -—
1 Numerical testbed
1 (unique solution!
Figure 7: Strategy for the numerical testbed
the stagnation pressure distribution will be close to the analytically exact solution of the Navier-Stokes equation
for a stagnation flow targeting a flat plate. Hence this can be utillised as “knowledge”. If this is not the case,
characteristic parameters of the surface will be extracted and the pressure distribution will then be reconstructed
from the parameterized solution of the shroud gas simulation and subsequently incorporated into the testbed
at that time step. For the subsequent time step, a new set of parameters will be identified and a new gas flow
profile profile retrieved.
4. ROAD-MAP
The time frame for the development for the numerical testbed is set for three years. In this paper the authors
have presented the work and results of the first year. During that year, a model has been developed for the
solution of the incompressible Navier-Stokes equations with free surfaces, surface pressure due to the curvature
of the surface and Marangoni surface tension driven flow with energy balance. Preliminary results from this
work are presented. In the forthcoming year, the model will be extended significantly. Knowledge based modules
will be incorporated to allow for shield (shroud) gas pressures, evaporation at the surface and melt outflow will
be incorporated and hence the cutting process will be captured. This has to go along with full parallelization
of the code, since for a realistic simulation the discretization needs a significant increase in density of discrete
points. During the third year, the incorporation of knowledge modules is expected to continue, with application
to case studies.
4.1. Preliminary results
The preliminary results from this simulation are concerned with computing the dynamic behaviour of a weld
pool subject to Marangoni surface driven flow. In Figures 8 and 9 a time sequence simulation is shown. Initially
the surface is flat, evolving through a set of dynamic oscillations during time. Isolines of pressure in the melt
pool are plotted and the velocities are indicated by their respective vectors, with the magnitude of velocity
represented by their length. The trace of the height of the central point of the free surface is plotted over time
in Figure 10.
The time step of the simulation is 0.5 x 10_4s and hence the time interval between the first and second
maxima is (333 — 135) x At « 0.01s. This leads to a frequency of about 100 Hz. As this is a solution to a very
coarsely discretised general problem, the results can certainly only be interpreted in a qualitative manner. It
shows clearly the complex interplay of different physical forcing and oscillation phenomena.
Proc. SPIE Vol. 4631 259

(b) 100 xA t
(c) 200 xA t
Figure 8: Time sequence of surface, pressure and velocity distribution
260 Proc. SPIE Vol. 4631

■V'-: w-
'
Figure 9: Time sequence of surface, pressure and velocity distribution

8
Initially the flow is confined to the volume immediately underneath the surface, with the velocities aiming
towards the center of the weld pool surface. In consequence a stagnation pressure builds up. Since initially less
energy is required to lift the surface, rather than to initiate a recirculation flow field, the surface moves upward.
The build-up of liquid in the center is counteracted by gravity and surface tension. This leads to a build-up of
recirculation that eventually reduces the surface height in the center. Since this is a dynamic process, several
oscillations are observed before a steady state profile is assumed.
5. DERIVATION OF SECONDARY INFORMATION FROM A NUMERICAL TESTBED
The authors believe that the full scale testbed will provide significant findings for the practician. With respect
to the laser cutting process, this could involve the precise prediction of the heat affected zone. Most simulations
available to date are not capable of capturing the extent of the HAZ at the outflow edge (shown in Figure 11),
since the fluid flow is often neglected.
Figure 11. Schematic and micrograph of the HAZ when cutting a ceramic tile. The microstructural change in the HAZ
is clearly visible due to its darker shading.
Predicting the size and cooling rate of the HAZ is of major importance since this can impact on the me¬
chanical properties of the finished product, when phase transformations due to the temperature distribution
262 Proc. SPIE Vol. 4631

are considered (e.g. tempering, hardening). Hence reduced cutting speeds (as opposed to the optimum speed,
usually defined as being the speed associated with best quality results) may enhance properties of the workpiece
in the proximity of the cut. Predicting dross distribution has a direct benefit during part manufacture, since
the build up of dross usually requires further processing steps to remove it, with associated quality issues.
6. CONCLUSION
The authors are optimistic that the final result will be a versatile tool for the applied scientist and engineer.
It is expected that the numerical testbed can be used in a diverse manner, ranging from evaluation of the
applicability of certain simplified simulations to gaining insight into ripple, stria and dross formation with a
predictive capability with respect to the HAZ. The authors contend that, in order to achieve these aims, a
significant computational resource is needed, and this may not always be justified. With regard to usability on
the shopfloor, this is a serious limitation. As experience shows, though, computational resources are getting
more and more accessible at significantly less cost, and hence the investigators envisage that this will ultimately
broaden the use of this tool at the shopfloor as well.
REFERENCES
1. A. V. La Rocca, “Laser applications in manufacturing,” Sci. Am. 246(3), pp. 80-87, 1982.
2. P. Sargent, H. Shercliff, and B. Wood, “Modelling materials processing: An overview,” in Proceedings of
International Conference on Computer-Assisted Materials Design and Process Simulation, COMMP’93,
pp. 474-479, Iron and Steel Institute of Japan, Sept 1993.
3. B. D. Copley S.M., “Laser melt quenching and alloying,” in Laser-Solid Interactions and Laser Processing,
AIP Conference Proceedings 50, AIP, 1978.
4. K. C. Moore P., “Topographical characteristics of laser surface melted metals,” in Laser-Solid Interactions
and Laser Processing, AIP Conference Proceedings 50, AIP, 1978.
5. T. R. Anthony and H. E. Cline, “Surface rippling induced by surface tension gradients during laser surface
melting and alloying,” Appl. Phys. 48, pp. 3888-3894, 1977.
6. U. Gratzke, P. D. Kapadia, J. Dowden, J. Kroos, and G. Simon, “Theoretical approach to the humping
phenomenon in welding processes,” Journal of Physics D: Applied Physics 25(11), pp. 1640-1647, 1992.
7. H. Atwa, N. M. Mawsouf, and M. Y. Younan, “Study of the effect of defects on the fatigue behavior and the
fracture-toughness for low-carbon steel (api 51 grade b) gas transmission pipelines,” Engineering Fracture
Mechanics 44, pp. 921-, APR 1993.
8. R. E. Green, ed., Machinery’s Handbook 25, Industrial Press, 25 ed., 1996.
9. P. Di Pietro and Y. L. Yao, “An investigation into characterizing and optimizing laser cutting quality - a
review,” International Journal of Machine Tools & Manufactur 34, pp. 225-243, FEB 1994.
10. R. A. Brown and S. H. Davis, Free boundaries in viscous flows. Workshop. Program on phase transitions and
free boundaries. Papers, vol. 61 of The IMA volumes in mathematics and its applications, Springer-Verlag,
1994.
11. J. Powell, CO2 Laser Cutting, Springer, second ed., 1998.
12. F. Klocke, O. Auer, and M. Hamers, “Laser treatment of advanced materials,” wt Werkstattstechnik 1,
2000.
13. K. Chen, Y. L. Yao, and V. Modi, “Numerical simulation of oxidation effects in the laser cutting process,”
International Journal of Advanced Manufacturing Technology 15(11), pp. 835-842, 1999.
14. M. Vicanek, G. Simon, H. M. Urbassek, and I. Decker, “Hydrodynamical instability of melt flow in laser
cutting,” Journal of Physics D: Applied Physics 20(1), pp. 140-145, 1987.
15. A. Kar and J. Mazumder, “Mathematical-model for laser-ablation to generate nanoscale and
submicrometer-size particles,” Physical Review E 49, pp. 410-419, JAN 1994.
Proc. SPIE Vol. 4631 263

High power gas-discharge and laser-plasma based EUV sources
Frank Flohrer, Kai Gabel, Diethard Klopfel, Peter Kohler XTREME technologies GmbH, Goschwitzer Str. 25, D-07745 Jena, Germany
Imtiaz Ahmad, Sven Gotze, Jurgen Kleinschmidt, Vladimir Korobotchko, Jens Ringling,
Guido Schriever, Uwe Stamm XTREME technologies GmbH, Hans-Bockler-Str. 27, D-37079 Gottingen, Germany
Phone +49-551-6938-261, Fax +49-551-6938-260, email [email protected]
ABSTRACT
In this paper we discuss new results from investigations on high power EUV sources for micro-lithography based on
gas discharge produced plasmas and laser produced plasmas. The EUV development is performed at XTREME
technologies GmbH, a joint venture of Lambda Physik AG, Gottingen, and Jenoptik LOS GmbH, Jena.
For gas discharge EUV sources we report data based on Xenon filled Z-pinches. Prototypes of the EUV source achieve
an EUV output power of 10 W in-band in continuous operation. Repetition rates of 1kHz are possible with liquid
cooling of the discharge head. The spectral distribution of the EUV radiation shows a maximum around 13.5 nm and matches the reflection characteristics of silicon/molybdenum multilayer mirrors. Conversion efficiencies between
0.25% and 0.7% into a solid angle of 2k sr were achieved with the Z-pinch source depending the discharge geometry. The total EUV average power in the spectral range between 5nm and 50 nm is about 200 W in 1.8 sr. Pulse energy
stability data show standard deviation between 1-4 %. Spatial and temporal emission characteristics of the discharge
source in dependence on the discharge geometry are discussed.
The laser plasma investigations are performed with an experimental setup consisting of a diode pumped laser system
coupled to a liquid jet target. Since the conversion efficiency into EUV-power depends critically on the emitter density
in the interaction region, we use a Xenon-jet, which is cryogenically liquefied and injected under high pressure into the
vacuum vessel. Thus the laser is impinging on a target of solid-state density, which allows the generation of EUV-
radiation with high conversion efficiencies of 0.5 % into a solid angle of 2k sr.
Keywords: gas-discharge, z-pinch, laser-produced plasma, EUV, lithography
1. INTRODUCTION
Next generation lithography exposure tools for semiconductor chip manufacturing are expected to be based on extreme
ultraviolet (EUV) technologies. Current approaches of the optical system are designed to use an illumination
wavelength of 13.5 nm. The mirrors used in the illumination system will reflect a spectral portion of 0.27 nm of the
radiation from the EUV source (2% bandwidth).
Currently two different kinds of EUV sources are under investigation worldwide for commercialization of EUV related
technology: Gas discharge produced plasmas and laser produced plasmas. The output power of the EUV radiation and
source lifetime of state of the art EUV sources are the most critical parameters. Up to now they are still orders of
magnitude below those parameters, which are expected as the requirements of sources for EUV-lithography mass-
production. Based on current knowledge both concepts, gas -discharge sources or laser-plasma sources, have their own,
specific advantages and drawbacks. Scientists at XTREME technologies are investigating both source concepts to fulfill
the source requirements. The gas discharge based sources are aimed to match the specifications needed during the
development phase for EUV lithography, whereas the achievement of specifications for production tools is a high
technical risk. The laser produced plasma source is considered as a backup development for high EUV output power for
production tools. This technology suffers from the high cost of ownership caused by the high power laser system.
Critical issues limiting the lifetime of the sources are the strong plasma wall interaction, which leads to sputtering
effects and wall material erosion. In case of gas discharge produced plasma sources these are the electrodes and the
264
Gas and Chemical Lasers and Intense Beam Applications III, Steven J. Davis, Michael C. Heaven, Editors, Proceedings of SPIE Vol. 4631 (2002) ©2002 SPIE • 0277-786X702/$ 15.00

ceramics separating them, in case of the laser produced plasma sources the nozzle providing the target material is the
part closest to the plasma. Gas-discharge produced plasma sources operate with small plasma-wall separation which
implies limitations due to heat removal. Laser-plasma sources offer a potentially larger plasma-wall separation while
the reliable operation of the plasma at a large distance from the nozzle at a high power level has to be demonstrated.
Both concepts are currently investigated by XTREME technologies.
2. GAS-DISCHARGE PRODUCED PLASMA EUV-SOURCE
We report data from gas discharge EUV sources based on Xenon filled Zpinches [1]. A wide field of discharge
parameter is accessible with this setup. This includes geometrical parameter (e.g. electrode distance, insulator diameter
and electrode shapes) as well as electrical parameter (e.g. voltage, capacity and inductivity) to achieve highest
conversion efficiencies (schematic see figure 1). The electrical circuit including magnetic compression stages are
matched to the discharge unit to achieve short discharge current rise-times and to minimize losses in the circuit. The
capacitor storage bank allow for electrical input energies up to 40 J/pulse.
Figure 1 Schematic of the Z-pinch gas discharge device with surface pre-ionization.
The emission power of the gas discharge based source has been determined by using calibrated standard metrology
tools. The energy monitoring tool comprising two multi-layer mirrors to select the proper EUV band, a metal filter to
reject “out of band” radiation, and an EUV sensitive photodiode. A calibration factor is applied to account for the
slightly wider EUV band of our particular measurement tool. These tools enable the absolute measurement of the EUV
output power. The calibration of the measurement tools was performed in collaboration with ALXUV, Aachen,
Germany. For this cross calibration the used metrology tools were compared to tools, which were calibrated before by using synchrotron radiation at PTB in Berlin.
The gas discharge prototype source achieves an EUV output power of 10 W at 13.5 nm wavelength in 2 % bandwidth
and the usable angle of 1.8 sr working with a repetition rate of 1000 Hz. Assuming an isotropic emission distribution
this corresponds to an output power of 35 W into a solid angle of In sr. Using a fast photodiode behind the described
optical filters the emission duration was determined to 180 ns (FWHM). The measured output energy leads to
conversion efficiencies between 0.25 and 0.7 % in 2% bandwidth and 27isr solid angle from electrically stored energy
into usable in-band EUV power, depending on the discharge geometry.
The surface discharge pre-ionization in the design allows for homogenous ignition conditions of the plasma yielding
reproducible results and good pulse-to-pulse energy stability (measured between <7=1% and <5=4 %) of the emitted pulses (figure 2).
Proc. SPIE Vol. 4631 265

Figure 2 Pulse to pulse stability of the EUV emission. At 400 Hz repetition rate the energy emission was measured to a< 2%.
The emission spectrum of the radiation was masured with a reflection grating spectrograph including a flat-field
grating and a CCD detector. Using Xenon as working gas the spectrum shows a maximum of intensity around 13.5nm
in adaptation to the reflection characteristic of a molybdenum silicon multilayer mirror (figure 3). The reflection band of
2% bandwidth of a multilayer system is shown as a bar in the background. Oxygen as working gas was used for the
emission of small freestanding lines for the wavelength calibration and the determination of the spectral resolution of
the spectrograph. Assuming delta shaped emission lines from oxygen the spectral resolution of the spectrograph could
be measured to /.'A/. = 100.
10.0 10.5 11.0 11.5 12.0 12.5 13.0 13.5 14.0 14.5
WAVELENGTH [ nm ]
Figure 3 Emission characteristic of the Z-pinch EUV source filled with xenon in comparison to oxygen. The 2 % bandwidth of a multilayer system at 13.5 nm is shown as bar in the background.
266 Proc. SPIE Vol. 4631

The Xenon emission spectrum (figure 3) shows a large amount of radiation in the EUV spectral range outside of the
bandwidth of 2% around 13.5 nm wavelength. Only radiation within the bandwidth, which is marked in the spectrum,
can be reflected by a stack of multilayer mirrors used for imaging in future lithography tool. All other radiation is
absorbed inside the mirror layers and heats the optics. The use of grazing incidence optics with broad reflection
characteristics could make this radiation utilizable for applications requiring broadband radiation as e.g. material
research or micro machining.
3. LASER-PRODUCED PLASMA EUV-SOURCE
Figure 4 shows the principal setup of a laser-produced plasma EUV-source and an additional EUV optics to collect the
emission and re-direct it into an intermediate focus. A similar scheme can be expected when the laser-produced EUV-
plasma is employed as the source in a lithography scanner. Several diagnostics of the emission characteristics, radiative
and particulate, are employed for optimization and source monitoring.
Laser radiation is converted into EUV in a hot plasma with temperature T ~ 106 K, which is formed by the interaction of
the laser beam with a high density target. Apart from the requirement of high conversion efficiency into EUV-radiation
additional constraints are imposed by minimized particle-bombardment (debris) of surrounding optics.
The requirements onto the target can be summarized as follows:
(1) A volume of high target density at the laser focus to supply a large number of emitters
=> liquid or solid modification
(2) An interaction region at a large distance from surrounding components to minimize the heat load density at
these components => high pointing stability of the target stream
(3) A benign material which converts laser radiation into EUV efficiently => Xe
The inert gas Xenon seems currently the best compromise of intense EUV-emission into a 2% bandwidth at 13.5 nm and minimal optics contamination / damage.
A first experimental setup of a laser produced plasma EUV source was built up consisting of a Xe-jet-target coupled to
a pulsed 40 W laser with 100Hz repetition rate. This system was used to acquire data on the spatial stability of the jet- target and on the conversion efficiency.
Jet-targets of different liquids coupled to intense laser beams are published to generate radiation in several spectral
regions, some of them covering the relevant EUV-band [2]. In our setup Xenon is cryogenically liquefied and injected
under high pressure through a nozzle of several 10 pm diameter into the vacuum vessel. A 2nd cryogenic pump serves
as the collector of the target material, and pumps the chamber to a pressure below 10"3 mbar. A photograph of the target
Proc. SPIE Vol. 4631 267

assembly is shown in figure 5. The jet enters the chamber from the top and is collected in the cryogenic pump at the
bottom. The laser beam enters the chamber normal to the plane of the figure and hits the jet in the center of the
chamber.
Figure 5 photograph of the interaction chamber
The spatial stability of the jet allows for plasma generation up to a distance of 1cm from the nozzle-tip. Typical
experiments were performed at a distance of about 5 mm, which results in reduced fluctuations of the EUV-yield.
Figure 6 shows a photograph of the liquid Xe-jet and of the plasma generated by interaction of the laser beam with the
jet respectively. The plasma picture was taken with a CCD-camera, which was sensitive in the VIS region.
Figure 6 photograph of the liquid Xenon jet (left) and of the laser plasma generated on the jet (right)
The EUV energy was measured with a calibrated energy monitoring tool as used for the gas discharge produced plasma EUV sources and described above. Figure 7 shows an EUV energy monitor signal averaged over 128 shots. The
measured EUV-yield corresponds to a conversion efficiency exceeding 0.5% in 2k sr and 2% bandwidth. The current
conversion efficiency corresponds to an average EUV power of 200 mW, which can be generated with 40 W laser
power. It is noteworthy that the current conversion efficiency was obtained with alignment of the laser focus relative to the Xe-
jet only. Improvements are expected by optimization of laser and target parameters.
268 Proc. SP1E Vol. 4631
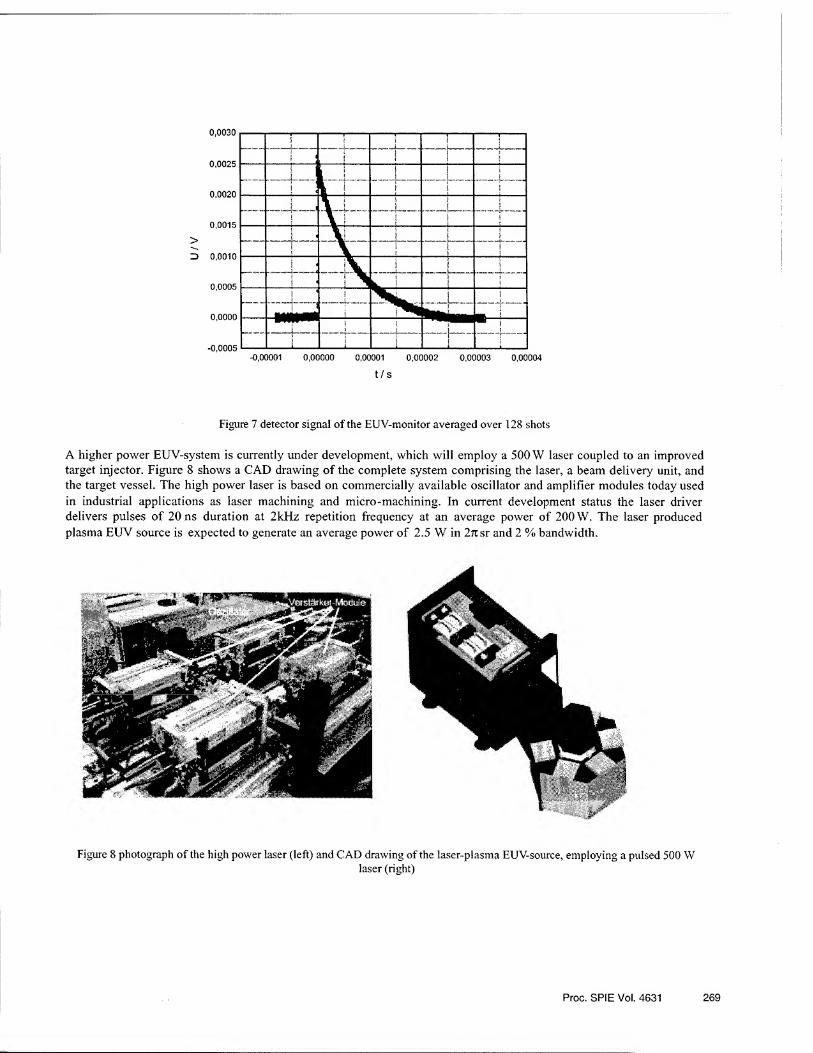
-0,00001 0,00000 0,00001 0,00002 0,00003 0,00004
t/s
Figure 7 detector signal of the EUV-monitor averaged over 128 shots
A higher power EUV-system is currently under development, which will employ a 500 W laser coupled to an improved
target injector. Figure 8 shows a CAD drawing of the complete system comprising the laser, a beam delivery unit, and
the target vessel. The high power laser is based on commercially available oscillator and amplifier modules today used
in industrial applications as laser machining and micro-machining. In current development status the laser driver
delivers pulses of 20 ns duration at 2kHz repetition frequency at an average power of 200 W. The laser produced
plasma EUV source is expected to generate an average power of 2.5 W in 2itsr and 2 % bandwidth.
Figure 8 photograph of the high power laser (left) and CAD drawing of the laser-plasma EUV-source, employing a pulsed 500 W laser (right)
Proc. SPIE Vol. 4631 269

4. CONCLUSIONS / SUMMARY
EUV sources based on gas discharge produced plasmas as well as laser produced plasmas have been investigated as
potential sources for EUV lithography exposure tools. For gas discharge produced plasmas conversion efficiencies of
0.3-0.7% into 2% bandwidth at 13.5 nm and in a solid angle of 2jc sr have been measured. For laser produced plasmas
conversion efficiencies under same conditions of 0.5 % have were achieved. As the conversion efficiencies are of the
same order of magnitude, the generation of a certain output power requires a similar energy input into the plasma for
both concepts. While the gas discharge produced plasma EUV sources require high voltage power supplies as driver,
laser produced plasma EUV sources have to use laser drivers of the same average power. With gas discharge we
generated an EUV output power of 10 W at 13.5 nm wavelength in 2% bandwidth. The usable angle was 1.8 sr. With
the laser produced plasma we achieved 200mW EUV output power in 2k sr and 2% bandwidth. Due to the broad emission characteristics of Xenon plasmas generated by both described methods, the output power of
the sources is much higher if the useable spectral range is not limited by multilayer optics. This can be used for other
applications working with broadband optics, e.g. grazing incidence mirrors.
5. ACKNOWLEDGEMENT
We acknowledge the research work by K. Nicklaus, R. Meyer, L. Becks, Ch. Warias, and D. Hoffmann of the
Fraunhofer Institut fur Lasertechnik performed on the development of a pulsed high power laser and V. Borisov, A.
Ivanov, O. Khristoforov and A. Vinokhodov from State Research Center of Russian Federation, Troitsk Institute for
Innovation and Fusion Research (TRINITI) for the support of the gas discharge plasma development.
6. REFERENCES
[1] G. Schriever, M. Rahe, U. Stamm, D. Basting, O. Khristoforov, A. Vinokhodov, V. Borisov, „Compact Z^pinch
EUV source for photolithography”, Proc. SPIE 4343, 615 - 620 (2001)
[2] Hertz, H.M., Bergland, M., Hansson, B.A.M., Rymelli, L.: SPIE 3767, No. 01, 2-9 (1999)
Phone +49-551-6938-261, Fax +49-551-6938-260, email: [email protected]
270 Proc. SPIE Vol. 4631

Pulsed COIL with Volume Generation of Iodine Atoms in Electric
Discharge.
Nikolai N. Yuryshev, Nikolai P. Vagin, Aleksei F. Konoshenko, Vladimir S. Paziuk P.N. Lebedev Physical Institute, Moscow, Russia 119991
ABSTRACT
The method of volume generation of iodine atoms to obtain the pulsed mode of COIL is the most effective by the ratio
of pulsed power to cw one at the same flowrate of chemicals. The electric discharge is a very convenient tool to
produce iodine atoms in an active medium. The electrical efficiency close to 100% was obtained when longitudinal
glow discharge was used.
The investigation of both influence of the discharge gap length on the performance of pulsed COIL initiated with
longitudinal discharge and transverse discharge initiated pulsed COIL based on the Jet Singlet Oxygen Generator were
performed. The lasing of Jet SOG based pulsed COIL has been obtained for the first time. The operation pressure of 17
Torr at oxygen partial pressure of 7 Torr in the laser cavity has been obtained
The temperature parameters of active medium being under electric discharge initiation were analyzed. The active
medium temperature growth was shown to be responsible for decrease of specific output energy in discharge initiated
COIL unlike that for photolytic initiation.
Keywords: gas laser, chemical oxygen-iodine laser, pulsed mode, singlet oxygen generator, iodide
1. INTRODUCTION
Application of the transverse self-sustained electric discharge to initiate pulsed chemical oxygen-iodine laser (COIL)
with volume generation of iodine atoms was successfully demonstrated in [1]. This kind of electric discharge makes it
possible to work at higher active medium pressure but at the same time it requires significant efforts to make this
discharge to be uniform. In its turn, longitudinal glow discharge, having limitation by operation pressure, is a very
simple in realization and provide the laser to have high electrical efficiency. The value of close to 100% efficiency
(ratio of laser output energy to that stored in capacity) was reported [2].
The goal of this work is investigation of the influence of the length of the longitudinal discharge gap on the
pulsed COIL output parameters. The results obtained can be useful for designing the pulsed COIL with electric
discharge initiation. Unlike that for transverse initiation geometry the longitudinal one reserve the degree of freedom
which can be used, for example, to mount the Q-switch system based on the Zeeman effect.
Saying on longitudinal discharge we have in mind the discharge geometry where the distance between the
electrodes significantly exceed the electrode size. So one can see that shortening the discharge gap results in discharge
geometry more close to transverse one.
As it was shown in the works carried out in Lebedev Physical Institute the application of such a discharge to initiate the
pulsed COIL with volume generation of iodine atoms makes it possible the laser to operate with a high electrical
efficiency close to 100 % at specific output energy of 0.5 J / 1 per 1 Torr of 02. The laser operation at a length of
discharge gap of 60 cm was demonstrated. The application of a glow discharge to generate iodine atoms in the gas
mixture containing the singlet oxygen to form COIL active medium is not a trivial task. Indeed, the electrical discharge
produces electrons, ions, and molecular fragments. The sort and concentration of these components, in general, depend
on discharge parameters - mainly discharge energy and reduced strength of electric field E/N. Besides, the length of the
discharge gap determines the resistance of plasma channel and, hence, the energy deposition into the active medium.
Thus the optimization of discharge parameters to improve the energy parameters of the laser is a crucial task and
variation of the length of the discharge gap allows one to vary latter parameter keeping the voltage constant.
2. EXPERIMENTAL
Gas and Chemical Lasers and Intense Beam Applications III, Steven J. Davis, Michael C. Heaven, Editors, Proceedings of SPIE Vol. 4631 (2002) © 2002 SPIE • 0277-786X702/$ 15.00 271

The schematic diagram of experiment with longitudinal discharge is shown in a Fig.l. The discharge chamber is
mounted in one of the shoulders of experimental facility used in investigations of a pulsed COIL initiated with a
longitudinal discharge [2] The discharge chamber, 39-mm i.d., is made of PMMA. The chamber has 5 electrode holes. The electrode section of
typical flash lamp, 20-mm o.d., is chosen as a cathode. These sections are inserted into electrode holes and sealed. The
annular electrode is a common anode. To eliminate the influence of near electrode regions the electrodes are carried out
the laser cavity area. Thus, the discharge positive column processes only form the laser active medium.
The discharge chamber with a moving annular cathode was investigated too. But this design was abandon due to
instability of results obtained. The electrical discharge fed by a capacitor bank is triggered with a thy ration TGI-25/1000 operating at a voltage up to
25 kV. The capacitor bank is assembled of several disk ceramic capacitors. Variation of both the voltage and the
number of capacitor makes it possible to change the discharge energy.
The singlet oxygen is produced in the sparger type SOG packed with Rushig rings to, firstly, intensify the mass-
transfer and, secondly, to prevent ejection of BHP from SOG. The buffer gases (N2, Ar, SF6) is fed trough the SOG in a
mixture with chlorine. The typical pump capacity in experiment is 80 1 / s. The previously made measurements of the
dependence of singlet oxygen yield on pump capacity allow us to evaluate the value of SO yield under different
experiment conditions. The laser operation at different length of the discharge gap is compared by output specific energy and efficiency, i.e.
ratio of output specific energy to specific deposition energy. But output laser energy depends on the level of threshold
exceeding, which, in its turn, depends on the gain length, i.e. length of the discharge gap. The 0.8 % transmission of the
output spherical mirror of laser cavity is chosen to minimize this effect (the transmission of about 4 % is optimal for
majority of experimental conditions). The 0.05 % transmission spherical mirror is chosen as a totally reflecting one. The
laser output energy is limited with an external 30-mm diameter diaphragm installed 45 cm from output mirror.
The output laser energy emitted from aperture of 30 mm is measured with IMO - 2N, the pulse shape is recorded with
a store oscilloscope and then is recorded with a digital camera Kodak DC-240.
The traditional design counter flow jet singlet oxygen generator of 4 cm internal diameter was used in experiments
with pulsed COIL initiated with transverse discharge (Fig-2). The jets were formed with an assembly of 120 tubes of 0.7
mm i.d. The length of jets or reaction zone (distance from jets injector edge to the point of chlorine injection) was as
long as 14 cm. The calculated value of specific surface area for smooth jet was 2 cm'1. The working BHP solution was
prepared in a separate vessel providing mixture cooling during the dilution process. Before utilization the working
mixture was cooled down to -10° C. Medicine purity hydrogen peroxide of 38 % concentration and 12 N water solution
of high purity KOH were used to prepare 4 1 of working BHP. The jets were driven with atmospheric pressure. This
volume was enough to provide the runtime of 17 s. The operation parameters of jet SOG were optimized to minimize
the content of residual chlorine in the SOG effluents. It was necessary to avoid instability of the mixture of singlet
oxygen with iodide due to raction
CnH2n+iI + 02 (*A) +C12 -»I + products The discharge chamber made of PMMA has a gain length 5 cm. The laser is initiated by a discharge occurring
between the bulk anode and 34 pins cathode. To stabilize the discharge each of pins is loaded with an active resistor R =
150 Q. The electrodes are 2 cm spaced. So the active medium volume is 20 cm3. The capacitor bank consist of ceramic
C = 4.7 nF capacitors. The necessary capacitance and operation voltage of the bank is obtained by connecting several
units in parallel or in series. The investigated region of capacitance is from 2.3 to 7 nF. Operation voltage is 16 kV. The
trigger generator provided the discharge repetition frequency of about 1 Hz.
The laser optical cavity is formed with spherical and plane mirrors spaced by 70 cm. The generation parameters are
detected with calorimeter IMO-2N and Ge-photodetector. Singlet oxygen produced in the jet SOG is fed to laser chamber through the transport section of 20x50 mm cross-
section and 160 mm length. The pump rate in the SOG is controlled via injection of necessary flow of buffer gas N2
through the tube injector. 8mm o.d placed near the inlet of transport section. Iodide is injected into N2 - 02 mixture 60
mm downstream of N2 injector. The iodide mixing length is 105 mm.
3. RESULTS AND DISCUSSION
3.1. Pulsed COIL initiated with longitudinal discharge
272 Proc. SPIE Vol. 4631

All experiments were carried out with an operation mixture of 1 Torr 02 and 0.5 Torr CF3I. Helium, nitrogen and
sulfur hexafluoride are used as buffer gases. The experimental parameters were varied within 10 - 58.5 cm for
discharge gap, from 10 to 20 kV for discharge voltage and from 2 to 8 Torr for partial buffer gas pressure.
Unlike photolysis, which is a very selective tool for iodide decomposition, the electric discharge interacts with all
components of active medium. Forming electrons, ions and different molecular fragments, electric discharge modifies
the active medium composition. In its turn, the initial composition of an active medium is a factor determining the
discharge parameters: breakdown voltage, electron distribution by energy, discharge resistance, etc. Thus, the
interpretation of the results obtained is a very difficult task. Nevertheless, we tried to evaluate the general rules in the
behavior of the pulsed COIL with longitudinal discharge initiation.
The term “transverse” usually applies to the discharge geometry when discharge gap is appreciably less the cross-size.
In this case the discharge resistance is low. When resistant loaded pins electrode is used for discharge stabilization the
energy stored in capacitor bank is distributed between the plasma and load proportionally to their resistance. So, the
variation of plasma resistance due to buffer gas, for example, results in change of energy deposition into active medium.
In the case of longitudinal geometry, when electrode separation is long enough, the capacitor energy is wholly
deposited into active medium. So, the energy deposition is governed by capacitor only. It results in less influence of
buffer gas pressure on laser output energy and pulse duration as compared with that for transverse excitation. This effect
is most strongly marked for He as a buffer gas.
Another situation takes place when nitrogen N2 is used as a buffer gas. In this case the pattern of buffer gas influence
depends on the length of the discharge gap. Considering only the situations when the laser operates highly over the
threshold one can see that for short discharge length the increase of nitrogen partial pressure results in initially weak and
then sharp drop of output energy. At longer discharge length the sharp drop of output energy arrives at less nitrogen
pressure. It means the buffer gases not only increases the heat capacity of active medium but also significantly change
the plasma parameters and, may be, the discharge uniformity.
This effect is more demonstrated for sulfur hexafluoride. Being very electronegative, SF6 affects very strongly even at
low concentration. Nevertheless, at short discharge length longitudinally excited COIL can operate with SF6 as a buffer
gas and, hence, chemical generation of iodine atoms due to reaction of fluorine atoms produced in a discharge with
hydrogen iodide as an iodine donor is possible.
F + HI = I + HF
It was observed in the first experiments with electric discharge initiated pulsed COIL the output specific energy of
such a laser is at disadvantage in relation to photolytically initiated one. The different factors can be the reason of such a
phenomen. They are decrease of the singlet oxygen yield, forming the effective quenchers of excited states, heating of
active medium and, hence, decrease of extractable fraction of energy stored in singlet oxygen. As it was shown the latter reason is the most possible.
The typical value of energy required to break the bond C-I in alkyliodides or perfluoro-alkyliodies is about 210
kJ/mol ( 53 kkal/mol for CF3I, 54 kkal/mol for CH3I). When photolysis is used to produce iodine atoms from these
species which have a maximum absorption at the wavelength of about 270 nm the energy absorbed to produce one
iodine atom is 7,4-10"19 J (446 kJ/mol). Thus, the photo dissociation process is 225 kJ/mol exothermic. In fact the
reaction is somewhat less exothermic because the fraction of iodine atoms is produced in excited state I (2P1/2) (92
kkal/mol). The yield of excited state strongly depends on the sort of iodine donor and assumed to be zero in this
consideration. If one produces the iodine concentration of L1018 l 3 that corresponds to the COIL pulse duration of
about 10 ps, the UV energy absorbed in the active medium is 0,74 J/l. But only half of this quantity of energy (0.37 J/l)
is transferred to translation degrees of freedom i.e.to heat.
Another situation takes place when electric discharge is used instead of photolysis. In this case the comparable
pulse duration is obtained when specific energy stored in the capacitor bank exceeds 8 J/l. When longitudinal discharge
without ballast resistor is used, all energy stored in the capacitor bank is deposited into active medium. Thus,
subtracting the energy consumed for breaking the CF3-1 bond, one can evaluate the value of energy to be transferred to
heat (7.63 J/l) twenty times as much as that in photolysis.
As soon as the active medium is practically immovable during the short pulse its temperature is governed by heat
capacity Cv. The values of Cv for different components of the mixture at partial pressure 1 Torr are:
CF3I 3.3-10'3 J/l K
02 1.12 Ar, He 0.67
Proc. SPIE Vol. 4631 273
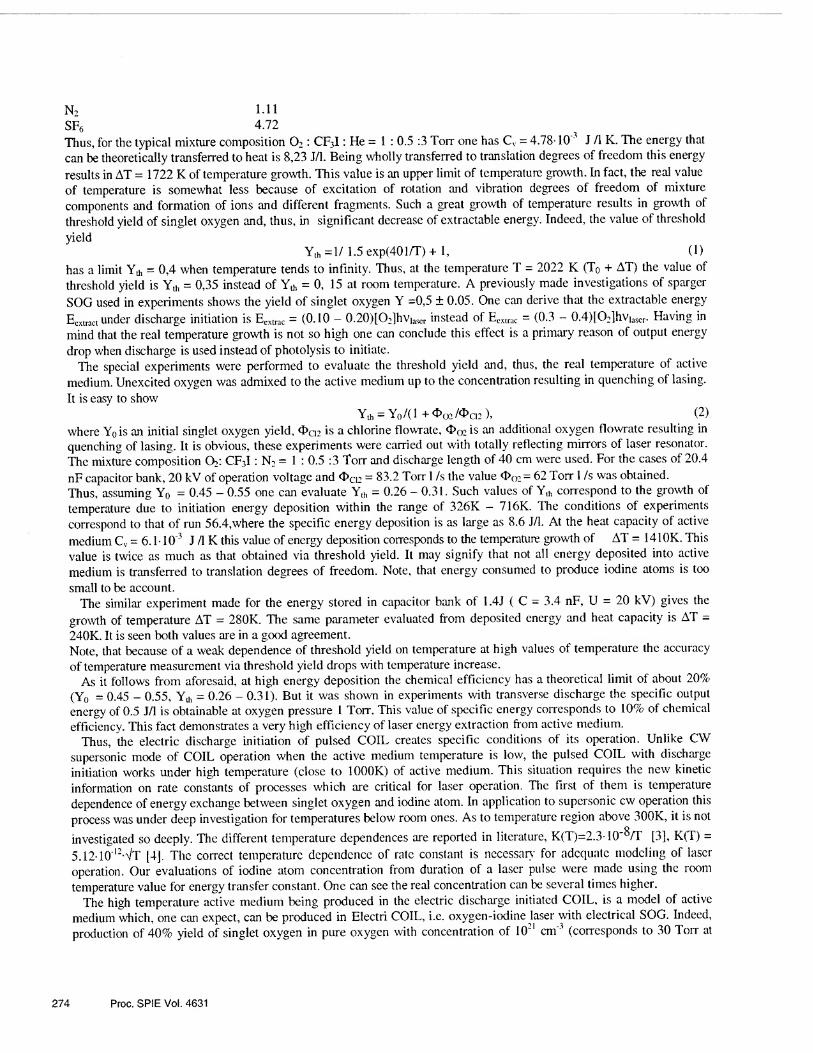
N2 1.11
SF6 4.72
Thus, for the typical mixture composition 02: CF3I: He = 1 : 0.5 :3 Torr one has Cv = 4.78* 10 3 J A K. The energy that
can be theoretically transferred to heat is 8,23 J/l. Being wholly transferred to translation degrees of freedom this energy
results in AT = 1722 K of temperature growth. This value is an upper limit of temperature growth. In fact, the real value
of temperature is somewhat less because of excitation of rotation and vibration degrees of freedom of mixture
components and formation of ions and different fragments. Such a great growth of temperature results in growth of
threshold yield of singlet oxygen and, thus, in significant decrease of extractable energy. Indeed, the value of threshold
yield Yth =1/ 1.5 exp(401/T) + 1, (1)
has a limit = 0,4 when temperature tends to infinity. Thus, at the temperature T = 2022 K (T0 + AT) the value of
threshold yield is Y* = 0,35 instead of Yth = 0, 15 at room temperature. A previously made investigations of sparger
SOG used in experiments shows the yield of singlet oxygen Y =0,5 ± 0.05. One can derive that the extractable energy
Eextract under discharge initiation is Eextrac = (0.10 - 0.20)[02]hViaser instead of Ecxtrac = (0.3 - 0.4)[O2]hViascr. Having in
mind that the real temperature growth is not so high one can conclude this effect is a primary reason of output energy
drop when discharge is used instead of photolysis to initiate. The special experiments were performed to evaluate the threshold yield and, thus, the real temperature of active
medium. Unexcited oxygen was admixed to the active medium up to the concentration resulting in quenching of lasing.
It is easy to show
Yth = Y0/(l+OO2/<I>a2), (2)
where Y0is an initial singlet oxygen yield, Oqz is a chlorine flowrate, d>o2 is an additional oxygen flowrate resulting in quenching of lasing. It is obvious, these experiments were carried out with totally reflecting mirrors of laser resonator.
The mixture composition O2: CF3I: N2 = 1 : 0.5 :3 Torr and discharge length of 40 cm were used. For the cases of 20.4
nF capacitor bank, 20 kV of operation voltage and <l>ci2 = 83.2 Torr 1 /s the value 002= 62 Torr 1 /s was obtained.
Thus, assuming Y0 = 0.45 - 0.55 one can evaluate Yth = 0.26 - 0.31. Such values of Yth correspond to the growth of
temperature due to initiation energy deposition within the range of 326K - 716K. The conditions of experiments
correspond to that of run 56.4,where the specific energy deposition is as large as 8.6 J/l. At the heat capacity of active
medium Cv = 6.1* 103 J /l K this value of energy deposition corresponds to the temperature growth of AT = 141 OK. This
value is twice as much as that obtained via threshold yield. It may signify that not all energy deposited into active
medium is transferred to translation degrees of freedom. Note, that energy consumed to produce iodine atoms is too
small to be account. The similar experiment made for the energy stored in capacitor bank of 1.4J ( C = 3.4 nF, U = 20 kV) gives the
growth of temperature AT = 280K. The same parameter evaluated from deposited energy and heat capacity is AT =
240K. It is seen both values are in a good agreement. Note, that because of a weak dependence of threshold yield on temperature at high values of temperature the accuracy
of temperature measurement via threshold yield drops with temperature increase. As it follows from aforesaid, at high energy deposition the chemical efficiency has a theoretical limit of about 20%
(Y0 = 0.45 - 0.55, Y^ = 0.26 - 0.31). But it was shown in experiments with transverse discharge the specific output
energy of 0.5 J/l is obtainable at oxygen pressure 1 Torr. This value of specific energy corresponds to 10% of chemical
efficiency. This fact demonstrates a very high efficiency of laser energy extraction from active medium. Thus, the electric discharge initiation of pulsed COIL creates specific conditions of its operation. Unlike CW
supersonic mode of COIL operation when the active medium temperature is low, the pulsed COIL with discharge
initiation works under high temperature (close to 1000K) of active medium. This situation requires the new kinetic
information on rate constants of processes which are critical for laser operation. The first of them is temperature
dependence of energy exchange between singlet oxygen and iodine atom. In application to supersonic cw operation this
process was under deep investigation for temperatures below room ones. As to temperature region above 300K, it is not
investigated so deeply. The different temperature dependences are reported in literature, K(T)=2.3- 10'^/T [3], K(T) =
5.12-10‘12*Vt [4]. The correct temperature dependence of rate constant is necessary' for adequate modeling of laser
operation. Our evaluations of iodine atom concentration from duration of a laser pulse were made using the room
temperature value for energy transfer constant. One can see the real concentration can be several times higher.
The high temperature active medium being produced in the electric discharge initiated COIL, is a model of active
medium which, one can expect, can be produced in Electri COIL, i.e. oxygen-iodine laser with electrical SOG. Indeed,
production of 40% yield of singlet oxygen in pure oxygen with concentration of IQ*"1 cm'3 (corresponds to 30 Torr at
274 Proc. SPIE Vol. 4631
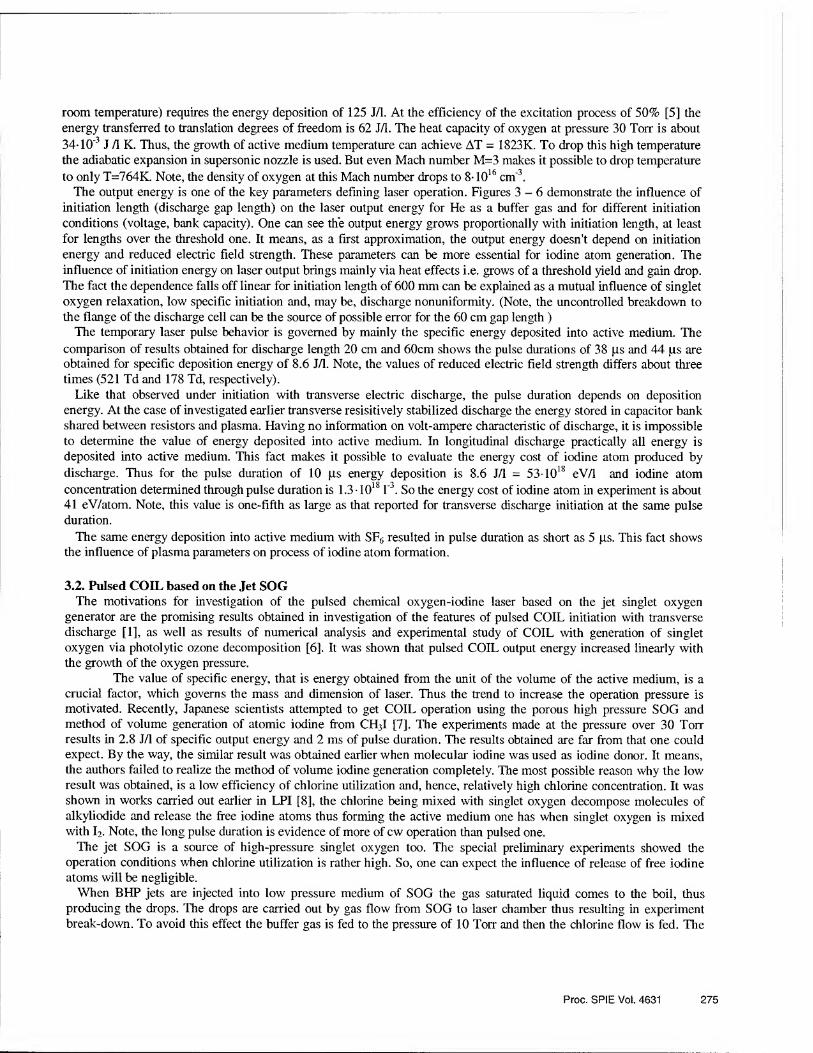
room temperature) requires the energy deposition of 125 J/l. At the efficiency of the excitation process of 50% [5] the
energy transferred to translation degrees of freedom is 62 J/l. The heat capacity of oxygen at pressure 30 Torr is about
3410*3 J /I K. Thus, the growth of active medium temperature can achieve AT = 1823K. To drop this high temperature
the adiabatic expansion in supersonic nozzle is used. But even Mach number M=3 makes it possible to drop temperature
to only T=764K. Note, the density of oxygen at this Mach number drops to 8* 1016 cm'3.
The output energy is one of the key parameters defining laser operation. Figures 3-6 demonstrate the influence of
initiation length (discharge gap length) on the laser output energy for He as a buffer gas and for different initiation
conditions (voltage, bank capacity). One can see the output energy grows proportionally with initiation length, at least
for lengths over the threshold one. It means, as a first approximation, the output energy doesn’t depend on initiation
energy and reduced electric field strength. These parameters can be more essential for iodine atom generation. The
influence of initiation energy on laser output brings mainly via heat effects i.e. grows of a threshold yield and gain drop.
The fact the dependence falls off linear for initiation length of 600 mm can be explained as a mutual influence of singlet
oxygen relaxation, low specific initiation and, may be, discharge nonuniformity. (Note, the uncontrolled breakdown to
the flange of the discharge cell can be the source of possible error for the 60 cm gap length)
The temporary laser pulse behavior is governed by mainly the specific energy deposited into active medium. The
comparison of results obtained for discharge length 20 cm and 60cm shows the pulse durations of 38 jus and 44 ps are
obtained for specific deposition energy of 8.6 J/l. Note, the values of reduced electric field strength differs about three
times (521 Td and 178 Td, respectively).
Like that observed under initiation with transverse electric discharge, the pulse duration depends on deposition
energy. At the case of investigated earlier transverse resisitively stabilized discharge the energy stored in capacitor bank
shared between resistors and plasma. Having no information on volt-ampere characteristic of discharge, it is impossible
to determine the value of energy deposited into active medium. In longitudinal discharge practically all energy is
deposited into active medium. This fact makes it possible to evaluate the energy cost of iodine atom produced by
discharge. Thus for the pulse duration of 10 ps energy deposition is 8.6 J/l = 531018 eV/1 and iodine atom
concentration determined through pulse duration is 1.3 * 10181'3. So the energy cost of iodine atom in experiment is about
41 eV/atom. Note, this value is one-fifth as large as that reported for transverse discharge initiation at the same pulse
duration.
The same energy deposition into active medium with SF6 resulted in pulse duration as short as 5 ps. This fact shows
the influence of plasma parameters on process of iodine atom formation.
3.2. Pulsed COIL based on the Jet SOG The motivations for investigation of the pulsed chemical oxygen-iodine laser based on the jet singlet oxygen
generator are the promising results obtained in investigation of the features of pulsed COIL initiation with transverse
discharge [1], as well as results of numerical analysis and experimental study of COIL with generation of singlet
oxygen via photolytic ozone decomposition [6]. It was shown that pulsed COIL output energy increased linearly with
the growth of the oxygen pressure.
The value of specific energy, that is energy obtained from the unit of the volume of the active medium, is a
crucial factor, which governs the mass and dimension of laser. Thus the trend to increase the operation pressure is
motivated. Recently, Japanese scientists attempted to get COIL operation using the porous high pressure SOG and
method of volume generation of atomic iodine from CH3I [7]. The experiments made at the pressure over 30 Ton-
results in 2.8 J/l of specific output energy and 2 ms of pulse duration. The results obtained are far from that one could
expect. By the way, the similar result was obtained earlier when molecular iodine was used as iodine donor. It means,
the authors failed to realize the method of volume iodine generation completely. The most possible reason why the low
result was obtained, is a low efficiency of chlorine utilization and, hence, relatively high chlorine concentration. It was
shown in works carried out earlier in LPI [8], the chlorine being mixed with singlet oxygen decompose molecules of
alkyliodide and release the free iodine atoms thus forming the active medium one has when singlet oxygen is mixed
with I2. Note, the long pulse duration is evidence of more of cw operation than pulsed one.
The jet SOG is a source of high-pressure singlet oxygen too. The special preliminary experiments showed the
operation conditions when chlorine utilization is rather high. So, one can expect the influence of release of free iodine atoms will be negligible.
When BHP jets are injected into low pressure medium of SOG the gas saturated liquid comes to the boil, thus
producing the drops. The drops are carried out by gas flow from SOG to laser chamber thus resulting in experiment
break-down. To avoid this effect the buffer gas is fed to the pressure of 10 Torr and then the chlorine flow is fed. The
Proc. SPIE Vol. 4631 275

oxygen pressure in the SOG is a sum of that for chlorine, nitrogen and iodide. At the same time, the oxygen partial
pressure in the laser chamber is equal to total pressure divided by ratio of nitrogen flowrate to that of oxygen. As the
flow velocity is subsonic the total pressure in the laser chamber is equal to that in the SOG.
Because of large idle volume of experimental set-up and low chlorine flowrate the transient period for gas flow is too
long. One can assume this effect is responsible for degradation of laser pulse parameters during the run. The pulse
amplitude decreases with time and, hence, with increase of oxygen pressure. Iodide methyl CH3I was used as an iodine
atom donor. As it was shown [9], this iodide provides the better energy parameters of laser. But its merit takes place
when active medium is free of chlorine. The experiments show that in spite the SOG operates under conditions when
the chlorine utilization is maximal, the concentration of residual chlorine is enough to cause the active medium to be
unstable. It is a reason why we could not increase the CHJ pressure and make a laser to work over the threshold.
The laser chamber used was previously designed to work in joint experiments with Samara branch of LPI and
comparison of CW and pulsed modes of COIL operation. It governed the dimensions of laser chamber. But, as it
follows from the analysis of the temperature working conditions of active medium in the case of discharge initiation, the
chosen dimension of laser chamber is not enough to provide the laser operation over threshold. Indeed, the typical
iodine atom concentration in supersonic cw COIL is about 1015 cm'3. It follows from the experiments on the pulsed
COIL initiated by the longitudinal electric discharge to create such a concentration needs to deposit into active medium
energy of 10 J/l. The specific heat capacity of the mixture of oxygen and nitrogen under 15 Torr is Cv = 16,8-10'3 J/1K.
Thus the temperature increase is AT = 600 K. It means the temperature of active medium can achieve the value of 900K.
Under such a temperature the small signal gain is G0 = 7,8* 104 cm'1 at singlet oxygen yield Y=50%. So the total gain at
the double pass length L= 10 cm is G = 7,8-103 = 0,78%. The temperature of active medium in the case of supersonic cw COIL is but 150K. This value at the similar operation
condition corresponds to the small signal gain of Go = 5,4* 10'3 cm'1 and total gain of G = 5,4%. Thus, pulsed laser with
discharge initiation has a gain one order of magnitude less. So, the laser operation needs application of mirrors with
high reflection. Such mirrors, as a rule, have relatively high level of losses.
It is not correct to say about any energy parameter when the laser operates with a totally reflecting mirrors.
Nevertheless, we succeeded to get the laser operation under oxygen pressure in laser cavity of 7 Torr, iodide pressure of
1.8 Torr and total pressure of 17 Torr. Note the pulse duration obtained was as short as 5 ps.
4. CONCLUSION
The experiments with pulsed COIL initiated with a longitudinal electric discharge showed the initiation length up to 60
cm is available in the active medium conditions close to that of cw laser.
It is shown the active medium temperature growth after discharge can be responsible for the specific output energy drop
as compared to photolytic initiation. The laser effect is obtained for the first time with the pulsed COIL based on the jet singlet oxygen generator. The
laser operation is obtained under the total pressure of 17 Torr and oxygen partial pressure of 7 Torr. The laser operation
under the high pressure makes it possible to reduce the pump rate and, thus, to minimize the weight and size of the
laser.
ACKNOWLEDGEMENTS
This work was partially supported by EOARD trough the ISTC contract #1864P
REFERENCES
1. .P. Vagin andN.N. Yuryshev, Quantum Electronics 31(2), pp. 127-131, 2001
2. N.P. Vagin, V.S .Pazyuk and N.N.Yuryshev, Quantum Electronics 25(8), pp. 746-748, 1995
3. D.A. Copeland , A.H.Bauer, IEEE J. Quant. Electron., 29, p. 2525, 1993
4. T.Marter, M.C. Heaven and D.Plummer, Chem. Phys. Lett., 260, p. 201 1996
276 Proc. SPIE Vo!. 4631

5. D. M. King, D. L. Carroll, J. K. Laystrom, J. T. Verdeyen, M. S. Sexauer, W. C. Solomon. Proc. Int. Conf. LASERS
2000, Dec. 4-8,2000, Albuquerque, NM, USA, Ed. by V.J.Corcoran & T.A.Corcoran, STS Press, McLEAN, VA, p.265, 2001
6. V.A. Zolotarev, P.G. Kryukov, et al. Kratk. Soobshch. Fiz. (3) p. 24,1990 7. K.Suzuki, K.Minoshima, D.Sugimoto et al, Proc. SPIE vol. 4184, pp. 124-127, 2001 8. N.P. Vagin, P.G. Kryukov, V.S .Pazyuk and N.N.Yuryshev, Sov. J. Quantum Electronics 18, pp. 1114-1117, 1988
9. N.P. Vagin., V.A. Zolotarev et al. J.Sov.Las.Res., 13, p. 60, 1992.
Proc. SPIE Vol. 4631 277
TO PUMP ,_58-j_^ TO PUMP
Fig.l. Schematic diagram of the discharge chamber used in investigation of a pulsed COIL initiated with a longitudinal glow discharge.
Fig.2. Schematic diagram of experiment with pulsed COIL based on a jet SOG
Proc. SPIE Vol. 4631


Observation on laser induced lens effect in sound generation under water using high power ultrashort pulse laser
Huijuan He *a, Saosong Feng b, a Shanghai Institute of Optics and
Fine Mechanics;b Shanghai Acoustics Lab
ABSTRACT
The ultrashort pulse of Nd:YAG laser system is used to generate the sound in water. The picosecond laser beams are
focused at two points in experiments. This effect implies that the time response is inherent due to the changes of index
of refraction of water induced by laser beam intensity.
Keywords: Ultrashort pulse, mode-locked laser, train pulse, single pulse, laser induced lens, index of refraction of
water, shock wave, focusing spots, sound wave, bifocus effect
1. INTRODUCTION
Since Bell1 discovered the photoacoustic effect in 1880, the generation of sound in water by photoacoustic effect
has been proposed again hundred years later2. Generation photoacoustic effect using laser beam with very high
intensity is an attractive method. According to the energy emitted by the laser, three mechanisms fall under the
generation of sound: (1) thermoacoustic, (2) evaporation and (3) optical breakdown. In this paper, the ultrashort pulse
laser has been used to generate the sound under water. An effect of laser induced lens has been observed obviously.
There are two focusing spots in water. One of them is the convex lens used for focusing laser beam to produce focusing
spot. Other is laser energy induced lens, which produces induced focus spot. The time process occurs when the index of
refraction of water is changed, the variety of index of refraction is induced by laser beam. This phenomenon can be
used to estimate the response time of the changes of index of refraction of water.
2. EXPERIMENT RESEARCH
The ultrashort pulse laser is a Nd:YAG mode-locked laser3, which consists of oscillator and two stages amplifiers.
Passive mode-locking dye cell for short pulse duration and active acousto-optics modulation for stabilization are
combined in the oscillator. It is possible to generate extremely reproducible mode-locked pulses with Gaussian temporal
and spatial profile. The transverse mode structure is TEM 00. Usually the output of ultrashort pulse is a train of 10
pulses as shown in Figure 1. A single pulse selector is used to select one pulse from the train for amplification. The train
pulse and single pulse laser beam are used for research the photoacoustic effect respectively. The duration of single
pulse is 40 picosecond. The envelope of train pulse is 100 nanosecond contains 10 pulses with pulse duration 40
picosecond. The separation between two pulses is 10 nanosecond. The power intensity of laser pulse is more than
10loW/cm2.
280
Gas and Chemical Lasers and Intense Beam Applications III, Steven J. Davis, Michael C. Heaven, Editors, Proceedings of SPIE Vol. 4631 (2002) ©2002 SPIE • 0277-786X/02/$15.00
The set-up of the experiment is shown in Figure 2. The laser beam is splitting into two beams by an optical splitter.
One of them is focused by a convex lens. The focusing spot is located under the water surface at 2cm. Other beam is
going to photodiode for monitor the energy of laser beam. The sound induced by laser beam in water is detected by a
Hydrophone (piezoelectric transducer). The frequency response is straight in the frequency band 1-lOMHz and the
sensitivity is about 0.5 // v/Pa.
When the laser beam is focused by the convex lens at 2cm under water surface, the hydrophone is located at the
4cm under the water surface and 1.5cm apart the laser beam. The waveform of the sound pulses have been detected by
hydrophone. The results are shown in Figures 3-5 with pulse duration 40 picosecond. In figures 3 and 4 the waveform is
induced by train pulse of laser. The waveform in figure 3 is the case of lower intensity 6 x 10¹⁰ W/cm 2, the shock wave
does not be excited on the water surface. In figure 4 the intensity of laser beam is stronger as 25 x 1010 W/cm2, in this
case the shock wave is excited on water surface. The waveform induced by a single pulse is shown in Figure 5. For this
case the laser beam intensity is 6.4 x 10¹⁰ W/cm2, similar to that for the case of figure 3, but the shocks excited on the
water surface, likes that in figure 4. For the case of figure 3, the laser beam intensity for every pulse in train pulses is
about ten times lower than the single pulse of laser beam in the case of figure 5. While for the case of figure 4, the laser
beam intensity of some pulses in train pulse is alike that of single pulse in the case of figure 5. For the case of figure 3,
the detected sound waves come from the focus spot 2cm below the water surface. For the case of figure 4 and 5, the
detected sound waves come from two different points. One focus spot is located at 2cm below the water surface, and
another is 3.3cm below the water surface. It is interesting to note that the sound waves generated from two focusing
spots a and b in figures 4 and 5. The sound waves are reflected by water surface as af and b' in figures 3-5.
3. ANALYSIS OF RESULTS
The phenomenon can be interpreted by nonlinear effect of high power laser beam in water. The induced lens is
produced by changes of index of refraction of water. When the intensity of laser beam is low, the beam is focused at the
focus spot of optical lens. While the intensity of laser beam is high, the index of refraction of water will be changed by
nonlinear effect of high power beam in water. This nonlinear effect produces induced lens in water. Therefore when the
intensity of laser beam is high enough to excite the effect of induced lens, the laser beam would not be focused at the
focus spot of optical lens, but at the focus spot of induced lens. If the time-width of laser pulse is far longer than the
response time, in which the change of index of refraction A n of water is taken place, the laser beam would be focused
at focus spot by induced lens. If these two times are comparable, but the time of the laser pulse is somewhat longer than
the response time, then the head of the laser pulse would be focused at the focus spot of optical lens, because A n could
not be established. The tail of laser pulse would be focused at the focus spot of induced lens, because the A n has been
taken place. If the change of index of refraction of water A n is negative, the focus spot of induced lens is behind the
focus spot of optical lens. If the A n is positive, the focus spot of induced lens is before that of optical lens. It means
Proc. SPIE Vol. 4631 281

that the self-induced focus would be caused. The change of index of refraction of water A n is negative, therefore,
when the intensity of ultrashort pulse from laser is high, the head of the laser pulse would be focused at the focus spot
of optical lens, then the tail of laser pulse would be focused at the focus spot of induced lens. It means that the bifocus
effect occurs.
The bifocus effect may be used to estimate the time response for the change of index of refraction of water A n.
The acoustical energy induced by the head of laser pulse focused at the focus spot of optical lens is proportional to the
laser beam energy in the head part of laser pulse; while the acoustical energy induced by the tail part of the laser pulse
focused at the focus spot of induced lens is proportional to the beam energy in the tail part of the laser pulse. The ratio
of the acoustical energy which comes from the focus spot of optical lens and from the focus of induced lens respectively
corresponds to the ratio of the beam energy in the head of laser pulse and in the tail of laser pulse, if the laser pulse is
approximately rectangular pulse. So this ratio is equivalent to the ratio of duration occupied by the head and by the tail.
Therefore, the time response for the change of index of refraction A n can be estimated roughly using this ratio. The
ratio is 0.15 / 0.85 given by our experiments. It implies that the first 15% of laser pulse is focused at the focus spot of
optical lens, when the index of refraction of water has not been changed by the laser beam. So the response time for the
change of index of refraction of water An equals to 40psx 0.15 = 6ps. It is interesting to point out that the acoustical
method to estimate the response time of A n is simple.
4. Conclusions
The mechanism of the generation of sound in water by ultra-short laser pulse is mainly the optical breakdown. As
the optical breakdown is caused in water by high power intensity ultrashort laser pulse, the bifocus effect is produced.
For train pulse of laser beam, if the intensity is insufficient to excite the induced lens, the optical breakdown occurs at
the focus spot of optical lens. For single pulse or train pulse of laser beam, if the intensity is sufficient to excite the
induced lens, the optical breakdown mainly occurs at the focus spot of induced lens. This bifocus effect shows the time
process in the change of index of refraction A n in water. So the bifocus effect can be used to estimate the time
response of A n.
REFERENCES
1. A. G. Bell, Phil. Mag. Ser. 5, pp. 32-34, 1881.
2. P. J. Westervelt, R. S. Larson, J. Acoust. Soc. Am. 54, pp. 121-123, 1973.
3. Huijuan He, Acta Optica Sinica, 12, pp. 1092-1096, 1986.
*[email protected]; Phone 0086-21 -59911863; fax 0086-21-59528812; Shanghai Institute of Optics and Fine
Mechanics, Shanghai 201800, China.
282 Proc. SPIE Vol. 4631
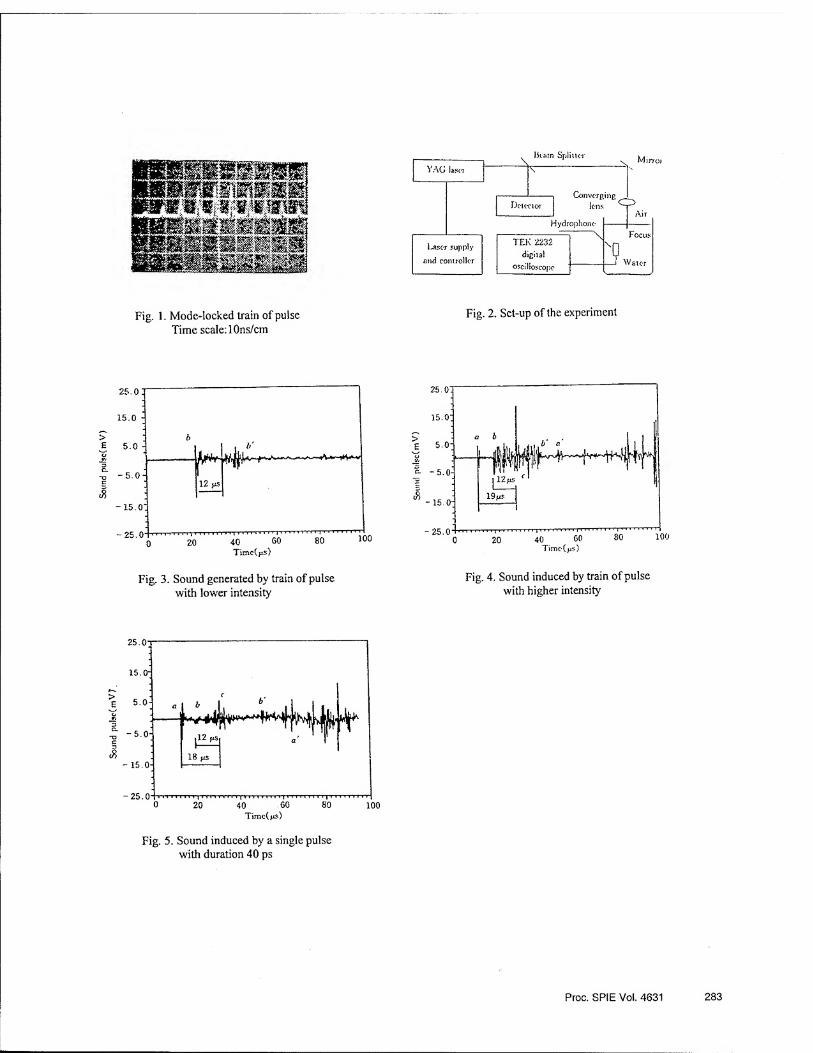
Sou
nd p
uls
c(m
V)
Fig. 1. Mode-locked train of pulse Time scale: lOns/cm
Fig. 2. Set-up of the experiment
: b
: |^2>1 o:
O^rrTTrrrrrpTrnri r-r. , i . ■ » . . . n > | ■ ■ ■ ■ ir n-r
0. 20.40. SO.80.'TOO Timers)
Fig. 3. Sound generated by train of pulse with lower intensity
Fig. 4. Sound induced by train of pulse with higher intensity
Fig. 5. Sound induced by a single pulse with duration 40 ps
Proc. SPIE Vol. 4631 283

Plasma-Chemical Oxygen-Iodine Laser: Problems of Development A.A.Ionin, A.P.Napartovich*, N.N.Yuryshev
P.N.Lebedev Physics Institute of Russian Academy of Sciences,
Leninsky pr. 53, 119991 Moscow, Russia; phone/fax: 7(095)132 0425,
e-mail: [email protected]; [email protected]
* TRINITI, Troitsk, Moscow Region, phone:7(095)334 0450, e-mail: [email protected]
ABSTRACT Great success has been obtained in the R&D of a chemical oxygen-iodine laser (COIL) operating on the electronic
transition of the iodine atom, which gets an excitation from the energy donor -singlet delta oxygen (SDO). The latter is
normally produced in a chemical SDO generator using very toxic and dangerous chemicals, which puts a limit for
civilian applications of COIL that is still a very unique apparatus. Totally new non-chemical SDO generator is needed
to allow oxygen-iodine laser to achieve its frill potential as a non-hazardous efficient source of high-power laser
radiation. There was interest in producing SDO in electric discharge plasma since the 50’s long before COIL appearing.
The idea of using SDO as a donor for iodine laser was formulated in the 70’s. However, the injection of iodine
molecules into a low- pressure self-sustained discharge did not result in iodine lasing. One of the main factors that could
prevent from lasing in many experiments is a rather high threshold yield -15% at 300K, which is needed for obtaining
an inversion population. An analysis of different attempts of producing SDO in different kinds of electric discharge
plasma has been done which demonstrates that high yield at gas pressure of practical interest (p > 10 Torr) for modem
COIL technology can be obtained only in non-self sustained electric discharge plasma. The reason is that the value of
relatively low reduced electrical field strength E/N ~10'16 V.cm2, which is an order of magnitude less than that for the
self-sustained discharge, is extremely important for the efficient SDO production. Although different kinds of non-self
sustained discharges can be used for SDO production, we got started experiments with e-beam sustained discharge in
gas mixtures containing oxygen. High specific input energy up to -3 - 5 kJ/1. atm [ 02] has been experimentally
obtained. Theoretical calculations have been done for different experimental conditions indicating a feasibility of
reasonable SDO yield. Experimental and theoretical research of self-sustained electric discharge in SDO produced in a
chemical generator, which is very important for getting plasma-chemical kinetic data needed for an estimation of SDO
yield, is also discussed.
Keywords'. COIL, iodine laser, singlet delta oxygen, electric discharge plasma
1. INTRODUCTION Great success has been obtained in the research and development (R&D) of a chemical oxygen-iodine laser (COIL) [1]
over the last 20 years, the best progress being obtained in the development of COIL for military applications such as the
high-power airborne laser [2]. The potential of civilian applications of a COIL was claimed [3] to be very high because
of its high-power output and the opportunity of using low loss optical fibers for delivery of the laser radiation at the
lasing wavelength A, = 1.315 (dm. Despite successful experiments on applications of COIL for construction materials
cutting [4; 5], rock drilling [6], etc., COIL is still a very unique apparatus. The active medium of COIL is atomic iodine
emitting photons when changing its electronic state: I*(2Pi/2) —»I(2Pv2) + hv. Atomic iodine in the excited state
I*(2P1/2) is produced by energy transfer from the singlet delta oxygen (SDO) 02(1 A) molecule: 02(1 A) +1(2 P3/2)
02(3£) +1(2 Pi/2) (1). SDO is obtained in COIL in a chemical generator through the following chemical reaction
running in liquid phase: Cl2 + 2 KOH + H202 —> 02(1 A) + 2 KC1 + 2 H20 (2). Very toxic and dangerous chemicals are
used in the reaction, which put a limit for civilian applications of COIL. Thus, a totally new non-chemical SDO
generator is needed to allow oxygen-iodine laser to achieve its full potential as a non-hazardous efficient source of high-
power laser radiation. Quite a different method of SDO production can be used, namely, generation of SDO in electric
discharge. The advantages of such a method of SDO production are the absence of dangerous chemicals, the feasibility
of a development of a gas phase oxygen-iodine laser and other ones such as atomic iodine production through I2
dissociation by 02(!Z) [7]. The problems of SDO production in electric discharge and development of an oxygen-
iodine laser using SDO produced in electric discharge plasma, i.e. plasma-chemical oxygen-iodine laser (PlasmaCOIL),
are discussed in the paper.
284
Gas and Chemical Lasers and Intense Beam Applications III, Steven J. Davis, Michael C. Heaven, Editors, Proceedings of SPIE Vol. 4631 (2002) © 2002 SPIE ■ 0277-786X/02/$ 15.00
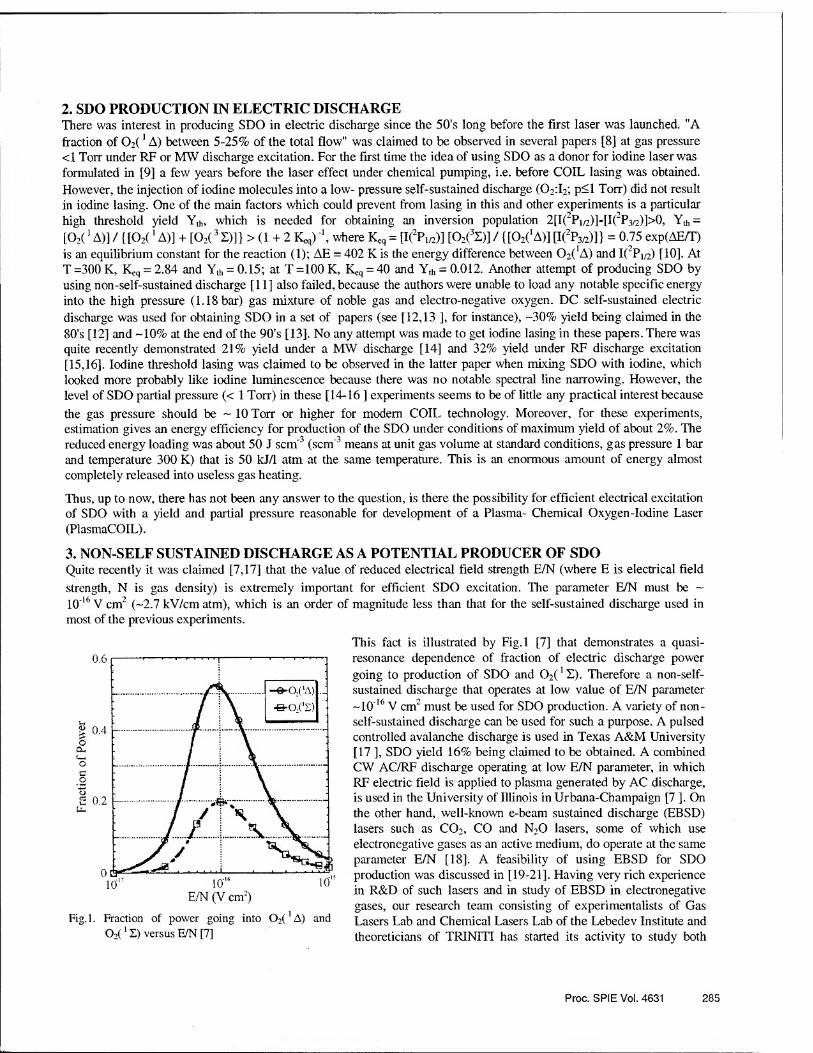
2. SDO PRODUCTION IN ELECTRIC DISCHARGE There was interest in producing SDO in electric discharge since the 50’s long before the first laser was launched. "A
fraction of 02(1 A) between 5-25% of the total flow" was claimed to be observed in several papers [8] at gas pressure <1 Torr under RF or MW discharge excitation. For the first time the idea of using SDO as a donor for iodine laser was formulated in [9] a few years before the laser effect under chemical pumping, i.e. before COIL lasing was obtained.
However, the injection of iodine molecules into a low- pressure self-sustained discharge (02:I2; p^l Torr) did not result in iodine lasing. One of the main factors which could prevent from lasing in this and other experiments is a particular high threshold yield Yth, which is needed for obtaining an inversion population 2[I(2Pi/2)]-[I(2P3/2)]>0, Yth =
[02(1 A)] / {[02(1 A)] + [02(3 E)]} > (1 + 2 Keq) , where Kcq = [I(2P1/2)] [02(3!)] / {[02('A)] [I(2P3/2)]} = 0.75 exp(AEAT) is an equilibrium constant for the reaction (1); AE = 402 K is the energy difference between 02('A) and I(2Pi/2) [10]. At T =300 K, Keq = 2.84 and Y^ = 0.15; at T =100 K, = 40 and Y^ = 0.012. Another attempt of producing SDO by using non-self-sustained discharge [11] also failed, because the authors were unable to load any notable specific energy into the high pressure (1.18 bar) gas mixture of noble gas and electro-negative oxygen. DC self-sustained electric
discharge was used for obtaining SDO in a set of papers (see [12,13 ], for instance), -30% yield being claimed in the 80’s [12] and -10% at the end of the 90's [13]. No any attempt was made to get iodine lasing in these papers. There was quite recently demonstrated 21% yield under a MW discharge [14] and 32% yield under RF discharge excitation [15,16]. Iodine threshold lasing was claimed to be observed in the latter paper when mixing SDO with iodine, which looked more probably like iodine luminescence because there was no notable spectral line narrowing. However, the level of SDO partial pressure (< 1 Torr) in these [14-16 ] experiments seems to be of little any practical interest because
the gas pressure should be - 10 Torr or higher for modem COIL technology. Moreover, for these experiments, estimation gives an energy efficiency for production of the SDO under conditions of maximum yield of about 2%. The reduced energy loading was about 50 J scm'3 (scm-3 means at unit gas volume at standard conditions, gas pressure 1 bar and temperature 300 K) that is 50 kJ/1 atm at the same temperature. This is an enormous amount of energy almost completely released into useless gas heating.
Thus, up to now, there has not been any answer to the question, is there the possibility for efficient electrical excitation of SDO with a yield and partial pressure reasonable for development of a Plasma- Chemical Oxygen-Iodine Laser (PlasmaCOIL).
3. NON-SELF SUSTAINED DISCHARGE AS A POTENTIAL PRODUCER OF SDO Quite recently it was claimed [7,17] that the value of reduced electrical field strength E/N (where E is electrical field
strength, N is gas density) is extremely important for efficient SDO excitation. The parameter E/N must be - 10'16 V cm2 (-2.7 kV/cm atm), which is an order of magnitude less than that for the self-sustained discharge used in most of the previous experiments.
Fig.l. Fraction of power going into 02(1A) and
02(1X) versus E/N [7]
This fact is illustrated by Fig.l [7] that demonstrates a quasi¬ resonance dependence of fraction of electric discharge power
going to production of SDO and 02(1X). Therefore a non-self- sustained discharge that operates at low value of E/N parameter
—10'16 V cm2 must be used for SDO production. A variety of non- self-sustained discharge can be used for such a purpose. A pulsed controlled avalanche discharge is used in Texas A&M University [17 ], SDO yield 16% being claimed to be obtained. A combined CW AC/RF discharge operating at low E/N parameter, in which RF electric field is applied to plasma generated by AC discharge, is used in the University of Illinois in Urbana-Champaign [7 ]. On the other hand, well-known e-beam sustained discharge (EBSD) lasers such as C02, CO and N20 lasers, some of which use electronegative gases as an active medium, do operate at the same parameter E/N [18]. A feasibility of using EBSD for SDO production was discussed in [19-21]. Having very rich experience in R&D of such lasers and in study of EBSD in electronegative gases, our research team consisting of experimentalists of Gas Lasers Lab and Chemical Lasers Lab of the Lebedev Institute and theoreticians of TRINITI has started its activity to study both
Proc. SPIE Vol. 4631 285
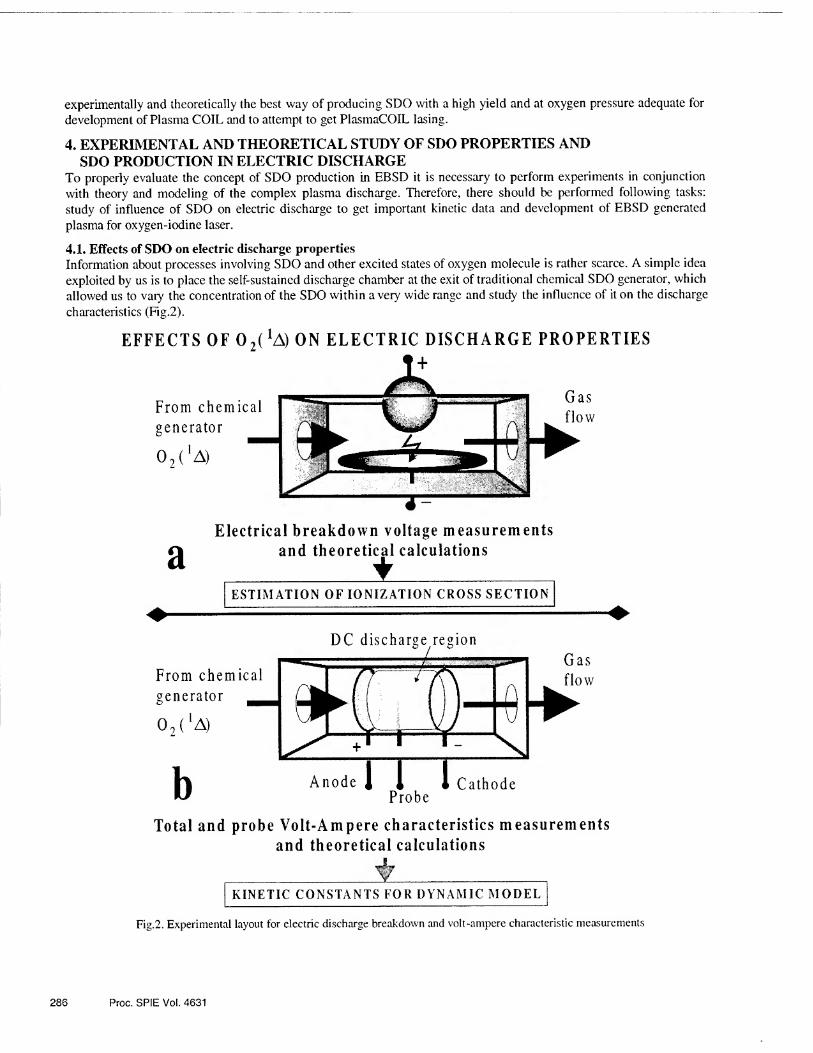
experimentally and theoretically the best way of producing SDO with a high yield and at oxygen pressure adequate for development of Plasma COIL and to attempt to get PlasmaCOIL lasing.
4. EXPERIMENTAL AND THEORETICAL STUDY OF SDO PROPERTIES AND SDO PRODUCTION IN ELECTRIC DISCHARGE
To properly evaluate the concept of SDO production in EBSD it is necessary to perform experiments in conjunction with theory and modeling of the complex plasma discharge. Therefore, there should be performed following tasks: study of influence of SDO on electric discharge to get important kinetic data and development of EBSD generated plasma for oxygen-iodine laser.
4.1. Effects of SDO on electric discharge properties Information about processes involving SDO and other excited states of oxygen molecule is rather scarce. A simple idea exploited by us is to place the self-sustained discharge chamber at the exit of traditional chemical SDO generator, which allowed us to vary the concentration of the SDO within a very wide range and study the influence of it on the discharge
characteristics (Fig.2).
EFFECTS OF O^A) ON ELECTRIC DISCHARGE PROPERTIES
Electrical breakdown voltage measurements
Total and probe Volt-Ampere characteristics measurements and theoretical calculations
__±__ KINETIC CONSTANTS FOR DYNAMIC MODEL
Fig.2. Experimental layout for electric discharge breakdown and volt-ampere characteristic measurements
286 Proc. SPIE Vol. 4631

4.1.1. Electric breakdown in SDO Breakdown characteristics of a low-pressure self-sustained discharge in oxygen with 50% of SDO content were measured and compared with the breakdown characteristics of pure oxygen. The breakdown voltage as a function of the composition, temperature, and pressure of the gas mixture was measured in the discharge chamber connected to the gas duct downstream of SDO chemical generator. The electric field was directed perpendicularly to the gas flow (Fig.2a). The experimental results obtained were compared with the
0.01 0.02 0.03 0.04 0.05 0.06 Fig.3. Inverse E/N versus Nd (N - density, d - electrode spacing)
for electric discharge breakdown in oxygen and SDO (experiment and theory)
decreases when oxygen is excited on the singlet delta level. Good agreement between the experimental and theoretical data justifies the procedure of calculating
<T;®n°. A decrease in the breakdown voltage in the
presence of 02(*A) is due to the increase in the ionization rate because of a lower ionization potential for the 02(*A) compared to 02(3X).
4.1.2. Volt-ampere characteristics of electric discharge in SDO The first results of experimental research of glow discharge in gas mixtures with high SDO content were obtained. Electric discharge chamber was incorporated into a gas duct going out of SDO chemical generator (Fig. 2b). An electric field being longitudinal relative to gas flow was produced with electrode system consisted of upstream anode and downstream cathode. The cathode was cooled by water. Electric potentials of plasma column in different points were measured with a metal needle probe. Experiments were carried out with pure oxygen going directly to the discharge chamber from a cylinder and gas mixture of oxygen containing 50% SDO going from SDO chemical generator through a water vapor trap to the discharge chamber. Probe and total volt-ampere characteristics of the electric discharge for pure oxygen
and gas mixture 02: SDO=l:l at gas pressure of ~1 Ton-
results of numerical modeling for adequate description of glow discharge in oxygen A comparison of breakdown
electric field strengths for 02 (3X) and gas mixture 02(3Z):02(1A) =1:1 was done (Fig.3). The ionization cross-section appears to be of the most importance for calculations of electric breakdown parameters. The direct data on the ionization cross-section for SDO are absent.
However, the position of the molecular terms for 02(1A) and 02(3Z) allows us to say that a simple downward shift along the energy axis gives satisfactory ionization cross- section for SDO.
<y^°(E) = atsmund(E-AE)
AE = ESDO-EO2gromd=0.9$eV
As one can see from Fig.3 threshold breakdown voltage
Fig.4. Volt-ampere probe and total characteristics of electric discharge in oxygen and SDO
Proc. SPIE Vol. 4631 287

are presented in Fig.4. As one can see in the figure, there is a big difference between the characteristics for pure oxygen and SDO, which indicates the fact that the two substances have different electrical features. It should be noted that the experimental results were obtained for relatively short electric discharge chamber, which did not permit to have a positive column of the electric discharge plasma. Although we did observe the big difference between the volt-ampere characteristics for pure oxygen and SDO, experiments should be done for longer discharge tube with a positive column, which makes it easy to calculate electric discharge characteristics. A simplified mathematical model for a description of a transitional space in electric discharge in oxygen was formulated. Diffusion coefficients, electron mobility and constants of ionization, attachment and detachment were calculated as a function of reduced electric field E/N. A comparison of the theoretical data with the experimental results is supposed to give new information about kinetic processes in electric discharge with SDO.
4.2. Electron beam sustained discharge in oxygen containing mixtures
ELECTRICALLY GENERATED PLASMA FOR PLASMACOIL
C-Be®? E-beam sustained
iiiiS) discharge in gas mixtures
containing 02 molecules
.Cooling down to -100 Kis possibl e
MgF2 Laser
Intracavity spectroscopy
PlasmaCOIL feasibility
study
Mirror
Iodic Flash lamp substance G; injection flo
Fig.5. Schematic diagrams of EBSD application for SDO production and plasma-chemical oxygen-iodine lasing
One of the principal advantages of the EBSD approach (Fig.5a) is that it is possible to control E/N parameter within the E/N range most optimal for effective SDO production. However, there is an important question if it is possible at all to load much energy into electronegative oxygen in EBSD. Previously EBSD characteristics were studied both for electric discharge in pure oxygen [22] and its mixture with noble gases [11]. Taking into account a cathode voltage drop specific input energy into oxygen can be indirectly estimated as -90 J/l atm [02] in [22] (active volume V=60 cm3)
and -150 J/l atm [02] in [11] (V=150 cm3; Ne:02=96:4; P= 1.18 bar). It should be pointed out that minimal specific energy formally needed for transformation of all oxygen (with efficiency of 100%) from its ground state 02(3Z) into SDO state with energy of 0.98 eV is 94 kJ/mole [02] « 4.2 kJ/1 atm [02]. If one even assumes the efficiency of SDO production to be 100%, only 2-3% of oxygen is transformed into SDO in [11,22], which is an order of magnitude less than it is needed for oxygen-iodine laser. Quite recently we demonstrated experimentally [20,21] that far more specific
energy up to -3-5 kJ/1 atm [02] can be loaded into EBSD with active volume of -15 1 (Fig.6). A fraction of total power going to SDO production taken from Fig. 1 is also presented in Fig.6, which allows
288 Proc. SPIE Vol. 4631
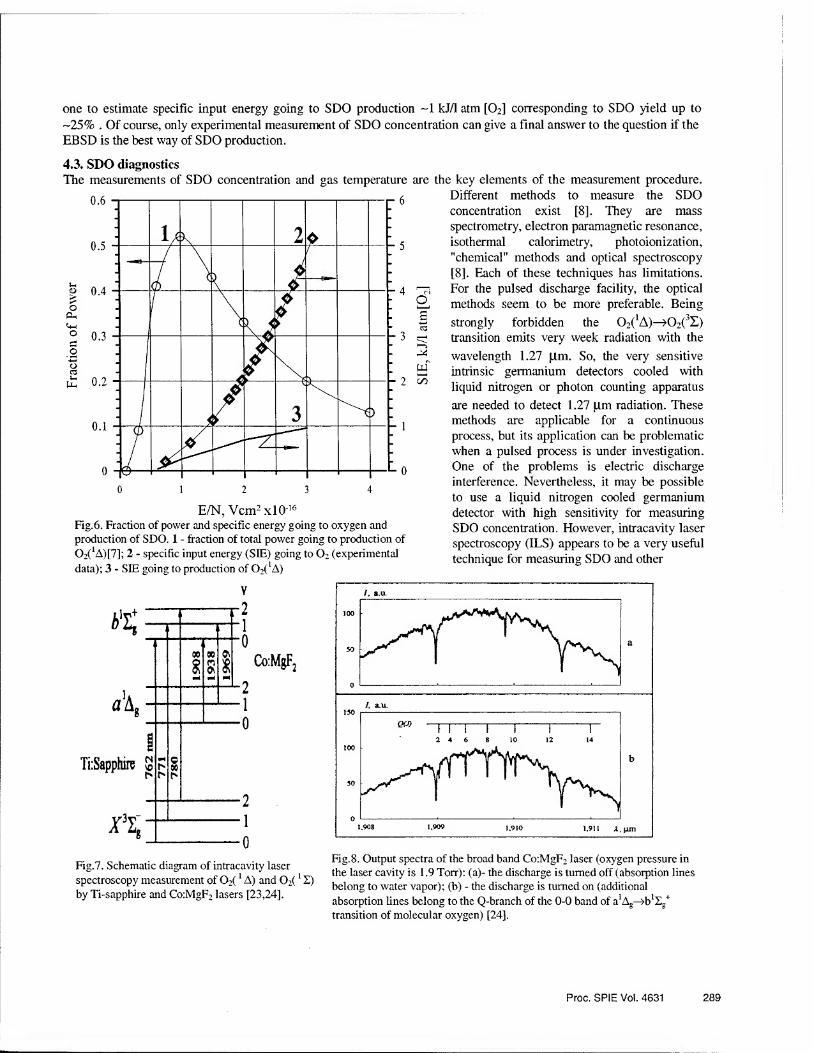
Fra
ctio
n o
f P
ow
er
one to estimate specific input energy going to SDO production ~1 kJ/1 atm [02] corresponding to SDO yield up to -25% . Of course, only experimental measurement of SDO concentration can give a final answer to the question if the EBSD is the best way of SDO production.
4.3. SDO diagnostics The measurements of SDO concentration and gas temperature
E/N, Vcm2 xlO'16 Fig.6. Fraction of power and specific energy going to oxygen and production of SDO. 1 - fraction of total power going to production of 02(1A)[7]; 2 - specific input energy (SIE) going to O2 (experimental
data); 3 - SIE going to production of 02(1A)
are the key elements of the measurement procedure. Different methods to measure the SDO concentration exist [8]. They are mass spectrometry, electron paramagnetic resonance, isothermal calorimetry, photoionization, "chemical" methods and optical spectroscopy [8]. Each of these techniques has limitations.
" For the pulsed discharge facility, the optical methods seem to be more preferable. Being
|j strongly forbidden the 02(1A)—>02(3£) transition emits very week radiation with the
wavelength 1.27 ]dm. So, the very sensitive intrinsic germanium detectors cooled with liquid nitrogen or photon counting apparatus
are needed to detect 1.27 |Llm radiation. These methods are applicable for a continuous process, but its application can be problematic when a pulsed process is under investigation. One of the problems is electric discharge interference. Nevertheless, it may be possible to use a liquid nitrogen cooled germanium detector with high sensitivity for measuring SDO concentration. However, intracavity laser spectroscopy (ILS) appears to be a very useful technique for measuring SDO and other
Fig.7. Schematic diagram of intracavity laser spectroscopy measurement of 02(1 A) and 02(1 £) by Ti-sapphire and Co:MgF2 lasers [23,24].
Fig.8. Output spectra of the broad band Co:MgF2 laser (oxygen pressure in the laser cavity is 1.9 Torr): (a)- the discharge is turned off (absorption lines belong to water vapor); (b) - the discharge is turned on (additional absorption lines belong to the Q-branch of the 0-0 band of a1 Ag^b1^ transition of molecular oxygen) [24].
Proc. SPIE Vol. 4631 289

species concentrations. The apparatus developed at the Lebedev Institute allows one to measure the concentration of the
key components 02(3X), 02(]X), and 02(1A) [23,24] (Fig.5b). It was shown that ground state oxygen can be measured
using a Ti: sapphire laser-based intracavity spectrometer operable near the 760 nm 02(3Z)^02(1Z) absorption lines
[23]. A sensitivity of ~(2-5) 1014 cm'3 was obtained when a Co:MgF2 laser (1.6-2.5 |Llm tuning range) was used in the
ILS method for direct measurement of 02(!A) produced in MW discharge [24]. The concentration of 02(1A, v=0,l,2)
can be determined via absorption measurements at 1.91 )Llm (0,0), 1.94 |Llm (1,1) and 1.97 )Llm (2,2 bands of 02(1A)—>
02(1Z) system) (Fig.7). Many rotational lines are recorded simultaneously in the ILS method due to the broad-band laser spectrum (Fig.8). Consequently, the gas temperature can be measured using the dependence of the absorption coefficients of molecular lines on the rotational quantum number.
Another approach is to inject iodine atoms to SDO and then detect the iodine luminescence at the wavelength 1.315 pm.
As soon as iodine is in equilibrium with singlet oxygen due to the fast energy exchange process 02 (*A) + I (2P3/2)
I (2Pi/2) + 02 (3X) the intensity of iodine luminescence can serve as a criteria of SDO yield (titration techniques). A calibration of this method can be made using a traditional chemical SDO generator with a known value of yield. The
Einstein coefficient for iodine transition I (2?m) -»I (2P3/:) is more than four orders of magnitude larger than that of the
02 (*A) —> 02 (3X) transition. Thus, even at lower iodine concentrations of about 1% of that of oxygen the luminescence intensity can be three orders of magnitude higher. To avoid the problems of dissociating iodine molecules we suggest to mix oxygen extracted from the discharge region with iodide CF3I, CH3I and then decompose iodide molecules by photolysis. Photolysis is preferable to a discharge because of its high selective interaction with the active medium. As a final step of the experiments, atomic iodine can be mixed with the SDO produced in a pulsed EBSD plasma and small- signal gain and/or lasing if any can be measured (Fig5c).
4.4. Theoretical calculations of EBSD generated plasma Electron energy balance as a function of the reduced electric field strength E/N is illustrated in Fig.9. It was calculated from solving the steady-state electron Boltzmann equation with the set of cross sections. Calculations were made for
pure oxygen, all molecules in ground state. One can see that the energy fraction going into direct excitation of 02(! Ag) is fairly high approaching maximum 0.43 at E/N = 0.87 10*16 V cm2.
Fig.9. Electron energy fraction going to some processes for pure 02
For the plasma with external source of ionization (e-beam, ionizing high-voltage pulses, etc.) the value of E/N can be controlled independently of electric current. Then, assuming that optimum conditions for production of the SDO are realized in a discharge plasma, we can take as an upper limit for SDO production efficiency, for a final concentration of 30%, the value
t| =0.21, which is roughly an average
of initial and final (set equal to zero) efficiencies of direct excitation of
02(*Ag). The minimum energy loading for such an efficiency and SDO yield of
30% is easily evaluated: e,nin=6.5 J/scm3. Assuming that the fraction of energy (1 -
T|sdo) is released into gas heating, the increment of gas temperature can be estimated as 5500 K.
The above estimations allow us to immediately draw two conclusions: it is necessary to cool the gas flow; it is necessary to take special measures for discharge stabilization. Let us note that these evaluations may over-estimate gas heating (we neglect the energy contained in atoms and other excited states). From the other side, the total efficiency of SDO production may be higher
290 Proc. SPIE Vol. 4631

Fig. 10. The maximum energy fraction going to excitation of SDO versus oxygen concentration for binary mixtures with Ar (1) and He (2)
than it was assumed (cascade excitation processes were neglected in making the estimations). Therefore, more detailed simulations may give more optimistic predictions.
Using mixtures of oxygen with some gases results in a variation of the electron energy balance. Generally, one may expect a decrease of the electron energy fraction going into direct
excitation of C^Ag) when molecular or atomic additives appear. Let us note an interesting effect observed in gas mixture O2:Ar. The results of Boltzmann
calculations of t|^ for this
mixture in dependence on oxygen content are shown in Fig. 10. It is seen that an optimum mixture composition exists ([O2]~0.1 AT, where N is the total gas density and the brackets
denote the oxygen molecule number density) for which T|£zx) =0-497. For comparison, in Fig. 10 a similar dependence
of the maximum energy fraction going to excitation of 02(1Ag) on oxygen percentage in the binary mixture 02:He is
shown. For this mixture, r| ^ is a monotonously growing function of oxygen content. Use of the gas mixture 02: Ar
may be advantageous due to some increase in discharge efficiency and lowering of the gas temperature for the same energy load into singlet oxygen.
5. CONCLUSIONS Breakdown and volt-ampere characteristics of self-sustained electric discharge in SDO studied both experimentally and theoretically indicate the fact that SDO and pure oxygen have different electric features. A comparison of the experimental and theoretical results justifies the procedure of calculating SDO ionization cross-section, the latter being that of ground state oxygen shifted 0.98 eV toward the lower energies. A difference between volt-ampere characteristics can give the opportunity of obtaining kinetic constants for SDO.
An analysis of different attempts of producing SDO in different kinds of electric discharge plasma has been done which demonstrates that high yield at gas pressure of practical interest (p > 10 Torr) for modem COIL technology can be obtained only in non-self sustained electric discharge plasma. The reason is that the value of relatively low reduced electrical field strength E/N ~10"16 V.cm2, which is an order of magnitude less than that for the self-sustained discharge, is extremely important for the efficient SDO production.
High specific energy up to 3- 5 kJ /I atm[02] has been demonstrated to be loaded into a pulse non-self-sustained (e- beam sustained) discharge in oxygen containing mixtures, which together with theoretical calculations brings a hope of obtaining SDO yield in EBSD up to 20-30% with a high efficiency.
In case of positive results on mixing iodine with products of e-beam sustained discharge containing SDO, i.e. iodine lasing, well developed technology of EBSD C02 and CO lasers can be used in future for designing SDO generators for PlasmaCOIL. The latter laser technology being cryogenic can diminish demand in high SDO yield.
Proc. SPIE Vol. 4631 291

ACKNOWLEDGMENTS The authors are very grateful to G.Hager, W.Solomon,.D.Carroll and.A.Hill for helpful discussions and to.A.Kotkov, I.Kochetov, N.Vagin,.D.Sinitsyn,.L.Seleznev, A.Deryugin and.Yu.Klimachev for their experimental and theoretical efforts on study of EBSD in oxygen containing mixtures and electric discharge in SDO.
The research has been supported by the Russian Foundation of Basic Research (grant 02-02-17452), the Russian Federal Program "Integration" ( Project AO 155), EOARD and AFRL.
REFERENCES 1. McDermott, W.E., Pchelkin, N.R. et al. (1978). Appl Phys. Lett., 32,469 2. Lambertson, S. (2001) Proc. SPIE ,4184 ,1 3. Hallada, M., Seiffert, S., Walter, R., Vetrovec, J. (2000). Laser Focus World, 5, 205 4. Kar, A., Scott, J.E., Latham, W.P. (1996). J. Laser Applications, 8, 125-133 5. Carroll, D. and Rothenflue, J. (1997). J. of Laser Applications, 9, 3, 119. 6. Graves, R., et al. (2000). Int. Conf. LASERS *2000, Albuquerque, NM, USA, Technical Digest, p.13 7. King, D., Carroll, D., Laystrom, J., Verdeyen, J., Sexauer, M. and Solomon, W. (2001). Proc. Int. Conf. LASERS ’2000, Ed. by V. Corcoran and T. Corcoran ,STS Press, McLean ,VA, p.265 8. Wayne,R.P., (1969) "Singlet Molecular Oxygen" in "Advances in Photochemistry", 7, p.311 9. Zalessky V., (1974) J. Experimental and theoretical physics, 67, 30 (in Russian) 10. Yuryshev, N.N. (1996). Quantum Electronics, 26 (7), 567 11. Foumier, G., Bonnet, J., Pigashe, D. (1980). Journal de Physique, Colloque C9, 41,449 12. Vasil'eva A., Grishina,I., Klopovsky K., Rakhimov A. et al, (1989) Physics of plasma,15, 190 (in Russian) 13. Ivanov, V, Klopovsky, K., Rakhimov ,A. et al, (1999) IEEE Transactions on plasma science, 27, 1279 14. Itami, S., Nakamura, Y., Shinagawa, K., Okamura, M., Fujii, H. et al (1999). Proc. SPIE, 3889, 503. 15. Fujii, H., Itami, S., Schmiedberger, J., et al (2000)., Proc. SPIE, 4065, 818. 16.Schmiedberger, J., Hirahara, S , Fujii, H. et al (2000). Proc. SPIE ,4184, 32 17. Hill, A.,(2001), Proc.Int.Conf. LASERS ’2000, Ed. by V.Corcoran and T.Corcoran ,STS Press, McLean ,VA, p.249 18. Basov, N., Ionin, A., Suchkov, A. (1990). Proc. SPIE, 1225, 389 19. Napartovich, A. ,Deryugin, A., Kochetov,I.,(2001) J.Phys.D:Appl.Phys, 34, 1827 20.1onin, A. ,(2001) Int. COIL R&D Workshop, Prague, Czech. Rep., 28-29 May 2001, CD-ROM 21.Ionin A., Napartovich, A, Yuryshev, N.(2001), Int. Workshop on High Energy Lasers Including Novel Pumping Schemes driven by Chemical Reactions or Explosives, French-German Res. Inst Saint-Louis, France, Nov 13-14, 2001 22. Londer, Ya., Menakhin, L., UTyanov,K.,(1981), Thermophysics of high temperatures, 4, 720 (in Russian) 23. Podmar’kov, Yu., Frolov M., (1996), Quantum Electronics,26,595 24. Pazyuk, V.S., Podmar'kov, Yu.P., Raspopov, N.A., Frolov, M.P. (2001)., Quantum Electronics,31,363
292 Proc. SPIE Vol. 4631

Addendum
The following papers were announced for publication in these proceedings but have been withdrawn or are unavailable.
[4631-13] Comparing the efficiency of supersonic oxygen-iodine laser with different mixing designs B. A. Vyskubenko, A. A. Adamenkov, V. V. Bakshin, V. I. Efremov, S. P. Ilyin, Y. V. Kolobyanin, I. M. Krukovsky, E. A. Kudryashov, V. B. Moiseyev, Russian Federal Nuclear Ctr.
[4631-18] Modeling of DF chemical laser flowfields with HYLTE nozzle array S. Yuan, Z. Jiang, W. Hua, Y. Zhao, National Univ. of Defense Technology (China)
[4631-26] Application of vortex-flow dc glow discharge for atomic iodine production P. A. Mikheyev, A. A. Shepelenko, P.N. Lebedev Physical Institute (Russia)
[4631-34] Discharge in Ini vapor as a lasant for indium 451.1-nm laser Y. 0. Shpenik, V. A. Kelman, Y. V. Zhmenyak, Institute of Electron Physics (Ukraine)
[4631-35] TEA-N2 and TEA-Xe lasers with increased average radiation power B. A. Kozlov, R. I. Ashurkov, A. V. Belikov, 0. N. Gulaeva, V. K. Darymov, S. V. Gidkov, A. V. Folomkin, D. V. Kizlitsin, Radio-Engineering Academy (Russia)
[4631-36] Programmable power supply for multikilowatt C02 laser R. Thekkeppat, Ctr. for Advanced Technology (India); P. Choudhary, Science Research Lab., Inc. (USA); M. 0. Ittoop, A. K. Nath, Ctr. for Advanced Technology (India)
[4631-37] Resource characteristics of small-sized sealed-off TEA-C02 lasers with pulse repetition rate of 25 Hz B. A. Kozlov, P. A. Anisiforov, 0. Y. Boiko, N. I. Egoshkin, A. S. Fomin, 0. N. Shamshina, P. V. Trubitsin, Radio-Engineering Academy (Russia)
[4631-39] Experimental study and optimization of the iodine gas and singlet oxygen mixing in a supersonic oxygen-iodine laser Y. V. Kolobyanin, A. A. Adamenkov, V. V. Bakshin, V. V. Buzoverya, L. A. Vdovkin, B. A. Vyskubenko, Y. N. Deryugin, V. I. Efremov, S. P. Ilyin, V. V. Kalinovsky, V. V. Konovalov, E. A. Kudryashov, I. M. Krukovsky, V. B. Moiseyev, Russian Federal Nuclear Ctr.
[4631-40] Numerical simulation of supersonic oxygen-iodine laser B. A. Vyskubenko, Y. N. Deryugin, D. A. Zelensky, S. P. Ilyin, Y. V. Kolobyanin, E. A. Kudryashov, Russian Federal Nuclear Ctr.
293

[4631-42] Visible and near-IR luminescence of microwave discharge products in oxygen and nitrogen mix Y. V. Savin, L. V. Goryachev, A. A. Adamenkov, V. V. Bakshin, V. V. Buzoverya,
B. A. Vyskubenko, V. V. Egorov, S. P. Ilyin, Y. V. Kolobyanin, E. A. Kudryashov,
Russian Federal Nuclear Ctr.
[4631-44] Novel wavelength tunable mode-locked fiber ring laser using a FP LD as a modulator and a comb filter C. Zhao, N. Ma, S. Yuan, W. Gao, Z. Li, S. Yang, X. Dong, Nankai Univ. (China)
[4631-45] Development of time-of-flight x-ray photoelectron spectrometer T. Harada, T. Iwamoto, Y. Morihisa, Y. Nagumo, S. Fujita, S. Hayashi,
Shimadzu Corp. (Japan)
[4631-47] Physics of overtone C02 laser operating on highly excited vibrational transitions A. A. lonin, P.N. Lebedev Physical Institute (Russia); A. P. Napartovich, Troitsk
Institute for Innovation and Fusion Research (Russia)
[4631-48] Energy transfer and reaction kinetics of the NCE(a)-driven iodine laser M. C. Heaven, Emory U'niv. (USA)
294

Author Index
Adamenkov, Anatoliy A., Addendum
Ahmad, Imtiaz, 264 Alekseev, Sergey B., 234 Anisiforov, Pavel A., Addendum
Arenberg, Jonathan W., 209 Ashurkov, Roman I., Addendum Bakshin, Victor V., Addendum Barmashenko, Boris D., 23, 74
Belikov, Andrei V., Addendum
Benard, David J., xi Black, Ian, 254
Bohn, Willy L., 53 Boiko, Olga Y., Addendum
Bousek, Ronald R., xi Bruins, Esther, 23, 74 Buzoverya, V. V., Addendum Carrig, Timothy J., 209
Carroll, David L., 154 Censky, Miroslav, 34, 43 Chen, Fang, 161 Choudhary, Praveen, Addendum Cox, Joseph L., 244 Crowell, Peter G., 167 Darymov, Vladislav K., Addendum Davis, Steven J., 60, 178, 217 Deryugin, Yuri N., Addendum Dolezal, Michael W., 244 Dong, Xiaoyi, Addendum Duo, Liping, 161, 184 Efremov, Valentin I., Addendum Egorov, Vladimir V., Addendum Egoshkin, Nikolay L, Addendum Endo, Masamori, 116 Fang, Benjie, 161 Fedenev, Andrey V., 234 Feng, Saosong, 280 Flohrer, Frank, 264 Folomkin, Alexander V., Addendum Fomin, Alexander S., Addendum Franklin, Robert E., 244 Fujioka, Tomoo, 116 Fujita, Shin, Addendum Furman, Dov, 23, 74 Gabel, Kai, 264 Gao, Weiqing, Addendum
Gelb, Alan H., 178 Gidkov, Sergey V., Addendum Goncharenko, Igor M., 234 Goncharov, Vasily, 13 Goryachev, L. V., Addendum Gotze, S., 264
Gross, Markus S., 254 Gulaeva, Olga N., Addendum
Hager, Gordon D., 167, 192 Han, Jiande, 225
Harada, Takahiro, Addendum Hayakawa, Akiyoshi, 128 Hayashi, Shigeki, Addendum
He, Huijuan, 280 Heaven, Michael C., Addendum, 13, 225
Hua, Weihong, Addendum Hurlock, Stephen, 101 Ilyin, Sergei P., Addendum lonin, Andrei A., Addendum, 284 Ittoop, Melappuram 0., Addendum
Iwamoto, Takashi, Addendum Jakubec, Ivo, 34 Jiang, Zhongfu, Addendum
Jirasek, Vit, 34, 43 Kalinovsky, V. V., Addendum
Katz, Arje, 23 Keene, Jennifer A., 209 Kelman, Vladimir A., Addendum
King, Darren M., 154 Kizlitsin, Dmitry V., Addendum Kleinschmidt, Jurgen, 264 Klopfel, Diethard, 264 Kodymova, Jarmila, 34, 43, 86 Kohler, Peter, 264 Kolobyanin, Yuriy V., Addendum Komissarov, Anatoly V., 13 Konoshenko, Aleksei F., 271 Konovalov, V. V., Addendum Korobotchko, Vladimir, 264 Koval, Nikolai N., 234 Kozlov, Boris A., Addendum Krukovsky, Ivan M., Addendum Kudryashov, Evgeniy A., Addendum
Li, Jian, 184 Li, Zhaohui, Addendum Ma, Ning, Addendum Manke, Gerald C., II, 167, 192, 225 McDermott, William E., xi,l Mikheyev, Pavel A., Addendum Min, Xiangde, 184 Moiseyev, V. B., Addendum Morihisa, Yuji, Addendum Mulhall, Phillip A., 217 Muller, Wolfgang H., 254 Nagumo, Yuzo, Addendum Nakabayashi, Tokuhiro, 128 Nanri, Kenzo, 116 Napartovich, Anatoly P., Addendum, 284 Nath, Ashish K., Addendum Oakes, David B., 178,217 Oien, AnnMarie L., 209 Orlovskii, Victor M., 234 Oskomov, Konstantin V., 234 Paziuk, Vladimir S., 271 Pchelkin, Nicholas R., xi

Perram, Glen P., 145, 244
Phillips, Grady T., 145
Rawlins, W. Terry, 217
Read, Michael J.f 178
Ringling, Jens, 264
Roh, Won B., 145
Rosenwaks, Salman, 23, 74 Rybalkin, Victor, 23, 74
Sang, Fengting, 161, 184 Savin, Yuri V., Addendum
Schriever, Guido, 264
Shamshina, Olga N., Addendum
Shepelenko, Alexander A., Addendum
Shpenik, Yuriy 0., Addendum
Shulepov, Mikhail A., 234
Sochugov, Nikolay S., 234
Solomon, Wayne C., 154
Spalek, Otomar, 34, 43, 86
Stamm, Uwe, 264
Suzuki, Sachio, 128
Takada, Tomohito, 137
Takeda, Shuzaburo, 116 Tang, Shukai, 184 Tarasenko, Victor F., 234 Thekkeppat, Reghu, Addendum Trubitsin, Pavel V., Addendum Truman, C. Randall, 167 Uchiyama, Taro, 116 Urbina, Chris J., 209 Vagin, Nikolai P., 271 Vdovkin, L. A., Addendum Verdeyen, Joseph T., 154 Vyskubenko, Boris A., Addendum Wagner, Gregory J., 209 Wani, Fumio, 128, 137 Wisniewski, Charles F., 167 Yang, Bailing, 184 Yang, Shiquan, Addendum Yasuda, Kozo, 128, 137
Yuan, Shengfu, Addendum Yuan, Shuzhong, Addendum Yuryshev, Nikolai N., 271, 284 Zelensky, D. A., Addendum Zhang, Yuelong, 161 Zhao, Chunliu, Addendum Zhao, Weili, 161 Zhao, Yijun, Addendum Zhmenyak, Yurij V., Addendum
Copyright © 2022 FDOKUMEN