Security - LASERS
152
A component unit of the State of Louisiana Comprehensive Annual Financial Report 2013-2014 For Fiscal Years Ended June 30, 2014 and 2013 Your Your Future Future Security Security Valuing Valuing
-
Upload
khangminh22 -
Category
Documents
-
view
1 -
download
0
Transcript of Security - LASERS

A component unit of the State of Louisiana
Comprehensive Annual Financial Report
2013-2014
For Fiscal Years EndedJune 30, 2014 and 2013
YourYour FutureFutureSecuritySecurity
Valuing Valuing

Iris Louisiana State Wildflower
YourYour FutureFutureSecuritySecurity
Valuing Valuing
Comprehensive Annual Financial Report
2013-2014
For Fiscal Years EndedJune 30, 2014 and 2013
A component unit of the State of Louisiana
Prepared by the Fiscal, Investments, and Public Information Divisions of the Louisiana State Employees’ Retirement System

Introductory SectionLetter of Transmittal 1Certificate of Achievement for Excellence in Financial Reporting 8 Public Pension Standards Award 8Administrative Organization 9Board of Trustees 10Professional Consultants 11 Financial SectionIndependent Auditors’ Report 13Report on Internal Control Over Financial Reporting and on Compliance and Other Matters Based on an Audit of Financial Statements Performed in Accordance with Government Auditing Standards 16Management’s Discussion and Analysis 18Basic Financial Statements Statements of Fiduciary Net Position 23 Statements of Changes in Fiduciary Net Position 24 Notes to Financial Statements 25Required Supplementary Information 57 Schedules of Changes in Net Pension Liability 58 Schedules of Employers’ Net Pension Liability 59 Schedules of Employer Contributions 60 Schedules of Investment Returns 61 Schedules of Funding Progress for OGB OPEB Trust 62 Notes to Required Supplementary Information 63 Supporting Schedules 65 Schedules of Administrative Expenses 66 Schedules of Investment Expenses 67 Schedules of Board Compensation 68 Schedules of Professional/Consultant Fees 69 Investment SectionChief Investment Officer’s Report 71 Summary of Investment Policy 73Investment Summary Report 81Largest Equity Holdings 82Largest Debt Holdings 82Largest Louisiana Holdings 83
iLouisiana State Employees’ Retirement System
Table of Contents
Valu
ing
your
Fut
ure
Secu
rity

Investment Section continuedLASERS Rates of Return Total Plan 84 Domestic Equity 84 International Equity 85 Domestic Fixed Income 85 Alternative Assets 86Schedule of Brokerage Commissions Paid 87Schedule of Investment Fees 88
Actuarial SectionActuary’s Certification Letter 89Summary of Assumptions 91Summary of Unfunded Actuarial Liabilities/Solvency Test 97Summary of Actuarial and Unfunded Actuarial Liabilities 97Reconciliation of Unfunded Actuarial Liabilities 98Membership Data 99Historical Membership Data 100Principal Provisions of the Plan 101
Statistical SectionSummary 107Changes in Fiduciary Net Position 108Valuation Assets vs. Pension Liabilities 110Employee Contribution Rates 111Employer Contribution Rates 112Benefit Expenses by Type 113Average Monthly Benefit Amounts 115LASERS Membership 135LASERS Changes in Membership 135Number of Benefit Recipients 136Retired Members by Recipient Type and Plan 137Fiscal Year 2014 Gross Benefits Paid by Region 140 Location of LASERS Benefit Recipients 142
ii
Valu
ing
your
Fut
ure
Secu
rity

Introdu
ctory Section
Brown PelicanOfficial State Bird
IntroductorySection
ContentsLetter of Transmittal 1Certificate of Achievement for Excellence in Financial Reporting 8Public Pension Standards Award 8Administrative Organization 9Board of Trustees 10Professional Consultants 11

1Louisiana State Employees’ Retirement System
Introductory Section
October 24, 2014 Dear Board Members: We are pleased to present to you the Comprehensive Annual Financial Report (CAFR) of the Louisiana State Employees’ Retirement System (LASERS or the System) for the fiscal years ended June 30, 2014 and 2013. For the second year in a row, we have had double digit market returns and we attribute this to a well‐diversified asset allocation across asset classes and geographies. Specifically this year, strong performance in the domestic and international equity markets had a definite impact on our returns. Also this year the unfunded accrued liability (UAL), the debt owed the System by the State, was impacted by a change in actuarial assumptions and cost methods. This report includes a wealth of information regarding the activities of LASERS during the past fiscal year, providing clear evidence that LASERS is accomplishing its mission of providing a sound retirement plan for our members through prudent management and exceptional customer service. We trust that you and the other members will find this CAFR helpful in understanding your public employees’ retirement system, which is dedicated to protecting your contributions and maximizing your return.
Management Responsibility
This report consists of management’s representation concerning LASERS finances. Management assumes full responsibility for the completeness and reliability of all information presented in this report. To provide a reasonable basis for making these representations, management has established a comprehensive internal control framework that is designed both to protect the assets from loss, theft, or misuse, and to compile sufficient, reliable information for the preparation of LASERS financial statements in conformity with generally accepted accounting principles. The internal control framework has been designed to provide reasonable, rather than absolute assurance, that the financial statements will be free from material misstatement. As management, we assert that, to the best of our knowledge and belief, this financial report is complete and reliable in all material respects.
Our independent external auditors, Duplantier, Hrapmann, Hogan, and Maher, have conducted an audit of the basic financial statements in accordance with auditing standards generally accepted in the United States of America, performing such tests and other procedures as they deem necessary to express an opinion in their report to the Board. The external auditors also have full and unrestricted access to the Board to discuss their audit and related findings as to the integrity of the financial reporting and adequacy of internal control systems.
2
Introductory Section
Financial Information
The basic financial statements have been prepared in accordance with generally accepted accounting principles applied on a consistent basis as promulgated by the Governmental Accounting Standards Board. The Management’s Discussion and Analysis (MD&A) includes a narrative introduction, overview, and analysis to accompany the basic financial statements. This Letter of Transmittal is designed to complement the MD&A, and should be read in conjunction with it. LASERS MD&A can be found immediately following the reports of the independent auditors in the Financial Section of this report.
Profile of LASERS
LASERS is a single employer defined benefit plan, established by the state legislature in 1946, with the first members joining the System on July 1, 1947. The System is a public trust fund created to provide retirement allowances and other benefits for state officers and employees and their beneficiaries. All invested funds, cash, and property are held in the name of LASERS for the sole benefit of the membership. A thirteen‐member Board of Trustees (comprised of six active members, three retired members, and four ex officio members) governs the System. The Board administers the programs and appoints key management personnel including the Executive Director, Deputy Director, Assistant Director, and the Chief Investment Officer.
The Board of Trustees annually approves an operating budget for administrative expenses that is prepared by staff to address member and employer needs while keeping costs reasonable. The Board must also approve any changes in the budget during the year. In addition to the Trustees’ approval, the budget is approved by the Louisiana Joint Legislative Committee on the Budget.
Investments
For the fiscal year, LASERS investment portfolio realized a market rate of return on investment assets of 12.6%. The plan earned an annualized return of 11.9% for the three‐year period, 6.1% for the seven‐year period, and 8.2% for the ten‐year period. These returns rank LASERS in the top 40% for the one‐year period, the top 35% for the three‐year period, the top 22% for the seven‐year period, and the top 19% for the ten‐year period in the Trust Universe Comparison Services (TUCS) universe of other larger pension plans in the United States.
The foundation of the Investment Division is its asset allocation which is comprehensively studied, monitored and adjusted to produce an optimal mix of assets in order to maximize returns while minimizing risk. A more detailed exhibit of investment performance and a summary of LASERS Statement of Investment Objectives can be found in the Investment Section of this report.
Funding
Annually, the LASERS actuary determines the annual funding requirements needed to meet current and future benefit obligations. Actuarial contributions are based on normal cost and amortization of the
Financial Information
The basic financial statements have been prepared in accordance with generally accepted accounting principles applied on a consistent basis as promulgated by the Governmental Accounting Standards Board. The Management’s Discussion and Analysis (MD&A) includes a narrative introduction, overview, and analysis to accompany the basic financial statements. This Letter of Transmittal is designed to complement the MD&A, and should be read in conjunction with it. LASERS MD&A can be found immediately following the reports of the independent auditors in the Financial Section of this report.
Profile of LASERS
LASERS is a cost‐sharing multiple‐employer defined benefit plan1, established by the state legislature in 1946, with the first members joining the System on July 1, 1947. The System is a public trust fund created to provide retirement allowances and other benefits for state officers and employees and their beneficiaries. All invested funds, cash, and property are held in the name of LASERS for the sole benefit of the membership. A thirteen‐member Board of Trustees (comprised of six active members, three retired members, and four ex officio members) governs the System. The Board administers the programs and appoints key management personnel including the Executive Director, Deputy Director, Assistant Director, and the Chief Investment Officer.
The Board of Trustees annually approves an operating budget for administrative expenses that is prepared by staff to address member and employer needs while keeping costs reasonable. The Board must also approve any changes in the budget during the year. In addition to the Trustees’ approval, the budget is approved by the Louisiana Joint Legislative Committee on the Budget.
Investments
For the fiscal year, LASERS investment portfolio realized a market rate of return on investment assets of 18.8%. The plan earned an annualized return of 10.2% for the three‐year period, 6.0% for the seven‐year period, and 8.3% for the ten‐year period. These returns rank LASERS in the top 10% for the one‐year period, the top 44% for the three‐year period, the top 23% for the seven‐year period, and the top 17% for the ten‐year period in the Trust Universe Comparison Services (TUCS) universe of all public pension plans in the United States with market values greater than $1 billion.
The foundation of the Investment Division is its asset allocation which is comprehensively studied, monitored and adjusted to produce an optimal mix of assets in order to maximize returns while minimizing risk. A more detailed exhibit of investment performance and a summary of LASERS Statement of Investment Objectives can be found in the Investment Section of this report.
1 Due to a definitional change with the implementation of GASB 67, LASERS is now considered a cost-sharing multiple-employer plan for financial reporting purposes. Prior to the implementation of GASB 67, LASERS was considered a single-employer plan.
3Louisiana State Employees’ Retirement System
Introductory Section
Funding
Annually, the LASERS actuary determines the annual funding requirements needed to meet current and future benefit obligations. Actuarial contributions are based on normal cost and amortization of the unfunded accrued liability, which has existed since the System’s inception. Employers are required to pay the percentage of total payroll equal to the normal cost plus an amount sufficient to amortize the unfunded accrued liability as outlined in Louisiana Revised Statute 11:102 as it pertains to LASERS. This year the LASERS actuary is recommending that the Public Retirement Systems’ Actuarial Committee (PRSAC) approve a composite employer contribution rate of 37% for the fiscal year ended June 30, 2016.
The actuarial value of member benefit liabilities exceeds the value of actuarial assets. At year end, the ratio of the value of actuarial assets to actuarial accrued liabilities decreased to 59.3% and the System’s unfunded actuarial accrued liability increased to $7.3 billion primarily a result of a change in discount rate and other actuarial assumptions and the change in actuarial cost methods. The investment yield on the actuarial value of assets was 8.3% for 30 years, which is above the net actuarial rate of return of 7.75% assumed in the valuation. Additional information regarding the financial condition of the pension trust fund can be found in the Actuarial Section of this report.
Major Initiatives
Part of our mission is to provide exceptional customer service to our members and contributing agencies as well as to improve the financial security of our members. Key accomplishments for the past year are summarized below:
System Governance
LASERS has positioned itself for the future with significant objectives and performance indicators. The Board of Trustees has continued to follow an adopted Board Resolution expressing that the following matters have reached such a critical state of importance to system members so as to elevate them to the status of significant board issues:
1. Identification and implementation of a legislatively enacted mechanism for the funding and granting of an annual cost‐of‐living adjustment for eligible System retirees in a reliable and dependable manner;
2. Preservation of the defined benefit plan for current and future LASERS members;
3. Preservation of Board autonomy as well as its primary composition of elected active and retired system members; and
4. While continuing to oppose mandatory Social Security participation, seek the reduction or elimination of the federal offsets, the Windfall Elimination Provision and the Government Pension Offset.

4
Introductory Section
Legislation
The 2014 Regular Session of the Louisiana Legislature resulted in the passage of a number of changes to the Plan administered by LASERS.
Act 102, effective July 1, 2014, granted a 1.5% cost‐of‐living adjustment to eligible retirees and beneficiaries. A retiree was eligible for the COLA if, by June 30, 2014, they had been retired at least one year and were at least age 60, unless they were a disability retiree. The amount on which the COLA is based was limited to the first $96,931 of the member’s retirement benefit.
Act 226 changes retirement eligibility to five years of service at age 62, for those hired on or after July 1, 2015. It does not apply to members of the Hazardous Duty Services Plan.
Act 399, effective July 1, 2014, is a complex piece of legislation designed to direct more investment earnings to pay System debt and tie the granting of future COLAs to the funded level of the System. It applies not only to LASERS, but to the other state retirement systems. It will result in the value of only one COLA being placed in the Experience Account until the System is 80% funded. Excess earnings that were previously put into the Experience Account will be applied to System debt. COLAs will be limited to every other year until the System is 85% funded and will be limited to the first $60,000 of the retirement benefit (indexed to the CPI‐U as of July 1, 2015). The amount of future COLAs will range from 1.5% to 3.0%, depending on the system funded level and investment returns, and limited by the CPI‐U.
Act 571, effective June 30, 2014, changes the actuarial funding method for LASERS from projected unit credit to entry age normal.
Act 648 provides for enrollment of new hires of the Harbor Police Department of the Port of New Orleans in the LASERS Hazardous Duty Services Plan starting July 1, 2014. It also authorizes a cooperative endeavor agreement to transfer the administration of the Harbor Police Retirement System to LASERS, effective July 1, 2015, upon approval of the agreement by the Public Retirement Systems’ Actuarial Committee.
Act 852, effective June 30, 2014, makes technical corrections dealing with the joint and survivor annuity option, the employee contribution rate for members working after DROP, and survivor benefits for physically handicapped and mentally disabled children.
Act 852 also provides enhanced retroactive retirement benefits to certain Adult Probation & Parole Officers employed prior to July 1, 2014. The benefits are funded through the Adult Probation & Parole Officer Retirement Fund.
Act 55 appropriates about $4.3 million in surplus funds to LASERS to be applied to the Initial Unfunded Accrued Liability of the System.

5Louisiana State Employees’ Retirement System
Introductory Section
Technology Improvements
Over the past year, we have addressed the following technology improvements:
Deployed key process automation improvements in the area of managing agency credit card accounting, refunds via EFT, and reporting from our third‐party administrator for DROP accounting.
Implemented Systems Development Life Cycle (SDLC) improvements for managing the prioritization, documentation, approval, and delivery of system enhancements resulting in a significant reduction of outstanding system defect corrections and change requests.
Completed a successful offsite disaster recovery test with SunGard of the new iSeries hardware and systems.
Initiated a project to upgrade the JD Edwards Financial suite to version 9.1 which is scheduled for completion by year‐end 2014.
Our next strategic projects will be the upgrade or replacement of the IBM Content Manager imaging and workflow system along with implementation of plan changes mandated by the 2014 legislative session.
Long‐term Investment Program
LASERS had approximately $11.5 billion under management as of June 30, 2014. The plan maintains its spot as one of the nation’s top state pension plans based on long‐term returns.
The Investment Program continuously maintains its commitment to a broadly diversified portfolio and achieving its actuarial rate of return with the least possible risk. LASERS allocation consists of equities, fixed income and alternative investments which consist of private equity, absolute return strategies, and real assets. No significant changes were made to the asset allocation this year.
LASERS works closely with its investment consultant to conduct a thorough asset allocation and liability review on an annual basis. In addition, our Chief Investment Officer reviews the asset allocation regularly to ensure that it is consistent with the exposure ranges set for LASERS. When necessary, funds are rebalanced, taking into consideration market conditions and transaction costs. This sound asset allocation approach does not veer off course due to market swings.
With nearly one‐third of the plan’s assets managed internally, LASERS saves millions in management fees each year. Other cost‐saving measures include monitoring investment manager trade execution costs and negotiating favorable investment management fees. The Investment Division continues to work with the custodian bank to enhance reporting capabilities, build upon the in‐house trade management system, and enhance its risk management evaluation capabilities.
6
Introductory Section
Accounting Processes Enhanced
Our Fiscal Division concentrated on the implementation of several new practices and initiatives over the past year which included:
The Chief Financial Officer serving on a Task Force that is acting in an advisory capacity for the implementation of GASB 67 and GASB 68 for the State of Louisiana.
Completing the upgrade of the Q2 investment accounting software. The new platform is cloud based and will eliminate the necessity of purchasing and maintaining hardware to support this software.
Coordinating the issuance of request for information for the upgrade of LASERS financial accounting system, JD Edwards EnterpriseOne XE, to the current version. This resulted in a contract with The iConsortium for a six month project to perform the upgrade.
Online Access Expanded
Utilization of technology to improve overall agency performance, communication, and education continues to be a major initiative of LASERS. Technological advances in imaging, bar coding, and online fillable forms continue to enable LASERS to enhance customer service to its members and agencies. Receiving an average of 1.4 million hits per month, the LASERS website, www.lasersonline.org, offers agency and member users access to current System information, educational programs, forms, publications, legislation, and a video and podcast library. The mobile version of the website continues to be utilized. In 2013, the Listen LASERS podcast series was launched, providing a variety of retirement topics for listeners. The LASERS eBeam blog includes information on public retirement issues, both on a local and national level. Social media, such as Facebook and Twitter, continues to build a following with the goal of keeping our membership informed. The Member Connection Email Service has proven to be an invaluable communications tool and serves over 40,000 members. LASERS also continues to utilize its YouTube Channel which houses all educational videos. LASERS offers a paperless version of the quarterly newsletter, The Beam, giving members the opportunity to opt‐out of the mailing list and receive an electronic version.
Member Outreach Enhanced
Our Member Services Division is focused on providing quality customer service and educating members across the state on their retirement options. Faced with handling an unprecedented number of state employee layoffs, the Division has focused on providing educational sessions to affected agencies and reaching out both in person and electronically to our members. Member Services has streamlined processes and improved internal procedures in an effort to handle the increased volume of service purchase requests and retirement applications. All of these improvements and the increased educational outreach have proven successful as agencies are able to provide information to LASERS timelier and members have experienced the swift payment and finalization of their retirement benefits.

7Louisiana State Employees’ Retirement System
Introductory Section
Awards
The Government Finance Officers Association of the United States and Canada (GFOA) awarded a Certificate of Achievement for Excellence in Financial Reporting to LASERS for its Comprehensive Annual Financial Report (CAFR) for the fiscal year ended June 30, 2013. This was the seventeenth consecutive year that the System has achieved this prestigious award. In order to be awarded a Certificate of Achievement, a governmental unit must publish an easily readable and efficiently organized CAFR. This report must satisfy both generally accepted accounting principles and applicable legal requirements.
A Certificate of Achievement is valid for a period of only one year. We believe that our current CAFR continues to meet the Certificate of Achievement Program’s requirements, and we are submitting it to the GFOA to determine its eligibility for another certificate.
LASERS also received the GFOA award for its Popular Annual Financial Report (PAFR) entitled LASERS Summary Annual Report, for the fiscal year ended 2013. This was the fifteenth consecutive year LASERS has received this award. The Popular Annual Financial Report presents, in a less technical manner, some of the major financial, actuarial, and other interesting information for the reporting year.
In addition, LASERS received the 2013 Public Pension Standards Award. The Public Pension Coordinating Council presents this award to public employee retirement systems in recognition of their achievement of high professional standards in the areas of plan design and administration, benefits, actuarial valuations, financial reporting, investments and membership communications. This is the tenth consecutive year that LASERS has received this prestigious award.
Conclusion
This report is a product of the combined efforts of the System’s staff and advisors functioning under your leadership. It is intended to provide extensive and reliable information that will facilitate management decisions, serve as a means for determining compliance with legal provisions, and allow for the evaluation of responsible stewardship of the funds of the System.
We would like to recognize the teamwork and contributions of our experienced and dedicated staff. They continue to keep the best interests of our members as their top priority. As we look toward the future, we will continue to fine‐tune our investment strategies to make every investment dollar count and to minimize employer contributions. Also, we will look to develop innovative programs to improve the value of the services provided to all that we serve. Respectfully submitted,
Cindy Rougeou Arthur P. Fillastre, IV CPA Executive Director Chief Financial Officer

8
Introductory Section
Certificate of Achievement for Excellence in Financial Reporting 2013
Public Pension Standards Award 2013

9Louisiana State Employees’ Retirement System
Introductory Section
Administrative Organization
Top row, left to right: Ryan Babin, Audit Division Director Arthur P. Fillastre, IV, Chief Financial Officer Tonja Normand, Public Information Division Director Sheila Metoyer, Human Resources Division Director Robert W. Beale, Chief Investment Officer Lance Armstrong, Information Technology Division Director Bottom row, left to right: Cindy Taylor, Member Services Division Director Maris E. LeBlanc, Deputy Director & Chief Operating Officer Cindy Rougeou, Executive Director Bernard E. “Trey” Boudreaux, III, Assistant Director & Chief Administrative Officer Tina Grant, Executive Counsel

10
Introductory Section
Board of Trustees
Top row, left to right: Ben Huxen, Designee for Commissioner of Administration Kristy Nichols Lori Pierce, Elected Active Member Barbara McManus, Elected Retired Member Thomas Bickham, Elected Active Member Bottom row, left to right: Janice Lansing, Elected Active Member Shannon Templet, Chair, Elected Active Member Connie Carlton, Elected Retired Member Beverly Hodges, Elected Active Member
Individual photos, left to right: Judge William Kleinpeter, Elected Active Member Kathy Singleton, Vice Chair, Elected Retired Member Senator Elbert Guillory, Chair, Senate Committee on Retirement Honorable John Kennedy, State Treasurer Commissioner Kristy Nichols, Division of Administration Representative Kevin Pearson, Chair, House Committee on Retirement

11Louisiana State Employees’ Retirement System
Introductory Section
June 30, 2014
Actuary Medical ExaminersFoster & Foster, Inc Dr. Eduardo L. Alvarez Hall Actuarial Associates Dr. Robert Branstetter
Dr. Rennie W. CulverAuditor Dr. David FerachiDuplantier, Hrapmann, Hogan & Maher, LLP Dr. Venkata Gadi
Dr. Edward GriffinCustodian Banks and Security Agents Dr. Sheldon HershBNY Mellon Asset Servicing Dr. Albert KrauseGreat‐West Retirement Services, Inc. Dr. Andrew MorsonJPMorgan Chase Dr. Joseph Nesheiwat
Dr. Victor OliverLegal Consultants Dr. Deepish Rubin PatelAvant & Falcon Dr. Thomas PresslyKlausner, Kaufman, Jensen, & Levinson Dr. Radha RamanLowenstein Sandler Dr. Jose A. SantiagoRoedel Parsons Koch Balhoff & McCollisterTarcza & Associates, LLC Other Consultants
Critical Start LLCInvestment Consultant iConsortium Inc.NEPC, LLC Sign Language Services International
Professional Consultants

12
Introductory Section
June 30, 2014
Investment AdvisorsAdams Street Partners LLC Mondrian Investments Partners LimitedApollo Management, L.P. Newstone Capital partners, L.P.Aronson+Johnson+Ortiz, L.P. Nomura Corporate Research and Asset Management, Inc.BlackRock Financial Management, Inc. Oaktree European Principal Fund, L.P.Bridgewater Associates, Inc. Orleans Capital ManagementCCMP Capital Advisors LLC Pacific Alternative Asset Management Company, LLCCity of London Investment Management Co Pantheon Ventures Inc.Coller International Partner, L.P. Pinnacle Asset ManagementDRI Capital, Inc. Prisma Capital Partners, L.P.Energy Spectrum Partners, L.P. Private Advisors, LLCEntrust Capital Partners, L.P. Rice Hall James & Associates, LLCGAM USA, Inc. Siguler Guff & CompanyEIG Global Energy Partners, LLC Stark Investments Limited PartnershipGoldman Sachs Private Equity Partners, L.P. Stepstone Capital, L.P.Gresham Investment Management, LLC Sterling Capital Partners, L.P.GTCR, LLC Stone Harbor Investment PartnersHarbourvest Partners, LLC The Brinson Partnership Fund TrustJ.P. Morgan Investment Management Inc. The Huff Alternative Fund, L.P.JMB Group Trust Thompson, Horstmann & Bryant, Inc.K2 Advisors, LLC Vista Equity Partners, L.P.Loomis, Sayles & Company, L.P. W.R. Huff Asset ManagementLSV Asset Management Westwood Global Investments, LLCMarathon Asset Management Williams Capital Partners Advisors, L.P.Mesirow Financial Private Equity Partnership
Professional Consultants (continued)

Finan
cial Section
MagnoliaOfficial State Flower
FinancialSection
ContentsIndependent Auditors’ Report 13Report on Internal Control Over Financial Reportingand on Compliance and Other Matters Based on an Auditof Financial Statements Performed in Accordance withGovernment Auditing Standards 16Management’s Discussion and Analysis 18
Basic Financial StatementsStatements of Fiduciary Net Position 23Statements of Changes in Fiduciary Net Position 24Notes to Financial Statements 25
Required Supplementary Information 57Schedules of Changes in Net Pension Liability 58Schedules of Employers’ Net Pension Liability 59Schedules of Employer Contributions 60Schedules of Investment Returns 61Schedules of Funding Progress for OGB OPEB Trust 62Notes to Required Supplementary Information 63Supporting Schedules 65Schedules of Administrative Expenses 66Schedules of Investment Expenses 67Schedules of Board Compensation 68Schedules of Professional/Consultant Fees 69
13Louisiana State Employees’ Retirement System
Financial Section
INDEPENDENT AUDITOR’S REPORT
September 19, 2014
To the Board of Trustees Louisiana State Employees’ Retirement System Baton Rouge, Louisiana
We have audited the accompanying financial statements of the Louisiana State Employees’ Retirement System (LASERS), a component unit of the State of Louisiana, as of and for the years ended June 30, 2014 and 2013, and the related notes to the financial statements, which collectively comprise the Louisiana State Employees’ Retirement System’s basic financial statements as listed in the table of contents.
Management’s Responsibility for the Financial Statements
Management is responsible for the preparation and fair presentation of these financial statements in accordance with accounting principles generally accepted in the United States of America; this includes the design, implementation, and maintenance of internal control relevant to the preparation and fair presentation of financial statements that are free from material misstatement, whether due to fraud or error.
Auditor’s Responsibility
Our responsibility is to express opinions on these financial statements based on our audit. We conducted our audit in accordance with auditing standards generally accepted in the United States of America and the standards applicable to financial audits contained in Government Auditing Standards, issued by the Comptroller General of the United States. Those standards require that we plan and perform the audit to obtain reasonable assurance about whether the financial statements are free from material misstatement.
1615 Poydras Street, Suite 2100 New Orleans, LA 70112 (504) 586-8866 Fax (504) 525-5888 1670 Old Spanish Trail Slidell, LA 70458 (985) 649-9996 Fax (985) 649-9940 247 Corporate Drive Houma, LA 70360 (985) 868-2630 Fax (985) 872-3833
5047 Highway 1, P. O. Box 830 Napoleonville, LA 70390 (985) 369-6003 Fax (985) 369-9941 www.dhhmcpa.com
HEATHER M. JOVANOVICH, C.P.A. TERRI L. KITTO, C.P.A.
WILLIAM G. STAMM, C.P.A. LINDSAY J. CALUB, C.P.A., L.L.C. GUY L. DUPLANTIER, C.P.A. MICHELLE H. CUNNINGHAM, C.P.A DENNIS W. DILLON, C.P.A. GRADY C. LLOYD, III, C.P.A.
MICHAEL J. O’ROURKE, C.P.A. DAVID A. BURGARD, C.P.A.
CLIFFORD J. GIFFIN, Jr., CPA _________________
A.J. DUPLANTIER JR, C.P.A. (1919-1985) FELIX J. HRAPMANN, JR, C.P.A. (1919-1990) WILLIAM R. HOGAN, JR., CPA (1920-1996)
JAMES MAHER, JR, C.P.A. (1921-1999)
MEMBERS AMERICAN INSTITUTE OF
CERTIFIED PUBLIC ACCOUNTANTS SOCIETY OF LA C.P.A.’S

14
Financial Section
An audit involves performing procedures to obtain audit evidence about the amounts and disclosures in the financial statements. The procedures selected depend on the auditor’s judgment, including the assessment of the risks of material misstatement of the financial statements, whether due to fraud or error. In making those risk assessments, the auditor considers internal control relevant to LASERS’ preparation and fair presentation of the financial statements in order to design audit procedures that are appropriate in the circumstances, but not for the purpose of expressing an opinion on the effectiveness of the LASERS’ internal control. Accordingly, we express no such opinion. An audit also includes evaluating the appropriateness of accounting policies used and the reasonableness of significant accounting estimates made by management, as well as evaluating the overall presentation of the financial statements.
We believe that the audit evidence we have obtained is sufficient and appropriate to provide a basis for our audit opinions.
Opinions
In our opinion, the financial statements referred to above present fairly, in all material respects, the fiduciary net position of the Louisiana State Employees’ Retirement System, at June 30, 2014, and 2013 and the changes in fiduciary net position for the years then ended in accordance with accounting principles generally accepted in the United States of America.
Emphasis of Matter
As disclosed in Note D to the financial statements, the financial statements include investments that are not listed on national exchanges or for which quoted market prices are not available. These investments include private equities, absolute returns, global tactical asset allocations, and investments in real assets. Such investments totaled $3.3 billion and $2.9 billion (25.5% of total assets) at June 30 2014 and 2013, respectively. Where a publicly listed price is not available, the management of LASERS uses alternative sources of information including audited financial statements, unaudited interim reports, independent appraisals, and similar evidence to determine the fair value of investments. Our opinion is not modified with respect to this matter.
As disclosed in Note A to the financial statements, the total pension liability for LASERS was $17,844,744,945 and $17,612,223,257 at June 30, 2014 and 2013, respectively. The actuarial valuations were based on various assumptions made by LASERS’ actuary. Because actual experience may differ from the assumptions used in the actuarial valuation, there is a risk that the total pension liability at June 30, 2014 and 2013 could be understated or overstated.
Other Matters
Required Supplementary Information
Accounting principles generally accepted in the United States of America require that the management’s discussion and analysis and other required supplementary information, as listed in the table of contents, be presented to supplement the basic financial statements. Such information, although not a part of the basic financial statements, is required by the Governmental Accounting Standards Board, who considers it to be an essential part of financial reporting

15Louisiana State Employees’ Retirement System
Financial Section
reporting for placing the basic financial statements in an appropriate operational, economic, or historical context. We have applied certain limited procedures to the required supplementary information in accordance with auditing standards generally accepted in the United States of America, which consisted of inquiries of management about the methods of preparing the information and comparing the information for consistency with management’s responses to our inquiries, the basic financial statements, and other knowledge we obtained during our audit of the basic financial statements. We do not express an opinion or provide any assurance on the information because the limited procedures do not provide us with sufficient evidence to express an opinion or provide any assurance.
Other Information
Our audit was conducted for the purpose of forming opinions on the financial statements that collectively comprise the Louisiana State Employees’ Retirement System’s basic financial statements. The supporting schedules, introductory section, investment section, actuarial section and statistical section, as listed in the table of contents, are presented for purposes of additional analysis and are not a required part of the basic financial statements.
The supporting schedules are the responsibility of management and were derived from and relate directly to the underlying accounting and other records used to prepare the basic financial statements. Such information has been subjected to the auditing procedures applied in the audit of the basic financial statements and certain additional procedures, including comparing and reconciling such information directly to the underlying accounting and other records used to prepare the basic financial statements or to the basic financial statements themselves, and other additional procedures in accordance with auditing standards generally accepted in the United States of America. In our opinion, the supplementary schedules are fairly stated, in all material respects, in relation to the basic financial statements as a whole.
The introductory section, investment section, actuarial section and statistical section have not been subjected to the auditing procedures applied in the audit of the basic financial statements and, accordingly, we do not express an opinion or provide any assurance on them.
Other Reporting Required by Government Auditing Standards
In accordance with Government Auditing Standards, we have also issued our report dated September 19, 2014 on our consideration of the Louisiana State Employees’ Retirement System's internal control over financial reporting and on our tests of its compliance with certain provisions of laws, regulations, contracts, and grant agreements and other matters. The purpose of that report is to describe the scope of our testing of internal control over financial reporting and compliance and the results of that testing, and not to provide an opinion on internal control over financial reporting or on compliance. That report is an integral part of an audit performed in accordance with Government Auditing Standards in considering the Louisiana State Employees’ Retirement System’s internal control over financial reporting and compliance.
Duplantier, Hrapmann, Hogan & Maher, LLP

16
Financial Section
INDEPENDENT AUDITOR’S REPORT ON INTERNAL CONTROL OVER FINANCIAL REPORTING AND ON COMPLIANCE AND OTHER MATTERS
BASED ON AN AUDIT OF FINANCIAL STATEMENTS PERFORMED IN ACCORDANCE WITH GOVERNMENT AUDITING STANDARDS
September 19, 2014
To the Board of Trustees Louisiana State Employees’ Retirement System Baton Rouge, Louisiana
We have audited, in accordance with the auditing standards generally accepted in the United States of America and the standards applicable to financial audits contained in Government Auditing Standards issued by the Comptroller General of the United States, the financial statements of the Louisiana State Employees’ Retirement System, as of and for the year ended June 30, 2014, and the related notes to the financial statements, which collectively comprise the Louisiana State Employees’ Retirement System’s basic financial statements, and have issued our report thereon dated September 19, 2014.
Internal Control Over Financial Reporting
In planning and performing our audit of the financial statements, we considered the Louisiana State Employees’ Retirement System’s internal control over financial reporting to determine the audit procedures that are appropriate in the circumstances for the purpose of expressing our opinions on the financial statements, but not for the purpose of expressing an opinion on the effectiveness of the Louisiana State Employees’ Retirement System’s internal control. Accordingly, we do not express an opinion on the effectiveness of the Louisiana State Employees’ Retirement System’s internal control.
1615 Poydras Street, Suite 2100 New Orleans, LA 70112 (504) 586-8866 Fax (504) 525-5888 1670 Old Spanish Trail Slidell, LA 70458 (985) 649-9996 Fax (985) 649-9940 247 Corporate Drive Houma, LA 70360 (985) 868-2630 Fax (985) 872-3833
5047 Highway 1, P. O. Box 830 Napoleonville, LA 70390 (985) 369-6003 Fax (985) 369-9941 www.dhhmcpa.com
HEATHER M. JOVANOVICH, C.P.A. TERRI L. KITTO, C.P.A.
WILLIAM G. STAMM, C.P.A. LINDSAY J. CALUB, C.P.A., L.L.C. GUY L. DUPLANTIER, C.P.A. MICHELLE H. CUNNINGHAM, C.P.A DENNIS W. DILLON, C.P.A. GRADY C. LLOYD, III, C.P.A.
MICHAEL J. O’ROURKE, C.P.A. DAVID A. BURGARD, C.P.A.
CLIFFORD J. GIFFIN, Jr., CPA _________________
A.J. DUPLANTIER JR, C.P.A. (1919-1985) FELIX J. HRAPMANN, JR, C.P.A. (1919-1990) WILLIAM R. HOGAN, JR., CPA (1920-1996)
JAMES MAHER, JR, C.P.A. (1921-1999)
MEMBERS AMERICAN INSTITUTE OF
CERTIFIED PUBLIC ACCOUNTANTS SOCIETY OF LA C.P.A.’S

17Louisiana State Employees’ Retirement System
Financial Section
A deficiency in internal control exists when the design or operation of a control does not allow management or employees, in the normal course of performing their assigned functions, to prevent, or detect and correct, misstatements on a timely basis. A material weakness is a deficiency, or a combination of deficiencies, in internal control, such that there is a reasonable possibility that a material misstatement of the entity’s financial statements will not be prevented, or detected and corrected on a timely basis. A significant deficiency is a deficiency, or a combination of deficiencies, in internal control that is less severe than a material weakness, yet important enough to merit attention by those charged with governance.
Our consideration of internal control over financial reporting for the limited purpose described in the first paragraph of this section and was not designed to identify all deficiencies in internal control that might be material weaknesses or significant deficiencies. Given these limitations, during our audit we did not identify any deficiencies in internal control that we consider to be material weaknesses. However, material weaknesses may exist that have not been identified.
Compliance and Other Matters
As part of obtaining reasonable assurance about whether the Louisiana State Employees’ Retirement System’s financial statements are free from material misstatement, we performed tests of its compliance with certain provisions of laws, regulations, contracts, and grant agreements, noncompliance with which could have a direct and material effect on the determination of financial statement amounts. However, providing an opinion on compliance with those provisions was not an objective of our audit, and accordingly, we do not express such an opinion. The results of our tests disclosed no instances of noncompliance or other matters that are required to be reported under Government Auditing Standards.
Purpose of this Report
The purpose of this report is solely to describe the scope of our testing of internal control and compliance and the results of that testing, and not to provide an opinion on the effectiveness of Louisiana State Employees’ Retirement System’s internal control or on compliance. This report is an integral part of an audit performed in accordance with Government Auditing Standards in considering Louisiana State Employees’ Retirement System’s internal control and compliance. Accordingly, this communication is not suitable for any other purpose.
Duplantier, Hrapmann, Hogan & Maher, LLP
18
Financial Section
Management’s Discussion and Analysis The following is management’s discussion and analysis of the financial performance of the Louisiana State Employees’ Retirement System (LASERS or the System). This narrative overview and analysis helps to interpret the key elements of the financial statements, notes to the financial statements, required supplementary information, and supporting schedules for the current year. Readers are encouraged to consider the information presented here in conjunction with additional information provided in the Transmittal Letter of LASERS Comprehensive Annual Financial Report (CAFR). Financial Highlights
Net position restricted for pensions increased by $1.3 billion, or 12.6%.
The actuarial rate of return on the market value of the System’s investments was 13.5% for 2014 compared to 14.1% for 2013.
LASERS had a Net Pension Liability of $6.3 billion and the Net Pension Liability as a percentage of covered payroll was 344.7% as of June 30, 2014.
Net investment income experienced a gain of $1.8 billion for 2014 compared to a gain $1.1 billion for 2013.
Total contributions decreased by $54.2 million or 6.6% from 2013 to $768.2 million in 2014.
Benefit payments increased by $97.1 million or 9.1% to $1.2 billion in 2014.
Refund and transfer payments of member contributions increased by $15.6 million or 25.4% to $77.1 million in 2014.
Overview of the Financial Statements The System’s basic financial statements were prepared in conformity with GASB Statement No. 67, Financial Reporting for Pension Plans and include the following: (1) statements of fiduciary net position, (2) statements of changes in fiduciary net position, (3) notes to the financial statements, and (4) required supplementary information.
The Statements of Fiduciary Net Position report the System’s assets, liabilities, and resultant net position restricted for pensions. They disclose the financial position of the System as of June 30, 2014, and 2013, respectively.
The Statements of Changes in Fiduciary Net Position report the results of the System’s operations during years 2014 and 2013 disclosing the additions to and deductions from the fiduciary net position. They support the change that has occurred to the prior year’s net position on the statement of fiduciary net position.

19Louisiana State Employees’ Retirement System
Financial Section
Notes to the Financial Statements provide additional information that is essential to a full understanding of the financial statements.
Note A provides a general description of LASERS organization, employer and membership participation, net pension liability of employers, actuarial methods and assumptions, information regarding legally required reserves, eligibility, and benefits.
Note B provides a summary of significant accounting policies and plan position matters including the basis of accounting, securities lending, estimates, methods used to value investments, new accounting pronouncements, property and equipment, accumulated leave, and reclassifications.
Note C provides information regarding member and employer contribution requirements.
Note D describes LASERS deposits and investment risk disclosures which include custodial credit risk, concentration of credit risk, credit risk, interest rate risk, and foreign currency risk.
Note E describes the System’s cash and investments, and includes information regarding bank balances, investments including the investment policy and rate of return, domestic equity, international equity, domestic core fixed income, global fixed income, emerging market debt, derivatives, alternative investments, and global tactical asset allocation.
Note F provides information regarding securities lending transactions.
Note G provides information on other postemployment benefits.
Required Supplementary Information consists of four schedules and related notes concerning changes in net pension liability, employers’ net pension liability, employer contributions, and the money‐weighted rate of investment returns. It also includes the schedule of funding progress for the Other Post‐Employment Benefits (OPEB) trust.
The Supporting Schedules section includes the schedules of administrative expenses, investment expenses, board compensation, and payments to consultants. Financial Analysis LASERS financial position is measured in several ways. One way is to determine the fiduciary net position (difference between total assets and total liabilities) available to pay benefits. Over time, increases and decreases in the LASERS fiduciary net position indicates whether its financial health is improving or deteriorating. Other factors, such as financial market conditions, should also be taken into consideration when measuring LASERS overall health.
The following table illustrates a condensed version of LASERS Statements of Fiduciary Net Position for fiscal years ending 2014, 2013, and 2012. LASERS fiduciary net position as of June 30, 2014, and 2013, totaled $11,624,853,426 and $10,327,598,351, respectively. All of the fiduciary net position is available to meet LASERS ongoing obligations to members, retirees, and beneficiaries.

20
Financial Section
Condensed Comparative Statements of Fiduciary Net Position
2014 2013 2012Cash and Cash Equivalents $ 77,729,832 $ 62,005,498 $ 76,484,826 Receivables 111,571,052 106,101,183 202,859,767 Investments 11,506,396,982 10,228,944,629 9,299,615,012 Securities Lending Cash Collateral Held 1,107,047,506 963,415,924 921,932,039 Capital Assets 5,127,676 6,373,829 8,106,259 Total Assets $ 12,807,873,048 $ 11,366,841,063 $ 10,508,997,903 Accounts Payable & Other Liabilities 73,245,876 67,756,826 61,782,973 Securities Lending Obligations 1,109,773,746 971,485,886 931,440,588 Total Liabilities $ 1,183,019,622 $ 1,039,242,712 $ 993,223,561
Net Position Restricted for Pensions $ 11,624,853,426 $ 10,327,598,351 $ 9,515,774,342
For the fiscal year ended June 30, 2014, fiduciary net position was approximately $11.6 billion. This reflected an increase of approximately 12.6% or $1,297,255,075 from the previous fiscal year‐end. In the one‐year period from June 30, 2012 to June 30, 2013, LASERS fiduciary net position increased approximately 8.5% or $811,824,009. These changes were a direct result of increases in the financial markets during those time periods.
LASERS maintains its commitment to a broadly diversified portfolio. Carefully underwritten and conservative assumptions for future expected returns have been adopted, and the investment portfolio is structured to optimize the risk‐return trade‐off. This is done in part by reviewing the Plan’s asset allocation. LASERS continues to believe that it is well positioned to meet its long‐term goals.

21Louisiana State Employees’ Retirement System
Financial Section
2014 2013 2012AdditionsEmployer Contributions 615,164,022$ 649,029,708$ 637,285,920$ Employee Contributions 152,993,052 173,357,802 192,795,057 Net Investment Income (Loss) 1,770,521,381 1,104,747,865 (11,299,929) Other Income 20,810,679 33,806,894 32,441,258 Total Additions 2,559,489,134 1,960,942,269 851,222,306 DeductionsRetirement Benefits 1,167,477,166 1,070,410,859 978,971,262 Refunds and Transfers of Contributions 77,118,765 61,522,162 43,221,742 Administrative Expenses 14,810,539 14,258,832 13,810,702 Other Postemployment Benefits Expenses 1,103,488 982,754 999,650 Depreciation and Amortization Expenses 1,724,101 1,943,653 1,941,249 Total Deductions 1,262,234,059 1,149,118,260 1,038,944,605 Net Increase (Decrease) in Net Position 1,297,255,075 811,824,009 (187,722,299) Net Position Restricted for PensionsBeginning of Year 10,327,598,351 9,515,774,342 9,703,496,641 End of Year 11,624,853,426$ 10,327,598,351$ 9,515,774,342$
Condensed Comparative Statements of Changes in Fiduciary Net Position
Additions to Fiduciary Net Position
The revenues needed to finance retirement benefits are accumulated primarily through the collection of employer and employee contributions and earnings on investments. Revenue for the fiscal year ended June 30, 2014, totaled $2,559,489,134. The revenue consisted of employer and employee contributions totaling $768,157,074, a net investment gain of $1,770,521,381, and other income of $20,810,679. Improvements in the financial markets are the primary reason for the increase in Fiduciary Net Position for the fiscal years presented. Our investment portfolio in 2014 completed the current year with a positive market rate of return on investment assets of 18.8% which ranked in the top ten percent of all public pension plans with market values greater than $1 billion in the Wilshire Trust Universe Comparison Service (TUCS). The net result was an increase of 60.3% or $665,773,516 in investment earnings over 2013.
At June 30, 2013, total revenues increased by 130.4% or $1,109,719,963 over fiscal year 2012. The increased revenue was due primarily to net investment income increasing 9,876.6% from 2012. Combined contributions decreased 0.9% while other income increased 4.2%. Our investment portfolio completed the fiscal year with a positive market rate of return on investment assets of 12.6%, which ranked in the top 40 percent of all public pension plans with market values greater than $1 billion in the Wilshire Trust Universe Comparison Service (TUCS).
During 2014, combined employer and employee contribution income decreased from 2013 by $54,230,436. Employer contributions based on covered payroll decreased $33,865,686, or 5.2%, and member contributions decreased $20,364,750, or 11.7%. The decrease in employer and employee

22
Financial Section
contributions is likely a result of fewer active members caused by the State’s privatization of several agencies and the resulting reduction in workforce.
Deductions from Plan Assets
LASERS was created to provide lifetime retirement, survivor, and disability benefits to qualified LASERS members. The cost of such programs includes recurring benefit payments, refund of contributions to employees who left the System, and the cost of administering LASERS.
Deductions for the fiscal year ended June 30, 2014, totaled $1,262,234,059, an increase of approximately 9.8% over June 30, 2013. For the fiscal year ended June 30, 2013, deductions were $1,149,118,260, an increase of about 10.6% over June 30, 2012. The increase in deductions for fiscal years ended 2014 and 2013 was due primarily to increases in benefits, refunds and transfers of member contributions paid. Benefits paid in 2014, as in 2013, increased because of the increase in the number of retirees and the average benefit resulting from the higher average salary history of the newer retirees. Refunds and transfers out of member contributions increased primarily because of the State’s privatization of several agencies and the effected employees requesting distributions.
Administrative expenses increased $551,707 or 3.9% for the fiscal year ended June 30, 2014. This is primarily attributable to increases in personnel costs and project consultant fees for financial accounting system upgrade. In 2013, administrative expenses increased $448,130 or 3.2% over fiscal year ended 2012. The increase was primarily attributable to the increases in personnel costs and computer acquisitions. Details of administrative expense activity can be found in the Schedules of Administrative Expenses located under Supporting Schedules.
Other Postemployment Benefit (OPEB) expenses increased $120,734 or 12.3% for the fiscal year ended June 30, 2014 compared to June 30, 2013. In 2013, OPEB expenses decreased $16,896 over fiscal year ended 2012. These amounts are based on adjusted calculations by the administrators of OPEB for the State.
Depreciation and amortization expense decreased 11.3% for the fiscal year ended June 30, 2014, compared to a 0.1% increase for 2013 over 2012. The decrease in 2014 compared to 2013 can be attributed to assets becoming fully depreciated during the year.
Total additions less total deductions resulted in a net increase in fiduciary net position of $1,297,255,075 in 2014, compared to an increase of $811,824,009 in 2013. The net result is a 12.6% increase in 2014 compared to an 8.5% increase in fiduciary net position restricted for pensions in 2013.
Requests for Information This Financial Report is designed to provide a general overview of the System’s finances. For questions concerning any information in this report, or for additional information contact the Louisiana State Employees’ Retirement System, Attention: Fiscal Division, P. O. Box 44213, Baton Rouge, LA 70804‐4213.

23Louisiana State Employees’ Retirement System
Financial Section
Louisiana State Employeesʹ Retirement SystemStatements of Fiduciary Net PositionJune 30, 2014 and 2013
2014 2013Assets Cash and Cash Equivalents 77,729,832$ 62,005,498$ Receivables: Employer Contributions 46,859,467 42,151,780 Member Contributions 11,490,580 12,926,450 Interest and Dividends 27,161,959 25,925,453 Investment Proceeds 23,064,105 22,041,039 Other 2,994,941 3,056,461 Total Receivables 111,571,052 106,101,183 Investments:Investments at Fair Value Short‐Term Investments ‐ Domestic/International 335,913,441 310,972,110 Bonds/Fixed Income ‐ Domestic 826,616,469 941,079,186 Bonds/Fixed Income ‐ International 323,150,997 313,875,045 Equity Securities ‐ Domestic 2,958,498,467 2,929,817,566 Equity Securities ‐ International 3,361,787,006 2,430,091,727 Global Tactical Asset Allocation 744,136,796 649,609,869 Alternative Investments 2,527,662,420 2,254,398,254 Total Investments at Fair Value 11,077,765,596 9,829,843,757 Investments at Contract Value Synthetic Guaranteed Investment Contract 428,631,386 399,100,872 Total Investments at Contract Value 428,631,386 399,100,872 Total Investments 11,506,396,982 10,228,944,629
Securities Lending Cash Collateral Held 1,107,047,506 963,415,924 Capital Assets (at cost) ‐ Net: Property and Equipment 4,307,615 3,998,553 Intangible Assets 820,061 2,375,276 Total Assets 12,807,873,048 11,366,841,063
Liabilities Payables: Investment Commitments 46,149,390 40,181,261 Trade Payables and Other Accrued Liabilities 27,096,486 27,575,565 Total Payables 73,245,876 67,756,826 Securities Lending Obligations 1,109,773,746 971,485,886 Total Liabilities 1,183,019,622 1,039,242,712
Net Position Restricted for Pensions 11,624,853,426$ 10,327,598,351$
The accompanying notes are an integral part of these statements.

24
Financial Section
Louisiana State Employeesʹ Retirement SystemStatements of Changes in Fiduciary Net Position
2014 2013AdditionsContributions:Employer Contributions 612,698,414$ 649,029,708$ Employee Contributions 152,993,052 173,357,802 Legislative Appropriation 2,465,608 ‐
Total Contributions 768,157,074 822,387,510 Investment Income:From Investment ActivitiesNet Appreciation in Fair Valueof Investments 1,237,417,957 740,570,895
Interest & Dividends 220,772,401 198,688,033 Alternative Investment Income 370,966,085 216,648,178 Less Alternative Investment Expenses (45,227,245) (33,397,818) Other Income 6,312,107 3,068,276 Less Investment Management Expenses (28,801,658) (26,634,914) Net Income from Investing Activities 1,761,439,647 1,098,942,650
From Securities Lending Activities Securities Lending Income 7,321,148 3,926,502
Borrower Rebates 2,566,422 2,792,054 Total Securities Lending Activities Income 9,887,570 6,718,556
Securities Lending ExpensesManagement Fees (805,836) (913,341) Total Securities Lending Activities Expenses (805,836) (913,341) Net Income from Securities Lending Activities 9,081,734 5,805,215 Total Net Investment Income 1,770,521,381 1,104,747,865
Other Income 20,810,679 33,806,894 Total Additions 2,559,489,134 1,960,942,269
Deductions Retirement Benefits 1,167,477,166 1,070,410,859 Refunds and Transfers of Member Contributions 77,118,765 61,522,162 Administrative Expenses 14,810,539 14,258,832 Other Postemployment Benefits Expenses 1,103,488 982,754 Depreciation and Amortization Expenses 1,724,101 1,943,653
Total Deductions 1,262,234,059 1,149,118,260
Net Increase in Net Position 1,297,255,075 811,824,009 Net Position Restricted for PensionsBeginning of Period 10,327,598,351 9,515,774,342
End of Period 11,624,853,426$ 10,327,598,351$
The accompanying notes are an integral part of these statements.
For the Period Ended June 30, 2014 and 2013

25Louisiana State Employees’ Retirement System
Financial Section
Notes to Financial Statements
A. Plan Description
1. General Organization
The Louisiana State Employeesʹ Retirement System (LASERS or the System) is the administrator of a cost‐sharing multi‐employer defined benefit pension plan2, and is a component unit of the State of Louisiana included in the Stateʹs Comprehensive Annual Financial Report (CAFR) as a pension trust fund. The System was established by Section 401 of Title 11 of the Louisiana Revised Statutes (La. R.S. 11:401).
In accordance with Louisiana Revised Statutes, the System is subject to certain elements of oversight:
The House and Senate Committees on Retirement review administration, benefits,
investments, and funding of the public retirement systems.
The operating budget of the System is subject to budgetary review and approval by the Joint Legislative Committee on the Budget.
The Legislative Auditor is responsible for the procurement of audits for the public retirement systems, and is authorized to contract with a licensed Certified Public Accountant (CPA) for each audit.
Actuarial calculations and results are reviewed by the Public Retirement Systems’ Actuarial Committee (PRSAC) annually.
A thirteen‐member Board of Trustees, comprised of six active members, three retired members and four ex‐officio members, governs the System. The Board administers the programs and appoints key management personnel including the Executive Director, Deputy Director, Assistant Director, and the Chief Investments Officer.
2. Plan Membership
The System is one of several public retirement systems in Louisiana. Each system has specific membership requirements established by legislation, with LASERS established for state officers, employees, and their beneficiaries. Other public employers report members who retained membership in LASERS upon transfer to other public systems or as provided by specific legislation. A summary of government employers and members participating in LASERS at June 30, 2014, and 2013, are as follows:
2 Due to a definitional change with the implementation of GASB 67, LASERS is now considered a cost-sharing multiple-employer plan for financial reporting purposes. Prior to the implementation of GASB 67, LASERS was considered a single-employer plan.
26
Financial Section
Type of EmployerActive
EmployersActive Members
Active Employers
Active Members
State Agencies 216 40,039 209 43,842 Other Public Employers 152 282 146 269 Total 368 40,321 355 44,111
2014 2013
Type of Active Members
2014 Member Count
2013 Member Count
Active After DROP 1,750 1,825 Alcohol and Tobacco Control* 16 19 Appellate Law Clerks* 160 172 Bridge Police* 7 7 Corrections* 2,620 2,949 Hazardous Duty 1,969 1,596 Judges 303 320 Legislators* 12 12 Peace Officers* 67 79 Regular State Employees 33,237 36,942 Wildlife Agents* 180 190 Total Active Members 40,321 44,111
* Plans closed to new members effective January 1, 2011.
At June 30, 2014, and 2013, membership consisted of:
2014 2013Active Members 40,321 44,111Regular Retirees* 38,675 37,145Disability Retirees* 2,506 2,554Survivors 5,759 5,726Vested & Reciprocals 4,558 4,162Inactive Members Due Refunds 52,042 52,385DROP Participants 1,838 2,092Total Membership 145,699 148,175
*For actuarial purposes “Disability Retirees” includes members who have reached normal retirement eligibility requirements and converted to Regular Retirement and are therefore counted by LASERS as “Regular Retirees”.

27Louisiana State Employees’ Retirement System
Financial Section
3. Net Pension Liability of Employers
The components of the net pension liability of the System’s employers determined in accordance with GASB No. 67 as of June 30, 2014 and 2013 were as follows:
2014 2013Total Pension Liability 17,877,744,945$ 17,612,223,257$ Plan Fiduciary Net Position 11,624,853,426 10,327,598,351 Employersʹ Net Pension Liability 6,252,891,519$ 7,284,624,906$
Plan Fiduciary Net Position as a Percentage of Total Pension Liability 65.0% 58.6%
Actuarial valuations involve estimates of the value of reported amounts and assumptions about the probability of events far into the future. Examples include assumptions about future employment mortality and future salary increases. Actuarially determined amounts regarding the net pension liability are subject to continual revision as actual results are compared to past expectations, and new estimates are made about the future. The last experience study was performed in 2013 and was based on the experience of the System for the period of July 1, 2008 through June 30, 2013. The required Schedules of Employers’ Net Pension Liability located in Required Supplementary Information following the Notes to the Financial Statements presents multi‐year trend information regarding whether the plan fiduciary net positions are increasing or decreasing over time relative to the total pension liability. The Total Pension Liability as of June 30, 2014 and 2013 is based on actuarial valuations for the same periods, updated using generally accepted actuarial procedures.
4. Actuarial Methods and Assumptions
A summary of the actuarial methods and assumptions used as of the June 30, 2014 and 2013, actuarial valuations are as follows:
Valuation Date June 30, 2014 and 2013 Actuarial Cost Method Entry Age Normal Actuarial Assumptions:
Investment Rate of Return
Inflation Rate
Mortality
7.75% per annum.
3.0% per annum.
Non‐disabled members ‐ Mortality rates based on the RP‐2000 Combined Healthy Mortality Table with mortality improvement projected to 2015.
Disabled members – Mortality rates based on the RP‐2000 Disabled Retiree Mortality Table, with no projection for mortality improvement.
Termination, Disability, and Retirement
Termination, disability, and retirement assumptions were projected based on a five‐year (2009‐2013) experience study of the Systemʹs members.
28
Financial Section
Salary Increases Salary increases were projected based on a 2009‐2013 experience study of the Systemʹs members. The salary increase ranges for specific types of members are:
Member Type Lower
Range Upper Range
Regular 4.0% 13.0%Judges 3.0% 5.5%Corrections Hazardous Duty Wildlife
3.6% 3.6% 3.6%
14.5%14.5%14.5%
The long‐term expected rate of return on pension plan investments was determined using a building‐block method in which best‐estimates ranges of expected future real rates of return (expected returns, net of pension plan investment expense and inflation) are developed for each major asset class. These ranges are combined to produce the long‐term expected rate of return by weighting the expected future real rates of return by the target asset allocation percentage and by adding expected inflation of 3.0% and an adjustment for the effect of rebalancing/diversification. The resulting expected long‐term rates of return are 8.78% for 2014 and 8.67% for 2013. Best estimates of geometric real rates of return for each major asset class included in the System’s target asset allocation as of June 30, 2014 and 2013 are summarized in the following table:
The discount rate used to measure the total pension liability was 7.75%. The projection of cash flows used to determine the discount rate assumed that contributions from plan members will be made at the current contribution rates and that contributions from participating employers will be made at the actuarially determined rates approved by PRSAC taking into consideration the recommendation of the System’s actuary. Based on those assumptions, the System’s fiduciary net position was projected to be available to make all projected future benefit payments of current plan members. Therefore, the long‐term expected rate of return on pension plan investments was applied to all periods of projected benefit payments to determine the total pension liability.
Asset Class 2014 2013Cash 0.50% ‐0.25%Domestic Equity 4.69% 4.95%International Equity 5.83% 5.86%Domestic Fixed Income 2.34% 1.65%International Fixed Income 4.00% 3.00%Alternative Investments 8.09% 7.98%Global Tactical Asset Allocation 3.42% 2.31%Total Fund 5.78% 5.67%
Expected Long Term Real Rates of Return

29Louisiana State Employees’ Retirement System
Financial Section
In accordance with GASB 67, regarding the disclosure of the sensitivity of the net pension liability to changes in the discount rate, the following presents the net pension liability of the participating employers calculated using the discount rate of 7.75%, as well as what the employers’ net pension liability would be if it were calculated using a discount rate that is one percentage point lower or one percentage point higher than the current rate.
5. Legally Required Reserves
Provisions for reserves, in which all assets of the System are to be credited according to their purpose, are established in La. R.S. 11:531, et. seq. Use of the term ʺreserveʺ by the System indicates that a portion of the fund balances is legally restricted for a specific future use. The nature and purpose of these reserves are explained below:
A) Expense Account Reserve:
The Expense Account Reserve provides for general and administrative expenses of the System and those expenses not funded through other specific legislative appropriations. Funding consists of transfers from the retirement funds and is made as needed. Any excess funds at year‐end are closed out to the Employers’ Accumulation Account.
B) Employees’ Savings Reserve:
The Employees’ Savings Reserve is credited with contributions made by members of the System. When a member terminates his service, or upon his death before qualifying for a benefit, the refund of his contributions is made from this reserve. If a member dies and there is a survivor who is eligible for a benefit, the amount of the memberʹs accumulated contributions is transferred from the Employees’ Savings Account Reserve to the Retiree’s Annuity Reserve. When a member retires, the amount of his accumulated contributions is transferred to the Retiree’s Annuity Reserve to provide part of the benefits.
C) Employers’ Accumulation Account:
The Employers’ Accumulation Account consists of contributions paid by employers, interest paid by the agency on purchases of state service, military service, and educational leave and training; interest, dividends, profits and other income earned on investments, and any other income not covered by other accounts. This reserve account is charged annually with an amount, determined by the actuary, to be transferred to the Retiree’s Annuity Reserve to fund retirement benefits and cost of living increases for existing retirees.
1% Decrease (6.75%)
Current Discount Rate
(7.75%) 1% Increase (8.75%)
2013 Employer Net Pension Liability 9,060,540,966$ 7,284,624,906$ 5,779,347,023$ 2014 Employer Net Pension Liability 8,019,840,047$ 6,252,891,519$ 4,755,150,938$
Changes in Discount Rate

30
Financial Section
D) Retiree’s Annuity Reserve:
The Retiree’s Annuity Reserve is credited with the employees’ accumulated contributions upon retirement or payment of survivor’s benefits, amount determined by actuary from the Employers’ Accumulated Account for payment of pensions, and cost of living increases for retirees. The Retiree’s Annuity Reserve shall be charged with retirements paid to retirees and beneficiaries, survivor’s benefits paid to eligible survivors, cost of living adjustments for retirees, beneficiaries, and survivor’s benefits recipients in addition to refunds paid to survivors or the estates of members whereby monthly benefits do not equal total accumulated contributions.
E) Deferred Retirement Option and Initial Benefit Option (DROP/IBO) Reserve:
The Deferred Retirement Option and Initial Benefit Option Reserve consist of the reserves for all members who select the Deferred Retirement Option or Initial Benefit Option upon retirement. For DROP, upon eligibility for retirement a member may elect to deposit in this reserve an amount equal to the member’s monthly benefit if he had retired. A member can only participate in DROP for three years and upon termination may receive his benefits in a lump sum payment or in a manner approved by the Board. For IBO, upon retirement a member elects to take a lump sum benefit payment of up to 36 months times the maximum benefit up front and subsequently receive a reduced monthly benefit.
F) Optional Retirement Plan (ORP) Reserve:
The ORP Reserve consists of reserves for certain active unclassified members who otherwise would be eligible to become members in the Defined Benefit Plan who chose to participate in the defined contribution Optional Retirement Plan. The member is credited with contributions made by the employee and the normal employer matching contributions for services rendered. When a member terminates his service, or upon his death before qualifying for a benefit, the refund of his contributions is made from this reserve. Also, when a member retires, his benefits are paid from this reserve.
G) Experience Account Reserve:
The Experience Account Reserve is used to fund permanent benefit increases for retirees. The benefit increase granted must be funded at 100% of the actuarial cost. At June 30, 2013, the account accumulated 50% of the excess investment gain relative to the actuarial valuation rate of 8.0% after such excess return exceeded $100,000,000, and the account balance was restricted to the reserve for two permanent benefit increases.
Effective June 30, 2014, if the System is at least 80% funded, the balance of the Experience Account maintains a reserve for two permanent benefit increases. However, if the System is less than 80% funded, the reserve is restricted to one permanent benefit increase, based on the current allowable percentage granted for the permanent benefit increase. Excess investment gains that would have otherwise gone to the Experience Account, if not for the restrictions, will be applied to the System’s net pension liability. Beginning June 30, 2019, allocations to the Experience Account will be amortized over ten years.

31Louisiana State Employees’ Retirement System
Financial Section
2014 2013Reserves Balance Balance
Expense Account Reserve ‐$ ‐$ Employeesʹ Savings Reserve 1,516,295,183 1,577,976,578 Employerʹs Accumulation Reserve 3,794,002,074 3,026,411,880 Retireesʹ Annuity Reserve 11,579,249,002 10,633,738,577 DROP/IBO Reserve 981,748,480 938,035,164 ORP Reserve 6,450,206 6,032,442 Experience Account Reserve 117,093,356 195,623,963 Total Reserves 17,994,838,301$ 16,377,818,604$
6. Eligibility Requirements
All state employees, except those specifically excluded by statute, become members of the System’s Defined Benefit Plan (DBP) as a condition of employment, unless they elect to continue as a contributing member in any other retirement system for which they remain eligible for membership. Certain elected officials and officials appointed by the Governor may, at their option, become members of LASERS. Also, qualifying unclassified state employees may have made an irrevocable election to participate in the Optional Retirement Plan (ORP) between July 12, 1999 and December 7, 2007, when the plan closed. All plans are considered one pension plan for financial reporting purposes. All assets accumulated for the payment of benefits may legally be used to pay benefits to any plan members or beneficiaries.
7. Retirement
The age and years of creditable service required in order for a member to retire with full benefits are established by statute, and vary depending on the memberʹs hire date, employer, and job classification. The substantial majority of members may retire with full benefits at any age upon completing 30 years of creditable service and at age 60 upon completing ten years of creditable service. Additionally, members may choose to retire with 20 years of service at any age, with an actuarially reduced benefit. The basic annual retirement benefit for members is equal to 2.5% to 3.5% of average compensation multiplied by the number of years of creditable service.
Average compensation is defined as the memberʹs average annual earned compensation for the highest 36 consecutive months of employment for members employed prior to July 1, 2006. For members hired July 1, 2006 or later, average compensation is based on the member’s average annual earned compensation for the highest 60 consecutive months of employment. The maximum annual retirement benefit cannot exceed the lesser of 100% of average compensation or a certain specified dollar amount of actuarially determined monetary limits, which vary depending upon the memberʹs age at retirement. Judges, court officers, and certain elected officials receive an additional annual retirement benefit equal to 1.0% of average compensation multiplied by the number of years of creditable service in their respective capacity. As an alternative to the basic retirement benefits, a member may elect to receive their retirement benefits under any one of six different options providing for reduced retirement benefits payable throughout their life, with certain benefits being paid to their designated beneficiary after their death.

32
Financial Section
Act 992 of the 2010 Louisiana Regular Legislative Session, changed the benefit structure for LASERS members hired on or after January 1, 2011. This resulted in three new plans: regular, hazardous duty, and judges. The new regular plan includes regular members and those members who were formerly eligible to participate in specialty plans, excluding hazardous duty and judges. Regular members and judges are eligible to retire at age 60 after five years of creditable service and, may also retire at any age, with a reduced benefit, after 20 years of creditable service. Hazardous duty members are eligible to retire with twelve years of creditable service at age 55, 25 years of creditable service at any age or with a reduced benefit after 20 years of creditable service. Average compensation will be based on the member’s average annual earned compensation for the highest 60 consecutive months of employment for all three new plans. Members in the regular plan will receive a 2.5% accrual rate, hazardous duty plan a 3.33% accrual rate, and judges a 3.5% accrual rate. The extra 1.0% accrual rate for each year of service for court officers, the governor, lieutenant governor, legislators, House clerk, sergeants at arms, or Senate secretary, employed after January 1, 2011, was eliminated by Act 992. Specialty plan and regular members, hired prior to January 1, 2011, who are hazardous duty employees have the option to transition to the new hazardous duty plan.
A member leaving employment before attaining minimum retirement age, but after completing certain minimum service requirements, becomes eligible for a benefit provided the member lives to the minimum service retirement age, and does not withdraw their accumulated contributions. The minimum service requirement for benefits varies depending upon the memberʹs employer and service classification but generally is ten years of service.
8. Deferred Benefits
The State Legislature authorized LASERS to establish a Deferred Retirement Option Plan (DROP). When a member enters DROP, their status changes from active member to retiree even though they continue to work and draw their salary for a period of up to three years. The election is irrevocable once participation begins. During DROP participation, accumulated retirement benefits that would have been paid to each retiree are separately tracked. For members who entered DROP prior to January 1, 2004, interest at a rate of one‐half percent less than the Systemʹs realized return on its portfolio (not to be less than zero) will be credited to the retiree after participation ends. At that time, the member must choose among available alternatives for the distribution of benefits that have accumulated in the DROP account. Members who enter DROP on or after January 1, 2004, are required to participate in LASERS Self‐Directed Plan (SDP) which is administered by a third‐party provider. The SDP allows DROP participants to choose from a menu of investment options for the allocation of their DROP balances. Participants may diversify their investments by choosing from an approved list of mutual funds with different holdings, management styles, and risk factors.
Members eligible to retire and who do not choose to participate in DROP may elect to receive at the time of retirement an initial benefit option (IBO) in an amount up to 36 months of benefits, with an actuarial reduction of their future benefits. For members who selected the IBO option prior to January 1, 2004, such amount may be withdrawn or remain in the IBO account earning interest at a rate of one‐half percent less than the System’s realized return on its portfolio (not to be less than zero). Those members who select the IBO on or after January 1, 2004, are required to enter the SDP as described above.

33Louisiana State Employees’ Retirement System
Financial Section
9. Disability Benefits
All members with ten or more years of credited service who become disabled may receive a maximum disability retirement benefit equivalent to the regular retirement formula without reduction by reason of age.
Upon reaching age 60, the disability retiree may receive a regular retirement benefit by making application to the Board of Trustees.
For injuries sustained in the line of duty, hazardous duty personnel in the Hazardous Duty Services Plan will receive a disability benefit equal to 75% of final average compensation.
10. Survivorʹs Benefits
Certain eligible surviving dependents receive benefits based on the deceased memberʹs compensation and their relationship to the deceased. The deceased member who was in state service at the time of death must have a minimum of five years of service credit, at least two of which were earned immediately prior to death, or who had a minimum of twenty years of service credit regardless of when earned in order for a benefit to be paid to a minor or handicapped child. Benefits are payable to an unmarried child until age 18, or age 23 if the child remains a full‐time student. The aforementioned minimum service credit requirement is ten years for a surviving spouse with no minor children, and benefits are to be paid for life to the spouse or qualified handicapped child.
11. Permanent Benefit Increases/Cost‐of‐Living Adjustments
As fully described in Title 11 of the Louisiana Revised Statutes, the System allows for the payment of permanent benefit increases, also known as cost‐of‐living adjustments (COLAs), that are funded through investment earnings when recommended by the Board of Trustees and approved by the State Legislature.
12. Optional Retirement Plan
In 1999, an Optional Retirement Plan (ORP) was established as a defined contribution component of LASERS for certain unclassified employees who otherwise would have been eligible to become members of the defined benefit plan. The ORP provides portability of assets and full and immediate vesting of all contributions submitted on behalf of members. The ORP is administered by a third‐party provider with oversight from LASERS Board of Trustees. Monthly employer and employee contributions are invested as directed by the member to provide the member with future retirement benefits. The amount of these benefits is entirely dependent upon the total contributions and investment returns accumulated during the member’s working lifetime. ORP balances are held by the provider in each participant’s name. These balances are included in LASERS total investments on the Statements of Fiduciary Net Position. The ORP was closed to new members on December 7, 2007. However, members in the ORP as of December 31, 2007 were granted the option by Act 718 of the 2012 Louisiana Regular Legislative Session to regain membership in the defined benefit plan. At June 30, 2014, and 2013, membership consisted of:
2014 2013
Number of Members 73 83
Fair Value of Assets 6,450,206$ 6,032,442$

34
Financial Section B. Summary of Significant Accounting Policies
1. Basis of Accounting
LASERS financial statements are prepared in conformity with accounting principles generally accepted in the United States of America using the accrual basis of accounting. Revenues are recognized in the accounting period in which they are earned, and expenses are recognized in the period incurred. Investment purchases and sales are recorded as of their trade date. State General Fund appropriations are recognized in the period when they are appropriated. Employer and member contributions are recognized when due, pursuant to formal commitments, as well as statutory or contractual requirements. Administrative expenses are funded through contributions to the plan from members, the State of Louisiana, and cumulative investment earnings, and are subject to budgetary control of the Board of Trustees and the Joint Legislative Committee on the Budget. Benefits and refunds are recognized when due and payable in accordance with the terms of the System.
2. Securities Lending
The System records collateral received under its securities lending agreement where the System has the ability to spend, pledge, or sell the collateral without borrower default. Liabilities resulting from these transactions are also reported. The security lending cash collateral pools are reported at the market value of the underlying securities. Security lending income and expenses are reported as investment income and expenses in the accompanying financial statements. The Statements of Fiduciary Net Position do not include detailed holdings of securities lending collateral by investment classification.
3. Estimates
The preparation of financial statements in conformity with accounting principles generally accepted in the United States of America requires management to make estimates and assumptions that affect the reported amounts of assets and liabilities and disclosure of contingent assets and liabilities at the date of the financial statements, and the reported amounts of additions to and deductions from fiduciary net position during the reporting period. Actual results could differ from those estimates. The retirement system utilizes various investment instruments, which, by nature, are exposed to a variety of risk levels and risk types, such as interest rate, credit, and overall market volatility. Due to the level of risk associated with certain investment securities, it is reasonably possible that changes in the values of investment securities will occur in the near term, and those changes could materially affect the amounts reported in the Statements of Fiduciary Net Position.
4. Method Used to Value Investments
As required by GASB 67, investments are reported at fair value. Short‐term investments are reported at market value when published prices are available, or at cost, which approximates fair value. Securities traded on a national or international exchange are valued at the last reported sales price at the current exchange rate. All derivative financial instruments are reported at fair value in the Statements of Fiduciary Net Position with valuation changes recognized in income. Gains and losses are reported in the Statements of Changes in Fiduciary Net

35Louisiana State Employees’ Retirement System
Financial Section
Position as net appreciation (depreciation) in fair value of investments during the period the instruments are held, and when the instruments are sold or expire. The nature and use of derivative instruments is discussed in Note E. Cash and Investments (9). The fair value of investments that are organized as limited partnerships and have no readily ascertainable fair value (such as private equity, real estate, and tangible assets) has been recorded based on the investment’s capital account balance which is reported at fair value, at the closest available reporting period, adjusted for subsequent contributions, distributions, and management fees. Because of the inherent uncertainties in estimating fair values, it is at least reasonably possible that the estimates will change in the near term. Investments that do not have an established market are reported at estimated fair value. Unrealized gains and losses are included as investment earnings in the Statements of Changes in Fiduciary Net Position. Synthetic Guaranteed Investment Contracts are carried at contract value as required by GASB 53.
5. New Accounting Pronouncements
GASB Statement No. 67 which was adopted during the year ended June 30, 2014, addresses accounting and financial reporting requirements for pension plans. The requirements for GASB No. 67 required changes in presentation of the financial statements, notes to the financial statements, and required supplementary information. Significant changes include an actuarial calculation of total and net pension liability. It also includes comprehensive footnote disclosure regarding the pension liability, the sensitivity of the net pension liability to the discount rate, and increased investment activity disclosures.
6. Property and Equipment
Property and equipment and computer software are reported at historical cost. Depreciation is computed using the straight‐line method based upon useful lives of 40 years for building, 3 to 15 years for equipment and furniture, and 7 years for computer software. The capitalization thresholds of property and equipment were:
Computer Software Developed or Modified Internally (reported as Intangible Assets): $1,000,000
Movable Property and Equipment: $5,000
LASERS is a 50% co‐owner of the Louisiana Retirement Systems Building and related land with Teachersʹ Retirement System of Louisiana. LASERS interest in the building and land is reflected in the following schedules.

36
Financial Section
June 30, 2013 AdditionsDeletions/ Transfers June 30, 2014
Asset Class (at Cost)Land 858,390$ ‐$ ‐$ 858,390$ Building 5,945,285 225,325 ‐ 6,170,610 Furniture, Equipment, and Vehicles 2,768,732 247,169 (354,242) 2,661,659 Intangibles 10,886,502 ‐ ‐ 10,886,502 Total Property and Equipment 20,458,909 472,494 (354,242) 20,577,161
Accumulated DepreciationBuilding (3,363,885) (231,054) ‐ (3,594,939) Furniture, Equipment, and Vehicles (2,209,969) 67,622 354,242 (1,788,105) Intangibles (8,511,226) (1,555,215) ‐ (10,066,441) Total Accumulated Depreciation (14,085,080) (1,718,647) 354,242 (15,449,485) Total Property and Equipment ‐ Net 6,373,829$ (1,246,153)$ ‐$ 5,127,676$
June 30, 2012 AdditionsDeletions/ Transfers June 30, 2013
Asset Class (at Cost)Land 858,390$ ‐$ ‐$ 858,390$ Building 5,936,927 8,358 ‐ 5,945,285 Furniture, Equipment, and Vehicles 3,147,077 301,106 (679,451) 2,768,732 Intangibles 10,886,502 ‐ ‐ 10,886,502 Total Property and Equipment 20,828,896 309,464 (679,451) 20,458,909
Accumulated DepreciationBuilding (3,171,993) (191,892) ‐ (3,363,885) Furniture, Equipment, and Vehicles (2,594,632) (294,788) 679,451 (2,209,969) Intangibles (6,956,012) (1,555,214) ‐ (8,511,226) Total Accumulated Depreciation (12,722,637) (2,041,894) 679,451 (14,085,080) Total Property and Equipment ‐ Net 8,106,259$ (1,732,430)$ ‐$ 6,373,829$
Changes in Property and EquipmentFor Period Ending June 30, 2014
Changes in Property and EquipmentFor Period Ending June 30, 2013

37Louisiana State Employees’ Retirement System
Financial Section
7. Accumulated Leave
The employees of the System accumulate unlimited amounts of annual and sick leave at varying rates as established by state regulations. Upon resignation or retirement, unused annual leave of up to 300 hours is paid to an employee at the employee’s current rate of pay. Upon retirement, unused annual leave in excess of 300 hours and sick leave are credited at the current pay rate as earned service in computing retirement benefits. The liability for accrued annual leave of up to 300 hours is included in other liabilities in the Statements of Fiduciary Net Position.
8. Reclassifications
Certain prior year amounts have been reclassified to conform to current year presentation. These reclassifications had no effect on the net position restricted for pensions or the net change in fiduciary net position.
C. Contributions
1. Member Contributions
Member contribution rates for the System are established by La. R.S. 11:62. Member contributions are deducted from a member’s salary and remitted to the System by participating employers. The rates in effect during the years ended June 30, 2014, and 2013, for the various plans as follows:
Plan Plan Status
Contribution Rate
Regular Employees and Appellate Law Clerks Pre Act 75 (hired before 7/1/2006) Closed 7.5% Post Act 75 (hired after 6/30/2006) Open 8.0%Legislators Closed 11.5%Special Legislative Employees Closed 9.5%Judges hired before 1/1/2011 Closed 11.5%Judges hired after 12/31/2010 Open 13.0%Corrections Primary and Secondary Closed 9.0%Wildlife Agents Closed 9.5%Peace Officers/Alcohol Tobacco Control Closed 9.0%Bridge Police Closed 8.5%Hazardous Duty Open 9.5%
If a member leaves covered employment or dies before any benefits become payable on their behalf, the accumulated contributions may be refunded to the member or their designated beneficiary. Similarly, accumulated contributions in excess of any benefits paid to members or their survivors are refunded to the memberʹs beneficiaries or their estates upon cessation of any survivorʹs benefits.

38
Financial Section
2. Employer Contributions
The employer contribution rate is established annually under La. R.S. 11:101‐11:104 by the Public Retirement Systems’ Actuarial Committee (PRSAC), taking into consideration the recommendation of the System’s Actuary. Each plan pays a separate actuarially‐determined employer contribution rate. However, all assets of LASERS are used for the payment of benefits for all classes of members, regardless of their plan membership. Rates for the years ended June 30, 2014, and 2013, are as follows:
Plan 2014 2013Alcohol and Tobacco Control 34.2% 30.1%Appelate Law Clerks 31.3% 29.1%Bridge Police 31.2% 28.1%Corrections ‐ Primary 34.6% 34.0%Corrections ‐ Secondary 34.3% 30.8%Hazardous Duty Plan 30.7% 28.0%Judges 36.3% 34.8%Judges (Elected after 1/1/2011) 31.3% 28.2%Legislators 35.0% 37.8%Peace Officers 34.8% 32.8%Regular State Employees 31.3% 29.1%Wildlife Agents 40.7% 36.9%Aggregate Rate 31.7% 29.4%
D.Deposits and Investment Risk Disclosures
The information presented on the following pages includes disclosures of custodial, interest rate, credit, and foreign currency risks in accordance with GASB 40, 53, and 67 and is designed to inform financial statement users about investment risks that could affect the System’s ability to meet its obligations. The tables presented classify investments by risk type, while the financial statements present investments by asset class; thus, the totals shown on the tables may not be comparable to the amounts shown for the individual asset classes on the financial statements.

39Louisiana State Employees’ Retirement System
Financial Section
1. Custodial Credit Risk
Custodial credit risk for deposits is the risk that, in the event of bank failure, the System’s deposits may not be returned. The System does not have a formal deposit policy for custodial credit risk. All U.S. bank balances at year‐end were insured or collateralized by the pledge of government securities held by the agents in the entity’s name. LASERS had time deposits and certificates of deposits in the securities lending cash collateral pool that were exposed to custodial credit risk of $355.2 million and $227.0 million as of June 30, 2014 and June 30, 2013. LASERS had uninsured cash deposits in non‐U.S. banks of $17.5 million and $7.5 million for the periods ended June 30, 2014, and June 30, 2013, respectively. These deposits were used for investments pending settlement.
Custodial credit risk for investments is the risk that, in the event of the failure of the counterparty, the pension trust fund will not be able to recover the value of its investments, or collateral securities that are in the possession of an outside party. Investment securities are exposed to custodial credit risk if the securities are uninsured, are not registered in the name of the government, and are held by either: a) the counterparty or b) the counterparty’s trust department or agent but not in the government’s name. LASERS had no custodial credit risk for investments for the years ending June 30, 2014 and June 30, 2013.
2. Concentration of Credit Risk
Concentration of credit risk is the “risk of loss attributed to the magnitude of investments in a single issuer.” The risk occurs “when investments are concentrated in any one issuer that represents 5% or more of plan net assets.” Investments issued or explicitly guaranteed by the U.S. Government and investments in mutual funds, external investment pools, and other pooled investments are excluded from this requirement. The System has no investments of any single organization (other than those issued or guaranteed by the U.S. Government) that represent 5% or more of the Systemʹs net plan assets, nor does the System hold more than 5% of any corporationʹs stock.
3. Credit Risk
Credit risk is the risk that a borrower will be unable to meet its obligation. The overall average quality of each core fixed income portfolio shall be rated A‐ or higher by Standard and Poor’s. Non‐rated issues or issues below investment grade (below BBB‐) may be purchased up to a maximum of 15% of each core fixed income portfolio. These quality restrictions will not apply to a manager that is hired by LASERS to manage dedicated high‐yield fixed income portfolios. The average duration shall not differ from the passive benchmark’s duration by more than two years.
In preparing this report, credit risk associated with all fixed income holdings including collateral for repurchase agreements and securities lending collateral has been included. The System’s exposure to credit risk as of June 30, 2014, and 2013, is as follows:

40
Financial Section
4. Interest Rate Risk
Interest rate risk is the risk from changes in interest rates adversely affecting the fair value of an investment. LASERS has no formal interest rate risk policy. LASERS, as expressed in its Investment Policy, expects its fixed income managers to approximate the portfolio’s duration (a measure of a debt investment’s exposure to fair value changes arising from interest rates) to within two years of its respective benchmark. Investments with fair values that are highly sensitive to interest rate changes may contain terms that increase the sensitivity of their fair values.
As of June 30, 2014, and 2013, the System had the following domestic and foreign debt investments and maturities:
Fair Value Percent Fair Value Percent Rating 2014 2014 2013 2013
AAA 22,731,435$ 0.9% 30,824,959$ 1.2%A‐1+ 181,381,535 7.0% 173,365,229 6.8%A‐1 441,916,462 17.0% 310,148,253 12.4%AA+ 271,468,803 10.5% 209,724,926 8.4%AA 5,920,981 0.2% 6,297,305 0.2%AA‐ 189,602,888 7.3% 167,465,486 6.6%A+ 98,292,601 3.8% 142,607,178 5.6%A 110,393,837 4.2% 50,546,927 2.0%A‐ 28,632,981 1.1% 86,120,614 3.4%BBB+ 52,229,581 2.0% 38,051,448 1.5%BBB 55,024,774 2.1% 45,523,617 1.8%BBB‐ 41,430,830 1.6% 52,346,025 2.1%BB+ 48,801,096 1.9% 38,392,010 1.5%BB 70,263,499 2.7% 58,329,610 2.3%BB‐ 64,062,996 2.5% 71,934,308 2.8%B+ 56,004,505 2.2% 73,735,309 2.9%B 69,934,522 2.7% 78,772,588 3.1%B‐ 77,728,084 3.0% 75,307,151 3.0%CCC+ 56,916,926 2.2% 60,377,279 2.4%CCC 32,687,066 1.3% 57,589,143 2.2%CCC‐ 7,141,262 0.3% 4,683,855 0.2%CC 2,678,780 0.1% 17,377,051 0.7%C ‐ 0.0% 299,250 0.0%D 68,919,490 2.6% 104,354,596 4.1%Non‐rated 538,563,479 20.8% 575,168,148 22.8%Total Fixed Income 2,592,728,413$ 100.0% 2,529,342,265$ 100.0%

41Louisiana State Employees’ Retirement System
Financial Section
Fair Value Less Greater Type 2014 Than 1 1 ‐ 5 5 ‐ 10 Than 10
U.S. Government Obligations $ 122,891,662 $ 96,633,328 $ 18,674,821 $ 5,043,347 $ 2,540,166 U.S. Agency Obligations 74,727,381 349 704,618 588,479 73,433,935 Mortgages 183,230,548 ‐ ‐ 7,898,211 175,332,337 Corporate Bonds 591,851,881 57,396,028 172,335,696 294,958,254 67,161,903 International Bonds 591,780,761 251,930,337 137,602,535 161,830,660 40,417,229 Commercial Paper and Other Short‐term Investments 352,768,638 352,768,638 ‐ ‐ ‐
International Commercial Paper and Other Short‐term Investments
671,317,913 671,317,913 ‐ ‐ ‐
Bond Mutual Funds 4,159,629 4,159,629 ‐ ‐ ‐
Total Debt Investments $ 2,592,728,413 $ 1,434,206,222 $ 329,317,670 $ 470,318,951 $ 358,885,570
Fair Value Less Greater Type 2013 Than 1 1 ‐ 5 5 ‐ 10 Than 10
U.S. Government Obligations $ 29,534,959 $ 13,676 $ 17,544 $ 4,919,989 $ 24,583,750 U.S. Agency Obligations 73,530,989 15,129,745 1,658,804 963,412 55,779,028 Mortgages 230,892,120 ‐ ‐ 11,608,057 219,284,063 Corporate Bonds 710,895,824 71,030,276 225,799,402 325,758,731 88,307,415 International Bonds 566,297,190 245,510,794 141,535,123 144,410,541 34,840,732 Commercial Paper and Other Short‐term Investments 450,126,695 450,126,695 ‐ ‐ ‐ International Commercial Paper and Other Short‐term Investments
463,105,208 463,105,208 ‐ ‐ ‐
Bond Mutual Funds 4,959,280 4,959,280 ‐ ‐ ‐
Total Debt Investments $ 2,529,342,265 $ 1,249,875,674 $ 369,010,873 $ 487,660,730 $ 422,794,988
Investment Maturities (in Years)
Investment Maturities (in Years)
42
Financial Section
5. Foreign Currency Risk
Foreign currency risk is the potential risk for loss due to changes in exchange rates. Cash held by the manager may be in U.S. dollar or foreign currencies of the manager’s choice. Managers may purchase or sell currency on a spot basis to accommodate securities settlements. Managers may enter into forward exchange contracts on currency provided that use of such contracts is designed to dampen portfolio volatility or to facilitate the settlement of securities transactions. Currency contracts may be utilized to either hedge the portfolio’s currency risk exposure or in the settlement of securities transactions.
Foreign investments denominated in U.S. currency such as American Depository Receipts (ADRs) and Yankee bonds do not carry foreign currency risk; therefore, are not included in the tables below. LASERS portfolio contained several commingled funds subject to foreign currency risk with aggregate fair values of $1,058.8 million and $896.2 million for the years ended June 30, 2014 and June 30, 2013, respectively. LASERS Investment Guidelines, some of which are noted in Note E. Cash and Investments, are designed to mitigate risk.
The fair value of LASERS securities including derivative instruments held in a foreign currency at June 30, 2014, and 2013, is as follows:

43Louisiana State Employees’ Retirement System
Financial SectionCurrency
Fair Value
Currency
Global Bonds
Global Stock
Cash/Other
Private Equity
Contracts
2014
Austra
lian Dollar
‐$
121,697,566
$
228,999
$
‐$
(9,237,552)
$
112,689,013
$
Brazilian Real
17,775,437
20,183,413
480,511
80,430
38,519,791
British Pou
nd Sterling
395,621,152
960,361
241,977
396,823,490
Canadian Dollar
146,550,522
1,228,206
147,778,728
Chile
an Peso
3,330,861
94,604
226,866
3,652,331
Colombian Peso
10,328,290
5,207,426
274,281
1,968,335
17,778,332
Czech Ko
runa
3,627,322
61,432
3,688,754
Danish Krone
25,453,153
378,232
25,831,385
Euro
7,044,866
587,905,177
4,021,829
80,307,256
679,279,128
Hon
g Ko
ng Dollar
87,443,618
1,680,170
196,245
89,320,033
Hun
garia
n Fo
rint
1,678,400
2,450,190
84,848
1,225,619
5,439,057
Indo
nesia
n Ru
piah
17,617,970
593,694
14,495
869,496
19,095,655
Israeli S
hekel
5,989,644
268,977
6,258,621
Japa
nese Yen
316,482,391
2,475,497
318,957,888
South Ko
rean W
on34,450,523
658,527
35,109,050
Malaysia
n Ring
git
18,526,060
12,431,479
382,416
2,300,718
33,640,673
Mexican Peso
32,329,931
5,996,838
260,189
38,586,958
New Taiwan Dollar
28,020,169
7 9,975
28,100,144
New Zealand Dollar
8,110,969
114,656
(3,320,185)
4,905,440
Nigerian Naira
1,722,002
1,722,002
Norwegian Kr
one
11,857,330
168,296
12,025,626
Philipp
ines Peso
1,712,099
1,203,884
24,130
1,471,398
4,411,511
Polish Zloty
20,998,209
6,733,237
27,731,446
Romanian Le
u3,563,123
3,563,123
Russian Ru
ble
13,781,176
146,006
13,927,182
Sing
apore D
ollar
65,840,882
611,140
108,949
66,560,971
South African Ra
nd13,510,850
31,016,636
264,989
44,792,475
Swed
ish Krona
43,052,873
977,949
44,030,822
Swiss Franc
152,429,009
1,662,125
154,091,134
Thailand Bah
t3,982,697
6,766,618
10,749,315
Turkish Lira
18,647,652
5,398,619
62,718
24,108,989
Total
181,496,760
$
2,135,845,195
$
17,519,552
$
80,307,256
$
(1,999,696)
$
2,413,169,067
$

44
Financial SectionCurrency
Fair Value
Currency
Global Bonds
Global Stock
Cash/Other
Private Equity
Contracts
2013
Austra
lian Dollar
‐$
95,607,617
$
7,878
$
‐$
(10,384,026)
$
85,231,469
$
Brazilian Real
21,979,354
‐
4,265
‐
160,110
22,143,729
British Pou
nd Sterling
‐
300,879,768
880,201
‐
‐
301,759,969
Canadian Dollar
‐
106,565,379
235,650
‐
74,877
106,875,906
Chile
an Peso
238,959
‐
‐
‐
‐
238,959
Colombian Peso
7,242,914
‐
‐
‐
(532,473)
6,710,441
Dan
ish Krone
‐
15,199,855
196,992
‐
‐
15,396,847
Euro
8,945,799
396,954,139
16,197,127
63,596,309
(261,536)
485,431,838
Hon
g Ko
ng Dollar
‐
39,654,323
290,833
‐
‐
39,945,156
Hun
garia
n Fo
rint
7,331,837
‐
‐
‐
‐
7,331,837
Indo
nesia
n Ru
piah
14,282,669
‐
‐
‐
‐
14,282,669
Israeli S
hekel
‐
4,733,248
131,388
‐
‐
4,864,636
Japa
nese Yen
‐
266,962,407
2,524,300
‐
(574,169)
268,912,538
Malaysia
n Ring
git
15,848,144
‐
‐
‐
‐
15,848,144
Mexican Peso
29,526,028
‐
206,262
‐
‐
29,732,290
New Taiwan Dollar
‐
303,407
9,856
‐
‐
313,263
Turkish Lira
17,266,646
‐
‐
‐
1,458
17,268,104
New Zealand Dollar
‐
4,862,536
74,202
‐
(2,470,503)
2,466,235
Nigerian Naira
616,348
‐
2,002,909
‐
‐
2,619,257
Norwegian Kr
one
‐
8,032,381
272,124
‐
‐
8,304,505
Peruvian Sol
79,980
‐
‐
‐
849,250
929,230
Philipp
ines Peso
1,689,893
‐
‐
‐
‐
1,689,893
Polish Zloty
15,142,383
‐
‐
‐
‐
15,142,383
Romanian Le
u‐
‐
‐
‐
913,891
913,891
Russian Ru
ble
16,342,196
‐
‐
‐
‐
16,342,196
Sing
apore Dollar
‐
48,037,430
244,288
‐
‐
48,281,718
South African Rand
17,715,857
‐
960
‐
‐
17,716,817
Swed
ish Krona
‐
31,611,364
157,147
‐
‐
31,768,511
Swiss Franc
‐
109,126,038
191,368
‐
‐
109,317,406
Thailand Baht
10,702,941
‐
‐
‐
‐
10,702,941
Total
184,951,948
$
1,428,529,892
$
23,627,750
$
63,596,309
$
(12,223,121)
$
1,688,482,778
$

45Louisiana State Employees’ Retirement System
Financial Section
E. Cash and Investments 1. Cash and Cash Equivalents
Cash and cash equivalents include cash deposited in banks. Cash is insured by the Federal Deposit Insurance Corporation up to $250,000, and cash equivalents are collateralized by the pledge of government securities held by the agents in LASERS name.
2. Short‐Term Investments
Short–term reserves may be held in U.S. dollar or global denominated investment vehicles available through the System’s custodian. These funds may be invested in direct U.S. Government obligations such as U.S. Treasury Bills or repurchase agreements, which are fully collateralized by issues of the U.S. Treasury or any agency of the United States Government. Repurchase agreement transactions as of June 30, 2014 and 2013 have underlying collateral with fair values of approximately 102% of the cost of the repurchase agreement. The agreed‐upon yields for the repurchase agreements were 25 basis points with maturity dates through July 1, 2014. LASERS had repurchase agreements with fair values of $79,796,094 as of June 30, 2014 and $61,001,405 as of June 30, 2013. Excess cash may also be invested in the negotiable certificates of deposit, global time deposits, global currency, or other short‐term investment vehicles designated by the Board.
3. Investments
Louisiana state law (La. R.S. 11:261‐269) provides for the fiduciary and investment responsibilities of LASERS. La. R.S. 11:263 states that the prudent man rule shall apply to all investments of LASERS. This law specifically requires management of LASERS to exercise the judgment and care under the circumstances prevailing that a prudent institutional investor would use in the conduct of an enterprise of a like character with like aims.
A) Investment Policy
The System’s policy in regard to the allocation of invested assets is established and may be amended by the LASERS Board. Plan assets are managed on a total return basis with a long‐term objective of achieving and maintaining a fully funded status for the benefits provided through the pension plan.
The following were LASERS Board adopted asset allocation policies in effect on June 30, 2014 and 2013:

46
Financial Section
Asset Class 2014 2013Cash 0% 0%Domestic Equity 27% 27%International Equity 30% 30%Domestic Fixed Income 11% 11%International Fixed Income 2% 2%Alternative Investments 23% 23%Global Tactical Asset Allocation 7% 7%Totals 100% 100%
Target Asset Allocation
B) Rate of Return
For the years ended June 30, 2014 and 2013, the annual money‐weighted rate of return on pension plan investments, net of pension plan investment expense, were 17.9% and 12.1%, respectively. The money‐weighted return expresses investment performance, net of investment expenses, adjusted for the changing amounts actually invested.
4. Domestic Equity
Domestic equity purchases are limited to publicly traded common stocks. Exceptions shall be approved by the Board in advance. No single holding shall account for more than 6% of the allowable equity portion of the portfolio at market value, or 150% of a stock’s weighting in the style benchmark against which the manager is measured, whichever is larger.
LASERS domestic equity portfolios are expected to be fully invested. No single holding in LASERS portfolio shall account for more than 5% of the outstanding common stock of any one corporation. No more than 10% of a manager’s domestic equity portfolio may consist of cash or cash equivalents. Additionally, no single holding across all actively managed portfolios of an investment management firm shall account for more than 15% of the outstanding common stock of any one corporation.
The purchase of stocks or convertibles in foreign companies which are publicly traded securities may be held by each domestic stock manager in proportions which each manager shall deem appropriate, up to 10% of the portfolio at market value. Convertible bonds, convertible preferred stocks, warrants and rights may be purchased as equity substitutes as long as they meet the equity guidelines listed above.
47Louisiana State Employees’ Retirement System
Financial Section
5. International Equity
Short‐term reserves may be held in U.S. dollar‐denominated, local currency securities, or investment vehicles available through the Systemʹs custodian. Managers may purchase or sell currency on a spot basis to accommodate security settlements. Managers may enter into forward exchange contracts on currency provided that use of such contracts is designed to dampen portfolio volatility or to facilitate the settlement of security transactions.
LASERS international equity portfolios are expected to be fully invested. No more than 10% of a manager’s international equity portfolio may consist of cash or cash equivalents. Equity securities should be issued by non‐U.S. corporations, although the manager has latitude to hold U.S. securities provided that such investment is consistent with attainment of the portfolioʹs investment objectives, and does not exceed 10% of the portfolioʹs market value. American Depository Receipts (ADRs) do not count toward this 10% limitation.
The number of issues held and their geographic or industry distribution shall be left to the investment manager provided that equity holdings in any one company (including common stock and convertible securities) do not exceed 6% of the market value of the managerʹs portion of LASERS portfolio. Additionally, bonds of the companies in question would be included in LASERS exposure calculation if held in the managerʹs portfolio.
Managers with established international equity mandates may invest up to 10% of their portfolio(s) in the emerging markets, as defined by the MSCI EM Index. Managers with an emerging markets equity mandate are expected to invest in the emerging (non‐established) markets, subject to the guidelines listed above.
6. Domestic Core Fixed Income
Domestic core fixed income investments may include U.S. Government and Federal Agency obligations, corporate bonds, debentures, commercial paper, certificates of deposit, Yankee bonds, mortgage‐backed securities, and senior secured debt and other instruments deemed prudent by the investment managers. No more than 6% of the market value of LASERS domestic core fixed income assets may be invested in the debt securities of any one issuer. No limitations on issues and issuers shall apply to obligations of U.S. Government and Federal Agencies.
The overall average quality of each fixed income portfolio shall be rated A‐ or higher. Issues not rated may be purchased provided that in the judgment of the manager, they are of a quality sufficient to maintain the average overall portfolio quality of A‐ or higher. Non‐rated issues or issues below investment grade (below BBB‐) may be purchased up to a maximum of 15% of the portfolio.
The diversification of securities by maturity, quality, sector, coupon, and geography is the responsibility of the manager. Active bond management is encouraged, as deemed appropriate by the investment managers. The average duration (interest rate sensitivity) of an actively managed portfolio shall not differ from the passive benchmark’s duration by more than two years.
Investments in mortgage‐backed securities shall have the characteristics of fixed income securities, and be responsive to changes in domestic interest rate changes, as well as other factors that affect the credit markets and mortgage investments. The investment managers are responsible for making an independent analysis of the credit worthiness of securities and their suitability as investments

48
Financial Section
for the Plan, and shall adhere to the specific investment, security, diversification limits, and administrative guidelines established in the investment management agreement(s).
High‐yield fixed income managers may invest up to 20% of their portfolios in non‐U.S. fixed income securities. They shall perform careful credit analysis to mitigate losses from defaults. Investments should be diversified across sector, industry, sub‐industry, and market to mitigate losses. No more than 6% of market value of the System’s high yield assets may be invested in the debt securities of any one issuer.
7. Global Fixed Income
The global bond portfolio may hold no more than 30% of its assets, at market value, in the debt securities of any single foreign government or non‐U.S. government entity. No single non‐government debt security shall constitute more than 6% of the global bond portfolio, at market value. Securities issued by AAA rated supranational organizations (such as the World Bank) shall be considered to be government equivalents.
Short‐term reserves may be held in U.S. dollar‐denominated or local currency securities or investment vehicles available through LASERS custodian.
Managers may enter into forward exchange contracts on currency provided that use of such contracts is designed to dampen portfolio volatility rather than leverage portfolio risk exposure. Currency contracts may be utilized to either hedge the portfolio’s currency risk exposure or in the settlement of securities transactions. Managers may purchase or sell currency on a spot basis to accommodate securities settlements. Decisions as to the number of issues held and their geographic distribution shall be the responsibility of the investment manager.
The overall average quality of each global fixed income portfolio shall be A‐ or higher. Non‐rated issues may be purchased, provided that in the judgment of the manager, they are of a quality sufficient to maintain the average overall portfolio quality of A‐ or higher. Issues below investment grade (below BBB‐) and/or mortgage backed securities may be purchased up to a maximum of 15% of the portfolio. The average duration (interest rate sensitivity) of a global fixed income portfolio shall not differ from the passive benchmark by more than two years.
8. Emerging Market Debt
The emerging markets debt portfolio may hold no more than 1.75 times the passive benchmark weight, at market value, in the debt securities of any single sovereign entity. The portfolio may hold up to 15% in securities not issued by benchmark countries. The portfolio may hold up to a combined allocation of 20% in non‐benchmark inflation‐linked bonds and corporate debt securities. Investments should be diversified across sovereign issuers and markets to mitigate losses from defaults.
Managers may enter into forward exchange contracts on currency provided that use of such contracts is designed to dampen portfolio volatility rather than leverage portfolio risk exposure. Currency contracts may be utilized to either hedge the portfolio’s currency risk exposure or in the settlement of securities transactions. Managers may purchase or sell currency on a spot basis to accommodate securities settlements. Decisions as to the number of issues held and their geographic distribution shall be the responsibility of the investment manager.
49Louisiana State Employees’ Retirement System
Financial Section
The overall average quality of each portfolio shall be BBB‐ or higher. Non‐rated issues may be purchased provided that in the judgment of the manager, they are of a quality sufficient to maintain the average overall portfolio quality of BBB‐ or higher. The modified duration (interest rate sensitivity) of an emerging markets debt (local currency) portfolio shall not differ from the passive benchmark by more than three years.
9. Derivatives
During the fiscal years ended 2014 and 2013, the System invested in collateralized mortgage obligations (forms of mortgage‐backed securities), foreign exchange currency contracts, futures, options, warrants, rights, and a Synthetic Guaranteed Investment Contract (SGIC). The System reviews market value of all securities on a monthly basis. Derivative securities may be held in part to maximize yields and in part to hedge against a rise in interest rates. The fair value of rights and warrants are determined based upon quoted market prices. For the years ending June 30, 2014, and June 30, 2013, the derivative instruments held by the System were considered investments and not hedges for accounting purposes. The term hedging, as it is used elsewhere in the notes to these financial statements, denotes an economic activity and not an accounting method. Investments in limited partnerships and commingled funds may include derivatives. Interest rate risk, credit rate risk, and foreign currency risk associated with derivatives are included on their respective tables in Note D. Deposits and Investment Risk Disclosures.
a. Collateralized mortgage obligations (CMOs) are bonds that are collateralized by whole loan mortgages, mortgage pass‐through securities, or stripped mortgage‐backed securities. Income is derived from payments and prepayments of principal and interest generated from collateral mortgages. Cash flows are distributed to different investment classes or tranches in accordance with that CMOs established payment order. Some CMO tranches have more stable cash flows relative to changes in interest rates than others that can be significantly sensitive to interest rate fluctuations. In a declining interest rate environment, some CMOs may be subject to a reduction in interest payments as a result of prepayments of mortgages which make up the collateral pool. Reductions in interest payments cause a decline in cash flows and, thus, a decline in market value of the CMO security. Rising interest rates may cause an increase in interest payments, thus an increase in the value of the security.
b. Synthetic Guaranteed Investment Contract (SGIC) is an investment for tax‐qualified, defined contribution pension plans consisting of two parts: an asset owned directly by the plan trust and a wrap contract providing book value protection for participant withdrawals prior to maturity. LASERS maintains a fully benefit‐responsive synthetic guaranteed investment contract option for members of the Optional Retirement Plan and the Self‐Directed Plan. The investment objective of the SGIC is to protect members from loss of their original investment and to provide a competitive interest rate. LASERS Stable Value Fund had fair values of $435.46 million and $402.8 million for the fiscal years ended June 30, 2014, and 2013, respectively. Fair values of this fund exceeded the values protected by the wrap contract by $6.8 million and $3.7 million for the fiscal years ended June 30, 2014, and 2013, respectively. The counterparty rating for the wrap contract was AA.

50
Financial Section
c. Futures contracts are standardized, exchange‐traded contracts to purchase or sell a specific financial instrument at a predetermined price. Gains and losses on futures contracts are settled daily based on a notional (underlying) principal value and do not involve an actual transfer of the specific instrument. The exchange assumes the risk that the counterparty will not pay and generally requires margin payments to minimize such risk. Futures are used primarily as a tool to increase or decrease market exposure to various asset classes.
d. A currency forward is a contractual agreement between two parties to pay or receive specific amounts of foreign currency at a future date in exchange for another currency at an agreed upon exchange rate. Forwards are usually transacted in the over‐the‐counter market. These transactions are entered into in order to hedge risks from exposure to foreign currency rate fluctuation. They are entered into with the foreign exchange department of a bank located in a major money market. Recognition of realized gain or loss depends on whether the currency exchange rate has moved favorably or unfavorably to the contract holder upon termination of the contract. Prior to termination of the contract, the System records the unrealized translation gain or loss. Forward commitments are not standardized, and carry counterparty risk. Counterparty risk ratings from forwards for the years ended June 30, 2014, and 2013, were A‐1.
e. Option contracts provide the option purchaser with the right, but not the obligation, to buy or sell the underlying security at a set price during a period or at a specified date. The option writer is obligated to buy or sell the underlying security if the option purchaser chooses to exercise the option.
The following tables represent the fair value of all open currency, futures, and options contracts at June 30, 2014, and 2013:
Derivative Type
Classification Gain/(Loss) Classification Amount Notional
Foreign Exchange Contracts Net Depreciation (1,807,982)
Investment Proceeds (208,662) 1,791,032
Commodity Futures Net Depreciation (6,447,530)
Alternative Investments 1,432,269 128,488,483
Option Net Depreciation (3,062,500) Alternative Investments ‐ ‐
Change in Fair Value 2014 Fair Value at June 30, 2014

51Louisiana State Employees’ Retirement System
Financial Section
Derivative Type
Classification Gain/(Loss) Classification Amount Notional
Foreign Exchange Contracts Net Appreciation 487,679$
Investment Proceeds 1,599,320$ 28,289,176$
Commodity Futures Net Depreciation (4,489,378)
Alternative Investments (5,015,261) 126,471,374
Option Net Appreciation 1,712,500 Alternative Investments 3,062,500 N/A
Change in Fair Value 2013 Fair Value at June 30, 2013
10. Alternative Investments
Investments in alternatives include, but are not limited to, private equity, absolute return (hedge funds), and real assets. Investment strategies may include buyouts or corporate restructuring, venture capital, secondary investments, distressed securities, mezzanine instruments, energy and natural resources, and any other special situation.
LASERS endeavors to systematically commit additional funds to this asset class over time as it becomes under‐represented relative to the LASERS target asset allocation. LASERS attempts to commit up to 200% of its target weighting to private equity investments to help ensure that the funded portion of the investments approximates the target allocation.
The Board of LASERS recognizes that alternative assets are potentially more risky than other investments of the System. As such, extra care is taken in evaluating and fully understanding all aspects on an alternative investment opportunity.
No more than 25% of the alternative asset investment allocation may be invested with a single manager, general partner, or single fund, with the exception of a fund‐of‐funds. Preference will be given to those funds where the general partner is contributing at least 1% of the total fund. All investments must have a mechanism for exit.

52
Financial Section
LASERS had the following unfunded commitments as of June 30, 2014 and 2013:
2014 2013Unfunded Commitments Denominated in US Dollars 827,607,637$ 842,085,687$ Denominated in Euros 50,651,152 57,531,427 Total Unfunded 878,258,789 899,617,114
Funded Commitments Denominated in US Dollars 2,040,793,151 1,801,315,101 Denominated in Euros 72,406,680 59,401,152 Total Funded 2,113,199,831 1,860,716,253 Total Commitments 2,991,458,620$ 2,760,333,367$
The dollar amounts representing Euros are subject to fluctuations based on changes in exchange rates.
11. Global Tactical Asset Allocation
Global Tactical Asset Allocation (GTAA) is a top‐down investment strategy that attempts to exploit short‐term mis‐pricings among a global set of assets. The strategy focuses on general movements in the market rather than on performance of individual securities. This portfolio is managed in a commingled format. As such, LASERS investment guidelines do not apply. The commingled fund’s guidelines are broadly similar to LASERS and shall take precedent.
F. Securities Lending Program State Statutes and the Board’s policies permit the system to make short‐term collateralized loans of its securities to broker‐dealers and other entities in order to earn incremental income. LASERS has contracted with its custodian, BNY Mellon, to lend domestic and international equity and debt securities. The majority of security loans can be terminated on demand by either LASERS or the borrower. Collateral in the form of cash or other securities is required for 102% of the fair value of domestic or sovereign debt, and 105% of the fair value of international securities excluding sovereign debt loaned. Since the majority of the loans are terminable at will, their duration does not generally match the duration of the investments made with the cash collateral.
Due to disruptions in the credit markets beginning in the fall of 2008, prices of several securities experienced declines. At June 30, 2013, LASERS had an approximate $4.9 million payable to BNY Mellon due to losses on Lehman Bonds. During fiscal year 2014, $3.6 million in security lending income has been applied bringing the balance owed BNY Mellon to $1.3 million. At June 30, 2014 and June 30, 2013, amounts payable to BNY Mellon were reported as trade payables and other accrued liabilities. The unrealized loss in the cash collateral pools decreased from an unrealized loss of $8.1 million at June 30, 2013, to an unrealized loss of $2.7 million at June 30, 2014.
LASERS is not permitted to pledge or sell collateral securities unless a borrower defaults. The System did not impose any restrictions during the fiscal year on the amount of the loans that BNY
53Louisiana State Employees’ Retirement System
Financial Section
Mellon made on its behalf, and BNY Mellon indemnified the System by agreeing to purchase replacement securities, or return cash collateral in the event a borrower failed to return a loaned security or pay distributions thereon. There were no such failures by any borrower to return loaned securities or pay distributions thereon during the fiscal year.
On June 30, 2014, the System had no credit risk exposure to borrowers because the amounts the System owed the borrowers exceeded the amounts the borrowers owed the System. The market value of securities on loan totaled $1,072,923,894 and $944,428,403 for the years ended June 30, 2014, and 2013, respectively.
G.Other Postemployment Benefits (OPEB) 1. Plan Description
The Office of Group Benefits (OGB) is an agent multiple‐employer postemployment healthcare plan that covers retired employees of the State, as well as school boards and various other non‐state employers. OGB provides health and life insurance benefits to eligible retirees, their spouses, and their dependents. La. R.S. 42:801‐883 assigns the authority to establish and amend the benefit provisions of the plan to the state legislature. OGB does not issue a publicly available financial report of the OPEB Plan; however, it is included in the Louisiana Comprehensive Annual Financial Report (CAFR). A copy of the CAFR may be obtained on the Office of Statewide Reporting and Accounting Policy’s website at www.doa.la.gov/osrap.
2. Funding Policy
La. R.S. 42:801‐883 assigns the authority to establish and amend the benefit provisions of the plan to the State Legislature. Retired plan members and beneficiaries currently receiving benefits are required to contribute specified amounts monthly toward the cost of health insurance premiums.
Summary of Plan Provisions:
Employees hired before January 1, 2002 pay approximately 25% of the cost of coverage (except single retirees under age 65 pay approximately 25% of the active employee cost). Total annual per capita medical contribution rates for 2013‐2014 are shown in the following tables.
Employees hired on or after January 1, 2002 pay a percentage of the total contribution rate upon retirement based on the following schedule:
Service
State Contribution Percentage
Retiree Contribution Percentage
Under 10 years 19% 81%10‐14 years 38% 62%15‐19 years 56% 44%20+ years 75% 25%

54
Financial Section
Total monthly per capita premium rates as of January 1, 2014 are as follows:
PPO HMOCDHP w/ HSA MHHMO
ActiveSingle 565.72$ 534.48$ 439.16$ 536.28$ With Spouse 1,201.64$ 1,135.12$ 932.76$ 1,122.20$ With Children 689.96$ 651.80$ 535.80$ 650.96$ Family 1,267.32$ 1,197.12$ 983.68$ 1,182.64$
Retired No Medicare & Re‐employed RetireeSingle 1,052.52$ 997.52$ N/A 984.56$ With Spouse 1,858.56$ 1,761.32$ N/A 1,727.36$ With Children 1,172.36$ 1,111.16$ N/A 1,095.08$ Family 1,849.52$ 1,752.38$ N/A 1,719.04$
Retired with 1 MedicareSingle 342.28$ 330.00$ N/A 330.36$ With Spouse 1,264.60$ 1,206.08$ N/A 1,180.04$ With Children 592.40$ 567.68$ N/A 560.76$ Family 1,684.96$ 1,605.36$ N/A 1,567.36$
Retired with 2 MedicareWith Spouse 615.24$ 591.56$ N/A 581.64$ Family 761.76$ 732.40$ N/A 716.64$
Medicare Supplement Rate
All members who retire on or after July 1, 1997 must have Medicare Parts A and B in order to qualify for the reduced premium rates. The monthly premium rates for the Medicare supplement plans for retirees are as follows:
Retired With Retired With1 Medicare 2 Medicare 1 Medicare 2 Medicare
Peoples Health HMO 251$ 502$ 234$ 468$ Vantage HMO 151$ 301$ 184$ 369$
2014 2013
Life Insurance Premiums
Effective January 1, 2013, retirees pay $0.54 for each $1,000 of personal life insurance and $0.98 for each $1,000 of spousal life insurance. Prior to that date, retirees paid $0.52 for each $1,000 of personal life insurance and $0.98 for each $1,000 of spouse life insurance.

55Louisiana State Employees’ Retirement System
Financial Section
3. Annual OPEB Cost and Net OPEB Obligation
The State is required to contribute the annual required contribution (ARC) of the employer, an amount actuarially determined in accordance with the parameters of GASB 45. The ARC represents a level of funding that, if paid on an ongoing basis, is projected to cover normal cost each year and amortize any unfunded actuarial liabilities (or funding excess) over a period not to exceed 30 years. The current ARC rate is 17.5% of annual covered payroll. At June 30, 2014, and 2013, annual OPEB costs and net OPEB obligations were:
2014 2013Annual Required Contribution 1,089,400$ 962,600$ Interest on OPEB Obligation 300,644 275,656
(286,556) (255,502)
Annual OPEB Cost (Expense) 1,103,488 982,754 Contributions Made (330,512) (350,871)
Increase in Net OPEB Obligation 772,976 631,883 Net OPEB Obligation Beginning of Year 7,515,453 6,883,570
Net OPEB Obligation End of Year 8,288,429$ 7,515,453$
Adjustment to Annual Required Contribution
For fiscal year 2014, LASERS net OPEB obligation of $8,288,429 is included in Trade Payables and Other Accrued Liabilities in the Statements of Fiduciary Net Position and annual OPEB cost (expense) of $1,103,488 is separately reported in the Statements of Changes in Fiduciary Net Position. The annual OPEB cost, the percentage of annual OPEB cost contributed to the plan, and the net OPEB obligation for fiscal years 2014, 2013, and 2012, are as follows:
Funded Status and Funding Progress: The funding status of the plan as of June 30, 2014, was as follows:
Actuarial Valuation Date
Actuarial Value of Assets
Actuarial Accrued Liability (AAL)
Unfunded AAL (UAAL)
Funded Ratio
Covered Payroll
UAAL as a Percentage of Covered Payroll
(a) (b) (b‐a) (a/b) (c) [(b‐a)/c]7/1/2012 ‐$ 12,659,600$ 12,659,600$ 0.0% 6,507,600$ 194.5%7/1/2013 ‐$ 13,278,700$ 13,278,700$ 0.0% 6,216,549$ 213.6%
Fiscal Year Ended
Annual OPEB Cost
Percentage of Annual OPEB Cost
ContributedNet OPEB Obligation
6/30/2012 999,650$ 37.9% 6,883,570$ 6/30/2013 982,754$ 35.7% 7,515,453$ 6/30/2014 1,103,488$ 30.0% 8,288,249$

56
Financial Section
Actuarial valuations of an ongoing plan involve estimates of the value of reported amounts and assumptions about the probability of occurrence of events far into the future. Examples include assumptions about future employment, mortality, and the healthcare cost trend. Amounts determined regarding the funded status of the plan and the annual required contributions of the employer are subject to continual revision as actual results are compared with past expectations and new estimates are made about the future. The Schedules of Funding Progress, presented as required supplementary information following the Notes to the Financial Statements, present the current year’s funding status, and presents multi‐year trend information that will show whether the actuarial value of plan assets is increasing or decreasing over time, relative to the actuarial accrued liabilities for benefits. Fiscal year 2008 was the implementation year of OPEB for LASERS.
4. Actuarial Methods and Assumptions
Projections of benefits for financial reporting purposes are based on the substantive plan (the plan as understood by the employer and plan members), and include the types of benefits provided at the time of each valuation, and the historical pattern of sharing of benefit costs between the employer and plan members to that point. The actuarial methods and assumptions used include techniques that are designed to reduce short‐term volatility in actuarial accrued liabilities, and the actuarial value of assets, consistent with the long‐term perspective of the calculations.
In the July 1, 2013 actuarial valuation, a projected unit credit cost method was used. The actuarial assumptions included a 4.0% investment rate of return (net of administrative expenses), an inflation rate of 3.0%, and an annual healthcare cost trend rate of 8.0% for pre‐Medicare and 6.0% for Medicare‐eligible participants initially, reduced by decrements to an ultimate rate of 4.5%. The valuation utilized participant data supplied by OGB, the State Payroll System, and the various state retirement systems. Projected claim costs were determined by combining trended claims data, actual capitation rates, and actual vendor fees. LASERS unfunded actuarial accrued liability is being amortized using both a level dollar amount and a level percent of pay over an open amortization period of 30 years, the maximum amortization period allowed by GASB 45.

57Louisiana State Employees’ Retirement System
Financial Section
Required Supplementary Information

58
Financial Section
2014
Total Pension LiabilityService Cost 228,140,255$ Interest 1,334,400,080 Changes of Benefit Terms 114,705,590 Differences Between Expected and Actual Experience (167,128,306) Changes of Assumptions ‐ Retirement Benefits (1,167,477,166) Refunds and Transfers of Member Contributions (77,118,765)
Net Change in Total Pension Liability 265,521,688
Total Pension Liability ‐ Beginning 17,612,223,257 Total Pension Liability ‐ Ending (a) 17,877,744,945$
Plan Fiduciary Net PositionEmployer Contributions 615,164,022$ Employee Contributions 152,993,052 Net Investment Income 1,770,521,381 Other Income 20,810,679 Retirement Benefits (1,167,477,166) Refunds and Transfers of Member Contributions (77,118,765) Administrative Expenses (14,810,539) Other Postemployment Benefits Expenses (1,103,488) Depreciation and Amortization Expenses (1,724,101)
Net Change in Plan Fiduciary Net Position 1,297,255,075
Plan Fiduciary Net Position ‐ Beginning 10,327,598,351 Plan Fiduciary Net Position ‐ Ending (b) 11,624,853,426$
Net Pension Liability ‐ Ending (a)‐(b) 6,252,891,519$
Plan Fiduciary Net Position as a Percentage of Total Pension Liabiltiy 65%Covered Employee Payroll 1,813,759,357$ Net Pension Liability as a Percentage of Covered Employee Payroll 344.7%
*Schedule is intended to show information for 10 years. Additional years will be displayed as they become available.
Schedules of Changes in Net Pension LiabilityFor the Year Ended June 30, 2014*

59Louisiana State Employees’ Retirement System
Financial Section
Schedules of Employersʹ Net Pension LiabilityFor the Two Years Ended June 30, 2014 and 2013*
2014 2013
Total Pension Liability 17,877,744,945$ 17,612,223,257$ Plan Fiduciary Net Position 11,624,853,426 10,327,598,351 Employersʹ Net Pension Liability 6,252,891,519$ 7,284,624,906$
Plan Fiduciary Net Position as a Percentage of Total Pension Liability 65.0% 58.6%
Covered Employee Payroll 1,813,759,357$ 1,951,987,750$
Employersʹ Net Pension Liability as a Percentage of Covered Employee Payroll 344.7% 373.2%
*Schedule is intended to show information for 10 years. Additional years will be displayed as they become available.

60
Financial Section
Schedules of Employer ContributionsFor the Ten Years Ended June 30, 2014
Date
Actuarial Determined Contribution
Contributions in Relation to Actuarial Determined Contribution
Contribution Deficiency (Excess)
Covered Employee Payroll
Contributions as a % of Covered Employee Payroll
2005 395,727,277$ 392,409,258$ 3,318,019$ 2,100,043,094$ 18.7%2006 407,044,927$ 411,907,909$ (4,862,982)$ 1,979,705,391$ 20.8%2007 417,899,955$ 417,059,370$ 840,585$ 2,175,366,607$ 19.2%2008 438,991,628$ 506,484,759$ (67,493,131)$ $ 2,436,955,566 20.8%2009 473,267,523$ 487,353,901$ (14,086,378)$ $ 2,562,575,942 19.0%2010 562,524,589$ 491,237,641$ 71,286,948$ $ 2,546,456,790 19.3%2011 651,770,540$ 558,183,107$ 93,587,433$ $ 2,408,839,604 23.2%2012 687,019,184$ 637,285,920$ 49,733,264$ $ 2,341,703,286 27.2%2013 724,391,420$ 649,029,708$ 75,361,712$ 1,951,987,750$ 33.2%2014 709,799,409$ 612,698,414$ 97,100,995$ 1,813,759,357$ 33.8%

61Louisiana State Employees’ Retirement System
Financial Section
Schedules of Investment ReturnsFor the Two Years Ended June 30, 2014 and 2013*
2014 2013
Annual Money‐Weighted Rate of Return, Net of Investment Expense 17.9% 12.1%
*Schedule is intended to show information for 10 years. Additional years will be displayed as they become available.
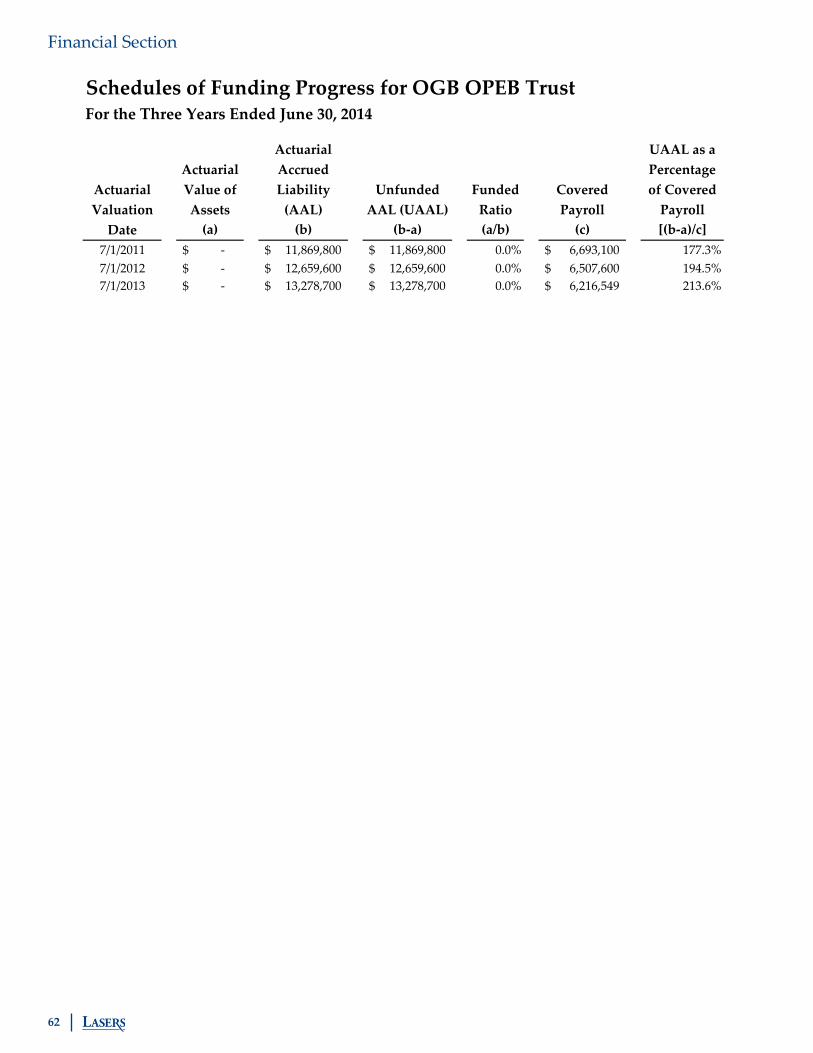
62
Financial Section
Schedules of Funding Progress for OGB OPEB TrustFor the Three Years Ended June 30, 2014
Actuarial Value of Assets
Actuarial Accrued Liability (AAL)
Unfunded AAL (UAAL)
Funded Ratio
Covered Payroll
UAAL as a Percentage of Covered Payroll
(a) (b) (b‐a) (a/b) (c) [(b‐a)/c]7/1/2011 ‐$ 11,869,800$ 11,869,800$ 0.0% 6,693,100$ 177.3%7/1/2012 ‐$ 12,659,600$ 12,659,600$ 0.0% 6,507,600$ 194.5%7/1/2013 ‐$ 13,278,700$ 13,278,700$ 0.0% 6,216,549$ 213.6%
Actuarial Valuation Date

63Louisiana State Employees’ Retirement System
Financial Section
Notes to Required Supplementary Information
A. Schedules of Changes in Net Pension Liability The total pension liability contained in this schedule was provided by System’s actuary, Foster & Foster. The net pension liability is measured as the total pension liability less the amount of the fiduciary net position of the System.
B. Schedules of Employers’ Net Pension Liability The schedule of employers’ net pension liability shows the percentage of LASERS employers’ net pension liability as a percentage of covered employee payroll. The employers’ net pension liability is the liability of contributing employers to members for benefits provided through LASERS. Covered employee payroll is the payroll of all employees that are provided with benefits through the plan.
C. Schedules of Employer Contributions The difference between actuarially determined employer contributions and employer contributions received, and the percentage of employer contributions received to covered employee payroll is presented in this schedule.
D. Schedules of Investment Returns The annual money‐weighted rate of return is shown in this schedule. The money‐weighted rate of return is calculated as the internal rate of return on pension plan investments, net of pension plan investment expense. This expresses investment performance adjusted for the changing amounts actually invested throughout the year, measured on daily inputs with expenses measured on an accrual basis.
E. Schedules of Funding Progress for OGB OPEB Trust This schedule shows LASERS actuarial accrued liability (AAL) to its retired employees participating in the Office of Group Benefits (OGB) postemployment healthcare plan. The plan is funded on a “pay‐as‐you‐go” basis. Therefore, the ratio of AAL to unfunded AAL (UAAL) is 0.0%. The schedule also represents the percentage of UAAL to covered payroll.

64
Financial Section
F. Actuarial Assumptions Contributions presented in the Schedules of Employers Contributions were determined using the following actuarial assumptions and methods that were recommended by the System actuary, adopted by LASERS Board, and approved by the Public Retirement Systems’ Actuarial Committee.
Valuation Date June 30, 2014 and 2013 Actuarial Cost Method Entry Age Normal Actuarial Assumptions:
Investment Rate of Return
Inflation Rate
Mortality
7.75% per annum.
3.0% per annum.
Non‐disabled members ‐ Mortality rates based on the RP‐2000 Combined Healthy Mortality Table with mortality improvement projected to 2015.
Disabled members – Mortality rates based on the RP‐2000 Disabled Retiree Mortality Table, with no projection for mortality improvement.
Termination, Disability, and Retirement
Termination, disability, and retirement assumptions were projected based on a five‐year (2009‐2013) experience study of the Systemʹs members.
Salary Increases Salary increases were projected based on a 2009‐2013 experience study of the Systemʹs members. The salary increase ranges for specific types of members are:
Member Type Lower
Range Upper Range
Regular 4.0% 13.0%Judges 3.0% 5.5%Corrections Hazardous Duty Wildlife
3.6% 3.6% 3.6%
14.5%14.5%14.5%

65Louisiana State Employees’ Retirement System
Financial Section
Supporting Schedules

66
Financial Section
Schedules of Administrative ExpensesFor the Years Ended June 30, 2014 and 2013
2014 2013
Administrative Expenses:
Salaries and Related Benefits 10,987,628$ 10,422,562$ Travel Expenses 117,939 125,652 Operating Services 2,829,183 3,031,142 Professional Services 615,377 482,290 Acquisitions 260,412 197,186
Total Administrative Expenses 14,810,539$ 14,258,832$

67Louisiana State Employees’ Retirement System
Financial Section
2014 2013
Investment Activities Expenses:
Alternative Investment Expenses Manager Fees 34,991,928$ 31,523,780$ Profit Sharing Fees 10,235,317 1,874,038 Total Alternative Investment Expenses 45,227,245 33,397,818
Investment Management Expenses Manager Fees 25,723,231 23,565,210 Administrative Expenses 1,855,102 1,747,007 Profit Sharing Fees ‐ 56,353 Consultant Fees 650,000 634,167 Research and Data Services 348,567 314,088 Investment Performance Management 70,875 176,228 Global Custodian Fees 153,883 141,861
Total Investment Management Expenses 28,801,658 26,634,914
Security Lending Expenses
Securities Lending Management Fees 805,836 913,341
Total Investment Expenses 74,834,739$ 60,946,073$
Schedules of Investment Expenses For the Years Ended June 30, 2014 and 2013

68
Financial Section
Board of TrusteesNumber of Meetings Amount
Number of Meetings Amount
Thomas Bickham1 16 ‐$ 11 ‐$
Connie Carlton 24 1,800 23 1,725
Beverly Hodges2 22 1,650 24 1,800
William Kleinpeter 21 1,575 19 1,425
Janice Lansing 23 1,725 21 1,575
Barbara McManus 20 1,500 22 1,650
Lori Pierce1 17 ‐ 9 ‐
Kathy Singleton 20 1,500 22 1,650
Shannon Templet 20 1,500 21 1,575
Total Compensation 11,250$ 11,400$
1
2 Board member chose to have per diem paid directly to their employer agency.
2014
Schedules of Board CompensationFor the Years Ended June 30, 2014 and 2013
2013
Board member chose not to receive per diem for all or part of their term.
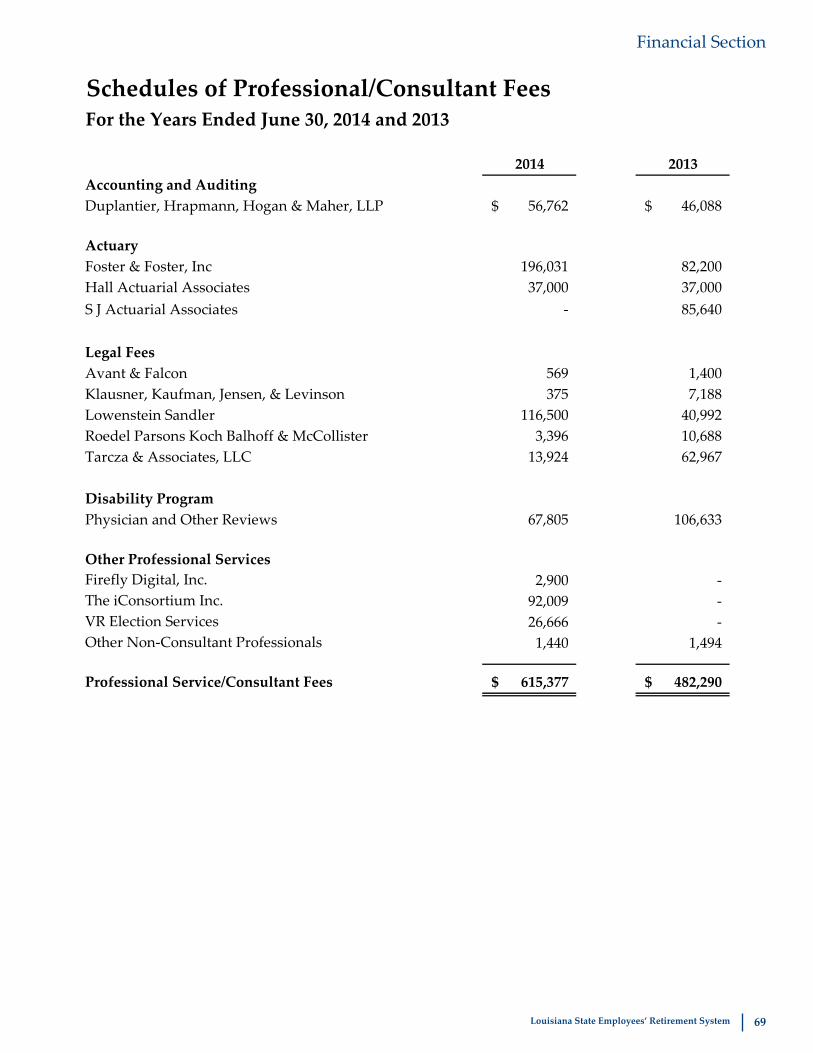
69Louisiana State Employees’ Retirement System
Financial Section
Schedules of Professional/Consultant FeesFor the Years Ended June 30, 2014 and 2013
2014 2013Accounting and AuditingDuplantier, Hrapmann, Hogan & Maher, LLP 56,762$ 46,088$
ActuaryFoster & Foster, Inc 196,031 82,200 Hall Actuarial Associates 37,000 37,000 S J Actuarial Associates ‐ 85,640
Legal FeesAvant & Falcon 569 1,400 Klausner, Kaufman, Jensen, & Levinson 375 7,188 Lowenstein Sandler 116,500 40,992 Roedel Parsons Koch Balhoff & McCollister 3,396 10,688 Tarcza & Associates, LLC 13,924 62,967
Disability ProgramPhysician and Other Reviews 67,805 106,633
Other Professional ServicesFirefly Digital, Inc. 2,900 ‐ The iConsortium Inc. 92,009 ‐VR Election Services 26,666 ‐Other Non‐Consultant Professionals 1,440 1,494
Professional Service/Consultant Fees 615,377$ 482,290$

70
Financial Section
This page left blank intentionally.

Investm
ent Section
Crawfish Louisiana State Crustacean
InvestmentSection
ContentsChief Investment Officer’s Report 71Summary of Investment Policy 73Investment Summary Report 81Largest Equity Holdings 82Largest Debt Holdings 82Largest Louisiana Holdings 83
LASERS Rates of Return Total Plan 84Domestic Equity 84International Equity 85Domestic Fixed Income 85Alternative Assets 86
Schedule of Brokerage Commissions Paid 87Schedule of Investment Fees 88
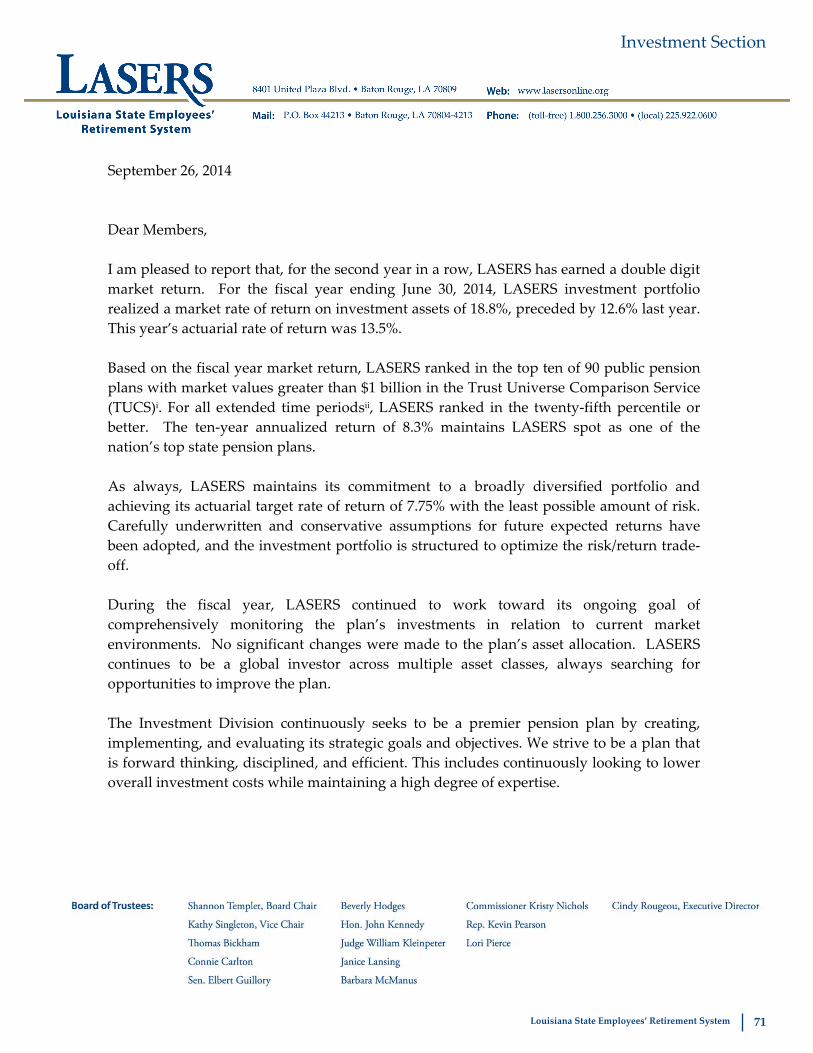
71Louisiana State Employees’ Retirement System
Investment Section
September 26, 2014 Dear Members, I am pleased to report that, for the second year in a row, LASERS has earned a double digit market return. For the fiscal year ending June 30, 2014, LASERS investment portfolio realized a market rate of return on investment assets of 18.8%, preceded by 12.6% last year. This year’s actuarial rate of return was 13.5%. Based on the fiscal year market return, LASERS ranked in the top ten of 90 public pension plans with market values greater than $1 billion in the Trust Universe Comparison Service (TUCS)i. For all extended time periodsii, LASERS ranked in the twenty‐fifth percentile or better. The ten‐year annualized return of 8.3% maintains LASERS spot as one of the nation’s top state pension plans. As always, LASERS maintains its commitment to a broadly diversified portfolio and achieving its actuarial target rate of return of 7.75% with the least possible amount of risk. Carefully underwritten and conservative assumptions for future expected returns have been adopted, and the investment portfolio is structured to optimize the risk/return trade‐off. During the fiscal year, LASERS continued to work toward its ongoing goal of comprehensively monitoring the plan’s investments in relation to current market environments. No significant changes were made to the plan’s asset allocation. LASERS continues to be a global investor across multiple asset classes, always searching for opportunities to improve the plan. The Investment Division continuously seeks to be a premier pension plan by creating, implementing, and evaluating its strategic goals and objectives. We strive to be a plan that is forward thinking, disciplined, and efficient. This includes continuously looking to lower overall investment costs while maintaining a high degree of expertise.

72
Investment Section
Going forward, we are committed to improving upon what we have already achieved and diligently working toward the future. We continue to believe that LASERS is well positioned to meet its long‐term goals and objectives. Sincerely, Robert W. Beale, CFA, CAIA Chief Investment Officer
i Trust Universe Comparison Services (TUCS) provides a universe comparison of market values for the larger public pension plans in the United States. At June 30, 2014, there were 90 constituents included in the one‐year time period rankings of public funds with market values greater than $1 billion universe. ii Investment performance calculated for periods over two years use monthly returns geometrically linked to calculate annualized “time‐weighted” rates of return.

73Louisiana State Employees’ Retirement System
Investment Section
Summary of Investment Policy
I. Statement of Investment Objectives This document specifically outlines the investment philosophy and practices of LASERS and has been developed to serve as a framework for the management of the System’s defined benefit plan. The Board has established the investment guidelines to formalize investment objectives, policies and procedures, and to define the duties and responsibilities of the various entities involved in the investment process. All policy decisions shall include liquidity and risk considerations that are prudent and reasonable under the circumstances that exist over time. The policies will evolve as the internal conditions of the fund and the capital markets environment changes. Any resulting material changes will be communicated to all affected parties.
II. Controlling Statutes and Regulation Investments of the Louisiana State Employees’ Retirement System shall be made in full accordance with Louisiana Revised Statutes, applicable legislation or regulation as well as LASERS internal policies and procedures. Among other applicable rules and regulations, the following apply:
LASERS shall operate under the “Prudent Man” rule, used herein meaning, that when investing, the Board shall exercise the care, skill, prudence, and diligence under the circumstances then prevailing that a prudent institutional investor acting in a like capacity and familiar with such matters would use in the conduct of an enterprise of a like character and with like aims. LASERS will apply this standard to the entire fund portfolio, and as part of an overall investment strategy. This will include an asset allocation study and a plan for implementation which will incorporate risk and return objectives reasonably suitable to the fund. The following types of risk are to be examined: market value, credit, interest rate, inflation, counterparty, and concentration. The study and implementation of such plan will be designed to preserve and enhance principal over the long term, provide adequate liquidity and cash flow for the system, and minimize the risk of loss unless it is clearly prudent not to do so.
LASERS is subject to a legislative limit restricting the fund so that no more than 65% of its total assets are invested in publicly traded equities. Should LASERS have more than 55% of its total assets invested in publicly traded equities, at least 10% of those equities must be invested in one or more index funds. Alternative assets are not considered to be equities when calculating LASERS equity exposure. LASERS is aware that markets will fluctuate, and any rebalancing will appropriately consider market conditions and any other relevant factors.
III. Roles and Responsibilities The following section outlines the roles and responsibilities for each of the parties involved with executing the policy. In addition to the activities described below, each person involved with the policy serves as a fiduciary and will adhere to the “Prudent Man” rule as described in State Statute.

74
Investment Section
Board of Trustees
The Board of Trustees is responsible for the total investment program. The Board shall approve the investment policy, and provide overall direction to the administrative staff in the execution of the investment policy. The Board will conduct formal annual evaluations of the administrative staff, investment consultant and custodian.
Investment Committee
The Investment Committee was established by the Board to assist in oversight of the investment program; it will consist of not less than seven members of the Board. The Committee reviews and makes recommendation to the Board on investment actions including, but not limited to, the following:
Asset Allocation Asset Management Risk Control Monitoring
Chief Investment Officer
The Chief Investment Officer (CIO) shall assist the Board in developing and modifying policy objectives and guidelines, including the development of liability driven asset allocation strategies and recommendations on long‐term asset allocation and the appropriate mix of investment manager styles and strategies. Choosing appropriate manager styles and strategies will include assisting the Board in evaluating the use of index funds as an alternative to active management. Additionally, the CIO shall provide assistance in manager searches and selection, investment performance calculation and evaluation, and any other analysis associated with the proper execution of the Board’s directives.
The CIO shall also communicate the decisions of the Investment Committee to investment managers, custodian bank(s), actuary, and consultant. The CIO provides oversight of the investment consultant, investment service providers, and personnel of LASERS investment division.
Investment Consultant
The Investment Consultant works under direction of the Board, offering a third‐party perspective and providing an additional level of oversight to the System’s investment program. The Consultant’s normal functions shall include assisting the Board and the CIO in developing and modifying policy objectives and guidelines, including the development of a liability‐driven asset allocation strategy and recommendations on the appropriate mix of investment manager styles, strategies and funding levels.
Investment Managers
The duties and responsibilities of each of the investment managers retained by the Board include, but may not be limited to, the following:
Investing the assets under its management in accordance with the policy guidelines and objectives.
Meeting or exceeding the manager‐specific benchmarks, net of all fees and expenses. Exercising investment discretion within the guidelines and objectives.

75Louisiana State Employees’ Retirement System
Investment Section
Complying with all provisions pertaining to the investment manager’s duties and responsibilities as a fiduciary.
Complying with the CFA Institute’s Code of Ethics & Standards of Professional Conduct and Global Investment Performance Standards (GIPS).
Disclosing all conflicts and potential conflicts of interest. Ensuring that all portfolio transactions are made on a “best execution” basis. Exercising ownership rights, where applicable. Meeting with the Board as needed upon request of the Board, and timely submitting all
required reports. Promptly informing the Board regarding all significant matters pertaining to the investment of
the fund assets. Initiating written communication with the Board when the manager believes that this
Investment Policy is inhibiting performance and/or should be altered for any valid reason. No deviation from the guidelines and objectives established in the Policy is permitted until after such communication has occurred and the Board has approved such deviation in writing.
Reconciling performance, holdings and security pricing data with the Fund’s custodian bank. Any other duties included in the contract.
Custodian Bank
The Custodian is responsible for the safekeeping of System assets and serves as the official book of record. It is understood that investments that are held in partnerships, commingled accounts or unique asset classes are unable to be held by the System’s custodian bank.
The Custodian(s) will be responsible for performing the following functions:
Holding System assets directly, through its agents, its sub‐custodians, or designated clearing systems.
Registration of System assets in good delivery form, collection of income generated by those assets, and any corporate action notification.
Delivery and receipt of securities. Disbursement of all income or principal cash balances as directed. Providing daily cash sweep of idle principal and income cash balances. Providing online records and reports. Providing monthly statements by investment managers’ accounts and a consolidated statement
of all assets. Providing monthly performance reports and quarterly performance analysis reports. Notifying appropriate entities of proxies. Managing the securities lending program (if applicable). Overseeing securities class actions on behalf of the System. Providing a compliance monitoring system. Any other duties and services included in the contract.

76
Investment Section
IV. Investment Objectives Nominal Return Requirements
The investment program shall be structured to preserve and enhance principal over the long term, in both real and nominal terms. For this purpose, short‐term fluctuations in values will be considered secondary to long‐term investment results. The investments of the Fund shall be diversified to minimize the risk of significant losses. Total return, which includes realized and unrealized gains, plus income less expenses, is the primary goal of LASERS.
The actuarially expected total rate of return for the Fund is 7.75% annually. However, LASERS seeks to achieve returns greater than 8.0%.
Relative Return Requirements
LASERS seeks to have total returns rank in the top half of the appropriate public fund universe, reflecting similar circumstances to the Fund. The Total Fund return should, over time, exceed the Policy and Allocation Indices. Returns for LASERS managers should exceed their respective benchmarks, as well as rank in the top half of the appropriate universe of managers adhering to the same investment strategy.
The Board further recognizes that the return targets described herein may not be achieved in any single year. A longer‐term horizon of 5‐7 years shall be used in measuring the long‐term success of the Fund. While the Board expects that returns will vary over time, LASERS has a risk tolerance consistent with that of other funds created for similar purposes, and the assets of the Fund shall be invested accordingly.
V. Performance Benchmarks Total Fund Return
The Total Fund return shall be compared against other public pension plans. LASERS will compare its returns against other funds of similar size and circumstances. LASERS Total Fund return should meet or exceed the Allocation Index return and the Policy Index return, which are each described below.
Allocation Index
The Allocation Index return shall measure the success of the Fund’s current allocation. It shall be calculated by using index rates of return for each asset class invested in by the Fund multiplied by the actual percent allocated to each asset class. The difference between the Allocation Index return and the Total Fund return measures the effect of active management. If the Total Fund return is greater than the Allocation Index return, then active management has in aggregate added value. If the Total Fund return is less than the Allocation Index return, then active management has not added value.
Policy Index
The Policy Index return shall measure the success of the Fund’s target allocation. It shall be calculated by using index rates of return for each asset class invested in by the Fund multiplied by the percent targeted to each asset class. The difference between the Allocation Index return and the Policy Index return measures the effects of deviating from the target allocation. If the Allocation Index return is

77Louisiana State Employees’ Retirement System
Investment Section
greater than the Policy Index return, then deviating from the target allocation has added value. If the Allocation Index return is less than the Policy Index return, then deviating has not added value.
Manager Benchmarks
LASERS Investment Managers shall be compared to a combination of passively managed index returns matching the managers’ specific investment styles, as well as the median manager in their appropriate peer group universe.
VI. Asset Allocation The foundation of the System’s strength and stability rests upon the diversification of plan assets. The following section outlines the current asset allocation, which was designed to achieve the required return objectives of the System, given certain risk considerations. This is to be pursued by LASERS on a long‐term basis, but will be revised if significant changes occur within the economic and/or capital market environments. Changes in liability structure, funded status, or long‐term investment prospects should trigger a revision of the asset allocation.
Based on the Board’s determination of the appropriate risk tolerance for the System and its long‐term expectations, the following asset class policy target allocation and permissible ranges have been established:
Target Asset Mix
Asset ClassMarket Value Target (%)
Minimum Exposure (%)
Maximum Exposure (%)
Equities 57 47 67 Domestic Large Cap 15 10 20 Domestic Mid and Small Cap 12 3 23 Established International Equity 18 5 27 Emerging International Equity 12 7 17
Fixed Income 12 2 22 Core Fixed Income 4 0 10 Domestic High Yield 4 0 10 Opportunistic Credit 2 0 7 Emerging Market Debt 2 0 7 Cash 0 0 5
Alternative Assets 24 14 34 Private Equity 13 5 20 Absolute Return 8 3 13 Real Assets/Inflation Protection Inv 3 0 7
Global Asset Allocation 7 2 12

78
Investment Section
Implementation LASERS recognizes that special expertise is required to properly invest the majority of the assets described. However, certain highly efficient passively managed investment strategies lend themselves to internal management, resulting in lower management fees for the Fund as a whole. Where appropriate, LASERS will manage these assets internally, so long as the same level of care, prudence and oversight is maintained that an outside professional investment advisor would typically provide.
Rebalancing
The CIO will review LASERS asset allocation at least quarterly to determine if it is consistent with the exposure ranges established for LASERS described herein. The CIO will direct staff and investment managers to transfer funds to rebalance the asset allocation as necessary. The CIO will consider market conditions and transaction costs, as well as any other relevant factors when rebalancing.
VII. Risk Management It is recognized that risk issues permeate the entire investment process, and risk is considered throughout the investment process from asset allocation to performance evaluation. Ongoing monitoring will be accomplished through a “mosaic” approach, in which various forms of analysis and reporting contribute to the total picture. Inspection of levels of diversification, nominal risk exposures, risk/return plots, sortino ratio, Value at Risk, tracking error, and worst‐case scenarios modeling form the core of the monitoring process.
VIII. Manager Selection LASERS reserves the right to retain managers to oversee portions of the System’s assets. Manager selection is accomplished in accordance with the vendor selection criteria in LASERS Board Governance Policy.
LASERS will not consider the selection of any manager without first setting a target allocation to a particular asset class, and determining that a manager is needed to implement that allocation strategy. Once LASERS has determined that a manager search is warranted, it will establish certain minimum criteria for a manager to be considered eligible to participate in the search. LASERS intends that any qualified candidate receive fair consideration. Therefore, the manager selection process will typically take place via an open Request for Proposal (RFP), except (1) when a pre‐existing contract period ends and it is the desire of LASERS to retain the manager, (2) for certain private equity opportunities, or (3) other instances where a unique investment strategy exists.
Traditional manager searches shall be publicly advertised for a predetermined amount of time, and prospective candidates shall be required to submit a proposal based on a predetermined RFP. The RFP shall be designed to ensure that managers are fairly and completely evaluated using industry best practices. As part of the search process prospective candidates will be required to disclose any campaign contributions made to any LASERS Trustee, staff member or elected official in Louisiana who can influence the selection of an advisor or manager.
79Louisiana State Employees’ Retirement System
Investment Section
LASERS shall strive to hire investment managers that offer the greatest incremental benefit to the Fund, net of fees and expenses, in accordance with, but not limited to, the criteria listed below:
Length of firm history Length of key professionals’ tenures Appropriateness of investment philosophy and process Fit between product and existing plan assets, liabilities and objectives Absolute and relative returns, and variability of returns Stability of the firm’s client base and assets under management Ownership structure Compensation structure Fee structure References and professional qualifications
IX. Investment Manager Guidelines Full discretion, within the parameters of the guidelines, is granted to the investment managers regarding the selection of securities, and the timing of transactions. Compliance with all guidelines must be monitored by the investment managers on a regular basis (monthly or more frequently when market conditions warrant), and based on then current market values. Securities that, at purchase, would move the portfolio out of compliance with these guidelines, based on the investment manager’s most recent valuation, may not be purchased.
In the event that a portfolio moves out of compliance with these guidelines (as identified in the investment manager’s regular review of the portfolio), through market conditions or other changes outside the control of the manager, the manager must bring the portfolio composition back into compliance within 45 days, or make a written request to LASERS Investment Committee for a compliance waiver.
X. Investment Manager Monitoring General Guidelines
LASERS shall monitor and evaluate manager performance using the following resources:
Monthly performance reports Quarterly Investment Performance and Portfolio Analysis Comprehensive Manager Reviews at the end of a manager’s contract with LASERS Other analyses as needed
Monitoring and Verification
Certain guidelines lend themselves to straightforward manager compliance monitoring. These guidelines will be monitored using daily holdings and transaction information provided by the Fund’s custodian bank. The custodian will monitor manager compliance by way of their investment policy reporting software, and shall be responsible for alerting the Staff if a manager is out of compliance.
Guidelines which do not lend themselves to straightforward manager compliance monitoring shall rely on manager supplied attestations of compliance. A guideline compliance checklist shall be reviewed

80
Investment Section
every quarter to ensure that all managers have reported guideline compliance, and note instances where managers claim to be out of compliance.
Manager Evaluation
LASERS portfolios shall be measured over various and appropriate time periods. A horizon of 3‐7 years shall be used in measuring the long‐term success of the manager. Shorter time periods shall be evaluated as appropriate and necessary. LASERS shall make
every effort to look at all factors influencing manager performance, and attempt to discern market cyclicality from manager over/underperformance.
On a timely basis, at least quarterly, the Board will review actual investment results achieved by each manager (with a perspective toward a three‐ to five‐year time horizon or a peak‐to‐peak or trough‐to‐trough market cycle) to determine whether the investment managers performed satisfactorily when compared with the objectives set, and in relation to other similarly managed funds.
Investment managers will periodically, upon request, present to the Board a portfolio review. This should include an update of the firm, current investments, their investment process, performance and their outlook for the market.
The Board will periodically assess the continued appropriateness of: (1) the manager structure; (2) the allocation of assets among the managers; and (3) the investment objectives for LASERS assets.
The Board may appoint investment consultants to assist in the ongoing evaluation process. The consultant(s) selected by the Board are expected to be familiar with the investment practices of similar retirement plans and will be responsible for suggesting appropriate changes in LASERS investment program over time.

81Louisiana State Employees’ Retirement System
Investment Section
Securities Market ValueCurrent Allocation Market Value
Current Allocation
Bonds Fixed Income‐Domestic 1,255,247,855$ 10.9% 1,340,180,058$ 13.1% Fixed Income‐International 323,150,997 2.8% 313,875,045 3.1%Total Fixed Income 1,578,398,852 13.7% 1,654,055,103 16.2%
Equity Securities‐Domestic 2,958,498,467 25.7% 2,929,817,566 28.6% Securities‐International 3,361,787,006 29.2% 2,430,091,727 23.8%Total Equity 6,320,285,473 54.9% 5,359,909,293 52.4%
Alternative Investments Absolute Return 912,295,827 7.9% 830,856,728 9.1% Private Placements 1,471,410,467 12.8% 1,280,700,222 11.5% Real Assets 143,956,126 1.3% 142,841,304 1.4%Total Alternative Investments 2,527,662,420 22.0% 2,254,398,254 22.0%
Global Tactical Asset Allocation 744,136,796 6.5% 649,609,869 6.4%
Short‐Term Investments Domestic/International Short‐Term 335,913,441 2.9% 310,972,110 3.0%Total Short‐Term Investments 335,913,441 2.9% 310,972,110 3.0%
Total Investments 11,506,396,982$ 100.0% 10,228,944,629$ 100.0%
Investment Summary ReportFor the Period Ended June 30, 2014 and 2013
2014 2013

82
Investment Section
Largest Equity Holdings June 30, 2014
Shares Stock Description Fair Value 1) 511,700 Apple Inc. $ 47,552,281 2) 346,600 Exxon Mobile Corp. $ 34,895,688 3) 382,375 Nestle SA $ 29,622,421 4) 315,639 Novartis AG $ 28,581,204 5) 195,800 Chevron Corp. $ 25,561,690 6) 589,900 Microsoft Corp. $ 24,598,830 7) 2,720,097 BP PLC $ 23,947,782 8) 326,246 Total SA EUR2.5 $ 23,575,755 9) 222,000 Johnson & Johnson $ 23,225,640 10) 409,600 Wells Fargo & Co. $ 21,528,576
Largest Debt Holdings June 30, 2014
Par Value Bond Description Fair Value 1) 18,020,000 US Treasury Note 0.250% 30‐Sept‐2015 $ 18,038,380 2) 100,133,000 Mexican Bonos 6.5% 10‐Jun‐2021 $ 8,268,471 3) 99,900,000,000 JPMorgan Chase Bank NA 5.625% 17‐May‐2023 $ 7,183,902 4) 19,840,000 Poland Government Bond 0.000% 25‐Jan‐2016 $ 6,291,3455) 210,480,000 Russian Federal Bond – OFZ 7.600% 14‐Apr‐2021 $ 6,020,3556) 16,342,000 Letra Tesouro Nacional 0.000% 01‐Jan‐2017 $ 5,626,6657) 63,400,000 Mexican Bonos 6.500% 09‐Jun‐2022 $ 5,194,3978) 57,301,000 Mexican Bonos 8.000% 11‐Jun‐2020 $ 5,078,1509) 4,920,000 Commit to pur FNMA SF MTG 3.500% 01‐Aug‐2044 $ 5,049,15010) 55,740,000 South Africa Government Bond 6.75% 31‐Mar‐2021 $ 4,908,421
The list of largest holdings excludes commingled funds. A complete list of LASERS portfolio holdings is available upon request.

83Louisiana State Employees’ Retirement System
Investment Section
Largest Louisiana HoldingsJune 30, 2014
Company Fair Value 1) Century Link Inc. $ 11,546,552 2) Entergy Corp. $ 5,253,7603) Tidewater Inc. $ 3,459,4024) Stone Energy Corp. $ 2,426,669 5) Lamar Advertising Corp. $ 2,240,783 6) Albemarle Corp. $ 1,530,100 7) First NBC Bank Holdings Corp. $ 1,318,000 8) Pool Corp. $ 1,182,104 9) PHI Inc. $ 1,032,667 10) Cleco Corp. $ 954,900
LASERS supports Louisiana by investing in companies that impact local economies. For the fiscal year ended June 30, 2014, LASERS invested more than $115 million in Louisiana stocks, bonds, and private equity. The above table illustrates the top ten companies headquartered in Louisiana in which LASERS has investments.

84
Investment Section
Rates of Returni June 30, 2014
Total Plan Years
1 3 5 7 10 20 LASERS Total Plan 18.8% 10.2% 14.1% 6.0% 8.3% 8.5% S&P 500 Index 24.6% 16.6% 18.8% 6.2% 7.8% 9.8% Money Weighted Rate of Returnii 17.9%
Domestic Equity Years
1 3 5 7 10 20 LASERS Domestic Equity 24.6% 16.3% 20.4% 7.0% 8.7% 9.9% S&P 500 Index 24.6% 16.6% 18.8% 6.2% 7.8% 9.8%
18.8
10.2
14.1
6.08.3 8.5
24.6
16.618.8
6.27.8
9.8
17.9
0
5
10
15
20
25
30
1YR 3YR 5YR 7YR 10YR 20YR
Ann
ualiz
ed Rates of R
eturn (%
)
LASERS Total Plan S&P 500 Index Money Weighted Rate of Return
24.6
16.3
20.4
7.08.7 9.9
24.6
16.618.8
6.27.8
9.8
0
5
10
15
20
25
30
1YR 3YR 5YR 7YR 10YR 20YRAnn
ualiz
ed Rates of R
eturn (%
)
LASERS Domestic Equity S&P 500 Index
Rates of Returni (continued) June 30, 2014
International Equity Years
1 3 5 7 10 20 LASERS International Equity 22.0% 6.0% 12.4% 1.8% 9.0% 7.3%
MSCI World Ex‐USA Index 24.4% 8.1% 12.2% 1.6% 7.7% 6.2%
Domestic Fixed Income Years
1 3 5 7 10 20 LASERS Domestic Fixed Income 10.7% 9.6% 12.9% 10.0% 8.8% 8.6% BC U.S. Aggregate Bond Index 4.4% 3.7% 4.9% 5.3% 4.9% 6.2%
22.0
6.0
12.4
1.8
9.07.3
24.4
8.1
12.2
1.6
7.7 6.2
0
5
10
15
20
25
30
1YR 3YR 5YR 7YR 10YR 20YR
Ann
ualiz
ed Rates of R
eturn (%
)
LASERS International Equity MSCI World Ex‐USA Index
10.7 9.612.9
10.0 8.8 8.6
4.4 3.7 4.9 5.3 4.9 6.2
0
5
10
15
20
25
30
1YR 3YR 5YR 7YR 10YR 20YRAnn
ualiz
ed Rates of R
eturn (%
)
LASERS Domestic Fixed Income BC U.S. Aggregate Bond Index

85Louisiana State Employees’ Retirement System
Investment Section
Rates of Returni (continued) June 30, 2014
International Equity Years
1 3 5 7 10 20 LASERS International Equity 22.0% 6.0% 12.4% 1.8% 9.0% 7.3%
MSCI World Ex‐USA Index 24.4% 8.1% 12.2% 1.6% 7.7% 6.2%
Domestic Fixed Income Years
1 3 5 7 10 20 LASERS Domestic Fixed Income 10.7% 9.6% 12.9% 10.0% 8.8% 8.6% BC U.S. Aggregate Bond Index 4.4% 3.7% 4.9% 5.3% 4.9% 6.2%
22.0
6.0
12.4
1.8
9.07.3
24.4
8.1
12.2
1.6
7.7 6.2
0
5
10
15
20
25
30
1YR 3YR 5YR 7YR 10YR 20YR
Ann
ualiz
ed Rates of R
eturn (%
)
LASERS International Equity MSCI World Ex‐USA Index
10.7 9.612.9
10.0 8.8 8.6
4.4 3.7 4.9 5.3 4.9 6.2
0
5
10
15
20
25
30
1YR 3YR 5YR 7YR 10YR 20YRAnn
ualiz
ed Rates of R
eturn (%
)
LASERS Domestic Fixed Income BC U.S. Aggregate Bond Index
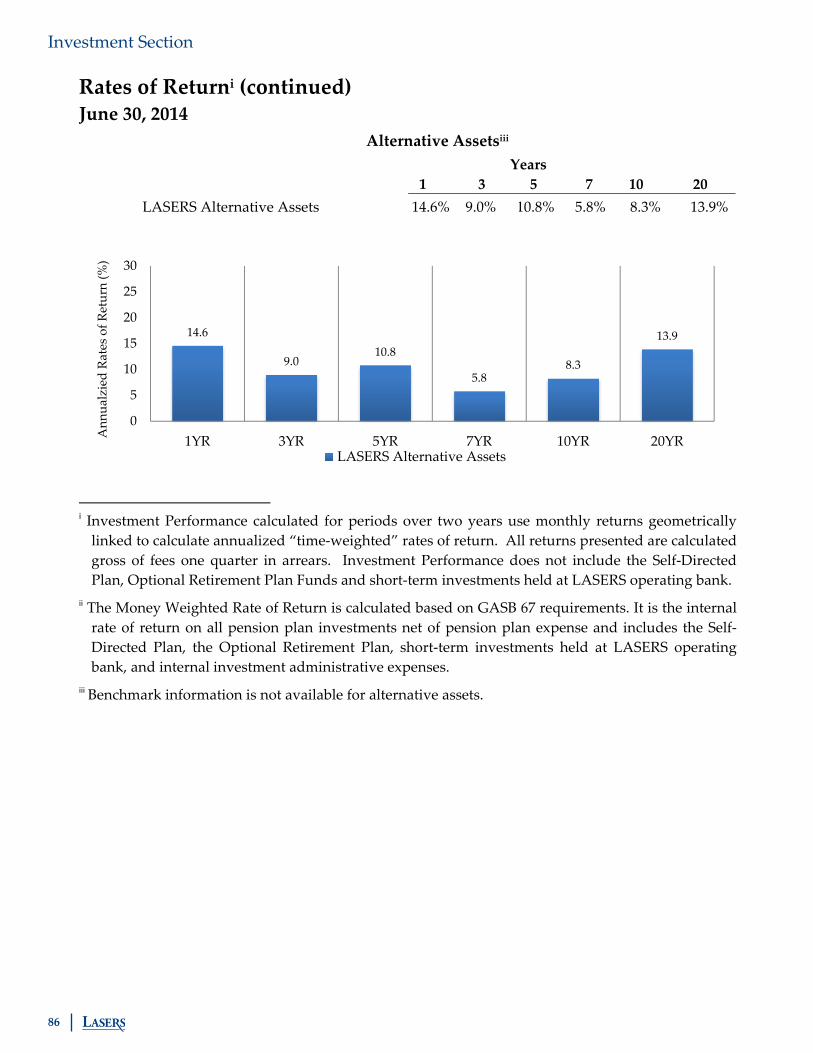
86
Investment Section
Rates of Returni (continued) June 30, 2014
Alternative Assetsiii Years
1 3 5 7 10 20 LASERS Alternative Assets 14.6% 9.0% 10.8% 5.8% 8.3% 13.9%
i Investment Performance calculated for periods over two years use monthly returns geometrically linked to calculate annualized “time‐weighted” rates of return. All returns presented are calculated gross of fees one quarter in arrears. Investment Performance does not include the Self‐Directed Plan, Optional Retirement Plan Funds and short‐term investments held at LASERS operating bank.
ii The Money Weighted Rate of Return is calculated based on GASB 67 requirements. It is the internal rate of return on all pension plan investments net of pension plan expense and includes the Self‐Directed Plan, the Optional Retirement Plan, short‐term investments held at LASERS operating bank, and internal investment administrative expenses.
iii Benchmark information is not available for alternative assets.
14.6
9.010.8
5.88.3
13.9
0
5
10
15
20
25
30
1YR 3YR 5YR 7YR 10YR 20YRAnn
ualzied Ra
tes o
f Return (%
)
LASERS Alternative Assets

87Louisiana State Employees’ Retirement System
Investment Section
Brokerage Firm CommissionsShares Traded
Average Commission Per Share
Merrill Lynch Pierce Fenner Smith 113,308$ 181,487,791 0.001$ Keybanc Capital Markets Inc. 107,995 3,015,407 0.036 Deutsche Bank Secs. Inc. 89,197 15,892,117 0.006 Stephens Inc. 88,968 2,661,107 0.033 Baird, Robert W & Co. Inc. 74,042 2,121,972 0.035 SG Americas Securities LLC 61,046 6,506,085 0.009 Morgan Stanley & Co Inc. 54,580 8,999,624 0.006 Weeden & Co. 40,512 2,025,454 0.020 Stifel Nicolaus 37,429 1,054,833 0.035 Guzman & Company, Coral Gables 33,937 2,031,220 0.017 Barclays Capital 28,473 11,660,350 0.002 G‐Trade Services Ltd. 23,612 5,862,836 0.004 Investment Technology Group 22,646 2,718,562 0.008 Sandler Oʹneill & Partners 22,241 654,635 0.034 Keefe Bruyette and Woods 21,169 606,602 0.035 Sidoti & Co. LLC 20,741 681,027 0.030 Johnson Rice & Co. 18,681 470,642 0.040 Pulse Trading LLC 18,643 593,408 0.031 King & Associates 17,996 597,820 0.030 UBS Securities LLC 17,634 12,806,120 0.001 Knight Equity Markets LP 17,473 1,116,074 0.016 JP Morgan Securities Inc. 16,548 3,836,189 0.004 Jefferies & Co. Inc. 16,326 419,882 0.039 Jonestrading Intl. Svcs. LLC 16,081 697,828 0.023 Instnet Corp 15,131 949,290 0.016 Fig Partners LLC 15,083 449,681 0.034 Rosenvalatt Securities LLC 14,946 987,750 0.015 Wells Fargo Securities LLC 14,812 370,300 0.040 Credit Suisse 14,590 4,506,541 0.003 Dougherty Company 14,000 433,555 0.032 Craig Hallum 13,219 407,728 0.032 Janney Montgomery Scott 13,093 369,997 0.035 BB&T Securities LLC 12,659 329,745 0.038 Citigroup Global Markets, Ltd. 12,447 4,129,993 0.003 Compass Point Research & TR 12,251 425,226 0.029 Oppeheimer & Co. Inc. 10,743 304,519 0.035 BTIG LLC 10,703 654,790 0.016 Other Commissions less than $10,000 257,546 48,039,150 0.005
1,410,501$ 330,875,850 0.004$
Schedule of Brokerage Commissions PaidFor the Period Ended June 30, 2014

88
Investment Section
Schedule of Investment Fees By Investment Manager Classificationi
For Years Ended June 30, 2014 and 2013
Investment Type Market Value Fees Market Value Fees Fixed Income Managers U.S. Fixed Income 1,519,508,980$ 5,180,233$ 1,574,787,442$ 5,797,090$ Emerging Market Debt 175,918,875 973,119 169,753,324 1,180,445 Total Fixed Income 1,695,427,855 6,153,352 1,744,540,766 6,977,535 Equity U.S. Equity 3,056,237,228 4,468,197 3,002,749,189 3,806,219 Global Equity 3,242,795,875 12,965,675 2,341,410,518 10,898,217 Total Equity 6,299,033,103 17,433,872 5,344,159,707 14,704,436 Alternative Investments 2,624,333,045 45,227,245 2,347,256,159 33,397,818 Global Tactical Asset Allocation 744,136,796 2,136,006 649,609,869 1,939,592 Cash 143,466,183 ‐ 143,378,128 ‐ Total 11,506,396,982$ 70,950,475 10,228,944,629$ 57,019,381
Other Investment Expenses Administrative Expenses 1,855,102 1,747,007 Consultant Fees 650,000 634,167 Research and Data Services 348,567 314,088 Performance Management Fees 70,875 176,228 Global Custodian Fees 153,884 141,861 Securities Lending Management Fees 805,836 913,341 Total Investment Expenses 74,834,739$ 60,946,073$
2014 2013
iFinancial Statements are prepared on the basis of security class. As specified in Manager Guidelines, at any given point in time, a money manager may have securities not specifically within their defined investment manager type due to market conditions.
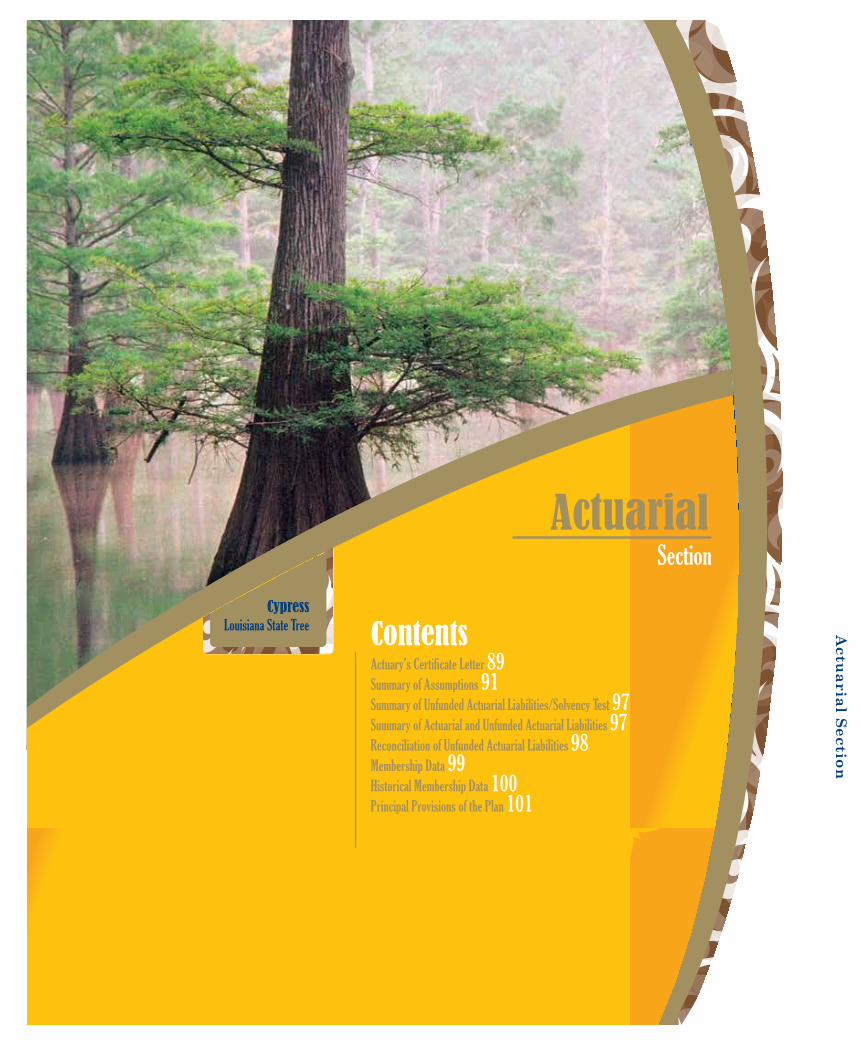
Actu
arial Section
Cypress Louisiana State Tree
ActuarialSection
ContentsActuary’s Certificate Letter 89Summary of Assumptions 91Summary of Unfunded Actuarial Liabilities/Solvency Test 97Summary of Actuarial and Unfunded Actuarial Liabilities 97Reconciliation of Unfunded Actuarial Liabilities 98Membership Data 99Historical Membership Data 100Principal Provisions of the Plan 101

89Louisiana State Employees’ Retirement System
Actuarial Section Foster & Foster, Actuaries and Consultants
Board of Trustees LASERS October 25, 2013 The present values shown in the June 30, 2013, actuarial valuation and supporting statistical schedules of this certification, which have been reformatted and comprise all the schedules of the Actuarial Section in the annual Financial Report, have been prepared in accordance with the actuarial methods specified in Louisiana Revised Statutes Title 11 Section 22(6) and assumptions which are appropriate for the purposes of this valuation. The funding method prescribed by state law is the Projected Unit Credit cost method. With this method, funding requirements, as a percentage of payroll, are expected to increase for plans that are closed to new entrants. The Entry Age Normal cost method would result in more level funding requirements for such plans. The Board has supported legislation allowing for the change to the Entry Age Normal cost method but until such legislation is passed, the plan must be funded using the Projected Unit Credit cost method. The 8.00% discount rate was recently reviewed and determined to be appropriate for purposes of the June 30, 2013, actuarial valuation for funding. The actuarial assumptions and methods used for funding purposes are within the parameters set forth by the Government Accounting Standards Board (GASB) Statement No. 25 and were employed in the development of the schedules listed below for the Financial Section of this report. The following supporting schedules were prepared by the system’s actuary for the Comprehensive Annual Financial Report:
Actuarial Section Summary of Actuarial Assumptions Summary of Unfunded Actuarial Liabilities Summary of Actuarial and Unfunded Actuarial Liabilities Reconciliation of Unfunded Actuarial Liabilities Membership Data
Financial Section Schedules of Funding Progress
We certify to the best of our knowledge, the methods and assumptions comply with generally recognized and accepted actuarial principals and practices set forth by the American Academy of Actuaries, are reasonable and represent our best estimate of the funding requirement to achieve the Retirement Systemʹs Funding Objective. Shelley is an Associate in the Society of Actuaries and Brad is a Fellow in the Society of Actuaries. We are members of the American Academy of Actuaries and meet the Qualification Standards of the American Academy of Actuaries to render the actuarial opinions contained herein.
Respectfully submitted,
FOSTER & FOSTER INC.
Shelley R. Johnson, ASA, MAAA Bradley R. Heinrichs, FSA, EA, MAAA
Foster & Foster, Actuaries and Consultants
Board of Trustees LASERS October 25, 2013 The present values shown in the June 30, 2013, actuarial valuation and supporting statistical schedules of this certification, which have been reformatted and comprise all the schedules of the Actuarial Section in the annual Financial Report, have been prepared in accordance with the actuarial methods specified in Louisiana Revised Statutes Title 11 Section 22(6) and assumptions which are appropriate for the purposes of this valuation. The funding method prescribed by state law is the Projected Unit Credit cost method. With this method, funding requirements, as a percentage of payroll, are expected to increase for plans that are closed to new entrants. The Entry Age Normal cost method would result in more level funding requirements for such plans. The Board has supported legislation allowing for the change to the Entry Age Normal cost method but until such legislation is passed, the plan must be funded using the Projected Unit Credit cost method. The 8.00% discount rate was recently reviewed and determined to be appropriate for purposes of the June 30, 2013, actuarial valuation for funding. The actuarial assumptions and methods used for funding purposes are within the parameters set forth by the Government Accounting Standards Board (GASB) Statement No. 25 and were employed in the development of the schedules listed below for the Financial Section of this report. The following supporting schedules were prepared by the system’s actuary for the Comprehensive Annual Financial Report:
Actuarial Section Summary of Actuarial Assumptions Summary of Unfunded Actuarial Liabilities Summary of Actuarial and Unfunded Actuarial Liabilities Reconciliation of Unfunded Actuarial Liabilities Membership Data
Financial Section Schedules of Funding Progress
We certify to the best of our knowledge, the methods and assumptions comply with generally recognized and accepted actuarial principals and practices set forth by the American Academy of Actuaries, are reasonable and represent our best estimate of the funding requirement to achieve the Retirement Systemʹs Funding Objective. Shelley is an Associate in the Society of Actuaries and Brad is a Fellow in the Society of Actuaries. We are members of the American Academy of Actuaries and meet the Qualification Standards of the American Academy of Actuaries to render the actuarial opinions contained herein.
Respectfully submitted,
FOSTER & FOSTER INC.
Shelley R. Johnson, ASA, MAAA Bradley R. Heinrichs, FSA, EA, MAAA
September 26, 2014
Board of Trustees Louisiana State Employees' Retirement System Post Office Box 44213 Baton Rouge, Louisiana 70804-4213 Ladies and Gentlemen: Pursuant to your request, we have completed the annual actuarial valuation for the Louisiana State Employees' Retirement System as of June 30, 2014. The valuation was prepared relying on the data submitted by the Retirement System and the actuarial assumptions adopted by the Board of Trustees and reflects the current benefit structure on the valuation date.
The funding objective of the Retirement System was established by Constitutional Amendment Number 3 during the 1987 Legislative Session and requires the following:
a) Fully fund all current normal costs determined in accordance with the prescribed statutory funding method; and
b) Liquidate the unfunded liability as of June 30, 1988, over a forty year period with subsequent changes in unfunded liabilities amortized over period(s) specified by statute.
The results of the current valuation indicate that the employer contribution rate for the plan year commencing July 1, 2014, should have been set at 37.7% of payroll. When compared to the 37.4% projected rate set by the Public Retirement Systems’ Actuarial Committee, the current rate of 37.6% reflects an increase resulting primarily from a decrease in projected aggregate payroll. The current employer contribution rate, together with the contributions payable by the members, is sufficient to achieve the funding objective set forth above.
The actuarial value of assets is determined as the market value of assets adjusted to gradually recognize investment gains and losses relative to the net assumed investment return, over a 5 year period in 20% increments. The adjusted asset value is subject to corridor limits of 80% to 120% of the market value of assets. The objective of the asset valuation method is to smooth the volatility which might otherwise occur due to market conditions on the measurement date. The actuarial value of assets for the plan year ending on June 30, 2014, is $10,723,568,031. After adjusting for the Employee Experience Account balance of $117,093,356, the valuation assets used for funding purposes is $10,606,474,675. In performing the June 30, 2014, valuation, we have relied upon the employee data and financial information provided by the administrative staff of the Louisiana State Employees' Retirement System. Participant data was edited for reasonableness, and consistency to prior plan year data. However, the validity of the information submitted was not compared to actual source documents. Plan assets were reviewed for consistency and balance tested with information furnished from the prior year's valuation.
13420 Parker Commons Blvd., Suite 104 Fort Myers, FL 33912 · (239) 433-5500 · Fax (239) 481-0634 · www.foster-foster.com
13420 Parker Commons Blvd., Suite 104 Fort Myers, FL 33912 · (239) 433-5500 · Fax (239) 481-0634 · www.foster-foster.com
October 25, 2013
Board of Trustees Louisiana State Employeesʹ Retirement System Post Office Box 44213 Baton Rouge, Louisiana 70804‐4213 Ladies and Gentlemen: Pursuant to your request, we have completed the annual actuarial valuation for the Louisiana State Employeesʹ Retirement System as of June 30, 2013. The valuation was prepared relying on the data submitted by the Retirement System and the actuarial assumptions adopted by the Board of Trustees, and reflects the current benefit structure on the valuation date.
The funding objective of the Retirement System was established by Constitutional Amendment Number 3 during the 1987 Legislative Session and requires the following:
a) Fully fund all current normal costs determined in accordance with the prescribed statutory funding method; and
b) Liquidate the unfunded liability as of June 30, 1988, over a forty year period with subsequent changes in unfunded liabilities amortized over period(s) specified by statute.
The results of the current valuation indicate that the employer contribution rate for the plan year commencing July 1, 2013, should have been set at 36.0% of payroll. When compared to the 31.7% projected rate set by the Public Retirement Systems’ Actuarial Committee, the current rate of 36.0% reflects an increase resulting primarily from a decrease in projected aggregate payroll. The current employer contribution rate, together with the contributions payable by the members, is sufficient to achieve the funding objective set forth above.
Beginning June 30, 2013, the actuarial value of assets is determined as the market value of assets adjusted to gradually recognize investment gains and losses relative to the net assumed investment return, over a 5 year period in 20% increments. The adjusted asset value is subject to corridor limits of 80% to 120% of the market value of assets. The objective of the asset valuation method is to smooth the volatility which might otherwise occur due to market conditions on the measurement date. The actuarial value of assets for the plan year ending on June 30, 2013, is $9,936,501,640. After adjusting for the Employee Experience Account balance of $195,623,963, the valuation assets used for funding purposes is $9,740,877,677. In performing the June 30, 2013, valuation, we have relied upon the employee data and financial information provided by the administrative staff of the Louisiana State Employeesʹ Retirement System. Participant data was edited for reasonableness, and consistency to prior plan year data. However, the validity of the information submitted was not compared to actual source documents. Plan assets were reviewed for consistency and balance tested with information furnished from the prior yearʹs valuation.
Foster & Foster, Actuaries and Consultants
Board of Trustees LASERS October 25, 2013 The present values shown in the June 30, 2013, actuarial valuation and supporting statistical schedules of this certification, which have been reformatted and comprise all the schedules of the Actuarial Section in the annual Financial Report, have been prepared in accordance with the actuarial methods specified in Louisiana Revised Statutes Title 11 Section 22(6) and assumptions which are appropriate for the purposes of this valuation. The funding method prescribed by state law is the Projected Unit Credit cost method. With this method, funding requirements, as a percentage of payroll, are expected to increase for plans that are closed to new entrants. The Entry Age Normal cost method would result in more level funding requirements for such plans. The Board has supported legislation allowing for the change to the Entry Age Normal cost method but until such legislation is passed, the plan must be funded using the Projected Unit Credit cost method. The 8.00% discount rate was recently reviewed and determined to be appropriate for purposes of the June 30, 2013, actuarial valuation for funding. The actuarial assumptions and methods used for funding purposes are within the parameters set forth by the Government Accounting Standards Board (GASB) Statement No. 25 and were employed in the development of the schedules listed below for the Financial Section of this report. The following supporting schedules were prepared by the system’s actuary for the Comprehensive Annual Financial Report:
Actuarial Section Summary of Actuarial Assumptions Summary of Unfunded Actuarial Liabilities Summary of Actuarial and Unfunded Actuarial Liabilities Reconciliation of Unfunded Actuarial Liabilities Membership Data
Financial Section Schedules of Funding Progress
We certify to the best of our knowledge, the methods and assumptions comply with generally recognized and accepted actuarial principals and practices set forth by the American Academy of Actuaries, are reasonable and represent our best estimate of the funding requirement to achieve the Retirement Systemʹs Funding Objective. Shelley is an Associate in the Society of Actuaries and Brad is a Fellow in the Society of Actuaries. We are members of the American Academy of Actuaries and meet the Qualification Standards of the American Academy of Actuaries to render the actuarial opinions contained herein.
Respectfully submitted,
FOSTER & FOSTER INC.
Shelley R. Johnson, ASA, MAAA Bradley R. Heinrichs, FSA, EA, MAAA

90
Actuarial Section Foster & Foster, Actuaries and Consultants
Board of Trustees LASERS October 25, 2013 The present values shown in the June 30, 2013, actuarial valuation and supporting statistical schedules of this certification, which have been reformatted and comprise all the schedules of the Actuarial Section in the annual Financial Report, have been prepared in accordance with the actuarial methods specified in Louisiana Revised Statutes Title 11 Section 22(6) and assumptions which are appropriate for the purposes of this valuation. The funding method prescribed by state law is the Projected Unit Credit cost method. With this method, funding requirements, as a percentage of payroll, are expected to increase for plans that are closed to new entrants. The Entry Age Normal cost method would result in more level funding requirements for such plans. The Board has supported legislation allowing for the change to the Entry Age Normal cost method but until such legislation is passed, the plan must be funded using the Projected Unit Credit cost method. The 8.00% discount rate was recently reviewed and determined to be appropriate for purposes of the June 30, 2013, actuarial valuation for funding. The actuarial assumptions and methods used for funding purposes are within the parameters set forth by the Government Accounting Standards Board (GASB) Statement No. 25 and were employed in the development of the schedules listed below for the Financial Section of this report. The following supporting schedules were prepared by the system’s actuary for the Comprehensive Annual Financial Report:
Actuarial Section Summary of Actuarial Assumptions Summary of Unfunded Actuarial Liabilities Summary of Actuarial and Unfunded Actuarial Liabilities Reconciliation of Unfunded Actuarial Liabilities Membership Data
Financial Section Schedules of Funding Progress
We certify to the best of our knowledge, the methods and assumptions comply with generally recognized and accepted actuarial principals and practices set forth by the American Academy of Actuaries, are reasonable and represent our best estimate of the funding requirement to achieve the Retirement Systemʹs Funding Objective. Shelley is an Associate in the Society of Actuaries and Brad is a Fellow in the Society of Actuaries. We are members of the American Academy of Actuaries and meet the Qualification Standards of the American Academy of Actuaries to render the actuarial opinions contained herein.
Respectfully submitted,
FOSTER & FOSTER INC.
Shelley R. Johnson, ASA, MAAA Bradley R. Heinrichs, FSA, EA, MAAA
Foster & Foster, Actuaries and Consultants
Board of Trustees LASERS October 25, 2013 The present values shown in the June 30, 2013, actuarial valuation and supporting statistical schedules of this certification, which have been reformatted and comprise all the schedules of the Actuarial Section in the annual Financial Report, have been prepared in accordance with the actuarial methods specified in Louisiana Revised Statutes Title 11 Section 22(6) and assumptions which are appropriate for the purposes of this valuation. The funding method prescribed by state law is the Projected Unit Credit cost method. With this method, funding requirements, as a percentage of payroll, are expected to increase for plans that are closed to new entrants. The Entry Age Normal cost method would result in more level funding requirements for such plans. The Board has supported legislation allowing for the change to the Entry Age Normal cost method but until such legislation is passed, the plan must be funded using the Projected Unit Credit cost method. The 8.00% discount rate was recently reviewed and determined to be appropriate for purposes of the June 30, 2013, actuarial valuation for funding. The actuarial assumptions and methods used for funding purposes are within the parameters set forth by the Government Accounting Standards Board (GASB) Statement No. 25 and were employed in the development of the schedules listed below for the Financial Section of this report. The following supporting schedules were prepared by the system’s actuary for the Comprehensive Annual Financial Report:
Actuarial Section Summary of Actuarial Assumptions Summary of Unfunded Actuarial Liabilities Summary of Actuarial and Unfunded Actuarial Liabilities Reconciliation of Unfunded Actuarial Liabilities Membership Data
Financial Section Schedules of Funding Progress
We certify to the best of our knowledge, the methods and assumptions comply with generally recognized and accepted actuarial principals and practices set forth by the American Academy of Actuaries, are reasonable and represent our best estimate of the funding requirement to achieve the Retirement Systemʹs Funding Objective. Shelley is an Associate in the Society of Actuaries and Brad is a Fellow in the Society of Actuaries. We are members of the American Academy of Actuaries and meet the Qualification Standards of the American Academy of Actuaries to render the actuarial opinions contained herein.
Respectfully submitted,
FOSTER & FOSTER INC.
Shelley R. Johnson, ASA, MAAA Bradley R. Heinrichs, FSA, EA, MAAA
Foster & Foster, Actuaries and ConsultantsBoard of Trustees LASERS September 26, 2014 The present values shown in the June 30, 2014, actuarial valuation and supporting statistical schedules of this certification, which have been reformatted and comprise all the schedules of the Actuarial Section in the annual Financial Report, have been prepared in accordance with the actuarial methods specified in Louisiana Revised Statutes Title 11 Section 22(6) and assumptions which are appropriate for the purposes of this valuation. The funding method prescribed by state law changed from the Projected Unit Credit cost method to the Entry Age Normal cost method, pending approval by the Public Retirement System’s Actuarial Committee (PRSAC). Valuation results presented in this report are based on the Entry Age Normal cost method. The discount rate was changed from 8.0% to 7.75% for the funding and GASB valuations. The actuarial assumptions and methods used are within the parameters set forth by the Government Accounting Standards Board (GASB) Statement Nos. 25 and 67 and were employed in the development of the schedules listed below for the Financial Section of this report. The following supporting schedules were prepared by the system’s actuary for the Comprehensive Annual Financial Report:
Actuarial Section • Summary of Actuarial Assumptions • Summary of Unfunded Actuarial Liabilities • Summary of Actuarial and Unfunded Actuarial Liabilities • Reconciliation of Unfunded Actuarial Liabilities • Membership Data
Financial Section • Schedules of Changes in Net Pension Liability • Schedule of Employers’ Net Pension Liability • Schedule of Employer Contributions
We certify to the best of our knowledge, the methods and assumptions comply with generally recognized and accepted actuarial principals and practices set forth by the American Academy of Actuaries, are reasonable and represent our best estimate of the funding requirement to achieve the Retirement System's Funding Objective, unless otherwise noted. Shelley is an Associate in the Society of Actuaries and Brad is a Fellow in the Society of Actuaries. We are members of the American Academy of Actuaries and meet the Qualification Standards of the American Academy of Actuaries to render the actuarial opinions contained herein.
Respectfully submitted, FOSTER & FOSTER INC. Shelley R. Johnson, ASA, MAAA Bradley R. Heinrichs, FSA, EA, MAAA

91Louisiana State Employees’ Retirement System
Actuarial Section Foster & Foster, Actuaries and Consultants
Board of Trustees LASERS October 25, 2013 The present values shown in the June 30, 2013, actuarial valuation and supporting statistical schedules of this certification, which have been reformatted and comprise all the schedules of the Actuarial Section in the annual Financial Report, have been prepared in accordance with the actuarial methods specified in Louisiana Revised Statutes Title 11 Section 22(6) and assumptions which are appropriate for the purposes of this valuation. The funding method prescribed by state law is the Projected Unit Credit cost method. With this method, funding requirements, as a percentage of payroll, are expected to increase for plans that are closed to new entrants. The Entry Age Normal cost method would result in more level funding requirements for such plans. The Board has supported legislation allowing for the change to the Entry Age Normal cost method but until such legislation is passed, the plan must be funded using the Projected Unit Credit cost method. The 8.00% discount rate was recently reviewed and determined to be appropriate for purposes of the June 30, 2013, actuarial valuation for funding. The actuarial assumptions and methods used for funding purposes are within the parameters set forth by the Government Accounting Standards Board (GASB) Statement No. 25 and were employed in the development of the schedules listed below for the Financial Section of this report. The following supporting schedules were prepared by the system’s actuary for the Comprehensive Annual Financial Report:
Actuarial Section Summary of Actuarial Assumptions Summary of Unfunded Actuarial Liabilities Summary of Actuarial and Unfunded Actuarial Liabilities Reconciliation of Unfunded Actuarial Liabilities Membership Data
Financial Section Schedules of Funding Progress
We certify to the best of our knowledge, the methods and assumptions comply with generally recognized and accepted actuarial principals and practices set forth by the American Academy of Actuaries, are reasonable and represent our best estimate of the funding requirement to achieve the Retirement Systemʹs Funding Objective. Shelley is an Associate in the Society of Actuaries and Brad is a Fellow in the Society of Actuaries. We are members of the American Academy of Actuaries and meet the Qualification Standards of the American Academy of Actuaries to render the actuarial opinions contained herein.
Respectfully submitted,
FOSTER & FOSTER INC.
Shelley R. Johnson, ASA, MAAA Bradley R. Heinrichs, FSA, EA, MAAA
Foster & Foster, Actuaries and Consultants
Board of Trustees LASERS October 25, 2013 The present values shown in the June 30, 2013, actuarial valuation and supporting statistical schedules of this certification, which have been reformatted and comprise all the schedules of the Actuarial Section in the annual Financial Report, have been prepared in accordance with the actuarial methods specified in Louisiana Revised Statutes Title 11 Section 22(6) and assumptions which are appropriate for the purposes of this valuation. The funding method prescribed by state law is the Projected Unit Credit cost method. With this method, funding requirements, as a percentage of payroll, are expected to increase for plans that are closed to new entrants. The Entry Age Normal cost method would result in more level funding requirements for such plans. The Board has supported legislation allowing for the change to the Entry Age Normal cost method but until such legislation is passed, the plan must be funded using the Projected Unit Credit cost method. The 8.00% discount rate was recently reviewed and determined to be appropriate for purposes of the June 30, 2013, actuarial valuation for funding. The actuarial assumptions and methods used for funding purposes are within the parameters set forth by the Government Accounting Standards Board (GASB) Statement No. 25 and were employed in the development of the schedules listed below for the Financial Section of this report. The following supporting schedules were prepared by the system’s actuary for the Comprehensive Annual Financial Report:
Actuarial Section Summary of Actuarial Assumptions Summary of Unfunded Actuarial Liabilities Summary of Actuarial and Unfunded Actuarial Liabilities Reconciliation of Unfunded Actuarial Liabilities Membership Data
Financial Section Schedules of Funding Progress
We certify to the best of our knowledge, the methods and assumptions comply with generally recognized and accepted actuarial principals and practices set forth by the American Academy of Actuaries, are reasonable and represent our best estimate of the funding requirement to achieve the Retirement Systemʹs Funding Objective. Shelley is an Associate in the Society of Actuaries and Brad is a Fellow in the Society of Actuaries. We are members of the American Academy of Actuaries and meet the Qualification Standards of the American Academy of Actuaries to render the actuarial opinions contained herein.
Respectfully submitted,
FOSTER & FOSTER INC.
Shelley R. Johnson, ASA, MAAA Bradley R. Heinrichs, FSA, EA, MAAA
Foster & Foster, Actuaries and ConsultantsBoard of Trustees LASERS September 26, 2014 The present values shown in the June 30, 2014, actuarial valuation and supporting statistical schedules of this certification, which have been reformatted and comprise all the schedules of the Actuarial Section in the annual Financial Report, have been prepared in accordance with the actuarial methods specified in Louisiana Revised Statutes Title 11 Section 22(6) and assumptions which are appropriate for the purposes of this valuation. The funding method prescribed by state law changed from the Projected Unit Credit cost method to the Entry Age Normal cost method, pending approval by the Public Retirement System’s Actuarial Committee (PRSAC). Valuation results presented in this report are based on the Entry Age Normal cost method. The discount rate was changed from 8.0% to 7.75% for the funding and GASB valuations. The actuarial assumptions and methods used are within the parameters set forth by the Government Accounting Standards Board (GASB) Statement Nos. 25 and 67 and were employed in the development of the schedules listed below for the Financial Section of this report. The following supporting schedules were prepared by the system’s actuary for the Comprehensive Annual Financial Report:
Actuarial Section • Summary of Actuarial Assumptions • Summary of Unfunded Actuarial Liabilities • Summary of Actuarial and Unfunded Actuarial Liabilities • Reconciliation of Unfunded Actuarial Liabilities • Membership Data
Financial Section • Schedules of Changes in Net Pension Liability • Schedule of Employers’ Net Pension Liability • Schedule of Employer Contributions
We certify to the best of our knowledge, the methods and assumptions comply with generally recognized and accepted actuarial principals and practices set forth by the American Academy of Actuaries, are reasonable and represent our best estimate of the funding requirement to achieve the Retirement System's Funding Objective, unless otherwise noted. Shelley is an Associate in the Society of Actuaries and Brad is a Fellow in the Society of Actuaries. We are members of the American Academy of Actuaries and meet the Qualification Standards of the American Academy of Actuaries to render the actuarial opinions contained herein.
Respectfully submitted, FOSTER & FOSTER INC. Shelley R. Johnson, ASA, MAAA Bradley R. Heinrichs, FSA, EA, MAAA
Foster & Foster, Actuaries and Consultants
Summary of Assumptions The following assumptions were adopted by the Board of Trustees of The Louisiana State Employees' Retirement System of Louisiana (LASERS) based on the recommendations presented to the Board following the completion of the 2009-2013 actuarial experience study. The assumptions are effect as of June 30, 2014, unless otherwise noted.
I. General Actuarial Method
1. Actuarial Cost Method/Amortization of Changes in UAL
The Actuarial cost method is prescribed in Section 22 of Title 11 of the Louisiana Revised Statutes. Act 571 of 2014 changed the method from Projected Unit Credit to Entry Age Normal, effective with the Public Retirement Systems’ Actuarial Committee’s adoption of a LASERS actuarial valuation utilizing this method.
The unfunded accrued liability on June 30, 1988, also referred to as the initial unfunded accrued liability, or initial UAL, was amortized over a 40-year period commencing in 1989. The amortization payment initially reflected a 4% increase for the first five years, reducing by 0.5% at the end of each five year period, but has subsequently been revised by Acts of the Louisiana Legislature as described below. Changes in unfunded accrued liabilities occurring after June 30, 1988, were originally amortized as a level dollar amount as follows:
Act 81 Effective 6/30/88
As Amended Act 257 Effective 6/30/92
Experience Gains/Losses 15 years Later of 2029 or 15 yearsActuarial Assumptions 30 years Later of 2029 or 30 yearsActuarial Methods 30 years Later of 2029 or 30 years
Benefit Changes Determined by enabling statute
Act 257 of 1992 further amended the amortization schedule to reflect a 4.5% payment increase over the remaining amortization period.
Act 588 of 2004 re-amortized changes in liabilities occurring from 1993 thru 1998 as a level dollar payment to 2029. Amortization periods for changes in liabilities beginning with 1999 were extended to a 30-year period from the date of occurrence, with a 4.5% increasing payment schedule. Amortization periods for changes in liabilities beginning with 2004 are extended to a 30-year period from the date of occurrence, paid as a level dollar amount.
Act 484 of 2007 and resulting Constitutional Amendment requires increases in UAL due to altered benefit provisions by legislative enactment to be amortized over a ten year period with level payments.

92
Actuarial Section Foster & Foster, Actuaries and Consultants
Board of Trustees LASERS October 25, 2013 The present values shown in the June 30, 2013, actuarial valuation and supporting statistical schedules of this certification, which have been reformatted and comprise all the schedules of the Actuarial Section in the annual Financial Report, have been prepared in accordance with the actuarial methods specified in Louisiana Revised Statutes Title 11 Section 22(6) and assumptions which are appropriate for the purposes of this valuation. The funding method prescribed by state law is the Projected Unit Credit cost method. With this method, funding requirements, as a percentage of payroll, are expected to increase for plans that are closed to new entrants. The Entry Age Normal cost method would result in more level funding requirements for such plans. The Board has supported legislation allowing for the change to the Entry Age Normal cost method but until such legislation is passed, the plan must be funded using the Projected Unit Credit cost method. The 8.00% discount rate was recently reviewed and determined to be appropriate for purposes of the June 30, 2013, actuarial valuation for funding. The actuarial assumptions and methods used for funding purposes are within the parameters set forth by the Government Accounting Standards Board (GASB) Statement No. 25 and were employed in the development of the schedules listed below for the Financial Section of this report. The following supporting schedules were prepared by the system’s actuary for the Comprehensive Annual Financial Report:
Actuarial Section Summary of Actuarial Assumptions Summary of Unfunded Actuarial Liabilities Summary of Actuarial and Unfunded Actuarial Liabilities Reconciliation of Unfunded Actuarial Liabilities Membership Data
Financial Section Schedules of Funding Progress
We certify to the best of our knowledge, the methods and assumptions comply with generally recognized and accepted actuarial principals and practices set forth by the American Academy of Actuaries, are reasonable and represent our best estimate of the funding requirement to achieve the Retirement Systemʹs Funding Objective. Shelley is an Associate in the Society of Actuaries and Brad is a Fellow in the Society of Actuaries. We are members of the American Academy of Actuaries and meet the Qualification Standards of the American Academy of Actuaries to render the actuarial opinions contained herein.
Respectfully submitted,
FOSTER & FOSTER INC.
Shelley R. Johnson, ASA, MAAA Bradley R. Heinrichs, FSA, EA, MAAA
Foster & Foster, Actuaries and Consultants
Board of Trustees LASERS October 25, 2013 The present values shown in the June 30, 2013, actuarial valuation and supporting statistical schedules of this certification, which have been reformatted and comprise all the schedules of the Actuarial Section in the annual Financial Report, have been prepared in accordance with the actuarial methods specified in Louisiana Revised Statutes Title 11 Section 22(6) and assumptions which are appropriate for the purposes of this valuation. The funding method prescribed by state law is the Projected Unit Credit cost method. With this method, funding requirements, as a percentage of payroll, are expected to increase for plans that are closed to new entrants. The Entry Age Normal cost method would result in more level funding requirements for such plans. The Board has supported legislation allowing for the change to the Entry Age Normal cost method but until such legislation is passed, the plan must be funded using the Projected Unit Credit cost method. The 8.00% discount rate was recently reviewed and determined to be appropriate for purposes of the June 30, 2013, actuarial valuation for funding. The actuarial assumptions and methods used for funding purposes are within the parameters set forth by the Government Accounting Standards Board (GASB) Statement No. 25 and were employed in the development of the schedules listed below for the Financial Section of this report. The following supporting schedules were prepared by the system’s actuary for the Comprehensive Annual Financial Report:
Actuarial Section Summary of Actuarial Assumptions Summary of Unfunded Actuarial Liabilities Summary of Actuarial and Unfunded Actuarial Liabilities Reconciliation of Unfunded Actuarial Liabilities Membership Data
Financial Section Schedules of Funding Progress
We certify to the best of our knowledge, the methods and assumptions comply with generally recognized and accepted actuarial principals and practices set forth by the American Academy of Actuaries, are reasonable and represent our best estimate of the funding requirement to achieve the Retirement Systemʹs Funding Objective. Shelley is an Associate in the Society of Actuaries and Brad is a Fellow in the Society of Actuaries. We are members of the American Academy of Actuaries and meet the Qualification Standards of the American Academy of Actuaries to render the actuarial opinions contained herein.
Respectfully submitted,
FOSTER & FOSTER INC.
Shelley R. Johnson, ASA, MAAA Bradley R. Heinrichs, FSA, EA, MAAA
Foster & Foster, Actuaries and Consultants
Act 497 of 2009 consolidates the outstanding balance of all amortization schedules established on or before July 1, 2008, except those established due to an increase in benefits after 2007, into two amortization schedules, the Original Amortization Base (OAB) and the Experience Account Amortization Base (EAAB). The consolidation is effective July 1, 2010. The outstanding balance of the OAB was credited with funds from the Initial UAL fund, excluding the subaccount of this fund. The OAB will be paid off in plan year ending June 30, 2029. The EAAB was credited with funds from the Initial UAL subaccount, which were transferred from the Employee Experience Account on June 30, 2009. The EAAB will be paid off in plan year ending June 30, 2040. Future payments for each of these bases will increase each plan year as follows:
Plan Year Original
Amortization Base Experience Account Amortization Base
2015/2016 5.5% 5.5% 2016/2017 – 2017/2018 5.0% 5.0%
2018/2019 + 2.0% Level Payments
Additionally, Act 497 changes the amortization of investment gains relative to the discount rate. Previously, one-half of any investment gain was amortized over a thirty year period with level payments and one-half was credited to the Employee Experience Account. Act 497 specifies that the first $100 million of any investment experience gain will be credited to the OAB and EAAB, with re-amortization of these schedules. One-half of the remaining gain would be credited to the Employee Experience Account, up to the maximum limit of this account and any remaining gain would be amortized over a thirty year period with level payments.
Employer contribution requirements for normal costs and amortization of the unfunded accrued liabilities are determined as a percentage of payroll. The discrepancy between dollars generated by percent of payroll versus the required dollar amount is treated as a shortfall credit/debit. The five year level amortization payment of the debit/credit is applied to the following year's contribution requirement. Act 497 changed the amortization of future contribution variance credits. Any overpayment through plan year 2016/2017 will be credited to the OAB. The OAB will then be re-amortized according to the new payment schedule. Subsequent overpayments will be credited to the EAAB, without re-amortization.
Act 399 of 2014 changed the allocation of investment gains to existing schedules and to the Experience Account and changes the amortization of any remaining investment gains. For the June 30, 2014 valuation only, the investment experience gains up to a threshold of $50 million and any additional gains not allocated to the Experience Account will be amortized with level payments over a 5 year period. For all future valuations until the system is 85% funded, the OAB and EAAB will not be re-amortized after application of the investment gains or after any application of overpayment of contributions. Beginning with the June 30, 2015 valuation, the threshold will increase each year by the percentage increase in the actuarial value of assets. Beginning with the June 30, 2019 valuation, gains allocated to the experience account will be amortized as a loss with level payments over 10 years, rather than current practice of reducing the investment gain that is amortized over 30 years. Once the system attains an 85% funded ratio, all future gains and losses will be amortized over 20 years. The Act extends the application of the threshold after the OAB and EAAB are paid off and provides for the allocation of funds.

93Louisiana State Employees’ Retirement System
Actuarial Section Foster & Foster, Actuaries and Consultants
Board of Trustees LASERS October 25, 2013 The present values shown in the June 30, 2013, actuarial valuation and supporting statistical schedules of this certification, which have been reformatted and comprise all the schedules of the Actuarial Section in the annual Financial Report, have been prepared in accordance with the actuarial methods specified in Louisiana Revised Statutes Title 11 Section 22(6) and assumptions which are appropriate for the purposes of this valuation. The funding method prescribed by state law is the Projected Unit Credit cost method. With this method, funding requirements, as a percentage of payroll, are expected to increase for plans that are closed to new entrants. The Entry Age Normal cost method would result in more level funding requirements for such plans. The Board has supported legislation allowing for the change to the Entry Age Normal cost method but until such legislation is passed, the plan must be funded using the Projected Unit Credit cost method. The 8.00% discount rate was recently reviewed and determined to be appropriate for purposes of the June 30, 2013, actuarial valuation for funding. The actuarial assumptions and methods used for funding purposes are within the parameters set forth by the Government Accounting Standards Board (GASB) Statement No. 25 and were employed in the development of the schedules listed below for the Financial Section of this report. The following supporting schedules were prepared by the system’s actuary for the Comprehensive Annual Financial Report:
Actuarial Section Summary of Actuarial Assumptions Summary of Unfunded Actuarial Liabilities Summary of Actuarial and Unfunded Actuarial Liabilities Reconciliation of Unfunded Actuarial Liabilities Membership Data
Financial Section Schedules of Funding Progress
We certify to the best of our knowledge, the methods and assumptions comply with generally recognized and accepted actuarial principals and practices set forth by the American Academy of Actuaries, are reasonable and represent our best estimate of the funding requirement to achieve the Retirement Systemʹs Funding Objective. Shelley is an Associate in the Society of Actuaries and Brad is a Fellow in the Society of Actuaries. We are members of the American Academy of Actuaries and meet the Qualification Standards of the American Academy of Actuaries to render the actuarial opinions contained herein.
Respectfully submitted,
FOSTER & FOSTER INC.
Shelley R. Johnson, ASA, MAAA Bradley R. Heinrichs, FSA, EA, MAAA
Foster & Foster, Actuaries and Consultants
Board of Trustees LASERS October 25, 2013 The present values shown in the June 30, 2013, actuarial valuation and supporting statistical schedules of this certification, which have been reformatted and comprise all the schedules of the Actuarial Section in the annual Financial Report, have been prepared in accordance with the actuarial methods specified in Louisiana Revised Statutes Title 11 Section 22(6) and assumptions which are appropriate for the purposes of this valuation. The funding method prescribed by state law is the Projected Unit Credit cost method. With this method, funding requirements, as a percentage of payroll, are expected to increase for plans that are closed to new entrants. The Entry Age Normal cost method would result in more level funding requirements for such plans. The Board has supported legislation allowing for the change to the Entry Age Normal cost method but until such legislation is passed, the plan must be funded using the Projected Unit Credit cost method. The 8.00% discount rate was recently reviewed and determined to be appropriate for purposes of the June 30, 2013, actuarial valuation for funding. The actuarial assumptions and methods used for funding purposes are within the parameters set forth by the Government Accounting Standards Board (GASB) Statement No. 25 and were employed in the development of the schedules listed below for the Financial Section of this report. The following supporting schedules were prepared by the system’s actuary for the Comprehensive Annual Financial Report:
Actuarial Section Summary of Actuarial Assumptions Summary of Unfunded Actuarial Liabilities Summary of Actuarial and Unfunded Actuarial Liabilities Reconciliation of Unfunded Actuarial Liabilities Membership Data
Financial Section Schedules of Funding Progress
We certify to the best of our knowledge, the methods and assumptions comply with generally recognized and accepted actuarial principals and practices set forth by the American Academy of Actuaries, are reasonable and represent our best estimate of the funding requirement to achieve the Retirement Systemʹs Funding Objective. Shelley is an Associate in the Society of Actuaries and Brad is a Fellow in the Society of Actuaries. We are members of the American Academy of Actuaries and meet the Qualification Standards of the American Academy of Actuaries to render the actuarial opinions contained herein.
Respectfully submitted,
FOSTER & FOSTER INC.
Shelley R. Johnson, ASA, MAAA Bradley R. Heinrichs, FSA, EA, MAAA
Foster & Foster, Actuaries and Consultants
All schedules existing prior to June 20, 2014, were re-amortized on June 30, 2014, based on the revised discount rate of 7.75%.
2. Asset Valuation Method
Beginning June 30, 2013, the market value of assets is adjusted to gradually recognize investment gains and losses relative to the net assumed investment return, over a 5 year period in 20% increments. The adjusted asset value is subject to Corridor Limits of 80% to 120% of the market value of assets.
3. Valuation Data
The administrative staff of LASERS furnishes the actuary with demographic data relating to the active life membership and retired life members. Retired life members included inactive members who are entitled to a deferred reciprocal or vested benefit. The administrative staff of LASERS provides the book value and market value of system assets. All data is reviewed for reasonableness and consistency from year to year, but is not audited by the actuary.
II. Economic Assumptions
1. Actuarially Assumed Rate of Return
The Board of Trustees adopted a discount rate of 7.75% net of investment expenses and expected gain sharing, effective June 30, 2014 for purposes of the funding valuation and a discount rate of 7.75% net of investment expenses for purposes of GASB reporting. Investment manager fees are treated as a direct offset to investment income.
Statutory provisions pertaining to LASERS provide for the automatic transfer of a portion of excess investment earnings to the Experience Account to potentially fund future post-retirement benefit increases. Statutory provisions pertaining to LASERS law do not provide for automatic post-retirement benefit increases; therefore, the liabilities do not explicitly include liabilities for future retiree benefit increases. However, since a portion of investment earnings will be used to potentially fund benefits which are not accrued benefits of the plan, the accrued benefits are discounted using a net discount rate. The net discount rate is determined as the expected long-term return net of investment expenses, less the expected return used to provide for future retiree benefit increases. Since the discount rate for funding purposes reflects LASERS’ specific gain sharing provisions, the determined funding requirements recognize the statutory provisions for future retiree benefit increases.

94
Actuarial Section Foster & Foster, Actuaries and Consultants
Board of Trustees LASERS October 25, 2013 The present values shown in the June 30, 2013, actuarial valuation and supporting statistical schedules of this certification, which have been reformatted and comprise all the schedules of the Actuarial Section in the annual Financial Report, have been prepared in accordance with the actuarial methods specified in Louisiana Revised Statutes Title 11 Section 22(6) and assumptions which are appropriate for the purposes of this valuation. The funding method prescribed by state law is the Projected Unit Credit cost method. With this method, funding requirements, as a percentage of payroll, are expected to increase for plans that are closed to new entrants. The Entry Age Normal cost method would result in more level funding requirements for such plans. The Board has supported legislation allowing for the change to the Entry Age Normal cost method but until such legislation is passed, the plan must be funded using the Projected Unit Credit cost method. The 8.00% discount rate was recently reviewed and determined to be appropriate for purposes of the June 30, 2013, actuarial valuation for funding. The actuarial assumptions and methods used for funding purposes are within the parameters set forth by the Government Accounting Standards Board (GASB) Statement No. 25 and were employed in the development of the schedules listed below for the Financial Section of this report. The following supporting schedules were prepared by the system’s actuary for the Comprehensive Annual Financial Report:
Actuarial Section Summary of Actuarial Assumptions Summary of Unfunded Actuarial Liabilities Summary of Actuarial and Unfunded Actuarial Liabilities Reconciliation of Unfunded Actuarial Liabilities Membership Data
Financial Section Schedules of Funding Progress
We certify to the best of our knowledge, the methods and assumptions comply with generally recognized and accepted actuarial principals and practices set forth by the American Academy of Actuaries, are reasonable and represent our best estimate of the funding requirement to achieve the Retirement Systemʹs Funding Objective. Shelley is an Associate in the Society of Actuaries and Brad is a Fellow in the Society of Actuaries. We are members of the American Academy of Actuaries and meet the Qualification Standards of the American Academy of Actuaries to render the actuarial opinions contained herein.
Respectfully submitted,
FOSTER & FOSTER INC.
Shelley R. Johnson, ASA, MAAA Bradley R. Heinrichs, FSA, EA, MAAA
Foster & Foster, Actuaries and Consultants
Board of Trustees LASERS October 25, 2013 The present values shown in the June 30, 2013, actuarial valuation and supporting statistical schedules of this certification, which have been reformatted and comprise all the schedules of the Actuarial Section in the annual Financial Report, have been prepared in accordance with the actuarial methods specified in Louisiana Revised Statutes Title 11 Section 22(6) and assumptions which are appropriate for the purposes of this valuation. The funding method prescribed by state law is the Projected Unit Credit cost method. With this method, funding requirements, as a percentage of payroll, are expected to increase for plans that are closed to new entrants. The Entry Age Normal cost method would result in more level funding requirements for such plans. The Board has supported legislation allowing for the change to the Entry Age Normal cost method but until such legislation is passed, the plan must be funded using the Projected Unit Credit cost method. The 8.00% discount rate was recently reviewed and determined to be appropriate for purposes of the June 30, 2013, actuarial valuation for funding. The actuarial assumptions and methods used for funding purposes are within the parameters set forth by the Government Accounting Standards Board (GASB) Statement No. 25 and were employed in the development of the schedules listed below for the Financial Section of this report. The following supporting schedules were prepared by the system’s actuary for the Comprehensive Annual Financial Report:
Actuarial Section Summary of Actuarial Assumptions Summary of Unfunded Actuarial Liabilities Summary of Actuarial and Unfunded Actuarial Liabilities Reconciliation of Unfunded Actuarial Liabilities Membership Data
Financial Section Schedules of Funding Progress
We certify to the best of our knowledge, the methods and assumptions comply with generally recognized and accepted actuarial principals and practices set forth by the American Academy of Actuaries, are reasonable and represent our best estimate of the funding requirement to achieve the Retirement Systemʹs Funding Objective. Shelley is an Associate in the Society of Actuaries and Brad is a Fellow in the Society of Actuaries. We are members of the American Academy of Actuaries and meet the Qualification Standards of the American Academy of Actuaries to render the actuarial opinions contained herein.
Respectfully submitted,
FOSTER & FOSTER INC.
Shelley R. Johnson, ASA, MAAA Bradley R. Heinrichs, FSA, EA, MAAA
Foster & Foster, Actuaries and Consultants
2. Employee Salary Increases
Incorporated in the following salary scales (shown for periodic durations, but representing full range of assumptions) is an explicit 3.0% inflation assumption. The following salary scale is based upon years of service:
Duration (Years)
Regular State Employees Judges
Corrections, Haz Duty, Wildlife
0 13.00% 5.50% 14.50%5 5.75% 3.00% 6.30%
10 5.10% 3.00% 6.05%15 4.60% 3.00% 5.80%20 4.10% 3.00% 5.55%25 4.00% 3.00% 5.50%30 4.00% 3.00% 3.60%
The active member population is assumed to remain constant.
III. Demographic Assumptions
1. Mortality Assumption
Pre-retirement deaths and post-retirement life expectancies are projected in accordance with the experience of the RP-2000 mortality table with projection for mortality improvement through 2015, as supported by the most recent experience study. Mortality rates after disability continue to be based on the RP-2000 table for disabled lives.
2. Disability Assumption
Rates of total and permanent disability were projected by age in accordance with the 2009-2013 disability experience of the Retirement System. Sample rates are illustrated by employment classification.
AGERegular State
Employees JudgesCorrections, Haz Duty, Wildlife
25 0.00% 0.00% 0.00%30 0.01% 0.00% 0.00%35 0.04% 0.00% 0.20%40 0.04% 0.00% 0.25%45 0.22% 0.00% 0.25%50 0.28% 0.02% 0.30%55 0.36% 0.02% 0.75%

95Louisiana State Employees’ Retirement System
Actuarial Section Foster & Foster, Actuaries and Consultants
Board of Trustees LASERS October 25, 2013 The present values shown in the June 30, 2013, actuarial valuation and supporting statistical schedules of this certification, which have been reformatted and comprise all the schedules of the Actuarial Section in the annual Financial Report, have been prepared in accordance with the actuarial methods specified in Louisiana Revised Statutes Title 11 Section 22(6) and assumptions which are appropriate for the purposes of this valuation. The funding method prescribed by state law is the Projected Unit Credit cost method. With this method, funding requirements, as a percentage of payroll, are expected to increase for plans that are closed to new entrants. The Entry Age Normal cost method would result in more level funding requirements for such plans. The Board has supported legislation allowing for the change to the Entry Age Normal cost method but until such legislation is passed, the plan must be funded using the Projected Unit Credit cost method. The 8.00% discount rate was recently reviewed and determined to be appropriate for purposes of the June 30, 2013, actuarial valuation for funding. The actuarial assumptions and methods used for funding purposes are within the parameters set forth by the Government Accounting Standards Board (GASB) Statement No. 25 and were employed in the development of the schedules listed below for the Financial Section of this report. The following supporting schedules were prepared by the system’s actuary for the Comprehensive Annual Financial Report:
Actuarial Section Summary of Actuarial Assumptions Summary of Unfunded Actuarial Liabilities Summary of Actuarial and Unfunded Actuarial Liabilities Reconciliation of Unfunded Actuarial Liabilities Membership Data
Financial Section Schedules of Funding Progress
We certify to the best of our knowledge, the methods and assumptions comply with generally recognized and accepted actuarial principals and practices set forth by the American Academy of Actuaries, are reasonable and represent our best estimate of the funding requirement to achieve the Retirement Systemʹs Funding Objective. Shelley is an Associate in the Society of Actuaries and Brad is a Fellow in the Society of Actuaries. We are members of the American Academy of Actuaries and meet the Qualification Standards of the American Academy of Actuaries to render the actuarial opinions contained herein.
Respectfully submitted,
FOSTER & FOSTER INC.
Shelley R. Johnson, ASA, MAAA Bradley R. Heinrichs, FSA, EA, MAAA
Foster & Foster, Actuaries and Consultants
Board of Trustees LASERS October 25, 2013 The present values shown in the June 30, 2013, actuarial valuation and supporting statistical schedules of this certification, which have been reformatted and comprise all the schedules of the Actuarial Section in the annual Financial Report, have been prepared in accordance with the actuarial methods specified in Louisiana Revised Statutes Title 11 Section 22(6) and assumptions which are appropriate for the purposes of this valuation. The funding method prescribed by state law is the Projected Unit Credit cost method. With this method, funding requirements, as a percentage of payroll, are expected to increase for plans that are closed to new entrants. The Entry Age Normal cost method would result in more level funding requirements for such plans. The Board has supported legislation allowing for the change to the Entry Age Normal cost method but until such legislation is passed, the plan must be funded using the Projected Unit Credit cost method. The 8.00% discount rate was recently reviewed and determined to be appropriate for purposes of the June 30, 2013, actuarial valuation for funding. The actuarial assumptions and methods used for funding purposes are within the parameters set forth by the Government Accounting Standards Board (GASB) Statement No. 25 and were employed in the development of the schedules listed below for the Financial Section of this report. The following supporting schedules were prepared by the system’s actuary for the Comprehensive Annual Financial Report:
Actuarial Section Summary of Actuarial Assumptions Summary of Unfunded Actuarial Liabilities Summary of Actuarial and Unfunded Actuarial Liabilities Reconciliation of Unfunded Actuarial Liabilities Membership Data
Financial Section Schedules of Funding Progress
We certify to the best of our knowledge, the methods and assumptions comply with generally recognized and accepted actuarial principals and practices set forth by the American Academy of Actuaries, are reasonable and represent our best estimate of the funding requirement to achieve the Retirement Systemʹs Funding Objective. Shelley is an Associate in the Society of Actuaries and Brad is a Fellow in the Society of Actuaries. We are members of the American Academy of Actuaries and meet the Qualification Standards of the American Academy of Actuaries to render the actuarial opinions contained herein.
Respectfully submitted,
FOSTER & FOSTER INC.
Shelley R. Johnson, ASA, MAAA Bradley R. Heinrichs, FSA, EA, MAAA
Foster & Foster, Actuaries and Consultants
2. Employee Salary Increases
Incorporated in the following salary scales (shown for periodic durations, but representing full range of assumptions) is an explicit 3.0% inflation assumption. The following salary scale is based upon years of service:
Duration (Years)
Regular State Employees Judges
Corrections, Haz Duty, Wildlife
0 13.00% 5.50% 14.50%5 5.75% 3.00% 6.30%10 5.10% 3.00% 6.05%15 4.60% 3.00% 5.80%20 4.10% 3.00% 5.55%25 4.00% 3.00% 5.50%30 4.00% 3.00% 3.60%
The active member population is assumed to remain constant.
III. Demographic Assumptions
1. Mortality Assumption
Pre-retirement deaths and post-retirement life expectancies are projected in accordance with the experience of the RP-2000 mortality table with projection for mortality improvement through 2015, as supported by the most recent experience study. Mortality rates after disability continue to be based on the RP-2000 table for disabled lives.
2. Disability Assumption
Rates of total and permanent disability were projected by age in accordance with the 2009-2013 disability experience of the Retirement System. Sample rates are illustrated by employment classification.
AGERegular State
Employees JudgesCorrections, Haz Duty, Wildlife
25 0.00% 0.00% 0.00%30 0.01% 0.00% 0.00%35 0.04% 0.00% 0.20%40 0.04% 0.00% 0.25%45 0.22% 0.00% 0.25%50 0.28% 0.02% 0.30%55 0.36% 0.02% 0.75%
Foster & Foster, Actuaries and Consultants
3. Termination Assumptions
Voluntary withdrawal rates are derived from the 2009-2013 termination experience study. Sample rates are illustrated by employment classification below.
AGE< 1
YEAR 1 YEAR2-3
YEARS4-5
YEARS6
YEARS7
YEARS8
YEARS9
YEARS10+
YEARS25 29.0% 20.7% 20.0% 11.8% 10.0% 8.0% 7.0% 6.0% 5.0%30 29.0% 19.2% 17.0% 10.8% 10.0% 8.0% 7.0% 6.0% 5.0%35 29.0% 17.7% 13.0% 9.8% 10.0% 8.0% 7.0% 6.0% 5.0%40 26.5% 16.2% 11.0% 8.8% 10.0% 8.0% 7.0% 6.0% 5.0%45 24.0% 14.7% 8.0% 7.8% 8.0% 7.0% 6.0% 5.0% 4.0%50 21.5% 13.2% 8.0% 6.8% 8.0% 7.0% 6.0% 5.0% 4.0%
Regular State Employees
<10 YEARS 10+ YEARS25 1.0% 29.0% 10.0% 3.0%30 1.0% 20.0% 10.0% 3.0%35 1.0% 20.0% 8.0% 3.0%40 1.0% 18.0% 5.0% 3.0%45 1.0% 17.0% 6.0% 3.0%50 1.0% 13.0% 7.0% 3.0%
Corrections/Haz DutyJudges WildlifeAGE
For members terminating with ten or more years of service, it is assumed that 75% will not withdraw their accumulated employee contributions.
4. Retirement/DROP Assumptions
Retirement rates and DROP probabilities were projected based upon the 2009-2013 experience study. At eligibility, including eligibility for a reduced early retirement benefit, the probability of retirement or DROP is determined based upon the Retirement/DROP assumptions, based on the most recent experience study. Sample rates are illustrated by employment classification below:
AGE < 10 YOS 10-19 YOS 20-24 YOS 25-29 YOS 30+ YOS45 0% 0% 2% 3% 3%50 0% 0% 3% 7% 43%55 0% 0% 8% 55% 30%60 10% 33% 55% 30% 24%65 25% 24% 25% 25% 25%70 75% 23% 25% 35% 25%
Regular Members

96
Actuarial Section Foster & Foster, Actuaries and Consultants
Board of Trustees LASERS October 25, 2013 The present values shown in the June 30, 2013, actuarial valuation and supporting statistical schedules of this certification, which have been reformatted and comprise all the schedules of the Actuarial Section in the annual Financial Report, have been prepared in accordance with the actuarial methods specified in Louisiana Revised Statutes Title 11 Section 22(6) and assumptions which are appropriate for the purposes of this valuation. The funding method prescribed by state law is the Projected Unit Credit cost method. With this method, funding requirements, as a percentage of payroll, are expected to increase for plans that are closed to new entrants. The Entry Age Normal cost method would result in more level funding requirements for such plans. The Board has supported legislation allowing for the change to the Entry Age Normal cost method but until such legislation is passed, the plan must be funded using the Projected Unit Credit cost method. The 8.00% discount rate was recently reviewed and determined to be appropriate for purposes of the June 30, 2013, actuarial valuation for funding. The actuarial assumptions and methods used for funding purposes are within the parameters set forth by the Government Accounting Standards Board (GASB) Statement No. 25 and were employed in the development of the schedules listed below for the Financial Section of this report. The following supporting schedules were prepared by the system’s actuary for the Comprehensive Annual Financial Report:
Actuarial Section Summary of Actuarial Assumptions Summary of Unfunded Actuarial Liabilities Summary of Actuarial and Unfunded Actuarial Liabilities Reconciliation of Unfunded Actuarial Liabilities Membership Data
Financial Section Schedules of Funding Progress
We certify to the best of our knowledge, the methods and assumptions comply with generally recognized and accepted actuarial principals and practices set forth by the American Academy of Actuaries, are reasonable and represent our best estimate of the funding requirement to achieve the Retirement Systemʹs Funding Objective. Shelley is an Associate in the Society of Actuaries and Brad is a Fellow in the Society of Actuaries. We are members of the American Academy of Actuaries and meet the Qualification Standards of the American Academy of Actuaries to render the actuarial opinions contained herein.
Respectfully submitted,
FOSTER & FOSTER INC.
Shelley R. Johnson, ASA, MAAA Bradley R. Heinrichs, FSA, EA, MAAA
Foster & Foster, Actuaries and Consultants
Board of Trustees LASERS October 25, 2013 The present values shown in the June 30, 2013, actuarial valuation and supporting statistical schedules of this certification, which have been reformatted and comprise all the schedules of the Actuarial Section in the annual Financial Report, have been prepared in accordance with the actuarial methods specified in Louisiana Revised Statutes Title 11 Section 22(6) and assumptions which are appropriate for the purposes of this valuation. The funding method prescribed by state law is the Projected Unit Credit cost method. With this method, funding requirements, as a percentage of payroll, are expected to increase for plans that are closed to new entrants. The Entry Age Normal cost method would result in more level funding requirements for such plans. The Board has supported legislation allowing for the change to the Entry Age Normal cost method but until such legislation is passed, the plan must be funded using the Projected Unit Credit cost method. The 8.00% discount rate was recently reviewed and determined to be appropriate for purposes of the June 30, 2013, actuarial valuation for funding. The actuarial assumptions and methods used for funding purposes are within the parameters set forth by the Government Accounting Standards Board (GASB) Statement No. 25 and were employed in the development of the schedules listed below for the Financial Section of this report. The following supporting schedules were prepared by the system’s actuary for the Comprehensive Annual Financial Report:
Actuarial Section Summary of Actuarial Assumptions Summary of Unfunded Actuarial Liabilities Summary of Actuarial and Unfunded Actuarial Liabilities Reconciliation of Unfunded Actuarial Liabilities Membership Data
Financial Section Schedules of Funding Progress
We certify to the best of our knowledge, the methods and assumptions comply with generally recognized and accepted actuarial principals and practices set forth by the American Academy of Actuaries, are reasonable and represent our best estimate of the funding requirement to achieve the Retirement Systemʹs Funding Objective. Shelley is an Associate in the Society of Actuaries and Brad is a Fellow in the Society of Actuaries. We are members of the American Academy of Actuaries and meet the Qualification Standards of the American Academy of Actuaries to render the actuarial opinions contained herein.
Respectfully submitted,
FOSTER & FOSTER INC.
Shelley R. Johnson, ASA, MAAA Bradley R. Heinrichs, FSA, EA, MAAA
Foster & Foster, Actuaries and Consultants
AGE<15
YEARS15-19
YEARS20+
YEARS < 25 YOS>= 25 YOS < 25 YOS
>= 25 YOS
45 0% 0% 0% 20% 25% 20% 25%50 0% 20% 5% 35% 20% 35% 20%55 5% 20% 10% 30% 35% 30% 35%60 10% 2% 8% 45% 50% 45% 50%65 50% 10% 6% 35% 50% 35% 50%70 10% 10% 10% 50% 50% 50% 50%
Judges Corrections/Haz Wildlife
IV. Other Assumptions
Administrative Expenses:
Administrative expenses are not explicitly assumed but rather funded in accordance with R.S. 11 Section 102, which by omission of language regarding the funding of administrative expenses precludes funding of these expenses by a direct allocation through the employer contribution rate. These expenses are instead funded through the employer rate as an experience loss which is amortized over a 30-year period. While this would not have been our recommended approach, further use of this practice will continue to produce stable contribution rates.

97Louisiana State Employees’ Retirement System
Actuarial Section Foster & Foster, Actuaries and Consultants
Board of Trustees LASERS October 25, 2013 The present values shown in the June 30, 2013, actuarial valuation and supporting statistical schedules of this certification, which have been reformatted and comprise all the schedules of the Actuarial Section in the annual Financial Report, have been prepared in accordance with the actuarial methods specified in Louisiana Revised Statutes Title 11 Section 22(6) and assumptions which are appropriate for the purposes of this valuation. The funding method prescribed by state law is the Projected Unit Credit cost method. With this method, funding requirements, as a percentage of payroll, are expected to increase for plans that are closed to new entrants. The Entry Age Normal cost method would result in more level funding requirements for such plans. The Board has supported legislation allowing for the change to the Entry Age Normal cost method but until such legislation is passed, the plan must be funded using the Projected Unit Credit cost method. The 8.00% discount rate was recently reviewed and determined to be appropriate for purposes of the June 30, 2013, actuarial valuation for funding. The actuarial assumptions and methods used for funding purposes are within the parameters set forth by the Government Accounting Standards Board (GASB) Statement No. 25 and were employed in the development of the schedules listed below for the Financial Section of this report. The following supporting schedules were prepared by the system’s actuary for the Comprehensive Annual Financial Report:
Actuarial Section Summary of Actuarial Assumptions Summary of Unfunded Actuarial Liabilities Summary of Actuarial and Unfunded Actuarial Liabilities Reconciliation of Unfunded Actuarial Liabilities Membership Data
Financial Section Schedules of Funding Progress
We certify to the best of our knowledge, the methods and assumptions comply with generally recognized and accepted actuarial principals and practices set forth by the American Academy of Actuaries, are reasonable and represent our best estimate of the funding requirement to achieve the Retirement Systemʹs Funding Objective. Shelley is an Associate in the Society of Actuaries and Brad is a Fellow in the Society of Actuaries. We are members of the American Academy of Actuaries and meet the Qualification Standards of the American Academy of Actuaries to render the actuarial opinions contained herein.
Respectfully submitted,
FOSTER & FOSTER INC.
Shelley R. Johnson, ASA, MAAA Bradley R. Heinrichs, FSA, EA, MAAA
Foster & Foster, Actuaries and Consultants
Board of Trustees LASERS October 25, 2013 The present values shown in the June 30, 2013, actuarial valuation and supporting statistical schedules of this certification, which have been reformatted and comprise all the schedules of the Actuarial Section in the annual Financial Report, have been prepared in accordance with the actuarial methods specified in Louisiana Revised Statutes Title 11 Section 22(6) and assumptions which are appropriate for the purposes of this valuation. The funding method prescribed by state law is the Projected Unit Credit cost method. With this method, funding requirements, as a percentage of payroll, are expected to increase for plans that are closed to new entrants. The Entry Age Normal cost method would result in more level funding requirements for such plans. The Board has supported legislation allowing for the change to the Entry Age Normal cost method but until such legislation is passed, the plan must be funded using the Projected Unit Credit cost method. The 8.00% discount rate was recently reviewed and determined to be appropriate for purposes of the June 30, 2013, actuarial valuation for funding. The actuarial assumptions and methods used for funding purposes are within the parameters set forth by the Government Accounting Standards Board (GASB) Statement No. 25 and were employed in the development of the schedules listed below for the Financial Section of this report. The following supporting schedules were prepared by the system’s actuary for the Comprehensive Annual Financial Report:
Actuarial Section Summary of Actuarial Assumptions Summary of Unfunded Actuarial Liabilities Summary of Actuarial and Unfunded Actuarial Liabilities Reconciliation of Unfunded Actuarial Liabilities Membership Data
Financial Section Schedules of Funding Progress
We certify to the best of our knowledge, the methods and assumptions comply with generally recognized and accepted actuarial principals and practices set forth by the American Academy of Actuaries, are reasonable and represent our best estimate of the funding requirement to achieve the Retirement Systemʹs Funding Objective. Shelley is an Associate in the Society of Actuaries and Brad is a Fellow in the Society of Actuaries. We are members of the American Academy of Actuaries and meet the Qualification Standards of the American Academy of Actuaries to render the actuarial opinions contained herein.
Respectfully submitted,
FOSTER & FOSTER INC.
Shelley R. Johnson, ASA, MAAA Bradley R. Heinrichs, FSA, EA, MAAA
Foster & Foster, Actuaries and Consultants
(1) (2) (3)
(3)2005 1,318.8$ 6,322.6$ 3,205.6$ 6,673.5$ 0%2006 1,290.3$ 7,109.8$ 3,148.6$ 7,430.8$ 0%2007 1,331.6$ 7,793.3$ 3,297.0$ 8,345.5$ 0%2008 1,394.1$ 8,398.4$ 3,769.7$ 9,167.2$ 0%2009 1,464.9$ 8,785.4$ 3,736.5$ 8,499.7$ 0%2010 1,507.0$ 9,418.6$ 3,838.4$ 8,512.4$ 0%2011 1,494.8$ 10,158.2$ 3,568.0$ 8,763.1$ 0%2012 1,649.7$ 11,030.2$ 3,478.0$ 9,026.4$ 0%2013 1,578.0$ 11,981.3$ 2,622.9$ 9,740.9$ 0%2014 1,516.3$ 13,072.6$ 3,288.8$ 10,606.5$ 0%
Valuation Date
Actuarial Accrued
Liabilities (AAL)
Actuarial Valuation
Assets
Ratio Of Assets To
AAL
Unfunded AAL
(UAAL)2005 10,847.1$ 6,673.5$ 61.52% 4,173.6$ 2006 11,548.7$ 7,430.8$ 64.34% 4,117.9$ 2007 12,421.9$ 8,345.5$ 67.18% 4,076.4$ 2008 13,562.2$ 9,167.2$ 67.59% 4,395.0$ 2009 13,986.8$ 8,499.7$ 60.77% 5,487.1$ 2010 14,764.0$ 8,512.4$ 57.66% 6,251.6$ 2011 15,221.0$ 8,763.1$ 57.57% 6,457.9$ 2012 16,157.9$ 9,026.4$ 55.86% 7,131.5$ 2013 16,182.2$ 9,740.9$ 60.20% 6,441.3$ 2014 17,877.7$ 10,606.5$ 59.33% 7,271.2$
2,437.0$ 180.3%
2,100.0$ 198.7%1,979.7$ 208.0%2,175.4$ 187.4%
100% 93%
100% 85%100%100%
83%90%
1,813.8$ 400.9%1,952.0$ 330.0%
304.5%
Active Member Payroll
2,562.6$ 2,546.5$ 2,408.8$
214.1%
69%
(1)
Summary of Unfunded Actuarial Liabilities/Solvency Test(Dollar Amounts in Millions)
Valuation Date
Active Member
Contribution
Retirees Term. Vested
Inactive
Active Members Employer
Fin. Portion
Actuarial Valuation
Assets (2)
74%72%
Summary of Actuarial and Unfunded Actuarial Liabilities(Dollar Amounts in Millions)
Portion of Actuarial Accrued Liabilities Covered By Assets
100% 71%
2,341.7$
245.5%268.1%
100%100%100%
UAAL As Percentage of
Active Payroll
80%
100%
100% 72%

98
Actuarial Section Foster & Foster, Actuaries and Consultants
Board of Trustees LASERS October 25, 2013 The present values shown in the June 30, 2013, actuarial valuation and supporting statistical schedules of this certification, which have been reformatted and comprise all the schedules of the Actuarial Section in the annual Financial Report, have been prepared in accordance with the actuarial methods specified in Louisiana Revised Statutes Title 11 Section 22(6) and assumptions which are appropriate for the purposes of this valuation. The funding method prescribed by state law is the Projected Unit Credit cost method. With this method, funding requirements, as a percentage of payroll, are expected to increase for plans that are closed to new entrants. The Entry Age Normal cost method would result in more level funding requirements for such plans. The Board has supported legislation allowing for the change to the Entry Age Normal cost method but until such legislation is passed, the plan must be funded using the Projected Unit Credit cost method. The 8.00% discount rate was recently reviewed and determined to be appropriate for purposes of the June 30, 2013, actuarial valuation for funding. The actuarial assumptions and methods used for funding purposes are within the parameters set forth by the Government Accounting Standards Board (GASB) Statement No. 25 and were employed in the development of the schedules listed below for the Financial Section of this report. The following supporting schedules were prepared by the system’s actuary for the Comprehensive Annual Financial Report:
Actuarial Section Summary of Actuarial Assumptions Summary of Unfunded Actuarial Liabilities Summary of Actuarial and Unfunded Actuarial Liabilities Reconciliation of Unfunded Actuarial Liabilities Membership Data
Financial Section Schedules of Funding Progress
We certify to the best of our knowledge, the methods and assumptions comply with generally recognized and accepted actuarial principals and practices set forth by the American Academy of Actuaries, are reasonable and represent our best estimate of the funding requirement to achieve the Retirement Systemʹs Funding Objective. Shelley is an Associate in the Society of Actuaries and Brad is a Fellow in the Society of Actuaries. We are members of the American Academy of Actuaries and meet the Qualification Standards of the American Academy of Actuaries to render the actuarial opinions contained herein.
Respectfully submitted,
FOSTER & FOSTER INC.
Shelley R. Johnson, ASA, MAAA Bradley R. Heinrichs, FSA, EA, MAAA
Foster & Foster, Actuaries and Consultants
Board of Trustees LASERS October 25, 2013 The present values shown in the June 30, 2013, actuarial valuation and supporting statistical schedules of this certification, which have been reformatted and comprise all the schedules of the Actuarial Section in the annual Financial Report, have been prepared in accordance with the actuarial methods specified in Louisiana Revised Statutes Title 11 Section 22(6) and assumptions which are appropriate for the purposes of this valuation. The funding method prescribed by state law is the Projected Unit Credit cost method. With this method, funding requirements, as a percentage of payroll, are expected to increase for plans that are closed to new entrants. The Entry Age Normal cost method would result in more level funding requirements for such plans. The Board has supported legislation allowing for the change to the Entry Age Normal cost method but until such legislation is passed, the plan must be funded using the Projected Unit Credit cost method. The 8.00% discount rate was recently reviewed and determined to be appropriate for purposes of the June 30, 2013, actuarial valuation for funding. The actuarial assumptions and methods used for funding purposes are within the parameters set forth by the Government Accounting Standards Board (GASB) Statement No. 25 and were employed in the development of the schedules listed below for the Financial Section of this report. The following supporting schedules were prepared by the system’s actuary for the Comprehensive Annual Financial Report:
Actuarial Section Summary of Actuarial Assumptions Summary of Unfunded Actuarial Liabilities Summary of Actuarial and Unfunded Actuarial Liabilities Reconciliation of Unfunded Actuarial Liabilities Membership Data
Financial Section Schedules of Funding Progress
We certify to the best of our knowledge, the methods and assumptions comply with generally recognized and accepted actuarial principals and practices set forth by the American Academy of Actuaries, are reasonable and represent our best estimate of the funding requirement to achieve the Retirement Systemʹs Funding Objective. Shelley is an Associate in the Society of Actuaries and Brad is a Fellow in the Society of Actuaries. We are members of the American Academy of Actuaries and meet the Qualification Standards of the American Academy of Actuaries to render the actuarial opinions contained herein.
Respectfully submitted,
FOSTER & FOSTER INC.
Shelley R. Johnson, ASA, MAAA Bradley R. Heinrichs, FSA, EA, MAAA
Foster & Foster, Actuaries and Consultants
2014 2013 2012 2011
Unfunded Actuarial Liability at Beginning of Fiscal Year (7/1) 6,441,317$ 7,131,481$ 6,457,954$ 6,251,612$
Interest on Unfunded Liability 515,305 570,519 532,782 515,758
Investment Experience (excl. change in AVM) (gains) decreases UAL (472,810) (321,038) 254,603 233,308
Change in Asset Valuation or Actuarial Cost Method 622,017 (170,210)
Plan Experience (gains) decreases UAL (61,188) (429,311) 18,140 (146,324)
Employer Amortization Payments (payments) decreases UAL (606,938) (614,067) (541,095) (494,868)
Employer Contribution Variance (excess contributions) decreases UAL 100,910 78,318 50,918 98,016
Side Fund Allocation(s) (distributions) decreases UAL 4,590 195,624 - Other - Miscellaneous gains and losses from transfers, assumption changes, or Acts of the Legislature 728,066 - 358,179 452
Unfunded Actuarial Liability at End of Fiscal Year (6/30) 7,271,270$ 6,441,317$ 7,131,481$ 6,457,954$
Fiscal Year Ending
Reconciliation of Unfunded Actuarial Liabilities(Dollar Amounts in Thousands)

99Louisiana State Employees’ Retirement System
Actuarial Section Foster & Foster, Actuaries and Consultants
Board of Trustees LASERS October 25, 2013 The present values shown in the June 30, 2013, actuarial valuation and supporting statistical schedules of this certification, which have been reformatted and comprise all the schedules of the Actuarial Section in the annual Financial Report, have been prepared in accordance with the actuarial methods specified in Louisiana Revised Statutes Title 11 Section 22(6) and assumptions which are appropriate for the purposes of this valuation. The funding method prescribed by state law is the Projected Unit Credit cost method. With this method, funding requirements, as a percentage of payroll, are expected to increase for plans that are closed to new entrants. The Entry Age Normal cost method would result in more level funding requirements for such plans. The Board has supported legislation allowing for the change to the Entry Age Normal cost method but until such legislation is passed, the plan must be funded using the Projected Unit Credit cost method. The 8.00% discount rate was recently reviewed and determined to be appropriate for purposes of the June 30, 2013, actuarial valuation for funding. The actuarial assumptions and methods used for funding purposes are within the parameters set forth by the Government Accounting Standards Board (GASB) Statement No. 25 and were employed in the development of the schedules listed below for the Financial Section of this report. The following supporting schedules were prepared by the system’s actuary for the Comprehensive Annual Financial Report:
Actuarial Section Summary of Actuarial Assumptions Summary of Unfunded Actuarial Liabilities Summary of Actuarial and Unfunded Actuarial Liabilities Reconciliation of Unfunded Actuarial Liabilities Membership Data
Financial Section Schedules of Funding Progress
We certify to the best of our knowledge, the methods and assumptions comply with generally recognized and accepted actuarial principals and practices set forth by the American Academy of Actuaries, are reasonable and represent our best estimate of the funding requirement to achieve the Retirement Systemʹs Funding Objective. Shelley is an Associate in the Society of Actuaries and Brad is a Fellow in the Society of Actuaries. We are members of the American Academy of Actuaries and meet the Qualification Standards of the American Academy of Actuaries to render the actuarial opinions contained herein.
Respectfully submitted,
FOSTER & FOSTER INC.
Shelley R. Johnson, ASA, MAAA Bradley R. Heinrichs, FSA, EA, MAAA
Foster & Foster, Actuaries and Consultants
Board of Trustees LASERS October 25, 2013 The present values shown in the June 30, 2013, actuarial valuation and supporting statistical schedules of this certification, which have been reformatted and comprise all the schedules of the Actuarial Section in the annual Financial Report, have been prepared in accordance with the actuarial methods specified in Louisiana Revised Statutes Title 11 Section 22(6) and assumptions which are appropriate for the purposes of this valuation. The funding method prescribed by state law is the Projected Unit Credit cost method. With this method, funding requirements, as a percentage of payroll, are expected to increase for plans that are closed to new entrants. The Entry Age Normal cost method would result in more level funding requirements for such plans. The Board has supported legislation allowing for the change to the Entry Age Normal cost method but until such legislation is passed, the plan must be funded using the Projected Unit Credit cost method. The 8.00% discount rate was recently reviewed and determined to be appropriate for purposes of the June 30, 2013, actuarial valuation for funding. The actuarial assumptions and methods used for funding purposes are within the parameters set forth by the Government Accounting Standards Board (GASB) Statement No. 25 and were employed in the development of the schedules listed below for the Financial Section of this report. The following supporting schedules were prepared by the system’s actuary for the Comprehensive Annual Financial Report:
Actuarial Section Summary of Actuarial Assumptions Summary of Unfunded Actuarial Liabilities Summary of Actuarial and Unfunded Actuarial Liabilities Reconciliation of Unfunded Actuarial Liabilities Membership Data
Financial Section Schedules of Funding Progress
We certify to the best of our knowledge, the methods and assumptions comply with generally recognized and accepted actuarial principals and practices set forth by the American Academy of Actuaries, are reasonable and represent our best estimate of the funding requirement to achieve the Retirement Systemʹs Funding Objective. Shelley is an Associate in the Society of Actuaries and Brad is a Fellow in the Society of Actuaries. We are members of the American Academy of Actuaries and meet the Qualification Standards of the American Academy of Actuaries to render the actuarial opinions contained herein.
Respectfully submitted,
FOSTER & FOSTER INC.
Shelley R. Johnson, ASA, MAAA Bradley R. Heinrichs, FSA, EA, MAAA
Foster & Foster, Actuaries and Consultants
Membership Data
Data regarding the membership of the System for valuation were furnished by the System.
Active Members Census Avg. Sal. Census Avg. Sal.Regular Members 33,237 43,505$ 36,942 42,747$ Legislators 12 84,978 12 81,450 Judges - prior to 1/1/2011 273 137,208 298 132,395 Judges - on or after 1/1/11 30 136,506 22 130,654 Appellate Law Clerks 160 73,077 172 72,234 Wildlife Agents 180 56,025 190 53,859 Corrections 2,620 45,296 2,949 44,022 Peace Officers 67 52,886 79 50,885 Alcohol Tobacco Control 16 47,349 19 49,438 Bridge Police 7 58,170 7 52,317 Hazardous Duty 1,969 32,614 1,596 32,665 Active After DROP 1,750 59,198 1,825 59,198 Total 40,321 44,680$ 44,111 43,990$
Valuation Salaries
Inactive Members 2014 2013Due Refunds 52,042 52,385 Vested & Reciprocals 4,558 4,162
Annuitants and Survivors Census Avg. Ben. Census Avg. Ben.Retirees 38,675 24,645$ 37,145 23,895$ Disabilities 2,506 13,740 2,554 13,350 Survivors 5,759 15,072 5,726 14,517 DROP 1,838 33,454 2,092 34,153 Total 48,778 23,286$ 47,517 22,650$
2014 2013
2014 2013
$1,813,759,357 $1,951,987,750

100
Actuarial Section Foster & Foster, Actuaries and Consultants
Board of Trustees LASERS October 25, 2013 The present values shown in the June 30, 2013, actuarial valuation and supporting statistical schedules of this certification, which have been reformatted and comprise all the schedules of the Actuarial Section in the annual Financial Report, have been prepared in accordance with the actuarial methods specified in Louisiana Revised Statutes Title 11 Section 22(6) and assumptions which are appropriate for the purposes of this valuation. The funding method prescribed by state law is the Projected Unit Credit cost method. With this method, funding requirements, as a percentage of payroll, are expected to increase for plans that are closed to new entrants. The Entry Age Normal cost method would result in more level funding requirements for such plans. The Board has supported legislation allowing for the change to the Entry Age Normal cost method but until such legislation is passed, the plan must be funded using the Projected Unit Credit cost method. The 8.00% discount rate was recently reviewed and determined to be appropriate for purposes of the June 30, 2013, actuarial valuation for funding. The actuarial assumptions and methods used for funding purposes are within the parameters set forth by the Government Accounting Standards Board (GASB) Statement No. 25 and were employed in the development of the schedules listed below for the Financial Section of this report. The following supporting schedules were prepared by the system’s actuary for the Comprehensive Annual Financial Report:
Actuarial Section Summary of Actuarial Assumptions Summary of Unfunded Actuarial Liabilities Summary of Actuarial and Unfunded Actuarial Liabilities Reconciliation of Unfunded Actuarial Liabilities Membership Data
Financial Section Schedules of Funding Progress
We certify to the best of our knowledge, the methods and assumptions comply with generally recognized and accepted actuarial principals and practices set forth by the American Academy of Actuaries, are reasonable and represent our best estimate of the funding requirement to achieve the Retirement Systemʹs Funding Objective. Shelley is an Associate in the Society of Actuaries and Brad is a Fellow in the Society of Actuaries. We are members of the American Academy of Actuaries and meet the Qualification Standards of the American Academy of Actuaries to render the actuarial opinions contained herein.
Respectfully submitted,
FOSTER & FOSTER INC.
Shelley R. Johnson, ASA, MAAA Bradley R. Heinrichs, FSA, EA, MAAA
Foster & Foster, Actuaries and Consultants
Board of Trustees LASERS October 25, 2013 The present values shown in the June 30, 2013, actuarial valuation and supporting statistical schedules of this certification, which have been reformatted and comprise all the schedules of the Actuarial Section in the annual Financial Report, have been prepared in accordance with the actuarial methods specified in Louisiana Revised Statutes Title 11 Section 22(6) and assumptions which are appropriate for the purposes of this valuation. The funding method prescribed by state law is the Projected Unit Credit cost method. With this method, funding requirements, as a percentage of payroll, are expected to increase for plans that are closed to new entrants. The Entry Age Normal cost method would result in more level funding requirements for such plans. The Board has supported legislation allowing for the change to the Entry Age Normal cost method but until such legislation is passed, the plan must be funded using the Projected Unit Credit cost method. The 8.00% discount rate was recently reviewed and determined to be appropriate for purposes of the June 30, 2013, actuarial valuation for funding. The actuarial assumptions and methods used for funding purposes are within the parameters set forth by the Government Accounting Standards Board (GASB) Statement No. 25 and were employed in the development of the schedules listed below for the Financial Section of this report. The following supporting schedules were prepared by the system’s actuary for the Comprehensive Annual Financial Report:
Actuarial Section Summary of Actuarial Assumptions Summary of Unfunded Actuarial Liabilities Summary of Actuarial and Unfunded Actuarial Liabilities Reconciliation of Unfunded Actuarial Liabilities Membership Data
Financial Section Schedules of Funding Progress
We certify to the best of our knowledge, the methods and assumptions comply with generally recognized and accepted actuarial principals and practices set forth by the American Academy of Actuaries, are reasonable and represent our best estimate of the funding requirement to achieve the Retirement Systemʹs Funding Objective. Shelley is an Associate in the Society of Actuaries and Brad is a Fellow in the Society of Actuaries. We are members of the American Academy of Actuaries and meet the Qualification Standards of the American Academy of Actuaries to render the actuarial opinions contained herein.
Respectfully submitted,
FOSTER & FOSTER INC.
Shelley R. Johnson, ASA, MAAA Bradley R. Heinrichs, FSA, EA, MAAA
Foster & Foster, Actuaries and Consultants
Historical Membership Data (Dollar Amounts in Thousands)
Year Ending
6/30
Number of Participating Employers
Number of Active
Members
Pecentage Change In
Membership
Annual Active Member Payroll
Percentage Change In
Avg Payroll2005 352 64,168 0.03% 2,100,043$ 32,522$ 4.10%2006 360 57,811 -9.91% 1,979,705$ 33,231$ -5.70%2007 362 60,444 4.55% 2,175,367$ 35,799$ 7.73%2008 362 61,780 2.21% 2,436,956$ 39,218$ 9.55%2009 358 61,991 0.34% 2,562,576$ 41,085$ 4.76%2010 359 58,881 -5.02% 2,546,457$ 42,983$ 4.62%2011 354 54,930 -6.71% 2,408,840$ 43,606$ 1.45%2012 362 52,352 -4.69% 2,341,703$ 44,485$ 2.02%2013 355 44,111 -15.74% 1,951,988$ 43,957$ -1.19%2014 368 40,321 -8.59% 1,813,759$ 44,680$ 1.64%
History of Active Membership Data for Last 10 Years
Annual Active Member Average Payroll
No. Amount No. Amount No. Amount2005 37,015 609,764$ 2,775 61,985$ 2,051 34,342$ 16,473$ 2.7%2006 38,132 654,574$ 3,096 77,503$ 1,979 32,693$ 17,166$ 4.2%2007 39,366 721,333$ 2,839 68,972$ 1,605 2,213$ 18,324$ 6.7%2008 40,218 775,214$ 2,518 65,411$ 1,666 11,530$ 19,275$ 5.2%2009 40,936 804,455$ 2,418 65,127$ 1,700 35,886$ 19,652$ 2.0%2010 42,014 852,060$ 2,735 76,189$ 1,657 28,584$ 20,281$ 3.2%2011 43,711 923,617$ 3,307 96,480$ 1,610 24,923$ 21,130$ 4.2%2012 45,299 996,167$ 3,191 98,955$ 1,603 26,405$ 21,991$ 4.1%2013 47,517 1,076,245$ 3,929 113,668$ 1,711 33,590$ 22,650$ 3.0%2014 48,778 1,135,847$ 2,944 81,624$ 1,683 22,022$ 23,286$ 2.8%
Total Members Members Added Members Removed
History of Annuitants and Survivor Annuitant Membership for Last 10 Years
Year Ending
6/30
Percent Change in Annuity
Average Annuity

101Louisiana State Employees’ Retirement System
Actuarial Section Foster & Foster, Actuaries and Consultants
Board of Trustees LASERS October 25, 2013 The present values shown in the June 30, 2013, actuarial valuation and supporting statistical schedules of this certification, which have been reformatted and comprise all the schedules of the Actuarial Section in the annual Financial Report, have been prepared in accordance with the actuarial methods specified in Louisiana Revised Statutes Title 11 Section 22(6) and assumptions which are appropriate for the purposes of this valuation. The funding method prescribed by state law is the Projected Unit Credit cost method. With this method, funding requirements, as a percentage of payroll, are expected to increase for plans that are closed to new entrants. The Entry Age Normal cost method would result in more level funding requirements for such plans. The Board has supported legislation allowing for the change to the Entry Age Normal cost method but until such legislation is passed, the plan must be funded using the Projected Unit Credit cost method. The 8.00% discount rate was recently reviewed and determined to be appropriate for purposes of the June 30, 2013, actuarial valuation for funding. The actuarial assumptions and methods used for funding purposes are within the parameters set forth by the Government Accounting Standards Board (GASB) Statement No. 25 and were employed in the development of the schedules listed below for the Financial Section of this report. The following supporting schedules were prepared by the system’s actuary for the Comprehensive Annual Financial Report:
Actuarial Section Summary of Actuarial Assumptions Summary of Unfunded Actuarial Liabilities Summary of Actuarial and Unfunded Actuarial Liabilities Reconciliation of Unfunded Actuarial Liabilities Membership Data
Financial Section Schedules of Funding Progress
We certify to the best of our knowledge, the methods and assumptions comply with generally recognized and accepted actuarial principals and practices set forth by the American Academy of Actuaries, are reasonable and represent our best estimate of the funding requirement to achieve the Retirement Systemʹs Funding Objective. Shelley is an Associate in the Society of Actuaries and Brad is a Fellow in the Society of Actuaries. We are members of the American Academy of Actuaries and meet the Qualification Standards of the American Academy of Actuaries to render the actuarial opinions contained herein.
Respectfully submitted,
FOSTER & FOSTER INC.
Shelley R. Johnson, ASA, MAAA Bradley R. Heinrichs, FSA, EA, MAAA
Foster & Foster, Actuaries and Consultants
Board of Trustees LASERS October 25, 2013 The present values shown in the June 30, 2013, actuarial valuation and supporting statistical schedules of this certification, which have been reformatted and comprise all the schedules of the Actuarial Section in the annual Financial Report, have been prepared in accordance with the actuarial methods specified in Louisiana Revised Statutes Title 11 Section 22(6) and assumptions which are appropriate for the purposes of this valuation. The funding method prescribed by state law is the Projected Unit Credit cost method. With this method, funding requirements, as a percentage of payroll, are expected to increase for plans that are closed to new entrants. The Entry Age Normal cost method would result in more level funding requirements for such plans. The Board has supported legislation allowing for the change to the Entry Age Normal cost method but until such legislation is passed, the plan must be funded using the Projected Unit Credit cost method. The 8.00% discount rate was recently reviewed and determined to be appropriate for purposes of the June 30, 2013, actuarial valuation for funding. The actuarial assumptions and methods used for funding purposes are within the parameters set forth by the Government Accounting Standards Board (GASB) Statement No. 25 and were employed in the development of the schedules listed below for the Financial Section of this report. The following supporting schedules were prepared by the system’s actuary for the Comprehensive Annual Financial Report:
Actuarial Section Summary of Actuarial Assumptions Summary of Unfunded Actuarial Liabilities Summary of Actuarial and Unfunded Actuarial Liabilities Reconciliation of Unfunded Actuarial Liabilities Membership Data
Financial Section Schedules of Funding Progress
We certify to the best of our knowledge, the methods and assumptions comply with generally recognized and accepted actuarial principals and practices set forth by the American Academy of Actuaries, are reasonable and represent our best estimate of the funding requirement to achieve the Retirement Systemʹs Funding Objective. Shelley is an Associate in the Society of Actuaries and Brad is a Fellow in the Society of Actuaries. We are members of the American Academy of Actuaries and meet the Qualification Standards of the American Academy of Actuaries to render the actuarial opinions contained herein.
Respectfully submitted,
FOSTER & FOSTER INC.
Shelley R. Johnson, ASA, MAAA Bradley R. Heinrichs, FSA, EA, MAAA
Foster & Foster, Actuaries and Consultants Principal Provisions of the Plan
The Louisiana State Employees' Retirement System (LASERS) was enacted in 1947. Initially, the plan covered regular State Employees (Regular Plan), but membership has expanded to participating agencies, and the merger of Louisiana State University Administration Employees and the Judges Retirement System. The purpose of the plan is to provide benefits to members and their dependents at retirement or in the event of death, disability or termination of employment. LASERS is a defined benefit plan and is funded on an actuarial reserve basis to fund benefits as prescribed by law.
I. Administration
The plan is governed by Title 11 Sections 401-699 of the Louisiana Revised Statutes. The Board of Trustees is composed of thirteen members; six elected from the active membership, three elected retired members and four ex-officio members. Elected members serve staggered four-year terms. The treasurer, chairman of the House Retirement Committee, the chairman of the Senate Retirement Committee, and the commissioner of administration serve as voting, ex-officio members.
The Board of Trustees appoints an Executive Director who is responsible for the operation of the system. The Board also retains other consultants as deemed necessary.
II. Member Contributions
Members contribute a percentage of their gross compensation, depending on plan participation:
Plan Current Contribution Regular Employees and Appellate Law Clerks Pre-Act 75 (hired before 7/1/2006) 7.5% Post-Act 75 (hired after 6/30/2006) 8.0% Legislators 11.5% Judges hired before 1/1/2011 11.5% Judges hired after 12/31/2010 13.0% Corrections Primary and Secondary 9.0% Wildlife 9.5% Peace Officers & Alc/Tobacco Control Officers 9.0% Bridge Police 8.5% Hazardous Duty 9.5% Special Legislative Employees (Seargent at Arms, Secretary of Senate, Clerk of the House)
9.5%
III. Employer Contributions
All participating employers, regardless of plan participation, contribute a percentage of their total gross payroll to the system. The employer percentage is actuarially determined and is sufficient to pay annual accruals plus an amortization charge which liquidates the system's unfunded liability as required by law. The rate is determined annually and recommended by the Public Retirement Systems’ Actuarial Committee to the State Legislature.

102
Actuarial Section Foster & Foster, Actuaries and Consultants
Board of Trustees LASERS October 25, 2013 The present values shown in the June 30, 2013, actuarial valuation and supporting statistical schedules of this certification, which have been reformatted and comprise all the schedules of the Actuarial Section in the annual Financial Report, have been prepared in accordance with the actuarial methods specified in Louisiana Revised Statutes Title 11 Section 22(6) and assumptions which are appropriate for the purposes of this valuation. The funding method prescribed by state law is the Projected Unit Credit cost method. With this method, funding requirements, as a percentage of payroll, are expected to increase for plans that are closed to new entrants. The Entry Age Normal cost method would result in more level funding requirements for such plans. The Board has supported legislation allowing for the change to the Entry Age Normal cost method but until such legislation is passed, the plan must be funded using the Projected Unit Credit cost method. The 8.00% discount rate was recently reviewed and determined to be appropriate for purposes of the June 30, 2013, actuarial valuation for funding. The actuarial assumptions and methods used for funding purposes are within the parameters set forth by the Government Accounting Standards Board (GASB) Statement No. 25 and were employed in the development of the schedules listed below for the Financial Section of this report. The following supporting schedules were prepared by the system’s actuary for the Comprehensive Annual Financial Report:
Actuarial Section Summary of Actuarial Assumptions Summary of Unfunded Actuarial Liabilities Summary of Actuarial and Unfunded Actuarial Liabilities Reconciliation of Unfunded Actuarial Liabilities Membership Data
Financial Section Schedules of Funding Progress
We certify to the best of our knowledge, the methods and assumptions comply with generally recognized and accepted actuarial principals and practices set forth by the American Academy of Actuaries, are reasonable and represent our best estimate of the funding requirement to achieve the Retirement Systemʹs Funding Objective. Shelley is an Associate in the Society of Actuaries and Brad is a Fellow in the Society of Actuaries. We are members of the American Academy of Actuaries and meet the Qualification Standards of the American Academy of Actuaries to render the actuarial opinions contained herein.
Respectfully submitted,
FOSTER & FOSTER INC.
Shelley R. Johnson, ASA, MAAA Bradley R. Heinrichs, FSA, EA, MAAA
Foster & Foster, Actuaries and Consultants
Board of Trustees LASERS October 25, 2013 The present values shown in the June 30, 2013, actuarial valuation and supporting statistical schedules of this certification, which have been reformatted and comprise all the schedules of the Actuarial Section in the annual Financial Report, have been prepared in accordance with the actuarial methods specified in Louisiana Revised Statutes Title 11 Section 22(6) and assumptions which are appropriate for the purposes of this valuation. The funding method prescribed by state law is the Projected Unit Credit cost method. With this method, funding requirements, as a percentage of payroll, are expected to increase for plans that are closed to new entrants. The Entry Age Normal cost method would result in more level funding requirements for such plans. The Board has supported legislation allowing for the change to the Entry Age Normal cost method but until such legislation is passed, the plan must be funded using the Projected Unit Credit cost method. The 8.00% discount rate was recently reviewed and determined to be appropriate for purposes of the June 30, 2013, actuarial valuation for funding. The actuarial assumptions and methods used for funding purposes are within the parameters set forth by the Government Accounting Standards Board (GASB) Statement No. 25 and were employed in the development of the schedules listed below for the Financial Section of this report. The following supporting schedules were prepared by the system’s actuary for the Comprehensive Annual Financial Report:
Actuarial Section Summary of Actuarial Assumptions Summary of Unfunded Actuarial Liabilities Summary of Actuarial and Unfunded Actuarial Liabilities Reconciliation of Unfunded Actuarial Liabilities Membership Data
Financial Section Schedules of Funding Progress
We certify to the best of our knowledge, the methods and assumptions comply with generally recognized and accepted actuarial principals and practices set forth by the American Academy of Actuaries, are reasonable and represent our best estimate of the funding requirement to achieve the Retirement Systemʹs Funding Objective. Shelley is an Associate in the Society of Actuaries and Brad is a Fellow in the Society of Actuaries. We are members of the American Academy of Actuaries and meet the Qualification Standards of the American Academy of Actuaries to render the actuarial opinions contained herein.
Respectfully submitted,
FOSTER & FOSTER INC.
Shelley R. Johnson, ASA, MAAA Bradley R. Heinrichs, FSA, EA, MAAA
Foster & Foster, Actuaries and Consultants
IV. Termination
A member who terminates covered employment, regardless of plan membership, may request a refund of the member's contributions without interest. Upon re-employment, a member may reinstate the credit forfeited through termination of previous membership by repaying the refunded contributions plus interest. For members terminating with vested benefits, it is assumed that eighty percent will not withdraw their accumulated employee contribution, and will receive a benefit beginning at age 60.
V. Retirement Benefits
Service retirement benefits are payable to members who have terminated covered employment and met both age and service eligibility requirements.
1. Normal Retirement
Regular Plan – Members hired prior to July 1, 2006, may retire with a 2.5% annual accrual rate, at age 55 with 25 years, age 60 with 10 years or at any age with 30 years of service. Members hired on or after July 1, 2006, will be eligible at age 60 with 5 years of service.
Note: Members may retire with 20 years at any age with benefits actuarially reduced.
Judges – Judges hired prior to January 1, 2011 may retire with a 3.5% annual accrual rate at any age with 18 years of service, age 55 with 12 years, age 50 with 20 years (minimum 12 years judicial), age 65 with 10 years of service, or 70 without regard to creditable service. Judges hired on or after January 1, 2011 may retire with a 3.5% annual accrual rate with 5 years of service at age 60. Eligibility requirements apply to Appellate Law Clerks hired prior to January 1, 2011.
Legislators, Governor, Lieutenant Governor and State Treasurer - May retire with a 3.5% annual accrual rate with 16 years of legislative service; age 50 with 20 years (minimum 12 years legislative service) or age 55 with 12 years.
Correction Officers – Members of the Primary Component may retire with a 2.5% annual accrual rate at age 60 with 10 years of service, age 50 with 20 years , or 20 years of service regardless of age if employed prior to August 15, 1986. Effective January 1, 2002, new members accrue 3.33% per year and are eligible for retirement at 25 years of service regardless of age or age 60 with 10 years of service. Effective June 30, 2014, certain probation and parole officers in the office of adult services of the Department of Corrections who were employed prior to December 21, 2001 and did not join the Corrections Secondary plan may retire with a 3.0% accrual rate for service earned prior to June 30, 2014 and 3.33% for service earned after June 30, 2014.
Wildlife – Members hired prior to July 1, 2003 may retire at age 55 with 10 years of service, or at any age with 20 years. Benefit accrual rate is 3.0% for service earned prior to July 1, 2003 and 3.33% for service earned after July 1, 2003. Members hired on or after July 1, 2003 may retire at age 60 with 10 years or at any age with 25 years of service. Benefit accrual rate is 3.33%, or 2.5% if members retire with less than 10 years of wildlife service.
Peace Officers – Annual accrual rate is 3.33%. Eligibility is the same as regular members hired prior to July 1, 2006.

103Louisiana State Employees’ Retirement System
Actuarial Section Foster & Foster, Actuaries and Consultants
Board of Trustees LASERS October 25, 2013 The present values shown in the June 30, 2013, actuarial valuation and supporting statistical schedules of this certification, which have been reformatted and comprise all the schedules of the Actuarial Section in the annual Financial Report, have been prepared in accordance with the actuarial methods specified in Louisiana Revised Statutes Title 11 Section 22(6) and assumptions which are appropriate for the purposes of this valuation. The funding method prescribed by state law is the Projected Unit Credit cost method. With this method, funding requirements, as a percentage of payroll, are expected to increase for plans that are closed to new entrants. The Entry Age Normal cost method would result in more level funding requirements for such plans. The Board has supported legislation allowing for the change to the Entry Age Normal cost method but until such legislation is passed, the plan must be funded using the Projected Unit Credit cost method. The 8.00% discount rate was recently reviewed and determined to be appropriate for purposes of the June 30, 2013, actuarial valuation for funding. The actuarial assumptions and methods used for funding purposes are within the parameters set forth by the Government Accounting Standards Board (GASB) Statement No. 25 and were employed in the development of the schedules listed below for the Financial Section of this report. The following supporting schedules were prepared by the system’s actuary for the Comprehensive Annual Financial Report:
Actuarial Section Summary of Actuarial Assumptions Summary of Unfunded Actuarial Liabilities Summary of Actuarial and Unfunded Actuarial Liabilities Reconciliation of Unfunded Actuarial Liabilities Membership Data
Financial Section Schedules of Funding Progress
We certify to the best of our knowledge, the methods and assumptions comply with generally recognized and accepted actuarial principals and practices set forth by the American Academy of Actuaries, are reasonable and represent our best estimate of the funding requirement to achieve the Retirement Systemʹs Funding Objective. Shelley is an Associate in the Society of Actuaries and Brad is a Fellow in the Society of Actuaries. We are members of the American Academy of Actuaries and meet the Qualification Standards of the American Academy of Actuaries to render the actuarial opinions contained herein.
Respectfully submitted,
FOSTER & FOSTER INC.
Shelley R. Johnson, ASA, MAAA Bradley R. Heinrichs, FSA, EA, MAAA
Foster & Foster, Actuaries and Consultants
Board of Trustees LASERS October 25, 2013 The present values shown in the June 30, 2013, actuarial valuation and supporting statistical schedules of this certification, which have been reformatted and comprise all the schedules of the Actuarial Section in the annual Financial Report, have been prepared in accordance with the actuarial methods specified in Louisiana Revised Statutes Title 11 Section 22(6) and assumptions which are appropriate for the purposes of this valuation. The funding method prescribed by state law is the Projected Unit Credit cost method. With this method, funding requirements, as a percentage of payroll, are expected to increase for plans that are closed to new entrants. The Entry Age Normal cost method would result in more level funding requirements for such plans. The Board has supported legislation allowing for the change to the Entry Age Normal cost method but until such legislation is passed, the plan must be funded using the Projected Unit Credit cost method. The 8.00% discount rate was recently reviewed and determined to be appropriate for purposes of the June 30, 2013, actuarial valuation for funding. The actuarial assumptions and methods used for funding purposes are within the parameters set forth by the Government Accounting Standards Board (GASB) Statement No. 25 and were employed in the development of the schedules listed below for the Financial Section of this report. The following supporting schedules were prepared by the system’s actuary for the Comprehensive Annual Financial Report:
Actuarial Section Summary of Actuarial Assumptions Summary of Unfunded Actuarial Liabilities Summary of Actuarial and Unfunded Actuarial Liabilities Reconciliation of Unfunded Actuarial Liabilities Membership Data
Financial Section Schedules of Funding Progress
We certify to the best of our knowledge, the methods and assumptions comply with generally recognized and accepted actuarial principals and practices set forth by the American Academy of Actuaries, are reasonable and represent our best estimate of the funding requirement to achieve the Retirement Systemʹs Funding Objective. Shelley is an Associate in the Society of Actuaries and Brad is a Fellow in the Society of Actuaries. We are members of the American Academy of Actuaries and meet the Qualification Standards of the American Academy of Actuaries to render the actuarial opinions contained herein.
Respectfully submitted,
FOSTER & FOSTER INC.
Shelley R. Johnson, ASA, MAAA Bradley R. Heinrichs, FSA, EA, MAAA
Foster & Foster, Actuaries and Consultants
IV. Termination
A member who terminates covered employment, regardless of plan membership, may request a refund of the member's contributions without interest. Upon re-employment, a member may reinstate the credit forfeited through termination of previous membership by repaying the refunded contributions plus interest. For members terminating with vested benefits, it is assumed that eighty percent will not withdraw their accumulated employee contribution, and will receive a benefit beginning at age 60.
V. Retirement Benefits
Service retirement benefits are payable to members who have terminated covered employment and met both age and service eligibility requirements.
1. Normal Retirement
Regular Plan – Members hired prior to July 1, 2006, may retire with a 2.5% annual accrual rate, at age 55 with 25 years, age 60 with 10 years or at any age with 30 years of service. Members hired on or after July 1, 2006, will be eligible at age 60 with 5 years of service.
Note: Members may retire with 20 years at any age with benefits actuarially reduced.
Judges – Judges hired prior to January 1, 2011 may retire with a 3.5% annual accrual rate at any age with 18 years of service, age 55 with 12 years, age 50 with 20 years (minimum 12 years judicial), age 65 with 10 years of service, or 70 without regard to creditable service. Judges hired on or after January 1, 2011 may retire with a 3.5% annual accrual rate with 5 years of service at age 60. Eligibility requirements apply to Appellate Law Clerks hired prior to January 1, 2011.
Legislators, Governor, Lieutenant Governor and State Treasurer - May retire with a 3.5% annual accrual rate with 16 years of legislative service; age 50 with 20 years (minimum 12 years legislative service) or age 55 with 12 years.
Correction Officers – Members of the Primary Component may retire with a 2.5% annual accrual rate at age 60 with 10 years of service, age 50 with 20 years , or 20 years of service regardless of age if employed prior to August 15, 1986. Effective January 1, 2002, new members accrue 3.33% per year and are eligible for retirement at 25 years of service regardless of age or age 60 with 10 years of service. Effective June 30, 2014, certain probation and parole officers in the office of adult services of the Department of Corrections who were employed prior to December 21, 2001 and did not join the Corrections Secondary plan may retire with a 3.0% accrual rate for service earned prior to June 30, 2014 and 3.33% for service earned after June 30, 2014.
Wildlife – Members hired prior to July 1, 2003 may retire at age 55 with 10 years of service, or at any age with 20 years. Benefit accrual rate is 3.0% for service earned prior to July 1, 2003 and 3.33% for service earned after July 1, 2003. Members hired on or after July 1, 2003 may retire at age 60 with 10 years or at any age with 25 years of service. Benefit accrual rate is 3.33%, or 2.5% if members retire with less than 10 years of wildlife service.
Peace Officers – Annual accrual rate is 3.33%. Eligibility is the same as regular members hired prior to July 1, 2006.
Foster & Foster, Actuaries and Consultants
Retirement Benefits (continued)
Alcohol Tobacco Control – Annual accrual rate is 3.33%. Member’s eligibility to retire with 25 years of service at any age, age 60 with 10 years.
Bridge Police – Annual accrual rate is 2.5% with 10 years at age 60, or 25 years at any age. The last 10 years of service must be served as bridge police.
Hazardous Duty Plan –Annual accrual rate is 3.33%. Members are eligible to retire with 12 years at age 55. The last 10 years of service must be served in a hazardous duty position.
2. Benefit Formula
For all plans, monthly retirement benefits are based on a formula, which multiplies the final average compensation, by the applicable accrual rate, and by the years of creditable service, plus a $25 per month supplemental benefit for members hired prior to July 1, 1986. Final average compensation is determined as the highest successive 36 months for all but regular members hired on or after July 1, 2006, Judges whose first membership making them eligible for LASERS membership occurred on or after January 1, 2011, and members of the Hazardous Duty Plan. For these members final average compensation is determined as the highest successive sixty months.
3. Payment Options
A retiring member is entitled to receive the maximum benefit payable until member's death. In lieu of the maximum benefit, the member may elect to receive a reduced benefit payable in the form of a Joint and Survivor Option, or a reduced benefit with a lump-sum payment which cannot exceed 36 monthly benefit payments. In addition, beginning July 1, 2009, members may elect to receive a reduced benefit that will increase at 2.5% annually once the retiree attains age 55. This option is not available to recipients of disability retirement benefits.
Judges receive the maximum benefit payable without reduction for a 50% Joint and Survivor Option. Wildlife members receive the maximum benefit payable without reduction for a 75% Joint and Survivor Option.
VI. Deferred Retirement Option Program (DROP)
In lieu of terminating employment and accepting a service retirement, an eligible member may begin participation on the first retirement eligibility date or within 60 days thereafter, for a period not to exceed 36 months. Delayed participation reduces the 36 month participation period. During participation, benefits otherwise payable are fixed, and deposited in an individual DROP account.
Upon termination of DROP, the member may continue employment and earn additional accruals to be added to the fixed pre-DROP benefit.
Upon termination of employment, the member is entitled to the fixed benefit plus post-DROP accruals, plus the individual DROP account balance, which can be paid in a lump sum, or an additional annuity based upon the account balance.

104
Actuarial Section Foster & Foster, Actuaries and Consultants
Board of Trustees LASERS October 25, 2013 The present values shown in the June 30, 2013, actuarial valuation and supporting statistical schedules of this certification, which have been reformatted and comprise all the schedules of the Actuarial Section in the annual Financial Report, have been prepared in accordance with the actuarial methods specified in Louisiana Revised Statutes Title 11 Section 22(6) and assumptions which are appropriate for the purposes of this valuation. The funding method prescribed by state law is the Projected Unit Credit cost method. With this method, funding requirements, as a percentage of payroll, are expected to increase for plans that are closed to new entrants. The Entry Age Normal cost method would result in more level funding requirements for such plans. The Board has supported legislation allowing for the change to the Entry Age Normal cost method but until such legislation is passed, the plan must be funded using the Projected Unit Credit cost method. The 8.00% discount rate was recently reviewed and determined to be appropriate for purposes of the June 30, 2013, actuarial valuation for funding. The actuarial assumptions and methods used for funding purposes are within the parameters set forth by the Government Accounting Standards Board (GASB) Statement No. 25 and were employed in the development of the schedules listed below for the Financial Section of this report. The following supporting schedules were prepared by the system’s actuary for the Comprehensive Annual Financial Report:
Actuarial Section Summary of Actuarial Assumptions Summary of Unfunded Actuarial Liabilities Summary of Actuarial and Unfunded Actuarial Liabilities Reconciliation of Unfunded Actuarial Liabilities Membership Data
Financial Section Schedules of Funding Progress
We certify to the best of our knowledge, the methods and assumptions comply with generally recognized and accepted actuarial principals and practices set forth by the American Academy of Actuaries, are reasonable and represent our best estimate of the funding requirement to achieve the Retirement Systemʹs Funding Objective. Shelley is an Associate in the Society of Actuaries and Brad is a Fellow in the Society of Actuaries. We are members of the American Academy of Actuaries and meet the Qualification Standards of the American Academy of Actuaries to render the actuarial opinions contained herein.
Respectfully submitted,
FOSTER & FOSTER INC.
Shelley R. Johnson, ASA, MAAA Bradley R. Heinrichs, FSA, EA, MAAA
Foster & Foster, Actuaries and Consultants
Board of Trustees LASERS October 25, 2013 The present values shown in the June 30, 2013, actuarial valuation and supporting statistical schedules of this certification, which have been reformatted and comprise all the schedules of the Actuarial Section in the annual Financial Report, have been prepared in accordance with the actuarial methods specified in Louisiana Revised Statutes Title 11 Section 22(6) and assumptions which are appropriate for the purposes of this valuation. The funding method prescribed by state law is the Projected Unit Credit cost method. With this method, funding requirements, as a percentage of payroll, are expected to increase for plans that are closed to new entrants. The Entry Age Normal cost method would result in more level funding requirements for such plans. The Board has supported legislation allowing for the change to the Entry Age Normal cost method but until such legislation is passed, the plan must be funded using the Projected Unit Credit cost method. The 8.00% discount rate was recently reviewed and determined to be appropriate for purposes of the June 30, 2013, actuarial valuation for funding. The actuarial assumptions and methods used for funding purposes are within the parameters set forth by the Government Accounting Standards Board (GASB) Statement No. 25 and were employed in the development of the schedules listed below for the Financial Section of this report. The following supporting schedules were prepared by the system’s actuary for the Comprehensive Annual Financial Report:
Actuarial Section Summary of Actuarial Assumptions Summary of Unfunded Actuarial Liabilities Summary of Actuarial and Unfunded Actuarial Liabilities Reconciliation of Unfunded Actuarial Liabilities Membership Data
Financial Section Schedules of Funding Progress
We certify to the best of our knowledge, the methods and assumptions comply with generally recognized and accepted actuarial principals and practices set forth by the American Academy of Actuaries, are reasonable and represent our best estimate of the funding requirement to achieve the Retirement Systemʹs Funding Objective. Shelley is an Associate in the Society of Actuaries and Brad is a Fellow in the Society of Actuaries. We are members of the American Academy of Actuaries and meet the Qualification Standards of the American Academy of Actuaries to render the actuarial opinions contained herein.
Respectfully submitted,
FOSTER & FOSTER INC.
Shelley R. Johnson, ASA, MAAA Bradley R. Heinrichs, FSA, EA, MAAA
Foster & Foster, Actuaries and ConsultantsVII. Disability Retirement Benefits
Active members with ten or more years of service credit are eligible for disability retirement benefits if determined to be disabled from performing the duties of their job. Members receive a service retirement benefit based upon their accrued retirement benefit, except as specified below:
Judges – A service retirement benefit, but not less than 50% of current salary.
Corrections – Benefit for total disability incurred in-line-of-duty service is the greater of the accrued benefit or 40% of average compensation (60% for members of the Primary Plan). If a member of the Secondary Plan has 10 or more years of service, benefit is the greater of the accrued retirement benefit or 60% of final average compensation. Otherwise, benefit is the accrued retirement benefit.
Wildlife Agents – Minimum total disability incurred in-line-of-duty service is 60% of average compensation.
Hazardous Duty Plan– Total disability incurred in-line-of-duty benefit is 75% of average compensation.
VIII. Survivor Benefits
Members whose first employment which makes them eligible for membership in a Louisiana state retirement system occurs prior to January 1, 2011:
A surviving spouse with minor children of an active member with five years of creditable service (two years immediately prior to death) or 20 years of creditable service is entitled to a benefit equal to the greater of 1) $300 per month, or 2) 75% of the member's benefit calculated at the 2.5% accrual rate for all creditable service.
A surviving minor child, with no surviving spouse shall receive an amount equal to the greater of 75% of compensation or $300. Benefits to minors cease at attainment of age 18, marriage or age 23 if enrolled in an approved institution of higher education.
A surviving spouse without minor children of an active member with 10 years of creditable service (2 years immediately prior to death) or 20 years of creditable service is entitled to a benefit equal to the greater of 1) $200 per month, or 2) 50% of the member's benefit calculated at the 2.5% accrual rate for all creditable service.
Members whose first employment which makes them eligible for membership in a Louisiana state retirement system occurs on or after January 1, 2011:
A surviving spouse with minor children of an active member with five years of creditable service (two years immediately prior to death) or 20 years of creditable service is entitled to a benefit equal to the greater of 1) $600 per month, or 2) 50% of the member's accrued benefit. Each child receives 50% of the spouses benefit, up to 2 children. Minimum benefit based on the Option 2A equivalent for the surviving spouse.
A surviving minor child, with no surviving spouse shall receive an amount equal 50% of the benefit for surviving spouse with minor children, divided equally among all children.

105Louisiana State Employees’ Retirement System
Actuarial Section Foster & Foster, Actuaries and Consultants
Board of Trustees LASERS October 25, 2013 The present values shown in the June 30, 2013, actuarial valuation and supporting statistical schedules of this certification, which have been reformatted and comprise all the schedules of the Actuarial Section in the annual Financial Report, have been prepared in accordance with the actuarial methods specified in Louisiana Revised Statutes Title 11 Section 22(6) and assumptions which are appropriate for the purposes of this valuation. The funding method prescribed by state law is the Projected Unit Credit cost method. With this method, funding requirements, as a percentage of payroll, are expected to increase for plans that are closed to new entrants. The Entry Age Normal cost method would result in more level funding requirements for such plans. The Board has supported legislation allowing for the change to the Entry Age Normal cost method but until such legislation is passed, the plan must be funded using the Projected Unit Credit cost method. The 8.00% discount rate was recently reviewed and determined to be appropriate for purposes of the June 30, 2013, actuarial valuation for funding. The actuarial assumptions and methods used for funding purposes are within the parameters set forth by the Government Accounting Standards Board (GASB) Statement No. 25 and were employed in the development of the schedules listed below for the Financial Section of this report. The following supporting schedules were prepared by the system’s actuary for the Comprehensive Annual Financial Report:
Actuarial Section Summary of Actuarial Assumptions Summary of Unfunded Actuarial Liabilities Summary of Actuarial and Unfunded Actuarial Liabilities Reconciliation of Unfunded Actuarial Liabilities Membership Data
Financial Section Schedules of Funding Progress
We certify to the best of our knowledge, the methods and assumptions comply with generally recognized and accepted actuarial principals and practices set forth by the American Academy of Actuaries, are reasonable and represent our best estimate of the funding requirement to achieve the Retirement Systemʹs Funding Objective. Shelley is an Associate in the Society of Actuaries and Brad is a Fellow in the Society of Actuaries. We are members of the American Academy of Actuaries and meet the Qualification Standards of the American Academy of Actuaries to render the actuarial opinions contained herein.
Respectfully submitted,
FOSTER & FOSTER INC.
Shelley R. Johnson, ASA, MAAA Bradley R. Heinrichs, FSA, EA, MAAA
Foster & Foster, Actuaries and Consultants
Board of Trustees LASERS October 25, 2013 The present values shown in the June 30, 2013, actuarial valuation and supporting statistical schedules of this certification, which have been reformatted and comprise all the schedules of the Actuarial Section in the annual Financial Report, have been prepared in accordance with the actuarial methods specified in Louisiana Revised Statutes Title 11 Section 22(6) and assumptions which are appropriate for the purposes of this valuation. The funding method prescribed by state law is the Projected Unit Credit cost method. With this method, funding requirements, as a percentage of payroll, are expected to increase for plans that are closed to new entrants. The Entry Age Normal cost method would result in more level funding requirements for such plans. The Board has supported legislation allowing for the change to the Entry Age Normal cost method but until such legislation is passed, the plan must be funded using the Projected Unit Credit cost method. The 8.00% discount rate was recently reviewed and determined to be appropriate for purposes of the June 30, 2013, actuarial valuation for funding. The actuarial assumptions and methods used for funding purposes are within the parameters set forth by the Government Accounting Standards Board (GASB) Statement No. 25 and were employed in the development of the schedules listed below for the Financial Section of this report. The following supporting schedules were prepared by the system’s actuary for the Comprehensive Annual Financial Report:
Actuarial Section Summary of Actuarial Assumptions Summary of Unfunded Actuarial Liabilities Summary of Actuarial and Unfunded Actuarial Liabilities Reconciliation of Unfunded Actuarial Liabilities Membership Data
Financial Section Schedules of Funding Progress
We certify to the best of our knowledge, the methods and assumptions comply with generally recognized and accepted actuarial principals and practices set forth by the American Academy of Actuaries, are reasonable and represent our best estimate of the funding requirement to achieve the Retirement Systemʹs Funding Objective. Shelley is an Associate in the Society of Actuaries and Brad is a Fellow in the Society of Actuaries. We are members of the American Academy of Actuaries and meet the Qualification Standards of the American Academy of Actuaries to render the actuarial opinions contained herein.
Respectfully submitted,
FOSTER & FOSTER INC.
Shelley R. Johnson, ASA, MAAA Bradley R. Heinrichs, FSA, EA, MAAA
Foster & Foster, Actuaries and ConsultantsSurvivor Benefits (continued) A surviving spouse without minor children of an active member with 10 years of creditable service (2 years immediately prior to death) or 20 years of creditable service is entitled to a benefit based on the Option 2A equivalent for the surviving spouse.
The Option 2A equivalent is an actuarially reduced benefit whereby 100% of the actuarially reduced benefit continues for the life of the beneficiary.
IX. Post-Retirement Increases
Provisions regarding future Permanent Benefit Increases (PBIs) were substantially changed by Act 399 of 2014. PBIs may be granted, if requested by the Board and approved with a two-thirds vote of both houses of legislature, provided there are sufficient funds in the Experience Account to fully fund the increase on an actuarial basis. Experience Account Credits/Debits: After allocation of the first $100,000,000 of investment experience gains to the Unfunded Accrued Liability, the Experience Account is credited with up to 50% of the remaining excess investment income, up to a maximum balance as described below. The $100,000,000 threshold is indexed based upon the increase in the actuarial value of assets. Excess investment income is investment income for the prior fiscal year in excess of the expected income based on the actuarial valuation rate for that fiscal year. Balances in the experience account accrue interest at the actuarial rate of return during the prior year, however, all credits are limited as follows: If the system’s funded ratio is less than 80%, the Experience Account is limited to the reserve necessary to grant one PBI. If the funded ratio is at least 80%, the Experience Account is limited to the reserve necessary to fund two PBI’s. The Experience Account is debited for the increase in actuarial accrued liability resulting from the increases. Permanent Benefit Increases: No increase can be granted if the legislature granted an increase in the preceding fiscal year, unless the system is 85% funded or greater. Additionally, PBI’s are limited to the lesser of the increase in the CPI-U for the twelve month period ending on the system’s valuation date, or an amount determined by the system’s funded ratio:
Funded Ratio PBI Increase Limit < 55% 0%
55% to <65% 1.5% 65% to <75% 2.0% 75% to <80% 2.5%
80% + 3.0% Beginning July 1, 2015, any increase is limited to the first $60,000 of a retiree’s annual benefit, increased annually by the CPI-U for the 12 month period ending in June. If the actuarial rate of return for the prior plan year is less than 8.25%, regardless of the discount rate, the increase is limited to the lesser of 2% or the amount described above. Eligibility Requirements: Benefits are restricted to those retirees who have attained the age of 60 and have been retired for at least one year. The age 60 requirement does not apply to disability retirees.

106
Actuarial Section Foster & Foster, Actuaries and Consultants
Board of Trustees LASERS October 25, 2013 The present values shown in the June 30, 2013, actuarial valuation and supporting statistical schedules of this certification, which have been reformatted and comprise all the schedules of the Actuarial Section in the annual Financial Report, have been prepared in accordance with the actuarial methods specified in Louisiana Revised Statutes Title 11 Section 22(6) and assumptions which are appropriate for the purposes of this valuation. The funding method prescribed by state law is the Projected Unit Credit cost method. With this method, funding requirements, as a percentage of payroll, are expected to increase for plans that are closed to new entrants. The Entry Age Normal cost method would result in more level funding requirements for such plans. The Board has supported legislation allowing for the change to the Entry Age Normal cost method but until such legislation is passed, the plan must be funded using the Projected Unit Credit cost method. The 8.00% discount rate was recently reviewed and determined to be appropriate for purposes of the June 30, 2013, actuarial valuation for funding. The actuarial assumptions and methods used for funding purposes are within the parameters set forth by the Government Accounting Standards Board (GASB) Statement No. 25 and were employed in the development of the schedules listed below for the Financial Section of this report. The following supporting schedules were prepared by the system’s actuary for the Comprehensive Annual Financial Report:
Actuarial Section Summary of Actuarial Assumptions Summary of Unfunded Actuarial Liabilities Summary of Actuarial and Unfunded Actuarial Liabilities Reconciliation of Unfunded Actuarial Liabilities Membership Data
Financial Section Schedules of Funding Progress
We certify to the best of our knowledge, the methods and assumptions comply with generally recognized and accepted actuarial principals and practices set forth by the American Academy of Actuaries, are reasonable and represent our best estimate of the funding requirement to achieve the Retirement Systemʹs Funding Objective. Shelley is an Associate in the Society of Actuaries and Brad is a Fellow in the Society of Actuaries. We are members of the American Academy of Actuaries and meet the Qualification Standards of the American Academy of Actuaries to render the actuarial opinions contained herein.
Respectfully submitted,
FOSTER & FOSTER INC.
Shelley R. Johnson, ASA, MAAA Bradley R. Heinrichs, FSA, EA, MAAA
Foster & Foster, Actuaries and Consultants
Board of Trustees LASERS October 25, 2013 The present values shown in the June 30, 2013, actuarial valuation and supporting statistical schedules of this certification, which have been reformatted and comprise all the schedules of the Actuarial Section in the annual Financial Report, have been prepared in accordance with the actuarial methods specified in Louisiana Revised Statutes Title 11 Section 22(6) and assumptions which are appropriate for the purposes of this valuation. The funding method prescribed by state law is the Projected Unit Credit cost method. With this method, funding requirements, as a percentage of payroll, are expected to increase for plans that are closed to new entrants. The Entry Age Normal cost method would result in more level funding requirements for such plans. The Board has supported legislation allowing for the change to the Entry Age Normal cost method but until such legislation is passed, the plan must be funded using the Projected Unit Credit cost method. The 8.00% discount rate was recently reviewed and determined to be appropriate for purposes of the June 30, 2013, actuarial valuation for funding. The actuarial assumptions and methods used for funding purposes are within the parameters set forth by the Government Accounting Standards Board (GASB) Statement No. 25 and were employed in the development of the schedules listed below for the Financial Section of this report. The following supporting schedules were prepared by the system’s actuary for the Comprehensive Annual Financial Report:
Actuarial Section Summary of Actuarial Assumptions Summary of Unfunded Actuarial Liabilities Summary of Actuarial and Unfunded Actuarial Liabilities Reconciliation of Unfunded Actuarial Liabilities Membership Data
Financial Section Schedules of Funding Progress
We certify to the best of our knowledge, the methods and assumptions comply with generally recognized and accepted actuarial principals and practices set forth by the American Academy of Actuaries, are reasonable and represent our best estimate of the funding requirement to achieve the Retirement Systemʹs Funding Objective. Shelley is an Associate in the Society of Actuaries and Brad is a Fellow in the Society of Actuaries. We are members of the American Academy of Actuaries and meet the Qualification Standards of the American Academy of Actuaries to render the actuarial opinions contained herein.
Respectfully submitted,
FOSTER & FOSTER INC.
Shelley R. Johnson, ASA, MAAA Bradley R. Heinrichs, FSA, EA, MAAA
This page left blank intentionally.

Statistical Section
Strawberry Louisiana State Fruit
StatisticalSection
ContentsSummary 107Changes in Fiduciary Net Position 108Valuation Assets vs. Pension Liabilities 110Employee Contribution Rates 111Employer Contribution Rates 112Benefit Expenses by Type 113Average Monthly Benefit Amounts 115
LASERS Membership 135LASERS Changes in Membership 135Number of Benefit Recipients 136Retired Members by Recipient Type and Plan 137Fiscal Year 2014 Gross Benefits Paid by Region 140Location of LASERS Benefit Recipients 142

107Louisiana State Employees’ Retirement System
Statistical Section
Summary The objective of the Statistical Section is to provide financial statement users with a historical perspective, context, and detail to assist in using the information in the financial statements and the notes to the financial statements to better understand and assess LASERS economic condition. All non‐accounting data is taken from LASERS internal sources except for that information which is derived from actuarial valuations. Financial Trends The schedules listed below provide financial trend information that assists users in understanding and assessing how LASERS financial position has changed over time:
Changes in Fiduciary Net Position Valuation Assets vs. Pension Liabilities Employee Contribution Rates Employer Contribution Rates
Operational Information The schedules listed below are intended to provide contextual information about LASERS operations to assist in assessing the System’s economic condition:
Benefit Expenses by Type Average Monthly Benefit Amounts LASERS Membership LASERS Changes In Membership Number of Benefit Recipients Retired Members by Recipient Type and Plan
Demographic Information This information is intended to assist readers in understanding the environment in which LASERS operates. The demographic information includes:
Fiscal Year 2014 Gross Benefits Paid by Region Location of LASERS Benefit Recipients

108
Statistical Section
Changes in Fiduciary Net Position
For the Ten Years Ended June 30, 2014
2005
2006
2007
2008
2009
Additions (Reductions):
Employ
er Con
tributions
392,409,258
$
411,907,909
$
417,059,370
$
506,484,759
$
487,353,901
$
Employ
ee Con
tributions
169,143,849
165,509,666
167,957,870
192,412,444
203,050,933
Le
gislative App
ropriatio
n‐
13,600,000
‐
20,000,000
‐
Investment Incom
e:From Investment Activities
Net In
vestment Incom
e648,439,250
831,543,975
1,471,903,775
(358,893,780)
(1,740,923,309)
Other In
come
36,824,466
32,457,872
11,555,274
15,701,647
13,149,187
Total Additions (Reductions) to Fiduciary Net Position
1,246,816,823
$ 1,455,019,422
$ 2,068,476,289
$ 375,705,070
$
(1,037,369,288)
$
Deductions
Re
tirem
ent B
enefits
581,665,163
$
620,367,483
$
673,617,033
$
718,303,319
$
771,408,255
$
Re
fund
s an
d Tran
sfers of M
ember C
ontributions
30,357,552
37,821,549
38,030,600
32,149,383
30,314,007
Adm
inistrative Ex
penses
15,977,447
13,633,431
13,572,469
14,921,172
14,152,251
Other Postemploy
ment B
enefits Exp
enses
‐
‐
‐
2,350,000
2,279,986
Dep
reciation an
d Amortiz
ation Ex
penses
750,268
744,134
616,163
1,240,974
2,030,618
Total Deductions from Fiduciary Net Position
628,750,430
$
672,566,597
$
725,836,265
$
768,964,848
$
820,185,117
$
Total Change in Fiduciary Net Position
618,066,393
$
782,452,825
$
1,342,640,024
$ (393,259,778)
$
(1,857,554,405)
$

109Louisiana State Employees’ Retirement System
Statistical Section
Changes in Fiduciary Net Position (continued)
For the Ten Years Ended June 30, 2014
Additions (Reductions):
Employ
er Con
tributions
Employ
ee Con
tributions
Le
gislative App
ropriatio
nInvestment Incom
e:From Investment Activities
Net In
vestment Incom
eOther In
come
Total Additions (Reductions) to Fiduciary Net Position
Deductions
Re
tirem
ent B
enefits
Re
fund
s an
d Tran
sfers of M
ember C
ontributions
Adm
inistrative Ex
penses
Other Postemploy
ment B
enefits Exp
enses
Dep
reciation an
d Amortiz
ation Ex
penses
Total Deductions from Fiduciary Net Position
Total Change in Fiduciary Net Position
2010
2011
2012
2013
2014
491,237,641
$
558,183,107
$
637,285,920
$
649,029,708
$
612,698,414
$
205,328,033
197,825,267
192,795,057
173,357,802
152,993,052
‐
‐
‐
‐
2,465,608
1,128,126,909
1,852,933,704
(11,299,929)
1,104,747,865
1,770,669,130
12,153,663
14,072,770
32,441,258
33,806,894
20,810,679
1,836,846,246
$ 2,623,014,848
$ 851,222,306
$
1,960,942,269
$ 2,559,636,883
$
829,236,652
$
915,840,721
$
978,971,262
$
1,070,410,859
$ 1,167,477,166
$ 35,676,509
41,553,896
43,221,742
61,522,162
77,118,765
13,891,799
13,572,253
13,810,702
14,258,832
14,810,539
1,561,605
1,310,517
999,650
982,754
1,103,488
2,134,303
1,919,585
1,941,249
1,943,653
1,724,101
882,500,868
$
974,196,972
$
1,038,944,605
$ 1,149,118,260
$ 1,262,234,059
$ 954,345,378
$
1,648,817,876
$ (187,722,299)
$
811,824,009
$
1,297,402,824
$
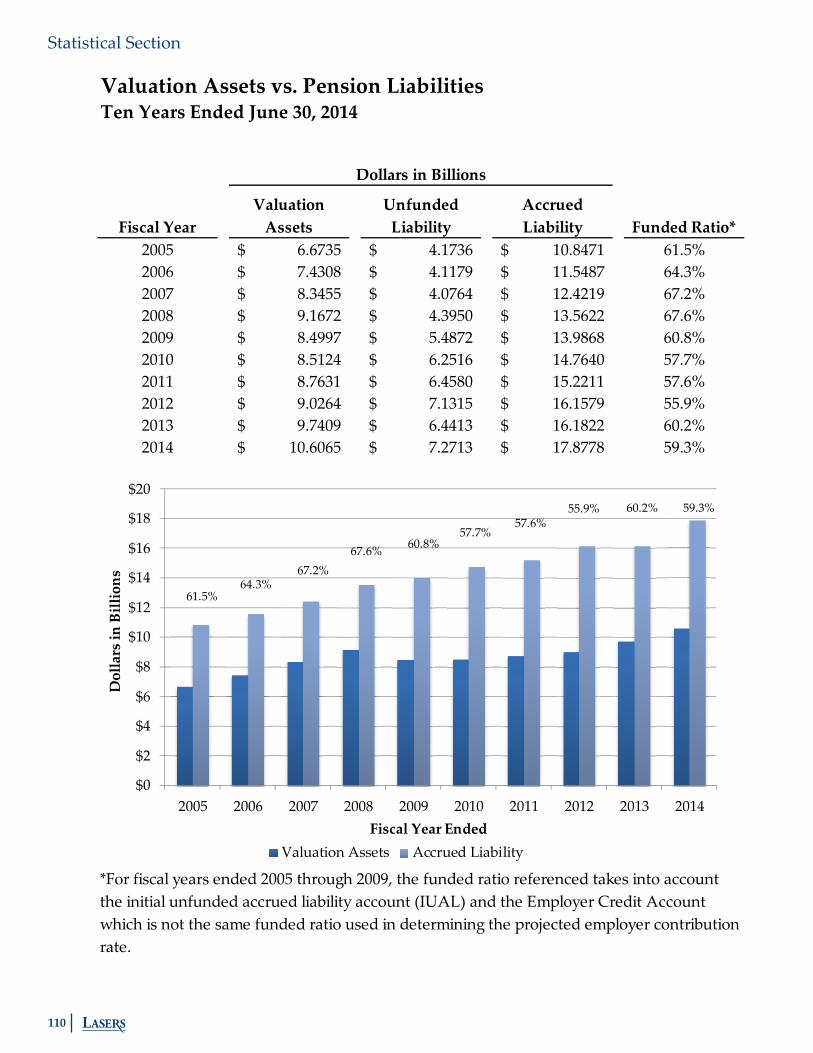
110
Statistical Section
Valuation Assets vs. Pension Liabilities
Fiscal YearValuation Assets
Unfunded Liability
Accrued Liability Funded Ratio*
2005 6.6735$ 4.1736$ 10.8471$ 61.5%2006 7.4308$ 4.1179$ 11.5487$ 64.3%2007 8.3455$ 4.0764$ 12.4219$ 67.2%2008 9.1672$ 4.3950$ 13.5622$ 67.6%2009 8.4997$ 5.4872$ 13.9868$ 60.8%2010 8.5124$ 6.2516$ 14.7640$ 57.7%2011 8.7631$ 6.4580$ 15.2211$ 57.6%2012 9.0264$ 7.1315$ 16.1579$ 55.9%2013 9.7409$ 6.4413$ 16.1822$ 60.2%2014 10.6065$ 7.2713$ 17.8778$ 59.3%
Ten Years Ended June 30, 2014
Dollars in Billions
*For fiscal years ended 2005 through 2009, the funded ratio referenced takes into account the initial unfunded accrued liability account (IUAL) and the Employer Credit Account which is not the same funded ratio used in determining the projected employer contribution rate.
$0
$2
$4
$6
$8
$10
$12
$14
$16
$18
$20
2005 2006 2007 2008 2009 2010 2011 2012 2013 2014
Dollars in Billions
Fiscal Year EndedValuation Assets Accrued Liability
61.5%64.3%
67.2%67.6% 60.8%
57.7%57.6%
55.9% 60.2% 59.3%
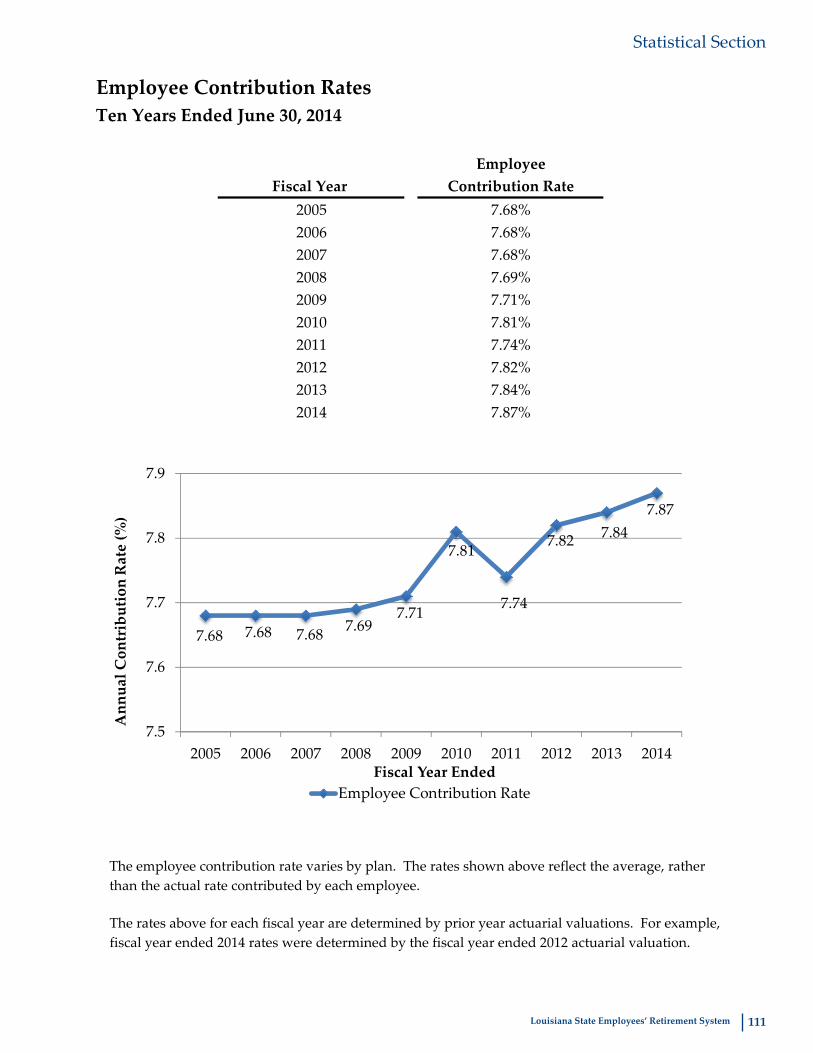
111Louisiana State Employees’ Retirement System
Statistical Section
Employee Contribution RatesTen Years Ended June 30, 2014
EmployeeFiscal Year Contribution Rate
2005 7.68%2006 7.68%2007 7.68%2008 7.69%2009 7.71%2010 7.81%2011 7.74%2012 7.82%2013 7.84%2014 7.87%
The employee contribution rate varies by plan. The rates shown above reflect the average, rather than the actual rate contributed by each employee.
The rates above for each fiscal year are determined by prior year actuarial valuations. For example, fiscal year ended 2014 rates were determined by the fiscal year ended 2012 actuarial valuation.
7.68 7.68 7.68 7.697.71
7.81
7.74
7.82 7.847.87
7.5
7.6
7.7
7.8
7.9
2005 2006 2007 2008 2009 2010 2011 2012 2013 2014
Annual Contribution Rate (%)
Fiscal Year EndedEmployee Contribution Rate

112
Statistical Section
Employer Contribution RatesTen Years Ended June 30, 2014
Employer Unfunded Total EmployerFiscal Year Normal Cost Accrued Liability Contribution Rate
2005 6.69% 11.11% 17.80%2006 7.08% 12.02% 19.10%2007 7.40% 11.70% 19.10%2008 7.49% 12.91% 20.40%2009 7.32% 11.18% 18.50%2010 7.31% 11.29% 18.60%2011 6.56% 15.44% 22.00%2012 6.98% 18.92% 25.90%2013 7.29% 22.11% 29.40%2014 6.10% 25.60% 31.70%
The rates above for each fiscal year are determined by prior year actuarial valuations. For example, fiscal year ended 2014 rates were determined by the fiscal year ended 2012 actuarial valuation, and reflect the composite employer normal cost and unfunded accrued liability rates for all plans within LASERS.
17.8019.10 19.10
20.4018.50 18.60
22.00
25.90
29.4031.70
11.11 12.02 11.711.70
11.18 11.18
15.44
18.92
22.11
25.60
6.69 7.08 7.40 7.49 7.32 7.31 6.56 6.98 7.296.105
10
15
20
25
30
35
2005 2006 2007 2008 2009 2010 2011 2012 2013 2014
Annual Contribution Rate (%)
Fiscal Year EndedEmployer Contribution Rate Unfunded Accrued LiabilityEmployer Normal Cost

113Louisiana State Employees’ Retirement System
Statistical Section
Benefit Expenses by Type
For the Ten Years Ended June 30, 2014
Type
2005
2006
2007
2008
2009
Benefits
Regular
457,521,300
$
493,538,492
$
543,463,747
$
585,239,345
$
631,155,812
$
Survivors
59,662,090
61,151,906
64,756,893
67,792,994
71,126,808
Deferred Retirement Option
47,091,359
48,744,710
49,038,361
49,321,773
53,226,087
Initial Benefit Option
3,338,644
2,481,107
1,230,820
957,668
1,242,870
Disability Benefits
14,051,770
14,451,268
15,127,212
14,991,539
14,656,678
Total Benefits
581,665,163
$
620,367,483
$
673,617,033
$
718,303,319
$
771,408,255
$
Refunds
Separation
23,661,815
$
32,356,236
$
32,468,625
$
22,951,994
$
23,078,248
$
Death
1,402,913
969,090
1,558,358
966,460
903,986
Total Refunds
25,064,728
$
33,325,326
$
34,026,983
$
23,918,454
$
23,982,234
$
Transfers to Other Systems
5,292,804
$
4,496,223
$
4,003,617
$
8,230,929
$
6,331,773
$
Total Refunds and Transfers
30,357,532
$
37,821,549
$
38,030,600
$
32,149,383
$
30,314,007
$

114
Statistical Section
Benefit Expenses by Type (continued)
For the Ten Years Ended June 30, 2014
Type
Benefits
Regular
Survivors
Deferred Retirement Option
Initial Benefit Option
Disability Benefits
Total Benefits
Refunds
Separation
Death
Total Refunds
Transfers to Other Systems
Total Refunds and Transfers
2010
2011
2012
2013
2014
668,581,029
$
733,039,471
$
791,945,615
$
872,055,895
$
965,434,718
$
74,482,830
77,667,823
79,190,930
81,755,704
83,901,456
69,287,299
88,056,162
90,928,480
99,350,219
101,306,705
1,566,842
1,966,560
1,686,544
1,618,364
1,537,741
15,318,652
15,110,705
15,219,693
15,630,677
15,296,546
829,236,652
$
915,840,721
$
978,971,262
$
1,070,410,859
$
1,167,477,166
$
29,724,211
$
34,393,711
$
38,575,552
$
52,012,078
$
66,904,948
$
1,395,156
1,445,450
954,378
2,235,860
1,604,857
31,119,367
$
35,839,161
$
39,529,930
$
54,247,938
$
68,509,805
$
4,557,142
$
5,714,735
$
3,691,812
$
7,274,224
$
8,608,960
$
35,676,509
$
41,553,896
$
43,221,742
$
61,522,162
$
77,118,765
$

115Louisiana State Employees’ Retirement System
Statistical Section
Average Monthly Benefit AmountsTen Years Ended June 30, 2014
Summary of All Retirees
<5 5 ‐ 10 10 ‐ 15 15 ‐ 20 20 ‐ 25 25 ‐ 30 30 ‐ 35 35 ‐ 40 40+All
MembersAverage Benefit Received 548$ 760$ 810$ 1,231$ 1,571$ 2,186$ 2,750$ 3,454$ 3,457$ 1,908$ Average Final Average Compensation 2,129$ 2,786$ 2,561$ 2,780$ 3,165$ 3,293$ 3,570$ 4,202$ 4,119$ 3,190$ Number of Retirees 118 360 7,142 6,067 9,375 10,443 11,340 1,742 353 46,940Average Benefit Received 538$ 805$ 786$ 1,188$ 1,519$ 2,106$ 2,667$ 3,320$ 3,372$ 1,844$ Average Final Average Compensation 2,383$ 2,675$ 2,638$ 2,876$ 3,154$ 3,334$ 3,641$ 4,224$ 4,114$ 3,237$ Number of Retirees 124 293 6,982 5,984 8,911 10,149 10,961 1,666 355 45,425Average Benefit Received 564$ 889$ 767$ 1,148$ 1,460$ 2,026$ 2,575$ 3,154$ 3,237$ 1,771$ Average Final Average Compensation 2,496$ 2,345$ 2,516$ 2,732$ 2,904$ 3,158$ 3,471$ 3,844$ 3,687$ 3,048$ Number of Retirees 132 235 6,745 5,770 8,160 9,589 10,217 1,539 335 42,722Average Benefit Received 579$ 906$ 754$ 1,112$ 1,417$ 1,961$ 2,491$ 3,043$ 3,189$ 1,705$ Average Final Average Compensation 2,517$ 2,282$ 2,474$ 2,675$ 2,827$ 3,067$ 3,368$ 3,701$ 3,593$ 2,961$ Number of Retirees 138 235 6,637 5,676 7,895 9,246 9,545 1,439 331 41,142Average Benefit Received 605$ 860$ 736$ 1,080$ 1,380$ 1,893$ 2,413$ 2,846$ 3,062$ 1,636$ Average Final Average Compensation 2,456$ 2,218$ 2,437$ 2,620$ 2,751$ 2,987$ 3,267$ 3,466$ 3,518$ 2,876$ Number of Retirees 140 234 6,497 5,577 7,629 8,772 8,887 1,337 312 39,385Average Benefit Received 618$ 813$ 722$ 1,058$ 1,350$ 1,839$ 2,355$ 2,750$ 3,041$ 1,588$ Average Final Average Compensation 2,529$ 2,251$ 2,417$ 2,604$ 2,705$ 2,932$ 3,197$ 3,379$ 3,497$ 2,827$ Number of Retirees 144 242 6,413 5,488 7,478 8,431 8,457 1,281 319 38,253Average Benefit Received 589$ 837$ 726$ 1,044$ 1,337$ 1,809$ 2,311$ 2,722$ 2,958$ 1,559$ Average Final Average Compensation 2,503$ 2,194$ 2,404$ 2,558$ 2,675$ 2,883$ 3,146$ 3,312$ 3,385$ 2,783$ Number of Retirees 141 252 6,365 5,467 7,449 8,178 8,130 1,278 315 37,575Average Benefit Received 775$ 930$ 700$ 1,024$ 1,283$ 1,767$ 2,337$ 2,801$ 3,002$ 1,543$ Average Final Average Compensation 2,344$ 2,087$ 2,368$ 2,472$ 2,662$ 2,899$ 3,198$ 3,453$ 3,388$ 2,781$ Number of Retirees 101 237 6,223 5,423 7,262 7,947 7,918 1,308 323 36,742Average Benefit Received 716$ 875$ 661$ 959$ 1,207$ 1,672$ 2,216$ 2,638$ 2,860$ 1,450$ Average Final Average Compensation 2,318$ 2,020$ 2,374$ 2,447$ 2,622$ 2,861$ 3,134$ 3,340$ 3,310$ 2,739$ Number of Retirees 97 230 6,080 5,364 7,130 7,569 7,517 1,254 314 35,555Average Benefit Received 718$ 867$ 656$ 940$ 1,178$ 1,600$ 2,113$ 2,486$ 2,685$ 1,389$ Average Final Average Compensation 1,876$ 1,966$ 2,371$ 2,425$ 2,600$ 2,843$ 3,077$ 3,225$ 3,277$ 2,704$ Number of Retirees 117 229 5,891 5,335 6,917 7,090 7,112 1,194 320 34,205
Ten Years Ended June 30, 2014 Average Benefit Received 618$ 848$ 734$ 1,082$ 1,381$ 1,907$ 2,452$ 2,958$ 3,095$ 1,655$ Average Final Average Compensation 2,369$ 2,316$ 2,461$ 2,625$ 2,825$ 3,045$ 3,335$ 3,658$ 3,601$ 2,932$
2005
2013
Years of Service Credit
2012
2007
2014
2006
2011
2010
2009
2008

116
Statistical Section
Average Monthly Benefit Amounts (continued)Ten Years Ended June 30, 2014
Summary of Regular State Employees
<5 5 ‐ 10 10 ‐ 15 15 ‐ 20 20 ‐ 25 25 ‐ 30 30 ‐ 35 35 ‐ 40 40+All
MembersAverage Benefit Received 363$ 522$ 800$ 1,237$ 1,559$ 2,210$ 2,827$ 3,643$ 3,546$ 2,017$ Average Final Average Compensation 1,834$ 2,805$ 2,680$ 2,856$ 3,257$ 3,315$ 3,651$ 4,392$ 4,147$ 3,303$ Number of Retirees 89 266 4,925 4,050 6,422 8,583 10,090 1,472 272 36,169Average Benefit Received 359$ 516$ 773$ 1,198$ 1,503$ 2,134$ 2,744$ 3,503$ 3,449$ 1,956$ Average Final Average Compensation 2,191$ 2,651$ 2,705$ 2,934$ 3,192$ 3,316$ 3,683$ 4,378$ 4,146$ 3,314$ Number of Retirees 94 197 4,756 3,972 5,952 8,356 9,752 1,417 279 34,775Average Benefit Received 410$ 521$ 752$ 1,151$ 1,437$ 2,051$ 2,653$ 3,353$ 3,356$ 1,882$ Average Final Average Compensation 2,318$ 2,087$ 2,566$ 2,763$ 2,877$ 3,126$ 3,511$ 3,987$ 3,743$ 3,104$ Number of Retirees 98 138 4,578 3,760 5,256 7,859 9,063 1,286 264 32,302Average Benefit Received 448$ 523$ 737$ 1,119$ 1,391$ 1,984$ 2,566$ 3,244$ 3,303$ 1,811$ Average Final Average Compensation 2,386$ 2,026$ 2,526$ 2,708$ 2,785$ 3,035$ 3,402$ 3,827$ 3,630$ 3,011$ Number of Retirees 100 130 4,485 3,660 5,030 7,542 8,441 1,194 258 30,840Average Benefit Received 541$ 512$ 720$ 1,088$ 1,354$ 1,917$ 2,492$ 3,032$ 3,162$ 1,740$ Average Final Average Compensation 2,382$ 1,992$ 2,498$ 2,657$ 2,706$ 2,950$ 3,300$ 3,582$ 3,510$ 2,922$ Number of Retirees 103 129 4,338 3,574 4,836 7,130 7,819 1,091 242 29,262Average Benefit Received 556$ 510$ 707$ 1,061$ 1,320$ 1,861$ 2,430$ 2,939$ 3,102$ 1,686$ Average Final Average Compensation 2,424$ 2,082$ 2,471$ 2,635$ 2,657$ 2,893$ 3,225$ 3,489$ 3,528$ 2,867$ Number of Retirees 107 137 4,281 3,512 4,733 6,861 7,432 1,041 255 28,359Average Benefit Received 537$ 519$ 699$ 1,042$ 1,297$ 1,820$ 2,384$ 2,898$ 3,078$ 1,648$ Average Final Average Compensation 2,455$ 2,076$ 2,448$ 2,604$ 2,634$ 2,849$ 3,170$ 3,411$ 3,399$ 2,824$ Number of Retirees 99 140 4,237 3,507 4,731 6,654 7,138 1,049 249 27,804Average Benefit Received 581$ 477$ 654$ 970$ 1,208$ 1,702$ 2,245$ 2,757$ 2,897$ 1,520$ Average Final Average Compensation 2,587$ 2,230$ 2,439$ 2,586$ 2,596$ 2,793$ 3,088$ 3,346$ 3,395$ 2,768$ Number of Retirees 83 131 4,629 3,922 4,958 6,625 6,952 1,066 259 28,625Average Benefit Received 563$ 450$ 620$ 913$ 1,138$ 1,608$ 2,124$ 2,587$ 2,756$ 1,429$ Average Final Average Compensation 2,648$ 2,207$ 2,456$ 2,589$ 2,573$ 2,754$ 3,025$ 3,221$ 3,343$ 2,735$ Number of Retirees 80 125 4,484 3,832 4,818 6,277 6,572 1,015 250 27,453Average Benefit Received 578$ 443$ 605$ 887$ 1,113$ 1,532$ 2,029$ 2,441$ 2,597$ 1,364$ Average Final Average Compensation 2,646$ 2,210$ 2,480$ 2,583$ 2,569$ 2,742$ 2,974$ 3,110$ 3,260$ 2,715$ Number of Retirees 81 120 4,293 3,814 4,684 5,845 6,185 958 250 26,230
Ten Years Ended June 30, 2014 Average Benefit Received 492$ 503$ 708$ 1,068$ 1,344$ 1,906$ 2,488$ 3,091$ 3,133$ 1,725$ Average Final Average Compensation 2,381$ 2,304$ 2,530$ 2,694$ 2,810$ 3,001$ 3,341$ 3,736$ 3,621$ 2,978$
Years of Service Credit
2013
2012
2011
2005
2014
2010
2009
2008
2007
2006

117Louisiana State Employees’ Retirement System
Statistical Section
Average Monthly Benefit Amounts (continued)Ten Years Ended June 30, 2014
Regular State Employees (Hired before July 1, 2006)
<5 5 ‐ 10 10 ‐ 15 15 ‐ 20 20 ‐ 25 25 ‐ 30 30 ‐ 35 35 ‐ 40 40+All
MembersAverage Benefit Received 364$ 586$ 798$ 1,237$ 1,558$ 2,209$ 2,827$ 3,643$ 3,546$ 2,023$ Average Final Average Compensation 1,794$ 2,105$ 2,674$ 2,856$ 3,255$ 3,314$ 3,651$ 4,392$ 4,147$ 3,302$ Number of Retirees 88 122 4,913 4,047 6,418 8,582 10,090 1,472 272 36,004Average Benefit Received 360$ 542$ 771$ 1,197$ 1,503$ 2,134$ 2,744$ 3,503$ 3,449$ 1,959$ Average Final Average Compensation 2,156$ 2,131$ 2,701$ 2,933$ 3,192$ 3,316$ 3,683$ 4,378$ 4,146$ 3,313$ Number of Retirees 93 125 4,750 3,969 5,951 8,356 9,752 1,417 279 34,692Average Benefit Received 411$ 529$ 752$ 1,151$ 1,437$ 2,051$ 2,653$ 3,353$ 3,356$ 1,883$ Average Final Average Compensation 2,287$ 2,068$ 2,566$ 2,763$ 2,877$ 3,126$ 3,511$ 3,987$ 3,743$ 3,105$ Number of Retirees 97 128 4,577 3,759 5,256 7,859 9,063 1,286 264 32,289Average Benefit Received 450$ 523$ 737$ 1,119$ 1,391$ 1,984$ 2,566$ 3,244$ 3,303$ 1,811$ Average Final Average Compensation 2,356$ 2,026$ 2,525$ 2,708$ 2,785$ 3,035$ 3,402$ 3,827$ 3,630$ 3,011$ Number of Retirees 99 130 4,484 3,659 5,030 7,542 8,441 1,194 258 30,837Average Benefit Received 541$ 512$ 720$ 1,088$ 1,354$ 1,917$ 2,492$ 3,032$ 3,162$ 1,740$ Average Final Average Compensation 2,382$ 1,992$ 2,498$ 2,657$ 2,706$ 2,950$ 3,300$ 3,582$ 3,510$ 2,922$ Number of Retirees 103 129 4,337 3,574 4,836 7,130 7,819 1,091 242 29,261Average Benefit Received 556$ 510$ 707$ 1,061$ 1,320$ 1,861$ 2,430$ 2,939$ 3,102$ 1,686$ Average Final Average Compensation 2,424$ 2,082$ 2,471$ 2,635$ 2,657$ 2,893$ 3,225$ 3,489$ 3,528$ 2,867$ Number of Retirees 107 137 4,281 3,512 4,733 6,861 7,432 1,041 255 28,359Average Benefit Received 537$ 519$ 699$ 1,042$ 1,297$ 1,820$ 2,384$ 2,898$ 3,078$ 1,648$ Average Final Average Compensation 2,455$ 2,076$ 2,448$ 2,604$ 2,634$ 2,849$ 3,170$ 3,411$ 3,399$ 2,824$ Number of Retirees 99 140 4,237 3,507 4,731 6,654 7,138 1,049 249 27,804Average Benefit Received 581$ 477$ 654$ 970$ 1,208$ 1,702$ 2,245$ 2,757$ 2,897$ 1,520$ Average Final Average Compensation 2,587$ 2,230$ 2,439$ 2,586$ 2,596$ 2,793$ 3,088$ 3,346$ 3,395$ 2,768$ Number of Retirees 83 131 4,629 3,922 4,958 6,625 6,952 1,066 259 28,625Average Benefit Received 563$ 450$ 620$ 913$ 1,138$ 1,608$ 2,124$ 2,587$ 2,756$ 1,429$ Average Final Average Compensation 2,648$ 2,207$ 2,456$ 2,589$ 2,573$ 2,754$ 3,025$ 3,221$ 3,343$ 2,735$ Number of Retirees 80 125 4,484 3,832 4,818 6,277 6,572 1,015 250 27,453Average Benefit Received 578$ 443$ 605$ 887$ 1,113$ 1,532$ 2,029$ 2,441$ 2,597$ 1,364$ Average Final Average Compensation 2,646$ 2,210$ 2,480$ 2,583$ 2,569$ 2,742$ 2,974$ 3,110$ 3,260$ 2,715$ Number of Retirees 81 120 4,293 3,814 4,684 5,845 6,185 958 250 26,230
Ten Years Ended June 30, 2014 Average Benefit Received 493$ 509$ 708$ 1,068$ 1,344$ 1,906$ 2,488$ 3,091$ 3,133$ 1,726$ Average Final Average Compensation 2,368$ 2,111$ 2,529$ 2,694$ 2,809$ 3,001$ 3,341$ 3,736$ 3,621$ 2,977$
Years of Service Credit
2011
2010
2012
2013
2014
2005
2009
2008
2007
2006

118
Statistical Section
Average Monthly Benefit Amounts (continued)
Regular State Employees 2 (Hired on or after July 1, 2006)
<5 5 ‐ 10 10 ‐ 15 15 ‐ 20 20 ‐ 25 25 ‐ 30 30 ‐ 35 35 ‐ 40 40+All
MembersAverage Benefit Received 299$ 469$ 1,537$ 1,701$ 2,455$ 9,200$ ‐$ ‐$ ‐$ 664$ Average Final Average Compensation 5,355$ 3,397$ 5,691$ 3,960$ 5,415$ 12,041$ ‐$ ‐$ ‐$ 3,675$ Number of Retirees 1 144 11 3 4 1 0 0 0 164Average Benefit Received 295$ 471$ 1,805$ 1,666$ 2,174$ ‐$ ‐$ ‐$ ‐$ 615$ Average Final Average Compensation 5,355$ 3,539$ 6,780$ 3,960$ 4,596$ ‐$ ‐$ ‐$ ‐$ 3,787$ Number of Retirees 1 72 5 3 1 0 0 0 0 82Average Benefit Received 295$ 411$ 876$ 723$ ‐$ ‐$ ‐$ ‐$ ‐$ 462$ Average Final Average Compensation 5,355$ 2,327$ 3,151$ 1,409$ ‐$ ‐$ ‐$ ‐$ ‐$ 2,553$ Number of Retirees 1 10 1 1 0 0 0 0 0 13Average Benefit Received 295$ ‐$ 876$ 711$ ‐$ ‐$ ‐$ ‐$ ‐$ 627$ Average Final Average Compensation 5,355$ ‐$ 3,151$ 1,409$ ‐$ ‐$ ‐$ ‐$ ‐$ 3,305$ Number of Retirees 1 0 1 1 0 0 0 0 0 3Average Benefit Received ‐$ ‐$ 876$ ‐$ ‐$ ‐$ ‐$ ‐$ ‐$ 876$ Average Final Average Compensation ‐$ ‐$ 3,151$ ‐$ ‐$ ‐$ ‐$ ‐$ ‐$ 3,151$ Number of Retirees 0 0 1 0 0 0 0 0 0 1Average Benefit Received No ActivityAverage Final Average Compensation No ActivityNumber of Retirees No Activity
Ten Years Ended June 30, 2014 Average Benefit Received 296$ 467$ 1,503$ 1,442$ 2,399$ 9,200$ ‐$ ‐$ ‐$ 641$
Average Final Average Compensation 5,355$ 3,395$ 5,577$ 3,322$ 5,251$ 12,041$ ‐$ ‐$ ‐$ 3,662$
2010
2005‐2009
Ten Years Ended June 30, 2014
Years of Service Credit
2013
2011
2012
2014

119Louisiana State Employees’ Retirement System
Statistical Section
Average Monthly Benefit Amounts (continued)
Regular State Employees 3 (Hired on or after January 1, 2011)
<5 5 ‐ 10 10 ‐ 15 15 ‐ 20 20 ‐ 25 25 ‐ 30 30 ‐ 35 35 ‐ 40 40+All
MembersAverage Benefit Received ‐$ ‐$ 1,168$ ‐$ ‐$ ‐$ ‐$ ‐$ ‐$ 1,168$ Average Final Average Compensation ‐$ ‐$ 3,405$ ‐$ ‐$ ‐$ ‐$ ‐$ ‐$ 3,405$ Number of Retirees 0 0 1 0 0 0 0 0 0 1Average Benefit Received ‐$ ‐$ 1,151$ ‐$ ‐$ ‐$ ‐$ ‐$ ‐$ 1,151$ Average Final Average Compensation ‐$ ‐$ 3,405$ ‐$ ‐$ ‐$ ‐$ ‐$ ‐$ 3,405$ Number of Retirees 0 0 1 0 0 0 0 0 0 1Average Benefit Received No ActivityAverage Final Average Compensation No Activity
Number of Retirees No Activity
Ten Years Ended June 30, 2014 Average Benefit Received ‐$ ‐$ 1,160$ ‐$ ‐$ ‐$ ‐$ ‐$ ‐$ 1,160$ Average Final Average Compensation ‐$ ‐$ 3,405$ ‐$ ‐$ ‐$ ‐$ ‐$ ‐$ 3,405$
Ten Years Ended June 30, 2014
2014
2013
2005‐2012
Years of Service Credit

120
Statistical Section
Average Monthly Benefit Amounts (continued)Ten Years Ended June 30, 2014
Summary of Corrections
<5 5 ‐ 10 10 ‐ 15 15 ‐ 20 20 ‐ 25 25 ‐ 30 30 ‐ 35 35 ‐ 40 40+All
MembersAverage Benefit Received ‐$ ‐$ 997$ 1,621$ 1,697$ 2,782$ 3,639$ 4,110$ 5,977$ 2,028$ Average Final Average Compensation ‐$ ‐$ 3,341$ 3,972$ 3,296$ 4,452$ 5,036$ 5,290$ 7,515$ 3,723$ Number of Retirees 0 0 112 118 1,078 424 107 8 3 1,850Average Benefit Received ‐$ ‐$ 972$ 1,594$ 1,665$ 2,657$ 3,562$ 4,330$ 4,542$ 1,952$ Average Final Average Compensation ‐$ ‐$ 3,305$ 3,954$ 3,243$ 4,320$ 4,969$ 5,575$ 5,577$ 3,629$ Number of Retirees 0 0 105 105 1,055 373 97 6 4 1,745Average Benefit Received 1,645$ ‐$ 966$ 1,574$ 1,622$ 2,552$ 3,495$ 4,256$ 4,542$ 1,886$ Average Final Average Compensation 3,474$ ‐$ 3,284$ 3,942$ 3,165$ 4,205$ 4,871$ 5,586$ 5,577$ 3,529$ Number of Retirees 1 0 86 93 1,036 337 84 5 4 1,646Average Benefit Received 1,645$ ‐$ 958$ 1,552$ 1,588$ 2,436$ 3,354$ 4,096$ 4,542$ 1,825$ Average Final Average Compensation 3,474$ ‐$ 3,267$ 3,904$ 3,090$ 4,000$ 4,605$ 5,135$ 5,577$ 3,405$ Number of Retirees 1 0 66 83 1,001 296 76 4 4 1,531Average Benefit Received 1,645$ ‐$ 874$ 1,424$ 1,526$ 2,362$ 3,290$ 3,980$ 4,542$ 1,758$ Average Final Average Compensation 3,474$ ‐$ 3,072$ 3,662$ 2,930$ 3,824$ 4,395$ 4,656$ 5,577$ 3,208$ Number of Retirees 1 0 33 48 915 250 58 3 4 1,312Average Benefit Received ‐$ ‐$ 850$ 1,309$ 1,494$ 2,326$ 3,201$ 3,980$ 4,542$ 1,723$ Average Final Average Compensation ‐$ ‐$ 2,996$ 3,452$ 2,843$ 3,685$ 4,294$ 4,656$ 5,577$ 3,090$ Number of Retirees 0 0 15 32 879 212 55 3 4 1,200Average Benefit Received ‐$ ‐$ 831$ 1,246$ 1,466$ 2,314$ 3,206$ 3,980$ 4,542$ 1,700$ Average Final Average Compensation ‐$ ‐$ 2,689$ 3,304$ 2,797$ 3,600$ 4,270$ 4,656$ 5,577$ 3,023$ Number of Retirees 0 0 10 16 860 195 53 3 4 1,141Average Benefit Received ‐$ ‐$ 672$ 1,297$ 1,425$ 2,187$ 3,081$ 3,909$ 4,429$ 1,646$ Average Final Average Compensation ‐$ ‐$ 2,237$ 3,020$ 2,732$ 3,528$ 4,211$ 4,656$ 5,451$ 2,954$ Number of Retirees 0 0 5 14 841 186 52 3 5 1,106Average Benefit Received ‐$ ‐$ 636$ 1,244$ 1,382$ 2,134$ 3,021$ 3,399$ 4,223$ 1,597$ Average Final Average Compensation ‐$ ‐$ 2,337$ 2,729$ 2,685$ 3,438$ 4,189$ 4,455$ 5,451$ 2,895$ Number of Retirees 0 0 2 9 802 169 49 2 5 1,038Average Benefit Received ‐$ ‐$ 635$ 1,194$ 1,341$ 2,070$ 2,925$ 2,637$ 4,222$ 1,538$ Average Final Average Compensation ‐$ ‐$ 2,337$ 2,671$ 2,638$ 3,394$ 4,073$ 2,805$ 5,451$ 2,833$ Number of Retirees 0 0 2 9 766 153 43 1 5 979
Ten Years Ended June 30, 2014 Average Benefit Received 1,645$ ‐$ 954$ 1,526$ 1,534$ 2,455$ 3,344$ 4,040$ 4,555$ 1,798$ Average Final Average Compensation 3,474$ ‐$ 3,241$ 3,804$ 2,968$ 3,968$ 4,595$ 5,048$ 5,670$ 3,296$
Years of Service Credit
2013
2012
2011
2005
2014
2010
2009
2008
2007
2006
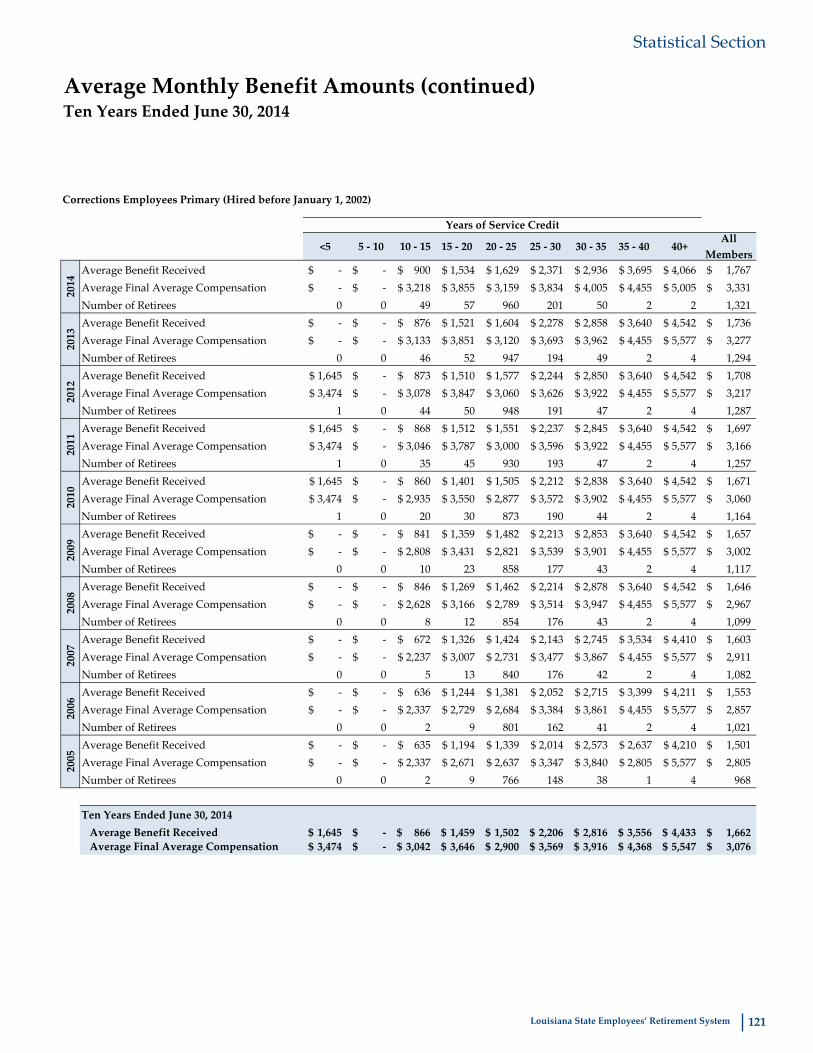
121Louisiana State Employees’ Retirement System
Statistical Section
Average Monthly Benefit Amounts (continued)Ten Years Ended June 30, 2014
Corrections Employees Primary (Hired before January 1, 2002)
<5 5 ‐ 10 10 ‐ 15 15 ‐ 20 20 ‐ 25 25 ‐ 30 30 ‐ 35 35 ‐ 40 40+All
MembersAverage Benefit Received ‐$ ‐$ 900$ 1,534$ 1,629$ 2,371$ 2,936$ 3,695$ 4,066$ 1,767$ Average Final Average Compensation ‐$ ‐$ 3,218$ 3,855$ 3,159$ 3,834$ 4,005$ 4,455$ 5,005$ 3,331$ Number of Retirees 0 0 49 57 960 201 50 2 2 1,321Average Benefit Received ‐$ ‐$ 876$ 1,521$ 1,604$ 2,278$ 2,858$ 3,640$ 4,542$ 1,736$ Average Final Average Compensation ‐$ ‐$ 3,133$ 3,851$ 3,120$ 3,693$ 3,962$ 4,455$ 5,577$ 3,277$ Number of Retirees 0 0 46 52 947 194 49 2 4 1,294Average Benefit Received 1,645$ ‐$ 873$ 1,510$ 1,577$ 2,244$ 2,850$ 3,640$ 4,542$ 1,708$ Average Final Average Compensation 3,474$ ‐$ 3,078$ 3,847$ 3,060$ 3,626$ 3,922$ 4,455$ 5,577$ 3,217$ Number of Retirees 1 0 44 50 948 191 47 2 4 1,287Average Benefit Received 1,645$ ‐$ 868$ 1,512$ 1,551$ 2,237$ 2,845$ 3,640$ 4,542$ 1,697$ Average Final Average Compensation 3,474$ ‐$ 3,046$ 3,787$ 3,000$ 3,596$ 3,922$ 4,455$ 5,577$ 3,166$ Number of Retirees 1 0 35 45 930 193 47 2 4 1,257Average Benefit Received 1,645$ ‐$ 860$ 1,401$ 1,505$ 2,212$ 2,838$ 3,640$ 4,542$ 1,671$ Average Final Average Compensation 3,474$ ‐$ 2,935$ 3,550$ 2,877$ 3,572$ 3,902$ 4,455$ 5,577$ 3,060$ Number of Retirees 1 0 20 30 873 190 44 2 4 1,164Average Benefit Received ‐$ ‐$ 841$ 1,359$ 1,482$ 2,213$ 2,853$ 3,640$ 4,542$ 1,657$ Average Final Average Compensation ‐$ ‐$ 2,808$ 3,431$ 2,821$ 3,539$ 3,901$ 4,455$ 5,577$ 3,002$ Number of Retirees 0 0 10 23 858 177 43 2 4 1,117Average Benefit Received ‐$ ‐$ 846$ 1,269$ 1,462$ 2,214$ 2,878$ 3,640$ 4,542$ 1,646$ Average Final Average Compensation ‐$ ‐$ 2,628$ 3,166$ 2,789$ 3,514$ 3,947$ 4,455$ 5,577$ 2,967$ Number of Retirees 0 0 8 12 854 176 43 2 4 1,099Average Benefit Received ‐$ ‐$ 672$ 1,326$ 1,424$ 2,143$ 2,745$ 3,534$ 4,410$ 1,603$ Average Final Average Compensation ‐$ ‐$ 2,237$ 3,007$ 2,731$ 3,477$ 3,867$ 4,455$ 5,577$ 2,911$ Number of Retirees 0 0 5 13 840 176 42 2 4 1,082Average Benefit Received ‐$ ‐$ 636$ 1,244$ 1,381$ 2,052$ 2,715$ 3,399$ 4,211$ 1,553$ Average Final Average Compensation ‐$ ‐$ 2,337$ 2,729$ 2,684$ 3,384$ 3,861$ 4,455$ 5,577$ 2,857$ Number of Retirees 0 0 2 9 801 162 41 2 4 1,021Average Benefit Received ‐$ ‐$ 635$ 1,194$ 1,339$ 2,014$ 2,573$ 2,637$ 4,210$ 1,501$ Average Final Average Compensation ‐$ ‐$ 2,337$ 2,671$ 2,637$ 3,347$ 3,840$ 2,805$ 5,577$ 2,805$ Number of Retirees 0 0 2 9 766 148 38 1 4 968
Ten Years Ended June 30, 2014 Average Benefit Received 1,645$ ‐$ 866$ 1,459$ 1,502$ 2,206$ 2,816$ 3,556$ 4,433$ 1,662$ Average Final Average Compensation 3,474$ ‐$ 3,042$ 3,646$ 2,900$ 3,569$ 3,916$ 4,368$ 5,547$ 3,076$
2005
2010
2009
2008
2007
2006
Years of Service Credit
2011
2012
2013
2014

122
Statistical Section
Average Monthly Benefit Amounts (continued)Ten Years Ended June 30, 2014
Corrections Employees Secondary (Hired on or after January 1, 2002)
<5 5 ‐ 10 10 ‐ 15 15 ‐ 20 20 ‐ 25 25 ‐ 30 30 ‐ 35 35 ‐ 40 40+All
MembersAverage Benefit Received ‐$ ‐$ 1,072$ 1,703$ 2,249$ 3,152$ 4,255$ 4,248$ 9,800$ 2,680$ Average Final Average Compensation ‐$ ‐$ 3,436$ 4,082$ 4,407$ 5,008$ 5,942$ 5,569$ 12,534$ 4,701$ Number of Retirees 0 0 63 61 118 223 57 6 1 529Average Benefit Received ‐$ ‐$ 1,047$ 1,667$ 2,193$ 3,067$ 4,280$ 4,676$ ‐$ 2,572$ Average Final Average Compensation ‐$ ‐$ 3,440$ 4,055$ 4,323$ 4,999$ 5,997$ 6,135$ ‐$ 4,639$ Number of Retirees 0 0 59 53 108 179 48 4 0 451Average Benefit Received ‐$ ‐$ 1,062$ 1,648$ 2,106$ 2,954$ 4,338$ 4,667$ ‐$ 2,525$ Average Final Average Compensation ‐$ ‐$ 3,495$ 4,050$ 4,282$ 4,962$ 6,111$ 6,340$ ‐$ 4,644$ Number of Retirees 0 0 42 43 88 146 37 3 0 359Average Benefit Received ‐$ ‐$ 1,059$ 1,598$ 2,068$ 2,806$ 4,207$ 4,553$ ‐$ 2,411$ Average Final Average Compensation ‐$ ‐$ 3,517$ 4,040$ 4,264$ 4,752$ 5,752$ 5,815$ ‐$ 4,501$ Number of Retirees 0 0 31 38 71 103 29 2 0 274Average Benefit Received ‐$ ‐$ 896$ 1,461$ 1,950$ 2,839$ 4,711$ 4,661$ ‐$ 2,438$ Average Final Average Compensation ‐$ ‐$ 3,282$ 3,844$ 4,010$ 4,625$ 5,945$ 5,058$ ‐$ 4,365$ Number of Retirees 0 0 13 18 42 60 14 1 0 148Average Benefit Received ‐$ ‐$ 866$ 1,187$ 1,981$ 2,897$ 4,447$ 4,661$ ‐$ 2,603$ Average Final Average Compensation ‐$ ‐$ 3,371$ 3,502$ 3,866$ 4,447$ 5,594$ 5,058$ ‐$ 4,306$ Number of Retirees 0 0 5 9 21 35 12 1 0 83Average Benefit Received ‐$ ‐$ 768$ 1,180$ 1,998$ 3,283$ 4,614$ 4,661$ ‐$ 3,129$ Average Final Average Compensation ‐$ ‐$ 2,932$ 3,683$ 3,889$ 4,426$ 5,658$ 5,058$ ‐$ 4,516$ Number of Retirees 0 0 2 4 6 19 10 1 0 42Average Benefit Received ‐$ ‐$ ‐$ 946$ 2,153$ 2,953$ 4,492$ 4,661$ 4,504$ 3,613$ Average Final Average Compensation ‐$ ‐$ ‐$ 3,172$ 3,348$ 4,415$ 5,658$ 5,058$ 4,945$ 4,886$ Number of Retirees 0 0 0 1 1 10 10 1 1 24Average Benefit Received ‐$ ‐$ ‐$ ‐$ 2,153$ 4,011$ 4,590$ ‐$ 4,271$ 4,189$ Average Final Average Compensation ‐$ ‐$ ‐$ ‐$ 3,348$ 4,654$ 5,872$ ‐$ 4,945$ 5,167$ Number of Retirees 0 0 0 0 1 7 8 0 1 17Average Benefit Received ‐$ ‐$ ‐$ ‐$ ‐$ 3,418$ 5,464$ ‐$ 4,270$ 4,425$ Average Final Average Compensation ‐$ ‐$ ‐$ ‐$ ‐$ 4,739$ 6,182$ ‐$ 4,945$ 5,414$ Number of Retirees 0 0 0 0 0 5 5 0 1 11
Ten Years Ended June 30, 2014 Average Benefit Received ‐$ ‐$ 1,043$ 1,614$ 2,136$ 3,025$ 4,369$ 4,523$ 5,711$ 2,611$ Average Final Average Compensation ‐$ ‐$ 3,445$ 4,010$ 4,268$ 4,883$ 5,917$ 5,728$ 6,842$ 4,612$
Years of Service Credit
2011
2010
2013
2014
2006
2005
2012
2009
2008
2007
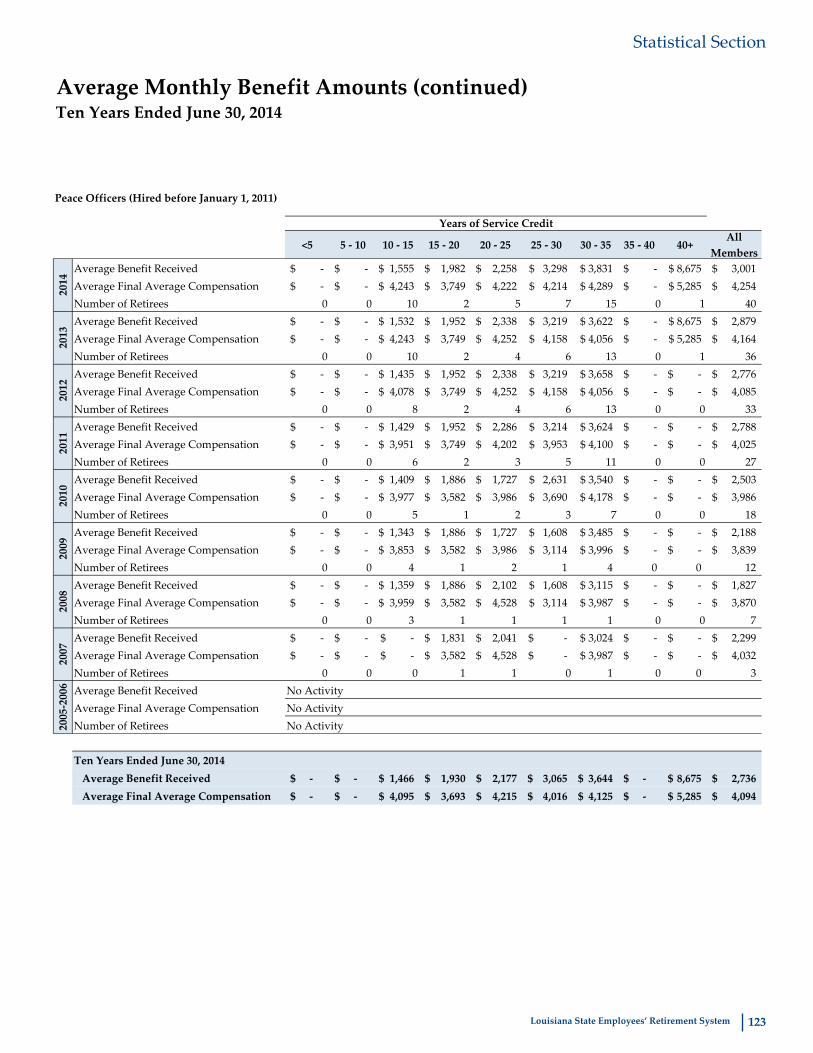
123Louisiana State Employees’ Retirement System
Statistical Section
Average Monthly Benefit Amounts (continued)Ten Years Ended June 30, 2014
Peace Officers (Hired before January 1, 2011)
<5 5 ‐ 10 10 ‐ 15 15 ‐ 20 20 ‐ 25 25 ‐ 30 30 ‐ 35 35 ‐ 40 40+All
MembersAverage Benefit Received ‐$ ‐$ 1,555$ 1,982$ 2,258$ 3,298$ 3,831$ ‐$ 8,675$ 3,001$ Average Final Average Compensation ‐$ ‐$ 4,243$ 3,749$ 4,222$ 4,214$ 4,289$ ‐$ 5,285$ 4,254$ Number of Retirees 0 0 10 2 5 7 15 0 1 40Average Benefit Received ‐$ ‐$ 1,532$ 1,952$ 2,338$ 3,219$ 3,622$ ‐$ 8,675$ 2,879$ Average Final Average Compensation ‐$ ‐$ 4,243$ 3,749$ 4,252$ 4,158$ 4,056$ ‐$ 5,285$ 4,164$ Number of Retirees 0 0 10 2 4 6 13 0 1 36Average Benefit Received ‐$ ‐$ 1,435$ 1,952$ 2,338$ 3,219$ 3,658$ ‐$ ‐$ 2,776$ Average Final Average Compensation ‐$ ‐$ 4,078$ 3,749$ 4,252$ 4,158$ 4,056$ ‐$ ‐$ 4,085$ Number of Retirees 0 0 8 2 4 6 13 0 0 33Average Benefit Received ‐$ ‐$ 1,429$ 1,952$ 2,286$ 3,214$ 3,624$ ‐$ ‐$ 2,788$ Average Final Average Compensation ‐$ ‐$ 3,951$ 3,749$ 4,202$ 3,953$ 4,100$ ‐$ ‐$ 4,025$ Number of Retirees 0 0 6 2 3 5 11 0 0 27Average Benefit Received ‐$ ‐$ 1,409$ 1,886$ 1,727$ 2,631$ 3,540$ ‐$ ‐$ 2,503$ Average Final Average Compensation ‐$ ‐$ 3,977$ 3,582$ 3,986$ 3,690$ 4,178$ ‐$ ‐$ 3,986$ Number of Retirees 0 0 5 1 2 3 7 0 0 18Average Benefit Received ‐$ ‐$ 1,343$ 1,886$ 1,727$ 1,608$ 3,485$ ‐$ ‐$ 2,188$ Average Final Average Compensation ‐$ ‐$ 3,853$ 3,582$ 3,986$ 3,114$ 3,996$ ‐$ ‐$ 3,839$ Number of Retirees 0 0 4 1 2 1 4 0 0 12Average Benefit Received ‐$ ‐$ 1,359$ 1,886$ 2,102$ 1,608$ 3,115$ ‐$ ‐$ 1,827$ Average Final Average Compensation ‐$ ‐$ 3,959$ 3,582$ 4,528$ 3,114$ 3,987$ ‐$ ‐$ 3,870$ Number of Retirees 0 0 3 1 1 1 1 0 0 7Average Benefit Received ‐$ ‐$ ‐$ 1,831$ 2,041$ ‐$ 3,024$ ‐$ ‐$ 2,299$ Average Final Average Compensation ‐$ ‐$ ‐$ 3,582$ 4,528$ ‐$ 3,987$ ‐$ ‐$ 4,032$ Number of Retirees 0 0 0 1 1 0 1 0 0 3Average Benefit Received No ActivityAverage Final Average Compensation No ActivityNumber of Retirees No Activity
Ten Years Ended June 30, 2014 Average Benefit Received ‐$ ‐$ 1,466$ 1,930$ 2,177$ 3,065$ 3,644$ ‐$ 8,675$ 2,736$ Average Final Average Compensation ‐$ ‐$ 4,095$ 3,693$ 4,215$ 4,016$ 4,125$ ‐$ 5,285$ 4,094$
2005‐2006
2008
Years of Service Credit
2010
2009
2013
2011
2012
2014
2007

124
Statistical Section
Average Monthly Benefit Amounts (continued)Ten Years Ended June 30, 2014
Appellate Law Clerks (Hired before July 1, 2006)
<5 5 ‐ 10 10 ‐ 15 15 ‐ 20 20 ‐ 25 25 ‐ 30 30 ‐ 35 35 ‐ 40 40+All
MembersAverage Benefit Received ‐$ ‐$ 1,806$ 2,432$ 3,724$ 4,282$ 5,308$ 7,487$ ‐$ 3,837$ Average Final Average Compensation ‐$ ‐$ 5,271$ 5,585$ 6,635$ 7,178$ 7,645$ 8,618$ ‐$ 6,625$ Number of Retirees 0 0 3 8 5 4 6 2 0 28Average Benefit Received ‐$ ‐$ 1,795$ 2,595$ 3,840$ 4,063$ 4,207$ 5,406$ ‐$ 3,292$ Average Final Average Compensation ‐$ ‐$ 5,271$ 5,813$ 6,787$ 7,217$ 7,355$ 7,277$ ‐$ 6,412$ Number of Retirees 0 0 3 7 4 3 3 1 0 21Average Benefit Received ‐$ ‐$ 2,032$ 2,464$ 3,944$ 4,446$ 4,906$ 5,406$ ‐$ 3,387$ Average Final Average Compensation ‐$ ‐$ 5,930$ 5,837$ 7,038$ 7,255$ 6,833$ 7,277$ ‐$ 6,484$ Number of Retirees 0 0 2 5 3 2 1 1 0 14Average Benefit Received ‐$ ‐$ ‐$ 2,310$ 4,039$ 3,150$ 4,906$ ‐$ ‐$ 3,172$ Average Final Average Compensation ‐$ ‐$ ‐$ 5,794$ 6,838$ 6,878$ 6,833$ ‐$ ‐$ 6,320$ Number of Retirees 0 0 0 4 2 1 1 0 0 8Average Benefit Received ‐$ ‐$ ‐$ 2,442$ 4,030$ 4,906$ ‐$ ‐$ ‐$ 3,382$ Average Final Average Compensation ‐$ ‐$ ‐$ 5,876$ 6,838$ 6,833$ ‐$ ‐$ ‐$ 6,356$ Number of Retirees 0 0 0 3 2 1 0 0 0 6Average Benefit Received No ActivityAverage Final Average Compensation No ActivityNumber of Retirees No Activity
Ten Years Ended June 30, 2014 Average Benefit Received ‐$ ‐$ 1,858$ 2,463$ 3,872$ 4,206$ 4,935$ 6,447$ ‐$ 3,502$ Average Final Average Compensation ‐$ ‐$ 5,436$ 5,754$ 6,799$ 7,144$ 7,418$ 7,948$ ‐$ 6,488$
2004‐2009
Years of Service Credit
2013
2010
2012
2011
2014

125Louisiana State Employees’ Retirement System
Statistical Section
Average Monthly Benefit Amounts (continued)Ten Years Ended June 30, 2014
Alcohol and Tobacco Control (Hired after June 30, 2007)
<5 5 ‐ 10 10 ‐ 15 15 ‐ 20 20 ‐ 25 25 ‐ 30 30 ‐ 35 35 ‐ 40 40+All
MembersAverage Benefit Received ‐$ ‐$ 1,981$ 4,548$ 4,375$ 3,554$ ‐$ ‐$ ‐$ 3,589$ Average Final Average Compensation ‐$ ‐$ 4,258$ 9,103$ 5,586$ 4,445$ ‐$ ‐$ ‐$ 5,247$ Number of Retirees 0 0 1 1 1 4 0 0 0 7Average Benefit Received ‐$ ‐$ 1,952$ 4,481$ ‐$ 3,649$ ‐$ ‐$ ‐$ 3,433$ Average Final Average Compensation ‐$ ‐$ 4,258$ 9,103$ ‐$ 4,740$ ‐$ ‐$ ‐$ 5,710$ Number of Retirees 0 0 1 1 0 2 0 0 0 4Average Benefit Received ‐$ ‐$ 1,604$ ‐$ ‐$ 2,976$ ‐$ 3,970$ ‐$ 2,882$ Average Final Average Compensation ‐$ ‐$ 4,754$ ‐$ ‐$ 4,425$ ‐$ 4,889$ ‐$ 4,623$ Number of Retirees 0 0 1 0 0 2 0 1 0 4Average Benefit Received No ActivityAverage Final Average Compensation No ActivityNumber of Retirees No Activity
Ten Years Ended June 30, 2014 Average Benefit Received ‐$ ‐$ 1,846$ 4,515$ 4,375$ 3,433$ ‐$ 3,970$ ‐$ 3,358$ Average Final Average Compensation ‐$ ‐$ 4,423$ 9,103$ 5,586$ 4,514$ ‐$ 4,889$ ‐$ 5,204$
2005‐2011
Years of Service Credit
2014
2013
2012

126
Statistical Section
Average Monthly Benefit Amounts (continued)Ten Years Ended June 30, 2014
Summary of Wildlife
<5 5 ‐ 10 10 ‐ 15 15 ‐ 20 20 ‐ 25 25 ‐ 30 30 ‐ 35 35 ‐ 40 40+All
MembersAverage Benefit Received ‐$ ‐$ ‐$ 1,792$ 2,374$ 3,317$ 4,851$ 2,204$ 6,680$ 3,053$ Average Final Average Compensation ‐$ ‐$ ‐$ 3,271$ 3,594$ 4,044$ 5,136$ 3,061$ 7,505$ 3,971$ Number of Retirees 0 0 0 5 84 76 21 2 2 190Average Benefit Received ‐$ ‐$ ‐$ 1,621$ 2,205$ 3,181$ 4,798$ 2,171$ 6,601$ 2,925$ Average Final Average Compensation ‐$ ‐$ ‐$ 2,936$ 3,450$ 3,969$ 5,033$ 3,061$ 7,505$ 3,864$ Number of Retirees 0 0 0 6 79 76 21 2 2 186Average Benefit Received ‐$ ‐$ ‐$ 1,597$ 2,056$ 3,037$ 4,751$ 2,171$ 2,434$ 2,761$ Average Final Average Compensation ‐$ ‐$ ‐$ 2,885$ 3,230$ 3,792$ 4,998$ 3,061$ 4,024$ 3,656$ Number of Retirees 0 0 0 7 73 77 20 2 1 180Average Benefit Received ‐$ ‐$ ‐$ 1,547$ 1,974$ 3,026$ 4,680$ 2,171$ 2,434$ 2,709$ Average Final Average Compensation ‐$ ‐$ ‐$ 2,781$ 3,151$ 3,786$ 4,927$ 3,061$ 4,024$ 3,606$ Number of Retirees 0 0 0 8 70 78 19 2 1 178Average Benefit Received ‐$ ‐$ ‐$ 1,547$ 1,917$ 2,957$ 4,172$ 2,171$ 2,434$ 2,595$ Average Final Average Compensation ‐$ ‐$ ‐$ 2,781$ 3,119$ 3,717$ 4,542$ 3,061$ 4,024$ 3,518$ Number of Retirees 0 0 0 8 71 76 19 2 1 177Average Benefit Received ‐$ ‐$ ‐$ 1,354$ 1,910$ 2,879$ 4,032$ 2,171$ 2,434$ 2,543$ Average Final Average Compensation ‐$ ‐$ ‐$ 2,454$ 3,089$ 3,585$ 4,363$ 3,061$ 4,024$ 3,421$ Number of Retirees 0 0 0 7 70 75 19 2 1 174Average Benefit Received ‐$ ‐$ ‐$ 1,338$ 1,858$ 2,731$ 4,073$ 2,171$ 2,434$ 2,463$ Average Final Average Compensation ‐$ ‐$ ‐$ 2,455$ 3,115$ 3,423$ 4,376$ 3,061$ 4,024$ 3,364$ Number of Retirees 0 0 0 8 70 74 20 2 1 175Average Benefit Received ‐$ 799$ 1,239$ 1,369$ 1,767$ 2,598$ 3,855$ 2,108$ ‐$ 2,265$ Average Final Average Compensation ‐$ 1,520$ 1,786$ 2,657$ 3,040$ 3,352$ 4,270$ 3,061$ ‐$ 3,231$ Number of Retirees 0 1 3 16 74 73 20 2 0 189Average Benefit Received ‐$ 758$ 1,175$ 1,298$ 1,720$ 2,632$ 3,751$ 2,044$ ‐$ 2,239$ Average Final Average Compensation ‐$ 1,520$ 1,786$ 2,657$ 2,991$ 3,282$ 4,153$ 3,061$ ‐$ 3,171$ Number of Retirees 0 1 3 16 74 72 20 2 0 188Average Benefit Received ‐$ 757$ 1,174$ 1,297$ 1,586$ 2,106$ 3,308$ 2,043$ ‐$ 1,880$ Average Final Average Compensation ‐$ 1,520$ 1,786$ 2,657$ 2,892$ 3,135$ 3,923$ 3,061$ ‐$ 3,015$ Number of Retirees 0 1 3 16 70 63 13 2 0 168
Ten Years Ended June 30, 2014 Average Benefit Received ‐$ 771$ 1,196$ 1,425$ 1,947$ 2,863$ 4,266$ 2,143$ 4,304$ 2,549$ Average Final Average Compensation ‐$ 1,520$ 1,786$ 2,712$ 3,177$ 3,621$ 4,601$ 3,061$ 5,571$ 3,486$
Years of Service Credit
2013
2012
2011
2005
2014
2010
2009
2008
2007
2006

127Louisiana State Employees’ Retirement System
Statistical Section
Average Monthly Benefit Amounts (continued)Ten Years Ended June 30, 2014
Wildlife Agents (Hired before July 1, 2003)
<5 5 ‐ 10 10 ‐ 15 15 ‐ 20 20 ‐ 25 25 ‐ 30 30 ‐ 35 35 ‐ 40 40+All
MembersAverage Benefit Received ‐$ ‐$ ‐$ 1,201$ 1,751$ 2,320$ 3,352$ 2,204$ 2,470$ 2,079$ Average Final Average Compensation ‐$ ‐$ ‐$ 2,434$ 2,674$ 2,987$ 4,408$ 3,061$ 4,024$ 2,921$ Number of Retirees 0 0 0 3 54 45 7 2 1 112Average Benefit Received ‐$ ‐$ ‐$ 1,113$ 1,730$ 2,264$ 3,302$ 2,171$ 2,434$ 2,036$ Average Final Average Compensation ‐$ ‐$ ‐$ 2,141$ 2,753$ 3,014$ 4,408$ 3,061$ 4,024$ 2,954$ Number of Retirees 0 0 0 4 55 48 7 2 1 117Average Benefit Received ‐$ ‐$ ‐$ 1,181$ 1,724$ 2,251$ 3,302$ 2,171$ 2,434$ 2,028$ Average Final Average Compensation ‐$ ‐$ ‐$ 2,228$ 2,727$ 2,969$ 4,408$ 3,061$ 4,024$ 2,921$ Number of Retirees 0 0 0 5 56 52 7 2 1 123Average Benefit Received ‐$ ‐$ ‐$ 1,183$ 1,707$ 2,264$ 3,302$ 2,171$ 2,434$ 2,016$ Average Final Average Compensation ‐$ ‐$ ‐$ 2,200$ 2,811$ 2,990$ 4,408$ 3,061$ 4,024$ 2,958$ Number of Retirees 0 0 0 6 58 53 7 2 1 127Average Benefit Received ‐$ ‐$ ‐$ 1,183$ 1,692$ 2,264$ 3,058$ 2,171$ 2,434$ 2,007$ Average Final Average Compensation ‐$ ‐$ ‐$ 2,200$ 2,847$ 2,990$ 4,005$ 3,061$ 4,024$ 2,967$ Number of Retirees 0 0 0 6 60 53 9 2 1 131Average Benefit Received ‐$ ‐$ ‐$ 1,183$ 1,692$ 2,270$ 2,886$ 2,171$ 2,434$ 2,002$ Average Final Average Compensation ‐$ ‐$ ‐$ 2,200$ 2,847$ 2,986$ 3,685$ 3,061$ 4,024$ 2,944$ Number of Retirees 0 0 0 6 60 55 9 2 1 133Average Benefit Received ‐$ ‐$ ‐$ 1,189$ 1,672$ 2,255$ 2,886$ 2,171$ 2,434$ 1,980$ Average Final Average Compensation ‐$ ‐$ ‐$ 2,237$ 2,919$ 2,936$ 3,685$ 3,061$ 4,024$ 2,951$ Number of Retirees 0 0 0 7 62 57 9 2 1 138Average Benefit Received ‐$ 799$ 1,239$ 1,306$ 1,634$ 2,158$ 2,775$ 2,108$ ‐$ 1,864$ Average Final Average Compensation ‐$ 1,520$ 1,786$ 2,569$ 2,896$ 2,885$ 3,619$ 3,061$ ‐$ 2,879$ Number of Retirees 0 1 3 15 67 58 10 2 0 156Average Benefit Received ‐$ 758$ 1,175$ 1,238$ 1,565$ 2,049$ 2,511$ 2,044$ ‐$ 1,771$ Average Final Average Compensation ‐$ 1,520$ 1,786$ 2,569$ 2,868$ 2,885$ 3,503$ 3,061$ ‐$ 2,863$ Number of Retirees 0 1 3 15 68 58 11 2 0 158Average Benefit Received ‐$ 757$ 1,174$ 1,237$ 1,549$ 2,020$ 2,409$ 2,043$ ‐$ 1,741$ Average Final Average Compensation ‐$ 1,520$ 1,786$ 2,569$ 2,856$ 3,048$ 3,251$ 3,061$ ‐$ 2,898$ Number of Retirees 0 1 3 15 68 60 9 2 0 158
Ten Years Ended June 30, 2014 Average Benefit Received ‐$ 771$ 1,196$ 1,223$ 1,666$ 2,205$ 2,933$ 2,142$ 2,439$ 1,940$
Average Final Average Compensation ‐$ 1,520$ 1,786$ 2,413$ 2,825$ 2,968$ 3,880$ 3,061$ 4,024$ 2,923$
Years of Service Credit
2009
2008
2010
2011
2012
2007
2006
2005
2014
2013

128
Statistical Section
Average Monthly Benefit Amounts (continued)Ten Years Ended June 30, 2014
Wildlife Agents (Hired on or after July 1, 2003)
<5 5 ‐ 10 10 ‐ 15 15 ‐ 20 20 ‐ 25 25 ‐ 30 30 ‐ 35 35 ‐ 40 40+All
MembersAverage Benefit Received ‐$ ‐$ ‐$ 2,678$ 3,495$ 4,763$ 5,601$ ‐$ 10,889$ 4,451$ Average Final Average Compensation ‐$ ‐$ ‐$ 4,526$ 5,248$ 5,578$ 5,499$ ‐$ 10,986$ 5,479$ Number of Retirees 0 0 0 2 30 31 14 0 1 78Average Benefit Received ‐$ ‐$ ‐$ 2,638$ 3,294$ 4,753$ 5,546$ ‐$ 10,767$ 4,432$ Average Final Average Compensation ‐$ ‐$ ‐$ 4,526$ 5,045$ 5,606$ 5,345$ ‐$ 10,986$ 5,405$ Number of Retirees 0 0 0 2 24 28 14 0 1 69Average Benefit Received ‐$ ‐$ ‐$ 2,638$ 3,152$ 4,642$ 5,531$ ‐$ ‐$ 4,330$ Average Final Average Compensation ‐$ ‐$ ‐$ 4,526$ 4,887$ 5,472$ 5,316$ ‐$ ‐$ 5,229$ Number of Retirees 0 0 0 2 17 25 13 0 0 57Average Benefit Received ‐$ ‐$ ‐$ 2,638$ 3,264$ 4,642$ 5,484$ ‐$ ‐$ 4,437$ Average Final Average Compensation ‐$ ‐$ ‐$ 4,526$ 4,790$ 5,472$ 5,229$ ‐$ ‐$ 5,217$ Number of Retirees 0 0 0 2 12 25 12 0 0 51Average Benefit Received ‐$ ‐$ ‐$ 2,638$ 3,141$ 4,554$ 5,063$ ‐$ ‐$ 4,243$ Average Final Average Compensation ‐$ ‐$ ‐$ 4,526$ 4,602$ 5,391$ 4,973$ ‐$ ‐$ 5,074$ Number of Retirees 0 0 0 2 11 23 10 0 0 46Average Benefit Received ‐$ ‐$ ‐$ 2,382$ 3,215$ 4,525$ 5,063$ ‐$ ‐$ 4,284$ Average Final Average Compensation ‐$ ‐$ ‐$ 3,978$ 4,540$ 5,201$ 4,973$ ‐$ ‐$ 4,954$ Number of Retirees 0 0 0 1 10 20 10 0 0 41Average Benefit Received ‐$ ‐$ ‐$ 2,382$ 3,295$ 4,328$ 5,044$ ‐$ ‐$ 4,265$ Average Final Average Compensation ‐$ ‐$ ‐$ 3,978$ 4,632$ 5,055$ 4,941$ ‐$ ‐$ 4,901$ Number of Retirees 0 0 0 1 8 17 11 0 0 37Average Benefit Received ‐$ ‐$ ‐$ 2,313$ 3,039$ 4,271$ 4,936$ ‐$ ‐$ 4,152$ Average Final Average Compensation ‐$ ‐$ ‐$ 3,978$ 4,415$ 5,127$ 4,921$ ‐$ ‐$ 4,879$ Number of Retirees 0 0 0 1 7 15 10 0 0 33Average Monthly Benefit ‐$ ‐$ ‐$ 2,193$ 3,477$ 5,006$ 5,267$ ‐$ ‐$ 4,685$ Average Final Average Compensation ‐$ ‐$ ‐$ 3,978$ 4,388$ 4,899$ 4,948$ ‐$ ‐$ 4,781$ Number of Retirees 0 0 0 1 6 14 9 0 0 30Average Monthly Benefit ‐$ ‐$ ‐$ 2,192$ 2,649$ 3,805$ 5,331$ ‐$ ‐$ 4,023$ Average Final Average Salary ‐$ ‐$ ‐$ 3,978$ 4,022$ 4,831$ 5,433$ ‐$ ‐$ 4,825$ Number of Retirees 0 0 0 1 2 3 4 0 0 10
Ten Years Ended June 30, 2014 Average Benefit Received ‐$ ‐$ ‐$ 2,528$ 3,285$ 4,613$ 5,314$ ‐$ 10,828$ 4,364$
Average Final Average Compensation ‐$ ‐$ ‐$ 4,343$ 4,862$ 5,360$ 5,168$ ‐$ 10,986$ 5,166$
2008
2006
2005
Years of Service Credit
2009
2007
2010
2013
2011
2012
2014

129Louisiana State Employees’ Retirement System
Statistical Section
Average Monthly Benefit Amounts (continued)Ten Years Ended June 30, 2014
Judges (Elected before January 1, 2011)
<5 5 ‐ 10 10 ‐ 15 15 ‐ 20 20 ‐ 25 25 ‐ 30 30 ‐ 35 35 ‐ 40 40+All
MembersAverage Benefit Received ‐$ 2,094$ 3,834$ 5,341$ 6,133$ 7,978$ 8,406$ 8,983$ 10,821$ 6,542$ Average Final Average Compensation ‐$ 6,742$ 8,079$ 8,159$ 7,663$ 7,859$ 8,393$ 8,927$ 10,375$ 8,050$ Number of Retirees 0 3 25 59 50 53 33 9 3 235Average Benefit Received ‐$ 2,100$ 3,788$ 5,197$ 6,047$ 7,775$ 8,213$ 8,485$ 10,701$ 6,374$ Average Final Average Compensation ‐$ 6,522$ 7,774$ 7,955$ 7,289$ 7,681$ 8,129$ 8,195$ 10,375$ 7,775$ Number of Retirees 0 4 25 55 48 50 35 7 3 227Average Benefit Received ‐$ 2,100$ 3,745$ 5,113$ 6,039$ 7,642$ 7,754$ 7,832$ 10,220$ 6,174$ Average Final Average Compensation ‐$ 6,522$ 7,622$ 7,299$ 7,235$ 6,736$ 5,524$ 5,936$ 3,837$ 6,866$ Number of Retirees 0 4 24 57 50 51 31 6 2 225Average Benefit Received ‐$ 2,100$ 3,745$ 5,090$ 6,039$ 7,614$ 7,595$ 7,361$ 9,449$ 6,136$ Average Final Average Compensation ‐$ 6,522$ 7,622$ 7,485$ 7,235$ 6,685$ 5,844$ 6,854$ 4,880$ 6,972$ Number of Retirees 0 4 24 53 50 51 29 5 3 219Average Benefit Received ‐$ 2,100$ 3,695$ 5,106$ 6,058$ 7,489$ 7,370$ 7,361$ 9,449$ 6,011$ Average Final Average Compensation ‐$ 6,522$ 7,490$ 7,469$ 7,202$ 7,188$ 6,128$ 6,954$ 4,880$ 7,118$ Number of Retirees 0 4 27 54 52 48 27 5 3 220Average Benefit Received ‐$ 2,100$ 3,623$ 5,105$ 6,029$ 7,494$ 7,365$ 7,361$ 9,568$ 6,023$ Average Final Average Compensation ‐$ 6,522$ 7,371$ 7,459$ 7,179$ 7,193$ 6,128$ 6,954$ 5,758$ 7,106$ Number of Retirees 0 4 27 55 54 50 27 5 4 226Average Benefit Received ‐$ 2,100$ 3,455$ 5,067$ 5,897$ 7,221$ 7,106$ 7,241$ 8,527$ 5,892$ Average Final Average Compensation ‐$ 6,522$ 6,834$ 6,929$ 6,853$ 6,656$ 6,235$ 6,685$ 7,325$ 6,746$ Number of Retirees 0 4 21 44 50 46 23 4 3 195Average Benefit Received 2,042$ 2,370$ 3,422$ 4,873$ 5,685$ 6,935$ 6,780$ 6,979$ 8,308$ 5,687$ Average Final Average Compensation 3,196$ 6,504$ 6,648$ 6,790$ 6,730$ 6,564$ 5,993$ 6,522$ 7,325$ 6,584$ Number of Retirees 1 5 19 44 46 47 24 5 3 194Average Benefit Received 1,936$ 2,247$ 3,290$ 4,632$ 5,292$ 6,661$ 6,359$ 6,635$ 7,934$ 5,382$ Average Final Average Compensation 3,196$ 6,504$ 6,679$ 6,780$ 6,515$ 6,593$ 5,794$ 6,522$ 7,325$ 6,512$ Number of Retirees 1 5 20 43 44 46 25 5 3 192Average Benefit Received 1,935$ 2,246$ 3,186$ 4,545$ 5,071$ 6,454$ 6,241$ 6,379$ 7,934$ 5,241$ Average Final Average Compensation 3,196$ 6,504$ 6,609$ 6,795$ 6,591$ 6,659$ 5,686$ 5,575$ 7,325$ 6,491$ Number of Retirees 1 5 21 43 44 47 28 5 3 197
Ten Years Ended June 30, 2014 Average Benefit Received 1,971$ 2,167$ 3,597$ 5,031$ 5,848$ 7,345$ 7,387$ 7,617$ 9,269$ 5,971$ Average Final Average Compensation 3,196$ 6,531$ 7,320$ 7,362$ 7,065$ 6,995$ 6,470$ 7,089$ 7,005$ 7,053$
2009
2008
2007
2006
2005
2010
2012
Years of Service Credit
2011
2013
2014

130
Statistical Section
Average Monthly Benefit Amounts (continued)Ten Years Ended June 30, 2014
Legislators (Hired before January 1, 2011)
<5 5 ‐ 10 10 ‐ 15 15 ‐ 20 20 ‐ 25 25 ‐ 30 30 ‐ 35 35 ‐ 40 40+All
MembersAverage Benefit Received ‐$ ‐$ 1,139$ 1,618$ 2,849$ 3,507$ 2,733$ 6,675$ ‐$ 2,421$ Average Final Average Compensation ‐$ ‐$ 2,894$ 2,691$ 3,758$ 3,596$ 3,449$ 8,522$ ‐$ 3,421$ Number of Retirees 0 0 13 26 25 11 7 3 0 85Average Benefit Received ‐$ ‐$ 1,119$ 1,598$ 2,764$ 3,491$ 2,634$ 5,702$ ‐$ 2,387$ Average Final Average Compensation ‐$ ‐$ 2,899$ 2,996$ 4,194$ 4,278$ 3,295$ 7,224$ ‐$ 3,712$ Number of Retirees 0 0 14 26 26 12 8 4 0 90Average Benefit Received ‐$ ‐$ 1,140$ 1,598$ 2,764$ 3,473$ 2,634$ 3,623$ ‐$ 2,292$ Average Final Average Compensation ‐$ ‐$ 2,947$ 2,996$ 4,194$ 4,128$ 3,295$ 5,248$ ‐$ 3,588$ Number of Retirees 0 0 13 26 26 13 8 2 0 88Average Benefit Received ‐$ ‐$ 1,140$ 1,549$ 2,729$ 3,414$ 2,634$ 3,517$ ‐$ 2,286$ Average Final Average Compensation ‐$ ‐$ 2,947$ 3,233$ 4,177$ 4,060$ 3,295$ 4,804$ ‐$ 3,650$ Number of Retirees 0 0 13 25 25 14 8 3 0 88Average Benefit Received ‐$ ‐$ 1,134$ 1,547$ 2,728$ 3,297$ 2,634$ 3,517$ ‐$ 2,257$ Average Final Average Compensation ‐$ ‐$ 2,883$ 3,326$ 4,177$ 3,984$ 3,295$ 4,804$ ‐$ 3,646$ Number of Retirees 0 0 14 26 25 15 8 3 0 91Average Benefit Received ‐$ ‐$ 1,158$ 1,646$ 2,512$ 3,297$ 2,630$ 3,152$ ‐$ 2,207$ Average Final Average Compensation ‐$ ‐$ 2,892$ 3,421$ 4,061$ 3,984$ 3,198$ 3,624$ ‐$ 3,589$ Number of Retirees 0 0 13 28 24 15 9 2 0 91Average Benefit Received ‐$ ‐$ 1,250$ 1,671$ 2,458$ 3,297$ 3,218$ 3,152$ ‐$ 2,311$ Average Final Average Compensation ‐$ ‐$ 3,063$ 3,415$ 3,975$ 3,984$ 2,912$ 3,624$ ‐$ 3,565$ Number of Retirees 0 0 11 29 26 15 11 2 0 94Average Benefit Received ‐$ 197$ 1,322$ 1,549$ 2,436$ 3,144$ 3,074$ 3,209$ 5,140$ 2,238$ Average Final Average Compensation ‐$ 8,374$ 3,139$ 3,207$ 4,106$ 3,745$ 2,836$ 3,917$ 4,466$ 3,543$ Number of Retirees 0 1 7 24 19 9 11 1 1 73Average Benefit Received ‐$ 193$ 1,494$ 1,453$ 1,847$ 2,981$ 2,766$ 3,043$ 4,874$ 1,967$ Average Final Average Compensation ‐$ 8,374$ 3,057$ 3,114$ 3,463$ 3,745$ 2,233$ 3,917$ 4,466$ 3,275$ Number of Retirees 0 1 7 25 20 9 9 1 1 73Average Benefit Received ‐$ 192$ 1,183$ 1,430$ 1,799$ 2,980$ 2,645$ 3,042$ 4,873$ 1,907$ Average Final Average Compensation ‐$ 8,374$ 3,057$ 3,246$ 3,241$ 3,745$ 2,239$ 3,917$ 4,466$ 3,260$ Number of Retirees 0 1 7 24 20 9 9 1 1 72
Ten Years Ended June 30, 2014 Average Benefit Received ‐$ 194$ 1,186$ 1,569$ 2,520$ 3,309$ 2,784$ 4,231$ 4,962$ 2,238$ Average Final Average Compensation ‐$ 8,374$ 2,958$ 3,168$ 3,957$ 3,949$ 2,975$ 5,456$ 4,466$ 3,536$
Years of Service Credit
2009
2008
2010
2011
2012
2007
2006
2005
2014
2013

131Louisiana State Employees’ Retirement System
Statistical Section
Average Monthly Benefit Amounts (continued)Ten Years Ended June 30, 2014
Bridge Police Employees (Hired before July 1, 2006)
<5 5 ‐ 10 10 ‐ 15 15 ‐ 20 20 ‐ 25 25 ‐ 30 30 ‐ 35 35 ‐ 40 40+All
MembersAverage Benefit Received ‐$ ‐$ ‐$ ‐$ 3,124$ ‐$ 3,944$ ‐$ ‐$ 3,534$ Average Final Average Compensation ‐$ ‐$ ‐$ ‐$ 5,505$ ‐$ 6,627$ ‐$ ‐$ 6,066$ Number of Retirees 0 0 0 0 1 0 1 0 0 2Average Benefit Received ‐$ ‐$ ‐$ ‐$ 3,124$ ‐$ 3,886$ ‐$ ‐$ 3,505$ Average Final Average Compensation ‐$ ‐$ ‐$ ‐$ 5,505$ ‐$ 6,627$ ‐$ ‐$ 6,066$ Number of Retirees 0 0 0 0 1 0 1 0 0 2Average Benefit Received ‐$ ‐$ ‐$ ‐$ ‐$ ‐$ 3,886$ ‐$ ‐$ 3,886$ Average Final Average Compensation ‐$ ‐$ ‐$ ‐$ ‐$ ‐$ 6,627$ ‐$ ‐$ 6,627$ Number of Retirees 0 0 0 0 0 0 1 0 0 1Average Benefit Received ‐$ ‐$ ‐$ ‐$ ‐$ ‐$ 3,886$ ‐$ ‐$ 3,886$ Average Final Average Compensation ‐$ ‐$ ‐$ ‐$ ‐$ ‐$ 6,627$ ‐$ ‐$ 6,627$ Number of Retirees 0 0 0 0 0 0 1 0 0 1Average Benefit Received No ActivityAverage Final Average Compensation No ActivityNumber of Retirees No Activity
Ten Years Ended June 30, 2014 Average Benefit Received ‐$ ‐$ ‐$ ‐$ 3,124$ ‐$ 3,901$ ‐$ ‐$ 3,642$ Average Final Average Compensation ‐$ ‐$ ‐$ ‐$ 5,505$ ‐$ 6,627$ ‐$ ‐$ 6,253$
Years of Service Credit
2013
2005‐2010
2012
2014
2011

132
Statistical Section
Average Monthly Benefit Amounts (continued)Ten Years Ended June 30, 2014
Hazardous Duty (Hired after January 1, 2011)
<5 5 ‐ 10 10 ‐ 15 15 ‐ 20 20 ‐ 25 25 ‐ 30 30 ‐ 35 35 ‐ 40 40+All
MembersAverage Benefit Received ‐$ ‐$ 1,263$ 1,699$ 2,382$ 3,219$ 4,963$ ‐$ ‐$ 2,180$ Average Final Average Compensation ‐$ ‐$ 3,430$ 3,895$ 4,491$ 4,292$ 5,089$ ‐$ ‐$ 4,228$ Number of Retirees 0 0 10 14 41 2 2 0 0 69Average Benefit Received ‐$ ‐$ 1,267$ 1,728$ 2,353$ 4,016$ 5,650$ ‐$ ‐$ 2,152$ Average Final Average Compensation ‐$ ‐$ 3,539$ 3,941$ 4,516$ 4,805$ 5,650$ ‐$ ‐$ 4,281$ Number of Retirees 0 0 8 13 36 1 1 0 0 59Average Benefit Received ‐$ ‐$ 1,137$ 1,791$ 2,375$ 4,016$ ‐$ ‐$ ‐$ 2,155$ Average Final Average Compensation ‐$ ‐$ 3,552$ 4,202$ 4,384$ 4,802$ ‐$ ‐$ ‐$ 4,244$ Number of Retirees 0 0 3 4 12 1 0 0 0 20Average Benefit Received ‐$ ‐$ 1,434$ 1,561$ 2,010$ ‐$ ‐$ ‐$ ‐$ 1,805$ Average Final Average Compensation ‐$ ‐$ 4,499$ 3,471$ 4,082$ ‐$ ‐$ ‐$ ‐$ 4,043$ Number of Retirees 0 0 1 1 3 0 0 0 0 5Average Benefit Received No ActivityAverage Final Average Compensation No ActivityNumber of Retirees No Activity
Ten Years Ended June 30, 2014 Average Benefit Received ‐$ ‐$ 1,255$ 1,718$ 2,357$ 3,618$ 5,192$ ‐$ ‐$ 2,154$ Average Final Average Compensation ‐$ ‐$ 3,535$ 3,939$ 4,473$ 4,548$ 5,276$ ‐$ ‐$ 4,244$
2011
2005‐2010
Years of Service Credit
2014
2013
2012

133Louisiana State Employees’ Retirement System
Statistical Section
Average Monthly Benefit Amounts (continued)Ten Years Ended June 30, 2014
Disability
<5 5 ‐ 10 10 ‐ 15 15 ‐ 20 20 ‐ 25 25 ‐ 30 30 ‐ 35 35 ‐ 40 40+All
MembersAverage Benefit Received 534$ 981$ 746$ 1,118$ 1,469$ 1,832$ 1,980$ ‐$ ‐$ 1,143$ Average Final Average Compensation 3,080$ 2,423$ 2,173$ 2,422$ 2,516$ 2,583$ 2,926$ ‐$ ‐$ 2,379$ Number of Retirees 7 16 849 789 605 228 12 0 0 2,506Average Benefit Received 458$ 922$ 723$ 1,070$ 1,436$ 1,778$ 1,958$ ‐$ ‐$ 1,112$ Average Final Average Compensation 3,151$ 2,326$ 2,349$ 2,439$ 2,698$ 2,897$ 2,942$ ‐$ ‐$ 2,519$ Number of Retirees 6 16 858 790 636 235 13 0 0 2,554Average Benefit Received 327$ 1,161$ 692$ 1,040$ 1,396$ 1,760$ 1,958$ ‐$ ‐$ 1,085$ Average Final Average Compensation 3,410$ 2,365$ 2,157$ 2,244$ 2,434$ 2,835$ 2,942$ ‐$ ‐$ 2,325$ Number of Retirees 5 17 848 786 635 240 13 0 0 2,544Average Benefit Received 333$ 1,113$ 677$ 1,026$ 1,364$ 1,749$ 1,958$ ‐$ ‐$ 1,067$ Average Final Average Compensation 3,250$ 2,615$ 2,266$ 2,375$ 2,566$ 2,875$ 2,942$ ‐$ ‐$ 2,441$ Number of Retirees 6 18 856 803 642 248 13 0 0 2,586Average Benefit Received 294$ 955$ 662$ 1,001$ 1,349$ 1,699$ 1,884$ ‐$ ‐$ 1,041$ Average Final Average Compensation 3,506$ 2,793$ 2,185$ 2,268$ 2,515$ 2,821$ 2,878$ ‐$ ‐$ 2,363$ Number of Retirees 8 20 863 817 642 238 15 0 0 2,603Average Benefit Received 557$ 691$ 646$ 984$ 1,324$ 1,676$ 1,884$ ‐$ ‐$ 1,019$ Average Final Average Compensation 3,573$ 2,643$ 2,181$ 2,330$ 2,530$ 2,775$ 2,878$ ‐$ ‐$ 2,379$ Number of Retirees 8 21 878 822 647 240 15 0 0 2,631Average Benefit Received 470$ 675$ 644$ 967$ 1,315$ 1,662$ 1,879$ ‐$ ‐$ 1,008$ Average Final Average Compensation 3,004$ 2,573$ 2,229$ 2,330$ 2,525$ 2,797$ 2,878$ ‐$ ‐$ 2,394$ Number of Retirees 12 22 890 833 658 239 15 0 0 2,669Average Benefit Received ‐$ 597$ 694$ 1,013$ 1,478$ 1,868$ 1,929$ ‐$ ‐$ 1,081$ Average Final Average Compensation ‐$ 1,471$ 2,053$ 2,200$ 2,535$ 2,813$ 2,471$ ‐$ ‐$ 2,273$ Number of Retirees 0 8 385 365 304 69 3 0 0 1,134Average Benefit Received ‐$ 564$ 655$ 941$ 1,375$ 1,711$ 1,791$ ‐$ ‐$ 1,009$ Average Final Average Compensation ‐$ 1,471$ 2,001$ 2,118$ 2,477$ 2,694$ 2,442$ ‐$ ‐$ 2,208$ Number of Retirees 0 8 408 380 333 71 2 0 0 1,202Average Benefit Received ‐$ 508$ 621$ 920$ 1,320$ 1,686$ 1,500$ ‐$ ‐$ 971$ Average Final Average Compensation ‐$ 1,363$ 1,910$ 2,053$ 2,357$ 2,620$ 2,358$ ‐$ ‐$ 2,116$ Number of Retirees 0 10 408 375 335 68 3 0 0 1,199
Ten Years Ended June 30, 2014 Average Benefit Received 434$ 853$ 679$ 1,017$ 1,380$ 1,738$ 1,910$ ‐$ ‐$ 1,059$ Average Final Average Compensation 3,263$ 2,362$ 2,181$ 2,307$ 2,525$ 2,789$ 2,872$ ‐$ ‐$ 2,367$
Years of Service Credit
2013
2012
2011
2005
2014
2010
2009
2008
2007
2006

134
Statistical Section
Average Monthly Benefit Amounts (continued)Ten Years Ended June 30, 2014
Survivors
<5 5 ‐ 10 10 ‐ 15 15 ‐ 20 20 ‐ 25 25 ‐ 30 30 ‐ 35 35 ‐ 40 40+All
MembersAverage Benefit Received 1,286$ 1,499$ 804$ 979$ 1,206$ 1,398$ 1,638$ 2,012$ 2,545$ 1,252$ Average Final Average Compensation 3,017$ 2,639$ 2,118$ 2,242$ 2,504$ 2,484$ 2,421$ 2,775$ 3,502$ 2,388$ Number of Retirees 22 75 1,194 995 1,058 1,051 1,046 246 72 5,759Average Benefit Received 1,235$ 1,445$ 769$ 922$ 1,137$ 1,322$ 1,545$ 1,896$ 2,416$ 1,177$ Average Final Average Compensation 2,918$ 2,591$ 2,377$ 2,545$ 2,808$ 2,940$ 2,924$ 3,050$ 3,499$ 2,731$ Number of Retirees 24 76 1,202 1,007 1,070 1,035 1,017 229 66 5,726Average Benefit Received 1,084$ 1,423$ 777$ 912$ 1,110$ 1,288$ 1,521$ 1,880$ 2,462$ 1,159$ Average Final Average Compensation 2,970$ 2,418$ 2,279$ 2,444$ 2,652$ 2,855$ 2,884$ 2,954$ 3,333$ 2,631$ Number of Retirees 28 76 1,182 1,030 1,065 1,001 983 236 64 5,665Average Benefit Received 1,010$ 1,387$ 774$ 877$ 1,088$ 1,266$ 1,512$ 1,843$ 2,374$ 1,136$ Average Final Average Compensation 2,763$ 2,385$ 2,267$ 2,435$ 2,664$ 2,839$ 2,851$ 2,951$ 3,259$ 2,616$ Number of Retirees 31 83 1,186 1,037 1,069 1,011 946 231 65 5,659Average Benefit Received 868$ 1,315$ 746$ 841$ 1,051$ 1,227$ 1,484$ 1,827$ 2,278$ 1,097$ Average Final Average Compensation 2,628$ 2,317$ 2,260$ 2,397$ 2,656$ 2,838$ 2,826$ 2,849$ 3,355$ 2,595$ Number of Retirees 28 81 1,217 1,046 1,084 1,012 933 233 62 5,696Average Benefit Received 834$ 1,296$ 742$ 841$ 1,036$ 1,193$ 1,472$ 1,765$ 2,188$ 1,078$ Average Final Average Compensation 2,560$ 2,271$ 2,259$ 2,369$ 2,620$ 2,812$ 2,781$ 2,788$ 3,030$ 2,561$ Number of Retirees 29 80 1,195 1,031 1,069 977 896 228 55 5,560Average Benefit Received 819$ 1,345$ 822$ 914$ 1,145$ 1,312$ 1,491$ 1,786$ 2,056$ 1,152$ Average Final Average Compensation 2,474$ 2,136$ 2,293$ 2,352$ 2,594$ 2,766$ 2,782$ 2,758$ 2,959$ 2,545$ Number of Retirees 30 86 1,194 1,028 1,053 953 869 219 58 5,490Average Benefit Received 1,312$ 1,324$ 765$ 834$ 1,057$ 1,171$ 1,391$ 1,616$ 1,894$ 1,061$ Average Final Average Compensation 3,105$ 2,089$ 2,293$ 2,310$ 2,575$ 2,757$ 2,771$ 2,706$ 2,918$ 2,528$ Number of Retirees 17 91 1,175 1,037 1,019 938 855 231 55 5,418Average Benefit Received 1,073$ 1,310$ 690$ 760$ 944$ 1,013$ 1,240$ 1,449$ 1,763$ 948$ Average Final Average Compensation 2,703$ 2,008$ 2,284$ 2,315$ 2,559$ 2,794$ 2,757$ 2,709$ 2,868$ 2,524$ Number of Retirees 16 90 1,156 1,059 1,039 925 840 229 55 5,409Average Benefit Received 1,146$ 1,275$ 727$ 763$ 920$ 1,000$ 1,225$ 1,419$ 1,792$ 947$ Average Final Average Compensation 2,832$ 1,920$ 2,265$ 2,309$ 2,520$ 2,718$ 2,702$ 2,682$ 2,849$ 2,487$ Number of Retirees 35 92 1,157 1,054 998 905 831 227 61 5,360
Ten Years Ended June 30, 2014 Average Benefit Received 1,047$ 1,358$ 762$ 863$ 1,071$ 1,224$ 1,460$ 1,752$ 2,195$ 1,103$ Average Final Average Compensation 2,779$ 2,262$ 2,269$ 2,372$ 2,616$ 2,780$ 2,769$ 2,823$ 3,175$ 2,561$
2005
2014
2010
2009
2008
2007
2006
Years of Service Credit
2013
2012
2011

135Louisiana State Employees’ Retirement System
Statistical Section
Fiscal Year
Active Members
Regular Retirees
Disability Retirees Survivors DROP
Terminated Vested
Terminated Nonvested**
Total Members
2005 64,168 27,646 1,199 5,360 2,810 1,486 34,379 137,0482006 57,811 28,944 1,202 5,409 2,577 2,492 43,382 141,8172007 60,444 30,190 1,134 5,418 2,624 1,980 43,797 145,5872008 61,780 29,416 2,669 5,490 2,643 1,824 47,828 151,6502009 61,991 30,062 2,631 5,560 2,683 1,947 49,701 154,5752010 58,881 31,086 2,603 5,696 2,629 1,981 50,842 153,7182011 54,930 32,897 2,586 5,659 2,569 2,125 51,959 152,7252012 52,352 34,513 2,544 5,665 2,577 2,222 50,590 150,4632013 44,111 37,145 2,554 5,726 2,092 4,162 52,385 148,1752014 40,321 38,675 2,506 5,759 1,838 4,558 52,042 145,699
** Chart does not include Terminated Nonvested
LASERS Membership
LASERS Changes In Membership**
0
10
20
30
40
50
60
70
2005 2006 2007 2008 2009 2010 2011 2012 2013 2014
In Thousands
Fiscal Year Ended
Active Members Regular Retirees Disability Retirees Survivors DROP Terminated Vested

136
Statistical Section
Fiscal Year Ended Recipients* Net Change2005 34,205 2.2%2006 35,555 3.9%2007 36,742 3.3%2008 37,575 2.3%2009 38,253 1.8%2010 39,385 3.0%2011 41,142 4.5%2012 42,722 3.8%2013 45,425 6.3%2014 46,940 3.3%
*Recipients include Regular, Disability and Survivor retirees.
Number of Benefit Recipients
34.2
35.6
36.7
37.638.3
39.4
41.1
42.7
45.4
46.9
34
35
36
37
38
39
40
41
42
43
44
45
46
47
2005 2006 2007 2008 2009 2010 2011 2012 2013 2014
In Thousands
Fiscal Year Ended

137Louisiana State Employees’ Retirement System
Statistical Section
Retired Members By Recipient Type and Plan
Retirement Plan
Benefit Recipient Type
2005
2006
2007
2008
2009
2010
2011
2012
2013
2014
Regu
lar S
tate Employ
ees
Regu
lar R
etiree
26,230
27,453
28,625
27,804
28,359
29,261
30,837
32,289
34,692
36,004
(H
ired before July 1, 2006)
Survivor
5,114
5,149
5,146
5,201
5,256
5,383
5,336
5,325
5,370
5,391
Disability Retiree
1,126
1,121
1,057
2,571
2,528
2,491
2,474
2,425
2,425
2,363
DRO
P Accrual
2,652
2,438
2,516
2,543
2,576
2,526
2,460
2,469
1,989
1,714
Regular State Employees‐Total
35,122
36,161
37,344
38,119
38,719
39,661
41,107
42,508
44,476
45,472
Re
gulary State Employ
ees 2
Regu
lar R
etiree
‐
‐
‐
‐
‐
1
3
13
82
164
(Hired on or afte
r July 1, 2006)
Survivor
‐
‐
‐
‐
‐
‐
‐
‐
3
7
Disability Retiree
‐
‐
‐
‐
‐
‐
‐
‐
‐
1
DRO
P Accrual
‐
‐
‐
‐
‐
‐
1
8
16
24
Regular State Employees 2‐Total
‐
‐
‐
‐
‐
1
4
21
101
196
Regu
lary State Employ
ees 3
Regu
lar R
etiree
‐
‐
‐
‐
‐
‐
‐
‐
1
1
Regular State Employees 3‐Total
‐
‐
‐
‐
‐
‐
‐
‐
1
1
Corrections Employ
ees Prim
ary
Regu
lar R
etiree
968
1,021
1,082
1,099
1,117
1,164
1,257
1,287
1,294
1,321
(H
ired before Janu
ary 1, 2002)
Survivor
83
96
103
114
126
134
136
146
154
158
Disability Retiree
57
62
58
59
60
67
61
62
69
72
DRO
P Accrual
121
100
74
59
61
56
57
46
32
29
Corrections Employees Primary‐Total
1,229
1,279
1,317
1,331
1,364
1,421
1,511
1,541
1,549
1,580
Corrections Employ
ees Second
ary
Regu
lar R
etiree
11
17
24
42
83
148
274
359
451
529
(Hired on or afte
r Jan
uary 1, 2002)
Survivor
1
2
5
7
10
11
16
21
29
30
Disability Retiree
2
4
3
7
12
16
23
31
34
44
DRO
P Accrual
9
11
5
8
18
24
30
32
32
38
Corrections Employees Secondary‐Total
23
34
37
64
123
199
343
443
546
641
Peace Officers
Regu
lar R
etiree
‐
‐
3
7
12
18
27
33
36
40
(Hired before Janu
ary 1, 2011)
Disability Retiree
‐
‐
1
1
1
1
1
1
1
1
DRO
P Accrual
‐
‐
1
10
8
6
2
1
3
3
Peace Officers‐Total
‐
‐
5
18
21
25
30
35
40
44
Fiscal Year

138
Statistical Section
Retired Members By Recipient Type and Plan (continued)
Retirement Plan
Benefit Recipient Type
2005
2006
2007
2008
2009
2010
2011
2012
2013
2014
Fiscal Year
App
ellate Law Clerks
Regu
lar R
etiree
‐
‐
‐
‐
‐
6
8
14
21
28
(Hired before July 1, 2006)
DRO
P Accrual
‐
‐
‐
‐
‐
‐
‐
2
‐
1
Appellate Law Clerks‐Total
‐
‐
‐
‐
‐
6
8
16
21
29
Wild
life Agents
Regu
lar R
etiree
158
158
156
138
133
131
127
123
117
112
(Hired before July 1, 2003)
Survivor
73
71
68
66
63
60
59
57
55
54
Disability Retiree
11
11
10
21
20
19
19
17
17
16
DRO
P Accrual
‐
‐
‐
‐
‐
‐
2
‐
‐
‐
Wildlife Agents (Before 2003)‐Total
242
240
234
225
216
210
207
197
189
182
Wild
life Agents
Regu
lar R
etiree
10
30
33
37
41
46
51
57
69
78
(Hired on or afte
r July 1, 2003)
Survivor
‐
‐
1
1
2
2
2
3
3
3
Disability Retiree
2
3
3
3
3
3
3
3
3
3
DRO
P Accrual
‐
‐
3
5
4
4
3
8
6
5
Wildlife Agents (After 2003)‐Total
12
33
40
46
50
55
59
71
81
89
Judg
esRe
gular R
etiree
197
192
194
195
226
220
219
225
227
235
(Elected before Janu
ary 1, 2011)
Survivor
71
72
73
79
80
82
87
88
89
90
Disability Retiree
1
1
2
7
7
6
5
5
5
5
DRO
P Accrual
23
23
20
18
16
13
14
11
13
21
Judges‐Total
292
288
289
299
329
321
325
329
334
351
Legislators
Regu
lar R
etiree
72
73
73
94
91
91
88
88
90
85
(Elected before Janu
ary 1, 2011)
Survivor
18
19
22
22
23
24
23
25
23
26
DRO
P Accrual
5
5
5
‐
‐
‐
‐
‐
‐
‐
Legislators‐Total
95
97
100
116
114
115
111
113
113
111

139Louisiana State Employees’ Retirement System
Statistical Section
Retired Members By Recipient Type and Plan (continued)
Retirement Plan
Benefit Recipient Type
2005
2006
2007
2008
2009
2010
2011
2012
2013
2014
Fiscal Year
Bridge Police Em
ploy
ees
Regu
lar R
etiree
‐
‐
‐
‐
‐
‐
1
1
2
2
(Hired before July 1, 2006)
Bridge Police Employees‐Total
‐
‐
‐
‐
‐
‐
1
1
2
2
Hazardo
us Duty
Regu
lar R
etiree
‐
‐
‐
‐
‐
‐
5
20
59
69
(Hired on or afte
r Jan
uary 1, 2011)
Disability Retiree
‐
‐
‐
‐
‐
‐
‐
‐
‐
1
DRO
P Accrual
‐
‐
‐
‐
‐
‐
‐
1
1
3
Hazardous Duty‐Total
‐
‐
‐
‐
‐
‐
5
21
60
73
Alcoh
ol and Tob
acco Con
tro
Regu
lar R
etiree
‐
‐
‐
‐
‐
‐
‐
4
4
7
(Hired on or afte
r Jun
e 30, 2007)
Alcohol and Tobacco Control‐Total
‐
‐
‐
‐
‐
‐
‐
4
4
7
Grand Total Benefit Recipients
37,015
38,132
39,366
40,218
40,936
42,014
43,711
45,300
47,517
48,778

140
Statistical Section
Fiscal Year 2014 Gross Bene�ts Paid by Region
Shreveport
MonroeAlexandria
Lake CharlesAcadiana
Baton Rouge New Orleans
North Shore
This chart provides a regional snapshot of benefits paid to retirees during the 2013-2014 fiscal year. The parishes are separated into eight regions: Shreveport, Monroe, Alexandria, Lake Charles, Acadiana, Baton Rouge, New Orleans, and North Shore.
$73,929,113 $61,613,677
$77,962,815
$27,691,519 $67,597,266 $265,174,150
$66,449,973
$136,968,585

141Louisiana State Employees’ Retirement System
Statistical Section
Fiscal Year 2014 Gross Benefits Paid By Region (continued)
Acadiana MonroeAcadia 5,919,191$ Caldwell 3,254,893$ Evangeline 4,586,213 East Carroll 511,553Iberia 4,806,209 Franklin 4,185,687Lafayette 29,075,227 Jackson 2,632,921St. Landry 10,210,855 Lincoln 11,180,783St. Martin 6,285,177 Madison 1,290,893St. Mary 2,398,833 Morehouse 2,451,580Vermilion 4,315,561 Ouachita 26,742,440
67,597,266$ Richland 3,677,143Alexandria Tensas 958,817Avoyelles 12,962,648 Union 3,455,990Catahoula 1,568,838 West Carroll 1,270,977Concordia 2,173,129 61,613,677$ Grant 5,730,401 New OrleansLa Salle 1,784,653 Jefferson 47,363,864Natchitoches 6,488,464 Lafourche 10,467,151Rapides 37,755,395 Orleans 56,750,409Sabine 3,059,532 Plaquemines 1,997,868Vernon 4,355,670 St. Bernard 2,700,319Winn 2,084,085 St. Charles 3,192,208
77,962,815$ St. John the Baptist 3,449,182Baton Rouge Terrebonne 11,047,584Ascension 17,996,654 136,968,585$ Assumption 1,423,496 North ShoreEast Baton Rouge 159,107,044 St. Helena 3,002,849East Feliciana 19,458,291 St. Tammany 26,193,928Iberville 8,745,223 Tangipahoa 26,727,804Livingston 34,811,805 Washington 10,525,392Pointe Coupee 6,555,020 66,449,973$ St. James 1,766,479 ShreveportWest Baton Rouge 6,926,990 Bienville 2,969,979West Feliciana 8,383,148 Bossier 14,268,701
265,174,150$ Caddo 43,415,198Lake Charles Claiborne 3,705,694Allen 2,092,773 De Soto 2,794,231Beauregard 3,273,413 Red River 1,631,566Calcasieu 19,717,469 Webster 5,143,744Cameron 183,564 73,929,113$ Jefferson Davis 2,424,300
27,691,519$ Total 777,387,098$

142
Statistical Section
American Samoa 1Australia 1Canada 2Colombia 1France 1Great Britain 1Ireland 1Korea 1Mexico 1Panama 1Philippines 3Turkey 1Thailand 1
TOTAL 16
AK9
MS798
AR225
AZ35
CA96
CO73
CT4
DC3
DE2
FL237
GA19 3
HI3
IA7
ID9
IL29
IN25
KS16
KY34
LA43,187
MA11
MD21
ME2
MI19
MN11
MO45
AL173
MT2
NC114
ND1
NE4 NJ
16
NM32
NV22
NY25
OH26
OK42
OR16
PA23
SC31
SD4
TN160
TX1,021
UT6 VA
55
VT1
WA36
WV4
WY3
WI11
NH1
RI1
1Recipients include Regular, Disability and Survivor retirees
Location of LASERS Benefit Recipients1
Foreign Countries
Contact InformationLocation: 8401 United Plaza Blvd. • Baton Rouge, LA 70809
Mail: P.O. Box 44213 • Baton Rouge, LA 70804-4213
Phone: (toll-free) 800.256.3000 • (local) 225.922.0600
Web: www.lasersonline.org
Vision
To provide a sound retirement plan for our members through prudent
management and exceptional service
Mission
Highest Ethical StandardsIntegrity
Prudent Management
Core Values
Iris, Brown Pelican, Magnolia, Crawfish, Cypress Photos Courtesy of Louisiana Office of Tourism
�e Louisiana State Employees’ Retirement System (LASERS) distributed this document digitally. No publication costs were incurred.