A Multifunctional LNA Oligonucleotide-Based Strategy Blocks ...
Upload
independentCategory
view
4download
0
Interactions in Oligonucleotide Hybrid Duplexes on Microarrays
Hans Binder,*,† Toralf Kirsten, † Ivo L. Hofacker,‡ Peter F. Stadler,†,§ and Markus Loeffler †,|
Interdisciplinary Centre for Bioinformatics, UniVersity of Leipzig, Institute of Theoretical Chemistry andStructural Biology, UniVersity of Vienna, Bioinformatics group, Department of Computer Science, andInstitute for Medical Informatics, Statistics and Epidemiology, UniVersity of Leipzig, Kreuzstrasse 7b,D-4103 Leipzig, Germany
ReceiVed: January 29, 2004; In Final Form: August 23, 2004
We investigated Affymetrix GeneChip intensity data in terms of chip-averaged sensitivities over all perfectmatch (PM) and mismatch (MM) probes possessing a common triple of neighboring bases in the middle oftheir sequence. This approach provides a model-independent estimation of base-specific contributions to theprobe sensitivities. We found that fluorescent labels attached to nucleotide bases forming Watson-Crick(WC) pairs in most cases decrease their binding affinity and, thus, decrease the sensitivity of the probe.Single-base-related mean sensitivity values rank in ascending order according to C> G ≈ T > A. Thecentral base of PM and MM probes mainly forms WC pairings in duplexes with nonspecific transcripts,which obviously dominate the chip-averaged sensitivity values. Linear combinations of the triple-averagedprobe sensitivities provide nearest-neighbor (NN) sensitivity terms, which rank in a similar order as therespective NN free-energy terms obtained from previous thermodynamic studies on the stability of RNA/DNA duplexes in solution. Systematic deviations between both data sets can be mostly attributed to thelabeling of the target RNA in the chip experiments. Our results provide a set of molecular NN and single-base-related interaction parameters which consider specific properties of duplex formation in microarrayhybridization experiments.
Introduction
Target binding to high-density oligonucleotide microarraysused for gene expression experiments is governed by themolecular interactions in the hybrid duplexes formed by RNAfragments and DNA probes. The knowledge of the details ofthe DNA/RNA hybridization behavior on a molecular level andits estimation by means of effective parameters represents oneprerequisite for selecting optimal probe sequences from targetgenes for newly designed chips. Especially short oligonucle-otides might be ineffective as RNA binders as a result ofrelatively weak interactions between probe and target. Existingmethods for chip design mostly involve thermodynamic criteriabased on interaction parameters referring to hybrid duplexes insolution for the optimization of probe sequences (see refs 1, 2and references therein). Recent analyses show that severalfactors, such as the presence of fluorescent labels, modifies thestability of RNA/DNA duplexes on microarrays compared withduplexes in solution.3,4 The understanding of the hybridizationproperties of microarray probes presumably requires a modifiedview of the molecular interactions in DNA/RNA duplexes,which takes into account labeling and also, possibly, effectsdue to the fixation of the probes at the quartz surface.
Available microarray intensity data are directly related to thebinding affinity of the individual probes.4 They therefore providevaluable information about molecular interactions in RNA/DNAduplexes, which can be used to extract relevant interaction
parameters. In this work, we make use of two types ofredundancies in the design of Affymetrix GeneChip microarrays,which were created to improve the reliability of the method.5,6
First, so-called probe sets consisting of 11-20 differentreporter probes for each gene allows us to estimate the sensitivityof a probe as the deviation of its intensity from the respectiveset average in a logarithmic scale.4 The sensitivity of a micro-array oligonucleotide probe characterizes its ability to detect acertain amount of RNA transcripts independently of the condi-tions of sample preparation, hybridization, and measurementof the fluorescence intensity. It is mainly determined by theaffinity of a particular DNA probe to bind RNA fragments viacomplementary Watson-Crick (WC) pairs.
Second, each probe is present in pairs of so-called perfectmatch (PM) and mismatch (MM) modifications. The sequenceof the PM is taken from the gene of interest, and thus, it iscomplementary to a 25-mer in the RNA target sequence. Thesequence of the MM is identical with that of the PM probeexcept the position in the middle of the oligomer where themiddle base is replaced by its complementary base. The pairwisedesign of probes intends to measure the amount of nonspecifichybridization and, by this way, to correct the PM intensities.An important question for GeneChip data analysis is how toinclude the MM intensities adequately. One prerequisite forsolving this issue is the detailed study of the effect of the MMbase in probe-target duplexes on the signal intensity.
In the accompanying paper,4 we found that the middle basesystematically shifts the PM and MM probe sensitivities relativeto another. Also, other studies reported that the strength of base-pair interaction in the middle of the oligonucleotide affects theaffinity of the probes for target binding to an extraordinaryextend.3,7 In addition, stacking interactions between nearest
* Corresponding author. E-mail: [email protected]. Fax:++49-341-1495-119.
† Interdisciplinary Centre for Bioinformatics.‡ Institute of Theoretical Chemistry and Structural Biology.§ Department of Computer Science.| Institute for Medical Informatics, Statistics and Epidemiology.
18015J. Phys. Chem. B2004,108,18015-18025
10.1021/jp049592o CCC: $27.50 © 2004 American Chemical SocietyPublished on Web 10/27/2004

neighbors within the sequence of the probe and the target areknown to influence the stability of the duplexes.8-10 It seems,therefore, reasonable to consider the middle base and also itsnearest neighbors and to study the probe sensitivities as afunction of the middle triple XYZ (X, Y, Z) A, T, G, C; seeFigure 1 for illustration) (i.e., of the nucleotide bases at positionk ) 12-14 of the probe sequence).
One key issue of probe design and chip data analysisaddresses the relationship between the base composition of aprobe and its affinity for target binding. Matveeva et al. showedthat thermodynamic evaluations of the oligomer-target duplexand oligomer self-structure stabilities based on sequence in-formation can facilitate probe design.1 In our previous publica-tion, we analyzed probe sensitivities as a function of simplesequence characteristics.4 The results reveal, for example, adirect correlation between the number of C or A bases in theprobe sequence and the sensitivity.
Our present work is aimed at characterizing the interactionsbetween DNA and labeled RNA in terms of sequence-relatedparameters referring either to PM or MM probes. We make useof the fact that a typical Affymetrix GeneChip contains, on theaverage, more than 3500, but at minimum, more than 1000different probes with a common middle triple. Averaging ofthe sensitivity values over these ensembles of probes withcommon triples XYZ to a large extent reduces the specific effectof the sequence outside of the middle triple (i.e., for basepositionsk ) 1-11 and 15-25). The chip-averaged sensitivitiesfor each middle triple of the PM and MM probes, by this way,allow the detailed characterization of the binding affinity as afunction of the triple sequence. We derived here nearest-neighbor (NN) interaction parameters from the triple averagesand compared them with the NN free-energy terms of duplexformation in solution.10,11
Our model-independent approach complements previousstudies which analyze the intensity of microarray probes in theframework of base- and position-dependent models.3,7,12,13Analternative model which considers the positional dependenceof NN sensitivity terms was recently presented.14
Methods and Microarray Data
Triple Averages of the Probe Sensitivity.We defined thesensitivity of perfect match (PM) and mismatch (MM) probesof Affymetrix GeneChips as their normalized intensity in a log10scale
where the angular brackets⟨‚‚‚⟩set denote arithmetic averagingover the probe set of 11-20 probes referring to one target gene.4
The probe intensities are corrected for the optical backgroundusing the algorithm provided byMAS 5.0.6 So-called chipaverages of middle triples,⟨YP(XYZ) ⟩chip, are calculated overall probe sequences with a common middle triple given by thebases XYZ (X, Y, Z) A, T, G, C) at positionk ) 12-14 ofthe probe sequence.
Most of the presented triple averages are mean values of thechip averages over theNchip ) 42 GeneChips provided by theAffymetrix human genome HG U133 Latin square (HG U133-LS) data set available at http://www.affymetrix.com/ support/technical/sample_data/datasets.affx
In addition, we analyzed chip data taken from two differenttypes of Affymetrix GeneChips referring to the human (HGU95Av2) and mouse (MG U74Av2) genome. The results onlydiffer insignificantly from results obtained from the HG U133chips presented here (not shown). All chip analyses areperformed using the gene expression data warehouse platformof IZBI (see www.izbi.de).
Each HG U133 Affymetrix chip contains, on the average,nearly 4000 different probes with a common middle triple. It istherefore reasonable to assume that averaging reduces thespecific effect of the sequence outside of the middle triple (i.e.,for base positionsk ) 1-11 and 15-25). On the other hand,the distribution of the nucleotide bases in the ensemble of probeswith a common middle triple can significantly deviate from therandom distribution. In the Appendix, we show that this effectgives rise to a systematic bias of the triple averages, which canbe considered by a correction factorFtriple ≈ 1.2 for the tripleaverages andFNN ≈ FSB ≈ 1.1 for the derived nearest-neighborand single-base terms.
Binding Affinity of PM and MM Probes for Specific andNonspecific Transcripts.The normalized intensity,YP, definesthe sensitivity of a given probe.4 It is directly related to thebinding constant between target RNA and DNA oligonucleotideprobes,KP,S ) KP,S(êPêT) (the superscripts, P) PM, MM, andT, differentiate between PM and MM probes and the target;see also eq 2), to nonspecific hybridization and terms whichconsider fluorescence emission, saturation of the probes withbound targets, and the folding propensity of probe and target
with
and the definition∆ log(A) ≡ log(A) - ⟨log(A)⟩set (see theaccompanying paper4 for a detailed description). The ratio
Figure 1. Schematic representation of RNA/DNA probe duplexes onGeneChip microarrays. A probe pair consists of a PM and MM probe.In the MM sequence, the middle base is replaced by the respectivecomplementary base. Upper case letters indicate the middle triple ofthe DNA probe, which is paired with the respective complementarybases of the RNA target except the middle base of the MM (lowercase letters; the asterisk indicates fluorescence labeling). We assumethat the central base of the MM probes forms complementary WC pairsin duplexes with nonspecific transcripts and SC pairs in duplexes withspecific transcripts (see text). The middle letters of PM and MM probesof the same pair are different. PMs and MMs with common middlebases refer to different probe pairs.
YP ) log IP - ⟨log IP⟩set; P ) PM, MM (1)
⟨YP(XYZ) ⟩ )1
Nchip∑i)1
Nchip
⟨YP(XYZ) ⟩chip,i
YP ≈ YSP + YNS
P + YFP - Ysat
P - YfoldP - Yfold
T (2)
YSP ) ∆ log[KP,S(êPêT)]
YNSP ≈ ∆ log[xS + (1 - xS)‚rP(êP)]
18016 J. Phys. Chem. B, Vol. 108, No. 46, 2004 Binder et al.

rP(êP) ) ⟨KP,NS(êPê)⟩|ê*êT/KP,S(êPêT) specifies the relationshipbetween the affinity of specific and nonspecific binding (seetext to follow).
We expect that the difference between the sensitivities of thePM and MM probes of one pair
essentially cancels out the contributions due to fluorescence andfolding, because both probe sequences refer to one target.This expectation is confirmed by the observation that themean standard deviation of the difference⟨Ypair
PM - MM(XYZ) ⟩,SD(YPM - MM)triple ≈ 0.28, is markedly smaller compared withthe standard deviations of the individual PM and MM sensitivi-ties, SD(YPM)triple ≈ 0.41 and SD(YMM)triple ≈ 0.47 (see also textto follow). Hence, systematic factors such as specific bindingoutside the middle triple, nonspecific binding, fluorescence, andfolding indeed affectYPM and YMM in a similar fashion. The
variability due to these effects is considerably reduced in thesensitivity differenceYPM - MM. A similar tendency is expectedfor the triple averaged PM-MM differences of PM and MMprobes with identical middle triples (see eq 5) and for the PM-PM and MM-MM differences of probes with complementarymiddle bases (see eqs 6 and 7).
The sample solution used for hybridization contains a totalRNA concentration ofcRNA
tot . Only a fractionxS ) xS(êT) refersto target RNA, whereasxNS(ê * êT) ) 1 - xS defines thefraction of nonspecific transcripts involving sequences otherthan the intended target. The binding constant of the PMs,KPM,S(êPMêT), quantifies the affinity of specific binding betweenthe target and the probe with sequencesêT andêPM, respectively.Both sequences are complementary in terms of WC base pairs.The binding constant of the MMs,KMM,S(êMMêT), characterizesthe binding affinity of target RNA, which specifically binds tothe respective MM probe despite the fact that the middle basedisables WC pairing with the target. Instead, the 13th base isassumed to form the respective SC pair, A-a, T-u*, G-g, orC-c* (see Figure 1: uppercase letters refer to the DNA probeand lower case letters to the RNA oligonucleotide; potentiallylabeled bases are indicated by asterisks).
The ratiorP(êP) ) ⟨KP,NS(êPê)⟩|ê*êT/KP,S(êPêT) specifies themean binding affinity of nonspecific transcripts relative to theaffinity of specific binding.4 The binding constant of nonspecifichybridization, ⟨KP,NS(êPê)⟩|ê*êT, represents the concentration-weighted average over the binding constants of an ensemble ofRNA sequences,ê * êT, which only partly match the probesequenceêP by complementary bases. The stability of theseduplexes is mainly determined by the number of remaining WCbase pairings between the probe and bound RNA according tothe conventional theory of hybridization on microarrays.15 Thenonspecific transcripts are taken from a cocktail of RNAfragments with a broad distribution of base composition, whichenables WC pairings with the middle bases of the PM and theMM probes despite the fact that the respective bases arecomplementary (see Figure 1). In other words, we assume thatthe hybridization solution contains a sufficiently large numberof different sequences that partially match the probe sequences
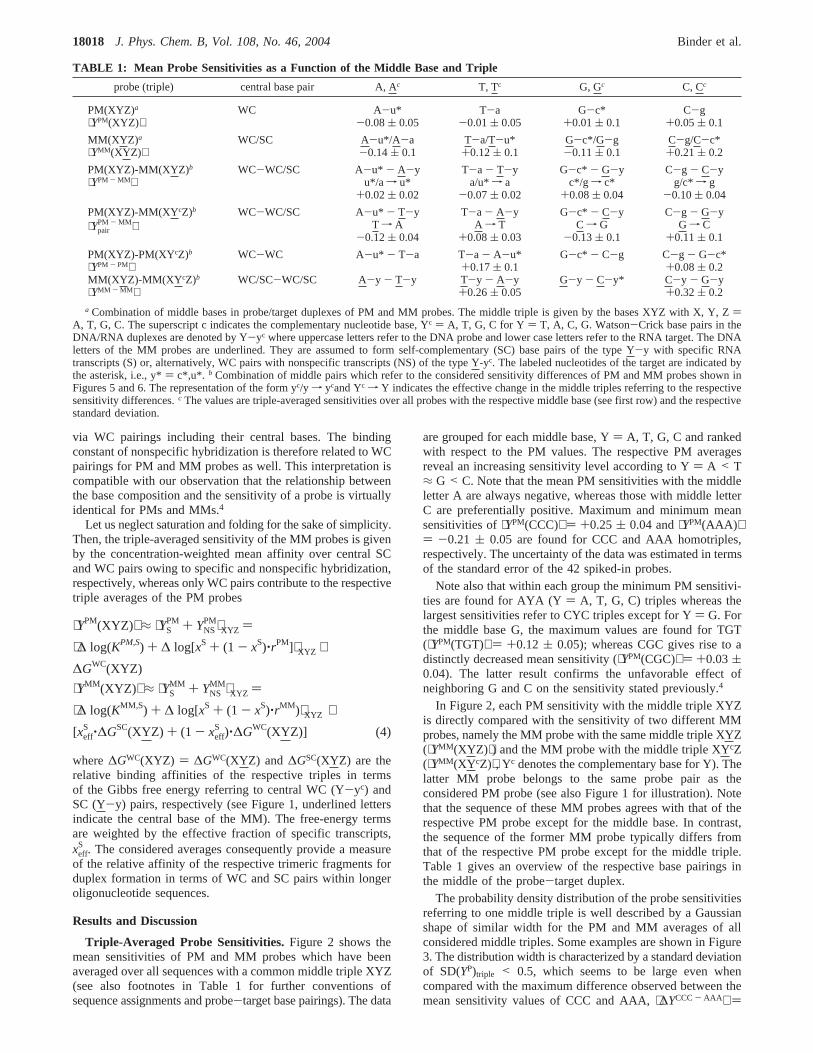
Figure 2. Mean sensitivities of all PM and MM probes with a givenmiddle triple of letters (see left axis and figure for assignment). Thedata reflect the base-specific interactions in the middle of the target-probe duplexes which systematically affect the probe sensitivities. Thecombination of middle triples XYZ/XYcZ refers to PM/MM probe pairs(Yc denotes the complementary nucleotide base of Y; underlined lettersdenote the mismatched middle base of the MMs). The probes aregrouped for each middle letter of the PM sequence and ranked withincreasing⟨YPM⟩ within each group. The error bars are the standarderrors referring to the averaging over 42 chips provided by the HGU133-LS experiment. The mean number of probes per triple on anHG U133 chip is 3900 with a standard deviation of(1380. The signs- and+ indicate triples with only 1100-1400 and with 6000-7400probes, respectively.
YpairPM - MM ≡ YPM - YMM ≈ YS
PM - MM + YNSPM - MM (3)
Figure 3. Probability density distribution of the sensitivity of probeswith certain middle triples. PM probes with the middle triples AAAand CCC (panel below); PM probes with the triple CGC and MMprobes with CGC and CCC (panel above).
Interactions in Oligonucleotide Duplexes J. Phys. Chem. B, Vol. 108, No. 46, 200418017
via WC pairings including their central bases. The bindingconstant of nonspecific hybridization is therefore related to WCpairings for PM and MM probes as well. This interpretation iscompatible with our observation that the relationship betweenthe base composition and the sensitivity of a probe is virtuallyidentical for PMs and MMs.4
Let us neglect saturation and folding for the sake of simplicity.Then, the triple-averaged sensitivity of the MM probes is givenby the concentration-weighted mean affinity over central SCand WC pairs owing to specific and nonspecific hybridization,respectively, whereas only WC pairs contribute to the respectivetriple averages of the PM probes
where∆GWC(XYZ) ) ∆GWC(XYZ) and ∆GSC(XYZ) are therelative binding affinities of the respective triples in termsof the Gibbs free energy referring to central WC (Y-yc) andSC (Y-y) pairs, respectively (see Figure 1, underlined lettersindicate the central base of the MM). The free-energy termsare weighted by the effective fraction of specific transcripts,xeff
S . The considered averages consequently provide a measureof the relative affinity of the respective trimeric fragments forduplex formation in terms of WC and SC pairs within longeroligonucleotide sequences.
Results and Discussion
Triple-Averaged Probe Sensitivities.Figure 2 shows themean sensitivities of PM and MM probes which have beenaveraged over all sequences with a common middle triple XYZ(see also footnotes in Table 1 for further conventions ofsequence assignments and probe-target base pairings). The data
are grouped for each middle base, Y) A, T, G, C and rankedwith respect to the PM values. The respective PM averagesreveal an increasing sensitivity level according to Y) A < T≈ G < C. Note that the mean PM sensitivities with the middleletter A are always negative, whereas those with middle letterC are preferentially positive. Maximum and minimum meansensitivities of⟨YPM(CCC)⟩ ) +0.25( 0.04 and⟨YPM(AAA) ⟩) -0.21 ( 0.05 are found for CCC and AAA homotriples,respectively. The uncertainty of the data was estimated in termsof the standard error of the 42 spiked-in probes.
Note also that within each group the minimum PM sensitivi-ties are found for AYA (Y) A, T, G, C) triples whereas thelargest sensitivities refer to CYC triples except for Y) G. Forthe middle base G, the maximum values are found for TGT(⟨YPM(TGT)⟩ ) +0.12 ( 0.05); whereas CGC gives rise to adistinctly decreased mean sensitivity (⟨YPM(CGC)⟩ ) +0.03(0.04). The latter result confirms the unfavorable effect ofneighboring G and C on the sensitivity stated previously.4
In Figure 2, each PM sensitivity with the middle triple XYZis directly compared with the sensitivity of two different MMprobes, namely the MM probe with the same middle triple XYZ(⟨YMM(XYZ) ⟩) and the MM probe with the middle triple XYcZ(⟨YMM(XYcZ)⟩, Yc denotes the complementary base for Y). Thelatter MM probe belongs to the same probe pair as theconsidered PM probe (see also Figure 1 for illustration). Notethat the sequence of these MM probes agrees with that of therespective PM probe except for the middle base. In contrast,the sequence of the former MM probe typically differs fromthat of the respective PM probe except for the middle triple.Table 1 gives an overview of the respective base pairings inthe middle of the probe-target duplex.
The probability density distribution of the probe sensitivitiesreferring to one middle triple is well described by a Gaussianshape of similar width for the PM and MM averages of allconsidered middle triples. Some examples are shown in Figure3. The distribution width is characterized by a standard deviationof SD(YP)triple < 0.5, which seems to be large even whencompared with the maximum difference observed between themean sensitivity values of CCC and AAA,⟨∆YCCC- AAA ⟩ )
TABLE 1: Mean Probe Sensitivities as a Function of the Middle Base and Triple
probe (triple) central base pair A, Ac T, Tc G, Gc C, Cc
PM(XYZ)a
⟨YPM(XYZ) ⟩WC A-u*
-0.08( 0.05T-a
-0.01( 0.05G-c*
+0.01( 0.1C-g
+0.05( 0.1
MM(XYZ) a
⟨YMM(XYZ) ⟩WC/SC A-u*/A-a
-0.14( 0.1T-a/T-u*
+0.12( 0.1G-c*/G-g-0.11( 0.1
C-g/C-c*+0.21( 0.2
PM(XYZ)-MM(XYZ) b
⟨YPM - MM⟩WC-WC/SC A-u* - A-y
u*/a f u*+0.02( 0.02
T-a - T-ya/u* f a
-0.07( 0.02
G-c* - G-yc*/g f c*
+0.08( 0.04
C-g - C-yg/c* f g
-0.10( 0.04
PM(XYZ)-MM(XY cZ)b
⟨YpairPM - MM⟩
WC-WC/SC A-u* - T-yT f A
-0.12( 0.04
T-a - A-yA f T
+0.08( 0.03
G-c* - C-yC f G
-0.13( 0.1
C-g - G-yG f C
+0.11( 0.1
PM(XYZ)-PM(XYcZ)b
⟨YPM - PM⟩MM(XYZ)-MM(XY cZ)b
⟨YMM - MM⟩
WC-WC
WC/SC-WC/SC
A-u* - T-a
A-y - T-y
T-a - A-u*+0.17( 0.1T-y - A-y+0.26( 0.05
G-c* - C-g
G-y - C-y*
C-g - G-c*+0.08( 0.2C-y - G-y+0.32( 0.2
a Combination of middle bases in probe/target duplexes of PM and MM probes. The middle triple is given by the bases XYZ with X, Y, Z)A, T, G, C. The superscript c indicates the complementary nucleotide base, Yc ) A, T, G, C for Y ) T, A, C, G. Watson-Crick base pairs in theDNA/RNA duplexes are denoted by Y-yc where uppercase letters refer to the DNA probe and lower case letters refer to the RNA target. The DNAletters of the MM probes are underlined. They are assumed to form self-complementary (SC) base pairs of the type Y-y with specific RNAtranscripts (S) or, alternatively, WC pairs with nonspecific transcripts (NS) of the type Y-yc. The labeled nucleotides of the target are indicated bythe asterisk, i.e., y*) c*,u*. b Combination of middle pairs which refer to the considered sensitivity differences of PM and MM probes shown inFigures 5 and 6. The representation of the form yc/y f ycand Yc f Y indicates the effective change in the middle triples referring to the respectivesensitivity differences.c The values are triple-averaged sensitivities over all probes with the respective middle base (see first row) and the respectivestandard deviation.
⟨YPM(XYZ) ⟩ ≈ ⟨YSPM + YNS
PM⟩XYZ )
⟨∆ log(KPM,S) + ∆ log[xS + (1 - xS)‚rPM]⟩XYZ ∝
∆GWC(XYZ)
⟨YMM(XYZ) ⟩ ≈ ⟨YSMM + YNS
MM⟩XYZ )
⟨∆ log(KMM,S) + ∆ log[xS + (1 - xS)‚rMM)⟩XYZ ∝
[xeffS ‚∆GSC(XYZ) + (1 - xeff
S )‚∆GWC(XYZ)] (4)
18018 J. Phys. Chem. B, Vol. 108, No. 46, 2004 Binder et al.
⟨YPM(CCC)⟩ - ⟨YPM(AAA) ⟩ < 0.6. Application of the two-sample t-test to the difference between the triple averages forthe 42 chips of the LS experiment provides a significance levelof 0.02 for the mean difference⟨∆YCCC- AAA ⟩. Analyses ofthe differences between the other triples provide similar results.Hence, differences between the triple averages greater than 0.02might be judged as significant. Note that the standard error ofthe individual triple values, SE(Y) ≈ 0.05, is more than twiceas large as the standard error of the difference, SE(∆Y) ≈ 0.02,owing to correlations between the intensity values on each chip,which contribute to SE(Y) but not to SE(∆Y). Consequently,SE(Y) represents a maximum error estimate of the triple averages(see error bars in Figure 2).
Sensitivity Differences of PM and MM Triple Averages.Both types of mean MM sensitivities deviate from the respectivePM sensitivity into opposite directions, and in most cases, theydiffer even in sign (compare open and solid symbols with thebars in Figure 2). The differences between the mean PM andMM sensitivities
and
reveal this behavior more clearly (Figure 4). The sign of⟨YPM - MM⟩ strongly correlates with the middle base of the PMprobe. As a rule of thumb, the middle letters A and G give riseto positive mean sensitivity differences between PMs and MMswith common middle triples, XYZ/XYZ, whereas T and C causenegative values of⟨YPM - MM(XYZ)⟩ (see open symbols in Figure4 and Table 1). The relationship reverses for the sensitivitydifferences,⟨Ypair
PM - MM(XYZ) ⟩, between the PMs and MMs ofone probe pair with middle triples XYZ/XYcZ (note that thefigure reverses sign for⟨YPM - MM(XYZ) ⟩ for direct comparisonwith ⟨Ypair
PM - MM(XYZ) ⟩). This result is compatible with thepreference of middle letters A and G for sensitive MMs,YPM
< YMM, and vice versa, the preference of T and C for sensitivePMs, YPM > YMM.4
In addition, we calculated the sensitivity difference betweenthe PMs with complementary middle bases
and the respective sensitivity difference between the MMs (seeFigure 5 and Table 1)
Only two middle letters, T and C, have been consideredin Figure 5 owing to the symmetry⟨YP-P(XYZ) ⟩ )-⟨YP-P(XYcZ)⟩.
The sign of the PM-PM and MM-MM sensitivity differ-ences correlate with the middle letter in a similar fashion asthe PM-MM heterodifferences (Figure 4). Moreover, compari-son of Figures 5 and 6 reveals a similar effect of the adjacentbases on the calculated sensitivity differences. For example, thetriples CCC and GCG provide the largest and smallest valuesfor all considered sensitivity differences with middle letter C.The sensitivity values are obviously related to the base in themiddle of the probe-target duplex (see Table 1 for an overviewand assignments). Most of the positive⟨Ypair
PM - MM(XYZ) ⟩ and⟨YP- P(XYZ)⟩ data correspond to pyrimidines (C and T), whereasnegative differences are found for purines (G and A).
Molecular Interactions in Probe-Target Duplexes.Thesensitivity difference between the PMs with complementarymiddle bases,⟨YPM - PM(XYZ) ⟩ (eq 6), directly compares thestrengths of complementary WC base pairs in DNA/RNA hy-brid duplexes (see Figure 5 and Table 1). For example,⟨YPM - PM(XCZ)⟩ compares the strength of C-g with that ofG-c* in the respective triples. The middle-base-related sign ofthe ⟨YPM - PM(XYZ) ⟩ data therefore reflects the followingrelationships between the interaction strengths: T-a > A-u*and, partially, C-g > G-c*. The asymmetry can be, at leastpartially, explained by the biotinilation and labeling of thepyrimidines c* and u* in the RNA sequence. The labelsobviously hamper the formation of WC pairs.
This suggestion is further confirmed by the observation thatthe sensitivity difference reverses and becomes negative fornonlabeled middle pairs (i.e., C-g < G-c*) if both nearestneighbors became labeled in the triples GCG/c*gc*, TCT/u*gu*,TCG/u*gc*, and GCT/c*gu*. In other words, in these triples,the G-c* pair adjacent to the central C-g obviously decreasesthe sensitivity if two labeled bases flank the nonlabeled centralbase in the target sequence. On the other hand, the opposite
⟨YPM - MM(XYZ) ⟩ ) ⟨YPM(XYZ) ⟩ - ⟨YMM(XYZ)⟩
⟨YpairPM - MM(XYZ) ⟩ ) ⟨YPM(XYZ) ⟩ - ⟨YMM(XYcZ)⟩ (5)
⟨YPM - PM(XYZ) ⟩ ) ⟨YPM(XYZ) ⟩ - ⟨YPM(XYcZ)⟩ (6)
⟨YMM - MM(XYZ)⟩ ) ⟨YMM(XYZ)⟩ - ⟨YMM(XYcZ)⟩ (7)
Figure 4. Mean sensitivity difference of PM and MM probes,⟨YPM - MM⟩ and ⟨Ypair
PM - MM⟩ (see eq 5). The sign of the data stronglycorrelates with the middle base. The PM/MM couples refer either toone probe pair with the combination of middle letters XYZ/XYcZ (bars)or to different probe pairs with PMs and MMs possessing iden-tical middle triples (XYZ/XYZ, squares). The middle triples aregrouped for each PM middle letter (see figure) and ranked with re-spect to⟨Ypair
PM - MM⟩. Note that the figure shows negative values of⟨YPM - MM⟩ for direct comparison with⟨Ypair
PM - MM⟩. The error bars referto the standard error of 42 chips. See text and Table 1 for furtherexplanation.
Interactions in Oligonucleotide Duplexes J. Phys. Chem. B, Vol. 108, No. 46, 200418019
tendency is observed for labeled G-c* pairs adjacent to thenonlabeled middle pair in GTG/c*ac*. Neighboring TG behavesobviously differently compared with adjacent CG and CT.
The sensitivity differences between the MMs with comple-mentary middle bases,⟨YMM - MM(XYZ) ⟩, depend in a verysimilar fashion on the middle base as the respective PMdifference (see Figure 5). This agreement can be rationalized ifthe central base in the MM-transcript duplex mainly forms WCpairings with the bound RNA as in the case of the PMs. Notethat the formation of central WC pairings by the MMs isexpected if nonspecific hybridization dominates duplex forma-tion (xeff
S , 1, see eq 4). From the chip-averaged intensitydifference between PM and MM probes, we concluded that mostof the probes of the considered chips are nonspecificallyhybridized (see ref 4) in agreement with our interpretation ofthe sensitivity difference of the MM probes. Alternatively, asimilar behavior of MM and PM sensitivity differences turnsout if the binding strength of the central SC pair in specificduplexes is relatively weak (|∆GSC(XYZ) | , |∆GWC(XYZ) |,see eq 4). In this case, the SC pair virtually does not contributeto the respective triple-averaged sensitivity value.
The heterodifferences⟨YpairPM - MM(XYZ) ⟩ highly correlate
with the respective homodifferences⟨YP- P(XYZ) ⟩ (see Figures4-6). This correspondence can be simply explained if thecentral base pairings in the PM and MM probes are dominatedby WC pairings, in agreement with our interpretation givenalready. Hence, the difference between the PM and MM
sensitivities of one probe pair mainly reflects the Y-yc versusYc-y asymmetry of the WC pairings (e.g., C-g versus G-c*).
Correlation Between the Middle Triple Averages of PMand MM Sensitivities: The Effect of Mismatches.The plotof ranked sensitivities shown in Figure 2 provides a firstimpression of the degree of correlation between the PM andMM averages for each middle letter. For example,⟨YPM(XYZ) ⟩and⟨YMM(XYZ) ⟩ run almost parallel for middle bases T, A, C,and partially G. The correlation between⟨YPM(XYZ) ⟩ and⟨YMM(XYcZ)⟩ is, however, much weaker for the latter twomiddle letters G and C. Note that middle letters C and Ggenerally give rise to the considerably wider scattering of alltriple averages as a function of the nearest neighbors comparedwith the middle letters T and A (see Figures 1, 3, and 4).
Correlation plots more clearly reveal the characteristicrelationships between the PM and MM averages (see Figure 6,parts a and b). The data can be divided into two groupsdependent on the middle letter of the MM probes. Forpyrimidines, T and C, the mean MM sensitivities always exceedthose of the PMs in correspondence with the results of theprevious section (i.e.,⟨YMM(XYcZ)⟩ > ⟨YPM(XYZ) ⟩ (with Yc )T, C). For purines, A and G, one obtains in nearly all cases thereverse relationship owing to the reversal of the respectivesubstitution of the middle base (vide supra and Table 1).
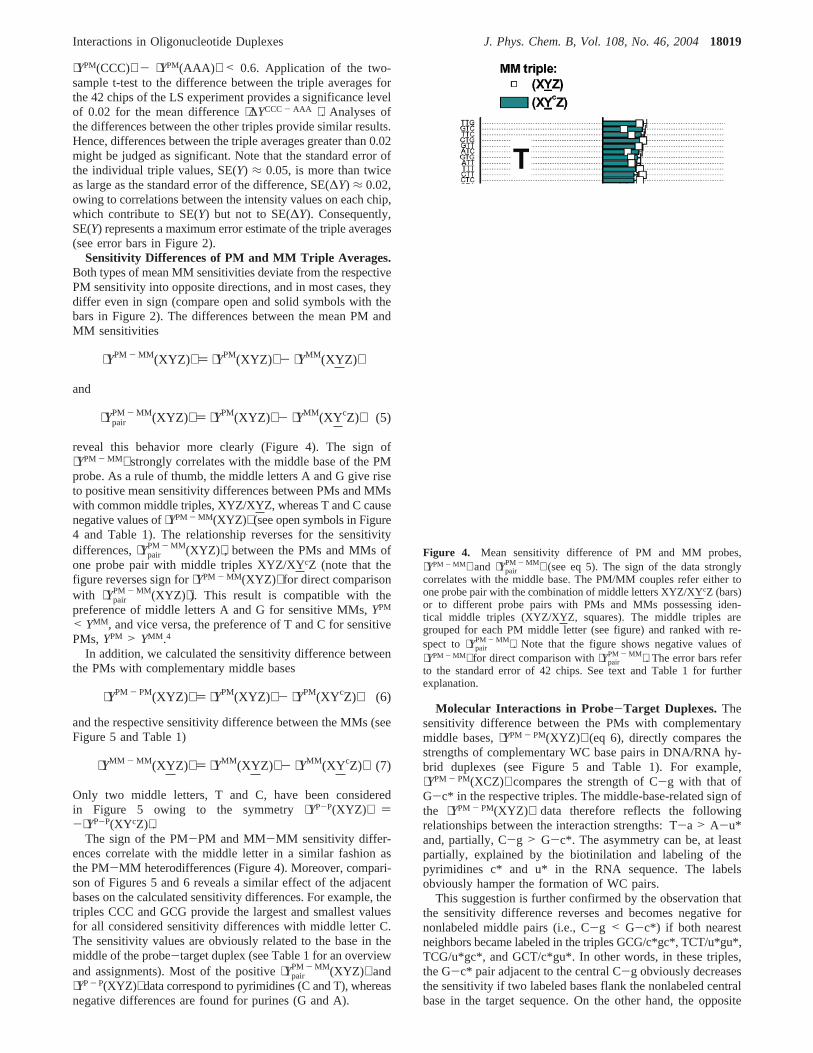
Figure 5. Mean sensitivity difference of PM and of MM probes withmiddle triples XYZ and XYcZ (see eqs 6 and 7). The differences⟨YPM - PM(XYZ) ⟩ compare the strength of WC base pairs of comple-mentary letters, e.g. T-a with A-u* (panel above) and C-g with G-c*(panel below). Only middle letters T and C are considered because ofsymmetry reasons. The PM data are ranked by ascending sensitivitydifference for each middle letter.
Figure 6. Correlation plots between the triple-averaged MM and PMsensitivities shown in Figure 2 (panels a and b) and between differ-ences of MM and PM sensitivities with changed middle letter shownin Figure 5 (panel c). The degree of correlation reflects the effect ofthe nearest neighbors adjacent to the central base pair on the meansensitivities. Panel a refers to the same middle base in the PM andMM sequences, whereas part b refers to the complementary middlebases. Panel c correlates differences between the complementary basesin PM and MM probes. The assignments of the symbols are givenwithin the figure. Underlined letters specify the central base in the MMsequence (see also Table 1). The lines refer to linear fits to the data(see text).
18020 J. Phys. Chem. B, Vol. 108, No. 46, 2004 Binder et al.

Separate linear fits of the formy ) kx + δ (with x ≡⟨YPM(XYZ) ⟩ andy ≡ ⟨YMM(XYZ) ⟩/⟨YMM(XYcZ)⟩) to each of thetwo groups of data provide slopes and intercepts ofk ≈ 1.1 (0.1 andδ ≈ +0.15/+0.20 ((0.03) for T and C, respectively,andk ≈ 0.6( 0.1 andδ ≈ -0.10/-0.15 ((0.03) for A and G,respectively. In other words, the sensitivities of MMs of thefirst group with the central pyrimidines T (and C), on theaverage, change in a similar fashion to the respective PMsensitivities (see panels a and b of Figure 6). Consequently,both the PM and MM sensitivities of this group are affected toa similar extent by factors which modulate the probe sensitivity,such as the nearest neighbors of the central base pair. The sameconclusion can be derived from the sensitivities of the secondgroup with central purines A and G in the MM sequences. Thesmaller slope,k ) 0.6, however, indicates that the MMsensitivities with central A (and G) depend to a considerablysmaller extent on these factors, compared with the respectivePM sensitivities.
In part c of Figure 6, we correlate the MM sensitivitydifference between pyrimidine and purine middle bases,⟨YMM(XYZ) ⟩ - ⟨YMM(XYcZ)⟩ (with Y ) T, C), with therespective triple-averaged PM sensitivity differences,⟨YPM(XYZ)⟩ - ⟨YPM(XYcZ)⟩ (Y ) T, C). The slopes of the linearfits to the data show that the considered differences betweenthe MMs with central Y) C (and Yc ) G) are affected bytheir nearest neighbors in a similar fashion as the respectivedifference between the PMs with central C (and G,k ) 0.8). Incontrast, the difference between MMs with central T (and A)to a considerably lesser degree correlates with the respectivedifference between PM pairs with central T (and A,k ) 0.2).
Nearest-Neighbor Interactions: Excess Sensitivity and 3′f 5′ Asymmetry. Stacking interactions between nearestneighbors within the RNA and DNA sequence make an im-portant contribution to the stability of probe-target du-plexes.8-10 The interaction strength between adjacent nucleotidebases can be estimated on a relative scale by means of the so-called excess values making use of the averaged sensitivitiesof symmetrical triples XYX/YXY
The excess sensitivity provides a measure of the deviation ofthe cross interaction in the XY heterocouple of nearest neighborsfrom the additivity rule for the interactions in the respectivehomocouples, XX and YY.
Negative excess values are obtained for the symmetrical PMtriples ACA and GCG (see panel a of Figure 7). This resultshows that the heterocouples AC/CA and GC/CG decrease thesensitivity compared with the arithmetic mean of the sensitivitiesof the respective homocouples. In contrast, the triple TGT givesrise to a positive excess sensitivity, and thus, TG/GT hetero-couples enhance the probe sensitivity on a relative scale.
The sensitivities of asymmetrical triples can be analyzed interms of the 3′ f 5′ or left-right asymmetry
which provides a measure of the sensitivity change owing tothe reversal of order of neighboring letters, YXf XY. Notethat the left letter points toward the 3′ end of the DNA probeattached to the chip surface. The negative asymmetry value ofthe couple CG indicates a sensitivity gain of the probe if the
sequence CG reverses into GC (see Figure 7). For the otherNN couples, one obtains the following relationship between thesensitivities CA> AC, CT > TC, AT > TA, TG ≈ GT, andGA ≈ AG.
Nearest-Neighbor Sensitivity Terms.The 64 triple-averagedsensitivity values,⟨YP(XYZ) ⟩, can be used to specify 16 NNsensitivity terms,⟨YP(XY) ⟩, in analogy with the NN energycontributions in models describing the stability of RNA/DNAoligonucleotide duplexes in solution (vide infra). For thispurpose, we decompose the triple averages into two NN andtwo boundary terms, which consider the mean effect of the basesadjacent to the triple
According to eq 10, the triple data provide a system of 64 linearequations with 4 SB boundary terms and 32 NN terms referringto positions 12-13 and 13-14 of the sequence. The system ofequations was solved by multiple linear regression using singularvalue decomposition.16 The NN terms of the PM probes wereaggregated into averages⟨YPM(XY) ⟩ ) 0.5[⟨YPM(XY) ⟩12,13 +⟨YPM(XY) ⟩13,14].
The upper panel of Figure 8 shows the NN sensitivity termsobtained from the PM and MM sensitivities. The maximum andminimum ⟨YPM(XY) ⟩ values refer to XY ) CC and AAhomocouples, respectively. Note that the respective MMsensitivities,⟨YMM(XY) ⟩ ≡ ⟨YMM(XY) ⟩12,13 and ⟨YMM(XY) ⟩ ≡⟨YMM(XY) ⟩13,14, are in a systematic fashion either bigger orsmaller than the respective PM data. For pyrimidines in themiddle of the sequence (Y) C, T), we obtained⟨YMM(XY) ⟩ >⟨YPM(XY) ⟩, whereas the PM values mostly exceed the respectiveMM sensitivities for purine middle letters, Y) G, A. This resultcorresponds to the classification of triple averages accordingto their middle base discussed already.
Purine-Pyrimidine Asymmetry. We found a strong middle-base-related purine-pyrimidine asymmetry of the triple aver-ages. This trend can be partly related to the labels attached tothe cytosines and uracils of the complementary RNA fragments
⟨YexcPM(XY) ⟩ ) ⟨Yexc
PM(YX) ⟩ ) (1/4){⟨YPM(XYX) ⟩ +
⟨YPM(YXY) ⟩ - [⟨YPM(XXX) ⟩ + ⟨YPM(YYY) ⟩]} (8)
⟨YasymPM (XY) ⟩ ) (1/2){[⟨YPM(XXY) ⟩ - ⟨YPM(YXX) ⟩] +
[⟨YPM(XYY) ⟩ - ⟨YPM(YYX) ⟩]} (9)
Figure 7. Excess sensitivities (part a) and left-right asymmetry (partb) of adjacent bases, XY. The values were derived from triple-averagedPM sensitivities using eqs 8 and 9, respectively.
⟨YP(XYZ) ⟩ ) ⟨YP(XY) ⟩12,13+ ⟨YP(YZ)⟩13,14+
(1/2)[⟨YP(X)⟩ + ⟨YP(Z)⟩] (10)
Interactions in Oligonucleotide Duplexes J. Phys. Chem. B, Vol. 108, No. 46, 200418021

(see previous text). This purine-pyrimidine asymmetry can befurther specified by the difference of sensitivities correspondingto nearest neighbors, which differ exactly by one pyrimidineaccording to
and
with X ) A, T, G, C; X ) A, T, G, C; Y ) A, G; Yc ) T, C;Y ) A, G; and Yc ) T, C.
Note that eq 11 expresses the change of sensitivity upon thereplacement of a nonlabeled by a labeled base pair in therespective couples. The PM sensitivity difference refers to twoadjacent WC pairs, whereas the MM data split into two options.The first one,⟨YRY,13
MM (XY) ⟩, assesses the effect of a pyrimidinein the central sequence position, which forms an SC or a WCpair in specific and nonspecific duplexes, respectively. Thesecond option,⟨YRY,WC
MM (YX) ⟩, estimates the sensitivity changedue to the pyrimidine in the WC pairs adjacent to the centralbase.
The values of the three calculated differences are plotted inFigure 9 for G (left part) and A (right part) in the probesequence. The negative values for most of the couples indicate
that the replacement of a purine by a pyrimidine predominantlydecreases the sensitivity of the probes. For example, the G inXY ) CG diminishes the sensitivity by about-0.1 comparedwith CC, which refers to the decrease of intensity by about 20%.However, the sensitivity change after the substitution Cf Gconsiderably depends on the neighboring base and even becomespositive for XY ) GG. On the other hand, the replacement Tf A is much less sensitive to adjacent nucleotides.
Comparison with Solution Data. The sensitivity of oligo-nucleotide probes is scaled in terms of free energy accordingto ∆G ) G - ⟨G⟩set) -RT‚ln 10‚Yp
P (see eq 13 in ref 4). Afterchip averaging for each triple, this equation rewrites into
In other words, the chip average of the sensitivity for each tripleprovides a measure of the increment of free energy with respectto the chip-averaged free energy of duplex formation. Note thatthe chip average roughly agrees with the average over a reservoirof probes with equally and randomly distributed nucleotide bases(i.e., ⟨⟨‚‚‚⟩set⟩chip ≈ ⟨‚‚‚⟩random; see Appendix).
The stability of DNA/RNA oligonucleotide duplexes insolution is well described by means of NN models whichdecompose the free energy of duplex formation into a sum ofNN terms,Gsol(XY), and an initiation energy (e.g., refs 10 and17). These NN energies are functions of neighboring base pairs,XY (X, Y ) A, T, G, C). For comparison of the chip data,⟨YP(XY) ⟩, with the NN free-energy contributions obtained fromstudies on oligonucleotide duplex stability in solution, wetransform the latter data according to the following (comparewith eq 12)
with
Figure 9 compares chip and solution NN sensitivities, whichare ranked in the same order. This representation reveals thatboth types of data are well correlated. On the other hand, the
Figure 8. Nearest-neighbor pair sensitivities derived from triple-averaged PM and MM sensitivities of the HG U133-LS experiment(panel above, see eq 10) and the respective solution data which arecalculated from NN free-energy terms (see eq 13) taken from refs 10,11. Both sets of NN sensitivity terms roughly rank in the same orderas a function of adjacent base couples. See the figure for assignment.
⟨YRYPM(XY) ⟩ )
(1/2){⟨YPM(XY) ⟩ + ⟨YPM(YX) ⟩ - [⟨YPM(XYc)⟩ +
⟨YPM(YcX)⟩]}
⟨YRY,13MM (XY)⟩ ) ⟨YMM(XY)⟩ - ⟨YMM(XYc)⟩
⟨YRY,WCMM (YX)⟩ ) ⟨YMM(YX)⟩ - ⟨YMM(YcX)⟩ (11)
Figure 9. Sensitivity increment of purine-pyrimidine replacement forthe couples of nearest neighbors, XYc f XY. The sensitivity of basepairs with guanine strongly depends on their nearest neighbor, whereaspairs with adenine are relatively insensitive to adjacent bases. The valueswere derived from triple-averaged PM and MM sensitivities usingeq 11.
⟨∆G(XYZ) ⟩chip ) ⟨G(XYZ) ⟩chip - ⟨⟨G⟩set⟩chip )
-RT‚ln 10‚⟨YP(XYZ) ⟩chip (12)
Ysol(XY) ) -1RT ln 10
[Gsol(XY) - ⟨Gsol(XY) ⟩total]
⟨Gsol(XY) ⟩total )1
16∑
X,Y)A,T,G,C
Gsol(XY) (13)
18022 J. Phys. Chem. B, Vol. 108, No. 46, 2004 Binder et al.
solution and chip data for some of the labeled couples deviatemarkedly from each other on a relative scale. The largest relativedifference is found for the couple CG.
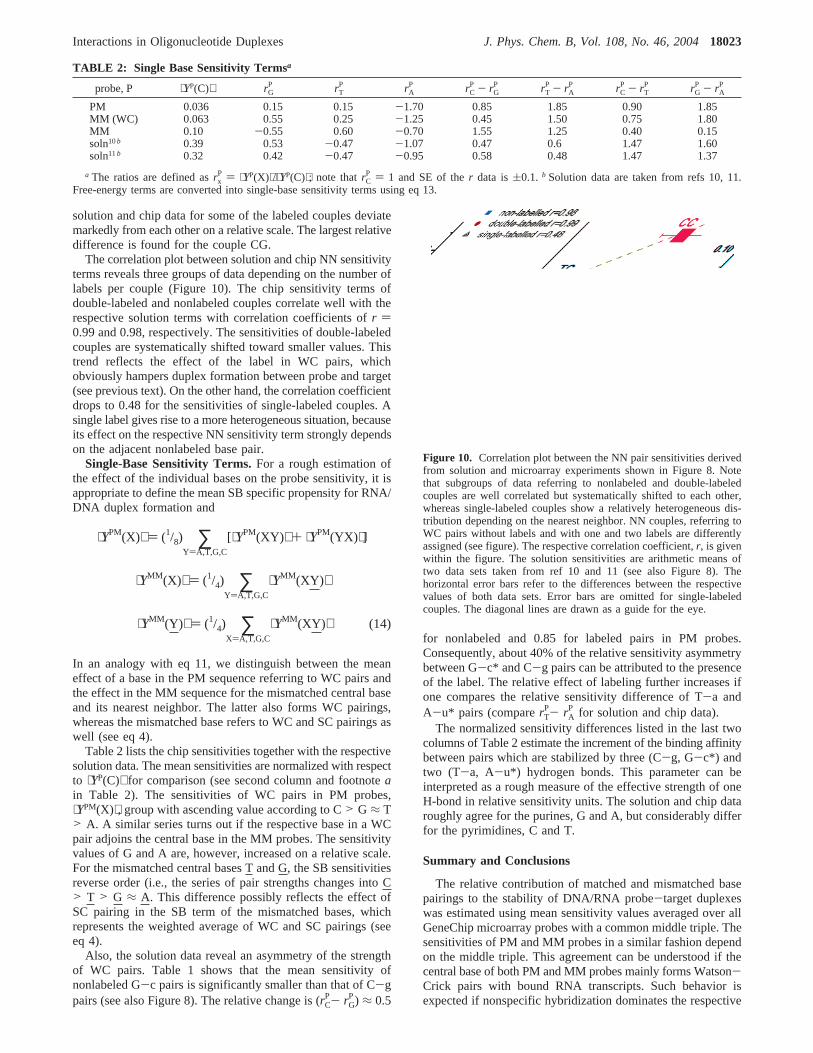
The correlation plot between solution and chip NN sensitivityterms reveals three groups of data depending on the number oflabels per couple (Figure 10). The chip sensitivity terms ofdouble-labeled and nonlabeled couples correlate well with therespective solution terms with correlation coefficients ofr )0.99 and 0.98, respectively. The sensitivities of double-labeledcouples are systematically shifted toward smaller values. Thistrend reflects the effect of the label in WC pairs, whichobviously hampers duplex formation between probe and target(see previous text). On the other hand, the correlation coefficientdrops to 0.48 for the sensitivities of single-labeled couples. Asingle label gives rise to a more heterogeneous situation, becauseits effect on the respective NN sensitivity term strongly dependson the adjacent nonlabeled base pair.
Single-Base Sensitivity Terms.For a rough estimation ofthe effect of the individual bases on the probe sensitivity, it isappropriate to define the mean SB specific propensity for RNA/DNA duplex formation and
In an analogy with eq 11, we distinguish between the meaneffect of a base in the PM sequence referring to WC pairs andthe effect in the MM sequence for the mismatched central baseand its nearest neighbor. The latter also forms WC pairings,whereas the mismatched base refers to WC and SC pairings aswell (see eq 4).
Table 2 lists the chip sensitivities together with the respectivesolution data. The mean sensitivities are normalized with respectto ⟨YP(C)⟩ for comparison (see second column and footnoteain Table 2). The sensitivities of WC pairs in PM probes,⟨YPM(X)⟩, group with ascending value according to C> G ≈ T> A. A similar series turns out if the respective base in a WCpair adjoins the central base in the MM probes. The sensitivityvalues of G and A are, however, increased on a relative scale.For the mismatched central bases T and G, the SB sensitivitiesreverse order (i.e., the series of pair strengths changes into C> T > G ≈ A. This difference possibly reflects the effect ofSC pairing in the SB term of the mismatched bases, whichrepresents the weighted average of WC and SC pairings (seeeq 4).
Also, the solution data reveal an asymmetry of the strengthof WC pairs. Table 1 shows that the mean sensitivity ofnonlabeled G-c pairs is significantly smaller than that of C-gpairs (see also Figure 8). The relative change is (rC
P- rGP) ≈ 0.5
for nonlabeled and 0.85 for labeled pairs in PM probes.Consequently, about 40% of the relative sensitivity asymmetrybetween G-c* and C-g pairs can be attributed to the presenceof the label. The relative effect of labeling further increases ifone compares the relative sensitivity difference of T-a andA-u* pairs (comparerT
P- rAP for solution and chip data).
The normalized sensitivity differences listed in the last twocolumns of Table 2 estimate the increment of the binding affinitybetween pairs which are stabilized by three (C-g, G-c*) andtwo (T-a, A-u*) hydrogen bonds. This parameter can beinterpreted as a rough measure of the effective strength of oneH-bond in relative sensitivity units. The solution and chip dataroughly agree for the purines, G and A, but considerably differfor the pyrimidines, C and T.
Summary and Conclusions
The relative contribution of matched and mismatched basepairings to the stability of DNA/RNA probe-target duplexeswas estimated using mean sensitivity values averaged over allGeneChip microarray probes with a common middle triple. Thesensitivities of PM and MM probes in a similar fashion dependon the middle triple. This agreement can be understood if thecentral base of both PM and MM probes mainly forms Watson-Crick pairs with bound RNA transcripts. Such behavior isexpected if nonspecific hybridization dominates the respective
TABLE 2: Single Base Sensitivity Termsa
probe, P ⟨YP(C)⟩ rGP rT
P rAP rC
P - rGP rT
P - rAP rC
P - rTP rG
P - rAP
PM 0.036 0.15 0.15 -1.70 0.85 1.85 0.90 1.85MM (WC) 0.063 0.55 0.25 -1.25 0.45 1.50 0.75 1.80MM 0.10 -0.55 0.60 -0.70 1.55 1.25 0.40 0.15soln10b 0.39 0.53 -0.47 -1.07 0.47 0.6 1.47 1.60soln11b 0.32 0.42 -0.47 -0.95 0.58 0.48 1.47 1.37
a The ratios are defined asrxP ) ⟨YP(X)⟩/⟨YP(C)⟩; note thatrC
P ) 1 and SE of ther data is(0.1. b Solution data are taken from refs 10, 11.Free-energy terms are converted into single-base sensitivity terms using eq 13.
Figure 10. Correlation plot between the NN pair sensitivities derivedfrom solution and microarray experiments shown in Figure 8. Notethat subgroups of data referring to nonlabeled and double-labeledcouples are well correlated but systematically shifted to each other,whereas single-labeled couples show a relatively heterogeneous dis-tribution depending on the nearest neighbor. NN couples, referring toWC pairs without labels and with one and two labels are differentlyassigned (see figure). The respective correlation coefficient,r, is givenwithin the figure. The solution sensitivities are arithmetic means oftwo data sets taken from ref 10 and 11 (see also Figure 8). Thehorizontal error bars refer to the differences between the respectivevalues of both data sets. Error bars are omitted for single-labeledcouples. The diagonal lines are drawn as a guide for the eye.
⟨YPM(X)⟩ ) (1/8) ∑Y)A,T,G,C
[⟨YPM(XY) ⟩ + ⟨YPM(YX) ⟩]
⟨YMM(X)⟩ ) (1/4) ∑Y)A,T,G,C
⟨YMM(XY)⟩
⟨YMM(Y)⟩ ) (1/4) ∑X)A,T,G,C
⟨YMM(XY)⟩ (14)
Interactions in Oligonucleotide Duplexes J. Phys. Chem. B, Vol. 108, No. 46, 200418023

chip averages of the sensitivity. Sensitivity differences betweenthe PMs and MMs of one pair indicate a purine-pyrimidineasymmetry of interaction strengths in WC pairings accordingto which a C (or T) more strongly contributes to the bindingaffinity than a G (or A). This asymmetry can be partly attributedto the labeling in the complementary RNA sequence. Biotinylresidues with attached fluorescent labels obviously tend toreduce the sensitivity. The adjacent bases in each sequence con-siderably modify the sensitivity values, probably because ofstacking interactions and steric effects. The triple-averaged probesensitivities provide NN sensitivity terms, which rank in a sim-ilar order to the respective NN free-energy terms obtained fromthermodynamic studies on the stability of RNA/DNA duplexesin solution. Systematic deviations between both data sets canbe attributed mostly to the labeling of the target RNA in thechip experiments. The triple averages provide detailed informa-tion about sequence-specific effects in the middle of the probesequence. In a forthcoming publication, we will address theeffect of the complete base sequence on the probe sensitivities.
Acknowledgment. We thank the reviewers for the importantideas and suggestions, which significantly improved some ofthe presented results. The work was supported by the DeutscheForschungsgemeinschaft under grant BIZ 6/1-1.
Appendix
Correction of the Chip-Averaged Triple Means for Non-random Base Distributions. The probability profiles of theoccurrence of base B) A, T, G, C at positionk in probes withthe middle triple XYZ, fk
XYZ(B), significantly deviate fromfkchip(B), the probability of occurrence of base B at positionk in
any probe of the chip (see Figure 11; compare the points inparts a and b with the lines for B) A and C, respectively).Note thatfk
chip(B) only slightly deviates from the random valuefor equally distributed basesfrandom ) 0.25 for most of thepositionsk (see lines in panels a and b of Figure 11).
The difference,fkXYZ(B) - fk
chip(B), provides a measure of thenonrandomness of probe composition relative to the chip
average. The respective difference profiles for XYZ) AAAand CCC illustrate the worst cases (i.e., the triples providingthe largest bias with respect to the mean; see Figure 11, panelsc and d). The chip averages of the sensitivity,⟨YP(XYZ) ⟩ ≡⟨YP(XYZ) ⟩chip, are weighted means referring to the probabilityprofile, fk
XYZ(B), along the sequence. Consequently, the posi-tive and negative deviations offk
XYZ(C) effectively reduce theabsolute values of the triple averages⟨YPM(AAA) ⟩ and⟨YPM(CCC)⟩ compared with averages over a random basedistribution, because cytosines most strongly contribute to theprobe sensitivity compared with the other bases (see previoustext and refs 3 and 7).
One can estimate the effect of nonrandomness of the basedistribution on the sensitivity by
where ⟨YP(B)⟩ is the single-base-related sensitivity term (seeeq 14) andf(B) is given byfk
chip(B) or frandomif one chooses themean base distribution of the chip or complete randomness asthe reference state, respectively. The weighting function consid-ers the positional dependence of single-base sensitivity terms.We used a parabola-like function,wk ) 1 - [(k - 13)/12]2,which was derived from single-base model analyses andaccounts for the decrease of single-base-related sensitivity termstoward the ends of the probe sequence.4,3,7,13
Equation A1 provides a first-order correction of the triplesensitivities for deviations from the mean distribution of basesalong the probe sequences,⟨YP(XYZ) ⟩random≈ ⟨YP(XYZ) ⟩chip -∆Ycorr
P (XYZ). It turns out that the absolute sensitivity value ofthe triples CCC and AAA increases after correction by about20%. Similar corrections are obtained for the other triples.
Linear regression of the corrected data,⟨YP(XYZ) ⟩random,versus the uncorrected data,⟨YP(XYZ) ⟩chip, reveals that thecorrection with respect to randomness (f(B) ) frandom) can besimply considered by a multiplicative factor,Ftriple ) 1.19 (
Figure 11. Probability profile,fkchip(B), of the occurrence of base B) T, A (panel a) and G, C (panel b) in any probe of the HG U133 chip along
the sequence (see lines). The points refer to the probability of occurrence,fkXYZ(B), of base B) A (part a) and C (part b) in the subsets of probes
with middle triple XYZ. Note that the data scatter about the respective chip average,fkchip(B) with B ) A and C, respectively. Panels c and d show
the deviations,fkXYZ(B) - fk
chip(B), for the middle triples AAA and CCC. They represent the worst cases, i.e., the distributions with the maximumdeviation from the mean.
∆YcorrP (XYZ) ≈ ∑
k)1k*12..14
25
∑B)A,T,G,C
wk‚⟨YP(B)⟩‚(fk
XYZ(B) - f(B))
(A1)
18024 J. Phys. Chem. B, Vol. 108, No. 46, 2004 Binder et al.

0.02 (r > 0.99), which scales the raw data according to⟨YP(XYZ) ⟩random ≈ Ftriple‚⟨YP(XYZ) ⟩chip. The corrected tripleaverages were used to calculate corrected NN and SB terms bymeans of eqs 10 and 14, respectively. An analogous correlationanalysis provides correction factors ofFNN ) 1.10( 0.01 andFSB ) 1.13 ( 0.04 (r > 0.99) between the corrected anduncorrected NN and SB terms, respectively. Note that the NNand SB terms are calculated as linear combinations of the tripleaverages, which gives rise to the partial compensation of thecorrection terms and thus to the smaller correction factors forthe derived data. The correction with respect to the basedistribution of the chip (f(B) ) fk
chip(B)) provides a slightchange of the correction factors by less than 5% of its value.
In summary, the systematic bias of the triple averages due tothe nonrandom base distributions among the probes of onemiddle triple is nonneglible but relatively small. It can beconsidered by a correction factorFtriple ≈ 1.2 for the tripleaverages andFNN ≈ FSB ≈ 1.1 for the derived nearest-neighborand single-base terms.
References and Notes
(1) Matveeva, O. V.; Shabalina, S. A.; Nemtsov, V. A.; Tsodikov, A.D.; Gesteland, R. F.; Atkins, J. F.Nucleic Acids Res.2003, 31, 4211.
(2) Rouillard, J.-M.; Zuker, M.; Gulari, E.Nucleic Acids Res.2003,31, 3057.
(3) Naef, F.; Magnasco, M. O.Phys. ReV. E 2003, 68, 11906.(4) Binder, H.; Kirsten, T.; Loeffler, M.; Stadler, P.J. Phys. Chem. B
2004, 108, 18003.(5) Lipshutz, R. J.; Fodor, S. P. A.; Gingeras, T. R.; Lockhart, D. J.
Nat. Genet.1999, 21, 20.(6) Affymetrix Microarray Suite, version 5.0; Affymetrix, Inc.: Santa
Clara, CA, 2001.(7) Mei, R.; Hubbell, E.; Bekiranov, S.; Mittmann, M.; Christians, F.
C.; Shen, M.-M.; Lu, G.; Fang, J.; Liu, W.-M.; Ryder, T.; Kaplan, P.; Kulp,D.; Webster, T. A.Proc. Natl. Acad. Sci. U.S.A.2003, 100, 11 237.
(8) Gralla, J.; Crothers, D. M.J. Mol. Biol. 1973, 73, 497.(9) Borer, P. N.; Dengler, B.; Tinoco, I., Jr.; Uhlenbeck, O. C.J. Mol.
Biol. 1974, 86, 843.(10) Sugimoto, N.; Nakano, S.; Katoh, M.; Matsumura, A.; Nakamuta,
H.; Ohmichi, T.; Yoneyama, M.; Sasaki, M.Biochemistry1995, 34, 11 211.(11) Wu, P.; Nakano, S.; Sugimoto, N.Eur. J. Biochem. 2002, 269,
2821.(12) Held, G. A.; Grinstein, G.; Tu, Y.Proc. Natl. Acad. Sci. U.S.A.
2003, 100, 7575.(13) Zhang, L.; Miles, M. F.; Aldape, K. D.Nat. Biotechnol.2003, 21,
818.(14) Binder, H.; Kirsten, T.; Loeffler, M.; Stadler, P. Sequence specific
sensitivity of oligonucleotide probes. InProceedings of the GermanBioinformatics Conference, Munich, Germany, Oct. 12-14, 2003.
(15) Li, C.; Wong, W. H.Proc. Natl. Acad. Sci. U.S.A.2001, 98, 31.(16) Press, W. H.; Flannery, B. P.; Teukolsky, S. A.; Vetterling, W. T.
Numerical Recipes; Cambridge University Press: New York, 1989.(17) Xia, T.; Santa Lucia, J. J.; Burkard, M. E.; Kierzek, R.; Schroeder,
S. J.; Jiao, X.; Cox, C.; Turner, D. H.Biochemistry1998, 37, 14 719.
Interactions in Oligonucleotide Duplexes J. Phys. Chem. B, Vol. 108, No. 46, 200418025
Copyright © 2022 FDOKUMEN