Whole genome genotyping technologies on the BeadArray™ platform
High-Resolution Genotyping via Whole GenomeHybridizations to Microarrays Containing LongOligonucleotide ProbesYan Fu1.¤, Nathan M. Springer2., Kai Ying3,4., Cheng-Ting Yeh5, A. Leonardo Iniguez6, Todd Richmond6,
Wei Wu1, Brad Barbazuk7, Dan Nettleton8, Jeff Jeddeloh6, Patrick S. Schnable1,4,5*
1 Department of Agronomy, Iowa State University, Ames, Iowa, United States of America, 2 Department of Plant Biology, University of Minnesota, St Paul, Minnesota,
United States of America, 3 Interdepartmental Genetics Graduate Program, Iowa State University, Ames, Iowa, United States of America, 4 Department of Genetics,
Development and Cell Biology, Iowa State University, Ames, Iowa, United States of America, 5 Center for Plant Genomics, Iowa State University, Ames, Iowa, United States
of America, 6 Roche NimbleGen, Inc., Madison, Wisconsin, United States of America, 7 Department of Biology and the Genetics Institute, University of Florida, Gainesville,
Florida, United States of America, 8 Department of Statistics, Iowa State University, Ames, Iowa, United States of America
Abstract
To date, microarray-based genotyping of large, complex plant genomes has been complicated by the need to performgenome complexity reduction to obtain sufficiently strong hybridization signals. Genome complexity reduction techniquesare, however, tedious and can introduce unwanted variables into genotyping assays. Here, we report a microarray-basedgenotyping technology for complex genomes (such as the 2.3 GB maize genome) that does not require genome complexityreduction prior to hybridization. Approximately 200,000 long oligonucleotide probes were identified as being polymorphicbetween the inbred parents of a mapping population and used to genotype two recombinant inbred lines. While multiplehybridization replicates provided ,97% accuracy, even a single replicate provided ,95% accuracy. Genotyping accuracywas further increased to .99% by utilizing information from adjacent probes. This microarray-based method provides asimple, high-density genotyping approach for large, complex genomes.
Citation: Fu Y, Springer NM, Ying K, Yeh C-T, Iniguez AL, et al. (2010) High-Resolution Genotyping via Whole Genome Hybridizations to Microarrays ContainingLong Oligonucleotide Probes. PLoS ONE 5(12): e14178. doi:10.1371/journal.pone.0014178
Editor: Ivan Baxter, United States Department of Agriculture, Agricultural Research Service, United States of America
Received July 23, 2010; Accepted November 9, 2010; Published December 2, 2010
Copyright: � 2010 Fu et al. This is an open-access article distributed under the terms of the Creative Commons Attribution License, which permits unrestricteduse, distribution, and reproduction in any medium, provided the original author and source are credited.
Funding: This project was supported in part by Hatch Act funds to Iowa, Minnesota and Florida. These funders had no role in study design, data collection andanalysis, decision to publish, or preparation of the manuscript. Roche NimbleGen, Inc. (http://www.nimblegen.com/) provided support for this study through thedonation of reagents and team-member time. Roles of Roche NimbleGen authors in the work are as follows: A. Leonardo Iniguez participated in experimentaldesign and experimental execution; Todd Richmond participated in experimental and array design; Jeffrey A. Jeddeloh participated in experimental design arraydesign, data interpretation and manuscript preparation.
Competing Interests: Roche NimbleGen provided support for this study through the donation of reagents and team-member time. A. Leonardo Iniguez, ToddRichmond and Jeffrey A. Jeddeloh recognize a competing interest in this publication as employees of Roche NimbleGen, Inc. This does not alter the authors’adherence to all the PLoS ONE policies on sharing data and materials.
* E-mail: [email protected]
¤ Current address: Monsanto Company, St. Louis, Missouri, United States of America,
. These authors contributed equally to this work.
Introduction
The ability to rapidly determine genotypes at many loci in
numerous individuals is critical to furthering our understanding of
the inheritance of complex traits and for developing improved
strategies for plant breeding. The use of molecular markers based
on isozymes, RFLPs (restriction fragment length polymorphisms),
SSRs (simple sequence repeats) and CAPS (cleaved amplified
polymorphic sequences) genetic markers allowed for the construc-
tion of early genetic maps. However, these initial genotyping
technologies were of relatively low throughput and required
significant effort per data point.
A number of technologies have been developed for high-
throughput genotyping (reviewed by [1,2,3,4]). There are
additional approaches that combine the use of microarrays and
restriction digests such as diversity array technology (DArT) [5]
and restriction site associated DNA (RAD) tags [6] to assay up to
several thousand markers. These high-throughput approaches
vary substantially in number of markers, amount of information
required for development, accuracy, ease of application and data
analysis. In particular, there are limitations on the application of
some of these methods to species with large, complex genomes.
The wide-spread availabilities of genomic and EST sequences in
many species have led to the development of markers based on
SNPs (single nucleotide polymorphisms). Several companies have
developed high-throughput technologies that can genotype up to
several hundred thousand SNPs in a single reaction [7,8]. Flibotte
et al. [9] have reported the detection of SNPs in C. elegans (genome
size 0.1 GB) using whole genome hybridization to arrays
containing oligo probes designed based on the sequences of
known SNPs (SNP-CGH). SNPs can be extremely valuable
molecular markers but effort is required for the discovery and
validation of SNPs, as well as for assay development. Alternative
genotyping approaches that do not require prior knowledge of
SNPs have also been developed. For example, RAD tags can be
sequenced to discover and map SNPs [10]. Alternatively, SNPs
PLoS ONE | www.plosone.org 1 December 2010 | Volume 5 | Issue 12 | e14178
and SFPs (single feature polymorphisms) can be detected by
hybridizing genomic DNA or RNA to short oligonucleotide
microarrays that contain short (,25 mer) oligonucleotides
[11,12,13,14,15,16,17]. Longer oligonucleotide probes have also
been used to detect SFPs caused by indel (insertion/deletion)
polymorphisms [18,19,20]. Although this process is quite efficient
in organisms with relatively small genomes, it has proven less
successful for detecting polymorphisms in genomic DNA from
organisms with larger genomes, such as maize (2.3 GB, [21]), due
to a lack of sufficient signal strength. To obtain sufficient signal
strengths in such species it is necessary to utilize RNA or reduced
complexity (e.g., high Cot or methylation filteration) DNA.
Unfortunately, these approaches introduce variables, such as
expression level or filtration efficiency, that can complicate
genotyping efforts.
Previously we developed a custom long oligonucleotide micro-
array that yielded strong signals from whole genome hybridiza-
tions. This array was used to assess structural variation between
the two maize inbreds B73 and Mo17 [22]. In that study
,200,000 probes were identified that exhibited highly differential
and discriminatory hybridization signals between B73 and Mo17
genomic DNA. These hybridization differences were typically
caused by the presence of multiple SNPs, small IDPs (InDel
Polymorphisms), and CNVs (copy number variants), including
PAVs (presence absence variants), rather than by single SNPs [22].
To demonstrate the utility using these polymorphic probes as
molecular markers for whole-genome genotyping in a large,
complex genome, in this study two recombinant inbred lines
(RILs) from the maize IBM mapping population [23] were
randomly selected and analyzed via array comparative genomic
hybridization (aCGH). In this report, we demonstrate the utility of
using long oligonucleotide microarrays for high-throughput
mapping in maize without the need to apply complexity reduction
methods. The attractive features of this system are first, that it does
not require prior knowledge of polymorphisms; second, that the
genotyping results are highly accurate; third, high probe density
allows for the fine-mapping of recombination breakpoints; and
fourth, data analysis can be relatively simple.
Results
Identification of a large number of CGH-basedpolymorphisms
The first objective was to identify polymorphic probes that
could be scored in the RILs. To identify such probes we used data
derived from hybridization of the two parental genotypes (B73 and
Mo17) to the microarray (all microarray data were deposited into
GEO under Series# GSE16938). The microarray platform
contained 1,262,421 probes that could each be unambiguously
mapped to a single location (i.e., uniquely mapped) in the maize
genome and that we therefore concluded are non-repetitive [22].
Following normalization and linear modeling (see [22] for full
details), we identified 225,867 probes that exhibited significant
differences in hybridization between B73 and Mo17 genomic
DNA at a false discovery rate (FDR) cut-off of ,0.0001 (Table 1).
The vast majority (91%) of these probes have higher hybridization
signal intensities in B73 than in Mo17 and are referred to as B.M
probes. Because the microarray was designed based on the
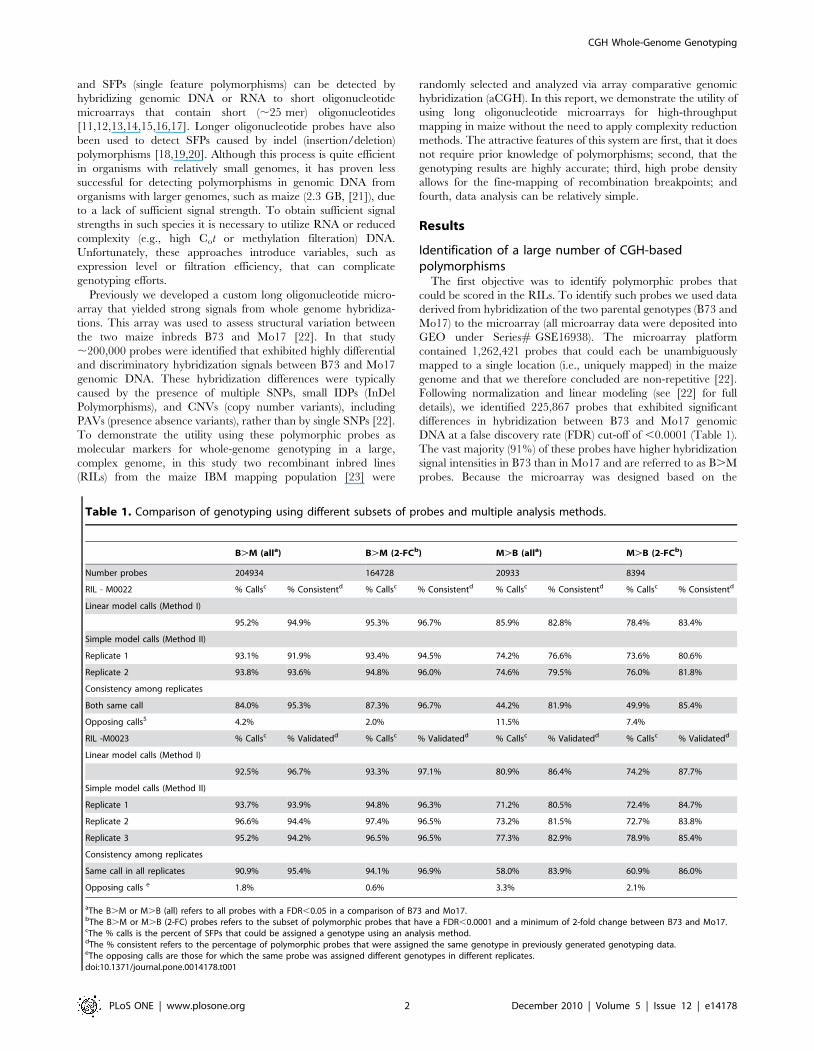
Table 1. Comparison of genotyping using different subsets of probes and multiple analysis methods.
B.M (alla) B.M (2-FCb) M.B (alla) M.B (2-FCb)
Number probes 204934 164728 20933 8394
RIL - M0022 % Callsc % Consistentd % Callsc % Consistentd % Callsc % Consistentd % Callsc % Consistentd
Linear model calls (Method I)
95.2% 94.9% 95.3% 96.7% 85.9% 82.8% 78.4% 83.4%
Simple model calls (Method II)
Replicate 1 93.1% 91.9% 93.4% 94.5% 74.2% 76.6% 73.6% 80.6%
Replicate 2 93.8% 93.6% 94.8% 96.0% 74.6% 79.5% 76.0% 81.8%
Consistency among replicates
Both same call 84.0% 95.3% 87.3% 96.7% 44.2% 81.9% 49.9% 85.4%
Opposing calls5 4.2% 2.0% 11.5% 7.4%
RIL -M0023 % Callsc % Validatedd % Callsc % Validatedd % Callsc % Validatedd % Callsc % Validatedd
Linear model calls (Method I)
92.5% 96.7% 93.3% 97.1% 80.9% 86.4% 74.2% 87.7%
Simple model calls (Method II)
Replicate 1 93.7% 93.9% 94.8% 96.3% 71.2% 80.5% 72.4% 84.7%
Replicate 2 96.6% 94.4% 97.4% 96.5% 73.2% 81.5% 72.7% 83.8%
Replicate 3 95.2% 94.2% 96.5% 96.5% 77.3% 82.9% 78.9% 85.4%
Consistency among replicates
Same call in all replicates 90.9% 95.4% 94.1% 96.9% 58.0% 83.9% 60.9% 86.0%
Opposing calls e 1.8% 0.6% 3.3% 2.1%
aThe B.M or M.B (all) refers to all probes with a FDR,0.05 in a comparison of B73 and Mo17.bThe B.M or M.B (2-FC) probes refers to the subset of polymorphic probes that have a FDR,0.0001 and a minimum of 2-fold change between B73 and Mo17.cThe % calls is the percent of SFPs that could be assigned a genotype using an analysis method.dThe % consistent refers to the percentage of polymorphic probes that were assigned the same genotype in previously generated genotyping data.eThe opposing calls are those for which the same probe was assigned different genotypes in different replicates.doi:10.1371/journal.pone.0014178.t001
CGH Whole-Genome Genotyping
PLoS ONE | www.plosone.org 2 December 2010 | Volume 5 | Issue 12 | e14178

reference B73 genomic sequence this observation is an expected
consequence of ascertainment bias. B.M probes may have either
of three possible characteristics. They can occur due to the
existence of polymorphisms within the probe sequence between
the two genotypes, due to the presence of more copies of the probe
sequence in B73 than in Mo17, or due to a deletion of the probe
sequence from the Mo17 genome. Because all probes were
designed based on the B73 reference genome sequence, those
probes that exhibit M.B hybridization ratios are expected to be
present at higher copy number in the Mo17 genome than in the
B73 genome.
An additional filter was applied to the derived probe list to cull
for only the most utilitarian probes. This additional filter identified
173,122 probes that exhibited a minimum fold change of 2
(Table 1). This filter removed ,20% of the B.M probes and
nearly 60% of the M.B probes.
The remaining 173,122 probes were annotated based on their
genomic map positions relative to the B73 reference genome [21]
and conservation in the Mo17 genome. Each probe sequence was
compared with an ,5X whole-genome shotgun (WGS) sequence
of Mo17 generated by the Joint Genome Institute using 454
sequencing technology (pre-publication access to these sequences
was kindly provided by Dan Rokshar). Each probe was assigned a
value of perfect match (100% identity and coverage), conserved
(.90% coverage and identity) or ‘‘no match’’ (,90% coverage
and/or identity). The majority (59%) of the B.M probes had no
match in the collection of Mo17 WGS sequence reads, while only
1% had a perfect match (Table S1). Hence, as expected most
(99%) of the B.M probe sequences are either absent from Mo17
or are polymorphic relative to B73. In contrast, the majority (51%)
of the M.B probes had a perfect match in the collection of Mo17
WGS sequence reads, while only 13% did not have a match.
Collectively, this set of polymorphic probes consisted of 173,122
probes, which included at least 12,000 probes for each of the 10
maize chromosomes (Table S2).
Assessment of data analysis and subsets of polymorphicprobes
The potential of these polymorphic probes for genetic mapping
was evaluated using two B73xMo17 recombinant inbred lines
(IBM RILs; [23]) both of which we and others had previously
genotyped using ,10,000 markers [24,25]. To enhance the utility
of microarray-based genotyping we assessed the importance of
hybridization replication, compared various methodologies for
data analysis, and determined the effects of polymorphism types
upon the accuracy of genotype determinations. Comparisons of
the number of markers and accuracy of several different analytical
approaches, including linear modeling of replicates, simple
assessment of relative signals from a single replicate, and BAC-
based genotyping were considered most germane. A visualization
of the results obtained for chromosome 1 mapping was made for
each of these approaches and is depicted in Figure 1.
The first analytical approach (Method I) involved the use of
normalization methodology and subsequent estimation of the
errors accounted for by dye and genotype effects upon the signal as
determined via a linear model. This approach allowed for
statistical contrasting of RIL vs. B73 and RIL vs. Mo17 at each
probe using two hybridizations (See Methods for details). q-values
were obtained for each of these contrasting comparisons and each
probe was assigned to one of four classes in each RIL. Probes that
were significantly different (q,0.05) from B73 but not from Mo17
in the RIL hybridizations were assigned a genotype of B (Class I)
and probes that were different from Mo17 but not from B73 were
assigned a genotype of M (Class II). Some probes exhibited
significant differences as compared to both parental lines (Class
III) or were not significant in either of the two comparisons (Class
IV). These later two classes may reflect non-polymorphic probes,
residual heterozygosity or complex genome arrangements of gene
families. Based on the broad genomic distribution of these probes
(black dots in Figure 1) it is unlikely that residual heterozygosity is
a major cause. Method I was able to assign genotypes for 93–95%
of B.M probes in both RILs and was unaffected by the use of
filtering based on a fold change (Table 1). However, substantially
fewer of the M.B probes (74–86%) could be assigned genotypes
(Table 1). Previously obtained genotyping results (from [25]) were
used to validate the array-based genotyping calls (see Methods for
details). As expected, consistency rates were substantially higher
for the B.M probes than for the M.B probes and the use of the
filtered probe set provided only a slight improvement in the
validation (consistency) rate. While Method I provides robust
results, it requires substantial bioinformatics expertise, as well as
replication of hybridizations, factors that could discourage the
broad adoption of this microarray-based genotyping platform.
Therefore, a more streamlined analytic method (Method II) was
considered. This method employed a single hybridization and thus
vastly reduced the complexity of the required computational
analyses. In Method II, spatially normalized data from a single
array were analyzed and hybridization contrasts were considered
without applying statistical methods (See Methods for details). Our
goal was to assess the relative loss of accuracy and information
achieved using this relatively simple method of analysis and a
single hybridization as compared to the robust Method I. The
genotype for each probe was assigned by calculating the
hybridization difference of the RIL and B73 relative to Mo17
and B73 [(RIL-B73)/(Mo17-B73)]. Probes with values near zero
have hybridization intensities that are more similar to B73 than to
Mo17, while values near 1 have hybridization intensities more
similar to Mo17 than to B73. All probes with values less than 0.33
were assigned a genotype of B73 and probes with values greater
than 0.66 were assigned a genotype of Mo17. The remaining
probes were not classified (visualization provided in Figure 1). This
approach assigned genotypes to slightly fewer probes than did the
linear model (Method I) and had a slightly lower validation rate.
Even so, this less complex analytic method still provided
genotyping calls for .90% of the B.M probes and these calls
were ,95% consistent with independently determined genotypes.
Note that the filtered set of B.M probes provided substantially
more benefit for Method II than for Method I. Consequently,
rigorous filtering of probes is more critical when using a single
hybridization (Method II) than when data from multiple
hybridizations (Method I) are available. Based on a comparison
of genotyping calls between two replicates (only two of the M0023
Cy3 replicates was used to enhance the consistency of analyses) the
majority of the genotype assignments determined using B.M
probes were consistent between pairs of replicates and only 2–4%
of probes were called as different genotypes in the two replicates.
As expected, the performance for the M.B probes was
substantially lower for this approach. Only 40–60% of the M.B
probes were consistently assigned to the same genotype across
independent replicates and the rate of inconsistent calls between
the replicates was higher (Table 1).
Next, we investigated the utility of assigning genotypes to RILs
based on a series of probes that were closely linked and that
exhibited similar genotyping calls. The physical map of the maize
genome is quite accurate at a resolution of single BACs [21].
However, the order and orientation of DNA sequences within
BACs is often not known. This can lead to incorrect fine-scale
arrangements in the order of probes in our genotyping data.
CGH Whole-Genome Genotyping
PLoS ONE | www.plosone.org 3 December 2010 | Volume 5 | Issue 12 | e14178

Assigning each BAC a genotype in each RIL alleviates this
problem. BAC-level genotyping is also expected to increase the
accuracy of genotyping assignments because it allows for a
genotyping assignment to be made using multiple probes located
on the same BAC. In addition, doing so simplifies data visuali-
zation by reducing the number of data points. For this analysis we
used only those B.M probes that had a minimum of a 2-fold
change because this set exhibited the greatest accuracy in both
Methods I and II. To be assigned a genotype a BAC had to have
at least 5 probes that were assigned a genotype of B73 or Mo17
and these probes had to exhibit at least 80% genotype agreement
within the BAC. Using this approach, genotypes could be assigned
to over 95% the 8,497 BACs that contain at least 5 polymorphic
probes (Method III, Table 2). The different methods of analysis
were able to assign a genotype for slightly different sets of BACs
(Table 2) but for BACs that were assigned genotypes with both
methods there was 100% agreement of the genotyping calls made
by the different approaches. By comparing the genotyping
assignments with the genotyping data of Liu et al. [25] we could
demonstrate .99% accuracy for each of these approaches. This
approach of assigning a genotype for each BAC in each RIL allows
for simple visualization of the genotyping calls (Figures 1 and 2).
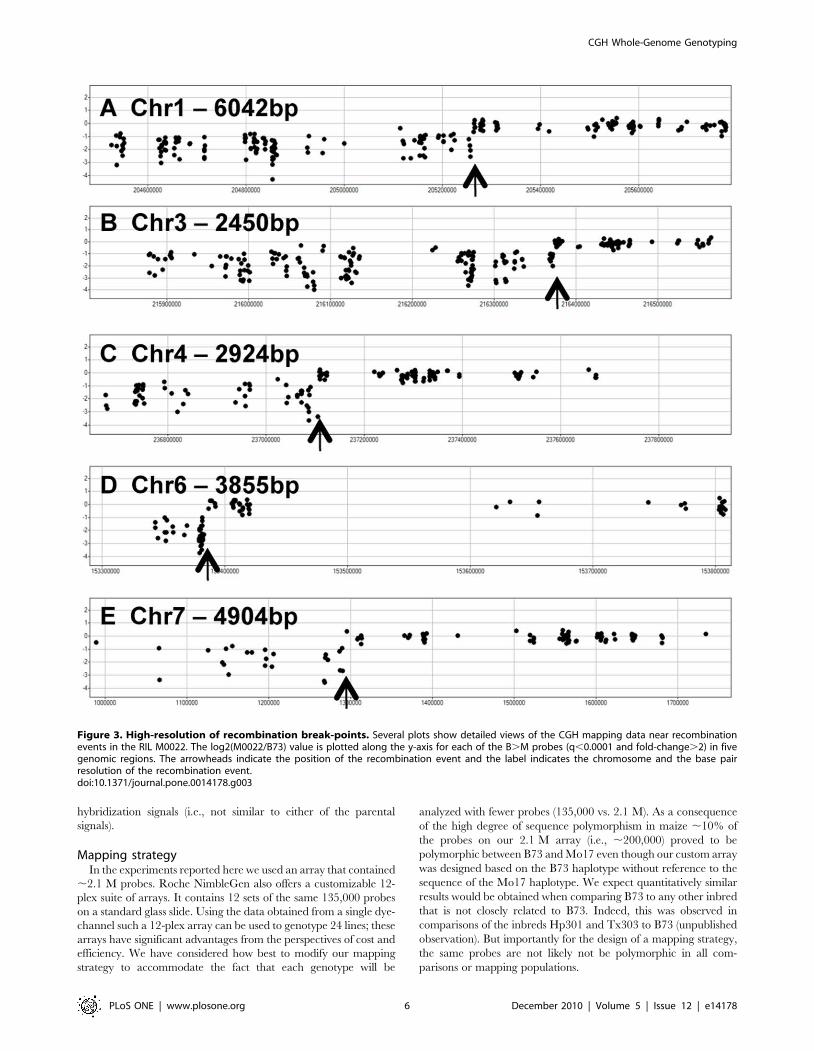
We assessed the resolution of the genotyping data that was
generated by CGH. While some recombination break-points can
only be resolved within ,100 kb due to lack of polymorphic
probes in the region of the recombination event other cross-overs
can be resolved at quite high resolution. Figure 3 provides five
examples of highly resolved cross-overs in the M0022 RIL. The
exact location of these five cross-overs could be identified within
2,450 to 6,042 base pairs. The ability to pinpoint the location of
recombination events was influenced by the number of polymor-
phic probes within the region.
Discussion
This report documents the feasibility of genotyping complex
genomes via a microarray-based method that does not require the
use of methods to reduce genome complexity prior to hybridiza-
tion. To do so, we used long oligonucleotides, which increased our
ability to detect signal from genomic DNA and leveraged the
abundance of frequent and widely distributed differences in DNA
sequences between haplotypes as molecular markers. This
approach is particularly valuable because it allows for mapping
experiments even in the absence of any prior knowledge of
polymorphisms between the parents of a mapping population,
does not require extensive laboratory manipulation and can be
performed using a single hybridization replicate. Additional
experiments (data not shown) have demonstrated that this
Figure 1. Comparisons of analytical approaches for CGH-based mapping. Data for B.M probes located on chromosome 1 that exhibit atleast a 2-fold change (n = 26,953) were plotted following the use of different data analysis approaches. The upper set of plots display data for the RILM0022 while the lower panels show data for the RIL M0023. The plots on the left and right display probes from the entire chromosome 1 and a close-up view of a 20 Mb region of chromosome 1 (positions 200 Mb–220 MB), respectively. For each set of plots the first panel provides visualizationgenotyping calls and log2 (RIL/B73) ratios following normalization and analysis using a linear model of multiple replications (Method I). The secondand third panels show the genotyping calls and log2(RIL/B73) ratios based on the analysis of a single replicate of data that was normalized usingstandard NimbleScan approaches (Method II). The final plot shows the genotyping calls for each BAC (n = 1,369) using data from replicate 1 (MethodIII).doi:10.1371/journal.pone.0014178.g001
CGH Whole-Genome Genotyping
PLoS ONE | www.plosone.org 4 December 2010 | Volume 5 | Issue 12 | e14178

approach can be used to genotype individuals containing
heterozygosity (such as F2 individuals) as well as homozygous
RILs.
Comparison of linear model (Method I) and single array(Method II) analyses
Careful comparisons enabled us to determine the numbers of
markers that could be genotyped, and their validation rates using
replicated data analyzed using a linear model (Method I) as well as
a more simplified analysis (Method II) conducted on non-
replicated data. Replicates did provide slightly high numbers of
markers that could be scored and yielded genotyping data that was
validated at slightly higher rates. However, when probes were
filtered to use only those that exhibited at least 2-fold change
between the parental lines, the overall validation rates for Methods
I and II were quite similar. We found that assigning genotypes to
each BAC based on the occurrence of multiple polymorphic
probes within the same BAC provided highly accurate genotyping
scores. Indeed, this method resulted in nearly perfect validation
rates (.99%). If it is desired to perform fine-scale mapping of
recombination break-points to the highest possible resolution it
would be possible to first conduct a BAC-based analysis to map
recombination breakpoints to a BAC-level resolution. Subsequent-
ly, the analysis of individual probes within those BACs near the
recombination breakpoint could further define the position of the
recombination breakpoint.
Genotyping accuracy of different classes of probesBecause this method relies on long oligonucleotide probes many
of the detected polymorphisms are likely to be structural variants.
Because our probes were designed based upon the sequence of the
B73 reference genome [21], each exhibits a perfect match to B73.
Therefore, all probes with higher hybridization intensities in Mo17
than in B73 (M.B probes) are expected to represent sequences
that are present in more copies in Mo17 than in B73 (CNVs).
In contrast, the sequences detected by probes having higher
hybridization intensities in B73 than in Mo17 (B.M probes) are
likely to: 1) exhibit multiple sequence differences (SNPs and/or
IDPs) between B73 and Mo17; 2) be absent from the Mo17
genome (PAVs); or 3) exist in higher copy number in B73 than in
Mo17 (CNV). Because only probes that had a single match to the
B73 reference genome were used in this analysis, it is likely that
most of the B.M probes are from the first two classes. Consistent
with this view, a comparison of the B.M probes with a collection
of Mo17 WGS sequences (,5X coverage) revealed that many do
not have a 90% identical sequence. Although all probes used in
this analysis are single copy in the B73 reference genome, it is,
however, conceivable that some of the B.M probes match
duplicated regions of the actual B73 genome that were either not
sequenced or that were inadvertently collapsed into single copies
during genome assembly. Hence, a small fraction of the B.M
probe sequences may in fact exist at higher copy numbers in the
B73 genome than in the Mo17 genome. Consistent with this
possibility, a small fraction (1%) of the B.M probes had a perfect
match to Mo17. This result is unexpected if indeed these probe
sequences exist as single copy sequences in the B73 genome. The
13% of the M.B probes that did not have matches in the
collection of Mo17 WGS sequence reads could be the result of
inadequate sampling of the Mo17 genome. Although a small
fraction of probes exhibit hybridization patterns that differ from
expectations for various reasons, the overall mapping accuracy
and resolution generated using this technology is high.
It is noteworthy that the proportion of M.B probes that could
be called and their validation rates were much lower than for the
B.M probes. This likely reflects the fact that copy number
variants (CNVs) could be in either the cis or trans configuration. If
the multiple copies of a probe sequence are not closely linked in
the Mo17 genome (i.e., in a trans configuration) they would be
expected to segregate among RILs, potentially yielding novel
Figure 2. Visualization of whole genome genotypes of two RILs. The genotype of each BAC with at least 5 filtered B.M probes (n = 7,978that were called in both lines) was determined and color coded (B73 – blue; Mo17 – red). BACs were then plotted according to their physical positionsalong a chromosome (x-axis) and by chromosome (y-axis). This visualization was created using a single replicate of data.doi:10.1371/journal.pone.0014178.g002
Table 2. Genotyping calls by BAC (Method III).
# BACs assignedgenotype
% Consistent with PCRgenotyping
M0022
Linear model 8333 99.19%
Simple model
Replicate 1 8206 99.18%
Replicate 2 8264 99.22%
Consensusa 8036 99.23%
M0023
Linear model 8262 99.44%
Simple model
Replicate 1 8289 99.47%
Replicate 2 8351 99.51%
Replicate 3 8325 99.47%
Consensus 8273 99.47%
aThe consensus line specifies the number of BACs that were assigned the samegenotype in all replicates.
doi:10.1371/journal.pone.0014178.t002
CGH Whole-Genome Genotyping
PLoS ONE | www.plosone.org 5 December 2010 | Volume 5 | Issue 12 | e14178
hybridization signals (i.e., not similar to either of the parental
signals).
Mapping strategyIn the experiments reported here we used an array that contained
,2.1 M probes. Roche NimbleGen also offers a customizable 12-
plex suite of arrays. It contains 12 sets of the same 135,000 probes
on a standard glass slide. Using the data obtained from a single dye-
channel such a 12-plex array can be used to genotype 24 lines; these
arrays have significant advantages from the perspectives of cost and
efficiency. We have considered how best to modify our mapping
strategy to accommodate the fact that each genotype will be
analyzed with fewer probes (135,000 vs. 2.1 M). As a consequence
of the high degree of sequence polymorphism in maize ,10% of
the probes on our 2.1 M array (i.e., ,200,000) proved to be
polymorphic between B73 and Mo17 even though our custom array
was designed based on the B73 haplotype without reference to the
sequence of the Mo17 haplotype. We expect quantitatively similar
results would be obtained when comparing B73 to any other inbred
that is not closely related to B73. Indeed, this was observed in
comparisons of the inbreds Hp301 and Tx303 to B73 (unpublished
observation). But importantly for the design of a mapping strategy,
the same probes are not likely not be polymorphic in all com-
parisons or mapping populations.
Figure 3. High-resolution of recombination break-points. Several plots show detailed views of the CGH mapping data near recombinationevents in the RIL M0022. The log2(M0022/B73) value is plotted along the y-axis for each of the B.M probes (q,0.0001 and fold-change.2) in fivegenomic regions. The arrowheads indicate the position of the recombination event and the label indicates the chromosome and the base pairresolution of the recombination event.doi:10.1371/journal.pone.0014178.g003
CGH Whole-Genome Genotyping
PLoS ONE | www.plosone.org 6 December 2010 | Volume 5 | Issue 12 | e14178

We therefore recommend a two-step mapping strategy. In the
first step a survey array containing ,2.1 M probes sampled from
the low-copy, genic regions of the genome of interest will be used
to identify probes that are informative in a given population via
hybridizations to the parents of the mapping population. In the
second step, based on the results of these hybridizations, ,135,000
of the most informative polymorphic probes would be selected and
used to construct 12-plex arrays for genotyping members of a
mapping population.
We recommend for routine genotyping experiments using those
probes that exhibit higher hybridization intensities from the
reference genome (e.g., B.M probes) for initial mapping
applications because they have higher validation rates. Subsequent
analyses could use probes having higher hybridization intensities
in the non-reference genome to estimate the relative rates of
tandem and dispersed duplications.
Materials and Methods
Plant materialsGenomic DNA was isolated from two-week-old seedlings of the
inbreds B73 and Mo17 as well as from two IBM RILs: M0022 and
M0023. According to previous genotyping results [24] the
genomes of these two RILs are ,56% identical. 1 mg of DNA
was labeled using either 59 Cy3 or Cy5-labeled Random
Nonamers (TriLink Biotechnologies). DNA was incubated for
2 hours at 37uC with 100 units (exo-) Klenow fragment (NEB) and
dNTP mix (6 mM each in TE; Invitrogen). Labeled samples were
then precipitated with NaCl and isopropanol and rehydrated in
25 ml of VWR H20. 34 mg of test and reference samples were
combined in a 1.5 ml tube and dried down using a SpeedVac.
Samples were resuspended in 12.3 ml of H20 and 31.7 ml of
NimbleGen Hybridization Buffer (Roche NimbleGen Inc.) and
incubated at 95uC. The combined and resuspended samples were
then hybridized to the array for 60–72 hours at 42uC degrees with
mixing. Arrays were washed using NimbleGen Wash Buffer
System and dried using a NimbleGen Microarray Dryer (Roche
NimbleGen, Inc). Arrays were scanned at 5 mm resolution using a
GenePix4000B scanner (Axon Instruments). Data were extracted
from scanned images using NimbleScan 2.4 extraction software
(Roche NimbleGen, Inc.), which allows for automated grid
alignment, extraction and generation of data files. For this
experiment, five hybridizations were performed and the samples
hybridized to each array are as follows: Array 1 M0023 (Cy3)/B73
(Cy5); Array 2 M0022 (Cy3)/B73 (Cy5); Array 3 Mo17 (Cy3)/
M0023 (Cy5); Array 4 Mo17 (Cy3)/M0022 (Cy5); Array 5 M0023
(Cy3)/B73 (Cy5).
CGH data analysesThe probes were mapped to the B73 RefGen_v1 genome
sequence [21] with 100% identity and coverage [22] and only
probes with a single perfect match were used for this analysis.
The integrated genetic and physical map of maize [25] was used
to determine the physical location of each genetic marker on B73
RefGen_v1. The hybridization intensity of each mapped probe
was estimated within each genotype using LIMMA [26]
according to [22]. When applying q,0.0001 cutoff [27], a total
of 225,867 probes that exhibited significantly different hybrid-
ization signals between B73 and Mo17 were deemed to be
polymorphic. This set was further divided and filtered based on
which genotype exhibited a higher signal and whether there was
at least a 2-fold change in signal intensity between B73 and
Mo17 (Table 1).
CGH-based GenotypingLinear model. A linear model was used to calculate a q-value
to estimate the false-discovery corrected probability that a
particular probe was different from B73 or from Mo17. For
each RIL, a probe was assigned a value of ‘‘B73’’ if it was
significantly different from Mo17 (q,0.05) but not from B73 and
was assigned a value of ‘‘Mo17’’ if it was significantly different
from B73 (q,0.05) but not from Mo17. The probes that were
significantly different from both or neither parental lines were not
assigned a genotype.
Single array based model. A simple model was employed to
assign genotype calls using a single replicate of data. The spatially
normalized data extracted for each array using the NimbleScan
software were imported into Excel. For each probe the value of
[(RIL-B73)/(Mo17-B73)] was calculated. Cut-off values of 0.33
and 0.66 were arbitrarily selected for the purpose of this analysis.
All probes having values of less than 0.33 was assigned a genotype
of B73, while probes having values greater than 0.66 were assigned
a genotype of Mo17. Probes with values between 0.33 and 0.66
were not classified. The values for different replicates were
subsequently compared to determine the number of genotype
assignments that were shared or conflicting for each of the
hybridizations.
BAC based genotyping. Genotypes of each BAC were
determined by comparing the calls for all polymorphic probes
within a BAC. Genotypes were assigned to BACs have at least five
polymorphic probes and only BACs with at least 80% agreement
for the genotypes of all probes within the BAC that were classified
as B73 or Mo17. The ‘‘consensus’’ genotyping assignments were
assigned when a BAC was assigned the same genotype for each of
the replicates for a RIL.
Validation of genotype assignmentsThe genotype scores for each of the two RILs were collected
from a total of 10,143 markers [25] including IDP markers [24],
TIDP markers [28], SNP markers [29] and other markers
downloaded from MaizeGDB (http://www.maizegdb.org). If
one of these markers was located within 5,000 bp of a probe,
the genotype obtained from this marker was treated as the ‘‘true’’
genotype for this probe. The proportions of the genotyping calls
for probes that were supported by these other markers were then
determined.
Supporting Information
Table S1 Conservation of probe sequences in Mo17 whole
genome shotgun sequence.
Found at: doi:10.1371/journal.pone.0014178.s001 (0.04 MB
DOC)
Table S2 Number of polymorphic probes per chromosome.
Found at: doi:10.1371/journal.pone.0014178.s002 (0.04 MB
DOC)
Acknowledgments
We thank An-Ping Hsia for useful scientific comments and assistance with
manuscript preparation and Dan Rokhsar of the DOE’s Joint Genome
Institute for sharing unpublished whole-genome shotgun sequences of the
Mo17 genome.
Author Contributions
Conceived and designed the experiments: YF NMS JAJ PSS. Performed
the experiments: NMS ALI TR WW. Analyzed the data: YF NMS KY
CGH Whole-Genome Genotyping
PLoS ONE | www.plosone.org 7 December 2010 | Volume 5 | Issue 12 | e14178

CTY WBB DN PSS. Contributed reagents/materials/analysis tools: JAJ
PSS. Wrote the paper: YF NMS JAJ PSS.
References
1. Kidgell C, Winzeler EA (2005) Elucidating genetic diversity with oligonucleotide
arrays. Chromosome Res 13: 225–235.2. Gilad Y, Borevitz J (2006) Using DNA microarrays to study natural variation.
Curr Opin Genet Dev 16: 553–558.
3. Gunderson KL, Steemers FJ, Ren H, Ng P, Zhou L, et al. (2006) Whole-genomegenotyping. Methods Enzymol 410: 359–376.
4. Gupta PK, Rustgi S, Mir RR (2008) Array-based high-throughput DNAmarkers for crop improvement. Heredity 101: 5–18.
5. Wenzl P, Carling J, Kudrna D, Jaccoud D, Huttner E, et al. (2004) DiversityArrays Technology (DArT) for whole-genome profiling of barley. Proc Natl
Acad Sci U S A 101: 9915–9920.
6. Miller MR, Dunham JP, Amores A, Cresko WA, Johnson EA (2007) Rapid andcost-effective polymorphism identification and genotyping using restriction site
associated DNA (RAD) markers. Genome Res 17: 240–248.7. Syvanen AC (2005) Toward genome-wide SNP genotyping. Nat Genet 37
Suppl: S5–10.
8. Fan JB, Chee MS, Gunderson KL (2006) Highly parallel genomic assays. NatRev Genet 7: 632–644.
9. Flibotte S, Edgley ML, Maydan J, Taylor J, Zapf R, et al. (2009) Rapid highresolution single nucleotide polymorphism-comparative genome hybridization
mapping in Caenorhabditis elegans. Genetics 181: 33–37.10. Baird NA, Etter PD, Atwood TS, Currey MC, Shiver AL, et al. (2008) Rapid
SNP discovery and genetic mapping using sequenced RAD markers. PLoS One
3: e3376.11. Winzeler EA, Richards DR, Conway AR, Goldstein AL, Kalman S, et al. (1998)
Direct allelic variation scanning of the yeast genome. Science 281: 1194–1197.12. Borevitz JO, Liang D, Plouffe D, Chang HS, Zhu T, et al. (2003) Large-scale
identification of single-feature polymorphisms in complex genomes. Genome
Res 13: 513–523.13. Rostoks N, Borevitz JO, Hedley PE, Russell J, Mudie S, et al. (2005) Single-
feature polymorphism discovery in the barley transcriptome. Genome Biol 6:R54.
14. West MA, van Leeuwen H, Kozik A, Kliebenstein DJ, Doerge RW, et al. (2006)High-density haplotyping with microarray-based expression and single feature
polymorphism markers in Arabidopsis. Genome Res 16: 787–795.
15. Borevitz JO, Hazen SP, Michael TP, Morris GP, Baxter IR, et al. (2007)Genome-wide patterns of single-feature polymorphism in Arabidopsis thaliana.
Proc Natl Acad Sci U S A 104: 12057–12062.
16. Kumar R, Qiu J, Joshi T, Valliyodan B, Xu D, et al. (2007) Single feature
polymorphism discovery in rice. PLoS One 2: e284.17. Bernardo AN, Bradbury PJ, Ma H, Hu S, Bowden RL, et al. (2009) Discovery
and mapping of single feature polymorphisms in wheat using Affymetrix arrays.
BMC Genomics 10: 251.18. Salathia N, Lee HN, Sangster TA, Morneau K, Landry CR, et al. (2007) Indel
arrays: an affordable alternative for genotyping. Plant J 51: 727–737.19. Edwards JD, Janda J, Sweeney MT, Gaikwad AB, Liu B, et al. (2008)
Development and evaluation of a high-throughput, low-cost genotypingplatform based on oligonucleotide microarrays in rice. Plant Methods 4: 13.
20. Singer T, Fan Y, Chang HS, Zhu T, Hazen SP, et al. (2006) A high-resolution
map of Arabidopsis recombinant inbred lines by whole-genome exon arrayhybridization. PLoS Genet 2: e144.
21. Schnable PS, Ware D, Fulton RS, Stein JC, Wei F, et al. (2009) The B73 maizegenome: complexity, diversity, and dynamics. Science 326: 1112–1115.
22. Springer NM, Ying K, Fu Y, Ji T, Yeh CT, et al. (2009) Maize inbreds exhibit
high levels of copy number variation (CNV) and presence/absence variation(PAV) in genome content. PLoS Genet 5: e1000734.
23. Lee M, Sharopova N, Beavis WD, Grant D, Katt M, et al. (2002) Expanding thegenetic map of maize with the intermated B73 x Mo17 (IBM) population. Plant
Mol Biol 48: 453–461.24. Fu Y, Wen TJ, Ronin YI, Chen HD, Guo L, et al. (2006) Genetic dissection of
intermated recombinant inbred lines using a new genetic map of maize. Genetics
174: 1671–1683.25. Liu S, Yeh CT, Ji T, Ying K, Wu H, et al. (2009) Mu transposon insertion sites
and meiotic recombination events co-localize with epigenetic marks for openchromatin across the maize genome. PLoS Genet 5: e1000733.
26. Smyth G (2005) Limma: Linear models for microarray data. Bioinformatics and
Computational Biology Solutions using R and Bioconductor. New York. pp397–420.
27. Storey JD, Tibshirani R (2003) Statistical significance for genomewide studies.Proc Natl Acad Sci U S A 100: 9440–9445.
28. Hsia AP, Wen TJ, Chen HD, Liu Z, Yandeau-Nelson MD, et al. (2005)Temperature gradient capillary electrophoresis (TGCE)–a tool for the high-
throughput discovery and mapping of SNPs and IDPs. Theor Appl Genet 111:
218–225.29. Barbazuk WB, Emrich SJ, Chen HD, Li L, Schnable PS (2007) SNP discovery
via 454 transcriptome sequencing. Plant J 51: 910–918.
CGH Whole-Genome Genotyping
PLoS ONE | www.plosone.org 8 December 2010 | Volume 5 | Issue 12 | e14178
Copyright © 2022 FDOKUMEN