Comparative Analysis of Human Conjunctival and Corneal Epithelial Gene Expression with...
32
Comparative Analysis of Human Conjunctival and Corneal Epithelial Gene Expression with Oligonucleotide Microarrays Helen C. Turner 1 , Murat T. Budak 2 , M. A. Murat Akinci 1 , and J. Mario Wolosin 1,3 1 Department of Ophthalmology, Mount Sinai School of Medicine, New York, New York 3 Black Family Stem Cell Institute, Mount Sinai School of Medicine, New York, New York 2 Pennsylvania Muscle Institute, University of Pennsylvania, Philadelphia, Pennsylvania Abstract Purpose—To determine global mRNA expression levels in corneal and conjunctival epithelia and identify transcripts that exhibit preferential tissue expression. Methods—cDNA samples derived from human conjunctival and corneal epithelia were hybridized in three independent experiments to a commercial oligonucleotide array representing more than 22,000 transcripts. The resultant signal intensities and microarray software transcript present/absent calls were used in conjunction with the local pooled error (LPE) statistical method to identify transcripts that are preferentially or exclusively expressed in one of the two tissues at significant levels (expression >1% of the β-actin level). EASE (Expression Analysis Systematic Explorer software) was used to identify biological systems comparatively overrepresented in either epithelium. Immuno-, and cytohistochemistry was performed to validate or expand on selected results of interest. Results—The analysis identified 332 preferential and 93 exclusive significant corneal epithelial transcripts. The corresponding numbers of conjunctival epithelium transcripts were 592 and 211, respectively. The overrepresented biological processes in the cornea were related to cell adhesion and oxiredox equilibria and cytoprotection activities. In the conjunctiva, the biological processes that were most prominent were related to innate immunity and melanogenesis. Immunohistochemistry for antigen-presenting cells and melanocytes was consistent with these gene signatures. The transcript comparison identified a substantial number of genes that have either not been identified previously or are not known to be highly expressed in these two epithelia, including testican-1, ECM1, formin, CRTAC1, and NQO1 in the cornea and, in the conjunctiva, sPLA 2 -IIA, lipocalin 2, IGFBP3, multiple MCH class II proteins, and the Na-Pi cotransporter type IIb. Conclusions—Comparative gene expression profiling leads to the identification of many biological processes and previously unknown genes that are potentially active in the function of corneal and conjunctival epithelia. During the past decade, high throughput, high-density DNA microarrays have emerged as an efficient, powerful tool for providing useful information in the analysis of the global gene expression patterns in various tissues or biological systems. 1–3 At the ocular surface, such studies have been performed in the corneal epithelium in the context of disease (e.g., Corresponding author: J. Mario Wolosin, Department of Ophthalmology, Mount Sinai School of Medicine, 100th Street and 5th Avenue, New York, NY 10029-6574; [email protected]. Disclosure: H.C. Turner, None; M.T. Budak, None; M.A. Murat Akinci, None; J.M. Wolosin, None NIH Public Access Author Manuscript Invest Ophthalmol Vis Sci. Author manuscript; available in PMC 2010 July 26. Published in final edited form as: Invest Ophthalmol Vis Sci. 2007 May ; 48(5): 2050–2061. doi:10.1167/iovs.06-0998. NIH-PA Author Manuscript NIH-PA Author Manuscript NIH-PA Author Manuscript
Transcript of Comparative Analysis of Human Conjunctival and Corneal Epithelial Gene Expression with...

Comparative Analysis of Human Conjunctival and CornealEpithelial Gene Expression with Oligonucleotide Microarrays
Helen C. Turner1, Murat T. Budak2, M. A. Murat Akinci1, and J. Mario Wolosin1,31 Department of Ophthalmology, Mount Sinai School of Medicine, New York, New York3 Black Family Stem Cell Institute, Mount Sinai School of Medicine, New York, New York2 Pennsylvania Muscle Institute, University of Pennsylvania, Philadelphia, Pennsylvania
AbstractPurpose—To determine global mRNA expression levels in corneal and conjunctival epitheliaand identify transcripts that exhibit preferential tissue expression.
Methods—cDNA samples derived from human conjunctival and corneal epithelia werehybridized in three independent experiments to a commercial oligonucleotide array representingmore than 22,000 transcripts. The resultant signal intensities and microarray software transcriptpresent/absent calls were used in conjunction with the local pooled error (LPE) statistical methodto identify transcripts that are preferentially or exclusively expressed in one of the two tissues atsignificant levels (expression >1% of the β-actin level). EASE (Expression Analysis SystematicExplorer software) was used to identify biological systems comparatively overrepresented ineither epithelium. Immuno-, and cytohistochemistry was performed to validate or expand onselected results of interest.
Results—The analysis identified 332 preferential and 93 exclusive significant corneal epithelialtranscripts. The corresponding numbers of conjunctival epithelium transcripts were 592 and 211,respectively. The overrepresented biological processes in the cornea were related to cell adhesionand oxiredox equilibria and cytoprotection activities. In the conjunctiva, the biological processesthat were most prominent were related to innate immunity and melanogenesis.Immunohistochemistry for antigen-presenting cells and melanocytes was consistent with thesegene signatures. The transcript comparison identified a substantial number of genes that haveeither not been identified previously or are not known to be highly expressed in these twoepithelia, including testican-1, ECM1, formin, CRTAC1, and NQO1 in the cornea and, in theconjunctiva, sPLA2-IIA, lipocalin 2, IGFBP3, multiple MCH class II proteins, and the Na-Picotransporter type IIb.
Conclusions—Comparative gene expression profiling leads to the identification of manybiological processes and previously unknown genes that are potentially active in the function ofcorneal and conjunctival epithelia.
During the past decade, high throughput, high-density DNA microarrays have emerged as anefficient, powerful tool for providing useful information in the analysis of the global geneexpression patterns in various tissues or biological systems.1–3 At the ocular surface, suchstudies have been performed in the corneal epithelium in the context of disease (e.g.,
Corresponding author: J. Mario Wolosin, Department of Ophthalmology, Mount Sinai School of Medicine, 100th Street and 5thAvenue, New York, NY 10029-6574; [email protected]: H.C. Turner, None; M.T. Budak, None; M.A. Murat Akinci, None; J.M. Wolosin, None
NIH Public AccessAuthor ManuscriptInvest Ophthalmol Vis Sci. Author manuscript; available in PMC 2010 July 26.
Published in final edited form as:Invest Ophthalmol Vis Sci. 2007 May ; 48(5): 2050–2061. doi:10.1167/iovs.06-0998.
NIH
-PA Author Manuscript
NIH
-PA Author Manuscript
NIH
-PA Author Manuscript

diabetes) or growth conditions.4,5 The corneal (Co) and conjunctival (Cnj) epithelia are themain cellular components of the ocular surface.
These two distinct lineages derive from a small cohort of head ectodermal cells that becomePAX6 positive at a relatively early developmental stage, before optical vesicle formationand organogenesis.6–8 Both ocular surface epithelia are stratified and nonkeratinizing anddisplay a wet phenotype that comprises multiple secretory and absorptive features related tothe phenotypes of simple epithelia. They functionally combine to establish the protectiveand light refractory properties of the ocular surface. Unlike the keratinizing epidermis, theseepithelia constitutively express PAX-6 throughout life. Given the common developmentalorigin and a degree of structural similarity between corneal and conjunctival epithelia, itappears logical that identification of genes that are uniquely or preferentially expressed ineither of these two lineages will provide clues to the mechanisms that specifically underlieeach phenotype and distinguish one from the other.
Accordingly, in this study, we used a large oligonucleotide array system, representing morethan half of the known human genes, to compare the molecular signatures of these twotissues. Approximately one half of the genes represented in the array are expressed in eitherthe corneal or conjunctival systems. Ninety percent of the transcripts present in one of thesystems are also present in the other at a comparable level of expression. The remaining10% represent genes that are present in only one of the tissues or are expressed atsubstantially higher levels in one epithelium over the other.
Materials and MethodsTissue Procurement and Processing
Whole human conjunctivae and human corneas were obtained from the National DiseaseResearch Interchange (NDRI, Philadelphia, PA) and processed between 48 and 72 hours ofdeath. No donor details apart from age, sex, and cause of death were released. The criteriafor tissue acceptance and inclusion were donor ages between 25 and 65 years (irrespectiveof sex) and overt physical integrity of the epithelium over the central cornea, as revealed bytrypan blue stain. Conjunctivae and whole corneas that excluded an outer strip of limbus (toensure that the sample contains no cells derived from the adjacent conjunctiva) werequartered and incubated overnight at 4°C in conical tubes containing 5 mL of 0.5% Dispasedissolved in 1:1 Dulbecco’s modified minimal essential medium-Ham F-12 mix with slow(~20 cycles/min) end-to-end rocking. This treatment results in the spontaneous separation ofintact epithelial sheets from the underlying stroma. The use of human tissue in the study wasin accordance with the provisions of the Declaration of Helsinki and was sanctioned by thelocal Institutional Review Board.
RNA Preparation and AnalysisEpithelial sheets were manually transferred from the Dispase solution directly into lysisbuffer, and total RNA was isolated (RNeasy Minikit; Qiagen Inc., Valencia, CA) and wasfurther purified (RNeasy spin columns; Qiagen). The quantity and purity of each RNAsample was determined from the 260- and 280-nm absorbance, and its integrity wasdetermined (2100 BioAnalyzer; Agilent Technologies Inc., Palo Alto, CA). Pooled RNAfrom two different corneal or conjunctival specimens (each one pair) was used for eachreplicate experiment. For both cornea and conjunctival tissues, there were one female andfive male donors. This distribution merely resulted from the availability of donor tissue, asapportioned by the NDRI.
The pooled RNA was converted into cDNA with reverse transcriptase (SuperScript Choice;Invitrogen-Gibco, Bethesda, MD) and a modified oligodT primer (Affymetrix, Santa Clara,
Turner et al. Page 2
Invest Ophthalmol Vis Sci. Author manuscript; available in PMC 2010 July 26.
NIH
-PA Author Manuscript
NIH
-PA Author Manuscript
NIH
-PA Author Manuscript

CA). The purified cDNA was subjected to in vitro transcription to generate biotin-labeledcRNA (ENZO BioArray HighYield Kit; Affymetrix).
Microarray Hybridization and Data ProcessingAppropriately fragmented biotin-labeled cRNA was hybridized to an oligonucleotidemicroarray (HG-U133A GeneChips; Affymetrix), according to the manufacture’s protocol.Three separate experiments, each including one conjunctival and one corneal cRNA poolwere performed. The HG-U133A array contains ~16, 000 unique GenBank accessionnumbers arranged in 22,283 probe sets (http://www.ncbi.nlm.nih.gov/Genbank; provided inthe public domain by the National Center for Biotechnology Information, Bethesda, MD).Hybridized microarrays were stained with a streptavidin-phycoerythrin reagent, andfluorescence images were captured with a laser scanner (G2500A; Agilent).
Expression data were extracted from the fluorescence images (Microarray Analysis Suite,ver. 5.0 [MAS 5.0]; Affymetrix) to determine (1) the likelihood that the signal test result issignificantly greater than the background signal, to determine whether the target transcript ispresent (P) or absent (A); and (2) a normalized signal intensity (SI) for each transcript. Thedata discussed in this publication have been deposited in the National Center forBiotechnology Information (NCBI) Gene Expression Omnibus (GEO,http://www.ncbi.nlm.nih.gov/geo/ provided in the public domain by the NCBI, Bethesda,MD) and are accessible through GEO Series accession number GSE5543. Annotation datawere obtained from the Affymetrix Web site and by manual retrieval of selected transcriptsfrom GenBank. Signal intensity values for all six individual data sets were subjected tounsupervised hierarchical clustering tests (conditional tree analysis) to assess the extent ofglobal similarities and differences among the conjunctival and corneal replicates(GeneSpring; Silicon Genetics, Redwood City, CA).
To identify differentially expressed transcripts, the MAS 5.0-generated signal intensitytriplicate data, without regard to present or absent status, was subjected to the local poolederror (LPE) statistical test, implemented in the R statistical programming language.9Transcripts included within the 1% false discovery rate level of the LPE test wereconsidered to have a significantly different expression level between the two tissues. TheMAS 5.0 signal intensity and P or A calls for all these transcripts were then transferred intoa spreadsheet program (Excel; Microsoft, Redmond, WA) for further analysis. A transcriptwas considered present when it received a P call in at least two of the replicates andsignificant (S) when the mean SI for all three replicates exceeded 1% of the mean SI for thethree β-actin transcripts represented in the microarray. The results were used to buildconjunctival PS transcript (CnjPS) and corneal PS transcript (CoPS) spreadsheets. TheCnjPS was then used to generate CnjPS/CoA, a transcript list containing all conjunctival PStranscripts that were completely absent from the cornea (designated A call in all threeexperiments) and CnjPS>1.5×CoP, a transcript list comprising all conjunctival PStranscripts not included in CnjPS/CoA for which the mean SI is at least 1.5 times as large asthe respective corneal value. In an analogous manner, CoPS was used to build cornea-exclusive (CoPS/CnjA) and cornea-preferred (CoPS>1.5×CnjP) transcript lists. In thesubsequent text, we alternatively refer to the sequences included in these lists as conjunctiva(or cornea-)-exclusive and conjunctiva (or cornea-)-preferred transcripts, respectively.
Analysis of Differential Gene ExpressionDifferentially expressed conjunctival and corneal transcripts were imported into theExpression Analysis Systematic Explorer software (EASE10;http://david.niaid.nih.gov/david/ease/htm/ provided in the public domain by the NationalInstitute of Allergy and Infectious Diseases [NIAID]), to examine functional gene clusters of
Turner et al. Page 3
Invest Ophthalmol Vis Sci. Author manuscript; available in PMC 2010 July 26.
NIH
-PA Author Manuscript
NIH
-PA Author Manuscript
NIH
-PA Author Manuscript

the differentially expressed genes and/or to identify biological and molecular processes thatare overrepresented in both tissues. EASE analysis with Bonferroni multiplicity correctionprobes each gene list against the corresponding population lists, and an EASE score iscalculated for the likelihood of overrepresentation in the Gene Ontology Consortiumannotation categories (GO biological process, GO cell component and GO molecularfunction; for sources of annotation, statistical methods, and EASE documentation, see theNIAID Web site).
Real-Time RT-PCRIndependent validation of relative expression levels by real-time PCR was performed withprimer sets for all the connexin genes represented in the microarray. The RNA was obtainedfrom epithelia mechanically scrapped from the corneal surface rather than from the Dispaserelease epithelial sheets and was treated with DNAase I (Qiagen) before its release from thepurification columns (RNeasy Minikit; Qiagen), to eliminate possible contaminatinggenomic DNA, and was transcribed into cDNA (Omniscript reverse transcriptase; Qiagen).PCR reactions were performed with a SYBR green nucleic acid staining kit (Quantitect;Qiagen) in 384-well plates in a sequence-detection system (Prism 7900HT; AppliedBiosystems [ABI], Foster City CA). For each primer pair, we used nine wells; threecontained test cDNA, three contained a control sample in which the reverse transcriptasewas omitted from the transcription reaction, and three contained human genomic DNA(Biochain, Hayward, CA). Products were analyzed by agarose (4%) gel chromatography.Relative amounts of the target genes in the corneal and conjunctival epithelia were thendetermined from the cycle thresholds according to the delta of delta Ct method using theaverage of the triplicate results. The following primer sets (forward/reverse) were used:Cx31, ccaacgtctgctacgacaactact/cacaggcctccgtgcttcttctt; Cx31.1, cccgacaccatgtgaagaaaa/tctcttgcctgcccctacct; Cx32, ggccgctccaatccac-ctt/gcggcgcagtatgtctttcag; Cx36,tcaaggaggtggaatgttatgtgt/tggcaggtcct-tgttacgaatct; Cx37, gagcactgatgggcacctatg/gctcgctggcacacaaaca; Cx40, gcctcccaacaaaacacagacaa/cataacgaacctggatgaaacctt; Cx43,cttttgatttc-cccgatgataacc/ggtgcactttctacagcaccttttt; Cx50, gaacccgaggtgggagagaa/ggcagcccttgctttgaca; Cx59, ttggggaaaatacaagttgaagaag/ataatcaggggca-gaagggagtc.
CytohistochemistryFreshly frozen human conjunctival (comprising predominantly of palpebral/fornicealconjunctival regions) and corneal cryosections (6–8 μm thick) were prepared forimmunocytochemistry as previously described.11–15 After fixation with ice-cold methanol at−20°C for 10 minutes, the tissue sections were incubated for 2 hours (RT) with monoclonalmouse antibodies against the following antigens: human secretory PLA2 type II (sPLA2-IIA;1:100 dilution; Upstate Biotechnology, Lake Placid, NY), tyrosine-related protein-1(TYRP-1; clone Ta99; 1:200 dilution; GeneTex, Inc., San Antonio, TX), and HLA class II(DP, DQ, DR; 1:200; Serotec, Raleigh, NC). Bound antibodies were stained by a 1-hourincubation with 1:500 diluted Alexa Fluor 488–conjugated goat anti-mouse IgG (Invitrogen-Molecular Probes Inc., Eugene, OR). The slides were rinsed three times with phosphate-buffered saline (PBS) and covered with antifade medium (Vectashield; Vector Laboratories,Burlingame, CA). Fluorescence was visualized on a fluorescence microscope (Axiophot2;Carl Zeiss Meditec, Inc., Thornwood, NY).
To identify melanocytes, we subjected the paraffin-embedded sections to Fontana-Massonsilver stain (American Master Tech Sci., Lodi, CA). Briefly, the sections were incubated for45 minutes at 60°C in ammoniacal silver solution, for 2 minutes in 5% sodium thiosulfateand for 5 minutes in nuclear fast red stain. To examine dihydronicotinamide adeninedinucleotide phosphate (NADPH) reductase activity,16 –17 cryosections were incubated for2 to 4 hours at 37°C in 0.1 M phosphate buffer (pH 7.4) containing 2.5 mM NADPH
Turner et al. Page 4
Invest Ophthalmol Vis Sci. Author manuscript; available in PMC 2010 July 26.
NIH
-PA Author Manuscript
NIH
-PA Author Manuscript
NIH
-PA Author Manuscript

(Sigma-Aldrich, St. Louis, MO), 0.4 mM nitroblue tetrazolium (Sigma-Aldrich), and 10%dimethylsulfoxide. For control sections, NADPH was omitted from the incubation solution.The sections were rinsed in PBS, mounted in antifade medium (Vectashield; VectorLaboratories), and examined by light microscopy.
ResultsRNA Quality
All RNA samples showed 260/280 nm absorption ratios in excess of 2.0. The RNA yieldsper single cornea and conjunctiva were approximately 6 and 20 μg, respectively. Based oncell counts independently obtained by trypsinization of epithelial sheets, these yieldscorrespond to 4 to 6 pg RNA/cell, the typical RNA content of epithelial cells. Profiles(determined by Biochip; Agilent) were very similar in both tissues (Fig. 1). These profilesdisplayed a flat baseline, no significant tailing of the ribosomal RNA bands, and S18/S23ratios of 1.5 to 1.8. RNA samples prepared from tissue that was released by scraping, insteadof overnight Dispase incubation, showed poorer profiles (not shown), probably because ofthe presence of apoptotic or preapoptotic exfoliating surface cells, which are washed awayduring the Dispase incubation.
Microarray AnalysisSeveral empiric tests were used to evaluate the soundness of the raw data extracted (MAS5.0; Affymetrix). The number of transcripts recognized by the software program as presentin all three independent experiments was 9237 and 8905 for the conjunctiva and cornealepithelia, respectively. In addition, 1727 and 1633 further transcripts were identified in twoof the experiments. Together, these transcripts account for approximately 50% (Cnj) and48% (Co) of the total represented in the microarray. The number of P calls in eachexperiment and the median and average SIs (Table 1) or the distribution of twice present(PP) transcripts within the three experiments suggest no significant tissue bias in either ofthe replicates (not shown).
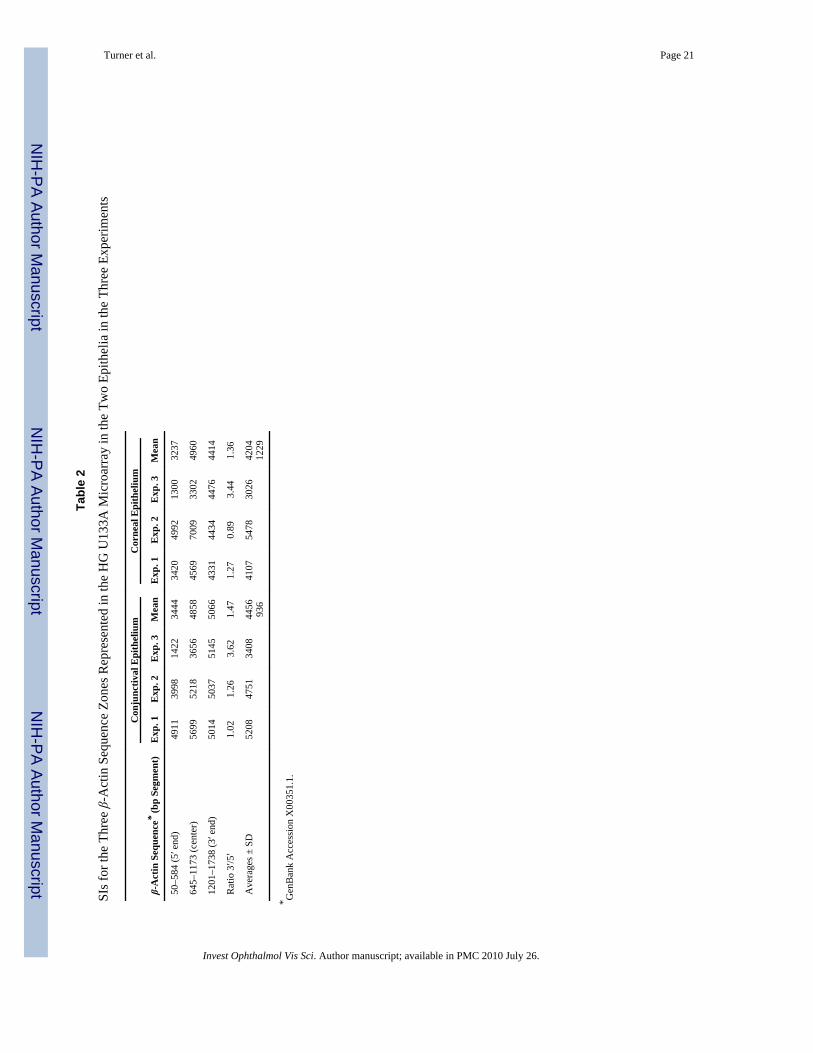
The microarray (HG-U133A; Affymetrix) contains three distinct probes for β-actinrepresenting distinct sections of the gene. The similarity in average SIs for the spotsrepresenting the sequence segment closer to the polyA tail (bp 1201–1738) and the segmentclose to the starting codon (bp 50 –584), demonstrates that there was outstandingpreservation of message length in the course of RNA isolation and generation of cRNAprobes in experiments 1 and 2. There was some degradation, albeit of a similar degree inboth tissues, in experiment 3 (Table 2). Because the probes for essentially all the transcriptsin the Affymetrix microarray have been intentionally developed from the 3′ of the sequence,this degree of degradation is likely to have a minimal effect on our results. Similar resultswere obtained for the three GAPDH sequences present in the array (not shown). In addition,the similarity in the average SIs for conjunctival and corneal epithelia for this control geneindicates well-normalized SIs across the three experiments. Finally, conditional treeanalyses of the whole transcript set or of the subsets of transcripts preferentially expressed inthe Cnj and Co epithelia (Fig. 2) appropriately clustered the three conjunctival and cornealsamples into two separate groups.
Identification of Differentially Expressed GenesThe differential analysis described in the Methods section resulted in the identification of alarge number of genes that were uniquely or preferentially expressed in both epithelia. Sincegenes expressed at very low levels may not yield measurable levels of actual protein, wedecided to limit the analysis to transcripts with expression higher than 1% of the highlyexpressed β-actin gene. The methodology outlined in the Methods section led to the
Turner et al. Page 5
Invest Ophthalmol Vis Sci. Author manuscript; available in PMC 2010 July 26.
NIH
-PA Author Manuscript
NIH
-PA Author Manuscript
NIH
-PA Author Manuscript

establishment of conjunctiva- and cornea-exclusive gene lists containing 93 and 339transcripts, respectively, as well as 211 and 589 transcripts in the respective preferred genelists. Genes included in the exclusive transcript sets were categorized according to relativeSIs. For the preferred lists, to take into account both the level of expression and expressionratios as factors that would affect the phenotypic distinction between both tissues, we choseto use the product of the SI by the SI ratio (SI×R) as an index of significance.
The 25 genes with the highest SIs and SI×Rs, along with gene annotations are displayed inTables 3 and 4, respectively. Note, that for many genes, the microarray chip (HG-U133A;Affymetrix) included two and even three transcript representations. In those instances inwhich a gene was represented in the array by more than one transcript set, only the transcriptwith the highest SI is displayed in Tables 3 and 4 (tissue ratios for these lower-SI transcriptswere highly similar to those for the transcripts included in the tables). The top componentsof these lists include genes with high expression levels that have already been demonstrated,genes that are novel in these tissues, and genes of yet to be identified function. The full listsof the four exclusively or differentially expressed transcript sets have been included in theAppendix, online at http://www.iovs.org/cgi/content/full/48/5/2050/DC1. Updatedfunctional GO annotations for each gene can be found athttp://www.affymetrix.com/analysis/index.affx.
Pathway Identification by EASE/Gene Ontology AnalysesExclusive and preferentially expressed conjunctival and corneal transcripts wereamalgamated into conjunctival and corneal selective transcript lists containing 803 and 432transcripts, respectively.
Affymetrix gene identifiers for both sets were imported into EASE software, to identifygene ontologies that are overexpressed in either tissue. This comparative analysis yieldedseveral biological processes that were overrepresented in the corneal epithelium, albeit withonly moderate to low significance scores (Table 5). The only noticeable group includedactivities related to cellular handling of heavy metals. In contrast, EASE analysis ofselective conjunctival genes led to the identification of a large number of processesassociated with very high levels of significance (EASE scores up to 10−28 and 10−24, whensubjected to Bonferroni adjustment). When the conjunctival statistically significantbiological processes were organized into a GO ontology classification tree(http://www.geneontology.org), nearly all of the significantly overrepresented categories inthe conjunctival epithelium coalesced within a narrow set of the physiological processes(Fig. 3) that includes two subcategories: genes related to responses to stimulus (stress,biotic, and external stimulus) and organismal physiological processes associated withimmune mechanisms (humoral immune responses, including complement activation, antigenpresentation, and processing). This level of statistical significance is probably attributable tothe presence of a large number of HLA class II antigen mRNA within the conjunctivalepithelium (Table 6; when more than one transcript is represented, only the highest SIrepresentation has been included for each gene). Within the conjunctival epithelial layer,another category showing statistically significant overexpression related to melaninbiosynthesis (Table 5).
Validation of Microarray Expression LevelsTo validate the intensities obtained by the microarray study by real-time PCR, we chose aset of connexin transcripts represented in the microarray. The results for genomic DNAconfirmed the similar effectiveness of all these primers against their respective targets(Table 7). Gel chromatography confirmed that, in each case, the SYBR green signalrepresented the generation of a single amplicon with the correct molecular size (not shown).
Turner et al. Page 6
Invest Ophthalmol Vis Sci. Author manuscript; available in PMC 2010 July 26.
NIH
-PA Author Manuscript
NIH
-PA Author Manuscript
NIH
-PA Author Manuscript

The comparison of the results from the Δ-Δ Ct and SI calculations demonstrate that therelative levels of expression and P/A status provided by the microarray accurately indicatethe relative levels of expression reported by real-time PCR.
HistochemistryThe presence and localization of some of the most prominent conjunctiva-specific genesidentified by the corneal– conjunctival comparison were examined by indirectimmunofluorescence. Secretory PLA2-IIA, the top gene in the Cnj epithelia-exclusive setwas detectable at the protein level in conjunctival goblet cells and other superficial epithelialcells (Figs. 4A, 4B). Labeling occurred principally in granules accumulated in proximity tothe plasma membrane that seem to be mobilized and excreted in Goblet cells undergoingactive degranulation.
Cells expressing overly intense stain for HLA-class II antigen-presenting proteins (DR, DP,DQ) were intercalated throughout the suprabasal conjunctival epithelial cells (Fig. 4C).Neither of these proteins was expressed in the corneal epithelium (Figs. 4A, 4C, insets).Immunostaining for TYRP1 and the Fontana-Masson silver stain (Fig. 5) showed theabundant presence of melanocytes in the basal cell layer of the conjunctival epithelium. Nostaining was noted in the cornea (not shown).
Conversely, consistent with the existence of a highly expressed dehydrogenase reductasewithin the corneal preferred cohort (Table 4A), an enzymatic assay for NADH/NADPHreductase (diaphorase) activity revealed high reductase activity in the basal cells of thecorneal epithelium (Fig. 6A), whereas activity throughout the conjunctival epithelium wasminimal to nil (Fig. 6B).
DiscussionWe have performed a microarray-based comparative global gene expression profiling(Affymetrix) of the two linings covering the ocular surface, the corneal and conjunctivalepithelia. Given the embryologic and functionally related nature of these epithelial linings,the identification of genes and biological pathways that are specifically or preferentiallyexpressed in either of these two tissues could selectively contribute to tissue phenotype and/or function. The use of SIs and PS/A calls (definitions for present and absent transcriptsdescribed in the Methods section), the LPE statistical approach, and a limitation of theanalysis to substantially expressed transcripts led to the identification of 425 and 803transcripts that were significantly overexpressed in the cornea and conjunctiva, respectively.
The most prominent global feature of the microarray data is the large excess of differentiallyexpressed transcripts in the conjunctival set versus its corneal counterpart, and the highsignificance of EASE scores for multiple subcategories within the response to stimulus andorganismal physiological processes (Fig. 3). This result probably reflects themultiphenotypic nature of the conjunctival epithelium.
Blood-derived intraepithelial antigen-presenting cells are numerous in this tissue (Fig. 4)and lymphocytes account for between 1% and 3% of the epithelial mass.18,19 Consistentwith this preponderance of intraepithelial leukocytes, the differential analysis identifiedmultiple blood cell– exclusive cell markers (Tables 3B, 4B). Of the 29 MHC class IItranscripts represented in the HG-U133A microarray, 20 were present in the differentialconjunctival sets. Table 6 displays the genes represented by these transcripts. Notably, theexpression levels for some of the MHC transcripts match the expression levels ofhousekeeping genes such as β-actin and GAPDH. MHC class II genes are expressed only incells from the hematopoietic lineage. Thus, the results imply that the intraepithelial cells in
Turner et al. Page 7
Invest Ophthalmol Vis Sci. Author manuscript; available in PMC 2010 July 26.
NIH
-PA Author Manuscript
NIH
-PA Author Manuscript
NIH
-PA Author Manuscript

conjunctiva express class II genes at extraordinary levels. The very intense level of theimmunostaining for HLA class II for DP, DQ, and/or DR subtypes (Fig. 4) is fullyconsistent with this conclusion. The presence of lymphocytes is reflected by the prominentlocation of the lymphocyte-specific protein 1 (LSP1) within the exclusive Cnj gene list(Table 3A). Likewise, the high concentration of melanocytes within the Cnj epithelial basallayer (Fig. 5) is reflected in the substantial representation of TYRP-1 and -2 (Tables 3, 4).
In contrast to conjunctival gene expression, the homogeneous cellular nature of the cornealepithelium generated minimal uncertainty as to the epithelial cell origin of transcripts thatshowed preferential expression in this tissue. EASE analysis indicated that the preferentialexpression of transcripts related to genes involved in the control of oxidative damage andheavy metal detoxification were the only biological processes that are more prominent in thecorneal than in the conjunctival epithelia at a statistically significant level. The high levels ofcornea-preferred genes of two well-known corneal proteins, aldolase dehydrogenase type3AI and transketolase,20,21 and of an NADH/NADPH reductase (diaphorase), known underthe aliases of NQO1,22 diaphorase 4, cytochrome b5 reductase, and dioxin-induciblemenadione oxidoreductase, are likely to be the main contributors to the statisticalsignificance of this EASE score (Tables 4A, 8). NQO1 has not been shown to be prominentin the cornea. Its function is to catalyze the two-electron reduction of quinones tohydroquinones, thereby preempting one-electron reduction of quinones by other reductases.The latter leads to the formation of detrimental reactive oxygen species. Overall, NQO1could protect the cornea by directly scavenging free radicals or by allowing the rapidrecovery of highly efficient free radical scavengers, such as ascorbate, to their active state.23,24 The biological significance of NQO1 is also indicated by the fact that its absence leadsto severe neurologic disability due to deficiencies in lipid and steroid metabolism that causetoxic accumulations in microsomal compartments.25 Consistent with the NQO1 expressiondifferences, our histochemical study of NADPH reductase indicates large differences in totaloxiredox activity between corneal and conjunctival epithelia. Aldehyde dehydrogenase type3A1 has recently been shown to be critical for corneal oxidative protection.26 Consideringthat the gene expression level for diaphorase/NQO1 is similar to, and the Co/CNJ ratio islarger than, those for ALDH3A1, a detailed study of the role(s) played by this diaphorase incorneal biology appears to be highly warranted.
In addition to global gene expression analyses, it is also valuable to focus on the significanceof individual transcripts (Table 8). The highest-expressing cornea-exclusive gene is testican1. This large secreted multidomain proteoglycan has been shown to have strong inhibitoryactivity against cathepsin and activation of matrix metalloproteinases (MMPs).27,28 Thecorneal epithelium expresses multiple MMPs and cathepsins, in particular, cathepsin L/V2,29 which in itself shows a high corneal preference (Table 4A). Thus, it is intriguing toconsider the possibility of a role for testican-1 in locally protecting the corneal epithelial cellsurface membrane against the activity of its own proteolytic agents. The third gene in thecornea-exclusive list is a formin isoform. Formins are a conserved family of actin nucleatorsresponsible for the assembly of diverse actin structures such as cytokinetic rings andfilopodia. Formin binding to the barbed end of actin filaments increases filament flexibilityand has been documented to cause critical modulation of cell adhesion and cell motility. Theexclusive presence of a certain formin isoform in the corneal epithelium is likely to play aweighty role in the phenotypic difference of this tissue with that of its ocular surfacecounterpart. It will be interesting to assess formin’s contribution to the rapid migration incorneal wound healing and response to physical pressure.30 Another intriguing andunexpected corneal gene is cartilage acidic protein 1 (CRTAC1; Table 4A), a matrixcomponent with high affinity for integrins. It is profusely expressed in cartilage, a mostlyavascular tissue, but it is absent in most other organs and tissues examined, including brain,liver, and muscle.31 Its corneal expression may indicate that its function is somehow related
Turner et al. Page 8
Invest Ophthalmol Vis Sci. Author manuscript; available in PMC 2010 July 26.
NIH
-PA Author Manuscript
NIH
-PA Author Manuscript
NIH
-PA Author Manuscript

to the avascular environs. Adiponectin, is another cornea-preferred, highly expressed gene.In a fashion similar to CRTAC1, it codes for a protein that until now has been believed to bespecific for one cell type, the adipocyte.32 Adiponectin is a secreted protein with multiplesystemic functions including growth-promoting activity in epithelial cells.33,34 If indeed,adiponectin is secreted by the corneal epithelium, it may function as part of the proliferationpromoter autocrine loop. Other valuable corneal preferred genes to be considered for futureinvestigations are chemokine CXCL14 (BRAK) and Dickkoft 3 (DKK3). CXCL14 plays acentral role in monocyte attraction and their in situ conversion to Langerhans cells.35 Thus,it could be important for the ontogeny of these immunosurveillance cells in the limbus.DKK proteins are involved in the regulation of the WNT-β-catenin cascade, which, in turnmay control developmental cell fate36 and the expression of connexin43, another highlyexpressed corneal preferred transcript (Table 4A). DKK2, which is not expressed in themature human cornea (Table 9), has recently been found to be a critical component ofcorneal epithelial development in mouse.37 Thus, it is possible that in humans, this role isperformed by DKK3.
In the case of the conjunctival epithelium, the presence of substantial levels of infiltratedleukocytes and resident melanocytes implies that for most transcripts, confirmation of abona fide epithelial origin will require specific spatial techniques such as in situhybridization and/or immunohistochemistry. In the present study, we performed such a testfor sPLA2-IIA, a natural antimicrobial protein in tears38,39 and a systemic proinflammatorymediator40 that occupies the top position in the list of conjunctiva-expressed transcripts notexpressed in the cornea (Table 3B). Immunohistology showed that the protein is abundantlyexpressed in the conjunctival Goblet cells. The stain displays spatial patterns and featuressuggestive of a secretory process (Fig. 4). To our knowledge, this is the first report of anonmucinous secretion by mucin-rich cells anywhere in the body. Thus, the potential role(s)of this sPLA2n in Goblet cell biology and secretory activity warrant further study. The moretenuous expression in other differentiated cells is consistent with the identification of highlevels of gene and polypeptide expression of sPLA2 class II, in a human conjunctivalepithelial cell line that does not form mature Goblet cells.41 Other very prominentconjunctival novel genes within the conjunctival lists that deserve future attention includelipocalin 2, an iron sequester protein that is part of tissue innate immunity42; insulin-likegrowth factor binding protein-3 (IGFBP3), a multifunctional soluble protein that regulatesthe potent mitogenic and antiapoptotic effects of IGF-I and -II and has been recently shownto have decreased expression in pterygium43; RARRES1, a retinoid receptor; trefoil factor 1,an estrogen-inducible protein; ceruloplasmin (Table 3B), and the Na-dependent phosphatetransporter isoform NaPi-IIb (Table 4B). In the kidney proximal tubule and intestine, thistransporter is localized at apical membranes, where it determines reabsorption or uptake ofphosphate toward the circulation.44,45 A similar role in the conjunctiva implies vigorousphosphate removal from the tears, which may be important in corneal protection; recentstudies have shown that phosphate catalyzes corneal calcification.46,47
For some proteins (e.g., IGFBPs48) the two tissues displayed isoform expression differences.These secreted, high-affinity, IGF-binding proteins act as modulators of IGF bioavailability.Differential patterns of spatial and temporal expression in dynamic processes such adevelopment and cellular transformation, indicate subtle differences in function. The cornealepithelium expresses high levels of the isoforms 6 and 7 (Table 4A). These isoforms arepoorly expressed in the conjunctival epithelium which, conversely, shows a selectivity forisoform 3 (Table 4B).
Finally, in relation to keratins, the fundamental markers of epithelial phenotype, themicroarray measurements yielded, as expected, high expression levels of the two cornea-specific keratins K3 and K1249 (Table 10). In addition, consistent with its cornea-specific
Turner et al. Page 9
Invest Ophthalmol Vis Sci. Author manuscript; available in PMC 2010 July 26.
NIH
-PA Author Manuscript
NIH
-PA Author Manuscript
NIH
-PA Author Manuscript

classification, K3 was absent from the conjunctiva. K12, however, was expressed in thistissue at substantial levels. This result reflects the fact that patches of K12-expressing cellsare intercalated within the conjunctival epithelium. As proposed by Kawasaki et al.,50 thesimplest interpretation of the patch pattern is the existence of a misdirected cell migration ofcorneal epithelial precursors from the limbus toward the conjunctiva. However, examinationof other genes highly expressed in the cornea does not fit such a model. For instance, K3,testican-1, and ECM-1 transcripts well expressed in the cornea, are not found at all withinthe conjunctival set (Table 3A). In addition, the conjunctiva/cornea SI ratios for certaintranscripts showing abundant corneal expression (e.g., cathepsin L2/V and NQO1 in Table4A) are much lower than those for K12. Thus, none of those genes are substantiallyexpressed within the K12-positive cells in the conjunctival cells. Therefore, the possibilitythat the cells in the K12-positive patches are not corneal cells but rather K12-expressingconjunctival cells requires attention. Other keratins also provide interesting distributionpatterns. The simple epithelial keratin type 18 was moderately expressed by both tissueswhereas K4, K13, K15, and K19 expression occurred at very high levels in the conjunctivaldomain only. These gene expression patterns in humans are generally coincident withreports of keratin protein expression in the ocular surface of rodents.51 Finally, K19 hasbeen mentioned occasionally as a potential limbal stem cell marker.52 Given theconjunctival levels observed (Table 4B), it is unlikely that it plays such a function in theconjunctiva.
In summary, our microarray analysis of the embryologically related, yet phenotypicallydisparate corneal and conjunctival epithelia, allowed the identification of a large number ofnovel conjunctiva- and cornea-preferred transcripts for proteins that can have importantroles in the ocular epithelial physiology of each of these tissues.
AcknowledgmentsSupported by National Eye Institute Grants R01EY014878 and R03EY015132 (JMW).
The authors thank Tearina Chu, Director, Mount Sinai Microarray Facility, for helpful assistance.
References1. Arcellana-Panlilio M, Robbins SM. Cutting-edge technology. I. Global gene expression profiling
using DNA microarrays. Am J Physiol 2002;282:G397–G402.2. Verducci JS, Melfi VF, Lin S, Wang Z, Roy S, Sen CK. Microarray analysis of gene expression:
considerations in data mining and statistical treatment. Physiol Genomics 2006;25:355–363.[PubMed: 16554544]
3. Schena M, Shalon D, Davis RW, Brown PO. Quantitative monitoring of gene expression patternswith a complementary DNA microarray. Science 1995;270:467–470. [PubMed: 7569999]
4. Saghizadeh M, Kramerov AA, et al. Proteinase and growth factor alterations revealed by genemicroarray analysis of human diabetic corneas. Invest Ophthalmol Vis Sci 2005;46:3604–3615.[PubMed: 16186340]
5. Sun CC, Su Pang JH, Cheng CY, et al. Interleukin-1 receptor antagonist (IL-1RA) preventsapoptosis in ex vivo expansion of human limbal epithelial cells cultivated on human amnioticmembrane. Stem Cells 2006;24:2130–2139. [PubMed: 16741227]
6. Davis JA, Reed RR. Role of Olf-1 and Pax-6 transcription factors in neurodevelopment. J Neurosci1996;16:5082–5094. [PubMed: 8756438]
7. Koroma BM, Yang JM, Sundin OH. The Pax-6 homeobox gene is expressed throughout the cornealand conjunctival epithelia. Invest Ophthalmol Vis Sci 1997;38:108–120. [PubMed: 9008636]
8. Nishina S, Kohsaka S, Yamaguchi Y, et al. PAX6 expression in the developing human eye. Br JOphthalmol 1999;83:723–727. [PubMed: 10340984]
Turner et al. Page 10
Invest Ophthalmol Vis Sci. Author manuscript; available in PMC 2010 July 26.
NIH
-PA Author Manuscript
NIH
-PA Author Manuscript
NIH
-PA Author Manuscript

9. Jain N, Thatte J, Braciale T, Ley K, O’Connell M, Lee JK. Local-pooled-error test for identifyingdifferentially expressed genes with a small number of replicated microarrays. Bioinformatics2003;19:1945–1951. [PubMed: 14555628]
10. Hosack DA, Dennis G Jr, Sherman BT, Lane HC, Lempicki RA. Identifying biological themeswithin lists of genes with EASE. Genome Biol 2003;4:R70. [PubMed: 14519205]
11. Turner HC, Alvarez LJ, Candia OA, Bernstein AM. Characterization of serotonergic receptors inrabbit, porcine and human conjunctivae. Curr Eye Res 2003;27:205–215. [PubMed: 14562171]
12. Oen H, Cheng P, Turner HC, Alvarez LJ, Candia OA. Identification and localization of aquaporin5 in the mammalian conjunctival epithelium. Exp Eye Res 2006;83:995–998. [PubMed:16750192]
13. Turner HC, Bernstein A, Candia OA. Presence of CFTR in the conjunctival epithelium. Curr EyeRes 2002;24:182–187. [PubMed: 12221525]
14. Wolosin JM, Budak MT, Akinci MA. Ocular surface epithelial and stem cell development. Int JDev Biol 2004;48:981–991. [PubMed: 15558489]
15. Budak MT, Alpdogan OS, Zhou M, Lavker RM, Akinci MA, Wolosin JM. Ocular surface epitheliacontain ABCG2-dependent side population cells exhibiting features associated with stem cells. JCell Sci 2005;118:1715–1724. [PubMed: 15811951]
16. Sandell JH. NADPH diaphorase cells in the mammalian inner retina. J Comp Neurol1985;238:466–472. [PubMed: 4044926]
17. Sandell JH. NADPH diaphorase histochemistry in the macaque striate cortex. J Comp Neurol1986;251:388–397. [PubMed: 3771835]
18. Gomes JA, Dua HS, Rizzo LV, Nishi M, Joseph A, Donoso LA. Ocular surface epithelium inducesexpression of human mucosal lymphocyte antigen (HML-1) on peripheral blood lymphocytes. Br JOphthalmol 2004;88:280–285. [PubMed: 14736792]
19. Gomes JA, Jindal VK, Gormley PD, Dua HS. Phenotypic analysis of resident lymphoid cells in theconjunctiva and adnexal tissues of rat. Exp Eye Res 1997;64:991–997. [PubMed: 9301480]
20. Pappa A, Estey T, Manzer R, Brown D, Vasiliou V. Human aldehyde dehydrogenase 3A1(ALDH3A1): biochemical characterization and immunohistochemical localization in the cornea.Biochem J 2003;376:615–623. [PubMed: 12943535]
21. Sax CM, Salamon C, Kays WT, et al. Transketolase is a major protein in the mouse cornea. J BiolChem 1996;271:33568–33574. [PubMed: 8969223]
22. Vasiliou V, Ross D, Nebert DW. Update of the NAD(P)H:quinone oxidoreductase (NQO) genefamily. Hum Genomics 2006;2:329–335. [PubMed: 16595077]
23. Gomez-Diaz C, Rodriguez-Aguilera JC, Barroso MP, et al. Antioxidant ascorbate is stabilized byNADH-coenzyme Q10 reductase in the plasma membrane. J Bioenerg Biomembr 1997;29:251–257. [PubMed: 9298710]
24. Kurian JR, Bajad SU, Miller JL, Chin NA, Trepanier LA. NADH cytochrome b5 reductase andcytochrome b5 catalyze the microsomal reduction of xenobiotic hydroxylamines and amidoximesin humans. J Pharmacol Exp Ther 2004;311:1171–1178. [PubMed: 15302896]
25. Jaffe ER. Enzymopenic hereditary methemoglobinemia: a clinical/biochemical classification.Blood Cells 1986;12:81–90. [PubMed: 3539237]
26. Estey T, Piatigorsky J, Lassen N, Vasiliou V. ALDH3A1: a corneal crystallin with diversefunctions. Exp Eye Res 2007;84:3–12. [PubMed: 16797007]
27. Edgell CJ, BaSalamah MA, Marr HS. Testican-1: a differentially expressed proteoglycan withprotease inhibiting activities. Int Rev Cytol 2004;236:101–122. [PubMed: 15261737]
28. Hausser HJ, Decking R, Brenner RE. Testican-1, an inhibitor of pro-MMP-2 activation, isexpressed in cartilage. Osteoarthritis Cartilage 2004;12:870–877. [PubMed: 15501402]
29. Kenney MC, Chwa M, Atilano SR, et al. Increased levels of catalase and cathepsin V/L2 butdecreased TIMP-1 in keratoconus corneas: evidence that oxidative stress plays a role in thisdisorder. Invest Ophthalmol Vis Sci 2005;46:823–832. [PubMed: 15728537]
30. Faix J, Grosse R. Staying in shape with formins. Dev Cell 2006;10:693–706. [PubMed: 16740473]
Turner et al. Page 11
Invest Ophthalmol Vis Sci. Author manuscript; available in PMC 2010 July 26.
NIH
-PA Author Manuscript
NIH
-PA Author Manuscript
NIH
-PA Author Manuscript

31. Zhao GQ, Zhou X, Eberspaecher H, Solursh M, de Crombrugghe B. Cartilage homeoprotein 1, ahomeoprotein selectively expressed in chondrocytes. Proc Natl Acad Sci USA 1993;90:8633–8637. [PubMed: 7690966]
32. Scherer PE, Williams S, Fogliano M, Baldini G, Lodish HF. A novel serum protein similar to C1q,produced exclusively in adipocytes. J Biol Chem 1995;270:26746–26749. [PubMed: 7592907]
33. Mendez-Sanchez N, Chavez-Tapia NC, Zamora-Valdes D, Uribe M. Adiponectin, structure,function and pathophysiological implications in non-alcoholic fatty liver disease. Mini Rev MedChem 2006;6:651–656. [PubMed: 16787375]
34. Ogunwobi OO, Beales IL. Adiponectin stimulates proliferation and cytokine secretion in colonicepithelial cells. Regul Pept 2006;134:105–113. [PubMed: 16529829]
35. Schaerli P, Willimann K, Ebert LM, Walz A, Moser B. Cutaneous CXCL14 targets bloodprecursors to epidermal niches for Langerhans cell differentiation. Immunity 2005;23:331–342.[PubMed: 16169505]
36. van der Horst G, van der Werf SM, Farih-Sips H, van Bezooijen RL, Lowik CW, Karperien M.Downregulation of Wnt signaling by increased expression of Dickkopf-1 and -2 is a prerequisitefor late-stage osteoblast differentiation of KS483 cells. J Bone Miner Res 2005;20:1867–1877.[PubMed: 16160745]
37. Mukhopadhyay M, Gorivodsky M, Shtrom S, et al. Dkk2 plays an essential role in the corneal fateof the ocular surface epithelium. Development 2006;133:2149–2154. [PubMed: 16672341]
38. Buckland AG, Wilton DC. The antibacterial properties of secreted phospholipases A(2). BiochimBiophys Acta 2000;1488:71–82. [PubMed: 11080678]
39. Moreau JM, Girgis DO, Hume EB, Dajcs JJ, Austin MS, O’Callaghan RJ. Phospholipase A(2) inrabbit tears: a host defense against Staphylococcus aureus. Invest Ophthalmol Vis Sci2001;42:2347–2354. [PubMed: 11527949]
40. Touqui L, Wu YZ. Interaction of secreted phospholipase A2 and pulmonary surfactant and itspathophysiological relevance in acute respiratory distress syndrome. Acta Pharmacol Sin2003;24:1292–1296. [PubMed: 14653960]
41. Hori Y, Spurr-Michaud SJ, Russo CL, Argueso P, Gipson IK. Effect of retinoic acid on geneexpression in human conjunctival epithelium: secretory phospholipase A2 mediates retinoic acidinduction of MUC16. Invest Ophthalmol Vis Sci 2005;46:4050–4061. [PubMed: 16249480]
42. Berger T, Togawa A, Duncan GS, et al. Lipocalin 2-deficient mice exhibit increased sensitivity toEscherichia coli infection but not to ischemia-reperfusion injury. Proc Natl Acad Sci USA2006;103:1834–1839. [PubMed: 16446425]
43. Wong YW, Chew J, Yang H, Tan DT, Beuerman R. Expression of insulin-like growth factorbinding protein-3 in pterygium tissue. Br J Ophthalmol 2006;90:769–772. [PubMed: 16488932]
44. Xu L, Dixit MP, Chen R, et al. Effects of angiotensin II on NaPi-IIa co-transporter expression andactivity in rat renal cortex. Biochim Biophys Acta 2004;15(1667):114–121. [PubMed: 15581846]
45. Radanovic T, Wagner CA, Murer H, Biber J. Regulation of intestinal phosphate transport. I.Segmental expression and adaptation to low-P(i) diet of the type IIb Na(+)-P(i) cotransporter inmouse small intestine. Am J Physiol 2005;288:G496–G500.
46. Schrage NF, Schlossmacher B, Aschenberner W, et al. Phosphate buffer in alkali eye burns as aninducer of experimental corneal calcification. Burns 2001;27:459–464. [PubMed: 11451598]
47. Bernauer W, Thiel MA, Langenauer UM, Rentsch KM. Phosphate concentration in artificial tears.Graefes Arch Clin Exp Ophthalmol 2006;244:1010–1014. [PubMed: 16418839]
48. Hwa V, Oh Y, Rosenfeld RG. The insulin-like growth factor-binding protein (IGFBP) superfamily.Endocr Rev 1999;20:761–787. [PubMed: 10605625]
49. Kinoshita S, Adachi W, Sotozono C, et al. Characteristics of the human ocular surface epithelium.Prog Retin Eye Res 2001;20:639–673. [PubMed: 11470454]
50. Kawasaki S, Tanioka H, Yamasaki K, Yokoi N, Komuro A, Kinoshita S. Clusters of cornealepithelial cells reside ectopically in human conjunctival epithelium. Invest Ophthalmol Vis Sci2006;47:1359–1367. [PubMed: 16565369]
51. Kasper M. Patterns of cytokeratins and vimentin in guinea pig and mouse eye tissue: evidence forregional variations in intermediate filament expression in limbal epithelium. Acta Histochem1992;93:319–332. [PubMed: 1382351]
Turner et al. Page 12
Invest Ophthalmol Vis Sci. Author manuscript; available in PMC 2010 July 26.
NIH
-PA Author Manuscript
NIH
-PA Author Manuscript
NIH
-PA Author Manuscript

52. Schlotzer-Schrehardt U, Kruse FE. Identification and characterization of limbal stem cells. ExpEye Res 2005;81:247–264. [PubMed: 16051216]
Turner et al. Page 13
Invest Ophthalmol Vis Sci. Author manuscript; available in PMC 2010 July 26.
NIH
-PA Author Manuscript
NIH
-PA Author Manuscript
NIH
-PA Author Manuscript

Figure 1.Biochip profiles (Agilent, Palo Alto, CA) of total RNA isolated from Dispase-releasedcorneal and conjunctival epithelia.
Turner et al. Page 14
Invest Ophthalmol Vis Sci. Author manuscript; available in PMC 2010 July 26.
NIH
-PA Author Manuscript
NIH
-PA Author Manuscript
NIH
-PA Author Manuscript

Figure 2.Heat map for unsupervised hierarchical sample clustering of corneal and conjunctivaltranscripts with significant expression. Whole transcript sets for three conjunctival (Cnj1-3)and three corneal (Co1-3) samples were clustered by the unsupervised hierarchical samplemethod (Pearson correlation similarity measurement) to generate a sample tree (verticallines). Note that the process has correctly clustered the two cell types. The 1228 statisticallydifferent transcripts (803 for the Cnj and 425 for the Co samples) are shown as individualhorizontal color-coded lines within this sample tree, where color represents relativeexpression level in a base 10 logarithmic scale. The color code is shown in the right side bar.
Turner et al. Page 15
Invest Ophthalmol Vis Sci. Author manuscript; available in PMC 2010 July 26.
NIH
-PA Author Manuscript
NIH
-PA Author Manuscript
NIH
-PA Author Manuscript

Figure 3.Hierarchical tree of GO ontology processes significantly overrepresented in the Cnjepithelium.
Turner et al. Page 16
Invest Ophthalmol Vis Sci. Author manuscript; available in PMC 2010 July 26.
NIH
-PA Author Manuscript
NIH
-PA Author Manuscript
NIH
-PA Author Manuscript

Figure 4.Immunolocalization of sPLA2-IIA and HLA-II antigen presenting cells in freshly isolatedhuman conjunctival epithelium. Cryosections (5–8 mm thick) fixed in ice-cold methanolwere probed with anti-human sPLA2-IIA and HLA-II antibodies. (A) Low magnificationdemonstrates that the sPLA2-IIA protein predominantly labeled to immature and matureGoblet cells. (B) Higher magnification of the asterisk-marked area reveals that the sPLA2-IIA protein was distributed in both Goblet and non-Goblet cells in vesicular granulesstructures within or in proximity to the plasma membrane. In surface goblet cells undergoingdegranulation, numerous vesicle profiles were observed migrating toward the cell secretorypit, whereas vesicular density at the membrane wall appeared markedly reduced. Cellscontaining very high levels of HLA-II antigen distributed between the Cnj epithelial stratum(C). (A, C, insets) Results for the cornea.
Turner et al. Page 17
Invest Ophthalmol Vis Sci. Author manuscript; available in PMC 2010 July 26.
NIH
-PA Author Manuscript
NIH
-PA Author Manuscript
NIH
-PA Author Manuscript

Figure 5.Fontana-Mason stain of the mucocutaneous zone of human conjunctiva and immunostain forTYRP1 in the palpebral conjunctiva (inset). Note the high frequency of stained cells in thebasal layer in both cases.
Turner et al. Page 18
Invest Ophthalmol Vis Sci. Author manuscript; available in PMC 2010 July 26.
NIH
-PA Author Manuscript
NIH
-PA Author Manuscript
NIH
-PA Author Manuscript

Figure 6.Distribution of NADPH reductase activity in the conjunctival and corneal epithelium.Activity was found in the basal stratum of the corneal epithelium (A) but not in theconjunctival epithelium (B).
Turner et al. Page 19
Invest Ophthalmol Vis Sci. Author manuscript; available in PMC 2010 July 26.
NIH
-PA Author Manuscript
NIH
-PA Author Manuscript
NIH
-PA Author Manuscript

NIH
-PA Author Manuscript
NIH
-PA Author Manuscript
NIH
-PA Author Manuscript
Turner et al. Page 20
Tabl
e 1
Num
ber o
f P C
alls
and
Med
ian
and
Mea
n SI
s and
Dis
tribu
tion
of P
rese
nt (P
), M
argi
nal,
(M) a
nd A
bsen
t (A
) Cal
ls in
Eac
h of
the
Thre
e Ex
perim
ents
Tis
sue
Exp
erim
ent
Mea
nSD
12
3
P ca
lls (n
)C
onju
nctiv
a11
,593
10,3
7710
,901
10,9
5761
0
Cor
nea
10,1
2511
,101
10,6
8710
637
490
SI M
edia
n/M
ean
Con
junc
tiva
57.1
/234
61.0
/238
53.6
/244
57.2
/239
3.7/
5
Cor
nea
57.7
/242
56.7
/226
53.4
/244
55.9
/238
2.2/
10
Invest Ophthalmol Vis Sci. Author manuscript; available in PMC 2010 July 26.
NIH
-PA Author Manuscript
NIH
-PA Author Manuscript
NIH
-PA Author Manuscript
Turner et al. Page 21
Tabl
e 2
SIs f
or th
e Th
ree β-
Act
in S
eque
nce
Zone
s Rep
rese
nted
in th
e H
G U
133A
Mic
roar
ray
in th
e Tw
o Ep
ithel
ia in
the
Thre
e Ex
perim
ents
β-A
ctin
Seq
uenc
e* (b
p Se
gmen
t)
Con
junc
tival
Epi
thel
ium
Cor
neal
Epi
thel
ium
Exp
. 1E
xp. 2
Exp
. 3M
ean
Exp
. 1E
xp. 2
Exp
. 3M
ean
50–5
84 (5′ e
nd)
4911
3998
1422
3444
3420
4992
1300
3237
645–
1173
(cen
ter)
5699
5218
3656
4858
4569
7009
3302
4960
1201
–173
8 (3′ e
nd)
5014
5037
5145
5066
4331
4434
4476
4414
Rat
io 3′/5′
1.02
1.26
3.62
1.47
1.27
0.89
3.44
1.36
Ave
rage
s ± S
D52
0847
5134
0844
5693
641
0754
7830
2642
0412
29
* Gen
Ban
k A
cces
sion
X00
351.
1.
Invest Ophthalmol Vis Sci. Author manuscript; available in PMC 2010 July 26.

NIH
-PA Author Manuscript
NIH
-PA Author Manuscript
NIH
-PA Author Manuscript
Turner et al. Page 22
Table 3
Transcripts Exhibiting the Highest Expression in the Co- and Cnj-Exclusive Sets
A. CoPS/CnjA Set
Affymetrix GB Accession SI Gene Symbol
202363_at AF231124.1 1,136.5 Testican1/sparc/osteonectin SPOCK1
209365_s_at U65932.1 1,106.9 Extracellular matrix protein 1 ECM1
218980_at NM_025135.1 884.2 Formin homology 2, dcm 3 FHOD3
208789_at BC004295.1 780.6 Polymerase 1 and transcript release factor PTRF
201481_s_at NM_002862.1 544.2 Phosphorylase, glycogen; brain PYGB
213236_at AK025495.1 528.3 Sam and sh3, dmc 1 SASH1
201108_s_at BF055462 468.6 Thrombospondin 1 THBS1
201465_s_at BC002646.1 417.3 v-Jun avian sarcoma virus 17 oncogene homolog JUN
206423_at NM_021146.1 414.8 Angiopoietin-like 7 ANGPTL7
205397_x_at U76622.1 410.4 Smad, mothers against dpp, h 3 SMAD3
207114_at NM_025261.1 383.4 Lymphocyte antigen 6 complex, locus g6c LY6G6C
220291_at NM_017711.1 379.8 Glycerophosphodiester phosphodiesterase, dmc 2 GDPD2
206207_at NM_001828.3 341.7 Charot-leyden crystal protein CLC
214961_at A1818409 311.8 KIAA0774 KIAA0774
209469_at BF939489 292.7 Glycoprotein, m 6a GPM6A
203980_at NM_001442.1 286.5 Adipocyte fatty acid binding protein 4 FABP4
213652_at AU152579 286.1 Proprotein convertase subtilisin/kexin, t 5 PCSK5
216080_s_at AC004770 276.3 Fatty acid desaturase 3 FADS3
221291_at NM_025217.1 265.1 U116-binding protein 2 ULBP2
214680_at BF674712 264.0 Neurotrophic tyrosine kinase, receptor, t 2 NTRK2
216603_at AL365343.2 262.8 Carrier family 7/cationic aa transporter, m 8 SLC7A8
204726_at NM_001257.1 258.1 Cadherin 13, h-cadherin (heart) CDH13
206706_at NM_002527.2 241.3 Neurotrophin 3 NTF3
211891_s_at AB042199.1 233.1 Rho guanine nucleotide exchange factor (gef) 4 ARHGEF4
202729_s_at NM_000627.1 230.6 Latent tgf beta binding protein 1 LTBP1
B. CnjPS/CoA Set
Affymetrix GB Accession SI Gene Symbol
203649_s_at NM_000300.1 6,529.8 Phospholipase A2, group IIA (platelets, synovial) PLA2G2A
221872_at A1669229 4,089.4 Retinoic acid receptor responder (tazarotene induced) 1 RARRES1
213611_at BF726531 2,280.4 Aquaporin 5 AQP5
205009_at NM_003225.1 1,892.4 Trefoil factor 1 (estrogen-inducible sequence) TFF1
204846_at NM_000096.1 1,724.8 Ceruloplasmin (ferroxidase) CP
218990_s_at NM_005416.1 1,298.0 Small proline-rich protein 3 SPRR3
204213_at NM_002644.1 1,044.4 Polymeric immunoglobulin receptor PIGR
214063_s_at AI073407 838.5 Transferrin TF
209278_s_at L27624.1 715.9 Tissue factor pathway inhibitor 2 TFP12
212671_s_at BG397856 683.4 Major histocompatibility complex, class II, DQ alpha 1* HLA-DQA1
205044_at NM_014211.1 679.5 Gamma-aminobutyric acid (GABA) A receptor, p1 GABRP
Invest Ophthalmol Vis Sci. Author manuscript; available in PMC 2010 July 26.

NIH
-PA Author Manuscript
NIH
-PA Author Manuscript
NIH
-PA Author Manuscript
Turner et al. Page 23
A. CoPS/CnjA Set
Affymetrix GB Accession SI Gene Symbol
205338_s_at NM_001922.2 658.9 Dopachrome tautomerase (tyrp 2)† DCT
217059_at L13283.1 638.4 Mucin 7, secreted MUC7
210096_at J02871.1 634.0 Cytochrome P450, family 4, subfamily B, polypeptide 1 CYP4B1
204623_at NM_003226.1 608.7 Trefoil factor 3 (intestinal) TFF3
219630_at NM_005764.1 571.2 PDZK1 interacting protein 1 PDZK1IP1
214566_at NM_012390.1 532.8 Submaxillary gland androgen regulated protein 3 h A SMR3A
203523_at NM_002339.1 516.6 Lymphocyte-specific protein 1, isoform 1* LSP1
211656_x_at M32577.1 453.7 Major histocompatibility complex, class II, DQ beta 1* HLA-DQB1
209498_at X16354.1 449.7 Carcinoembryonic antigen-related cell adhesion, m 1 CEACAM1
206509_at NM_002652.1 428.5 Prolactin-induced protein PIP
209488_s_at D84109.1 428.2 RNA binding protein with multiple splicing RBPMS
215388_s_at X56210.1 412.5 Complement factor H -related protein 1 CFH
204897_at AA89756 407.3 Prostaglandin E receptor 4 (subtype EP4) PTGER4
221667_s_at AF133207.1 397.1 Heat shock 22kDa protein 8 HSPB8
Affymetrix, Santa Clara, CA. GB, GenBank; dmc, domain containing; m, member; h, homologue; t, type.
*Leucocyte-associated gene.
†Melanocyte-associated gene.
Invest Ophthalmol Vis Sci. Author manuscript; available in PMC 2010 July 26.

NIH
-PA Author Manuscript
NIH
-PA Author Manuscript
NIH
-PA Author Manuscript
Turner et al. Page 24
Tabl
e 4
Tran
scrip
ts D
ispl
ayin
g th
e H
ighe
st S
I×R
Tim
es S
I in
the
Co-
and
Cnj
-Pre
ferr
ed S
ets
A. C
ojPS
> 1
.5 C
oCN
J Tr
ansc
ripts
Disp
layi
ng th
e H
ighe
st Co
PS/C
nj S
I Rat
io T
imes
Co
SIs
Affy
met
rix
Acc
essi
onSI
Rat
ioSI
× R
× 1
0−3
Gen
eSy
mbo
l
2212
04_s
_at
NM
_018
058.
15,
275.
235
.518
7C
artil
age
acid
ic p
rote
in 1
CRT
AC1
2100
74_a
tA
F070
448.
16,
529.
524
.916
3C
athe
psin
L2/
VC
TSL2
2014
67_s
_at
AI0
3987
44,
366.
926
.511
6N
AD
(P)H
deh
ydro
gena
se, q
uino
ne 1
NQ
O1
2078
11_a
tN
M_0
0022
3.1
10,0
29.9
9.8
98K
erat
in 1
2 (M
eesm
ann
corn
eal d
ystro
phy)
KRT
12
2142
47_s
_at
AU
1480
572,
311.
436
.284
Dic
kkop
f hom
olog
3D
KK
3
2086
99_x
_at
BF6
9684
06,
952.
810
.774
Tran
sket
olas
e (W
erni
cke-
Kor
sako
ff sy
nd.)
TKT
2016
67_a
tN
M_0
0016
5.2
4,57
3.3
15.5
71C
onne
xin
43G
JAI
2202
67_a
tN
M_0
1901
6.1
3,34
9.7
18.7
63K
erat
in 2
4K
RT24
2035
71_s
_at
NM
_006
829.
19,
858.
84.
646
Adi
pone
ctin
/adi
pose
spec
ific
colla
gen-
like
APM
1
2180
02_s
_at
NM
_004
887.
15,
828.
27.
846
Che
mok
ine
(C-X
-C m
otif)
liga
nd 1
4C
XCL1
4
2047
77_s
_at
NM
_002
371.
23,
985.
39.
337
Mal
, T-c
ell d
iffer
entia
tion
prot
ein
MAL
2056
23_a
tN
M_0
0069
1.1
11,1
99.8
3.3
35A
ldeh
yde
dehy
drog
enas
e 3
fam
ily, m
A1
ALD
H3A
1
2197
36_a
tN
M_0
1870
0.1
782.
038
.830
Trip
artit
e m
otif-
cont
aini
ng 3
6TR
IM36
2066
42_a
tN
M_0
0194
2.1
2,23
7.5
11.1
25D
esm
ogle
in 1
DSG
1
2172
94_s
_at
U88
968.
18,
135.
63.
024
Enol
ase
1, (a
lpha
)EN
O1
2007
48_s
_at
NM
_002
032.
110
,141
.72.
424
Ferr
itin,
hea
vy p
olyp
eptid
e 1
FTH
1
2038
51_a
tN
M_0
0217
8.1
4,84
4.0
4.7
23In
sulin
-like
gro
wth
fact
or b
indi
ng p
rote
in 6
IGFB
P6
2217
95_a
tA
I346
341
986.
422
.622
Neu
rotro
phic
tyro
sine
kin
ase,
rece
ptor
, typ
e 2
NTR
K2
2116
28_x
_at
J047
55.1
10,4
58.9
2.1
22Fe
rriti
n, h
eavy
pol
ypep
tide
pseu
doge
ne 1
FTH
P1
2047
53_s
_at
A18
1071
21,
281.
217
.122
Hep
atic
leuk
emia
fact
orH
LF
2043
26_x
_at
NM
_002
450.
16,
870.
33.
222
Met
allo
thio
nein
IXM
T1X
2125
43_a
tU
8311
5.1
3,91
3.5
4.7
18A
bsen
t in
mel
anom
a 1
AIM
1
2011
62_a
tN
M_0
0155
3.1
2,59
6.0
6.6
17In
sulin
-like
gro
wth
fact
or b
indi
ng p
rote
in 7
IGFB
P7
2122
24_a
tN
M_0
0068
9.1
5,39
7.7
3.0
16A
ldeh
yde
dehy
drog
enas
e 1
fam
ily, m
A1
ALD
HIA
1
2183
09_a
tN
M_0
1858
4.1
2,59
8.2
5.8
15C
alci
um/c
alm
odul
in P
K II
inhi
bito
r 1C
AMK
2N1
2037
81_a
tN
M_0
0489
1.1
14,0
393.
3814
Mito
chon
dria
l rib
osom
al p
rote
in L
33M
RPL3
3
2030
74_a
tN
M_0
0163
0.1
13,4
572.
4613
Ann
exin
8AN
XA8
Invest Ophthalmol Vis Sci. Author manuscript; available in PMC 2010 July 26.

NIH
-PA Author Manuscript
NIH
-PA Author Manuscript
NIH
-PA Author Manuscript
Turner et al. Page 25
A. C
ojPS
> 1
.5 C
oCN
J Tr
ansc
ripts
Disp
layi
ng th
e H
ighe
st Co
PS/C
nj S
I Rat
io T
imes
Co
SIs
Affy
met
rix
Acc
essi
onSI
Rat
ioSI
× R
× 1
0−3
Gen
eSy
mbo
l
2121
85_x
_at
NM
_005
953.
113
,433
2.42
13M
etal
loth
ione
in 2
AM
T2A
2008
72_a
tN
M_0
0296
6.1
12,7
882.
6813
S100
cal
cium
-bin
d pr
otei
n A
10S1
00A1
0
2190
93_a
tN
M_0
1793
3.1
12,3
9720
.63
12H
ypot
hetic
al p
rote
in F
LJ20
701
FLJ2
0701
2115
38_s
_at
U56
725.
112
,193
13.8
512
Hea
t sho
ck p
rote
in 7
0H
SPA2
B. T
he C
njPS
> 1
.5 C
oP T
rans
crip
ts D
ispla
ying
the
Hig
hest
Cnj/C
o SI
Rat
io T
imes
Cnj
SIs
Affy
met
rix
GB
Acc
essi
onSI
Rat
ioSI
× R
× 1
0−3
Gen
eSy
mbo
l
2125
31_a
tN
M_0
0556
4.1
7,58
9.4
134.
710
22Li
poca
lin 2
(onc
ogen
e 24
p3)
LCN
2
2100
95_s
_at
M31
159.
15,
671.
610
3.9
589
Insu
lin-li
ke g
row
th fa
ctor
bin
ding
pro
tein
3IG
FBP3
2079
35_s
_at
NM
_002
274.
18,
808.
562
.555
1K
erat
in 1
3K
RT13
2030
21_a
tN
M_0
0306
4.1
7,41
5.1
53.0
393
Secr
etor
y le
ukoc
yte
prot
ease
inhi
bito
rSL
P1
2016
50_a
tN
M_0
0227
6.1
5,96
5.1
43.4
259
Ker
atin
19
KRT
19
2035
35_a
tN
M_0
0296
5.2
7,32
1.1
35.2
258
S100
cal
cium
-bin
ding
pro
tein
A9
S100
A9
2018
84_a
tN
M_0
0436
3.1
2,53
5.4
69.4
176
Car
cino
embr
yoni
c an
tigen
-rel
ated
cel
l adh
esio
n, m
5C
EAC
AM5
2116
57_a
tM
1872
8.1
3,30
8.9
52.3
173
Car
cino
embr
yoni
c an
tigen
-rel
ated
cel
l adh
esio
n, m
6C
EAC
AM6
2096
19_a
tK
0114
4.1
4,57
7.2
35.5
163
CD
74, b
inds
MH
C c
lass
II p
rote
in in
varia
nt c
hain
*C
D74
2109
82_s
_at
M60
333.
12,
738.
959
.216
2M
HC
cla
ss II
HLA
-DR
A*
HLA
-DRA
2061
99_a
tN
M_0
0689
0.1
2,55
4.3
59.1
151
Car
cino
embr
yoni
c an
tigen
-rel
ated
cel
l adh
esio
n m
7C
EAC
AM7
2043
51_a
tN
M_0
0598
0.1
2,60
7.1
55.2
144
S100
cal
cium
-bin
ding
pro
tein
PS1
00P
2029
17_s
_at
NM
_002
964.
29,
208.
714
.012
9S1
00 c
alci
um-b
indi
ng p
rote
in A
8 (c
algr
anul
in A
)S1
00A8
2093
12_x
_at
U65
585.
14,
072.
530
.212
3M
HC
cla
ss II
, DR
bet
a 4*
HLA
-DRB
4
2132
40_s
_at
X07
695.
17,
173.
010
71K
erat
in 4
KTR
4
2039
63_a
tN
M_0
0121
8.2
1,39
4.0
43.1
60C
arbo
nic
anhy
dras
e X
IIC
A12
2056
94_a
tN
M_0
0055
0.1
1,58
1.9
35.7
56Ty
rosi
nase
-rel
ated
pro
tein
1†
TYRP
1
2091
40_x
_at
L420
24.1
8,63
2.4
6.2
53M
HC
HLA
-B39
*H
LA-B
39
2041
24_a
tA
F146
796.
11,
370.
337
.752
Sodi
um d
epen
dent
pho
spha
te tr
ansp
orte
r iso
form
IIb
NaP
i-IIb
2038
92_a
tN
M_0
0610
3.1
2,18
6.1
23.4
51W
AP
four
-dis
ulfid
e co
re d
omai
n 2
WFD
C2
2135
68_a
tA
1811
298
1,11
2.7
40.0
44O
dd-s
kipp
ed re
late
d 2
(Dro
soph
ila)
OSR
2
2119
90_a
tM
2748
7.1
2,04
3.1
21.2
43M
HC
cla
ss II
DPw
3-al
pha-
1 ch
ain*
HLA
-DPA
1
Invest Ophthalmol Vis Sci. Author manuscript; available in PMC 2010 July 26.

NIH
-PA Author Manuscript
NIH
-PA Author Manuscript
NIH
-PA Author Manuscript
Turner et al. Page 26
A. C
ojPS
> 1
.5 C
oCN
J Tr
ansc
ripts
Disp
layi
ng th
e H
ighe
st Co
PS/C
nj S
I Rat
io T
imes
Co
SIs
Affy
met
rix
Acc
essi
onSI
Rat
ioSI
× R
× 1
0−3
Gen
eSy
mbo
l
2119
11_x
_at
L079
50.1
6,60
4.4
6.4
43M
HC
cla
ss I,
BH
LA-B
2144
59_x
_at
M12
679.
17,
628.
35.
441
MH
C c
lass
I, C
HLA
-C
2114
29_s
_at
AF1
1987
3.1
1,28
7.3
3140
Serp
in p
eptid
ase
inhi
bito
r (al
pha-
1 an
tipro
tein
ase)
m1
SERP
INA1
2140
22_s
_at
AA
7491
011,
892.
720
.738
Inte
rfer
on in
duce
d tra
nsm
embr
ane
prot
ein
1 (9
–27)
IFIT
M1
2136
93_s
_at
A16
1086
91,
091.
735
.138
Muc
in I,
tran
smem
bran
eM
UC
1
2043
63_a
tN
M_0
0199
3.2
2,33
2.7
15.5
36Th
rom
bopl
astin
coa
gula
tion
fact
or II
IF3
2047
34_a
tN
M_0
0227
5.1
3,42
2.0
10.0
34K
erat
in 1
5K
TR15
2023
57_s
_at
gb:N
M_0
0171
0.1
1,45
5.8
23.1
34C
ompl
emen
t fac
tor B
CFB
Aff
ymet
rix, S
anta
Cla
ra, C
A. G
B, G
enB
ank.
* Leuc
ocyt
e as
soci
ated
gen
e.
† Mel
anoc
yte
asso
ciat
ed g
ene.
Invest Ophthalmol Vis Sci. Author manuscript; available in PMC 2010 July 26.

NIH
-PA Author Manuscript
NIH
-PA Author Manuscript
NIH
-PA Author Manuscript
Turner et al. Page 27
Table 5
Biological Processes Overrepresented within the Differentially Expressed Transcripts in the Conjunctival andCorneal Epithelium
Corneal Epithelium 10−3 – 5 × 10⁻²*
Conjunctival Epithelium
10−28 – 10−5* 10−5 – 10−2*
Cell adhesion Response to biotic stimulus Response to wounding
Transition metal ion homeostasis Immune response Inflammatory response
Copper ion homeostasis Defense response Innate immune response
Epidermal differentiation Response to external stimulus Complement activation, classic pathway
Heavy metal sensitivity/resistance Antigen processing
Posttranslational membrane targeting Antigen presentation Nucleosome assembly
Blood coagulation Response to pest/pathogen/parasite Regulation of catabolism
Hemostasis Antigen processing, exogenous antigen via MHC-II Regulation of proteolysis and peptidolysis
Ectoderm development
Histogenesis Antigen presentation, exogenous antigen Monocarboxylic acid transport
Alcohol metabolism Antigen processing, endogenous antigen via MHC-I Melanin biosynthesis
Fatty acid metabolism Melanin biosynthesis from tyrosine
Proteoglycan metabolism Response to stress
Di-, tri-valent inorganic cation Humoral immune response Blood coagulation
Homeostasis Humoral defense mechanism (sensu vertebrata) Melanin metabolism
Carbohydrate biosynthesis mRNA cleavage
Secretory pathway Antigen presentation/endogenous antigen Antimicrobial humoral response
Aldehyde metabolism Complement activation Hemostasis
*EASE score range.
Invest Ophthalmol Vis Sci. Author manuscript; available in PMC 2010 July 26.

NIH
-PA Author Manuscript
NIH
-PA Author Manuscript
NIH
-PA Author Manuscript
Turner et al. Page 28
Table 6
HLA Class II Antigen Expression
Gene Cnj SI Co SI
MHC Class II
DRB1 4073 135
DRB4 3984 137
DRB1-0402 allele 3324 85
DRA 3117 69
DRB5 2793 118
DPw3-alpha-1 chain 2043 96
DPB1 1300 67
DQB/DRw6 1168 93
DMA 705 46
DQ alpha 1 683 29
DMB 462 85
DRB3 260 33
Reference
GAPDH 5487 8365
β-Actin 4456 4204
Invest Ophthalmol Vis Sci. Author manuscript; available in PMC 2010 July 26.

NIH
-PA Author Manuscript
NIH
-PA Author Manuscript
NIH
-PA Author Manuscript
Turner et al. Page 29
Tabl
e 7
Rel
ativ
e Le
vels
of M
essa
ge fo
r Con
nexi
n in
the
Cor
neal
Epi
thel
ium
as C
alcu
late
d fr
om C
t Val
ues O
btai
ned
by R
eal-T
ime
PCR
or f
rom
the
Mic
roar
ray
SIs Tar
get
Hum
an G
enom
e C
t
Rea
l-Tim
e PC
RM
icro
arra
y
Ct
ΔC2−
ΔCt
SI/S
IC×4
3SI
P St
atus
Con
nexi
n 43
25.3
626
.14
0.00
1.00
1.00
4,57
3.27
PPP
Con
nexi
n 31
.125
.99
28.6
72.
530.
170.
1253
4.53
PPP
Con
nexi
n 31
25.0
729
.08
2.94
0.13
0.09
413.
07PP
P
Con
nexi
n 36
26.5
6>4
0.00
>15.
860.
00*
83.5
7A
AA
Con
nexi
n 59
24.6
738
.96
12.8
20.
00*
55.5
0A
AA
Con
nexi
n 37
25.2
837
.26
11.1
20.
00*
34.1
0A
PA
Con
nexi
n 50
23.9
9>4
0.00
>15.
860.
00*
28.7
7A
AA
Con
nexi
n 32
26.5
239
.05
12.9
10.
00*
28.0
0A
AA
Con
nexi
n 40
25.1
738
.78
12.6
40.
00*
13.8
7A
AA
P St
atus
: pre
sent
or a
bsen
t in
expe
rimen
ts 1
, 2, a
nd 3
resp
ectiv
ely.
* Not
rele
vant
(tra
nscr
ipt i
s abs
ent).
Invest Ophthalmol Vis Sci. Author manuscript; available in PMC 2010 July 26.

NIH
-PA Author Manuscript
NIH
-PA Author Manuscript
NIH
-PA Author Manuscript
Turner et al. Page 30
Table 8
SIs and Co/Cnj Ratios for Corneal Reductases and Dehydrogenases
Gene GB Accession Co Cnj Co/Cnj
Reductases
NQO1/cytochrome b5 red./NAD(P)H menadione reductase 1 NM_000903 8053 734 11.0
Ubiquinol-cytochrome c reductase complex NM_013387 2446 1952 1.3
NADH-coenzyme Q reductase NM_004552 1501 1605 0.9
Ubiquinol-cytochrome c reductase binding protein NM_006294 1413 1542 0.9
Ubiquinol-cytochrome c reductase, Rieske polypeptide 1 BC000649 1411 1508 0.9
Ubiquinol-cytochrome c reductase core protein I NM_003365 1296 977 1.3
Ubiquinol-cytochrome c reductase hinge protein (UQCRH) NM_006004 1263 1135 1.1
Dehydrogenases
Aldehyde dehydrogenase 3A1 NM_000691 11200 3535 3.2
Glyceraldehyde-3-phosphate dehydrogenase BE561479 10874 7559 1.4
Lactate dehydrogenase A (LDHA) NM_005566 7174 4339 1.7
NADH dehydrogenase (Ubiquinone) 1, subcomplex unknown NM_002494 2188 1452 1.5
Lactate dehydrogenase B BE042354 2164 1346 1.6
NADH dehydrogenase (Ubiquinone) 1 beta subcomplex, 4 NM_004547 2042 1687 1.2
Malate dehydrogenase 1, NAD (soluble) (MDH1) NM_005917 1408 1479 1.0
GB, GenBank.
Invest Ophthalmol Vis Sci. Author manuscript; available in PMC 2010 July 26.

NIH
-PA Author Manuscript
NIH
-PA Author Manuscript
NIH
-PA Author Manuscript
Turner et al. Page 31
Table 9
Expression of DKK Isoforms
Gene GB Accession Co Cnj Co/Cnj
DKK1 NM_012242.1 17.4 18.6 0.9
DKK2 NM_014421.1 11.5 4.5 2.6
DKK3 NM_013253.1 2311.3 64.1 36.0
DKK4 NM_014420.1 71.6 100.3 0.7
Bold, significant expression. GB, GenBank.
Invest Ophthalmol Vis Sci. Author manuscript; available in PMC 2010 July 26.
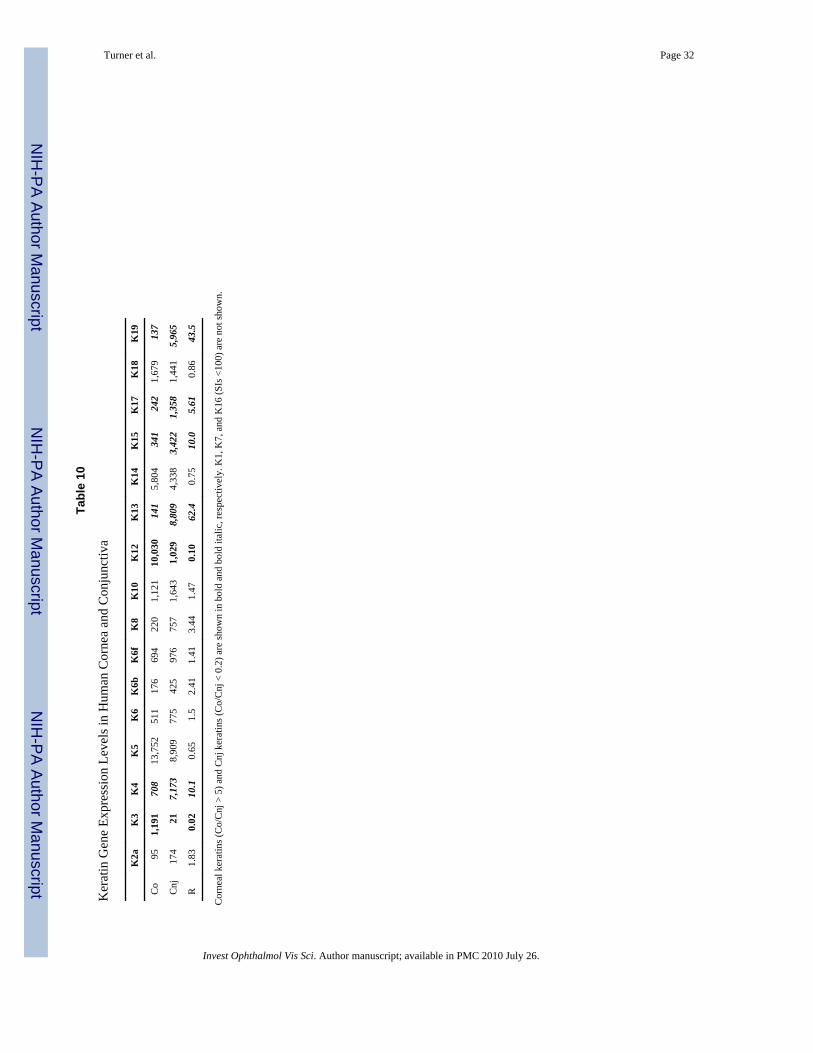
NIH
-PA Author Manuscript
NIH
-PA Author Manuscript
NIH
-PA Author Manuscript
Turner et al. Page 32
Tabl
e 10
Ker
atin
Gen
e Ex
pres
sion
Lev
els i
n H
uman
Cor
nea
and
Con
junc
tiva
K2a
K3
K4
K5
K6
K6b
K6f
K8
K10
K12
K13
K14
K15
K17
K18
K19
Co
951,
191
708
13,7
5251
117
669
422
01,
121
10,0
3014
15,
804
341
242
1,67
913
7
Cnj
174
217,
173
8,90
977
542
597
675
71,
643
1,02
98,
809
4,33
83,
422
1,35
81,
441
5,96
5
R1.
830.
0210
.10.
651.
52.
411.
413.
441.
470.
1062
.40.
7510
.05.
610.
8643
.5
Cor
neal
ker
atin
s (C
o/C
nj >
5) a
nd C
nj k
erat
ins (
Co/
Cnj
< 0
.2) a
re sh
own
in b
old
and
bold
ital
ic, r
espe
ctiv
ely.
K1,
K7,
and
K16
(SIs
<10
0) a
re n
ot sh
own.
Invest Ophthalmol Vis Sci. Author manuscript; available in PMC 2010 July 26.