
Intra-platform comparison of 25-mer and 60-mer oligonucleotide Nimblegen DNA microarrays
Upload
independentCategory
view
6download
0
Genome Biology 2003, 4:R5
com
ment
reviews
reports
deposited research
interactions
inform
ation
refereed research
ResearchAssessing unmodified 70-mer oligonucleotide probe performanceon glass-slide microarraysHong-Ying Wang*, Renae L Malek*, Anne E Kwitek†, Andrew S Greene†,Truong V Luu*, Babak Behbahani*, Bryan Frank*, John Quackenbush*and Norman H Lee*‡
Addresses: *The Institute for Genomic Research, 9712 Medical Center Drive, Rockville, MD 20850, USA. †Department of Physiology, MedicalCollege of Wisconsin, 8701 Watertown Plank Road, Milwaukee, WI 53226, USA. ‡Department of Pharmacology, The George WashingtonUniversity Medical Center, 2300 Eye Street NW, Washington, DC 20037, USA.
Correspondence: Norman H Lee. E-mail: [email protected]
Abstract
Background: Long oligonucleotide microarrays are potentially more cost- and management-efficient than cDNA microarrays, but there is little information on the relative performance ofthese two probe types. The feasibility of using unmodified oligonucleotides to accurately measurechanges in gene expression is also unclear.
Results: Unmodified sense and antisense 70-mer oligonucleotides representing 75 known ratgenes and 10 Arabidopsis control genes were synthesized, printed and UV cross-linked onto glassslides. Printed alongside were PCR-amplified cDNA clones corresponding to the same genes,enabling us to compare the two probe types simultaneously. Our study was designed to evaluatethe mRNA profiles of heart and brain, along with Arabidopsis cRNA spiked into the labelingreaction at different relative copy number. Hybridization signal intensity did not correlate withprobe type but depended on the extent of UV irradiation. To determine the effect ofoligonucleotide concentration on hybridization signal, 70-mers were serially diluted. Nosignificant change in gene-expression ratio or loss in hybridization signal was detected, even at thelowest concentration tested (6.25 �M). In many instances, signal intensity actually increased withdecreasing concentration. The correlation coefficient between oligonucleotide and cDNA probesfor identifying differentially expressed genes was 0.80, with an average coefficient of variation of13.4%. Approximately 8% of the genes showed discordant results with the two probe types, andin each case the cDNA results were more accurate, as determined by real-time PCR.
Conclusions: Microarrays of UV cross-linked unmodified oligonucleotides provided sensitiveand specific measurements for most of the genes studied.
Published: 6 January 2003
Genome Biology 2003, 4:R5
The electronic version of this article is the complete one and can befound online at http://genomebiology.com/2003/4/1/R5
Received: 14 August 2002Revised: 17 October 2002Accepted: 8 November 2002
Background The advent of microarray technology has enabled scientists
to investigate biological questions in a more global fashion.
Instead of studying genes individually, the expression of
thousands of genes can be analyzed simultaneously using
probes attached to the surface of a microscope slide [1-6].
Open Access
© 2003 Wang et al.; licensee BioMed Central Ltd. This is an Open Access article: verbatim copying and redistribution of this article are permitted in allmedia for any purpose, provided this notice is preserved along with the article's original URL.

The cDNA microarray represents a popular array type in
which double-stranded PCR products amplified from
expressed sequence tag (EST) clones are spotted onto glass
slides [7,8], allowing gene-expression profiles to be deter-
mined with high reproducibility and efficiency. However,
construction of cDNA microarrays presents a number of
challenges, largely related to costs associated with clone vali-
dation, tracking and maintenance. The laborious and prob-
lematic tracking of cDNA clones and PCR amplicons may
lead to 10-30% misidentification of clones [6]. For all practi-
cal purposes, sequence verification of array elements is an
ongoing necessity. Other limitations of cDNA microarrays
are their difficulty, because of cross-hybridization, in dis-
criminating expression patterns of homologous genes, alter-
native splice variants and antisense RNAs.
Alternatively, microarrays can be composed of short
oligonucleotides (25 bases) synthesized directly onto a solid
matrix using photolithographic technology (Affymetrix)
[2,9] or constructed from long oligonucleotides (55-70
bases) spotted onto glass slides [10-12]. To mimic the
Affymetrix design of freely moving probes tethered at one
end onto a solid support, in-house manufactured or com-
mercially available long oligonucleotides are modified by
the addition of a 5� amino group for covalent attachment
onto pre-activated glass slides [5,10]. This oligonucleotide
design strategy has been widely viewed as a prerequisite for
accurate gene-expression measurements. However, there is
no clear evidence that other covalent attachments do not
form. With oligonucleotide arrays, problems related to
clone tracking, handling of glycerol stocks and failed PCR
amplifications are avoided. The completion of numerous
microbial, plant and eukaryotic genomes, as well as exten-
sive EST data, provides sufficient sequence information to
design unique oligonucleotides capable of distinguishing
homologous genes and alternative splice variants. As
such, oligonucleotide probes have an added flexibility over
PCR amplicons.
Comprehensive studies comparing the Affymetrix approach
with cDNA arrays have only recently appeared in the litera-
ture [13,14]. Studies comparing long oligonucleotides to
cDNA arrays have not been as forthcoming. In the only
example to date, 5�-amino-modified 50-mers representing
prokaryotic genes were compared to corresponding PCR
amplicons [12]. Analysis of the hybridization signals derived
from these two probe types, while providing important
insights pertaining to sensitivity and specificity, were limited
in scope (total of eight genes) and design (interrogation was
carried out with complementary targets derived from syn-
thetic RNA as opposed to cellular RNA). A drawback to using
modified oligonucleotides is the significant cost associated
with the addition of the 5�-amino linker. An alternative strat-
egy is to utilize unmodified oligonucleotides spotted onto
glass slides, where attachment is believed to be primarily
ionic in nature [11]. However, a comparison of this approach
to standard cDNA arrays has yet to be provided. It is impera-
tive that comparisons be carried out on all probe types in
the light of conflicting reports regarding the correlation
between Affymetrix and cDNA array-based expression mea-
surements [13,14]. Whereas one study shows both
approaches correctly identifying 16 out of 17 differentially
regulated genes [13], a second study found a correlation of
r = 0.328 between matched results from the same two plat-
forms [14]. Discordant results were not resolved in the
latter study. Here we test the performance of unmodified
70-mers printed alongside PCR amplicons. Using this
unique study design, both probe types can be simultane-
ously interrogated with a complex target composed of both
cellular and synthetic RNA.
Results Optimal attachment parameters for 70-mers andPCR amplicons on the same slide The success of microarray assays requires stable binding and
retention of probes throughout the entire printing/block-
ing/hybridization/washing process. Oligonucleotides were
spotted alongside PCR amplicons onto TeleChem Super-
Amine aminated slides, and immobilized by ultraviolet (UV)
cross-linking. To determine the optimal UV cross-linking
energy required for efficient oligonucleotide immobilization,
a series of spotted arrays from the same printing session
were subjected to increasing UV energy (70, 150, 250, and
450 mJ/cm2). Deposition and retention of the probe onto
aminated slides were assessed by: staining with Vistra Green
solution and subsequent fluorescence scanning at 532 nm;
and hybridization with Cy-labeled targets derived from rat
brain and heart RNA. Using these two methods, optimal
retention of both oligonucleotide and PCR amplicon probes
was determined to occur between 250 and 450 mJ/cm2 as
described below.
Directly following probe deposition, UV cross-linking at 250
mJ/cm2 and Vistra Green staining, the measured fluores-
cence intensity from oligonucleotide probes was typically
higher than PCR amplicons (Figure 1a). The efficiency of the
oligonucleotide immobilization strategy was tested by strin-
gently washing the same slide overnight in 0.2% SDS (at
42°C, SSC absent in wash solution) to remove Vistra Green
and any loosely bound nucleic acids, restained with Vistra
Green and scanned (Figure 1b). There was essentially no
change in the average median intensity values for either the
oligonucleotide or PCR amplicon probes after incubation
with detergent (Figure 1c).
These results show that immobilization of unmodified 70-
mer oligonucleotides to SuperAmine aminated slides by
high-UV cross-linking energy is sufficient and comparable to
PCR amplicons. Clearly, our oligonucleotide immobilization
protocol should be sufficient to sustain routine microarray
hybridization and wash procedures, which are much less
R5.2 Genome Biology 2003, Volume 4, Issue 1, Article R5 Wang et al. http://genomebiology.com/2003/4/1/R5
Genome Biology 2003, 4:R5

stringent than the overnight wash at 42°C with 0.2% SDS
and no salt.
The importance of titrating UV cross-linking energy for
oligonucleotide immobilization is exemplified by a series of
spotted arrays hybridized with Cy-labeled targets derived from
rat brain and heart RNA. As seen in Figure 2, there was an
increase in the appearance of hybridized spots and signal
intensity as the energy of cross-linking was increased. At lower
cross-linking energies (for example, 70 and 150 mJ/cm2) it is
apparent that oligonucleotide probes were not sufficiently
attached to the surface of aminated slides. In contrast, PCR
amplicons are sufficiently immobilized onto the aminated
surface of glass slides at these intensities [15]. On the basis
of the hybridization experiments and in agreement with
Vistra Green staining results, optimal attachment of 70-mer
oligonucleotides occurred between 250 and 450 mJ/cm2. An
improvement in oligonucleotide retention onto aminated
slides was not seen at intensities higher than 450 mJ/cm2
(data not shown). Of interest was the finding that different
slide chemistries (that is, poly-L-lysine, aldehyde, aminosi-
lane, epoxide) had different UV cross-linking titration curves
for optimal attachment of 70-mer oligonucleotides, and
increasing the cross-linking intensity in some slide types
actually decreased apparent probe deposition (data not
shown). Even more surprising was the observation that
slides with the same or similar slide chemistry from different
vendors exhibited marked differences in the optimal UV
cross-linking energy for probe attachment.
Sensitivity of unmodified 70-mers on aminated slides Defining assay sensitivity is important as the ability to
measure gene-expression changes is desired not only for
moderate and abundant mRNAs but also for rare tran-
scripts. One method for assessing the sensitivity of microar-
ray assays is to use exogenous spiking controls. These
controls also help to identify systematic problems associated
with target labeling, slide hybridization and scanning. For
this purpose, we developed a set of 10 Arabidopsis control
cDNA plasmids. Each of the 10 plasmids was used to synthe-
size cRNA in vitro. cRNAs were quantitated and differen-
tially spiked into heart and brain RNA samples at specific
copy numbers based on the following assumptions: 360,000
mRNA transcripts per cell, 20 pg total RNA per cell and 1 pg
mRNA transcript per cell; hence, 100 ‘spike’ copies/cell
com
ment
reviews
reports
deposited research
interactions
inform
ation
refereed research
http://genomebiology.com/2003/4/1/R5 Genome Biology 2003, Volume 4, Issue 1, Article R5 Wang et al. R5.3
Genome Biology 2003, 4:R5
Figure 1Retention of unmodified rat 70-mer oligonucleotide and cDNA probesprinted on the same array. 70-mer oligonucleotides (50 �M) and PCRamplicons (100-200 nM; insert size ranged from 0.5 to 1.5 kb) wereprinted onto TeleChem SuperAmine slides and immobilized by UV cross-linking at 250 mJ/cm2. The image depicts DNA probes deposited ontoslides stained with Vistra Green nucleic acid staining solution. (a) Sectionof array after staining. (b) The same section of array after the slide wasextensively washed overnight in 0.2% SDS at room temperature,restained and scanned. (c) Average DNA fluorescence intensity of targethybridization to PCR amplicon and oligonucleotide probes before andafter the extensive wash. Signal intensities were obtained from GenePix3.0 software (Axon Instruments, CA) after scanning at 532 nm. Resultsare representative of 10 independent experiments.
Before wash
After extensive wash
PCR
Oligo
PCR
Oligo
29,4233,726After wash
31,0054,157Before washOligoPCR
Fluorescence intensity(fluorescence units)
(a)
(b)
(c)
Figure 2Effect of UV cross-linking intensity on retention of unmodified rat 70-meroligonucleotides. The 70-mer oligonucleotides (50 �M) were printedonto TeleChem SuperAmine slides that were subjected to different UVcross-linking intensities and hybridized to Cy3- and Cy5-labeled targetsderived from reverse transcribed rat heart and brain total RNA. Arepresentative array section is shown for each UV cross-linking energy.(a,d) Experiments in which brain and heart targets were labeled with Cy3and Cy5, respectively. (b,c) Flip-dye experiments in which brain andheart targets were labeled with Cy5 and Cy3, respectively. Each panel isrepresentative of three to four independent experiments.
70 mJ/cm2
150 mJ/cm2
250 mJ/cm2
450 mJ/cm2
(a)
(b)
(c)
(d)

would be equivalent to about 0.14 ng ‘spike’ transcript in
10 �g total RNA [12]. To normalize our array data, we spiked
five of the ten control cRNAs into the Cy3 and Cy5 labeling
reactions at equal copy number, ranging from 40 to 100
copies per cell. The remaining five control cRNAs were
spiked into the labeling reactions at concentrations ranging
from 1 to 300 copies per cell. We printed Arabidopsis 70-
mers and PCR amplicons across six different sectors in order
to measure intra-slide variability. Inter-slide variability was
evaluated across independent hybridizations and target
labeling. Figures 3a and b compare the intra- and inter-slide
variation of oligonucleotides to discern twofold changes in
Arabidopsis targets. Similar results were obtained for the
detection of targets spiked at threefold ratios (data not
shown). These data show that our oligonucleotide array plat-
form was able to detect two- and threefold changes in tran-
script number at a sensitivity of one to two copies per cell.
Comparing the sensitivity of oligonucleotide probes to PCR
amplicons indicates that the two probe types perform
equally well at consistently detecting twofold changes in rare
transcript levels (Figure 3c).
Arabidopsis probe elements serve as excellent negative con-
trols when exogenous cRNA is not added to the labeling
reaction. In the absence of cRNA spiking, cross-hybridiza-
tion of Cy-labeled rat targets to Arabidopsis probe elements
was negligible (data not shown).
Concordance between probe types when measuringdifferential gene expression in biological samples To compare the accuracy of unmodified oligonucleotide
arrays to conventional cDNA arrays, we hybridized slides
containing both probe types with equal amounts of Cy-
labeled target derived from rat heart and brain RNA.
Hybridization to 36 out of 38 antisense-strand oligonu-
cleotide probes was negligible to nonexistent under our incu-
bation and wash protocols (data not shown). A positive
hybridization signal (threefold above background) was
obtained for 65 of the 75 sense-strand oligonucleotide probes
interrogated with labeled target. Accordingly, each of the cor-
responding 65 PCR amplicon probes had a positive
hybridization signal (threefold above background). As the
intra-slide variation was low (average standard deviation
(SD) was around 0.07 and around 0.11 for log2-transformed
ratio values derived from PCR amplicon and 70-mer spots,
respectively), ratio values from replicate spots within a slide
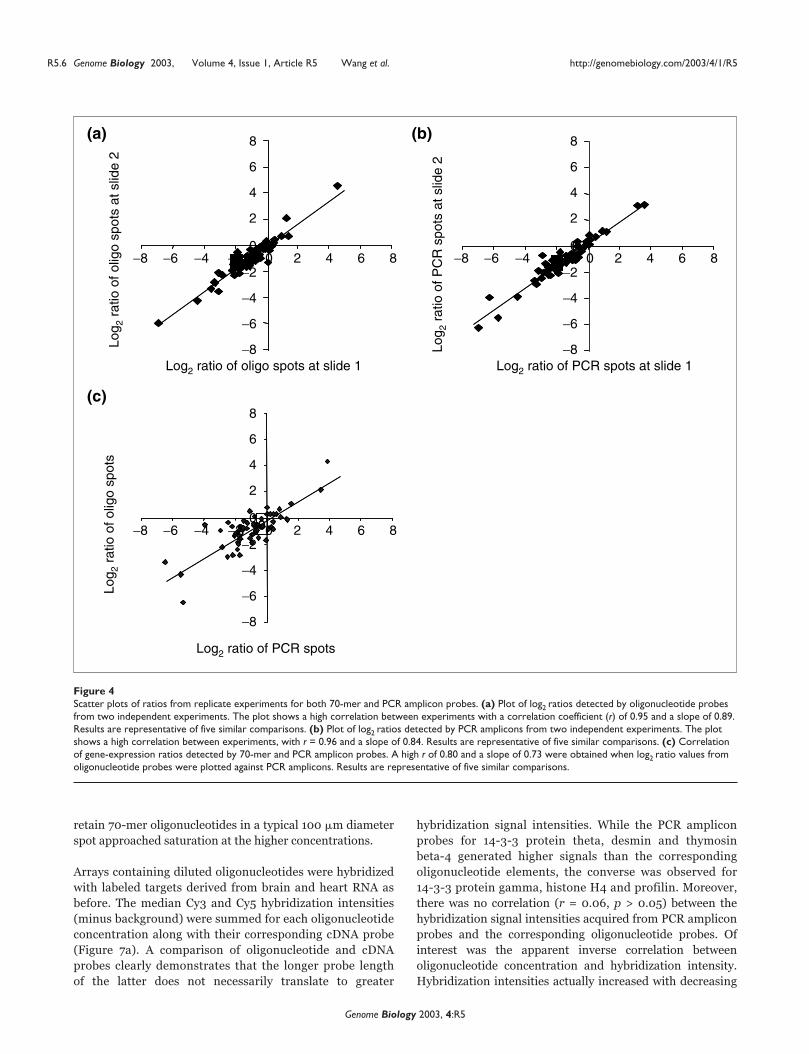
were averaged. Averaged ratios derived from independent
experiments were plotted and regression analysis was per-
formed to assess reproducibility of arrays containing oligonu-
cleotide targets (Figure 4a). A similar comparison was
performed on PCR amplicon probes (Figure 4b). Both
oligonucleotide and PCR amplicon probes showed high
reproducibility between replicate experiments (that is, differ-
ent slides hybridized with targets generated from different
batches of RNA samples) with correlation coefficients (r) of
0.95 and 0.96, respectively. Next, we compared oligonu-
cleotide-derived ratios with those obtained from PCR ampli-
con probes (Figure 4c). A correlation coefficient of r = 0.80
(p < 0.05) and a slope close to unity were obtained, indicat-
ing that unmodified oligonucleotide and PCR amplicon
probes gave comparable expression ratios. Moreover, there
was agreement in the calculated average coefficient of varia-
tion (13.4%) for the expression ratios computed from the two
probe types.
Validation of microarray results with real-time PCR Of the 65 represented genes that had a positive hybridization
signal with both the oligonucleotide and PCR amplicon
probe types, 60 were in agreement of each other (Figure 4c).
Real-time PCR was used to test the accuracy of our microar-
ray results (Figure 5a). Six genes exhibiting a range of
expression differences in heart and brain were selected for
validation. These included histone H4, which did not exhibit
differential expression in the two tissues (log2 ratio around
0); cytochrome oxidase IV, kynurenine 3-hydroxylase,
serine/threonine protein kinase and 14-3-3 protein gamma
which exhibited two- to threefold differences (log2 ratio = 1
to 1.6); and desmin which was around 32-fold differentially
expressed between the two tissues (log2 ratio approximately
5). In each case, the expression ratios derived from oligonu-
cleotide and PCR amplicon probes were in accord with real-
time PCR results.
There were five notable discrepancies between the two probe
types, as compared to the 60 that were in agreement. A dis-
crepancy was defined as a change equal to or greater than
twofold measured with one probe type and no change (or a
change in the opposite direction) measured with the other
probe type. The resolution of the discordant results for inosi-
tol-1,4,5-trisphosphate receptor, H+-ATPase, branched
aminotransferase and epoxide hydrolase is presented in
Figure 5b. In each case, real-time PCR results were in agree-
ment with the PCR amplicon-derived expression ratios.
Interestingly, each of the oligonucleotide-derived expression
ratios erroneously suggested that these genes were not dif-
ferentially expressed in heart and brain tissues.
Effect of oligonucleotide probe concentration onsignal intensity In our initial experiments, unmodified 70-mer oligonu-
cleotides were printed onto TeleChem slides at a relatively
high concentration of 50 �M. By comparison, the concentra-
tion for printing 5�-amino linker modified 50-mer oligonu-
cleotides was 20 �M [12]. To test the performance of
unmodified oligonucleotides at lower printing concentra-
tions, seven rat 70-mer oligonucleotides were serially diluted
from 50, 25, 12.5 to 6.25 �M. Each oligonucleotide was
chosen on the basis of earlier microarray results showing
that both oligonucleotide and cDNA probes could hybridize
to heart and brain targets, and that hybridization intensities
associated with the seven different gene elements varied by
at least an order in magnitude. The selected probes included
R5.4 Genome Biology 2003, Volume 4, Issue 1, Article R5 Wang et al. http://genomebiology.com/2003/4/1/R5
Genome Biology 2003, 4:R5

SCG10 and desmin, which were highly differentially
expressed in brain and heart, respectively; 14-3-3-gamma
and profilin which were expressed at around twofold higher
levels in brain and heart, respectively; and histone H4,
14-3-3-theta and thymosin beta-4, which showed no differ-
ence in expression between brain and heart. All diluted
oligonucleotides along with their corresponding undiluted
PCR amplicons (approximately 100-200 nM) were spotted
onto the array at least four times. A stained representative
section of an array printed with different starting concentra-
tions of oligonucleotides and a single concentration of the
corresponding PCR amplicons is depicted in Figure 6. As the
starting oligonucleotide concentration was decreased from
50 �M to 6.25 �M (eightfold dilution), DNA fluorescence
decreased on average twofold for the oligonucleotides (data
not shown). This suggests that the capacity of the slides to
com
ment
reviews
reports
deposited research
interactions
inform
ation
refereed research
http://genomebiology.com/2003/4/1/R5 Genome Biology 2003, Volume 4, Issue 1, Article R5 Wang et al. R5.5
Genome Biology 2003, 4:R5
Figure 3Assessment of sensitivity and reproducibility within and between slides, using the Arabidopsis controls. In vitro transcribed cRNA from a set of fiveArabidopsis gene constructs (Ra, Cab, rbcL, Ltp4 and Ltp6) was spiked at varying levels into rat heart and brain RNA (that is, 2/1 represents two copiesper cell and one copy per cell of Ra cRNA spiked into heart and brain RNA, respectively). Cy3- and Cy5-labeled targets were hybridized to rat arrayscontaining Arabidopsis 70-mer and PCR amplicon probes. (a) Intra-slide measurements. Arabidopsis cRNAs were added into the labeling reactions toassess the ability of oligonucleotide probes to discriminate twofold changes. The measured fold-change values are shown for each Arabidopsis targethybridizing to its complementary probe printed across six different sectors of an array. Values derived from a particular sector are represented by anopen triangle, open square, open circle, closed circle, closed diamond or closed square. Ra, Cab, rbcL, Ltp4 and Ltp6 cRNAs were differentially spiked at2/1, 10/5, 60/30, 100/50 and 300/150 copies per cell, respectively. Results are representative of four independent hybridizations. (b) Inter-slidemeasurements. Arabidopsis cRNAs were spiked into the labeling reactions to evaluate slide-to-slide reproducibility of oligonucleotide probes todiscriminate twofold differences. The averaged result from four independent experiments is shown. (c) Comparison of Arabidopsis oligonucleotide andPCR amplicon probes printed on the same array to discriminate twofold changes. Data shown are the mean ± SD of five independent experiments.
2/1 10/5 60/30 100/50 300/150Spiked twofold change (copies/cell)
0
1
2
3
4
2/1 10/5 60/30 100/50 300/150
Spiked fold change (copies per cell)
Mea
sure
d fo
ld c
hang
e
Mea
sure
d fo
ld c
hang
e
0
1
2
3
4
Mea
sure
d fo
ld c
hang
e
0
1
2
3
4
2/1 10/5 60/30 100/50 300/150
cDNA
Oligo
Spiked fold change (copies per cell)
(a) (b)
(c)
retain 70-mer oligonucleotides in a typical 100 �m diameter
spot approached saturation at the higher concentrations.
Arrays containing diluted oligonucleotides were hybridized
with labeled targets derived from brain and heart RNA as
before. The median Cy3 and Cy5 hybridization intensities
(minus background) were summed for each oligonucleotide
concentration along with their corresponding cDNA probe
(Figure 7a). A comparison of oligonucleotide and cDNA
probes clearly demonstrates that the longer probe length
of the latter does not necessarily translate to greater
hybridization signal intensities. While the PCR amplicon
probes for 14-3-3 protein theta, desmin and thymosin
beta-4 generated higher signals than the corresponding
oligonucleotide elements, the converse was observed for
14-3-3 protein gamma, histone H4 and profilin. Moreover,
there was no correlation (r = 0.06, p > 0.05) between the
hybridization signal intensities acquired from PCR amplicon
probes and the corresponding oligonucleotide probes. Of
interest was the apparent inverse correlation between
oligonucleotide concentration and hybridization intensity.
Hybridization intensities actually increased with decreasing
R5.6 Genome Biology 2003, Volume 4, Issue 1, Article R5 Wang et al. http://genomebiology.com/2003/4/1/R5
Genome Biology 2003, 4:R5
Figure 4Scatter plots of ratios from replicate experiments for both 70-mer and PCR amplicon probes. (a) Plot of log2 ratios detected by oligonucleotide probesfrom two independent experiments. The plot shows a high correlation between experiments with a correlation coefficient (r) of 0.95 and a slope of 0.89.Results are representative of five similar comparisons. (b) Plot of log2 ratios detected by PCR amplicons from two independent experiments. The plotshows a high correlation between experiments, with r = 0.96 and a slope of 0.84. Results are representative of five similar comparisons. (c) Correlationof gene-expression ratios detected by 70-mer and PCR amplicon probes. A high r of 0.80 and a slope of 0.73 were obtained when log2 ratio values fromoligonucleotide probes were plotted against PCR amplicons. Results are representative of five similar comparisons.
Log 2
rat
io o
f PC
R s
pots
at s
lide
2
0-2-2
Log2 ratio of oligo spots at slide 1 Log2 ratio of PCR spots at slide 1
Log 2
rat
io o
f olig
o sp
ots
at s
lide
2
-0
-2
Log2 ratio of PCR spots
Log 2
rat
io o
f olig
o sp
ots
0-2-2
-0
-2
−8 −6 −4 −2 20 4 6 8
8
6
4
2
0
−2
−4
−6
−8
−8 −6 −4 −2 20 4 6 8
8
6
4
2
0
−2
−4
−6
−8
−8 −6 −4 −2 20 4 6 8
8
6
4
2
0
−2
−4
−6
−8
(a)
(c)
(b)

oligonucleotide concentration for 14-3-3 protein gamma,
desmin, SCG10, and to a lesser extent thymosin beta-4
(Figure 7a).
For the oligonucleotides corresponding to differentially
expressed genes (for example, SCG10, desmin, 14-3-3-
gamma, profilin), the log2 ratios from four independent
hybridizations (including flip dye experiments) were aver-
aged and plotted in Figure 7b. The calculated ratios were
highly reproducible and similar across the entire concentra-
tion range tested. This suggests that an oligonucleotide con-
centration as low as 6.25 �M is sufficient for accurate
determination of relative expression differences. As the
absolute levels of these four transcripts in rat heart and
brain are not known with certainty, we repeated these exper-
iments with known concentrations of synthetic Arabidopsis
cRNA that were differentially spiked into rat heart and brain
RNA. Six Arabidopsis oligonucleotides were accordingly
diluted and printed onto aminated slides to test their ability
to discriminate twofold differences in synthetic cRNA con-
centrations ranging from 10 to 300 copies per cell. Our data
clearly show that an Arabidopsis oligonucleotide probe con-
centration as low as 6.25 �M was sufficient to accurately
determine twofold differences in cRNA species at a ratio of
20/10 copies per cell (Figure 8).
Discussion In the study reported here, we systematically compared the
performance of unmodified 70-mer oligonucleotides to tra-
ditional PCR amplicons, both probe types printed and UV
cross-linked onto glass slides coated with primary amine
groups. Direct comparisons are best accomplished when
both probes are printed alongside each other, allowing for
simultaneous interrogation with a complex target. Hence,
analysis is not confounded by uneven aminosilane coating
in different batches of slides, inconsistencies in the array
resulting from different print sessions, differences in day-
to-day label incorporation, or variations in day-to-day
com
ment
reviews
reports
deposited research
interactions
inform
ation
refereed research
http://genomebiology.com/2003/4/1/R5 Genome Biology 2003, Volume 4, Issue 1, Article R5 Wang et al. R5.7
Genome Biology 2003, 4:R5
Figure 5Real-time PCR validation of microarray results. (a) Concordance of gene-expression patterns determined by oligonucleotide and PCR ampliconmicroarrays and real-time PCR. Data shown are the mean ± SD of fourto five independent determinations. H4, histone H4; K3H, kynurenine 3-hydroxylase; 14-3-3�, 14-3-3 protein gamma Ser/Thr PK, serine/threonineprotein kinase; CO, cytochrome c oxidase. (b) Real-time PCR analysis ofdiscordant results from oligonucleotide and PCR amplicon arrays. Datashown are the mean ± SD of four to five independent determinations.IP3R, inositiol-1,4,5-trisphosphate receptor; HATP, H+-ATPase; HBCA,heart branched-chain aminotransferase; EH, cytosolic epoxide hydrolase.
Desmin
6
4
2
0
−2
−4
−6
−3
−2
−1
0
1
2
3
H4
K3H
14-3-3γ
Ser/ThrPK
Log 2
rat
io (
brai
n/he
art)
Log 2
rat
io (
brai
n/he
art)
PCROligoReal-time PCR
PCROligoReal-time PCR
CO
IP3R HATP HBCA EH
(a)
(b)
Figure 6Serial dilution of 70-mer oligonucleotides compared to PCR amplicons.The array was stained with Vistra Green dye. A representative grid ofoligonucleotides at each concentration, along with a single concentrationof the corresponding PCR amplicon (100-200 ng/�l) is shown. Results arerepresentative of three independent experiments.
Oligo 50 µM
Oligo 25 µM
Oligo 12.5 µM
Oligo 6.25 µM
PCR
SC
G10
Pro
filin
Des
min
His
tone
H4

hybridization and wash procedures. A correlation coeffi-
cient (r) of 0.80 was obtained from our analysis, indicating
that the two probe types gave comparable expression ratios.
One variable that was not controlled for in our study was
the number of cross-links per DNA molecule. Given a con-
stant UV exposure, many more cross-links per molecule of
cDNA probe are presumably formed compared to the
shorter oligonucleotide probe. It is possible that the correla-
tion coefficient was not higher as a result of the differential
reaction of the two probe types to UV irradiation.
We designed our arrays to contain 75 different probes corre-
sponding to mammalian signal transduction genes with a
wide range of expression levels. In heart versus brain com-
parisons, oligonucleotide probes, like their cDNA probe
counterparts, could reproducibly discern differences in
mRNA populations as low as twofold (namely, 14-3-3
protein gamma) and as high as around 90-fold (namely,
creatine kinase). Hence, the dynamic range of unmodified
oligonucleotides is at least two orders of magnitude in fold-
change measurements.
R5.8 Genome Biology 2003, Volume 4, Issue 1, Article R5 Wang et al. http://genomebiology.com/2003/4/1/R5
Genome Biology 2003, 4:R5
Figure 7The role of oligonucleotide concentration on microarray hybridization measurements. (a) Comparison of hybridization intensities of seven genesdetected by oligonucleotides printed at different concentrations. Corresponding PCR amplicons at 100-200 ng/�l are included for comparison. Themedium background subtracted fluorescent intensities were summed for the Cy3 and Cy5 channels for each gene and plotted. (b) Comparison of theexpression ratios of differentially expressed genes detected by oligonucleotides printed at different concentrations. Data are the mean ± SD of fourindependent experiments.
Hyb
ridiz
atio
n in
tens
ity(f
luor
esce
nt u
nit x
103
)
6.25 µM 12.5 µM 25 µM 50 µM PCR
Log 2
rat
io (
brai
n/he
art)
SCG10Desmin14-3-3γProfilin
0
5
10
6
4
2
0
−2
−4
−6
15
20
25 6 µM 12 µM 25 µM 50 µM PCR
14-3-3γ 14-3-3θ Desmin H4 Profilin SCG10 Thymosin β4
(a)
(b)

In the course of our work, we generated a resource of 10
Arabidopsis spiking control cRNAs along with their corre-
sponding 70-mer oligonucleotide and PCR amplicon probes.
As part of our quality-control procedures, all microarray
assays routinely incorporate the spiking controls. These
reagents will allow the microarray user to add specific con-
centrations of known transcripts into a complex mix of
mammalian target RNA in order to assess, for example,
hybridization kinetics, intra-slide variability, inter-slide vari-
ability, sensitivity and effectiveness of normalization algo-
rithms. On the basis of experiments with the spiking
controls, unmodified oligonucleotides can be used to detect
twofold changes in transcript number at a level of 2-20
mRNA copies per cell. It is important to note that our proto-
col for generating first-strand cDNA target involves the use
of random primers. At the outset, the Arabidopsis cRNAs
were engineered to contain a 3� poly(A) tail. Hence, alterna-
tive protocols using oligo(dT) to prime mRNA for the syn-
thesis of labeled target [15,16] can still take advantage of our
spiking control set.
In our initial assessment of cDNA and 70-mer oligonu-
cleotide probe types, the latter was printed at a concentra-
tion of 50 �M. Even at a printing concentration as low as
6 �M, oligonucleotide probes were capable of discerning
twofold expression differences in complex cellular RNA
mixtures and in synthetic spiked cRNAs. In fact, decreasing
the oligonucleotide printing concentration from 50 to 6 �M
had the effect of increasing the hybridization signal around
two- to sixfold for a number of the probes (Figure 7a). The
reason is unclear, but it is possible that high-density
packing of an oligonucleotide probe within the confines of a
small spot interferes with fluorescence emission of the
target or hybridization efficiency. Alternatively, the higher
spotting concentrations may favor cross-linking of the
oligonucleotide probes to each other following UV irradia-
tion. In either case, this phenomenon appears to be
sequence dependent as not all probes exhibited this behav-
ior. The present study also demonstrates that longer probes
are not necessarily associated with higher hybridization
signals, as the hybridization signals from half of the 70-mer
oligonucleotide probes were actually higher than or equiva-
lent to their corresponding PCR amplicons, which have an
average length of 1 kilobase (kb). Taken together, the com-
bination of unmodified oligonucleotides and low printing
concentrations has resulted in an approximately 16-fold
reduction in reagent costs. An issue not evaluated in the
present study, but one that has significant cost-saving
potential, is the effect of reducing the length of unmodified
oligonucleotides on microarray sensitivity. Clearly, this is
an area for future investigation.
Of the five discordant results found between oligonu-
cleotide and cDNA arrays, real-time PCR data validated the
accuracy of the cDNA probe type in every case (Figure 5b).
It seems likely that a failure in oligonucleotide probe design
was responsible for the discordant data. Analysis of the dis-
cordant oligonucleotide sequences (that is, inositol-1,4,5-
trisphosphate receptor, H+-ATPase, branched
aminotransferase and epoxide hydrolase) did not reveal
any obvious secondary structure that might interfere with
hybridization. Treatment of spotted arrays with UV light is
thought to induce free-radical-based coupling between
thymidine residues on the oligonucleotide and carbon
atoms on the alkyl amine groups of coated glass slides
(Todd Martinsky, TeleChem International, personal com-
munication). The T content of concordant and discordant
oligonucleotides was similar, with average values of 26%
and 29%, respectively, suggesting that UV cross-linking
was not preferentially disrupting hybridization specificity
of discordant 70-mers. Moreover, there was a lack of corre-
lation (r = 0.03, p > 0.05) between T content of the
oligonucleotides and corresponding hybridization signal
intensities. Of interest, however, was the finding that the
discordant oligonucleotides had an average GC content of
57% compared to the concordant oligonucleotide average of
50%. Accordingly, the hybridization signal associated with
the discordant oligonucleotides was around two- to three-
fold higher than the concordant oligonucleotides, suggest-
ing that ‘non-specific’ Cy-labeled targets were
cross-hybridizing with the discordant oligonucleotides.
This possibility is clearly illustrated for the H+-ATPase gene
(Figure 9). Within the H+-ATPase 70-mer sequence is a
stretch of 20 contiguous nucleotides perfectly matching a
com
ment
reviews
reports
deposited research
interactions
inform
ation
refereed research
http://genomebiology.com/2003/4/1/R5 Genome Biology 2003, Volume 4, Issue 1, Article R5 Wang et al. R5.9
Genome Biology 2003, 4:R5
Figure 8Comparison of the expression ratios of Arabidopsis genes detected by70-mer oligonucleotides at different printing concentrations. SixArabidopsis control cRNAs were spiked at varying levels correspondingto twofold differences into two labeling reactions containing rat brainand heart RNA. Another four Arabidopsis control cRNAs were spiked ata 1:1 ratio and served as normalization controls. The measured log2expression ratios from four independent experiments were plotted asthe mean ± SD. The expected twofold change was detectable for alloligonucleotides at the different printing concentrations (twofolddifference equals a log2 ratio of 1 or -1).
Log 2
rat
io
Arabidopsis oligo concentration
6.25 µM 12.5 µM 25 µM 50 µM
300/150150/7520/10
10/2075/150150/300
−2
−1
0
1
2

region in the tumor endothelial marker 8 mRNA. It has
been shown previously that 15 contiguous nucleotides are
sufficient for cross-hybridization of non-target species [12].
There are two important points to note. First, the PCR
amplicon for H+-ATPase also contains the same 20 contigu-
ous nucleotides (Figure 9). Regardless of this, this particu-
lar probe was still able to distinguish differential
expression of the H+-ATPase gene in heart and brain tissue.
We postulate that a large fraction of H+-ATPase-specfic Cy-
labeled targets (which on average should be 100-200
nucleotides long) were available for hybridization to com-
plementary sequences found on the longer PCR amplicon
probe but absent on the shorter 70-mer probe (for example,
sequences downstream of the 70-mer). Second, tumor
endothelial marker 8 mRNA was identified in mouse. The
orthologous rat mRNA has not been cloned yet, which is
reflected by the more than 2.5 million mouse EST
sequences present in dbEST, compared to only 351,827
ESTs for the rat. On the basis of BLAST searches of human
and mouse sequences, contiguous non-target sequences
could also be identified in the discordant oligonucleotides
for inositol-1,4,5-trisphosphate receptor, branched amino-
transferase and epoxide hydrolase. Hence, future oligonu-
cleotide design considerations should include an analysis of
mouse and human sequences, because of the relatively
small number of available rat sequence for expressed tran-
scripts. In addition, the synthesis of redundant probe sets
(for example, two 70-mers per gene) might be warranted to
help decrease false negatives by an order of magnitude.
The mechanism of the adherence of unmodified oligonu-
cleotides to glass slides has been addressed [11]. Attachment
involves noncovalent interactions such as electrostatic inter-
actions, where the negatively charged phosphate backbone
of the oligonucleotide is attracted to the positively charged
surface of the glass slide (for example, a surface containing
protonated alkyl amines). Whereas noncovalent interactions
appear to be the predominant mechanism for oligonu-
cleotide attachment, covalent linkage is likely to have an
important supplementary role in UV-irradiated microarrays.
This seems plausible as our stringent overnight washes in
strong detergent did not appreciably detach unmodified
oligonucleotides from the slide surface. The importance of
UV cross-linking cannot be overemphasized. Under-irradia-
tion of cDNA arrays is known to cause insufficient binding of
DNA and over-irradiation results in over-nicking of DNA
samples [17]. A further complicating factor is our finding
that oligonucleotides printed onto different slide chemistries
(or slides with similar chemistries from different vendors)
will have very different optimal UV titration curves. In our
hands, optimal UV cross-linking occurred at 450 and 70
mJ/cm2 for oligonucleotides printed onto TeleChem
SuperAmineTM and Corning GAP IITM slides, respectively.
For TeleChem slides, under-irradiation (70-150 mJ/cm2)
causes insufficient oligonucleotide attachment. For Corning
slides, over-irradiation (150-450 mJ/cm2) results in a
decrease in the hybridization signal that may reflect exces-
sive covalent attachment of oligonucleotides. As UV cross-
linking may adversely affect oligonucleotide accessibility to
R5.10 Genome Biology 2003, Volume 4, Issue 1, Article R5 Wang et al. http://genomebiology.com/2003/4/1/R5
Genome Biology 2003, 4:R5
Figure 9Specificity of 70-mer oligonucleotide probes. An oligonucleotide probe (70-mer) was designed to detect Cy-labeled H+-ATPase cDNA (target)reverse transcribed from rat heart and brain RNA. Nucleotides 1-70 of the oligonucleotide probe correspond to nucleotides 72-141 of an EST clonefor H+-ATPase (GenBank accession BM986597). This EST clone serves as the DNA template for generating the PCR amplicon probe. For orientation,the 70-mer oligonucleotide sequence is shown aligned with nucleotides 669-738 of the full-length H+-ATPase mRNA (GenBank accession D10874).Contained within the 70-mer oligonucleotide probe is a stretch of 20 contiguous nucleotides that is also found in the tumor endothelial marker 8mRNA (GenBank accession AF378762). Other than this stretch of contiguous nucleotides, there is no sequence identity between H+-ATPase andtumor endothelial marker 8.
1598
1,082
72 1411 4962 487
1 70
1 5,2202,389 2,408
5′ AAATGTGCAGTGTCCCTAGT 3′1 20
GB: D10874
Rattus norvegicus mRNA for
H+-transporting ATPase
GB: BM986597
EST clone for PCR amplicon
70-mer oligo probe
GB: AF378762
Mus musculustumor endothelial marker 8
precursor (Tem8) mRNA
Strand: plus/plus

labeled target during hybridization, we cannot discount the
possibility that alternative attachment strategies (for
example, 5�-amino-modified oligonucleotides) may provide
greater sensitivity and specificity. This issue needs to be
explored in the future.
In summary, the present study provides evidence that the
performance of unmodified 70-mer oligonucleotides is com-
parable to cDNAs printed on glass slides. Optimal condi-
tions were identified for oligonucleotide attachment and
hybridization/wash conditions, resulting in high assay sensi-
tivity and reproducibility. Our results show that unmodified
oligonucleotides can provide an accurate, reproducible and
cost-effective means to measure gene-expression profiles. Of
interest is the fact that our hybridizations were successfully
carried out on slides that simultaneously contained both
PCR amplicons and oligonucleotides. Hence, future microar-
rays can be constructed in a modular fashion, with oligonu-
cleotide-based elements being added to existing PCR
amplicons as more genomic sequence information is gath-
ered, in the absence of readily available cDNA clones. Lastly,
our findings have broader implications, suggesting that the
combination of expression measurements across different
platforms (for example, Affymetrix and cDNA arrays,
unmodified long oligonucleotides and cDNA arrays) within a
single analysis maybe feasible [18].
Materials and methods Constructing exogenous spiking cRNA controls and aPCR amplicon printing set to assess oligonucleotidesensitivity Ten Arabidopsis thaliana genes corresponding to chloro-
phyll a/b-binding protein (Cab), lipid transfer protein 4
(Ltp4), lipid transfer protein 6 (Ltp6), NAC1, ribulose-5-
phosphate kinase (PRKase), ribulose-1,5-bisphosphate car-
boxylase/oxygenase large subunit (rbcL), rubisco activase
(Ra), root cap 1 (RCP1), triosphosphate isomerase (TIM),
and papain-type cysteine endopeptidase (XCP2) were
chosen for PCR amplification on the basis of their plant-spe-
cific expression. PCR amplicons of approximately 500 base-
pairs (bp) were amplified from an Arabidopsis cDNA library
constructed from leaf tissue or genomic DNA using sense
and antisense gene-specific primers flanked by a HindIII
and SacI adaptor sites for subcloning, respectively. Primers
were synthesized by Invitrogen/Life Technologies or Operon
Technologies and purified by PAGE. Primer sequences are as
follows: 5�-CCACTGTAGATGGGCTATGC-3� and 5�-AGGG-
ATAACAATATCGCCAA-3� for Cab; 5�-TCACCCAAAAGA-
GAAGAGCA-3� and 5�-CAAAGCCATCAAGACAAACA-3� for
Ltp4; 5�-TCTTATTAGCCGTGTGCCTG-3� and 5�-CAACTAG-
CAAACCAATGCCC-3� for Ltp6; 5�-CAACATGGGAAGCTG-
TTTTG-3� and 5�-CAAGCACACGTTATTTCCCC-3� for NAC1;
5�-CGGAGAAGAAGAGGAGACCA-3� and 5�-GAGGGTCAA-
GAAGTCCAGTG-3� for PRKase; 5�-GTTCCACCTGAA-
GAAGCAGG-3� and 5�-CGCATAAATGGTTGGGAGTT-3� for
rbcL; 5�- GAGTGGAAACGCAGGAGAAG -3� and 5�- ACTC-
CAAGGCTCTCAACGAA-3� for Ra; 5�-TGGTGGACTCTCCG-
TTCTTC-3� and 5�-CGAGTTGTGACCATAAGCCA-3� for
RCP1; 5�-TCAAATCCTCGTTGACAGAC-3� and 5�-CTGTTG-
CCTCCATTGACAGA-3� for TIM; and 5�-CAAATGGCTCT-
TTCTTCACC-3� and 5�-TGGTTCTTAACTTCCGCCAC-3� for
XCP2. PCR products were digested with the restriction
enzymes HindIII and SacI, subcloned into pSP64 poly(A)
vector (Promega, Madison, WI) and sequence verified. For
printing Arabidopsis genes, inserts in pSP64poly(A) were
amplified by PCR with the SP6 (5�-ATTTAGGTGACAC-
TATAG-3�) and M13R primers. To generate cRNAs contain-
ing a 3� poly(A) tail, pSP64poly(A) constructs were
linearized with EcoRI and in vitro transcribed from the SP6
promoter using the MEGAscriptTM High Yield Transcription
Kit (Ambion, Austin, TX). The Arabidopsis cRNA set was
designed to serve as spiking controls to assess a broad range
of copy numbers (rare, moderate, abundant) and varying
expression ratios (1:3, 1:2, 1:1, 2:1, 3:1). For printing control
70-mers, oligonucleotides were synthesized on the basis of
the corresponding 500 bp of each gene in the Arabidopsis
control spiking cRNA set (Table 1). Development of our
control set of 10 Arabidopsis oligonucleotides and corre-
sponding set of PCR amplicons subcloned into pSP64poly(A)
serve as a valuable quality-control resource for cDNA/oligo
microarrays. The Arabidopsis control spiking cRNA vector
set and protocols will be made freely available to academic
investigators upon request.
Rat 70-mer oligonucleotide design To minimize cross-hybridization, oligonucleotides of 70 bases
(unmodified) were designed using the computer program,
Pick70 [19]. Oligonucleotide design considerations included
uniqueness, avoidance of internal self-annealing structures,
narrow Tm range (75-80°C) over the entire oligonucleotide
set and masking of low-complexity regions. The TIGR Rat
Gene Index containing a non-redundant set of expressed
mRNA sequences [20] was used as the ‘complete genome
source’ for selecting 70-mer oligonucleotide sequences with
Pick70. Oligonucleotides were chosen to represent ‘house-
keeping’ and signal transduction genes, while other 70-mers
were designed to detect tissue-specific transcripts from either
brain or heart (for example, those for SCG10, creatine kinase,
and desmin). The sequences of the 70-mers and correspond-
ing GenBank accession numbers of the genes are available as
an additional data file. Oligonucleotides were synthesized at a
50 nmol scale by Invitrogen/Life Technologies (Carlsbad,
CA) or Operon Technologies (Alameda, CA), and resus-
pended in sterile milliQ water to a final concentration of
100 �M. We selected individual cDNA clones from the TIGR
Rat Gene Index whose EST sequences corresponded to the
same gene from which the 70-mers were designed. Rat
cDNA clone inserts were amplified by PCR with M13F
(5�-GTTTTCCCAGTCACGACGTTG-3�) and M13R (5�-TGAG-
CGGATAACAATTTCACACAG-3�) primers [15,16]. Insert
size ranged from 0.5 to 1.5 kb.
com
ment
reviews
reports
deposited research
interactions
inform
ation
refereed research
http://genomebiology.com/2003/4/1/R5 Genome Biology 2003, Volume 4, Issue 1, Article R5 Wang et al. R5.11
Genome Biology 2003, 4:R5

Microarray fabrication Oligonucleotides (50 �M, except where indicated otherwise)
and PCR amplicons (100-200 nM) in 50% DMSO were
printed onto SuperAmine slides (TeleChem International,
Sunnyvale, CA) using an Intelligent Automation Systems
(IAS) arrayer (Cambridge, MA) with a 12-pen print head
[16]. The rat 70-mers and PCR amplicons were printed in
quadruplicate while the 10 Arabidopsis 70-mers and PCR
amplicons were spotted into six different sectors on the
slide. After printing, DNA was cross-linked to the slides by
UV irradiation with a Stratalinker UV Crosslinker (Strata-
gene, La Jolla, CA) and stored in a vacuum chamber until
use. To assess oligonucleotide retention, slides were UV
cross-linked and stained for 10 min in Vistra Green Nucleic
Acid staining solution (Amersham Pharmacia, Piscataway,
NJ) at a 1:10,000 dilution. Afterwards, slides were washed at
least five times, 1 min each, in milliQ water at room temper-
ature, centrifuged to dryness (500 rpm x 5 min), and
scanned at 535 nm using a dual laser GenePix 4000B
scanner (Axon Instruments, Foster City, CA). Subsequently,
slides were gently agitated in 0.2% SDS (no salt) overnight at
42°C, washed extensively with water, scanned to ensure that
the dye was completely removed, restained with Vistra
Green and rescanned.
Target labeling and array hybridization To generate labeled single-stranded cDNA target, 10 �g total
RNA from rat heart or brain (Clontech, Palo Alto, CA) was
reverse transcribed for 2-3 h at 42°C in the presence of 6 �g
random primers (Invitrogen/Life Technologies), 1x first-
strand synthesis buffer (Invitrogen/Life Technologies),
10 mM DTT, dNTP mix (25 mM dATP, 25 mM dCTP, 25 mM
dGTP, 15 mM dTTP, 10 mM amino allyl-dUTP), and 200
units SuperScript II reverse transcriptase (Invitrogen/Life
Technologies). RNA was hydrolyzed with 200 mM NaOH
and 100 mM EDTA for 15 min at 65°C, then neutralized with
200 mM HCl. First-strand cDNA was purified from unincor-
porated amino allyl-dUTPs on QIAquick PCR purification
columns (Qiagen, Valencia, CA) according to manufacturer’s
instructions, except that QIAquick wash buffer was replaced
with 5 mM K+ phosphate buffer (pH 8.5) containing 80%
ethanol, and cDNA was eluted with 4 mM K+ phosphate
buffer (pH 8.5). Eluted cDNA was lyophilized, resuspended
in 4.5 �l 0.1 M Na2CO3 buffer (pH 9), mixed with either Cy3
or Cy5 NHS-ester (Amersham Pharmacia), and incubated
for 1 h in the dark at room temperature. Cy3- and Cy5-
labeled cDNA targets were then purified on QIAquick PCR
purification columns, combined and concentrated by
lyophilization, and hybridized to the microarray at 42°C for
R5.12 Genome Biology 2003, Volume 4, Issue 1, Article R5 Wang et al. http://genomebiology.com/2003/4/1/R5
Genome Biology 2003, 4:R5
Table 1
Arabidopsis 70-mer oligonucleotide probes
GenBankaccession
Abbreviation Complete gene name number 70-mer sequence
RCP1 Root cap 1 protein AF168390 5�-AACAGTATCTTGCCTGGGACAACTGCTTTTGGTATTGCTGTGGCAGCTATAATCATGGCTCGAACTGGGA-3�
Cab Photosystem I chlorophyll X56062 5�-TGCTCGCTGTTCCTGGGATTTTGGTACCAGAAGCATTAGGATATGGAAACTGGGTTAAGGCTCAGGAATG-3�
A/B-binding protein
TIM Triosephosphate isomerase AF247559 5�-GAACAGCTCAAAGACCTTGGCTGCAAGTGGGTCATTCTTGGGCATTCCGAACGGAGACATGTCATCGGAG-3�
Ltp4 Lipid transfer protein 4 AF159801 5�-AGTCCATGTCTAGGCTACCTATCGAAGGGTGGGGTGGTGCCACCTCCGTGCTGTGCAGGAGTCAAAAAGT-3�
PRKase Ribulose-5-phosphate X58149 5�-CAAACCAACCGGAGATTCAACACACTCATCACTTGCGCACAAGAAACCATCGTGATCGGACkinase TAGCTGCTG-3�
Ltp6 Lipid transfer protein 6 AF159803 5�-GCCGTGTGCCTGGTTCTTGCTTTACACTGCGGTGAAGCAGCCGTGTCTTGCAACACGGTGATTGCGGATC-3�
rbcL Ribulose-1,5-bisphosphate ATU91966 5�-AGCTGCTGAATCTTCTACTGGTACATGGACAACTGTGTGGACCGATGGGCTTACCAGCCTcarboxylase/oxygenase, TGATCGTTAC-3�large subunit
Ra Rubisco activase X14212 5�-ACGCTGGTGCGGGTCGTATGGGTGGTACTACTCAGTACACTGTCAACAACCAGATGGTTAACGCAACACT-3�
XCP2 Papain-type cysteine AF191028 5�-GCTTCTTCCCACGATTACTCCATCGTTGGATACTCCCCCGAGGATTTGGAATCTCATGACendopeptidase AAACTCATAG-3�
NAC1 NAM-like protein AF198054 5�-GCCTCTGCATCGCTTCCTCCACTGATGGATCCTTACATCAACTTTGACCAAGAACCCTCTTCTTATCTCA-3�

16 h in hybridization solution containing 50% formamide, 5x
SSC, 0.1% SDS, 20 �g mouse Cot-1 DNA and 10 �g poly(dA).
Reverse dye labeling of samples was employed in separate
experiments to account for any bias in dye coupling or emis-
sion efficiency of Cy dyes. After hybridization, microarray
slides were washed by immersion into 2x SSC, 0.2% SDS for
5 min at 42°C, 0.2x SSC, 0.1% SDS for 1 min at room tem-
perature, 0.2x SSC for 1 min at room temperature, and 0.05x
SSC twice for 1 min at room temperature, dried by centrifu-
gation, and immediately scanned. Different hybridization
and wash conditions were tested (data not shown). The pro-
cedures described above have been optimized for both PCR
amplicon and oligonucleotide probes regardless of whether
the two probe types are printed together or separately. We
chose a random primer labeling scheme so that oligonu-
cleotide probe design would not be restricted to any particu-
lar region of the mRNA molecule. In contrast, oligo(dT)12-18
priming protocols [16] limit design considerations to the
3� end of the mRNA molecule.
Array image processing and data analysis Cy3 and Cy5 fluorescence on microarray slides were scanned
at 10 �m resolution using a GenePix 4000B scanner and
saved as two single TIFF images. The intensities of spots on
the two images were subsequently analyzed with GenePix
Pro 3.0 software and a dataset was output. We used the fol-
lowing criteria to flag bad or extremely weak spots from the
array dataset: spot area < 70 pixels, % saturated pixels >
50%, and sum of the median signal intensity < 1,000. Nor-
malization of the array dataset was based on total median
background subtracted intensities from the Cy3 and Cy5
channels and linear regression of the median signal intensi-
ties generated from the Arabidopsis control cRNA set spiked
into the query RNA samples at a 1:1 ratio [21]. After normal-
ization, expression ratios were calculated for each non-
flagged spot and log2 transformed.
Additional data files The sequences of the 70-mers and corresponding GenBank
accession numbers of the genes are available as an addi-
tional data file with the online version of this paper.
Acknowledgements We thank Nnenna Nwokekeh for her excellent technical assistance. Wealso thank members of the TIGR microarray team for technical assis-tance and helpful comments. This work was supported by a Programsfor Genomic Applications grant from the National Heart Lung and BloodInstitute.
References1. Harkin DP: Uncovering functionally relevant signaling path-
ways using microarray- based expression profiling. Oncologist2000, 5:501-507.
2. Lipshutz RJ, Fodor SP, Gingeras TR, Lockhart DJ: High density syn-thetic oligonucleotide arrays. Nat Genet 1999, 21:20-24.
3. Schulze A, Downward J: Navigating gene expression usingmicroarrays - a technology review. Nat Cell Biol 2001, 3:E190-E195.
4. Schena M, Heller RA, Theriault TP, Konrad K, Lachenmeier E, DavisRW: Microarrays: biotechnology’s discovery platform forfunctional genomics. Trends Biotechnol 1998, 16:301-306.
5. Southern E, Mir K, Shchepinov M: Molecular interactions onmicroarrays. Nat Genet 1999, 21:5-9.
6. Watson A, Mazumder A, Stewart M, Balasubramanian S: Technol-ogy for microarray analysis of gene expression. Curr OpinBiotechnol 1998, 9:609-614.
7. Schena M, Shalon D, Davis RW, Brown PO: Quantitative moni-toring of gene expression patterns with a complementaryDNA microarray. Science 1995, 270:467-470.
8. Harrington CA, Rosenow C, Retief J: Monitoring gene expres-sion using DNA microarrays. Curr Opin Microbiol 2000, 3:285-291.
9. Lockhart DJ, Dong H, Byrne MC, Follettie MT, Gallo MV, Chee MS,Mittmann M, Wang C, Kobayashi M, Horton H, et al.: Expressionmonitoring by hybridization to high-density oligonucleotidearrays. Nat Biotechnol 1996, 14:1675-1680.
10. Zhao X, Nampalli S, Serino, AJ, Kumar, S: Immobilization ofoligodeoxyribonucleotides with multiple anchors tomicrochips. Nucleic Acids Res 2001, 29:955-959.
11. Call DR, Chandler DP, Brockman F: Fabrication of DNAmicroarrays using unmodified oligonucleotide probes.Biotechniques 2001, 30:368-372.
12. Kane MD, Jatkoe TA, Stumpf CR, Lu J, Thomas JD, Madore SJ:Assessment of the sensitivity and specificity of oligonu-cleotide (50mer) microarrays. Nucleic Acids Res 2000, 28:4552-4557.
13. Yuen T, Wurmbach E, Pfeffer RL, Ebersole BJ, Sealfon SC: Accuracyand calibration of commercial oligonucleotide and customcDNA microarrays. Nucleic Acids Res 2002, 30:e48.
14. Kuo WP, Jenssen TK, Butte AJ, Ohno-Machado L, Kohane IS:Analysis of matched mRNA measurements from two differ-ent microarray technologies. Bioinformatics 2002, 18:405-412.
15. Guo QM, Malek RL, Kim S, Chiao C, He M, Ruffy M, Sanka K, LeeNH, Dang CV, Liu ET: Identification of c-myc responsive genesusing rat cDNA microarray. Cancer Res 2000, 60:5922-5928.
16. Hegde P, Qi R, Abernathy K, Gay C, Dharap S, Gaspard R, HughesJE, Snesrud E, Lee N, Quackenbush J: A concise guide to cDNAmicroarray analysis. Biotechniques 2000, 29:548-550.
17. Cheung VG, Morley M, Aguilar F, Massimi A, Kucherlapati R, ChildsG: Making and reading microarrays. Nat Genet 1999,21(Suppl):15-19.
18. Malek RL, Irby RB, Guo QM, Lee K, Wong S, Ruffy M, Tsai J, KwongKY, Frank B, Liu ET, et al.: Identification of Src transformationfingerprint in human colon cancer. Oncogene 2002, 21:7256-7265.
19. Pick70[http://se.osxgnu.org/pub/mirrors/sourceforge/arrayoligosel/]
20. TIGR rat gene index [http://www.tigr.org/tdb/tgi/rgi]21. Quackenbush J: Computational analysis of microarray data.
Nat Rev Genet 2001, 2:418-427.
com
ment
reviews
reports
deposited research
interactions
inform
ation
refereed research
http://genomebiology.com/2003/4/1/R5 Genome Biology 2003, Volume 4, Issue 1, Article R5 Wang et al. R5.13
Genome Biology 2003, 4:R5
Copyright © 2022 FDOKUMEN