Human and mouse oligonucleotide-based array CGH
9
Human and mouse oligonucleotide-based array CGH Paul van den IJssel, Marianne Tijssen, Suet-Feung Chin 1 , Paul Eijk, Beatriz Carvalho, Erik Hopmans, Henne Holstege 2 , Dhinoth Kumar Bangarusamy 3 , Jos Jonkers 2 , Gerrit A. Meijer, Carlos Caldas 1 and Bauke Ylstra* Department of Pathology, VU University Medical Center, Amsterdam, The Netherlands, 1 Cancer Genomics Program, Department of Oncology, University of Cambridge, Cambridge, UK, 2 Division of Molecular Biology, The Netherlands Cancer Institute, Amsterdam, The Netherlands and 3 Genome Institute of Singapore, Biomedical Sciences Institutes, Singapore Received July 19, 2005; Revised September 26, 2005; Accepted November 24, 2005 ABSTRACT Array-based comparative genomic hybridization is a high resolution method for measuring chromo- somal copy number changes. Here we present a validated protocol using in-house spotted oligonuc- leotide libraries for array comparative genomic hybridization (CGH). This oligo array CGH platform yields reproducible results and is capable of detecting single copy gains, multi-copy amplifications as well as homozygous and heterozygous deletions as small as 100 kb with high resolution. A human oligonuc- leotide library was printed on amine binding slides. Arrays were hybridized using a hybstation and analysed using BlueFuse feature extraction software, with .95% of spots passing quality control. The protocol allows as little as 300 ng of input DNA and a 90% reduction of Cot-1 DNA without compromising quality. High quality results have also been obtained with DNA from archival tissue. Finally, in addition to human oligo arrays, we have applied the protocol successfully to mouse oligo arrays. We believe that this oligo-based platform using ‘off-the-shelf’ oligo libraries provides an easy accessible alternative to BAC arrays for CGH, which is cost-effective, avail- able at high resolution and easily implemented for any sequenced organism without compromising the quality of the results. INTRODUCTION Microarray comparative genomic hybridization (CGH) is now the method of choice for the detection of DNA copy number changes, such as gains, losses, amplifications and (micro-) deletions in tumours and genetic diseases (1,2). The first whole genome microarray contained 2400 large-insert genomic clones, primarily bacterial artificial chromosomes (BACs) (3). With the total human genome covering 3000 Mb, the resolution of this array is on average close to 1 Mb, about one order of magnitude higher than that obtained with classical CGH (4). For a full coverage resolution array 30 000 BACs have been arrayed (5), increasing the resolution with another order of magnitude. However, producing such large numbers of BACs for array CGH is expensive and time-consuming and due to the large size of the BACs, the limits of BAC array CGH resolution have been reached. These problems can be over- come when oligonucleotides are used as targets in microarray experiments. Oligonucleotides allow a sheer infinite resolu- tion, great flexibility and are cost-effective (6). Moreover, oligonucleotides allow for the generation of microarrays for any organism of which the genome has been sequenced. Attempts have been undertaken to increase the resolution of BAC arrays in other ways, such as BAC-based (7) or exon- based (8) PCR-fragments, but both are laborious ways to generate targets for whole genome array CGH that cannot compete with the flexibility and versatility of oligonucleotides. Finally, oligonucleotide arrays are being used, designed and accepted for expression profiling and thus widely available. Using the same oligo array for CGH and expression profiling allows direct comparison of mRNA expression and DNA copy number ratios (9). We have published results showing proof of principle for the use of spotted 60mer oligonucleotides for high resolution microarray CGH (6). Commercially available oligonucleotide microarray platforms have also successfully been used for array CGH (10–12). The aim of the current study was to optimize and validate our protocol for in-house spotted oligo array CGH. We present results showing high resolution detection of single copy gains, amplifications and (micro-) deletions. Fluorescence in situ hybridization (FISH) has *To whom correspondence should be addressed at Microarray Core Facility, VU University Medical Center, van der Boechorststraat 7-9, 1081 BT Amsterdam, The Netherlands. Tel: +31 20 444 8299; Fax: +31 20 444 8318; Email: [email protected] Ó The Author 2005. Published by Oxford University Press. All rights reserved. The online version of this article has been published under an open access model. Users are entitled to use, reproduce, disseminate, or display the open access version of this article for non-commercial purposes provided that: the original authorship is properly and fully attributed; the Journal and Oxford University Press are attributed as the original place of publication with the correct citation details given; if an article is subsequently reproduced or disseminated not in its entirety but only in part or as a derivative work this must be clearly indicated. For commercial re-use, please contact [email protected] Nucleic Acids Research, 2005, Vol. 33, No. 22 e192 doi:10.1093/nar/gni191 Published online December 16, 2005 by guest on May 25, 2014 http://nar.oxfordjournals.org/ Downloaded from
-
Upload
independent -
Category
Documents
-
view
1 -
download
0
Transcript of Human and mouse oligonucleotide-based array CGH

Human and mouse oligonucleotide-based array CGHPaul van den IJssel, Marianne Tijssen, Suet-Feung Chin1, Paul Eijk, Beatriz Carvalho,
Erik Hopmans, Henne Holstege2, Dhinoth Kumar Bangarusamy3, Jos Jonkers2,
Gerrit A. Meijer, Carlos Caldas1 and Bauke Ylstra*
Department of Pathology, VU University Medical Center, Amsterdam, The Netherlands, 1Cancer GenomicsProgram, Department of Oncology, University of Cambridge, Cambridge, UK, 2Division of Molecular Biology,The Netherlands Cancer Institute, Amsterdam, The Netherlands and 3Genome Institute of Singapore,Biomedical Sciences Institutes, Singapore
Received July 19, 2005; Revised September 26, 2005; Accepted November 24, 2005
ABSTRACT
Array-based comparative genomic hybridization isa high resolution method for measuring chromo-somal copy number changes. Here we present avalidated protocol using in-house spotted oligonuc-leotide libraries for array comparative genomichybridization (CGH). This oligo array CGH platformyields reproducible resultsand iscapable ofdetectingsingle copy gains, multi-copy amplifications as wellas homozygous and heterozygous deletions as smallas 100 kb with high resolution. A human oligonuc-leotide library was printed on amine binding slides.Arrays were hybridized using a hybstation andanalysed using BlueFuse feature extraction software,with .95% of spots passing quality control. Theprotocol allows as little as 300 ng of input DNA anda 90% reduction of Cot-1 DNA without compromisingquality. High quality results have also been obtainedwith DNA from archival tissue. Finally, in additionto human oligo arrays, we have applied the protocolsuccessfully to mouse oligo arrays. We believe thatthis oligo-based platform using ‘off-the-shelf’ oligolibraries provides an easy accessible alternative toBAC arrays for CGH, which is cost-effective, avail-able at high resolution and easily implemented forany sequenced organism without compromising thequality of the results.
INTRODUCTION
Microarray comparative genomic hybridization (CGH) is nowthe method of choice for the detection of DNA copy numberchanges, such as gains, losses, amplifications and (micro-)
deletions in tumours and genetic diseases (1,2). The first wholegenome microarray contained 2400 large-insert genomicclones, primarily bacterial artificial chromosomes (BACs)(3). With the total human genome covering �3000 Mb, theresolution of this array is on average close to 1 Mb, about oneorder of magnitude higher than that obtained with classicalCGH (4). For a full coverage resolution array �30 000 BACshave been arrayed (5), increasing the resolution with anotherorder of magnitude. However, producing such large numbersof BACs for array CGH is expensive and time-consuming anddue to the large size of the BACs, the limits of BAC array CGHresolution have been reached. These problems can be over-come when oligonucleotides are used as targets in microarrayexperiments. Oligonucleotides allow a sheer infinite resolu-tion, great flexibility and are cost-effective (6). Moreover,oligonucleotides allow for the generation of microarrays forany organism of which the genome has been sequenced.Attempts have been undertaken to increase the resolution ofBAC arrays in other ways, such as BAC-based (7) or exon-based (8) PCR-fragments, but both are laborious ways togenerate targets for whole genome array CGH that cannotcompete with the flexibility and versatility of oligonucleotides.Finally, oligonucleotide arrays are being used, designed andaccepted for expression profiling and thus widely available.Using the same oligo array for CGH and expression profilingallows direct comparison of mRNA expression and DNA copynumber ratios (9).
We have published results showing proof of principle forthe use of spotted 60mer oligonucleotides for high resolutionmicroarray CGH (6). Commercially available oligonucleotidemicroarray platforms have also successfully been used forarray CGH (10–12). The aim of the current study was tooptimize and validate our protocol for in-house spotted oligoarray CGH. We present results showing high resolutiondetection of single copy gains, amplifications and (micro-)deletions. Fluorescence in situ hybridization (FISH) has
*To whom correspondence should be addressed at Microarray Core Facility, VU University Medical Center, van der Boechorststraat 7-9, 1081 BT Amsterdam,The Netherlands. Tel: +31 20 444 8299; Fax: +31 20 444 8318; Email: [email protected]
� The Author 2005. Published by Oxford University Press. All rights reserved.
The online version of this article has been published under an open access model. Users are entitled to use, reproduce, disseminate, or display the open accessversion of this article for non-commercial purposes provided that: the original authorship is properly and fully attributed; the Journal and Oxford University Pressare attributed as the original place of publication with the correct citation details given; if an article is subsequently reproduced or disseminated not in its entirety butonly in part or as a derivative work this must be clearly indicated. For commercial re-use, please contact [email protected]
Nucleic Acids Research, 2005, Vol. 33, No. 22 e192doi:10.1093/nar/gni191
Published online December 16, 2005 by guest on M
ay 25, 2014http://nar.oxfordjournals.org/
Dow
nloaded from

been used to validate both homozygous and heterozygousdeletions. The presented oligo array CGH protocol providesa highly sensitive and reproducible platform both for humanand mouse samples applicable to DNA isolated from bothfresh and formalin fixed paraffin embedded (FFPE) tissueas validated by BAC arrays. For laboratories that alreadyhave oligonucleotide-based expression array platforms run-ning or are planning to, we here provide protocols withwhich those platforms can easily be adapted for array CGH.
MATERIALS AND METHODS
Oligo array preparations
The Human Release 2.0 oligonucleotide library, containing60mer oligonucleotides representing 28 830 unique genesand the Mouse Release 2.0 oligonucleotide library, containing65mer oligonucleotides representing 21 587 unique genes asdesigned by Compugen (San Jose, CA, USA), were obtainedfrom Sigma-Genosys (Zwijndrecht, The Netherlands). Theoligonucleotides were dissolved at 10 mM concentration in50 mM sodium phosphate buffer pH 8.5 and single spottedonto CodeLink� slides (Amersham Biosciences), using anOmniGrid� 100 microarrayer (Genomic Solutions,Ann Arbor, MI, USA) equipped with SMP3 pins (TeleChemInternational, Sunnyvale, CA, USA). After printing slideswere processed and blocked prior to use according to themanufacturer’s protocol.
DNA isolation and labelling
Genomic DNA was isolated from blood obtained from10 males or 10 females using DNAzol (Invitrogen) accordingto the manufacturer’s protocol and was pooled for use asreference DNA. Genomic DNA from cell lines BT474(ATCC nr. HTB-20), MDA-MB-468 (ATCC nr. HTB-132),SKBR7 (obtained from Dr M. J. O’Hare, Ludwig Institute forCancer Research, London, UK), SUM159, GM01750,GM13031 and GM07408 (obtained from Coriell Institutefor Medical Research, Camden, USA) was isolated accordingto Snijders et al. (3). Genomic DNA from FFPE gastric tumourwas isolated according to Weiss et al. (13).
DNA labelling was performed essentially according toSnijders et al. (3) using the BioPrime DNA labelling system(Invitrogen). Genomic DNA (300 ng) was mixed with 20 ml of2.5· Random primer (Invitrogen) and MilliQ water to a totalvolume of 42 ml. The mixture was then incubated for 10 minat 100�C to denature the DNA, instantly cooled down onice/water and kept on ice while adding 5 ml of dNTP mixture(2 mM dATP, 0.5 mM dCTP, 2 mM dGTP, 2 mM dTTP, 10mM Tris pH 7.6, 1 mM EDTA) 2 ml of 1 mM Cy3-dCTP (testsample) or Cy5-dCTP (pooled reference sample) (PerkinElmer) and 1 ml of Klenow DNA polymerase (40 U/ml, Invit-rogen). After gently mixing the DNA was incubated for 16 h at37�C. Unincorporated label was removed before mixing testand reference samples using ProbeQuant G-50 Micro Columns(Amersham Biosciences) according to the manufacturer’s pro-tocol, by applying the sample to the top centre of the resinwhile being careful not to disturb the resin bed. The purifiedsample was stored in the dark until used on the same day or at�20�C for longer storage.
Hybridization
For preparation of the hybridization mixture of both humanand mouse samples 50 ml of Cy3-labelled test DNA, 50 ml ofCy5-labelled reference DNA and 10 mg Human Cot-1 DNA(Invitrogen) were mixed and precipitated using 0.1 vol of 3 MNaAc pH 5.2 and 2.5 vol of ice-cold absolute ethanol. Aftermixing by inversion the DNA was collected by centrifugationfor 30 min at 20 000 g and 4�C, the supernatant aspiratedand the pellet air-dried for �5–10 min. The pellet was thendissolved in 13 ml Yeast tRNA (100 mg/ml, Invitrogen) and26 ml 20% SDS taking care to prevent foam formation. Afterincubating at room temperature for 15 min 91 ml of Mastermix [14.3% (w/v) dextran sulphate (USB), 50% (v/v) form-amide (Invitrogen), 2.9· SSC pH 7.0 (Sigma)] was added andgently mixed. The hybridization solution was then incubated at73�C for 10 min to denature the DNA and subsequently at37�C for 60 min to allow the Cot-1 DNA to block repetitivesequences. Hybridization and washing were done automatic-ally using a GeneTAC/HybArray12 hybstation (GenomicSolutions/Perkin Elmer). Hybridization was done for 38 hat 37�C. Subsequently slides were washed 6 cycles (flowfor 10 s, hold for 20 s) with 50% (v/v) formamide, 2· SSC,2 cycles with phosphate-buffer [0.1 M Na2HPO4/NaH2PO4,pH 8.0, 0.1% (v/v) Igepal CA630 (Sigma)], 2 cycles with0.2· SSC (Sigma) and 2 cycles with 0.1· SSC. Slides werethen taken out of the hybstation and briefly rinsed in 0.01·SSC, dried by centrifugation for 3 min at 1000 g and scannedusing an Microarray Scanner G2505B (Agilent Technologies).
Analysis
Spot analysis and quality control were fully automated usingBlueFuse version 3.1 (BlueGnome, Cambridge, UK). Spotswere excluded when the quality flag was <1 or the Confidencevalue <0.1. Oligonucleotides from the human library weremapped to the human genome build NCBI35 and from themouse library to the mouse genome build NCBIm33 (Ensemblv31). Oligonucleotide sequences and mapping have beenmade accessible by Compugen (San Jose, CA, USA) and TheSanger Institute (Hinxton, Cambridge, UK), respectively, viawww.ensembl.org. A unique chromosomal position was iden-tified for 26 845 of the 28 830 oligonucleotides in the humanlibrary. For the mouse library, 15 140 oligonucleotides of the21 587 had a unique position. Oligonucleotides were excludedwhen they mapped to more than one position in the genomeor showed one or more mismatches with regard to the currentbuild.
Log2ratios of spots that were not excluded after qualityflagging and mapping were normalized to their mode value.Weighted moving average values were then calculated using atriangular function and a window of 250 kb as described (11)solely to display genomic profiles where indicated. Break-points, gains, losses and amplifications were detected usingthe January 2005 version of ArrayCGHsmooth (14) that usesa ratio-dependent penalty for breakpoints in order to facilitatethe detection of amplifications. Genetic Algorithm Parametersused were lambda: 3, pool size: 300, maximum numberof breakpoints initial pool: 10 and maximum number ofgenerations: 5000. The minimum difference between levelsfor the ‘Join Closest Levels’ parameter was 0.1. The ‘new ratiojoin’ levels were used to display in the figures.
e192 Nucleic Acids Research, 2005, Vol. 33, No. 22 PAGE 2 OF 9
by guest on May 25, 2014
http://nar.oxfordjournals.org/D
ownloaded from

Fluorescence in situ hybridization
FISH was performed using BAC clones identified for thedeleted region of interest i.e. the RB1 gene was identifiedfrom Ensembl to be contained within the RP11-305D15BAC clone while the deleted region of 12q24 is representedby three BACs RP11-340F14, RP11-44F24 and RP11-7M8.The BAC DNA was isolated by the alkaline-lysis method andlabelled with biotin-16-dUTP (Roche Biochemicals, UK)using nick translation (Vysis, UK). The labelled BAC wasprecipitated together with a whole chromosome 13 paintlabelled with Spectrum Orange (Abbott Diagnostics, UK) inthe presence of unlabelled Human Cot-1 DNA. The precipit-ated DNA was resuspended in hybridization buffer (50%formamide/10% dextran sulphate/2· SSC).
Metaphase preparations from MDA-MB-468 were obtainedusing standard potassium chloride/Carnoy’s fixative protocolsand stored at �20�C or from peripheral blood lymphocytesof normal individuals for reference. Slides were denatured in70% formamide/2· SSC at 72�C for 1 min and immersed intoice-cold ethanol series (70, 90 and 100%) for 3 min each. Atotal of 15 ml of probes were denatured at 72�C for 10 min,allowed to pre-anneal at 37�C for 30 min and applied ontoslides for a 72 h hybridization. Bound probes were detectedwith streptavidin-FITC (Vector Labs, UK) and counterstainedwith DAPI in a mounting medium (Vectashield, Vector Labs,UK). Slides were examined under a Zeiss Axioplan 2 epifluor-escence microscope equipped with single band pass emissionfilters. Digital images were taken using a Hamamatsu ORCA IIcamera (Hamamatsu, Japan) operated via the SmartCaptureSoftware (Digital Scientific, UK).
Human and mouse BAC arrays
As control experiments both human and mouse BAC arrayshave been used. BACs for the 5 K human array were collectedand amplified as described (6) and spotted in triplicate usingan OmniGrid� 100 microarrayer (Genomic Solutions, AnnArbor, MI, USA) equipped with SMP3 pins (TeleChemInternational, Sunnyvale, CA, USA). After printing slideswere processed and blocked prior to use according to themanufacturer’s protocol, hybridized as described (6) andscanned using a Microarray Scanner G2505B (Agilent Tech-nologies). Results were analysed as described earlier for oligoarrays with the addition that triplicates from the human BACarrays were fused by BlueFuse in a weighted fashion. Thehuman BAC clones were mapped to the human genomebuild NCB134. Production, DNA isolation, DNA labelling,hybridization, scanning and analysis of 1 Mb mouse BACarrays were done completely according to Chung et al.(15). The lambda parameter setting for BAC in ArrayCGHs-mooth (14) was set to 1.5.
RESULTS
Performance, sensitivity and reproducibility
We have optimized the quality of our in-house oligo arrayCGH platform (6) using enhanced, automated hybridizationconditions and a newly designed extended oligonucleotidelibrary. In addition, we have used BlueFuse feature extractionsoftware enabling fully automated spot analysis. Using thesenew measures two major goals were achieved owing to the
optimized protocol. First, a significant reduction in the amountof background signal was obtained, resulting in a substantialdecrease in the number of flagged spots. Second, the variationas defined by the SD in areas without detected copy numberchanges was considerably reduced. Simultaneously, we havecut the total hybridization costs by removing the prehy-bridization and reducing the amount of Cot-1 DNA by 90%without compromising quality.
The capability of the current oligo platform to detect andmap chromosomal aberrations is demonstrated by a hybrid-ization of DNA from the breast tumour cell line BT474 withnormal male human reference DNA (Figure 1A). In anotherexperiment we hybridized DNA from an individual normalfemale sample with DNA from a pool of normal malesamples (Figure 1B). The genome-wide profiles from theseexperiments are displayed with a weighted moving averageof 250 kb to facilitate visual interpretation. The BT474profile shows many well-defined gains, losses and ampli-fications as calculated by the smoothing algorithm (14) andthe female–male profile shows a straight line with only theX-chromosome gain and Y-chromosome loss, confirmingthe sex mismatch. With 25 388 (BT474) or 25 030 (female–male) uniquely mapped oligonucleotides that passedquality control, from a total of 26 845 oligonucleotides,>93% of spots were used for calculations resulting in a res-olution of �100 kb on average. Reproducibility of these resultsis demonstrated by three additional technical repeats of theBT474 and seven additional biological repeats of female–male hybridizations. Statistics for these and all otherarray experiments described are provided in SupplementaryTable 1.
Variation between consecutive oligonucleotides in an areawithout chromosomal aberrations is an accumulative con-sequence of technical noise and biological variation, whichis the copy number variations across individuals (16), in thiscase BT474 and the pooled reference. Snijders et al. (3) makethe same distinction for BAC arrays. Technical noise here isdefined as the SD of a particular oligonucleotide across a seriesof experiments, further referred to as intra-oligonucleotidevariation. Individual copy number variations cannot be meas-ured independently, but are part of the inter-oligonucleotidenoise, defined as the SD within one array and chromosomalarea without copy number changes. To estimate the inter-oligonucleotide variation in the BT474 profile we measuredthe SD of the log2ratio on chromosome 2 where no chromo-somal copy number changes are observed. This SD is 0.25when calculated on the raw data and 0.13 when a weightedmoving average with a window of 250 kb is applied. Bycomparison, the SD on the log2ratios in chromosome 2 inthe BT474 BAC profile from Snijders et al. (3) (hybridization4001024) is 0.17. In order to visualize the actual variation andresolution detailed views of chromosome 17 from both experi-ments without moving average are shown in Figure 1C(BT474) and D (female–male). The amplifications are well-defined and the results suggests a fifth amplification at 17q24.1(Figure 1C, arrow) that has not been observed in a 1 Mb BACarray (3).
The performance of the current oligo array CGH platform asdefined by the capability to detect single copy number differ-ences, was assessed by a hybridization of DNA from the malecell line GM01750 with two validated single copy gains on
PAGE 3 OF 9 Nucleic Acids Research, 2005, Vol. 33, No. 22 e192
by guest on May 25, 2014
http://nar.oxfordjournals.org/D
ownloaded from

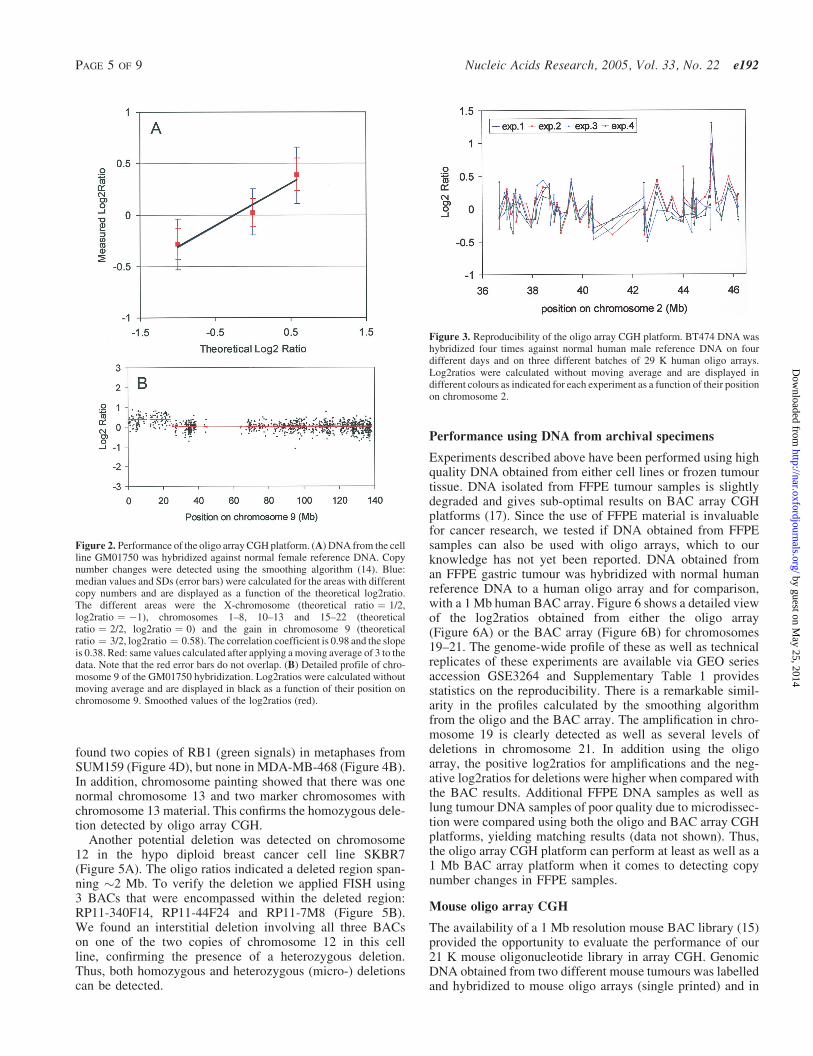
chromosomes 9 and 14, respectively (3), and a pool of normalfemale reference DNA. Median and SD of the log2ratio fromthe chromosome 9 single copy gain (ratio ¼ 3/2) and doublecopy X-chromosome variations (ratio ¼ 1/2) are displayedagainst the theoretical ratios (Figure 2A). The correlationcoefficient is 0.98 and the slope is 0.38. Ideally, measuredratios would be the same as theoretical ratios (slope is 1)(1), but alike results with BAC arrays (1) this is not thecase. The overlap between the SDs (Figure 2A, blue errorbars) indicate that the result of a single oligonucleotide isstatistically non-informative to call a single copy numberchange. If a moving average of 3 is applied to the data(Figure 2A, red error bars), SDs no longer overlap. Thus,three consecutive oligonucleotides are sufficient to call a sin-gle copy number change. The single copy gain on chromo-some 9 shown in Figure 2B indeed demonstrates that theoligo array CGH platform is powerful for effective break-point detection. Similar results were obtained with twomore validated cell lines, GM13031 and GM07408 (Supple-mentary Table 1).
Variation due to intra-oligonucleotide noise was evaluatedby analysing four hybridizations using one batch of BT474DNA with normal male human reference DNA. Hybridiza-tions were done independently on four different days and onthree different print batches of the 29 K human oligo arrays. A
detailed view of part of chromosome 2 from all four hybrid-izations shows the resemblance between the profiles from eachhybridization (Figure 3). The average of the SDs calculatedper oligo (technical noise) from the four experiments is0.14, whereas for BAC arrays a value of 0.08 was obtained(3). Thus, this experiment shows that variation between thelog2ratios obtained from different oligonucleotides within oneexperiment is reproducible, as shown by the low technicalnoise value (intra-oligonucleotide noise).
Detection of deletions
The most difficult events to show by array CGH are chro-mosomal deletions (9). The signal in the test channel isvery low, thus can only be accurately measured if backgroundis minimal. Here we show that our current oligo array CGHplatform is able to detect both heterozygous and homozygousdeletions with high resolution. A potential homozygous dele-tion was revealed on chromosome 13 in the breast cancer cellline MDA-MB-468 (Figure 4A). The deletion spanned �100kb from position 47 883 to 47 977 kb which falls within13q14.2 encompassing retinoblastoma 1 (RB1) and was notdetected in another cell line, illustrated by SUM159(Figure 4C). To verify the deletion, we applied FISH usinga probe for RB1 combined with chromosome 13 paint. We
Figure 1. Capability of the oligo array CGH platform to detect and map chromosomal aberrations. Genome-wide profiles are shown that were obtained fromhybridization of BT474 DNA (A) with human male reference DNA or (B) normal male with normal female DNA on a 29 K human oligonucleotide array. Log2ratioswere calculated with a weighted moving average as described (11) using a window of 250 kb and are displayed as a function of their position in the genome. Log2ratiosof the odd and even chromosomes are shown in aqua blue and black, respectively. Chromosome numbers are indicated. Smoothed values of the log2ratios werecalculated using a dedicated smoothing algorithm (14) (red). Note the many breakpoints, gains, losses and amplifications in the BT474 profile and the lack of those inthe male–female profile. Detailed profiles of chromosome 17 for the BT474 (C) and male–female (D) hybridizations. Log2ratios were calculated without movingaverage and are displayed in black as a function of their position on chromosome 17. Smoothed values of the log2ratios (red). The arrow in C indicates a fifthamplification in the BT474 profile on chromosome 17 that was not observed in a 1 Mb BAC array (3).
e192 Nucleic Acids Research, 2005, Vol. 33, No. 22 PAGE 4 OF 9
by guest on May 25, 2014
http://nar.oxfordjournals.org/D
ownloaded from
found two copies of RB1 (green signals) in metaphases fromSUM159 (Figure 4D), but none in MDA-MB-468 (Figure 4B).In addition, chromosome painting showed that there was onenormal chromosome 13 and two marker chromosomes withchromosome 13 material. This confirms the homozygous dele-tion detected by oligo array CGH.
Another potential deletion was detected on chromosome12 in the hypo diploid breast cancer cell line SKBR7(Figure 5A). The oligo ratios indicated a deleted region span-ning �2 Mb. To verify the deletion we applied FISH using3 BACs that were encompassed within the deleted region:RP11-340F14, RP11-44F24 and RP11-7M8 (Figure 5B).We found an interstitial deletion involving all three BACson one of the two copies of chromosome 12 in this cellline, confirming the presence of a heterozygous deletion.Thus, both homozygous and heterozygous (micro-) deletionscan be detected.
Performance using DNA from archival specimens
Experiments described above have been performed using highquality DNA obtained from either cell lines or frozen tumourtissue. DNA isolated from FFPE tumour samples is slightlydegraded and gives sub-optimal results on BAC array CGHplatforms (17). Since the use of FFPE material is invaluablefor cancer research, we tested if DNA obtained from FFPEsamples can also be used with oligo arrays, which to ourknowledge has not yet been reported. DNA obtained froman FFPE gastric tumour was hybridized with normal humanreference DNA to a human oligo array and for comparison,with a 1 Mb human BAC array. Figure 6 shows a detailed viewof the log2ratios obtained from either the oligo array(Figure 6A) or the BAC array (Figure 6B) for chromosomes19–21. The genome-wide profile of these as well as technicalreplicates of these experiments are available via GEO seriesaccession GSE3264 and Supplementary Table 1 providesstatistics on the reproducibility. There is a remarkable simil-arity in the profiles calculated by the smoothing algorithmfrom the oligo and the BAC array. The amplification in chro-mosome 19 is clearly detected as well as several levels ofdeletions in chromosome 21. In addition using the oligoarray, the positive log2ratios for amplifications and the neg-ative log2ratios for deletions were higher when compared withthe BAC results. Additional FFPE DNA samples as well aslung tumour DNA samples of poor quality due to microdissec-tion were compared using both the oligo and BAC array CGHplatforms, yielding matching results (data not shown). Thus,the oligo array CGH platform can perform at least as well as a1 Mb BAC array platform when it comes to detecting copynumber changes in FFPE samples.
Mouse oligo array CGH
The availability of a 1 Mb resolution mouse BAC library (15)provided the opportunity to evaluate the performance of our21 K mouse oligonucleotide library in array CGH. GenomicDNA obtained from two different mouse tumours was labelledand hybridized to mouse oligo arrays (single printed) and in
Figure 2. Performance of the oligo array CGH platform. (A) DNA from the cellline GM01750 was hybridized against normal female reference DNA. Copynumber changes were detected using the smoothing algorithm (14). Blue:median values and SDs (error bars) were calculated for the areas with differentcopy numbers and are displayed as a function of the theoretical log2ratio.The different areas were the X-chromosome (theoretical ratio ¼ 1/2,log2ratio ¼ �1), chromosomes 1–8, 10–13 and 15–22 (theoreticalratio ¼ 2/2, log2ratio ¼ 0) and the gain in chromosome 9 (theoreticalratio ¼ 3/2, log2ratio ¼ 0.58). The correlation coefficient is 0.98 and the slopeis 0.38. Red: same values calculated after applying a moving average of 3 to thedata. Note that the red error bars do not overlap. (B) Detailed profile of chro-mosome 9 of the GM01750 hybridization. Log2ratios were calculated withoutmoving average and are displayed in black as a function of their position onchromosome 9. Smoothed values of the log2ratios (red).
Figure 3. Reproducibility of the oligo array CGH platform. BT474 DNA washybridized four times against normal human male reference DNA on fourdifferent days and on three different batches of 29 K human oligo arrays.Log2ratios were calculated without moving average and are displayed indifferent colours as indicated for each experiment as a function of their positionon chromosome 2.
PAGE 5 OF 9 Nucleic Acids Research, 2005, Vol. 33, No. 22 e192
by guest on May 25, 2014
http://nar.oxfordjournals.org/D
ownloaded from

fluor-reversed experiments to the mouse BAC arrays (printedin duplicate) (GEO accession GSE3264). Genomic profilesobtained from one of these tumours are shown (Figure 7).All profiles show a striking degree of similarity, despite dif-ferences in noise and number of probes. For instance, inFigure 7 chromosome 1 shows two distinct deletions in bothprofiles and the amplifications as well as the deletion on chro-mosome 10 completely match. In some cases the smoothedpattern is not exactly the same in both profiles (i.e. chromo-some 7), but usually is more refined in the oligo profile, mostlikely due to the larger number of data points. As observed forthe human oligo and BAC arrays in Figure 6 also the positivelog2ratios for amplifications and the negative log2ratios fordeletions were higher for the mouse oligo arrays comparedwith the mouse BAC array results. These data show that theoligo array CGH protocol can successfully be applied tomouse oligo libraries in order to assess copy number changesin mouse samples.
DISCUSSION
In this paper we show that the current, optimized protocol foroligo array CGH results in high resolution, reproducible dataproviding a high quality, cost-effective platform for the detec-tion of chromosomal aberrations in samples from varioussources. As our results show, the oligo array CGH platformcan detect amplifications (Figure 1), deletions as small as100 kb (Figure 4), as well as single copy gains (Figure 2)and losses (Figure 5) in single hybridization experiments.When compared with results obtained with a 1 Mb BACarray, the resolution is at least as good and at times
Figure 4. Detection of a homozygous deletion by the oligo array CGH platform. DNA from the cell lines MDA-MB-468 (A) and SUM159 (C) was hybridized withnormal male reference DNA on a human oligo array. Log2ratios were calculated without moving average and are displayed in black as a function of their position onchromosome 13. The smoothed values of the log2ratios are displayed in red and the position of the RB1 oligo is indicated by the green circle in A and the arrow in C.Note the lack of the deletion in SUM159. Validation of the HD by FISH analysis in cell lines: MDA-MB-468 (B) and SUM159 (D). The green signal from the RB1probe clearly shows the presence of RB1 in SUM159 (D), but is absent from MDA-MB-468 (B). Chromosome 13 paint (red) shows the presence of three normalcopies of chromosome 13 and two marker chromosomes with chromosome 13 material.
Figure 5. Detection of a heterozygous deletion by the oligo array CGH plat-form. (A) DNA from the cell line SKBR7 was hybridized with normal malereference DNA on a human oligo array. Log2ratios were calculated withoutmoving average and are displayed in black as a function of their position onchromosome 12. The smoothed values of the log2ratios are displayed in red. (B)Validation of the heterozygous deletion on 12q24 by FISH analysis of cell lineSKBR7. Chromosome 12 paint (dark blue) shows two copies of seeminglynormal chromosome 12. FISH using 3 BACs, RP11-340F14 (red), RP11-44F24(green) and RP11-7M8 (aqua blue) confirmed the interstitial deletion on onecopy of chromosome 12 (arrow). Overlapping FISH signals from differentBACs show up in white.
e192 Nucleic Acids Research, 2005, Vol. 33, No. 22 PAGE 6 OF 9
by guest on May 25, 2014
http://nar.oxfordjournals.org/D
ownloaded from

considerably better, providing a more refined genomic profile.Furthermore, we demonstrate that good quality results can beobtained with this platform using archival DNA. Finally,labelling DNA from a mouse tumour sample and hybridizingit to the mouse oligo array (Figure 7) showed how easy it wasto apply the oligo array CGH platform to a new species.
Optimized hybridization conditions resulted in bettersignal-to-background ratios. As a result, when using a goodquality DNA sample, <5% of spots would not pass qualitycontrol, much less than the 65% we previously reported (6). Inaddition, the inter-oligonucleotide noise as defined by the SDin an area without chromosomal aberrations has been consid-erably decreased from 0.45 previously (6) to 0.25 with thecurrent protocol (see also Supplementary Figure 1 allowing adirect comparison of the optimized protocol with the previousone). On average from all fresh human DNA samples analysedin this study using the present protocol, the -oligonucleotidenoise is even as low as 0.22 (±0.03) with 91% (±5%) of spotspassing quality control (data extracted from SupplementaryTable 1). Moreover, we show that the technical noise (intra-oligonucleotide variation) is as low as 0.14. Finally, only300 ng of input DNA is needed for efficient labelling, almost
one order of magnitude less than that needed in other protocols(11,18), omitting the need for amplification for many samples.
Breakpoints and copy number changes are easily detectedusing a dedicated smoothing algorithm (14), although the per-formance of the oligo array platform, as defined by the relationbetween the measured and theoretical ratio (11), may not bethe most optimal (Figure 2). The platform is also sensitiveenough to detect single copy gains (Figure 2) as well asheterozygous deletions (Figure 5). It is likely that homozygousand heterozygous deletions can be distinguished from eachother if such difference appears within one experiment. Ourresults do show evidence that the performance of oligo arraysis comparable with those of BAC arrays (Figures 6 and 7). Thesuppressed performance of measured versus theoretical ratiosis also observed using BAC arrays and is thought to resultfrom incomplete suppression of repetitive sequences (3). Thisexplanation would not be applicable to oligonucleotides,because they are designed within unique genomic sequences.We have successfully tried to take advantage of the lackof repetitive sequences in the oligonucleotide library by
Figure 6. Validation of the oligo array CGH platform with DNA obtained fromFFPE tissue. DNA from an FFPE gastric tumour was hybridized with normalhuman reference DNA on a human oligo array (A) and a 1 Mb human BAC array(B). Log2ratios were calculated without moving average and are displayed forchromosomes 19–21 as a function of their position on the genome. Log2ratiosof the odd and even chromosomes are shown in aqua blue and black,respectively. Chromosome numbers are indicated. Smoothed values of thelog2ratios (red).
Figure 7. Validation of the mouse oligo array CGH platform. DNA from amouse tumour was hybridized with normal mouse reference DNA on a 21 Kmouse oligo array (A). Log2ratios were calculated with a weighted movingaverage as described (11) using a window of 250 kb and are displayed as afunction of their position in the genome. The same mouse tumour and referenceDNA was hybridized in a paired fluor-reversed experiment (dye-swap) to a1 Mb mouse BAC array (B). Log2ratios were calculated as described (15) anddisplayed as a function of their position in the genome. Log2ratios of the oddand even chromosomes are shown in aqua blue and black, respectively.Smoothed values of the log2ratios (red).
PAGE 7 OF 9 Nucleic Acids Research, 2005, Vol. 33, No. 22 e192
by guest on May 25, 2014
http://nar.oxfordjournals.org/D
ownloaded from

experimenting with lower Cot-1 DNA concentrations duringhybridization. Removing 90% of the amount of Cot-1 DNAused for hybridization of BAC arrays did not have any effecton the results (Supplementary Figure 2). Removing all Cot-1DNA is possible as most aberrations were detected, butshowed a suppressing effect on the ratios, especially thosein deletions (Supplementary Figure 2). Although theoreticallythere is no reason for the use of Cot-1 DNA, apparently thepresence of small amounts of Cot-1 DNA is yet advantageousin our hands. Interestingly, the use of Human Cot-1 DNA forthe mouse oligo array hybridization produced good results.
When evaluating the reproducibility of the oligo array CGHplatform, we noticed that the technical noise of an individualoligonucleotide in independent repeats (intra-oligonucleotidevariation), is considerably lower than the variation betweenconsecutive oligonucleotides within one experiment (inter-oligonucleotide variation). A considerable difference betweentechnical noise and variation amongst consecutive clones hasalso been demonstrated for BAC arrays (3), which is a con-sequence of small chromosomal copy number variationsbetween individuals (16,19). Despite the selection of uniqueoligonucleotides some cross-hybridization may still occur.However, while array CGH-specific design of oligonuc-leotides, aimed to minimize cross-hybridization, may improvethe performance of an oligo array CGH platform, it does notdecrease the variation when compared with oligonucleotidesdesigned for expression arrays (11).
When compared with BAC arrays, signal intensitiesobtained in oligo arrays are relatively low, explaining partof the noise (SD) observed in profiles from oligo arrays.This is however compensated for by the high number of oli-gonucleotides when compared with the number of BACs in a1 Mb BAC array. Moreover, in both human and mouse arrayexperiments ratios obtained by the BAC arrays were slightlycompressed compared with the corresponding oligo arrays(Figures 6 and 7). The profiles calculated by the smoothingalgorithm (14) are usually very similar between oligo andBAC array experiments from the same sample. In areaswhere the difference in probe density is high and many aber-rations occur the smoothing algorithm may result in differentprofiles. The high number of oligonucleotides then tends toindicate a more refined pattern of aberrations. A moving aver-age is used to illustrate the sensitivity of an individual elementon the oligonucleotide CGH arrays. This shows that threeoligonucleotides are sufficient to call for a single copy change.In reality the resolution for downstream analysis of the arraysis higher due to the implementation of sophisticated seg-mentation algorithms such as ArrayCGHsmooth used here(14,20,21). The average spacing between the oligonucleotidesin the human library is �100 kb, but one should realize that theactual spacing can be very much different. Because most oligolibraries have so far been designed for expression arrays, oligoarray CGH will mainly focus on gene-rich areas. Also gene-rich chromosomes, such as chromosome 19, will have a loweraverage spacing (35 kb) than gene-poor chromosomes, such aschromosome 4 or the X-chromosome (170 kb). Althougholigonucleotides are not evenly spread along the genome, in75% of all oligonucleotides in the human library the distanceto the next oligo is <100 kb. Thus, theoretically, the resolutionis almost one order of magnitude higher than that of a 1 MbBAC array for most of the genome.
We have done several hundreds of oligo array CGH exp-eriments in our lab and usually obtain clear profiles. Over 150of these were breast tumour samples and have confirmed res-ults obtained using Vysis BAC arrays (data not shown). Wethus strongly believe that this oligo array CGH protocol pro-vides a robust and reproducible platform. We further evaluatedwhether our optimized protocol could be replicated in inde-pendent laboratories. DNA from the cell line MCF7 waslabelled and hybridized to a human oligo array both in ourlaboratory and by an experienced array CGH group (O. Monni,personal communication) according to the current protocoland very similar results were obtained (not shown). In anotherexperiment DNA from a lung tumour sample was hybridizedto the 29 K human oligo array that was printed both on aCodeLink as well as a home-made poly-L-lysine coatedslide by a group experienced in oligo arrays (L. Miller,personal communication) resulting in high quality data (Sup-plementary Figure 3) for both slide types. Although the ratiosobtained from the poly-L-lysine slide were compressed whencompared with those from the CodeLink slide and the noisewas lower on the CodeLink slide, indicating that slide chem-istry may be an important factor that contributes to the qualityof the data, essentially the same aberrations were detected onboth slide types.
Although tiling resolution BAC arrays have been developed(5) and now several commercial oligo array CGH platformsare available (Agilent, Nimblegen), we have shown here thatin-house spotting of commercially available oligonucleotidelibraries can be a cost-effective way to produce high quality,high resolution results. There is no need for expensive andlaborious probe amplifications and as oligo libraries for neworganisms become available, these can now easily be imple-mented for array CGH as shown by us for the mouse oligoarray CGH platform, which has already proven its value (22).In contrast, to our knowledge only several groups have inves-ted in producing a genome-wide mouse BAC array (15,23).Moreover, when new libraries are designed, it is worth takinginto account that they can also be used for array CGH as isalready being done by Illumina (www.illumina.com/products/dna/genomesets/meebo_mouse.ilmn). Special care should betaken to design probes that are unique and show minimalcross-hybridization. Finally, because oligonucleotide probesare exactly defined, in contrast to PCR amplified BAC probes,they are more suitable for use in diagnostic applications.
SUPPLEMENTARY DATA
All microarray data described in this paper are available fromthe Gene Expression Omnibus (GEO, http://www.ncbi.nlm.nih.gov/projects/geo/) through series accession GSE3264.Supplementary Table 1 provides an overview of the GEOaccession numbers for the individual array experiments.
ACKNOWLEDGEMENTS
The authors would like to thank Nir Gamliel (Compugen USA,Inc) and Tony Cox, (Sanger Institute, UK) for making the oligosequences publicly available and mapping them onto the humanand mouse genomes in Ensembl (http://www.ensembl.org/).We are also grateful to Prof Outi Monni (University of
e192 Nucleic Acids Research, 2005, Vol. 33, No. 22 PAGE 8 OF 9
by guest on May 25, 2014
http://nar.oxfordjournals.org/D
ownloaded from

Helsinki, Finland) and Prof Lance Miller (Genome Institute ofSingapore, Singapore) for collaborating and testing the plat-form and to Dr Mark van der Wiel for statistical advice. Wewould like to thank Dr Stephen P Ethier for the SUM 159 cellline and Dr Mike O’Hare for the SKBR7 cell line. S.F.C. andC.C. are funded by the Cancer Research UK. We also acknowl-edge support by the COST B19 action WG4 for S.F.C. Thisstudy was supported by the Centre for Medical SystemsBiology (CMSB), a centre of excellence approved by theNetherlands Genomics Initiative/Netherlands Organisationfor Scientific Research (NWO) and by the sixth frameworkprogramme (EU). Funding to pay the Open Access publicationcharges for this article was provided by VUmc intramuralfunding.
Conflict of interest statement. None declared.
REFERENCES
1. Pinkel,D., Segraves,R., Sudar,D., Clark,S., Poole,I., Kowbel,D.,Collins,C., Kuo,W.L., Chen,C., Zhai,Y. et al. (1998) High resolutionanalysis of DNA copy number variation using comparative genomichybridization to microarrays. Nature Genet., 20, 207–211.
2. Oostlander,A.E., Meijer,G.A. and Ylstra,B. (2004) Microarray-basedcomparative genomic hybridization and its applications in humangenetics. Clin. Genet., 66, 488–495.
3. Snijders,A.M., Nowak,N., Segraves,R., Blackwood,S., Brown,N.,Conroy,J., Hamilton,G., Hindle,A.K., Huey,B., Kimura,K. et al. (2001)Assembly of microarrays for genome-wide measurement of DNA copynumber. Nature Genet., 29, 263–264.
4. Kallioniemi,A., Kallioniemi,O.P., Sudar,D., Rutovitz,D., Gray,J.W.,Waldman,F. and Pinkel,D. (1992) Comparative genomic hybridizationfor molecular cytogenetic analysisof solid tumors.Science, 258, 818–821.
5. Ishkanian,A.S., Malloff,C.A., Watson,S.K., DeLeeuw,R.J., Chi,B.,Coe,B.P., Snijders,A., Albertson,D.G., Pinkel,D., Marra,M.A. et al.(2004) A tiling resolution DNA microarray with complete coverage ofthe human genome. Nature Genet., 36, 299–303.
6. Carvalho,B., Ouwerkerk,E., Meijer,G.A. and Ylstra,B. (2004) Highresolution microarray comparative genomic hybridization analysis usingspotted oligonucleotides. J. Clin. Pathol., 57, 644–646.
7. Ren,H., Francis,W., Boys,A., Chueh,A.C., Wong,N., La,P., Wong,L.H.,Ryan,J., Slater,H.R. and Choo,K.H. (2005) BAC-based PCR fragmentmicroarray: high-resolution detection of chromosomal deletion andduplication breakpoints. Hum. Mutat., 25, 476–482.
8. Dhami,P., Coffey,A.J., Abbs,S., Vermeesch,J.R., Dumanski,J.P.,Woodward,K.J., Andrews,R.M., Langford,C. and Vetrie,D. (2005) ExonArray CGH: detection of copy-number changes at the resolution ofindividual exons in the human genome. Am. J. Hum. Genet., 76, 750–762.
9. Pinkel,D. and Albertson,D.G. (2005) Array comparative genomichybridization and its applications in cancer. Nature Genet., 37, S11–S17.
10. Brennan,C., Zhang,Y., Leo,C., Feng,B., Cauwels,C., Aguirre,A.J.,Kim,M., Protopopov,A. and Chin,L. (2004) High-resolution globalprofiling of genomic alterations with long oligonucleotide microarray.Cancer Res., 64, 4744–4748.
11. Barrett,M.T., Scheffer,A., Ben-Dor,A., Sampas,N., Lipson,D.,Kincaid,R., Tsang,P., Curry,B., Baird,K., Meltzer,P.S. et al. (2004)Comparative genomic hybridization using oligonucleotidemicroarrays and total genomic DNA. Proc. Natl Acad. Sci. USA, 101,17765–17770.
12. Winterberg,K.M., Luecke,J., Bruegl,A.S. and Reznikoff,W.S. (2005)Phenotypic screening of Escherichia coli K-12 Tn5 insertion libraries,using whole-genome oligonucleotide microarrays. Appl. Environ.Microbiol., 71, 451–459.
13. Weiss,M.M., Hermsen,M.A., Meijer,G.A., van Grieken,N.C., Baak,J.P.,Kuipers,E.J. and van Diest,P.J. (1999) Comparative genomichybridization. Mol. Pathol., 52, 243–251.
14. Jong,K., Marchiori,E., Meijer,G., Vaart,A.V. and Ylstra,B. (2004)Breakpoint identification and smoothing of array comparative genomichybridization data. Bioinformatics, 20, 3636–3637.
15. Chung,Y.J., Jonkers,J., Kitson,H., Fiegler,H., Humphray,S., Scott,C.,Hunt,S., Yu,Y., Nishijima,I., Velds,A. et al. (2004) A whole-genomemouse BAC microarray with 1-Mb resolution for analysis of DNAcopy number changes by array comparative genomic hybridization.Genome Res., 14, 188–196.
16. Sebat,J., Lakshmi,B., Troge,J., Alexander,J., Young,J., Lundin,P.,Maner,S., Massa,H., Walker,M., Chi,M. et al. (2004) Large-scale copynumber polymorphism in the human genome. Science, 305,525–528.
17. Devries,S., Nyante,S., Korkola,J., Segraves,R., Nakao,K., Moore,D.,Bae,H., Wilhelm,M., Hwang,S. and Waldman,F. (2005) Array-basedcomparative genomic hybridization from formalin-fixed, paraffin-embedded breast tumors. J. Mol. Diagn., 7, 65–71.
18. Pollack,J.R., Perou,C.M., Alizadeh,A.A., Eisen,M.B.,Pergamenschikov,A., Williams,C.F., Jeffrey,S.S., Botstein,D. andBrown,P.O. (1999) Genome-wide analysis of DNA copy-numberchanges using cDNA microarrays. Nature Genet., 23, 41–46.
19. van Ommen,G.J. (2005) Frequency of new copy number variationin humans. Nature Genet., 37, 333–334.
20. Willenbrock,H. and Fridlyand,J. (2005) A comparison study: applyingsegmentation to array CGH data for downstream analyses.Bioinformatics, 21, 4084–4091.
21. Lai,W.R., Johnson,M.D., Kucherlapati,R. and Park,P.J. (2005)Comparative analysis of algorithms for identifying amplifications anddeletions in array CGH data. Bioinformatics, 21, 3763–3770.
22. van de Wiel,M.A., Costa,J.L., Smit,K., Oudejans,C.B., Bergman,A.M.,Meijer,G.A., Peters,G.J. and Ylstra,B. (2005) Expression microarrayanalysis and oligo array comparative genomic hybridization of acquiredgemcitabine resistance in mouse colon reveals selection for chromosomalaberrations. Cancer Res., 65, 10208–10213.
23. Snijders,A.M., Nowak,N.J., Huey,B., Fridlyand,J., Law,S., Conroy,J.,Tokuyasu,T., Demir,K., Chiu,R., Mao,J.H. et al. (2005) Mappingsegmental and sequence variations among laboratory mice using BACarray CGH. Genome Res., 15, 302–311.
PAGE 9 OF 9 Nucleic Acids Research, 2005, Vol. 33, No. 22 e192
by guest on May 25, 2014
http://nar.oxfordjournals.org/D
ownloaded from