Postblink changes in total and corneal ocular aberrations
10
Postblink Changes in Total and Corneal Ocular Aberrations Robert Monte ´s-Mico ´, OD, MPhil, 1,2 Jorge L. Alio ´, MD, PhD, 1 Gonzalo Mun ˜oz, MD, PhD, 1 Juan J. Pe ´rez-Santonja, MD, PhD, 1 W. Neil Charman, PhD 2 Objective: The purpose of this study was to determine objectively the changes in optical aberrations induced by the progressive tear film irregularity after a blink and their effects on retinal image quality. Design: Prospective, consecutive, nonrandomized comparative trial (self-controlled). Participants: Twenty healthy subjects. Main Outcome Measures: Corneal and total ocular aberrations were determined in 20 subjects at various time intervals (approximately 0, 10, and 20 seconds) after a blink. Corneal and total aberrations were measured with an Orbscan II topographer (Orbtek Inc, Salt Lake City, UT) and a Zywave aberrometer (Bausch & Lomb, Irvine, CA), respectively. All data were decomposed using Zernike polynomials to yield the root mean square wavefront deviations, in micrometers (m), for different pupil diameters (3.5, 4.5, 5.5, and 6.5 mm). A merit function (Mf), defined as the volume under the 2-dimensional modulation transfer function as computed from the total wavefront error, was taken as the image quality metric. Results: Both corneal and total aberrations (third order and higher) showed a statistically significant increase with time after the blink for all pupil diameters except 3.5 mm. The magnitude of the increase was greater at larger pupil diameters. For a 6.5-mm pupil, the aberrations increased on average by a factor of 2.5 (total) and 2.5 (corneal). Increases in total aberration were related closely to increases in corneal aberration (P0.0001). For a 6.5-mm pupil, after 20 seconds, the reduction in optical quality (Mf) among the subjects studied was 218%. Conclusions: After a blink, the gradual increase in optical aberration associated with the increasingly irregular tear film may cause a progressive reduction in the optical quality of the eye. These changes in aberration with time may partly limit the improvements in visual performance that are achievable by customized corneal ablation. Ophthalmology 2004;111:758 –767 © 2004 by the American Academy of Ophthalmology. Over the last few years, there has been increased interest in the study of the optical quality of the eye. A major reason for this has been the suggestion that, rather than as now simply correcting defocus and astigmatism, it may be pos- sible to obtain “supernormal” visual performance by using customized corneal ablation additionally to correct higher- order ocular aberrations and to yield an eye that, on axis, is totally free of monochromatic aberrations. 1–5 Despite the widespread expectation that customized cor- neal ablation may open the door to improved vision, it is recognized that there will still be various limits to the visual performance that is achievable, even if the monochromatic aberrations of the eye can be perfectly corrected. These limits include image blur resulting from diffraction (which depends on the wavelength and pupil size) and chromatic aberration (resulting from polychromatic light), photorecep- tor sampling and associated aliasing, and neural processing. All of these are unavoidable and are impossible to correct with laser refractive surgery. The benefits that customized higher-order corneal correction is able to produce also may be reduced by intraocular scattered light. Monte ´s-Mico ´ and Charman 6,7 found that haze reduces visual performance after laser refractive surgery and changes with time after surgery. A particularly important factor influencing the degree to which all axial, monochromatic, ocular aberrations poten- tially can be corrected is the stability of the ocular aberra- tions. It is clear that if, for any reason, the eye’s optics are not stable, no fixed ablation pattern can completely correct the aberrations. It is known, for example, that the eye’s higher-order aberrations change substantially with accom- modation, 8,9 so that a higher-order aberration correction tailored for distance vision is not appropriate for near vi- sion: even at a fixed distance, small, rapid fluctuations in aberrations occur. 10 The wavefront aberrations also change with age 11–13 and with any long-term wound healing pro- cess after refractive surgery. Originally received: January 30, 2003. Accepted: June 27, 2003. Manuscript no. 230052. 1 Department of Research, Development and Innovation, Ophthalmologic Institute of Alicante and the School of Medicine, University Miguel Her- na ´ndez, Alicante, Spain. 2 Department of Optometry and Neuroscience, University of Manchester Institute of Science and Technology (UMIST), Manchester, United King- dom. This study was supported in part by a grant of the Spanish Ministry of Science and Technology, Red Tema ´tica de Investigacio ´n en Oftalmologia, Subproyecto de Cirugı ´a Refractiva y Calidad Visual (C03/13). The authors have no proprietary interests. Correspondence to Robert Monte ´s-Mico ´, OD, MPhil, Department of Re- search, Development and Innovation, Instituto Oftalmolo ´gico de Alicante, Universidad Miguel Herna ´ndez, Avda. Denia 111, 03015 Alicante, Spain. E-mail: [email protected]. 758 © 2004 by the American Academy of Ophthalmology ISSN 0161-6420/04/$–see front matter Published by Elsevier Inc. doi:10.1016/j.ophtha.2003.06.027
-
Upload
independent -
Category
Documents
-
view
5 -
download
0
Transcript of Postblink changes in total and corneal ocular aberrations

Postblink Changes in Total and CornealOcular Aberrations
Robert Montes-Mico, OD, MPhil,1,2 Jorge L. Alio, MD, PhD,1 Gonzalo Munoz, MD, PhD,1
Juan J. Perez-Santonja, MD, PhD,1 W. Neil Charman, PhD2
Objective: The purpose of this study was to determine objectively the changes in optical aberrationsinduced by the progressive tear film irregularity after a blink and their effects on retinal image quality.
Design: Prospective, consecutive, nonrandomized comparative trial (self-controlled).Participants: Twenty healthy subjects.Main Outcome Measures: Corneal and total ocular aberrations were determined in 20 subjects at various
time intervals (approximately 0, 10, and 20 seconds) after a blink. Corneal and total aberrations were measuredwith an Orbscan II topographer (Orbtek Inc, Salt Lake City, UT) and a Zywave aberrometer (Bausch & Lomb,Irvine, CA), respectively. All data were decomposed using Zernike polynomials to yield the root mean squarewavefront deviations, in micrometers (�m), for different pupil diameters (3.5, 4.5, 5.5, and 6.5 mm). A meritfunction (Mf), defined as the volume under the 2-dimensional modulation transfer function as computed from thetotal wavefront error, was taken as the image quality metric.
Results: Both corneal and total aberrations (third order and higher) showed a statistically significant increasewith time after the blink for all pupil diameters except 3.5 mm. The magnitude of the increase was greater at largerpupil diameters. For a 6.5-mm pupil, the aberrations increased on average by a factor of 2.5 (total) and 2.5(corneal). Increases in total aberration were related closely to increases in corneal aberration (P�0.0001). For a6.5-mm pupil, after 20 seconds, the reduction in optical quality (Mf) among the subjects studied was 21�8%.
Conclusions: After a blink, the gradual increase in optical aberration associated with the increasinglyirregular tear film may cause a progressive reduction in the optical quality of the eye. These changes in aberrationwith time may partly limit the improvements in visual performance that are achievable by customized cornealablation. Ophthalmology 2004;111:758–767 © 2004 by the American Academy of Ophthalmology.
restsonnow
pos-ing
her-is, i
corit is
ualatic
hesech
aticep-ssing.rrectizedmay
afterery.to
ten-rra-are
rrectye’scom-tion
vi-s in
ngero-
052.
ologicer-
estering-
ry of,
-,ain.
Over the last few years, there has been increased intethe study of the optical quality of the eye. A major reafor this has been the suggestion that, rather than assimply correcting defocus and astigmatism, it may besible to obtain “supernormal” visual performance by uscustomized corneal ablation additionally to correct higorder ocular aberrations and to yield an eye that, on axtotally free of monochromatic aberrations.1–5
Despite the widespread expectation that customizedneal ablation may open the door to improved vision,
Originally received: January 30, 2003.Accepted: June 27, 2003. Manuscript no. 2301 Department of Research, Development and Innovation, OphthalmInstitute of Alicante and the School of Medicine, University Miguel Hnandez, Alicante, Spain.2 Department of Optometry and Neuroscience, University of ManchInstitute of Science and Technology (UMIST), Manchester, United Kdom.
This study was supported in part by a grant of the Spanish MinistScience and Technology, Red Tema´tica de Investigacio´n en OftalmologiaSubproyecto de Cirugı´a Refractiva y Calidad Visual (C03/13).
The authors have no proprietary interests.
Correspondence to Robert Monte´s-Mico, OD, MPhil, Department of Research, Development and Innovation, Instituto Oftalmolo´gico de AlicanteUniversidad Miguel Herna´ndez, Avda. Denia 111, 03015 Alicante, SpE-mail: [email protected].
758 © 2004 by the American Academy of OphthalmologyPublished by Elsevier Inc.
in
s
-
recognized that there will still be various limits to the visperformance that is achievable, even if the monochromaberrations of the eye can be perfectly corrected. Tlimits include image blur resulting from diffraction (whidepends on the wavelength and pupil size) and chromaberration (resulting from polychromatic light), photorector sampling and associated aliasing, and neural proceAll of these are unavoidable and are impossible to cowith laser refractive surgery. The benefits that customhigher-order corneal correction is able to produce alsobe reduced by intraocular scattered light. Monte´s-Mico andCharman6,7 found that haze reduces visual performancelaser refractive surgery and changes with time after surg
A particularly important factor influencing the degreewhich all axial, monochromatic, ocular aberrations potially can be corrected is the stability of the ocular abetions. It is clear that if, for any reason, the eye’s opticsnot stable, no fixed ablation pattern can completely cothe aberrations. It is known, for example, that the ehigher-order aberrations change substantially with acmodation,8,9 so that a higher-order aberration correctailored for distance vision is not appropriate for nearsion: even at a fixed distance, small, rapid fluctuationaberrations occur.10 The wavefront aberrations also chawith age11–13 and with any long-term wound healing pcess after refractive surgery.
ISSN 0161-6420/04/$–see front matterdoi:10.1016/j.ophtha.2003.06.027

Montes-Mico et al � Postblink Changes in Wavefront Aberrations
One factor contributing to instability in ocular aberrationthat recently has received increasing attention is the tearfilm. Several clinical studies support the hypothesis that theincreased aberrations consequent on tear film disruptionmay reduce retinal image quality14–17: other studies relatedto videokeratography clearly illustrate the irregularities inthe surface of the tear film that develop with time after ablink.18–22 Because the front surface of the precorneal tearfilm is the most anterior optical surface of the eye, and themost powerful because it is associated with the largestchange in refractive index, any local change in tear filmthickness and regularity will introduce additional aberra-tions into the eye’s optical system.14 Maintenance of asmooth, intact tear film therefore is essential for achievinghigh-quality retinal images.15,16 Albarran et al,14 using adouble-pass optical method; Thibos and Hong15 and Koh etal,17 using a Shack-Hartmann aberrometer; and Tutt et al,16
monitoring psychophysical contrast sensitivity and distribu-tion of tear thickness by retroillumination, have concludedthat optical aberrations created by tear film changes con-tribute to a decline in image quality. However, the source ofthese optical aberrations is still uncertain. They could comefrom the underlying irregularity of the corneal surface,nonuniformity of the refractive index of the tears, the irreg-ular surface of the tear film during disruption, corneal de-hydration after tear break-up, or a combination of thesefactors.16
A simple calculation illustrates the optical importance ofthe tear film in the imagery of an individual eye. Theanterior radius of the tear film is approximately 7.8 mm andits index is 1.336, giving a surface power of 43.08 diopters(D). With a tear film thickness of between 6 and 20 �m,23
a uniform reduction in the thickness of the film can havelittle effect on the surface power or aberrations, because,evidently, the surface radius can change only by a maximumof 20 �m to yield a maximum power increase of approxi-mately 0.1 D. If, however, the film becomes irregular inthickness, much larger variations may occur in its localanterior radius of curvature and power. For example, ifthe radius falls to 7.6 mm, the local power will increaseby approximately 1.3 D. Such local variations in powerare, of course, equivalent to higher-order wavefrontaberrations.
To explore the optical importance of postblink tear filmchanges, we studied the change of the individual overallocular aberrations induced by tear film disruption. We alsomeasured the aberrations resulting from the anterior surfaceof the tear film. If the change in overall ocular aberrationwas simply the result of changes in the anterior surface ofthe tear layer, we would expect the change in overall aber-ration to be approximately equal to the change in cornealaberration. If, however, factors such as postblink changes inthe uniformity of the tear film index or corneal dehydrationcontributed substantially to the changes in overall aberra-tion, this would not be true. The internal aberrations wouldchange, as well as those of the anterior tear surface, so thatthe change in the corneal aberration would not equal thechange in overall ocular aberration.
Patients and Methods
Twenty subjects, 16 men and 4 women, participated in this study.All were emmetropes with a visual acuity of 20/20 or better andnormal ocular health. Their corneas were free of scarring or otherabnormalities and they had normal tear characteristics. Agesranged from 25 to 30 years (mean�standard deviation, 28�1.2years). Only the left eye was used for the measurements because ithas been suggested that aberration patterns may be symmetricbetween left and right eyes of the same subject.24,25 Fluoresceintear break-up time as measured by standard methods ranged from6 to 15 seconds among subjects. The tenets of the Declaration ofHelsinki were followed in this study. Informed consent was ob-tained from all patients after the nature and possible consequencesof the study had been explained.
To avoid possible changes to the cornea, tear film, or both fromsuccessive periods of nonblinking, the experiments on each indi-vidual were performed on 5 separate days to yield 5 sets ofmeasurements. The tests were run in a controlled temperature(22�3° C) and humidity (40�4%) at the Instituto Oftalmologicode Alicante (Spain).
Total Wavefront Aberration Measurements
The total ocular aberrations were measured by means of a Zywaveaberrometer (Bausch & Lomb, Irvine, CA), which is based on theHartmann-Shack aberrometer.15 The measurements were carriedout in a darkened room to avoid the need to dilate the pupilpharmacologically: aberrations then could be measured over thefull extent of a physiologically natural pupil (up to a 6.5-mmdiameter). The subject was instructed to blink 3 or 4 times and tofixate on a distant image created by the aberrometer while keepingtheir eyes wide open for as long as possible. During this period ofnonblinking, 3 images were captured with the aberrometer. Thefirst was taken immediately after the blink (nominally, t � 0) andthe others 10 and 20 seconds later: the timing accuracy for thelatter was �1 second. These times compare with an averagenormal blink rate of approximately 1 blink every 5 seconds,26
although there is a considerable variation in blink rate betweenindividuals and visual tasks.27–29 Five runs (each consisting of 3images for different times) were collected per eye, each run beingon a different day.
Corneal Aberrations from Corneal Topography
Videokeratographic data were obtained by computerized videokera-tography (Orbscan II; Orbtek Inc, Salt Lake City, UT) immediatelyafter the measurement of total ocular aberration. Measurements ineach eye were repeated until a well-focused and aligned image wasobtained. After the previous procedure, the subject was instructedto keep his or her eyelids open during the image capture. Threeimages were obtained for the same postblink time intervals: t � 0,10, and 20 seconds. Corneal videokeratographic data were down-loaded onto floppy disks in ASCII files that contained informationabout corneal elevation, curvature, power, and position of thepupil.
Data Analysis
The aberroscopic wavefront data were fitted with Zernike polyno-mials up to the sixth order to determine aberration coefficients,from which the wavefront aberration function was reconstructed.30
From the Zernike coefficients, the root mean square (RMS) wave-front errors for comalike aberrations (third-order components Z3
i
and fifth-order components Z i) and sphericallike aberrations
5759

760

Montes-Mico et al � Postblink Changes in Wavefront Aberrations
(fourth-order component Z40 and sixth-order component Z6
0) werecalculated. Because of the linear independence of the Zerniketerms, the total RMS wavefront error was computed by summingall components (i.e., the total RMS error was the square root of thesum of the squares of the RMS values of the components).31 Toderive aberration coefficients for different pupil diameters (3.5,4.5, 5.5, and 6.5 mm), the raw data images were masked to includeonly the data inside the required pupil diameter before proceedingwith Zernike analysis. Different pupil diameters were assessed toallow evaluation of the corresponding contribution of the possibleirregularity of the tear film during disruption. Because the spacingof the lenslets of the Hartmann-Shack device used in this experi-ment was approximately 0.8 mm, only a limited number of imagespots (approximately 20) were available for Zernike polynomialestimation when the pupil diameter was 3.5 mm. Thus, for thispupil size, calculations were carried out only up to the fourth-orderZernike modes, with only primary spherical and coma being esti-mated. For the larger pupil sizes (4.5, 5.5, and 6.5 mm) a sixth-order calculation was carried out. The modulation transfer function(MTF) was computed for each eye from the corresponding waveaberrations (ignoring apodization imposed by the Stiles-Crawfordeffect32 by standard Fourier optics methods33; computed algo-rithms with Matlab [Mathworks Inc, Natik, MA]).
The calculation of corneal wavefront aberration was performedusing the descriptive polynomial method of Howland and How-land.34,35 As in the case of total ocular aberrations, the comalikeaberrations were examined using the third- and fifth-order compo-nents (Z3
i�Z5i), and sphericallike aberrations were examined us-
ing the fourth- and sixth-order components (Z40�Z6
0). The totalRMS wavefront error was computed by summing the individualerrors up to the sixth order (Z3
i�Z4i�Z5
i�Z6i). These calculations
again were carried out for pupil diameters of 4.5, 5.5, and 6.5 mm.For the 3.5-mm pupil, only corneal components up to the fourthorder were considered, to allow comparison with the total aberra-tions measured with the Hartmann-Shack. For direct comparisonof corneal and total aberrations, a proper alignment is necessary.Corneal and total aberrations were compared directly for all pupildiameters at 0, 10, and 20 seconds after a blink, care being takento ensure proper alignment.
Results
Total Wavefront Aberrations
The amounts of the different types of higher-order wavefrontaberrations of the eye as a function of the time after the blink areplotted graphically in Figure 1A for different pupil diameters.
With a small, 3.5-mm pupil, although values of sphericallike,comalike, and total aberration increased with postblink time by afactor of approximately 2 after 20 seconds, in no case was theincrease statistically significant at the 1% level, and amounts ofaberration generally were small. With larger pupil sizes, amountsof all types of higher-order aberration increased with pupil size andwith postblink interval. Wavefront aberration of all types wascorrelated significantly with the time after the blink (Fig 1A), theincrease of more than 20 seconds typically being by a factor ofapproximately 2 to 3 times. These results are broadly compatible
4™™™™™™™™™™™™™™™™™™™™™™™™™™™™™™™™™™™™Figure 1. Correlation between time after the blink and sphericallike aberwavefront aberration (root mean square) for (A) the complete eye and (B(r � Pearson correlation coefficient). Only mean values have been includfor 3.5-, 4.5-, 5.5-, and 6.5-mm diameter pupils.
with those of Koh et al17 for 4- and 6-mm pupils, although exactcomparison is not possible because the postblink time interval usedby the latter authors was merely defined as “15 seconds or more”and the pupil sizes were different.
To illustrate the nature of the changes in the wavefront aber-ration pattern in the individual eye after the blink, Figure 2 showsthe color-coded maps of the total wavefront aberration across thepupil at t � 0, 10, and 20 seconds after the blink in a typical eye.Only third- and higher-order aberrations have been considered(i.e., best correction of any defocus and astigmatism has beenassumed). The pupil diameter is 6.5 mm. It is possible to observea clear deterioration of the wave aberration map after the blink,reflecting an increase in the aberrations that correlates with thedata analysis carried out previously (Fig 1, total RMS). Theseexamples are shown with a pupil diameter of 6.5 mm because, asnoted earlier, the impact of the tear film disruption (time after theblink) on aberrations is much more pronounced at larger pupilsizes.
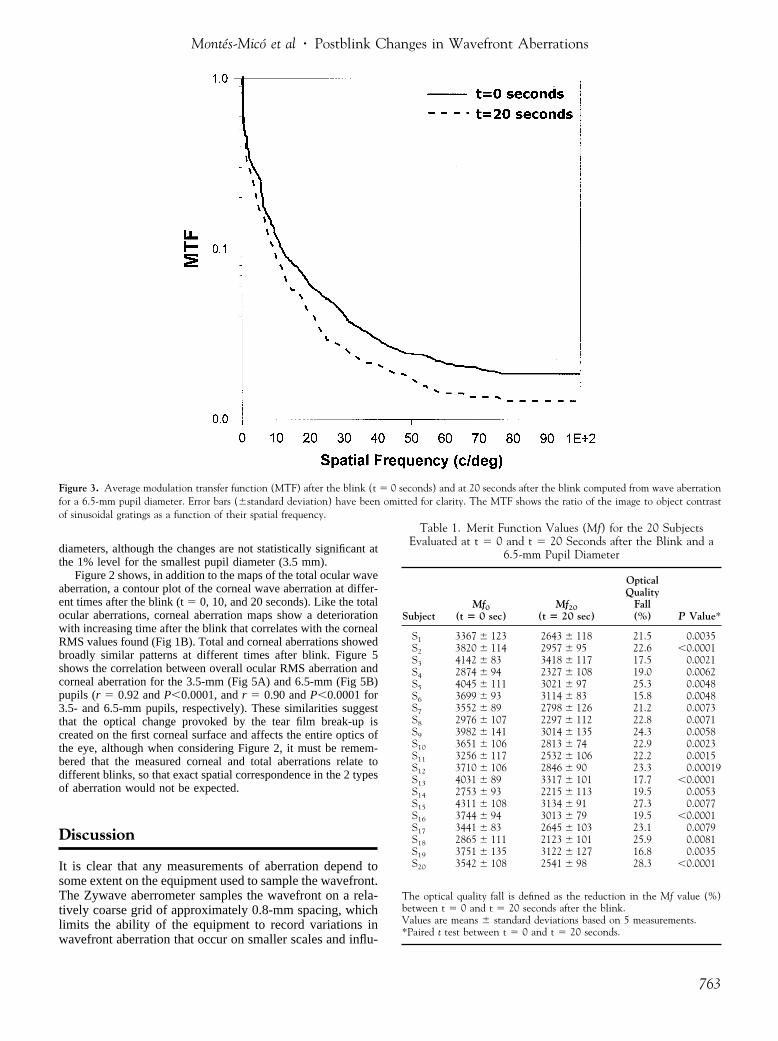
Figure 3 shows the MTF averaged over all azimuths (logarith-mic scale and radial profile) for a 6.5-mm pupil for all the eyes, asevaluated at t � 0 and 20 seconds after the blink. There is asignificant loss in modulation transfer at all spatial frequenciesmore than the 20-second time interval. On average, from 15 c/deg,the MTF decreased by a factor of 2.2 at 20 seconds after the blinkin relation to t � 0 seconds. To compare the optical quality of theeye as a function of the time after blink, we calculated a meritfunction, Mf. This is defined as the volume under the 2-dimen-sional MTF [in polar coordinates (�,�), where � is the spatialfrequency and � the azimuth] between 2 spatial frequencies, �1 and�2, and is calculated as follows36:
Mf ���1
�2�0
2�
MTF(�,�)d�d� (1)
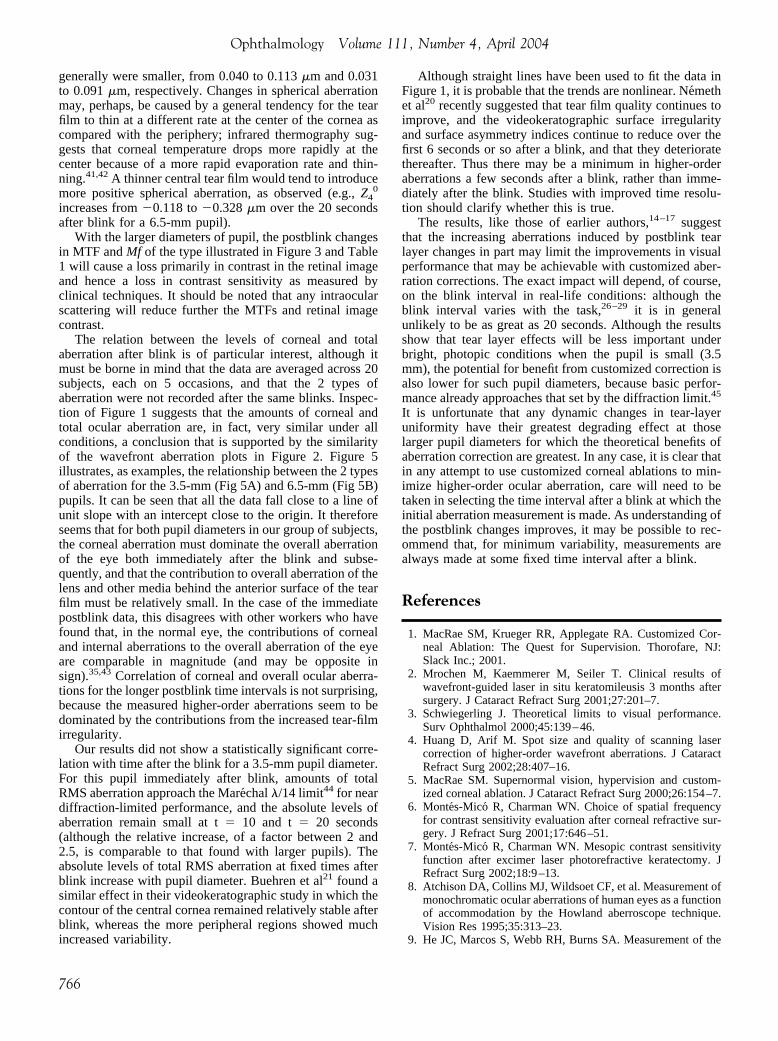
�1 and �2 may be chosen as required, so that with this qualityparameter, the study of any frequency region (low, middle, or highfrequencies) is possible. For the present purposes, values 0.016 and100.5 c/deg were used. The averages of the Mf values obtained areshown in Table 1 for each of the subjects studied. A t testperformed to look for the differences in the optical quality betweent � 0 and t � 20 seconds is shown in the same table. From thistable, we can observe that a significant reduction in the opticalquality of the eye at more than 20 seconds after blink occurred forall subjects (P�0.01). The mean fall was 21�8%, implying asubstantial loss in retinal image contrast. Figure 4 shows thechanges in overall ocular aberrations (sphericallike, comalike, andtotal) as a function of the pupil diameter immediately after a blink(Fig 4A) and 20 seconds after a blink (Fig 4B). All aberrationsincreased with time after a blink correlating with the reduction inthe optical quality of the eye found at 20 seconds after blink (MTF,Fig 3; Mf, Table 1).
Corneal Wavefront AberrationsFigure 1B shows the RMS wavefront aberration of the cornea at t� 0, 10, and 20 seconds after the blink for the 4 pupil diameters.Sphericallike, comalike, and total aberrations increase with post-blink interval by a factor of between 2.1 to 2.5 times at all pupil
™™™™™™™™™™™™™™™™™™™™™™™™™™™™™™™™™™™™(Z4
0 and Z60), comalike aberration (Z3
i and Z5i), and total higher-order
cornea aberrations. Solid lines represent the linear regression of the dataclarity. Both overall ocular and corneal aberrations have been computed
™™™ration) theed for
761

Figure 2. Total and corneal wave aberration color-coded maps in a subset of one eye recorded immediately after the blink (t � 0) and then at 10 and 20 seconds after the blink (third- and higher-orderaberrations). Pupil diameter, 6.5 mm. Left column contains the matrix of dots of the aberrometer image at different times after blink.
762
Montes-Mico et al � Postblink Changes in Wavefront Aberrations
diameters, although the changes are not statistically significant atthe 1% level for the smallest pupil diameter (3.5 mm).
Figure 2 shows, in addition to the maps of the total ocular waveaberration, a contour plot of the corneal wave aberration at differ-ent times after the blink (t � 0, 10, and 20 seconds). Like the totalocular aberrations, corneal aberration maps show a deteriorationwith increasing time after the blink that correlates with the cornealRMS values found (Fig 1B). Total and corneal aberrations showedbroadly similar patterns at different times after blink. Figure 5shows the correlation between overall ocular RMS aberration andcorneal aberration for the 3.5-mm (Fig 5A) and 6.5-mm (Fig 5B)pupils (r � 0.92 and P�0.0001, and r � 0.90 and P�0.0001 for3.5- and 6.5-mm pupils, respectively). These similarities suggestthat the optical change provoked by the tear film break-up iscreated on the first corneal surface and affects the entire optics ofthe eye, although when considering Figure 2, it must be remem-bered that the measured corneal and total aberrations relate todifferent blinks, so that exact spatial correspondence in the 2 typesof aberration would not be expected.
Discussion
It is clear that any measurements of aberration depend tosome extent on the equipment used to sample the wavefront.The Zywave aberrometer samples the wavefront on a rela-tively coarse grid of approximately 0.8-mm spacing, whichlimits the ability of the equipment to record variations inwavefront aberration that occur on smaller scales and influ-
Figure 3. Average modulation transfer function (MTF) after the blink (tfor a 6.5-mm pupil diameter. Error bars (�standard deviation) have beenof sinusoidal gratings as a function of their spatial frequency.
� 0 seconds) and at 20 seconds after the blink computed from wave aberrationomitted for clarity. The MTF shows the ratio of the image to object contrast
Table 1. Merit Function Values (Mf) for the 20 SubjectsEvaluated at t � 0 and t � 20 Seconds after the Blink and a
6.5-mm Pupil Diameter
SubjectMf0
(t � 0 sec)Mf20
(t � 20 sec)
OpticalQuality
Fall(%) P Value*
S1 3367 � 123 2643 � 118 21.5 0.0035S2 3820 � 114 2957 � 95 22.6 �0.0001S3 4142 � 83 3418 � 117 17.5 0.0021S4 2874 � 94 2327 � 108 19.0 0.0062S5 4045 � 111 3021 � 97 25.3 0.0048S6 3699 � 93 3114 � 83 15.8 0.0048S7 3552 � 89 2798 � 126 21.2 0.0073S8 2976 � 107 2297 � 112 22.8 0.0071S9 3982 � 141 3014 � 135 24.3 0.0058S10 3651 � 106 2813 � 74 22.9 0.0023S11 3256 � 117 2532 � 106 22.2 0.0015S12 3710 � 106 2846 � 90 23.3 0.00019S13 4031 � 89 3317 � 101 17.7 �0.0001S14 2753 � 93 2215 � 113 19.5 0.0053S15 4311 � 108 3134 � 91 27.3 0.0077S16 3744 � 94 3013 � 79 19.5 �0.0001S17 3441 � 83 2645 � 103 23.1 0.0079S18 2865 � 111 2123 � 101 25.9 0.0081S19 3751 � 135 3122 � 127 16.8 0.0035S20 3542 � 108 2541 � 98 28.3 �0.0001
The optical quality fall is defined as the reduction in the Mf value (%)between t � 0 and t � 20 seconds after the blink.Values are means � standard deviations based on 5 measurements.*Paired t test between t � 0 and t � 20 seconds.
763

after
Ophthalmology Volume 111, Number 4, April 2004
ence higher-order Zernike terms. The existence of thesesmall-scale variations is illustrated by the blurring thatoccurs in the points in the aberrometer images at t � 20seconds (Fig 2), particularly toward the edge of the pupil.Other factors also may serve to limit the ability of anyHartmann-Shack device to record aberrations accurate-ly.37,38 Qualitatively similar limitations also must apply tothe Orbscan analysis. With this proviso, there appears to belittle doubt that ocular aberrations become larger as thepostblink interval increases, and that regular blinking plays
Figure 4. Changes in overall ocular sphericallike (SA), comalike (Coma)of pupil diameter immediately after a blink (A) and 20 seconds after a blidata from the study by Koh et al17 (data for 0 and “15 seconds or more”
764
an important role in maintaining the optical quality of theeye.14–17,39
The 10- and 20-second time intervals after a blink thatwere used in the study are longer than the approximately5-second blink interval that usually is quoted.26 Neverthe-less, blink intervals extend to 10 seconds for many individ-uals under some observation conditions. Moreover, thepresent subjects had tear break-up times within the normalrange: it may be anticipated that these aberration changeswill be accelerated in dry eye patients.39 It should be noted,
total root mean square (RMS) wavefront (Total) deviation as a function). Filled symbols are from the present study, and open symbols representblink).
, andnk (B

Montes-Mico et al � Postblink Changes in Wavefront Aberrations
however, that in comparison with normal conditions, duringmeasurements like these, where subjects are asked to opentheir eyes wide, the wider palpebral aperture may causethinning of the tear film and an increased evaporation ratefor the tear fluid because of the greater surface area40: tearfilm changes therefore may be somewhat accelerated.
Considering the results in more detail, we note first thatamounts of ocular RMS aberration immediately after a blinkseem to lie within normal limits for the different pupilsizes9,17,24 (Fig 4A). It is interesting to note that bothsphericallike and comalike aberrations tend to increase withtime after a blink: similar effects, although smaller in mag-nitude, were found by Koh et al17 (Fig 4B). Changes in
Figure 5. Correlation between overall ocular root mean square (RMS) abeSquares refer to data for sphericallike aberrations, diamonds to comalikepoints of each type refer to times t � 0, 10, and 20 seconds after a blink,for all higher-order aberrations.
comalike aberration may, perhaps, be anticipated, becauseof gravitational effects on the tear layer and recovery fromthe effects of lid pressure after blink.21 The effects would beexpected to produce asymmetry, primarily in the verticalmeridian of the anterior cornea. This suggestion is sup-ported by the fact that the largest changes were observed invertical and trefoil coma. For example, with a 6.5-mm pupil,the vertical coma terms Z3
�1 and Z5�1 increased between t
� 0 to t � 20 seconds from �0.109 to 0.653 �m and�0.088 to 0.442 �m, respectively, and the trefoil comaterms Z3
3 and Z53 from 0.041 to 0.115 �m and 0.043 to
0.159 �m, respectively. In contrast, the changes in thehorizontal coma terms Z 1 and Z 1 for the same pupil size
n and corneal aberration for 3.5-mm (A) and 6.5-mm (B) pupil diameters.ations, and circles to the sum of all higher-order aberrations. The 3 dataerrations all increasing with time. Lines are linear regressions of the data
rratioaberrthe ab
3 5
765
Ophthalmology Volume 111, Number 4, April 2004
generally were smaller, from 0.040 to 0.113 �m and 0.031to 0.091 �m, respectively. Changes in spherical aberrationmay, perhaps, be caused by a general tendency for the tearfilm to thin at a different rate at the center of the cornea ascompared with the periphery; infrared thermography sug-gests that corneal temperature drops more rapidly at thecenter because of a more rapid evaporation rate and thin-ning.41,42 A thinner central tear film would tend to introducemore positive spherical aberration, as observed (e.g., Z4
0
increases from �0.118 to �0.328 �m over the 20 secondsafter blink for a 6.5-mm pupil).
With the larger diameters of pupil, the postblink changesin MTF and Mf of the type illustrated in Figure 3 and Table1 will cause a loss primarily in contrast in the retinal imageand hence a loss in contrast sensitivity as measured byclinical techniques. It should be noted that any intraocularscattering will reduce further the MTFs and retinal imagecontrast.
The relation between the levels of corneal and totalaberration after blink is of particular interest, although itmust be borne in mind that the data are averaged across 20subjects, each on 5 occasions, and that the 2 types ofaberration were not recorded after the same blinks. Inspec-tion of Figure 1 suggests that the amounts of corneal andtotal ocular aberration are, in fact, very similar under allconditions, a conclusion that is supported by the similarityof the wavefront aberration plots in Figure 2. Figure 5illustrates, as examples, the relationship between the 2 typesof aberration for the 3.5-mm (Fig 5A) and 6.5-mm (Fig 5B)pupils. It can be seen that all the data fall close to a line ofunit slope with an intercept close to the origin. It thereforeseems that for both pupil diameters in our group of subjects,the corneal aberration must dominate the overall aberrationof the eye both immediately after the blink and subse-quently, and that the contribution to overall aberration of thelens and other media behind the anterior surface of the tearfilm must be relatively small. In the case of the immediatepostblink data, this disagrees with other workers who havefound that, in the normal eye, the contributions of cornealand internal aberrations to the overall aberration of the eyeare comparable in magnitude (and may be opposite insign).35,43 Correlation of corneal and overall ocular aberra-tions for the longer postblink time intervals is not surprising,because the measured higher-order aberrations seem to bedominated by the contributions from the increased tear-filmirregularity.
Our results did not show a statistically significant corre-lation with time after the blink for a 3.5-mm pupil diameter.For this pupil immediately after blink, amounts of totalRMS aberration approach the Marechal �/14 limit44 for neardiffraction-limited performance, and the absolute levels ofaberration remain small at t � 10 and t � 20 seconds(although the relative increase, of a factor between 2 and2.5, is comparable to that found with larger pupils). Theabsolute levels of total RMS aberration at fixed times afterblink increase with pupil diameter. Buehren et al21 found asimilar effect in their videokeratographic study in which thecontour of the central cornea remained relatively stable afterblink, whereas the more peripheral regions showed muchincreased variability.
766
Although straight lines have been used to fit the data inFigure 1, it is probable that the trends are nonlinear. Nemethet al20 recently suggested that tear film quality continues toimprove, and the videokeratographic surface irregularityand surface asymmetry indices continue to reduce over thefirst 6 seconds or so after a blink, and that they deterioratethereafter. Thus there may be a minimum in higher-orderaberrations a few seconds after a blink, rather than imme-diately after the blink. Studies with improved time resolu-tion should clarify whether this is true.
The results, like those of earlier authors,14–17 suggestthat the increasing aberrations induced by postblink tearlayer changes in part may limit the improvements in visualperformance that may be achievable with customized aber-ration corrections. The exact impact will depend, of course,on the blink interval in real-life conditions: although theblink interval varies with the task,26–29 it is in generalunlikely to be as great as 20 seconds. Although the resultsshow that tear layer effects will be less important underbright, photopic conditions when the pupil is small (3.5mm), the potential for benefit from customized correction isalso lower for such pupil diameters, because basic perfor-mance already approaches that set by the diffraction limit.45
It is unfortunate that any dynamic changes in tear-layeruniformity have their greatest degrading effect at thoselarger pupil diameters for which the theoretical benefits ofaberration correction are greatest. In any case, it is clear thatin any attempt to use customized corneal ablations to min-imize higher-order ocular aberration, care will need to betaken in selecting the time interval after a blink at which theinitial aberration measurement is made. As understanding ofthe postblink changes improves, it may be possible to rec-ommend that, for minimum variability, measurements arealways made at some fixed time interval after a blink.
References
1. MacRae SM, Krueger RR, Applegate RA. Customized Cor-neal Ablation: The Quest for Supervision. Thorofare, NJ:Slack Inc.; 2001.
2. Mrochen M, Kaemmerer M, Seiler T. Clinical results ofwavefront-guided laser in situ keratomileusis 3 months aftersurgery. J Cataract Refract Surg 2001;27:201–7.
3. Schwiegerling J. Theoretical limits to visual performance.Surv Ophthalmol 2000;45:139–46.
4. Huang D, Arif M. Spot size and quality of scanning lasercorrection of higher-order wavefront aberrations. J CataractRefract Surg 2002;28:407–16.
5. MacRae SM. Supernormal vision, hypervision and custom-ized corneal ablation. J Cataract Refract Surg 2000;26:154–7.
6. Montes-Mico R, Charman WN. Choice of spatial frequencyfor contrast sensitivity evaluation after corneal refractive sur-gery. J Refract Surg 2001;17:646–51.
7. Montes-Mico R, Charman WN. Mesopic contrast sensitivityfunction after excimer laser photorefractive keratectomy. JRefract Surg 2002;18:9–13.
8. Atchison DA, Collins MJ, Wildsoet CF, et al. Measurement ofmonochromatic ocular aberrations of human eyes as a functionof accommodation by the Howland aberroscope technique.Vision Res 1995;35:313–23.
9. He JC, Marcos S, Webb RH, Burns SA. Measurement of the

Montes-Mico et al � Postblink Changes in Wavefront Aberrations
wave-front aberration of the eye by a fast psychophysicalprocedure. J Opt Soc Am A Opt Image Sci Vis 1998;15:2449–56.
10. Hofer H, Artal P, Singer B, et al. Dynamics of the eye’s waveaberration. J Opt Soc Am A Opt Image Sci Vis 2001;18:497–506.
11. Artal P, Ferro M, Miranda I, Navarro R. Effects of aging inretinal image quality. J Opt Soc Am A 1993;10:1656–62.
12. Oshika T, Klyce SD, Applegate RA, Howland HC. Changes incorneal wavefront aberrations with aging. Invest OphthalmolVis Sci 1999;40:1351–5.
13. McLellan JS, Marcos S, Burns SA. Age-related changes inmonochromatic wave aberrations of the human eye. InvestOphthalmol Vis Sci 2001;42:1390–5.
14. Albarran C, Pons AM, Lorente A, et al. Influence of the tearfilm on optical quality of the eye. Contact Lens Anterior Eye1997;20:129–35.
15. Thibos LN, Hong X. Clinical applications of the Shack-Hart-mann aberrometer. Optom Vis Sci 1999;76:817–25.
16. Tutt R, Bradley A, Begley C, Thibos LN. Optical and visualimpact of tear break-up in human eyes. Invest Ophthalmol VisSci 2000;41:4117–23.
17. Koh S, Maeda N, Kuroda T, et al. Effect of tear film break-upon higher-order aberrations measured with wavefront sensor.Am J Ophthalmol 2002;134:115–7.
18. Cronje-Dunn S, Harris WF. Keratometric variation: the influ-ence of a fluid layer. Ophthalmic Physiol Opt 1996;16:234–6.
19. Licznerski TJ, Kasprzak HT, Kowalik W. Analysis of shear-ing interferograms of tear film using fast Fourier transforms. JBiomed Opt 1998;3:23–37.
20. Nemeth J, Erdelyi B, Csakany B. Corneal topography changesafter a 15 second pause in blinking. J Cataract Refract Surg2001;27:589–92.
21. Buehren T, Collins MJ, Iskander DR, et al. The stability ofcorneal topography in the post-blink interval. Cornea 2001;20:826–33.
22. Nemeth J, Erdelyi B, Csakany B, et al. High-speed videoto-pographic measurement of tear film build-up time. InvestOphthalmol Vis Sci 2002;43:1783–90.
23. Ruben M, Guillon M. Contact Lens Practice. London: Chap-man and Hall; 1994:195, 453–80.
24. Porter J, Guirao A, Cox IG, Williams DR. Monochromaticaberrations of the human eye in a large population. J Opt SocAm A Opt Image Sci Vis 2001;18:1793–803.
25. Marcos S, Burns SA. On the symmetry between eyes ofwavefront aberration and cone directionality. Vision Res2000;40:2437–47.
26. King DC, Michels KM. Muscular tension and the human blinkrate. J Exp Psychol 1957;53:113–6.
27. York M, Ong J, Robbins JC. Variation in blink rate associatedwith contact lens wear and task difficulty. Am J Optom ArchAm Acad Optom 1971;48:461–7.
28. Monster AW, Chan HC, O’Connor D. Long-term trends inhuman eye blink rate. Biotelem Patient Monit 1978;5:206–22.
29. Patel S, Henderson R, Bradley L, et al. Effect of visual displayunit use on blink rate and tear stability. Optom Vis Sci1991;68:888–92.
30. Malacara D. Optical Shop Testing. 2nd ed. New York: JohnWiley & Sons; 1992.
31. Kim CJ, Shannon RR. Catalog of Zernike polynomials. In:Shannon RR, Wyant JC, eds. Applied Optics and OpticalEngineering. Vol. X. New York: Academic Press; 1987:193–221.
32. Metcalf H. Stiles-Crawford apodization. J Opt Soc Am 1965;55:72–4.
33. Goodman JW. Introduction to Fourier Optics. San Francisco:McGraw-Hill; 1968:101–33.
34. Howland HC, Howland B. A subjective method for the mea-surement of monochromatic aberrations of the eye. J Opt SocAm 1977;67:1508–18.
35. Marcos S, Barbero S, Llorente L, Merayo-Lloves J. Opticalresponse to LASIK surgery for myopia from total and cornealaberration measurements. Invest Ophthalmol Vis Sci 2001;42:3349–56.
36. Lorente A, Pons AM, Malo J, Artigas JM. Standard criterionfor fluctuations of the modulation transfer function in thehuman eye: application to disposable contact lenses. Ophthal-mic Physiol Opt 1997;17:267–72.
37. Salmon TO, Thibos LN, Bradley A. Comparison of the eye’swave-front aberration measured psychophysically and withthe Shack-Hartmann wave-front sensor. J Opt Soc Am A OptImage Sci Vis 1998;15:2456–65.
38. Prieto PM, Vargas-Martin F, Goelz S, Artal P. Analysis of theperformance of the Hartmann-Shack sensor in the human eye.J Opt Soc Am A Opt Image Sci Vis 2000;17:1388–98.
39. Rieger G. The importance of the precorneal tear film for thequality of optical imaging. Br J Ophthalmol 1992;76:157–8.
40. Tsubota K, Nakamori K. Effects of ocular surface area andblink rate on tear dynamics. Arch Ophthalmol 1995;113:155–8.
41. Mori A, Oguchi Y, Okusawa Y, et al. Use of high-speed,high-resolution thermography to evaluate the tear film layer.Am J Ophthalmol 1997;124:729–35.
42. Morgan PB, Soh MP, Efron N, Tullos AB. Potential applica-tions of ocular thermography. Optom Vis Sci 1993;70:568–76.
43. Artal P, Guirao A. Contributions of the cornea and lens to theaberrations of the human eye. Opt Lett 1998;23:1713–5.
44. Born M, Wolf E. Principles of Optics: Electromagnetic The-ory of Propagation, Interference, and Diffraction of Light. 7thed. Cambridge, United Kingdom: Cambridge UniversityPress; 1999:528.
45. Yoon GY, Williams DR. Visual performance after correctingthe monochromatic and chromatic aberrations of the eye. JOpt Soc Am A Opt Image Sci Vis 2002;19:266–75.
767