Bioinformatics Tools Enabling U-Statistics for Microarrays
18
Bioinformatics Tools Enabling U-Statistics for Microarrays Knut M. Wittkowski, The Rockefeller University Hospital, General Clinical Research Center, New York, NY 10021 USA (phone: 212-327-7175; fax: 212-327-8450; e-mail: [email protected]) Asifa Haider, The Rockefeller University, Laboratory of Investigative Dermatology, New York, NY 10021 (e-mail: [email protected]) Ephraim Sehayek, The Rockefeller University, Laboratory of Biochemical Genetics and Metabolism, (e-mail: [email protected]) Mayte Suárez-Fariñas, the Rockefeller University, Center for Studies in Physics and Biology (e-mail: [email protected] and [email protected]) Maurizio Pellegrino, the Rockefeller University, Center for Studies in Physics and Biology (e-mail: [email protected] and [email protected]) Alexandre Peshansky, The Rockefeller University Hospital, General Clinical Research Center and is now with the University of Medicine and Dentistry New Jersey, General Clinical Research Center, Newark, NJ 07103 (e- mail: [email protected]) Cameron Coffran, and The Rockefeller University, Department of Information Technology, New York, NY 10021 USA (e- mail: [email protected] and [email protected]) Sanford Coker The Rockefeller University, Department of Information Technology, New York, NY 10021 USA (e- mail: [email protected] and [email protected]) Abstract It is rare that a single gene is sufficient to represent all aspects of genomic activity. Similarly, most common diseases cannot be explained by a mutations at a single locus. Since complex systems tend to be neither linear nor hierarchical in nature, but to have correlated components of unknown relative importance, the assumptions of traditional (parametric) multivariate statistical methods can rarely be justified on theoretical grounds. Empirical “validation” is not only problematic, but also time consuming. Here we demonstrates how bioinformatics tools, ranging from spreadsheets to grids, can enable u-statistics as a non-parametric alternative for scoring multivariate ordinal data. Applications are shown to improve assessment of genetic risk factors, quality control of microarrays and signal value estimation, scoring genomic profiles that best correlated with complex risk factors (cardiovascular diseases), and complex responses to an intervention (treatment of psoriasis). I. Introduction When applying statistical methods to complex phenomena, a single measure often does not reflect all relevant aspects to be considered, so that several measures of influences and/or outcomes need to be considered. When the definite measure is not easily obtained, surrogate NIH Public Access Author Manuscript Conf Proc IEEE Eng Med Biol Soc. Author manuscript; available in PMC 2008 November 17. Published in final edited form as: Conf Proc IEEE Eng Med Biol Soc. 2006 ; 1: 3464–3469. doi:10.1109/IEMBS.2006.260846. NIH-PA Author Manuscript NIH-PA Author Manuscript NIH-PA Author Manuscript
-
Upload
rockefeller -
Category
Documents
-
view
3 -
download
0
Transcript of Bioinformatics Tools Enabling U-Statistics for Microarrays
Bioinformatics Tools Enabling U-Statistics for Microarrays
Knut M. Wittkowski,The Rockefeller University Hospital, General Clinical Research Center, New York, NY 10021 USA(phone: 212-327-7175; fax: 212-327-8450; e-mail: [email protected])
Asifa Haider,The Rockefeller University, Laboratory of Investigative Dermatology, New York, NY 10021 (e-mail:[email protected])
Ephraim Sehayek,The Rockefeller University, Laboratory of Biochemical Genetics and Metabolism, (e-mail:[email protected])
Mayte Suárez-Fariñas,the Rockefeller University, Center for Studies in Physics and Biology (e-mail:[email protected] and [email protected])
Maurizio Pellegrino,the Rockefeller University, Center for Studies in Physics and Biology (e-mail:[email protected] and [email protected])
Alexandre Peshansky,The Rockefeller University Hospital, General Clinical Research Center and is now with the Universityof Medicine and Dentistry New Jersey, General Clinical Research Center, Newark, NJ 07103 (e-mail: [email protected])
Cameron Coffran, andThe Rockefeller University, Department of Information Technology, New York, NY 10021 USA (e-mail: [email protected] and [email protected])
Sanford CokerThe Rockefeller University, Department of Information Technology, New York, NY 10021 USA (e-mail: [email protected] and [email protected])
AbstractIt is rare that a single gene is sufficient to represent all aspects of genomic activity. Similarly, mostcommon diseases cannot be explained by a mutations at a single locus. Since complex systems tendto be neither linear nor hierarchical in nature, but to have correlated components of unknown relativeimportance, the assumptions of traditional (parametric) multivariate statistical methods can rarelybe justified on theoretical grounds. Empirical “validation” is not only problematic, but also timeconsuming. Here we demonstrates how bioinformatics tools, ranging from spreadsheets to grids, canenable u-statistics as a non-parametric alternative for scoring multivariate ordinal data. Applicationsare shown to improve assessment of genetic risk factors, quality control of microarrays and signalvalue estimation, scoring genomic profiles that best correlated with complex risk factors(cardiovascular diseases), and complex responses to an intervention (treatment of psoriasis).
I. IntroductionWhen applying statistical methods to complex phenomena, a single measure often does notreflect all relevant aspects to be considered, so that several measures of influences and/oroutcomes need to be considered. When the definite measure is not easily obtained, surrogate
NIH Public AccessAuthor ManuscriptConf Proc IEEE Eng Med Biol Soc. Author manuscript; available in PMC 2008 November 17.
Published in final edited form as:Conf Proc IEEE Eng Med Biol Soc. 2006 ; 1: 3464–3469. doi:10.1109/IEMBS.2006.260846.
NIH
-PA Author Manuscript
NIH
-PA Author Manuscript
NIH
-PA Author Manuscript
measures have to be evaluated, when the aim is to ameliorate a complex phenomenon, adefinitive measure may not even exist. Such problems may arise in many applications, althoughhere we focus on SNP and gene expression microarrays.
Most multivariate methods are based on the linear model, either explicitly, as in regression,factor, discriminant, and cluster analysis, or implicitly, as in neural networks. One scores eachvariable individually on a comparable scale, either present/absent, low/inter mediate/high, 1to 10, or z-transformation, and then defines a global score as a weighted average of these scores.Thus, data are interpreted as points in a Euclidian space. The number of dimensions is reducedby assuming them to be related by a function of known type (linear, exponential, etc.), allowingone to determine for each point the Euclidian distance from a model hyperspace.
While mathematically elegant and computationally efficient, this approach has shortcomingswhen applied to real world data. Since neither the variables’ relative importance and correlationnor their functional relationship with the immeasurable latent factor ‘overall usefulness’,‘efficacy’, ‘risk’, or ‘safety’ are typically known, construct validity [1] cannot be establishedon theoretical grounds. Instead, one needs to resort to empirical ‘validation’, choosing weightsand functions to provide a reasonable fit with a ‘gold standard’ when applied to a sample. Thediversity of scoring systems used attests to the subjective nature of this process.
Even when the assumptions of the linear model regarding contribution to and relationship withthe underlying immeasurable factor are questionable, as in genetics and genomics, one canoften assume that the contribution of a locus and the expression of a gene have at least an‘orientation’, i.e., that, if all other conditions are held constant, presence of an additionalmutation or increase in a gene’s expression is either ‘good’ or ‘bad’. The sign of this orientationcan be known (hypothesis testing) or unknown (selection procedures).
When faced with the risk of anal vs. vaginal contacts for sexual transmission of HIV [2], wepresented a partial ordering for dealing with graded and ungraded variables, which allowed toincorporate knowledge that anal contacts carry more risk than vaginal contacts. Using themarginal likelihood (MrgL) for this partial ordering, we developed a non-parametric methodto assess overall risk of HIV infection based on different types of behavior [2] and overallprotective effect of barrier methods [3]. More recently, we applied this approach to assessingimmunogenicity in cancer patients [4]. In short, one determines all rankings compatible withthe partial ordering of the observed multivariate data and then computes a vector of scores asthe average across these rankings. While this constituted the first objective approach to theanalysis of multivariate ordinal data, because it did not rely on questionable assumptions, itlacked computational efficiency. The computational effort required could be prohibitive evenfor moderately sized samples, let alone micro arrays with thousands of SNPs or genes.
Here, we present computational tools based on a closely related approach, u-statistics, whichis computationally more efficient. With u-statistics [5], individual analyses can often beperformed using spreadsheet software. Screening for optimal subsets of explanatory variablesbecomes feasible without the restrictions imposed by commonly used hierarchical strategies,although larger sample sizes and, even more importantly, larger numbers of variables requirea variety of bioinformatics strategies.
U-statistics let to a family of simple tests. For uncensored data, this includes stratified ranktests with MrgL block weights [6] in general, for binary data the stratified MCNEMAR [7] test[8], for designs with two or more treatments the WMW [9], KRUSKAL-WALLIS [10], and FRIEDMAN
tests [11].
Wittkowski et al. Page 2
Conf Proc IEEE Eng Med Biol Soc. Author manuscript; available in PMC 2008 November 17.
NIH
-PA Author Manuscript
NIH
-PA Author Manuscript
NIH
-PA Author Manuscript
II. MethodsA. U Statistics
To develop a computationally efficient procedure to score multivariate ordinal data, we willnot make any assumptions regarding the functional relationships between variables and thelatent factor, except that each variable has an orientation, i.e., that if all other variables are heldconstant, an increase in this variable is either always ‘good’ or always ‘bad’.
Each subject is compared to every other subject in a pairwise manner. For stratified designs,these comparisons will be made within each stratum (e.g., sex) only. When the genes of interestcan be assumed to be correlated with the outcome, although not necessarily in a linear fashion,a partial ordering [12] among the subjects is easily defined. If the second of two subjects hasvalues at least as high among all variables, but higher in at least one variable, it is ‘superior’.
For univariate data, all pairs of observations can be decided, i.e., the resulting ordering is‘çomplete’. For multivariate data, however, the ordering is only ‘partial’, in general, becausefor some pairs of expression profiles the order may be undetermined. This is the case, forinstance, if the expression of the first gene is higher in subject A, but that of the second geneis higher in subject B.
Although a partial ordering does not guarantee that all pairs of subjects can be ordered, typicallyall subjects can be scored. With I as an indicator function, one assigns a score to each subjectby counting the number of subjects being inferior and subtracting the number of subjects beingsuperior
The lattice on Fig. 1 provides a graphical representation of a partial ordering for multivariatedata, showing the main features of u-statistics. (1) Pairs are linked if the order is independentof any (non-zero) weights that could be assigned to the different variables. (2) Adding a highlycorrelated variable is unlikely to have any effect on the lattice structure. Relative importanceand correlation do not even need to be constant, but may depend on the other variables.
Some applications may ask for specific partial orderings. Intervals, for instance, can only beordered if they are disjoint. This leads to tests for censored data, including the tests of GEHAN
[13,14] for KAPLAN-MEIER curves. Drawing on a general theory, yields a family of statisticalmethods for a variety of situations, including signal value estimation.
When estimating the signal value for a particular gene on a microarray from a probe set of pairsof perfect (PM) and mis-matches (MM), several parametric and semi-parametric (‘robust’)methods have been proposed. An MM differs from a PM in that a single nucleotide is exchangedfor its WATSON-CRICK complement to estimate non-specific binding. For genes that are notexpressed, it is to be expected that mismatches have higher expression levels than perfectmatches ( xk,PM < xk,MM) in 50% of all probe pairs. To allow for a linear model based on thelogarithms of the differences, it has been suggested [15] to artificially decrease xk,MM of suchprobe pairs to a heuristically motivated level that ensures each difference to be positive. Ofcourse, this decreases sensitivity for genes with low expression levels. When using u statistics,this bias can easily be overcome by employing the following partial ordering:
From this, one selects the pair with a score of zero as the most ‘typical’, or, if necessary, theaverage or median among those closest to zero. As this guarantees ‘outliers’ to be excluded,
Wittkowski et al. Page 3
Conf Proc IEEE Eng Med Biol Soc. Author manuscript; available in PMC 2008 November 17.
NIH
-PA Author Manuscript
NIH
-PA Author Manuscript
NIH
-PA Author Manuscript
the perceived need for taking logarithms is overcome. Even if one is to request that this estimatebe non-negative, the resulting bias would be much lower than if one decreases xk,MM for eachpair where xk,PM < xk,MM.
B. Bioinformatics toolsWhen HOEFFDING formalized this concept of u-statistics in 1948 [5], he allowed for multivariateobservations, yet the potential of u-statistics for the analysis of multivariate data was not fullyrecognized, most likely because the computational effort to handle multivariate data wasprohibitive, in general, and no algorithm was presented that would have allowed applicationof the method at least for small sample sizes. When GEHAN [13,14], in 1965, applied u statisticsto censored observations, he viewed them as univariate observations (xjk1: time under study),accompanied by an indicator of precision (xjk2 = 1: event, xjk2 = 0: censoring).
Even with today’s computers, dealing with large quantities of complex data requires acombination of bioinformatics strategies to develop computationally feasible tools.
Methods—First and foremost, a method had to be found that was not np-hard. Moving fromthe MrgL principle to u statistics, while foregoing some second order information, formed thebasis for developing algorithms that were computationally efficient.
Algorithms—The u-test, except for a missing variance term, had already been published in1914, 33 years before MANN AND WHITNEY, by THOMAS DEUCHLER [16]. Unfortunately, he presented hisideas more verbally, which made the results less accessible internationally. On the other hand,being a psychologist, he laid out a scheme for computations that, had it been more widelyknown, could potentially have given u-statistics an equal footing with methods based on thelinear model. Based on his work, we developed algorithms that, besides growing with thesquare of the number of subjects only, are easily implemented.
For small samples, spreadsheets for different partial orderings can be downloaded frommuStat.rockefeller.edu. While clearly not the suggested implementation for routineapplications, this demonstrates the ease and computational simplicity of the method.
Language—The power of S (www.insightful.com) or R (www.r-project.org) as abioinformatics tool lies in the ease with which statistical concepts can be expressed in the code.The downside of having a conceptually simple language is lack of computational efficiency.
Implementation—To deal with a large number of subjects, several subroutines had to bewritten in C for computational efficiency.
Environment—‘Screening’ thousands of expression profiles or epistatic sets to find theprofile or set whose scores correlate best with the scores of a complex phenotype, can easilybecome impractical even on a fast computer or traditional ‘beowolf’ style cluster. Thus, wehave formed a grid of PC work stations at The Rockefeller University Hospital. Data isuploaded to a Web front-end and then passed to a dispatcher that splits the job in dozens ofwork units, which are then sent to the work stations to be analyzed in parallel.
The grid is controlled by a Linux server acting that acts as dispatcher, verifies integrity ofreturned work units, and notifies the requester when the job is done. This server runs an IBMDB2 database, secure Apache web server for a management console, and grid software fromUnited Devices (www.ud.com). The client nodes consist of mixed x86 Microsoft Windowsworkstations running the United Devices agent, which processes the work unit at low prioritywhenever the workstation is idle. As the agent is centrally customized to include an installation
Wittkowski et al. Page 4
Conf Proc IEEE Eng Med Biol Soc. Author manuscript; available in PMC 2008 November 17.
NIH
-PA Author Manuscript
NIH
-PA Author Manuscript
NIH
-PA Author Manuscript
of the S-Plus application, it suffices for the work units to include the subset of the data to beanalyzed and the S-Plus script to do the analysis.
These tools and services, which for the first time make u-statistics for multivariate data morewidely available, can be accessed through muStat.rockefeller.edu
III. ApplicationsA. Genetic Data from Trios (Case and Parents)
In a study on the genetics of cardiovascular diseases [17], we are analyzing genetic data ofhypercholesteremia patients and their parents. Each parent transmits one of two alleles at eachlocus and we would like to find loci where one form is transmitted more often to affectedchildren than the other.
In 1993, the sign test formula resurfaced in the Transmission Disequilibrium Test (TDT)[18] with pT and qT counting the number of rare and common alleles, respectively, transmittedto a diseased child. Since then, the TDT has become one of the most frequently used methodsin genetics.
Although non-parametric tests require fewer assumptions to be made than parametric tests,they still require that observations are independent. While each parent transmits its alleleindependently, the effects of the two alleles transmitted to the same child are not independentlyobserved. For a dominant locus, where one copy of the disease allele is sufficient to cause thedisease, heterozygous children of two heterozygous parents contribute evidence associatingboth alleles with the disease. If one simply counts alleles, the contribution of these childrencancel each other out in the effect estimate, but inflate the variance term, reducing the powerof the TDT to detect dominant diseases.
Fig. 3 demonstrates how even exact tests, where all possible permutations of data need to beconsidered, can be implemented in as few as four lines of native S language code.
B. Microarray Quality ControlFor univariate data, the median and the range between the 25% and the 75% quantile are simpleapplication of u-statistics. Interestingly, they are conceptually much simpler than mean andstandard deviation. Neither need exclusion of ‘outliers’ to be considered nor needs ajustifications to be sought for taking the squares (rather than, for instance, the absolute value)of an observation’s distance from the ‘center’ (mean or median, respectively) to determine thedeviation from a model hyper plane.
As one of our applications of u-statistics to microarrays, we have recently developed a tool,termed ‘Harshlight’ [19,20] to identify localized defects on the surface of microarrays byplotting the distance of each location’s log expression from the median across a set of chips.Since probes are randomly allocated on the chip, the shadowy circle on the left side of this u-filter image (Fig. 4b) is clearly an artifact, as are the isolated bright and dark spots close to thecenter and in the upper right corner. Fig. 4b demonstrates how Harshlight masks areas withlocalized defects, preventing them from interfering with subsequent analyses.
The justification for the choice of the arithmetic mean (average) as the measure of centraltendency in linear models relies either on the law of large numbers and the central limit theoremor the assumption that the distribution of errors is symmetrical, in general, and Gaussian, inparticular. Here, neither assumption is easily justified. Fig. 5 demonstrates that u-filteringcauses less ‘ghosting’ than average filtering.
Wittkowski et al. Page 5
Conf Proc IEEE Eng Med Biol Soc. Author manuscript; available in PMC 2008 November 17.
NIH
-PA Author Manuscript
NIH
-PA Author Manuscript
NIH
-PA Author Manuscript
C. Signal Value EstimationOn Affymetrix microarrays, standardized activity is often computed as log(PM-MM),assuming multiplicative effects and additive noise, although fluid dynamics close to surfacesare known to be highly non-linear.
When some genes are not expressed in the particular tissue, MM and PM reflect random noiseonly, so that MM is expected to be larger than PM in 50% of all cases. The logarithm of anegative number, however, is undefined, so for a formula based on the multiplicative modelto be applicable, it has been argued that a probe with higher mis- than perfect match needs tobe “background corrected”. Fig. 6 uses data from one of our psoriasis patients to demonstratethe bias created by this “correction”. By elevating all non-expressed genes to have signal valueestimates between 1 and 100, it becomes virtually impossible to differentiate genes with ‘true’expression levels within this range from unexpressed genes that were merely ‘corrected’.
From Fig. 7, using data from the commonly used ‘spike in’ dataset, we recognize an ‘old friend’from statistical text-books. As in many physical and biological systems, low concentrationsare less reliably measured. Thus, variance increases as the concentration decreases. MAS 5.0‘flattens’ the typical sigmoidal curve, but, as is to be expected, decreasing the variance for lowconcentrations comes at a price: a substantial bias.
D. Complex Dependent VariablesWhen trying to identify the factors that contribute to a complex phenomenon such as diseasesusceptibility or treatment effect, we are faced with several problems. First, most complexphenomena lack a physical scale to be ‘measured’ in the traditional sense. Instead, we are facedwith several surrogate variables. While it is often reasonable to assume that ‘more’ is ‘worse’for each of them, it may not be easy to determine, how much ‘more’ is how much ‘worse’.
Psoriasis, for instance, is a complex inflammatory disease characterized by hyperproliferationof keratinocytes and accumulation of activated T-cells in lesional skin. Treatments with variousimmunomodulatory or -suppressive agents (e.g., cyclosporine and methotrexate) have atherapeutic index, which precludes long-term treatment. Therefore, there is an ongoing interestin reducing toxicity through targeting cells mediating this disease more specifically.
The PASI (Psoriasis Area Severity Index) and its variants, while frequently used, are crudemeasures at best. As a linear scoring systems, it is computed by scoring thickness, redness, andscaling on a scale from 0 (none) to 4 (striking) for four body areas independently. The sum ofthese scores is then multiplied by the size of the area (legs: 40%, trunk: 30%, arms: 20%, head:10%) and a score for the estimated percentage of skin involved from 0 (none) to 6 (90-100%).These weighted sums of individual scores are then added to an overall score. One characteristicof the linear model is that the difference between slight and no redness, for instance, is assumedto have the same meaning as the difference between moderate and striking scaling.
One of the advantages of u scores is that they are invariant to scale transformations (logarithms,weights, etc.). Moreover, independency is not required. Adding highly correlated variables haslittle effect on the results. If the correlation is ‘perfect’, an additional variable would not haveaffected the results at all. Thus, u scores are perfectly suited for dealing with complexphenotypes, using the analytical tools described above.
E. Genetic profiles and genomic pathwaysOnce the effect has been scored, we can identify the set of independent variables that indicatethe most likely genomic pathway or genetic constellation causing the complex phenotype.
Wittkowski et al. Page 6
Conf Proc IEEE Eng Med Biol Soc. Author manuscript; available in PMC 2008 November 17.
NIH
-PA Author Manuscript
NIH
-PA Author Manuscript
NIH
-PA Author Manuscript
Activity profiles along a genomic pathway can be scored in essentially the same fashion asresponse profiles, although we are faced with two additional levels of complexity.
First, if the size of the subset of relevant variables among a total of n is unknown, 2n subsetsneed to be considered in an exhaustive search. Second, when scoring responses, it wasreasonable to assume that we know, whether ‘more’ is ‘better’ or ‘worse’. With genomicactivity, this is typically not true. If treatment were to shift activity from one pathways to theother ‘alternative’, less effective pathway, ‘better’ effects may be associated with less activityalong the former pathway and more activity along the other. On the other hand, if pathwaysare synergistic, more activity on either pathway may be ‘worse’. Thus, one may wish to allowfor various combinations of signs (polarities) to be associated with each set of activity variables.To allow for this, for each pathway (subset of genes) with k components, all 2k-1 possiblecombinations of polarities are to be considered.
When fitting linear models, variables are frequently added or dropped sequentially, e.g., byselecting the most ‘significant’ variable in univariate analyses first, and then add morevariables. As we have demonstrated [21], such strategies may not even come close to theoptimum. Tree based approaches (CART [22]), are also sequential in nature. Subjects areseparated by the most significant variable first, and each subset is then separated by anothersubset-specific variable. While this may result in easily communicated decision strategies, step-functions are not more easily justified on theoretical grounds than linear, exponential, orpolynomial functions. Moving to random forests reduces the effect of outliers, but does notaccount for interactions.
With u-statistics, non-parametric analysis of large sample sizes m (number of subjects) arefeasible, because the complexity is of order m2 only, compared to m! with the marginallikelihood principle. As there are “only” 30 000-35 000 human genes, looking into at least allpairs of genes before start pruning is within reach, but conducting 109 bivariate analyses takesseveral hours, even on a grid with 1000 PCs running at 2 GHz. Looking into sets of three genesamong the subset of 1000 most “interesting” genes selected from the uni- and bi-variateanalyses requires a similar effort.
With SNP arrays, the number of variables is larger (currently at 100K), but the knowledgeabout the sequence on the chromosome helps with reducing complexity.
However, the large amount of data created on the grid regarding evidence for epistaticinteraction between diplotypes is not easily interpreted. Thus, after the results from the nodesare collected, we are using S-Plus to generate maps highlighting evidence for epistaticinteraction (Fig. 9).
IV. Discussion and ConclusionsMultivariate ordinal data are often used to assess semi-quantitative characteristics. Traditionalapproaches for combining measures into a utility function require that relative weights beassigned to the measures. Typically, neither the transformation (linear, exponential,polynomial, ...), nor the weights are easily justified, but results based on inappropriate modelseasily may be misleading.
A frequently used attempt to resolve this dilemma is to use a ‘training set’ to determinetransformations and weights within this set, and then to check, if this scoring system is‘reasonably good’ when applied to an ‘evaluation set’. If not, one selects another family and/or optimality criterion and tries again. Of course, a set of functions and weights that seems tobe ‘reasonably good’ in the evaluation set is not guaranteed to be optimal and the number ofpossible combinations of functions and weights is infinite.
Wittkowski et al. Page 7
Conf Proc IEEE Eng Med Biol Soc. Author manuscript; available in PMC 2008 November 17.
NIH
-PA Author Manuscript
NIH
-PA Author Manuscript
NIH
-PA Author Manuscript
U statistics overcome the limitations of many approaches. No assumptions other thenmonotonicity need to be made. This, in turn, allows for u-statistics to drive a new generationof systems for decision support, in general, and predictive medicine, in particular. Because noempirical validation is needed, scoring systems can be created ad hoc, opening a range ofapplications, such as diagnostic support fine tuned to the particular characteristics of a patientand risk assessments in homeland security, where intelligence suggests indicators for imminentthreats, but the relative importance of these indicators would only be known post mortem[23].
AcknowledgementsThis work was supported in part by the National Center for Research Resources at the NIH under GCRC grant M01-RR00102.
REFERENCES[1]. Cronbach LJ, Meehl PE. Construct validity in psychological tests. Psychological Bulletin
1955;52:281–302. [PubMed: 13245896][2]. Susser E, Desvarieux M, Wittkowski KM. Reporting sexual risk behavior for HIV: a practical risk
index and a method for improving risk indices. American Journal of Public Health 1998;88:671–674. [PubMed: 9551017]
[3]. Wittkowski KM, Susser E, Dietz K. The protective effect of condoms and nonoxynol-9 against HIVinfection. American Journal of Public Health 1998;88:590–596. 972. [PubMed: 9551000]
[4]. Banchereau J, Palucka AK, Dhodapkar M, Kurkeholder S, Taquet N, Rolland A, Taquet S, CoqueryS, Wittkowski KM, Bhardwj N, Pineiro L, Steinman R, Fay J. Immune and clinical responses aftervaccination of patients with metastatic melanoma with CD34+ hematopoietic progenitor-deriveddendritic cells. Cancer Research 2001;61:6451–8. [PubMed: 11522640]
[5]. Hoeffding W. A class of statistics with asymptotically normal distribution. Annals of MathematicalStatistics 1948;19:293–325.
[6]. Wittkowski KM. Friedman-type statistics and consistent multiple comparisons for unbalanceddesigns. Journal of the American Statistical Association 1988;83:1163–1170.
[7]. McNemar Q. Note on the sampling error of the differences between correlated proportions orpercentages. Psychometrica 1947;12:153–157.
[8]. Wittkowski KM, Liu X. A statistically valid alternative to the TDT. Human Heredity 2002;54:157–64. [PubMed: 12626848]
[9]. Wilcoxon F. Individual Comparisons by Ranking Methods. Biometrics 1954;1:80–83.[10]. Kruskal WH, Wallis WA. Use of ranks in one-criterion variance analysis. Journal of the American
Statistical Association 1952;47:583–631.[11]. Friedman M. The use of ranks to avoid the assumption of normality implicit in the analysis of
variance. Journal of the American Statistical Association 1937;32:675–701.[12]. Wittkowski KM. An extension to Wittkowski. Journal of the American Statistical Association
1992;87:258.[13]. Gehan EA. A generalised two-sample Wilcoxon test for doubly censored samples. Biometrika
1965;52:650–653. [PubMed: 5858975][14]. Gehan EA. A generalised Wilcoxon test for comparing arbitrarily singly censored samples.
Biometrika 1965;52:203–223. [PubMed: 14341275][15]. Hubbell E, Liu W-M, Mei R. Robust estimators for expression analysis. Bioinformatics
2002;18:1585–1592. [PubMed: 12490442][16]. Deuchler G. Über die Methoden der Korrelationsrechnung in der Pädagogik und Psychologie. Z.
pädagog. Psychol 1914;15:114–131. 145–159, 229–242.[17]. Sehayek E, Yu HJ, von Bergmann K, Lutjohann D, Wittkowski KM, Levenstien MA, Gordon D,
Stoffel M, Garcia-Naveda L, Salit J, Blundell M, Friedman JM, Breslow JL. Genetics of cholesterolabsorption and plasma plant sterol levels on the Pacific island of Kosrae. Circulation 2005;110:720.
Wittkowski et al. Page 8
Conf Proc IEEE Eng Med Biol Soc. Author manuscript; available in PMC 2008 November 17.
NIH
-PA Author Manuscript
NIH
-PA Author Manuscript
NIH
-PA Author Manuscript
[18]. Spielman RS, McGinnis RE, Ewens WJ. Transmission test for linkage disequilibrium: the insulingene region and insulin-dependent diabetes mellitus (IDDM). American Journal of Human Genetics1993;52:506–16. [PubMed: 8447318]
[19]. Suárez-Fariñas M, Haider A, Wittkowski KM. Harshlighting” small blemishes on microarrays.BMC Bioinformatics 2005;6:65. [PubMed: 15784152]
[20]. Suarez-Farinas M, Pellegrino M, Wittkowski KM, Magnasco MO. Harshlight: a “corrective make-up” program for microarray chips. BMC Bioinformatics 2005;6:294. [PubMed: 16336691]
[21]. Wittkowski KM, Lee E, Nussbaum R, Chamian FN, Krueger JG. Combining several ordinalmeasures in clinical studies. Statistics in Medicine 2004;23:1579–1592. [PubMed: 15122738]
[22]. Breiman, L. Classification and regression trees. Wadsworth; Belmont, CA: 1984.[23]. Wittkowski KM. Novel Methods for Multivariate Ordinal Data applied to Genetic Diplotypes,
Genomic Pathways, Risk Profiles, and Pattern Similarity. Computing Science and Statistics2003;35:626–646.
Wittkowski et al. Page 9
Conf Proc IEEE Eng Med Biol Soc. Author manuscript; available in PMC 2008 November 17.
NIH
-PA Author Manuscript
NIH
-PA Author Manuscript
NIH
-PA Author Manuscript
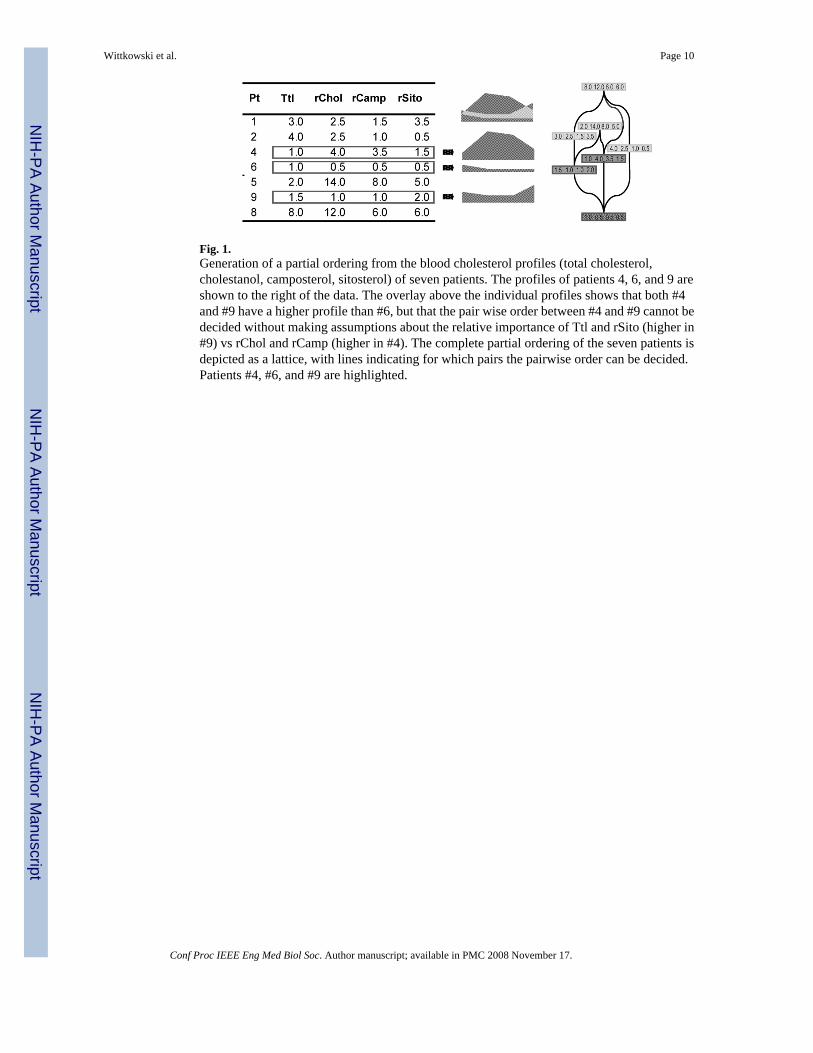
Fig. 1.Generation of a partial ordering from the blood cholesterol profiles (total cholesterol,cholestanol, camposterol, sitosterol) of seven patients. The profiles of patients 4, 6, and 9 areshown to the right of the data. The overlay above the individual profiles shows that both #4and #9 have a higher profile than #6, but that the pair wise order between #4 and #9 cannot bedecided without making assumptions about the relative importance of Ttl and rSito (higher in#9) vs rChol and rCamp (higher in #4). The complete partial ordering of the seven patients isdepicted as a lattice, with lines indicating for which pairs the pairwise order can be decided.Patients #4, #6, and #9 are highlighted.
Wittkowski et al. Page 10
Conf Proc IEEE Eng Med Biol Soc. Author manuscript; available in PMC 2008 November 17.
NIH
-PA Author Manuscript
NIH
-PA Author Manuscript
NIH
-PA Author Manuscript
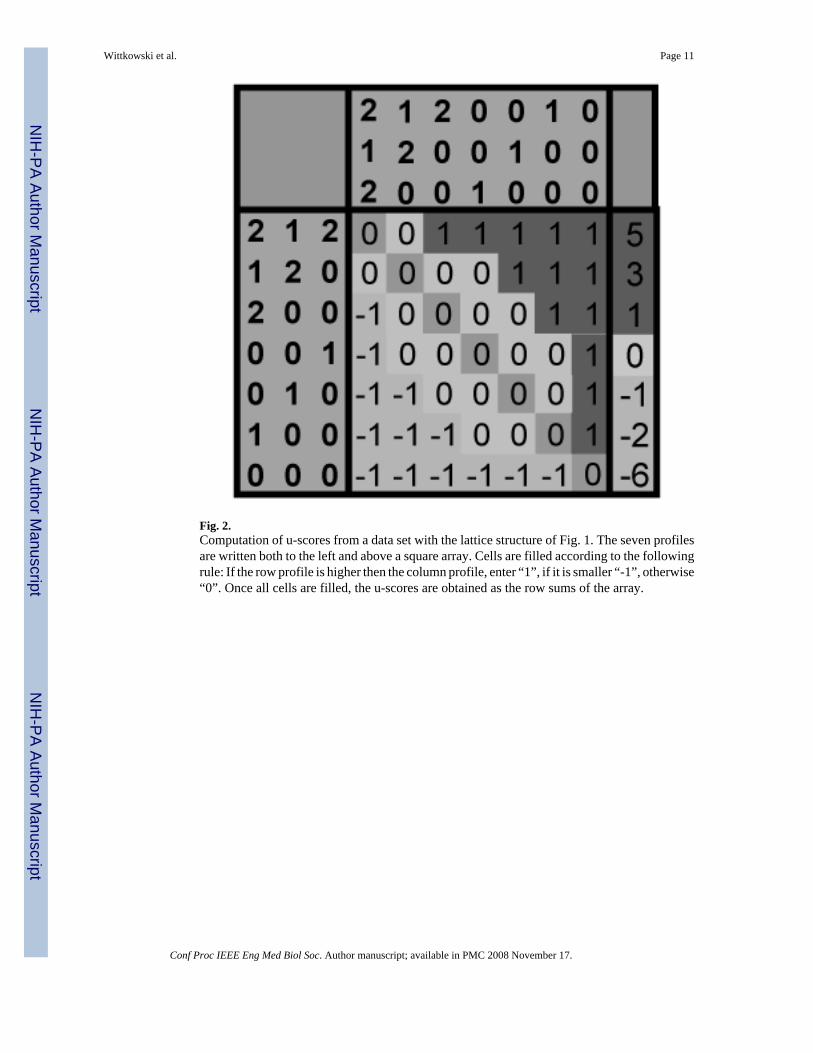
Fig. 2.Computation of u-scores from a data set with the lattice structure of Fig. 1. The seven profilesare written both to the left and above a square array. Cells are filled according to the followingrule: If the row profile is higher then the column profile, enter “1”, if it is smaller “-1”, otherwise“0”. Once all cells are filled, the u-scores are obtained as the row sums of the array.
Wittkowski et al. Page 11
Conf Proc IEEE Eng Med Biol Soc. Author manuscript; available in PMC 2008 November 17.
NIH
-PA Author Manuscript
NIH
-PA Author Manuscript
NIH
-PA Author Manuscript
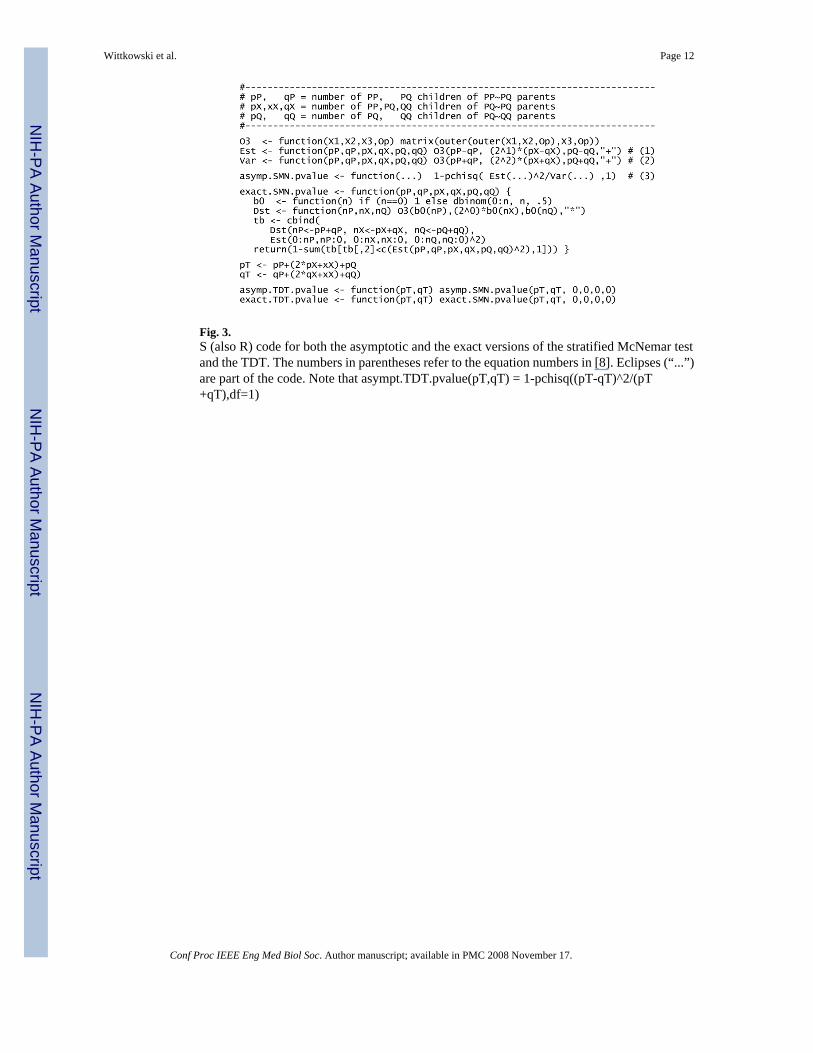
Fig. 3.S (also R) code for both the asymptotic and the exact versions of the stratified McNemar testand the TDT. The numbers in parentheses refer to the equation numbers in [8]. Eclipses (“...”)are part of the code. Note that asympt.TDT.pvalue(pT,qT) = 1-pchisq((pT-qT)^2/(pT+qT),df=1)
Wittkowski et al. Page 12
Conf Proc IEEE Eng Med Biol Soc. Author manuscript; available in PMC 2008 November 17.
NIH
-PA Author Manuscript
NIH
-PA Author Manuscript
NIH
-PA Author Manuscript
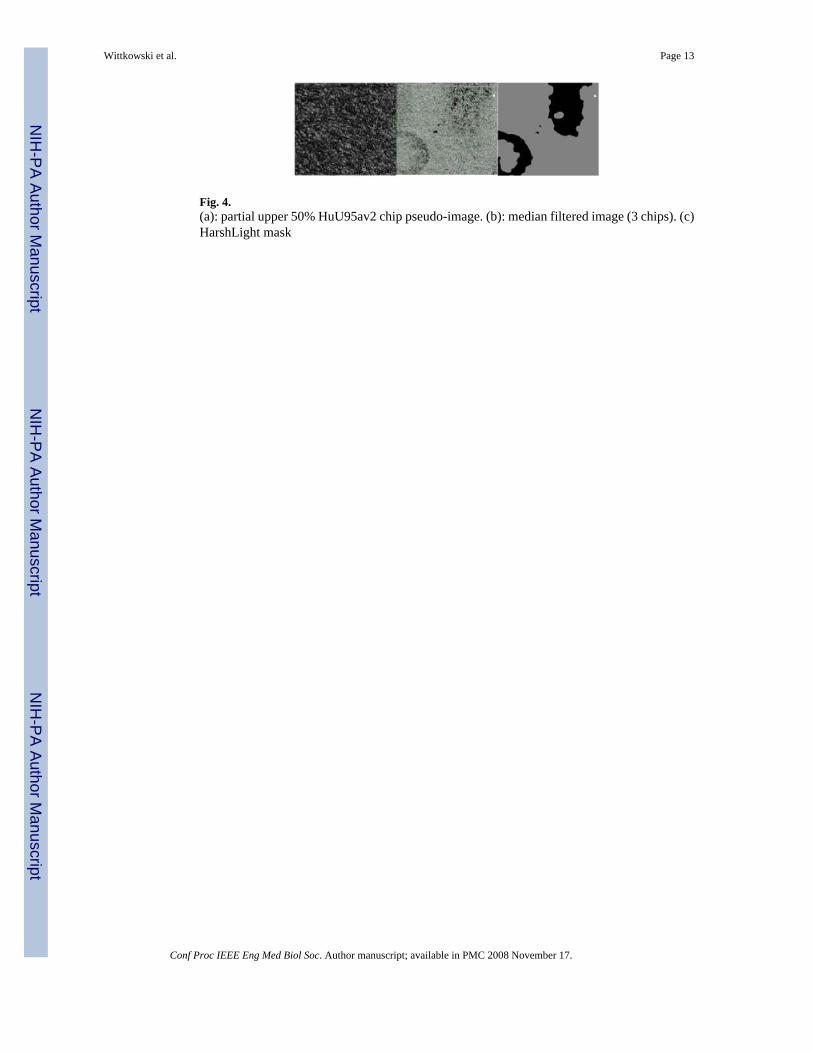
Fig. 4.(a): partial upper 50% HuU95av2 chip pseudo-image. (b): median filtered image (3 chips). (c)HarshLight mask
Wittkowski et al. Page 13
Conf Proc IEEE Eng Med Biol Soc. Author manuscript; available in PMC 2008 November 17.
NIH
-PA Author Manuscript
NIH
-PA Author Manuscript
NIH
-PA Author Manuscript
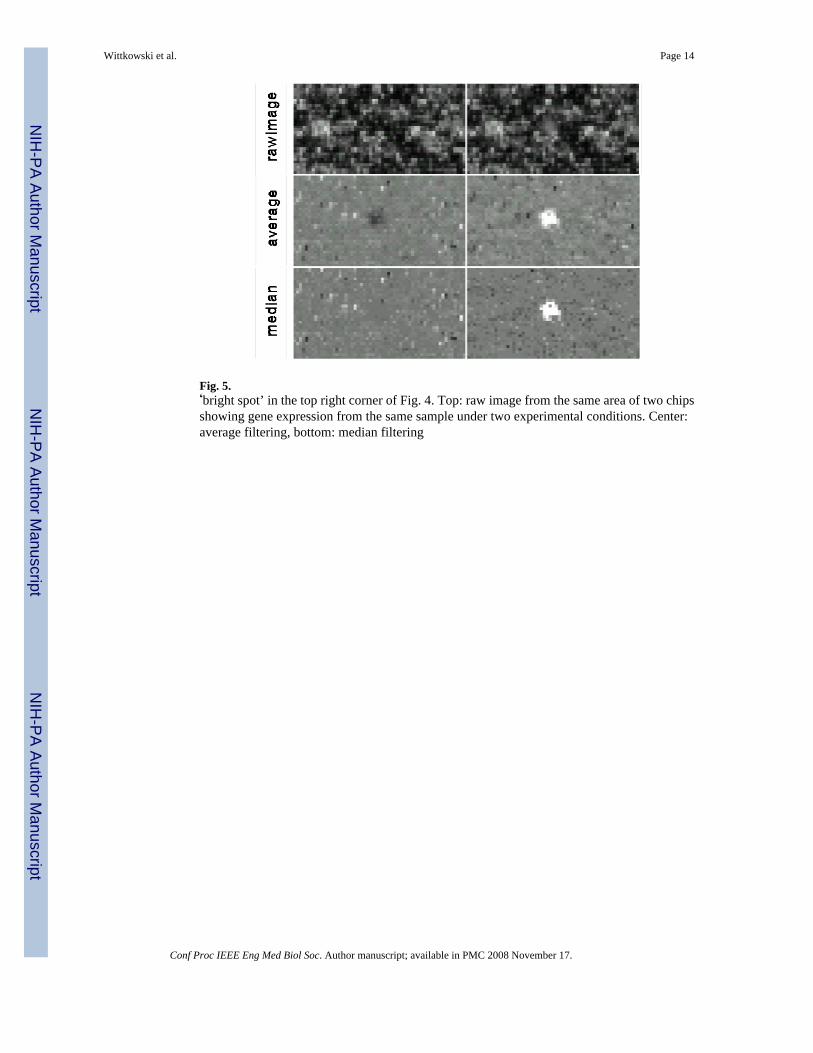
Fig. 5.‘bright spot’ in the top right corner of Fig. 4. Top: raw image from the same area of two chipsshowing gene expression from the same sample under two experimental conditions. Center:average filtering, bottom: median filtering
Wittkowski et al. Page 14
Conf Proc IEEE Eng Med Biol Soc. Author manuscript; available in PMC 2008 November 17.
NIH
-PA Author Manuscript
NIH
-PA Author Manuscript
NIH
-PA Author Manuscript
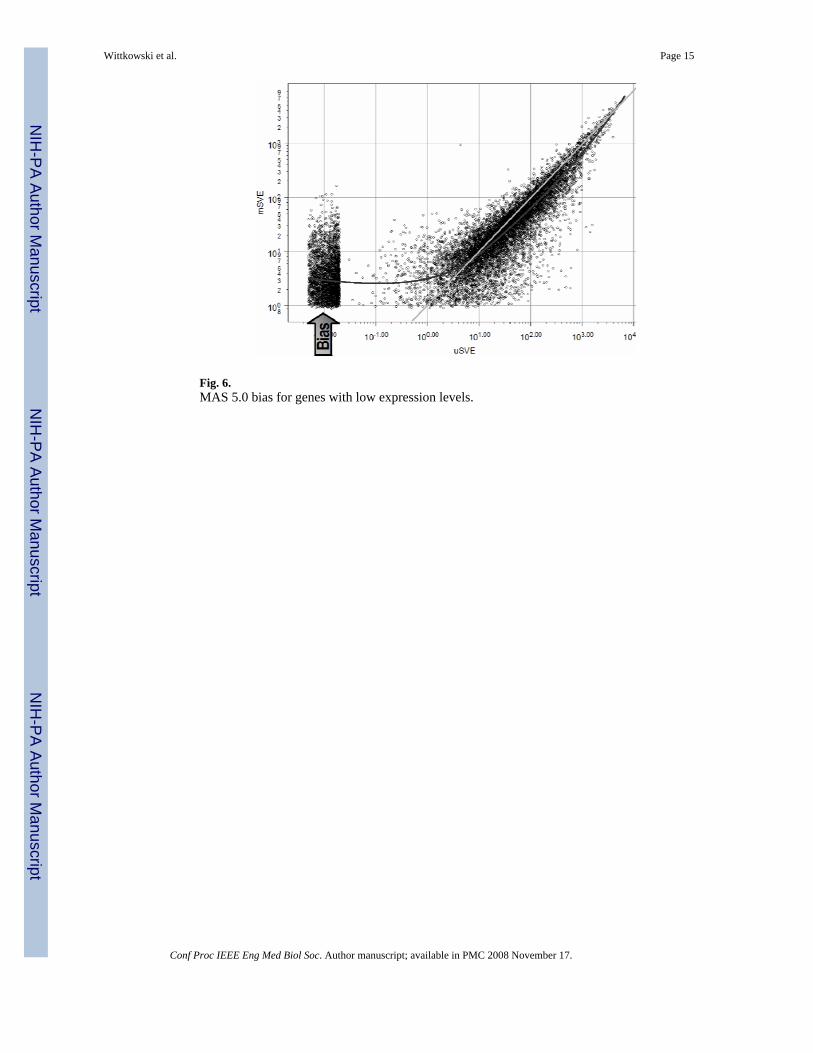
Fig. 6.MAS 5.0 bias for genes with low expression levels.
Wittkowski et al. Page 15
Conf Proc IEEE Eng Med Biol Soc. Author manuscript; available in PMC 2008 November 17.
NIH
-PA Author Manuscript
NIH
-PA Author Manuscript
NIH
-PA Author Manuscript
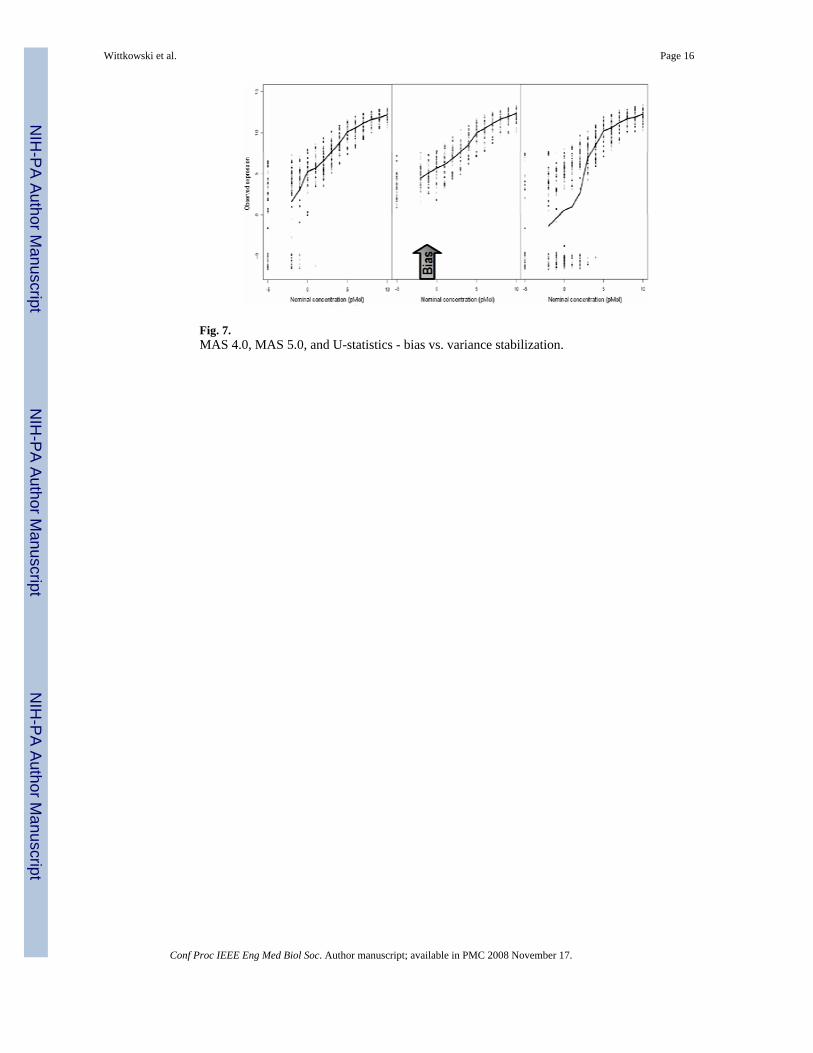
Fig. 7.MAS 4.0, MAS 5.0, and U-statistics - bias vs. variance stabilization.
Wittkowski et al. Page 16
Conf Proc IEEE Eng Med Biol Soc. Author manuscript; available in PMC 2008 November 17.
NIH
-PA Author Manuscript
NIH
-PA Author Manuscript
NIH
-PA Author Manuscript
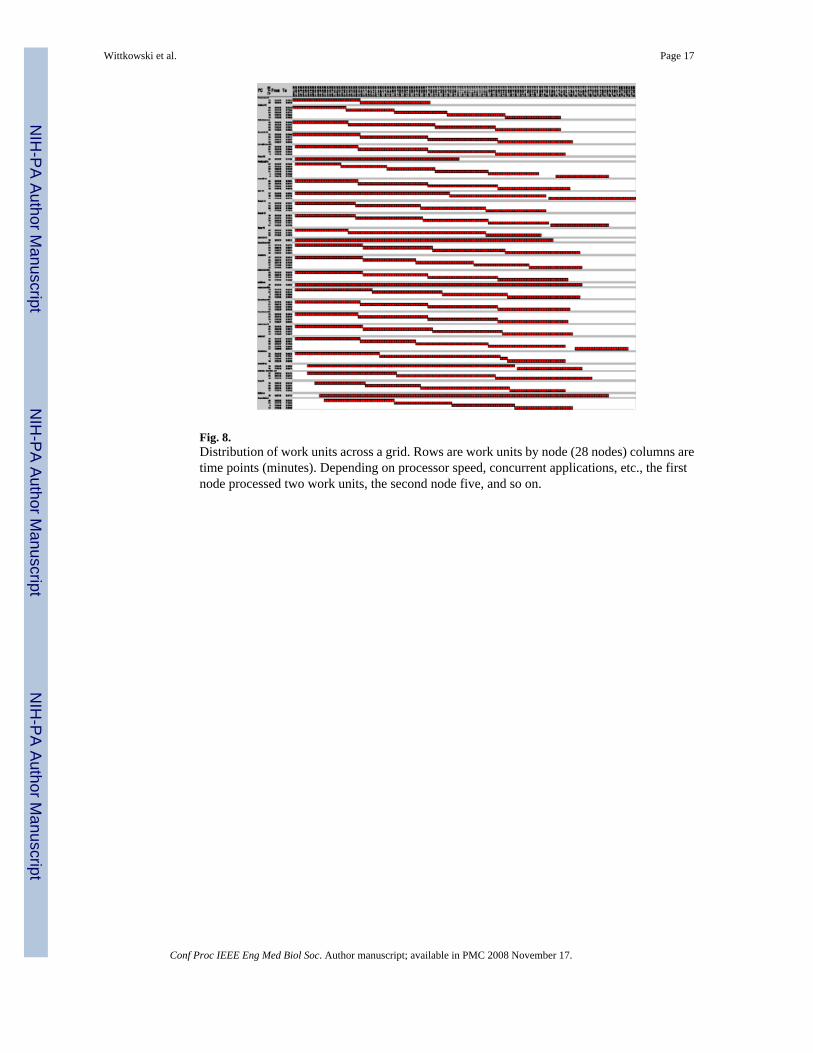
Fig. 8.Distribution of work units across a grid. Rows are work units by node (28 nodes) columns aretime points (minutes). Depending on processor speed, concurrent applications, etc., the firstnode processed two work units, the second node five, and so on.
Wittkowski et al. Page 17
Conf Proc IEEE Eng Med Biol Soc. Author manuscript; available in PMC 2008 November 17.
NIH
-PA Author Manuscript
NIH
-PA Author Manuscript
NIH
-PA Author Manuscript
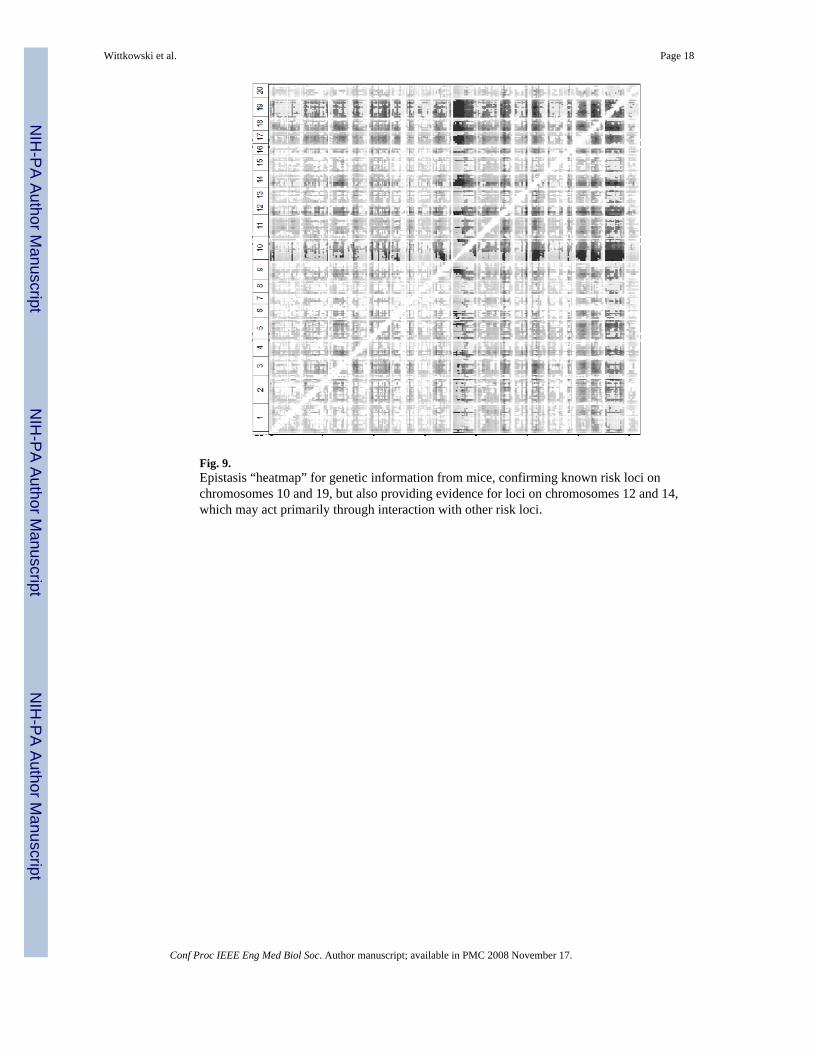
Fig. 9.Epistasis “heatmap” for genetic information from mice, confirming known risk loci onchromosomes 10 and 19, but also providing evidence for loci on chromosomes 12 and 14,which may act primarily through interaction with other risk loci.
Wittkowski et al. Page 18
Conf Proc IEEE Eng Med Biol Soc. Author manuscript; available in PMC 2008 November 17.
NIH
-PA Author Manuscript
NIH
-PA Author Manuscript
NIH
-PA Author Manuscript