DNA Microarrays for Identifying Fishes
11
ORIGINAL ARTICLE DNA Microarrays for Identifying Fishes M. Kochzius & M. Nölte & H. Weber & N. Silkenbeumer & S. Hjörleifsdottir & G. O. Hreggvidsson & V. Marteinsson & K. Kappel & S. Planes & F. Tinti & A. Magoulas & E. Garcia Vazquez & C. Turan & C. Hervet & D. Campo Falgueras & A. Antoniou & M. Landi & D. Blohm Received: 26 September 2007 / Accepted: 7 November 2007 / Published online: 13 February 2008 # The Author(s) 2008 Abstract In many cases marine organisms and especially their diverse developmental stages are difficult to identify by morphological characters. DNA-based identification methods offer an analytically powerful addition or even an alternative. In this study, a DNA microarray has been developed to be able to investigate its potential as a tool for the identification of fish species from European seas based on mitochondrial 16S rDNA sequences. Eleven commer- cially important fish species were selected for a first prototype. Oligonucleotide probes were designed based on the 16S rDNA sequences obtained from 230 individuals of 27 fish species. In addition, more than 1200 sequences of 380 species served as sequence background against which the specificity of the probes was tested in silico. Single target hybridisations with Cy5-labelled, PCR-amplified 16S rDNA fragments from each of the 11 species on microarrays containing the complete set of probes confirmed their suitability. True-positive, fluorescence signals obtained were at least one order of magnitude stronger than false-positive cross-hybridisations. Single nontarget hybridisations resulted in cross-hybridisation signals at approximately 27% of the cases tested, but all of them were at least one order of magnitude lower than true-positive signals. This study demonstrates that the 16S rDNA gene is suitable for designing oligonucleotide probes, which can be used to differentiate 11 fish species. These data are a solid basis for the second step to create a “Fish Chip” for approximately 50 fish species relevant in marine environmental and fisheries research, as well as control of fisheries products. Keywords DNA chips . Species identification . Capture oligonucleotide . Pisces Introduction Compared with terrestrial ecosystems, little is known about marine biodiversity and changes in species richness and Mar Biotechnol (2008) 10:207–217 DOI 10.1007/s10126-007-9068-3 M. Kochzius (*) : H. Weber : N. Silkenbeumer : K. Kappel : D. Blohm Centre for Applied Gene Sensor Technology (CAG), University of Bremen, Bremen, Germany e-mail: [email protected] M. Nölte Zentrum für Technomathematik (ZeTeM), University of Bremen, Bremen, Germany S. Hjörleifsdottir : G. O. Hreggvidsson : V. Marteinsson Prokaria, Reykjavík, Iceland S. Planes : C. Hervet UMR CNRS EPHE 8046, Université de Perpignan, Perpignan, France F. Tinti : M. Landi CIRSA, University of Bologna, Ravenna, Italy A. Magoulas : A. Antoniou Institute of Marine Biology and Genetics, Hellenic Centre for Marine Research, Heraklion, Greece E. Garcia Vazquez : D. Campo Falgueras Universidad de Oviedo, Oviedo, Spain C. Turan College of Fisheries and Aquaculture, Mustafa Kemal University, Antakya, Turkey
Transcript of DNA Microarrays for Identifying Fishes

ORIGINAL ARTICLE
DNA Microarrays for Identifying Fishes
M. Kochzius & M. Nölte & H. Weber & N. Silkenbeumer &
S. Hjörleifsdottir & G. O. Hreggvidsson &
V. Marteinsson & K. Kappel & S. Planes & F. Tinti &A. Magoulas & E. Garcia Vazquez & C. Turan &
C. Hervet & D. Campo Falgueras & A. Antoniou &
M. Landi & D. Blohm
Received: 26 September 2007 /Accepted: 7 November 2007 /Published online: 13 February 2008# The Author(s) 2008
Abstract In many cases marine organisms and especiallytheir diverse developmental stages are difficult to identifyby morphological characters. DNA-based identificationmethods offer an analytically powerful addition or evenan alternative. In this study, a DNA microarray has beendeveloped to be able to investigate its potential as a tool forthe identification of fish species from European seas basedon mitochondrial 16S rDNA sequences. Eleven commer-cially important fish species were selected for a firstprototype. Oligonucleotide probes were designed based onthe 16S rDNA sequences obtained from 230 individuals of27 fish species. In addition, more than 1200 sequences of380 species served as sequence background against whichthe specificity of the probes was tested in silico. Single targethybridisations with Cy5-labelled, PCR-amplified 16S rDNAfragments from each of the 11 species on microarrayscontaining the complete set of probes confirmed theirsuitability. True-positive, fluorescence signals obtained wereat least one order of magnitude stronger than false-positive
cross-hybridisations. Single nontarget hybridisations resultedin cross-hybridisation signals at approximately 27% of thecases tested, but all of them were at least one order ofmagnitude lower than true-positive signals. This studydemonstrates that the 16S rDNA gene is suitable fordesigning oligonucleotide probes, which can be used todifferentiate 11 fish species. These data are a solid basis forthe second step to create a “Fish Chip” for approximately 50fish species relevant in marine environmental and fisheriesresearch, as well as control of fisheries products.
Keywords DNA chips . Species identification .
Capture oligonucleotide . Pisces
Introduction
Compared with terrestrial ecosystems, little is known aboutmarine biodiversity and changes in species richness and
Mar Biotechnol (2008) 10:207–217DOI 10.1007/s10126-007-9068-3
M. Kochzius (*) :H. Weber :N. Silkenbeumer :K. Kappel :D. BlohmCentre for Applied Gene Sensor Technology (CAG),University of Bremen,Bremen, Germanye-mail: [email protected]
M. NölteZentrum für Technomathematik (ZeTeM), University of Bremen,Bremen, Germany
S. Hjörleifsdottir :G. O. Hreggvidsson :V. MarteinssonProkaria,Reykjavík, Iceland
S. Planes : C. HervetUMR CNRS EPHE 8046, Université de Perpignan,Perpignan, France
F. Tinti :M. LandiCIRSA, University of Bologna,Ravenna, Italy
A. Magoulas :A. AntoniouInstitute of Marine Biology and Genetics,Hellenic Centre for Marine Research,Heraklion, Greece
E. Garcia Vazquez :D. Campo FalguerasUniversidad de Oviedo,Oviedo, Spain
C. TuranCollege of Fisheries and Aquaculture, Mustafa Kemal University,Antakya, Turkey

ecosystem function. This is mainly because of samplingdifficulties and problems in taxonomy. Many marineorganisms and especially their diverse developmentalstages, such as (1) eggs and larvae of fishes andinvertebrates, (2) zoo- and phytoplankton, and (3) benthicinvertebrates, are cumbersome and difficult to identify bymorphological characters. Classical microscopy methodsare time-consuming and require a high degree of taxonomicexpertise, which is currently falling short. In many casesidentifying a species is the major bottleneck in marinebiodiversity and ecosystem research, hampering the neces-sary monitoring of marine biodiversity. As an example, areview of 138 studies on invertebrate diversity in Europeanseas showed that approximately one-third of the specimenscould not have been identified to species level (Schanderand Willassen 2005).
DNA-based identification methods are meanwhile estab-lished (Barlow and Tzotzos 1995) as powerful tools,exhibiting an unprecedented accuracy because of theirinherently highest possible resolution, which can reacheven the level of single base changes in a whole genome.Using these methods, the following marine animals havebeen investigated: eggs, larvae, and adults of fishes (Rocha-Olivares 1998; Noell et al. 2001; Fox et al. 2005; Ward etal. 2005), planktonic copepods (Bucklin et al. 1999),invertebrate larvae (Garland and Zimmer 2002; Barberand Boyce 2006), and prey in the gut content or feces ofpenguins, whales, and fishes (Jarman et al. 2002; Saitho etal. 2003).
Sequences of the small subunit of the rRNA gene areused as a standard method for identifying microbialorganisms (Ludwig et al. 2004), and a fragment of themitochondrial cytochrome oxidase I gene is in use as“DNA-barcode” for the identification of metazoans (Hebertet al. 2002; Ward et al. 2005). As shown above, a growingnumber of recently published studies are using moleculargenetic identification methods. Nevertheless, their applica-tion is still restricted mainly because of methodicalproblems and because special knowledge and experiencein molecular genetics is required. This is especially true ifDNA-based identification is performed by using microarrayplatforms that are error-prone and difficult to quantify (Shiet al. 2006). Whereas most of the methods presently in use,such as PCR-based DNA amplification followed bysequencing techniques, allow to handle only single or afew species at the same time, DNA microarrays arebelieved to have the potential of identifying hundreds ofspecies in parallel and to differentiate them against an evenlarger number of related species.
Commonly, microarrays are glass microscope slides onwhich oligonucleotide probes are spotted that are comple-mentary to the DNA target sequences to be analysed(Relógio et al. 2002, Pirrung 2002, Dufva 2005). The
DNA target, which is usually fluorophore-labelled duringPCR amplification, hybridises with the oligonucleotideprobe on the microarray and can be detected after washingsteps by its label. Whereas applying of DNA microarraysfor gene expression has already reached the routine level ofhigh throughput systems (Blohm and Guiseppi-Elie 2001,Hoheisel 2006), they have been only recently applied forthe identification of organisms, such as microbes (Wang etal. 2002; Call et al. 2003; Korimbocus et al. 2005; Loy andBodrossy 2005), animals (Pfunder et al. 2004), and plants(Rønning et al. 2005). In terms of identifying marineorganisms, microarrays have been used for bacteria (Peplieset al. 2003; Peplies et al. 2004) and phytoplankton (Metfiesand Medlin 2004; Metfies et al. 2005; Godhe et al. 2007)Other DNA-hybridisation methods for the identification ofhigher marine organisms, such as invertebrate larvae(Goffredi et al. 2006), copepods (Kiesling et al. 2002),and larvae of fishes (Rosel and Kocher 2002), have beenapplied, but microarrays have not been used for this kind ofstudies. Other applications of microarrays in research onmarine organisms are gene expression analysis (Williams etal. 2003; Lidie et al. 2005; Wang et al. 2006; Cohen et al.2007; Jenny et al. 2007) and genotyping in populationgenetics (Moriya et al. 2004; Moriya et al. 2007).
One of the methodical limitations for using microarraysis the design of species specific probes. On the one hand,oligonucleotide probes designed in silico do not alwaysexhibit the experimental hybridisation properties they wereselected for and must be empirically tested. On the otherhand, the molecular marker must have highly selectivecharacteristics, such as low intraspecific and a highinterspecific variation. One of the most frequently usedmarkers in phylogenetics of fishes is the mitochondrial 16SrRNA gene. This gene has a well-characterized secondarystructure (Meyer 1993; Ortí et al. 1996) and especially theloop regions exhibit many insertions, deletions, andsubstitutions forming highly variable molecular features,which usually allow the design of highly specific probes.This is underlined by a study on lionfishes (Kochzius et al.2003), which showed that individuals of one species exhibitidentical 16S rDNA haplotypes even though they weresampled at sites thousands of kilometres apart, but cleardifferences could be detected between closely relatedlionfish species.
In this study, the development of a DNA microarray isdescribed, demonstrating the suitability of the 16S rRNAgene for designing oligonucleotides as microarray probes todifferentiate at least 11 fish species from European seas.Based on these data, a “Fish Chip” for approximately 50fish species is under construction to support the identifica-tion of eggs and larval stages from species that areotherwise difficult to identify, and of adult or processedfishes in fisheries industry.
208 Mar Biotechnol (2008) 10:207–217

Material and Methods
Sampling and DNA Extraction
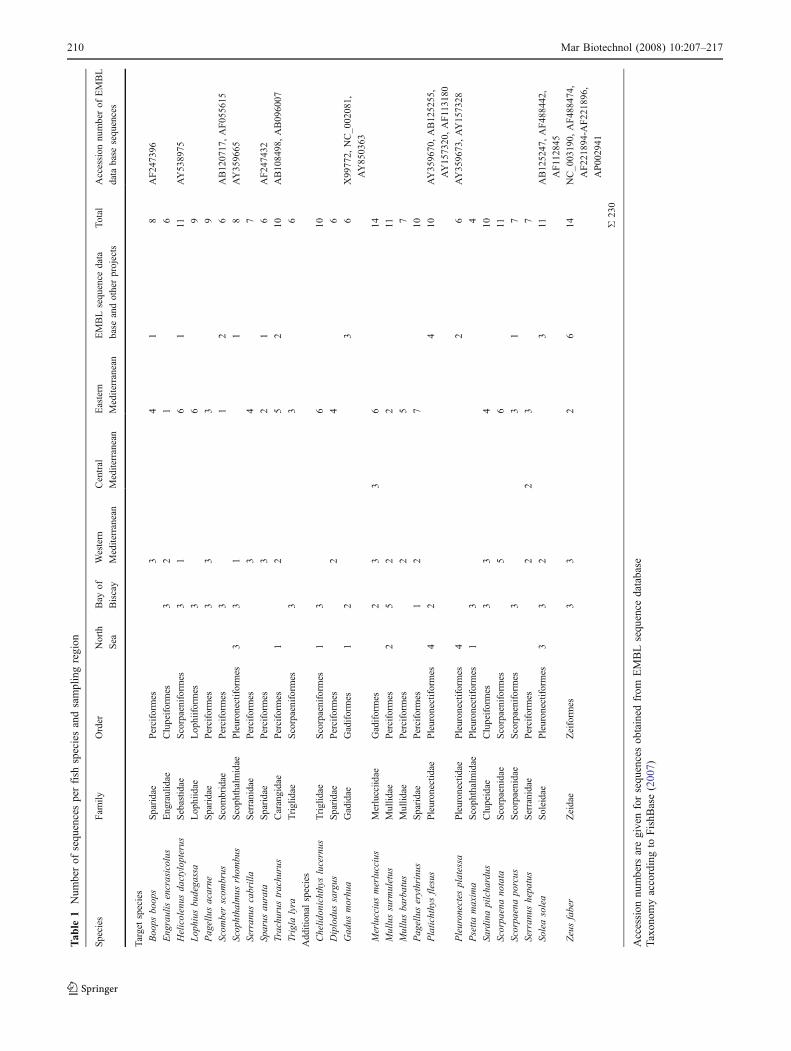
To consider possible intraspecies sequence variations,fishes were collected in five different regions of theEuropean seas: North Sea, Bay of Biscay, and Western,Central, as well as Eastern Mediterranean (Fig. 1, Table 1).All together 267 individual samples from 79 fish specieswere investigated. In addition sequences from the EMBLsequence data base were included. Voucher specimens andtissue samples have been preserved in absolute ethanol andstored at 4°C or were frozen at -20°C. DNA was extractedfrom gill filaments with the Agowa mag midi DNAisolation kit (AGOWA, Berlin, Germany) or from muscletissue with the DNeasy tissue kit (Qiagen, Hilden,Germany) according to the instructions of the manufacturer.
Polymerase Chain Reaction and Sequencing
A fragment of approximately 1380 bp length from themitochondrial 16S rRNA gene was amplified with the primer16fiF140 (5′-CGY AAG GGA AHG CTG AAA-3′), whichhas a single-base modification compared with Palumbi et al.(1991, unpublished manuscript) as well as with the newlydesigned primer 16fiR1524 (5′-CCG GTC TGA ACT CAGATC ACG TAG-3′). Polymerase chain reaction (PCR)reactions with a total volume of 15 μl contained 1.5 μl 10X reaction buffer, 1.5 μl dNTPs (10 mM), 0.05 μl of eachprimer (100 pmol/μl), 5 μl DNA-extract, 0.3 μl Tegpolymerase (3 U/μl; Prokaria, Reykjavik, Iceland), and6.6 μl deionized water. Thermal profile began at 94°C for4 min, followed by 35 cycles of 94°C (30 s), 54°C (30 s), 72°C (90 s), with a final step of 7 min at 72°C.
PCR products were purified by using the ExoSAP-IT forPCR clean-up (GE Healthcare, Uppsala, Sweden). Thenewly designed sequencing primer 16fiseq1463 (5′-TGCACC ATTAGG ATG TCC TGATCC AAC-3′) was used tosequence one strand of the amplified fragment using theBigDye Terminator Cycle Sequencing Kit (ver. 3.1, PEBiosystems, Foster City, USA). The sequencing reactionswere run in an ABI Prism 3730 automated DNA Analyzer(Applied Biosystems, Foster City, USA) according to themanufacturer’s instructions.
Sequence Analysis and Oligonucleotide Probe Design
In the framework of this project, 267 sequences have beenacquired and 944 sequences have been obtained fromEMBL sequence database and other projects, repre-senting approximately 380 species of fish from Europeanseas. Probes were designed based on 230 sequencesobtained from 27 species (Table 1). A multiple alignmentof these 230 sequences was performed with the programmeClustal W (Thompson et al. 1994) as implemented inBioEdit (version 7.0.4.1; Hall 1999) to ensure that allsequences represent a homologous fragment of the 16SrDNA. Before probe design gaps have been removed fromeach sequence. A computer program developed by thebioinformatics group of the Centre for Applied GeneSensor Technology (CAG) and the Zentrum für Techno-mathematik (ZeTeM), both at University of Bremen, wasused to design species-specific oligonucleotide probes,which ideally cover all sequences of one species and donot match any other species (Nölte 2002). The followingcriteria have been considered: (1) length of 23 to 27 bp, (2)melting temperature (Tm) of 81 to 85°C based on theunified model (SantaLucia 1998), (3) GC content of 52% to
20˚W
0˚ 20˚E
40˚E
40˚N
60˚N0 500 1000
km
NS
BB
WM
EMCM
Europe
Africa
Atlantic
Mediterranean
Black Sea
Fig. 1 Map with the samplingareas; NS North Sea; BB Bayof Biscay; WM Western Medi-terranean; CM CentralMediterranean; EM EasternMediterranean
Mar Biotechnol (2008) 10:207–217 209209
Tab
le1
Num
berof
sequ
encesperfish
speciesandsamplingregion
Species
Fam
ilyOrder
North
Sea
Bay
of
Biscay
Western
Mediterranean
Central
Mediterranean
Eastern
Mediterranean
EMBLsequence
data
base
andotherprojects
Total
Accession
numberof
EMBL
data
base
sequences
Targetspecies
Boops
boops
Sparidae
Perciform
es3
41
8AF247396
Engraulisencrasicolus
Engraulidae
Clupeiformes
32
16
Helicolenus
dactylopterus
Sebastid
aeScorpaeniform
es3
16
111
AY538975
Lophius
budegassa
Lophiidae
Lophiiformes
36
9
Pagellusacarne
Sparidae
Perciform
es3
33
9
Scom
berscom
brus
Scombridae
Perciform
es3
12
6AB120717,AF055615
Scophthalmus
rhom
bus
Scophthalmidae
Pleuronectiformes
33
11
8AY359665
Serranus
cabrilla
Serranidae
Perciform
es3
47
Sparus
aurata
Sparidae
Perciform
es3
21
6AF247432
Trachurustrachurus
Carangidae
Perciform
es1
25
210
AB108498,AB096007
Trigla
lyra
Triglidae
Scorpaeniform
es3
36
Additional
species
Chelid
onichthyslucernus
Triglidae
Scorpaeniform
es1
36
10
Diplodussargus
Sparidae
Perciform
es2
46
Gadus
morhua
Gadidae
Gadiformes
12
36
X99772,
NC_002081,
AY850363
Merlucciusmerluccius
Merlucciid
aeGadiformes
23
36
14
Mullussurm
uletus
Mullid
aePerciform
es2
52
211
Mullusbarbatus
Mullid
aePerciform
es2
57
Pagelluserythrinus
Sparidae
Perciform
es1
27
10
Platichthysflesus
Pleuronectid
aePleuronectiformes
42
410
AY359670,AB125255,
AY157320,AF113180
Pleuronectesplatessa
Pleuronectid
aePleuronectiformes
42
6AY359673,AY157328
Psetta
maxima
Scophthalmidae
Pleuronectiformes
13
4
Sardinapilchardus
Clupeidae
Clupeiformes
33
410
Scorpaenanotata
Scorpaenidae
Scorpaeniform
es5
611
Scorpaenaporcus
Scorpaenidae
Scorpaeniform
es3
31
7
Serranus
hepatus
Serranidae
Perciform
es2
23
7
Soleasolea
Soleidae
Pleuronectiformes
33
23
11AB125247,AF488442,
AF112845
Zeusfaber
Zeidae
Zeiform
es3
32
614
NC_003190,
AF488474,
AF221894-A
F221896,
AP002941
Σ230
Accession
numbers
aregivenforsequ
encesob
tained
from
EMBLsequ
ence
database
Taxon
omyaccordingto
FishB
ase(200
7)
210 Mar Biotechnol (2008) 10:207–217

54%, (4) secondary structure of the oligonucleotides andthe target sequence, (5) possible dimer formation, and (6)the energy content of a bond between the probe and thetarget sequence. Minimal free energy (mfe) structures arecomputed by using RNAfold (Hofacker et al. 1994). Probesexhibiting strong secondary structures or binding to aregion of the target with such a strong secondary structurewere not used. If more than one probe qualified for aspecies, the one with the highest binding energy betweenprobe and target was chosen. Already during the design-phase the selected oligonucleotide probes were tested insilico against 1211 background sequences from approxi-mately 380 fish species.
Preparation of DNA Microarrays and HybridisationExperiments
Aminosilane (3-aminopropyltrimethoxysilane)-coated glassslides were used with a PDITC-linker (1,4-phenylendiiso-thiocyanate) from Asper Biotech (Tartu, Estonia). Oligonu-cleotide probes (Thermo Hybaid, Ulm, Germany) with a5′-amino-C6-modification were spotted in 150 mM Na3PO4
buffer (pH 8.5) at a concentration of 30 μM using aspotting robot based on a modified version of the contact-less TopSpot® technology. The spotted volume of thisoligonucleotides solution was 200 pl, producing a spotdiameter of approximately 220 μm. Each probe was spottedin four replicates per block. An array contained five blocksand three arrays were spotted on one microarray slide(Fig. 2). After spotting, the microarrays were incubated for16 h in a wet chamber to ensure efficient covalent bindingof the oligonucleotides. Finally, the microarrays wereshrink-wrapped under a nitrogen atmosphere and werestorable at 4°C for up to 6 months.
DNA for hybridisation experiments was amplified andlabelled with 5′-Cy5-modified primers. The primers 16sar-L(3′-CGC CTG TTTAAC AAA AAC AT-3′) and 16sbr-H (5′-CCG GTT TGA ACT CAG ATC ACG T-3′) amplify afragment of approximately 600 bp length from the mitochon-drial 16S rRNA gene (Palumbi et al. 1991, unpublishedmanuscript). PCR reactions with a volume of 100 μl contained
10 μl 10 X reaction buffer, 4 μl dNTPs (5 mM), 2 μl of eachprimer (10 μM), 2 μl DNA-extract, 0.4 μl Taq polymerase(5 U/μl), 2 μl BSA (20 mg/ml), and 77.6 μl deionized water.The PCR thermal profile began at 95°C for 2 min, followedby 35 cycles of 95°C (30 s), 54°C (45 s), 72°C (60 s),followed by a final step of 10 min at 72°C. The Cy5-labelledPCR amplified DNA was purified using the QIAquick PCRPurification Kit (QIAGEN, Hilden, Germany).
Hybridisation experiments were performed with 11target and 14 nontarget fish species. As nontarget speciesfishes were chosen that are closely related to the targetspecies and from which false-positive signals could beexpected according to the in silico specificity testsperformed during the design phase of the probes (Table 2).
A positive control at a concentration of 1 nM (5′-CGTGTG AGT CGA TGG ATC ATA-3′; 5′-Cy3-labelled) and10 nM of the purified Cy5-labelled PCR product werehybridized to the microarray in a volume of 65 μl usingGeneFrames® (ABgene House, Epsom, UK), which wereapplied to the microarray slides according to the manufac-turer’s instruction (Fig. 2). Hybridisation was conducted at50°C in a hybridisation oven. After 2 h hybridisation timethe GeneFrames® were removed and the microarrays werewashed 5 minutes each with 2×SSC (sodium chloridetrisodium citrate) buffer containing 0.05% SDS (sodiumdodecyl sulphate), 1×SSC containing 0.05% SDS, and 1×SSC. Finally the microarrays were dried in a centrifuge at2000 rpm for 3 minutes.
Measurement of Fluorescence Signals and Data Analysis
Hybridisation signals were measured using an Axon 4000Bfluorescence microarray scanner at 635 nm (Cy5) as well asat 528 nm (Cy3). The fluorescence signal analysis was
Block
Array
Microarray (DNA chip)
GeneFrame
Fig. 2 Layout of the microarray
Table 2 Nontarget species tested in hybridisation experiments
Species Family Order
Dentex dentex Sparidae PerciformesDiplodus vulgaris Sparidae PerciformesGadus morhua Gadidae GadiformesMelanogrammus aeglefinus Gadidae GadiformesMerlangius merlangus Gadidae GadiformesMerluccius merluccius Gadidae GadiformesMicromesistius poutassou Gadidae GadiformesMullus surmuletus Mullidae PerciformesPollachius pollachius Gadidae GadiformesPollachius virens Gadidae GadiformesPsetta maxima Scophthalmidae PleuronectiformesSerranus hepatus Serranidae PerciformesTrachurus mediterraneus Carangidae PerciformesTrachuru picturatus Carangidae Perciformes
Taxonomy according to FishBase (2007)
Mar Biotechnol (2008) 10:207–217 211211
conducted with the software GenePix 4.1 (Axon, UnionCity, USA). The fluorescence signals of each probe weremeasured and the arithmetic mean was calculated. How-ever, data were removed from the analysis if the spotsshowed artefacts caused during the spotting process (e.g.,inhomogeneous spots documented by a monitoring cameraduring spotting) or experimental artefacts (e.g., air bub-bles). Background noise was corrected by subtracting thearithmetic mean of the negative control measurement fromthe arithmetic mean of the spot measurements. Negativevalues were set to zero.
Results
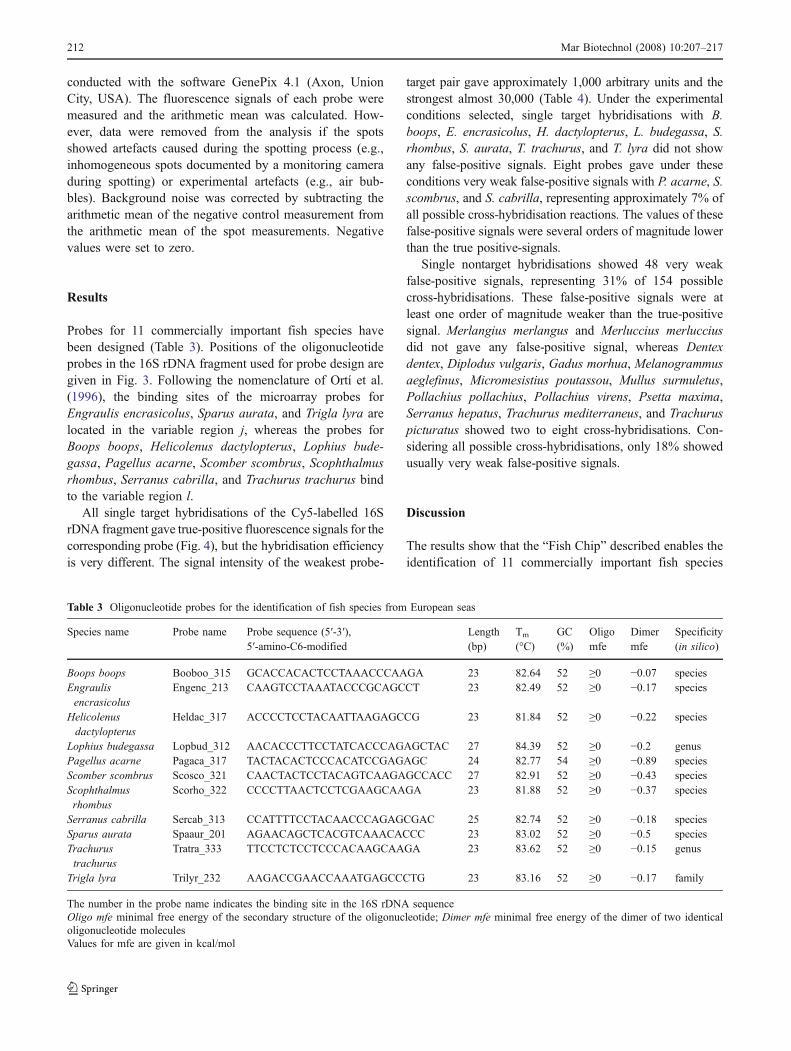
Probes for 11 commercially important fish species havebeen designed (Table 3). Positions of the oligonucleotideprobes in the 16S rDNA fragment used for probe design aregiven in Fig. 3. Following the nomenclature of Ortí et al.(1996), the binding sites of the microarray probes forEngraulis encrasicolus, Sparus aurata, and Trigla lyra arelocated in the variable region j, whereas the probes forBoops boops, Helicolenus dactylopterus, Lophius bude-gassa, Pagellus acarne, Scomber scombrus, Scophthalmusrhombus, Serranus cabrilla, and Trachurus trachurus bindto the variable region l.
All single target hybridisations of the Cy5-labelled 16SrDNA fragment gave true-positive fluorescence signals for thecorresponding probe (Fig. 4), but the hybridisation efficiencyis very different. The signal intensity of the weakest probe-
target pair gave approximately 1,000 arbitrary units and thestrongest almost 30,000 (Table 4). Under the experimentalconditions selected, single target hybridisations with B.boops, E. encrasicolus, H. dactylopterus, L. budegassa, S.rhombus, S. aurata, T. trachurus, and T. lyra did not showany false-positive signals. Eight probes gave under theseconditions very weak false-positive signals with P. acarne, S.scombrus, and S. cabrilla, representing approximately 7% ofall possible cross-hybridisation reactions. The values of thesefalse-positive signals were several orders of magnitude lowerthan the true positive-signals.
Single nontarget hybridisations showed 48 very weakfalse-positive signals, representing 31% of 154 possiblecross-hybridisations. These false-positive signals were atleast one order of magnitude weaker than the true-positivesignal. Merlangius merlangus and Merluccius merlucciusdid not gave any false-positive signal, whereas Dentexdentex, Diplodus vulgaris, Gadus morhua, Melanogrammusaeglefinus, Micromesistius poutassou, Mullus surmuletus,Pollachius pollachius, Pollachius virens, Psetta maxima,Serranus hepatus, Trachurus mediterraneus, and Trachuruspicturatus showed two to eight cross-hybridisations. Con-sidering all possible cross-hybridisations, only 18% showedusually very weak false-positive signals.
Discussion
The results show that the “Fish Chip” described enables theidentification of 11 commercially important fish species
Table 3 Oligonucleotide probes for the identification of fish species from European seas
Species name Probe name Probe sequence (5′-3′),5′-amino-C6-modified
Length(bp)
Tm
(°C)GC(%)
Oligomfe
Dimermfe
Specificity(in silico)
Boops boops Booboo_315 GCACCACACTCCTAAACCCAAGA 23 82.64 52 ≥0 −0.07 speciesEngraulisencrasicolus
Engenc_213 CAAGTCCTAAATACCCGCAGCCT 23 82.49 52 ≥0 −0.17 species
Helicolenusdactylopterus
Heldac_317 ACCCCTCCTACAATTAAGAGCCG 23 81.84 52 ≥0 −0.22 species
Lophius budegassa Lopbud_312 AACACCCTTCCTATCACCCAGAGCTAC 27 84.39 52 ≥0 −0.2 genusPagellus acarne Pagaca_317 TACTACACTCCCACATCCGAGAGC 24 82.77 54 ≥0 −0.89 speciesScomber scombrus Scosco_321 CAACTACTCCTACAGTCAAGAGCCACC 27 82.91 52 ≥0 −0.43 speciesScophthalmusrhombus
Scorho_322 CCCCTTAACTCCTCGAAGCAAGA 23 81.88 52 ≥0 −0.37 species
Serranus cabrilla Sercab_313 CCATTTTCCTACAACCCAGAGCGAC 25 82.74 52 ≥0 −0.18 speciesSparus aurata Spaaur_201 AGAACAGCTCACGTCAAACACCC 23 83.02 52 ≥0 −0.5 speciesTrachurustrachurus
Tratra_333 TTCCTCTCCTCCCACAAGCAAGA 23 83.62 52 ≥0 −0.15 genus
Trigla lyra Trilyr_232 AAGACCGAACCAAATGAGCCCTG 23 83.16 52 ≥0 −0.17 family
The number in the probe name indicates the binding site in the 16S rDNA sequenceOligo mfe minimal free energy of the secondary structure of the oligonucleotide; Dimer mfe minimal free energy of the dimer of two identicaloligonucleotide moleculesValues for mfe are given in kcal/mol
212 Mar Biotechnol (2008) 10:207–217

from European seas in certain experimental limits. Theselimits are primarily given by the fact that the fluorescencesignal intensities of true-positive hybridisation signals wereheterogeneous. This phenomenon is commonly encoun-
tered in DNA microarray experiments (Peplies et al. 2003;Warsen et al. 2004; Korimbocus et al. 2005; Rønning et al.2005; Tobler et al. 2006) and can probably be overcomeonly by an extreme methodical effort (Shi et al. 2006). The
variable region j
variable region l
10 20 30 40 50 60 70 80 90 100....|....|....|....|....|....|....|....|....|....|....|....|....|....|....|....|....|....|....|....|
Pygocentrus nattereri CCCAGTGACAATCAGTTAAACGGCCGCGGTATTTTGACCGTGCTAAGGTAGCGCAATCACTTGTCTTTTAAATGAGGACCTGTATGAATGGCGAAACGAGBoops boops ...T.....T..AT...T.................A.......G..............................GA................ATC.....Engraulis encrasicolus ...T.....TC.A....T...............C.A.......G...............A...C...........A.G.............TAT......Helicolenus dactylopterus ...T.....T..T....T.........................A...............................A................AC......Lophius budegassa ...T........T....C.........................G...............................A................A.......
Pagellus acarne ...T.....T..AT...T.........................G...............................A................ACC.....Scomber scombrus .........T..AT...C.................A.......A...............................A...............TATT.....Scophthalmus rhombus ..........CC.....C.........................A.........T............C.......GA................AT......
Serranus cabrilla -........C..-GTG.C......-........--A.......A.....................C........G.................ACG.....Sparus aurata ...T.....T..AT...T.........................G...............................A................ATC.....Trachurus trachurus ...........C-....C.........................G.........T.....................A................AT......
Trigla lyra ...T.....T..A....T.........................G...............................A................AT......
110 120 130 140 150 160 170 180 190 200....|....|....|....|....|....|....|....|....|....|....|....|....|....|....|....|....|....|....|....|
Pygocentrus nattereri GGCTTAACTGTCTCCTTTTTCCAGTCAATGAAATTGATCTGCCCGTGCAGAAGCGGGCATACCTATACAAGACGAGAAGACCCTTTGGAGCTTAA-GATA
Boops boops ......G........CCC......................C................G...AGC.C.T................A..........-..CGEngraulis encrasicolus ..TC..G.......T......T.....G.T...C.......T..............A....AA.....................A........T.-..C.Helicolenus dactylopterus ................C....A..................C................G...TAA.C.T................A........T.-..C.Lophius budegassa ......G..........CCC....................C......A.........G....T..C.T................A........T.-..C.Pagellus acarne ...............C.C.C....................CT...............G...AAA.C.T................A..........-.GCG
Scomber scombrus .....................A.....G............C................G...AAACC.T................A........T.A..C.Scophthalmus rhombus ................C....G..........G.......C................G...TT..C.T................A........G.-..CGSerranus cabrilla ....CT..........C.......................C................G..G.ACTC.T................A..A.....T.-..CG
Sparus aurata ......G........C.C.C....................C................G...AAG.C.T................A..........-.GCGTrachurus trachurus ................C.......................CT..............AG...AAA.C.T................A........T.-..C.Trigla lyra ................C...TA..................C................G....T.CC.T................A........T.-..C.
210 220 230 240 250 260 270 280 290 300....|....|....|....|....|....|....|....|....|....|....|....|....|....|....|....|....|....|....|....|
Pygocentrus nattereri AAAGGTCAACT-AGGTCAAGAGCCCAAATAAAT-TTGAACTAAACAAACAGCCAAC--TGACC-ACT-ATCTTCGGTTGGGGCGACCACGGGGGAAAACABoops boops CC...G..G..C.C..T..AC....CT.-.T.A-AG...TA....CT.GT.AATC.--..CT.T.A.-G....T...................A.TC.T.Engraulis encrasicolus CT.-.C.....GT.AAT...C.A.TG..CTG.ACAA.TC.....T.CC.GCAGCCTTA..GTGATG.AG....A..................A....GT.Helicolenus dactylopterus CC.AAGA.GA.CCT.....ATAA..CTCA.T.A-GG.CCT-G...T..T..AATC.--.TC..T.A.-G....T.............G.....A..C.A.
Lophius budegassa CC.A.G..GA.C.C..T..A-A...CCGA.T.A-GG...T-......GAT.AAG..--..C..T.-.-G....T.............G.....C....AGPagellus acarne CC..AA..G..C.CA....ATAA..CC.CT..A-GG.GGAA..GTC..AT.AACC.--..CT.T.G.-G.T..T.............G.....A....TTScomber scombrus CTGA.C..TA.C.A..T..ACA...CC.A.C.A-GG..CT-....TT.TT.AA.T.AT..G..GTA.-G...................T....A..C.A.
Scophthalmus rhombus .T...G..G.CC.T..T..ACA...T-TATT.A-CG..CT-....T..AT.G.C-.-C..CTTT.A.-G..................CT....A.-T...Serranus cabrilla CC.A.A.GGA.T.T..T..ACAA..C-T..T.A-AG.T.T-.....T.GTAA.C-.-C..T..G.A.-G....T.............G.....A..C.A.
Sparus aurata CC..AA..G..C.C.....ACA...CCGC.T.A-AG.G.A.....C..GT.GACC.--..CT.T.G.-G....T.............G.....A....TTTrachurus trachurus C..A.A..GA.C.T..T..ACA...C.CA.C.A-AG.CC.-....TT.AT.ATCT.-C..T..T.A.-G...................T....A..C...Trigla lyra CT.AAG..G..C.T.....A.A...TGCA.T.A-AA..C.-G...C..AT.AGCC.--..C..T.A.-G....T.............G.....A..T.A.
310 320 330 340 350 360 370 380 390 400....|....|....|....|....|....|....|....|....|....|....|....|....|....|....|....|....|....|....|....|
Pygocentrus nattereri AAGCCCCCGCGTAGAATGGGGATCACA----------------------CCCTAAAACCAAGAGGGACACCTCTAAGTCACAGAACATCTGACTAAACA-Boops boops ..A.....A...G.-.AT....G...CACAC------------------T......C.......CTT.CG......TGA.......T....G.C.T.TTAEngraulis encrasicolus ....T...AA.C..-.CC....AA..------------------------...T..G..G....TTG..A.......C.G..A..TT.T.....G..AT-
Helicolenus dactylopterus ..A.....A...G.-.AA....G...CCC--------------------T....C..TT.....CCG..G......T.A......T.......C..TA.-Lophius budegassa T.C.....AT..G.-.AA....A...--CCT------------------T....TC...C....CT..CG......T.AT.............C.--A.A
Pagellus acarne ..A.....AT..G.-.ATA...GT..TACAC------------------T..C.C.T..G....CTC.CG......AAA......TT......C.-...AScomber scombrus ..A.....A...G.-.AT....G....ACTAC-----------------T....C.GT......CC..CA......CAA......TT......C..TA.CScophthalmus rhombus ..A.....A...G.G.ATA...G...CCCCCC----------CCTTAACT...CG..G......CC.......C.GT.A.......T.T....C...A.T
Serranus cabrilla C.A.....AT..G.-.CTA...AA..CCATTT-----------------T....C....C....C....G........A...A..TT.T....C..TTG-Sparus aurata ..A.....AT..G.-.ACA...A...TATAT------------------T...T..T.......CTC.CG......TAA.......T......C.-...ATrachurus trachurus ..T.....AT..G.-.ATA...GG...ATCCCATATTATTTTCCTCTCCT..C.C..G......CC...A.....GC.A.......T.T....CTT.T.TTrigla lyra T.A.....AT..G.-.AT....AT..CTC--------------------T........T.....CC...G.......CA.......T......CT.TT.-
410 420 430 440 450 460....|....|....|....|....|....|....|....|....|....|....|....|....|....
Pygocentrus nattereri -GATCCGGCCAACAAGCCGATCAACGGACCAAGTTACCCTAGGGATAACAGCGCAATCCCCTCCAAGAG
Boops boops -.......T--.-..A..........A...G............................T..TA.....Engraulis encrasicolus -.......TTG.A..A.....T....A................................T....C....
Helicolenus dactylopterus -........--.-.T...............G...............................TTT....Lophius budegassa -........--T..................G...............................T.T....Pagellus acarne -........--.-.T.............A.G............................T..TA.....
Scomber scombrus T........--.-.C...............................................TTT....Scophthalmus rhombus -........--.-.T...............................................TTT....Serranus cabrilla -........--.-.C...........A...G......T........................TTT....Sparus aurata -........--.-.C...............G...............................-A.....Trachurus trachurus -........--G..C...............................................TTT....
Trigla lyra -........--.-.T...........A...G...............................TT-....
Fig. 3 Alignment (5′>3′) of representative 16S rDNA sequencesfrom the target species with binding sites (light grey) of probes (5′>3′;probes hybridise to the reverse complementary target strand). Double
stranded (dark grey) and single stranded regions (grey) of thesecondary structure are indicated in the reference sequence ofPygoplites nattereri (Ortí et al. 1996; Accession number: U33590)
Mar Biotechnol (2008) 10:207–217 213213

Boo
psbo
ops
(2)
Non-target species
Pro
bes
Eng
raul
isen
cras
ico
lus
(2)
Hel
icol
enu
sda
ctyl
opte
rus
(2)
Mel
anog
ram
mus
aegl
efin
us(4
)
Loph
ius
bud
egas
sa(2
)P
agel
lus
acar
ne(2
)S
coph
thal
mus
rho
mbu
s(1
)S
com
ber
scom
brus
(2)
Ser
ranu
sca
brill
a(2
)S
paru
sau
rata
(2)
Trac
huru
str
ach
urus
(1)
Trig
laly
ra(2
)
Target species
Den
tex
dent
ex(6
)D
iplo
dus
vulg
aris
(3)
Gad
usm
orh
ua(2
)
Mer
lang
ius
mer
lang
us
(6)
Mer
lucc
ius
mer
lucc
ius
(1)
Mic
rom
esis
tius
pout
asso
u(3
)M
ullu
ssu
rmul
etu
s(2
)
Pol
lach
ius
polla
chiu
s(2
)P
olla
chiu
svi
rens
(4)
Pse
ttam
axim
a(3
)
Ser
ranu
she
patu
s(1
)Tr
achu
rus
med
iterr
aneu
s(1
)
Trac
huru
sp
ictu
ratu
s(2
) Booboo_315 ( Boops boops)Engenc_231 ( )Engraulis encrasicolusHeldac_317 ( )Helicolenus dactylopterusLopbud_312 ( )Lophius budegassaPagaca_317 ( )Pagellus acarneScorho_322 ( )Scophthalmus rhombusScosco_321 ( )Scomber scombrusSercab_313 ( )Serranus cabrillaSpaaur_201 ( )Sparus aurataTratra_333 ( )Trachurus trachurusTrilyr_232 ( )Trigla lyra
25,804 10,628
15
20 2040 27
40
21
30
34
40
21
2035
3540
40
4040
119
120
120120
120
120
60
60
6060 40
4080
80
6040
40
40
80
8080
8080
80
8060
60
15
20
20
20
20
4040
4040
40
40
60
40
80
40
Flu
ores
cenc
esi
gnal
(arb
itrar
yun
its)
Fig. 4 Signals (background subtracted from absolute signal) of singletarget and nontarget hybridisations. White bars represent true-positivesignals; false-positive signals are shown as grey bars. Numbers at thebasis of the bars indicate the amount of measured spots. The number
of hybridisations is given in brackets after target and nontarget names.Replication and absolute signal intensities (± standard deviation) ofhybridized targets to the corresponding probe are given in Table 4
Table 4 Target hybridisations
Hybridized targets No. of hybridisations Measurements of specific probes
Measured probes/absoluteno. of probes
Mean absolute fluorescencesignal in arbitrary units
Standard deviation
Boops boops 2 21/40 2991 ±1491Engraulis encrasicolus 2 20/40 1659 ±962Helicolenus dactylopterus 2 20/40 3502 ±912Lophius budegassa 2 40/40 3450 ±1515Pagellus acarne 2 27/40 3727 ±1270Scophthalmus rhombus 1 15/20 1528 ±269Scomber scombrus 2 40/40 27827 ±5330Serranus cabrilla 2 40/40 10814 ±4396Sparus aurata 2 40/40 963 ±227Trachurus trachurus 1 20/20 2015 ±880Trigla lyra 2 35/40 2343 ±560
214 Mar Biotechnol (2008) 10:207–217

problems encountered when single-colour microarray expe-riments need to be quantified are severe and in part not yetsolved, because complex parameters are influencing theresults. These are the sequence dependent hybridisationefficiency, specifically steric hindrance, secondary struc-tures (Southern et al. 1999), and the relative position of thefluorescent label at the target (Zhang et al. 2005).
Sometimes the duplex formation can be favoured byusing spacers, which obviously give the captures a greaterdegree of freedom from their neighbouring molecules andfrom the surface (Southern et al. 1999), leading to anenhancement of signal intensity with increasing spacerlength (Peplies et al. 2003).
An important criterion of probe design was the basecomposition (Southern et al. 1999) and therefore all but onecapture oligonucleotides were designed to have a GCcontent of 52% and 54% for the exception (Table 3). Thedifferent hybridisation efficiencies of the captures and thevarying sensitivity for the different fishes is still a severedisadvantage, because it can hamper the estimation of asmall amount of fishes of one species in the presence of alarger number of individuals of another species in a mixedsample. These limits are presently under investigation withfish eggs and other biological material.
Because all oligonucleotide probes bind to the variableregions j and l of the 16S rRNA gene, which represent largesingle-stranded loops, the secondary structure is unlikely tobe a factor contributing to the partially low sensitivity.Also, the POL effect, a phenomenon decreasing thefluorescence signal with increasing distance between theprobe binding site and the label on the target (Zhang et al.2005) seems not to be important in this case. Most of theprobes used in this study hybridise to the variable regionl of the 16S rDNA and their distance from the fluorescencelabel is more or less identical.
Although cross-hybridisations occur, true-positive sig-nals could clearly be differentiated from false-positivesignals because of their generally higher signal. Mostfalse-positive signals occurred when the 16S rDNAfragment of nontarget species was hybridised on themicroarray.
Testing of nontarget species is seemingly important instudies using DNA microarrays for the identification oforganisms, because even if a comprehensive sequencebackground is utilised for probe design and even ifextensive in silico testing has been performed, the speci-ficity of oligonucleotide probes has to be evaluated withclosely related species and specifically those that showcross-hybridisations in silico.
This study shows that the 16S rRNA gene of fishes issuitable to design oligonucleotide probes that are able todifferentiate eleven fish species from European seas by singletarget hybridisation on a microarray. Such a “Fish Chip” can
hopefully be applied in marine environmental and fisheriesresearch, as well as in fisheries and food control if the unevenhybridisation signal intensities of the different probe-targetpairs can be improved or compensated.
The correct identification of fish eggs and larvae is crucialfor fish stock assessment based on ichthyoplankton surveys.Genetic identification has shown that the majority of eggs inthe Irish Sea, wrongly believed to be from cod, were actuallyfrom whiting, leading to an overestimation of cod stocks(Fox et al. 2005). A study on food fish in the United Statesrevealed that three-quarters of fish sold as “red snapper”were mislabelled and belonged to other species (Marko etal. 2004), a situation that needs better analytical tools to bechanged. The European Union (EU) also has strictregulations for seafood labelling, which must include, forexample, the species name (EU Council Regulation No104/2000; EU Commission Regulation No 2065/2001).Approximately 420 species of fish are sold in the Germanmarket alone, making a reliable identification methodurgently necessary to protect the customer. DNA micro-arrays might have the potential to fulfill these requirements.
Recent efforts in compiling sequences of fishes, such asthe European projects “FishTrace” http://www.fishtrace.org) and “Fish & Chips” (http://www.fish-and-chips.uni-bremen.de; Kochzius et al. 2007), as well as the interna-tional “Fish Barcode of Life Initiative” http://www.fishbol.org; Ward et al. 2005), will provide the necessary sequencebackground for the design of species specific oligonucleo-tide probes for the development of DNA microarrays forthe identification of fishes.
Acknowledgements The authors thank S. Roll and F. Meyerjürgensfor producing the microarrays. The “Fish & Chips” project is aSpecific Targeted Research Project (STREP) funded by the EuropeanCommission under the contract no. 505491.
Open Access This article is distributed under the terms of theCreative Commons Attribution Noncommercial License which per-mits any noncommercial use, distribution, and reproduction in anymedium, provided the original author(s) and source are credited.
References
Barlow BA, Tzotzos GT (1995) Biotechnology. In: Heywood VH (ed)Global biodiversity assessment. UNEP, Cambridge UniversityPress, pp. 671–710
Barber P, Boyce SL (2006) Estimating diversity of Indo-Pacific coralreef stomatopods through DNA barcoding of stomatopod larvae.Proc Royal Soc London B 273:2053–2061
Blohm D, Guiseppi-Elie A (2001) New developments in microarraytechnology. Current Opin Biotech 12:41–47
Bucklin A, Guarnieri M, Hill RS, Bentley AM, Kaartvedt S (1999)Taxonomic and systematic assessment of planktonic copepodsusing mitochondrial COI sequence variation and competitive,species-specific PCR. Hydrobiologia 401:239–254
Mar Biotechnol (2008) 10:207–217 215215

Call DR, Borucki MK, Loge FJ (2003) Detection of bacterialpathogens in environmental samples using DNA microarrays. JMicrobiologic Methods 53:235–243
Cohen R, Chalifa-Caspi V, Williams TD, Auslander M, George SG,Chipman JK, Tom M (2007) Estimating the efficiency of fishcross-species cDNA microarray hybridisation. Marine Biotech9:491–499
Dufva M (2005) Fabrication of high quality microarrays. Biomolec-ular Engineer 22:173–184
FishBase (2007) FishBase: a global information system on fishes.Available at: http://www.fishbase.de
Fox CJ, Taylor MI, Pereyra R, Villasana MI, Rico C (2005) TaqManDNA technology confirms likely overestimation of cod (Gadusmorhua L.) egg abundance in the Irish Sea: implications for theassessment of the cod stock and mapping of spawning areasusing egg-based methods. Mol Ecol 14:879–884
Garland ED, Zimmer CA (2002) Techniques for the identification ofbivalve larvae. Marine Ecol Prog Ser 225:299–310
Godhe A, Cusack C, Pedersen J, Andersen P, Anderson DM, BresnanE, Cembella A, Dahl E, Diercks S, Elbrächter M, Edler L,Galluzzi L, Gescher G, Gladstone M, Karlson B, Kulis D,LeGresley M, Lindahl O, Marin R, McDermott G, Medlin LK,Naustvoll L-J, Penna A, Kerstin Töbe (2007) Intercalibration ofclassical and molecular techniques for identification of Alexan-drium fundyense (Dinophyceae) and estimation of cell densities.Harmful Algae 6:56–72
Goffredi SK, Jones WJ, Scholin CA, Marin R, Vrijenhoek (2006)Molecular detection of marine invertebrate larvae. MarineBiotechnol 8:149–160
Hall TA (1999) BioEdit: a user-friendly biological sequence alignmenteditor and analysis program for Windows 95/98/NT. NucleicAcids Symp Ser 41:95–98
Hebert PDN, Cywinska A, Ball SL, deWaard JR (2002) Biologicalidentifications through DNA barcodes. Proc Royal Soc LondonB 270:313–321
Hofacker IL, Fontana W, Stadler PF, Bonhoeffer LS, Tacker M,Schuster P (1994) Fast folding and comparison of RNAsecondary structures (The Vienna RNA package). Monatsheftefür Chemie (Chemical Monthly) 125:167–188
Hoheisel JD (2006) Microarray technology: beyond transcript profil-ing and genotype analysis. Nat Rev Genetics 7:200–210
Jarman SN, Gales NJ, Tierney M, Gill PC, Elliott NG (2002) A DNA-based method for identification of krill species and its applicationto analysing the diet of marine vertebrate predators. Mol Ecol11:2679–2690
Jenny MJ, Chapman RW, Mancia A, Chen YA, McKillen DJ, Trent H,Lang P, Escoubas JM, Bachere E, Boulo V, Liu ZJ, Gross PS,Cunningham C, Cupit PM, Tanguy A, Guo X, Moraga D, Boutet I,Huvet A, De Guise S, Almeida JS, Warr GW (2007) A cDNAMicroarray for Crassostrea virginica and C. gigas. Mar Bio-technol 9:577–591
Kiesling TL, Wilkinson E, Rabalais J, Ortner PB, McCabe, MM, FellJW (2002) Rapid identification of adult and naupliar stages ofcopepods using DNA hybridisation methodology. Marine Bio-technol 4:30–39
Kochzius M, Söller R, Khalaf MA, Blohm D (2003) Molecularphylogeny of the lionfish genera Dendrochirus and Pterois(Scorpaenidae, Pteroinae) based on mitochondrial DNA sequen-ces. Mol Phylogenetics Evol 28:396–403
Kochzius M, Kappel K, Döbitz L, Silkenbeumer N, Nölte M, WeberH, Hjörleifsdottir S, Marteinsson V, Hreggvidsson G, Planes S,Tinti F, Magoulas A, Garcia Vazquez E, Turan C, Medlin L,Metfies K, Gescher C, Cariani A, Landi M, Hervet C, CampoFalgueras D, Antoniou A, Bertasi F, Chitipothu S, Blohm D(2007) The “Fish & Chips” project: microarrays as a tool for theidentification of marine organisms in biodiversity and ecosystem
research. Oceans ’07 IEEE Aberdeen 18–21 June 2007, Aber-deen, Conference Proceedings, ISBN: 1-4244-0635-8, 4 pp
Korimbocus J, Scaramozzino N, Lacroix B, Crance JM, Garin D,Vernet G (2005) DNA probe array for the simultaneousidentification of herpesviruses, enteroviruses, and flaviviruses. JClin Microbiol 43:3779–3787
Lidie KB, Ryan JC, Barbier M, Van Dolah FM (2005) Geneexpression in Florida red tide dinoflagellate Karenia brevis:analysis of an expressed sequence tag library and development ofDNA microarray. Marine Biotechnol 7:481–493
Loy A, Bodrossy L (2005) Highly parallel microbial diagnostics usingoligonucleotide microarrays. Clinica Chimica Acta 363:106–119
Ludwig W, Strunk O, Westram R, Richter L, Meier H, Yadhukumar,Buchner A, Lai T, Steppi S, Jobb G, Förster W, Brettske I,Gerber S, Ginhart AW, Gross O, Grumann S, Hermann S, Jost R,König A, Liss T, Lüßmann R, May M, Nonhoff B, Reichel B,Strehlow R, Stamatakis A, Stuckmann N, Vilbig A, Lenke M,Ludwig T, Bode A, Schleifer K-H (2004) ARB: a softwareenvironment for sequence data. Nucleic Acids Res 32:1363–1371
Marko PB, Lee SC, Rice AM, Gramling JM, Fitzhenry TM, McAlisterJS, Harpert GR, Moran AL (2004) Misslabelling of a depletedreef fish. Nature 430:309–310
Metfies K, Medlin L (2004) DNA microchips for phytoplankton: thefluorescent wave of the future. Nova Hedwigia 79:321–327
Metfies K, Huljic S, Lange M, Medlin LK (2005) Electrochemicaldetection of the toxic dinoflagellate Alexandrium ostenfeldii witha DNA-biosensor. Biosensors Bioelectronics 20:1349–1357
Meyer A (1993) Evolution of mitochondrial DNA in fishes. In:Hochachka PW, Mommsen TP (eds) Biochemistry and molecularbiology of fishes. 2nd edn. Elsevier, Amsterdam, p 1–38
Moriya S, Urawa S, Suzuki O, Urano A, Abe S (2004) DNAmicroarray for rapid detection of mitochondrial DNA haplotypesof chum salmon. Marine Biotechnol 6:430–434
Moriya S, Sato S, Azumaya T, Suzuki O, Urawa S, Urano A, Abe S(2007) Genetic stock identification of chum salmon in the BeringSea and North Pacific Ocean using mitochondrial DNA micro-array. Marine Biotechnol 9:179–191
Noell CJ, Donnellan S, Foster R, Haigh L (2001) Moleculardiscrimination of garfish Hyporhamphus (Beloniformes) larvaein southern Australian waters. Marine Biotechnol 3:509–514
Nölte M (2002) Optimization of oligonucleotide sets for DNAmicroarrays. Ph.D. thesis, University of Bremen, Germany
Ortí G, Petry P, Porto JIR, Jégu M, Meyer A (1996) Patterns ofnucleotide change in mitochondrial ribosomal RNA genes andthe phylogeny of Piranhas. J Mol Evolution 42:169–182
Peplies J, Glöckner FO, Amann R (2003) Optimization strategies forDNA microarray-based detection of bacteria with 16S rRNA-targeting oligonucleotide probes. Appl Environ Microbiol69:1397–1407
Peplies J, Lau SC, Pernthaler J, Amann R, Glöckner FO (2004) Appli-cation and validation of DNA microarrays for the 16S rRNA-based analysis of marine bacterioplankton. Environ Microbiol6:638–645
PfunderM,HolzgangO, Frey JE (2004) Development of microarray-baseddiagnostics of voles and shrews for use in biodiversity monitoringstudies, and evaluation of mitochondrial cytochrome oxidase I vs.cytochrome b as genetic markers. Mol Ecol 13:1277–1286
Pirrung MC (2002) How to make a DNA chip. Angewandte ChemieInt Ed 41:1276–1289
Relógio A, Schwager C, Richter A, Ansorge W, Valcárcel J (2002)Optimization of oligonucleotide-based DNA microarrays.Nucleic Acids Res 30(11):e51
Rocha-Olivares A (1998) Multiplex haplotype-specific PCR: a newapproach for species identification of the early life stages ofrockfishes of the species-rich genus Sebastes Cuvier. J ExpMarine Biol Ecol 231:279–290
216 Mar Biotechnol (2008) 10:207–217
Rønning SB, Rudi K, Berdal KG, Holst-Jensen A (2005) Differenti-ation of important and closely related cereal plant species(Poaceae) in food by hybridisation to an oligonucleotide array.J Agricultural Food Chem 53:8874–8880
Rosel PE, Kocher TD (2002) DNA-based identification of larval codin stomach contents of predatory fishes. J Exp Marine Biol Ecol267:75–88
Saitho K, Takagaki M, Yamashita Y (2003) Detection of Japaneseflounder-specific DNA from gut contents of potential predators inthe field. Fisheries Sci 69:473–477
SantaLucia J (1998) A unified view of polymer, dumbbell, andoligonucleotide DNA nearest-neighbor thermodynamics. ProcNatl Acad Sci USA 95:1460–1465
Schander C, Willassen E (2005) What can biological barcoding do formarine biology? Marine Biol Res 1:79–83
Shi L, Reid LH, Jones WD, Shippy R, Warrington JA, Baker SC,Collins PJ, de Longueville F, Kawasaki ES, Lee KY, Luo Y, SunYA, Willey JC, Setterquist RA, Fischer GM, Tong W, DraganYP, Dix DJ, Frueh FW, Goodsaid FM, Herman D, Jensen RV,Johnson CD, Lobenhofer EK, Puri RK, Scherf U, Thierry-MiegJ, Wang J, Wilson M, Wolber PK, Zhang L, Amur S, Bao W,Barbacioru CC, Bergstrom Lucas A, Bertholet V, Boysen C,Bromley B, Brown D, Brunner A, Canales R, Megan Cao XM,Cebula TA, Chen JJ, Cheng J, Chu T-M, Chudin E, Corson J,Corton JC, Croner LJ, Davies C, Davison TS, Delenstarr G,Deng X, Dorris D, Eklund AC, Fan X-H, Fang H, Fulmer-Smentek S, Fuscoe JC, Gallagher K, Ge W, Guo L, Guo X,Hager J, Haje PK, Han J, Han T, Harbottle HC, Harris SC,Hatchwell E, Hauser CA, Hester S, Hong H, Hurban P, JacksonSA, Ji H, Knight CR, Kuo WP, LeClerc JE, Levy S, Li Q-Z, LiuC, Liu Y, Lombardi MJ, Ma Y, Magnuson SR, Maqsodi B,McDaniel T, Mei N, Myklebost O, Ning B, Novoradovskaya N,Orr MS, Osborn TW, Papallo A, Patterson TA, Perkins RG,Peters EH, Peterson R, Philips KL, Pine PS, Pusztai L, Qian F,Ren H, Rosen M, Rosenzweig BA, Samaha RR, Schena M,Schroth GP, Shchegrova S, Smith DD, Staedtler F, Su Z, Sun H,Szallasi Z, Tezak Z, Thierry-Mieg D, Thompson KL, Tikhonova
I, Turpaz Y, Vallanat B, Van C, Walker SJ, Wang SJ, Wang Y,Wolfinger R, Wong A, Wu J, Xiao C, Xie Q, Xu J, Yang W,Zhang L, Zhong S, Zong Y, Slikker Jr W (2006) The microarrayquality control (MAQC) project shows inter- and intraplatformreproducibility of gene expression measurements. Nat Biotechnol24:1151–1161
Southern E, Mir K, Shchepinov M (1999) Molecular interactions onmicroarrays. Nat Genet 21:5–9
Thompson JG, Higgins DG, Gibson TJ (1994) CLUSTAL W:improving the sensitivity of progressive multiple sequencealignments through sequence weighting, position specific gappenalties and weight matrix choice. Nucleic Acids Res 22:4673–4680
Tobler NE, Pfunder M, Herzog K, Frey JE, Altwegg M (2006) Rapiddetection and species identification of Mycobacterium spp. usingreal-time PCR and DNA-microarray. J Microbiol Methods66:116–124
Wang D, Coscoy L, Zylberberg M, Avila PC, Boushey HA, Ganem D,DeRisi JL (2002) Microarray-based detection and genotyping ofviral pathogens. Proc Natl Acad Sci USA 99:15687–15692
Wang B, Li F, Dong B, Zhang X, Zhang C, Xiang J (2006) Discoveryof the genes in response to white spot syndrome virus (WSSV)infection in Fenneropenaeus chinensis through cDNA micro-array. Marine Biotechnol 8:491–500
Ward RD, Zemlak TS, Innes BH, Last PR, Hebert PDN (2005) DNAbarcoding Australia’s fish species. Philos Trans Royal Soc B360:1847–1857
Warsen AE, Krug MK, LaFrentz S, Stanek DR, Loge F, Call DR(2004) Simultaneous discrimination between 15 fish pathogensby using 16S ribosomal DNA PCR and DNA microarrays. ApplEnviron Microbiol 70:4216–4221
Williams TD, Gensberg K, Minchin SD, Chipman JK (2003) A DNAexpression array to detect toxic stress response in Europeanflounder (Platichthys flesus). Aquatic Toxicol 65:141–157
Zhang L, Hurek T, Reinhold-Hurek B (2005) Position of thefluorescent label is a crucial factor determining signal intensityin microarray hybridisations. Nucleic Acids Res 33:e166
Mar Biotechnol (2008) 10:207–217 217217