ON IDENTIFYING SUCCESSFUL FINANCIAL STRATEGIES ...
257
United Arab Emirates University United Arab Emirates University Scholarworks@UAEU Scholarworks@UAEU Business Administration Dissertations Business Administration 4-2018 ON IDENTIFYING SUCCESSFUL FINANCIAL STRATEGIES FOR THE ON IDENTIFYING SUCCESSFUL FINANCIAL STRATEGIES FOR THE LISTED COMPANIES IN THE UNITED ARAB EMIRATES: AN LISTED COMPANIES IN THE UNITED ARAB EMIRATES: AN EMPIRICAL APPROACH EMPIRICAL APPROACH Abdulla Mohammed Abdulghafoor Follow this and additional works at: https://scholarworks.uaeu.ac.ae/business_dissertations Part of the Business Commons Recommended Citation Recommended Citation Abdulghafoor, Abdulla Mohammed, "ON IDENTIFYING SUCCESSFUL FINANCIAL STRATEGIES FOR THE LISTED COMPANIES IN THE UNITED ARAB EMIRATES: AN EMPIRICAL APPROACH" (2018). Business Administration Dissertations. 19. https://scholarworks.uaeu.ac.ae/business_dissertations/19 This Dissertation is brought to you for free and open access by the Business Administration at Scholarworks@UAEU. It has been accepted for inclusion in Business Administration Dissertations by an authorized administrator of Scholarworks@UAEU. For more information, please contact [email protected].
-
Upload
khangminh22 -
Category
Documents
-
view
1 -
download
0
Transcript of ON IDENTIFYING SUCCESSFUL FINANCIAL STRATEGIES ...

United Arab Emirates University United Arab Emirates University
Scholarworks@UAEU Scholarworks@UAEU
Business Administration Dissertations Business Administration
4-2018
ON IDENTIFYING SUCCESSFUL FINANCIAL STRATEGIES FOR THE ON IDENTIFYING SUCCESSFUL FINANCIAL STRATEGIES FOR THE
LISTED COMPANIES IN THE UNITED ARAB EMIRATES: AN LISTED COMPANIES IN THE UNITED ARAB EMIRATES: AN
EMPIRICAL APPROACH EMPIRICAL APPROACH
Abdulla Mohammed Abdulghafoor
Follow this and additional works at: https://scholarworks.uaeu.ac.ae/business_dissertations
Part of the Business Commons
Recommended Citation Recommended Citation Abdulghafoor, Abdulla Mohammed, "ON IDENTIFYING SUCCESSFUL FINANCIAL STRATEGIES FOR THE LISTED COMPANIES IN THE UNITED ARAB EMIRATES: AN EMPIRICAL APPROACH" (2018). Business Administration Dissertations. 19. https://scholarworks.uaeu.ac.ae/business_dissertations/19
This Dissertation is brought to you for free and open access by the Business Administration at Scholarworks@UAEU. It has been accepted for inclusion in Business Administration Dissertations by an authorized administrator of Scholarworks@UAEU. For more information, please contact [email protected].
I nl 1: u College of Business U~ and Economics •• a.ula.l I ~JSLII 1..::.11J La~ I iist.a l;l -
United Arab Emirates University
United Arab Emirates University
College of Business and Economics
ON IDENTIFYING SUCCESSFUL FINANCIAL STRATEGIES FOR
THE LISTED COMPANIES IN THE UNITED ARAB EMIRATES:
AN EMPIRICAL APPROACH
Abdulla Mohammed Abdulghafoor Ahmed Alawadhi
This dissertation is submitted in partial fulfilment of the requirements for the degree
of Doctorate of Business Administration
Under the Supervision of Professor Abdulnasser Hatemi Jarabad
April2018


iii
Copyright © 2018 Abdulla Mohammed Abdulghafoor Ahmed Alawadhi
All Rights Reserved
iv
Advisory Committee
1) Advisor (Committee Chair): Abdulnasser Hatemi Jarabad
Title: Professor
Department of Economics and Finance
College of Business and Economics
2) Member: Abdulrahman Al-Shayeb
Title: Associate Professor
Department of Economics and Finance
College of Business and Economics
3) Member: Youssef El-Khatib
Title: Associate Professor
Department of Mathematical Sciences
College of Science

\'
Approval of Doctorate Dissertation
The fo llO\\·ing Examining Committee Members approved this Doctorate dissertation :
1) Advisor (Committee Chair): Abdulnasser Hatemi-J
Title: Professor
Department of Economics and Finance
College of Business and Economics
Sigature: 1\.l, /tal,(?~ -J=-oate: _/ _2-_-_D_~_- 2_ 0 I g
2) Member: Kilani Ghoudi
Title: Professor
Department of Statistics
College of Business and Economics
Signaooe: ~_) LL uJ 3) Member: Qasem Al-Mdallal
Title: Professor
Department of Mathematical Science
:i:::,:fS~ 4) Member (External Examiner): Bo Sjo
Title: Associate Professor
Department of Management and Engineering
Institution: Linkoping University, Sweden
signature: ___ !0r __ __,r..X ..... ---o::::...._ ____ _
Date: rz I () 4 J 2.~ I y r (
Date: I 2 ) 0 V / 2.; ) I


vii
Abstract
Financial profile mirrors the performance of a company regarding its competitive
market abilities, sustainability and capacity. Thus, it is a crucial matter for a firm to
seek appropriate financial strategies to furnish a positive influence on boosting the
target outcomes of its entire business performance. This study investigates how the
adopted financial strategies are associated with short/mid/long-term performance of
the UAE Public Joint Stock Companies (PJSCs) that work in ten different business
and industrial sectors, The quarterly based ten-year (2006-2015) Panel Data Set of the
92 PJSCs has been used in measuring the performance of each PJSC. Consequently,
the researcher extracted eleven variables from the refereed finance literature to be
viewed in this study as financial strategy-related factors; four out of them could be
tested for the first time. These variables went into two themes, these are: i) six variables
as a proxy for capital structure, and ii) five variables as a proxy for cash flow
management. These variables were subject to further investigation for determining
which of them have a direct influence on the financial and market performance of the
PJSCs. We combined four measures of financial performance with two measures of
market performance as influential variables to measure the success of the PJSCs
regarding their financial performance. The model of panel data analysis was performed
to make sure that the desirable statistical assumptions are fulfilled correctly, whereas
the estimations were determined by using the Generalized Method of Moments (GMM)
as an estimation technique by the econometric software package EViews. Both, the
analysis of the dataset, and validity of the influential variables have defined a mix of
appropriate dynamic financial strategies for the PJSCs to be stable in averting
unfavourable different economic conditions. This dissertation argues that establishing
a mutual relationship between the financial strategy of a PJSC and its market
performance would be leading it to be successful. Thus, the findings confirmed the
primary assumption of this dissertation that states “Different financial strategies under
different economic conditions would be leading to different results (performance)”.
From a professional viewpoint, this dissertation represents a reliable reference source
for the financial management practitioners.
Keywords: Stock market, Public joint stock firms, Market performance, Firm
performance, Financial strategy, Global financial crisis, the UAE.

viii
Title and Abstract (in Arabic)
نحو تحديد االستراتيجيات المالية الناجحة للشركات المساهمة العامة في اإلمارات العربية المتحدة:
نهج تجريبي
الملخص
البيانات المالية تعكس أداء الشركة من حيث قدراتها التنافسية في السوق واستدامتها لألعمال.
هي أن تحدد الشركة االستراتيجيات المالية المناسبة التي لذلك، فإن من األمور الحاسمة للشركات
يكون لها مردود إيجابي على نتائج وأداء أعمالها بأكمله. تقوم هذه الدراسة بقياس تأثير
االستراتيجيات المالية المعتمدة في أداء الشركة على المدى القصير، والمتوسط، والطويل.
عشر قطاعات أعمال وصناعية مختلفة ا العامة في شركة مساهمة عامة تعمل في 92أستخدمت
دولة اإلمارات العربية المتحدة لقياس تأثير االستراتيجيات المالية المعتمدة على أداء كل شركة.
للشركات المختاره. تم ( 2015-2006) تم استخدام حزمة البيانات المالية الفصلية للسنوات العشر
حتمل كمرجع للسياسات المالية التي سيتم اختبارها وفق استخالص عدد أحد عشر عامل مؤثر م
األبحاث العلمية السابقة في مجال المالية، منها أربع عوامل يتم اختبارها للمرة األولى. تم تصنيف
هذه العوامل المؤثرة في مجموعتين: ستة عوامل تمثل هيكلية رأس المال، وخمسة عوامل تمثل
خضاع هذه العوامل المؤثرة لمزيد من التحقيق لقياس التأثير مباشر إدارة التدفق النقدي. وقد تم إ
المحتمل على األداء المالي والسوقي للشركات المساهمة العامة. تم اختيار مجموعة من أربعة
مقاييس لألداء المالي، إلى جانب مقياسين لألداء السوقي كمؤشرات لقياس نجاح الشركات. كذلك،
الختبارات التشخيص والفحص ( Panel Data) حليل حزمة البياناتلقد تم استخدام نموذج ت
وذلك للتأكد من تلبية متطلبات االفتراضات اإلحصائية البيانية المستهدفة، كما ،المطلوبة إحصائيا
عن طريق Generalized Method of Moments -(GMM) تم اختبار التأثيرات باستخدام أسلوب
وبناء على تحليل البيانات وعالقة العوامل المؤثرة، فقد (.EViews) برنامج اإلحصاء االقتصادي
تم استخالص وتحديد مزيج من االستراتيجيات المالية الديناميكية المناسبة التي تساعد في استقرار
وتخطي الشركات المساهمة العامة لألزمات والظروف االقتصادية المتقلبة. بناء على النتائج
الدراسة تبين أن نجاح الشركات المساهمة العامة يتعلق بوجود عالقة وثيقة المستخلصة، فإن هذه
متبادلة بين االستراتيجيات المالية المعتمدة وتأثيرها في األداء المؤسسي للشركة. الخالصة، النتائج
أن االستراتيجيات المالية المستخلصة من الدراسة تؤكد االفتراض الرئيسي لهذه األطروحة، "
رى، ". من ناحية أخ، تحت الظروف االقتصادية المختلفة، تؤدي إلى نتائج أداء مختلفةالمختلفة
من وجهة نظر أكاديمية، تمثل هذه الدراسة مرجعا موثوقا به في مجال ممارسات اإلدارة المالية،
.والتي تؤسس لمزيد من الدراسات المستقبلية في هذا المجال
ق المالية، الشركات المساهمة العامة، االستراتيجية المالية، سوق األورا: الرئيسيةمفاهيم البحث
.أداء السوق المالي، األزمة المالية العالمية، اإلمارات العربية المتحدة
ix
Acknowledgements
Primarily, my sincere thanks are due to the Mighty ALLAH for giving me the
willpower and persistence to accomplish this unique research study from which I
gained a better understanding and advanced knowledge of a complex economic system
with providing significant contributions to the field of my research interest.
This dissertation would not have come to light without the careful and precise
supervision and guidance of my dissertation advisor Professor Abdulnasser Hatemi
Jarabad , to pave me the way to become a professional researcher. My thanks extended
to the advisory committee members Dr Abdulrahman Al-Shayeb and Dr Youssef El-
Khatib for their effort. I am also truly grateful to Prof. Mohammed Madi, Dr. Rihab
Khalifa, and Dr. Amani El-Anshasy for every particular effort they have furnished to
develop such successful postgraduate programme. I devoted special thanks to Ahmed
Taha (Library Research Desk) for furnishing the required research resources. My
sincere thanks are due to Mr. Assil El-Mahmah (statistician in the UAE Central Bank)
for his substantial efforts in the data analysis and interpretation of the results.
Many professionals in the financial issues have cordially provided me with valuable
data, which sufficiently enriched the research material. Thus, my sincere appreciation
is due to Tawazun Holding for granting me the scholarship for the DBA study.
Likewise, my grateful gratitude is due to Dr. Obaid Al-Zaabi (CEO of SCA) who
eagerly took part in making this study possible. My humble gratitude is for the Abu
Dhabi Securities Exchange (ADX), Dubai Financial Market (DFM), and the Central
Bank of the UAE for their effort in facilitating the data and information availability.
Two conference papers based on the preliminary findings of this dissertation, these
were i) “Financial strategies and firms’ performance: the interrelationship; at The first
HDR Colloquium, May 2017, the University of Wollongong in Dubai”, and ii)
“Financial strategy and firm performance under different economic conditions;
accepted by The 4th UAE Graduate Students Research Conference (UAEGSRC2018),
21st April 2018, the American University of Sharjah. Finally, the usual disclaimer
applies.

x
Dedication
To my late beloved mother (may Allah forgive her and grant her the merciful), who
raised me with respect and loved all people regardless the differences.
To my late father (may Allah forgive her and grant her the merciful), who built on me
the passion of learning and foraging knowledge, from the cradle to the grave.
To my unique country the UAE whose founders, leaders, and people paved the way
to the summit and whom I am proud to belong.
To my beloved family (wife, sons and daughters), whose patience and smiles were
enough to make peaceful oasis during the journey of my DBA study.
xi
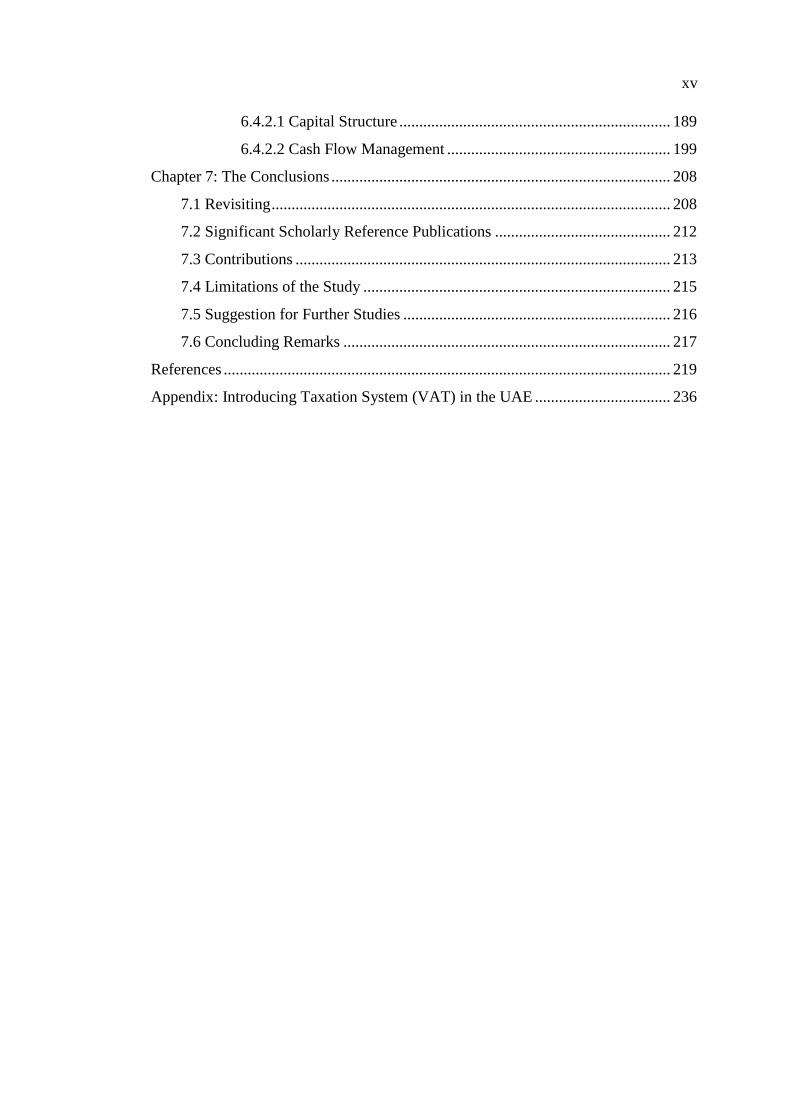
Table of Contents
Title ............................................................................................................................... i
Declaration of Original Work ...................................................................................... ii
Copyright ..................................................................................................................... ii
Advisory Committee ................................................................................................... iv
Approval of Doctorate Dissertation ............................................................................. v
Abstract ...................................................................................................................... vii
Title and Abstract (in Arabic) ................................................................................... viii
Acknowledgements ..................................................................................................... ix
Dedication .................................................................................................................... x
Table of Contents ........................................................................................................ xi
List of Tables............................................................................................................. xvi
List of Figures .......................................................................................................... xvii
List of Abbreviations............................................................................................... xviii
Chapter 1: Introduction ................................................................................................ 1
1.1 Preamble ......................................................................................................... 1
1.2 Research Intention .......................................................................................... 6
1.3 Performance Measures- An Overview ........................................................... 8
1.4 Research Issues ............................................................................................... 9
1.4.1 Research Statement .............................................................................. 9
1.4.2 Research Assumption and Aim .......................................................... 10
1.4.3 Research Objectives ........................................................................... 11
1.4.4 Research Questions ............................................................................ 11
1.4.5 Research Hypotheses ......................................................................... 12
1.4.5.1 Capital Structure and Firm Performance ................................. 12
1.4.5.2 Cash Flow Management and Firm Performance ..................... 12
1.5 Research Strategy ......................................................................................... 12
1.6 Research Ethics and Integrity ....................................................................... 14
1.7 Dissertation Structure ................................................................................... 15
1.8 Summary ....................................................................................................... 17
Chapter 2: The UAE National Economy and Financial Markets ............................... 19
2.1 Synopsis ........................................................................................................ 19
2.2 The UAE Economy- Characteristics ............................................................ 19

xii
2.3 The UAE Economic Conditions in the New Millennium ............................. 23
2.3.1 The Gross Domestic Product (GDP) .................................................. 25
2.3.2 The UAE Financial Markets: A Brief History ................................... 28
2.3.3 Core Roles of the Financial Markets (2001- Present) ........................ 32
2.3.4 Performance of the Emirates Securities Market (2001-2015) ............ 33
2.4 ESM Interrelationship with GDP ................................................................. 37
2.4.1 Traded Value and GDP ...................................................................... 37
2.4.2 Market Capitalisation and GDP ......................................................... 38
2.4.3 ESM and Economic Growth .............................................................. 42
2.5 Summary ....................................................................................................... 46
Chapter 3: Literature Review ..................................................................................... 50
3.1 Introduction .................................................................................................. 50
3.2 Theoretical Debates ...................................................................................... 53
3.3 Performance Measurements ......................................................................... 55
3.3.1 Historical Review ............................................................................... 55
3.3.2 Current Studies ................................................................................... 56
3.3.3 Financial Performance ....................................................................... 57
3.3.3.1 Return-On-Investment (ROI) .................................................. 59
3.3.3.2 Net Profit (NP)......................................................................... 59
3.3.3.3 Growth Rate (GR) in Sales ...................................................... 60
3.3.3.4 Earnings Per Share (EPS) ........................................................ 61
3.3.4 Market Performance ........................................................................... 62
3.3.4.1 Return of the Share Price (Return) .......................................... 63
3.3.4.2 Tobin’s Q (Market-to-Book Ratio) ......................................... 63
3.3.5 Theoretical Framework ...................................................................... 65
3.4 Financial Strategy ......................................................................................... 65
3.4.1 Financial Strategies as Potential Factors ............................................ 68
3.5 Capital Structure ........................................................................................... 70
3.5.1 Leverage Level ................................................................................... 78
3.5.2 Firm’s Size ......................................................................................... 80
3.5.3 Capital Expenditure ............................................................................ 83
3.5.4 Government Ownership ..................................................................... 85
3.5.5 Sustainable Growth Rate (SGR) ........................................................ 86

xiii
3.5.6 Unrelated Assets................................................................................. 90
3.6 Cash Flow Management ............................................................................... 92
3.6.1 Cash Conversion Cycle (CCC) .......................................................... 95
3.6.2 Operating Activities Management ..................................................... 96
3.6.3 Investing Activities Management ...................................................... 97
3.6.4 Financial Activities Management ...................................................... 97
3.6.5 Cash Holding Position ....................................................................... 98
3.7 Summary ..................................................................................................... 101
Chapter 4: Data and Methodology ........................................................................... 103
4.1 Introduction ................................................................................................ 103
4.2 Data Description ......................................................................................... 103
4.2.1 Dependent Variable .......................................................................... 107
4.2.2 Independent Variables ...................................................................... 109
4.2.2.1 Capital Structure .................................................................... 109
4.2.2.2 Cash Flow Management ........................................................ 111
4.2.3 Control Variables ............................................................................. 112
4.3 Model Specifications .................................................................................. 113
Chapter 5: Results and Discussions ......................................................................... 116
5.1 Synopsis ...................................................................................................... 116
5.2 Model Estimation ....................................................................................... 117
5.2.1 Capital Structure Analysis (CSA) .................................................... 117
5.2.2 Cash Flow Management (CFM) Analysis ....................................... 119
5.3 Empirical Results ........................................................................................ 121
5.3.1 Capital Structure and Firm Performance.......................................... 121
5.3.1.1 Return-On-Investment (ROI) ................................................ 121
5.3.1.1.1 Global Period ........................................................................ 122
5.3.1.1.2 Under Different Economic Conditions ................................. 125
5.3.1.2 Earnings-Per-Share (EPS) ..................................................... 126
5.3.1.2.1 Global Period ........................................................................ 127
5.3.1.2.2 Under Different Economic Conditions ................................. 129
5.3.1.3 Net Profit (NP)....................................................................... 130
5.3.1.3.1 Global Period ........................................................................ 131
5.3.1.3.2 Under Different Economic Conditions ................................. 133

xiv
5.3.1.4 Return of Share Price (Return) .............................................. 134
5.3.1.4.1 Global Period ........................................................................ 135
5.3.1.4.2 Under Different Economic Conditions ................................. 137
5.3.1.5 Sales Growth (GR_Sale) ....................................................... 139
5.3.1.5.1 Global Periods ...................................................................... 140
5.3.1.5.2 Under Different Economic Conditions ................................. 142
5.3.1.6 Tobin's Q (Q) ......................................................................... 144
5.3.1.6.1 Global Period ........................................................................ 144
5.3.1.6.2 Under Different Economic Conditions ................................. 147
5.3.2 Cash Flow Management and Firm Performance .............................. 148
5.3.2.1 Return on Investment (ROI) .................................................. 149
5.3.2.1.1 Global Period ........................................................................ 149
5.3.2.1.2 Under Different Economic Conditions ................................. 152
5.3.2.2 Earnings Per Share (EPS) ...................................................... 153
5.3.2.2.1 Global Period ........................................................................ 154
5.3.2.2.2 Under Different Economic Conditions ................................. 155
5.3.2.3 Net Profit (NP)....................................................................... 157
5.3.2.3.1 Global Period ........................................................................ 157
5.3.2.3.2 Under Different Economic Conditions ................................. 159
5.3.2.4 Return of the Share Price (Return) ........................................ 161
5.3.2.4.1 Global Period ........................................................................ 162
5.3.2.4.2 Under Different Economic Conditions ................................. 163
5.3.2.5 Sales Growth (GR_Sale) ....................................................... 165
5.3.2.5.1 Global Period ........................................................................ 166
5.3.2.5.2 Under Different Economic Conditions ................................. 168
5.3.2.6 Tobin's Q (Q) ......................................................................... 169
5.3.2.6.1 Global Period ........................................................................ 170
5.3.2.6.2 Under Different Economic Conditions ................................. 172
Chapter 6: Policy Implications and Recommendations ........................................... 174
6.1 Preamble ..................................................................................................... 174
6.2 The UAE Economy: Current Status and Future Visions ............................ 174
6.3 Financial Markets and National Economy- A Possible Connection .......... 181
6.4 Financial Strategies and Firm’s Performance ............................................. 185
6.4.1 Firm’s Performance .......................................................................... 185
6.4.2 Proposed Financial Strategies .......................................................... 188
xv
6.4.2.1 Capital Structure .................................................................... 189
6.4.2.2 Cash Flow Management ........................................................ 199
Chapter 7: The Conclusions ..................................................................................... 208
7.1 Revisiting .................................................................................................... 208
7.2 Significant Scholarly Reference Publications ............................................ 212
7.3 Contributions .............................................................................................. 213
7.4 Limitations of the Study ............................................................................. 215
7.5 Suggestion for Further Studies ................................................................... 216
7.6 Concluding Remarks .................................................................................. 217
References ................................................................................................................ 219
Appendix: Introducing Taxation System (VAT) in the UAE .................................. 236
xvi
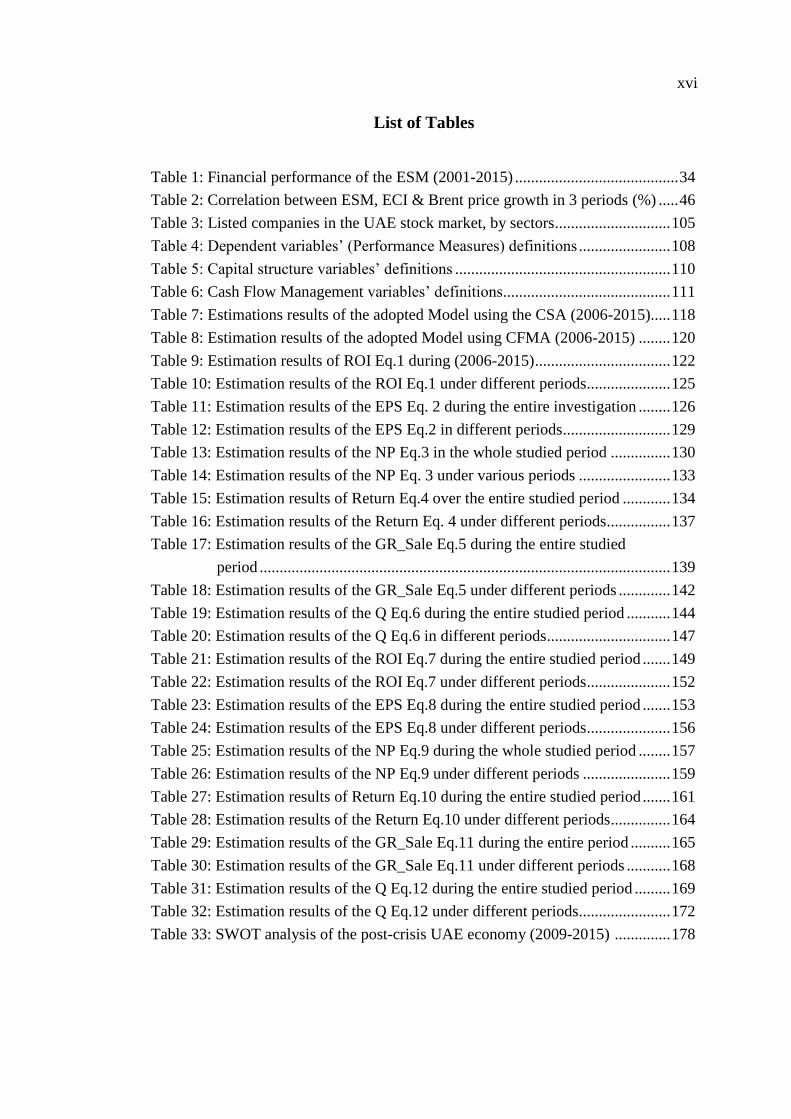
List of Tables
Table 1: Financial performance of the ESM (2001-2015) ......................................... 34
Table 2: Correlation between ESM, ECI & Brent price growth in 3 periods (%) ..... 46
Table 3: Listed companies in the UAE stock market, by sectors............................. 105
Table 4: Dependent variables’ (Performance Measures) definitions ....................... 108
Table 5: Capital structure variables’ definitions ...................................................... 110
Table 6: Cash Flow Management variables’ definitions .......................................... 111
Table 7: Estimations results of the adopted Model using the CSA (2006-2015)..... 118
Table 8: Estimation results of the adopted Model using CFMA (2006-2015) ........ 120
Table 9: Estimation results of ROI Eq.1 during (2006-2015) .................................. 122
Table 10: Estimation results of the ROI Eq.1 under different periods ..................... 125
Table 11: Estimation results of the EPS Eq. 2 during the entire investigation ........ 126
Table 12: Estimation results of the EPS Eq.2 in different periods........................... 129
Table 13: Estimation results of the NP Eq.3 in the whole studied period ............... 130
Table 14: Estimation results of the NP Eq. 3 under various periods ....................... 133
Table 15: Estimation results of Return Eq.4 over the entire studied period ............ 134
Table 16: Estimation results of the Return Eq. 4 under different periods ................ 137
Table 17: Estimation results of the GR_Sale Eq.5 during the entire studied
period ....................................................................................................... 139
Table 18: Estimation results of the GR_Sale Eq.5 under different periods ............. 142
Table 19: Estimation results of the Q Eq.6 during the entire studied period ........... 144
Table 20: Estimation results of the Q Eq.6 in different periods ............................... 147
Table 21: Estimation results of the ROI Eq.7 during the entire studied period ....... 149
Table 22: Estimation results of the ROI Eq.7 under different periods ..................... 152
Table 23: Estimation results of the EPS Eq.8 during the entire studied period ....... 153
Table 24: Estimation results of the EPS Eq.8 under different periods ..................... 156
Table 25: Estimation results of the NP Eq.9 during the whole studied period ........ 157
Table 26: Estimation results of the NP Eq.9 under different periods ...................... 159
Table 27: Estimation results of Return Eq.10 during the entire studied period ....... 161
Table 28: Estimation results of the Return Eq.10 under different periods ............... 164
Table 29: Estimation results of the GR_Sale Eq.11 during the entire period .......... 165
Table 30: Estimation results of the GR_Sale Eq.11 under different periods ........... 168
Table 31: Estimation results of the Q Eq.12 during the entire studied period ......... 169
Table 32: Estimation results of the Q Eq.12 under different periods....................... 172
Table 33: SWOT analysis of the post-crisis UAE economy (2009-2015) .............. 178

xvii
List of Figures
Figure 1: Flowchart of dissertation structure ............................................................. 18
Figure 2: The UAE national economy (GDP) in current US$ ................................... 26
Figure 3: Annual GDP growth rate of the UAE ......................................................... 27
Figure 4: Comparison of the UAE’s GDP growth rate to other regions .................... 27
Figure 5: Traded value as a percentage of GDP ........................................................ 38
Figure 6: Market capitalisation of UAE and other developing countries .................. 39
Figure 7: ESM vs the UAE economy performance (2001-2015) .............................. 40
Figure 8: ECI and ESM developments....................................................................... 44
Figure 9: ECI and lag of ESM developments ............................................................ 45

xviii
List of Abbreviations
ABC Activity-based Costing
ADX Abu Dhabi Securities Exchange
AED Arab Emirates Dirham
CAP Capitalisation
CAPEX Capital Expenditure
CCC Cash Conversion Cycle
CCP Central Counterparty Processing
COGS Cost of Goods Sold
CSA Cash Structure Analysis
DFM Dubai Financial Market
D/E debt-to-equity ratio
ECI Economic Composite Indicator
EPS Earnings per Share
ES&CA Emirates Securities and Commodities Authority
ESM Emirates Securities Market
EVA Economic Value-Added
FBD&M Firm’s Board of Directors and Management
FDI Foreign Direct Investment
FEM Fixed Effect Model
G&A General and Administration Expenses
GCC Gulf Cooperation Council Countries
GDP Gross Domestic Production
GM Growth Margin
GMM Generalised Method of Moments
GPM Gross Profit Margin
GR Growth Rate
GRS Growth Rate in Sales
ICI Istanbul Chamber of Industry
IFRS International Financial Reporting Standards
IGR Internal Growth Rate
IMF International Monetary Fund
IPO Initial Public Offering
JV Joint Venture
LPE Law of proportionate effect
MENA Middle Eastern and North African Countries
MNC Multi-National Companies
MOE Ministry of Economy
MSCI Morgan Stanley Capital International
MVA Market Value-Added
MVBV Market-to-Book Value

xix
NP Net Profit
NPV Net Present Value
OLS Ordinary Least Squares
OPEC Oil-Producing and Exporting Countries
PCA Principal Component Analysis
PJSC Public Joint Stock Companies in the UAE
PLS Panel Least Squares
REM Random Effect Model
ROA Return-On-Assets
ROCE Return-On-Capital Employed
ROE Return-On-Equity
ROI Return-On-Investment
RBV Resource-Based View
S&P Standard and Poor’s
SCA Securities and Commodity Authority
SGR Sustainable Growth Rate
SRO Self-Regulatory Organization
UK United Kingdom
UAE United Arab Emirates, The
VAT Value-Added Tax
WACC Weighted Average Cost of Capital (WACC)
WEF World Economic Forum, The
WTO World Trade Organisation, The

1
Chapter 1: Introduction
1.1 Preamble
There has been a continuing debate continues amongst the academics and financial
practitioners about the ability of a business firm to overcoming various unfavourable
economic conditions and business market fluctuations regarding its financial
performance. Hence, many financial firms are striving to find suitable approaches for
managing their financial revenues from various business sources and activities, such
as contracts, trading, supply and outsource services.
Development and adoption of an efficient approach are significantly needed for the
firm to managing its existing financial assets with snack risks. In this case, while the
financial firm planning for achieving sustainable business growth and stability, it
should adopt a suitable financial strategy as a driving force for assessing its own
financial needs and sources, which could enable it to meet its proposed business
objectives conveniently, and likewise to fulfil the ultimate mission. Therefore, the
financial strategy is considered a company-specific strategy. On the other side, the
Firm’s Board of Directors and Management (FBD&M) is eventually responsible for
structuring and adopting this strategy, which could potentially be derived from the
company own business activities and missions.
The steady progress in the financial, as well as economic studies, and their
interdisciplinary association with other business areas has promoted the elements of
concern of many academics and researchers in business strategy to recognise finance
as an interesting subject of study, such like management, operations research,
accounting, and the like. Likewise, many business scholars attempted to find logical
2
annexation between the firm’s strategy for its financial performance (Barton &
Gordon, 1987).
Many theories developed, and empirical research conducted to find decisive solutions
to the finance-related problems. Some of such relentless research activities aimed
purposely to find a standard page of agreement on the factors that possess direct effects
on making decisions regarding the financial strategies; in other words, the way and
pattern of efficiency with which the factor can influence the firm performance (Myers,
1984). Nonetheless, the concept of strategy from business management aspect and
theory of firm from financial aspect were overlapping for developing a firm-specific
financial strategy.
The firm-specific financial strategy is based on a sound justification and definition of
the term of its business plan that aims to maintain the business mission and
competitiveness in the domains of relevant markets. Therefore, the financial firm
should scan the surrounding business environments, and forecast the financial trends
in similar markets. This preparedness can be assisting the firm to be more responsive
to predictable and unpredictable changes and uncertainties of the local and global
market regarding identifying its priorities and modifying financial strategy to cope
with these changes (Cibin & Grant, 1996; Pickernell & Hermyt, 1999). In connection
to this, Slater and Zwilein (1996) indicated that “The firm’s financial strategy has
significant potential in influencing shareholder value creation; therefore, it is a
product of firm’s investment, financing, and dividend decisions”.
The adoption of an appropriate financial strategy could largely influence the business
performance of the firm over both short-term and long-term, this on the one hand. On
3
the other hand, the adopted financial strategy might deviate the business sustainability
of the firm since it is considered as a driving force that paves the way for the firm for
its future business directions. Pickernell and Hermyt (1999) stated the theories that
concerned with the definition of a successful company are incorporating specific
criteria, such as annual turnover, profitability, growth rate, return-on-capital-
employed (ROCE), and size of the asset (or firm size). Likewise, the researcher took
on some of these standards in measuring financial success of the UAE PJSCs.
Thompson (1998) conceived the business firm as a healthy governing body when it
has developed distinctive advantages over its challengers and competitor in many
business domains. These exciting activities are underpinned by corporate synergy,
successful transfer of professional accomplishments, sharing business activities, and
creating effective linkages between its several departments that required in the
different output lines. In this regard, Antcliff, Higgins, Toms, and Wilson (2007)
determined the successful firm as an entity, which i) works independently with high
productivity; ii) overtakes its peer group regarding the median yield-to-capital within
the firm’s business field; and iii) outpaces another peer group regarding return-on-
capital to industry norms.
The firm size has long been focusing on the financial and microeconomic studies,
because of its potential application as a criterion to assess the business/financial
performance. In connection to this, Peter and Waterman (1982) indicated that there is
an apparent relationship between the firm size and its productivity; in other words, the
big firm is potentially more favourable regarding its mass production, financial
capability, and reaching foreign markets over broad geographical coverage. Moreover,
it was found proven evidence that the best practices of a business firm can maintain a

4
superior execution of its business success (Yusuff, 2004). Consequently, the business
firm should put into action an effective business strategy to enhance sufficiently the
sustainability of its success regarding developing the ability to gain some advantages
over its competitors in the same business domains (Ohmae, 1982).
Many research studies attempted to identify the potential factors that potentially
involved in striking the target success of the execution of the firm’s business strategy.
Grienitz and Schmidt (2012) defined some factors associated with the successful
business strategy of some German automotive supply firms. Among these factors were
market scanning, flexible operations, standard knowledge management, and hiring
skilled personnel. Thus, the successful business firm could run a broad range of
innovative technologies, providing consistent outsourcing, and developing various
reaction scenarios for meeting uncertainties in its surrounding business environments.
The existing body of the relevant financial literature revealed that a business firm that
progressively reached a point above the average of its financial performance is branded
by having thorough managerial outcomes. Thus, such a business firm usually produces
its specific values as a critical component of success to keeping its focused
commitments to customers and suppliers, as well as promoting business innovation
and seeking continuous advancement, along with building mutual relationships with
its employees. Hence, the created values could support the firm to be successful via
the enhanced competition racing with its peers.
Many scholars who are interested in firm’s success are still in dispute over which factor
is more potent in bringing the firm to be successful. The scholars in the financial fields
are in searching of settling such disputes through reaching agreed-upon criteria for
5
identifying and determining that could be used in the evaluation of the firm’s
performance regarding the success or failure causes. Some criteria have been extracted
from the relevant existing literature that focused on market behaviour, managerial
autonomy, business capability, technology involvement, product design quality and
monopoly (Pickernell & Hermyt, 1999).
The potential factors are frequently facing various socioeconomic and political stresses
that could alter their effectiveness. Therefore, the business firm often proposes a
specific strategy to deal with a bundle of economic issues, such as market trends,
competitor behaviour, stakeholders’ interest, and ability to gain governmental support.
Thus, the ultimate purpose of the developed strategy would be acting as an immunity
barrier against financial crises and unfavourable economic conditions.
Inquiry about this topical theme has revolved around the assumption that specific
financial strategies should either boost or hinder the competitive performance of the
business firm. This research study is exploratory and empirically driven to examine
the potential relationship and impact of various financial strategies on both short-term
and long-term organisational performance of the UAE PJSCs within ten years (2006-
2015) including potential effects of the 2008 global financial crisis and its post
consequences. The investigation of the crisis and its consequences has given vital
importance to the empirical findings generated from this dissertation.
This dissertation aims at focusing on defining a possible connection between the
achievement of significant financial performance and identifying and adoption of an
appropriate financial strategy to consider as a successful approach. Also, the study
highlights the significance of the PJSCs and the Financial Market to the UAE national
6
economy, as well as, at the macro level, it considers the UAE as a suitable case study.
Thus, the dissertation’s findings would furnish applicable criteria for the evaluation of
the effectiveness of the adopted financial strategy on the financial performance and
capacity of the business firms in the business context of the UAE.
We are looking at achieving the aim of this study through inquiring about how the
existence of the financial markets has efficiently enhanced with the development of
financial activities of the UAE PJSCs, as well as absorbing the shocks of local and
global financial turbulence and instability. Consequently, particular emphasis is given
to testing the firm's performance statistically within the realm of adopting a successful
financial strategy.
1.2 Research Intention
Over the past three decades, the global economic order has undergone rapid changes
and diversification in the core business activities, which had provided the business
firms suitable capacities for a persistent growth. The pioneering work of Modigliani
and Merton (1963) “The theory of potential relationships between efficiency and
capital structure” regarding firm’s performance. This theory has been subject to
intensive investigations conducted by many researchers in the corporate finance
domains (e.g., Stattman, 1980; Basu, 1983; Rosenberg, Reid, and Lanstein, 1985;
Chan, Hamao, and Lakonishok, 1991; Fama & French, 1992; Johnson & Soenen,
2003; Höbarth, 2006) using different measures of financial and market performance.
The research intention of this study considers the firm’s financial strategy as a critical
factor in reaching a satisfactory performance. Doubtless, different financial strategies
might generate different results regarding formulating financial performance.
Therefore, the business firm is required to develop various management approaches in

7
response to such interrupting financial conditions, taking into consideration the
interests and expectations of various stakeholders, such as the Firm’s Board of
Directors, policy-makers, shareholders, fund providers, stock marketers, and firm’s
employees. Nevertheless, it is crucial for the upper management to adopt appropriate
financial policies and strategic basis for making the right decisions that could
positively affect the financial and market performance of a business firm.
The global financial crisis in 2008 was considered a demarked economic event whose
adverse effects have profoundly interrupted great number of PJSCs, worldwide.
However, the UAE PJSCs was not an exception. The concerned global crisis represents
a typical financial case for scholarly investigation to inquire about the behaviour and
responses of a business firm towards such hazardous economic conditions. Also, the
UAE capital markets were also severely affected by 2008 global financial crisis; on
the other hand, most of the studies investigated the consequences of the 2008 crisis on
the UAE PJSCs in the business context were about the impact of the corporate
governance on the firm’s performance.
Moreover, the 2008 global crisis unveiled the dis-efficiency of some corporation
management in financial and investment decisions to sustain the business growth of
the firms for securing desirable future efficiently. Therefore, the primary aim of this
study is finding decisive factors for measuring both the financial and market
performance of the UAE PJSCs before, during, and post the 2008 global financial
crisis. Moreover, it investigates the roles of the financial management and investment
decisions in the organisational performance to facing such crisis and the like.
In this dissertation, the required financial data have been collected from the Securities
and Commodities Authority (SCA) about local companies listed in both Abu Dhabi
8
Securities Exchange (ADX) and Dubai Financial Market (DFM) covering the period
from the 1st quarter of 2006 till 4th quarter of 2015. The interesting PJSC-related data
drawn from a quarterly panel dataset of 92 PJSCs listed in the UAE stock market
covering different sectors and industries. The relevant scholarly literature provides a
pool of various financial models and strategies. Thus, the different financial strategies
could be applied in various ways by the Firm’s Board.
This research study employs four measurements of financial performance with two
measurements of market performance. One of the striking findings of this study is
defining, at least, four variable factors that are believed to have significant influences
on such concerned relationships within the context of the regional business
environment. The further investigation also covers the investment and financing
decisions from operation perspective.
The issue of the potential influences on the relationship between financial strategies
and the performance of the UAE PJSCs under hazardous economic conditions has not
been tackled or investigated by any scholarly study in the UAE, hitherto. However,
this work could be considered as the first scholarly research investigating the
performance of a company regarding financial strategy to pass successfully over
unstable economic conditions to the best knowledge.
1.3 Performance Measures- An Overview
The previously conducted studies revealed that neither a single performance measure
could be regarded as an appropriate approach, nor could a single method be considered
as the best way to estimate the firm’s value despite the accessibility of various
scientific methods to act thus. Consequently, performance measures and firm valuation

9
could defer among studies, and thus, different results are expected. Nevertheless, the
performance measures that could be useful for all firms in this context, according to
the underpinning assumptions, are selected to consider in further analysis tasks.
Hassan and Halbouni (2013) mentioned, “Due to uncontrollable factors of the market-
based measures, executives prefer accounting-based performance since these
measures are easier to control. However, market-based measures are more objective
since it is out of company’s control, and can be affected by different economic
conditions”. This study employs both dimensions of measurements to validate the
impact of various financial strategies on the firm’s financial performance.
The dissertation chose six different measures from the reviewed literature for
evaluating the performance and deciding the success of companies. These measures
are categorised into two broad dimensions i) financial performance (i.e., ROI, net
profit (NP), Earnings per share (EPS), and growth rate in sales (GR)], and ii) market
performance (i.e., share price, and Tobin’s Q (Market-to-Book-value). These two
dimensions are crucial for any listed company to evaluate the performance and
achieving success in the way to reach their optimal goal of maximising the shareholder
value. As part of performance analysis, it is assumed that these measures will have
interactions and interdependent relationships as discussed in many scholarly works.
1.4 Research Issues
1.4.1 Research Statement
This dissertation investigated how the adopted financial strategies by the firms’
Management and Board of Directors are associated to the various period-terms of the
UAE Public Joint Stock Companies (PJSC) performance through focusing on the
10
corporate finance and performance of the firm. Such adopted strategies are concerned
mostly with the performance of a firm listed among the UAE PJS companies. In this
dissertation, the financial strategies are categorised into two main dimensions i) capital
structure and ii) cash flow management. While the performance measurements cover
two different approaches; these are financial performance and market performance.
The adopted strategies should be viable for such stakeholders as the Board of
Directors, shareholders, investors, fund providers, stock market brokers, policy-
makers, along with the firm’s management to achieve desirable results. The study
covers forty quarterly-based periods extended through ten years (2006-2015) to
develop a reliable reference to measure the firms’ performance under different
economic conditions (i.e. before, during, and after the 2008 global financial crisis).
1.4.2 Research Assumption and Aim
The primary research assumption is “The different financial strategies under different
economic conditions are leading to different performance”. Thus, the study aims at:
1) Determining the potential effects of financial strategies on firm’ performance.
2) Providing evidence-based results of the possible connection between financial
strategy and firm’s performance.
3) Recommending proper dynamic financial strategies to business firms to meet
economic crisis to enhance their desirable performance continuously.
4) Outlining the implications, recommendations, and suggestions for further
studies based on the dissertation findings.

11
1.4.3 Research Objectives
The core research objectives of this dissertation study are focusing on:
Consolidating the capital structure and cash flow management as paramount
components of the financial strategies adopted by various companies.
Defining factors affecting the financial strategy regarding firm’s performance.
Investigating the relationship between the capital structure and performance.
Investigating the cash flow management-performance relationship.
Exploiting two sets of performance measures, namely, financial measures and
market measures to reveal the financial strategy-performance relationship.
Examining the objectivity and rationalism of relationship between the financial
strategies and performance that occurred during different economic conditions.
In this dissertation, eleven different financial strategies as potential factors tested; these
strategies divided into two sets. The first set represents the capital structure related
financial strategies. The second set represents the cash flow management related
financial strategies. This dissertation considers the gained data as homogeneous
according to the mentioned categories. Thus, we assume that these potential factors
and performance measures are relative measures as they are in the format of either
ratios or percentage, which would be facilitating the comparison between different
companies and different sectors.
1.4.4 Research Questions
1) How could different financial strategies (e.g., capital structure and cash flow
management) influence firm’s performance in various economic conditions?
2) How could financial-mixed strategies be helping firms to face emerging
economic crisis regarding performance sustainability?

12
1.4.5 Research Hypotheses
Based on the research’s key assumption, the retrieved literature told about a gap that
could help to develop eleven hypotheses of two categories:
1.4.5.1 Capital Structure and Firm Performance
H1: The higher is the leverage level, the lower is the firm’s performance
H2: The bigger the company, the better the performance
H3: The higher the capital expenditure, the better the performance.
H4: The higher the Government Ownership, the better the performance.
H5: The higher the sustainable growth rates, the better the performance.
H6: The higher the Investment in Unrelated Assets, the better the performance.
1.4.5.2 Cash Flow Management and Firm Performance
H7: The shorter the Cash Conversion Cycle (CCC), the better the performance.
H8: The higher the cash from operating activities, the better the performance.
H9: The higher negative cash of investment, the better the performance.
H10: Positive cash from financing activities lead to better firm’s performance.
H11: The higher some cash holdings, the better the firm’s performance.
1.5 Research Strategy
This study will use the deductive research approach “Top-to-Down” through an
empirical study of the UAE listed companies to examine how related financial
strategies (factors) influence the firms’ performance (dependent variables). Financial
strategies are of two dimensions: capital structure and cash flow management, whereas
the performance measurements cover two different approaches: financial performance
and market performance.
13
Based on previous studies, most of the nominated factors were tested in different
business contexts and market regions worldwide. However, the extant literature
revealed that no relevant scholarly studies had investigated four of these selected
factors hitherto. Also, according to the researcher’s best knowledge, most of the
performance measurements used in the ongoing study (dependent variables) have not
been examined in the context of the GCC or UAE market. Therefore, we shall filtrate
the existing related theories to select the one that could help us in the validity of the
proposed model and argument of this study.
Many researchers have not yielded to the failure of their investigative attempts for
reaching acceptable findings; however, they could get the most benefit from the
lessons learned from the previous related research endeavours. As a result, the adopted
research paradigm would be critical rationalism, whereas the ontology (social reality)
would be a cautious realist, and the epistemology (reality study) would be falsifying
theories/hypotheses via new data that created for the observations. Furthermore, neo-
realism will be followed for new testing factors; by discovering structures (variables
relationship) and mechanism that cause observed phenomena (firm’s performance).
The problem investigation and data interpretation enhanced by merging my
professional expertise with academic elaboration. The research approach achieved via:
1) Start with identifying a regularity (theories and hypotheses) to be explained or
examined to falsify or corroborate (validate); the regularity would be “related
financial strategies affect firm’s performance”.
2) Construct a theory and deduce hypothesis for new Factors.
3) Examine (selected theories) and developed hypotheses from collected data.
14
4) Suggest solutions: recommend an appropriate mix of dynamic financial
strategies for companies to be prepared for the economic crisis and to sustain
its desirable performance continuously.
1.6 Research Ethics and Integrity
The stock markets in Abu Dhabi and Dubai, as major players in the UAE financial
market in which release their respective reports annually. This means that the actual
financial data of the Dubai JPSCs are accessible (i.e., unclassified). Thus, the most
critical ethic in this regard is avoidance of any biases that might come from the data
analysis and interpretation of the findings.
The below research integrity and ethical principles would help to conduct the study:
Objectivity/Unbiasedness: Avoiding bias in the data collection, empirical design,
data analysis, personal opinion/self-experiment, or any other part of the study
where objectivity could negatively affect the results and aim.
Cautiousness: Avoiding error or conversion mistakes while collecting the data
from the original resources, to build on reliable data.
Respect for Intellectual Property: Appreciating the effort of others and the
copyrights; especially the other researchers, by avoiding using or reproducing their
findings without citing the real resource or getting an authorisation.
Honesty: Supporting all data, findings, methods, followed procedures, and
publication free of any misrepresentation, falsification, or fabrication.
Openness: Finalising the study and sharing the findings with the stated
stakeholders where it is applicable. The Security and Commodity Authority (SCA)
is expecting to share the findings, as they are the primary resource of the data will
be used in this dissertation.
15
Responsible Publication: Publishing the studies/articles’ findings with following
the rules of the UAEU, scholarly resources, and other related parties with avoiding
any possible breach the rights of others.
1.7 Dissertation Structure
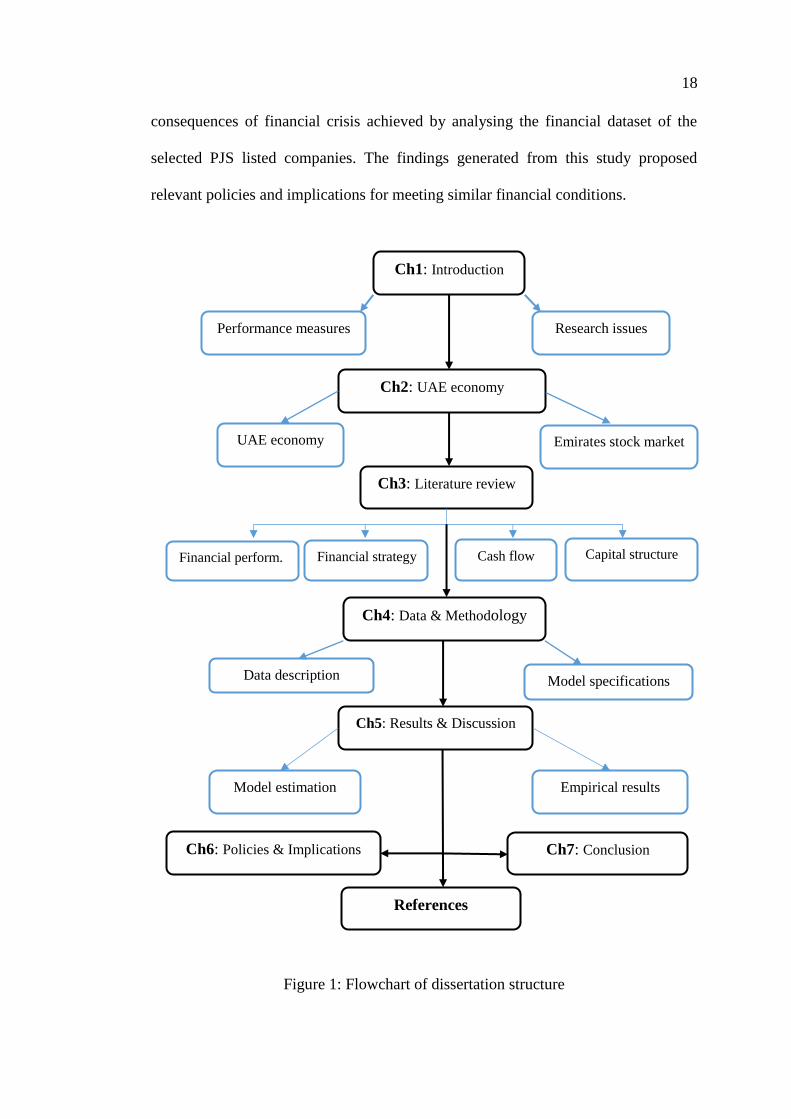
This dissertation is set in conformity with the standard template designed by the
College of Graduate Studies at the United Arab Emirates University (UAEU). Figure
1 illustrates the scheme of the physical structure of the dissertation body, which is
divided into seven chapters; each chapter is concerned with specific coverage.
Chapter 1- Introduction: This chapter presents an original background about the
functional relationship between the financial strategies and firm performance
measures, which gives overall coverage of the research topic of this study. The chapter
also covers i) research issues (e.g., statement, assumption and aim, objectives,
questions, and hypotheses), ii) the research strategy, iii) research ethics and integrity,
and iv) a summary.
Chapter 2- The UAE National Economy and Financial Markets: This chapter
presents the milestone of the financial market in the UAE, which is based on the World
Bank and Emirates Stock Market coverage. The focused details are concerned with the
status of the UAE national economy since the turn of the 21st century and its mutual
relations with financial market activities. Such interrelationship between the two
entities can give a clear interpretation of various economic indicators under the
umbrella of the UAE national economy and financial market.
Chapter 3- Literature Review: This chapter reviews the existing body of scholarly
finance literature to highlight a possible gap in the research domain concerning firm
performance and financial strategy firm performance from theoretical and applied
16
perspectives. It also covers related topics, such as criteria for the successful business
firm, stock price, market competitive advantages, resource-based view (RBV), and
corporate finance. It defines the terms of interest as net profit (NP), return-on-
investment (ROI), growth rate (GR).
Chapter 4- Research Methodology- Data Collection: Describes the data collection
and discuss the Model specification to investigate the relationship between the
proposed variables and the firm’s performance measures. The quantitative research
method adopted to analyse the collected data employing Generalized Method of
Moments (GMM) as estimation technique by EViews™ econometric analytic software
to develop functional mathematical models.
Chapter 5: Empirical Results and Discussion: This chapter discusses the EViews
generated findings, which concerned with the data that cover the entire 40 periods and
the three consecutive periods of financial market performance, where considering
2008 global financial crisis as a significant year. Thus, the findings represented pre-,
during, post-financial crisis, and the entire period.
Chapter 6- Policy Implications and Recommendations: This chapter furnishes
policies and implications of the dissertation’s findings for the policy/decision-makers
who are interested or indulged in the financial issues pertinent to the UAE national
economy; notably, during the financial crisis or unfavourable economic conditions
(e.g., consequences of the 2008 global financial crisis) through emphasising the
significance of key economic indicators. Also, recommends some dynamic financial
strategies to overcome the similar economic crisis and to sustain its desirable
performance continuously.
Chapter 7- Conclusion: This chapter sheds light on the whole results and findings of
the empirical investigations. It attempts likewise to link the generated results with the
17
raised research questions and proposed hypotheses, as well as it mentions the
significant contributions of the findings to firm’s financial strategy to meet
unfavourable economic conditions. This study faced certain limitations concerned
with sample size, methodology and data analysis instrument, along with prevailed
economic condition when the study conducted. The conclusion summarises the
critiques about the significance of the findings that could fill the knowledge gap in the
domain of the mutual relation between the financial strategy and firm’s performance.
The dissertation acknowledges the relevant scholarly works that borrowed from other
refereed information resources; moreover, it relied on the fundamental financial
theories, which proposed by eminent authors, such as Nobel laureates (see 7.2). These
citations were helpful references to supporting the researcher in analysing the collected
data and conducting critical analyses to compare the study findings against previously
published works on the topic to fill the existing knowledge gap in this domain since
there are six proposed variables have not tackled by the financial studies.
1.8 Summary
Many countries are striving to make their financial system reaching the best level of
stability to play an essential role in their socio-economic development and welfare.
The financial crisis of 2008 took place in different parts of the world leaving a wide
range of post-crisis consequences, which possess the same pattern of worries among
the investors, traders, and government financial institutions, such as central banks.
Therefore, the implications of the 2008 global financial crisis have national, regional
and international relevance. The primary objective of this empirical study is to
highlight the importance of recovering the post-crisis consequences for attaining
stability and functionalities of the UAE financial system. The diagnosis of the
18
consequences of financial crisis achieved by analysing the financial dataset of the
selected PJS listed companies. The findings generated from this study proposed
relevant policies and implications for meeting similar financial conditions.
Figure 1: Flowchart of dissertation structure
Ch1: Introduction
Performance measures
Ch2: UAE economy
Research issues
UAE economy
Financial strategy
Ch3: Literature review
Financial perform.
Emirates stock market
Data description
Ch4: Data & Methodology
Model specifications
Model estimation
Ch5: Results & Discussion
Ch6: Policies & Implications
Empirical results
Ch7: Conclusion
Cash flow Capital structure
References

19
Chapter 2: The UAE National Economy and Financial Markets
2.1 Synopsis
This chapter discusses the development of the financial market activities in the UAE
through highlighting the milestones of significant phases that made the finance
business as a hallmark of the UAE national economy and financial market since the
onset of the federation. The chapter consists of four main sections; some sections are
further divided into related subsections:
Section 2.2 is an introductory note on the mutual relationship between the UAE
national economic conditions and the financial market activities.
Section 2.3 sheds light on the UAE economic conditions since the turn of the
21st century. Subsection 2.3.1 furnishes some statistical data about the growth
of the UAE gross domestic production (GDP) within the period 2001-2014.
Subsection 2.3.2 gives a brief history of the evolution of the UAE financial
market since the 1970s. Subsection 2.3.3 discusses the critical role of the ADX
and DFM from 2001- present. Subsection 2.3.4 illustrates the performance of
the Emirates Securities Market (ESM) in 2001-2015.
Section 2.4 explores the possible significant importance and interrelationship
between various economic indicators under the umbrella of the UAE national
economy and financial market.
Section 2.5 summarises the issues discussed in this chapter.
2.2 The UAE Economy- Characteristics
It is beyond dispute that the dynamic growth and maturity of the financial market in
any free economy is an interface of a healthy and stable economic system. However,
the establishment of a financial market within an emerging economy in developing
20
countries is an attempt to integrate a national economy and local business activities
with the global financial markets and world business stream (Al-Shayeb, 1999).
Therefore, those emerging financial markets had received intensive academic research
and investigations since the early 1990s, when the Berlin wall demolished to pave the
way for the cascading fever of open economic policies worldwide. Accordingly, many
economies were started restructuring their strategic plans and priorities.
The UAE established on 2 December 1971 as a federal state as a result of a union of
seven emirates previously known as the Trucial States. Since its establishment, the
UAE has modelled its national economy on a liberal economic system with a free tax
income and trade openness. The UAE national economy has long been depending on
the oil-based industries, services, and free-zone business (e.g., active export/import
activities). Such fast-growing foreign trade and financial transactions of the UAE with
the international industrial centres and financial markets has enabled the UAE to be a
key player in today’s business world.
Although it is a young emerging economy, the UAE has achieved an impressive
national economic growth and performance, along with proven records in furnishing
secure financial and investment opportunities, expansion of foreign trade, social
welfare, community safety, and recently invading tourism marketing and conference
events business. Such attractive business environment of the UAE is a result of the
political and economic stability, along with enforcement of laws to maintain such
stability and economic diversity, as well as introduced tourism as a new business genre
in the UAE national economy (Al-Shayeb & Hatemi-J, 2016).

21
The World Bank (WB) categorises the UAE among the countries that achieved a
significant highest income per capita to assume the 29th country of the WB ranking
(WB Indicators, 2016). Moreover, UAE well-protects the various economic activities
(business, financial, investment, trading, industries, and the like) with legislation and
laws that aimed at enhancing the business and investment environment for providing
opportunities to the UAE financial markets to play a strategic role in maintaining the
sustainability of the national economy.
The UAE economy has enjoyed relatively large surpluses on current accounts and
foreign trade over ten years from 2005 to 2014 despite adverse consequences of the
2008 global financial crisis. Such surpluses were maintained by intensive earnings of
re-export and high oil prices, along with non-oil exports. However, the current regional
tensions had caused a drastic decline in oil prices and cautiousness of the traders to
invest in widening their business. Al-Adwani (2016) indicated that such unfavourable
economic conditions had affected the current account that decreased from US$322
billion in 2013 to US$266 billion in 2014 (i.e., -17.40%). The broad connectivity of
the national economy with the global one through rapid expansion of import/export
business has sparked a deep interest in the financial communities to establish a
securities market for sustaining the momentum of the national economy grows.
Euler Hermes (2015), a financial consultant company, released a report detailed the
findings of a SWOT analysis of the status quo of the UAE economic conditions over
seven years later the 2008 global financial crisis; the analysis revealed that:
The UAE national economy enjoys the following strengths:
Socioeconomic and political stability with an established pattern of power
succession.

22
The abundance of hydrocarbon and mineral resources.
Diversification in the national economy and income.
Relatively liberal business and trading environment.
Large asset holdings and investments held overseas.
Fiscal and current accounts sound, despite some short-term effects of current
low oil prices.
Reclassified to emerging market status within the Morgan Stanley Capital
International (MSCI) Index.
Intensive regional economic co-operation through the GCC.
Its Credit Rating is BB1 classified by Standard and Poor’s (S&P) as a country
with low investment risk.
The UAE national economy suffers from some weakness, such as:
Speculative flows (stock market, real estate, etc.) provides some concern of
asset bubbles.
Data provided is sparse for a high-income economy.
There are reliable factors to sustain the economic opportunities, such as:
Sound foreign bilateral relations and cooperation with international agencies.
Furnished secured business environment to attract foreign investors.
Well-established infrastructure that favourable to overseas organisations.
Its multi-ethnic society is providing a sense of security to live and work.
Increasing the foreign investments of the UAE in advanced technology.
In contrast, the UAE economy might face some threats, such as:
The surrounding region is facing severe socio-political tensions and civil wars,
which impact directly on the stability of the national economy.
Unpredictable fluctuations in the energy market and raw material prices.
23
High dependence on expatriates increased unemployment among the nationals.
The high sensitivity of the UAE national economy towards global/regional
financial crises.
2.3 The UAE Economic Conditions in the New Millennium
The UAE economic environments have attracted scholarly investigations on the
various aspects and factors that might play crucial roles in enhacing the sustainability
of the national economy; prticularly, the trend towards business heterogenicity and
diversification (Jensen, 2018). Moreover, the small and medium enterprises and family
business have become the driving force establishing an attractive business hub in the
Arab Peninsula (Bodolica, Spraggon, & Zaidi, 2015).
Since its establishment, the UAE was a liberal economic country tried to get the most
benefits from the economic experiences generated by the advanced developed in the
Western and Asian countries. The UAE inclined to the adoption of the liberal economy
as a suitable economic paradigm to engine its growth in association with similar
advanced and emerging economies, at the same time, providing sufficient social
security and welfare to its citizens (i.e., a mixture of liberalism and socialism).
However, the UAE has been receiving many merit recognition from international
agencies and organisations for its attractive business environment, economic
performance, and citizen-focused government services.
The financial sector is considered the driving force of sustainable economic growth
and development of the global and local business conditions. The financial market had
been developed from the womb of the liberal economic system to play vital roles in
flourishing the macroeconomic growth and business promotion. The stock markets are
24
regarded as inessential entities for the economic growth since no corporate investment
funded through the issuance of equity existed (Mayer, 1998). However, the founding
of a financial market has a substantial impact on economic growth of a country, which
is still a controversial issue (Demirguc-Kunt & Levine, 1996b; Banerjee & Majumdar,
2018)
Many financial analysts weighed the pros versus the cons of the stock markets,
particularly in the developing countries, where these markets have not been regarded
as a marker of the economic development (Al-Shayeb, 1999). However, the realisation
of the potential importance of a securities market to emerging economy has prompted
elements of concern of the UAE leaders to take on serious efforts to establish their
financial markets (Al-Mohana, 2016). The UAE financial enterprises sector is often
able to absorb the consequences of a broad spectrum of financial crises because the
Federal Government is superintending the imposed financial policies and regulations
through its monetary authorities, such as the Central Bank and the like. With these
imposed policies, the financial sector is capable of providing the financial
requirements of the other business domains (Otman, 2014).
The impact the consequences of the 2008 global financial crisis on the UAE financial
market and related sectors had promoted the element of intensive research interests.
For instance, focusing on assessing the global financial crisis its consequences on the
Dubai Financial Market performance (Al-Jarouf, Al Mansoori, Nooraddin, and
Elshareif, 2017), Dubai stock market volatility (Salameh & Alzubi, 2018), and the real
estate and construction sector (Renaud, 2012; Al-Malkawi & Pillai, 2013).
25
In the years 2014-2015, many international economic organisations reported on the
economic performance of the UAE, which has been ranked as the follows:
The World Economic Forum (WEF) ranked the UAE in the Global
Competitiveness Index (2015/2016) as the 17th attributed to its foremost
position as the first country in inflation annual % change; the first in effect of
taxation on incentives to work; the second in effect of taxation on incentives to
invest. The 16th in WEF Enabling Trade Index as it is the first in ease of hiring
foreign labour; the third in ease of access to loans.
The WB ranked the UAE as the 31st country in doing business in 2015.
The World Trade Organization (WTO) ranked the UAE in World Trade Report
2015 as the 16th country in commodity exports and the 19th in imports.
2.3.1 The Gross Domestic Product (GDP)
The UAE is currently among the first ten oil-producing countries; therefore, the prices
of the oil and gas in the international energy markets influence the national income
directly and, in turn, on the GDP. On the other hand, the UAE proposed a long-term
economic plan, namely UAE 2030. The core strategic objective is to diversify the
economic activities, instead of dependent upon hydrocarbon resources merely, which
are assumed as non-renewable natural resources.
It is worth to illustrate a comparison of GDP (in current US$) among the
developing countries in MENA region, Europe and Central Asia based on the data
released by World Bank. However, Over the examined period (2001-2014), the
average of the UAE’s GDP worth more than 21% over other developing countries in
Europe and Central Asia, and 24% over the developing countries in the MENA region,
despite that we compare a single country to the entire region. Figure 2 shows how the

26
UAE national economy (GDP in current US$ as a proxy) has achieved remarkable
value compared to the MENA regional scale.
Figure 2: The UAE national economy (GDP) in current US$ (Source: Word bank country report, 2016)
In term of GDP growth rate, the UAE economy performs well compared to the regional
scale. However, over the examined period (2001-2014), the average of the UAE’s
GDP Growth rate was 4.33%, almost similar to both Arab World and developing
countries in Europe and Central Asia, which were 4.66% and 4.48%, respectively.
Moreover, the average GDP Growth rate of the UAE was higher than the MENA and
other developing countries, which were 3.6% and 2.56%, respectively. Figure 3
presents the UAE’s GDP Growth rate (annual %) for the period (2001-2014), whereas
Figure 4 presents a comparison of the UAE’s GDP Growth rate (annual %) to other
regions, for the same period.
-
200,000,000,000
400,000,000,000
600,000,000,000
800,000,000,000
1,000,000,000,000
1,200,000,000,000
1,400,000,000,000
1,600,000,000,000
1,800,000,000,000
2,000,000,000,000
20
01
20
02
20
03
20
04
20
05
20
06
20
07
20
08
20
09
20
10
20
11
20
12
20
13
20
14
in U
S$
Year
GDP (current US$) Comparison
UAE Europe & Central Asia (Developing only) Middle East & North Africa (Developing only)
27
Figure 3: Annual GDP growth rate of the UAE (Source: Word bank country report, 2016)
Figure 4: Comparison of the UAE’s GDP growth rate to other regions (Source: Word bank country report, 2016)
1.40%
2.43%
8.80%
9.5…
4.86%
9.84%
3.18%3.19%
-5.24%
1.64%
5.21%
6.89%
4.32%
4.57%
-6.0000%
-4.0000%
-2.0000%
0.0000%
2.0000%
4.0000%
6.0000%
8.0000%
10.0000%
12.0000%
UAE GDP growth (annual %)
1.40 2.43
8.80 9.57
4.86
9.84
3.18
3.19
(5.24)
1.64
5.21
6.89
4.32 4.57
-6
-4
-2
0
2
4
6
8
10
12
Gro
wth
Rat
e (%
)
Year
GDP growth (annual %) Comparison
Arab World
UAE
Europe & Central Asia(Developing only)
Middle East & NorthAfrica (Developingonly)

28
2.3.2 The UAE Financial Markets: A Brief History
The financial markets in emerging economies constitute an essential part of
their development. They allow a means of diversification for the investor asset classes
and redistribution of the risks associated. If the companies in a country are
seeking investments from the public, this indicates that they plan to grow bigger and
thereby contribute more towards the growth of the national income (Suetin, 2011).
The UAE stock market is relatively young and growth-oriented containing
both official and unofficial markets. On 29 January 2000, the late President of the
UAE, HH Sheikh Zayed bin Sultan Al Nahyan, has issued a Federal Decree under
the Federal Law No. (4/2000) to establish the Emirates Securities and
Commodities Authority (ES&CA), which overseen by Ministry of Economy. The
Federal Law determines the administration system of the Authority of Securities
and Commodities, as well as describes its goals, power, authorities and structure of
the board of directors.
The ES&CA represents and supervises the two government-owned stock
markets, namely Abu Dhabi Securities Exchange (ADX) founded in November 2000,
and Dubai Financial Market (DFM) founded in March 2000. The ADX is authorized
by the local law number 3/2000 to establish branches and centres within the Abu
Dhabi emirate territory, whereas DFM was changed to a corporate (i.e.,
corporatization) on December 2005, then it had been gone public partially through an
Initial Public Offering (IPO) of 20% of its value in November 2006. Finally, its stocks
listed on DFM on March 2007 (Moustafa, 2013).
29
The primary task of ES&CA is ensuring an adequate regulatory and monitoring
the UAE securities market in order to protect investors’ interests from volatility and
the handling of their stocks, at the same time, to prevent a struggle of interests
by breaking up the responsibilities related to oversight, and by organizing trading in
the markets for goods and securities, based on equal policies and a regulatory
structure (Al-Shayeb and Hatemi-J, 2013). These regulations had forced out the long-
time of unregulated stock market operations. However, a parallel unofficial financial
market, or OTC, works through several brokerage firms, which most of them affiliated
with the commercial banks (Moustafa, 2013).
The current UAE financial market had initially produced from the brokerage
business of private market, which emerged in the late 1970s. The financial market
has witnessed and experienced many volatile periods regarding share trading
activities and fluctuation of price levels, as described by Bin-Sabit (as cited in
Moustafa, 2013):
1975-1982: The UAE had witnessed the establishment of many companies and
business organisation in both private and public sectors due to rising oil prices.
Moreover, the increasing income and reserve from the petrodollars sparked a
deep interest in the Federal Government to build a strong economy.
1983-1986: The drastic collapse of the Kuwaiti stock market, which known
as the 1983 crisis of Al-Manakh market, which later compounded with
the falling of oil prices in 1986 with a continuation of Iraq-Iran military
conflicts. Such conditions had exerted a negative impact on the UAE capital
market.

30
1993-1998: The UAE capital market rose again due to the establishment
of many new companies and free-zones (e.g., Jebel Ali, and the like) to attract
many international companies to run their commercial and business operations
near rich oil-producing countries in the Middle East.
1998-1999: Once again, the UAE capital market experienced a broad decline in
the mid-1998; that might be attributed to; for instance, lack of
regularity, manipulation of the market by block traders and professional
investors, negative speculative trading by all the participants, lack of
financial disclosure, and the drop-in oil prices. Since the summer of 1998, the
market has suffered sharp declines in both trading volume and trading value to
such an extent that the market prices of most-traded stocks have decreased
under their par values.
Since their official inception in 2000, both the primary UAE stock markets have
been experiencing snacks fluctuations and recoverable financial situations until
the unpredictable global financial crisis in 2008. However, both financial markets
have severely suffered from the 2008 global financial crisis regarding the drastic
reversal of asset prices, and long-term financial consequences of post-crisis.
Nevertheless, the capital markets are agreeing to be stable and secure sources of funds
for various economic activities to make them more resilient to any shocks or
limitations within their listed companies to such as those who have contented
themselves with minority shares due to lack of capital (AICPA, 1991).
It is worth to explain further the behaviour of the UAE financial markets through
the professional lens. For this purpose, the author of this study has approached the
UAE Securities and Commodities Authority (ES&CA) to discuss with its CEO Obaid

31
Al-Zaabi the possible mutual effects between the financial markets and the
national economy in the context of the ES&CA involvements. In this personal
communication (25 Aug. 2016), Al-Zaabi shed light on various aspects concerned the
ES&CA roles.
On the impacts of speculative flows, Al-Zaabi appreciated the significant role of
the speculative flows (stock market, real estate, and the like) as the spirit of the
financial market behaviour, but to be under control of the ES&CA through imposing
daily supervision and accountability. Also, the ES&CA has proposed a practical
prescription to include essentially enforced regulations and disclosure policy.
This prescription could avert the adverse consequences of financial crises (e.g., assets
bubbles).
To minimise the impact of such speculation, the ES&CA introduced two
main approaches: i) surveillance and monitor the limit up/down of every security or
each listed company, and ii) recruitment of professional investigators having a broad
authority to carry out the necessary action plans and parameters for monitoring
the transactions and the securities trading of the all involved stakeholders. Al-
Zaabi added, in an advanced step towards increasing the efficiency of market
functions, the ES&CA has introduced in 2015 some liquidity enhancement products
and techniques, which are available to different types of traders
(individuals, governments, institutions, and the like). The liquidity strategy would be
encouraging many investors and traders to maximise their business activities, as well
as reducing the negative impacts of the speculation that the market possibly to face.

32
2.3.3 Core Roles of the Financial Markets (2001- Present)
The UAE monetary system is based on the Federal Law of 1980 to be independent of
any intervention of the federal government in running its organisation and profitability.
In 2015, the IMF reported that the UAE possesses a robust financial position despite
the surrounding regional tensions. However, the strength of the UAE economy comes
from strong fundamentals in prudent financial policies and development strategies,
which incorporate the opportunities in the global financial markets (Al-Zarouni, 2008).
In 2004, the ES&CA adopted new laws to ensure that every shareholding company in
UAE listed its shares either in ADX or DFM, and ensure compliance with the
internationally accepted standards related to the professional securities markets. Since
2004, there has been significant development of the securities market, and the volume
of capital and listing has increased considerably. The number of public shareholdings
companies had steadily grown from 27 in 2000 to 128 in 2015. Rao (2008) highlighted
that the genuine intention behind establishing both ADX and DFM was furnishing a
sound guarantee to the foreign investors find a suitable platform where they could
invest and receive a return based on the financial performance of the local companies.
The Rao argued both DFM and ADX serving these needs successfully and efficiently.
Securities of the listed companies are traded only in those markets, which are licensed
by the ES&CA under strict rules and regulations. However, the terms and conditions
of the stock market allow any listed firm to change ownership for facilitating its
business development. Therefore, the listed companies do not have to rely on
financial intermediaries to raise the funding needed for their new ventures; thus, they
are able to sell shares directly to the public when they feel the need to raise capital.
33
This flexibility in the stock market ensures that the required funds are available to
the public upon their need (Ben-Naceur, Ghazouani, & Omran, 2007).
Both ADX and DFM have taken on the initiative to get more companies to be
listed with them and to diversify the financial instruments they are offering to the
public. This initiative can increase the public interest in the stock exchanges activities.
There are 60 companies listed with DFM, whereas ADX lists a separate set of
68 companies, and this is currently the largest of the financial markets in the UAE
regarding market capitalisation and traded value. The main advantage of having
two stock exchanges is that companies can choose where they are listed (Al-Mohana,
2016). The records indicate that the DFM has higher trading volumes than the ADX
(SCA, 2014).
2.3.4 Performance of the Emirates Securities Market (2001-2015)
The Emirates Securities Market (ESM) witnessed several genuine improvements,
along with its leading indicators since its launch in 2001. The ESM currently serves as
a typical case of the newly emerging stock market with notable growth potential
(Marashdeh & Shrestha, 2008). The historical performance of the ESM has passed
over fifteen years through three distinctive periods and fixed 2008 (global financial
crisis) as a significant year:
Pre-crisis (2001 to 2007) within which the markets showing an apparent
dynamic growth (Uprising period)
During the crisis (Q3-2008 to Q4-2012) when the markets witnessed severe
collapse in the market value of many listed companies (Declining period)
Post-crisis (Q1-2013 to the present) in which, the markets almost recovered
from the 2008 crisis consequences (Recovery period).
The financial performance of the ESM (2001-2015) by highlighting the records of
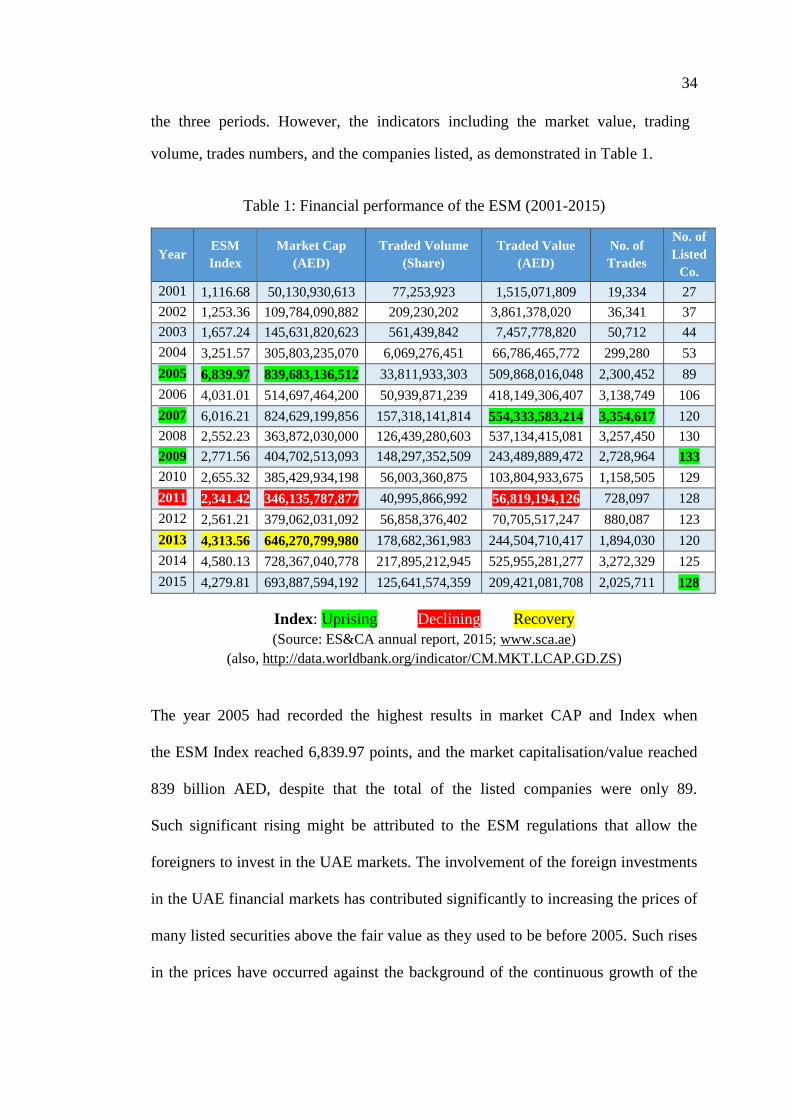
34
the three periods. However, the indicators including the market value, trading
volume, trades numbers, and the companies listed, as demonstrated in Table 1.
Table 1: Financial performance of the ESM (2001-2015)
Year ESM
Index
Market Cap
(AED)
Traded Volume
(Share)
Traded Value
(AED)
No. of
Trades
No. of
Listed
Co.
2001 1,116.68 50,130,930,613 77,253,923 1,515,071,809 19,334 27
2002 1,253.36 109,784,090,882 209,230,202 3,861,378,020 36,341 37
2003 1,657.24 145,631,820,623 561,439,842 7,457,778,820 50,712 44
2004 3,251.57 305,803,235,070 6,069,276,451 66,786,465,772 299,280 53
2005 6,839.97 839,683,136,512 33,811,933,303 509,868,016,048 2,300,452 89
2006 4,031.01 514,697,464,200 50,939,871,239 418,149,306,407 3,138,749 106
2007 6,016.21 824,629,199,856 157,318,141,814 554,333,583,214 3,354,617 120
2008 2,552.23 363,872,030,000 126,439,280,603 537,134,415,081 3,257,450 130
2009 2,771.56 404,702,513,093 148,297,352,509 243,489,889,472 2,728,964 133
2010 2,655.32 385,429,934,198 56,003,360,875 103,804,933,675 1,158,505 129
2011 2,341.42 346,135,787,877 40,995,866,992 56,819,194,126 728,097 128
2012 2,561.21 379,062,031,092 56,858,376,402 70,705,517,247 880,087 123
2013 4,313.56 646,270,799,980 178,682,361,983 244,504,710,417 1,894,030 120
2014 4,580.13 728,367,040,778 217,895,212,945 525,955,281,277 3,272,329 125
2015 4,279.81 693,887,594,192 125,641,574,359 209,421,081,708 2,025,711 128
Index: Uprising Declining Recovery
(Source: ES&CA annual report, 2015; www.sca.ae)
(also, http://data.worldbank.org/indicator/CM.MKT.LCAP.GD.ZS)
The year 2005 had recorded the highest results in market CAP and Index when
the ESM Index reached 6,839.97 points, and the market capitalisation/value reached
839 billion AED, despite that the total of the listed companies were only 89.
Such significant rising might be attributed to the ESM regulations that allow the
foreigners to invest in the UAE markets. The involvement of the foreign investments
in the UAE financial markets has contributed significantly to increasing the prices of
many listed securities above the fair value as they used to be before 2005. Such rises
in the prices have occurred against the background of the continuous growth of the
35
GDP, along with the remarkable sustainable economic performance of the UAE, which
led to improvements in corporate distribution and annual profitability.
The year 2007 was the highest in traded shares (value and number of trades) coincident
with the sharp rising of the oil prices worldwide, booming in the real estate and
infrastructure development sectors (Al-Mohana, 2016). In 2007, about 157
billion shares were traded to value about 554 billion AED where more
than 3,354,000 trading transactions have been performed. These market conditions
have encouraged more companies to become PJSC, which increased from 120 in 2007
to 130 in 2008 and to be highest in 2009 as listed 133 companies despite the
continuation of the crisis’s consequences. Such unexpected increase might be
attributed to lack of fund because of the 2008 financial crisis. That funding situation
triggered off a keen interest in the companies to get fund by going to be PJSC issuing
an initial public offer (IPO).
The year 2011 was the lowest in ESM Index to record 2,341.42 points,
Market Capitalization was 346 billion AED, and Traded Value was 56 Billion AED.
This can be seen as the most substantial impact of the global financial crisis
consequences on the UAE economic activities and financial market situation. In 2013,
both ADX and DFM experienced gradual recovery from the consequences of the post-
2008 crisis, which illustrated in return to be higher than the level of 2008 regarding
ESM Index and Market Capitalization but did not reach the levels that performed in
2005-2007, hitherto.
On this issue, Al-Zaabi further explained the reasons behind this market behaviour. He
indicated that during 2005-2007, the UAE financial markets were immature regarding
36
inflation, shortage ineffective rules and regulations, and a gap in balancing mechanism.
Therefore, the speculation was highly unrealistic, which later resulted in a dramatic
drop in the market higher than the world average (60-70% decline in the market cap
and Index). However, ES&CA has not considered the financial performance of the
markets in the 2005-2007 as a benchmark, while the 2008 global financial crisis has
dramatically helped in initiating a severe correction to the global financial markets;
particularly in the UAE growing markets.
Regarding ESM Index, it increased almost by 68%; from 2,561 points by the end
of 2012 to 4,313 points by the end of 2013. At the same time, the Market CAP
has jumped by 70%; from 379 billion AED by the end of 2012 to 646 billion AED by
the end of 2013 to represent the highest market value gained by the UAE listed
companies on the market since 2008, i.e., post the crisis year. This amount exhibits
that the worth of these companies had increased by 70.45% above the value of the
same companies at the end of 2012, one year before. The ESM however, has seen
total trading of 178.68 billion shares performed throughout 2013 to value about
244.50 billion AED, whereas the shares traded during 2012 were 56.85 million valued
70.70 billion AED.
Most of the business sectors were striking an overall improvement in their performance
during 2013. Al-Zaabi illustrated the current experience of the UAE markets, where
the growth (Index and Market Cap) in the financial markets depends on new Initial
Public Offers (IPOs), volume and value of trading, numbers of the transaction,
investors motivation and preference, and Institutions’ entry and trading, where the ROI
could be better than alternative investments. In this case, the institutions should play
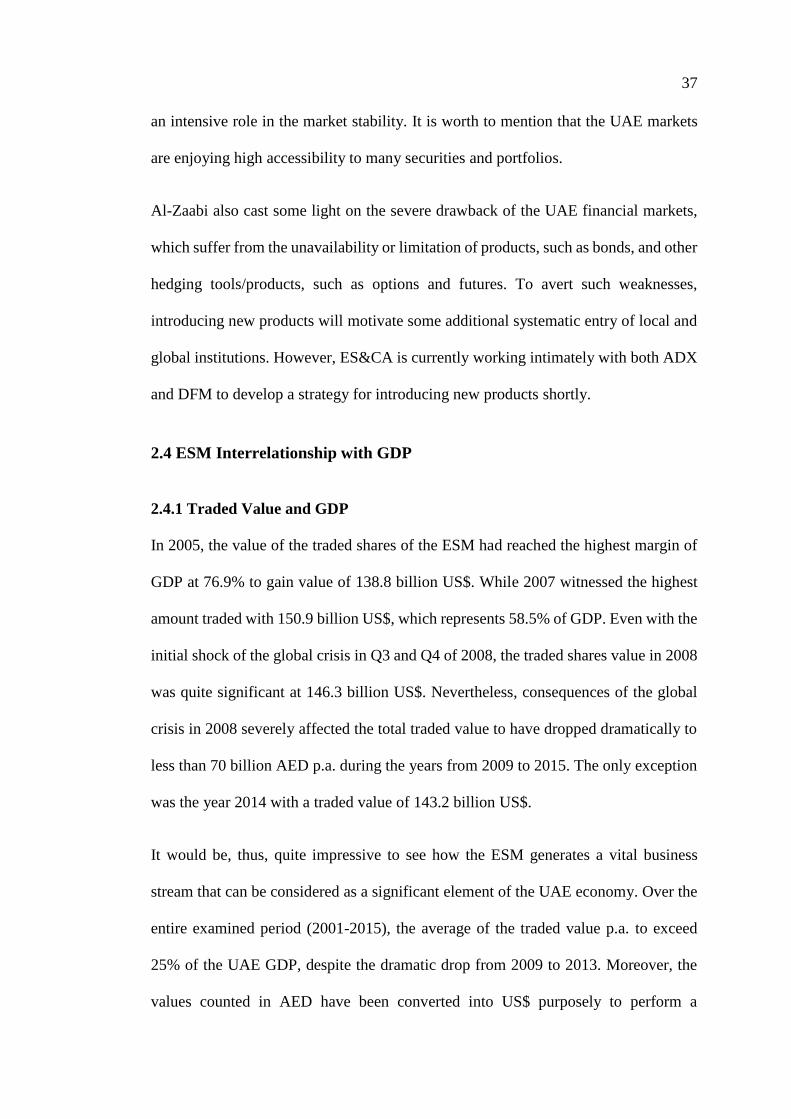
37
an intensive role in the market stability. It is worth to mention that the UAE markets
are enjoying high accessibility to many securities and portfolios.
Al-Zaabi also cast some light on the severe drawback of the UAE financial markets,
which suffer from the unavailability or limitation of products, such as bonds, and other
hedging tools/products, such as options and futures. To avert such weaknesses,
introducing new products will motivate some additional systematic entry of local and
global institutions. However, ES&CA is currently working intimately with both ADX
and DFM to develop a strategy for introducing new products shortly.
2.4 ESM Interrelationship with GDP
2.4.1 Traded Value and GDP
In 2005, the value of the traded shares of the ESM had reached the highest margin of
GDP at 76.9% to gain value of 138.8 billion US$. While 2007 witnessed the highest
amount traded with 150.9 billion US$, which represents 58.5% of GDP. Even with the
initial shock of the global crisis in Q3 and Q4 of 2008, the traded shares value in 2008
was quite significant at 146.3 billion US$. Nevertheless, consequences of the global
crisis in 2008 severely affected the total traded value to have dropped dramatically to
less than 70 billion AED p.a. during the years from 2009 to 2015. The only exception
was the year 2014 with a traded value of 143.2 billion US$.
It would be, thus, quite impressive to see how the ESM generates a vital business
stream that can be considered as a significant element of the UAE economy. Over the
entire examined period (2001-2015), the average of the traded value p.a. to exceed
25% of the UAE GDP, despite the dramatic drop from 2009 to 2013. Moreover, the
values counted in AED have been converted into US$ purposely to perform a
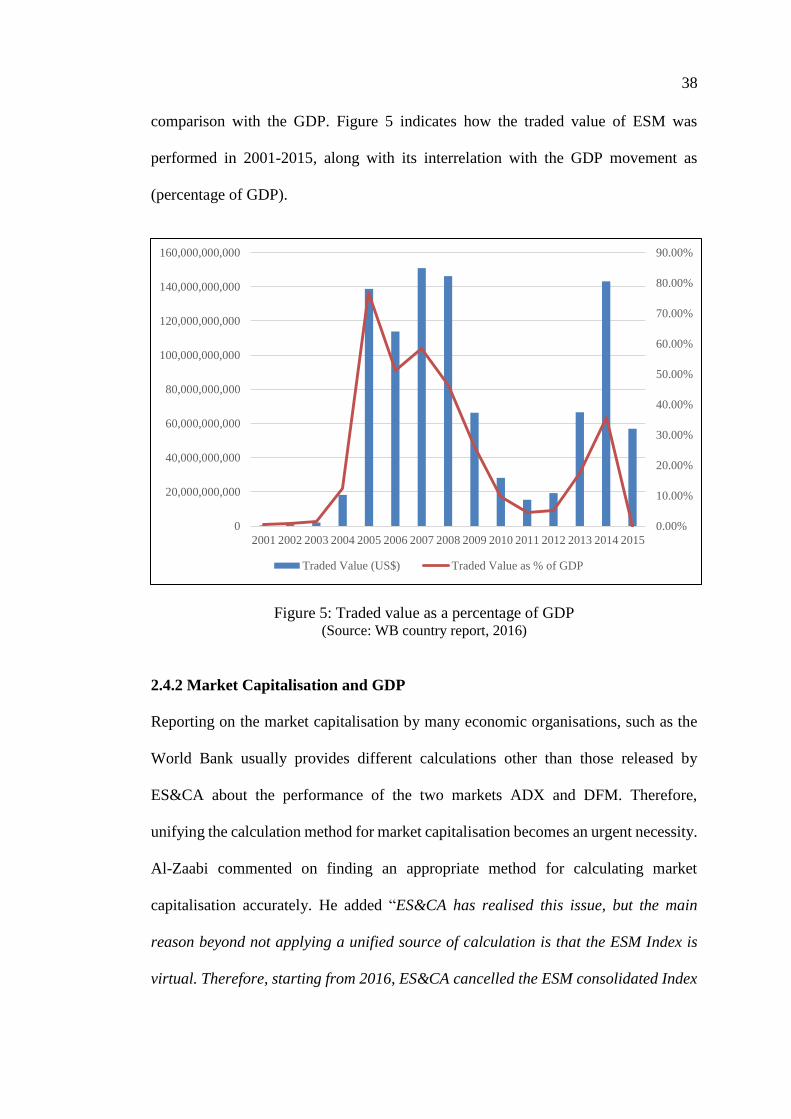
38
comparison with the GDP. Figure 5 indicates how the traded value of ESM was
performed in 2001-2015, along with its interrelation with the GDP movement as
(percentage of GDP).
Figure 5: Traded value as a percentage of GDP (Source: WB country report, 2016)
2.4.2 Market Capitalisation and GDP
Reporting on the market capitalisation by many economic organisations, such as the
World Bank usually provides different calculations other than those released by
ES&CA about the performance of the two markets ADX and DFM. Therefore,
unifying the calculation method for market capitalisation becomes an urgent necessity.
Al-Zaabi commented on finding an appropriate method for calculating market
capitalisation accurately. He added “ES&CA has realised this issue, but the main
reason beyond not applying a unified source of calculation is that the ESM Index is
virtual. Therefore, starting from 2016, ES&CA cancelled the ESM consolidated Index
0.00%
10.00%
20.00%
30.00%
40.00%
50.00%
60.00%
70.00%
80.00%
90.00%
0
20,000,000,000
40,000,000,000
60,000,000,000
80,000,000,000
100,000,000,000
120,000,000,000
140,000,000,000
160,000,000,000
2001 2002 2003 2004 2005 2006 2007 2008 2009 2010 2011 2012 2013 2014 2015
Traded Value (US$) Traded Value as % of GDP
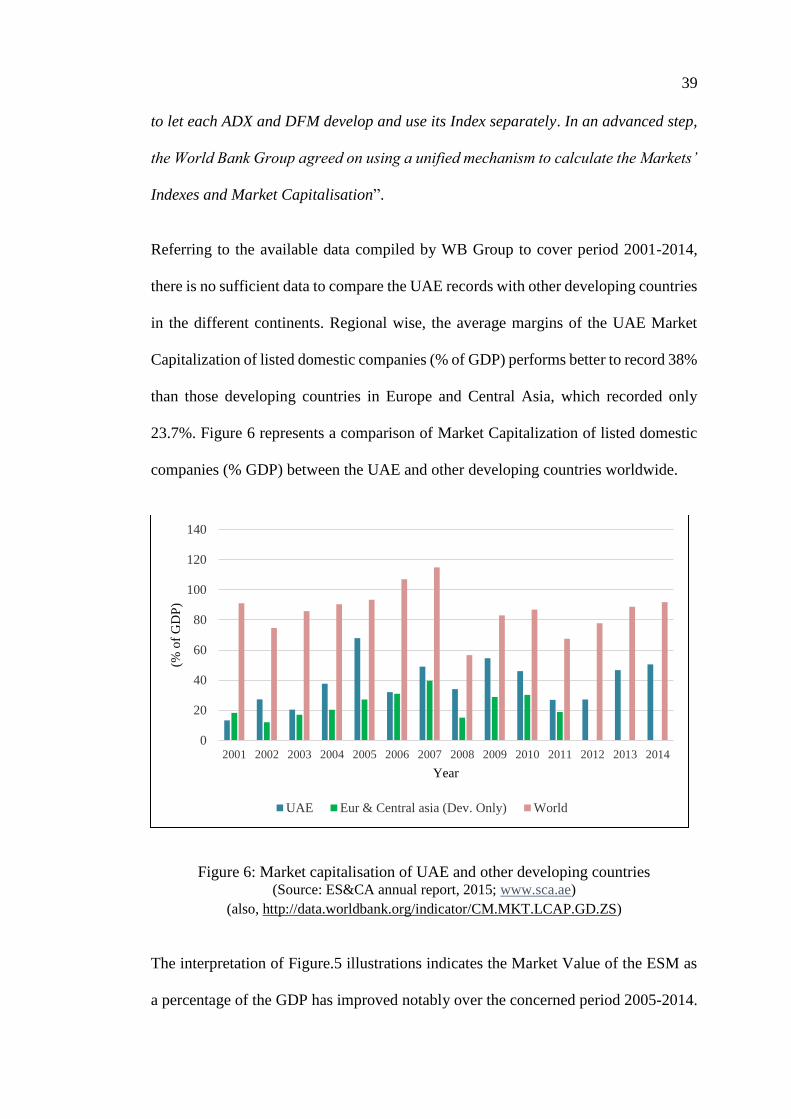
39
to let each ADX and DFM develop and use its Index separately. In an advanced step,
the World Bank Group agreed on using a unified mechanism to calculate the Markets’
Indexes and Market Capitalisation”.
Referring to the available data compiled by WB Group to cover period 2001-2014,
there is no sufficient data to compare the UAE records with other developing countries
in the different continents. Regional wise, the average margins of the UAE Market
Capitalization of listed domestic companies (% of GDP) performs better to record 38%
than those developing countries in Europe and Central Asia, which recorded only
23.7%. Figure 6 represents a comparison of Market Capitalization of listed domestic
companies (% GDP) between the UAE and other developing countries worldwide.
Figure 6: Market capitalisation of UAE and other developing countries (Source: ES&CA annual report, 2015; www.sca.ae)
(also, http://data.worldbank.org/indicator/CM.MKT.LCAP.GD.ZS)
The interpretation of Figure.5 illustrations indicates the Market Value of the ESM as
a percentage of the GDP has improved notably over the concerned period 2005-2014.
0
20
40
60
80
100
120
140
2001 2002 2003 2004 2005 2006 2007 2008 2009 2010 2011 2012 2013 2014
(% o
f G
DP
)
Year
UAE Eur & Central asia (Dev. Only) World
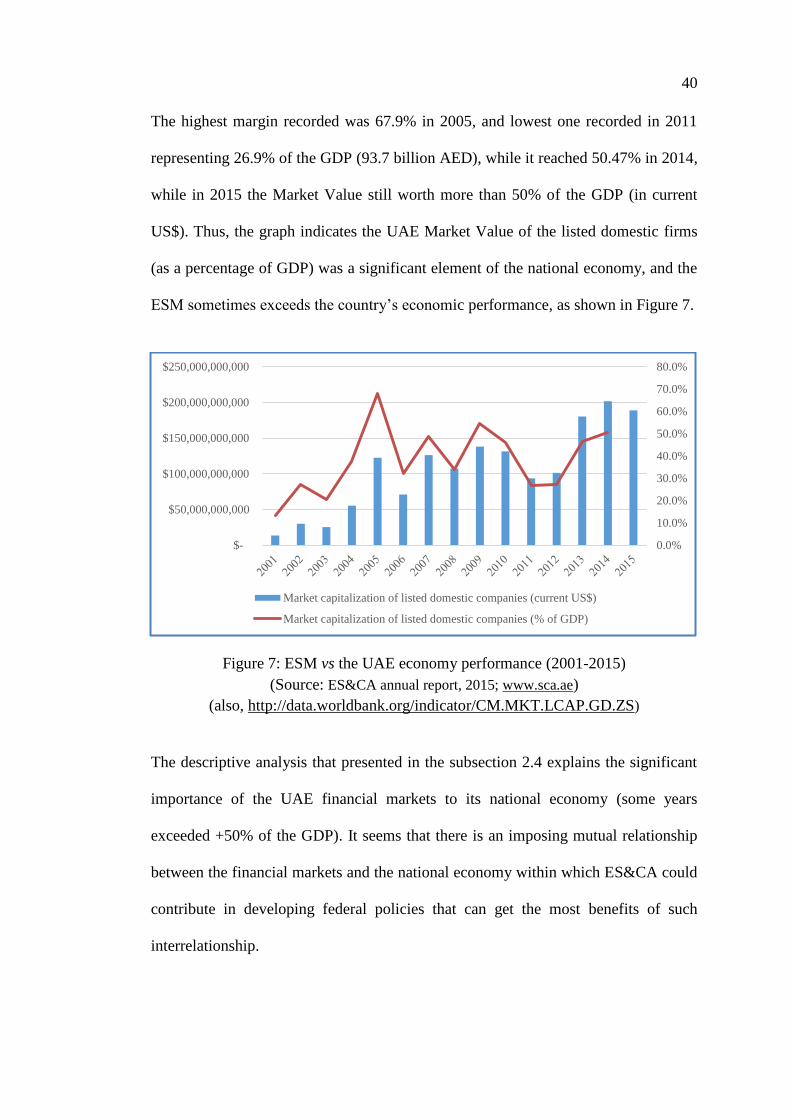
40
The highest margin recorded was 67.9% in 2005, and lowest one recorded in 2011
representing 26.9% of the GDP (93.7 billion AED), while it reached 50.47% in 2014,
while in 2015 the Market Value still worth more than 50% of the GDP (in current
US$). Thus, the graph indicates the UAE Market Value of the listed domestic firms
(as a percentage of GDP) was a significant element of the national economy, and the
ESM sometimes exceeds the country’s economic performance, as shown in Figure 7.
Figure 7: ESM vs the UAE economy performance (2001-2015)
(Source: ES&CA annual report, 2015; www.sca.ae)
(also, http://data.worldbank.org/indicator/CM.MKT.LCAP.GD.ZS)
The descriptive analysis that presented in the subsection 2.4 explains the significant
importance of the UAE financial markets to its national economy (some years
exceeded +50% of the GDP). It seems that there is an imposing mutual relationship
between the financial markets and the national economy within which ES&CA could
contribute in developing federal policies that can get the most benefits of such
interrelationship.
0.0%
10.0%
20.0%
30.0%
40.0%
50.0%
60.0%
70.0%
80.0%
$-
$50,000,000,000
$100,000,000,000
$150,000,000,000
$200,000,000,000
$250,000,000,000
Market capitalization of listed domestic companies (current US$)
Market capitalization of listed domestic companies (% of GDP)

41
Al-Zaabi added the ES&CA strategic plan (2014-2016) focuses on some dimensions
to make the financial markets more attractive to encourage more corporates and
individuals to increase their investments in the financial markets through:
Introducing added-value services for variant customers include tools and new
investment products to support the stability and attractiveness of financial
markets. Developing focused studies and researchers to support the strategic
directions for the development of the market.
Applying efficient corporate governance systems that lead to adequate
resources and expenditures.
Providing updated, sufficient, adequate and reliable information support the
investors in making the right decision.
Enhancing ES&CA's identity and roles in developing the UAE financial
markets sector.
Raising the efficiency and effectiveness of control, licensing, implementation,
and follow-up procedures.
Developing effective coordination with all stakeholders in the financial
markets and the commodities sector.
Coordinating with partners to pass laws affecting the financial markets sector.
Thus, the possible mutual impact of the financial markets and the national economic
performance in the UAE is the research topic of this study. Thence, the expected
findings would be a significant reference source for the researchers, scholars, and
policy-makers who are interested in the UAE economy and related financial issues.

42
2.4.3 ESM and Economic Growth
The relationship between economic growth and stock market performance is a
recurring question amongst economists and financial analyst alike. In fact, according
to the existing literature, some studies have established a positive correlation between
economic growth and stock market development. Bencivenga, Smith, and Starr
(1996), and Levine (1991) reported that stock market liquidity is crucial for economic
growth, while Greenwood and Jovanovic (1990), as well as King and Levine (1993),
showed that the stock markets provide timely and accurate information about the
economic activity. Moreover, North (1991) showed that the developing stock
exchange might lower the cost of transferring the ownership, which gains the
investor’s attention to investing in equity markets and, therefore, can increase the
economic growth.
According to Sigel (2002) and Ritter (2012), there has been a negative correlation in
the long run between economic growth and stock market return in both developed
markets and emerging markets. This is also consistent with the work of Demirguc-
Kunt (1994), which indicate that the ease with which shares can be sold on the stock
market weakens corporate governance and it may decelerate economic growth.
Another group of views believe that there is no correlation at all, given that the
financial market is mainly affected by the speculation and reactions of the investors
towards the results published by listed companies.
Estrada (2012) found no significant relationship between economic growth and stock
returns and also the lack of correlation between the fundamental condition of a
company and rate of return on its stocks. In this subsection, we examine the link
between GDP growth and the ESM index development, under tight constraints of data

43
availability, to provide an adequate analysis of the relationship between the financial
market and the Real Sector in the UAE.
In fact, since the GDP of the UAE, the leading measure of the economic activity, is
available only on an annual basis with a considerable publication delay, there has been
little attention to this relationship. To this end, in the absence of a quarterly GDP, we
use in this dissertation the Economic Composite Indicator (ECI)1, constructed by the
Central Bank of the UAE, as a proxy for quarterly GDP growth. The ECI is constructed
by synthesising a large number of macroeconomic variables reflecting the economic
activity, using the Principal Component Analysis (PCA). These macroeconomic
variables are collected from different sources, to obtain a dataset that covers a wide
range of economic activity, such as global economy, sectoral activity, financial
markets and price trends.
This index has proven to be a useful tool for the policymakers since it tracks the
economic activity of the UAE closely on a quarterly basis and offers a timely clear
picture about the current economic situation, in the absence of official data for
quarterly GDP. Thus, the ECI has three significant advantages: first, it takes into
account all critical policy issues, both at the national and international levels.
Secondly, it captures economic fluctuations for the UAE at a relatively high frequency,
compared to the available information. Finally, it could be used to give an early
indication of turning points.
1 Central Bank of UAE, Constructing an Economic Composite Indicator for the UAE, June 2017
https://www.centralbank.ae/en/pdf/dataroom/WP19062017.pdf
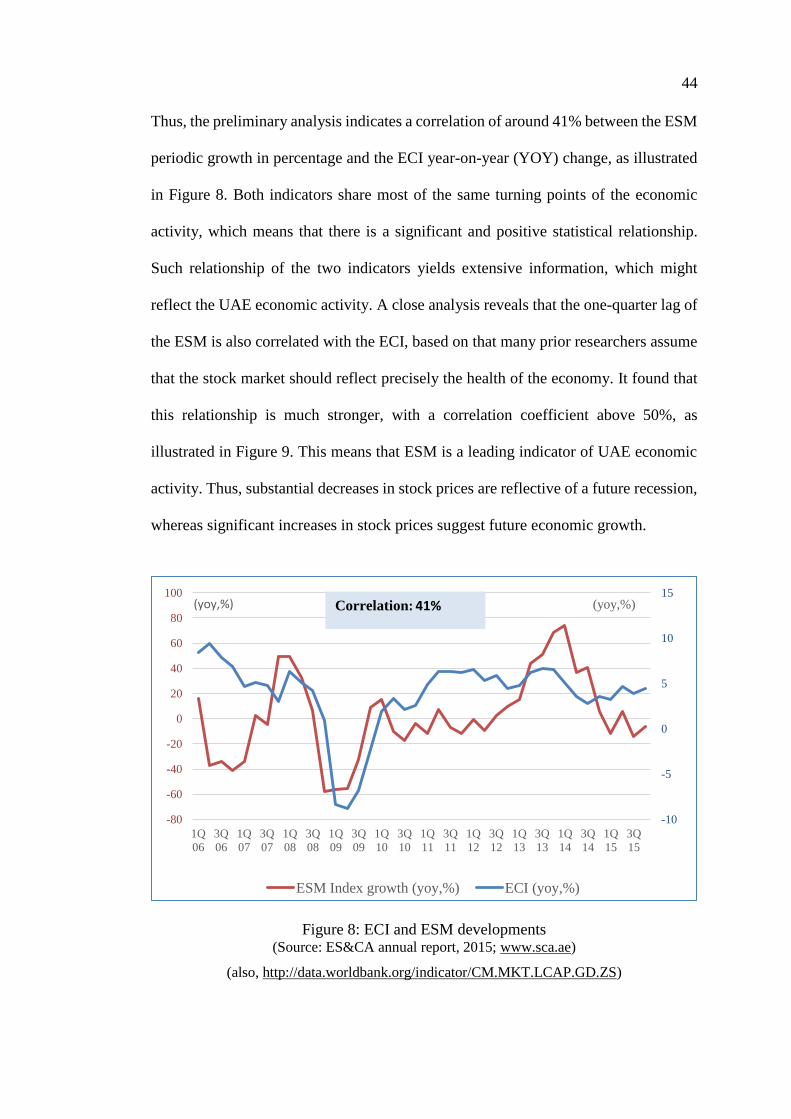
44
Thus, the preliminary analysis indicates a correlation of around 41% between the ESM
periodic growth in percentage and the ECI year-on-year (YOY) change, as illustrated
in Figure 8. Both indicators share most of the same turning points of the economic
activity, which means that there is a significant and positive statistical relationship.
Such relationship of the two indicators yields extensive information, which might
reflect the UAE economic activity. A close analysis reveals that the one-quarter lag of
the ESM is also correlated with the ECI, based on that many prior researchers assume
that the stock market should reflect precisely the health of the economy. It found that
this relationship is much stronger, with a correlation coefficient above 50%, as
illustrated in Figure 9. This means that ESM is a leading indicator of UAE economic
activity. Thus, substantial decreases in stock prices are reflective of a future recession,
whereas significant increases in stock prices suggest future economic growth.
Figure 8: ECI and ESM developments (Source: ES&CA annual report, 2015; www.sca.ae)
(also, http://data.worldbank.org/indicator/CM.MKT.LCAP.GD.ZS)
-10
-5
0
5
10
15
-80
-60
-40
-20
0
20
40
60
80
100
1Q
06
3Q
06
1Q
07
3Q
07
1Q
08
3Q
08
1Q
09
3Q
09
1Q
10
3Q
10
1Q
11
3Q
11
1Q
12
3Q
12
1Q
13
3Q
13
1Q
14
3Q
14
1Q
15
3Q
15
(yoy,%)(yoy,%)
ESM Index growth (yoy,%) ECI (yoy,%)
Correlation: 41%
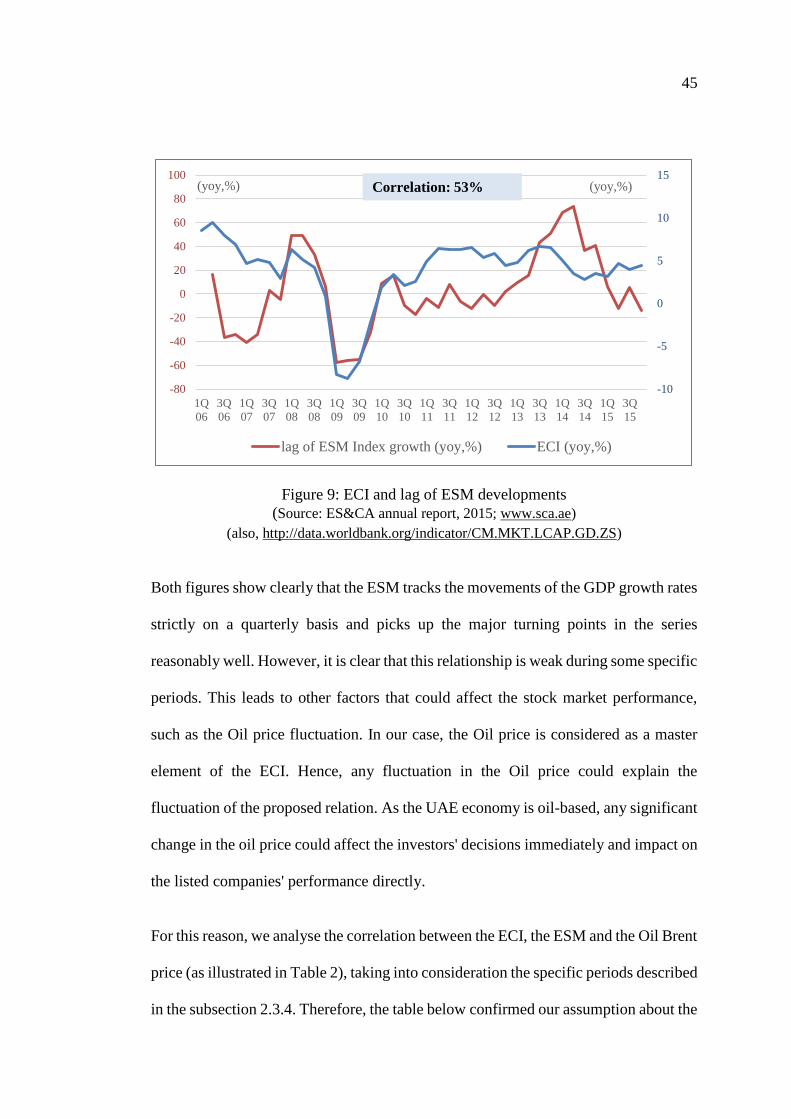
45
Figure 9: ECI and lag of ESM developments
(Source: ES&CA annual report, 2015; www.sca.ae)
(also, http://data.worldbank.org/indicator/CM.MKT.LCAP.GD.ZS)
Both figures show clearly that the ESM tracks the movements of the GDP growth rates
strictly on a quarterly basis and picks up the major turning points in the series
reasonably well. However, it is clear that this relationship is weak during some specific
periods. This leads to other factors that could affect the stock market performance,
such as the Oil price fluctuation. In our case, the Oil price is considered as a master
element of the ECI. Hence, any fluctuation in the Oil price could explain the
fluctuation of the proposed relation. As the UAE economy is oil-based, any significant
change in the oil price could affect the investors' decisions immediately and impact on
the listed companies' performance directly.
For this reason, we analyse the correlation between the ECI, the ESM and the Oil Brent
price (as illustrated in Table 2), taking into consideration the specific periods described
in the subsection 2.3.4. Therefore, the table below confirmed our assumption about the
-10
-5
0
5
10
15
-80
-60
-40
-20
0
20
40
60
80
100
1Q
06
3Q
06
1Q
07
3Q
07
1Q
08
3Q
08
1Q
09
3Q
09
1Q
10
3Q
10
1Q
11
3Q
11
1Q
12
3Q
12
1Q
13
3Q
13
1Q
14
3Q
14
1Q
15
3Q
15
(yoy,%)(yoy,%)
lag of ESM Index growth (yoy,%) ECI (yoy,%)
Correlation: 53%

46
between economic growth and stock market performance. In fact, the correlation
between the lag of the ESM and the ECI is stable during the crisis and weak otherwise.
Meanwhile, the oil Brent price is highly correlated with the ESM, especially during
pre-crisis and the post-crisis periods.
Table 2: Correlation between ESM, ECI & Brent price growth in 3 periods (%)
ECI &
ESM ECI & ESM (-1)
ESM & Brent
price growth
ESM (-1) &
Brent price
growth
Pre-crisis: Q1 06 - Q2 08 -46.8 3.4 73.6 89.9
During crisis: Q3 08 - Q4 12 68.9 80 83.6 68.6
Post-crisis: Q1 13 - Q4 15 56.7 10.3 86.2 74.6
According to this simplified approach, based on correlation analysis, the UAE stock
market could be considered as a leading economic indicator, but still affected by the
oil market development.
2.5 Summary
Over the past two decades, the UAE economy has emerged as a growth-oriented and
diversified economic paradigm. This economic paradigm has enabled the UAE to
establish itself as a strategic and stable business and trade hub at regional and
international levels. Nevertheless, the UAE enjoys with abundant hydrocarbon
resources, which represent about 10% of the proven world reserves. The hydrocarbon-
based industries for a long time have been the essential fuel of the UAE national
economy and a significant contributor to the GDP, but the business diversity of today’s
UAE economy has contributed significantly to reducing reliance upon hydrocarbon
revenues (Al-Shayeb & Hatemi-J, 2016).

47
Before the 1990s wrapping, most of the stock exchanges all over the world used to
operate as mutual organisations. Historically, these stock exchanges began initially as
individual clubs that eventually took a conventional construction. While their rules
were evolved, the setting of a time and place of trading, the priority of trades, and
monetary value-setting mechanisms were settled. In contrast, the consequences of the
post-2008 global financial crisis remarkably slowed down the growth of the UAE
financial markets. One significant feature of such adverse effects was illustrated in
declining significant financial indicators, such as market capitalisation, trading value,
and the number of listed companies. Thus, the effect on the UAE domestic financial
markets by the global fluctuations and crises gives proven evidence that the UAE
economy could pace with accelerated world economy development (Kern, 2012).
The two financial markets of the ADX and DFM have facilitated the growth of many
business organisations significantly without causing any interruption due to the 2008
crisis consequences. Moreover, both markets help the foreign shareholders to play key
roles in improving the financial situation of the post-crisis (Madura & Richie, 2007).
The UAE has been striving to be a financial hub in both regional and global context.
Therefore, the UAE developed its infrastructure, facilities, laws, regulations, and
security environment, which are collectively representing encouraging factors to
attract the international companies and foreign investors to run their business
effectively (Al-Tamimi & Kalli, 2009; Al-Tamimi, Alwan, and Abdel Rahman 2011).
The UAE government looks forward to finding the best business and financial
practices for improving its national economy. Therefore, it is necessary for the
Government to propose a strategic plan purposely for mobilising the available
resources (human and physical) to pave the way for migrating the traditional market
48
practices into smart one. Also, the companies that are interested to be listed should
build its trust and reputation to avoid furnishing any false information or data to the
customers, likewise to the market authorities. Such trust and transparency would set
up an incentive financial environment.
Recently, some economic analyses highlighted an apparent sensitivity of the national
economy towards global financial crises and even toward regional ones. Al-Zaabi
indicated an initiative led to establishing a collaborative committee included ES&CA
and other federal parties involved in the financial policies and strategy, such as the
Federal Central Bank, Ministry of Finance, and Insurance Authority. This
collaboration is needed purposely to set up and review the federal financial policies
and strategies for developing effective rules, regulations, predictive tools, and
preventive procedures to avoid or even reduce the consequences of any future crisis.
Therefore, the primary purpose of the committee is securing the financial stability,
especially for the financial sector and financial market.
Al-Zaabi summarised the unyielding effort of the ES&CA in making the local financial
markets more attractive internationally. In 2016, ES&CA introduced the Self-
Regulatory Organisation (SRO) project in collaboration with ADX and DFM. The
SRO project allows the financial markets to organise their products, monitor the
disclosures, and introduce further market/trading enhancement products. Also,
ES&CA established an independent authority called Central Counterparty Processing
(CCP) to monitor all types of potential risks.
The primary purpose of this independent authority is to establish a secure financial
environment for the investors and traders against any crisis by maintaining the

49
exceptional level of security to avoid or minimise the possible negative impact of an
upcoming crisis. Their central role is to predict possible risks and provide/propose
hedging techniques. To exercise this control power, the CCP has the authority to
interfere to stabilise the financial market.
Overall, the financial and business development in the UAE has represented an
appropriate case for conducting this study in terms the security and stability of its
business environment and financial performance despite that by the UAE is
surrounded by a catalogue of political tensions. The ability of the UAE economy to
recover rapidly from the consequences of the 2008 global financial crisis is evidence
of the flexibility of the UAE national economy to absorb these financial shocks
whether internally or at the global level. Such sound stability has attracted both local
and foreign investors.
50
Chapter 3: Literature Review
3.1 Introduction
The scholarly literature on the economic studies appeared over the last few decades
reflects a steadily increasing concern with the dissertation of finance as a discrete
discipline in the business and management studies like management, operations
research. Likewise, scholars in the financial studies have relentless tried to define the
performance of a firm in the financial strategy context, as well as explaining decisions
that could be made in its favour. This concern is both the consequences of and
responses to growing interest from within the business firm to adopt the tools of the
financial management and strategy. The interest was sparked by many factors, among
these were the successful employment, and increasing complexity and critical nature
of decisions being created by technology in the financial market networks (Barton &
Gordon, 1987).
Many financial firms are striving to achieve their business mission and market
competitiveness using building an appropriate financial strategy through a precise
definition of their respective business plans. Thus, the business firm is needed to
prioritise its business activities as a responsiveness policy to meet the rapid changes in
the local and global market environments, which might result in yielding new business
conditions (Cibin & Grant, 1996; Pickernell & Hermyt, 1999).
Supporting this argument, Slater and Zwilein (1996) stated: “The firm’s financial
strategy possesses a significant potential for influencing shareholder value creation;
therefore, it is a product of firm’s investment, financing, and dividend decisions”. This
statement could be considered as a critical driver for establishing the underlying study.
51
Based on the possibility of having an impact on the firm’s performance that might be
resulted in the creation of shareholder value, we are examining empirically the firm’s
financial strategies from two dimensions, i.e. capital structure and cash flow
management, within the context of the UAE, which has not been done before to our
best knowledge.
In this context, Myers (1984) noted that many theoretical and empirical research
studies on the financial issues had not developed a sufficient consensus about which
factors are affecting the decision-making processes concerning the financial strategies
directly, or how these factors, if any, could influence the firm performance, as well.
Thus, both concepts of strategy and theory of firm have been used to establish a link
between the strategy as a management tool and the firm’s financial performance as an
enabler for developing a firm-specific financial strategy.
Many financial strategists assumed that the impact of different financial strategies
usually defers among various financial and market performance measures. Therefore,
the management should pay careful attention to the trade-off relationship between
these performance measures when considering different financial strategies. The
selection of variant financial strategies to be examined, as well as, the definition of the
proposed hypotheses is mainly based on the existing relevant literature. However, four
of these strategies’ proxies are being scholarly examined for the first time, where the
existing financial literature did not trace any research work supported these unique
proxies.
Yusuff (2004) linked the firm’s best practices that contribute to superior execution
with its business success. Accordingly, the business firm should propose an effective
52
strategy devoted purposely to enhance the sustainability of the firm success regarding
enabling the business firm to gain, as efficiently as possible, an advantage edge over
competitors in the same business domains (Ohmae, 1982). In general, the factors that
could identify and determine a business firm as a successful entity have still been
controversial and debatable. Still, all the business firms, whether successful or
unsuccessful, are subject to stresses of finding an appropriate strategy to be adopted,
such as flexibility in responding to unexpected alterations in the job market.
This dissertation initially attempts to bridge the gap in the performance of financial
strategies through reviewing the existing related literature. So, introducing additional
new suggested variables can fill the current knowledge gap. The comprehensive
literature search probed the relevant previous financial studies that empirically tackled
the dissertation theme; notably, the suggested research variables. Thus, the dissertation
considers a literature gap relevant to its research problem by focusing on:
a) Examining the possible connection between the financial strategies and firm’s
business performance in the UAE context.
b) Examining the 2008 financial crisis consequences in the UAE’s PJSC context.
c) Studying the interrelationship between the UAE National Economy and the
Financial Market activities.
d) Employing six performance measures (dependent variables) together (4
financial plus two markets), and introducing four new factors (independent
variables).
e) Examining the behaviour of the proposed interrelationships under different
economic conditions (pre-, during-, and post-crisis).

53
The newly defined variables are going to examine, for the first time, the financial
strategy-performance relationship under different economic conditions (i.e. before,
within, and after the global financial crisis started in 2008) within the context of the
UAE capital market. Likewise, this empirical dissertation takes on some of these
standards in measuring the financial success of the UAE PJSCs. Accordingly, the
primary assumption of this dissertation is that “Different financial strategies under
different economic conditions are leading to different performance”.
3.2 Theoretical Debates
Fama (1976) argues finance, among the diverse fields of economics, is a unique
research domain, which balances between the theoretical views and practical grounds,
which is the domain of the ongoing dissertation. Such mutual correspondence appears
in the current globalisation of business activities and capital markets, which provoked
many firms to pursue development of their management and business strategies to
make out better performance in their respective business lines to surpass other
competitors.
In their pioneer work, Fama and French (1992) explained the stock returned pattern
and defined the actual driving forces of the stock returns through testing different
factors/indicators. Consequently, the proposed hypotheses of this dissertation
emphasise theory of the firm as suggested by Jensen and Meckling (1976), as
considerably as the concept of the strategy developed by Andrews (1980), to
expressing the management style. Once the management defines, some vital factors
concerned with achieving its success; therefore, could reach sustainable competitive
advantages to perform better than its peers, and above the market average performance.
54
Many firms, therefore, seeking usually the best and proper strategies for achieving
their desirable performance and outcomes. However, the sound performance of a firm
is considered as a vital factor for attracting the investments in its various business
activities, whereas different firm-specific characteristics could explain different
driving factors of success to exceed over the peer firms regarding the average
performance of both sector and market.
Johnson and Soenen (2003) studied the indicators of successful firms to identify the
factors and unique characteristics of firms that are significant to distinguish between
successful and failed firms by testing the impact of potential indicators of the firm’s
financial performance. They agreed with Fama and French in defining the substantial
financial success as an only market-related measure. In contrast, Höbarth (2006)
conducted a dissertation to detect the critical factors involved in the superior
performance for examining both profitability and cash flow measures. Differently,
Erdamar, Adiloglu, and Gürsoy (2013) explain the successful firms as “those were
listed in the Istanbul Chamber of Industry’s (ICI) top 500 firms list for ten years
continuously” without linking the variables to any other performance measure.
Based on the argument of Peter and Waterman (1982), which connected the firm size
with its business success “the big firms be potentially more successful due to their
mass production, financial capability, and geographical coverage”, Pickernell and
Hermyt (1999) stated that the definition of a successful firm had incorporated such
specific criteria as annual turnover, profitability, growth rate, return-on-capital-
employed (ROCE), and size of the asset. Moreover, they derived from the existing
literature some such factors for figuring out fruitful and unsuccessful firms as strategic
leadership, autonomy, market orientation, business capacity, integrity perception,

55
quality control, merchandise design, and evolution of core technologies and
installations.
3.3 Performance Measurements
3.3.1 Historical Review
Organisation theory and strategic management representing the main twin drivers
for studying the firm performance (Jensen & Murphy, 1990). On the other side, the
financial, operational or market aspects can be performance measures, which
represents the firm’s effectiveness, and operational measures merely affect the
financial performance. The market performance measures are the reaction of the
investors and market to the firm’s business results (i.e. earnings per share, share price,
and market-to-book-value). Thus, this dissertation defines the performance measures
in two dimensions, i.e. financial and market.
The financial performance measurement has sparked a keen interest in many
researchers for investigating the firm’s performance using a variety of profitability
measures, such as return-on-investment (ROI), return-on-equity (ROE), return-on-
assets (ROA), and gross profit margin measure (GPM) in studying financial
performance (e.g., Zajac, Kraatz, & Bresser, 2000; Hassan & Halbouni, 2013; Ebaid,
2009; Majumdar & Chhibber,1999; Delios & Beamish, 1999).
The ROI can be measuring the financial performance of different approaches (e.g.,
Busija, O'Neill, & Zeithaml, 1997; Dess, Lumpkin, & Covin, 1997; Johansson & Yip,
1994). The main reason for using these measures to calculate easily by abstracting
accounting numbers from firm’s financial report (i.e., balance sheet and income
statement). Other financial researchers have used more complicated
56
portfolio measures, such frontier efficiency, as Sharpe’s ratio, and Jensen’s alpha (e.g.,
Johnson & Soenen, 2003; Berger & Patti, 2006). However, Johnson and Soenen (2003)
contributed significantly by adding the advanced and sophisticated method, namely
economic value-added (EVA), which requires robust adjustments of reported figures
to avoid any distortion of financial data.
Regarding market performance measurement, many researchers determined the value
stock performance of a firm by employing share price, earnings per share, or dividends
cash payout (e.g., Stattman, 1980; Basu, 1983; Chan et al., 1991); Fama & French,
1992). In contrast, other financial researchers used market-to-book-value or Tobin’s
Q in determining the firm’s value (Keats & Hitt, 1988; Woo, Willard, & Daellenbach,
1992; Farjoun, 1998; Combs & Ketchen, 1999). Some researchers have started
recently using a combination of financial and market measures to examine the firm’s
performance, so, this dissertation does.
For instance, Marquardt and Wiedman (2004) reviewed the mix of stock returns and
volatility, whereas Zeitun and Tian (2007) used Tobin’s q, which mixes market and
accounting values. Abor (2007) applied two performance variables; these were
accounting-based and Tobin’s q measures. Hassan and Halbouni (2013) incorporated
two sets of variables to measure the firms’ performance, i) ROE and ROA as
accounting-based measures, and ii) the market-based measure (Tobin’s q) to measure
the market-to-book value (MVBV) ratio.
3.3.2 Current Studies
The previous studies revealed that neither a single performance measure could be an
appropriate approach, nor could a single method be considered as the best way to
57
estimate the firm’s value despite the accessibility of various scientific methods to act
thus. Consequently, the performance measures and firm valuation could defer among
studies to expect different results. Based on a literature review conducted on the topic,
the performance measures that could be useful for all firms in this context, according
to the underlying assumptions, are selected to consider in further analysis tasks.
The study chose six different measures from the reviewed literature for evaluating the
performance and determining the success of firms by testing each hypothesis
empirically against each performance measure. These measures categorised into two
broad dimensions i) financial performance (i.e., ROI, net profit (NP), Earnings per
share (EPS), and growth rate in sales (GR_Sale)], and ii- market performance (i.e.,
share price, and Tobin’s Q (Market-to-Book-value). These two dimensions are crucial
for any listed firm to evaluate the performance and achieving success in the way to
reach their optimal goal of maximising the shareholder value.
As part of performance analysis, it is assumed that these measures will have
interactions and interdependent relationships as discussed in many scholarly works.
Hassan and Halbouni (2013) mentioned, “Due to uncontrollable factors of the market-
based measures, executives prefer accounting-based performance since these
measures are easier to control. However, market-based measures are more objective
since it is out of firm’s control, and can be affected by different economic conditions”.
Therefore, this dissertation will employ both dimensions of measurements to validate
the impact of various financial strategies on firms’ performance.
3.3.3 Financial Performance
Most of the previous empirical studies reviewed have largely adopted the financial
measures for proper firm’s valuation (Kaplan & Ruback, 1995; Gilson, Hotchkiss, &
58
Ruback, 2000; Johnson & Soenen, 2003). The advantages of using such measures are
the accessibility of data, simplicity of calculation, and the comparability among peer
firms. Hassan and Halbouni (2013) argued, “The market-based performance measures
are objective ones under normal economic circumstances while the accounting-based
performance measures are better ones in the years where unstable economic
conditions exist”.
Many empirical studies have investigated the impact of the various factors on the firm
performance that might be affected by the consequences of the global financial crisis
in 2008 within different business environments worldwide. However, the financial
scholars paid little attention to investigating such consequences on the firm
performance in the GCC countries and other MENA countries. Consequently, there is
an apparent scarcity of scholarly research concerned with this issue. The differences
in accounting and financial reporting standards, however, could affect the financial
performance patterns. In connection to this, Hitt, Hoskisson et al. (1997) argued,
“Despite differences in accounting standards overall trends and analysis should not
be affected too much by them”.
As the financial performance as a concern of this research, four measures (as detailed
below), namely Return-On-Investment (ROI), Net Profit (NP), Growth Rate (GR) in
sales, and Earnings per Share (EPS), are primarily involved in the evaluation of the
firm’s financial performance. The four nominated measures have been a subject of
intensive research investigations. Thus, it is worth to present definition of the
previously mentioned evaluative factors to gain a better understanding of firm’s
financial performance in the domains of investment, profitability, and asset growth.

59
3.3.3.1 Return-On-Investment (ROI)
ROI is well recognised, by financials and management practitioners, as a critical ratio
to evaluate different investment opportunities between the firms of similar business
activities. It explains how much money a firm need to invest to generate specific
income, and what would be the profit of such investments. Thus, among an essential
firm-specific characteristic for all shareholders is how their firm does employ
the available money efficiently in the various investments, particularly when a
comparison between different groups of companies is adequately exercised. Therefore,
ROI was the first method used in measuring how management is efficient in
operating the firm. As it is easy to compare among many companies using the ROI, it
indicates the efficiency of the investment money among those companies.
The ROI is a master ratio widely being used rather than profitability measure because
the ROI considers all possible internal factors. Therefore, the ROI has a direct positive
impact on the firm’s profitability (Johansson & Yip, 1994; Busija et al., 1997; Dess et
al., 1997; Höbarth, 2006). The ROI, which is a key financial performance measure
used in this dissertation, has some drawbacks, such as the differences in accounting
standards used by different firms could create challenges when comparing a group of
the firms, although no other single measure could be considered unbiased. Moreover,
the ROI is calculated in this ongoing dissertation as net income divided by invested
capital including long-term debt plus all shares and then multiplied by 100.
3.3.3.2 Net Profit (NP)
Net profit, synonymously as net income or net earnings, measures the profitability
after subtracting all firm’s costs. i.e., it is the money remain over for shareholders after
paying all expenses. NP is a thus useful instrument for comparing how firms are

60
successful. It is also a measure of how the assets are efficiently employed and how
much profit a firm can generate by every Dirham earned.
NP either in rectilinear figure or as the margin is expected to vary by firm and by
sector. However, a successful firm is that generates a high net profit than its peers do,
or above the average of its sector. The main reason for including the NP is because
easily calculated, and a reliable method for comparing various firms. In this study, we
will use NP as a financial performance measure instead of Gross Profit Margin (GPM)
that appeared in other works (e.g. Ebaid, 2009; Majumdar & Chhibber, 1999).
3.3.3.3 Growth Rate (GR) in Sales
Growth is literarily defined as the key driving factor for sustainable success and
continuous development. Many scholarly studies have proved the importance of long-
term growth as a notion of business success and market competition (e.g. Woo et al.,
1992; Nohria, Joyce, & Roberson, 2003; Mass, 2005; Höbarth, 2006). Different
Internal Growth Rates (IGR) have incorporated in investigating the gross production,
sales, income, assets, and human capital as performance measure (e.g., Woo et al.,
1992; Nohria & Ghoshal, 1994; Margarethe & Liebeskind, 1995; Simmonds &
Lamont, 1996; Davidsson et al., 2002; Höbarth, 2006).
The work of Davidsson et al. (2002) shows that “Business age, beginning size,
ownership form, industrial sector/market, ownership, and legal form are the most
important factors related to growth”. According to Evans (1987), the firm size and
growth rate has a significant negative relationship; consequently, the industry sector is
considered as an essential factor to impact on the firm growth. In our dissertation, the
industry sector could be designated as a control variable. In this dissertation, the GR
in sales is used as a performance measure to present its change of the annual total sales.
61
The dissertation also assumes that the financial strategy-sales growth rate is an existing
positive relationship as reported by Woo et al. (1992) and Höbart 2006).
Almost all the UAE PJS firms faced dramatic downturns and severe challenges in
recovering their financial status, as well as sustaining their growth post-2008 global
crisis. This situation gives a good reason to determine which-of-which financial
strategies could potentially impact the growth rate as performance measure across all
sectors of the UAE capital market. However, there is an apparent scarcity of scholarly
research works concerned with this issue.
3.3.3.4 Earnings Per Share (EPS)
The earnings per share are the amount of money that allocated to each share if a firm
distributes all of its profits to the outstanding shares at every fiscal period end. Despite
that some of the previous studies considered EPS as a market performance measure
(e.g., Stattman,1980; Basu, 1983; Chan et al., 1991), most of the academics, like Fama
and French (1992), defined it as a financial measure since EPS is seen as a firm's
profitability indicator to explain how profitable a firm is from the shareholders’ view.
The employed EPS in this dissertation is considered as “financial performance
measure”, similar to Fama and French. Also, it is easy to use this measure to compare
among a group of the firms. Investors always prefer a firm with higher earnings
per share (EPS); it is expected to distribute more money against each share. EPS is a
key variable used to determine a share's price/value as it presents the history of
profits distributed to shareholders, as well as can be considered to predict future
earnings. When a firm generates income by using its capital efficiently, this will lead
to higher EPS, and will consequently impact positively the share’s price/value. The
62
EPS is = (Net Income-Dividends) divided by Average Outstanding Shares (Instead of
“average outstanding shares”, some practitioners use the number of shares outstanding
at the end of the period).
Practically, the fund providers, financials, analysts, and investors use EPS ratio to
compare different shares or firm performance. However, the context of financial
strategy-EPS relationship has drawn little attention and rarely conducted in empirical
studies. Höbarth (2006) used what was so-called “cash dividend” instead, which is the
sum of all paid dividends. However, this EPS measure has a significant disadvantage,
which the accounting standards and valuation methods used can show a significant
variance either over an extended period within a firm or among a group of the firms.
Therefore, it cannot rely on a single performance measure; thus, there is no other single
measure can be considered unbiased or without disadvantage.
3.3.4 Market Performance
The top managers usually possess privileges of administrative control and authority
power on accounting-based performance. However, different economic conditions can
affect the adopted measures of the firm devoted market performance while the market-
based measures are out of the senior managers’ control, (Hassan and Halbouni, 2013).
Moreover, the market performance measures have received increasing attention in the
major financial studies (e.g. Stattman, 1980; Basu, 1983; Rosenberg, Reid, & Lanstein,
1985; Chan et al., 1991; Fama & French, 1992).
Other approaches employed in measuring the market performance; nevertheless, two
measures are involved predominantly in measuring the performance, these are: i) Share
Price, and ii) Tobin’s Q or Market-to-Book-Value. Hence, in this dissertation, both
63
financial and market performance measures were used in the test of the relationships
between the financial strategy and the market performance. Thus, investigating this
relationship is for bridging the knowledge gap through verifying the impact of different
adopted financial strategies on the market performance of the firm of various
dimensions and some related factors.
3.3.4.1 Return of the Share Price (Return)
The return of the share price (movement) is an important common instrument used
frequently in many empirical studies to measure the firm’s market performance (e.g.
Stattman,1980; Basu, 1983; Keats & Hitt, 1988; Jensen & Murphy, 1990; Chan et al.,
1991; Fama & French, 1992; Woo et al., 1992; Farjoun, 1998; Combs & Ketchen,
1999; Höbarth, 2006). Share price presents the current market value (market
capitalisation) of a firm compared to its book or ultimate share price; thus, it affects
the investors’ decision to buy, keep, or sell the share.
A firm with higher share price than its book or maximum price shows above
expectation performance and indicates the future expectations of investors. According
to Höbarth (2006), a stock can be affected by speculation for maximum a period of
three to five years. To avoid the possible influence of speculation in the short term, I
shall measure the share price movements over almost 40-quarters (average of ten
years) to reflect the firm’s real value for the prudent investors. The assumption beyond
that is: when the share price is positive, the market reacts to increase firm’s value.
3.3.4.2 Tobin’s Q (Market-to-Book Ratio)
The second market measure used in this dissertation is Tobin’s q measures the ratio of
stock price to book value per share. It is used as an instrument for market performance
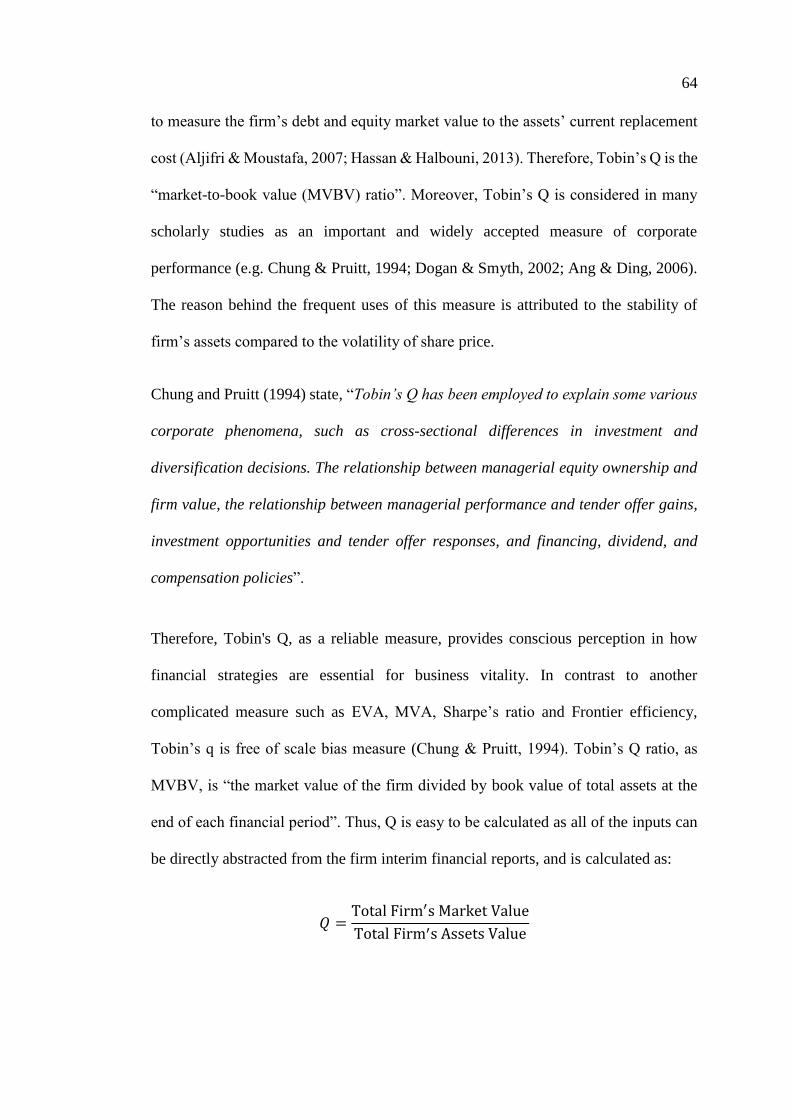
64
to measure the firm’s debt and equity market value to the assets’ current replacement
cost (Aljifri & Moustafa, 2007; Hassan & Halbouni, 2013). Therefore, Tobin’s Q is the
“market-to-book value (MVBV) ratio”. Moreover, Tobin’s Q is considered in many
scholarly studies as an important and widely accepted measure of corporate
performance (e.g. Chung & Pruitt, 1994; Dogan & Smyth, 2002; Ang & Ding, 2006).
The reason behind the frequent uses of this measure is attributed to the stability of
firm’s assets compared to the volatility of share price.
Chung and Pruitt (1994) state, “Tobin’s Q has been employed to explain some various
corporate phenomena, such as cross-sectional differences in investment and
diversification decisions. The relationship between managerial equity ownership and
firm value, the relationship between managerial performance and tender offer gains,
investment opportunities and tender offer responses, and financing, dividend, and
compensation policies”.
Therefore, Tobin's Q, as a reliable measure, provides conscious perception in how
financial strategies are essential for business vitality. In contrast to another
complicated measure such as EVA, MVA, Sharpe’s ratio and Frontier efficiency,
Tobin’s q is free of scale bias measure (Chung & Pruitt, 1994). Tobin’s Q ratio, as
MVBV, is “the market value of the firm divided by book value of total assets at the
end of each financial period”. Thus, Q is easy to be calculated as all of the inputs can
be directly abstracted from the firm interim financial reports, and is calculated as:
𝑄 =Total Firm′s Market Value
Total Firm′s Assets Value

65
The ratio figure is an essential indicator of investors’ decision, which if a q value equal
or less than (≤1), it means that the share is undervalued. Vis-a-vis, if a q value bigger
(˃1), it means that the share is overvalued. In this study, we will examine the impact
of variant financial strategies on Tobi’s Q value to predict the investors’ approach.
3.3.5 Theoretical Framework
This section aims at connecting scholarly work of strategy as per se with those works
tackling firm’s financial performance to address a set of assumptions suggesting an
interpretation the strategic financial decision in the context of strategy perspectives. I
used the theory of the firm as proposed by Jensen and Meckling (1976), and the concept
of the strategy developed by Andrews (1980), as main theories, to establish a linkage
between firm’s financial performance and strategy concept through the capital
structure and cash flow management to create a type of financial strategy.
The idea of the strategy serves as a theoretical framework within which additional
elements or variables can be incorporated to define the strategy-specific issue.
Considering establishing this link, Bettis (1983) suggested that the interdisciplinary
research between strategy concept and financial performance would be useful in
defining the formulation of corporate strategy. Also, such theories as Corporate
Finance, Resource-based View (RBV), and Pecking-Order have been used parallel to
explain the relationships between firm’s performance and various potential variables.
3.4 Financial Strategy
A growing body of financial literature examines the strategic decision of the firms on
models for managing their financial assets. In this case, while firm planning for
achieving sustainable business growth and stability, it must adopt the right financial
66
strategy to be a driving force for enabling the assessment of its financial needs and
sources. Such assessment is required to meet the firm's proposed business objectives
conveniently, and likewise to fulfil the concerned financial mission; therefore, the
financial strategy is considered a firm-specific tool. Hence, the Firm’s Board of
Directors and Management (FBD&M) is eventually responsible for re-structuring this
strategy that derived from the firm’s business and market involvements.
The recent trends in the strategic business management research adhere to the
dissertation of finance as a discrete discipline within the classic theories of economics,
business management, econometrics, and public administration. Many scholarly works
tried to identify the financial performance of a firm in the management strategy
context. Thus, many existing theoretical and empirical research in financial studies
have not developed a consensus about which factors can develop a direct effect on the
decision of financial strategies, or how these factors, if any, could influence the firm
performance (Barton & Gordon, 1987; Myers, 1984). Thus, the conceptual approach
of this dissertation would be by merging the financial strategy concept, and firm’s
theory has bridged the strategy as a management approach with the implementation of
the budget to give birth to the financial strategy of the firm.
Deploying a financial strategy thus needs a precise definition of a business plan
(Short/Mid/Long-term) for achieving the firm business mission that merely devoted to
sustaining its competitiveness in various marketing domains. Consequently, the firm
is needed to prioritise its business activities based on the mission and objectives of its
strategic plan as a responsiveness policy to meet the rapid changes in the financial
market environments (Cibin & Grant, 1996; Pickernell & Hermyt, 1999). However,
Slater and Zwilein (1996) indicated that “The firm’s financial strategy has significant

67
potential in influencing the creation of shareholder values; therefore, it is a product of
firm’s investment, financing, and dividend decisions”.
Some factors, as capital structure, are significantly affecting the firm’s performance
(i.e., financial and marketing). Much attention paid to probing any relationship
whether as positive, negative or none that could be set up to the firm’s performance
and capital structure (Salim & Yadav, 2012). Recently, the finance scholars are
striving to identify the factors that could be related to the successful firm strategy.
Grienitz and Schmidt (2012) identified some strategic success factors that involved in
reversing some of the German firms working in the automotive supply industry into
successful companies. These factors were including an active market investigation,
efficient operations, project management, knowledge management, and admission to
skilled employees. In summary, these successful firms are well-positioned concerning
a broad range of engineering innovations, like outsourcing, and developing a
significantly immediate reaction towards the changes in their business surroundings.
The migration of a firm from failure to the successful entity is paced with the
generation of business values. This issue has received proper attention from related
financial studies to suggest that the business firms that reached consistently above the
average of financial performance are frequently being characterised by having sound
managerial values. So, each of these firms usually produces its specific values as a
portion of its success to preserving its commitments to focusing on the customers and
suppliers, promoting innovation and pursuing improvement; also, establishing fruitful
relationships with their employees. These values can support the business success of
the firm through the compactness of the competition racing with their peers.
68
In general, the factors that could identify and determine a business firm as a successful
entity have still been controversial and debatable. Still, all the business firms, whether
satisfactory and unsuccessful, are subject to stresses of the importance of adopting
appropriate strategies, such as flexibility in responding to unexpected alterations in the
job market. However, some of the researchers have agreed upon common factors be
used in identifying the degree of firm’s success. Pickernell and Hermyt (1999)
enumerated some such factors determining success and failure of firms as strategic
leadership, autonomy, market orientation, line capability, integrity perception,
character control, merchandise design, and evolution of core technology and facilities.
Inquiry about this topical theme has revolved around the assumption that specific
financial strategies should either boost or hinder the competitive performance of the
business firm. This research dissertation is exploratory and empirically driven; it
examines the potential relationship and its impact of various financial strategies on
both short-term and long-term organisational performance of the UAE PJSCs in a
period span of ten years (2006-2015), with which the 2008 global financial crisis has
happened, with its post consequences., which developed the research intention of this
dissertation study.
3.4.1 Financial Strategies as Potential Factors
The financial strategies standing for the possible factors in the performance of a firm
above the average usually reflects the creation of the shareholders’ value. This
superior performance could be measured against either peer, sector, or the entire
market, although, many researchers in strategy-related domains consider management
techniques and applications within the strategic studies (Hofer, Murray, Charon, &
Pitts, 1984).
69
As long as the financial strategies are the concern of this dissertation, there is still
disagreement among the community of financial economists upon what possible
factors affect the right selection of specific types of financial strategies to maximise
the wealth of the shareholders, regardless such selected strategies exert any effect on
the firm-specific value. Within this disagreement context, therefore any proposed
financial strategy seems “economically defensible". Concerning the corporate
strategy, many scholars dealt corporate studies under the umbrella of financial
research, such as marketing, manufacturing, and financial research domains; therefore,
the financial strategy study is scholarly accepted as a functional research field in the
economics (Barton & Gordon, 1987).
Some specific indicators explain how some firms achieve a superior performance
leading therefore to creating the shareholders’ value. Other stakeholders, such as
policy-makers, fund providers, suppliers, customers, management, and employees are
also having a profound interest in monitoring and tracking successful firms. The
process of making the right decision is considered a fundamental aspect of corporate
strategy. In contrast, both corporate strategy and financial, economic theories have not
furnished sufficient information or useful guidelines for financial practitioners or
academics. Thus, both financial scholars and practitioners are still suffering from
scarcity of needed information for making better financial decisions, along with
realising to what extent the importance of the involved factor would be.
This dissertation considers the role of financial strategy- performance relationship
since little has been written about financial strategy as a potential driving factor for
success. It is believed that different indicators and ratios reflect the result of the
strategies’ implementation have explained the existence of various financial strategies.

70
Thus, this dissertation assumes different financial strategies possibly influence the
performance measures differently. The primary role of the financial strategy in
measuring the performance of the business firm is catalysing the applications of the
related theories and concepts to financial strategies as capital structure and cash flow
management. These applications of the concerned theories are expected to cast much
light over the connection between financial strategies and firm’s performance as an
organic part of its target goals.
3.5 Capital Structure
The capital structure is defined in the financial practices as “how a firm finances its
overall operations and growth by using different sources of funds”. The firm's capital
structure can be a mixture of long-term debt, short-term debt, common equity and
preferred equity. A firm's proportion of short- and long-term debt is considered
when analysing the capital structure. When analysts refer to capital structure, they are
referring to a firm's debt-to-equity (D/E) ratio, which provides insight into how to risk
a firm is. Usually, a firm that is heavily financed by debt has a more aggressive capital
structure and therefore poses a higher risk to investors. This risk, however, may be the
primary source of the firm's growth.
The financial studies have witnessed an ascendancy of research in the capital structure
and its impact on firm performance. For instance, the co-founder of the Google™
Patrick Pichette has described this issue in 2009 as a central matter of the business
firms at all levels. Thus, the emphasised the role of the open market and free trade in
the efficiency of the capital structure in the context flexibility theory “If we could
predict the strategic flexibility, we would need it for such conditions as uncertain
71
business environments, and market saleability; thus, we could optimise the balance
sheet seamlessly for keeping the amount of debt low”.
The genuine interest in tackling various aspects of the capital structure might be
attributed to many reasons; Firstly, there is a significant gap existing between the
capital structure-related theories and its professional practices in the financial domains.
Secondly, the differences in the viewpoints of the financial researchers on how to take
on the capital structure concept. For example, Frank and Goyal (2008, 2009) and Singh
and Kumar (2008) inclined towards the theory of trade-off in describing the driving
force behind the decision processes regarding capital structure functionality. In
contrast, the pecking-order theory was the ideal approach of many other researchers
(e.g., Shyam-Sunder & Myers, 1999; Lemmon & Zender, 2010; Văidean, 2014) in
investigating the driving forces of the capital structure in various contexts.
Graham and Leary (2011) debated whether the key associated problems in the financial
research field are due to the lack of convincing theories or complications with
empirical estimations of the facts that might be associated with the capital structure.
The agency theory (Jensen & Meckling, 1976; Fama, 1980) has paved the way for
deciding the optimal capital structure within the framework of the total agency costs
while minimising amongst the involved agents, shareholders, and bondholders. On the
other hand, it has been observed that the increase in dividend payouts causes the free
cash flow to reduce. Such counteractive relationship enforces the business firm to
extend its activities into the external markets and subject to monitoring. This, in turn,
may result in a significant reduction in the related agency costs (Easterbrook, 1983;
Jensen,1986).
72
Debt-to-Equity Ratio is a key measure of capital structure. Debt is one of the two most
important ways firms can raise capital in the financial markets. Firms like to issue debt
because of the tax advantages. Interest payments are tax-deductible. Debt also allows
a firm or business to retain ownership, unlike equity. Additionally, in times of low-
interest rates, debt is abundant and easy to access. Both debt and equity can be found
on the balance sheet. The assets listed on the balance sheet are purchased with this debt
and equity. Firms that use more debt than equity to finance assets have a high leverage
ratio and an aggressive capital structure.
A firm that pays for assets with more equity than debt has a low leverage ratio and a
conservative capital structure. That said, a high leverage ratio and an aggressive capital
structure can also lead to higher growth rates, whereas a conservative capital structure
can result in lower growth rates. It is the goal of firm management to find the optimal
mix of debt and equity, also referred to as the optimal capital structure. Debt comes in
the form of bond issues or long-term notes payable, while equity is classified
as common stock, preferred stock or retained earnings. Short-term debt, such as
operating capital requirements is likewise believed to be part of the capital
construction.
Equity is more expensive than debt, especially when interest rates are low. However,
unlike debt, equity does not need to be paid back if earnings decline. In contrast, equity
represents a claim on the future earnings of the firm as a part owner. Analysts use the
D/E ratio to compare capital structure. It is calculated by dividing debt by equity.
Practical understanding, the financial firms have learned to incorporate both debt and
equity into their corporate strategies. At times, however, firms may rely too heavily on

73
external funding and debt. Investors can monitor a firm's capital structure by tracking
the D/E ratio and comparing it against the firm's peers.
Many empirical studies in the field of corporate finance noted the existence of the
capital structure-performance relationship. Patel and Bhatt (2013) argue that the
“capital structure decisions affect the liquidity and profitability of a firm”. Similarly,
they examined the capital structure decision-performance relationship through testing
six proxies represent decisions of financing and investing in assets against six
performance measures. Capital structure formulation defines how a firm could finance
and invest in its assets. Despite there is no perfect formula for the equity-debt ratio, in
reality, management usually exercise different options to improve the efficiency to
reach a superior firm performance.
Modigliani and Miller (1958) introduced the theory of corporate finance and modified
in 1963 by incorporating the tax effects. The modified theory and its model postulates
that the actual value of a firm increases as more leverage (the ratio of the debt to a
firm's loan capital to the equity as a value of its common stock) is utilised because the
subtraction of payment interest (after-tax debt) allows further operating income to
circulate among the investors. Modigliani and Miller (M&M) proved their theory
assumption in the real-world of the capital markets. In other words, if the lower cost
of post-tax debt is more significant than offsets, the equity cost increases parallel the
growth in firm’s leverage, causing the Weighted Average Cost of Capital (WACC) to
decline continuously whereas, the firm value increases steadily. Consequently, the
UAE does not impose taxes on doing business hitherto; we do not expect any
advantage of using more debt to reduce the WACC. Therefore, we hypothesise that
higher debt would be leading to lower performance.
74
Andrews (1980) focused on the firm’s financial status (debt vs equity) from a corporate
strategy perspective. According to him, this status represents a necessary functional
decision of financial strategy, which is expected to be consistent with the long-term
strategy of the firm. However, the previous thirty years witnessed a boom of empirical
studies conducted globally to examine the capital structure-performance correlation
(e.g. Banz, 1981; Basu, 1983; Chand, 1988; Fama & French, 1992, 1998; Zajac et al.,
2000; Johnson & Soenen, 2003; Höbarth, 2006; Berger & Patti, 2006; Aljifri &
Moustafa, 2007; Ebaid, 2009; Patel & Bhatt, 2013; Hassan & Halbouni,
2013; Văidean, 2014).
Among the list mentioned above of studies, further studies conducted in the GCC
region, which covered such specific factors as government ownership, advantage level,
and firm’s size to be used as control variables. For example, Kamal Hassan and Saadi
Halbouni (2013) and Ebaid (2009) investigated governance-performance relationship
by using the firm’s size as a control variable. Further, most of these studies in the
region covered a short period that does not reflect the market fluctuation under
different economic conditions, which is the research problem of this dissertation. They
also suggested that these research areas yielded interesting findings including the
supply side of capital, capital structure-labour contracts connections, financial
contracting, dynamic trade-off theory and capital adjustment mechanisms.
Regarding the local causes of the 2008/2009 financial crisis, some investigations on
this issue have accused the nature of the capital structure to initiate the crisis, even at
local level. Moreover, the different availability and accessibility of information, along
with misconduct behaviour of the stockbrokers have collectively compounded the
crisis. The perfect market is a conceptual financial term that assumes a financial market
75
with no asymmetric information, moral commitments, benefits yield, and the like. This
concept predicts findings of classical finance theories as follows:
a) The capital structure does not matter to a firm (Modigliani & Miller, 1958).
b) Prices of securities are equal to the expected value of the future earnings.
c) Investment and capital structure decisions are independent (Fisher separation
theorem, 1930) and all the investment projects with positive Net Present Value
(NPV) should be undertaken.
In the real world, we found empirical evidence that contradicts the predictions
mentioned above of a perfect market. For instance, the assumed empirical evidence
supports the following:
a) The capital structure does matter to the firm.
b) The newly issued shares are quite low-priced.
c) The firms with positive NPV projects may gain different levels and routes of
access to the credit.
The trade-off theory has been recalled in the current research on the capital structure
to explain does matter where the firm possesses vast amounts of tangible assets tending
to be financed with more debts rather than the firm with large amounts of intangible
assets. In deciding on the proper capital structure for a firm, shareholders and top
management must balance the potential risks before repaying the debt with the
availability of equity capital to pursue steady growth of market opportunities. The
reviewed theories in the previous studies can help in the validity of the aim of this
dissertation “different capital structure determines the firm’s performance”.
76
Most of the existing financial models presuming that the demand of the firm for debt
or equity exclusively determines its capital structure. This implies the flexibility of the
capital supply in these concerned models; therefore, the business behaviour and the
availability of capital supply are entirely relying on the firm-specific characteristics.
In this case, we suppose that the existing assets of a firm can sustain continuous cash
flows. Thus, the firm would gain some taxation privilege by averting its debt with the
profits. Nevertheless, its leverage would be restricted due to the specific cost of the
debt financing (Fisher, Heinkel, & Zechner, 1989; Leland, 1998).
The relationship between the firm characteristics and the debt-to-equity ratio has
received much attention from scholars and professionals of the financial community.
The substantial growth is a mirror of the firm’s characteristics regarding capital
intensity, investment ratio, business size, return-on-total assets, and export ratio.
Moreover, debt-to-equity ratio characteristics impact significantly on the firm growth;
for instance, its high value is often associated with the lower growth, whereas, the high
gained profitability of the total assets is associated with higher growth. Therefore,
much scholarly proved that a firm having a significant financial structure would be an
enabler of a dynamic growth (Forss, 2006).
The capital structure theories have opened a new track for intensive research in firm’s
financial business. Thus, the vital importance of studying the capital structure is giving
a predictive tool for achieving greater financial success for the firm (Ross, Cox, &
Ingersoll., 2005). As the capital structure is still being a central financial concern,
defining an ideal firm’ capital structure is a financial research challenge facing a theory
of finance during the past quarter century (Bradley et al., 1984; Mikkelson, 1984).
Since the capital structure is an intriguing area of financial research studies, it may
77
attract other disciplines, such as econometrics, to share in finding results for
unanswerable questions raised in capital structure functions. Ross et al. (2005)
considered prescribing an exact formula for computing the optimal rate of the firm’s
leverage is a central issue, whereas an attractive link between the leverage and firm
profitability looks to exist. Thus, this dissertation attempts to confirm such relationship
between leverage level strategy and firm performance.
The trade-off theory of the capital structure involves using the real debt as a tool to
drive of generating returns. Thus, this theory highlights the advantages of the tax over
the debt and other leverage-associated costs both directly or indirectly, also indicates
that the peak level of debt is a firm-specific to be chased by the financial directors
(Bradley et al., 1984; Mikkelson, 1984). Myers (1984) unveiled the gap in the trade-
off theory, which is the leverage target level for the business firm does not exist to
enable a successful firm uses less debt. Therefore, Myers proposed the pecking-order
theory to fill the revealed gap. Thus, the stable relationship between leverage target
level and profitability, as hypothesised in this dissertation, could be described as
negative.
Ross et al. (2005) presumed that the profitable firms are capable of producing
sufficient internal funds to be utilised or invested in financing their business projects.
Such plenty financial resources of the company would be sustaining its ranking in the
financial market to obey the pecking-order theory. Therefore, such mutual relationship
between leverage and profitability can take on the best way to determining the optimal
capital structure. The capital structure of a firm is a mix of its equity and debt. In other
words, it is the amount of equity and debt, and the types of debt and equity used to
fund the operations of the firm. “Although this article is not intended to test capital

78
structure theories in an international environment, we need first to understand the role
of various factors in the capital structure decision” (Öztekin, 2015).
This dissertation was trying to explain how the structure of capital can impact on the
firm’s performance; its conceptual interpretation/philosophy is that there are many
items could define how the capital is structured, which are those affecting the
management of decision on capital structure, and what the types and proportion of
each component.
The investigation on the research problem has been made possible through
incorporating six variables as proxies for the capital structure to explore the
relationship between the capital structure and firm performance. This dissertation has
determined six common financial strategies, namely leverage level, unrelated assets,
firm’s size, capital expenditure, government ownership, and sustainable growth
rate. Moreover, any management approach can use one of them in examining the
capital structure-performance relationship. A keen concern on investigating various
aspects of capital structure determinants and the institutional characteristics across
many countries has found the way to scholarly literature (e.g., Rajan & Zingales,
1995; Booth, Aivazian, Demirguc‐Kunt, & Maksimovic, 2001; Antoniou, Guney, &
Paudyal, 2008; Fan, Titman, & Twite, 2012). The following are details of each
strategy.
3.5.1 Leverage Level
Our Definition: How much the firm borrow (debt) as a percentage of total assets, such
as money to operate and expand the business.
79
According to Modigliani and Merton (1963), the main reason for a firm to borrow
money (increasing leverage level) is to gain the tax deduction benefit. Many financial
studies (e.g., Chand, 1988; Fama & French, 1998; Johnson & Soenen, 2003; Berger &
di Patti, 2006; Höbarth, 2006) have proven that the increasing leverage level is a
cheaper fund than the equity. The arguments of these studies that to borrow money can
raise the return-on-equity (ROE) and stock return, which means better performance.
However, borrowing money may increase the firm’s cost and financial stress (Merton,
1977). Nevertheless, a firm can employ different funding strategies to define its proper
debt-equity ratio, which depends on the firm’s specific characteristics, by considering
a trade-off benefit-cost relationship between debt and equity (Höbarth, 2006).
The early studies in this field reported different results of the leverage-performance
relationship. Chand (1988) and Berger and Patti (2006) found a positive relationship
between the firm’s performance (stock return) and debt level. Despite Fama and
French (1998) reached a negative relation between debt and performance (i.e., firm’s
value), they also found no enough evidence of the tax benefits from borrowing money.
In contrast, Johnson and Soenen (2003) not accepted any correlation between the
capital structure and performance, whereas, a weak-to-no impact between capital
structure and firm’s performance including the ROE, the return-on-assets (ROA), and
the gross profit margin (GPM) existed (Ebaid, 2009). Hassan and Halbouni (2013)
used the leverage level, which is measured by the amount of total long-term debt to
total assets considered as a control variable; find that the leverage-performance
relationship is not significant.
80
The generating findings revealed that the leverage was negatively related to the stock
market performance. However, the more levered a firm is, the more likely the firm
would not able to fulfil its contractual commitments. In other words, a massive debt
can be leading to a higher probability of bankruptcy and financial recession. Thus, the
firm with a higher level of leverage can associate with weak financial performance,
but this relation would be reciprocal for the firm with a sizeable debt-to-asset ratio.
The Theory of Corporate Finance could also be an approach to explaining why more
leverage is being used? The reason might be attributed to the deductibility of interest
payments that allows more of the operating incomes to flow through to the investors.
In this dissertation, despite the different findings of previous research, we will follow
Fama and French (1998) assuming a negative relationship between debt and
performance. Therefore, this dissertation will assume that the higher is the leverage
level, the lower is the firm’s performance. Nevertheless, this dissertation examines the
impact of leverage level on the six suggested measures of the firm’s performance.
3.5.2 Firm’s Size
Our Definition: The total assets that could be represented by the tangible value of a
firm.
The size of the firm is a standard variable used in measuring the firm performance
through employing different methods, such as market value/capitalisation, total assets,
sales, or number of employees (e.g., Banz, 1981; Basu, 1983; Fama & French, 1992);
Barber & Lyon, 1997; Rouwenhorst, 1999; Zajac et al., 2000; Johnson & Soenen,
2003; Höbarth, 2006; Fagiolo & Luzzi, 2006; Ang & Ding, 2006; Zeitun & Tian, 2007;
Ebaid, 2009; Hassan & Halbouni, 2013).
81
The early years of empirical studies on the relationship between firm size and growth
had employed the cross-sectional analysis in which logarithmic firm growth is
regressed on logarithmic firm size at the initial period including lagged growth. The
debate over the relationship between both is still vivid. Some empirical studies showed
mixed evidence about the relationship between firm size and growth; whereas, some
studies gave evidence of no existing relationship, others have found a positive
correlation (Mansfield, 1962; Utton, 1971; Singh & Whittington, 1975).
The recent studies on manufacturing industries found that an inverse size-growth
relationship at either the firm’s level or the plant level predominates (Evans, 1987;
Hall, 1987; Dunne & Hughes, 1994; Blonigen & Tomlin, 2001). More recently, studies
have favoured using panel data to examine the growth size relationship, as panel data
analysis makes it possible to control for time-invariant individual effects. Nakano and
Donghun (2011) investigated the interaction between substantial growth and
profitability. These findings also exhibit a high inverse growth-size relationship to
suggest that the small firms grow faster than large firms; also indicates the mean-
reversion of growth rates over the long-run. The larger firms become more competent
over time, and there is less room for further improvement in these firms regarding
profitability and growth, in turn, leading to a random process for growth, especially
among larger firms (Kiani, Chen, & Madjd-Sadjadi, 2012).
Robson and Bennett (2000) examined the growth of the British small and medium-
sized firms to find a positive relationship between both profitability and sales growth
but also profitability and number of employees (firm size). However, the growth of the
sales is considered to be a statistically significant result. Kung et al. (2002) surveyed
672 registered members of the British Institute of the Entrepreneur to find a positive
82
relation between sales growth rate and profit growth rate. Liu and Hsu (2006) found
a significant positive effect on the growth of the firm, as well.
Asimakopoulos, Samitas, and Papadogonas (2009) investigated the determinants of
firm profitability of non-financial Greek firms listed in Athens Exchange. Their
findings showed that the firm profitability is positively affected by size, sales growth
and investment; whereas, negatively by leverage and current assets. Frank and Goyal
(2009) documented the critical factors for the American firms are industry leverage,
market-to-book assets ratio, tangibility, profits, inflation, and firm size. Rajan and
Zingales (1995) examined the size of the business firms and its impact on the
performance across the G-7 countries to find that the dominant factors were the
market-to-book assets ratio, tangibility, profits, and firm size. However, what is
unknown yet is whether the results from primary industrial countries extend to a much
larger panel of countries.
Hamilton, Shapiro, & Vining (2002) used a sample of Hi-Tech Canadian firms to test
the Gibrat’s Law to conclude the firm size has a significant impact on firm’s growth,
causing smaller companies to grow faster than larger ones. Likewise, Lotti and
Santarelli (2001) noted that different industries have different patterns of growth and
that the size of firms can change significantly over the time. Jovanovic (1982) set up a
theoretical model to analyse the survival of firms. The model showed that both the age
and size of the firm were essential factors in determining its market survivability; it
also revealed that the small firm could grow faster but likely fails earlier than large
one does.
The empirical findings show that profitability measures, especially ROA and firm size
have a positive and significant effect on firm’s financial success whereas leverage is
83
negatively related to stock market performance. In contrast, as the firm grows, the
financial performance improves but after a certain size, this relationship appears to
reverse. In some empirical studies, the firm’s size was used as control variables (e.g.,
Zajac et al., 2000; Ebaid, 2009; Hassan & Halbouni, 2013) to find the firm’s size-
performance relationship was positive and significant. Other studies reported a
positive and meaningful mutual impact on the firm size and performance (e.g., Johnson
& Soenen, 2003; Höbarth, 2006; Zeitun & Tian, 2007).
Despite the weakness of using total assets measure, as the total assets can dramatically
be affected by the valuation method and different accounting standards, it can be easily
obtained from the financial reports. Furthermore, it is assumed that the extended period
covered by this empirical dissertation will be improving the reliability of this figure.
The literature search revealed different findings of the firm’s size-performance
relationship where a negative correlation was frequently reported in many studies (e.g.,
Banz, 1981; Basu, 1983; Fama & French, 1992; Barber & Lyon, 1997; Rouwenhorst,
1999).
In contrast, due to specific characteristics of the UAE business environment, this
dissertation assumes the firm’s size-performance relationship is positive, and
therefore, the more prominent firm will perform better than peers, sector, and market.
Thus, all the previously reviewed work in this section agreed upon “A firm’s size is an
important determinant of firm performance”.
3.5.3 Capital Expenditure
Our Definition: A sort of expenses used to purchase or upgrade the firm’s assets those
are important to generate income or future business.

84
According to accounting standard is capitalised expense, capital expenditure is “money
paid, in particular, period, to acquire additional assets to the existing Fixed Assets
list, or to upgrade the existing ones”. Depends on generating additional income and
future business, proper employment of property is a success factor of superior firms.
Johnson and Soenen (2003)) and Höbarth (2006)) both used ROA as a performance
measure to assess how assets can generate income and how efficient the management
is in utilising these assets; their findings were similar in reaching a positive relationship
between ROA and firm’s performance. However, this finding did not exist with most
of the performance measures used (e.g., financial and market).
A higher ROA means more profit to increase the overall business profitability to
eventually push the share price to increase and lead to higher market value. In this
dissertation, examined the relationship between capital expenditure and six
performance measures (i.e. financial performance and market performance). Similar
to previous studies, in this empirical dissertation, the assumption will be, the higher
the capital expenditure, the higher the income will be, the better the performance is.
Despite that, in the short-term, capital expenditure led to lesser profits and cash flow
when a firm spends the money, in the long-term, it is expected to have a positive
relationship. The Resource-Based View (RBV) theory could be used to explain the
investment in related assets; in other words, the firms can earn superior returns if they
can obtain sufficient resources. A literature review revealed that, to the researcher’s
best knowledge, this variable had not been tested within the context of the UAE capital
market or the GCC region.
85
3.5.4 Government Ownership
Our Definition: Government ownership may add value to firms, as they
can provide variant support and protection, and therefore, they may define how the
capital structure is?
In principle, government ownership will add value to firms, as they can provide variant
support and protection. The government-owned firms operate more efficiently by
controlling their expenses. However, this is maybe applicable to the domestic market
not when a firm operating in the international market.
Most of the previous studies, using data before the global financial crisis in 2008,
examined the impact of government ownership on firm’s performance. For example,
Ang and Ding (2006) compared this relationship between government-owned and non-
government owned firms. He finds that government ownership provides remarkable
support that helps in achieving superior financial and market performance summarised
in high value and more significant return. Aljifri and Moustafa (2007) evaluated the
governance mechanisms to examine the impact of government ownership of firm’s
performance and find a significant positive relationship.
Nevertheless, to the researcher’s best knowledge, this variable has not been tested
under different economic conditions in the region. Especially, with considering the
government support provided to certain firms after the global economic crisis started
in 2008. Similar to previous studies, in this empirical dissertation, we will examine the
government ownership-performance relationship to determine the possible influence
on different performance measurements of the firm (i.e. financial and market). Similar
to the studies mentioned above, it is assumed that government-owned firms will
perform better than non-government owned firms.

86
3.5.5 Sustainable Growth Rate (SGR)
Our Definition: The SGR is the money that remains internally from profits and is not
paid out to shareholders (i.e., a maximum growth rate that a firm could maintain
without borrowing more money; it, therefore, impacts the capital structure decision.
It defines how much a firm can grow with self-funding. A firm can increase its
sustainable growth rate either by increasing its profits and generates more cash or
minimising the payment of dividends. The Pecking-order theory states that when a
firm prefers private financing (retained earnings) that the external one. Thus, the
business firm maximises the value at the point where the marginal benefits are in the
balance against the marginal cost of increasing debt. Therefore, the decision on the
capital structure is a fundamental element in the overall corporate strategy of the firm.
Myers (1990) debated over a well-defined ratio of debt to equity in the context of the
pecking-order theory of capital structure.
Andrews (1980) indicated the capital structure decision be a crucial element of the
overall corporate strategy of the firm. The collective evidence on the capital structure
shows that the moderate use of debt increases the firm’s value and lowers the cost of
capital. The firm can increase its value when the debt costs are in the balance of the
leverage and marginal benefits. Therefore, the firms may adapt their capital structure
to minimise the total agency costs and the negative signals that may be sent out as a
result of information asymmetries. Thus, the investment and dividend decisions do
play a significant role in setting the optimal capital structure. Thus, firm’s growth
through retained earnings and skilful use of financial derivatives can presumably ready
to mitigate the future financial crises.

87
The business firm growth and profitability have drawn lots of attention since the early
years of the twentieth century. Gibrat (1931) proposed the first law to investigate the
patterns of the business firm growth, namely (Law of proportionate effect LPE) as an
alternative to neoclassical theory. The Gibrat’s Law employs both firm’s growth and
size as dependent and independent variables, respectively. The law defines the growth
of a business firm as “The firm tends to change the distributed proportions of its size
randomly to set forth an equilibrium firm size to which all business firms meet”. In
other words, the small firm having the same growth opportunity equally to that of the
large firm, if the small one operates in the same industrial sector.
The LPE sparked a deep interest in many financial community researchers to
investigate it in the various industrial/business environment. Geroski, Lazarova, Urga,
& Walters (2003) examined the LPE using panel data on 147 United Kingdom (UK)
firms over a 30-year span to find the growth rates varied over time. Moreover, these
firms showed no tendency to the converge on either a standard size or a pattern of
stable size differences over time, which is consistent with the LPE. In the same context,
Oliveira and Fortunato (2006) investigated the LPE using panel data on Portuguese
manufacturing firms to find an inverse growth-size relationship and, hence, rejected
the LPE. Goddard, Wilson, and Blandon (2002) examined the LPE using panel data
on 443 Japanese manufacturing firms for 1980-1996 to find an inverse growth-size
relationship and a mean-reversion of log firm size thus rejecting the LPE.
Çoban (2014) investigated the interaction between the firm growth and profitability
using panel data on 137 Turkish listed manufacturing firms over the period 1997-2012.
According to results, there is a statistically significant positive relationship between
current profits and current growth. The impact of current profits on current growth is

88
much stronger than the impact of current growth on current profits. These results
appear to contradict the theories of industrial organisation, which suggest a negative
relationship. With such a range of findings, it is not surprising that the debate remains
on whether the LPE holds or not.
Penrose (1959) indicated that there is an inverse relationship between the current
growth and the future profits to yield “Penrose effect”, which states that “As the
business firm grows, it tends to spend more on administrative costs due to inefficient
management, and rates of profit decrease accordingly”. Likewise, Marris (1964)
suggested if the motivation of the firm’s managers by increasing salaries, power, non-
financial benefits, and prestige would increase the loyalty and commitment of the
employees to the employer. However, this incentive policy might be associated with
size rather than with the profit. So, if the managers are interested in striving to pursue
the achievement of their objectives, they could blend firm’s objectives into theirs.
The various limits on the market size may constrain the growth in demand, which can
be removed by diversification; however, there are some limits to the rate at which firms
can diversify successfully without suffering the profitability, where the growth and
profit compete interdependently. Therefore, the firm needs to opt a proper position to
meet the continuum of inverse profitability-growth relationships. In other words, firms
face trade-offs between growth and profit. Thus, the current profits are a crucial factor
when predicting future growth (Goddard et al., 2004).
Coad (2007) performed a similar analysis on French manufacturing firms and
concluded on the contrary that profit rate and subsequent growth are independent.
Coad also found that lagged growth has a positive effect on subsequent rates of profit,

89
also contrary to Goddard et al. (2004). Coad (2010) states a negative correlation
between growth and profitability based on his findings. Moreover, Bottazi et al. (2008)
reported that there is not a remarkable relationship between growth trend and the
differential profitability. Roper (1999) indicated that the high profitability is not
persistent above-average growth rates for Irish firms, while Gschwandtner (2005)
argues that there not a statistically significant relationship between firm growth and
profitability for the American firms.
Serrasqueiro, Nunes, and Sequeira (2007) employed different panel estimators to have
found the relationship between growth opportunities, and profitability is nonlinear.
These findings suggested that the agency problems between managers and owners are
especially relevant to firms with average growth opportunities, as managers seem to
act to grow while decrease profitability, simultaneously. In their later study,
Serrasqueiro et al. (2009) revealed the actual effect of growth on persistent profitability
is positive.
Capon, Farley, and Hoenig (1990) had an opposite finding to the view of growing
more than their rivals become more profitable as a result; these results would imply
that business firms having low and high growth opportunities usually tending to catch
an advantage for high profitability, and the other firms have small profitability. The
SGR calculation formula is “Multiplying the Earnings Retention Rate by the Return
on Equity”. Therefore, a high SGR is not always a good sign for investors; a firm
should pay particular attention to the trade-off relationship between a high earnings
retention rate (money not distributed to shareholders) and high dividend payout.

90
Johnson and Soenen (2003), and Höbarth (2006) concluded that sustain the growth
rate is a critical indicator for successful business firms. Thus, this conclusion reported
a positive relationship between sustainable growth rate and firm’s financial and market
performance. Thus, this dissertation hypothesises similarly as Johnson and Soenen
(2003) and Höbarth (2006) stated that the higher the SGR, the better the performance.
3.5.6 Unrelated Assets
Our Definition: When the firm uses its capital, external funds, and returned earnings
to invest in non-core business investment for acquiring assets purposely for generating
more incomes and future expansion of the business.
It is apparent that utilising available assets is a critical factor in success and superior
performance. Many business firms usually invest in developing new functions and
activities or acquire assets unrelated to their core business (such as financial assets,
properties, investments in other enterprises and joint venture) as a strategy to diversify
their businesses. Many such factors as surplus liquidity, expected return, a new
phenomenon, market trend, and some executives’ experience or preference are the
drivers that can support a decision on how and where to invest. The key common
measure to evaluate the assets’ performance is the ROA, which is usually used to
assess the performance of the entire assets.
Resource-Based View (RBV) theory could explain the investment pattern in unrelated
assets. The financial firms can earn superior returns if they can obtain exceptional
resources, which cannot be easily copied by their competitors; therefore, not diffused
throughout the business markets. Therefore, it can produce more economically to
91
satisfy the needs of the customers efficiently. A resource is an absolute asset that could
be a strength or weakness of a firm and tied semi-permanently with it (Caves, 1980).
The RBV focuses on the strategic choice for identifying, developing and deploying the
critical resources for maximising their returns. Thus, achieving a sustainable
competitive advantage is the conventional RBV of the firm (e.g., Penrose, 1959;
Wernerfelt, 1984), while Porter considered the competitive advantage concept as the
main starting point for the RBV (especially Porter’s five forces model). According to
Peteraf (1992), the heterogeneity in assets implies that the different capabilities can
assist the firms in competing well in the marketplace while achieving different results.
Barney (1991) indicated that heterogeneity among firms allows some of them to gain
some competitive advantages.
The increasing opportunities in the financial markets for firms received little attention
from the financial community, where it could be a proper approach for the explanation
of performance. If the firms’ managers tend to maximise their utilities and not to
current profits, they will sacrifice to increase growth, investing in projects with
excellent growth opportunities to sustain their firms’ performance. This argument
received much attention and further developed the agency theory context (e.g. Fama
& Jensen, 1983; Jensen, 1986).
Regarding the startegy of business diversity, Montgomery (1994) found the firm that
adopts business diversity would be less profitable. In some cases, diversification is
closely related to a firms’ core product leading to increasing profits (Rumelt, 1997;
Teece, Pisano, & Shuen, 1997). Gemba and Kodama (2001) analysed the dynamics of
diversification in the Japanese manufacturing industries to conclude what the business
92
diversification was not related to a firm’s core field that tends to decrease profitability,
even contributes to high growth. Thus, the firm can achieve high rates of profit by
exercising market power through restricting production levels for obtaining high-profit
margins per item sold. Such relationship between profitability and business diversity
implies that the current growth correlates with future profit negatively.
The existing body of financial literature revelated severe scarcity of empirical studies
regarding that the impact of the investment in unrelated assets or irrelevant business
domains on the relationship between financial strategies and firm’s performance.
However, based on the RBV theory and the study of Peteraf (1992) on “the
heterogeneity in assets”, this dissertation puts much concern on examining the impact
of the firm’s investment in unrelated assets on its different performance measures.
Thus, the study assumes that a firm that tends to invest its surplus cash in unrelated
assets would perform better than peers in the same sector.
One can disclose that, due to the variance in accounting standards, the unrelated assets
were difficult to define and hard to be extracted directly from the financial statements
due to the unique characteristics of each sector/industry (Zuca, 2013). Therefore, in
this dissertation, the unrelated assets consist of all figures categorised in the balance
sheet/financial position as investments (any investment), financial assets, and any
other property, which are unrelated to the firm’s/sector business nature.
3.6 Cash Flow Management
Over different business life cycle and accounting periods, a business firm can either
generate positive or negative net cash flow temporarily. The net decrease/increase
cycle in cash and cash equivalent position in a single period is a result of the three
93
activities presented in the cash flow statement; these are operating activities, investing
activities, and financing activities. By merging all these activities’ net cash
contribution, the available cash and cash equivalent stand for the opening cash balance
available to be used in financing these activities in the next period.
Concerning the works of Ping and Zuguang (2009), the main concern of running an
enterprise is not its business boundary, but the efficiency of upper management. If the
effectiveness of the directorate is improved, the border of the firm will expand
naturally. Accordingly, the firm’s performance does not come only from the unique
products and services, but also from the management’s performance. Management
activities may consist of planning, organising, leading, and controlling including
liquidity control. Management of cash flow and working capital play a master role in
the firm’s management to maintain optimal business performance and satisfy various
stakeholders’ interest and expectation.
Thus, it is evident that both superior performance and shareholders’ value creation are
a matter of leading management practices. Hence, measuring management practices
and efficiency regarding managing the cash flow and working capital is a critical factor
in firm’s performance. So, each decision would affect the cost and financial results of
running a business either directly or indirectly. In this dissertation, defining the
relationship between managing the cash, including working capital, financial strategies
and the firm’s performance is assumed that a firm that is generating positive net cash
of the period will gain a better liquidity position, and consequently a better firm’s
performance than other peers.

94
The correlation between different activities management and variant performance
measures will be examined to evaluate how these factors are significant characteristics
of successful firms. We determined five common financial related strategies usually
adopt any management to consider the cash flow management-performance
relationship. These strategies are known as i) Cash Conversion Cycle-CCC (as a proxy
for working capital management), ii) Cash generated from operating activities, iii)
Cash generated from investing activities, iv) Cash generated from financing activities,
and v) Cash holding position.
In general, the primary networks of any access to cash sources money are more likely
to be used for:
1) Increasing distributions to equity via dividend payments or share repurchases.
2) Decreasing the cash amount, which is necessary to raise it in the financial
markets, which based on the firm's capital market accessibility.
3) Efficient recovering from the existing debt or other liabilities of the firm.
The argument is that under any of these scenarios, the nominal cash value might think
that the punishment needs signs tend to increase. The reason behind existing this
relationship is that as the firm’s cash status recovers, the firm would become more
expected to give out funds and less liable to raise cash. However, we claim that the
firm that encounters significant financing obstacles; mainly, when valuable investment
opportunities are coming across, the marginal value of cash should be higher for the
firm, which can easily raise additional capital.
The preference of the firm’s upper management is the crucial factor making financial
decisions, for instance, of investment options, capital structure, and dividend policy.

95
Therefore, the financial economics must furnish applicable guidelines to enhance the
upper management in the selection of preferable financial strategies. Andrews (1980)
stated, “The nature of the firm may cause variation in the preferable goals of top
management; therefore, the strategic financial decision should be inconsistent with
such goals”. However, the final decision must properly balance the business interest
of the firm against what was economically defensible. The investigation on the cash
flow and working capital management issue is applicable through incorporating five
variables, as proxies, to examine the relationship between the cash flow management
and firm performance. This dissertation has defined five common financial strategies,
namely cash conversion cycle “CCC”, Operating activities management, investing
activities management, Financing activities management, and Cash holding position.
The following are details of each strategy.
3.6.1 Cash Conversion Cycle (CCC)
Efficient working capital management is a crucial characteristic of any successful firm.
Richards and Laughlin (1980) introduced the cash conversion cycle (CCC) approach,
which defines the analysis method of working capital management efficiency. Thus,
the CCC is the time interval between the cash outflow paying suppliers to cash in-flow
from customer. In other meaning, it is the total days of the cycle between the cash
outflow for purchase to receive sales in-flow money.
Many financial scientists based their research on the CCC model (e.g., Hyun-Han &
Soenen, 1998; Johnson & Soenen, 2003; Höbarth, 2006; Gill et al., 2010; Ukaegbu,
2014) to conclude that the business firm with efficient working capital management is
the most successful firms. Gill et al. (2010) concluded that a significant negative
relationship existed between the CCC (as a proxy for working capital management)

96
and profitability. They added improving profitability is possible by reducing the credit
period granted to their customers to exist a connection between CCC and cash
sufficiency. Nevertheless, reducing the time between suppliers’ invoices payments and
cash collection from customers/sales can maintain the firm’s credit rating, as well as
creating shareholders’ value (Johnson & Soenen, 2003; Ukaegbu, 2014). In this
dissertation, we are following revealed literature and assume a negative relationship,
that, the shorter the CCC, the better the performance.
3.6.2 Operating Activities Management
Operating activities represent all the main activities and transactions that a firm is
involved in operating the business for generating profits. In other words, they cover all
the core business activities needed for generating money using purchase products or
raw materials, sales income, services income, General and Admin expenses (G&A),
marketing expenses, and any other related factor. The operating activities should then
be the leading resource of firm’s generated cash flow. Therefore, the operating
activities are indicating the profitability of a business firm.
The literature review revealed that, to the researcher’s best knowledge, this factor has
neither been detected in any significant empirical or comparative studies nor been
subject to test for defining the relationship between financial strategies and firm’s
performance. It is necessary to consider what would be the contribution of operating
activities (as short-term actions) to the overall change in cash. Thus, it is assumed that
a firm that generates sufficient cash from operating activities higher than the net
changes in the cash flow and cash equivalent during the concerned period will be
performing well than its peers in the same sector or market.
97
3.6.3 Investing Activities Management
Cash flow from investing activities is an essential aspect of growth and capital, as it
means the company is investing in future operations. Investing activities represent all
activities involved in buying or selling long-term fixed assets and investments in
related domains. It shows that how a firm does manage the money used to acquire long-
term assets or investments as (outflow), or received from selling these items during
the specific period as (inflow). These assets and investments are considered by the firm
as necessary transactions to generate long-term business and income.
Accordingly, the normal direction of the investing cash flow should be "negative", as
sometimes, firms need to spend money on making more money. In this dissertation,
we assume that a firm with negative cash from investing activities will have better
performance. However, the literature review revealed that, up to our best knowledge,
this variable has neither been detected in any significant empirical or comparative
studies nor been subject to test for defining the relationship between financial
strategies and firm’s performance.
3.6.4 Financial Activities Management
This section discusses the liquidity and efficiency of a financial firm in using the
available cash for generating more fund (either internally or externally) to run or
expand the business activities. It is worth to note that, the financing activities,
operating activities and investing activities, to the researcher’s best knowledge, have
not been studied empirically, nor tested for defining the relationship between financial
strategies and firm’s performance.

98
Financing activities are all the activities and transactions that represent long-term
liabilities (creditors), as well as the equity (investors). It shows how a firm manage the
provided money (internally and externally) using in operating or expanding the
business during the specific period. These transactions include paying loans,
dividends, new loans and financing, new stocks, and stocks buyback. Moreover,
financing activities of the cash contribution could be either positive through bank
borrowing, loans, and raising additional capital/equity, or, negative through loan
repayment, finance/interest cost, and paying dividends. Nevertheless, the business firm
needs to utilise available cash and raise additional fund to operate its activities and
expand its operations to create a sustainable business.
Measuring the contribution of financing activities to the overall changes in cash is an
indicator of the efficiency regarding the utilisation of the available cash by the firm to
denote the extent to which the cash utilisation impacts on the firm’s performance and
liquidity. Therefore, the business firm needs to allocate a sufficient fund to sustain and
broaden its business. So, the assumption is that the firm with positive cash that
generated from financing activities will be performing a better business. The literature
search revealed that, up to our best knowledge, this variable has neither been detected
in any significant empirical or comparative studies nor been subject to test for defining
the relationship between financial strategies and firm’s performance.
3.6.5 Cash Holding Position
The corporate liquidity reduces the likelihood of incurring inconvenient financial costs
if the firm's operations do not generate a sufficient cash flow to service required
payments to cover the debt. The corporate liquidity can come at a cost, where the
interest earned on corporate cash reserves is frequently subject to tax at a higher rate

99
than interest earned by individuals. Furthermore, the cash may provide more funds for
the financial managers to invest in desirable projects, which do not provide financial
benefits but may spoil the value of the shareholders (Jensen & Meckling, 1976).
It is surprising that the related studies have not explored the implications of potential
value for holding cash in the existence of these frictions. Hanson (1992) and Smith
and Kim (1994) estimated the consequences of excess cash flow value to find that
the bidding firms that possess high excess free cash flow would exhibit low excess
stock returns during merger notices, while their estimated coefficients interpreted
when the value destruction linked with the high level of excess free cash flow.
Since the existing financial constraints often related to inequality of information
between the firm and the capital providers, the firm would suffer from higher
transactions costs in accessing external capital. In such a context, the additional money
of internal funds could enable a constrained firm to avoid these increased costs of
raising funds, thereby, rendering additional internal funds more valuable. Faulkender
and Wang (2006) found that the marginal value of cash declines when the
cash holdings became larger and gained leverage higher, along with efficient access to
capital markets. Therefore, the firm has to opt superior cash distribution through the
dividends rather than does repurchase. Consequently, what would be the value that the
shareholders can place on the cash held by the firm? Moreover, what would be the
difference of value between the firms?
The existing body of financial literature reveals that the approximation of the actual
value of adding debt to the capital structure of the business firm is not well-
investigated; in contrast, the value of adding more cash to the capital not well studied,
hitherto. Thus, it is not a misunderstanding of the ability of firm’s liquidity in making

100
wise investments without approaching the external financial markets. Such access
would let the firm to avoid the costs of both transactions (either on the debt or equity)
and different information. Thus, the relationship between debt, cash and capital
structure could determine the feature of cash hold of the business firm.
The cross-sectional variations in the cash holdings level may be related to the
theoretical benefits, and costs have investigated extensively over the past three
decades. Consistent with the hypothesised effects, many authors found that the
business firms with stronger growth opportunities, low cash flows risk, and restricted
accessed to the capital markets hold higher cash balances (Kim et al., 1998; Opler et
al. 1999; Harford; 1999; Pinkowitz & Williamson, 2001; Billett & Garfinkle, 2004;
Faulkner, 2004; Ozkan & Ozkan, 2002; Mikkelson & Partch, 2003; Hartzell et al.,
2005; Dittmar et al., 2003). Pinkowitz and Williamson (2004) also examined the
marginal value of cash with a particular focus on the cross-sectional variations that
may relate to the set of the firm's investment opportunity.
Based on the work of Fama and French (1998), they unveiled that the shareholders of
a business firm with sound growth options, along with added opportunities of
volatile investment can place higher values on its cash than a firm with fewer, more
stable growth opportunities. Pinkowitz, Stulz, and Williamson (2006) extended the
examination of cross-country differences in the marginal value of cash. Faulkender
and Wang (2006) suggested that the market perceives the presence of market frictions
to make raising outside the capital quite costly. The market, therefore, rewards the firm
that retains liquidity with higher valuations and able to create more value than
a comparable firm with less internal cash.
101
In contrast to the findings generated by both Hanson (1992) and Smith and Kim
(1994), Pinkowitz and Williamson (2004) connected the higher value of cash holdings
with the firm performance in their hypothesis “the higher some cash holdings, the
better is the firm’s performance”. In this dissertation, the hypothesis is in agreement
with work of Pinkowitz and Williamson (2004), which found “the higher some cash
holdings (cash balance), the better is the firm’s performance”.
3.7 Summary
This chapter covers the topical theme of this dissertation on examining the impact of
variant financial strategies on the firm performance. The majority of the UAE PJS
firms faced dramatic downturns and common challenges in recovering their financial
status, as well as sustaining their growth post-2008 global crisis. This situation gives
an actual reason to determine which financial strategies could potentially affect
the performance measure across all sectors of the UAE capital market. Financial
strategy influences to some extent the performance of the firm. Therefore,
different indicators and ratios that reflect the results of the strategies’ implementation
explain the various financial strategies. Therefore, it is crucial for management to
adopt financial policies and strategic decisions that can positively influence the firm’s
financial performance.
Based on some previous studies, the findings of any empirical dissertation are possibly
varied depending on the employed measures. The main reason for using these
measures is that, with considering the reliability, they can be easily obtained directly
from firm’s financial quarterly reports (i.e., balance sheet, income statement, and cash
flow statement) without introducing any further adjustments.
102
This dissertation is examining the impact of eleven different potential financial
strategies (factors) on six of the firm’s financial and economic performance from two
dimensions (i.e. financial performance and market performance). To the researcher’s
best knowledge, four variables are newly incorporated in studying the Financial
strategies about the firm’s performance (i.e. Unrelated Assets, cash generated from
Operating Activities, cash generated from Investing Activities, and Cash generated
from financing activities).
In conclusion, the literature search concentrated on retrieval of the fundamental
theories and hypotheses in this field (i.e. the theory of the firm as suggested by Jensen
and Meckling (1976), as considerably as the concept of the strategy developed by
Andrews (1980) in addition, we have talked other related interpreting theories like:
pecking-order theory, trade-off theory, agency theory, the theory of corporate finance,
and the Resource-Based View Theory, along with reviewing the classical papers in the
financial issues that related to this dissertation. The proposed financial strategy-
performance relationship is expected to take different directions; it is supposed to vary
among different variables and the various sectors and to have a different influence.
Additionally, accounting standards issue may cause interference and explain some
of those different correlations.
103
Chapter 4: Data and Methodology
4.1 Introduction
This dissertation investigates empirically the influence of adopting different financial
strategies on the firm’s performance using a panel dataset of quarterly audited
published financial data of 92 listed companies, collected from the companies’
quarterly reports and the UAE stock market database. This sample covers different
sectors and industries, from 2006 to 2015. Thus, using panel data results in increasing
the degrees of freedom significantly. In fact, our sample data consists of 3,680
observations per variable in the Capital Structure section, and 3,589 observations per
variable in the Cash Management section.
The choice of what type of model to develop is based on the UAE’s economy
characteristics, data limitation, and the intended objectives. In this dissertation, we
adopt econometric methods for panel data analysis, and we conduct diagnostic tests to
make sure that the underlying assumptions for a good model are fulfilled. Moreover,
a suitable tool to measure each strategy is defined, along with conducting all required
tests to assure the reliability of data and suitability of using the various accurate
models. Then, we test each related financial strategy to six measures of the firm’s
performance. Due to natural weaknesses when each performance measure is tested
individually, we segregate the six performance measures into two groups (i.e. three
financial measures and another three market measures).
4.2 Data Description
To test the relationship between firm’s specific characteristics and performance in the
UAE, a significant effort was made to identify the needed data and the reliable sources,

104
given the importance of collecting pertinent variables, with a long enough time series
for econometric purposes. The 112 companies sorted out to build a homogeneity
between listed companies that inline with the requirements of this study. Twenty
companies declined due to: i) founded after 2007, ii) had inaccurate of non-available
data, iii) were de-listed during the tested period (2006-2015), and iv) non-Emirati /
non-local companies. Despite, the final number of the included companies reduced
from 128 listed companies, by the end of 2015, to only 92 companies represents 72%
of the total listed companies. Nevertheless, it still covers the ten different sectors listed
in the UAE financial market.
Further, we deleted all the observations that did not have a complete record of the
variables included in our analysis. Likewise, we deleted a small number of
observations with non-reliable values. Furthermore, we also eliminated firms, for
which not all data are available. After all, above mentioned adjustments, the companies
included in our sample are 92 with 3,680 observations per variable, on a quarterly
basis. However, given the availability of cash flow management variables’ data, the
number of observations used in the second model reached 3,589 during the same tested
period. Therefore, the panel data covers at least 40 time-periods from 2006 to 2015,
which means the covered period will measure the firms’ performance before, within,
and after the global financial crisis that started in 2008.
These firms represent the entire UAE stock market since 56 companies are listed in
Abu Dhabi Exchange Market (ADX), and 36 companies are listed in Dubai Financial
Market (DFM). These 92 listed companies are distributed over ten different industries
and sectors, as detailed in Table 3.

105
Table 3: Listed companies in the UAE stock market, by sectors
Sector ADX DFM Total
Insurance 13 9 23
Finance and Investment 1 4 5
Services 6 2 8
Bank 14 7 21
Industrial 13 1 14
Transportation 0 3 3
Consumer Staples 4 1 9
Real estate 2 5 7
Energy 2 0 2
Telecommunication 1 1 2
Total 56 36 92
Concerning the primary sources of the data, it was primarily collected from the
companies’ quarterly reports and the UAE stock-market database (i.e. Emirates
Security & Commodity Authority (ES&CA), Abu Dhabi Exchange Market (ADX),
and Dubai Financial Market (DFM)). Most of these quarterly audited reports are
available in PDF format in the ADX and DFM websites or databases, while it was
available in excel format in the ES&CA database, which we relied on to start building
our database. However, using data from various sources and different formats might
create mistakes and potential duplicates, especially when converting the gained data
into EViews format (econometric software) to avoid “Conversion Errors”.
To re-organise the data in a proper format that can be easily used in EViews, we had
to create an Excel file, to re-tabulate the whole data (more than 63,000 final figures),
and also to transform the data in either ratio or percentage format to build a relative
measure among all variables. So, we created a separate Excel worksheet to conduct
the whole calculation by applying the related equations (see Tables 4 and 5). Each
equation calculation contains two to four figures leading to deal with massive numbers.

106
Further, we had to repeat some of our calculation equations because we found different
formulas were used in previous literature to calculate the performance measures. For
example, Tobin’s Q has more than one equation to calculate (depends on different
hypothesis), and Firm Size has been calculated used different methods like market
value/ capitalisation, total assets, sales, or some employees. Thus, we decided to
change our assumptions and use the suitable equation depends on the available data.
Another remarkable effort that we have contributed that, we have collected and
tabulated other variables those were examined previously in the literature like
depreciation expenses, General and Admin (G&A) expenses, market capital, total
liabilities, total revenue, returned earnings, and accumulated profit. However, due to
either impacting of robustness, unavailability of data, or non-significant or not-
relevant relationship, we decided to eliminate them from this dissertation. Fortunately,
ignoring these variables might not be problematic, since our selected variables describe
well the firm’s performance in the UAE.
In a conclusion, the most prominent challenge we faced is the accuracy of the data,
because initially it was entered manually either by ES&CA’s employees or third
party’s/agent’s employees. It took us a very long time (more than 13 months) to be
confident about the accuracy and reliability of the tested data; the data was carefully
entered and organised by a research assistant, then audited by the researcher, and
finally verified by an independent statistician.
Another reason for this long time was that part of the required data was not ready with
ES&CA, ADX and DFM; they had to customise their reporting system to provide the
raw data in Excel format. For an instant, it took ADX more than eight months to

107
provide the data of government ownership variables. Another significant example is
that share (closing) price data varied between ES&CA’s index (ESM), and both ADX
and DFM. Therefore, we had to conduct dual cross-databases auditing effort among
provided data, published information, and historical reports. Then, we approach the
data source (ES&CA, ADX, or DFM) to get confirmation against any uncertainty.
For being sure that the gained data are accurate, the acquisition of the required data
was made from available firm’s quarterly audited financial reports to warrant the
quality and reliability of the generated financial results. Because the auditors revise
the financial figures and approved by the regulator before being published. According
to the diagnostic tests that have been conducted, the data could be considered
homogeneous regarding firms’ characteristics because i) the firms were compliant
with financial results disclosure regulations, and ii) all of them are listed in the UAE
stock market pre-2008 financial crisis, and its consequences continued for a while.
Taking into account that the UAE firms specificities and data availability, we selected
the primary variables, which reflect the firm’s performance, in line with the purpose
of this dissertation and the adopted model. Therefore, the definitions of dependent and
independent variables, as well as the associated measurement, are discussed below.
4.2.1 Dependent Variable
According to the literature, there are several ways to quantify the performance of the
company. In this section, Table 4 describes the six selected measures of the firm’s
performance used in the proposed model to examine and identify the primary
determinants of the firm’s financial activities by analysing the capital structure
variables; after that, by cash flows management indicators
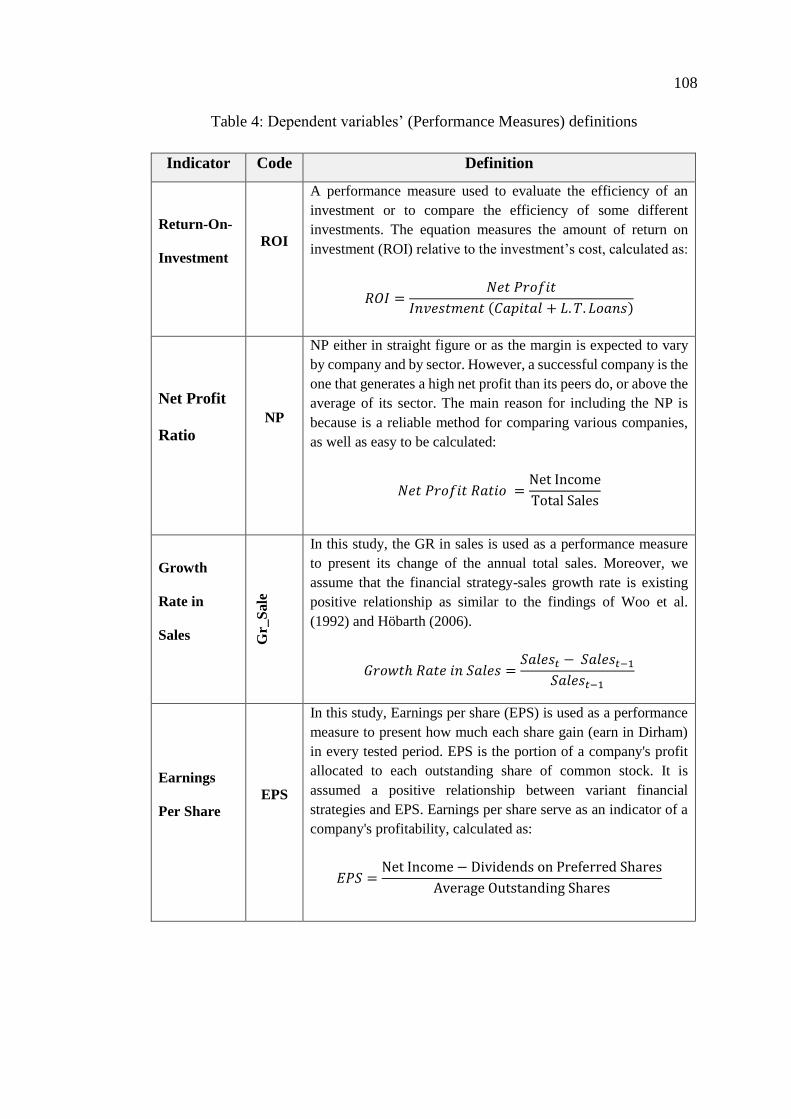
108
Table 4: Dependent variables’ (Performance Measures) definitions
Indicator
Code Definition
Return-On-
Investment
ROI
A performance measure used to evaluate the efficiency of an
investment or to compare the efficiency of some different
investments. The equation measures the amount of return on
investment (ROI) relative to the investment’s cost, calculated as:
𝑅𝑂𝐼 =𝑁𝑒𝑡 𝑃𝑟𝑜𝑓𝑖𝑡
𝐼𝑛𝑣𝑒𝑠𝑡𝑚𝑒𝑛𝑡 (𝐶𝑎𝑝𝑖𝑡𝑎𝑙 + 𝐿. 𝑇. 𝐿𝑜𝑎𝑛𝑠)
Net Profit
Ratio
NP
NP either in straight figure or as the margin is expected to vary
by company and by sector. However, a successful company is the
one that generates a high net profit than its peers do, or above the
average of its sector. The main reason for including the NP is
because is a reliable method for comparing various companies,
as well as easy to be calculated:
𝑁𝑒𝑡 𝑃𝑟𝑜𝑓𝑖𝑡 𝑅𝑎𝑡𝑖𝑜 =Net Income
Total Sales
Growth
Rate in
Sales Gr_
Sale
In this study, the GR in sales is used as a performance measure
to present its change of the annual total sales. Moreover, we
assume that the financial strategy-sales growth rate is existing
positive relationship as similar to the findings of Woo et al.
(1992) and Höbarth (2006).
𝐺𝑟𝑜𝑤𝑡ℎ 𝑅𝑎𝑡𝑒 𝑖𝑛 𝑆𝑎𝑙𝑒𝑠 =𝑆𝑎𝑙𝑒𝑠𝑡 − 𝑆𝑎𝑙𝑒𝑠𝑡−1
𝑆𝑎𝑙𝑒𝑠𝑡−1
Earnings
Per Share
EPS
In this study, Earnings per share (EPS) is used as a performance
measure to present how much each share gain (earn in Dirham)
in every tested period. EPS is the portion of a company's profit
allocated to each outstanding share of common stock. It is
assumed a positive relationship between variant financial
strategies and EPS. Earnings per share serve as an indicator of a
company's profitability, calculated as:
𝐸𝑃𝑆 =Net Income − Dividends on Preferred Shares
Average Outstanding Shares
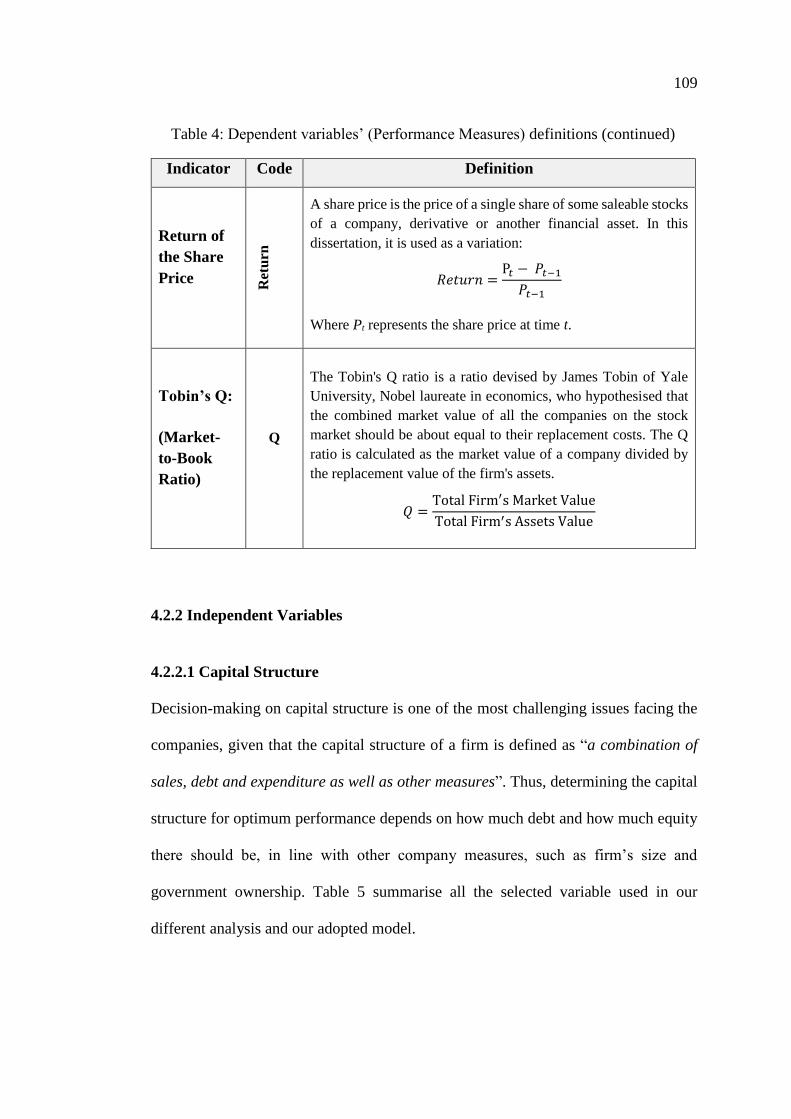
109
Table 4: Dependent variables’ (Performance Measures) definitions (continued)
Indicator
Code Definition
Return of
the Share
Price R
etu
rn
A share price is the price of a single share of some saleable stocks
of a company, derivative or another financial asset. In this
dissertation, it is used as a variation:
𝑅𝑒𝑡𝑢𝑟𝑛 =P𝑡 − 𝑃𝑡−1
𝑃𝑡−1
Where Pt represents the share price at time t.
Tobin’s Q:
(Market-
to-Book
Ratio)
Q
The Tobin's Q ratio is a ratio devised by James Tobin of Yale
University, Nobel laureate in economics, who hypothesised that
the combined market value of all the companies on the stock
market should be about equal to their replacement costs. The Q
ratio is calculated as the market value of a company divided by
the replacement value of the firm's assets.
𝑄 =Total Firm′s Market Value
Total Firm′s Assets Value
4.2.2 Independent Variables
4.2.2.1 Capital Structure
Decision-making on capital structure is one of the most challenging issues facing the
companies, given that the capital structure of a firm is defined as “a combination of
sales, debt and expenditure as well as other measures”. Thus, determining the capital
structure for optimum performance depends on how much debt and how much equity
there should be, in line with other company measures, such as firm’s size and
government ownership. Table 5 summarise all the selected variable used in our
different analysis and our adopted model.

110
Table 5: Capital structure variables’ definitions
Indicator Code Definition
Leverage
Level Debt
This indicator is measured by the amount of total long-term
debt to total assets. Therefore, this dissertation will assume
that the higher is the leverage level, the lower is the firm’s
performance.
𝐷𝑒𝑏𝑡 =Total L. T. Liabilities
Total Assets
Unrelated
Assets Ratio Unr_asset
In this dissertation, the unrelated assets consist of all figures
categorised in the balance sheet/financial position as
investments (any investment), financial assets, and any other
assets those are unrelated to the company’s/sector business
nature. The unrelated assets are measured as a percentage of
Total Assets.
𝑈𝑛𝑟_𝑎𝑠𝑠𝑒𝑡 =Unrelated Assets
Total Assets
Firm’s Size Size
Firm’s size is measured by different such methods as market
value/ capitalisation, total assets, sales, or some employees.
In this dissertation, we are using total assets measure.
𝑆𝑖𝑧𝑒 = 𝑇𝑜𝑡𝑎𝑙 𝐴𝑠𝑠𝑒𝑡𝑠
Capital
Expenditure Capex
The Capital Expenditure (CAPEX) is the amount spent to
acquire additional assets and is calculated as the changes of
Total Fixed assets amount (property, plant and equipment)
between two periods. In this dissertation, the assumption will
be, the higher the capital expenditure, the higher the income
will be, and therefore, the better the performance.
𝐶𝐴𝑃𝐸𝑋 = 𝐹. 𝐴𝑠𝑠𝑒𝑡𝑠𝑡 − 𝐹. 𝐴𝑠𝑠𝑒𝑡𝑠𝑡−1
Government
Ownership Gov_own
The percentage of government ownership measures the
factor to total equity/capital. This dissertation assumed that
government-owned companies would perform better than
non-government owned companies.
𝐺𝑜𝑣_𝑜𝑤𝑛 =Government Shares
Total Shares

111
Table 5: Capital structure variables’ definitions (continued)
Indicator
Code Definition
Sustainable
Growth
Rate
SGR
The sustainable growth rate (SGR) is the maximum rate of
growth that a firm can sustain without having to increase
financial leverage or look for outside financing. In this
empirical dissertation, the assumption will be, the higher the
sustainable growth rates, the more significant future growth
would be, and therefore, the better the performance is. The
SGR is calculated as:
𝑆𝐺𝑅 = 𝑅𝑂𝐸 × (1 − 𝐷𝑖𝑣𝑖𝑑𝑒𝑛𝑑 𝑃𝑎𝑦𝑜𝑢𝑡 𝑅𝑎𝑡𝑖𝑜)
4.2.2.2 Cash Flow Management
Cash flow generation can either positive or negative in different periods depends on
the firm’s responses to the different economic situation. The net decrease/increase
cycle in cash and cash equivalent is a summary of the three activities transactions
(operating activities, investing activities, and financing activities). By consolidation
all these activities’ contribution, the reported net cash is what can be used in financing
these activities in the next period. For this reason, there is a requirement to control the
financial resources to obtain better results for the firm. Therefore, Table 6 presents the
selected variables, related to the Cash Flow Management, used in our dissertation.
Table 6: Cash Flow Management variables’ definitions
Indicator Code Definition
Cash
Conversion
Cycle
CCC
The Cash Conversion Cycle (CCC) is a combination of several activity
ratios involving accounts receivable, accounts payable and inventory
turnover. Thus, the CCC is a significant variable for all performance
measures; the shorter is the cash cycle, the better is the performance, and
consequently, the better the working capital is managed, the higher
profitability is expected. The CCC is calculated as:
𝐶𝐶𝐶
=(Inventories + accounts receivables − accounts payable) × 90
Sales
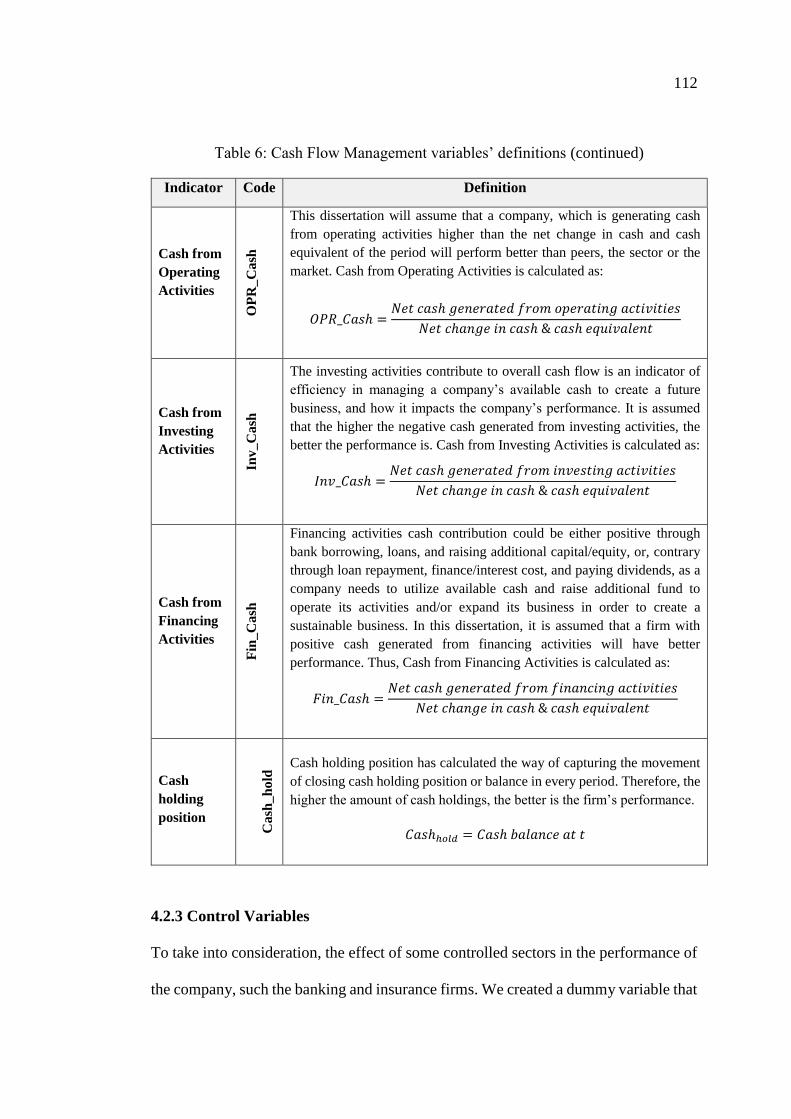
112
Table 6: Cash Flow Management variables’ definitions (continued)
Indicator
Code Definition
Cash from
Operating
Activities
OP
R_
Ca
sh
This dissertation will assume that a company, which is generating cash
from operating activities higher than the net change in cash and cash
equivalent of the period will perform better than peers, the sector or the
market. Cash from Operating Activities is calculated as:
𝑂𝑃𝑅_𝐶𝑎𝑠ℎ =𝑁𝑒𝑡 𝑐𝑎𝑠ℎ 𝑔𝑒𝑛𝑒𝑟𝑎𝑡𝑒𝑑 𝑓𝑟𝑜𝑚 𝑜𝑝𝑒𝑟𝑎𝑡𝑖𝑛𝑔 𝑎𝑐𝑡𝑖𝑣𝑖𝑡𝑖𝑒𝑠
𝑁𝑒𝑡 𝑐ℎ𝑎𝑛𝑔𝑒 𝑖𝑛 𝑐𝑎𝑠ℎ & 𝑐𝑎𝑠ℎ 𝑒𝑞𝑢𝑖𝑣𝑎𝑙𝑒𝑛𝑡
Cash from
Investing
Activities
Inv_C
ash
The investing activities contribute to overall cash flow is an indicator of
efficiency in managing a company’s available cash to create a future
business, and how it impacts the company’s performance. It is assumed
that the higher the negative cash generated from investing activities, the
better the performance is. Cash from Investing Activities is calculated as:
𝐼𝑛𝑣_𝐶𝑎𝑠ℎ =𝑁𝑒𝑡 𝑐𝑎𝑠ℎ 𝑔𝑒𝑛𝑒𝑟𝑎𝑡𝑒𝑑 𝑓𝑟𝑜𝑚 𝑖𝑛𝑣𝑒𝑠𝑡𝑖𝑛𝑔 𝑎𝑐𝑡𝑖𝑣𝑖𝑡𝑖𝑒𝑠
𝑁𝑒𝑡 𝑐ℎ𝑎𝑛𝑔𝑒 𝑖𝑛 𝑐𝑎𝑠ℎ & 𝑐𝑎𝑠ℎ 𝑒𝑞𝑢𝑖𝑣𝑎𝑙𝑒𝑛𝑡
Cash from
Financing
Activities
Fin
_C
ash
Financing activities cash contribution could be either positive through
bank borrowing, loans, and raising additional capital/equity, or, contrary
through loan repayment, finance/interest cost, and paying dividends, as a
company needs to utilize available cash and raise additional fund to
operate its activities and/or expand its business in order to create a
sustainable business. In this dissertation, it is assumed that a firm with
positive cash generated from financing activities will have better
performance. Thus, Cash from Financing Activities is calculated as:
𝐹𝑖𝑛_𝐶𝑎𝑠ℎ =𝑁𝑒𝑡 𝑐𝑎𝑠ℎ 𝑔𝑒𝑛𝑒𝑟𝑎𝑡𝑒𝑑 𝑓𝑟𝑜𝑚 𝑓𝑖𝑛𝑎𝑛𝑐𝑖𝑛𝑔 𝑎𝑐𝑡𝑖𝑣𝑖𝑡𝑖𝑒𝑠
𝑁𝑒𝑡 𝑐ℎ𝑎𝑛𝑔𝑒 𝑖𝑛 𝑐𝑎𝑠ℎ & 𝑐𝑎𝑠ℎ 𝑒𝑞𝑢𝑖𝑣𝑎𝑙𝑒𝑛𝑡
Cash
holding
position
Cash
_h
old
Cash holding position has calculated the way of capturing the movement
of closing cash holding position or balance in every period. Therefore, the
higher the amount of cash holdings, the better is the firm’s performance.
𝐶𝑎𝑠ℎℎ𝑜𝑙𝑑 = 𝐶𝑎𝑠ℎ 𝑏𝑎𝑙𝑎𝑛𝑐𝑒 𝑎𝑡 𝑡
4.2.3 Control Variables
To take into consideration, the effect of some controlled sectors in the performance of
the company, such the banking and insurance firms. We created a dummy variable that

113
takes the value 1 to indicate that the firm is a bank or an insurance company, and 0
otherwise. Finally, to perform all statistical tests and data analysis, we used, in this
dissertation, one of the most developed software (i.e. the econometric software
package - EViews). Therefore, the EViews 9.5 can deal efficiently with panel data and,
help in increasing the robustness of our model and the quality of our results.
4.3 Model Specifications
In this section, we examine the determinants of firm performance, by conducting
econometric methods for panel data analysis and diagnostic tests to make sure that the
underlying assumptions for a good model are fulfilled and depends on which is useful
for the collected data. Thus, our dynamic model specified in equation (1) below is
characterised by the presence of a lagged dependent variable among the other
explanatory variables. This empirical model could be expressed as follows:
𝑌𝑖𝑡 = ∝ +𝜆𝑌𝑖𝑡−1 + 𝛽𝑋𝑖𝑡 + 𝜏𝑖 + 휀𝑖𝑡 (1)
Where 𝑌𝑖𝑡 is the dependent variable of the firm i (the cross-sectional dimension), for
the period t (the time-series dimension) that could represent its financial performance,
as well as its market performance. Moreover, 𝑋𝑖𝑡 is the vector of explanatory variables
described above, capturing firm-specific characteristics, such as capital structure
variables or cash flow management indicators, where ∝ , 𝝀 and 𝛽 are coefficients,
while 𝝉𝒊 is unobserved firm-specific fixed effect and 𝜺𝒊𝒕 is error terms. Since the
variables may be endogenous, the estimation of this equation by Ordinary Least
Squares (OLS) could generate biased and inconsistent estimator.
To tackle the heteroscedasticity and autocorrelation problems, along with the
indigeneity problem of the lagged dependent variable, we use the Generalized Method

114
of Moments (GMM) estimation technique, which employs orthogonality moment
conditions to obtain valid instruments. GMM technique was developed by a Nobel
laureate in economics Hansen (2013), who proposed in 1982 GMM as the “method of
moments”, which was initially introduced by Pearson in 1894.
The primary intuition behind GMM is to establish the population moment conditions
and then to use their sample analogues to compute parameter estimates. More
specifically, we estimate our model using the System GMM estimator proposed by
Arellano and Bond (1991) and Blundell and Bond (1998) which combines, within a
system, the regression in levels and the regression in differences. For the regression in
levels, the instruments used are the lagged differences of the endogenous and
exogenous variables. The instruments for the regression in differences are lagged
levels of the endogenous and exogenous variables previous or equal to (t-2). Thus, to
eliminate the firm-specific effect that might cause the biases of estimators, we estimate
first-differences of our equation (2):
∆𝑌𝑖𝑡 = 𝜆∆𝑌𝑖𝑡−1 + 𝛽∆𝑋𝑖𝑡 + ∆휀𝑖𝑡 (2)
It should be noted that the validity of the System GMM estimator depends on two
fundamental assumptions. The error terms are not serially correlated, and the
instruments used in the regression in levels and differences are valid. To test both
hypotheses, we run two specification tests proposed by Arellano and Bond (1991) and
Arellano and Bover (1995).
The first test examines the null hypothesis that the differenced error term ∆𝜺𝒊𝒕 has no
second order serial autocorrelation, which means 𝐸(∆휀𝑖𝑡∆휀𝑖𝑡−2) = 0. The non-
rejection of the null hypothesis provides support to our model estimations. The second
is Sargan–Hansen test (J-Stat) of over-identifying restrictions, which tests the overall
115
validity of the instruments by analysing the sample of the moment conditions used in
the estimation procedure. The hypothesis tested is that the instrumental variables are
uncorrelated to some set of residuals, and therefore they are acceptable instruments.
Thus, our model specification is valid if we cannot reject the null hypothesis of over-
identifying restrictions.
Blundell and Bond (1998; 2000) show that the standard errors of the two-step system
GMM estimator are biased downward in finite samples. We tackle this problem by
employing a lower number of instruments than the number of sample firms to mitigate
the over-fitting problem of the endogenous variable and improve the efficiency of the
two-step estimator2. Finally, failure to reject the null hypotheses of both tests gives
support to our estimation procedure. In the next chapter, we estimate our proposed
model using the GMM procedure for our sample. The estimation tool is the
econometric software package EViews 9.5.
2 For more details, see Roodman (2009).
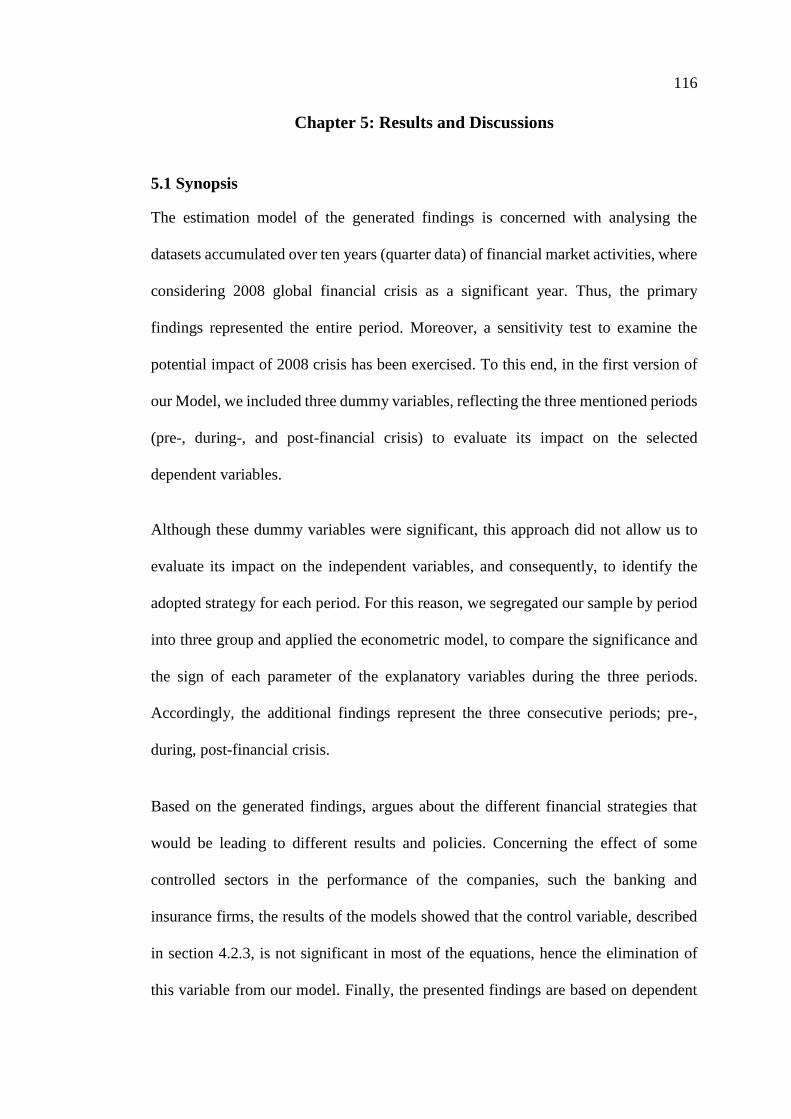
116
Chapter 5: Results and Discussions
5.1 Synopsis
The estimation model of the generated findings is concerned with analysing the
datasets accumulated over ten years (quarter data) of financial market activities, where
considering 2008 global financial crisis as a significant year. Thus, the primary
findings represented the entire period. Moreover, a sensitivity test to examine the
potential impact of 2008 crisis has been exercised. To this end, in the first version of
our Model, we included three dummy variables, reflecting the three mentioned periods
(pre-, during-, and post-financial crisis) to evaluate its impact on the selected
dependent variables.
Although these dummy variables were significant, this approach did not allow us to
evaluate its impact on the independent variables, and consequently, to identify the
adopted strategy for each period. For this reason, we segregated our sample by period
into three group and applied the econometric model, to compare the significance and
the sign of each parameter of the explanatory variables during the three periods.
Accordingly, the additional findings represent the three consecutive periods; pre-,
during, post-financial crisis.
Based on the generated findings, argues about the different financial strategies that
would be leading to different results and policies. Concerning the effect of some
controlled sectors in the performance of the companies, such the banking and
insurance firms, the results of the models showed that the control variable, described
in section 4.2.3, is not significant in most of the equations, hence the elimination of
this variable from our model. Finally, the presented findings are based on dependent

117
variables (performance measures) to illustrate the impact of the different financial
policies (independent variables) on performance measures (dependent variables).
5.2 Model Estimation
The package EViews 9.5 employed for estimating the proposed model, along using the
GMM procedure for target sample of 92 firms over the period 2006-2015 on a quarterly
basis. For each dependent variable, the model tries to explain the performance of these
firms by capital structure variables, after that, by cash flows management indicators.
The reason behind separating the explanatory variables according to the two groups is
that each of the financial strategies (capital structure & cash flow management) have
different characteristics, and consequently the decision-making strategies have
different approaches & parameters.
Moreover, a combination of all these variables in one model will lead to confusing
results, which are difficult to interpret. In fact, having one equation with many
variables will cause many statistical problems and will reduce the accuracy of the
results. That is why, we adopted in this study a reasonably parsimonious specification,
which means that the model should be the simplest with the least assumptions and
variables but at the same time with most considerable explanatory power.
5.2.1 Capital Structure Analysis (CSA)
Each dependent variable is modelled as a function of the six described capital structure
variables according to the following equations:
ROIit = δ0 + δ1ROIit−1+δ2Debtit + δ3Unrassetit+ δ4Sizeit + δ5Capexit +
δ6Govownit+ δ7SGit + ξit (1)
EPSit = β0 + β1EPSit−1+β2Debtit + β3Unrassetit+ β4Sizeit + β5Capexit +
β6Govownit+ β7SGit + Ωit (2)
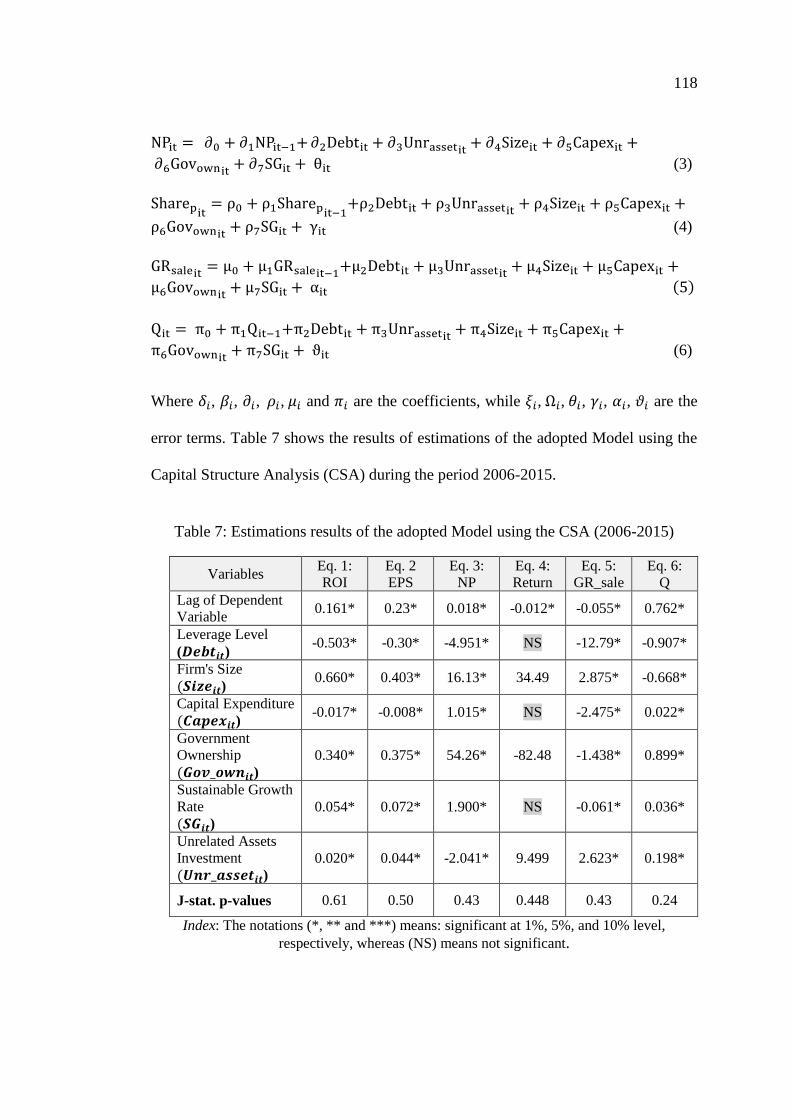
118
NPit = ∂0 + ∂1NPit−1+ ∂2Debtit + ∂3Unrassetit+ ∂4Sizeit + ∂5Capexit +
∂6Govownit+ ∂7SGit + θit (3)
Sharepit= ρ0 + ρ1Sharepit−1
+ρ2Debtit + ρ3Unrassetit+ ρ4Sizeit + ρ5Capexit +
ρ6Govownit+ ρ7SGit + γit (4)
GRsaleit= μ0 + μ1GRsaleit−1
+μ2Debtit + μ3Unrassetit+ μ4Sizeit + μ5Capexit +
μ6Govownit+ μ7SGit + αit (5)
Qit = π0 + π1Qit−1+π2Debtit + π3Unrassetit+ π4Sizeit + π5Capexit +
π6Govownit+ π7SGit + ϑit (6)
Where 𝛿𝑖, 𝛽𝑖, 𝜕𝑖, 𝜌𝑖, 𝜇𝑖 and 𝜋𝑖 are the coefficients, while 𝜉𝑖, Ω𝑖, 𝜃𝑖, 𝛾𝑖, 𝛼𝑖, 𝜗𝑖 are the
error terms. Table 7 shows the results of estimations of the adopted Model using the
Capital Structure Analysis (CSA) during the period 2006-2015.
Table 7: Estimations results of the adopted Model using the CSA (2006-2015)
Variables Eq. 1:
ROI
Eq. 2
EPS
Eq. 3:
NP
Eq. 4:
Return
Eq. 5:
GR_sale
Eq. 6:
Q
Lag of Dependent
Variable 0.161* 0.23* 0.018* -0.012* -0.055* 0.762*
Leverage Level
(𝑫𝒆𝒃𝒕𝒊𝒕) -0.503* -0.30* -4.951* NS -12.79* -0.907*
Firm's Size
(𝑺𝒊𝒛𝒆𝒊𝒕) 0.660* 0.403* 16.13* 34.49 2.875* -0.668*
Capital Expenditure
(𝑪𝒂𝒑𝒆𝒙𝒊𝒕) -0.017* -0.008* 1.015* NS -2.475* 0.022*
Government
Ownership
(𝑮𝒐𝒗_𝒐𝒘𝒏𝒊𝒕)
0.340* 0.375* 54.26* -82.48 -1.438* 0.899*
Sustainable Growth
Rate
(𝑺𝑮𝒊𝒕)
0.054* 0.072* 1.900* NS -0.061* 0.036*
Unrelated Assets
Investment
(𝑼𝒏𝒓_𝒂𝒔𝒔𝒆𝒕𝒊𝒕)
0.020* 0.044* -2.041* 9.499 2.623* 0.198*
J-stat. p-values 0.61 0.50 0.43 0.448 0.43 0.24
Index: The notations (*, ** and ***) means: significant at 1%, 5%, and 10% level,
respectively, whereas (NS) means not significant.
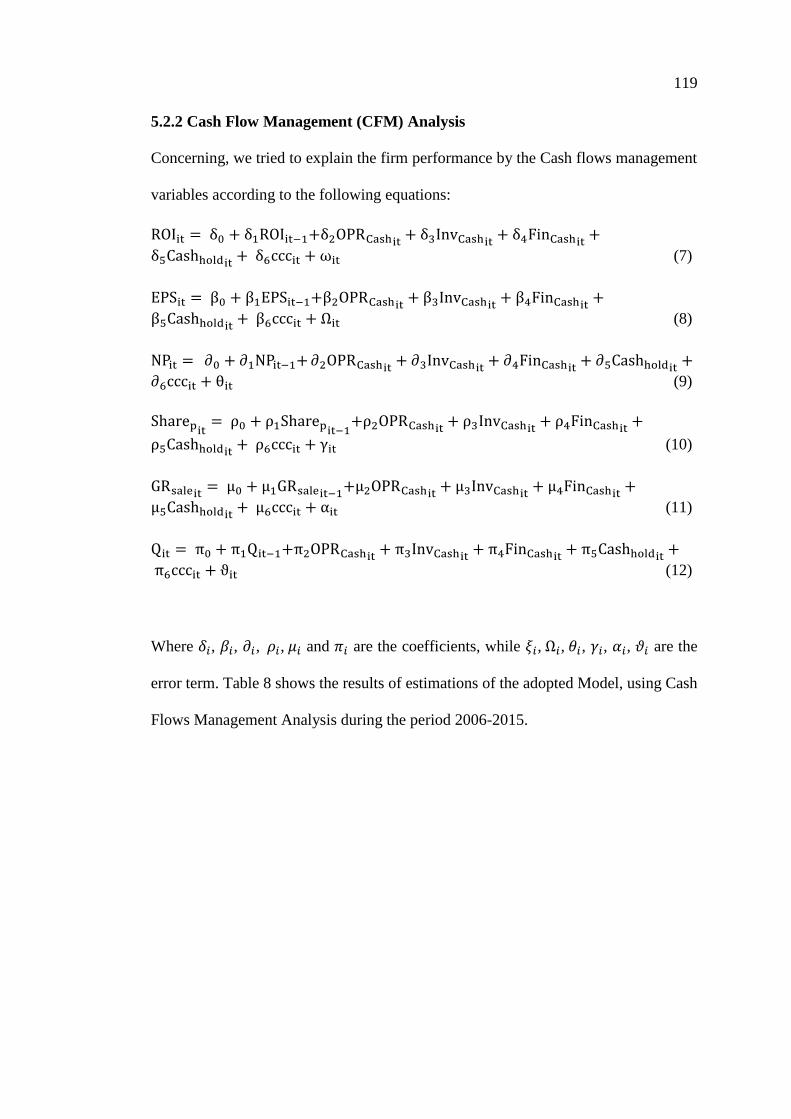
119
5.2.2 Cash Flow Management (CFM) Analysis
Concerning, we tried to explain the firm performance by the Cash flows management
variables according to the following equations:
ROIit = δ0 + δ1ROIit−1+δ2OPRCashit+ δ3InvCashit
+ δ4FinCashit+
δ5Cashholdit+ δ6cccit + ωit (7)
EPSit = β0 + β1EPSit−1+β2OPRCashit+ β3InvCashit
+ β4FinCashit+
β5Cashholdit+ β6cccit + Ωit (8)
NPit = ∂0 + ∂1NPit−1+ ∂2OPRCashit+ ∂3InvCashit
+ ∂4FinCashit+ ∂5Cashholdit
+
∂6cccit + θit (9)
Sharepit= ρ0 + ρ1Sharepit−1
+ρ2OPRCashit+ ρ3InvCashit
+ ρ4FinCashit+
ρ5Cashholdit+ ρ6cccit + γit (10)
GRsaleit= μ0 + μ1GRsaleit−1
+μ2OPRCashit+ μ3InvCashit
+ μ4FinCashit+
μ5Cashholdit+ μ6cccit + αit (11)
Qit = π0 + π1Qit−1+π2OPRCashit+ π3InvCashit
+ π4FinCashit+ π5Cashholdit
+
π6cccit + ϑit (12)
Where 𝛿𝑖, 𝛽𝑖, 𝜕𝑖, 𝜌𝑖, 𝜇𝑖 and 𝜋𝑖 are the coefficients, while 𝜉𝑖, Ω𝑖, 𝜃𝑖, 𝛾𝑖, 𝛼𝑖, 𝜗𝑖 are the
error term. Table 8 shows the results of estimations of the adopted Model, using Cash
Flows Management Analysis during the period 2006-2015.
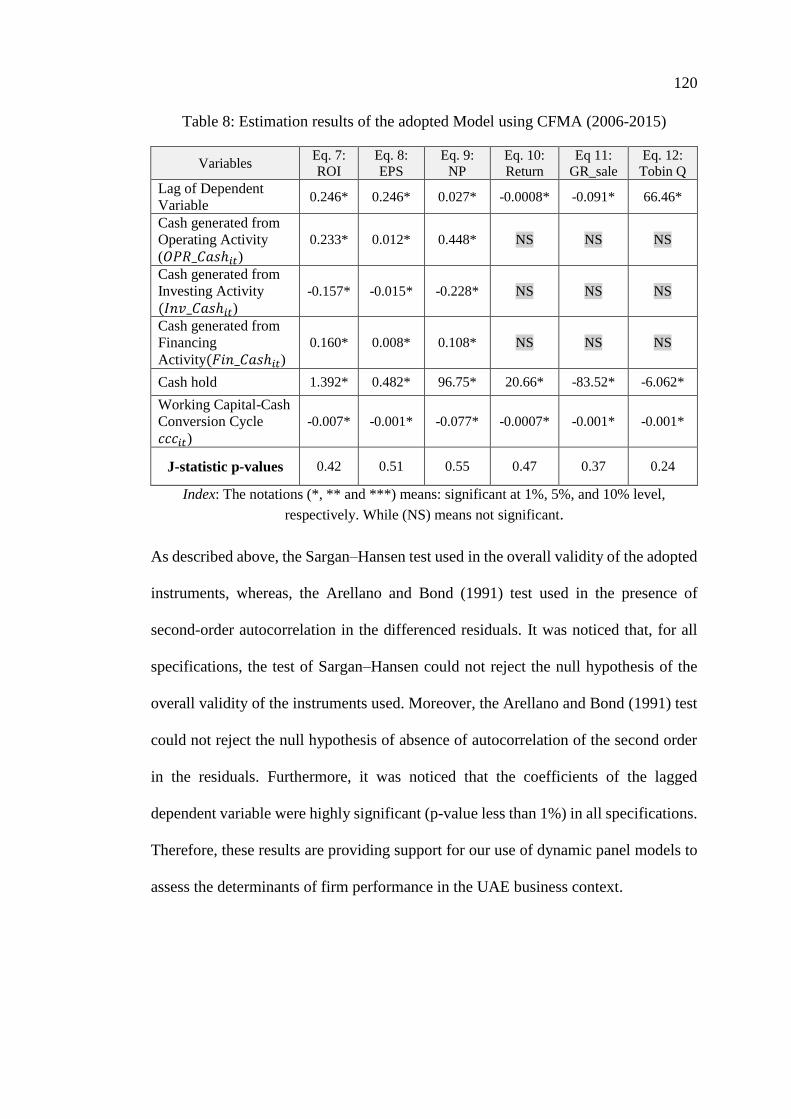
120
Table 8: Estimation results of the adopted Model using CFMA (2006-2015)
Variables Eq. 7:
ROI
Eq. 8:
EPS
Eq. 9:
NP
Eq. 10:
Return
Eq 11:
GR_sale
Eq. 12:
Tobin Q
Lag of Dependent
Variable 0.246* 0.246* 0.027* -0.0008* -0.091* 66.46*
Cash generated from
Operating Activity
(𝑂𝑃𝑅_𝐶𝑎𝑠ℎ𝑖𝑡)
0.233* 0.012* 0.448* NS NS NS
Cash generated from
Investing Activity
(𝐼𝑛𝑣_𝐶𝑎𝑠ℎ𝑖𝑡)
-0.157* -0.015* -0.228* NS NS NS
Cash generated from
Financing
Activity(𝐹𝑖𝑛_𝐶𝑎𝑠ℎ𝑖𝑡)
0.160* 0.008* 0.108* NS NS NS
Cash hold 1.392* 0.482* 96.75* 20.66* -83.52* -6.062*
Working Capital-Cash
Conversion Cycle
𝑐𝑐𝑐𝑖𝑡)
-0.007* -0.001* -0.077* -0.0007* -0.001* -0.001*
J-statistic p-values 0.42 0.51 0.55 0.47 0.37 0.24
Index: The notations (*, ** and ***) means: significant at 1%, 5%, and 10% level,
respectively. While (NS) means not significant.
As described above, the Sargan–Hansen test used in the overall validity of the adopted
instruments, whereas, the Arellano and Bond (1991) test used in the presence of
second-order autocorrelation in the differenced residuals. It was noticed that, for all
specifications, the test of Sargan–Hansen could not reject the null hypothesis of the
overall validity of the instruments used. Moreover, the Arellano and Bond (1991) test
could not reject the null hypothesis of absence of autocorrelation of the second order
in the residuals. Furthermore, it was noticed that the coefficients of the lagged
dependent variable were highly significant (p-value less than 1%) in all specifications.
Therefore, these results are providing support for our use of dynamic panel models to
assess the determinants of firm performance in the UAE business context.

121
5.3 Empirical Results
5.3.1 Capital Structure and Firm Performance
Applying the developed Equation (1) on page 111, 𝑌𝑖𝑡 is any of the six dependent
variables (performance measures) we are examining in this dissertation. The
dependent variables are: Return-on-Investment (ROI), Net Profit (NP), Growth-in-
Sales (GR_Sales), Earnings Per Share (EPS), Return of the Share Price (Return), and
Tobin’s Q (Q), while 𝑋𝑖𝑡 is an independent variable.
5.3.1.1 Return-On-Investment (ROI)
Out of the six proposed hypotheses, only one hypothesis (Capital Expenditure) was
rejected; the rest were supported. Table 9 shows results of the estimation of the ROI
Equation1 throughout entire period (2006-2015) of the investigation.
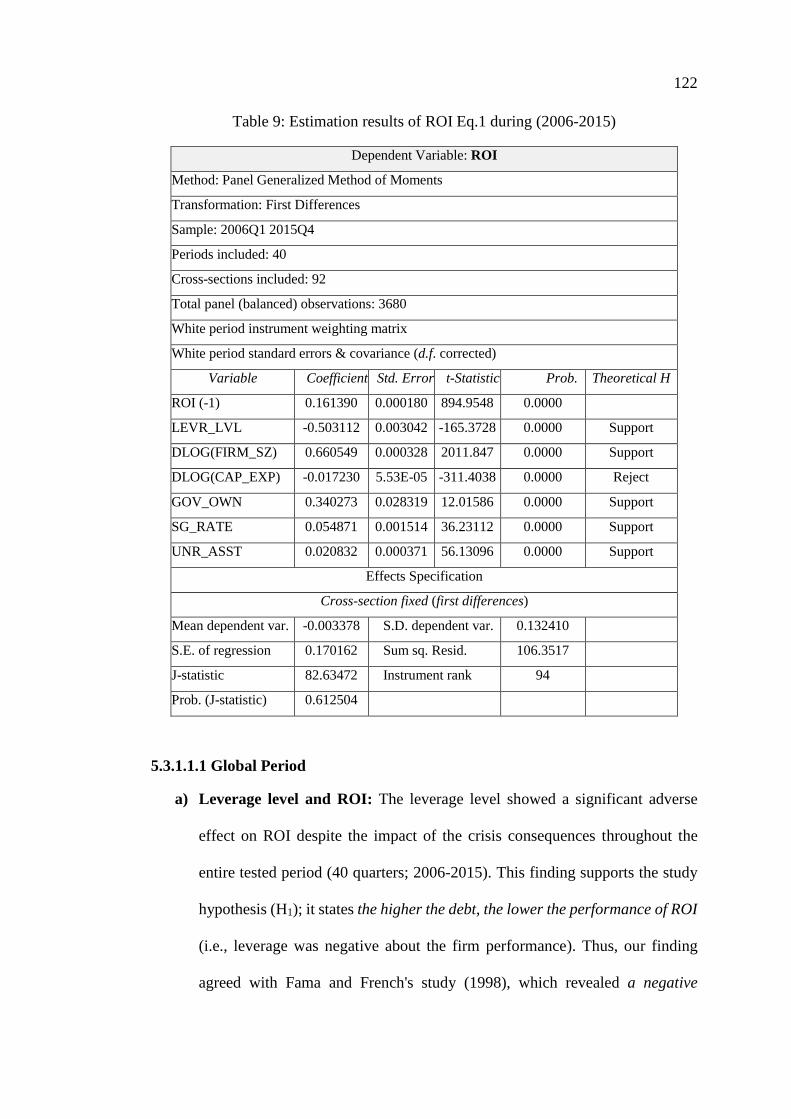
122
Table 9: Estimation results of ROI Eq.1 during (2006-2015)
Dependent Variable: ROI
Method: Panel Generalized Method of Moments
Transformation: First Differences
Sample: 2006Q1 2015Q4
Periods included: 40
Cross-sections included: 92
Total panel (balanced) observations: 3680
White period instrument weighting matrix
White period standard errors & covariance (d.f. corrected)
Variable Coefficient Std. Error t-Statistic Prob. Theoretical H
ROI (-1) 0.161390 0.000180 894.9548 0.0000
LEVR_LVL -0.503112 0.003042 -165.3728 0.0000 Support
DLOG(FIRM_SZ) 0.660549 0.000328 2011.847 0.0000 Support
DLOG(CAP_EXP) -0.017230 5.53E-05 -311.4038 0.0000 Reject
GOV_OWN 0.340273 0.028319 12.01586 0.0000 Support
SG_RATE 0.054871 0.001514 36.23112 0.0000 Support
UNR_ASST 0.020832 0.000371 56.13096 0.0000 Support
Effects Specification
Cross-section fixed (first differences)
Mean dependent var. -0.003378 S.D. dependent var. 0.132410
S.E. of regression 0.170162 Sum sq. Resid. 106.3517
J-statistic 82.63472 Instrument rank 94
Prob. (J-statistic) 0.612504
5.3.1.1.1 Global Period
a) Leverage level and ROI: The leverage level showed a significant adverse
effect on ROI despite the impact of the crisis consequences throughout the
entire tested period (40 quarters; 2006-2015). This finding supports the study
hypothesis (H1); it states the higher the debt, the lower the performance of ROI
(i.e., leverage was negative about the firm performance). Thus, our finding
agreed with Fama and French's study (1998), which revealed a negative

123
relationship between debt and performance (i.e., firm’s value). Thus, the firm
with a higher level of leverage could associate with weak financial
performance, but this relation would be reciprocal for the firm with a sizeable
debt-to-asset ratio.
b) Firm Size and ROI: Firm size showed a consistent and significant positive
effect on ROI despite the impact of the crisis consequences throughout the
entire tested period (40 quarters; 2006-2015). This finding supports the
hypothesis (H2); it states the bigger the company, the better the performance
of ROI. The studies pre-1980s gave evidence of no existing relationship; others
have found a positive correlation (e.g., Mansfield, 1962; Utton, 1971; Singh
and Whittington, 1975). A positive relationship between profitability and
number of employees (firm size) and performance reported by many works
(e.g., Robson & Bennett, 2000; Asimakopoulos et al., 2009). Thus, the finding
of the hypothesis (H2) is in good agreement with this assumption “A firm’s size
is a key determinant of corporate performance”.
c) Capital Expenditure and ROI: The capital expenditure showed the
significant and adverse effect on ROI throughout the entire tested period (40
quarters; 2006-2015). This finding rejects the hypothesis (H3); it states the
higher the capital expenditure, the lower the performance of ROI. This
rejection is yielded because the capital expenditure is a sort of expenses used
to purchase more assets to generate additional income (Johnson & Soenen,
2003; Höbarth, 2006). The findings reject this empirical study assumption the
higher the capital expenditure, the higher the income will be the better the
performance (i.e., the higher capital expenditure, the lesser profits/cash flow).
124
d) Government Ownership and ROI: The analysis of the datasets that covered
the entire tested period (40 quarters; 2006-2015) showed that the impact of
government ownership on ROI was significant and favourable to support the
hypothesis (H4); it says the higher the government ownership, the better the
performance (ROI). The government ownership often provides exceptional
support and protection to government-owned firms through efficient control of
their expenses (Ang & Ding, 2006; Aljifri & Moustafa, 2007). The variable’s
findings confirmed the government ownership provides exceptional support
and impact the firm’s performance positively on different economic conditions.
e) Sustainable Growth Rate (SGR) and ROI: The analysis of obtained data of
the entire tested crisis period (40 quarters; 2006-2015) revealed that the impact
of sustainable growth rate on ROI was significant and positive to support our
hypothesis (H5); it says the higher the sustainable growth rate, the better the
performance (ROI). SGR defines how much a firm could grow with self-
funding. Moreover, some studies (Johnson & Soenen, 2003; Höbarth,
2006; Serrasqueiro et al., 2009; Çoban, 2014) reported a directional interaction
between firm growth and profitability to support our gained findings the
sustainable growth rate is a critical indicator for successful business firms.
f) Unrelated Assets and ROI: Unrelated assets showed the consistent positive
impact on ROI throughout the entire tested period (40 quarters; 2006-2015).
This finding supports hypothesis (H6) “The higher the investment in unrelated
assets, the better the performance of ROI”. The unrelated assets may represent
such attractive business as financial assets, properties, and joint venture, which
might be enhanced though business diversity stratgey (Barney, 1991; Peteraf,
1992).

125
5.3.1.1.2 Under Different Economic Conditions
Assumption: Different financial strategies would be leading to different results under
different economic conditions. Table 10 illustrates the findings of the examined
relationships between the variant financial strategies (independent variables) and the
firm performance (ROI as a proxy for the firm performance).
Table 10: Estimation results of the ROI Eq.1 under different periods
Variables Pre-crisis
(Q1 05 – Q2 08)
Crisis
(Q3 08 – Q4 12)
Post-crisis
(Q1 13 – Q4 15)
Lag of Dependent Variable 0.056* 0.069* 0.092*
Leverage Level (𝑫𝒆𝒃𝒕𝒊𝒕) -0.567* -0.197* -0.262*
Firm's Size (𝑺𝒊𝒛𝒆𝒊𝒕) 0.350* 0.306* 0.495*
Capital Expenditure (𝑪𝒂𝒑𝒆𝒙𝒊𝒕) 0.038* -0.045* -0.013*
Government Ownership
(𝑮𝒐𝒗_𝒐𝒘𝒏𝒊𝒕) 1.412* 1.610* -0.155*
Sustainable Growth Rate (𝑺𝑮𝒊𝒕) 1.997* 0.799* 0.037*
Unrelated Assets Investment
(𝑼𝒏𝒓_𝒂𝒔𝒔𝒆𝒕𝒊𝒕) -0.214* 0.075* 0.029*
J-statistic; P-values 0.27 0.40 0.46
The notations (*, ** and ***) means: significant at 1%, 5%, and 10% level, respectively, while
(NS) means not significant.
The test of the global period (40 periods; 2006-2015) showed significant relationships
among the six test variables to support five proposed hypotheses and rejected one.
When segregating the global period in three different economic stages, different results
were found in various phases of the financial crisis as follows:
1) Pre-crisis: All tested variables have a significant relationship with the ROI;
five supported proposed hypotheses; the unrelated assets rejected ROI.
2) During-crisis: All tested variables showed a significant relations with the ROI;
five supported the proposed hypotheses; capital expenditure showed rejection.
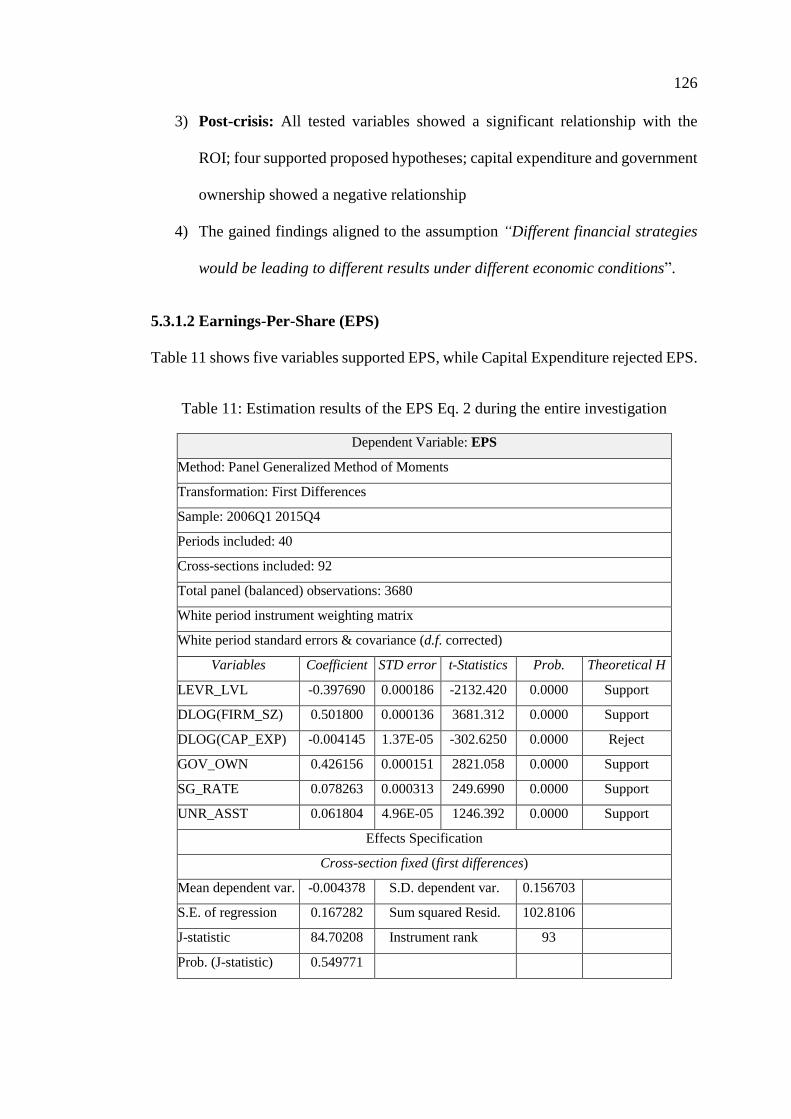
126
3) Post-crisis: All tested variables showed a significant relationship with the
ROI; four supported proposed hypotheses; capital expenditure and government
ownership showed a negative relationship
4) The gained findings aligned to the assumption “Different financial strategies
would be leading to different results under different economic conditions”.
5.3.1.2 Earnings-Per-Share (EPS)
Table 11 shows five variables supported EPS, while Capital Expenditure rejected EPS.
Table 11: Estimation results of the EPS Eq. 2 during the entire investigation
Dependent Variable: EPS
Method: Panel Generalized Method of Moments
Transformation: First Differences
Sample: 2006Q1 2015Q4
Periods included: 40
Cross-sections included: 92
Total panel (balanced) observations: 3680
White period instrument weighting matrix
White period standard errors & covariance (d.f. corrected)
Variables Coefficient STD error t-Statistics Prob. Theoretical H
LEVR_LVL -0.397690 0.000186 -2132.420 0.0000 Support
DLOG(FIRM_SZ) 0.501800 0.000136 3681.312 0.0000 Support
DLOG(CAP_EXP) -0.004145 1.37E-05 -302.6250 0.0000 Reject
GOV_OWN 0.426156 0.000151 2821.058 0.0000 Support
SG_RATE 0.078263 0.000313 249.6990 0.0000 Support
UNR_ASST 0.061804 4.96E-05 1246.392 0.0000 Support
Effects Specification
Cross-section fixed (first differences)
Mean dependent var. -0.004378 S.D. dependent var. 0.156703
S.E. of regression 0.167282 Sum squared Resid. 102.8106
J-statistic 84.70208 Instrument rank 93
Prob. (J-statistic) 0.549771

127
5.3.1.2.1 Global Period
a) Leverage level and EPS: Over the entire tested period (40 quarters; 2006-
2015), the leverage level shows the significant adverse effect on EPS to support
the hypothesis (H1); it states the higher the debt, the lower the performance
(EPS). The gained finding agreed with the Fama and French’s study (1998),
which says there is an adverse relationship between debt and firm
performance. Thus, the more levered a firm, the more likely the firm would not
be able to fulfil its contractual commitments, where a massive debt could
be leading to a higher probability of bankruptcy and financial recession (i.e.,
weak financial performance).
b) Firm Size and EPS: Over the entire tested period (40 quarters; 2006-2015),
the firm size showed the consistent positive effect on EPS, despite the impact
of the crisis consequences. This finding supported the hypothesis (H2); it says
the bigger the company, the better the performance. Many studies showed
mixed evidence regarding the relationship between firm size and growth as
negative (e.g., Mansfield, 1962; Utton, 1971; Singh & Whittington, 1975), or
positive (Robson & Bennett, 2000; Asimakopoulos et al., 2009). The gained
findings agreed on “A firm’s size is a key element of corporate performance”.
c) Capital Expenditure and EPS: Over the entire tested period (40 quarters;
2006-2015), the capital expenditure showed the significant and negative
impact on EPS. Therefore, the hypothesis (H3) is not in agreement with the
assumption the higher the capital expenditure, the lower the performance
(EPS). Johnson and Soenen (2003) and Höbarth (2006) had used ROI as a
performance measure to assess how assets to generate income. In contrast, this
finding rejects the assumption; the higher the capital expenditure, the higher
128
the income will be, and the better the performance is, where the short-term
capital expenditure led to lesser profits and cash flow when a firm spends the
money. In the long-term, it is expected to have a positive relationship.
d) Government Ownership and EPS: Over the entire tested period (40 quarters;
2006-2015), the government ownership showed the significant and positive
impact on EPS to support the hypothesis (H4); it says the higher the
Government Ownership, the better the performance (EPS). The government
ownership could add value to firms by providing variant support and protection
for controlling its expenses. Referring to the works of Ang and Ding (2006)
and Aljifri and Moustafa (2007), our findings confirm that government
ownership provides exceptional support to the firm’s performance, even, under
different economic conditions to consider as a critical factor for these firms.
e) Sustainable Growth Rate (SGR) and EPS: The data cover the entire tested
period (40 quarters; 2006-2015) revealed that the SGR impacts significantly
and positively on EPS, despite crisis consequences, to support the hypothesis
(H5); it says the higher the sustainable growth rate, the better the performance
(EPS). The SGR is to what extent a firm can grow at maximum rate with self-
funding. Some studies (e.g., Serrasqueiro et al., 2009; Çoban, 2014) revealed a
positive correlation between the firm growth and business profitability to
support SGR variable; it says SGR is a critical indicator for business firms.
f) Unrelated Assets and EPS: The data covered entire tested period (40 quarters;
2006-2015) showed that the unrelated assets had a consistently positive impact
on EPS to support the hypothesis (H6) the higher the investment in unrelated
assets the better the performance (EPS). In today’s global business diversity,
many firms are interested in investing in different businesses as a strategy to
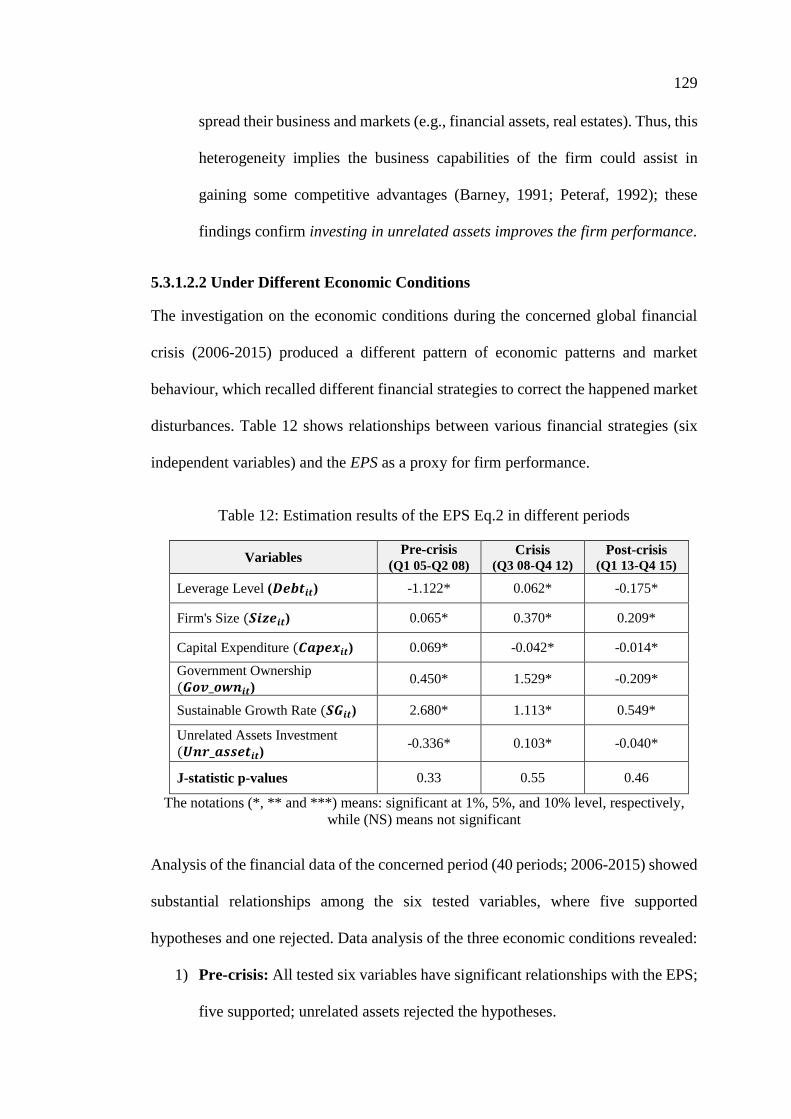
129
spread their business and markets (e.g., financial assets, real estates). Thus, this
heterogeneity implies the business capabilities of the firm could assist in
gaining some competitive advantages (Barney, 1991; Peteraf, 1992); these
findings confirm investing in unrelated assets improves the firm performance.
5.3.1.2.2 Under Different Economic Conditions
The investigation on the economic conditions during the concerned global financial
crisis (2006-2015) produced a different pattern of economic patterns and market
behaviour, which recalled different financial strategies to correct the happened market
disturbances. Table 12 shows relationships between various financial strategies (six
independent variables) and the EPS as a proxy for firm performance.
Table 12: Estimation results of the EPS Eq.2 in different periods
Variables Pre-crisis
(Q1 05-Q2 08) Crisis
(Q3 08-Q4 12)
Post-crisis (Q1 13-Q4 15)
Leverage Level (𝑫𝒆𝒃𝒕𝒊𝒕) -1.122* 0.062* -0.175*
Firm's Size (𝑺𝒊𝒛𝒆𝒊𝒕) 0.065* 0.370* 0.209*
Capital Expenditure (𝑪𝒂𝒑𝒆𝒙𝒊𝒕) 0.069* -0.042* -0.014*
Government Ownership
(𝑮𝒐𝒗_𝒐𝒘𝒏𝒊𝒕) 0.450* 1.529* -0.209*
Sustainable Growth Rate (𝑺𝑮𝒊𝒕) 2.680* 1.113* 0.549*
Unrelated Assets Investment
(𝑼𝒏𝒓_𝒂𝒔𝒔𝒆𝒕𝒊𝒕) -0.336* 0.103* -0.040*
J-statistic p-values 0.33 0.55 0.46
The notations (*, ** and ***) means: significant at 1%, 5%, and 10% level, respectively,
while (NS) means not significant
Analysis of the financial data of the concerned period (40 periods; 2006-2015) showed
substantial relationships among the six tested variables, where five supported
hypotheses and one rejected. Data analysis of the three economic conditions revealed:
1) Pre-crisis: All tested six variables have significant relationships with the EPS;
five supported; unrelated assets rejected the hypotheses.
130
2) In crisis: All tested variables have an essential relationship with the EPS; five
supported; capital expenditure rejected the hypotheses.
3) Post-crisis: All tested variables had particular relations with the EPS; three
supported; capital expenditure, government ownership, and unrelated assets
rejected the hypotheses.
4) The gained findings aligned to the assumption: Different financial strategies
would be leading to different results under different economic conditions].
5.3.1.3 Net Profit (NP)
Table 13 showed five hypotheses were accepted, and unrelated assets rejected the NP.
Table 13: Estimation results of the NP Eq.3 in the whole studied period
Dependent Variable: NP
Method: Panel Generalized Method of Moments
Transformation: First Differences
Sample: 2006Q1 2015Q4
Periods included: 40
Cross-sections included: 92
Total panel (balanced) observations: 3680
White period instrument weighting matrix
White period standard errors & covariance (d.f. corrected)
Variable Coefficient Std. Error t-Statistic Prob. Theoretical H
LEVR_LVL -4.787723 0.013017 -367.8128 0.0000 Support
DLOG(FIRM_SZ) 16.37080 0.010279 1592.674 0.0000 Support
DLOG(CAP_EXP) 1.017246 0.001990 511.2977 0.0000 Support
GOV_OWN 54.55749 0.315586 172.8766 0.0000 Support
SG_RATE 1.920242 0.016049 119.6496 0.0000 Support
UNR_ASST -2.084632 0.001960 -1063.858 0.0000 Reject
Effects Specification
Cross-section fixed (first differences)
Mean dependent var. 0.003761 S.D. dependent var. 10.12985
S.E. of regression 10.51080 Sum squared Resid. 405892.4
J-statistic 86.54552 Instrument rank 92
Prob. (J-statistic) 0.463213
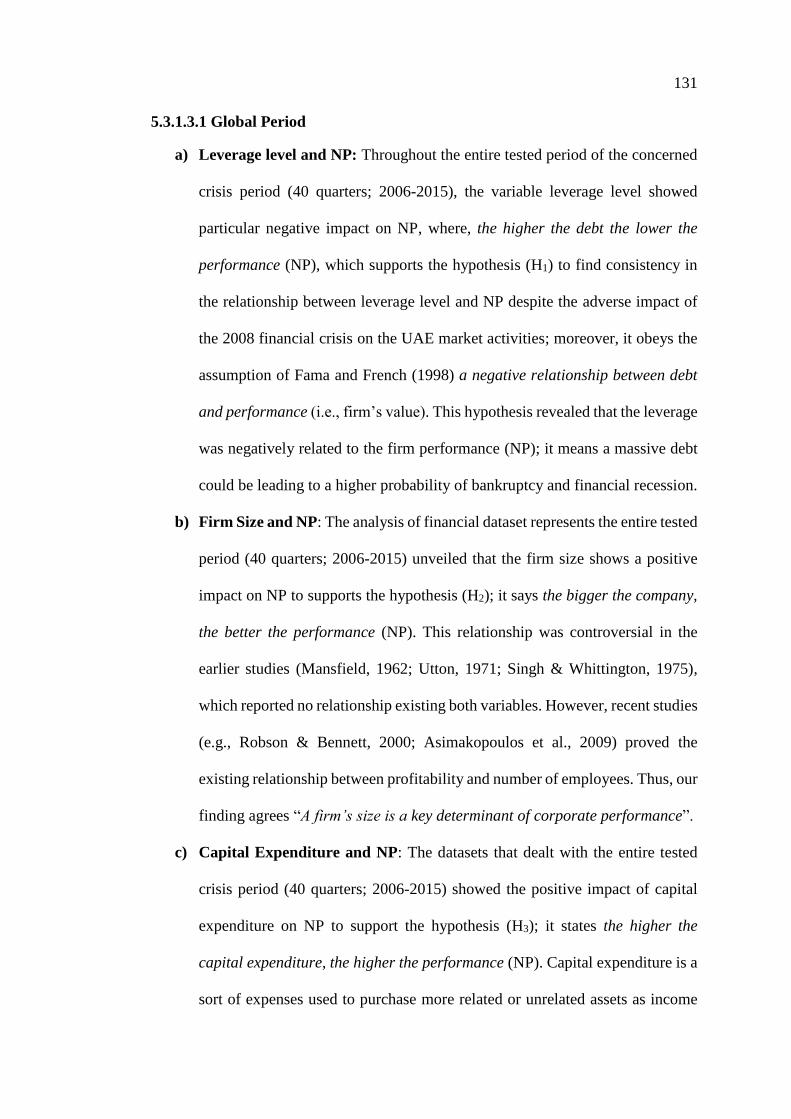
131
5.3.1.3.1 Global Period
a) Leverage level and NP: Throughout the entire tested period of the concerned
crisis period (40 quarters; 2006-2015), the variable leverage level showed
particular negative impact on NP, where, the higher the debt the lower the
performance (NP), which supports the hypothesis (H1) to find consistency in
the relationship between leverage level and NP despite the adverse impact of
the 2008 financial crisis on the UAE market activities; moreover, it obeys the
assumption of Fama and French (1998) a negative relationship between debt
and performance (i.e., firm’s value). This hypothesis revealed that the leverage
was negatively related to the firm performance (NP); it means a massive debt
could be leading to a higher probability of bankruptcy and financial recession.
b) Firm Size and NP: The analysis of financial dataset represents the entire tested
period (40 quarters; 2006-2015) unveiled that the firm size shows a positive
impact on NP to supports the hypothesis (H2); it says the bigger the company,
the better the performance (NP). This relationship was controversial in the
earlier studies (Mansfield, 1962; Utton, 1971; Singh & Whittington, 1975),
which reported no relationship existing both variables. However, recent studies
(e.g., Robson & Bennett, 2000; Asimakopoulos et al., 2009) proved the
existing relationship between profitability and number of employees. Thus, our
finding agrees “A firm’s size is a key determinant of corporate performance”.
c) Capital Expenditure and NP: The datasets that dealt with the entire tested
crisis period (40 quarters; 2006-2015) showed the positive impact of capital
expenditure on NP to support the hypothesis (H3); it states the higher the
capital expenditure, the higher the performance (NP). Capital expenditure is a
sort of expenses used to purchase more related or unrelated assets as income

132
resources (Johnson & Soenen, 2003; Höbarth, 2006), which confirms our
assumption the higher the capital expenditure, the higher the income will be,
and the better the performance.
d) Government Ownership and NP: The gained datasets concerned with the
entire tested period (40 quarters; 2006-2015) showed that the government
ownership, as an added value to firms, had a significant and positive impact on
the NP to support the hypothesis (H4); it says the higher the government
ownership, the better the performance (NP). In other words, the government-
owned firms operate more efficiently by controlling their expenses (Ang &
Ding, 2006; Aljifri & Moustafa, 2007). The finding of the hypothesis (H4)
confirmed that government ownership gives exceptional support to impact on
the firm’s performance positively even in different economic conditions; thus,
the government ownership is a crucial success factor for these firms.
e) Sustainable Growth Rate (SGR) and NP: SGR defines how much a firm can
grow with self-funding. The entire tested period (40 quarters; 2006-2015)
showed the significant and positive effect of sustainable growth rate shows on
NP to support the hypothesis (H5); it says the higher the sustainable growth
rate, the better the performance (NP). Moreover, some studies (e.g., Johnson
& Soenen, 2003; Serrasqueiro et al., 2009; Çoban, 2014) found a direct
relationship between the firm growth and profitability, which supported our
assumption “sustainable growth rate is a critical indicator for business firms”.
f) Unrelated Assets and NP: The global business furnishes interesting
opportunities for the firms to invest in unrelated assets (e.g., financial assets,
properties, investments in other enterprises and joint venture) as a business
strategy. The review of the entire tested period (40 quarters; 2006-2015)
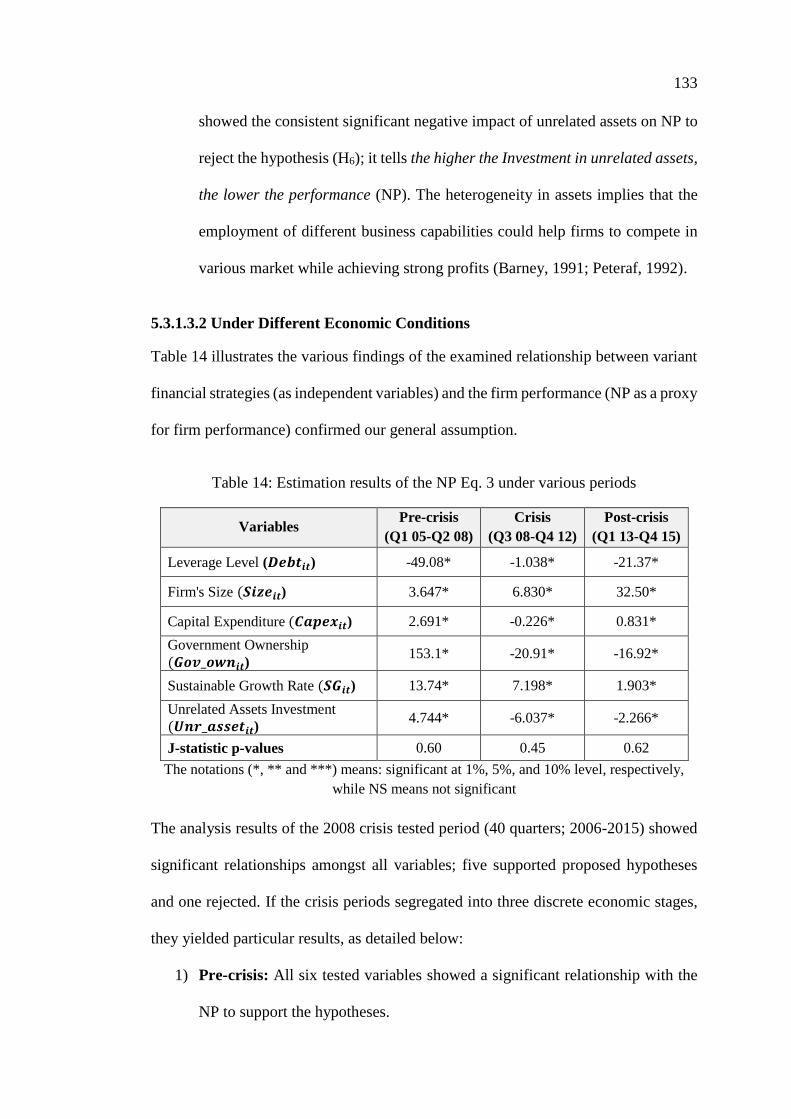
133
showed the consistent significant negative impact of unrelated assets on NP to
reject the hypothesis (H6); it tells the higher the Investment in unrelated assets,
the lower the performance (NP). The heterogeneity in assets implies that the
employment of different business capabilities could help firms to compete in
various market while achieving strong profits (Barney, 1991; Peteraf, 1992).
5.3.1.3.2 Under Different Economic Conditions
Table 14 illustrates the various findings of the examined relationship between variant
financial strategies (as independent variables) and the firm performance (NP as a proxy
for firm performance) confirmed our general assumption.
Table 14: Estimation results of the NP Eq. 3 under various periods
Variables Pre-crisis
(Q1 05-Q2 08)
Crisis
(Q3 08-Q4 12)
Post-crisis
(Q1 13-Q4 15)
Leverage Level (𝑫𝒆𝒃𝒕𝒊𝒕) -49.08* -1.038* -21.37*
Firm's Size (𝑺𝒊𝒛𝒆𝒊𝒕) 3.647* 6.830* 32.50*
Capital Expenditure (𝑪𝒂𝒑𝒆𝒙𝒊𝒕) 2.691* -0.226* 0.831*
Government Ownership
(𝑮𝒐𝒗_𝒐𝒘𝒏𝒊𝒕) 153.1* -20.91* -16.92*
Sustainable Growth Rate (𝑺𝑮𝒊𝒕) 13.74* 7.198* 1.903*
Unrelated Assets Investment
(𝑼𝒏𝒓_𝒂𝒔𝒔𝒆𝒕𝒊𝒕) 4.744* -6.037* -2.266*
J-statistic p-values 0.60 0.45 0.62
The notations (*, ** and ***) means: significant at 1%, 5%, and 10% level, respectively,
while NS means not significant
The analysis results of the 2008 crisis tested period (40 quarters; 2006-2015) showed
significant relationships amongst all variables; five supported proposed hypotheses
and one rejected. If the crisis periods segregated into three discrete economic stages,
they yielded particular results, as detailed below:
1) Pre-crisis: All six tested variables showed a significant relationship with the
NP to support the hypotheses.
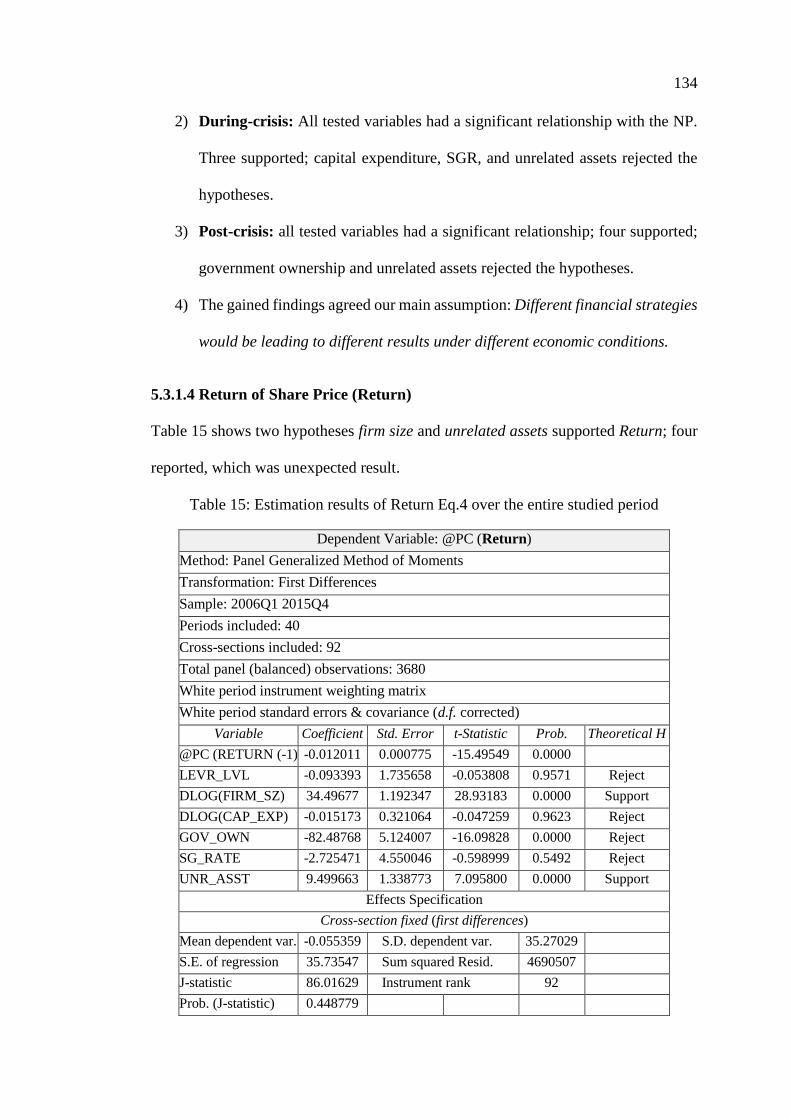
134
2) During-crisis: All tested variables had a significant relationship with the NP.
Three supported; capital expenditure, SGR, and unrelated assets rejected the
hypotheses.
3) Post-crisis: all tested variables had a significant relationship; four supported;
government ownership and unrelated assets rejected the hypotheses.
4) The gained findings agreed our main assumption: Different financial strategies
would be leading to different results under different economic conditions.
5.3.1.4 Return of Share Price (Return)
Table 15 shows two hypotheses firm size and unrelated assets supported Return; four
reported, which was unexpected result.
Table 15: Estimation results of Return Eq.4 over the entire studied period
Dependent Variable: @PC (Return)
Method: Panel Generalized Method of Moments
Transformation: First Differences
Sample: 2006Q1 2015Q4
Periods included: 40
Cross-sections included: 92
Total panel (balanced) observations: 3680
White period instrument weighting matrix
White period standard errors & covariance (d.f. corrected)
Variable Coefficient Std. Error t-Statistic Prob. Theoretical H
@PC (RETURN (-1) -0.012011 0.000775 -15.49549 0.0000
LEVR_LVL -0.093393 1.735658 -0.053808 0.9571 Reject
DLOG(FIRM_SZ) 34.49677 1.192347 28.93183 0.0000 Support
DLOG(CAP_EXP) -0.015173 0.321064 -0.047259 0.9623 Reject
GOV_OWN -82.48768 5.124007 -16.09828 0.0000 Reject
SG_RATE -2.725471 4.550046 -0.598999 0.5492 Reject
UNR_ASST 9.499663 1.338773 7.095800 0.0000 Support
Effects Specification
Cross-section fixed (first differences)
Mean dependent var. -0.055359 S.D. dependent var. 35.27029
S.E. of regression 35.73547 Sum squared Resid. 4690507
J-statistic 86.01629 Instrument rank 92
Prob. (J-statistic) 0.448779

135
5.3.1.4.1 Global Period
a) Leverage level and Return: The data concerned with the entire tested period
(40 quarters; 2006-2015) showed that leverage level did not impact
significantly on the Return to reject the hypothesis (H1): “The higher the debt,
the lower the performance (Return)”. This finding contradicts the finding of
Fama and French (1998) who reported a negative relationship between
leverage and firm’s performance (i.e., firm’s value). This study revealed that
“the leverage level does not affect the firm performance over long-term”.
b) Firm Size and Return: Over the entire tested period (40 quarters; 2006-2015),
the data showed that the firm size had a consistent significant and positive
impact on Return, despite the impact of the crisis consequences to supports our
hypothesis (H2): The bigger the company, the better the firm performance
(Return)”. The relationship between the firm’s size and the return of the share
price was debated across many financial studies. Some earlier studies gave no
evidence of such existing relationship (e.g., Mansfield, 1962; Utton, 1971;
Singh & Whittington, 1975). Recent key studies reported a positive
relationship existed between profitability and number of employees as firm
size (e.g., Robson & Bennett, 2000; Asimakopoulos et al., 2009). Nevertheless,
this study showed a positive firm’s size-performance relationship to fit the
hypothesis “A firm’s size is a key determinant of corporate performance”.
c) Capital Expenditure and Return: The data analysis of entire tested period
(40 quarters; 2006-2015) revealed that the capital expenditure showed an
insignificant relationship with Return to reject the hypothesis (H3) “the higher
the capital expenditure, the lower the performance (Return)”. Capital
expenditure is a sort of expenses used to spread the firm’s assets that would
136
increase its income. Thus, the ROA used as a performance measure to assess
how acquired assets could generate additional incomes (Johnson & Soenen,
2003; Höbarth, 2006). However, this study rejects this assumption “The higher
the capital expenditure, the higher the income would be, so, the better the
performance is”.
d) Government Ownership and Return: The data dealing with the entire tested
period (40 quarters; 2006-2015) indicated that the government ownership
showed the significant adverse impact on Return to rejects the hypothesis (H4)
“The higher the Government Ownership, the better the performance (Return)”.
Government ownership often adds capability value to enable firms to operate
more efficiently by controlling their expenses and government protection.
Some studies reported a positive relationship between government-ownership
and the return of the share price (e.g., Ang & Ding, 2006; Aljifri & Moustafa,
2007). In contrast, this study found that government ownership has a negative
impact on the firm’s performance (Return).
e) Sustainable Growth Rate (SGR) and Return: The SGR showed an
insignificant relationship with Return over the entire tested period (40 quarters;
2006-2015), despite the crisis consequences, to reject the hypothesis (H5) “The
higher the sustainable growth rate, the better the performance (RETURN)”.
SGR defines how much a firm could grow with self-funding regarding the
positive connection between the firm growth and profitability (Serrasqueiro et
al., 2009; Çoban, 2014). However, the produced results from this study
revealed that the SGR does not affect the firm’s performance (Return), which
contradict some literature that reported a positive relation (e.g., Johnson &
Soenen, 2003; Höbarth, 2006; Serrasqueiro et al., 2009; Çoban, 2014).

137
f) Unrelated Assets and Return: The data related to the entire tested period (40
quarters; 2006-2015) showed that unrelated assets showed the consistent
positive impact on Return to support the hypothesis (H6) “The higher the
Investment in Unrelated Assets, the better the performance (Return)”. The firm
usually invests in unrelated business areas purposely to increase its acquired
assets and, in turn, the returned income. Thus, heterogeneity in assets would be
supporting its market competitiveness (Barney, 1991; Peteraf, 1992). The
findings of this study confirm that “the investment in unrelated assets improves
the firm’s performance over long-run”.
5.3.1.4.2 Under Different Economic Conditions
Table 16 illustrates different findings of the examined relationships between financial
strategies (as independent variables) and the firm performance (Return of the Share
Price “Return” as a proxy for firm performance) to confirm the proposed assumption.
Table 16: Estimation results of the Return Eq. 4 under different periods
Variables Pre-crisis
(Q1 05 – Q2 08)
Crisis
(Q3 08 – Q4 12)
Post-crisis
(Q1 13 – Q4 15)
Lag of Dependent Variable -0.095* -0.041* -0.12*
Leverage Level (𝑫𝒆𝒃𝒕𝒊𝒕) 99.77* 7.996* -46.15*
Firm's Size (𝑺𝒊𝒛𝒆𝒊𝒕) 23.87* 18.86* 18.77*
Capital Expenditure (𝑪𝒂𝒑𝒆𝒙𝒊𝒕) 13.59* -4.777* 4.737*
Government Ownership
(𝑮𝒐𝒗_𝒐𝒘𝒏𝒊𝒕) 498.8* -142.2** -138.8*
Sustainable Growth Rate (𝑺𝑮𝒊𝒕) 369.5* 12.83* NS
Unrelated Assets Investment
(𝑼𝒏𝒓_𝒂𝒔𝒔𝒆𝒕𝒊𝒕) NS 11.05*** NS
J-statistic p-values 0.32 0.42 0.47
The notations (*, ** and ***) means: significant at 1%, 5%, and 10% level, respectively,
while (NS) means not significant
138
The gained results from the analysis of the global tested period (40 quarters; 2006-
2015) data revealed that different relationships were existing among all tested
variables, where three variables supported two proposed hypotheses. However, when
separating the global period into three distinct economic phases, different results were
found as follows:
1) Pre-crisis: During the pre-crisis period, four measured variables showed a
negative relationship with the Return; while leverage level showed opposite
(positive relationship) to support our hypotheses, and unrelated assets were
insignificant.
2) During-crisis: All tested variables have a significant relationship with the
Return at different levels; however, three tested variables supported our
hypotheses, while leverage level, capital expenditure and government
ownership showed negative relationships.
3) Post-crisis: Only four tested variables have a significant relationship with the
Return; three tested variables support our hypotheses; while leverage level,
firm size and capital expenditure. In contrast, government ownership showed
a negative relationship, while sustainable growth rate and unrelated assets
were insignificance.
4) Despite the findings of the global period (2006-2015), the study proved
“Different financial strategies led to different results under different economic
conditions”.
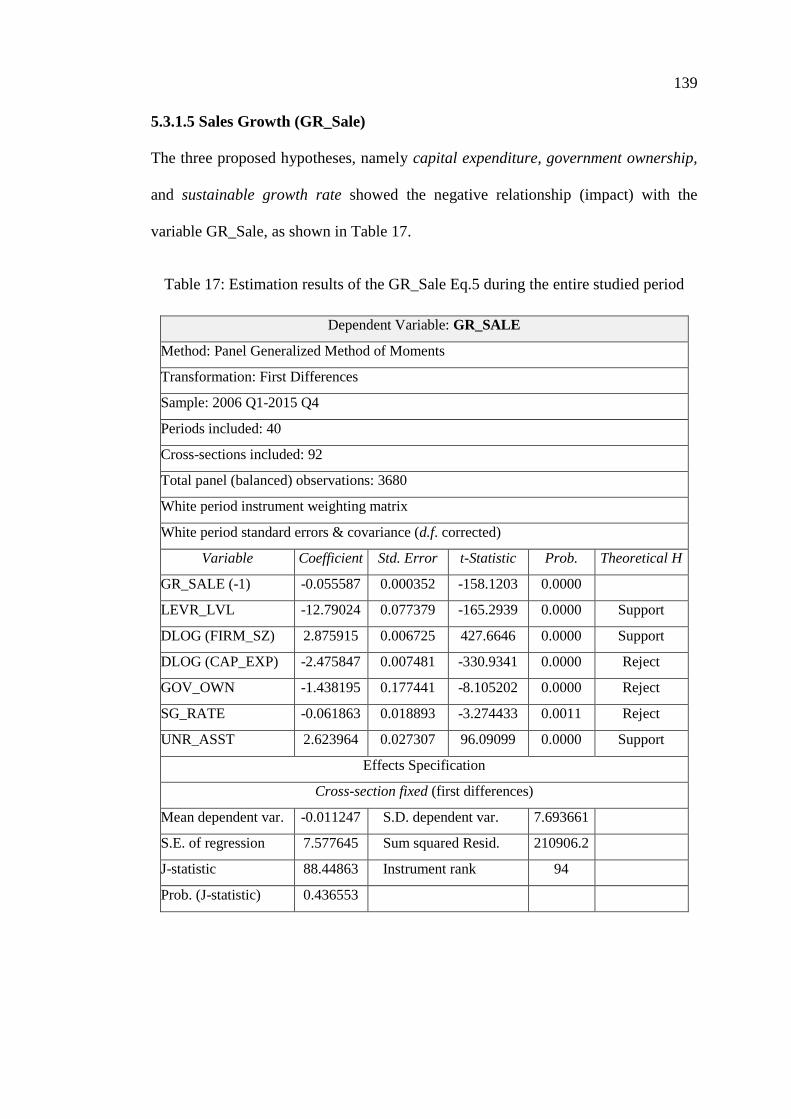
139
5.3.1.5 Sales Growth (GR_Sale)
The three proposed hypotheses, namely capital expenditure, government ownership,
and sustainable growth rate showed the negative relationship (impact) with the
variable GR_Sale, as shown in Table 17.
Table 17: Estimation results of the GR_Sale Eq.5 during the entire studied period
Dependent Variable: GR_SALE
Method: Panel Generalized Method of Moments
Transformation: First Differences
Sample: 2006 Q1-2015 Q4
Periods included: 40
Cross-sections included: 92
Total panel (balanced) observations: 3680
White period instrument weighting matrix
White period standard errors & covariance (d.f. corrected)
Variable Coefficient Std. Error t-Statistic Prob. Theoretical H
GR_SALE (-1) -0.055587 0.000352 -158.1203 0.0000
LEVR_LVL -12.79024 0.077379 -165.2939 0.0000 Support
DLOG (FIRM_SZ) 2.875915 0.006725 427.6646 0.0000 Support
DLOG (CAP_EXP) -2.475847 0.007481 -330.9341 0.0000 Reject
GOV_OWN -1.438195 0.177441 -8.105202 0.0000 Reject
SG_RATE -0.061863 0.018893 -3.274433 0.0011 Reject
UNR_ASST 2.623964 0.027307 96.09099 0.0000 Support
Effects Specification
Cross-section fixed (first differences)
Mean dependent var. -0.011247 S.D. dependent var. 7.693661
S.E. of regression 7.577645 Sum squared Resid. 210906.2
J-statistic 88.44863 Instrument rank 94
Prob. (J-statistic) 0.436553

140
5.3.1.5.1 Global Periods
a) Leverage level and GR_Sale: The variable leverage level exhibited negative
impact on GR_Sale over the entire tested period (40 quarters; 2006-2015) to
support the hypothesis (H1) “The higher the debt, the lower the performance
(GR_Sale)” to agree with Fama and French (1998) assumption “There is a
reverse relationship between debt and performance (i.e., firm’s value)”. In
other words, a massive debt would be leading to a higher probability of
bankruptcy and financial recession. Thus, the firm with a higher level of
leverage could be associated with weak financial performance; however, this
relation would be reciprocal for the firm with a sizeable debt-to-asset ratio.
b) Firm Size and GR_Sale: The variable firm size displayed a positive impact
on GR_Sale over the entire tested period (40 quarters; 2006-2015) to support
the hypothesis (H2) “The bigger the firm, the better the performance
(GR_Sale)”. The existence of such directional relationship was not reported in
the earlier related literature (e.g., Mansfield, 1962; Utton, 1971; Singh &
Whittington, 1975). However, the advanced mutual relationship of the finance
and microeconomics fruited in defining a positive relationship between
profitability and firm size (e.g., Robson & Bennett, 2000; Asimakopoulos et
al., 2009). Therefore, the bigger firm will perform better than peers in the
business sector and market to agree upon “A firm’s size is an important
determinant of corporate performance”.
c) Capital Expenditure and GR_Sale: The variable capital expenditure
exhibited a significant and negative impact on GR_Sale over the entire tested
period (40 quarters; 2006-2015) to reject the hypothesis (H3) “The higher the
capital expenditure, the lower the performance (GR_Sale)”. Capital
141
expenditure is used to expand the firm’s business by purchasing more assets.
Some studies (e.g., Johnson & Soenen, 2003; Höbarth, 2006) incorporated
ROA in assessing how assets can generate additional income. In contrast,
empirical study rejected the assumption; the higher the capital expenditure, the
higher the income will be; so, the better the performance is. Despite the capital
expenditure is leading in short-term to fewer profits and cash flow; however, it
is expected to have a positive relationship in long-term.
d) Government Ownership and GR_Sale: The variable government ownership
displayed a significant and negative impact on GR_Sale over the entire tested
period (40 quarters; 2006-2015) to reject the hypothesis (H4) “The higher the
government ownership, the lower the performance (GR_Sale)”. In principle,
government ownership adds value to firms through providing variant support
and protection. Thus, the government-owned firms operate more efficiently by
controlling their expenses (Ang & Ding, 2006; Aljifri & Moustafa, 2007). In
contrast, our gained findings indicated that government ownership impacts
negatively on the firm’s performance and does not support the growth in sales.
e) Sustainable Growth Rate (SGR) and GR_Sale: The variable SGR showed a
negative impact on GR_Sale over the entire tested period (40 quarters; 2006-
2015) to reject the hypothesis (H5) “The higher the sustainable growth rate,
the lower the performance (GR_Sale)”. The SGR indicates to what extent
could a firm grow with self-funding to establish a mutual relationship between
firm’s growth and profitability (Serrasqueiro et al., 2009; Çoban, 2014). This
study found that the higher the sustainable growth rate, the lower the
performance (GR_Sale) to contradict some reviewed citations (e.g., Johnson
& Soenen, 2003; Höbarth, 2006; Serrasqueiro et al., 2009; Çoban, 2014).

142
f) Unrelated Assets and GR_Sale: The unrelated variable assets exhibited a
consistent positive impact on GR_Sale over the entire tested period (40
quarters; 2006-2015) to support the hypothesis (H6) “The higher the Investment
in Unrelated Assets, the lower the performance (GR_Sale)”. Peteraf (1992)
argued that the heterogeneity in assets imply that the different capabilities
could assist the firms in competing well in the marketplace while achieving
different results and allowing firms to gain some competitive advantages
(Barney, 1991). These works supported ours “The investment in unrelated
assets could improve the firm’s performance”.
5.3.1.5.2 Under Different Economic Conditions
Table 18 illustrates the different findings of the examined relationship between variant
financial strategies (as independent variables) and the firm performance (GR_Sale as
a proxy for firm performance), which confirmed our general assumption.
Table 18: Estimation results of the GR_Sale Eq.5 under different periods
Variables Pre-crisis
(Q1 05-Q2 08)
Crisis
(Q3 08-Q4 12)
Post-crisis
(Q1 13-Q4 15)
Lag of Dependent Variable 0.173* -0.161* -0.107*
Leverage Level (𝑫𝒆𝒃𝒕𝒊𝒕) -15.36* -27.73* -23.73*
Firm's Size (𝑺𝒊𝒛𝒆𝒊𝒕) 4.850* 5.273* -4.202*
Capital Expenditure (𝑪𝒂𝒑𝒆𝒙𝒊𝒕) -2.542* -5.743* -2.482*
Government Ownership (𝑮𝒐𝒗_𝒐𝒘𝒏𝒊𝒕) 6.775* -109.9* -0.861*
Sustainable Growth Rate (𝑺𝑮𝒊𝒕) 26.38* -0.725* NS
Unrelated Assets Investment
(𝑼𝒏𝒓_𝒂𝒔𝒔𝒆𝒕𝒊𝒕) -6.711* 20.35* 0.492*
J-statistic p-values 0.34 0.49 0.77
The notations (*, ** and ***) means: significant at 1%, 5%, and 10% level, respectively,
while (NS) means not significant
143
The result of the global tested period (40 quarters; 2006-2015) exhibited significant
relationship among all variables; however, three variables were supportive of the
proposed hypotheses. The segregation of the global period into three distinct economic
phases of 2008 crisis, different results were found as follows:
1) Pre-crisis: All tested variables had a significant relationship with the GR_Sale.
However, four tested variables supported the proposed hypotheses; while
capital expenditure and unrelated assets displayed negative relationships.
2) During-crisis: All tested variables had a significant relationship with the
GR_Sale; however, three tested variables supported the proposed hypotheses;
while capital expenditure, government ownership and sustainable growth rate,
produced negative relationships.
3) Post-crisis: Five tested variables had a significant relationship with the
GR_Sale; the SGR’s was insignificant. Two tested variables supported the
proposed hypotheses, namely leverage level and unrelated assets.
4) Thus, the gained findings supported our assumption “Different financial
strategies led to different results under different economic circumstances”.
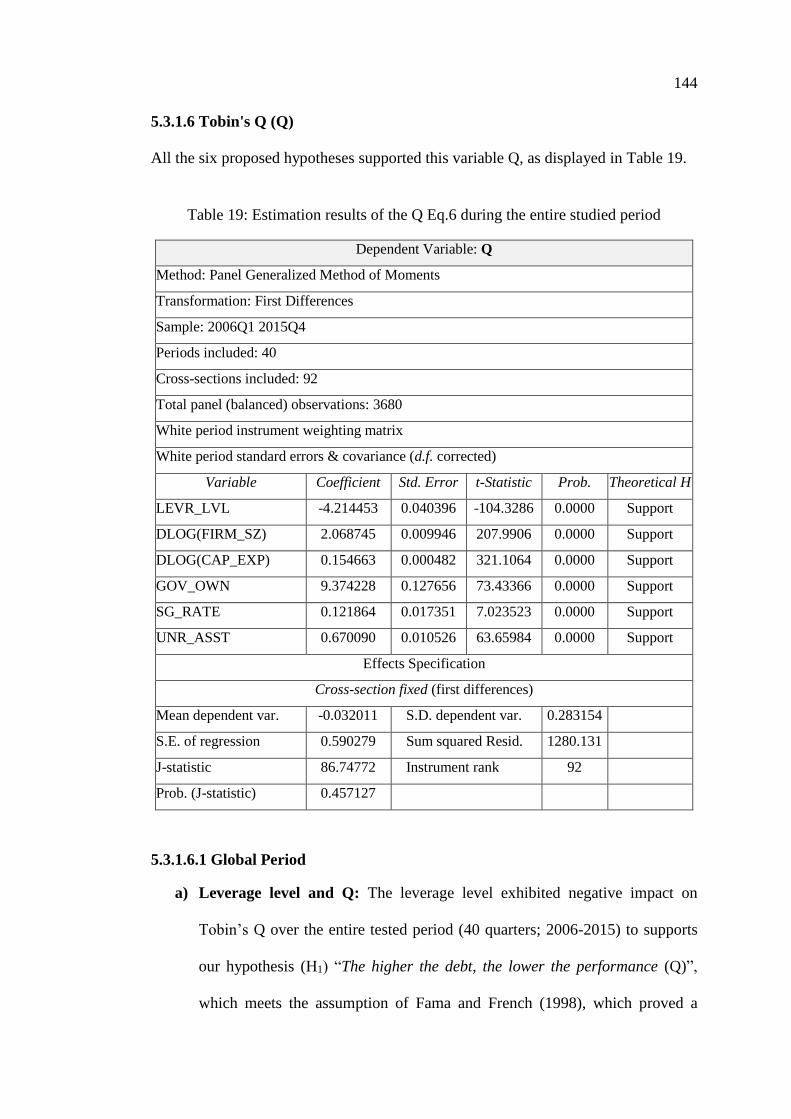
144
5.3.1.6 Tobin's Q (Q)
All the six proposed hypotheses supported this variable Q, as displayed in Table 19.
Table 19: Estimation results of the Q Eq.6 during the entire studied period
Dependent Variable: Q
Method: Panel Generalized Method of Moments
Transformation: First Differences
Sample: 2006Q1 2015Q4
Periods included: 40
Cross-sections included: 92
Total panel (balanced) observations: 3680
White period instrument weighting matrix
White period standard errors & covariance (d.f. corrected)
Variable Coefficient Std. Error t-Statistic Prob. Theoretical H
LEVR_LVL -4.214453 0.040396 -104.3286 0.0000 Support
DLOG(FIRM_SZ) 2.068745 0.009946 207.9906 0.0000 Support
DLOG(CAP_EXP) 0.154663 0.000482 321.1064 0.0000 Support
GOV_OWN 9.374228 0.127656 73.43366 0.0000 Support
SG_RATE 0.121864 0.017351 7.023523 0.0000 Support
UNR_ASST 0.670090 0.010526 63.65984 0.0000 Support
Effects Specification
Cross-section fixed (first differences)
Mean dependent var. -0.032011 S.D. dependent var. 0.283154
S.E. of regression 0.590279 Sum squared Resid. 1280.131
J-statistic 86.74772 Instrument rank 92
Prob. (J-statistic) 0.457127
5.3.1.6.1 Global Period
a) Leverage level and Q: The leverage level exhibited negative impact on
Tobin’s Q over the entire tested period (40 quarters; 2006-2015) to supports
our hypothesis (H1) “The higher the debt, the lower the performance (Q)”,
which meets the assumption of Fama and French (1998), which proved a

145
negative relationship between debt and performance (i.e., firm’s value). Thus,
the more levered a firm, the more likely the firm would not be able to fulfil its
contractual commitments. In other words, a massive debt can be leading to a
higher probability of bankruptcy and financial recession.
b) Firm Size and Q: The firm size showed a consistent significant and positive
impact on Tobin’s Q over the entire tested period (40 quarters; 2006-2015) to
support the hypothesis (H2) “The bigger the company, the better the
performance (Q)”, despite the crisis consequences. The relationship between
firm size and growth, along with profitability was a debatable topic in the
finance literature. However, a positive relationship was reported by some
research work (e.g., Mansfield, 1962; Utton, 1971; Singh & Whittington, 1975;
Robson & Bennett, 2000; Asimakopoulos et al., 2009) to support our
assumption the bigger firm will perform better than peers in the same sector
or market. Thus, our findings agreed on “firm’s size is a key determinant of
firm performance”.
c) Capital Expenditure and Q: The capital expenditure exhibited significant and
positive impact on Tobin’s Q over the entire tested period (40 quarters; 2006-
2015) to supports the hypothesis (H3) “The higher the capital expenditure, the
higher the performance (Q)”. Capital expenditure is an essential activity for
expanding the firm’s assets (Johnson & Soenen, 2003; Höbarth, 2006) to
support our assumption the higher the capital expenditure, the higher the
income will be, so, the better the performance. In the short-term, the capital
expenditure leading to lesser profits and cash flow when a firm spends the
money, in the long-term, it is expected to have a positive relationship.

146
d) Government Ownership and (Q): The government ownership showed the
significant and positive impact on Tobin’s Q over the entire tested period (40
quarters; 2006 - 2015) to support our hypothesis (H4) “The higher the
government ownership, the better the performance (Q)”. The government-
owned firm operates more efficiently by controlling their expenses through
government regulations even, under different economic conditions (Ang &
Ding, 2006; Aljifri & Moustafa, 2007). Thus, the government ownership is a
success factor for these firms.
e) Sustainable Growth Rate (SGR) and (Q): The SGR exhibited significant and
positive impact on Tobin’s Q over the entire tested period (40 quarters; 2006-
2015) to support the hypothesis (H5) “The higher the sustainable growth rate,
the better the performance (Q)” despite the impact of the crisis consequences.
As SGR defines how much a firm could maintain its growth with self-funding,
some scholarly work reported a positive relation between profits and growth
(e.g., Johnson & Soenen, 2003; Höbarth, 2006; Serrasqueiro et al., 2009;
Çoban, 2014); their findings supported our findings that the SGR is a critical
indicator for successful business firms.
f) Unrelated Assets and (Q): The unrelated assets displayed a significant and
positive impact on Tobin’s Q over the entire tested period (40 quarters; 2006-
2015) to support the hypothesis (H6) “The higher the investment in unrelated
assets, the better the performance (Q)”. This assumption indicates that the
firms are entering unrelated business fields to diversify their products and
services (Barney, 1991; Peteraf, 1992); our findings confirmed that the
investment in unrelated assets improves the performance.

147
5.3.1.6.2 Under Different Economic Conditions
Table 20 illustrates the gained findings of the examined relationship between variant
financial strategies (independent variables) and the firm performance (Tobin’s Q as a
proxy for firm performance), which, confirmed our general assumption.
Table 20: Estimation results of the Q Eq.6 in different periods
Variables Pre-crisis
(Q1 05-Q2 08)
Crisis (Q3 08-Q4 12)
Post-crisis
(Q1 13-Q4 15)
Leverage Level (𝑫𝒆𝒃𝒕𝒊𝒕) 0.726* -0.765* -0.255*
Firm's Size (𝑺𝒊𝒛𝒆𝒊𝒕) -1.080* -0.780* -0.443*
Capital Expenditure (𝑪𝒂𝒑𝒆𝒙𝒊𝒕) -0.064* -0.021* 0.040*
Government Ownership (𝑮𝒐𝒗_𝒐𝒘𝒏𝒊𝒕) NS -0.907* -1.610*
Sustainable Growth Rate (𝑺𝑮𝒊𝒕) 4.444* 0.118* NS
Unrelated Assets Investment
(𝑼𝒏𝒓_𝒂𝒔𝒔𝒆𝒕𝒊𝒕) -0.310* 0.099* 0.182*
J-statistic p-values 0.55 0.69 0.44
The notations (*, ** and ***) means: significant at 1%, 5%, and 10% level, respectively, while
(NS) means not significant.
The result of the global tested period (40 quarters; 2006-2015) exhibited consistency
in the relationships and support with all tested variables. The segregation of the global
period into three distinct economic periods represented the following conditions:
1) Pre-crisis: Five measured variables had a significant relationship with Tobin’s
Q; SGR supported; leverage level, firm size, capital expenditure, and unrelated
assets rejected hypotheses; and government ownership was insignificant.
2) During-crisis: All tested variables had a significant relationship with Tobin’s
Q; three tested variables supported the proposed hypotheses. The variables firm
size, capital expenditure and government ownership rejected the hypotheses.

148
3) Post-crisis: Five tested variables had a significant relationship with Tobin’s Q;
leverage level, capital expenditure and unrelated assets supported; firm size
and government ownership rejected the hypotheses. SGR was insignificant.
4) the study proved “Different financial strategies led to different results under
different economic conditions”.
5.3.2 Cash Flow Management and Firm Performance
Applying the developed Eq.1, 𝑌𝑖𝑡 is any of the five dependent variables (performance
measures). The dependent variables are: Return on Investment (ROI), Net Profit (NP),
Growth in Sales (GR_Sales), Earnings per Share (EPS), Return of the Share Price
(Return), and Tobin’s Q (Q). While, 𝑋𝑖𝑡 is the independent variables listed below.
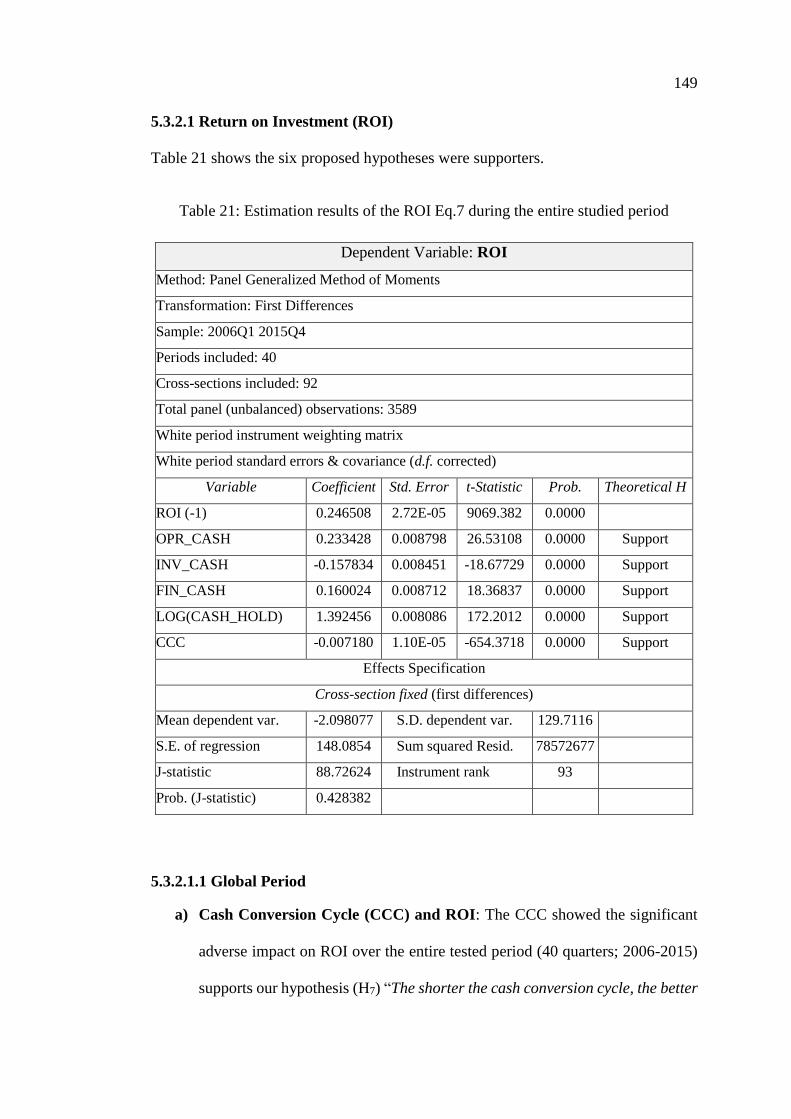
149
5.3.2.1 Return on Investment (ROI)
Table 21 shows the six proposed hypotheses were supporters.
Table 21: Estimation results of the ROI Eq.7 during the entire studied period
Dependent Variable: ROI
Method: Panel Generalized Method of Moments
Transformation: First Differences
Sample: 2006Q1 2015Q4
Periods included: 40
Cross-sections included: 92
Total panel (unbalanced) observations: 3589
White period instrument weighting matrix
White period standard errors & covariance (d.f. corrected)
Variable Coefficient Std. Error t-Statistic Prob. Theoretical H
ROI (-1) 0.246508 2.72E-05 9069.382 0.0000
OPR_CASH 0.233428 0.008798 26.53108 0.0000 Support
INV_CASH -0.157834 0.008451 -18.67729 0.0000 Support
FIN_CASH 0.160024 0.008712 18.36837 0.0000 Support
LOG(CASH_HOLD) 1.392456 0.008086 172.2012 0.0000 Support
CCC -0.007180 1.10E-05 -654.3718 0.0000 Support
Effects Specification
Cross-section fixed (first differences)
Mean dependent var. -2.098077 S.D. dependent var. 129.7116
S.E. of regression 148.0854 Sum squared Resid. 78572677
J-statistic 88.72624 Instrument rank 93
Prob. (J-statistic) 0.428382
5.3.2.1.1 Global Period
a) Cash Conversion Cycle (CCC) and ROI: The CCC showed the significant
adverse impact on ROI over the entire tested period (40 quarters; 2006-2015)
supports our hypothesis (H7) “The shorter the cash conversion cycle, the better

150
the performance (ROI)”. Gill et al. (2010) reported existing a significant and
negative relationship between the CCC (as a proxy for working capital
management) and profitability. Richards and Laughlin (1980) introduced the
CCC model, which open the door to further investigations on such relationship
(e.g., Hyun-Han & Soenen, 1998; Johnson & Soenen, 2003; Höbarth, 2006;
Gill et al., 2010; Ukaegbu, 2014). These scholarly findings supported our
findings pertinent this relationship.
b) Cash from Operating Activities and ROI: The cash that generated from
operating activities (i.e., profitability of a business firm) exhibited significant
and positive impact on ROI over the entire tested period (40 quarters; 2006-
2015) to support the hypothesis (H8) and related assumption “The higher
(sufficient) the cash generated from operating activities the better the business
performance (ROI)”. In other words, a firm that generates sufficient cash from
operating activities higher than the net changes in the cash flow and cash
equivalent during the concerned period will have better performance. The
literature review revealed that, up to our best knowledge, this variable has
neither been detected in any empirical or comparative studies nor been subject
to test for defining any relationship between financial strategies and firm’s
performance.
c) Cash from Investing Activities and ROI: The cash that generated from
investing activities (as an essential aspect of growth and capital) showed
significant and negative impact on ROI over the entire tested period (40
quarters; 2006-2015) to support the hypothesis (H9) and related assumption
“The higher the negative cash generated from investing activities, the better
the performance (ROI)”. The business firms need to promote the investment to

151
expand their products and services. The findings from data analysis pertinent
to such relationship supported our assumption “A firm negative cash from
investing activities would have better business performance”. The literature
review revealed that, up to our best knowledge, this variable has neither been
tackled in any empirical or comparative studies nor been subject to test for
defining the relationship between financial strategies and firm’s performance.
d) Cash from Financing Activities and ROI: The cash that generated from
financing activities showed significant and positive impact on ROI over the
entire tested period (40 quarters; 2006-2015) to support the hypothesis (H10)
and related assumption “The higher (positive) the cash generated from
financing activities, the better the business performance (ROI)”. The literature
review revealed that, up to our best knowledge, this variable has neither been
tackled in any significant empirical or comparative studies nor been subject to
the test to define any relation between financial strategies and firm’s
performance.
e) Cash Holdings and ROI: The cash holdings showed the significant and
positive impact on ROI over the entire tested period (40 quarters; 2006-2015)
to support the hypothesis (H11) and related assumption “The higher the amount
of cash holdings, the better is the firm’s performance (ROI)”. The findings
produced by Fama and French (1998) and Pinkowitz and Williamson (2004)
on adding higher values on its cash have supported our findings pertinent to
this hypothesis. Faulkender and Wang (2006), suggested that the market
rewards the firm that retains liquidity with higher valuations and able to create
more value.

152
5.3.2.1.2 Under Different Economic Conditions
Table 22 illustrates the different findings of the examined relationship between variant
financial strategies (independent variables) and the firm performance (ROI as a proxy
for firm performance), confirming our general assumption.
Table 22: Estimation results of the ROI Eq.7 under different periods
Variables Pre-crisis
(Q1 06-Q2 08)
Crisis
(Q3 08-Q4 12)
Post-crisis
(Q1 13-Q4 15)
Lag of Dependent Variable 0.063* 0.142* 0.116*
Cash generated from Operating
Activity (𝑶𝑷𝑹_𝑪𝒂𝒔𝒉𝒊𝒕) 0.676* 0.110* NS
Cash generated from Investing Activity
(𝑰𝒏𝒗_𝑪𝒂𝒔𝒉𝒊𝒕) -0.694* 0.110* NS
Cash generated from Financing
Activity (𝑭𝒊𝒏_𝑪𝒂𝒔𝒉𝒊𝒕) 0.685* 0.110* NS
Cash hold 0.355* 0.157* 0.883*
Working Capital-Cash Conversion
Cycle (𝒄𝒄𝒄𝒊𝒕) 0.000271* -7.86E-05* -0.000228*
J-statistic p-values 0.46 0.47 0.45
The notations (*, ** and ***) means: significant at 1%, 5%, and 10% level, respectively,
while (NS) means not significant
The result of the global tested period (40 quarters; 2006-2015) showed the significant
relationship among all variables with supporting all proposed hypotheses. However,
when segregating the global period in three different economic stages, different results
were found as follow:
1) Pre-crisis: All tested variables had a significant relationship with the ROI; five
tested variables support our hypotheses, while the variable CCC displayed
positive relationship.
2) During-crisis: All tested variables had a significant relationship with the ROI;
five tested variables support our hypotheses; the variable Cash generated from
investing activity showed a positive relationship.
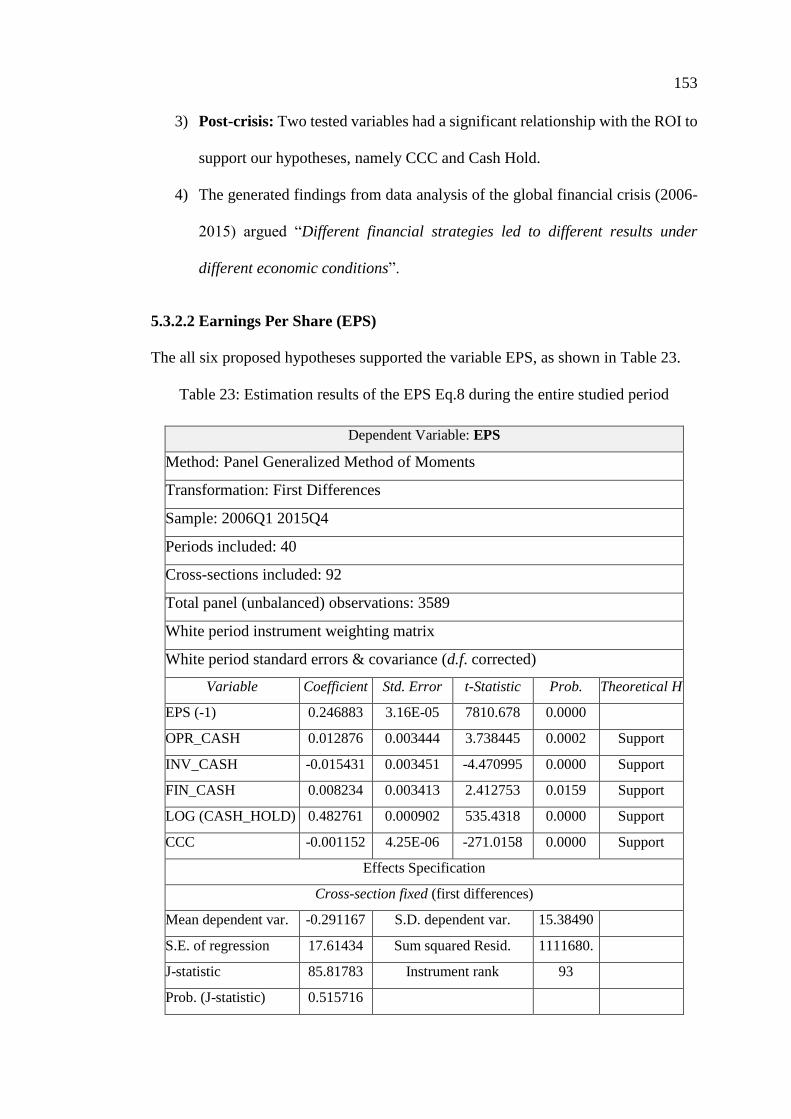
153
3) Post-crisis: Two tested variables had a significant relationship with the ROI to
support our hypotheses, namely CCC and Cash Hold.
4) The generated findings from data analysis of the global financial crisis (2006-
2015) argued “Different financial strategies led to different results under
different economic conditions”.
5.3.2.2 Earnings Per Share (EPS)
The all six proposed hypotheses supported the variable EPS, as shown in Table 23.
Table 23: Estimation results of the EPS Eq.8 during the entire studied period
Dependent Variable: EPS
Method: Panel Generalized Method of Moments
Transformation: First Differences
Sample: 2006Q1 2015Q4
Periods included: 40
Cross-sections included: 92
Total panel (unbalanced) observations: 3589
White period instrument weighting matrix
White period standard errors & covariance (d.f. corrected)
Variable Coefficient Std. Error t-Statistic Prob. Theoretical H
EPS (-1) 0.246883 3.16E-05 7810.678 0.0000
OPR_CASH 0.012876 0.003444 3.738445 0.0002 Support
INV_CASH -0.015431 0.003451 -4.470995 0.0000 Support
FIN_CASH 0.008234 0.003413 2.412753 0.0159 Support
LOG (CASH_HOLD) 0.482761 0.000902 535.4318 0.0000 Support
CCC -0.001152 4.25E-06 -271.0158 0.0000 Support
Effects Specification
Cross-section fixed (first differences)
Mean dependent var. -0.291167 S.D. dependent var. 15.38490
S.E. of regression 17.61434 Sum squared Resid. 1111680.
J-statistic 85.81783 Instrument rank 93
Prob. (J-statistic) 0.515716

154
5.3.2.2.1 Global Period
a) Cash Conversion Cycle (CCC) and EPS: CCC exhibited significant negative
impact on EPS over the entire tested period (40 quarters; 2006-2015) to support
the hypothesis (H7) “The shorter the cash conversion cycle, the higher the
performance (EPS)”. Gill et al. (2010) concluded that a significant negative
relationship existed between the CCC (as a proxy for working capital
management) and profitability; thus, the shorter the CCC, the better the
performance. Richards and Laughlin (1980) proposed the CCC model and cited
by some authors (e.g., Hyun-Han & Soenen, 1998; Johnson & Soenen, 2003;
Höbarth, 2006; Gill et al., 2010; Ukaegbu, 2014) supported our assumption “A
business firm with efficient working capital management is a successful firm”.
b) Cash from Operating Activities and EPS: Cash generated from operating
activities showed significant and positive impact on EPS over the entire tested
period (40 quarters; 2006-2015) to support the hypothesis (H8) and related
assumption “The higher (sufficient) the cash generated from operating
activities, the better the business performance (EPS)”. The literature review
revealed that, up to our best knowledge, this variable has neither been detected
in any empirical or comparative studies nor been subject to test for defining the
relationship between financial strategies and firm’s performance.
c) Cash from Investing Activities and EPS: Cash from Investing Activities
displayed significant and negative impact on EPS over the entire tested period
(40 quarters; 2006-2015) to support the hypothesis (H9) and the related
assumption “The higher the negative cash generated from Investing Activities,
the better the performance (EPS)”. The literature review revealed that, up to
our best knowledge, this variable has neither been detected in any significant

155
empirical or comparative studies nor been subject to test for defining the
relationship between financial strategies and firm’s performance.
d) Cash from Financing Activities and EPS: Cash generated from financing
activities exhibited significant and positive impact on EPS over the entire
tested period (40 quarters; 2006-2015) to support the hypothesis (H10) and
related assumption “The higher the positive cash generated from financing
activities, the better the performance (EPS)”. The literature review revealed
that, up to our best knowledge, this variable has neither been detected in any
significant empirical or comparative studies nor been subject to test for
defining the relationship between financial strategies and firm’s performance.
e) Cash Holdings and EPS: Cash holdings showed the significant and positive
impact on EPS over the entire tested period (40 quarters; 2006-2015) to support
the hypothesis (H11) and related hypothesis “The higher the amount of cash
holdings, the better is the firm’s performance (EPS)”. The findings of both
Fama and French (1998) and Pinkowitz and Williamson (2004) supported our
assumption regarding the direct relationship between the higher cash holdings
and firm’s performance. Faulkender and Wang (2006) argued that reward the
firm that retains liquidity with higher valuations to create more value.
5.3.2.2.2 Under Different Economic Conditions
Table 24 illustrates the various findings of the examined relationship between financial
strategies (as independent variables) and firm performance (EPS as a proxy for firm
performance) that confirmed our general assumption.

156
Table 24: Estimation results of the EPS Eq.8 under different periods
Variables Pre-crisis
(Q1 06-Q2 08)
Crisis
(Q3 08-Q4 12)
Post-crisis
(Q1 13-Q4 15)
Lag of Dependent Variable 0.057* 5.224* 0.089*
Cash generated from Operating
Activity (𝑶𝑷𝑹_𝑪𝒂𝒔𝒉𝒊𝒕) 0.040* 0.621* NS
Cash generated from Investing
Activity (𝑰𝒏𝒗_𝑪𝒂𝒔𝒉𝒊𝒕) -0.040* -0.639* NS
Cash generated from Financing
Activity(𝑭𝒊𝒏_𝑪𝒂𝒔𝒉𝒊𝒕) 0.042* 0.627* NS
Cash hold 0.026* 0.737* 0.015*
Working Capital-Cash
Conversion Cycle (𝒄𝒄𝒄𝒊𝒕) -3.66E-05* -0.000351* -5.35E-06*
J-statistic p-values 0.43 0.53 0.49
The notations (*, ** and ***) means: significant at 1%, 5%, and 10% level, respectively,
while (NS) means not significant
The result of the global tested period (40 quarters; 2006-2015) showed the significant
relationship among all variables to support all our hypotheses; when segregating the
global period in three economic stages, different results obtained:
1) Pre-crisis: All tested variables had a significant relationship with the EPS and
supported our hypotheses.
2) During-crisis: All tested variables had a significant relationship with the EPS
and supported our hypotheses.
3) Post-crisis: Only two tested variables had a significant relationship with the
EPS to support our hypotheses, namely CCC and Cash Hold.
4) The generated findings from data analysis of the global financial crisis (2006-
2015) argued “Different financial strategies led to different results under
different economic conditions”.
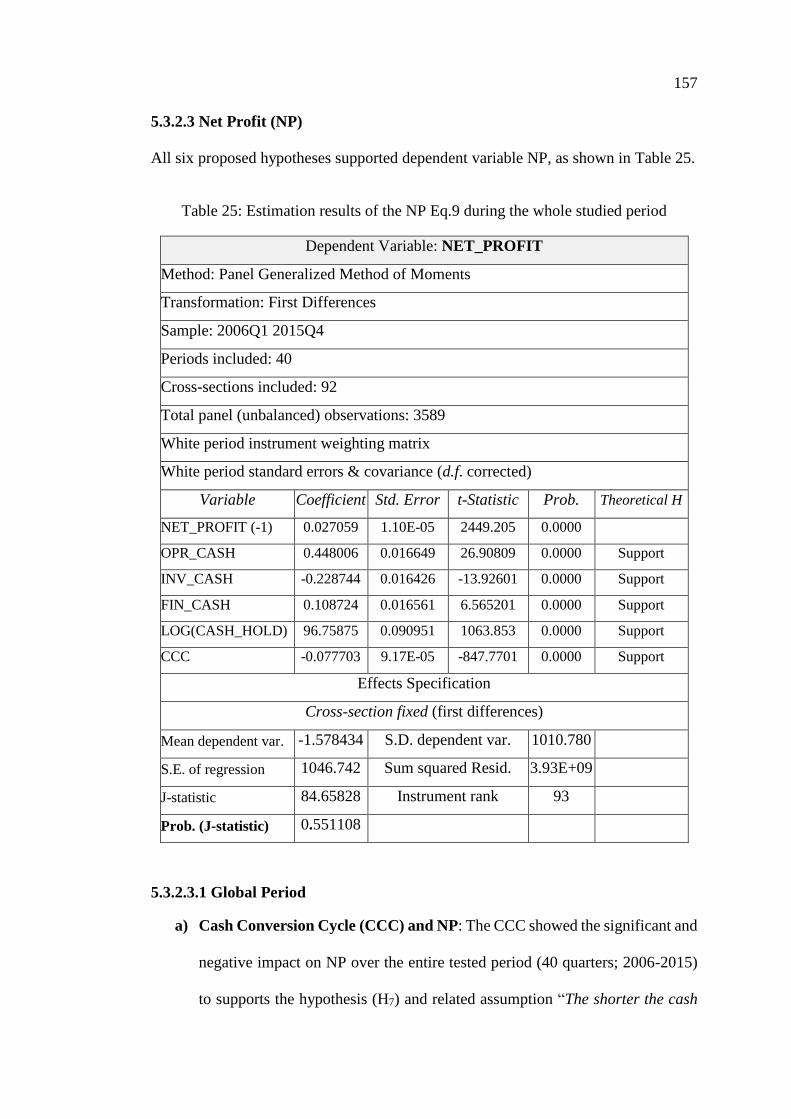
157
5.3.2.3 Net Profit (NP)
All six proposed hypotheses supported dependent variable NP, as shown in Table 25.
Table 25: Estimation results of the NP Eq.9 during the whole studied period
Dependent Variable: NET_PROFIT
Method: Panel Generalized Method of Moments
Transformation: First Differences
Sample: 2006Q1 2015Q4
Periods included: 40
Cross-sections included: 92
Total panel (unbalanced) observations: 3589
White period instrument weighting matrix
White period standard errors & covariance (d.f. corrected)
Variable Coefficient Std. Error t-Statistic Prob. Theoretical H
NET_PROFIT (-1) 0.027059 1.10E-05 2449.205 0.0000
OPR_CASH 0.448006 0.016649 26.90809 0.0000 Support
INV_CASH -0.228744 0.016426 -13.92601 0.0000 Support
FIN_CASH 0.108724 0.016561 6.565201 0.0000 Support
LOG(CASH_HOLD) 96.75875 0.090951 1063.853 0.0000 Support
CCC -0.077703 9.17E-05 -847.7701 0.0000 Support
Effects Specification
Cross-section fixed (first differences)
Mean dependent var. -1.578434 S.D. dependent var. 1010.780
S.E. of regression 1046.742 Sum squared Resid. 3.93E+09
J-statistic 84.65828 Instrument rank 93
Prob. (J-statistic) 0.551108
5.3.2.3.1 Global Period
a) Cash Conversion Cycle (CCC) and NP: The CCC showed the significant and
negative impact on NP over the entire tested period (40 quarters; 2006-2015)
to supports the hypothesis (H7) and related assumption “The shorter the cash

158
conversion cycle, the higher the performance (NP)”. Our assumption “the
business firm with efficient working capital management is the most successful
firms” supported by authenticated work on the CCC model of financial
scientists (e.g., Richards & Laughlin, 1980; Hyun-Han & Soenen, 1998;
Johnson & Soenen, 2003; Höbarth, 2006; Gill et al., 2010; Ukaegbu, 2014).
b) Cash from Operating Activities and NP: Cash generated from operating
activities displayed significant and positive impact on NP over the entire tested
period (40 quarters; 2006-2015) to supports our hypothesis (H8) and related
assumption “The higher the cash generated from sufficient operating activities,
the better the performance (NP)”. The literature review revealed that,
according to the best knowledge, this variable has neither been detected in any
significant empirical or comparative studies nor been subject to test for
defining the relationship between financial strategies and firm’s performance.
c) Cash from Investing Activities and NP: Cash from investing activities, as an
essential aspect of growth and capital, showed significant and negative impact
on NP over the entire tested period (40 quarters; 2006-2015) to support the
hypothesis (H9) and related assumption “The higher the negative cash
generated from investing activities, the better the performance (NP)”. The
literature review revealed that, on the best knowledge, this variable has neither
been detected in any empirical or comparative studies nor been subject to
define the relationship between financial strategies and firm’s performance.
d) Cash from Financing Activities and NP: Cash generated from financing
activities shows the significant and positive impact on NP over the entire tested
period (40 quarters; 2006-2015) to support the hypothesis (H10) and related
assumption “The higher the Cash generated from financing activities, the

159
better the performance (NP)”. Moreover, the literature review revealed that, to
the best knowledge, this variable has neither been detected in any significant
empirical or comparative studies nor been subject to test for defining the
relationship between financial strategies and firm’s performance.
e) Cash Holdings and NP: Cash holdings exhibited significant and positive
impact on NP over the entire tested period (40 quarters; 2006-2015) to support
the hypothesis (H11) and related assumption “The higher the amount of cash
holdings, the better is the firm’s performance (NP)”, and agreed on the findings
of Fama and French (1998) and Pinkowitz and Williamson (2004) regarding
direct relation between higher value of cash holdings and firm’s performance.
5.3.2.3.2 Under Different Economic Conditions
Table 26 illustrates the different findings of the examined relationship between variant
financial strategies (as independent variables) and the firm performance (NP as a proxy
for firm performance), confirming our general assumption.
Table 26: Estimation results of the NP Eq.9 under different periods
Variables Pre-crisis
(Q1 06 – Q2 08)
Crisis
(Q3 08 – Q4 12)
Post-crisis
(Q1 13 – Q4 15)
Lag of Dependent Variable -0.069* -0.072* -0.075*
Cash generated from Operating
Activity (𝑶𝑷𝑹_𝑪𝒂𝒔𝒉𝒊𝒕) 0.676* 1.506* NS
Cash generated from Investing
Activity (𝑰𝒏𝒗_𝑪𝒂𝒔𝒉𝒊𝒕) -0.696* -1.653* NS
Cash generated from Financing
Activity(𝑭𝒊𝒏_𝑪𝒂𝒔𝒉𝒊𝒕) 0.741* 1.652* NS
Cash hold -0.901* 0.423* -1.644*
Working Capital-Cash
Conversion Cycle (𝒄𝒄𝒄𝒊𝒕) -0.004* 0.901* -0.0004*
J-statistic p-values 0.52 0.39 0.44
The notations (*, ** and ***) means: significant at 1%, 5%, and 10% level, respectively,
while (NS) means not significant

160
The result obtained from the global tested period (40 quarters; 2006-2015) showed the
significant relationships among all variables to support all proposed hypotheses. Thus,
segregating the global period in three distinct economic stages obtained below results:
1) Pre-crisis: All tested variables supported the NP to support our hypotheses. In
contrast, the variable cash hold rejected the hypothesis (negative relationship).
2) During-crisis: All tested variables supported the NP. However, the variable
CCC rejected the hypotheses (positive relationship).
3) Post-crisis: Only two tested variables have a significant relationship with the
NP, namely CCC and cash hold. In contrast, the variable cash hold rejects the
hypothesis (negative relationships).
4) The generated findings from data analysis of the global financial crisis (2006-
2015) argued “Different financial strategies led to different results under
different economic conditions”.

161
5.3.2.4 Return of the Share Price (Return)
Three proposed hypotheses, namely cash from operating activities, cash from
investing activities and cash from financing activities rejected Return, as illustrated in
Table 27.
Table 27: Estimation results of Return Eq.10 during the entire studied period
Dependent Variable: @PC(RETURN)
Method: Panel Generalized Method of Moments
Transformation: First Differences
Sample: 2006Q1 2015Q4
Periods included: 40
Cross-sections included: 92
Total panel (unbalanced) observations: 3589
White period instrument weighting matrix
Variable Coefficient Std. Error t-Statistic Prob. Theoretical H
@PC (RETURN (-1) -0.000884 0.000160 -5.534149 0.0000
OPR_CASH 1.790657 2.095075 0.854698 0.3928 Reject
INV_CASH -2.024631 2.093446 -0.967129 0.3335 Reject
FIN_CASH 1.860019 2.105757 0.883302 0.3771 Reject
D(LOG(CASH_HOLD) 20.66223 0.085429 241.8638 0.0000 Support
CCC -0.000767 7.03E-05 -10.91656 0.0000 Support
Effects Specification
Cross-section fixed (first differences)
Mean dependent var. 4.398084 S.D. dependent var. 345.9807
S.E. of regression 353.1048 Sum squared resid. 4.47E+08
J-statistic 86.25362 Instrument rank 92
Prob (J-statistic) 0.472030

162
5.3.2.4.1 Global Period
a) Cash Conversion Cycle and Return: The CCC model exhibited significant
and negative impact on Return over the entire tested period (40 quarters; 2006-
2015) to support the hypothesis (H7) and related assumption “The shorter the
period, the better the performance (Return)”. Gill et al. (2010) reported that
there is a significant negative relationship existed between the CCC (as a proxy
for working capital management) and profitability, where the shorter the CCC,
the better the performance. This study found that the business firm with
efficient working capital management is the most successful firms, which
supported by some relevant citations (e.g., Richards & Laughlin, 1980; Hyun-
Han & Soenen, 1998; Johnson & Soenen, 2003; Höbarth, 2006; Gill et al.,
2010; Ukaegbu, 2014).
b) Cash from Operating Activities and Return: The cash that generated from
operating activities shows not-significant relationship over the entire tested
period (40 quarters; 2006-2015) to reject the hypothesis (H8) and related
assumption “The higher the cash generated sufficiently from operating
activities, the higher the performance (Return)”. The literature review revealed
that, up to our best knowledge, this variable has neither been detected in any
significant empirical or comparative studies nor been subject to test for
defining the relationship between financial strategies and firm’s performance.
c) Cash from Investing Activities and (Return): The cash that returned from
investing activities, as an essential aspect of growth and capital, showed
insignificant relationship over the entire tested period (40 quarters; 2006-2015)
to reject the hypothesis (H9) and related assumption “The higher the higher the
negative cash generated from investing activities the higher the performance
163
(Return)”. The literature review revealed that, to the best knowledge, this
variable has neither been tackled in any empirical studies nor been subject to
test for defining the potential relationship between financial strategies and
firm’s business performance.
d) Cash from Financing Activities and Return: The cash that generated from
financing activities displayed insignificant relationship over the entire tested
period (40 quarters; 2006-2015) to reject the hypothesis (H10) and related
assumption “The higher the Positive Cash generated from financing activities,
the better the business performance (Return)”. The literature review revealed
that, to the best knowledge, this variable has neither been tackled in any
empirical studies nor been subject to test for defining any existing relationship
between financial strategies and firm’s performance.
e) Cash Holdings and Return: The cash holdings exhibited significant and
positive impact on Return over the entire tested period (40 quarters; 2006-
2015) to support the hypothesis (H11) “The higher the amount of cash holdings,
the better is the firm’s performance (Return)”. The findings introduced by
Fama and French (1998) and Pinkowitz and Williamson (2004) supported and
in agreement with our proposed hypothesis; it says, “The higher some cash
holdings, the better is the firm’s performance.” On the other hand, Faulkender
and Wang (2006) indicated that the market could reward the firm that retains
liquidity with higher valuations and capable of creating more value.
5.3.2.4.2 Under Different Economic Conditions
Table 28 illustrates different findings of the examined relationship between various
financial strategies (independent variables) and the firm performance (Return as a
proxy for firm performance) that confirmed the related assumption.
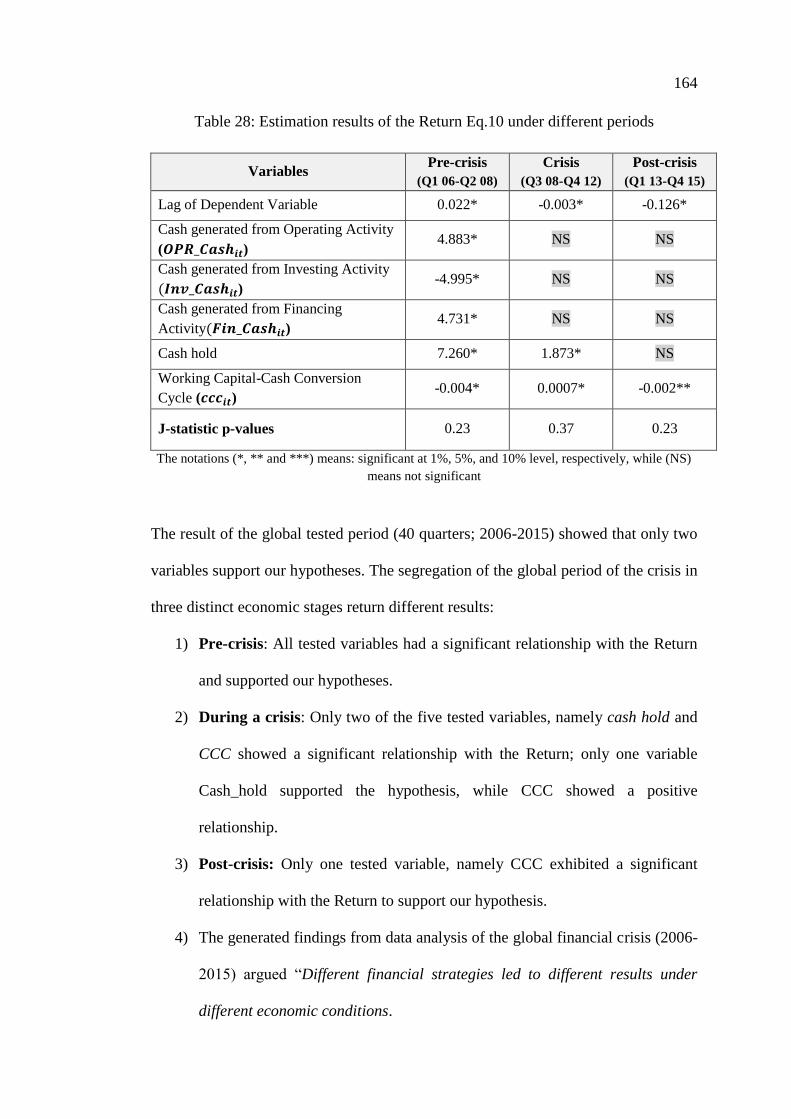
164
Table 28: Estimation results of the Return Eq.10 under different periods
Variables Pre-crisis
(Q1 06-Q2 08)
Crisis
(Q3 08-Q4 12)
Post-crisis
(Q1 13-Q4 15)
Lag of Dependent Variable 0.022* -0.003* -0.126*
Cash generated from Operating Activity
(𝑶𝑷𝑹_𝑪𝒂𝒔𝒉𝒊𝒕) 4.883* NS NS
Cash generated from Investing Activity
(𝑰𝒏𝒗_𝑪𝒂𝒔𝒉𝒊𝒕) -4.995* NS NS
Cash generated from Financing
Activity(𝑭𝒊𝒏_𝑪𝒂𝒔𝒉𝒊𝒕) 4.731* NS NS
Cash hold 7.260* 1.873* NS
Working Capital-Cash Conversion
Cycle (𝒄𝒄𝒄𝒊𝒕) -0.004* 0.0007* -0.002**
J-statistic p-values 0.23 0.37 0.23
The notations (*, ** and ***) means: significant at 1%, 5%, and 10% level, respectively, while (NS)
means not significant
The result of the global tested period (40 quarters; 2006-2015) showed that only two
variables support our hypotheses. The segregation of the global period of the crisis in
three distinct economic stages return different results:
1) Pre-crisis: All tested variables had a significant relationship with the Return
and supported our hypotheses.
2) During a crisis: Only two of the five tested variables, namely cash hold and
CCC showed a significant relationship with the Return; only one variable
Cash_hold supported the hypothesis, while CCC showed a positive
relationship.
3) Post-crisis: Only one tested variable, namely CCC exhibited a significant
relationship with the Return to support our hypothesis.
4) The generated findings from data analysis of the global financial crisis (2006-
2015) argued “Different financial strategies led to different results under
different economic conditions.
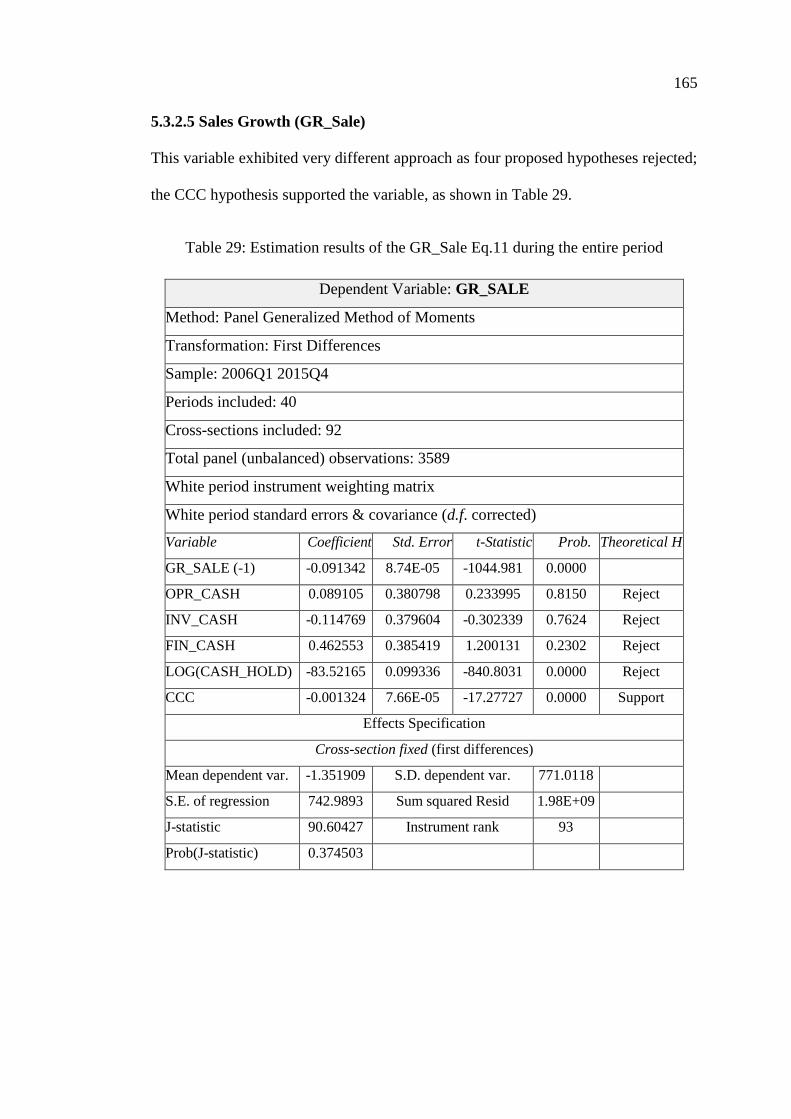
165
5.3.2.5 Sales Growth (GR_Sale)
This variable exhibited very different approach as four proposed hypotheses rejected;
the CCC hypothesis supported the variable, as shown in Table 29.
Table 29: Estimation results of the GR_Sale Eq.11 during the entire period
Dependent Variable: GR_SALE
Method: Panel Generalized Method of Moments
Transformation: First Differences
Sample: 2006Q1 2015Q4
Periods included: 40
Cross-sections included: 92
Total panel (unbalanced) observations: 3589
White period instrument weighting matrix
White period standard errors & covariance (d.f. corrected)
Variable Coefficient Std. Error t-Statistic Prob. Theoretical H
GR_SALE (-1) -0.091342 8.74E-05 -1044.981 0.0000
OPR_CASH 0.089105 0.380798 0.233995 0.8150 Reject
INV_CASH -0.114769 0.379604 -0.302339 0.7624 Reject
FIN_CASH 0.462553 0.385419 1.200131 0.2302 Reject
LOG(CASH_HOLD) -83.52165 0.099336 -840.8031 0.0000 Reject
CCC -0.001324 7.66E-05 -17.27727 0.0000 Support
Effects Specification
Cross-section fixed (first differences)
Mean dependent var. -1.351909 S.D. dependent var. 771.0118
S.E. of regression 742.9893 Sum squared Resid 1.98E+09
J-statistic 90.60427 Instrument rank 93
Prob(J-statistic) 0.374503

166
5.3.2.5.1 Global Period
a) Cash Conversion Cycle (CCC) and GR_SALE: The CCC displayed
significant and negative impact on GR_SALE over the entire tested period (40
quarters; 2006-2015) to support the hypothesis (H7) and related assumption
“The shorter the period, the better the business performance (GR_SALE)”.
The relationship between the CCC (as a proxy for working capital
management) and profitability has been a research focus of several studies
(e.g., Richards & Laughlin, 1980; Hyun-Han & Soenen, 1998; Johnson &
Soenen, 2003; Höbarth, 2006; Gill et al., 2010; Ukaegbu, 2014). The findings
of these studies supported ours “The business firm with efficient working
capital management is the most successful firms”.
b) Cash from Operating Activities and GR_SALE: The cash that generated
from operating activities showed insignificant relationship over the entire
tested period (40 quarters; 2006-2015) to reject the hypothesis (H8) and related
assumption “The higher (sufficient) the cash generated from operating
activities, the higher the business performance (GR_SALE)”. The literature
review revealed that, to the best knowledge, this variable has neither been
detected in any significant empirical studies nor subject to test for defining the
relationship between financial strategies and firm’s performance.
c) Cash from Investing Activities and GR_SALE: The cash that generated
from investing activities (as an essential factor of firm’s growth and capital)
exhibited insignificant relationship over the entire tested period (40 quarters;
2006-2015) to reject the hypothesis (H9) and related assumption “The higher
the higher the negative cash generated from investing activities, the higher
(better) the business performance (GR_SALE)”. Moreover, the literature

167
review revealed that, up to our best knowledge, this variable has neither been
detected in any relevant empirical studies nor been subject to the test to define
the relationship between financial strategies and firm’s performance.
d) Cash from Financing Activities and GR_SALE: The cash that generated
from financing activities showed insignificant relationship over the entire
tested period (40 quarters; 2006-2015) to reject the hypothesis (H10) and related
assumption “The higher the positive cash generated from financing activities,
the better the firm’s business performance (GR_SALE). The literature review
revealed that, up to our best knowledge, this variable has neither been detected
in any significant empirical or comparative studies nor been subject to test for
defining the relationship between financial strategies and firm’s performance.
e) Cash Holdings and GR_SALE: The cash holdings exhibited significant and
negative impact on GR_SALE over the entire tested period (40 quarters; 2006-
2015) to reject the hypothesis (H11) and related assumption “The higher the
number of cash holdings, the better is the firm’s business performance
(GR_SALE)”. Fama and French (1998) and Pinkowitz and Williamson (2004)
unveiled that the shareholders could enhance the firm’s value through added
opportunities for volatile investment. In contrast, Hanson (1992) and Smith and
Kim (1994) reported that those bidding firms are possessing a high excess of
free cash flow, which would be exhibiting low excess stock returns during
merger announcements (i.e., low performance). Therefore, our findings
rejected both Fama and French and Pinkowitz and Williamson approached,
while agreed Hanson (1992) and Smith and Kim (1994) assumption “The
higher some cash holdings, the lower is the firm’s performance”.
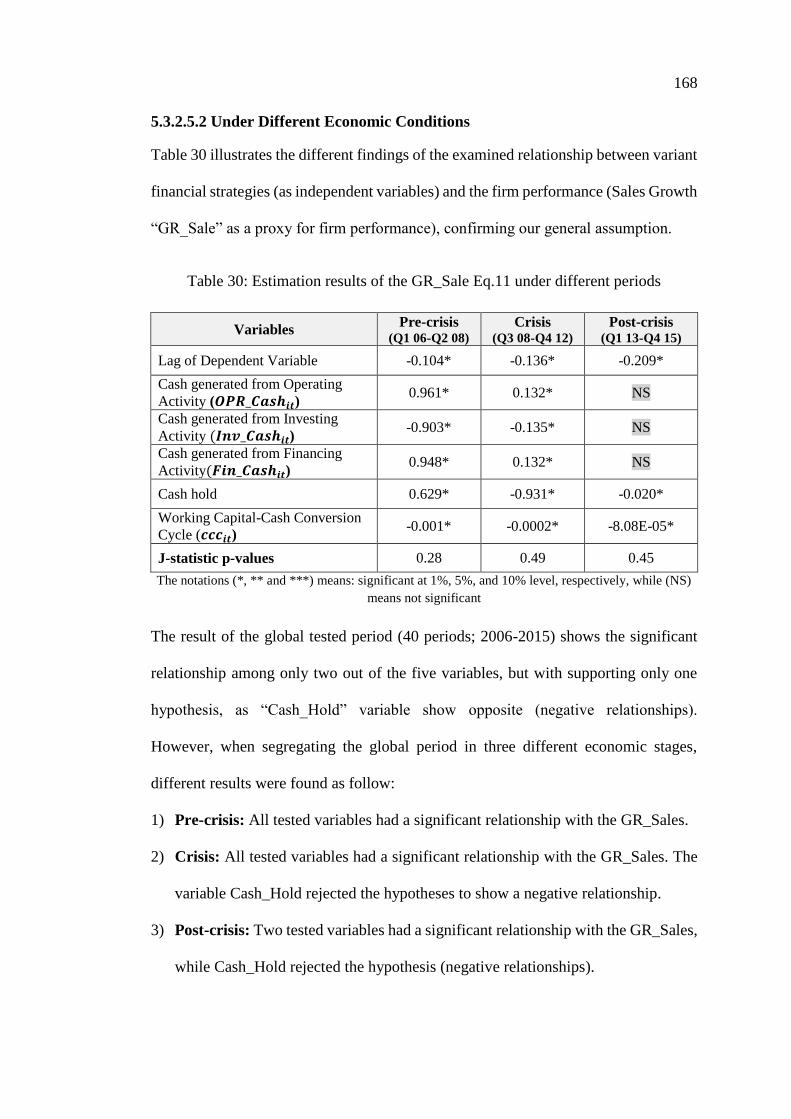
168
5.3.2.5.2 Under Different Economic Conditions
Table 30 illustrates the different findings of the examined relationship between variant
financial strategies (as independent variables) and the firm performance (Sales Growth
“GR_Sale” as a proxy for firm performance), confirming our general assumption.
Table 30: Estimation results of the GR_Sale Eq.11 under different periods
Variables Pre-crisis
(Q1 06-Q2 08)
Crisis (Q3 08-Q4 12)
Post-crisis (Q1 13-Q4 15)
Lag of Dependent Variable -0.104* -0.136* -0.209*
Cash generated from Operating
Activity (𝑶𝑷𝑹_𝑪𝒂𝒔𝒉𝒊𝒕) 0.961* 0.132* NS
Cash generated from Investing
Activity (𝑰𝒏𝒗_𝑪𝒂𝒔𝒉𝒊𝒕) -0.903* -0.135* NS
Cash generated from Financing
Activity(𝑭𝒊𝒏_𝑪𝒂𝒔𝒉𝒊𝒕) 0.948* 0.132* NS
Cash hold 0.629* -0.931* -0.020*
Working Capital-Cash Conversion
Cycle (𝒄𝒄𝒄𝒊𝒕) -0.001* -0.0002* -8.08E-05*
J-statistic p-values 0.28 0.49 0.45
The notations (*, ** and ***) means: significant at 1%, 5%, and 10% level, respectively, while (NS)
means not significant
The result of the global tested period (40 periods; 2006-2015) shows the significant
relationship among only two out of the five variables, but with supporting only one
hypothesis, as “Cash_Hold” variable show opposite (negative relationships).
However, when segregating the global period in three different economic stages,
different results were found as follow:
1) Pre-crisis: All tested variables had a significant relationship with the GR_Sales.
2) Crisis: All tested variables had a significant relationship with the GR_Sales. The
variable Cash_Hold rejected the hypotheses to show a negative relationship.
3) Post-crisis: Two tested variables had a significant relationship with the GR_Sales,
while Cash_Hold rejected the hypothesis (negative relationships).
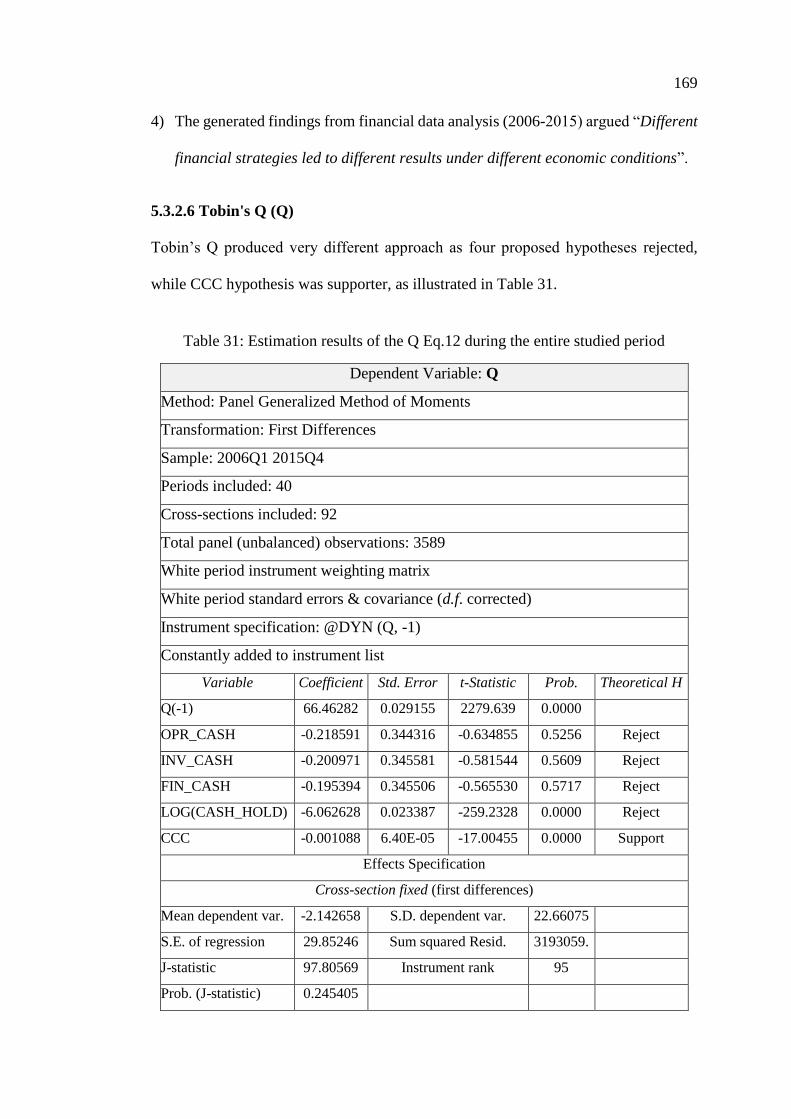
169
4) The generated findings from financial data analysis (2006-2015) argued “Different
financial strategies led to different results under different economic conditions”.
5.3.2.6 Tobin's Q (Q)
Tobin’s Q produced very different approach as four proposed hypotheses rejected,
while CCC hypothesis was supporter, as illustrated in Table 31.
Table 31: Estimation results of the Q Eq.12 during the entire studied period
Dependent Variable: Q
Method: Panel Generalized Method of Moments
Transformation: First Differences
Sample: 2006Q1 2015Q4
Periods included: 40
Cross-sections included: 92
Total panel (unbalanced) observations: 3589
White period instrument weighting matrix
White period standard errors & covariance (d.f. corrected)
Instrument specification: @DYN (Q, -1)
Constantly added to instrument list
Variable Coefficient Std. Error t-Statistic Prob. Theoretical H
Q(-1) 66.46282 0.029155 2279.639 0.0000
OPR_CASH -0.218591 0.344316 -0.634855 0.5256 Reject
INV_CASH -0.200971 0.345581 -0.581544 0.5609 Reject
FIN_CASH -0.195394 0.345506 -0.565530 0.5717 Reject
LOG(CASH_HOLD) -6.062628 0.023387 -259.2328 0.0000 Reject
CCC -0.001088 6.40E-05 -17.00455 0.0000 Support
Effects Specification
Cross-section fixed (first differences)
Mean dependent var. -2.142658 S.D. dependent var. 22.66075
S.E. of regression 29.85246 Sum squared Resid. 3193059.
J-statistic 97.80569 Instrument rank 95
Prob. (J-statistic) 0.245405
170
5.3.2.6.1 Global Period
a) Cash Conversion Cycle (CCC) and Tobin's Q: The CCC exhibited a
significant and negative impact on TOBIN'S Q over the entire tested period (40
quarters; 2006-2015) to support the hypothesis (H7) and related assumption
“The shorter the period, the better the business performance (Tobin's Q)”. The
relationship between the CCC (as a proxy for working capital management)
and firm’s profitability has attracted the research interest of several researchers
(e.g., Richards & Laughlin, 1980; Hyun-Han & Soenen, 1998; Johnson &
Soenen, 2003; Höbarth, 2006; Gill et al., 2010; Ukaegbu, 2014). The findings
of these studies supported ours “The business firm with efficient working
capital management would be successful firm”.
b) Cash from Operating Activities and Tobin's Q: The cash that generated
from operating activities (the profitability of a business firm) shows
insignificant relationship over the entire tested period (40 quarters; 2006-2015)
to reject the hypothesis (H8) and related assumption “The higher the cash
generated from operating activities, the higher (sufficient) the business
performance (Tobin's Q)”. Moreover, our findings rejected the assumption and
reported insignificant relationship. The literature review revealed that, up to
our best knowledge, this variable has neither been investigated in any
significant empirical or comparative studies nor been subject to test for
defining the relationship between financial strategies and firm’s performance.
c) Cash from Investing Activities and Tobin's Q: The cash that generated from
investing activities displayed insignificant relationship over the entire tested
period (40 quarters; 2006-2015) to reject the hypothesis (H9) and related
assumption “The higher, the higher the negative cash generated from investing
171
activities, the higher the performance (Tobin's Q)”. The generated findings
rejected the assumption “A firm negative cash from investing activities will
have better business performance and reported insignificant relationship”. The
literature review revealed that, up to our best knowledge, this variable has
neither been detected in any relevant empirical or comparative studies nor been
subject to test for defining the relationship between financial strategies and
firm’s performance.
d) Cash from Financing Activities and Tobin's Q: The cash generated from
financing activities showed insignificant relationship over the entire tested
period (40 quarters; 2006-2015) to reject the hypothesis (H10) and related
assumption “The higher the positive cash generated from financing activities,
the better the business performance (Tobin's Q)”. The literature review
revealed that, up to our best knowledge, this variable has neither been detected
in any similar empirical or comparative studies nor been subject to test for
defining the relationship between financial strategies and firm’s performance.
e) Cash Holdings and Tobin's Q: The cash holdings showed significant and
negative impact on TOBIN'S Q over the entire tested period (40 quarters; 2006-
2015) to reject the hypothesis (H11) and related assumption “The higher the
amount of cash holdings, the better is the firm’s performance (Tobin's Q)”.
Fama and French (1998) and Pinkowitz and Williamson (2004) highlighted the
role of the shareholders in enhancing the firm’s value through adding several
opportunities for volatile investment. In contrast, Hanson (1992) and Smith and
Kim (1994) reported that the firms possessing a high excess of free cash flow
would exhibit low excess stock returns during merger announcements (i.e., low
performance). Therefore, our findings rejected both Fama and French and
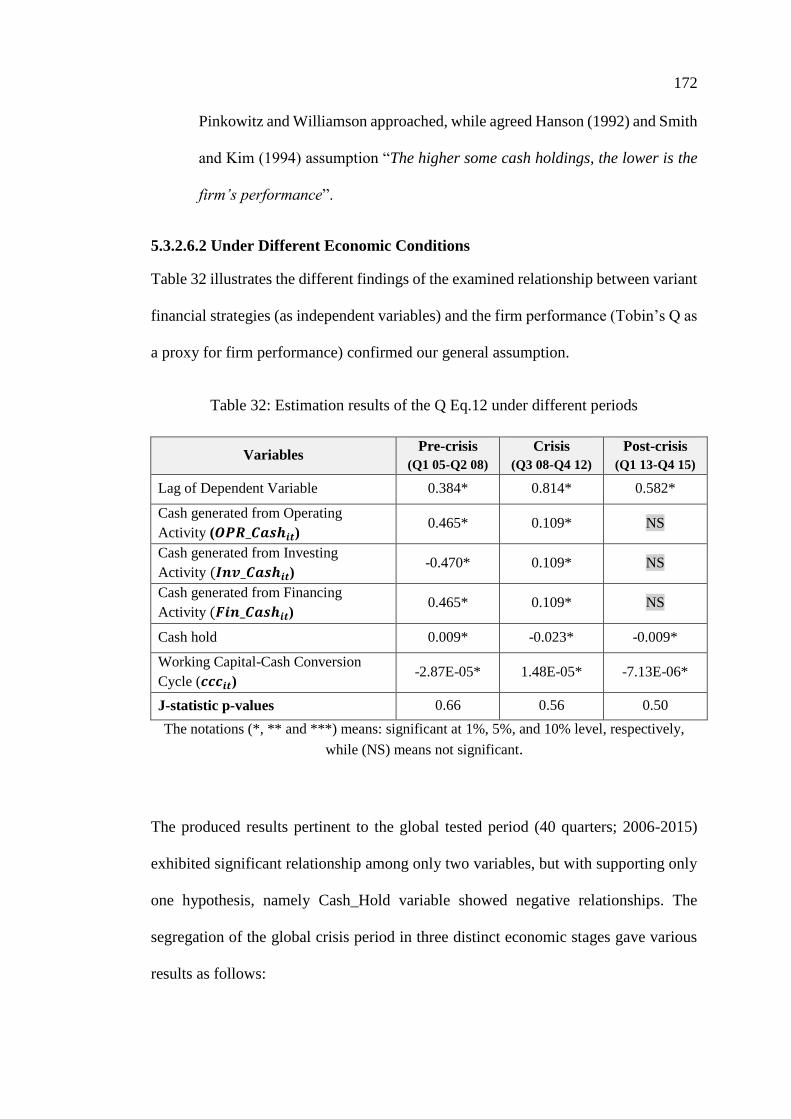
172
Pinkowitz and Williamson approached, while agreed Hanson (1992) and Smith
and Kim (1994) assumption “The higher some cash holdings, the lower is the
firm’s performance”.
5.3.2.6.2 Under Different Economic Conditions
Table 32 illustrates the different findings of the examined relationship between variant
financial strategies (as independent variables) and the firm performance (Tobin’s Q as
a proxy for firm performance) confirmed our general assumption.
Table 32: Estimation results of the Q Eq.12 under different periods
Variables Pre-crisis
(Q1 05-Q2 08)
Crisis
(Q3 08-Q4 12)
Post-crisis
(Q1 13-Q4 15)
Lag of Dependent Variable 0.384* 0.814* 0.582*
Cash generated from Operating
Activity (𝑶𝑷𝑹_𝑪𝒂𝒔𝒉𝒊𝒕) 0.465* 0.109* NS
Cash generated from Investing
Activity (𝑰𝒏𝒗_𝑪𝒂𝒔𝒉𝒊𝒕) -0.470* 0.109* NS
Cash generated from Financing
Activity (𝑭𝒊𝒏_𝑪𝒂𝒔𝒉𝒊𝒕) 0.465* 0.109* NS
Cash hold 0.009* -0.023* -0.009*
Working Capital-Cash Conversion
Cycle (𝒄𝒄𝒄𝒊𝒕) -2.87E-05* 1.48E-05* -7.13E-06*
J-statistic p-values 0.66 0.56 0.50
The notations (*, ** and ***) means: significant at 1%, 5%, and 10% level, respectively,
while (NS) means not significant.
The produced results pertinent to the global tested period (40 quarters; 2006-2015)
exhibited significant relationship among only two variables, but with supporting only
one hypothesis, namely Cash_Hold variable showed negative relationships. The
segregation of the global crisis period in three distinct economic stages gave various
results as follows:

173
1) Pre-crisis: All six tested variables had a significant relationship with Tobin’s
Q.
2) During-crisis: All tested variables had a significant relationship with Tobin’s
Q; however, only two tested variables supported our hypotheses, while the
variables cash generated from investing activity, cash hold and cash conversion
cycle showed inverse relationships.
3) Post-crisis: Only two tested variables had a significant relationship with
Tobin’s Q. However, the variable Cash_Hold rejected our hypothesis to show
negative relationships.
4) The generated findings from data analysis of the global financial crisis (2006-
2015) argued “Different financial strategies led to different results under
different economic conditions.”
174
Chapter 6: Policy Implications and Recommendations
6.1 Preamble
This dissertation aims at examining the possible connection between the market
performance of the UAE-based PJSCs and the various financial strategies adopted and
applied by their upper management and the Board of Directors. The research statement
considered that the financial market demonstrates the activities of the listed PJSCs,
which are a vital component of the UAE national economy. The scholarly significance
of this dissertation is that it investigated the market performance and responses of the
PJSCs thoroughly during 2006-2015, which witnessed three distinct economic
conditions that the UAE national economy had challenged. Based on the findings
generated, the dissertation delivers practical recommendations and policy implications
for the professionals in the finance and related business domains.
6.2 The UAE Economy: Current Status and Future Visions
Although the UAE is a young state (established on 2 December 1971), it has been
achieving proven records in the various aspects of such socioeconomic development,
an increase of income per capita, satisfactory financial and market performance of
business firms, and secure hub of investments. Such attractive features of the UAE
national economy promoted the expansion of foreign trade, social welfare, community
safety, schooling quality, and the advent of tourism and events business recently as
new economic activities. Therefore, the UAE successfully maintained its attractive
business ecosystem using the law enforcement, political stability, economic diversity,
transparency, and fighting all forms of corruption (Al-Shayeb & Hatemi-J, 2016).
The UAE national income is generated mainly from the oil-based industries.
Therefore, the price fluctuations in the international energy markets are significantly
175
influencing the economic and business performance and the GDP, as well. Thus, the
UAE has put into effect a long-term economic plan that termed as the UAE Economic
Vision 2021 to immunise itself against economic uncertainties and financial risks
through economic and business diversification while reducing the dependence on the
hydrocarbon resources.
The global financial crisis had promoted the elements of deep concerns amongst the
financial community that compelled both the Governments of Abu Dhabi and Dubai
emirates to restructure their economic plans, prioritising business activities, and
declining non-strategic projects and public expenditures. Therefore, the UAE Federal
Government had taken the necessary actions to implement the appropriate recovering
plan in 2009 for mitigating the consequences of the post-2008 financial crisis. The plan
aimed at initiating a dynamic correction of the two primary local financial markets in
Abu Dhabi (ADX) and in Dubai (DFM). In 2013, the recovery plan succeeded the two
financial markets geared to erase the post-crisis consequences gradually. Such success
of recovery was illustrated in a better return of market performance that higher than
the level recorded in 2008.
The UAE Minister of Economy, HE Sultan Mansouri has insisted this new economy
as stated “The Ministry of Economy is working currently on some laws concerned with
investment, industrial regulations, patents, industrial property, and commercial
arbitration. These laws aim at boosting the contribution of the non-oil sectors to reach
80% of the GDP by the year 2021. During 2011-2016, the contribution of the non-oil
sector was the major player, which accounted for 69% of the GDP to top 4.6%.” (The
National, 25/8/2017). However, it has been observed that the calculations of the UAE’s

176
GDP in US$, growth rate (annual%), and market capitalisation were apparently varied
in the records of the UAE federal organisations versus the World Bank’s.
The UAE has been receiving many merit certificates from international agencies and
organisations for its attractive business environment, economic performance, and
citizen-focused government services. HE Al-Mansouri in the mentioned press
interview acknowledged “The UAE GDP has maintained impressive positive growth
and records, which exceeded the global growth rate with an average of real GDP
growth during 2011-2016 topping 4.6%. The non-oil sector was the major player,
which accounted for 69% of the GDP”. In contrast, the UAE’s average GDP growth
rate was higher than the developing countries in the MENA region and the world,
which were 3.6% and 2.56%, respectively.
Such variations in the actual GDP might impact unfavourably on the market growth
and stock’s performance. The policy implications for the financial policy-makers of
the UAE Federal Government could be: i) unifying the GDP calculation procedures
and methods including related economic elements, and ii) unifying their efforts under
the umbrella of the Federal Statistics Bureau. These implications would be helping
both the macroeconomists and financial experts to measure the GDP components
based on recognised standards and reliable sources of statistical data.
The 2008 global financial crisis also unveiled that the UAE economy is susceptible to
any financial problem regardless its impact. Thus, the policy implications for the
policy-makers of both the UAE Federal Central Bank and the Ministry of Economy to
meet and manage the crisis impacts are the development of some predictive tools, such
as putting into action proper preventive procedures and analytics system. According

177
to the ESM and Market Capitalization Indices, the significant risks of the 2008 global
crisis were mitigated by the end of 2012.
Since the second half of 2014, the UAE national economy has been suffering from
some fluctuations due to conflict issues emerged across the Middle Eastern countries.
The policy implication for the Ministry of Economy is the initiation of a public
campaign amongst the investors for increasing their financial awareness and stock
literacy to equip the stockbrokers and investors with helpful information to avoid
possible risks and to differentiate between market crisis symptoms and correction
process to do right market transactions rationally.
In 2015, Euler Hermes (a financial consultant company) released a SWOT analysis
report that probes the status of the UAE economy within 2009-2015 (i.e., the seven
years after the 2008 global financial crisis) that coincided with the 2015 IMF country
report on the UAE. Both reports revealed retaining sound strength; however, some
weaknesses hit some business sectors.
The recommendations of the Herms’s report provided several implications for various
stakeholders, as detailed in Table 33. The Euler Hermes’s report indicated that the
financial policies and related plans should be reviewed on a regular basis to meet
particular economic and financial conditions.
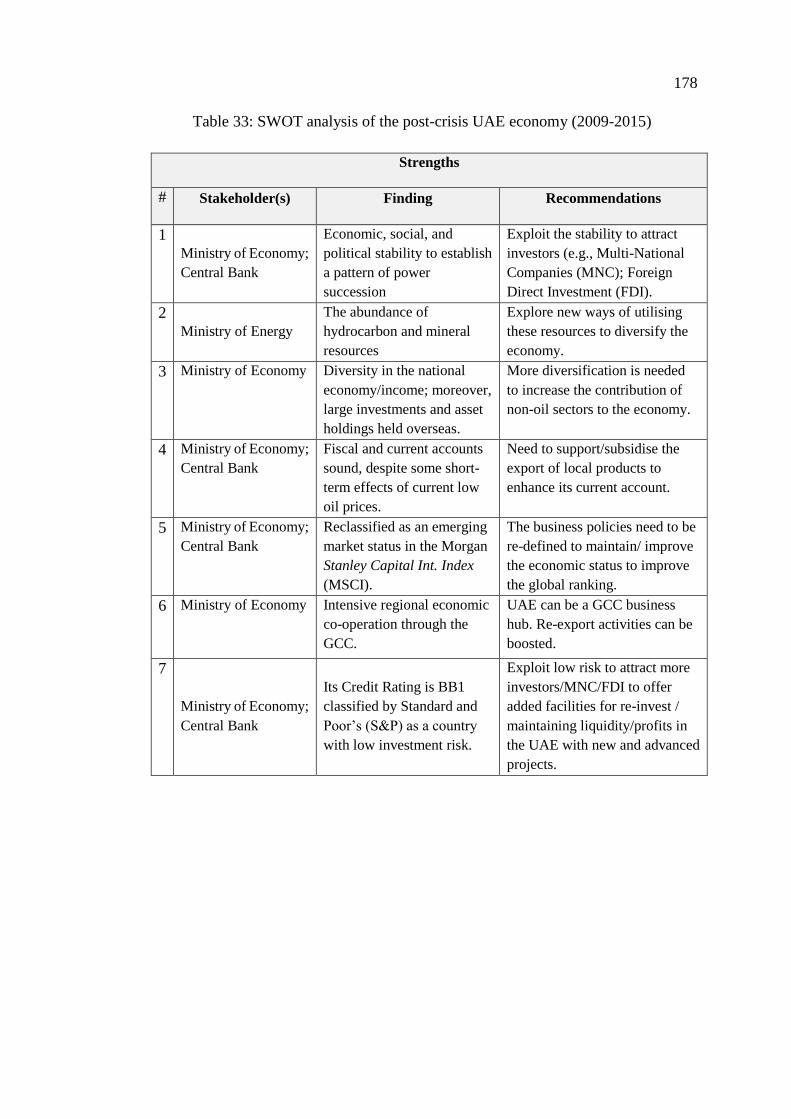
178
Table 33: SWOT analysis of the post-crisis UAE economy (2009-2015)
Strengths
# Stakeholder(s) Finding Recommendations
1
Ministry of Economy;
Central Bank
Economic, social, and
political stability to establish
a pattern of power
succession
Exploit the stability to attract
investors (e.g., Multi-National
Companies (MNC); Foreign
Direct Investment (FDI).
2
Ministry of Energy
The abundance of
hydrocarbon and mineral
resources
Explore new ways of utilising
these resources to diversify the
economy.
3 Ministry of Economy Diversity in the national
economy/income; moreover,
large investments and asset
holdings held overseas.
More diversification is needed
to increase the contribution of
non-oil sectors to the economy.
4 Ministry of Economy;
Central Bank
Fiscal and current accounts
sound, despite some short-
term effects of current low
oil prices.
Need to support/subsidise the
export of local products to
enhance its current account.
5 Ministry of Economy;
Central Bank
Reclassified as an emerging
market status in the Morgan
Stanley Capital Int. Index
(MSCI).
The business policies need to be
re-defined to maintain/ improve
the economic status to improve
the global ranking.
6 Ministry of Economy Intensive regional economic
co-operation through the
GCC.
UAE can be a GCC business
hub. Re-export activities can be
boosted.
7
Ministry of Economy;
Central Bank
Its Credit Rating is BB1
classified by Standard and
Poor’s (S&P) as a country
with low investment risk.
Exploit low risk to attract more
investors/MNC/FDI to offer
added facilities for re-invest /
maintaining liquidity/profits in
the UAE with new and advanced
projects.

179
Table 33: SWOT analysis of the post-crisis UAE economy (2009-2015) (continued)
Weaknesses
# Stakeholder(s) Finding Recommendations
1
Ministry of Economy;
Central Bank; ESCA
Speculative flows (as
the stock market, real
estates) giving some
concerns of asset
bubbles.
Despite that speculation is a natural
characteristic of the stock market, the
contrary impact should be controlled
introducing added policies and laws to
the introduced two main approaches by
ES&CA, i) surveillance/monitor the
limit up/down of every security or
each listed firms, ii) hiring
professional auditors having a full
authority to carry out the necessary
action plans and parameters for
monitoring transactions and the
securities trading of the all involved
stakeholders, are not enough to
minimise such impact of speculation.
2
Ministry of Economy;
Central Bank; ESCA
The provided data is
insufficient to a high-
income economy.
Need to acquire/develop tools for easy
access and re-design the data for doing
the adequate analysis.
Opportunities
# Stakeholder(s) Finding Recommendations
1
Ministry of Economy;
Ministry of Foreign
Affairs and Int. Coop.
Strong foreign bilateral
relations to aid cooperation
with international agencies.
Invest in unique opportunities in
each country. Enforce the
reputation of the UAE by
marketing the business and
investment atmosphere.
2
Ministry of Economy;
Central Bank
Furnished secured business
environment for attracting
foreign investors.
Support investments through
attracting foreign investors and
imposing flexible investment
laws and policies.
3
Ministry of Economy;
Central Bank
Standard infrastructure and
ICT facilities to set up a
favourable business hub for
the overseas business firms.
Imposing flexible investment
laws and regulation for the FDI
brought by multinational firms.
4 Ministry of Economy;
Central Bank
The multi-ethnic nature of
the UAE would be
providing a sense of security
for living and work.
Imposing flexible investment
laws and regulation for the FDI
brought by multinational firms-
MNC.

180
Table 33: SWOT analysis of the post-crisis UAE economy (2009-2015) (continued)
Threats
# Stakeholder(s) Finding Recommendations
1 Ministry of Economy;
Ministry of Foreign
Affairs and Int.
Coop.; Central Bank
The surrounding region is
facing severe socio-political
tensions and civil wars to
impact directly on the
stability of the national
economic conditions.
Need to develop some economic
defensive strategies (finding
alternative markets, attract new
investors) by marketing the
UAE as alternative market or
business hub of the region.
2
Ministry of Economy;
Central Bank; ESCA;
Academics
The high sensitivity of the
UAE national economy
towards global/regional
financial crises.
It is a double-edged weapon,
studying nature and sensitivity
of the proposed relation are
needed. It can furnish an
opportunity to gain from the
global/regional economic
fluctuation if we can define this
relation. Predicting mechanism
and tools are needed to plan the
preventive procedures properly.
3
Ministry of Finance;
Central Bank; Federal
Tax Authority
High dependence on foreign
workers.
It could also be seen as
necessary for economic
development; especially for low-
skills jobs. Added policy to
control/reduce the monetary
outbound transfer is needed to
support re-invest the surplus
cash in the country. Such policy
could consider applying ceiling
limit for transferred cash and
charge additional fees/tax if
exceed the ceiling limit (multi-
categories).
4
Ministry of Economy;
Central Bank; ESCA
Unpredictable fluctuation in
the energy market and raw
material prices.
Reduce the dependency on the
oil sector. Explore new raw
materials and new markets for
current raw material. Introduce
and apply hedging strategy and
tools on the federal level.
The strength of the UAE economy, however, is attributed to strong fundamentals in
functional financial policies, along with developing rational strategies for enabling the
181
UAE to be one of the major players in the global business and financial markets (Al-
Zarouni, 2008). In accordance, this dissertation recommends setting up a joint
committee including the relevant entities drawn from both federal and local
governments to assess these existing financial policies. Thus, an independent supreme
committee is needed to supervise the joint committee and review their impact on their
decisions on the national economy.
6.3 Financial Markets and National Economy- A Possible Connection
This section discusses the possible connection between the performance of both
financial markets and the UAE national economy under different conditions. The
assumption of this part is, therefore, the stability, and well-constructed financial
market in the UAE have enabled the stock and the economic system to absorb and
resist the consequences of a broad spectrum of any financial crisis, such as the global
one happened globally in 2008.
The UAE Federal Government agencies, such as Central Bank and ES&CA were
behind the stability of the local financial and securities markets through closely
superintending the obligatory financial policies and regulations to protect investors’
interests from volatility. With these imposed policies, the financial sector was capable
of providing the financial requirements of the other business domains (Otman, 2014),
and preventing conflicts by organising trading in the markets for goods and securities,
based on similar policies and a regulatory structure (Al-Shayeb & Hatemi-J, 2013).
The ES&CA produces vital statistics about the financial market and national economy;
however, the accuracy of data is apparently inadequate, or even incorrect due to the
lack of an official databank. Accordingly, there are related implications of recovering
182
deficiencies of such data for the financial entities. Therefore, the ES&CA should
launch an official databank database as an authenticated repository of relevant
financial-related documents released by all PJSCs. The organisation of the archived
data (i.e., classification, indexing, and retrieval) is recommended to be based on
unified recognised standards, such as the International Financial Report Standard
(IFRS) scheme for firm valuation (Elkelish, 2017). The end-users of this databank
would be the government entities, academic institutions, and business community
members as its service run on a commercial basis.
Since the accuracy of data-entry is a critical factor in assuring reliable information,
close supervision on the process of data collection, classification and storing is a
decisive step in developing efficient database functionalities regarding data search,
discovery and retrieval through incorporating ICT-based tools with the artificial
intelligence (AI). Thus, the databank would be a decision support entity assisting in
proposing proper strategic plans, and measuring the firm performance, along with
predicting the market trends efficiently.
The ES&CA released in 2014 its annual record that indicated a paradoxical situation
of the two financial markets; the DFM targeted higher trading volumes than the ADX,
while ADX had more listed companies with a higher market value (SCA, 2014). To
solve such contradictory situation using the both markets’ strengths, the related
implications are that the ES&CA could differentiate the financial products between
the two primary securities markets to furnish a distinction and speciality that might
result in attracting the potential traders who are interested in investing in both markets
simultaneously. Such policy could be supporting the national economic development
sufficiently.
183
The ES&CA also introduced liquidity strategy in 2015 to enhance diverse types of
traders (e.g., individuals, governments, institutions, and investors) through products
and techniques for maximising their business activities, while reducing the negative
impacts of the speculation that the market might come across. The newly introduced
products and techniques perhaps are not enough to spark sufficient incentives to attract
new traders. Therefore, the policy implications for the financial entities of the Federal
Government could use the ES&CA data for building a robust evaluation mechanism
of the impact of liquidity strategy on improving the business and financial ecosystems
for the potential traders, along with keeping tracking and reporting. Consequently,
such implications could establish a flexible market liquidity enhancement as a
necessary strategy to build an attractive financial market.
Al-Zaabi (personal interview; 25 August 2016) diagnosed the behaviour of the UAE
markets, where the growth (Index and Market Capital) in the financial markets
depends on new Initial Public Offers (IPO). Further, the UAE market value of the
listed domestic companies in both securities markets (as a percentage of the GDP)
recorded an average of 38% to represent a significant element of the national economy.
He mentioned that the fundamental drawbacks of the UAE financial markets are;
particularly, unavailability or product limitations of bonds and other hedging
tools/products, such as options and futures.
It would be quite impressive to see how the ESM generates a vital business stream that
can be considered as a significant element of the UAE economy; however, sometimes,
the ESM exceeds the performance, which is a weak indicator of the national economy.
Over the entire examined period (2001-2015), the average of the traded value per
annum to exceed 25% of the UAE GDP. Nevertheless, this average value indicates
184
that there is an imposing interrelationship between the UAE national economy and
ADX and DFM operations within which the ES&CA could contribute to developing
federal policies that would get the most benefits of such interrelationship.
Thus, the policy implication concerned with such connection between the national
economy and securities market for the UAE Ministry of Economy is that it is necessary
to enhance the ES&CA in developing appropriate economic and financial strategies
for introducing new products and opportunities to contributing to the market stability.
This policy might result in acceptable the mitigation of these existing weaknesses and
motivate the systematic flow of investments from both local and foreign institutions to
the stock market.
The analysis of periodic GDP growth and ESM index development were suffering
from tight constraints of data availability and accessibility. Therefore, the Economic
Composite Indicator (ECI) index has proven to be a useful alternative tool for the
policymakers. The ECI could track the economic activity of the UAE closely on a
quarterly basis and offers a timely clear picture about the current economic situation,
which could be used to give an early indication of economy turning points (i.e., the
ESM is a leading indicator of UAE economic activity).
The policy implications of this finding for the UAE Central Bank relied on keeping
the continuum of using the ECI index; the UAE Ministry of Economy should enhance
the various economic sectors to facing the fluctuations of the oil prices. However, this
approach needs further improvement with focusing on other essential components to
be added to the macroeconomic variables, such as the oil price as a master element of
the ECI, which might affect the investors' decisions immediately and impact the listed
185
companies' performance directly, and to consider the relationship between ECI and the
Stock Market Indicator in making their decision rationally (El-Mahmah, 2017).
The 2008 global financial crisis had caused a series of instabilities in the UAE national
economy, which might be attributed to the weak immunity of the domestic financial
market to unfavourable economic conditions. However, the lesson learned from the
concerned crisis supported the both ADX and DFM in taking the right track for
pushing recovery quite fast.
6.4 Financial Strategies and Firm’s Performance
This section discusses a range of financial strategies and their appropriateness to the
financial firms with which could achieve their performance successfully. A bundle of
thoughtful recommendations is offered to be conducted on the future financial trends
and strategies of interest to apply to unlisted firms facing similar business conditions.
6.4.1 Firm’s Performance
A large body of relevant empirical literature unveiled lack of a unified standard
measure pertaining the firm’s performance for estimating the real value of a financial
firm satisfactorily. However, there is a broad spectrum of existing scientific methods
to do similar functions with different approaches. Consequently, the pattern of
procedures for measuring the performance and valuation of a firm financial could yield
differences in both the results and models.
This empirical study selected six measures from the relevant scholarly literature for
gauging the performance of the listed companies. The dissertation categorised the
nominated measures into two groups, these are i) financial performance and ii) market
performance. As part of performance analysis, it is assumed that these measures will
186
have interactions and interdependent relationships as discussed by many scholarly
works.
The relevant literature also demonstrated that the use of various performance measures
of multi-dimensions (i.e. financial and market) in the ongoing dissertation is a great
idea, and led to the following conclusions:
1) Using different measures would be leading to different results. In other words,
the examination of the same variables with different measures of performance
could produce diverse results. This argument explains why previous relevant
studies gave different opinions, even when using various testing methods like
Panel Least Squares (PLS), and Generalized Method of Moments (GMM).
2) Such approach helps to outline the vital importance of employing some valid
performance measures rarely employed in the Arab region, such as Tobin’s Q.
Also, pay attention to the non-significance of relying on the overestimated
performance measures with intensive usages, such as Return of Share Price.
3) The findings of any proposed relationship/correlation, such as the undergoing
“financial strategies-performance relation”, could be translated inversely from
both the firms’ management and the investor's perspectives.
4) The return on investment (ROI) can be considered as a significant financial
performance measure to explain the impact of different factors, whereas
Tobin’s Q could be viewed as a substantial market performance measure to
demonstrate the effects of several factors.
The reviewed literature revealed that Earnings Per Share (EPS), on many occasions,
considered as a market performance measure. However, most of the academics define
EPS as a financial measure since it is seen as a firm's profitability indicator. In this
187
dissertation, according to the behaviour of the EPS, it could confirm that the EPS is a
financial measure. Therefore, EPS and ROI had a similar performance over the long-
term in response to the measured variables. Thus, each of them is sufficient to explain
the proposed hypothesis; however, the dissertation incorporates using both of them to
confirm his or her respective characteristics and similarity.
The generated findings of this dissertation indicated that the Return of share price
could not be considered as a proper market performance measure while lacking a
significant relationship with the six out of the eleven variables that the dissertation had
tested. The main reason beyond this behaviour might be mainly affected by investor’s
perception and speculation. Nevertheless, the investors or fund providers are neither
experts in financial performance nor market performance measure to decide which-of-
which securities portfolio is attractive to invest in considering them. On the other hand,
both the investors and fund providers are not considering financial performance
measures, nor the market performance measure is enough separately on deciding
which the right security is rewarding to invest in. Therefore, both traders should
consider the two dimensions of performance as essentials.
The yielded findings recommending the use of a mix of multiple performance
measures, such as financial and market, which are essential as performance measures
with a noticeable effect of the top management on accounting-based performance,
because it is more accessible to be controlled over. Thus, both measures are
inseparable as the market measures are out of the company management’s control.
Moreover, both the measures are primarily driven by the stock markets, and the
investor’s perception and speculation in the context different economic conditions.
However, they do not represent or reflect the firm’s real performance.

188
The financial performance indicators for rational investors are not enough to decide
where and when to invest, which depends on the investment strategy as short-, mid-,
or long-term. So, the need for keeping monitoring the PJSC’s performance, it is
necessary to improve the efficiency of shares/stocks trading, as well as know when
and how much to be traded in shares. Because the rational investors cannot rely on a
single measure to define the firm’s evaluation or performance, the dissertation
recommends that the performance measures should be composed of multi-dimensions
measures (both financial and market) based on the purpose of the assessment.
6.4.2 Proposed Financial Strategies
A significant finding of this dissertation is that the test of same performance measure
under different economic situations to perform differently. Consequently, no single
strategy could be useful for infinite; thus, such financial strategies should be
continually reviewed and evaluated. So, the degree of relying on a specific strategy for
a long-term depends on the magnitude of the response towards the different economic
situations. The firm’s top management should well-define their short-term, mid-term,
and long-term financial and business strategy.
This dissertation covers three unusual financial circumstances that investigated over
ten successive years from Q1-2006 to Q4-2015, i.e., it covers pre-2008 financial crisis,
during crisis and post-crisis. This section illustrates how the various financial strategies
could be employed and adopted by the financial firm to either maintain or improve its
performance under the different economic conditions. The eleven financial strategies

189
grouped into two dimensions: i) Six variables under the Capital Structure, and ii) Five
variables under the Cash Flow Management.
6.4.2.1 Capital Structure
a) Leverage level and Performance
As a long-term strategy, the findings generated showed consistency in the negative
relationship between the leverage level and variant performance measures despite the
stress of the crisis consequences. Thus, the higher the leverage level, the lower the
firm’s performance; however, it has no significance on the share price. On the other
hand, the higher debt reduces the ROI, net profit, growth in sales, earnings per share,
and the company’s market-to-book value (Tobin’s Q). So, whatever the debt level is,
it does not affect the share price in the market. However, the primary assumption is
that under varying financial conditions, the higher leverage (use the debt to finance an
activity) level would lead to different financial performance as explained in chapter 4.
Based on the dissertation findings, the following recommendations proposed for
implementing an optimal debt level (borrowing) strategy:
1) Under a healthy and stable economic and financial environment, the
Management and Board of Directors should consider keeping the debt level as
low as possible where the results are showing a consistent negative relationship
to performance. Thus, the investors and fund providers should pay attention to
the leverage level and default risk of the firm when they are planning to invest
in it. This strategy is valid before and after any financial crisis.
2) During the economic or financial crisis, the higher leverage level would be
enhancing the net profit and earning per share. Thus, the firm might use the
190
debts in financing its primary operations and, in turn, improving the liquidity,
to give a good sign to the investors that the firm is not facing any liquidity
problem and does better in the share price performance.
b) Firm’s Size and Performance
In the long-term, the generated findings revealed that the consistency was in a positive
relationship between the firm size and variant performance measures despite the
impact of the crisis. Therefore, the bigger the company, the better the firm’s
performance. Because big firm size would increase and improve the ROI, net profit,
growth in sales, earnings per share, share price, and the company’s market-to-book
value (Tobin’s Q).
From periodical aspect, the big firm size could lead to better performance for all
measures despite facing different economic situations, except:
Pre-crisis: Significant negative relationship leads to lower market-to-book
value (Tobin’s Q).
During a crisis: Significant negative relationship leads to lower market-to-
book value (Tobin’s Q).
Post-crisis: Significant negative relationship leads to lower market-to-book
value (Tobin’s Q) and sales growth.
Nevertheless, this dissertation has proven that different strategies under different
economic situations lead to different results. This study recommends the following for
implementing an optimal firm size strategy:
1) Under all economic or financial circumstances, the Management and Board of
Directors of the financial firm should consider going big by maximising the

191
firm size through investing in additional assets. Consequently, the firm could
generate more business with a consistent significant positive relationship to
performance. Under the specific economic situation of the post-crisis, more
leading companies might face real challenges in increasing their sales to be
explained by current market saturation of the firm, which may require
introducing new products and penetrate new markets.
2) The market-to-book value (Tobin’s Q) is a market performance measure
exposing to the perception and speculation of the investors. Therefore, it may
not be considered as an essential indicator for the Management and Board of
Directors of the firm in the short-run. However, it is a necessary element of the
firm’s evaluation, from the perspective of the potential investors and fund
providers. Therefore, it is imperative for the rational investors and fund
providers to consider this performance measure (Tobin’s Q) in the long-term.
c) Capital Expenditure and Performance
In the long-term, the produced findings unveiled that there was a degree of instability
in the relationship between the capital expenditure and various performance measures
taking place under various economic situations. However, the higher is the capital
expenditure leading to better net profits and market-to-book value (Tobin’s Q) as
assumed. On the other hand, the lower capital expenditure leading to low level of
firm’s performance in ROI, sales growth, and earnings per share, while, it has no
significance on the Return of the share price (Return).
The assumption is that under the different economic conditions, the various capital
expenditures are leading to different performance patterns in different crisis phases:
192
Pre-crisis: The higher capital expenditure, the higher ROI, higher net profit,
higher earnings per share, and higher Return of the share price (Return), while
leading to the lower growth in sales and lower (Tobin’s Q).
During a crisis: The higher capital expenditure will be leading to lower
performance in all tested measures.
Post-crisis: The Capital Expenditure, net profit, the Return of the share price
(Return), and Tobin’s Q were high, while ROI, growth in sales, and earnings
per share were low.
The dissertation proposed the following recommendations for executing an optimal
capital expenditure strategy:
1) No unique permanent strategy could be used in investing in the capital
expenditure. Thus, it is useful to invest in capital expenditure in the long-
term to increase the net profit and Tobin’s Q under normal and stable
economic and financial circumstances. In contrast, it does not improve
other performance measures like ROI, sales growth, and earnings per
share, also, it does not affect the Return of the share price (Return).
2) Based on the dissertation findings, the higher capital expenditure during
the crisis will be leading to low level of the firm performance, while all
tested performance were impacted negatively. The dissertation explains
this phenomenon as the capital expenditure during the crisis was unrealistic
and did not help to generate more business or enhance the firm’s image in
the market.
193
In conclusion, the Management and Board of Directors of the firm should carefully
consider their capital expenditure when investing in new assets to make sure that such
investment would be adding value to the business. Such added-values as imposing
suitable criteria for generating new business, improving the ROI, increase the sales
growth, and giving better earnings per share. On the other hand, the investors and fund
providers need to pay particular attention to the firm’s capital expenditure strategy
when they plan to invest in any company, especially during any financial crisis.
d) Government Ownership and Performance
In the long-term, the gained findings showed that government ownership of significant
shares is significant to the firm’s performance. Such significant impact was simplified
on the variant performance measures despite the 2008 crisis consequences effect.
Accordingly, this study assumes that the higher government ownership, the higher are
the ROI, net profit, earnings per share, and higher Tobin’s Q; while, higher
government ownership can reduce or weaken the growth-in-sales, the Return of the
share price (Return).
The assumption is that under the different economic situations, the different
government ownership leading to varying performance. Thus, the higher government
ownership will lead to:
Pre-crisis: The tested measures showed higher performance, while showed a
non-significant relationship with Tobin’s Q.
194
During a crisis: The higher ROI will lead to higher earnings per share and net
profit, and lower level of growth in sales, the Return of the share price
(Return), and Tobin’s Q.
Post-crisis: Surprisingly, the relationship did behave differently, while the turn
over swinging from positive to negative for all tested performance measures.
The dissertation proposed the following recommendations for implementing an
optimal government ownership strategy:
1) Under normal and stable economic or financial circumstances, the government
ownership is essential to support the strategic sectors or industries during the
crisis, as well as to improve the firm’s performance. However, the management
and board of the directors of the firm should not rely on this strength and should
pay much attention to the growth of the sales. As a result, shows the consistent
negative relationship between government ownership and sales growth. On the
other hand, the government ownership leading to lower share price movement.
One way to explain what could be is that these companies with higher
government ownership are well-structured against uncontrolled speculation.
Therefore, the dissertation recommends that the government increase their
investment, and also recommends to the rational investors to invest in these
companies based on these findings, which confirmed that the government
ownership improves, in general, firms’ performance.
2) Based on the produced findings, during the post-crisis circumstances, it seems
that the perception towards the market behaviour is that the higher government
ownership leads to negative performance, while all tested performance
measure was reacting negatively. Perhaps, there are other factors impact or
195
moderate this negative relationship. Therefore, this dissertation recommends
that the government must pay much attention to the performance of these
companies either to invest in them or to reshape their investment strategy in
these companies. The Governments needs to reconsider their strategy by
creating a balance/trade-off between their efforts in supporting the national
economy and their ROI.
e) Sustainable Growth Rate (SGR) and Performance
On the long-term, the generated findings showed significant consistency in the positive
relationship between the SGR and four (out of six) tested performance measures (e.g.,
ROI, net profit, earnings per share and Tobin’s Q). Thus, the higher the sustainable
growth rate, the better the firm’s performance; while the higher sustainable growth
rate reduces the growth in sales without causing an impact on the Return of the share
price (Return).
The assumption is that under the different economic situations, the various sustainable
growth rate strategies are leading to different performance patterns. Thus, the higher
SGR strategy will be leading to:
Pre-crisis: Showed positive relationship with all tested performance measures.
During a crisis: Showed positive relationship with all tested performance
measures, while sales growth showed a negative relation.
Post-crisis: act differently; significant positive relationship with ROI, net
profit and earnings per share, while the relationship was non-significant with
sales growth, the Return of the share price (Return)and Tobin’s Q.
196
The dissertation proposed the following recommendations for implementing an
optimal sustainable growth rate strategy under different economic conditions:
1) The Sustainable Growth Rate (SGR) strategy is the money that remains
internally over from the gained profits, which is not paid out to the
shareholders. Then, the dissertation recommends that the Management and
Board of Directors of the firm need to pick-up a flexible trade-off strategy
carefully between re-investing the profits and paying the dividends to the
shareholders. The produced findings of this dissertation support this approach.
2) The dissertation recommends retaining earnings in the company to finance
operations and future expansion, which positively impact on the firm’s
performance. Also, the high sustainable growth rate means that the firm could
maintain a maximum growth rate with self-funding.
3) The dissertation also recommends reducing the firm’s default risk. Therefore,
the Management and Board of Directors of the company should pay particular
attention to the growth of the sales. On the other side, the gained findings
showed that a negative relationship established between the sustainable growth
rate and sales growth in most of the performance measures tested within the
three periods
4) In the post-crisis, the produced findings showed that the sustainable growth
rate did not cause any impact on the Return of the share price (Return) and
Tobin’s Q. Moreover, as the market performance measure exposed to the
investors’ perception and speculation, it may not be considered an important
indicator for firm’s Management and Board of Directors in the short-run.
However, it is an important element of firm’s evaluation, from the potential
investors and fund providers’ perspective. Thus, it is necessary for rational
197
investors and fund providers to pay much attention to the firm’s sustainable
growth rate and consider Tobin’s Q as a performance measure in the long term.
f) Unrelated Assets and Performance
In the long-term, the generated findings showed significant consistency in the positive
relationship between the unrelated assets and various tested performance measures.
The exception was the net profit that the higher the investments in the unrelated assets,
the better is the performance. The assumption is that under the different economic
situations, the various unrelated assets investment strategies leading to different
performance patterns. Thus, the higher the investment in unrelated assets will be
leading to:
Pre-crisis: The lower performance was found to be for all tested measures
except the net profit, while showed an insignificant relation with the Return of
the share price (Return).
During a crisis: The higher performance was favourable to all tested measures
except net profit, while showed an insignificant relationship with the Return of
the share price (Return).
Post-crisis: The higher performance was found to be for ROI, sales growth and
Tobin’s Q, while the lower performance for the net profit and earnings per
share, while shows an insignificant relationship with the Return of the share
price (Return).
To the best knowledge, this variable is newly incorporated in investigating the
financial strategies; so, there is a severe lack of archival information regarding this
198
variable. Thus, the dissertation proposed the following recommendations for executing
an optimal unrelated assets investment strategy:
1) On the long run, it is essential for any business to invest in unrelated assets as
an enhancing factor for improving the performance of the firm. The existing
negative relationship with the net profits indicated that the contribution of the
profitability of the unrelated assets is minor or even negligent. Therefore, the
dissertation recommends that the Firm’s Management and Board of Directors
should choose right projects with feasible profitability for new investments.
Based on the gained findings, the higher investments in the unrelated assets
even during the 2008 crisis had led to a higher performance achieved by the
firm in most of the tested measures. This might mean that the investment in
unrelated assets is an essential strategy during the crisis.
2) Interestingly, the investigation on the pre-crisis relationship revealed that the
unrelated assets investment strategy had a negative impact on all tested
performance measures except the net profit. This phenomenon explained that
the investment in unrelated assets might be unrealistic and did not help to
generate more business or to enhance the firm’s performance, where the
financial crisis was a chance to correct their approach.
In conclusion, The Management and Board of Directors of the firm should carefully
consider their diversification strategy when investing in unrelated assets. Moreover,
the Board must make sure that such investment could add value to the firm’s business
and provide opportunities for generating new business, improve the ROI, increase the
sales growth, and give better earnings per share. On the other hand, investors and fund
199
providers need to pay particular attention to the firm’s unrelated assets investment
strategy as diversification when they plan to invest in any company.
6.4.2.2 Cash Flow Management
The dissertation unveiled that the relationship between the proxies of cash flow
management and variant performance measures was instability. Furthermore, under
different economic conditions, most of the tested relationships were found to be
insignificant. Nevertheless, such finding supports the dissertation’s assumption that
the various financial strategies are leading to different results, which appeared amongst
variant performance measures.
a) Cash Conversion Cycle and Performance
On the long-term, the generated findings showed that Cash Conversion Cycle (CCC),
as a proxy for working capital management, is a significant factor to the firm’s
performance under various economic circumstances, despite the impact of the
financial crisis. The positive or negative direction, along with the level of influence
could be varying according to the tested performance measure. Thus, the shorter the
CCC, the better the performance in ROI, net profit, earnings per share, and the Return
of the share price (Return). This finding is in agreement with the dissertation’s
hypothesis, while the shorter the CCC, the lower is the performance of sales growth
and Tobin’s Q.
The assumption under different economic situations, the CCC strategy, as working
capital management, leading to different performance. So, the shorter CCC led to:
200
Pre-crisis: The lower ROI, the lower growth in sales, the lower earnings per
share, and the lower Tobin’s Q. In contrast, the lower CCC leads to higher net
profit and higher Return of the share price (Return).
During-crisis: The higher ROI and earnings per share were leading to lower
net profit, lower growth in sales, lower Return of the share price (Return) and
lower Tobin’s Q.
Post-crisis: All financial performance measures were found to be higher (e.g.,
ROI, net profit, growth in sales, earnings per share), while, both market
performances (e.g., the Return of the share price (Return) and Tobin’s Q) were
found to be lower.
The dissertation proposed the following recommendations for executing an optimal
Cash Conversion Cycle (CCC), as working capital strategy:
1) Under healthy and stable economic and financial conditions, The Management
& Board of Directors of the company should consider the efficient working
capital management as a critical factor for firms. Thus, improving financial
performance (e.g., ROI, profitability, and EPS) is possible by reducing the
credit period granted to the customers and reducing the time between suppliers’
invoices payments and cash collection from customers and sales activities
could maintain the firm’s credit rating, and creating shareholders’ value.
2) During the crisis periods, the higher Cash Conversion Cycle is recommended
to enhance the net profit and sales growth. In other words, providing credit
facilities to current customers, along with attracting new customers to increase
sales, despite that it may hinder the ROI and EPS. Thus, during crisis
companies should focus more on liquidity rather than profitability to survive.
201
Such strategy will be improving the liquidity, which will give a good indication
for the market’s investors that the company does not face any liquidity issue,
and results in better Return of the share price (Return) and Tobin’s Q
performance.
Conversely, during the post-crisis, the economic situation starts recovery, and the
companies gained fruitful lesson learned to start focusing more on the collection to
reduce the Cash Conversion Cycle, which leads again to better financial performance
(e.g., ROI, net profit, growth in sales, and earnings per share). This strategy is in the
management favour and supports the notion said: “Due to uncontrollable factors of
the market-based measures, executives prefer accounting-based performance since
these measures are more accessible to control (Hassan & Halbouni, 2013). In contrast,
the investors need to pay attention to the working capital and treasury strategy of the
firm to know the transactions of the money when they are interested in investing in
any firm. So, it is essential to understand how the cash flow is captured and tracked
owing to its significant role in making businesses financial robust.
b) Cash from Operating Activities and Performance
On the long-term, the gained result shows that Cash generated from operating activities
is significant factors with a positive relationship to ROI, net profits and EPS, while
entirely insignificant to the variables (Growth in Sales, Return of the share price
(Return), and Tobin’s Q). Periodically, under the different economic situations,
confirmed central assumption that different Cash generation strategy leads to different
performance that higher Cash generated from operating activities will lead to:
202
Pre-crisis: significant to all performance measures, with higher performance
(ROI, EPS, sales growth, net profit, Return of the share price (Return) and
Tobin’s Q).
During a crisis: It is significant leads to higher performance to all performance
measures expect the Return of the share price (Return).
Post-crisis: It was not significant at all for all performance measures.
c) Cash from Investing Activities and Performance
In the long-term: the results showed that the cash generated from investing activities
is among significant factors with a negative relationship to ROI, net profits and EPS.
While, entirely non-significant to other dependent variables (Growth in Sales, Return
of the share price (Return), and Tobin’s Q). While, periodically under the different
economic situation, confirming our central assumption that different Cash generation
strategy leads to different performance that higher Cash generated from investing
activities will lead to:
Pre-crisis: significant to all performance measures, with higher performance
(ROI, EPS, sales growth, net profit, Return of the share price (Return) and
Tobin’s Q).
During a crisis: mixed results; first, it is significant to all performance
measures; expect the Return of the share price (Return). Lead to higher
performance for measures (EPS, NP, and Growth in Sales), while leading to
lower performance in ROI and Tobin’s Q.
Post-crisis: It was not significant at all for all performance measures.
d) Cash from Financing Activities and Performance

203
Similar to the cash generated from operating activities, on the long term, the generated
result showed that the cash that produced from the financing activities is significant
factors with a definite relationship to the ROI, net profits and EPS. While entirely non-
significant to other dependent variables (Growth in Sales, Return of the share price
(Return), and Tobin’s Q). Periodically, under different economic situations had,
confirmed the central assumption “different cash generation strategy leads to different
performance”. Thus, the higher Cash generated from financing activities will lead to:
Pre-crisis: significant to all performance measures, with higher performance
(ROI, EPS, sales growth, net profit, Return of the share price (Return) and
Tobin’s Q).
During a crisis: first, it is significant to all performance measures, lead to
higher performance for all measures, except for the Return of the share price
(Return); lead to lower performance.
Post-crisis: It was not significant at all for all performance measures.
e) Recommendations for Cash Generation
To the best knowledge, the financial community has not tested the variant activities in
the cash generation context. Consequently, there is lack historical of relevant data.
Thus, this dissertation proposed following recommendations for cash generated from
variant operating, investing, and financing activities:
1) The gained findings showed a typical homogeneous in these three variables,
regardless the source of the cash and how much does contribute to the total
generated cash. Thus, the critical point to consider by firms is how much
amount was brought forth to operate the business and pay dividends.

204
2) Firms’ management may consider that the business activities need the mix of
the three functions (operating, investing and financing) to run and generate a
new business stream, and therefore, someone could expect they have a similar
impact on all tested dependent variables (performance measures). However, it
is necessary to examine each of the three variables separately since they were
subject to test for the first time.
3) The dissertation’s findings confirm that a firm with negative cash generated
from investing activities will have better performance, as the companies prefer
to invest in their business domains to enhance their growth. Conversely, the
high positive cash flow from investing activities does not indicate that the
company is in functional status, because it may just be selling off assets.
4) Time-wise, the three variables have a significant relationship with some
performance measures in short-to-mid terms during the financial crisis.
Surprisingly, during the post-crisis, the cash generated from the three activities
have become entirely insignificant. The formulae employed to examine these
variables needed to be reconsidered, otherwise, an extended period is needed.
5) The activities that concerned with data collection and tabulating, some
unrealistic cash flow within the yearly Quarters, although there was confidence
in the data accuracy. However, sometimes the minor financial transactions and
substantial amount transactions happened. Thus, the statistical analysis upon
which these transactions based was found to be insignificant.
f) Cash Holdings and Performance
On the long-term, the obtained findings unveiled that the cash holding strategy, as a
proxy for working capital management, is a significant factor to the firm’s potential
205
performance under varying economic conditions, despite the impact of the crisis
consequences. The direction (positive or negative) and level of impact could be
varying as per the tested performance measure. Thus, the higher cash holding, the
better the performance in the ROI, net profit, and Return of the share price (Return).
In contrast, the higher cash holding, the lower is the performance for sales growth,
EPS and Tobin’s Q.
The assumption under the different economic conditions, the different cash holdings
strategy lead to different performance patterns. So, the higher cash holding leads to:
Pre-crisis: The higher performance of the majority of the tested performance
measures were (e.g., ROI, growth in sales, earnings per share, Return of the
share price (Return), and Tobin’s Q), while the net profit was lower.
During-crisis: The higher performance of the majority of the tested
performance measures were (e.g., ROI, net profit, earnings per share, and
Return of the share price (Return)), except growth in sales and Tobin’s Q.
Post-crisis: The gained results yielded ROI and EPS to be higher, while, the net
profit, growth in sales, and Tobin’s Q were lower, and the Return of the share
price (Return) was insignificant.
The dissertation proposed the following recommendations for implementing an
optimal cash holding strategy as working capital management:
1) Under healthy and stable economic or financial conditions, the Management
and Board of Directors of the firm should consider that efficient working
capital management is a critical factor in making the successful firm.
Furthermore, improving performance (e.g., ROI, profitability, and Return of
the share price (Return)) is possible by maintaining a high level of liquidity

206
(cash holding). Based on dissertation’s findings, such strategy does not help to
improve the sales growth, EPS, and Tobin’s Q. The explanation of this
phenomenon could be that the management with a prominent level of liquidity
does not pay serious attention to sales growth through investing the available
cash to generate more business. Thus, the investors could criticise the
management to invest the available cash feasibly. Accordingly, the firm’s
board should develop a strategy where cash holding level is dynamic and
investable rationally when suitable opportunities are available.
2) The dissertation findings revealed that during the crisis, the higher cash holding
is recommended as a success factor proving that “Cash is the King”. This
strategy will be enhancing the ROI, net profit, EPS and Return of the share
price (Return), as this means the readiness to create new business and give
better negotiation power to the firm’s Management, despite that it may hinder
the sales growth and Tobin’s Q. The reason beyond that is during the crisis;
companies strove to survive through focusing extensively on generating
liquidity rather than sales growth or enhancing the market-to-book value. Such
strategy will improve the liquidity, which will give a good indication for the
market’s investors, as the company does not face any liquidity issue, which
would result in a better Return of the share price (Return) performance.
3) Conversely, during the post-crisis period, the economic conditions were
recovering gradually, whereas the firms’ Management Board did not use the
available liquidity efficiently to improve the sales growth and net profit.
Therefore, it is recommended that the Management Board should develop a
dynamic treasury management strategy promptly for offering best returns. On
the other hand, the investors and fund providers need to pay much attention to

207
the contribution of the firm’s working capital and treasury strategy to
profitability and business future growth when they are planning to invest in any
company.
208
Chapter 7: The Conclusions
7.1 Revisiting
This section revisits to the coverage of each chapter as a reminder to the reader. Each
chapter is concerned with a specific related topic to the dissertation theme. The related
topics have collectively covered all aspects of the research problem of this dissertation.
The summary of each chapter is not an overlapping of what has been mentioned in the
introductory chapter.
1) Chapter1- The Introduction: This dissertation focused on defining the
potential relationship between various adopted financial strategies by firms’
board and management and the performance of these firms in the UAE context,
as well as finding the incorporated variables that might affect significantly. To
the best of knowledge, this dissertation provided the first investigation on
comparing these interrelations under different economic conditions including
the 2008 global financial crisis and its post consequences. Moreover, the
dissertation covers only the UAE market with the scarcity of published works.
Thus, it might be a useful reference source for studying the financial markets
and economics of the UAE. This dissertation investigated the relationship
between the adopted financial strategies and the firm performance within a
limited period of ten years (i.e., 40 financial quarter periods) empirically.
Moreover, the investigation of the post-crisis consequences covered only 12
quarters (i.e., three fiscal years); so, this dissertation the post-crisis period as a
study limitation. This dissertation also retained only the UAE-based PJSCs
whose data during 2006-2015were complete, reliable, and usable in tackling
the research problem.
209
2) Chapter 2- The UAE National Economy and the Financial Market: The
financial and business development in the UAE has represented an
appropriate case for conducting this study in terms the security and stability of
its business environment and financial performance. Thus, it was essential to
examine the potential impact of the listed companies’ performance on the
macro level through exploring the possible significant importance and
interrelationship between various economic indicators under the umbrella of
the UAE national economy, and the financial market. The UAE government
looks forward to finding the best business and financial practices for improving
its national economy. The financial market of the UAE has facilitated the
growth of many business sectors significantly. The consequences of the post-
2008 global financial crisis have remarkably slowed down the growth of the
UAE financial markets. However, in agreement with (Kern, 2012) statement,
our findings endorse that, “the effect on the UAE domestic financial markets
with the global fluctuations and crises gives proven evidence that the UAE
economy could pace with the accelerated development of the world economy”.
Our study confirms that the ability of the UAE economy to recover rapidly
from the consequences of the 2008 global financial crisis is evidence of the
flexibility of the UAE national economy to absorb these financial shocks
whether internally or at the global level; such sound stability has attracted both
local and foreign investors.
3) Chapter 3- Literature Review: The literary review aims at discussing the
theoretical basis of the topic critically through recalling the scholarly literature
that concerned with the concepts of strategy and theory of firm have been used
to establish a link between the strategy as a management tool and the firm’s

210
financial performance as an enabler for developing a firm-specific financial
strategy. Fama (1976) argues, among the diverse fields of economics, finance,
as a domain of dissertation, is unique about the balance between the theoretical
views and practical grounds.
Myers (1984) noted that many theoretical and empirical research studies on the
financial issues had not developed a sufficient consensus about which factors
are affecting the decision-making processes about the financial strategies, or
how these factors, if any, could influence the firm performance, as well.
A particular emphasis is devoted to testing the firm's performance statistically
within the realm of adopting a successful financial strategy. Slater and Zwilein
(1996) stated that “The firm’s financial strategy possesses a significant
potential for influencing shareholder value creation; therefore, it is a product
of firm’s investment, financing, and dividend decisions”. Following Fama and
French (1992), in their pioneer work, explaining the stock returned pattern (as
firms’ performance measure) and defined the actual driving forces of the stock
returns through testing different factors and or indicators.
As stated by Jensen and Murphy (1990), the organisation theory and strategic
management are also representing the main twin drivers for dissertation the
firm performance. Consequently, the proposed hypotheses of this dissertation
emphasise theory of the firm as suggested by Jensen and Meckling (1976), as
considerably as the concept of the strategy developed by Andrews (1980) to
express the management style. Most of these eleven examined factors
(independent variables) and six performance measures (dependent variables)
were chosen based on reviewed literature, while four of these factors, to our
best knowledge, is being introduced/examined for the first time.

211
4) Chapter 4- Data and Methodology: The econometric package EViews was
used to estimate the underlying parameters in each model. The generated
findings, using Generalized Method of Moments (GMM) estimation technique
to perform all panel data statistical estimations and data analysis, that
concerned with the data representing the ten years (quarterly data) of financial
market activities, whereas the 2008 global financial crisis fixed as a significant
benchmark event. Therefore, the primary findings generated would represent
the entire a ten-year period span. Furthermore, a statistical approach involved
in the sensitivity test for examining the potential impacts of 2008 financial
crisis. Accordingly, the added findings represent the three consecutive periods;
pre-, during, and post-financial crisis. This dissertation also investigated the
impact of adopting different financial strategies on the firm's performance
empirically. To quantify the performance of the company, six performance
measures have been incorporated to examine and identify the key determinants
of the firm’s activity through analysing the capital structure variables other
than by cash flows management variables.
5) Chapter 5- Empirical Results and Discussion: Based on the assumptions of
this dissertation, as stated: “Different financial strategies under different
economic conditions are leading to different performance”, the gained findings
from the global tested period (40 quarters; 2006-2015) analysis unveiled that
variance impact on the relationship between the eleven variables and the six
performance measures. Under the capital structure dimension, six variables
have been examined, all of them show a particular relationship with five out
the six performance measures, except for the “Share Price”, which shows
fluctuation in the relationship among the six capital structure variables. Under

212
the cash flow management dimension, the five variables have been examined;
the findings show enormous redundancy in the relationship among the five
examined variables with the six performance measures. The segregation of the
global period in three different economic stages, as defined earlier (pre, during,
and post-crisis), yielded different results, as assumed, found. Accordingly,
supporting or rejecting the proposed hypotheses is often based on the case-by-
case, as each variable (total is eleven) is examined against six measures four
times (i.e. 40 quarters), pre, during, and post-crisis.
6) Chapter 6- Policy Implications and Recommendations: The findings gained
from the data analysis confirmed the central assumption of this dissertation
“Different financial strategies under different economic conditions are leading
to different performance”. Thus, based on this crucial finding, the dissertation
recommends that the firm’s top management should define their short-term,
mid-term, and long-term financial and business strategy, as the performance
would defer, accordingly. Moreover, this dissertation paid particular attention
to find a potential link that would be existing between the UAE national
economy and the financial market. So, a set of recommendations based on this
linkage are suggested to enhance the national economy at the macro-level.
7.2 Significant Scholarly Reference Publications
The research problem of this empirical study relied on essential theories and published
work that represented fundamental breakthroughs in the finance science and
applications. These earlier references scholarly work defined the linkage between the
strategic financial factors and the firms’ performance, which is the research theme of
this dissertation’s investigation.

213
Most of the key cited reference publications written by Nobel laureates (e.g.,
Modigliani & Miller, 1958; 1963; Penrose, 1959; Fama, 1976; Jensen & Meckling,
1976; Andrews, 1980; Hansen, 1982; Fama & French, 1992; 1998) and other eminent
finance scientists (e.g., Utton, 1971; Bradley et al., 1984; Booth et al., 2001) supported
the findings of this dissertation to contribute remarkably in creating a linkage between
the firm’s strategies, finance, and performance, along with filling the knowledge gap
existing in this relationship.
7.3 Contributions
This dissertation contributed significantly to the existing financial literature as:
a) Addressing the knowledge gap regarding: i) using the econometric method for
panel data analysis as an innovative approach to research samples obtained
from the UAE financial market (PJSC), which, to our best knowledge, has not
been incorporated in similar studies, and ii) using GMM estimation technique
that employs orthogonality moment conditions to obtain valid instruments for
performing all panel data statistical estimations and analysis.
b) Furnishing reliable financial information needed by many stakeholders, such
as firm’s management and shareholders, government policy-makers, investors,
fund providers and the like about: i) what performance is expected from
implementing different financial strategies? Moreover, ii) what a mix of
financial strategies that could be implemented to meet any financial crisis?
c) Shrinking the knowledge gaps by offering practical perspectives that could be
implemented in professional settings by i) economy and financial market
policy-makers as government entities, ii) companies’ management and Board
of Directors (BOD), and iii) investors and fund providers.

214
d) Providing practical approaches to the PJS companies’, and large companies as
well, business through incorporating the proposed mix of dynamic financial
strategies as a framework for the large firms to adopt suitable applications in
the real market and financial practices.
e) The applications of the examined correlations (between various financial
strategies & various performance measures) would be offering some factors
that could assist the economic entities and companies in improving their
financial strategies and, in turn, achieving their vision and mission to show
acceptable business performance successfully.
f) This dissertation is the first scholarly investigation on examining the impact of
the 2008 global crisis on the listed companies in the UAE context; its
significance rests on that the dissertation sheds light on these relationships
under different economic conditions including the 2008 global crisis since any
scholarly studies did not tackle this issue.
g) This dissertation is the first study that went to actual reasons behind
establishing the interrelationship between the UAE national economy and the
Financial Market (as discussed in chapter 2). As a consequence, the dissertation
proposed several functional policies and implications for many stakeholders
like firms management and BOD, investors, fund providers, and economic and
financial policies makers to help them in improving the national economy and
the global competitiveness.
In summary, the following cases were the first time investigated in the UAE financial
literature and are considered as a notable contribution:
a) The impact of the 2008 global crisis on the listed companies in the UAE
context.

215
b) The financial strategies-performance relationships under different economic
conditions in the UAE context.
c) The UAE National economy-Financial Market interrelationship.
d) Highlight the significance of the PJSCs/Financial Market to the UAE national
economy.
e) The first scholarly Employing 6 dependent variables (performance measures;
4 financial plus two markets) together in one research.
f) Applying/testing the proposed relations under different economic conditions:
(pre-crisis, during the crisis, post-crisis).
7.4 Limitations of the Study
a) The empirical findings generated from this dissertation provide evidence of
wide-ranging practices of various financial strategies, along with their effects
on the firm performance. This section notes certain limitations (e.g., business
context, number of considered firms, financial strategy, and analysis tool) of
this dissertation to be considered. This dissertation investigated the market
behaviour and responses of the listed firms in Abu Dhabi Securities Exchange
(ADX) and Dubai Financial Market (DFM) towards specific economic
conditions in the UAE context. Thus, the generated findings are not necessarily
representing the financial markets of the countries in the Gulf Cooperation
Council Countries (GCC) nor the Middle Eastern and North African Countries
(MENA region).
b) The PJS firms that listed in the both of the UAE financial markets were 128 by
the end of the tested period in the year 2015. This dissertation considered only
92 PJS firms, which could be considered to represent the entire ten categorised

216
sectors in both ADX and DFM. Furthermore, the chosen PJS firms were subject
to test their performance over the three economic conditions happened in 2006-
2015 while the global financial crisis came across in 2008 to take as a
benchmark. Therefore, this dissertation investigated the performance of these
firms during the pre-crisis, in crisis, and the post-crisis.
c) We focused on examining only eleven financial strategies about the firm’s
performance from two dimensions: i) capital structure, and ii) cash flow
management. In the relevant literature, many authors identified and
investigated other financial strategies, which might not support exploring the
research problem satisfactorily.
d) Another limitation was that the financial data from various resources and in
different formats were collected and subject to analysis carefully to avoid any
vital mistake; especially when converting the collected data into EViews format
to cause what can be called conversion errors, such as duplication and
inconsistency of tabulation. Thus, the findings produced are based on using the
GMM as an estimation technique, while using another method might get
different findings of similar data.
7.5 Suggestion for Further Studies
The suggestions for further studies are based on and findings produced from analysis
of the collected financial data that supported the aim and objectives of this dissertation.
Among these financial problems that deemed further investigations are:
1) The examination of the link between GDP growth and the ESM index
development within the expanded period and more supported data. This

217
examination could provide an adequate analysis of the relationship between the
financial market and the real sector in the UAE.
2) Studying the correlation between the ECI, the ESM, and the Oil Brent price
over a more extended period with added variables by this correlation.
3) Incorporating more than one performance measures, along with using both
dimensions financial and market measures.
4) Exploring the behaviour and prompt response of the UAE national economy
towards the economic or financial instability and uncertainty happened
regionally or globally. Such investigation might define the mutual connection
and relations between the local market and the foreign ones to employ a smart
strategy to gain from such global or regional economic fluctuations.
5) Employing other financial strategies or analytic tools that discussed in the
relevant financial literature in studying the UAE financial markets to find other
solutions and beneficial results concerning the firm’s performance.
6) Applying the approaches of this dissertation to studying the performance of the
listed firms in normal economic or financial conditions in different contexts.
7) A particular area of interest is determining the vital importance of the cash flow
management strategy in improving the firm’s performance.
8) Finally, need to deal with the stand-still unanswerable question: How could the
financial crisis be forecasted? Moreover, what would be the possible predicting
indicators?
7.6 Concluding Remarks
Despite the chosen 92, JPS listed firms had exposed to the consequences of the 2008
global financial crisis, the majority of them have not learned the crisis lessons; this
218
reflected on the apparent variance in their post-crisis performance since 2013-
onwards. Therefore, the findings and related suggestions of this dissertation would be
significant reference sources for the researchers, scholars, and policy-makers who are
interested in studying the various aspects and reactions of the UAE economy and
related financial business issues, in particular, and the fluctuation and responses of the
financial markets and the listed companies worldwide. In general, the performance of
the listed companies could affect the national economy as the financial market-
economy performance gaining a positive correlation.
The academics who are interested in either the finance or the strategic management
areas would be finding the dissertation findings as a practical approach for conducting
further investigations. Likewise, this dissertation would be of value to improving the
firm’s performance by helping to bridge the gaps, notably, in the practical perspectives
of the financial strategies applications.
Moreover, there a genuine willingness to share the findings of this dissertation with
many interesting groups of stakeholders and decision-makers, such as government as
policy-maker (Stock markets), the board of directors of the listed and large companies,
management leaders, investors, and fund providers. This dissertation argues that the
post-crisis financial market not like the pre-crisis one, where the companies behaviour
changed due to their responses towards encountering the crisis consequences;
therefore, many other factors (e.g., financial and non-financial) could impact on the
firm performance. Accordingly, this financial issue deemed further investigation.

219
References
Abor, J. (2007). Corporate governance and financing decisions of Ghanaian listed
firms. Corporate Governance, 7(1), 83-92.
Abu Dhabi Exchange (ADX). ADX official reports. From: http://www.adx.gov.ae
AICPA Jenkins Report. (1991). Improving business reporting: A customer focus.
Retrieved from: http://www.aicpa.org/members/div/acctstd/ibr/chap2.htm.
Aladwani, J. M. (2016). Risk and return in domestic and foreign stock trading: The
GCC perspective- PhD dissertation, RMIT, Melbourne, Australia. Retrieved
from http://researchbank.rmit.edu.au/view/rmit:161772/Aladwani.pdf
Al-Jarouf, A. K., Al Mansoori, M., Nooraddin, S., & Elshareif, E. E. (2017). The
assessment of the global financial crisis on the Dubai Financial Market
performance. In R. Benlamri and M. Sparer (Eds.): Leadership, Innovation and
Entrepreneurship as Driving Forces of the Global Economy (pp. 749-759).
Berlin: Springer.
Aljifri, K., & Moustafa, M. (2007). The impact of corporate governance mechanisms
on the performance of UAE firms: An empirical analysis. Journal of Economic
and Administrative Sciences, 23(2), 71-93.
Al-Malkawi, H. A. N., & Pillai, R. (2013). The impact of financial crisis on UAE real
estate and construction sector: Analysis and implications. Humanomics, 29(2),
115-135.
Al-Mohana, S. A. M. (2016). An empirical investigation of the UAE stock markets-
DBA dissertation, UAE University [Unpublished].
Al-Shayeb, A. (1999). The emergence of the United Arab Emirates official securities
market-PhD dissertation, University of Essex, UK [Unpublished].
Al-Shayeb, A., & Hatemi-J, A. (2013). An empirical investigation of the potential
asymmetric relationship between the stock market and the exchanges rates in
the UAE. Economia Internazionale, 66(4), 425-438.
Al-Shayeb, A., & Hatemi-J., A. (2016). Trade openness and economic development in
the UAE: An asymmetric approach. Journal of Economic Studies, 43(4), 587-
597.
Al-Tamimi, H., & Kalli, A. (2009). Financial literacy and investment decisions of
UAE investors. Journal of Risk Finance, 10(5), 500-516.
220
Al-Tamimi, H. A. H., Alwan, A. A., & Abdel Rahman, A. A. (2011). Factors affecting
stock prices in the UAE financial markets. Journal of Transnational
Management, 16(1), 3-19.
Al-Zaabi, O. (26 August 2016). On the behaviour of the UAE stock market [personal
communication].
Al-Zarouni, A. (2008). Corporate financial disclosure in emerging markets: The case
of the UAE-PhD dissertation, Griffith University, Australia [Unpublished].
Andrews, K. R. (1980). The concept of corporate strategy. Revised edition.
Homewood, Illinois: Richard D. Irwin.
Ang, J. S., & Ding, D. K. (2006). Government ownership and the performance of
government-linked companies: The case of Singapore. Journal of Multinational
Financial Management, 16(1), 64-88.
Antcliff, V., Higgins, D., Toms, S., & Wilson, J. F. (2007). Business strategy and firm
performance: The British corporate economy, 1949-1984 [Working paper].
Department of Management Studies, University of York, UK.
Antoniou, A., Guney, Y., & Paudyal, K. (2008). The determinants of capital structure:
capital market-oriented versus bank-oriented institutions. Journal of Financial
and Quantitative Analysis, 43(1), 59-92.
Arellano, M., & Bover, O. (1995). Another look at the instrumental variable estimation
of error-components models. Journal of Econometrics 68(1), 29-51.
Arellano, M., & Bond, S. (1991). Some tests of specification for panel data: Monte
Carlo evidence and an application to employment equations. The Review of
Economic Studies, 58(2), 277-297.
Asimakopoulos, I., Samitas, A., & Papadogonas, T. (2009). Firm-specific and
economy-wide determinants of firm profitability: Greek evidence using panel
data. Managerial Finance, 35(11), 930-939.
Baldwin, J. & Yan, B. (2011). The death of Canadian manufacturing plants:
heterogeneous responses to changes in tariffs and real exchange rates. Review of
World Economics, 147(1), 131-167.
Baltagi, B. H., Song, S. H., & Jung, B. C. (2001). The unbalanced nested error
component regression model. Journal of Econometrics, 101(2), 357-381.

221
Banerjee, R., & Majumdar, S. (2018). Impact of firm specific and macroeconomic
factors on financial performance of the UAE insurance sector. Global Business
and Economics Review, 20(2), 248-261.
Banz, R. W. (1981). The relationship between return and market value of common
stocks. Journal of Financial Economics, 9(1), 3-18.
Barber, B. M., & Lyon, J. D. (1997). Firm size, book-to-market ratio, and security
returns: A holdout sample of financial firms. The Journal of Finance, 52(2),
875-883.
Barney, J. (1991). Firm resources and sustained competitive advantage. Journal of
Management, 17(1), 99-120.
Barton, S. L. and P. I. Gordon (1987). Corporate strategy: A useful perspective for the
study of capital structure? Academy of Management Review, 12(1), 67-75.
Basu, S. (1983). The relationship between earnings' yield, market value and return for
NYSE common stocks: Further evidence. Journal of Financial Economics,
12(1), 129-156.
Beck, T., & Levine, R. (2004). Stock markets, banks, and growth: Panel evidence.
Journal of Banking & Finance 28(3), 423-442.
Bencivenga, V. R., Smith, B. D., & Starr, R. M. (1996). Liquidity of secondary capital
markets: Allocative efficiency and the maturity composition of the capital
stock. Economic Theory, 7(1), 19-50.
Berger, A. N., & Bonaccorsi di Patti, E. (2006). Capital structure and firm
performance: A new approach to testing agency theory and an application to the
banking industry. Journal of Banking & Finance, 30(4), 1065-1102.
Bettis, R. A. (1983). Modern financial theory, corporate strategy and public policy:
Three conundrums. Academy of Management Review, 8, 406-415.
Billett, M. T., & Garfinkel, J. A. (2004). Financial flexibility and the cost of external
finance for US bank holding companies. Journal of Money, Credit, and Banking
36(5), 827-852.
Blonigen, B. A., & Tomlin, K. (2001). Size and growth of Japanese plants in the United
States. International Journal of Industrial Organization, 19(6), 931-952.
222
Blundell, R., & Bond, S. (1998). Initial conditions and moment restrictions in dynamic
panel data models. Journal of Econometrics, 87(1), 115-143.
Blundell, R., & Bond, S. (2000). GMM estimation with persistent panel data: an
application to production functions. Econometric reviews, 19(3), 321-340.
Bodolica, V., Spraggon, M., & Zaidi, S. (2015). Boundary management strategies for
governing family firms: A UAE-based case study. Journal of Business
Research, 68(3), 684-693.
Bond, S. R. (2002). Dynamic panel data models: a guide to micro data methods and
practice. Portuguese Economic Journal, 1(2), 141-162.
Booth, L., Aivazian, V., Demirguc‐Kunt, A., & Maksimovic, V. (2001). Capital
structures in developing countries. The Journal of finance, 56(1), 87-130.
Bottazzi, G., Secchi, A., & Tamagni, F. (2008). Productivity, profitability and financial
performance. Industrial and Corporate Change, 17(4), 711-751.
Bradley, M., Jarrell, G. A., & Kim, E. (1984). On the existence of an optimal capital
structure: Theory and evidence. The Journal of Finance, 39(3), 857-878.
Busija, E. C., O'Neill, H. M., & Zeithaml, C. P. (1997). Diversification strategy, entry
mode, and performance: Evidence of choice and constraints. Strategic
Management Journal, 18(4), 321-327.
Caves, R. E. (1980). Industrial organisation, corporate strategy and structure. Journal
of economic literature, 18(1), 64-92.
Chan, L. K. C., Hamao, Y., & Lakonishok, J. (1991). Fundamentals and stock returns
in Japan. The Journal of Finance, 46(5), 1739-1764.
Chung, K. H., & Pruitt, S. W. (1994). A simple approximation of Tobin's Q. FM: The
Journal of the Financial Management Association, 23(3), 70-74.
Cibin, R., & Grant, R. M. (1996). Restructuring among the world's leading oil
companies 1980-92. British Journal of Management, 7(3), 283-307.
Capon, N., Farley, J. U., & Hoenig, S. (1990). Determinants of financial performance:
A meta-analysis. Management Science, 36(10), 1143-1159.
Capozza, D. R, & Seguin, P. J. (1998). Managerial style and firm value. Real Estate
Economics, 26(1), 131-150.

223
Castenholz, W. B. (1931). Selling and administrative expense analysis as a basis for
sales control and cost reduction. Accounting Review, 125-130.
Chan, L. K., Hamao, Y., & Lakonishok, J. (1991). Fundamentals and stock returns in
Japan. The Journal of Finance, 46(5), 1739-1764.
Çoban, S. (2014). The Interaction between firm growth and profitability: Evidence
from Turkish listed manufacturing firms. Bilgi Ekonomisi ve Yönetimi
Dergisi, 9(1), 41-50.
Coad, A. (2007). Testing the principle of ‘growth of the fitter’: the relationship
between profits and firm growth. Structural Change and Economic Dynamics,
18(3), 370-386.
Coad, A. (2010). Exploring the processes of firm growth: evidence from a vector auto-
regression. Industrial and Corporate Change, 19(6), 1677-1703.
Coase, R. H. (1937). The nature of the firm. Economica, 4(16), 386-405.
Combs, J. G., & Ketchen, D. J., Jr. (1999). Explaining interfirm cooperation and
performance: Toward a reconciliation of predictions from the resource-based
view and organizational economics. Strategic Management Journal, 20(9),
867-888.
Davidsson, P., Kirchhoff, B., Hatemi–J, A., & Gustavsson, H. (2002). Empirical
analysis of business growth factors using Swedish data. Journal of small
business management, 40(4), 332-349.
Delios, Andrew, & Beamish, Paul W. (1999). Ownership strategy of japanese firms:
Transactional, institutional, and experience influences. Strategic Management
Journal, 20(10), 915-933.
Demirgüç-Kunt, A, & Detragiache, E. (1994). Interest rates, official lending, and the
debt crisis. Journal of Development Economics, 44(2), 263-285.
Demirgüç-Kunt, A., & Levine, R. (1996). Stock market development and financial
intermediaries. The World Bank Economic Review, 10(2), 291-321.
Dess, G. G., Lumpkin, G. T., & Covin, J. G. (1997). Entrepreneurial strategy making
and firm performance: Tests of contingency and configurational models.
Strategic Management Journal, 18(9), 677-695.

224
Dittmar, A., Mahrt-Smith, J., & Servaes, H. (2003). International corporate
governance and corporate cash holding. Journal of Financial & Quantitative
Analysis, 38(1), 111-133.
Dogan, E., & Smyth, R. (2002). Board remuneration, company performance, and
ownership concentration: Evidence from publicly listed Malaysian
companies. ASEAN Economic Bulletin, 19(3), 319-347.
Dubai Financial Market (DFM). DFM official reports. From http://www.dfm.gov.ae.
Dunne, P., & Hughes, A. (1994). Age, size, growth and survival: UK companies in the
1980s. The Journal of Industrial Economics, 42(2),115-140.
Easterbrook, F. H. (1984). Two agency-cost explanations of dividends. The American
Economic Review, 74(4), 650-659.
Ebaid, I. E. S. (2009). The impact of capital‐structure choice on firm performance:
empirical evidence from Egypt. The Journal of Risk Finance, 10(5), 477-487.
Ebaid, I. E‐S. (2009). The impact of capital‐structure choice on firm performance:
empirical evidence from Egypt. The Journal of Risk Finance, 10(5), 477-487.
Elkelish, W. W. (2017). IFRS related party transactions disclosure and firm valuation
in the United Arab Emirates emerging market. Journal of Accounting in
Emerging Economies, 7(2), 173-189.
Eisenhardt, K. M. (1989). Building theories from case study research. Academy of
Management Review, 14(4), 532-550.
El-Mahmah, A. (2017). Constructing an economic composite indicator for the UAE
[working paper]. Abu Dhabi: The Central Bank of the UAE. Retrieved from:
https://www.centralbank.ae/en/pdf/dataroom/WP19062017.pdf
Erdamar, C., Adiloglu, B., & Gürsoy, T. (2013). Financial indicators of steady success
in manufacturing companies: Research on big manufacturing companies in
Turkey. Advances in Management and Applied Economics, 3(4), 217-234.
Estrada, E. (2012). The structure of complex networks: Theory and applications
(various pages). London: Oxford University Press.
Euler Hermes (2015). The activities of the UAE economy in post-2008 financial crisis
(2009-2015). Retrieved from, http://www.eulerhermes.com.

225
Evans, D. S. (1987). Tests of alternative theories of firm growth. Journal of Political
Economy, 95(4), 657-674.
Fagiolo, G., & Luzzi, A. (2006). Do liquidity constraints matter in explaining firm size
and growth? Some evidence from the Italian manufacturing industry. Industrial
& Corporate Change, 15(1), 1-39.
Fama, E. F. (1976). Foundations of finance: portfolio decisions and securities prices
(various pages). New York: Basic Books.
Fama, E. F. (1980). Agency problems and the theory of the firm. Journal of Political
Economy 88(2), 288-307.
Fama, E. F., & French, K. R. (1992). The cross-section of expected stock returns. The
Journal of Finance, 47(2), 427-465.
Fama, E. F., & French, K. R. (1998). Value versus growth: The international evidence.
The Journal of Finance, 53(6), 1975-1999.
Fama, E. F., & Jensen, M. C. (1983). Agency problems and residual claims. The
Journal of Law and Economics, 26(2), 327-349.
Fan, J. P., Titman, S., & Twite, G. (2012). An international comparison of capital
structure and debt maturity choices. Journal of Financial & Quantitative
Analysis, 47(1), 23-56.
Farjoun, M. (1998). The independent and joint effects of the skill and physical bases
of relatedness in diversification. Strategic Management Journal, 19(7), 611-
630.
Faulkender, M., & Wang, R. (2006). Corporate financial policy and the value of cash.
The Journal of Finance, 61(4), 1957-1990.
Fischer, E. O., Heinkel, R., & Zechner, J. (1989). Dynamic capital structure choice:
Theory and tests. The Journal of Finance, 44(1), 19-40.
Forss, G. (2006). What characterises successful stocks? A case study of Swedish
companies between 1995 and 2005- MSc thesis, Uppsala University, Sweden.
Frank, M. Z., & Goyal, V. K. (2009). Capital structure decisions: Which factors are
reliably important? Financial Management, 38(1), 1-37.
226
Frank, M., & Goyal, V. K. (2009). Profits and capital structure. In The American
Finance Association Meetings, January 2009. Washington DC: The American
Finance Associations.
Gemba, K., & Kodama, F. (2001). Diversification dynamics of the Japanese industry.
Research Policy, 30(8), 1165-1184.
Geroski, P. A., Lazarova, S., Urga, G., & Walters, C. F. (2003). Are differences in firm
size transitory or permanent?. Journal of Applied Econometrics, 18(1), 47-59.
Gill, A., Biger, N., & Mathur, N. (2010). The relationship between working capital
management and profitability: Evidence from the United States. Business and
Economics Journal, 10(1), 1-9.
Gilson, S. C., Hotchkiss, E. S., & Ruback, R. S. (2000). Valuation of bankrupt
firms. The Review of Financial Studies, 13(1), 43-74.
Goddard, J., Molyneux, P., & Wilson, J. O. (2004). The profitability of European
banks: A cross‐sectional and dynamic panel analysis. The Manchester
School, 72(3), 363-381.
Goddard, J., Wilson, J., & Blandon, P. (2002). Panel tests of Gibrat’s law for Japanese
manufacturing. International Journal of Industrial Organization, 20(3), 415-
433.
Graham, J. R., & Leary, M. T. (2011). A review of empirical capital structure research
and directions for the future. Annuual Review of Finance and Economics, 3(1),
309-345.
Greenwood, J., & Jovanovic, B. (1990). Financial development, growth, and the
distribution of income-Part-1. Journal of Political Economy 98(5), 1076-1107.
Grienitz, V., & Schmidt, A. M. (2012). Anticipation of developments in industry
sectors with future scenarios and creation of business models using a multi-
stakeholder approach. International Journal of Foresight & Innovation
Policy, 8(4), 335-353.
Gschwandtner, A. (2005). Profit persistence in the ‘very’long run: evidence from
survivors and exiters. Applied Economics, 37(7), 793-806.
Hamilton, O., Shapiro, D., & Vining, A. (2002). The growth patterns of Canadian high-
tech firms. International Journal of Technology Management, 24(4), 458-472.

227
Hansen, L. P. (1982). Large sample properties of generalized method of moments
estimators. Econometrica: Journal of the Econometric Society, 1029-1054.
Hanson, R. C. (1992). Tender offers and free cash flow: An empirical analysis.
Financial Review, 27(2), 185-209.
Hassan, M. K., & Halbouni, S. S. (2013). Corporate governance, economic turbulence
and financial performance of UAE listed firms. Studies in Economics and
Finance, 30(2), 118-138.
Hatemi-J, A. (2016). On the tourism-led growth hypothesis in the UAE. Applied
Economics Letters, 23(6), 424-427.
Hitt, M. A., Hoskisson, R. E., & Kim, H. (1997). International diversification: Effects
on innovation and firm performance in product-diversified firms. Academy of
Management Journal, 40(4), 767-798.
Höbarth, L. L. (2006). Modeling the relationship between financial indicators and
company performance: An empirical study for US-listed companies-PhD
dissetation- WU Vienna University of Economics and Business [Unpublished].
Hofer, C. W. , Murray, E. A., Charon, R., & Pitts, R. A. (1984) Strategic management:
A casebook in policy and planning. 2nd edition. St. Paul, MN: West Publ.
Hyun-Han, S., & Soenen, L. (1998). Efficiency of working capital management and
corporate profitability. Financial Practice & Education, 8(2), 37-45.
Jensen, M. C. (1986). Agency costs of free cash flow, corporate finance, and takeovers.
The American Economic Review, 76(2), 323-329.
Jensen, M. C., & Meckling, W. H. (1976). Theory of the firm: Managerial behavior,
agency costs and ownership structure. Journal of Financial Economics, 3(4),
305-360.
Jensen, M. C., & Murphy, K. J. (1990). Performance pay and top-management
incentives. Journal of Political Economy, 98(2), 225-264.
Jensen, S. (2018). Policy Implications of the UAE’s economic diversification strategy:
prioritizing national objectives. In Economic Diversification in the Gulf Region,
Volume II (pp. 67-88). Singapore: Palgrave Macmillan.
Johansson, J. K., & Yip, G. S. (1994). Exploiting globalization potential: U.S. and
Japanese strategies. Strategic Management Journal, 15(8), 579-601.

228
Johnson, R., & Soenen, L. (2003). Indicators of successful companies. European
Management Journal, 21(3), 364-369.
Johnson, R., & Soenen, L. (2003). Indicators of Successful Companies. European
Management Journal, 21(3), 364-369.
Jovanovic, B. (1982). Selection and the evolution of industry. Econometrica, 50(3),
649-670.
Kang, P., & Hu, Z. (2009). Organization cost, sales, general and administrative
expenses and management cost (v.1; p.243-249). In The 2009 IEEE Information
Management, Innovation Management & Industrial Engineering, 26-27
December 2009, Xian, China.
Kaplan, S. N., & Ruback, R. S. (1995). The valuation of cash flow forecasts: An
empirical analysis. The Journal of Finance, 50(4), 1059-1093.
Keats, B. W., & Hitt, M. A. (1988). A causal model of linkages among environmental
dimensions, macro organizational characteristics, and performance. The
Academy of Management Journal, 31(3), 570-598.
Kern, S. (2012). GCC financial markets: Long-term prospects for finance in the Gulf
region [Report]. Frankfurt: Deutsche Bank Research.
Kiani, K. M., Chen, E. H., & Madjd-Sadjadi, Z. (2012). Financial factors and firm
growth: evidence from financial data on Taiwanese firms. Quantitative Finance,
12(8), 1299-1314.
Kim, J.-B., Chung, R., & Firth, M. (2005). Earnings management, surplus free cash
flow, and external monitoring. Journal of Business Research, 58(6), 766-776.
King, R. G., & Levine, R. (1993). Finance, entrepreneurship and growth. Journal of
Monetary Economics, 32(3), 513-542.
Kung, M., Monroe, K. B., & Cox, J. L. (2002). Pricing on the Internet. Journal of
Product & Brand Management, 11(5), 274-288.
Laxmi Chand, B. (1988). Debt/equity ratio and expected common stock returns:
Empirical evidence. The Journal of Finance, 43(2), 507-528.
Leland, H. E. (1998). Agency costs, risk management, and capital structure. The
Journal of Finance, 53(4), 1213-1243.
229
Levine, R. (1991). Stock markets, growth, and tax policy. The Journal of Finance,
46(4), 1445-1465.
Liu, W.-C., & Hsu, C.-M. (2006). Financial structure, corporate finance and growth of
Taiwan's manufacturing firms. Review of Pacific Basin Financial Markets and
Policies, 9(01), 67-95.
Lotti, F., & Santarelli, E. (2001). Is firm growth proportional? An appraisal of firm
size distribution. Economics Bulletin, 12(6), 1-7.
Madura, J., & Richie, N. (2007). Global valuation of equity: One market is correcting
another. International Journal of Managerial Finance, 3(2), 178-190.
Majumdar, S. K., & Chhibber, P. (1999). Capital structure and performance: Evidence
from a transition economy on an aspect of corporate governance. Public Choice,
98(3-4), 287-305.
Mansfield, E. (1962). Entry, Gibrat's law, innovation, and the growth of firms. The
American Economic Review, 52(5), 1023-1051.
Marashdeh, H., & Shrestha, M. B. (2008). Efficiency in emerging markets-evidence
from the Emirates securities market. European Journal of Economics, Finance
and Administrative Sciences, 12, 143-150.
Margarethe, F. W., & Liebeskind, J. P. (1995). The effects of leveraged buyouts on
corporate growth and diversification in large firms. Strategic Management
Journal, 16(6), 447-460.
Marquardt, C. A., & Wiedman, C. I. (2004). The effect of earnings management on
the value relevance of accounting information. Journal of Business Finance &
Accounting, 31(3/4), 297-332.
Marris, R. (1964). The economics of capital utilisation: A report on multiple-shift work
(University of Cambridge, Department of Applied Economic; monograph n.
10). London: Cambridge University Press Archive.
Mass, N. J. (2005). The relative value of growth. Harvard Business Review, 83(4),
102-112.
Mayer, C. (1998). Financial systems and corporate governance: a review of the
international evidence. Journal of Institutional and Theoretical Economics,
154(1), 144-165.

230
Merton, H. M. (1977). Debt and taxes. The Journal of Finance, 32(2), 261-275.
Mikkelson, W. H. (1984). On the existence of an optimal capital structure: Theory and
evidence- Discussion. The Journal of Finance, 39(3), 878-880.
Mikkelson, W. H., & Partch, M. M. (2003). Do persistent large cash reserves hinder
performance? Journal of Financial and Quantitative Analysis, 38(2), 275-294.
Modigliani, F., & Merton, H. M. (1963). Corporate income taxes and the cost of
capital: A correction. The American Economic Review, 53(3), 433-443.
Modigliani, F., & Merton, H. M. (1963). Corporate income taxes and the cost of
capital: A correction. The American Economic Review, 53(3), 433-443.
Modigliani, F., & Miller, M. H. (1958). The cost of capital, corporation finance and
the theory of investment. The American Economic Review, 48(3), 261-297.
Montgomery, C. A. (1994). Corporate diversification. The Journal of Economic
Perspectives, 8(3), 163-178.
Moustafa, M. A. (2013). The effect of the corporatization of Dubai Financial Market
on its efficiency: An Empirical study. EJEFAS, 60 (2013), 12p. Retrieved from
https://ssrn.com/abstract=2357829
Myers, S. C. (1984). The capital structure puzzle. Journal of Finance, 39(3), 574-592.
Naceur, S. B., Ghazouani, S., & Omran, M. (2007). The performance of newly
privatized firms in selected MENA countries: The role of ownership structure,
governance and liberalization policies. International Review of Financial
Analysis, 16(4), 332-353.
Nakano, A., & Kim, D. (2011). Dynamics of growth and profitability: The case of
Japanese manufacturing firms. Global Economic Review, 40(1), 67-81.
Nohria, N., & Ghoshal, S. (1994). Differentiated fit and shared values: Alternatives
for managing headquarter-subsidiary relation. Strategic Management Journal,
15(6), 491-502.
Nohria, N., Joyce, W., & Roberson, B. (2003). What really works. Harvard Business
Review, 81(7), 42-52.
Ohmae, K. (1982). The mind of the strategist: the art of Japanese management
(various pages). New York: McGraw-Hill.
231
Oliveir a, B., & Fortunato, A. (2006). Firm growth and liquidity constraints: A
dynamic analysis. Small business economics, 27(2), 139-156.
Opler, T., Pinkowitz, L., Stulz, R., & Williamson, R. (1999). The determinants and
implications of corporate cash holdings. Journal of Financial Economics,
52(1), 3-46.
Otman, K. A. M. (2014). Corporate governance and firm performance in listed
companies in the United Arab Emirates- Doctoral dissertation, Victoria
University, Australia [Unpublished].
Ozkan, A., & Ozkan, N. (2004). Corporate cash holdings: An empirical investigation
of UK companies. Journal of Banking & Finance, 28(9), 2103-2134.
Öztekin, Ö. (2015). Capital structure decisions around the world: Which factors are
reliably important? Journal of Financial and Quantitative Analysis, 50(03), 301-
323.
Patel, N., & Bhatt, V. (2013). Capital structure and profitability: Case of national stock
exchange. Indian Journal of Applied Research, 3(4), 276-260.
Patel, N., & Bhatt, V. (2013). Capital structure and profitability: Case of national stock
exchange. Indian Journal of Applied Research, 3(4), 276-260.
Pearson, K. (1894). Contributions to the mathematical theory of evolution.
Philosophical Transactions of the Royal Society of London. A, 185, 71-110.
Penrose, E. T. (1959). The theory of the growth ofthe firm (various pages). New York:
Sharpe Publisher.
Peteraf, M. A. (1992). A review of ghemawat's commitment: The dynamic of strategy.
Journal of Economics & Management Strategy, 1(3), 575-582.
Peter, T. J., & Waterman, R. H. (1982). In search of excellence: Lessons from
America’s best-run companies (various pages). New York: Warner Book.
Pickernell, D., & Hermyt, J. (1999). Succeeding in the post-BSE UK meat, poultry and
cheese processing and packaging industries. British Food Journal, 101(1), 32-
44.
Pinkowitz, L., & Williamson, R. (2001). Bank power and cash holdings: Evidence
from Japan. The Review of Financial Studies, 14(4), 1059-1082.
232
Pinkowitz, L., & Williamson, R. (2002). What is a dollar worth? The market value of
cash holdings. Retrieved from SSRN: https://ssrn.com/abstract=355840
Pinkowitz, L., Stulz, R., & Williamson, R. (2006). Does the contribution of corporate
cash holdings and dividends to firm value depend on governance? A cross‐
country analysis. The Journal of Finance, 61(6), 2725-2751.
Rajan, R. G., & Zingales, L. (1995). What do we know about capital structure? Some
evidence from international data. The Journal of Finance, 50(5), 1421-1460.
Rao, A. (2008). Analysis of volatility persistence in Middle East emerging equity
markets. Studies in Economics and Finance, 25(2), 93-111.
Renaud, B. (2012). Real estate bubble and financial crisis in Dubai: Dynamics and
policy responses. Journal of Real Estate Literature, 20(1), 51-77.
Richards, V. D., & Laughlin, E. J. (1980). A Cash Conversion Cycle Approach to
Liquidity Analysis. Financial Management (1972), 9(1), 32-38.
Ritter, J. R. (2012). Is economic growth good for investors? Journal of Applied
Corporate Finance, 24(3), 8-18.
Robson, P. J., & Bennett, R. J. (2000). SME growth: The relationship with business
advice and external collaboration. Small Business Economics, 15(3), 193-208.
Roodman, D. (2009). A note on the theme of too m any instruments. Oxford Bulletin
of Economics and statistics, 71(1), 135-158.
Roper, S. (1999). Modelling small business growth and profitability. Small Business
Economics, 13(3), 235-252.
Rosenberg, B., Reid, K., & Lanstein, R. (1985). Persuasive evidence of market
inefficiency. The Journal of Portfolio Management, 11(3), 9-16.
Ross, S. A., Cox, J. C., & Ingersoll Jr, J. E. (2005). A theory of the term structure of
interest rates. In Theory of Valuation (p. 129-164). Singapore: World Scientific.
Rouwenhorst, K. G. (1999). Local return factors and turnover in emerging stock
markets. The Journal of Finance, 54(4), 1439-1464.
Rumelt, R. P. (1997). Towards a strategic theory of the firm (p.131-145). In N. J. Foss
(Ed.): Resources, firms, and strategies: A reader in the resource-based
perspective. London: Oxford University Press.

233
Salameh, H. M., & Alzubi, B. (2018). An investigation of stock market volatility:
Evidence from Dubai financial market. Journal of Economic and
Administrative Sciences. https://doi.org/10.1108/JEAS-04-2017-0020
Salim, M., & Yadav, R. (2012). Capital structure and firm performance: Evidence from
Malaysian listed companies. Procedia-Social and Behavioral Sciences, 65, 156-
166.
Security and Commodity Authority (SCA). SCA official reports. Retrieved from:
http://www.sca.gov.ae
Sercu, P., Vander-Bauwhede, H., & Willekens, M. (2002). Earnings quality in
privately held firms: The roles of external audits, stakeholders, and governance
mechanisms (Research report; n. 0235). Leuven: Katholieke Universiteit
Leuven, Belgium.
Serrasqueiro, Z. M., Nunes, P. J. M., & Sequeira, T. N. (2007). Firms' growth
opportunities and profitability: a nonlinear relationship. Applied Financial
Economics Letters, 3(6), 373-379.
Serrasqueiro, Z. M., Nunes, P. J. M., & Sequeira, T. N. (2009). Profitability in
Portuguese service industries: A panel data approach. The Service Industries
Journal, 29(5), 693-707.
Shyam-Sunder, L., & Myers, S. C. (1999). Testing static tradeoff against pecking order
models of capital structure. Journal of Financial Economics, 51(2), 219-244.
Siegel, J. J., & Coxe, D. G. (2002). Stocks for the long run. New York: McGraw-Hill.
Simmonds, P. G., & Lamont, B. T. (1996). Product-market/international
diversification and corporate performance. International Journal of
Organizational Analysis, 4(3), 252.
Singh, A., & Whittington, G. (1975). The size and growth of firms. The Review
ofEconomic Studies, 42(1), 15-26.
Singh, P., & Kumar, B. (2008). Trade-off theory or pecking order theory: What
explains the behaviour of the Indian firms? Retrieved from:
https://ssrn.com/abstract=1263226
Slater, S. F., & Zwirlein, T. J. (1996). The structure of financial strategy: Patterns in
financial decision making. Managerial and Decision Economics, 17(3), 253-
266.
234
Smith, R. L., & Kim, J.-H. (1994). The combined effects of free cash flow and financial
slack on bidder and target stock returns. Journal of Business, 67(2), 281-310.
Stattman, D. (1980). Book values and stock returns. The Chicago MBA, 4(1), 25-45.
Suetin, A. (2011). Post-crisis developments in international financial markets.
International Journal of Law and Management, 53(1), 51-61.
Teece, D. J., Pisano, G., & Shuen, A. (1997). Dynamic capabilities and strategic
management. Strategic Management Journal, 18(7), 509-533.
Teoh, S. H., Welch, I., & Wong, T. J. (1998). Earnings management and the long-run
market performance of initial public offerings. The Journal of Finance, 53(6),
1935-1974.
Teoh, S. H., Welch, I., & Wong, T. J. (1998). Earnings management and the
underperformance of seasoned equity offerings1. Journal of Financial
Economics, 50(1), 63-99.
Thompson, J. L. (1998). Competency and measured performance outcomes. Journal
of Workplace Learning, 10(5), 219-231.
Ukaegbu, B. (2014). The significance of working capital management in determining
firm profitability: Evidence from developing economies in Africa. Research in
International Business and Finance, 31(0), 1-16.
Utton, M. A. (1971). The effect of mergers on concentration: UK manufacturing
industry, 1954-65. The Journal of Industrial Economics, 20(1), 42-58.
Vãidean, V. L. (2014). On financial performance and capital structure of Romanian
companies. Finante-provocarile Viitorului (Finance-Challenges of Future),
1(16), 151-157.
Wagner, J. (2012a). Exports, imports and profitability: First evidence for
manufacturing enterprises. Open Economies Review, 23(5), 747-765.
Wagner, J. (2012b). International trade and firm performance: a survey of empirical
studies since 2006. Review of World Economics, 148(2), 235-267.
Wagner, J. (2013). Exports, imports and firm survival: first evidence for
manufacturing enterprises in Germany. Review of World Economics, 149(1),
113-130.

235
Wagner, S. M., Grosse-Ruyken, P. T., & Erhun, F. (2012). The link between supply
chain fit and financial performance of the firm. Journal of Operations
Management, 30(4), 340-353.
Wernerfelt, B. (1984). A resource‐based view of the firm. Strategic Management
Journal, 5(2), 171-180.
Woo, C. Y., Willard, G. E., & Daellenbach, U. S. (1992). Spin-off performance: A
case of overstated expectations? Strategic Management Journal, 13(6), 433-
447.
Yusuff, R. M. (2004). Manufacturing best practices of the electric and electronic firms
in Malaysia. Benchmarking, 11(4), 361-369.
Zajac, E. J., Kraatz, M. S., & Bresser, R. K. (2000). Modelling the dynamics of
strategic fit: A normative approach to strategic change. Strategic Management
Journal, 21(4), 429-453.
Zeitun, R., & Tian, G. G. (2007). Capital structure and corporate performance:
evidence from Jordan, Australasian Accounting, Business and Finance
Journal, 1(4), 41-61.
Zuca, M. R. (2013). The accounting treatment of asset depreciation and the impact on
result. Annals of the University of Petrosani Economics, 13(2), 271-280.
236
Appendix: Introducing Taxation System (VAT) in the UAE
While this dissertation turned to close, the Federal UAE Government introduced
taxation system, as value-added tax (VAT) on consuming items and services for the
first time. The exceptions are those related to health and educational services, along
with properties. Taxation as per se has not practised within the free economy paradigm
that adopted by the UAE since its establishment.
Based on the unavailability of taxation system in that time, in the Global
Competitiveness Index (2015/2016), the World Economic Forum (WEF) ranked the
UAE as i) the first in effect of taxation on incentives to work and ii) the second in
effect of taxation on incentives to invest. However, the GCC countries, including the
UAE, decided to introduce the Value-added-Tax (VAT) as 5% of the value of the
provided services/products starting from January 2018.
This procedure, in principle, could re-rank UAE’s position in the Global
Competitiveness Index. Nevertheless, it is not expected to have a resilient impact on
investment or doing business due to the facts that:
1] The VAT is tolerated by the end-users/customers, not the business/companies,
despite that companies will pay taxes (as a customer) when they purchase or
pay for services and products, most of this amount is reimbursable,
2] The VAT is a well-known tax applied in most of the world countries with a
higher rate that the applied in the UAE, which make the VAT introduction in
the GCC/UAE is absorbable by the companies, especially for the multi-
national companies (MNC),
237
3] In the UAE the VAT is applicable for specific products and services, while the
main living products and services like: education except for higher education,
treatment medical services, transportation, residential real-estate, government
services, exporting, non-profit organisations and the like are exempted.
The Modigliani and Miller (M&M) modified theory of corporate finance (1963) which
incorporate the tax effects, has been proven worldwide for a long time. However, there
was no sufficient studied to examine it in the GCC countries since the taxation system
is introduced ever in 2018. The potential impact of taxes can be the additional approach
of further study. Nevertheless, we do not expect a significant impact of the VAT on
the companies since this taxation system does not impose direct taxes on doing
business or making profits.