Semiconductor quantum dots for multiplexed bio-detection on solid-state microarrays
Upload
rockefellerCategory
view
0download
0
BioMed CentralBMC Bioinformatics
ss
Open AcceMethodology article"Harshlighting" small blemishes on microarraysMayte Suárez-Fariñas*1, Asifa Haider2 and Knut M Wittkowski*3Address: 1Center for Studies in Physics and Biology, The Rockefeller University, 1230 York Ave, Box 212, New York, NY 10021, USA, 2Laboratory of Investigative Dermatology, The Rockefeller University, 1230 York Ave, Box 178, New York, NY 10021, USA and 3General Clinical Research Center, The Rockefeller University, 1230 York Ave, Box 322, New York, NY 10021, USA
Email: Mayte Suárez-Fariñas* - [email protected]; Asifa Haider - [email protected]; Knut M Wittkowski* - [email protected]
* Corresponding authors
AbstractBackground: Microscopists are familiar with many blemishes that fluorescence images can havedue to dust and debris, glass flaws, uneven distribution of fluids or surface coatings, etc. Microarrayscans show similar artefacts, which affect the analysis, particularly when one tries to detect subtlechanges. However, most blemishes are hard to find by the unaided eye, particularly in high-densityoligonucleotide arrays (HDONAs).
Results: We present a method that harnesses the statistical power provided by having severalHDONAs available, which are obtained under similar conditions except for the experimentalfactor. This method "harshlights" blemishes and renders them evident. We find empirically thatabout 25% of our chips are blemished, and we analyze the impact of masking them on screening fordifferentially expressed genes.
Conclusion: Experiments attempting to assess subtle expression changes should be carefullyscreened for blemishes on the chips. The proposed method provides investigators with a novelrobust approach to improve the sensitivity of microarray analyses. By utilizing topologicalinformation to identify and mask blemishes prior to model based analyses, the method preventsartefacts from confounding the process of background correction, normalization, andsummarization.
BackgroundAnalysis of hybridized microarrays starts with scanningthe fluorescent image. For high-density oligonucleotidearrays (HDONAs) such as Affymetrix GeneChip® oligonu-cleotide (Affy) arrays, the focus of this paper, eachscanned image is stored pixel-by-pixel in a 'DAT' file. Asthe first step in measuring intensity of the hybridizationsignal, a grid is overlaid, the image is segmented into spotsor features, and the pixel intensities within each of theseare summarized as a probe intensity estimate (See reviews[1] and [2] for cDNA chips). The probe-level intensity esti-
mates are stored in a 'CEL' file. Each gene is represented bypairs of probes, each representing another characteristicsequences and a 'mismatch', which is identical, except forthe Watson-Crick complement in the center. Expressionof a gene is estimated from such a probe set by applyingalgorithms for background correction, normalization,and summarization.
The quality of data scanned from a microarray is affectedby a plethora of potential confounders, which may actduring printing/manufacturing, hybridization, washing,
Published: 22 March 2005
BMC Bioinformatics 2005, 6:65 doi:10.1186/1471-2105-6-65
Received: 26 October 2004Accepted: 22 March 2005
This article is available from: http://www.biomedcentral.com/1471-2105/6/65
© 2005 Suárez-Fariñnas et al; licensee BioMed Central Ltd. This is an Open Access article distributed under the terms of the Creative Commons Attribution License (http://creativecommons.org/licenses/by/2.0), which permits unrestricted use, distribution, and reproduction in any medium, provided the original work is properly cited.
Page 1 of 14(page number not for citation purposes)
BMC Bioinformatics 2005, 6:65 http://www.biomedcentral.com/1471-2105/6/65
and reading. Each chip contains a number of probes spe-cifically designed to assess the overall quality of the bio-chemistry, such as 'checkerboards' in the corners andborders, whose purpose is, e.g., to indicate problems withthe biotinylated B2 hybridization. Affymetrix softwareprovides for a number of criteria to assess the overall qual-ity of a chip, such as percent present calls, scaling factor,background intensity, and overall pixel-to-pixel variation(raw Q). Software packages such as Bioconductor for R [3]have implemented biochemical quality control tools suchas RNA degradation plots. If a quality problem is found,however, these criteria and tools do not easily suggest aremedy and they have little sensitivity to detect localizedartefacts, like a speck of dust or a localized hybridizationproblem. Although such physical blemishes obviouslyaffect the expression estimates, they have hitherto beenonly narrowly addressed in the literature. Thus, there arecurrently no safeguards to signal potential physical blem-ishes. Instead, researchers are merely advised to carefullyinspect the chip images visually [4,5]. Given the high var-iance among the hundreds of thousands of probes andtheir random allocation on the chip, it is impossible tovisually detect any but the starkest artefacts. For two-col-our cDNA arrays, a Bayesian network approach has beenproposed [6], based on the 'features' of the pixel distribu-tion within each probe, yet, due to the standardized man-ufacturing process, the probes on an oligonucleotide arrayhave too few 'features' for such an approach to beeffective.
As the price of microarrays continues to drop, a typicalmicroarray experiment now contains several chips, eachrepresenting a sample obtained under conditions thatwere similar except for the experimental factor underinvestigation. Having collections of chips available offersnew strategies not only for analyzing the effect of theexperimental factor, but also for identifying blemishes.The power of having several chips available was first har-nessed for estimating mRNA expression levels by the'robust multichip average' (RMA) method [7]. One of theassumptions underlying the RMA model is that probesacross chips are highly correlated, due to differences intheir affinity [8,9] and because only a small proportion ofgenes are differentially expressed in any experimental set-ting. This correlation should be even higher for the mis-matches, because they are less likely to be affected by thespecific changes in gene expression induced by the exper-imental factor. Given the volume of pixel level data, (>50megapixels per image) it is desirable to devise algorithmsthat work from the 100 times smaller probe level files, thesame information used in traditional signal value estima-tion approaches.
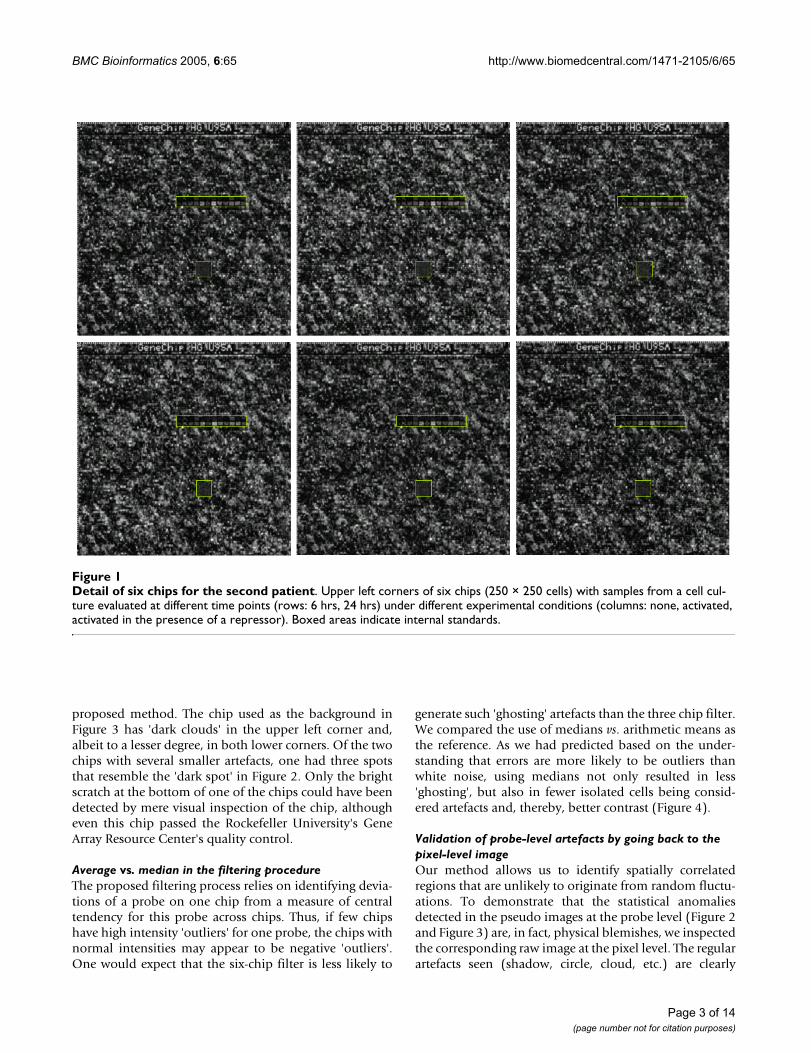
Figure 1 shows how the large probe-to-probe variance canobscure the subtle changes caused by all but the starkest
blemishes. Since probes vary in intensity by four orders ofmagnitude, a biologically relevant change of 30% inbrightness in a small region can easily go undetected. Infact one of the chips shown in Figure 1 is affected by sev-eral blemishes. However, Figure 1 shows that not only dothe internal standards have a very consistent pattern, asone would expect, but also that high expression values arecorrelated across chips. As we will show, drawing on thesecorrelations allows for a simple and efficient method toidentify areas on individual chips where the assumptionof spatially uncorrelated errors is clearly violated. We shalluse the chip-to-chip correlation to devise a 'harshlight'that makes the blemishes stand out.
ResultsDataPsoriasis is thought to be due to an overly active immunesystem [10,11]. To study how the immune response ofleukocytes isolated from blood can be affected by drugsthat may serve to control autoimmune diseases like pso-riasis, blood was drawn from five volunteers under a pro-tocol that had been approved by The RockefellerUniversity Hospital Institutional Review Board [12].
For each subject, peripheral blood mononuclear cells(PBMCs) were isolated and cultured in six Petri dishes.Four cultures were activated with an anti CD3/CD28 anti-body, two of which were pre-treated with a repressor drug.Two cultures served as control without drug or activation.One of the two sets of control, activated, and pre-treatedcultures (subject 1 and 2) was analyzed after 6, the otherafter 24 hrs. (For subjects 3, 4, and 5, only one time pointis available.) All samples were hybridized to AffymetrixHuU95av2 chips.
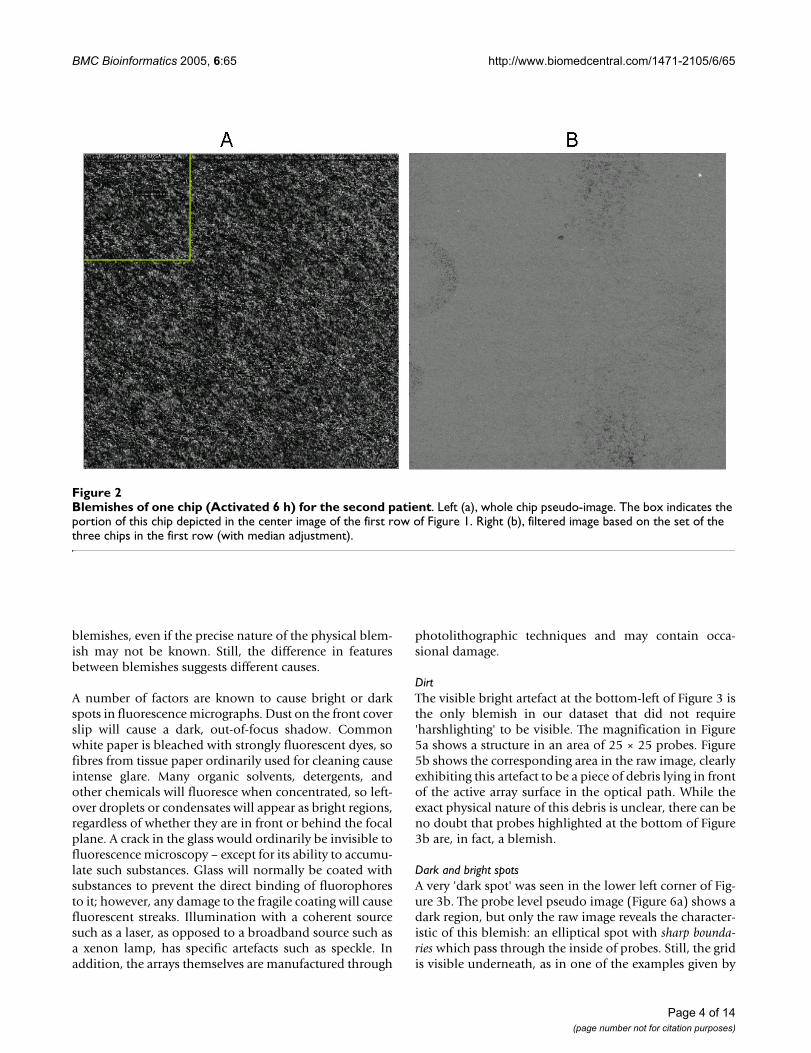
Artefacts identified on probe-level (CEL) filesFigure 1 displays the six chips obtained from one subject'sPBMC sample. This subject was chosen because one of thechips (upper row, centre) exhibits a variety of blemishes,which are discussed below, see Figure 2b: a 'bright spot' inthe upper-right corner, a 'dark spot' in the upper centre,'dark clouds' in the upper and lower right centre, and two'shadowy circles' reaching beyond the left border. Part ofthe upper circle is included in the chip portion depicted inFigure 1.
Similar results were obtained for all subjects (data notshown). None of the artefacts would have been detectedby visual inspection of the pseudo image (Figure 2a). Evenafter having seen the filtered image, most blemishes aredifficult to identify at best. Interestingly, some chipsappear to have a preponderance of specific artefacts, sug-gesting that at least some of the blemishes are caused byspecific environmental factors during hybridization, andproviding the first indication for the validity of the
Page 2 of 14(page number not for citation purposes)
BMC Bioinformatics 2005, 6:65 http://www.biomedcentral.com/1471-2105/6/65
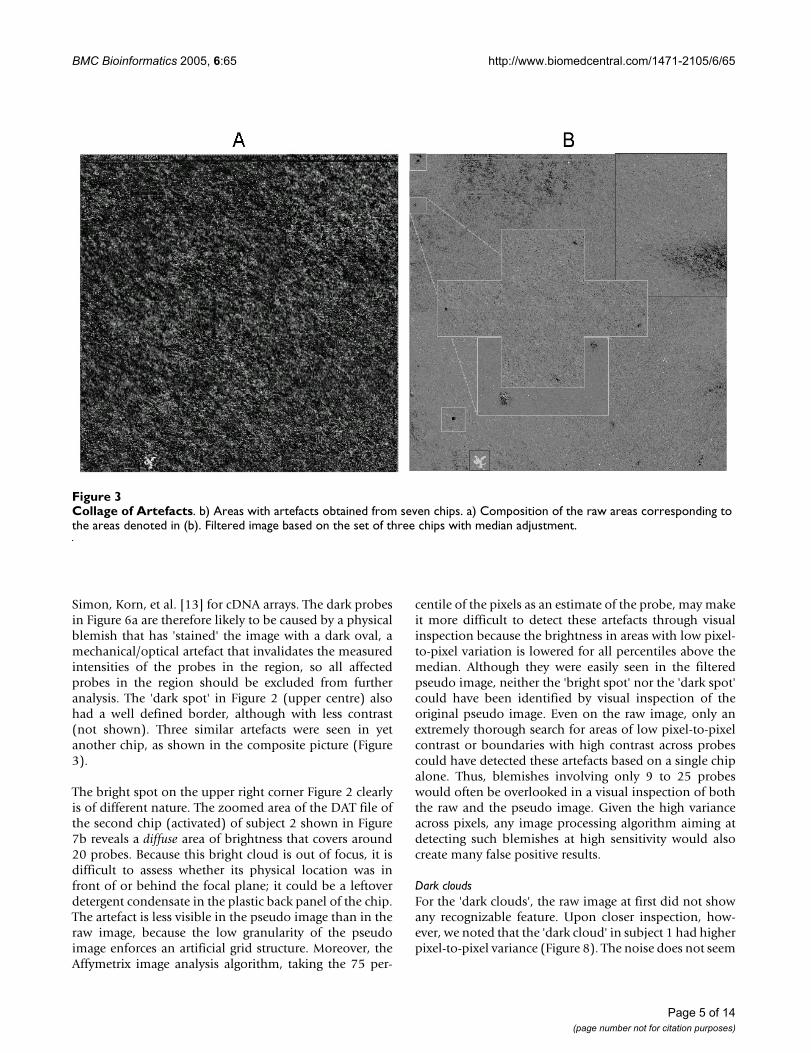
proposed method. The chip used as the background inFigure 3 has 'dark clouds' in the upper left corner and,albeit to a lesser degree, in both lower corners. Of the twochips with several smaller artefacts, one had three spotsthat resemble the 'dark spot' in Figure 2. Only the brightscratch at the bottom of one of the chips could have beendetected by mere visual inspection of the chip, althougheven this chip passed the Rockefeller University's GeneArray Resource Center's quality control.
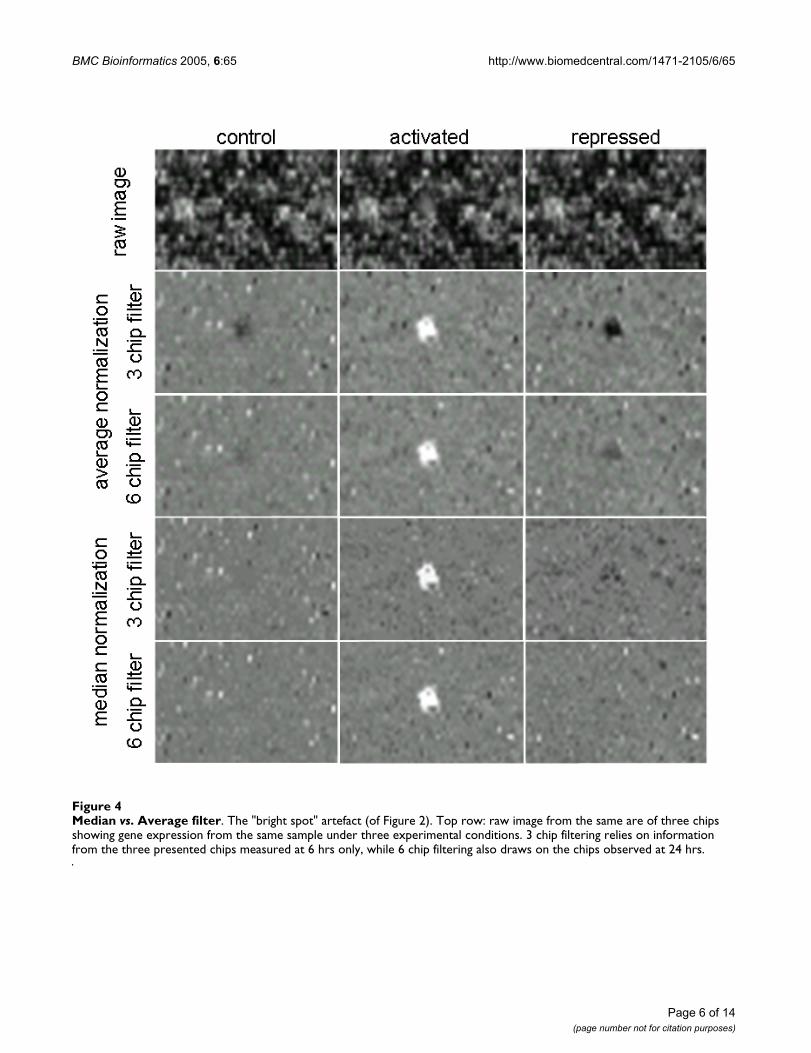
Average vs. median in the filtering procedureThe proposed filtering process relies on identifying devia-tions of a probe on one chip from a measure of centraltendency for this probe across chips. Thus, if few chipshave high intensity 'outliers' for one probe, the chips withnormal intensities may appear to be negative 'outliers'.One would expect that the six-chip filter is less likely to
generate such 'ghosting' artefacts than the three chip filter.We compared the use of medians vs. arithmetic means asthe reference. As we had predicted based on the under-standing that errors are more likely to be outliers thanwhite noise, using medians not only resulted in less'ghosting', but also in fewer isolated cells being consid-ered artefacts and, thereby, better contrast (Figure 4).
Validation of probe-level artefacts by going back to the pixel-level imageOur method allows us to identify spatially correlatedregions that are unlikely to originate from random fluctu-ations. To demonstrate that the statistical anomaliesdetected in the pseudo images at the probe level (Figure 2and Figure 3) are, in fact, physical blemishes, we inspectedthe corresponding raw image at the pixel level. The regularartefacts seen (shadow, circle, cloud, etc.) are clearly
Detail of six chips for the second patientFigure 1Detail of six chips for the second patient. Upper left corners of six chips (250 × 250 cells) with samples from a cell cul-ture evaluated at different time points (rows: 6 hrs, 24 hrs) under different experimental conditions (columns: none, activated, activated in the presence of a repressor). Boxed areas indicate internal standards.
Page 3 of 14(page number not for citation purposes)
BMC Bioinformatics 2005, 6:65 http://www.biomedcentral.com/1471-2105/6/65
blemishes, even if the precise nature of the physical blem-ish may not be known. Still, the difference in featuresbetween blemishes suggests different causes.
A number of factors are known to cause bright or darkspots in fluorescence micrographs. Dust on the front coverslip will cause a dark, out-of-focus shadow. Commonwhite paper is bleached with strongly fluorescent dyes, sofibres from tissue paper ordinarily used for cleaning causeintense glare. Many organic solvents, detergents, andother chemicals will fluoresce when concentrated, so left-over droplets or condensates will appear as bright regions,regardless of whether they are in front or behind the focalplane. A crack in the glass would ordinarily be invisible tofluorescence microscopy – except for its ability to accumu-late such substances. Glass will normally be coated withsubstances to prevent the direct binding of fluorophoresto it; however, any damage to the fragile coating will causefluorescent streaks. Illumination with a coherent sourcesuch as a laser, as opposed to a broadband source such asa xenon lamp, has specific artefacts such as speckle. Inaddition, the arrays themselves are manufactured through
photolithographic techniques and may contain occa-sional damage.
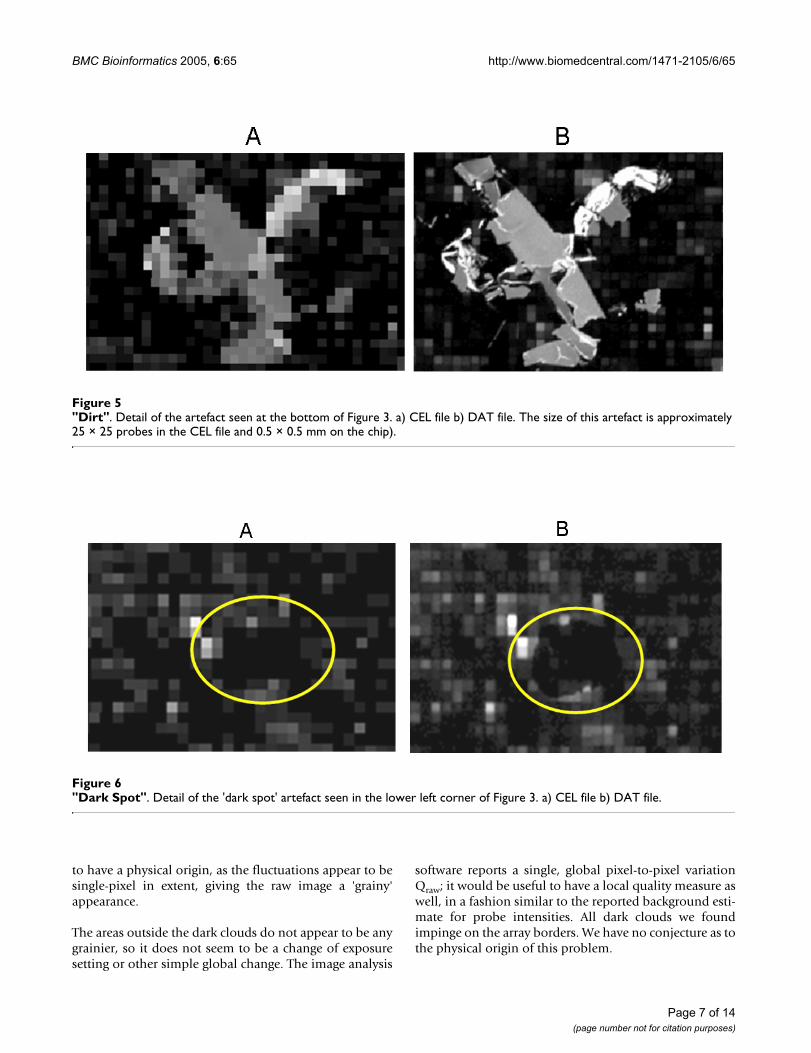
DirtThe visible bright artefact at the bottom-left of Figure 3 isthe only blemish in our dataset that did not require'harshlighting' to be visible. The magnification in Figure5a shows a structure in an area of 25 × 25 probes. Figure5b shows the corresponding area in the raw image, clearlyexhibiting this artefact to be a piece of debris lying in frontof the active array surface in the optical path. While theexact physical nature of this debris is unclear, there can beno doubt that probes highlighted at the bottom of Figure3b are, in fact, a blemish.
Dark and bright spotsA very 'dark spot' was seen in the lower left corner of Fig-ure 3b. The probe level pseudo image (Figure 6a) shows adark region, but only the raw image reveals the character-istic of this blemish: an elliptical spot with sharp bounda-ries which pass through the inside of probes. Still, the gridis visible underneath, as in one of the examples given by
Blemishes of one chip (Activated 6 h) for the second patientFigure 2Blemishes of one chip (Activated 6 h) for the second patient. Left (a), whole chip pseudo-image. The box indicates the portion of this chip depicted in the center image of the first row of Figure 1. Right (b), filtered image based on the set of the three chips in the first row (with median adjustment).
Page 4 of 14(page number not for citation purposes)
BMC Bioinformatics 2005, 6:65 http://www.biomedcentral.com/1471-2105/6/65
Simon, Korn, et al. [13] for cDNA arrays. The dark probesin Figure 6a are therefore likely to be caused by a physicalblemish that has 'stained' the image with a dark oval, amechanical/optical artefact that invalidates the measuredintensities of the probes in the region, so all affectedprobes in the region should be excluded from furtheranalysis. The 'dark spot' in Figure 2 (upper centre) alsohad a well defined border, although with less contrast(not shown). Three similar artefacts were seen in yetanother chip, as shown in the composite picture (Figure3).
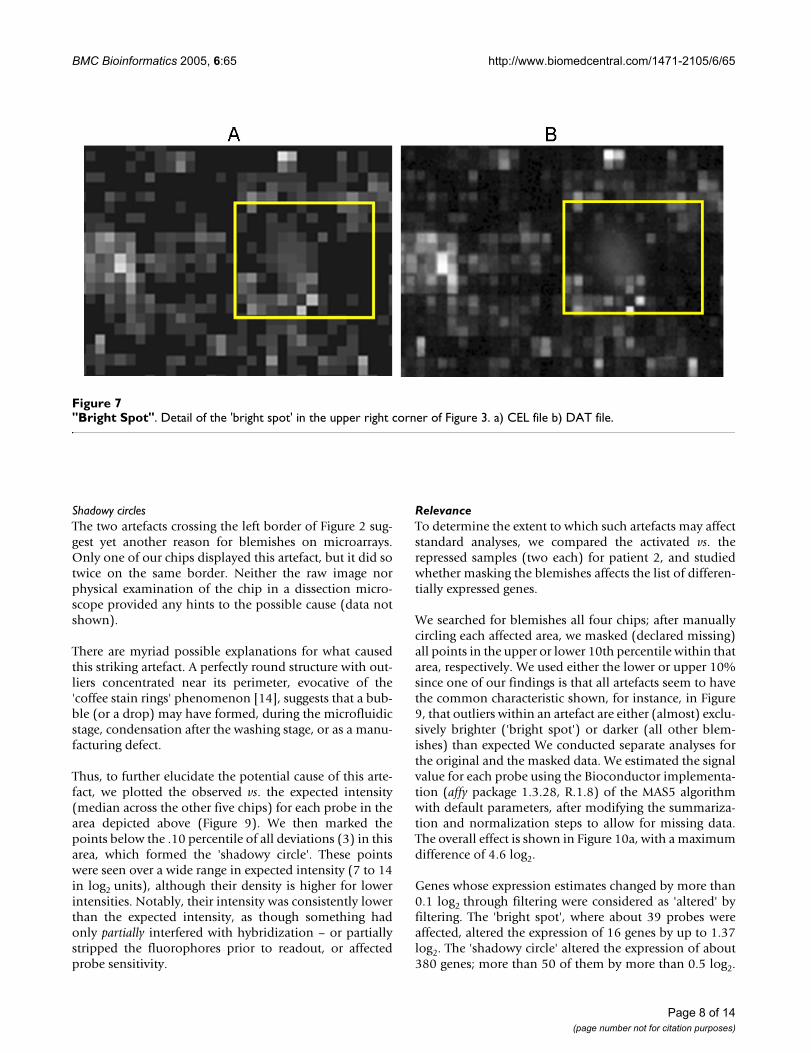
The bright spot on the upper right corner Figure 2 clearlyis of different nature. The zoomed area of the DAT file ofthe second chip (activated) of subject 2 shown in Figure7b reveals a diffuse area of brightness that covers around20 probes. Because this bright cloud is out of focus, it isdifficult to assess whether its physical location was infront of or behind the focal plane; it could be a leftoverdetergent condensate in the plastic back panel of the chip.The artefact is less visible in the pseudo image than in theraw image, because the low granularity of the pseudoimage enforces an artificial grid structure. Moreover, theAffymetrix image analysis algorithm, taking the 75 per-
centile of the pixels as an estimate of the probe, may makeit more difficult to detect these artefacts through visualinspection because the brightness in areas with low pixel-to-pixel variation is lowered for all percentiles above themedian. Although they were easily seen in the filteredpseudo image, neither the 'bright spot' nor the 'dark spot'could have been identified by visual inspection of theoriginal pseudo image. Even on the raw image, only anextremely thorough search for areas of low pixel-to-pixelcontrast or boundaries with high contrast across probescould have detected these artefacts based on a single chipalone. Thus, blemishes involving only 9 to 25 probeswould often be overlooked in a visual inspection of boththe raw and the pseudo image. Given the high varianceacross pixels, any image processing algorithm aiming atdetecting such blemishes at high sensitivity would alsocreate many false positive results.
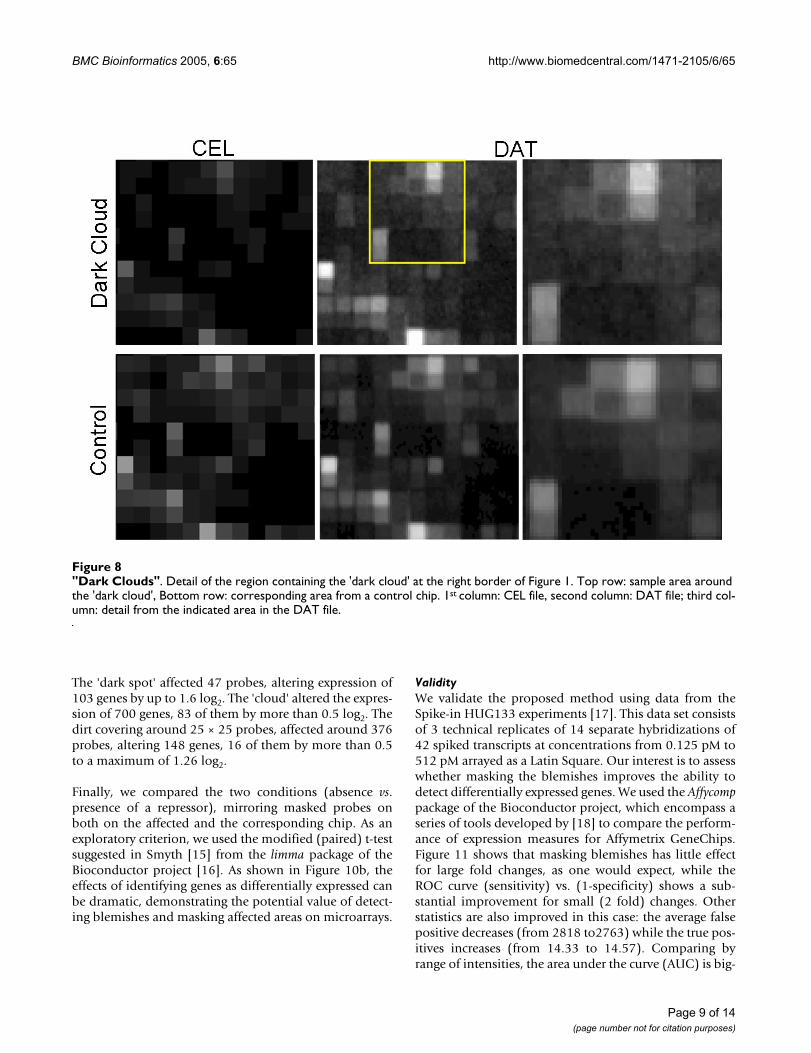
Dark cloudsFor the 'dark clouds', the raw image at first did not showany recognizable feature. Upon closer inspection, how-ever, we noted that the 'dark cloud' in subject 1 had higherpixel-to-pixel variance (Figure 8). The noise does not seem
Collage of ArtefactsFigure 3Collage of Artefacts. b) Areas with artefacts obtained from seven chips. a) Composition of the raw areas corresponding to the areas denoted in (b). Filtered image based on the set of three chips with median adjustment.
Page 5 of 14(page number not for citation purposes)
BMC Bioinformatics 2005, 6:65 http://www.biomedcentral.com/1471-2105/6/65
Median vs. Average filterFigure 4Median vs. Average filter. The "bright spot" artefact (of Figure 2). Top row: raw image from the same are of three chips showing gene expression from the same sample under three experimental conditions. 3 chip filtering relies on information from the three presented chips measured at 6 hrs only, while 6 chip filtering also draws on the chips observed at 24 hrs.
Page 6 of 14(page number not for citation purposes)
BMC Bioinformatics 2005, 6:65 http://www.biomedcentral.com/1471-2105/6/65
to have a physical origin, as the fluctuations appear to besingle-pixel in extent, giving the raw image a 'grainy'appearance.
The areas outside the dark clouds do not appear to be anygrainier, so it does not seem to be a change of exposuresetting or other simple global change. The image analysis
software reports a single, global pixel-to-pixel variationQraw; it would be useful to have a local quality measure aswell, in a fashion similar to the reported background esti-mate for probe intensities. All dark clouds we foundimpinge on the array borders. We have no conjecture as tothe physical origin of this problem.
"Dirt"Figure 5"Dirt". Detail of the artefact seen at the bottom of Figure 3. a) CEL file b) DAT file. The size of this artefact is approximately 25 × 25 probes in the CEL file and 0.5 × 0.5 mm on the chip).
"Dark Spot"Figure 6"Dark Spot". Detail of the 'dark spot' artefact seen in the lower left corner of Figure 3. a) CEL file b) DAT file.
Page 7 of 14(page number not for citation purposes)
BMC Bioinformatics 2005, 6:65 http://www.biomedcentral.com/1471-2105/6/65
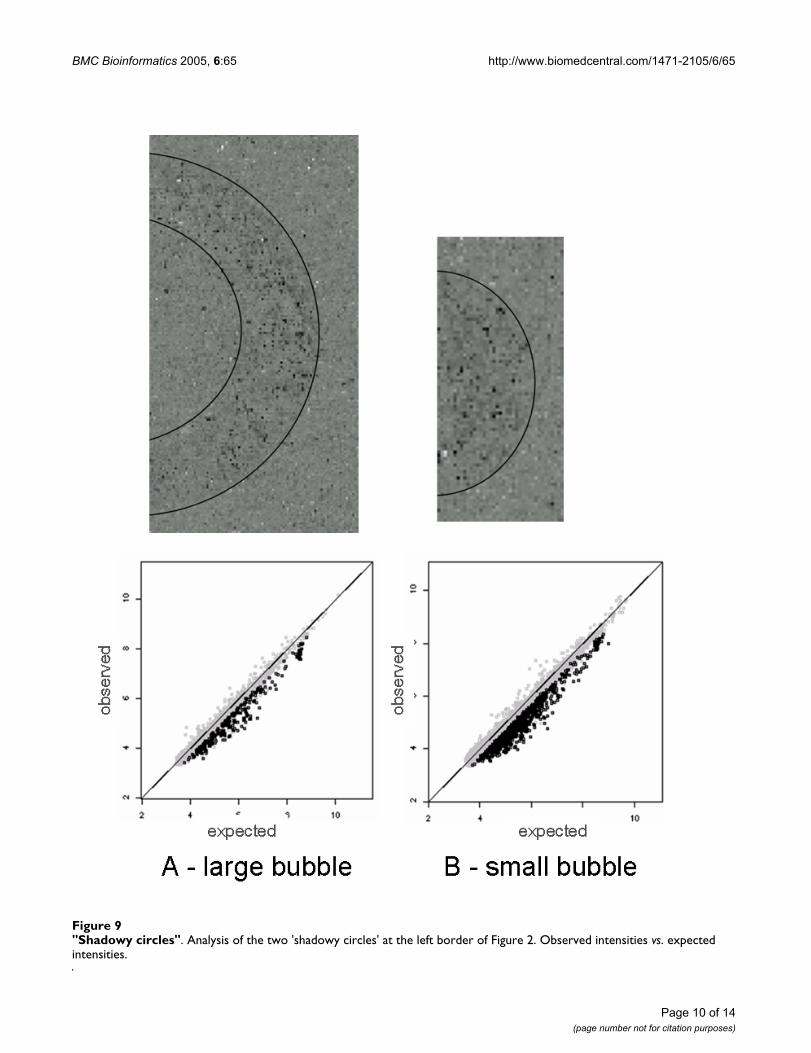
Shadowy circlesThe two artefacts crossing the left border of Figure 2 sug-gest yet another reason for blemishes on microarrays.Only one of our chips displayed this artefact, but it did sotwice on the same border. Neither the raw image norphysical examination of the chip in a dissection micro-scope provided any hints to the possible cause (data notshown).
There are myriad possible explanations for what causedthis striking artefact. A perfectly round structure with out-liers concentrated near its perimeter, evocative of the'coffee stain rings' phenomenon [14], suggests that a bub-ble (or a drop) may have formed, during the microfluidicstage, condensation after the washing stage, or as a manu-facturing defect.
Thus, to further elucidate the potential cause of this arte-fact, we plotted the observed vs. the expected intensity(median across the other five chips) for each probe in thearea depicted above (Figure 9). We then marked thepoints below the .10 percentile of all deviations (3) in thisarea, which formed the 'shadowy circle'. These pointswere seen over a wide range in expected intensity (7 to 14in log2 units), although their density is higher for lowerintensities. Notably, their intensity was consistently lowerthan the expected intensity, as though something hadonly partially interfered with hybridization – or partiallystripped the fluorophores prior to readout, or affectedprobe sensitivity.
RelevanceTo determine the extent to which such artefacts may affectstandard analyses, we compared the activated vs. therepressed samples (two each) for patient 2, and studiedwhether masking the blemishes affects the list of differen-tially expressed genes.
We searched for blemishes all four chips; after manuallycircling each affected area, we masked (declared missing)all points in the upper or lower 10th percentile within thatarea, respectively. We used either the lower or upper 10%since one of our findings is that all artefacts seem to havethe common characteristic shown, for instance, in Figure9, that outliers within an artefact are either (almost) exclu-sively brighter ('bright spot') or darker (all other blem-ishes) than expected We conducted separate analyses forthe original and the masked data. We estimated the signalvalue for each probe using the Bioconductor implementa-tion (affy package 1.3.28, R.1.8) of the MAS5 algorithmwith default parameters, after modifying the summariza-tion and normalization steps to allow for missing data.The overall effect is shown in Figure 10a, with a maximumdifference of 4.6 log2.
Genes whose expression estimates changed by more than0.1 log2 through filtering were considered as 'altered' byfiltering. The 'bright spot', where about 39 probes wereaffected, altered the expression of 16 genes by up to 1.37log2. The 'shadowy circle' altered the expression of about380 genes; more than 50 of them by more than 0.5 log2.
"Bright Spot"Figure 7"Bright Spot". Detail of the 'bright spot' in the upper right corner of Figure 3. a) CEL file b) DAT file.
Page 8 of 14(page number not for citation purposes)
BMC Bioinformatics 2005, 6:65 http://www.biomedcentral.com/1471-2105/6/65
The 'dark spot' affected 47 probes, altering expression of103 genes by up to 1.6 log2. The 'cloud' altered the expres-sion of 700 genes, 83 of them by more than 0.5 log2. Thedirt covering around 25 × 25 probes, affected around 376probes, altering 148 genes, 16 of them by more than 0.5to a maximum of 1.26 log2.
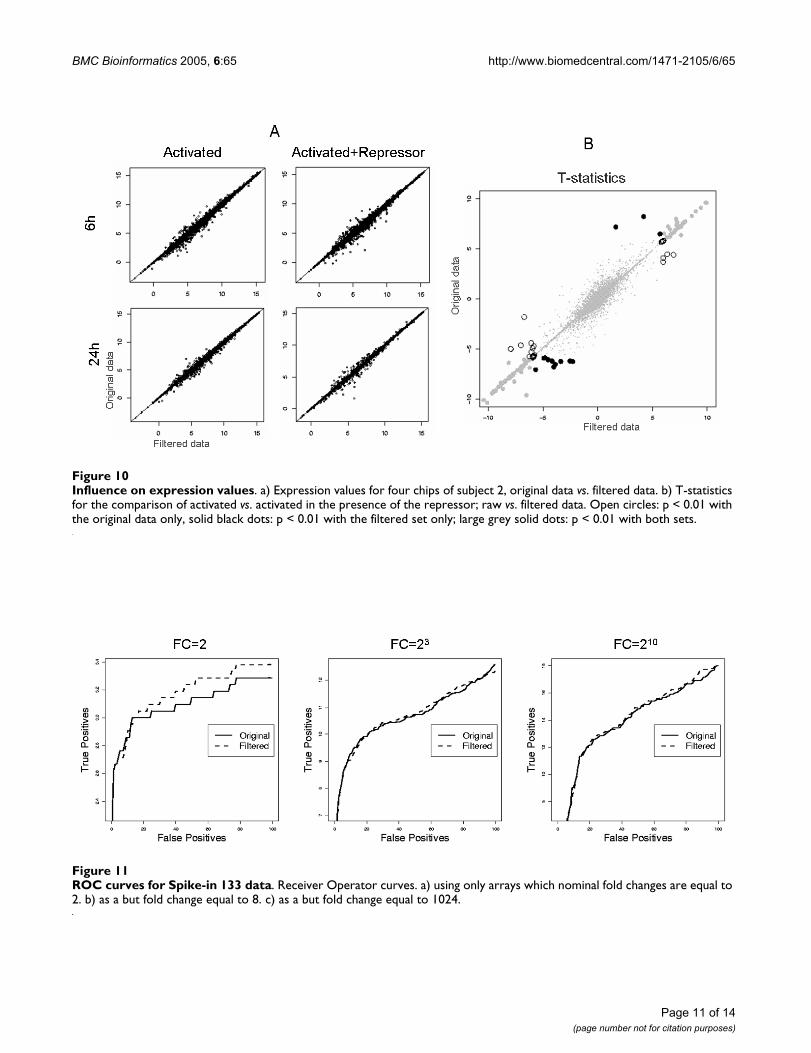
Finally, we compared the two conditions (absence vs.presence of a repressor), mirroring masked probes onboth on the affected and the corresponding chip. As anexploratory criterion, we used the modified (paired) t-testsuggested in Smyth [15] from the limma package of theBioconductor project [16]. As shown in Figure 10b, theeffects of identifying genes as differentially expressed canbe dramatic, demonstrating the potential value of detect-ing blemishes and masking affected areas on microarrays.
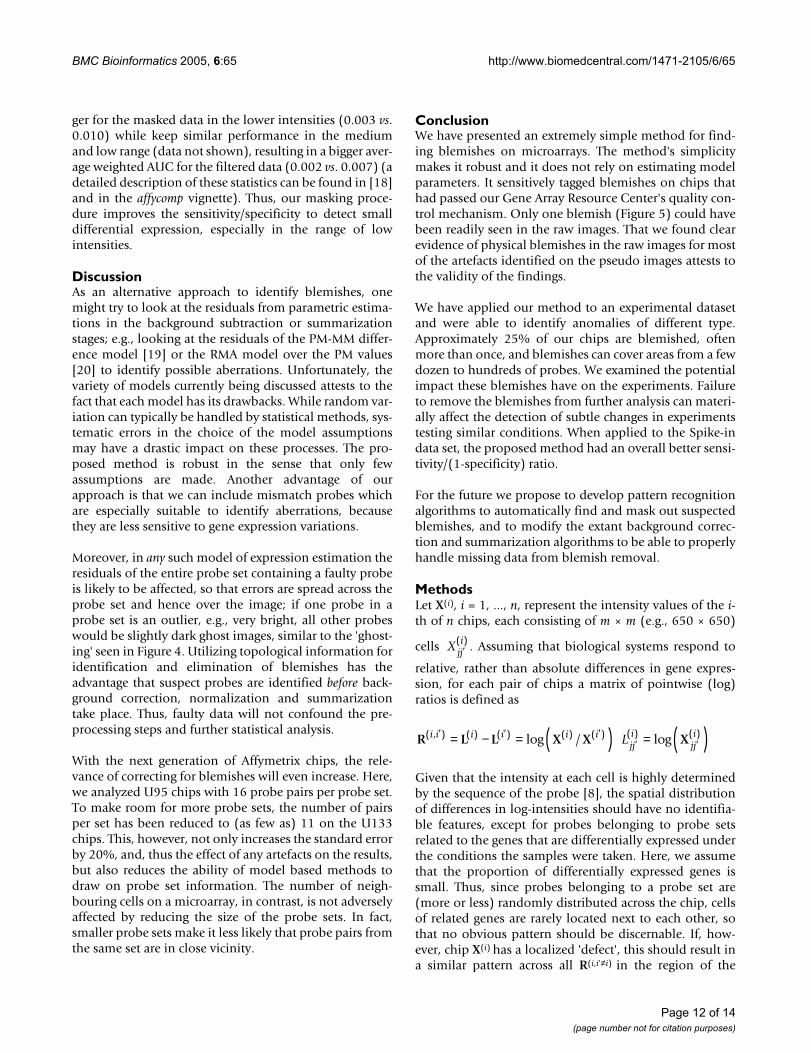
ValidityWe validate the proposed method using data from theSpike-in HUG133 experiments [17]. This data set consistsof 3 technical replicates of 14 separate hybridizations of42 spiked transcripts at concentrations from 0.125 pM to512 pM arrayed as a Latin Square. Our interest is to assesswhether masking the blemishes improves the ability todetect differentially expressed genes. We used the Affycomppackage of the Bioconductor project, which encompass aseries of tools developed by [18] to compare the perform-ance of expression measures for Affymetrix GeneChips.Figure 11 shows that masking blemishes has little effectfor large fold changes, as one would expect, while theROC curve (sensitivity) vs. (1-specificity) shows a sub-stantial improvement for small (2 fold) changes. Otherstatistics are also improved in this case: the average falsepositive decreases (from 2818 to2763) while the true pos-itives increases (from 14.33 to 14.57). Comparing byrange of intensities, the area under the curve (AUC) is big-
"Dark Clouds"Figure 8"Dark Clouds". Detail of the region containing the 'dark cloud' at the right border of Figure 1. Top row: sample area around the 'dark cloud', Bottom row: corresponding area from a control chip. 1st column: CEL file, second column: DAT file; third col-umn: detail from the indicated area in the DAT file.
Page 9 of 14(page number not for citation purposes)
BMC Bioinformatics 2005, 6:65 http://www.biomedcentral.com/1471-2105/6/65
"Shadowy circles"Figure 9"Shadowy circles". Analysis of the two 'shadowy circles' at the left border of Figure 2. Observed intensities vs. expected intensities.
Page 10 of 14(page number not for citation purposes)
BMC Bioinformatics 2005, 6:65 http://www.biomedcentral.com/1471-2105/6/65
Influence on expression valuesFigure 10Influence on expression values. a) Expression values for four chips of subject 2, original data vs. filtered data. b) T-statistics for the comparison of activated vs. activated in the presence of the repressor; raw vs. filtered data. Open circles: p < 0.01 with the original data only, solid black dots: p < 0.01 with the filtered set only; large grey solid dots: p < 0.01 with both sets.
ROC curves for Spike-in 133 dataFigure 11ROC curves for Spike-in 133 data. Receiver Operator curves. a) using only arrays which nominal fold changes are equal to 2. b) as a but fold change equal to 8. c) as a but fold change equal to 1024.
Page 11 of 14(page number not for citation purposes)
BMC Bioinformatics 2005, 6:65 http://www.biomedcentral.com/1471-2105/6/65
ger for the masked data in the lower intensities (0.003 vs.0.010) while keep similar performance in the mediumand low range (data not shown), resulting in a bigger aver-age weighted AUC for the filtered data (0.002 vs. 0.007) (adetailed description of these statistics can be found in [18]and in the affycomp vignette). Thus, our masking proce-dure improves the sensitivity/specificity to detect smalldifferential expression, especially in the range of lowintensities.
DiscussionAs an alternative approach to identify blemishes, onemight try to look at the residuals from parametric estima-tions in the background subtraction or summarizationstages; e.g., looking at the residuals of the PM-MM differ-ence model [19] or the RMA model over the PM values[20] to identify possible aberrations. Unfortunately, thevariety of models currently being discussed attests to thefact that each model has its drawbacks. While random var-iation can typically be handled by statistical methods, sys-tematic errors in the choice of the model assumptionsmay have a drastic impact on these processes. The pro-posed method is robust in the sense that only fewassumptions are made. Another advantage of ourapproach is that we can include mismatch probes whichare especially suitable to identify aberrations, becausethey are less sensitive to gene expression variations.
Moreover, in any such model of expression estimation theresiduals of the entire probe set containing a faulty probeis likely to be affected, so that errors are spread across theprobe set and hence over the image; if one probe in aprobe set is an outlier, e.g., very bright, all other probeswould be slightly dark ghost images, similar to the 'ghost-ing' seen in Figure 4. Utilizing topological information foridentification and elimination of blemishes has theadvantage that suspect probes are identified before back-ground correction, normalization and summarizationtake place. Thus, faulty data will not confound the pre-processing steps and further statistical analysis.
With the next generation of Affymetrix chips, the rele-vance of correcting for blemishes will even increase. Here,we analyzed U95 chips with 16 probe pairs per probe set.To make room for more probe sets, the number of pairsper set has been reduced to (as few as) 11 on the U133chips. This, however, not only increases the standard errorby 20%, and, thus the effect of any artefacts on the results,but also reduces the ability of model based methods todraw on probe set information. The number of neigh-bouring cells on a microarray, in contrast, is not adverselyaffected by reducing the size of the probe sets. In fact,smaller probe sets make it less likely that probe pairs fromthe same set are in close vicinity.
ConclusionWe have presented an extremely simple method for find-ing blemishes on microarrays. The method's simplicitymakes it robust and it does not rely on estimating modelparameters. It sensitively tagged blemishes on chips thathad passed our Gene Array Resource Center's quality con-trol mechanism. Only one blemish (Figure 5) could havebeen readily seen in the raw images. That we found clearevidence of physical blemishes in the raw images for mostof the artefacts identified on the pseudo images attests tothe validity of the findings.
We have applied our method to an experimental datasetand were able to identify anomalies of different type.Approximately 25% of our chips are blemished, oftenmore than once, and blemishes can cover areas from a fewdozen to hundreds of probes. We examined the potentialimpact these blemishes have on the experiments. Failureto remove the blemishes from further analysis can materi-ally affect the detection of subtle changes in experimentstesting similar conditions. When applied to the Spike-indata set, the proposed method had an overall better sensi-tivity/(1-specificity) ratio.
For the future we propose to develop pattern recognitionalgorithms to automatically find and mask out suspectedblemishes, and to modify the extant background correc-tion and summarization algorithms to be able to properlyhandle missing data from blemish removal.
MethodsLet X(i), i = 1, ..., n, represent the intensity values of the i-th of n chips, each consisting of m × m (e.g., 650 × 650)
cells . Assuming that biological systems respond to
relative, rather than absolute differences in gene expres-sion, for each pair of chips a matrix of pointwise (log)ratios is defined as
Given that the intensity at each cell is highly determinedby the sequence of the probe [8], the spatial distributionof differences in log-intensities should have no identifia-ble features, except for probes belonging to probe setsrelated to the genes that are differentially expressed underthe conditions the samples were taken. Here, we assumethat the proportion of differentially expressed genes issmall. Thus, since probes belonging to a probe set are(more or less) randomly distributed across the chip, cellsof related genes are rarely located next to each other, sothat no obvious pattern should be discernable. If, how-ever, chip X(i) has a localized 'defect', this should result ina similar pattern across all R(i,i'≠i) in the region of the
Xjji′
( )
R L L X X X( , ) ( ) ( ) ( ) ( ) ( ) ( )log / logi i i i i ijji
jjiL′ ′ ′
′ ′= − = ( ) = ( )
Page 12 of 14(page number not for citation purposes)
BMC Bioinformatics 2005, 6:65 http://www.biomedcentral.com/1471-2105/6/65
defect. To allow for visual inspection of such pattern, wedraw on the fact that the distribution of differences in log-intensities should be (more or less) symmetrical, exceptfor outliers caused by rare events affecting small areas inparticular chips. Probe-wise outliers (due to bothdifferential expression and defects) can be identified bycomparing each chip to a measure of central tendencyderived from all other chips. Although other measures ofcentral tendency will be discussed below, we start our dis-cussion with the special case of the arithmetic mean,which is known to be optimal in the classical linear model([21])
Let R(i,i') = ∆(i,i') + D(i) - D(i') + ε where ∆(i,i') indicates the ran-dom contribution from the differentially expressed genes,D(i) describes the defects of the i-th chip, and ε other ran-
dom errors. Then, D(i) contributes not only to (barsindicating the average over the index replaced by dot), butalso, albeit with only 1/n of the intensity, to each of the
other as a 'negative shadow' or 'ghost' image. Asthe number of chips n increases, however, the law of largenumbers allows for approximating the linear equationsystem (1), with hats indicating estimators, as
From (2), we get the linear equation system:
where I = (δj = j')j,j' = 1...n and J = (1)j,j' = 1...n. A system
has the trivial solution Y = D whenever
column sums are zero (JY = 0). As (2) guarantees that
, setting yields the solution
as the linear model estimate for the deviation of the i-thchip from the other chips. As the number of chipsincreases, ghosting reduces, so that any discernable pat-
tern in in the limit would suggest a defect.
The above justification for obtaining residuals within thelinear model by subtracting the average is well known.
Still, spelling out and justifying the individual steps abovehelps in two ways. First, we can fine tune the method forthe particular situation we are faced with and, second, wecan provide numerical examples comparing the proposednon-parametric with the traditional parametric approach.The justification for the choice of the arithmetic mean(average) as the measure of central tendency in linearmodels relies either on the law of large numbers and thecentral limit theorem or on the assumption that the distri-bution of errors is symmetrical, in general, and Gaussian,in particular. Neither assumption is easily justified for theerrors caused by defects on a chip.
The arithmetic mean is known to be relatively sensitive tooutliers. Thus, to discriminate outliers from observationsclose to the centre of the non-outliers, one would needeither a very large number of chips or a measure of centraltendency that is less likely to be affected by the outliersthemselves. While microarray 'experiments' now typicallyconsist of more than a single chip, the number of chipsanalyzed under comparable conditions is still too small torely on the central limit theorem for outlier detection.With the number of chips in the single digits, even 'Win-sorization' may not be feasible. Moreover, the need forchoosing some Winsorization cut-off points adds anundesirable level of arbitrariness to the results. Themedian, as the most robust form of Winsorization, pro-vides for a simple alternative measure of central tendency:
AcknowledgementsThe authors wish to thank Marcelo O. Magnasco for helpful discussions and support. M.S.F. acknowledges a Woman in Science fellowship from RU. K.M.W. was supported in part by GCRC grant M01-RR00102 from the National Center for Research Resources at the National Institutes of Health. This paper is, in part, based on a presentation given at the 2004 Joint Statistical Meetings in Toronto, Canada.
References1. Brown CS, Goodwin PC, Sorger PK: Image metrics in the statis-
tical analysis of DNA microarray data. PNAS 2001,98:8944-8949.
2. Jain AN, Tokuyasu TA, Snijders AM, Segraves R, Albertson DG, PinkelD: Fully Automatic Quantification of Microarray ImageData. Genome Res 2002, 12:325-332.
3. Ihaka R, Gentleman R: A language for data analysis andgraphics. Journal of Computational and Graphical Statistics 1996,5:299-314.
4. Parmigiani G, Garrett ES, Irizarry RA, Zeger SL: The analysis of geneexpression data: methods and software New York: Springer; 2003.
5. Affymetrix I: GeneChip Expression Analysis: Data AnalysisFundamentals. 2004.
6. Hautaniemi S, Edgren H, Vesanen P, Wolf M, Jarvinen A-K, Yli-HarjaO, Astola J, Kallioniemi O, Monni O: A novel strategy for micro-array quality control using Bayesian networks. Bioinformatics2003, 19:2031-2038.
7. Irizarry RA, Hobbs B, Collin F, Beazer-Barclay YD, Antonellis KJ,Scherf U, Speed TP: Exploration, normalization, and summa-ries of high density oligonucleotide array probe level data.Biostatistics 2003, 4:249-264.
R R( , ) ( , ).i i ii in
=−
( )′′≠∑1
11
R( , )i
R( , )′≠i i
R D D( , ) ( ) ( ).i i iin
= −−
( )′′≠∑1
12
1
11 1−
= −
n n
i iR I J D( , ) ( )
Y I J D= −
1n
JR 0( , )i = Y R= −
11n
i( , )
ˆ ( ) ( , ) ( ) ( ) ( ) ( )D R L L L Lavgi i i i
i ii
n n= −
= −( )( ) = −′′≠∑1
1 1
ˆ ( )Davgi
ˆ ,( ) ( ) ( ) ( ) ( )D L Lmed mediani ijj i jj
iL L= − = ( ) ( )′ ′ 3
Page 13 of 14(page number not for citation purposes)
BMC Bioinformatics 2005, 6:65 http://www.biomedcentral.com/1471-2105/6/65
Publish with BioMed Central and every scientist can read your work free of charge
"BioMed Central will be the most significant development for disseminating the results of biomedical research in our lifetime."
Sir Paul Nurse, Cancer Research UK
Your research papers will be:
available free of charge to the entire biomedical community
peer reviewed and published immediately upon acceptance
cited in PubMed and archived on PubMed Central
yours — you keep the copyright
Submit your manuscript here:http://www.biomedcentral.com/info/publishing_adv.asp
BioMedcentral
8. Naef F, Magnasco MO: Solving the riddle of the bright mis-matches: labeling and effective binding in oligonucleotidearrays. Phys Rev E Stat Nonlin Soft Matter Phys 2003, 68:011906. Epub012003 Jul 011916.
9. Wu Z, Irizarry RA, Gentleman R, Martinez Murillo F, Spencer F: Amodel based background adjustment for oligonucleotideexpression arrays. Journal of the American Statistical Association 2004,99:909-917.
10. Lew W, Bowcock AM, Krueger JG: Psoriasis vulgaris: cutaneouslymphoid tissue supports T-cell activation and 'Type 1'inflammatory gene expression. Trends in Immunology 2004,25:295-305.
11. Zhou X, Krueger JG, Kao M-CJ, Lee E, Du F, Menter A, Wong WH,Bowcock AM: Novel mechanisms of T-cell and dendritic cellactivation revealed by profiling of psoriasis on the 63,100-element oligonucleotide array. Physiol Genomics 2003, 13:69-78.
12. Bayliffe AI, Haider A, Haws TF, Kaplow Y, Krueger JG, Liy AG,Thompson PW, Wang X-J, Lamb JR: PPAR-g mechanisms inreducing cutaneus inflammation. European Academy of Dermatol-ogy and Venereology; Florence, IT 2004.
13. Simon RM, Korn EL, McShane LM, Radmacher MD, Wright GW,Zhao Y: Design and Analysis of DNA Microarray Investigations New York:Springer; 2003.
14. Deegan RD: Pattern formation in drying drops. Physical Review E2000, 61:475-485.
15. Smyth GK: Linear models and empirical Bayes methods forassessing differential expression in microarray experiments.Statistical Applications in Genetics and Molecular Biology 2004, 3:3.
16. Website title [http://www.bioconductor.org]17. Website title [http://www.affymetrix.com/analysis/
download_center2.affx]18. Cope L, Irizarry R, Jaffee H, Wu Z, Speed T: A benchmark for
affymetrix GeneChip expression measures. BIOINFORMATICS2004, 20:323-331.
19. Li C, Wong WH: Model-based analysis of oligonucleotidearrays: Expression index computation and outlier detection.PNAS 2001, 98:31-36.
20. Collin F, Brettschneider J, Bolstad B, Speed T: Quality Assessmentof Gene Expression Data for Affymetrix Genechips. AffymetrixGeneChip Microarray Low-Level Workshop; Berkeley, UC 2003.
21. Searle SR: Linear Models New York: Wiley; 1971.
Page 14 of 14(page number not for citation purposes)
Copyright © 2022 FDOKUMEN