Empowerment Program Implementation on Small and Medium ...
17
International Journal of Engineering and Advanced Technology (IJEAT) ISSN: 2249 – 8958, Volume-8 Issue-5C, May 2019 289 Published By: Blue Eyes Intelligence Engineering & Sciences Publication Retrieval Number:E10420585C19/2019©BEIESP DOI: 10.35940/ijeat.E1042.0585C19 Abstract:- The study entitled the influence of empowerment program implementation on small and medium businesses towards the performance of the businesses in Ogan Ilir Regency, Indonesia. The results indicated that the businesses performance was good. The score was 412. In addition, empowerment program implementation was scored 458. It meant also good. In terms of regression coefficient value, it was 0.502. It implied that empowerment program implementation positively influenced the business performance. Moreover, simple regression test showed the correlation [r] between the two variables was strong because the score was 0.711, lies between 0.601 - 0.800. Besides that, the correlation was positive and unindirectional. This meant that the better empowerment program implementation was, the higher the business performance would be. The value of t amounted to 10,972. While the value of t table was 1,657. It could be concluded that H1 hypothesis that said there was a positive and significant influence empowerment program implementation towards enterprises performance was accepted. From t test, it showed that t > t table [10,972 > 1,657 at 95% of confidence degree with 120 samples, it was understood that the influence of empowerment program implementation towards enterprises performance was significant. The value of r square was 0.505. It meant that the influence of empowerment program implementation towards enterprises performance was as much as 50,5%. Another 49,5% was influenced by other factors [Ԑ] which were not examined in this research. Index Terms: Empowerment, Enterprises Performance, implementation, Program. I. INTRODUCTION In Indonesia, small and medium businesses play extremely essential roles In economic aspect. They serve as daily needs suppliers, provide employment, play a role in the process of equity, increase the people's incomes, and to encourage national economic growth. Unluckily, most of them, - especialy in Ogan Ilir Regency, cannot play those roles well due to their less developed condition. They lack Revised Manuscript Received on April 19, 2019. Andy Alfatih, Public Administration Department, Universitas Sriwijaya, Palembang, Indonesia. Diana Dewi Sartika, Sociology Department, Universitas Sriwijaya, Palembang, Indonesia. Dyah Hapsari ENH, Sociology Department, Universitas Sriwijaya, Palembang, Indonesia. business capital, their business management systems are still poor, unattractive product packaging, and a very limited marketing system. To overcome the above problems, local government of Ogan Ilir Regency was encouraged to provide empowerment. Research Questions 1. Was there any influence of empowerment program implementation on small and medium businesses towards the performance of the businesses? 2. How much was the influence of empowerment program implementation on small and medium businesses towards the performance of the business? The Objectives of The Research The purposes of this research were to find out whether there was any influence of empowerment program implementation on small and medium businesses towards the performance of the businesses. In addition, it was also to know how much the influence was. II. LITERATURE REVIEW Van Meter and Van Horn, in Wibawa, et al (1994), stated that policy implementation was deliberately used to enhance performance. In the book of Ripley and Franklin [1986] entitled Policy Implementation and Bureaucracy, it was written that successful policy implementation was measured by some parameters. They were degree of compliance with applicable regulation, the smoothness of the routine functions, and realizing the desired target and impact. Business performance, according to Kaplan and Norton [1996], had 3 parameters. They were finance, customer, internal process, growth and learning process. Empowerment Program Implementation on Small and Medium Businesses Positively Influenced the Performance of the Businesses: (Study towards Small and Medium Businesses Empowered by the Cooperative and Small and Medium Office of Ogan Ilir Regency, Indonesia) Andy Alfatih, Diana Dewi Sartika, Dyah Hapsari ENH
-
Upload
khangminh22 -
Category
Documents
-
view
1 -
download
0
Transcript of Empowerment Program Implementation on Small and Medium ...

International Journal of Engineering and Advanced Technology (IJEAT)
ISSN: 2249 – 8958, Volume-8 Issue-5C, May 2019
289
Published By:
Blue Eyes Intelligence Engineering & Sciences Publication
Retrieval Number:E10420585C19/2019©BEIESP
DOI: 10.35940/ijeat.E1042.0585C19
Abstract:- The study entitled the influence of empowerment
program implementation on small and medium businesses
towards the performance of the businesses in Ogan Ilir Regency,
Indonesia. The results indicated that the businesses performance
was good. The score was 412. In addition, empowerment program
implementation was scored 458. It meant also good. In terms of
regression coefficient value, it was 0.502. It implied that
empowerment program implementation positively influenced the
business performance. Moreover, simple regression test showed
the correlation [r] between the two variables was strong because
the score was 0.711, lies between 0.601 - 0.800. Besides that, the
correlation was positive and unindirectional. This meant that the
better empowerment program implementation was, the higher the
business performance would be. The value of t amounted to
10,972. While the value of t table was 1,657. It could be
concluded that H1 hypothesis that said there was a positive and
significant influence empowerment program implementation
towards enterprises performance was accepted. From t test, it
showed that t > t table [10,972 > 1,657 at 95% of confidence
degree with 120 samples, it was understood that the influence of
empowerment program implementation towards enterprises
performance was significant. The value of r square was 0.505. It
meant that the influence of empowerment program
implementation towards enterprises performance was as much as
50,5%. Another 49,5% was influenced by other factors [Ԑ] which
were not examined in this research.
Index Terms: Empowerment, Enterprises Performance,
implementation, Program.
I. INTRODUCTION
In Indonesia, small and medium businesses play
extremely essential roles In economic aspect. They serve as
daily needs suppliers, provide employment, play a role in
the process of equity, increase the people's incomes, and to
encourage national economic growth. Unluckily, most of
them, - especialy in Ogan Ilir Regency, cannot play those
roles well due to their less developed condition. They lack
Revised Manuscript Received on April 19, 2019.
Andy Alfatih, Public Administration Department, Universitas
Sriwijaya, Palembang, Indonesia.
Diana Dewi Sartika, Sociology Department, Universitas Sriwijaya, Palembang, Indonesia.
Dyah Hapsari ENH, Sociology Department, Universitas Sriwijaya,
Palembang, Indonesia.
business capital, their business management systems are still
poor, unattractive product packaging, and a very limited
marketing system. To overcome the above problems, local
government of Ogan Ilir Regency was encouraged to
provide empowerment.
Research Questions
1. Was there any influence of empowerment program
implementation on small and medium businesses towards
the performance of the businesses?
2. How much was the influence of empowerment program
implementation on small and medium businesses towards
the performance of the business?
The Objectives of The Research
The purposes of this research were to find out whether
there was any influence of empowerment program
implementation on small and medium businesses towards
the performance of the businesses. In addition, it was also to
know how much the influence was.
II. LITERATURE REVIEW
Van Meter and Van Horn, in Wibawa, et al (1994), stated
that policy implementation was deliberately used to enhance
performance.
In the book of Ripley and Franklin [1986] entitled Policy
Implementation and Bureaucracy, it was written that
successful policy implementation was measured by some
parameters. They were degree of compliance with
applicable regulation, the smoothness of the routine
functions, and realizing the desired target and impact.
Business performance, according to Kaplan and Norton
[1996], had 3 parameters. They were finance, customer,
internal process, growth and learning process.
Empowerment Program Implementation on Small
and Medium Businesses Positively Influenced the
Performance of the Businesses: (Study towards
Small and Medium Businesses Empowered by the
Cooperative and Small and Medium Office of
Ogan Ilir Regency, Indonesia)
Andy Alfatih, Diana Dewi Sartika, Dyah Hapsari ENH
International Conference on Recents Advancements in Engineering and Technology (ICRAET-18) |15th and 16th
March 2019|Siddhartha Institute of Technology & Sciences, Telangana, India.
290
Published By:
Blue Eyes Intelligence Engineering & Sciences Publication
Retrieval Number:E10420585C19/2019©BEIESP
DOI: 10.35940/ijeat.E1042.0585C19
Fig. 1 Conceptual Framework
III. RESEARCH METHOD
The method of this research was quantitative.
Analysis Unit: The analysis and observation units were
Individual, the of owners of small and medium businesses in
Ogan Ilir Regency.
Operational Definition: The variables were
operationalized as follows.
Variables Dimensions
Successful program
implementation
[Ripley and
Franklin:1986]
degree of compliance,
implementation smoothness of
routine functions, and realizing
the desired target and impact
Enterprise
performance [Kaplan
and Norton: 1996]
Finance, customer, internal
process, and growth and learning
process
A. Population
There were 767 owners of small and medium enterprises.
From those, only 120 were under the empowerment program
of the Cooperative and Small and Medium Service of Ogan
Ilir Regency. The 120 empowered small and medium
enterprises had been the respondents of this research.
Data Collection Techniques: Questionnaire spreading,
and on the field observation.
B. Instrument Validity Test
The answers to the statements in questionnaires
referred to Likert scales. They were: Very much disagree
was coded 1, disagree > 2, neutral> 3, agree > 4, and very
much agree>5. Before the questionnaire was spreaded
out, it was tested for its validity by using Pearson correlation
product-moment, as suggested in Riduwan (2004:216).
Theoretically, the formula was as follows:
n∑ - (Σ x) (Σ y)
√ ( } - ( } ]
If the value of or r was ˃ r table, at 10% of
significance (α), it means the item was valid.
Instrument validity test result for the variable of
enterprises performance consisting of 12 questions,
indicated that all items were valid. The value of r ranged
from 0,533 to 0, 769 referring to the value of r table which
was 0.443. While, variable of empowerment program
implementation ranged from 0,473 to 0,852. It meant valid.
C. Instrument Reliability Test
The reliability test of the instrument made use of Alfa
Cronbach Standard. The reliability was attained by
comparing the value of r and r table in the degree of 5%
significance. With Alfa Cronbach Standard, r was
represented by Alpha value. If Alpha value was more than
the value of r table, it meant positive. The instrument was
reliable, Santoso in Budi (2006:248). Theoretically, the
calculation of reliability test was with the following
formula:
r = (
) (
) x 100%
Explanation:
r = Instrument reliability coefficient
k = Number of questions
= Total of item variant
= Total of variant.
Variant calculation [measurement] was conducted with
the following formula:
= - (
n – 1
Explanation:
= The value of variant
X = Data values
n = Number of respondents
The degree of reliability with Alpha Cronbach technique
was measured by referring to Alpha scale ranging from 0 to
1. The range was as follows:
Tabel 1. The Range for The Degree of Reliability
The Value of Alpha
Cronbach The Degree of Reliability
1 2
0,001 – 0,200
0,201 – 0,400
0,401 – 0,600
0,601 – 0,800
0,801 – 1,000
Less Reliable
Somewhat Reliable
Quite Reliable
Reliable
Very Reliable
Source: Budi, 2006
The result of instrument reliability test for enterprises
performance indicated that all questions were very reliable
when referred to the value of Alpha Cronbach which was
0,801 to 1,000. The degree of reliability ranged from 0,704
to 0,726. Meanwhile, the results of instrument reliability test
for variable empowerment program implementation were
from 0,676 to 0,867 which meant very reliable.
D. Techniques of Data Analysis
To find out how empowerment program implementation
and the performance of small and medium enterprises under
the Cooperative and Small and Medium Service of Ogan Ilir
Regency were, the technique of analysis used was
descriptive analysis technique. While to know whether there

International Journal of Engineering and Advanced Technology (IJEAT)
ISSN: 2249 – 8958, Volume-8 Issue-5C, May 2019
291
Published By:
Blue Eyes Intelligence Engineering & Sciences Publication
Retrieval Number:E10420585C19/2019©BEIESP
DOI: 10.35940/ijeat.E1042.0585C19
was any influence of empowerment program
implementation towards the enterprise performance, the
analysis technique applied had been explanative
[confirmatory] technique by making use of simple
regression approach by means of SPSS version 25.
Before analyzing the data, there were some requirements
had to do. They were data normality test, and data scale
conversion from ordinal to interval.
E. Data Normality Test
The test of data normality was conducted by using
sample statistical Kolmogrov Smirnov test through SPSS
(Budi, 2006 : 77).
Based on One-Sample Kolmogorov-Smirnov Test, it was
found that Kolmogorov-Smirnov Z was ,719 and the
Asymp. Sig. (2-tailed) was ,679. It meant the data were
normal.
Data scale conversion from ordinal to interval from 63
respondents had also be done and the results ranged from
49, 9907 to 50, 0145.
The statistical hypothesis :
Ho : r = 0 : There was no a positive and significant
effect empowerment program implementation of small and
medium enterprises of in Ogan Ilir Regency towards
enterprise performance
H1 : r ≠ 0 : There was a positive and significant
effect empowerment program implementation of small and
medium enterprises of in Ogan Ilir Regency towards
enterprise performance.
Hypothesis making of correlational analysis was meant to
find out the strength, the significance, and the correlational
direction between the two variables.
IV. RESEARCH RESULTS
Descriptive Quantitative Analysis Technique
Table 2. Assessment Range Score By Category
Assessment Criteria Based on Average Scores of Each
Indicator
No Score Range Category
1
2
3
4
5
508 >
411 – 507
314 – 410
217 – 313
120 – 216
Very Good
Good
Sufficient
Less Good
Not Good
A. Empowerment Program Implementation
Data analysis was carried out per indicator according to
their dimensions. The following was the first indicator of the
first dimension to be analyzed.
1. Degree of Compliance
The indicators of this first dimension were the needy
documents completeness, requirement fulfillment,
obedience to loan use, willingness to return loan money, and
readiness to participate in the trainings offered. Each of that
indicator was analyzed below.
1.1. The Needy Documents Completeness
In modern era, documents are extremely essential to have.
They are, very often, serve as infrastructures for the next
human need fulfillment. For example, one cannot apply for
money loan from a bank, if one does not have, in terms of
document, a personal identification card as a citizen proof.
Another instance, one is not legally allowed to drive a car, if
one does not possess a driving license, etc. So, are the small-
medium businesses in Ogan Ilir Regency. They could not
participate in empowerment program for small-medium
businesses held by Cooperative and Small-Medium
Business Affairs Office of Ogan Ilir Regency, if they were
not able to complete all the needy documents, like: personal
identification card of Ogan Ilir Regency, family card,
business licence, and home-land paid tax proof.
Regarding the ability of small-medium businesses in
Ogan Ilir Regency to complete the needy documents for
their participation in the empowerment program for small-
medium businesses held by Cooperative and Small-Medium
Business Affairs Office of Ogan Ilir Regency, see the
following table 3.
Table 3. Respondents’ Answer On The Needy
Documents Completeness
N
o
Stateme
nts
Answer options FS
RS Percent
age VM
D
(1)
D
(2
)
N
(3
)
A
(4
)
VM
A
(5)
1. There
are
some
docume
nts
needed.
- - -
61 59
53
9
60
0
100%
2. You can
complet
e them
-
-
- 65 55
53
5
60
0
100%
Average
Score
53
7
100%
Source: Questionnaires, 2018.
Annotation: Frequency Score [FS] = Answer option x
score
Result Score [RS] = Number of Respondent x 5
Score = (FS X 100%) : RS
The above table indicated that all respondents, 100%,
were able to complete all the needed documents for the
empowerment program which was held by the Cooperative
and Small-Medium Business Affairs Office of Ogan Ilir
Regency.
The needed documents, in general, were common ones to
have for everyone. Each good citizen must have those basic
papers, such as: personal identification card of Ogan Ilir
Regency, family card, business licence, and home-land paid
tax proof because they could also be helpful for other
affairs, like enrolling children to enter schools, possessing
driving licence, or getting rice ration from government for
certain families. If the businesses did not have some of those
documents, it was hard for them to deal with other sides for
any affair. In case, the businesses had not owned some of
the papers, they could right away go to the concerned offices

International Conference on Recents Advancements in Engineering and Technology (ICRAET-18) |15th and 16th
March 2019|Siddhartha Institute of Technology & Sciences, Telangana, India.
292
Published By:
Blue Eyes Intelligence Engineering & Sciences Publication
Retrieval Number:E10420585C19/2019©BEIESP
DOI: 10.35940/ijeat.E1042.0585C19
to have them. Unless, did those business have those
documents, they could not join the empowerment program
held by Cooperative and Small-Medium Business Affairs
Office of Ogan Ilir Regency. In short, the small-medium
businesses had to adjust themselves with their environment
in order to be successful. According to William F.Glueck
and Lawrence R. Jauch [1998] - in their book entitled
Strategic Management and Company Policy - that the point
of strategic management that businesses always adapted
themselves to environment change in order to win
competition, progress, or even to be survived. Unless, would
they lose their chances to develop. The business
environments could be external, like government,
competitor, or customer which are more demanding, or
internal, for examples, tools, strategy and business policy, or
the quality of available human resource.
In conclusion, that most small-medium businesses in
Ogan Ilir Regency could complete all the needed documents
for empowerment program. This indicator could be
categorized very good because the assessment score was
537.
The second indicator of the first dimension to discuss was
the ability of the small-medium businesses to fulfill the
requirements applied.
1.2. Requirement Fulfillment
Requirement are things which are needed or wanted. In
other words, it is a compulsory or necessary condition. If
requirements are not met, happening will not occur. Joining
the empowerment program could be realized, if the small-
medium businesses in Ogan Ilir Regency were able to fulfill
the requirements applied. The requirements, among others,
were; residency status, some residency documents, business
documents, never got involved in the similar program, and
business development plan proposal. After collecting data,
whether the small-medium businesses could fulfill the
conditions, the result was as follows
Table 4. Requirements Fulfillment
No Statement
s
Answer options FS RS Percena
ge VM
D
(1)
D
(2)
N
(3)
A
(4)
VM
A
(5)
1. There are a
number of
requiremen
ts for the
empowerm
ent and the
assistance
- - - 76 44 524 600 100%
2. You can
fulfill these
requiremen
ts
- - - 68 52 532 600 100%
Average
Score
528 100%
Source: Questionnaires, 2018.
Annotation: Frequency Score [FS] = Answer option x
score
Result Score [RS] = Number of Respondent x 5
Score = (FS X 100%) : RS
It seemed that every small-medium businesses had no
problem to meet all the requirements. By percentage, it was
also 100 %.
The Small-Medium Businesses managed hard to fulfill all
the conditions and were excited to join the program. They
insisted to join the program because it was very promising
for their progress. The program included various aids, such
as money loan for business capital, trainings, and marketing
opportunities. Unless, did they take part in the program, they
would have been left behind in developing their businesses.
By developing themselves, small-medium businesses could
play more roles in many ways, such as, making employment
available, providing daily needs for the people, and
contributing more revenues to government. Sudaryanto et al
(2011) claimed that small-medium businesses were the
biggest sector which were able to employ more labors in
Indonesia and contribute better product domestic bruto
through tax.
It could be concluded that each small-medium business in
Ogan Ilir Regency was eligible for the empowerment
program held by the Cooperative and Small-Medium
Business Affairs Office of the Regency. This indicator had
528 average score which meant very good.
Next, the analysis would be continued to the third
indicator of the first dimension of empowerment program
implementation.
1.3. Obedience To Loan Use
Money lent by Local Government of Ogan Ilir Regency to
the small-medium businesses in that area was supposed to
use to increase business capital. The fund had to be
beneficial for business development, such as buying more
raw materials, tools, shop repair, business equipment, etc.
The loan uses had to be obeyed as they were planned. The
businesses, even, were asked to make a signed letter of
agreement. Unless, were they given a punishment. To find
out whether the small-medium businesses participating in
the empowerment program held by the Cooperative and
Small-Medium Business Affairs Office of Ogan Ilir
Regency listened to the agreement, consult table below.
Table 5. Obedience To Loan Use
No Statement
s
Answer options FS
RS Percen
tage VM
D
(1)
D
(2)
N
(3)
A
(4)
VM
A
(5)
1. You use
loan
money
according
to the
stipulated
conditions
15 5 30 43 27 422 600 58.3%
Average
Score
422 58.3%
Source: Questionnaires, 2018.
Annotation: Frequency Score [FS] = Answer option x
score
Result Score [RS] =
Number of Respondent x 5
Score = (FS X 100%) : RS
International Journal of Engineering and Advanced Technology (IJEAT)
ISSN: 2249 – 8958, Volume-8 Issue-5C, May 2019
293
Published By:
Blue Eyes Intelligence Engineering & Sciences Publication
Retrieval Number:E10420585C19/2019©BEIESP
DOI: 10.35940/ijeat.E1042.0585C19
Data in table 5 above showed that the agreeing answers to
the appropriate loan use dominated the response. The total
percentage was 58.3%. It could be understood that most
respondents used the loan money for their business capital
since the main purpose of borrowing the money was to
increase business capital. The loan money was utilized to
buy tools, more raw materials, improve business place, and
equipments.
While, the respondents who abused the loan money
manipulated it for something else, such as, for daily needs,
school fee, and others. The reasons they abused the money
were that, firstly, they had to fulfill they daily needs. In
addition, some said they needed to buy their seconder
necessities which they had long dreamed of, like colourful
TV set, a better bed set, fridge. They could not pay for them
for they had no money. When they had that loan money on
hand, they carried out their desires. Secondly, they found
low demand for goods in market place. They thought it was
no use to get more wares which finally was unsellable that
they satisfied themselves with the items they actually
required.
It was proved that although some respondents disobeyed
the appropriate use of the loan money. Anyhow, most of
them did the right things by using the loan money
appropriately. Maman Rachman in Tu'u (2004: 35) stated
that discipline or obedience is very important for each
individual, such as; (1) provide support for the creation of
non-deviant behavior; (2) to regulate the balance of the
desires of one individual with another; and (3) good habits
cause peace of mind and environment.
Regarding the obedience to loan use, it could be said that
there was conformity to it. The loan money was used
correctly by most of respondents for business capital
increase. The average score for this indicator was 422. It
was classified good.
The fourth indicator of the first dimension was
willingness to return the loan money.
1.4. Willingness To Return Loan Money
Loan or also called credit is the trust of the borrower to
pay a sum of money in the future (Rolling G. Thomas, 1957:
109). Referring to the above understanding that indeed
something borrowed in its essence must be returned. The
Ogan Ilir Cooperative Office did not merely provide useless
assistance, but the money that had been lent to each related
small-medium business [SMB] must be returned to the
capital provider, Cooperative and Small-Medium Business
Affairs Office of Ogan Ilir Regency. The following table
will inform you the answers to the questionnaire from the
respondents regarding the above matter.
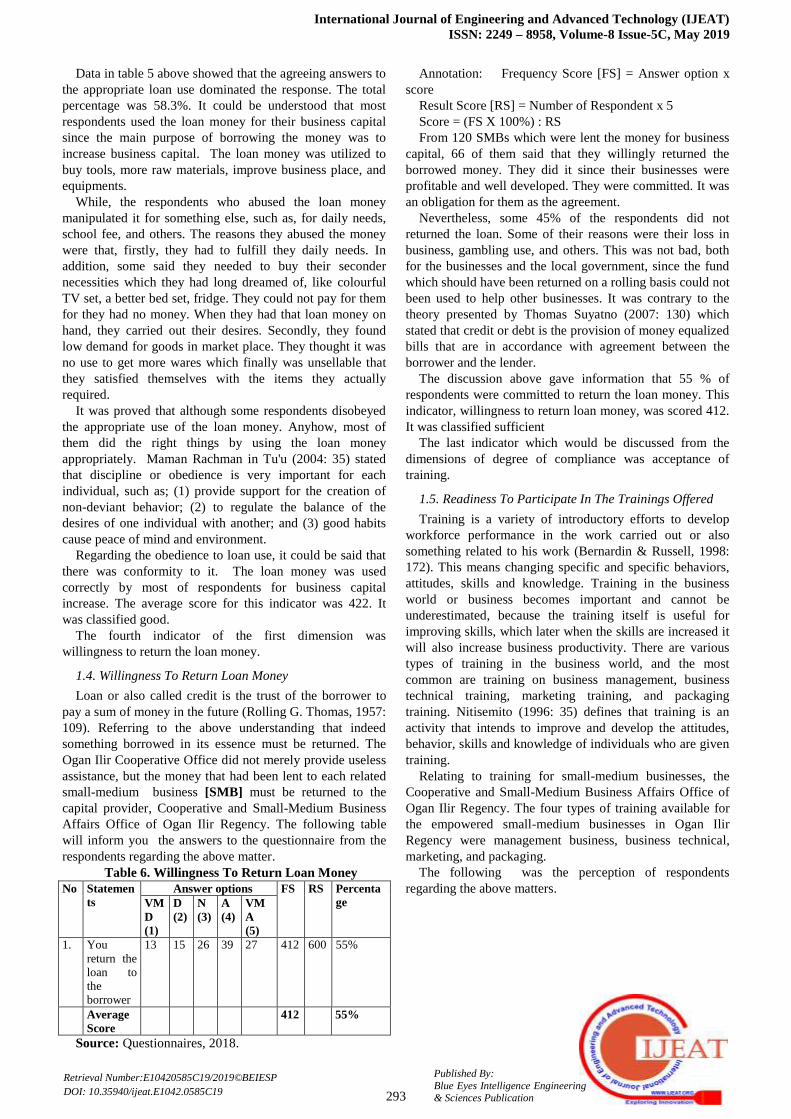
Table 6. Willingness To Return Loan Money
No Statemen
ts
Answer options FS RS Percenta
ge VM
D
(1)
D
(2)
N
(3)
A
(4)
VM
A
(5)
1. You
return the
loan to
the
borrower
13 15 26 39 27 412 600 55%
Average
Score
412 55%
Source: Questionnaires, 2018.
Annotation: Frequency Score [FS] = Answer option x
score
Result Score [RS] = Number of Respondent x 5
Score = (FS X 100%) : RS
From 120 SMBs which were lent the money for business
capital, 66 of them said that they willingly returned the
borrowed money. They did it since their businesses were
profitable and well developed. They were committed. It was
an obligation for them as the agreement.
Nevertheless, some 45% of the respondents did not
returned the loan. Some of their reasons were their loss in
business, gambling use, and others. This was not bad, both
for the businesses and the local government, since the fund
which should have been returned on a rolling basis could not
been used to help other businesses. It was contrary to the
theory presented by Thomas Suyatno (2007: 130) which
stated that credit or debt is the provision of money equalized
bills that are in accordance with agreement between the
borrower and the lender.
The discussion above gave information that 55 % of
respondents were committed to return the loan money. This
indicator, willingness to return loan money, was scored 412.
It was classified sufficient
The last indicator which would be discussed from the
dimensions of degree of compliance was acceptance of
training.
1.5. Readiness To Participate In The Trainings Offered
Training is a variety of introductory efforts to develop
workforce performance in the work carried out or also
something related to his work (Bernardin & Russell, 1998:
172). This means changing specific and specific behaviors,
attitudes, skills and knowledge. Training in the business
world or business becomes important and cannot be
underestimated, because the training itself is useful for
improving skills, which later when the skills are increased it
will also increase business productivity. There are various
types of training in the business world, and the most
common are training on business management, business
technical training, marketing training, and packaging
training. Nitisemito (1996: 35) defines that training is an
activity that intends to improve and develop the attitudes,
behavior, skills and knowledge of individuals who are given
training.
Relating to training for small-medium businesses, the
Cooperative and Small-Medium Business Affairs Office of
Ogan Ilir Regency. The four types of training available for
the empowered small-medium businesses in Ogan Ilir
Regency were management business, business technical,
marketing, and packaging.
The following was the perception of respondents
regarding the above matters.

International Conference on Recents Advancements in Engineering and Technology (ICRAET-18) |15th and 16th
March 2019|Siddhartha Institute of Technology & Sciences, Telangana, India.
294
Published By:
Blue Eyes Intelligence Engineering & Sciences Publication
Retrieval Number:E10420585C19/2019©BEIESP
DOI: 10.35940/ijeat.E1042.0585C19
Table 7. Readiness To Participate In The Trainings
Offered
No
Statement
s
Answer options FS
RS Percenta
ge VM
D
(1)
D
(2)
N
(3)
A
(4)
VM
A
(5)
1. You are
given
training on
business
manageme
nt by the
Cooperati
ve Office
19 6 4 56 35 442 600 75,83%
2 You are
given
technical
business
training
23 3 - 52 42 447 600 78,3%
3 You are
given
marketing
training
25 2 - 48 45 446 600 77,5%
4 You are
given
packaging
training
21 3 1 50 45 455 600 79,16%
5 You
attended
all the
trainings
provided
11 7 2 58 42 473 600 83,33%
Average
Score
453 78,82%
Source: Questionnaires, 2018.
Annotation: Frequency Score [FS] = Answer option x
score
Result Score [RS] = Number of Respondent x 5
Score = (FS X 100%) : RS
Looking at the data in Table above, it showed that
78,82% of respondents said they received training provided
by the Ogan Ilir Cooperative Service based. Participating in
training is indeed important for certain individuals,
especially business people, because it has certain goals for
the individual concerned. Procton and Thornton (1983: 4)
mention the training objectives are; (1) to adjust to the
demands of business and industrial operations since the first
day of work; and (2) making progress as a productive force
in the company by developing the needs of skills,
knowledge and attitudes. In accordance with Procton and
Thornton, the empowered small-medium businesses in Ogan
Ilir Regency got some benefits from trainings attended.
Namely, better culinary skill, business management,
marketing knowledge, and work-relating to packaging.
They, even, got also some knowledge from other
participants when they had discussions in their togetherness.
If not, the trainings would have been left behind for wasting
time.
Another 21,18% admitted they did not take part in the
trainings available because they had some reasons. They
were: they thought they had already been good at making
specific preferred local food they sold, some said they had
no one looking after their businesses if they went for the
trainings, and few reasoned that they did not gain a clear
information on the trainings.
Amongs others, the point was that the average score of
the indicator of readiness to participate in the trainings
offered was classified good. It was 453.
Having analyzed each indicator of the degree of
compliance, the first dimension, it could be concluded that
most small-medium businesses empowered by the
Cooperative and Small-Medium Business Affairs Office of
Ogan Ilir Regency complied the conditions of empowerment
program. The degree of compliance was high. It was
indicated by the following proofs;
1. All small-medium businesses were able to
complete the needed documents. The score was 537 which
mean very good.
2. None of the businesses could not fulfill the
requirement. It was classified very good as well since the
score was 528.
3. Most businesses – 58,30% - used the loan money
as should be. It was scored Good, 422.
4. 55% of respondents succeeded to return the loan.
The classification score was 412 which meant sufficient.
5. Majority of the businessmen took part in training
available. It was scored 453 and was good.
After analyzing the first dimension, it was followed by
the second one, the smoothness of routine functions.
2. Implementation Smoothness of Routine Functions
There were 2 indicators included in this second
dimension. They were production process smoothness as
well as product and service marketing smoothness. The
analysis would be carried out one after another.
2.1. Production Process Smoothness
Raw material is something that is used to make finished
goods. Materials must stick to become one with finished
goods (Hanggana, 2006: 11). Raw materials are the most
important component in every business sector. In production
process, one of the valuable elements is raw material. It
should be available in right amount, good quality, and in
time arrival. Unless, the production process will be stagnant.
The small-medium businesses in Ogan Ilir Regency had
received loan for business capital. Therefore, it was
reasonable if they could have more and better raw materials
for their business productions. Concerning production
process smoothness in their business, when they were asked,
the small-medium businesses under the empowerment of the
Cooperative and Small-Medium Business Affairs Office of
Ogan Ilir Regency answered as follows.

International Journal of Engineering and Advanced Technology (IJEAT)
ISSN: 2249 – 8958, Volume-8 Issue-5C, May 2019
295
Published By:
Blue Eyes Intelligence Engineering & Sciences Publication
Retrieval Number:E10420585C19/2019©BEIESP
DOI: 10.35940/ijeat.E1042.0585C19
Table 8. Production Process Smoothness
No Statemen
ts
Answer options
FS RS Percenta
ge
VM
D
(1)
D
(2)
N
(3)
A
(4)
VM
A
(5)
1. The
process
of your
business
productio
n is
smooth
1 17 14 64 24 453 600 73.3%
Average
Score
453 73.3%
Source: Questionnaires, 2018.
Annotation: Frequency Score [FS] = Answer option x
score
Result Score [RS] = Number of Respondent x 5
Score = (FS X 100%) : RS
Referring to the data in table above, it was known that
majority – 88 businesses - of respondents found that their
process production smooth. One of the causes was the
fulfillment of business raw materials got hardly any
problem. The smoothness happened due to good
procurement and – of course – payment. Here lay the role of
the loan money for business capital. Unless was business
capital available, business raw material procurement could
be an obstacle. This was in line with the opinion of Assauri
(2004: 177) who said that supply control was useful for; (1)
keep the company from running out of supplies so that
production activities can be stopped; (2) keep the formation
of company inventories not too large or excessive; and (3)
keeping small purchases can be avoided because the
ordering costs will be too large.
Since the average score of production process smoothness
was 453. It could be grouped into good category.
The final indicator of the second dimension, the
smoothness of routine functions, which would be analyzed
was would be product and service marketing smoothness.
2.2. Product And Service Marketing Smoothness
Dr. Philip Kotler - https://heidicohen.com/marketing-
definition - defines marketing as “the science and art of
exploring, creating, and delivering value to satisfy the needs
of a target market at a profit. Marketing identifies
unfulfilled needs and desires. It defines, measures and
quantifies the size of the identified market and the profit
potential. It pinpoints which segments the company is
capable of serving best and it designs and promotes the
appropriate products and services.” In short, the capacity of
a producer to satisfy customers through product or service
delivered has been marketing. Small-medium businesses
empowered by the Cooperative and Small-Medium Business
Affairs Office of Ogan Ilir Regency produced diverse
products and services. The description whether they could
market their products and services smoothly, see the below
table.
Table 9. Product And Service Marketing Smoothness
N
o
Statemen
ts
Answer options
FS RS Perce
ntage VMD
(1)
D
(2)
N
(3)
A
(4)
VMA
(5)
. Your
product
or service
were
marketabl
e
19 24 13 45 19 381 600 53.33
%
2. You
could
market
them
smoothly
- 36 18 58 8 398 600 55%
Average
Score
389 54,16
%
Source: Questionnaires, 2018.
Annotation: Frequency Score [FS] = Answer option x
score
Result Score [RS] = Number of Respondent x 5
Score = (FS X 100%) : RS
Table above informed us that – on average - 54%
respondents stated that the products or services they
produced could be marketed smoothly. Continuous product
supply played an essential role in marketing. If production
was hampered, marketing could also be hung up. The
smooth and unhindered production process was needed in
business activities, because –according to Ahyari (2002:
211) it was [the production process] was intermittent, if
there was no exact sequence or pattern from raw material to
final product or order is always changing. Therefore, it was
determined by stable raw material supply. In this context,
capital to buy raw materials was a determinant factor.
Successful marketing gave much contribution to income. In
https://www.salesfusion.com/resource/measuring-
marketing-effectiveness-5-metrics-need-track, it was stated
that effective marketing had 5 parameters. They were
marketing contribution to revenue, pipeline growth and
acceleration, conversion rates:, cost per lead, cost per
opportunity, and brand awareness.
Although most respondent found that they got successful
in product or service marketing, but some of them
experienced fluctuative situation. Even though, it was not
very encouraging, but it was positive. The average score was
389, it was, then, included to sufficient.
In general, in terms of routine functions, it could be stated
that it could run smoothly. The reasons were majority – 88
businesses - of respondents found that their process
production smooth. The average score of production process
smoothness was 453. It could be grouped into good
category. In addition, 54% respondents stated that the
products or services they produced could be marketed
smoothly. The average score was 389, it was, then, included
to sufficient.
The last dimension of variable empowerment program
implementation was the impact of the program
implementation.

International Conference on Recents Advancements in Engineering and Technology (ICRAET-18) |15th and 16th
March 2019|Siddhartha Institute of Technology & Sciences, Telangana, India.
296
Published By:
Blue Eyes Intelligence Engineering & Sciences Publication
Retrieval Number:E10420585C19/2019©BEIESP
DOI: 10.35940/ijeat.E1042.0585C19
3. The Impact of Empowerment Program Implementation
This dimension had 2 indicators. Namely; more and
broader product and service marketing and better welfare.
They were analyzed as follows.
3.1. More and broader product and service marketing
Marketing is one form of human activity that has a
foundation for getting needs and desires through a series of
processes of exchange, supply, and many other things
(Kotler, 2001: 10). Marketing is one of the most important
stages in every field of business, and marketing can also be
done in a variety of ways, both marketing directly or
indirectly such as advertising or brochures. Marketing
product and service should be smooth, continuous, and more
as well as broader in covering the area.
One of the purposes of empowerment program
implementation for small-medium business in Ogan Ilir
Regency was keeping the businesses’ product and service
marketing run well and got more and broader. In accordance
with this, respondents’ answer on question whether their
product and service marketing become more and broader in
area coverage, the result was as follows.
Table 10. More and Broader Product and Service
Marketing
No Statements
Answer options
FS RS Percen
tage VM
D
(1)
D
(2)
N
(3)
A
(4)
VM
A
(5)
1. Your
product and
service
marketing
became
more and
covered
broader
area, partly,
as the result
of your
participatio
n in the
empowerme
nt program.
2 29 27 50 12 401 600 51.67
%
Average
Score
401 51.67
%
Source :Questionnaires, 2018.
Annotation: Frequency Score [FS] = Answer option x
score
Result Score [RS] = Number of Respondent x 5
Score = (FS X 100%) : RS
Table above indicated that from 120 respondents, 62 of
them agreed and very much agreed [answered true and very
true] that they could market more product and service and
covered wider area.
This likable achievement happened because the
empowerment program gave trainings for better skill, lent
money for business capital, and helped marketing the
products and services produced through yearly scheduled
exhibition held by local and provincial governments, state-
owned enterprises, other expositions or festivals, both the
scheduled and the sudden one. Without this empowerment,
it was quite impossible for the businesses to develop
themselves in short time for their very limited capacity. It
was in line with the opinion of Kotler (2005: 11) on the
concept of marketing also stated that the key to achieving
organizational goals was to be more effective than
competitors in integrating marketing activities to determine
and satisfy the needs of the target market.
It could be deduced 51,6% respondents could market
more product and service and covered wider area. By
classification, this indicator was categorized sufficient, since
the average score was 401.
The analysis will be continued to the second indicator –
better welfare - of the last dimension of variable
empowerment program implementation.
3.2. Better Welfare
Welfare – for some people - has been the basic purpose of
running a business. All efforts taken are directed to
accomplish this goal. So, are the small-medium businesses
empowered by the Cooperative and Small-Medium Business
Affairs Office of Ogan Ilir Regency. When the business
were asked – as respondents of this research - on their
welfare due to their business progress, their answers were
like in table below.
Table 11 Better Welfare
No State
ments
Answer options
F
S
R
S
Perce
ntage V
MD
(1)
D
(2)
N
(3)
A
(4)
V
MA
(5)
1. Your
welfare
has been
better
due to
your
business
progress
2 36 10 58 14 4
06
6
00
60%
Avera
ge Score
4
06
60%
Source: Questionnaires, 2018.
Annotation: Frequency Score [FS] = Answer option x
score
Result Score [RS] = Number of Respondent x 5
Score = (FS X 100%) : RS
There were 72 out of 120 respondents who admitted that
their welfare had been better due to their business
development.
Logically, if a business had been well managed, sooner or
later, it would head to an enhancement. The enhancement
occurred because business capital became more. With better
finance, more raw materials, tools, and other business-
related necessities could be fulfilled. Those businessmen
had also be trained for better competencies. Through this
betterment, the product, the service, and the process got
better and more efficient.
These all led to more
products and services sellable.
The more selling well, the
more profitable the business

International Journal of Engineering and Advanced Technology (IJEAT)
ISSN: 2249 – 8958, Volume-8 Issue-5C, May 2019
297
Published By:
Blue Eyes Intelligence Engineering & Sciences Publication
Retrieval Number:E10420585C19/2019©BEIESP
DOI: 10.35940/ijeat.E1042.0585C19
was. This condition supported welfare gain for the
businessmen.
The discussion above led to conclusion that 60% of the
small-medium business had a better welfare since they were
empowered by the Cooperative and Small-Medium Business
Affairs Office of Ogan Ilir Regency. In terms of the average
score, it was 406 and classified into sufficient.
It could be deduced 51,6% respondents could market
more product and service and covered wider area. By
classification, this indicator was categorized sufficient, since
the average score was 401. There were 72 out of 120
respondents who admitted that their welfare had been better
due to their business development. In terms of the average
score, it was 406 and classified into sufficient.
The finding from the analysis of each indicator of every
dimension of variable empowerment program
implementation denoted that empowerment program
implementation was successful. It was notified from the
facts that the degree of compliance was scored 458 which
meant good.
Here is the end of the descriptive statistics [Descriptive
Quantitative] analysis of variable Empowerment Program
Implementation [variable X]. The next is the analysis of
variable Y, Namely The Performance Of Small and Medium
Businesses Which Were Fostered By The Cooperative and
Small And Medium Office Of Ogan Ilir Regency.
B. The Performance Of Small and Medium Businesses
This variable has 4 dimensions, namely, Finance,
Customer, Internal Process, and Growth and Learning.
The financial dimension has 2 indicators. While the
customer dimension consists of 2 indicators. Furthermore,
for the internal process dimension, there are 3 indicators,
and the dimension of growth and learning owns 4 indicators.
The analysis will be carried out per indicator for each
dimension and will be begun with the first indicator from
the first dimension.
1. Finance
The financial dimension has 2 indicators, namely 1)
Business Capital Returns, 2) Business profits.
1.1. Return on business capital
Timeliness of loan Payback is also very important. It is to
increase the confidence of financiers (Office of Cooperative
Ogan Ilir Regency) to the capital beneficiaries. Here will be
presented the answers to questionnaires from respondents
regarding the above.
Table 12. Return on business capital
No Statemen
ts
Answer options
FS RS Percenta
ge
VM
D
(1)
D
(2)
N
(3)
A
(4)
VM
A
(5)
1. You
return the
loaned
capital on
time
20 6 23 42 29 414 600 59.16%
Average
Score
414 59.16%
Source: Questionnaires, 2018.
Annotation: Frequency Score [FS] = Answer option x
score
Result Score [RS] = Number of Respondent x 5
Score = (FS X 100%) : RS
Looking at the data in the table above, it showed that
most of the respondents returned business capital loans on
time. This could be seen from 59.16% of respondents
answering agree. This meaned that the managed business
was successful and gave benefits. From these benefits, they
used to expand their business and paid capital loans on time
to the Ogan Ilir Regency Cooperative Office.
It could be deduced 71 respondents returned business
capital lent on time with an average total score of 414. The
score was included in the good category.
Next, the second indicator of the financial dimension
would be discussed was business profits.
1.2. Business Profit
Profit is one of the main goals of business people in
carrying out their activities. The profit earned will be used
for various purposes, the profit will also increase the welfare
of business actors for the services or products they provide.
profit is the overall measure of a company's achievement
defined as follows: Profit = Sales - Cost (Hanafi, 2010: 32).
The following was the respondents’ questionnaire answers
regarding the above matters.
Table 13. Business benefits
No Statemen
ts
Answer options
FS RS Percenta
ge VM
D
(1)
D
(2)
N
(3)
A
(4)
VM
A
(5)
1. You
benefit
from the
business
- - - 93 17 480 600 91,67%
2. The
benefits
of your
business
increase
2 24 22 66 6 410 600 60%
Average
Score
445 75,83%
Source: Questionnaires, 2018.
Annotation: Frequency Score [FS] = Answer option x
score
Result Score [RS] = Number of Respondent x 5
Score = (FS X 100%) : RS
Based on the table above, it showed that all respondents
stated that they benefited from the business they lived in.
These benefits were used to increase their business so that
the profits obtained were even greater. Profit was indeed
very important for business continuity for the foreseeable
future, because of the profits obtained, business actors
would balance certain expenditure costs, as stated by M.
Nafarin (2007: 788) that profit was the difference between
income and the balance of costs and expenditure for a
certain period.
Since the average score of
business profit was 445. It

International Conference on Recents Advancements in Engineering and Technology (ICRAET-18) |15th and 16th
March 2019|Siddhartha Institute of Technology & Sciences, Telangana, India.
298
Published By:
Blue Eyes Intelligence Engineering & Sciences Publication
Retrieval Number:E10420585C19/2019©BEIESP
DOI: 10.35940/ijeat.E1042.0585C19
could be grouped into good category.
Overall, in terms of finance, it was declared good. The
reason was in capital lending, as many as 71 respondents
returned capital on time with an average score of 414 in the
good category. Then, an indicator of business profits, as
many as 72 respondents stated that they received profits
from the business they lived in with an average score of 445.
The score was included in the good category.
Next, the second dimension will be discussed, namely the
customer with the first indicator is the customer group.
2. Customer
2.1. Customer group
Customers are those who buy or use products or services
from a company. Customers of a product must be developed
and expanded to make business products known and known.
That is why customers must be sought through intense
marketing.
Greenberg (2010: 116) stated that customers were
individuals or groups who bought physical products or
services by considering various factors such as price,
quality, place, service and so on based on their own
decisions. The respondents’ questionnaire answers regarding
the above matters were as follows.
Table 14. Customer group
No Statemen
ts
Answer options
FS RS Percenta
ge
VM
D
(1)
D
(2)
N
(3)
A
(4)
VM
A
(5)
1. You get
new
customers
5 19 20 58 18 425 600 63,33%
Average
Score
425 63,33%
Source :Questionnaires, 2018.
Annotation: Frequency Score [FS] = Answer option x
score
Result Score [RS] = Number of Respondent x 5
Score = (FS X 100%) : RS
The Table above showed that most of the respondents
stated that they got new customers. It was seen from 63.33%
of respondents answering agree. Customers or new
consumers of a business product must be given satisfaction,
because if the new customers were satisfied with the
product, or the services provided, it was possible that they
would be loyal to the related business product.
Surianto and Aisya (2009: 170) argued that if the
customer was satisfied, it could provide benefits for the
company in the form of a greater shopperan and the
possibility of becoming a customer in the long run.
The statement of respondents regarding the above
questionnaire had a score of 425, which was included in the
good category. The next indicator from the customer
dimension was customer mobility.
2.2. Customer mobility
New customers are good for a business, in order to make
the business more known and developed. However, the most
important thing is to make existing customers continue to
use business products rather than looking for new
customers, because customers who are interested in the
product and service will be very easily influenced to conduct
repeat transactions. The following were the respondents’
questionnaire answers regarding the above matters.
Table 15. Customer mobility
No Statemen
ts
Answer options
FS RS Percenta
ge
VM
D
(1)
D
(2)
N
(3)
A
(4)
VM
A
(5)
1. Your old
customers
remain
loyal
3 17 15 66 19 441 600 70.83%
Average
Score
441 70.83%
Source: Questionnaires, 2018.
Annotation: Frequency Score [FS] = Answer option x
score
Result Score [RS] = Number of Respondent x 5
Score = (FS X 100%) : RS
Based on the data in the table above, in this statement the
most dominant answer from respondents – 70,83%- were to
agree. Regarding customers’ loyality, Griffin, (2003: 31),
loyal or loyal customers are very useful for every business,
while the loyal customers are, among others; (1) make
repeated purchases regularly; (2) buy between product lines
and services; (3) referring to others; and (4) show immunity
to attraction from competitors
The respondent's statement regarding the questionnaire
above had a score of 441, which belonged to the good
category.
So, the conclusion of the two indicators on the second
dimension of the Y variable is that there are 76 respondents
from 120 respondents stating that they did get new
customers, and there were 85 respondents from 120
respondents who stated their old customers remained loyal.
The percentage of respondents from the first indicator of the
second dimension of variable Y who said that indeed they
got new customers was 63.33%. While the percentage of the
second indicator that said their old customers remained loyal
was 70.83%. The sum of the percentage of the first indicator
and the second indicator of the Y variable is divided by 2,
That is (63.33 + 70.83): 2 = 67.08. So the percentage of the
second dimension of the Y variable, namely the Quality
dimension is 67.08%.
The third dimension which will be discussed is the
internal process. The first indicator will be the book-
keeping.
3. Internal Process
3.1. Book-keeping System
Book-keeping is the act of recording financial
transactions. Transactions include sales, purchases, income
and expenses by individuals and organizations.
Whereas according to Law No. 28 of 2007 Article 28
book-keeping is defined as a process of recording that must
be carried out regularly to
collect financial data and
information including assets,
liabilities, capital, income,
International Journal of Engineering and Advanced Technology (IJEAT)
ISSN: 2249 – 8958, Volume-8 Issue-5C, May 2019
299
Published By:
Blue Eyes Intelligence Engineering & Sciences Publication
Retrieval Number:E10420585C19/2019©BEIESP
DOI: 10.35940/ijeat.E1042.0585C19
and costs, as well as the acquisition price and delivery of
goods or services, which are closed by preparing financial
statements in the form of balance sheet and income
statement for a certain period. Accounting is used almost in
every activity or business, this is useful for recapitulation of
data at any time needed, especially in the world of economy
or book-keeping business is very mandatory to see the
estimated funds to be issued or funds that will enter. The
following was the respondents’ to questionnaire answers
regarding the above matters.
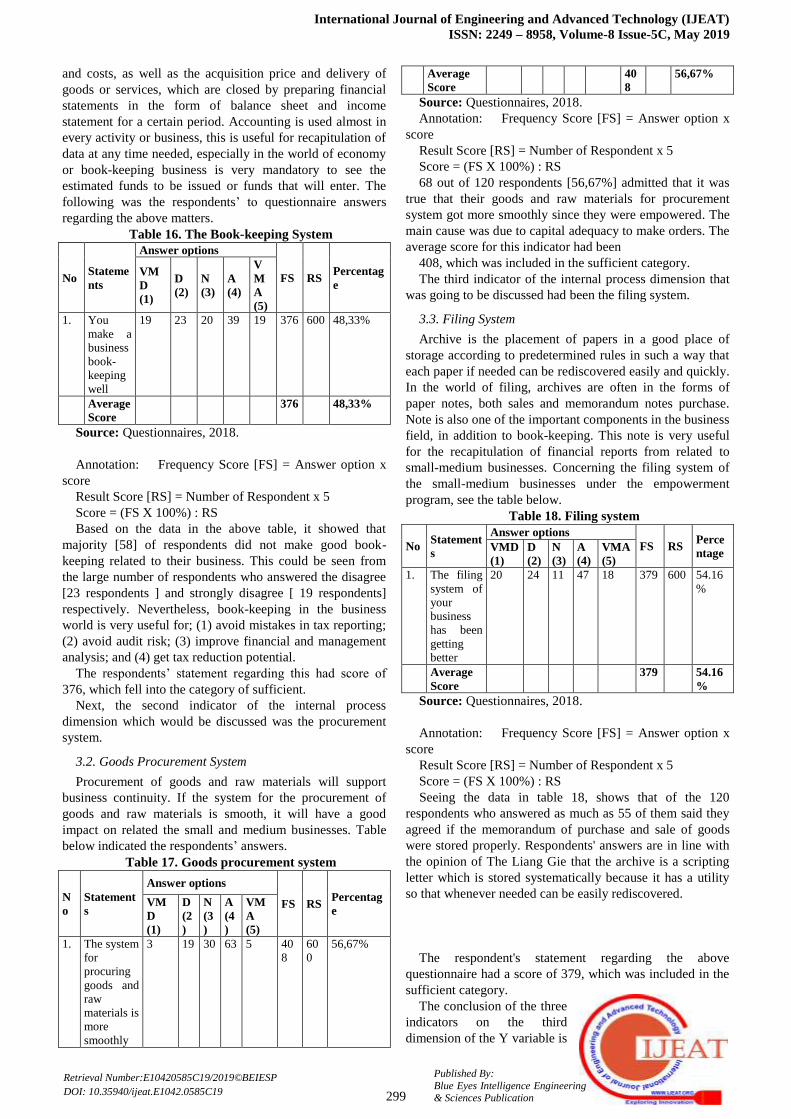
Table 16. The Book-keeping System
No Stateme
nts
Answer options
FS RS Percentag
e
VM
D
(1)
D
(2)
N
(3)
A
(4)
V
M
A
(5)
1. You
make a
business
book-
keeping
well
19 23 20 39 19 376 600 48,33%
Average
Score
376 48,33%
Source: Questionnaires, 2018.
Annotation: Frequency Score [FS] = Answer option x
score
Result Score [RS] = Number of Respondent x 5
Score = (FS X 100%) : RS
Based on the data in the above table, it showed that
majority [58] of respondents did not make good book-
keeping related to their business. This could be seen from
the large number of respondents who answered the disagree
[23 respondents ] and strongly disagree [ 19 respondents]
respectively. Nevertheless, book-keeping in the business
world is very useful for; (1) avoid mistakes in tax reporting;
(2) avoid audit risk; (3) improve financial and management
analysis; and (4) get tax reduction potential.
The respondents’ statement regarding this had score of
376, which fell into the category of sufficient.
Next, the second indicator of the internal process
dimension which would be discussed was the procurement
system.
3.2. Goods Procurement System
Procurement of goods and raw materials will support
business continuity. If the system for the procurement of
goods and raw materials is smooth, it will have a good
impact on related the small and medium businesses. Table
below indicated the respondents’ answers.
Table 17. Goods procurement system
N
o
Statement
s
Answer options
FS RS Percentag
e VM
D
(1)
D
(2
)
N
(3
)
A
(4
)
VM
A
(5)
1. The system
for
procuring
goods and
raw
materials is
more
smoothly
3 19 30 63 5 40
8
60
0
56,67%
Average
Score
40
8
56,67%
Source: Questionnaires, 2018.
Annotation: Frequency Score [FS] = Answer option x
score
Result Score [RS] = Number of Respondent x 5
Score = (FS X 100%) : RS
68 out of 120 respondents [56,67%] admitted that it was
true that their goods and raw materials for procurement
system got more smoothly since they were empowered. The
main cause was due to capital adequacy to make orders. The
average score for this indicator had been
408, which was included in the sufficient category.
The third indicator of the internal process dimension that
was going to be discussed had been the filing system.
3.3. Filing System
Archive is the placement of papers in a good place of
storage according to predetermined rules in such a way that
each paper if needed can be rediscovered easily and quickly.
In the world of filing, archives are often in the forms of
paper notes, both sales and memorandum notes purchase.
Note is also one of the important components in the business
field, in addition to book-keeping. This note is very useful
for the recapitulation of financial reports from related to
small-medium businesses. Concerning the filing system of
the small-medium businesses under the empowerment
program, see the table below.
Table 18. Filing system
No Statement
s
Answer options
FS RS Perce
ntage VMD
(1)
D
(2)
N
(3)
A
(4)
VMA
(5)
1. The filing
system of
your
business
has been
getting
better
20 24 11 47 18 379 600 54.16
%
Average
Score
379 54.16
%
Source: Questionnaires, 2018.
Annotation: Frequency Score [FS] = Answer option x
score
Result Score [RS] = Number of Respondent x 5
Score = (FS X 100%) : RS
Seeing the data in table 18, shows that of the 120
respondents who answered as much as 55 of them said they
agreed if the memorandum of purchase and sale of goods
were stored properly. Respondents' answers are in line with
the opinion of The Liang Gie that the archive is a scripting
letter which is stored systematically because it has a utility
so that whenever needed can be easily rediscovered.
The respondent's statement regarding the above
questionnaire had a score of 379, which was included in the
sufficient category.
The conclusion of the three
indicators on the third
dimension of the Y variable is

International Conference on Recents Advancements in Engineering and Technology (ICRAET-18) |15th and 16th
March 2019|Siddhartha Institute of Technology & Sciences, Telangana, India.
300
Published By:
Blue Eyes Intelligence Engineering & Sciences Publication
Retrieval Number:E10420585C19/2019©BEIESP
DOI: 10.35940/ijeat.E1042.0585C19
that there were 58 respondents from 120 respondents stating
that they made business bookkeeping well, and there were
68 out of 120 respondents stating that the procurement
system for raw materials was smoother, then 65 out of 120
respondents states that the memorandum of purchase and
sale of goods is stored properly. The percentage of
respondents from the first indicator of a well-made business
bookkeeping is 48.33%. Then the second indicator produced
a percentage of 56.67% regarding the system of
procurement of goods or raw materials more smoothly.
Furthermore, the last indicator on the internal process
dimension, namely the purchase and sale notes, are stored
well, resulting in a percentage of 54.16%. The sum of the
percentages of the first, second, and third indicators of the Y
variable is divided by 3, namely (48.33 + 56.67 + 54.16): 3
= 53.05. So the percentage of the third dimension of the Y
variable, namely the dimension of Cost is 53.05%.
Next, the fourth dimension will be discussed, namely
growth and learning, the first indicator of sales of goods and
business products has increased.
4. Growth and Learning
4.1. Level of Marketing and Sales
Sales of goods are elements or parts that are
interconnected and function together according to their
respective duties to achieve the stated goals. The stated goal
is to sell goods and business products, which must be
pursued to increase sales from time to time. The following
will be presented by the respondent's questionnaire answers
regarding the above matters through table below.
Table 19. Level of marketing and sales
No Statemen
ts
Answer options
FS RS Percent
age VMD
(1)
D
(2)
N
(3)
A
(4)
VMA
(5)
1. Sales of
your
business
goods and
products
have
increased
4 29 19 56 12 403 600 56.67%
Average
Score
403 56.67%
Source: Questionnaires, 2018.
Annotation: Frequency Score [FS] = Answer option x
score
Result Score [RS] = Number of Respondent x 5
Score = (FS X 100%) : RS
Based on the data in the table above, it shows that the
most dominant answer from the respondents stated that they
agreed that if their sales of goods and business products had
increased, the total percentage was 56.67%.
The respondents’ statement regarding the questionnaire
above had a score of 403, which were included in the
sufficient category. Next will be discussed the second
indicator of the dimensions of growth and learning, namely
the production of business goods has increased.
4.2. Production Level
Production is all activities that aim to increase or add to
the use of an object, or all activities aimed at satisfying
others through exchange (Partadireja, 1985: 21). Referring
to the previous indicator, if the sale of goods experiences a
significant increase, the production of business goods must
also be increased, this is the goal so that there is no
emptying of the stock if at any time consumers need. The
following will be presented by the respondent's
questionnaire answers regarding the above matters through
Table 20 below.
Table 20. Production level
No Statemen
ts
Answer options
FS RS Percenta
ge
VM
D
(1)
D
(2)
N
(3)
A
(4)
VM
A
(5)
1. Productio
n of
business
goods has
increased
3 29 14 63 11 410 600 61.67%
Average
Score
410 61.67%
Source: Questionnaires, 2018.
Annotation: Frequency Score [FS] = Answer option x
score
Result Score [RS] = Number of Respondent x 5
Score = (FS X 100%) : RS
In Table 18 the data presented, shows that out of 120
respondents the majority agree if the production of their
business goods has increased. Ahyari (2002: 150) says that
increasing production of a company must meet several
factors; (1) availability of basic materials; (2) availability of
the capacity of machines owned; (3) availability of labor; (4)
the amount of demand for production; and (5) availability of
production factors.
The respondent's statement regarding the questionnaire
above had a score of 410, which was included in the
sufficient category. Next will be discussed the third
indicator of the dimensions of growth and learning, namely
experience and insight increases.
4.3. Experience and Insight
According to Notoadmodjo (2010: 188) experience is a
way to obtain the truth of knowledge by repeating the
knowledge gained in solving problems encountered in the
past. The following will be presented by the respondent's
questionnaire answers regarding the above matters through
Table 21 below.
Table 21. Experience and insight
No State
ments Answer options
F
S
R
S
Percen
tage

International Journal of Engineering and Advanced Technology (IJEAT)
ISSN: 2249 – 8958, Volume-8 Issue-5C, May 2019
301
Published By:
Blue Eyes Intelligence Engineering & Sciences Publication
Retrieval Number:E10420585C19/2019©BEIESP
DOI: 10.35940/ijeat.E1042.0585C19
V
MD
(1)
D
(2)
N
(3)
A
(4)
V
MA
(5)
1. Your
experienc
e and
insight
increases
1 26 20 60 13 4
18
6
00
60.83
%
Avera
ge Score
4
18
60.83
%
Source: Questionnaires, 2018.
Annotation: Frequency Score [FS] = Answer option x
score
Result Score [RS] = Number of Respondent x 5
Score = (FS X 100%) : RS
Referring to the data in the table above, most of the total
100% said they would agree if their experiences and insights
increased.
The respondent's statement regarding the questionnaire
above has a score of 418, which is included in the good
category. Next will be discussed the last indicator of the
dimensions of growth and learning, namely knowledge
about business increases.
4.4. Knowledge
Knowledge is information that is known or realized by a
person based on sensory observation (Tjandra, 2004: 35). In
this case, the knowledge in question is knowledge of the
business obtained by business actors from the training
provided by the Cooperative Office. This knowledge is
expected not only to be accepted but also can be improved.
The following will be presented by the respondent's
questionnaire answers regarding the above matters through
Table 22 below.
Table 22. Knowledge
No State
ments
Answer options
F
S
R
S
Percen
tage
V
MD
(1)
D
(2)
N
(3)
A
(4)
V
MA
(5)
1. Knowl
edge
about
business
increases
1 22 21 65 11 4
23
6
00
63.33
%
Avera
ge Score
4
23
63.33
%
Source: Questionnaires, 2018.
Annotation: Frequency Score [FS] = Answer option x
score
Result Score [RS] = Number of Respondent x 5
Score = (FS X 100%) : RS
Referring to the data in the table above, 76 respondents
from all 120 respondents said they agreed if the knowledge
about their business increased. Knowledge can be obtained
in various ways, as mentioned by Soekidjo (2005: 76),
namely; (1) how to try sala; (2) the way of power or
authority; and (3) personal experience.
The last indicator of growth and learning dimension was
knowledge. It had been scored 423 which was included in
good category.
From the above analysis, it could be concluded that, on
average, the dimension of growth and learning was good
because the score was 413.
In terms of descriptive statistics analysis, it was positively
recapitulated that both variables empowerment program
implementation and the performance of small-medium
businesses were good. The scores were 458 and 413.
Table 23. Recapitulation of Empowerment Program Implementation and the Performance of Small and Medium
Businesses
No Variable: Empowerment Program Implementation
1 Dimension: The degree of compliance
with 5 indicators:
Score Creteria
The needed documents 537 Very good
The requirement fulfillment 528 Very good
The needed documents completeness 537 Very good
Loan money appropriateness 422 Good
Available training participation 453 Good
2
Dimension: The smoothness of routine functions
with 2 indicators:
Production process smoothness 453 Good
Marketing smoothness 389 Sufficient
3
Dimension: The desired target and impact
with 2 indicators:
More and broader product and service marketing 401 Sufficient
Better Welfare 406 Sufficient
Average score for Empowerment Program Implementation
458
Good
No Variable: The Performance of the businesses

International Conference on Recents Advancements in Engineering and Technology (ICRAET-18) |15th and 16th
March 2019|Siddhartha Institute of Technology & Sciences, Telangana, India.
302
Published By:
Blue Eyes Intelligence Engineering & Sciences Publication
Retrieval Number:E10420585C19/2019©BEIESP
DOI: 10.35940/ijeat.E1042.0585C19
1 Dimension: Finance with 2 indicators: Score Creteria
Return on business capital 414 Good
Business Profit 445 Good
2
Dimension: Customer with 2 indicators:
Customer group 425 Good
Customer mobility 441 Good
3
Dimension: Internal Process with 3 indicators:
Book-keeping System 376 Sufficient
Goods Procurement System 408 Sufficient
Filing System 379 Sufficient
4 Dimension: Growth and Learning with 4 indicators:
Level of Marketing and Sales 403 Sufficient
Production Level 410 Sufficient
Experience and Insight 418 Good
Knowledge 423 Good
Average score for The Performance of the businesses 412 Good
The analysis of descriptive statistics was going to be
followed by the analysis of explanative [confirmatory]
technique.
C. Data Analysis by Using Explanative (Confirmatory)
Technique
The questions raised were: Was there any influence of
small and medium enterprises empowerment program
implementation towards the performance of the small and
medium businesses? How much was the influence of small
and medium enterprises empowerment program
implementation towards the performance of the small and
medium businesses?
To answer the first question, it was necessary to find out
the value of correlation coefficient by making use of simple
linear regression approach by using SPSS program version
25.0 for windows. The first step was testing whether the
data were normally distributed. For this, see the following
figure.
Fig. 2Data Distribution Normality
The graph showed that data were concentrated around
linear lines. It could be concluded that data were normally
distributed.
Then, the result of hypothesis test by using t test denoted
that t = 10,972, while t table = 1,645 which was obtained
from the degree of freedom (df) = N - 2 where 120 – 2 = 118
with significance level was 5%. Because t was more that t
table [10,972 > 1,645 ] 1,645, it meant that H1 was
accepted, while H0 is rejected. Hypothesis test could be seen
from bell curve in the Figure 3 below:
Fig. 3. Bell curve for hypothesis testing
From the curve above, it could be drawn a conclusion that
there was a positive and significant influence of
empowerment program implementation towards the
performance of small and medium business empowered by
Cooperative and Small and Medium affairs Office of Ogan
Ilir Regency.
Tthe following is a recapitulation of the results of analysis
by means of simple linear regression.
-3 -2 -1 0 1 2 3
1
,
-
1,
0
Reception
Area of Ha
t count = 10,972
Reception
Area of H0
Reception
Area of Ha

International Journal of Engineering and Advanced Technology (IJEAT)
ISSN: 2249 – 8958, Volume-8 Issue-5C, May 2019
303
Published By:
Blue Eyes Intelligence Engineering & Sciences Publication
Retrieval Number:E10420585C19/2019©BEIESP
DOI: 10.35940/ijeat.E1042.0585C19
Table 24. Recapitulation of Results of Simple Linear
Regression Analysis Using SPSS Version 25.0
No. Results Information
1. Correlation
Coefficient (Value
R) of 0.711
The interpretation was that the
relationship between the two variables
had been in strong correlation
category.
2. The Determination
Coefficient (R
Square) was 0.505
It meant the influence of
empowerment program
implementation towards the
performance of the businesses had
been 50.5%. While another 49,5% was
influenced by other factors (epsilon)
which were not examined in this study.
3 The value of
significance (Sig.)
was 0.00
The significance test results from this
table were used to determine the level
of significance or linearity of the
regression. Criteria could be
determined based on the test of
significance value. The Sig value was
0.00. Since 0.00 < 0.05 (significance
criteria). Thus the regression equation
model was significant, or the
regression equation model met the
criteria.
4. Simple Linear
Regression
Coefficient
with the value
constant (a) of
18,831
and the value of
empowerment
program
implementation (b /
regression
coefficient) of 0.502
The constant value of 18,831 implied
that the consistent value of the variable
small-medium businesses performance
was 18,831. The regression coefficient
X of 0.502 stated that every 1%
addition to the value of the
empowerment program
implementation, the value of small-
medium businesses performance
increased by 0.502. The regression
coefficient was positive, so it could be
said that the direction of the influence
of variable X towards Y was positive.
5. The value of t
count is equal to
10,972
There is a significant effect of variable
X towards Y variable if t count> t
table. Based on the t test it was known
that the t-count value was 10,972 > t
table 1,645 so that it could be
concluded that the Empowerment
Program Implementation variable
influenced the Performance of Small
and Medium Micro Enterprises
variable. So that it can be concluded
that the variable X has a significant
effect on the variable Y. Then H1 is
accepted and H0 is rejected.
Source: Processed from primary data through SPSS
version 25.0, October 2018
From table 24 above, it could be seen that Empowerment
Program Implementation on small and medium businesses
influenced the Performance of the businesses. The influence
had been as much as 50,5%. See the following model.
Fig. 4The Model of Empowerment Program
Implementation affected the Performance of Small and
Medium Businesses
V. CONCLUSION
In terms of descriptive quantitative (descriptive statistics)
analysis technique, it showed that Empowerment Program
Implementation on small-medium businesses empowered by
Cooperative and Small-Medium Affairs Office of Ogan Ilir
Regency was was scored 458 which meant good. The
Performance of the small-medium businesses had been
good, too. The score was 412.
Furthermore, explanative [confirmatory] analysis by
making use of simple linear regression with SPSS program
25.0 showed that the Empowerment Program
Implementation positively and significantly influenced the
Performance of Small and Medium Micro Enterprises.
It was proved where t value was more than t table
[10,972 > t table 1,645]. Forward, the determination
coefficient (R Square) was 0.505. It meant the influence of
Empowerment Program Implementation towards the
Performance of Small and Medium businesses was as much
as 50,5 %. Another 49,5% was influenced by other factors
which were not examined in this study [Ԑ epsilon].
VI. SUGGESTION
based on the results of the discussion and calculation
above, the recommended advice to the ogan ilir cooperative
service is as follows:
1) The cooperative and small-medium business affairs
office is suggested to help more to market small-medium
businesses’ products by introducing the products in more
exhibitions on local, national, and, even, international levels.
more markets gives more benefits
2) The small-medium business to pay better attention
towards internal process for better book-keeping system,
filing system, and goods procurement system.

International Conference on Recents Advancements in Engineering and Technology (ICRAET-18) |15th and 16th
March 2019|Siddhartha Institute of Technology & Sciences, Telangana, India.
304
Published By:
Blue Eyes Intelligence Engineering & Sciences Publication
Retrieval Number:E10420585C19/2019©BEIESP
DOI: 10.35940/ijeat.E1042.0585C19
REFERENCES
Books :
1. Aditama, Yoga Tjandra. 2004. “Manajemen Administrasi
Rumah Sakit, Jakarta: UI Press
2. Ahyari, Agus. 2002. “Manajemen Produksi Perencanaan
Sistem Produksi Buku II”.
3. Yogyakarta: BPFE Yogyakarta.
4. Assauri, Sofian. 2004. “Manajemen Produksi dan
Operasi”. Edisi Revisi. Lembaga Penerbit Fakultas
Ekonomi, Universitas Indonesia. Jakarta.
5. Alex S, Nitisemito. 1996. “Managemen Personalia”.
Bandung: Ghalia Indonesia
6. Bernadin, H. John. 1998. “Human Resource
Management: An Exprential Approach”.
7. Irwin/McGraw-Hill.
8. Budi, Triton P. 2006. “SPSS13.0 Terapan: Riset Statistik
Parametrik”. Yogyakarta: C.V
9. Andi Offset.
10. Greenberg, Paul. 2010. “Customer Relationship
Management as the Spread of Light :Fourth
11. Edition”. Jakarta: Rineka Cipta.
12. Griffin, Jill. 2003. “Customer Loyalty : how to earn it,
how to keep it”. Jakarta: Erlangga.
13. Hanafi, Mahmud M. 2010. Manajemen Keuangan.
Cetakan kelima. Yogyakarta:BPFE.
14. Hanggana, Sri. 2006. “Akuntansi Biaya”. Surakarta:
Mediatama.
15. Jauch, Lawrence R. dan William F. Glueck, (1998),
“Manajemen Strategis dan Kebijakan Perusahaan”,
Edisi ketiga, Erlangga, Jakarta.
16. Kotler, Philip. 2001. Manajemen Pemasaran: Analisis,
Perencanaan, Implementasi dan Kontrol. Jakarta: PT.
Prehallindo.
17. Nafarin, M. 2007. ”Penganggaran Perusahaan”.
Jakarta:Salemba Empat.
18. Notoadmojo, Soekidjo. 2010. “Metodologi Penelitian
Kesehatan”. Jakarta: PT Rineka.
19. ___________________ 2005. “Metodologi Penelitian
Kesehatan”. Jakarta: PT Rineka.
20. Suyatno, Thomas. 2007. “Dasar-dasar Perkreditan”.
Jakarta: Gramedia Pustaka Bersama.
21. Thomas, Rolling G. 1957. “Our Modern Banking and
Monetary System”.
22. Tu’u, Tulus. 2004. “Peran Disiplin Pada Perilaku dan
Prestasi Siswa”. Jakarta: PT
23. Grasindo.
24. Partadireja, Ace. 1985. “Pengantar Ekonomi”.
Yogyakarta: BPFE-UGM.
25. Procton, J. H. Dan Thornton, W. M. (Diterjemahkan
Mulyana Sugandi). 1983. “Latihan
26. Kerja”. Jakarta: Bina Aksara.
Journal:
1. Sudaryanto. 2011. “The Need for ICT-Education for
Manager or Agribusinessman to Increasing Farm
Income : Study of Factor Influences on Computer
Adoption in East Java Farm Agribusiness”. International
Journal of Education and Development, JEDICT, Vol 7
No 1 halm. 56-67.
2. Surianto, Agung dan Aisyah, Nurul. 2009. “Pengaruh
Penerapan Experiential Marketing Strategik Terhadap
Kepuasan”. Journal of Logos Vol. 6, No. 2. Universitas
Muhammadiah Gresik.
Internet:
1. Kotler, Philip (2011, March 29). Marketing Definitions.
Heidin Cohen: Actionable Marketing Guide.
https://heidicohen.com/marketing-definition.
2. https://www.salesfusion.com/resource/measuring-
marketing-effectiveness-5-metrics-need-track
AUTHORS PROFILE
Andy Alfatih was born in Musi Banyuasin, South
Sumatera, on December 24, 1960. In 1989 graduated from
under graduate degree in field public administration,
University of Sriwijaya, South Sumatera Indonesia.
Graduated in 1996 from master degree of public
administration from Flinders University, South Australia,
Australia. In 2010, graduated from Doctoral degree
infield Public Administration, University of Padjajaran, Bandung, West
Java, Indonesia.
He is a lecturer in Public Administration Department, Faculty of Social
and Political Sciences and Public Administration Post Graduate Program,
Sriwijaya University, Palembang City, South Sumatera, Indonesia.
Published books and articles are : 1) The Effectiveness of Kambang Iwak
Besak Park as A Public Space, In Palembang City, Indonesia (Scopus
Journal in Advanced Science Letters. Volume 23, Number 5, May 2017,
pp.4904-4907), DOI:https://doi.org/10.1166/asl.2017.8952. 2) Journal
indexed by Copernicus on International Journal of Social Science and
Humanity, Public Policy on Green Open Space Development in Palembang
City, Indonesia. Volume 08. Nomor 2, February, 2018, pp. 55-58, doi:
10.18178/ijssh.2018.8.2.933. 3) Research Methodology, (Teaching Modul,
Faculty of Social and Political Sciences, Sriwijaya University, 2010).
Current and previous research interests are about public policy in local
government.
Dr. Alfatih active as both speaker and moderator since 2012 in Eastern
Regional Organization for Public Policy Administration (EROPA). Active
as both speaker and moderator since 2012 in International Conference on
Local Government (ICLG). Active as both speaker and moderator since
2012 in Indonesian Association for Public Administration (IAPA). Active
as speaker since 2014 in Asian Studies Association of Australia.
Diana D. Sartika was born in Prabumulih, South
Sumatera, Indonesia, on Februari, 11 1980. In 2003
graduated from under graduate degree in field
Sociology, University of Sriwijaya, South Sumatera
Indonesia. Graduated in 2007 from Master degree of
Sociology from Gadjah Mada University, Yogyakarta,
Indonesia. In 2016 until now still studying as a
Doctoral student in field Sociology, at Gadjah Mada
University, Yogyakarta, Indonesia.
She is a lecturer in Sociology Department, Faculty of Social and
Political Sciences, Sriwijaya University, Palembang City, South Sumatera,
Indonesia. Published books and articles are : 1) The Effectiveness of
Kambang Iwak Besak Park as A Public Space, In Palembang City,
Indonesia (Scopus Journal in Advanced Science Letters. Volume 23,
Number 5, May 2017, pp. 4904-4907),
DOI:https://doi.org/10.1166/asl.2017.8952. 2) Journal indexed by
Copernicus on International Journal of Social Science and Humanity,
Public Policy on Green Open Space Development in Palembang City,
Indonesia. Volume 08. Nomor 2, February, 2018, pp. 55-58, doi:
10.18178/ijssh.2018.8.2.933. Current and previous research interests are
about Sociology, Gender and Child Studies.
Sartika active as both Regional Facilitator and Activist of Integrated
Child Protection Based on Society in South Sumatera Province, Indonesia,
since 2016 until now. Also active as a researcher in Centre of Gender and
Child Studies, Institute for Research and Community Service, University of
Sriwijaya from 2003 until now.
Dyah H. ENH was born in Blora, Central Java,
Indonesia, on October, 02 1960. In 1986 graduated
from under graduate degree in field Sociology,
University of Gadjah Mada, Yogyakarta, Indonesia.
Graduated in 2008 from the master degree of Public
Administration from Sriwijaya University, South
Sumatera, Indonesia.
She is a lecturer in Sociology Department, Faculty
of Social and political Sciences, Sriwijaya University, Palembang City,
South Sumatera, Indonesia. She is also a former Dean on Faculty of Social
and Political Sciences, Sriwijaya University, South Sumatera, Indonesia, in
2009-2013. Published books and articles are : 1) The Effectiveness of
Kambang Iwak Besak Park as A Public Space, In Palembang City,

International Journal of Engineering and Advanced Technology (IJEAT)
ISSN: 2249 – 8958, Volume-8 Issue-5C, May 2019
305
Published By:
Blue Eyes Intelligence Engineering & Sciences Publication
Retrieval Number:E10420585C19/2019©BEIESP
DOI: 10.35940/ijeat.E1042.0585C19
Indonesia (Scopus Journal in Advanced Science Letters. Volume 23,
Number 5, May 2017, pp. 4904-4907),
DOI:https://doi.org/10.1166/asl.2017.8952. 2) Journal indexed by
Copernicus on International Journal of Social Science and Humanity,
Public Policy on Green Open Space Development in Palembang City,
Indonesia. Volume 08. Nomor 2, February, 2018, pp. 55-58, doi:
10.18178/ijssh.2018.8.2.933. 3) Implementasi Nilai-nilai Pancasila dalam
Mewujudkan Pembangunan Karakter Bangsa di Perguruan Tinggi,
(Padang, Indonesia, Laboratorium Sosiologi, Faculty of Social and Political
Sciences, Andalas University, 2016). Current and previous research
interests are about Sociology.