Single Stem Cell Positioning on Polylysine and Fibronectin Microarrays
Upload
independentCategory
view
2download
0
www.elsevier.com/locate/ygeno
Genomics 83 (2004) 989–999
T lymphocyte activation gene identification by coregulated expression
on DNA microarrays$
Mao Mao, Matt C. Biery, Sumire V. Kobayashi, Terry Ward, Greg Schimmack, Julja Burchard,Janell M. Schelter, Hongyue Dai, Yudong D. He, and Peter S. Linsley*
Rosetta Inpharmatics LLC, Merck Research Laboratories, 401 Terry Avenue N, Seattle, WA 98109, USA
Received 8 July 2003; accepted 20 December 2003
Available online 20 March 2004
Abstract
High-capacity methods for assessing gene function have become increasingly important because of the increasing number of newly
identified genes emerging from large-scale genome sequencing and cDNA cloning efforts. We investigated the use of DNA microarrays to
identify uncharacterized genes specifically involved in human T cell activation. Activation of human peripheral blood T lymphocytes induced
significant changes in hundreds of transcripts, but most of these were not unique to T cell activation. Variation of experimental parameters
and analysis techniques allowed better enrichment for gene expression changes unique to T cell activation. Best results were achieved by
identification of genes that were most highly coregulated with the T-cell-specific transcript interleukin 2 (IL2) in a ‘‘compendium’’ of
experiments involving both T cells and other cell types. Among the genes most highly coregulated with IL2 were many genes known to
function during T cell activation, together with ESTs of unknown function. Four of these ESTs were extended to novel full-length clones
encoding T-cell-regulated proteins with predicted functions in GTP metabolism, cell organization, and signal transduction.
D 2004 Elsevier Inc. All rights reserved.
Keywords: Microarray; T cell; Activation; Coregulation
Gene expression pattern comparison is a widely used
means to identify genes involved in cellular processes of
interest, and many experimental approaches have been
developed for this purpose [1]. One technique for comparing
gene expression is DNA microarray hybridization, which
allows quantification of the expression of many thousands of
discrete sequences in a single assay [2,3]. Coordinated
expression of genes functioning in common processes, as
exemplified by bacterial operons, is also common in higher
organisms [4]. Coregulation in DNAmicroarray experiments
was suggested as a method to uncover and assign function to
genes for which information is not available [5]. Coregula-
0888-7543/$ - see front matter D 2004 Elsevier Inc. All rights reserved.
doi:10.1016/j.ygeno.2003.12.019
1 Abbreviations: IL2, interleukin 2; ROAST, Rosetta Array Search
Tool.$ Supplementary data for this article may be found on Science Direct.
Sequence data from this article have been deposited with the Genbank
Data Library under Accession Nos. AF385429, AF385431, AF385435, and
AF385437.
* Corresponding author. Fax: (206) 802-6388.
E-mail address: [email protected] (P.S. Linsley).
tion has been used for functional characterization of un-
known genes from model organisms [6 –8], but this
approach has not been widely used for functional assignment
of unknown sequences in mammalian systems.
During an immune response, T lymphocytes interact with
antigen-presenting cells (APCs) in a complex process in-
volving intercellular interactions between many T cell
surface receptors and cognate ligands on APCs. During
these encounters, T cells undergo an elaborate transcription-
al response, leading to cellular differentiation and acquisi-
tion of immunologic function [9]. An understanding of the
molecular basis of T cell activation is essential to our
understanding of both immune responses and how to
manipulate them therapeutically. Therefore, gene expression
changes accompanying T cell activation and differentiation
have been intensively studied [10–17].
Previously, we have demonstrated the use of DNA
microarrays based on ink-jet technology [18] for the sys-
tematic identification of genes expressed under conditions
of interest [19]. We wished to identify genes specifically
regulated during T cell activation and not during other
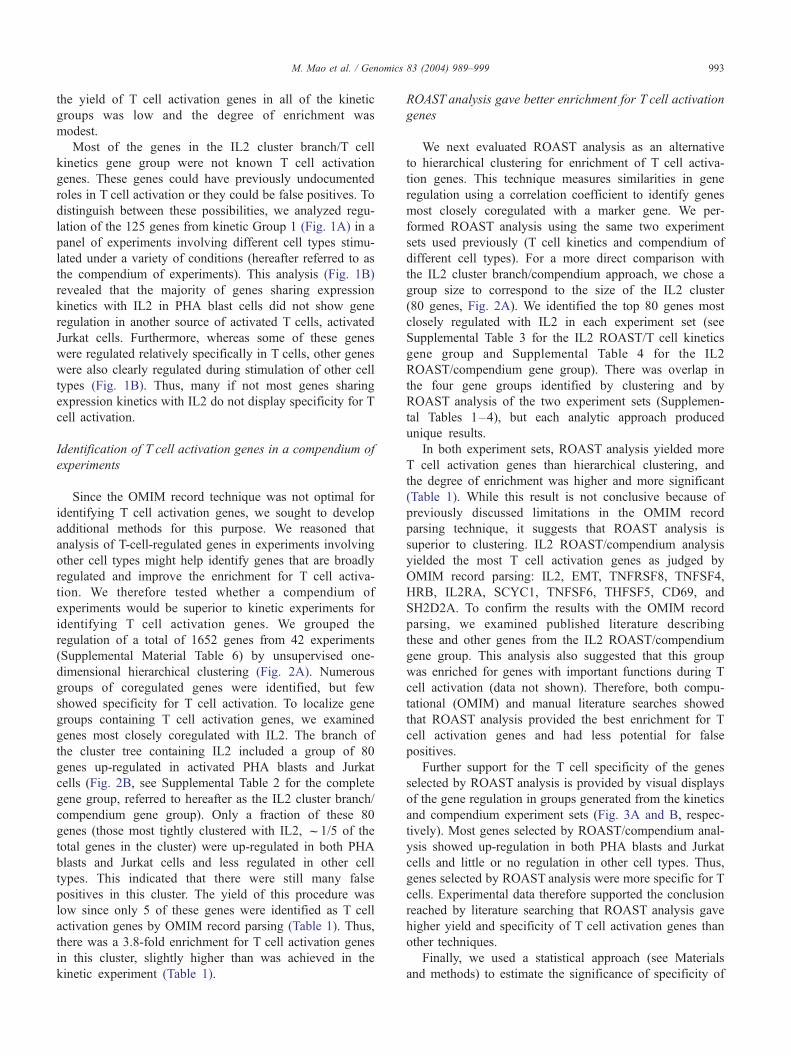
Table 1
Enrichment of T cell activation genes by different analytic approaches
Gene list Total
genes
OMIM
annotated
T cell
genes
Percentage
of T cell
genes
Enrichment
of T cell
genes
p value
All genes on Hu25K array 23,968 5943 185 3.1% 1.0 1.0� 100
Signature genes from T cell kinetics 357 180 15 8.3% 2.7 3.1�10� 4
IL2 cluster branch/T cell kinetics 125 70 5 7.1% 2.3 4.5� 10� 2
IL2 cluster branch/compendium 80 42 5 11.9% 3.8 7.5� 10� 3
IL2 ROAST/T cell kinetics 80 36 6 16.7% 5.4 6.5� 10� 4
IL2 ROAST/compendium 80 47 11 23.4% 7.5 1.2� 10� 7
Shown are the total numbers of genes from various gene groups defined in the text, numbers of genes from those groups having OMIM annotations, and
numbers of OMIM-annotated genes associated with T cell activation, calculated as described under Materials and methods. The percentage of T cell genes was
calculated as (number of T cell genes/number OMIM annotated genes)� 100. The enrichment of T cell genes for each group was calculated as (% T cell genes/
% T cell genes on the chip as a whole (3.1%)). The p value for the overrepresentation of T cell genes from OMIM annotations in each group was calculated
from the hypergeometric distribution.
M. Mao et al. / Genomics 83 (2004) 989–999990
biological events in other cell types (T cell activation genes).
Here, we evaluate the use of these arrays for functional
characterization of T cell activation genes.
Results
Identification of T cell activation genes using the Online
Mendelian Inheritance in Man (OMIM) database
We wished to use objective techniques to compare
different methods of expression analysis for enrichment of
T cell activation genes, but were limited by the lack of
readily available functional annotation for many genes. We
therefore devised a method for identifying known T cell
activation genes by extracting information from OMIM
records (see Materials and methods). Of the 23,968 genes
on the Hu25K array, 5943 had OMIM records; of the latter
group of OMIM records, 185 (f3.1%) contained the terms
‘‘T-cell’’ and ‘‘activat’’ in at least one sentence. A literature
search for information about the genes in this group sug-
gested that the assignments were largely valid. We therefore
used these 185 genes to monitor the yield and enrichment of
different experimental and analytical techniques for T cell
activation genes (Table 1).
Analysis of expression kinetics for enrichment of genes
regulated during T cell activation
We first evaluated the kinetics of gene regulation
during T cell activation, as this method has been previ-
Fig. 1. Enrichment for T cell activation genes by kinetic analysis of gene regula
regulation. DNA microarrays were hybridized with a mixture of cRNA from restin
with immobilized anti-CD3 and soluble anti-CD28 mAbs. Shown are 357 genes re
the experiment. The order of genes along the x axis has been rearranged by cluster
125 genes; Group 2, 84 genes; Group 3, 11 genes; Group 4, 27 genes; and Group 5
kinetics gene group. The expression ratios of individual genes along the x axis are c
Red indicates genes that were up-regulated and green, genes that were down-r
Specificity of genes regulated during T cell activation. Shown is the regulation of g
kinetics gene group) in experiments involving different cell types. The order of g
ously used for functional gene grouping [20]. Phytohe-
magglutinin-activated T cell blasts (PHA blasts), a source
of peripheral blood T cells, were stimulated for various
periods of time with a combination of anti-CD3 and anti-
CD28 monoclonal antibodies (mAbs). Total RNA was
isolated from each culture, and cRNA was amplified and
used for competitive hybridizations on Hu25K micro-
arrays. This experiment revealed a total of 357 statisti-
cally significant gene regulations (>3-fold, p<0.01, see
[8] for details of the p-value calculations). Only 180 of
these regulated genes had OMIM records, of which only
15 (8.3%) were annotated as T cell activation genes.
Thus, the vast majority of genes annotated in OMIM as
being associated with T cell activation were not regulated
in our experiments with anti-CD3 and anti-CD28 activat-
ed PHA blasts. This result indicates that the OMIM gene
list does not optimally represent T cells activated in this
manner. Nonetheless, the OMIM record searching tech-
nique is useful for tracking some T cell activation genes
and we continued to use this technique as an objective
metric. However, we always corroborated results obtained
with the OMIM record searching technique by literature
searching or by statistical analysis of experimental data
(see below).
We used hierarchical clustering to identify groups of T
cell activation genes with similar kinetic patterns, yield-
ing five distinct groups containing >3 genes each (Fig.
1A). Group 1 (125 genes, see Supplemental Table 1 for
the complete gene group) contained 5 T cell activation
genes (IL2,1 TNFSF5, SLAM, NFIL3, and MIG). Group
4 also contained 5 genes associated with T cell activation
tion during T cell activation. (A) Hierarchical clustering analysis of gene
g peripheral blood PHA blasts and blasts activated for the indicated periods
gulated >3-fold, p< 0.01, at two or more time points following initiation of
ing of expression ratios (log10 R/G) to fall into five kinetic groups: Group 1,
, 91 genes. Group 1 is referred to in the text as the IL2 cluster branch/T cell
olor-coded according to a 10-fold response range specified by the color bar.
egulated. Gray shows missing data or log10 intensity less than � 1. (B)
enes from Group 1 (A; referred to in the text as the IL2 cluster branch/T cell
enes along the x axis was arranged as it as in A.

M. Mao et al. / Genomics 83 (2004) 989–999 991
(IFNG, TNSF6, SCYC1, MYC, and SCYA4), whereas
other groups contained one or no T cell activation genes.
Two of the kinetic groups (Groups 1 and 4) gave slight
enrichment for T cell activation genes; examination of the
literature for these genes suggested those from Group 1
were more T cell specific. Only one T cell activation

M. Mao et al. / Genomics 83 (2004) 989–999992
gene (FYB) was found among the down-regulated genes
(Group 5); we therefore focused on only up-regulated
genes in subsequent experiments. Group 1 genes (here-
after referred to as the IL2 cluster branch/T cell kinetics
gene group) were enriched for genes involved in T cell
Fig. 2. Enrichment for T cell activation genes by hierarchical clustering of data f
compendium. The same clustering parameters as in Fig. 1A was used. The brack
branch/compendium gene group). (B) Exploded view of the IL2 cluster branch/co
from the IL2 cluster branch/compendium gene group are described in Supplemen
activation by 2.3-fold from all the 23,968 genes repre-
sented on the Hu25K microarray (see Table 1). However,
the overall enrichment for T cell activation genes in
Group 1 was essentially the same as seen with the entire
group of 357 regulated genes in this experiment. Thus,
rom an experimental compendium. (A) Gene regulation in an experimental
et indicates the branch of 80 genes tightly clustered with IL2 (IL2 cluster
mpendium gene group. Arrow designates the position of IL2. The 80 genes
tal Table 2.
M. Mao et al. / Genomics 83 (2004) 989–999 993
the yield of T cell activation genes in all of the kinetic
groups was low and the degree of enrichment was
modest.
Most of the genes in the IL2 cluster branch/T cell
kinetics gene group were not known T cell activation
genes. These genes could have previously undocumented
roles in T cell activation or they could be false positives. To
distinguish between these possibilities, we analyzed regu-
lation of the 125 genes from kinetic Group 1 (Fig. 1A) in a
panel of experiments involving different cell types stimu-
lated under a variety of conditions (hereafter referred to as
the compendium of experiments). This analysis (Fig. 1B)
revealed that the majority of genes sharing expression
kinetics with IL2 in PHA blast cells did not show gene
regulation in another source of activated T cells, activated
Jurkat cells. Furthermore, whereas some of these genes
were regulated relatively specifically in T cells, other genes
were also clearly regulated during stimulation of other cell
types (Fig. 1B). Thus, many if not most genes sharing
expression kinetics with IL2 do not display specificity for T
cell activation.
Identification of T cell activation genes in a compendium of
experiments
Since the OMIM record technique was not optimal for
identifying T cell activation genes, we sought to develop
additional methods for this purpose. We reasoned that
analysis of T-cell-regulated genes in experiments involving
other cell types might help identify genes that are broadly
regulated and improve the enrichment for T cell activa-
tion. We therefore tested whether a compendium of
experiments would be superior to kinetic experiments for
identifying T cell activation genes. We grouped the
regulation of a total of 1652 genes from 42 experiments
(Supplemental Material Table 6) by unsupervised one-
dimensional hierarchical clustering (Fig. 2A). Numerous
groups of coregulated genes were identified, but few
showed specificity for T cell activation. To localize gene
groups containing T cell activation genes, we examined
genes most closely coregulated with IL2. The branch of
the cluster tree containing IL2 included a group of 80
genes up-regulated in activated PHA blasts and Jurkat
cells (Fig. 2B, see Supplemental Table 2 for the complete
gene group, referred to hereafter as the IL2 cluster branch/
compendium gene group). Only a fraction of these 80
genes (those most tightly clustered with IL2, f1/5 of the
total genes in the cluster) were up-regulated in both PHA
blasts and Jurkat cells and less regulated in other cell
types. This indicated that there were still many false
positives in this cluster. The yield of this procedure was
low since only 5 of these genes were identified as T cell
activation genes by OMIM record parsing (Table 1). Thus,
there was a 3.8-fold enrichment for T cell activation genes
in this cluster, slightly higher than was achieved in the
kinetic experiment (Table 1).
ROAST analysis gave better enrichment for T cell activation
genes
We next evaluated ROAST analysis as an alternative
to hierarchical clustering for enrichment of T cell activa-
tion genes. This technique measures similarities in gene
regulation using a correlation coefficient to identify genes
most closely coregulated with a marker gene. We per-
formed ROAST analysis using the same two experiment
sets used previously (T cell kinetics and compendium of
different cell types). For a more direct comparison with
the IL2 cluster branch/compendium approach, we chose a
group size to correspond to the size of the IL2 cluster
(80 genes, Fig. 2A). We identified the top 80 genes most
closely regulated with IL2 in each experiment set (see
Supplemental Table 3 for the IL2 ROAST/T cell kinetics
gene group and Supplemental Table 4 for the IL2
ROAST/compendium gene group). There was overlap in
the four gene groups identified by clustering and by
ROAST analysis of the two experiment sets (Supplemen-
tal Tables 1–4), but each analytic approach produced
unique results.
In both experiment sets, ROAST analysis yielded more
T cell activation genes than hierarchical clustering, and
the degree of enrichment was higher and more significant
(Table 1). While this result is not conclusive because of
previously discussed limitations in the OMIM record
parsing technique, it suggests that ROAST analysis is
superior to clustering. IL2 ROAST/compendium analysis
yielded the most T cell activation genes as judged by
OMIM record parsing: IL2, EMT, TNFRSF8, TNFSF4,
HRB, IL2RA, SCYC1, TNFSF6, THFSF5, CD69, and
SH2D2A. To confirm the results with the OMIM record
parsing, we examined published literature describing
these and other genes from the IL2 ROAST/compendium
gene group. This analysis also suggested that this group
was enriched for genes with important functions during T
cell activation (data not shown). Therefore, both compu-
tational (OMIM) and manual literature searches showed
that ROAST analysis provided the best enrichment for T
cell activation genes and had less potential for false
positives.
Further support for the T cell specificity of the genes
selected by ROAST analysis is provided by visual displays
of the gene regulation in groups generated from the kinetics
and compendium experiment sets (Fig. 3A and B, respec-
tively). Most genes selected by ROAST/compendium anal-
ysis showed up-regulation in both PHA blasts and Jurkat
cells and little or no regulation in other cell types. Thus,
genes selected by ROAST analysis were more specific for T
cells. Experimental data therefore supported the conclusion
reached by literature searching that ROAST analysis gave
higher yield and specificity of T cell activation genes than
other techniques.
Finally, we used a statistical approach (see Materials
and methods) to estimate the significance of specificity of

Fig. 3.
M. Mao et al. / Genomics 83 (2004) 989–999994

Fig. 4. The specificity of different gene groups during T cell activation. Shown are the percentages of genes passing p-value threshold for four gene groups
identified by different analytic approaches (see text). The p value was estimated based on the hypergeometric distribution by counting number of up-regulations
in T-cell-related experiments versus number of regulations in non-T-cell experiments (see Materials and methods).
M. Mao et al. / Genomics 83 (2004) 989–999 995
gene up-regulation during T cell activation as identified by
different methods. A p value for association with T cell
activation was assigned to each gene in groups generated
in the four different method/experiment combinations. The
percentages of genes surviving different p-value thresholds
for four gene groups are shown in Fig. 4. The IL2
ROAST/compendium gene group showed the highest per-
centage of genes passing the threshold activation for all p
values <10�2; therefore, this group contained the most
genes with experimentally determined specificity for T cell
activation. The p values for the 11 genes in this group
annotated in OMIM as T cell activation genes (Table 1)
ranged from 1.8�10�11 to 4.0�10�3 (see Supplemental
Table 4).
ROAST analysis was also more robust than clustering,
in which small and biologically insignificant changes in
experiments analyzed sometimes resulted in dispropor-
tionate effects on the results obtained. In contrast,
ROAST analysis yielded results more consistent with
changes made to the biological content of the experiment
Fig. 3. Enrichment for T cell activation genes by ROAST analysis. (A) Regulation
cell kinetic experiment was subjected to ROAST analysis using IL2 as a query g
kinetics gene group in the experimental compendium (see Supplemental Table 3 f
correlation to IL2 in the ROAST analysis, with descending correlation from left to
compendium. The experimental compendium was subjected to ROAST analysis
compendium gene group) are described in Supplemental Table 4. Shown is a colo
ordered as described in A.
set. An additional advantage of ROAST over hierarchical
clustering is that it is computationally less intensive so
that larger data sets could be examined on a desktop PC.
Identity of ESTs coregulated with IL2
Among the 80 genes in the IL2 ROAST/compendium
gene group, there were 30 ESTs of unknown function
(Supplemental Table 4). The coregulation of these ESTs
with so many T cell activation-associated genes suggests
that some of the protein products of these EST transcripts
may also function during T cell activation. These ESTs may
represent unknown genes or extensions of known genes. To
distinguish these possibilities and to identify unknown
genes, we assigned transcripts for 20 of these ESTs (Sup-
plemental Table 5); 10 of these ESTs remain unidentified.
Transcripts corresponding to these ESTs were identified
by a combination of informatics and experimental
approaches. The EST sequences were first mapped to
known cDNA or genomic sequences by BLAST. Putative
of the IL2/T cell kinetics gene group in an experimental compendium. The T
ene. Shown is a color display of the regulation of the IL2 ROAST/T cell
or the gene group). The order of genes on the x axis represents the rank of
right. (B) Regulation of the IL2/compendium gene group in an experimental
using IL2 as a query gene. The top 80 genes coregulated with IL2 (IL2/
r display of the regulation of these genes in the experimental compendium,
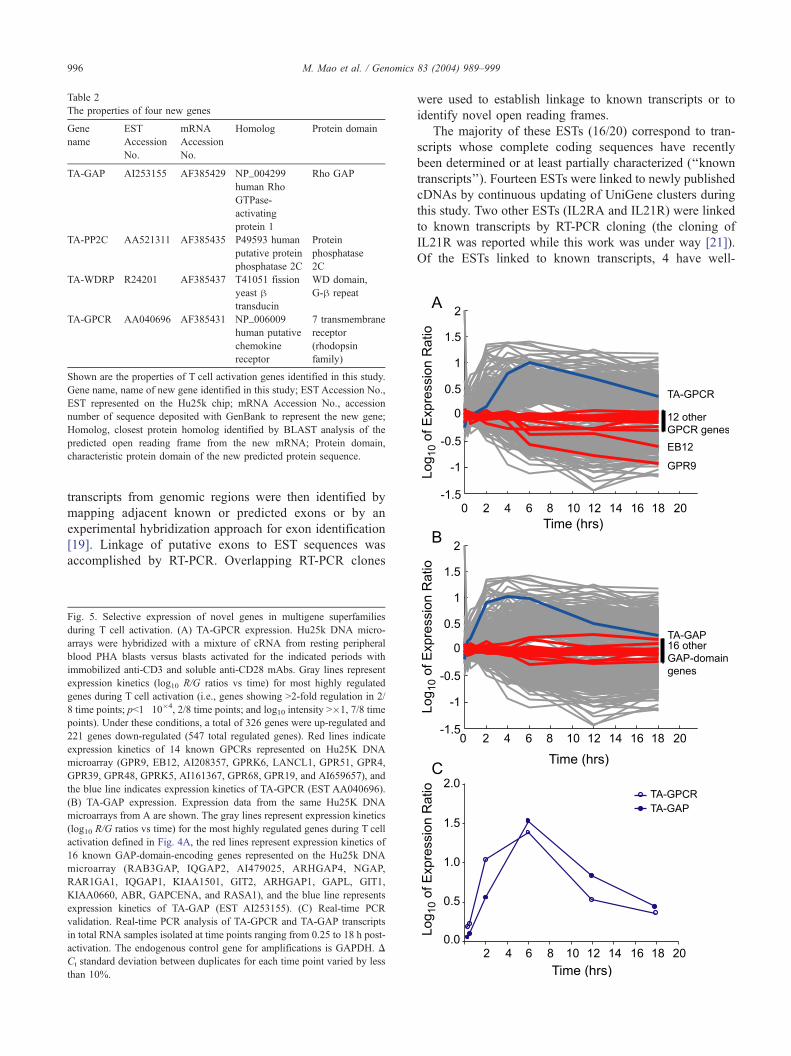
Table 2
The properties of four new genes
Gene
name
EST
Accession
No.
mRNA
Accession
No.
Homolog Protein domain
TA-GAP AI253155 AF385429 NP_004299
human Rho
GTPase-
activating
protein 1
Rho GAP
TA-PP2C AA521311 AF385435 P49593 human
putative protein
phosphatase 2C
Protein
phosphatase
2C
TA-WDRP R24201 AF385437 T41051 fission
yeast htransducin
WD domain,
G-h repeat
TA-GPCR AA040696 AF385431 NP_006009
human putative
chemokine
receptor
7 transmembrane
receptor
(rhodopsin
family)
Shown are the properties of T cell activation genes identified in this study.
Gene name, name of new gene identified in this study; ESTAccession No.,
EST represented on the Hu25k chip; mRNA Accession No., accession
number of sequence deposited with GenBank to represent the new gene;
Homolog, closest protein homolog identified by BLAST analysis of the
predicted open reading frame from the new mRNA; Protein domain,
characteristic protein domain of the new predicted protein sequence.
M. Mao et al. / Genomics 83 (2004) 989–999996
transcripts from genomic regions were then identified by
mapping adjacent known or predicted exons or by an
experimental hybridization approach for exon identification
[19]. Linkage of putative exons to EST sequences was
accomplished by RT-PCR. Overlapping RT-PCR clones
Fig. 5. Selective expression of novel genes in multigene superfamilies
during T cell activation. (A) TA-GPCR expression. Hu25k DNA micro-
arrays were hybridized with a mixture of cRNA from resting peripheral
blood PHA blasts versus blasts activated for the indicated periods with
immobilized anti-CD3 and soluble anti-CD28 mAbs. Gray lines represent
expression kinetics (log10 R/G ratios vs time) for most highly regulated
genes during T cell activation (i.e., genes showing >2-fold regulation in 2/
8 time points; p<1�10�4, 2/8 time points; and log10 intensity >�1, 7/8 time
points). Under these conditions, a total of 326 genes were up-regulated and
221 genes down-regulated (547 total regulated genes). Red lines indicate
expression kinetics of 14 known GPCRs represented on Hu25K DNA
microarray (GPR9, EB12, AI208357, GPRK6, LANCL1, GPR51, GPR4,
GPR39, GPR48, GPRK5, AI161367, GPR68, GPR19, and AI659657), and
the blue line indicates expression kinetics of TA-GPCR (EST AA040696).
(B) TA-GAP expression. Expression data from the same Hu25K DNA
microarrays from A are shown. The gray lines represent expression kinetics
(log10 R/G ratios vs time) for the most highly regulated genes during T cell
activation defined in Fig. 4A, the red lines represent expression kinetics of
16 known GAP-domain-encoding genes represented on the Hu25k DNA
microarray (RAB3GAP, IQGAP2, AI479025, ARHGAP4, NGAP,
RAR1GA1, IQGAP1, KIAA1501, GIT2, ARHGAP1, GAPL, GIT1,
KIAA0660, ABR, GAPCENA, and RASA1), and the blue line represents
expression kinetics of TA-GAP (EST AI253155). (C) Real-time PCR
validation. Real-time PCR analysis of TA-GPCR and TA-GAP transcripts
in total RNA samples isolated at time points ranging from 0.25 to 18 h post-
activation. The endogenous control gene for amplifications is GAPDH. D
Ct standard deviation between duplicates for each time point varied by less
than 10%.
were used to establish linkage to known transcripts or to
identify novel open reading frames.
The majority of these ESTs (16/20) correspond to tran-
scripts whose complete coding sequences have recently
been determined or at least partially characterized (‘‘known
transcripts’’). Fourteen ESTs were linked to newly published
cDNAs by continuous updating of UniGene clusters during
this study. Two other ESTs (IL2RA and IL21R) were linked
to known transcripts by RT-PCR cloning (the cloning of
IL21R was reported while this work was under way [21]).
Of the ESTs linked to known transcripts, 4 have well-
M. Mao et al. / Genomics 83 (2004) 989–999 997
characterized functions during T cell activation (IL2RA,
IL21R, SH2D2A, and TBX21) and one is functional in B
cells (BACH2 [22]).
For four ESTs, full-length cDNA clones that had not
been previously described (‘‘unknown transcripts’’) were
obtained.2 The properties of the predicted protein products
of the unknown transcripts are summarized in Table 2 and
Fig. 1, Supplemental Material. All of the predicted protein
products contained distinctive protein sequence motifs.
Although these motifs characterize proteins with many
diverse functions, three of them are found in proteins
involved in GTP metabolism (Refs. [24, 25 and 26],
respectively, for TA-GAP, TA-GPCR, and TA-WDRP).
GTP hydrolysis is known to play a key role in T cell
receptor signaling [27]. Two of the unknown protein prod-
ucts (TA-GPCR, TA-GAP) belong to large protein super-
families. Many other members of these protein
superfamilies were represented on the Hu25K DNA micro-
arrays used in these experiments. To test the specificities of
these unknown proteins further for T cell activation, we
compared the regulation of TA-GPCR and TA-GAP tran-
scripts with transcripts for other members of their super-
families during PHA blast activation (Fig. 5). TA-GPCR
transcript levels reached a maximum after approximately 6
h of activation. TA-GPCR was more highly regulated than
14 other G-protein-coupled receptor genes represented on
the Hu25k chip (Fig. 5A). TA-GAP transcript levels rose
transiently and reached maximal levels after approximately
4 h of activation. TA-GAP was more highly regulated than
16 other GTPase-activating protein domain genes repre-
sented on the Hu25K chip (Fig. 5B). The regulation of TA-
GPCR and TA-GAP during T cell activation was confirmed
by quantitative PCR analysis (Fig. 5C). These findings
suggest that TA-GPCR and TA-GAP may play important
roles during T cell activation.
Discussion
Historically, many techniques have been used to iden-
tify and clone differentially expressed genes [28]. These
techniques are generally not well suited to discerning the
specificity of gene expression differences, since they
generally rely on comparisons between only a few exper-
imental conditions. The specificity of gene expression
changes detected by these techniques becomes apparent
only after secondary characterization using labor-intensive
techniques [1].
2 These unknown transcripts were named by the acronym TA (for T
cell activation), followed by an acronym designating the most distinctive
type of protein domain of their protein product: TA-GAP, GTPase-
activating protein; TA-PP2C, protein phosphatase 2C; TA-WDRP, WD40
repeat protein; TA-GPCR, G-protein-coupled receptor. During preparation
of this article, a cDNA encoding a protein identical to TA-GPCR was
deposited with GenBank on August 17, 2001, and later described in Ref.
[23]. These authors referred to this sequence as GPR81.
The completion of the human genome sequence has
highlighted the need for functional understanding of many
poorly characterized genes. One approach to this problem is
development of high-throughput methods for inferring gene
function or specificity for cellular processes. In this study,
we have examined one such high-throughput methodology,
DNA microarray hybridization, for identifying genes regu-
lated specifically during T cell activation. Although we
identified hundreds of transcripts that were differentially
regulated during T cell activation, most of these showed
poor specificity for this process because they were also
regulated in other cell types. Thus, as with other techniques,
examination of gene regulation with DNA microarrays
under a limited set of experimental conditions can be
misleading.
By examining genes coregulated with IL2 in a combina-
tion of experiments involving T cell activation and other
conditions, we observed enrichment for genes with specific-
ity for T cell activation. While this approach is similar in
principle to the approach of Hughes et al. [8], the present
study utilized cellular activation and differentiation experi-
ments instead of genetic disruptions to provide experimental
diversity. This is advantageous when using mammalian cells,
in which genetic disruptions are less readily obtained. It will
be important to determine whether recently developed gene
modification technologies [29] might also be used for com-
pendium building. Gene disruption techniques may also be
useful for the functional associations predicted with our
techniques.
The results reported here suggest several possible ave-
nues for improvement in our approach of using coregulation
to assign unknown genes to biological processes. At pres-
ent, the optimal balance between experiments involving a
process of interest and other conditions is poorly under-
stood, as is the optimal total number of experiments.
Furthermore, it is unclear whether the algorithms used for
examining enrichment have been optimized. Our experience
suggested that ROAST is more robust than hierarchical
clustering and yields greater enrichment, but it may be
possible to develop even better algorithms.
In theory, it should be possible to improve our ability to
use coregulation to assign unknown genes to biological
processes by systematically examining gene regulation in
several systems under multiple conditions and quantitatively
determining optimal experimental and computational
approaches. Such approaches have shown promise for the
systematic annotation of unknown ORFs from Saccharo-
myces cerevisiae [30]. In contrast to S. cerevisiae, however,
a much lower percentage of human genes has been anno-
tated sufficiently to allow successful application of these
techniques at present. Advances in human gene annotation
[31] will undoubtedly aid in the improvement of methods
described in this study.
In conclusion, this study shows that genome-scale anal-
yses of gene expression during T cell activation can assign
poorly characterized genes to this process. We expect that

M. Mao et al. / Genomics 83 (2004) 989–999998
broadly diverse and comprehensive experimental conditions
will bring many of the f30,000 human genes into high-
resolution synexpression groups. Analysis of these groups
for unknown genes coregulated with other well-studied
markers should facilitate elucidation of gene function and
provide information on genetic networks.
Materials and methods
Microarray experiments
Sequences for microarrays were selected from UniGene
(a nonredundant set of sequence clusters or genes in
GenBank, http://www.ncbi.nlm.nih.gov/UniGene/). Each
UniGene cluster was represented on a microarray by a
single 60-mer oligonucleotide chosen from the longest
mRNA sequence belonging to the cluster [18]. Hu50k
microarrays represented a total of 49,218 UniGene clusters
present in UniGene Release 111, April 14, 1999. Hu25K
microarrays represented the 23,965 oligonucleotides from
the Hu50K microarrays that hybridized most strongly with
cRNA from PHA blasts (see Supplemental Material).
Microarrays were synthesized and hybridized using meth-
ods described elsewhere [18]. Probe sequences were chosen
near the 3Vends of transcript sequences to minimize detec-
tion biases resulting from the use of reverse transcriptase in
microarray sample preparation (50–350 bases from the 3Vend of the longest mRNA sequence representing each
Unigene cluster). The PCR-IVT technique described in
Ref. [18] was used to prepare samples for hybridization.
All hybridizations were performed in duplicate with fluor
reversal; data presented are the averages of duplicate deter-
minations. The primary microarray data are available at
Gene Expression Omnibus (GEO), http://www.ncbi.nlm.
nih.gov/geo/, Accession No. GLP771.
Quantitative PCR
RNA quantitation was performed by real-time PCR,
using AP Biosystems TaqMan Assays-on-Demand gene
expression products (50249551_C and 50289949_D) for
TA-GPCR and TA-GAP, respectively. mRNA values were
normalized to mRNA for GAPDH (No. 4333764F).
Data analysis
Hierarchical clustering was performed as described [5].
Rosetta Array Search Tool analysis was performed using a
modification of the algorithm used in the Rosetta Resolver
expression data analysis system. This technique takes a
pattern of interest, performs a correlation coefficient-based
similarity search against a library of patterns, and outputs a
ranked list of patterns in the library according to the degree
of similarity with the pattern of interest. The implementation
of ROAST used in these studies calculates the similarity by
the correlation coefficient between the gene expression
profiles. Given a gene response across multiple experiments,
ROAST analysis returns the genes showing the most similar
regulation.
Identification of genes associated with T cell activation via
OMIM annotation
Known gene associations with T cell activation were
assessed from the published literature by automated analysis
of the Online Mendelian Inheritance in Man database (http://
www.ncbi.nlm.nih.gov/entrez/query.fcgi?db=OMIM).
OMIM records were linked to genes represented on the
arrays according to LocusLink (http://www.ncbi.nlm.nih.-
gov/LocusLink/). Genes were scored positive for relevance
to T cell activation if their OMIM records contained the
terms ‘‘T cell’’ and ‘‘activat’’ in the same sentence. More
specifically, positive sentences were required to have these
features, in any order: <word boundary>t<any character>
cell<word boundary>activat. The search covered the text and
reference fields of OMIM records and was case insensitive.
Statistical significance of gene regulation unique to T cell
activation
The significance of gene associationswith Tcell activation
was assessed by statistical analysis of expression data from
experiments involving activated T cells and non-T cells. The
regulationofdifferentgene sets (>2-foldchanges,p<0.01)was
compared in the following twoexperimentgroups: (1)12Tcell
activation experiments involving PHA blasts and Jurkat cells;
(2) 30 myelocyte activation or differentiation experiments
including THP-1, HL60, K562, and NB4 cells. We hypothe-
sized that genes involved in T cell activation would be
preferentially up-regulated in group (1), but not regulated in
group (2). Hence, the number of experiments showing regula-
tionofaparticulargeneof interest ingroup(1)vs (2)wasusedas
a measure of how specific that regulation was for T cell
activation compared with other biological events. The hyper-
geometricdistributionwasusedtocalculate theprobabilitypof
observing n1 up-regulations in group (1) and n2 up- or down-
regulations in group (2). The validity of this approach for
assessing the specificity of gene regulation forTcell activation
was verified by many randomization tests.
Cell culture, PCR, and cloning methods
These are described in the Supplemental Material.
Acknowledgments
We thank Michael Carleton, Jason Johnson, Dan
Shoemaker, and Michele Cleary for helpful comments on
the manuscript and Sergey Stepaniants for array data
submission to GEO.

M. Mao et al. / Genomics 83 (2004) 989–999 999
References
[1] L. Shiue, Identification of candidate genes for drug discovery by
differenential display, Drug Dev. Res. 41 (1997) 142–159.
[2] M. Schena, D. Shalon, R.W. Davis, P.O. Brown, Quantitative moni-
toring of gene expression patterns with a complementary DNA micro-
array, Science 270 (1995) 467–470.
[3] D.J. Lockhart, et al., Expression monitoring by hybridization to
high-density oligonucleotide arrays, Nat. Biotechnol. 14 (1996)
1675–1680.
[4] C. Niehrs, N. Pollet, Synexpression groups in eukaryotes, Nature 402
(1999) 483–487.
[5] M.B. Eisen, P.T. Spellman, P.O. Brown, D. Botstein, Cluster analysis
and display of genome-wide expression patterns, Proc. Natl. Acad.
Sci. USA 95 (1998) 14863–14868.
[6] S.K. Kim, et al., A gene expression map for Caenorhabditis elegans,
Science 293 (2001) 2087–2092.
[7] G. Oshiro, L.M. Wodicka, M.P. Washburn, J.R. Yates 3rd, D.J. Winz-
eler, E.A. Winzeler, Parallel identification of new genes in Saccharo-
myces cerevisiae, Genome Res. 12 (2002) 1210–1220.
[8] T.R. Hughes, et al., Functional discovery via a compendium of ex-
pression profiles, Cell 102 (2000) 109–126.
[9] G.R. Crabtree, Contingent genetic regulatory events in T lymphocyte
activation, Science 243 (1989) 355–361.
[10] J.W. Choi, S.Y. Lee, Y. Choi, Identification of a putative G protein-
coupled receptor induced during activation-induced apoptosis of T
cells, Cell. Immunol. 168 (1996) 78–84.
[11] P.F. Zipfel, S.G. Irving, K. Kelly, U. Siebenlist, Complexity of the
primary genetic response to mitogenic activation of human T cells,
Mol. Cell. Biol. 9 (1989) 1041–1048.
[12] C. Renner, et al., RP1, a new member of the adenomatous polyposis
coli-binding EB1-like gene family, is differentially expressed in acti-
vated T cells, J. Immunol. 159 (1997) 1276–1283.
[13] W. Zheng, R.A. Flavell, The transcription factor GATA-3 is necessary
and sufficient for Th2 cytokine gene expression in CD4 T cells, Cell
89 (1997) 587–596.
[14] M. Ishaq, Y.M. Zhang, V. Natarajan, Activation-induced down-reg-
ulation of retinoid receptor RXRalpha expression in human T lym-
phocytes: role of cell cycle regulation, J. Biol. Chem. 273 (1998)
21210–21216.
[15] S.M. Hedrick, D.I. Cohen, E.A. Nielsen, M.M. Davis, Isolation of
cDNA clones encoding T cell-specific membrane-associated proteins,
Nature 308 (1984) 149–153.
[16] Y. Yanagi, Y. Yoshikai, K. Leggett, S.P. Clark, I. Aleksander, T.W.
Mak, A human T cell-specific cDNA clone encodes a protein having
extensive homology to immunoglobulin chains, Nature 308 (1984)
145–149.
[17] J.F. Brunet, F. Denizot, P. Golstein, A differential molecular biology
search for genes preferentially expressed in functional T lymphocytes:
the CTLA genes, Immunol. Rev. 103 (1988) 21–36.
[18] T.R. Hughes, et al., Expression profiling using microarrays fabricated
by an ink-jet oligonucleotide synthesizer, Nat. Biotechnol. 19 (2001)
342–347.
[19] D.D. Shoemaker, et al., Experimental annotation of the human ge-
nome using microarray technology, Nature 409 (2001) 922–927.
[20] V.R. Iyer, et al., The transcriptional program in the response of human
fibroblasts to serum, Science 283 (1999) 83–87.
[21] J. Parrish-Novak, et al., Interleukin 21 and its receptor are involved in
NK cell expansion and regulation of lymphocyte function, Nature 408
(2000) 57–63.
[22] S. Sasaki, et al., Cloning and expression of human B cell-specific
transcription factor BACH2 mapped to chromosome 6q15, Oncogene
19 (2000) 3739–3749.
[23] D.K. Lee, et al., Discovery and mapping of ten novel G protein-
coupled receptor genes, Gene 275 (2001) 83–91.
[24] M.S. Boguski, F. McCormick, Proteins regulating Ras and its rela-
tives, Nature 366 (1993) 643–654.
[25] G. Muller, Towards 3D structures of G protein-coupled receptors: a
multidisciplinary approach, Curr. Med. Chem. 7 (2000) 861–888.
[26] T.F. Smith, C. Gaitatzes, K. Saxena, E.J. Neer, The WD repeat: a
common architecture for diverse functions, Trends Biochem. Sci. 24
(1999) 181–185.
[27] S.W. Henning, D.A. Cantrell, GTPases in antigen receptor signalling,
Curr. Opin. Immunol. 10 (1998) 322–329.
[28] P. Liang, A.B. Pardee, Differential display of eukaryotic messenger
RNA by means of the polymerase chain reaction, Science 257 (1992)
967–971.
[29] S.M. Elbashir, J. Harborth, W. Lendeckel, A. Yalcin, K. Weber, T.
Tuschl, Duplexes of 21-nucleotide RNAs mediate RNA interference
in cultured mammalian cells, Nature 411 (2001) 494–498.
[30] L.F. Wu, T.R. Hughes, A.P. Davierwala, M.D. Robinson, R. Stough-
ton, S.J. Altschuler, Large-scale prediction of Saccharomyces cerevi-
siae gene function using overlapping transcriptional clusters, Nat.
Genet. 31 (2002) 255–265.
[31] M. Ashburner, et al., Gene ontology: tool for the unification of
biology. The Gene Ontology Consortium, Nat. Genet. 25 (2000)
25–29.
Copyright © 2022 FDOKUMEN