Multiplexed Passive Optical Fiber Sensor Networks for Water ...
Upload
independentCategory
view
0download
0
This article appeared in a journal published by Elsevier. The attachedcopy is furnished to the author for internal non-commercial researchand education use, including for instruction at the authors institution
and sharing with colleagues.
Other uses, including reproduction and distribution, or selling orlicensing copies, or posting to personal, institutional or third party
websites are prohibited.
In most cases authors are permitted to post their version of thearticle (e.g. in Word or Tex form) to their personal website orinstitutional repository. Authors requiring further information
regarding Elsevier’s archiving and manuscript policies areencouraged to visit:
http://www.elsevier.com/copyright

Author's personal copy
Critical Reviews in Oncology/Hematology 74 (2010) 1–15
Semiconductor quantum dots for multiplexed bio-detectionon solid-state microarrays
Gilles Rousserie a, Alyona Sukhanova a, Klervi Even-Desrumeaux b, Fabrice Fleury c,Patrick Chames b, Daniel Baty b, Vladimir Oleinikov d, Michel Pluot a,
Jacques H.M. Cohen a, Igor Nabiev a,e,∗a EA n◦3798 Détection et Approches Thérapeutiques Nanotechnologiques dans les Mécanismes Biologiques de Défense, Université de Reims
Champagne-Ardenne, 51100 Reims, Franceb Laboratoire d’anticorps thérapeutiques et immunociblage, INSERM U624 Stress cellulaire, 13288 Marseille, France
c Unité de Biotechnologie, Biocatalyse et Biorégulation, UMR6204, 44332 Nantes, Franced Shemyakin-Ovchinnikov Institute of Bioorganic Chemistry, Russian Academy of Sciences, 117997 Moscow, Russia
e CIC nanoGUNE Consolider Research Centre, E-20018 Donostia-San Sebastian, Spain
Accepted 17 April 2009
Contents
1. Introduction . . . . . . . . . . . . . . . . . . . . . . . . . . . . . . . . . . . . . . . . . . . . . . . . . . . . . . . . . . . . . . . . . . . . . . . . . . . . . . . . . . . . . . . . . . . . . . . . . . . . . . . . . . . . 22. Multiplexed microarray high-throughput technologies . . . . . . . . . . . . . . . . . . . . . . . . . . . . . . . . . . . . . . . . . . . . . . . . . . . . . . . . . . . . . . . . . . . . . . 2
2.1. DNA microarrays . . . . . . . . . . . . . . . . . . . . . . . . . . . . . . . . . . . . . . . . . . . . . . . . . . . . . . . . . . . . . . . . . . . . . . . . . . . . . . . . . . . . . . . . . . . . . . . . 32.2. Protein microarrays . . . . . . . . . . . . . . . . . . . . . . . . . . . . . . . . . . . . . . . . . . . . . . . . . . . . . . . . . . . . . . . . . . . . . . . . . . . . . . . . . . . . . . . . . . . . . . . 4
2.2.1. Types of protein microarrays . . . . . . . . . . . . . . . . . . . . . . . . . . . . . . . . . . . . . . . . . . . . . . . . . . . . . . . . . . . . . . . . . . . . . . . . . . . . . . 42.2.2. Solid supports and surface chemistry for arraying proteins . . . . . . . . . . . . . . . . . . . . . . . . . . . . . . . . . . . . . . . . . . . . . . . . . . . . 42.2.3. Capture molecules . . . . . . . . . . . . . . . . . . . . . . . . . . . . . . . . . . . . . . . . . . . . . . . . . . . . . . . . . . . . . . . . . . . . . . . . . . . . . . . . . . . . . . . . 52.2.4. Applications of protein microarrays . . . . . . . . . . . . . . . . . . . . . . . . . . . . . . . . . . . . . . . . . . . . . . . . . . . . . . . . . . . . . . . . . . . . . . . . 52.2.5. Nanoarrays . . . . . . . . . . . . . . . . . . . . . . . . . . . . . . . . . . . . . . . . . . . . . . . . . . . . . . . . . . . . . . . . . . . . . . . . . . . . . . . . . . . . . . . . . . . . . . 6
3. Choices of the labelling strategies . . . . . . . . . . . . . . . . . . . . . . . . . . . . . . . . . . . . . . . . . . . . . . . . . . . . . . . . . . . . . . . . . . . . . . . . . . . . . . . . . . . . . . . . 64. Optical and physico-chemical properties of quantum dots: advantages and limits . . . . . . . . . . . . . . . . . . . . . . . . . . . . . . . . . . . . . . . . . . . . . . 75. Use of quantum dots in microarray applications . . . . . . . . . . . . . . . . . . . . . . . . . . . . . . . . . . . . . . . . . . . . . . . . . . . . . . . . . . . . . . . . . . . . . . . . . . . . 9
5.1. Technical requirements for quantum dots applications . . . . . . . . . . . . . . . . . . . . . . . . . . . . . . . . . . . . . . . . . . . . . . . . . . . . . . . . . . . . . . . . 95.2. State-of-the-art of quantum dots application in microarray technologies . . . . . . . . . . . . . . . . . . . . . . . . . . . . . . . . . . . . . . . . . . . . . . . 105.3. Future directions . . . . . . . . . . . . . . . . . . . . . . . . . . . . . . . . . . . . . . . . . . . . . . . . . . . . . . . . . . . . . . . . . . . . . . . . . . . . . . . . . . . . . . . . . . . . . . . . 11
6. Concluding remarks . . . . . . . . . . . . . . . . . . . . . . . . . . . . . . . . . . . . . . . . . . . . . . . . . . . . . . . . . . . . . . . . . . . . . . . . . . . . . . . . . . . . . . . . . . . . . . . . . . . 12Acknowledgements . . . . . . . . . . . . . . . . . . . . . . . . . . . . . . . . . . . . . . . . . . . . . . . . . . . . . . . . . . . . . . . . . . . . . . . . . . . . . . . . . . . . . . . . . . . . . . . . . . . . 12Reviewers . . . . . . . . . . . . . . . . . . . . . . . . . . . . . . . . . . . . . . . . . . . . . . . . . . . . . . . . . . . . . . . . . . . . . . . . . . . . . . . . . . . . . . . . . . . . . . . . . . . . . . . . . . . . 13References . . . . . . . . . . . . . . . . . . . . . . . . . . . . . . . . . . . . . . . . . . . . . . . . . . . . . . . . . . . . . . . . . . . . . . . . . . . . . . . . . . . . . . . . . . . . . . . . . . . . . . . . . . . . 13Biographies . . . . . . . . . . . . . . . . . . . . . . . . . . . . . . . . . . . . . . . . . . . . . . . . . . . . . . . . . . . . . . . . . . . . . . . . . . . . . . . . . . . . . . . . . . . . . . . . . . . . . . . . . . . 15
Abstract
Understanding cellular systems requires identification and analysis of their multiple components and determination of how they act togetherand are regulated. Microarray technology is one of the few tools that is able to solve such problems. It is based on high-throughput recognitionof a target to the probe and has the potential to simultaneously measure the presence of numerous molecules in multiplexed tests, all containedin a small drop of test fluid. Microarrays allow the parallel analysis of genomic or proteomic content in healthy versus disease-affected oraltered tissues or cells. The signal read-out from the microarrays is done with organic dyes which often suffer of photobleaching, low brightness
∗ Corresponding author at: EA n◦3798 Détection et Approches Thérapeutiques Nanotechnologiques dans les Mécanismes Biologiques de Défense,Université de Reims Champagne-Ardenne, 51100 Reims, France. Tel.: +33 326918127; fax: +33 326918127.
E-mail address: [email protected] (I. Nabiev).
1040-8428/$ – see front matter © 2009 Elsevier Ireland Ltd. All rights reserved.doi:10.1016/j.critrevonc.2009.04.006

Author's personal copy
2 G. Rousserie et al. / Critical Reviews in Oncology/Hematology 74 (2010) 1–15
and background fluorescence. Recent data show that the use of fluorescent nanocrystals named “quantum dots” (QDs) allows to push theselimits away. QDs are sufficiently bright to be detected as individual particles, extremely resistant against photobleaching and provide uniquepossibilities for multiplexing, thus supplying the microarray technology with a novel read-out option enabling the sensitivity of detection toreach the single-molecule level.
This paper reviews QDs applications to microarray-based detection and demonstrates how the combination of microarray and QDs technolo-gies may increase sensitivity and highly parallel capacities of multiplexed microarrays. Such a combination should provide the breakthroughresults in drug discovery, cancer diagnosis and establish new therapeutic approaches through the identification of binding target moleculesand better understanding of cell signalling pathways.© 2009 Elsevier Ireland Ltd. All rights reserved.
Keywords: Quantum dots; Fluorescent nanocrystals; Multiplexed analysis; Microarray; DNA; Proteins; Diagnosis
1. Introduction
Applications of DNA or protein microarrays are high-throughput technologies which allow the study on thegenomic or proteomic contents, respectively [1,2]. Althoughthese two approaches provide information concerning com-pletely different molecules, they are very supplementaryin interpretation and both relate to high-content techniqueswhich allow the simultaneous analysis of multiple genes, pro-teins or low-molecular-weight molecules in one shot. Thiscapability enables very rapid comparative analysis of sev-eral physiological states, i.e. healthy, altered or diseased [3].In general, the main principle of all microarray technologiesis based on detection of the specific binding of a target tothe probe. Here, DNA binding in DNA microarray is dueto homology of the single strand nucleic acid sequencesbetween the probe and the target. The detection of such bind-ing event is normally performed by the reading of the signalfrom the label incorporated in the target [4]. For proteinmicroarrays the target is a protein which binds to the probe.The detection of the binding is done here with target-specificantibodies coupled with the label molecule [5].
Usually the label molecules used in DNA and proteinmicroarrays to detect binding events are fluorescent organicdyes or fluorophores. Although fluorophores provide a quitesensitive, safe and cheap detection system, enabling multi-plexed stains essential for the high-throughput capacity ofmicroarrays, they suffer from several limitations. Organicdyes are sensitive to photobleaching and they are often notbright enough to permit quantitative specific signal detectionover the background fluorescence [6]. Moreover, their fluo-rescence spectra are not symmetric and each fluorophore ischaracterized by its specific optimal wavelength of excita-tion, which limits their multiplexing capabilities. All thesedisadvantages can be avoided by the use of a novel class offluorophores, highly fluorescent semiconductor nanocrystals(NCs) quantum dots (QDs). QDs are ultra-resistant to photo-bleaching, extremely bright and their fluorescence colour canbe tuned by slight variation of their diameter on the nanoscale[6]. Furthermore, QDs of different diameters (colours) canbe excited with the same excitation wavelength and demon-strate ideally symmetrical fluorescent spectra, thus providingunique possibilities for multiplexing without overlapping ofsignals from different labels [7].
The integration of QDs in microarray technologies shouldcertainly increase sensitivity and specificity of analysis,reduce sample quantity and even presumes the possibilityof single-molecule detection. This last point is a critical onewhen studies of rare events are presumed or when low quan-titative differences between the analysed probes which needto be detected [8]. Finally, the high brightness and photo-stability of QDs may solve one of the crucial problems ofmicroarray technologies, i.e. quantitative detection of lowspecific fluorophore signal over background fluorescence.
We will start this review from the short description ofthe general principles of DNA and protein microarray tech-nologies, followed by an overview of the existing labellingprocedures and labels in use in existing microarray read-outsystems. We will further analyse the advantages and lim-its of the optical and physico-chemical properties of QDswhen compared with organic dyes, as well as the technicalrequirements which would enable realisation of QDs advan-tages in the microarray read-out systems. And finally, themost promising applications of QDs as labels in multiplexedmicroarrays and the overview of published QDs applicationsto microarray technologies will be discussed. This review isfocused on the solid-phase microarray technologies. Readersinterested in the QDs applications to the liquid-phase arraysbased on optically encoded microbeads are addressed to therecently published reviews [9–11].
2. Multiplexed microarray high-throughputtechnologies
Understanding complex cellular systems requires first theidentification and analysis of its components and then todetermine how they interact together and are regulated. Tra-ditionally, scientists study one gene or one molecule at once.In contrast to this traditional approach, some high-throughputmethods have been developed in the last decade to optimizethe study of large number of molecules: DNA and proteinmicroarrays. The development of microarray technologieshas been phenomenal in the past few years. It has becomea standard tool in many research laboratories. The reasonfor this popularity is that microarrays have revolutionizedthe approach to biological research thanks to their multi-plexed staining capacities. For example, instead of working

Author's personal copy
G. Rousserie et al. / Critical Reviews in Oncology/Hematology 74 (2010) 1–15 3
on a gene-by-gene basis, scientists can now study tens ofthousands of genes at once with DNA microarrays.
Applications of microarrays in detection and diagnos-tics are quantitative, and have minimal reagent and sampleconsumption due to miniaturization. They can be done onsolid-state chips as support. The parallel processing powerof microarrays depends essentially on the number of dif-ferent probes spotted on the array. More probes per arraymeans more information. However, between DNA and pro-tein microarray, the number of probes differs significantly.Indeed, as examples, Affimetrix has developed a DNAmicroarray support for 400,000 oligonucleotide probes ona 1.6 cm2 glass surface [12], ready for hybridization andnucleic acid content analysis, and more recently, someDNA microarrays were made with 2.1 million micro-scaleprobes DNA microarray (NimbleGen, Roche). For proteinmicroarrays, the number of immobilized proteins, peptidesor antigens on the chips is not so large. As an example, theMagyArray® microarray possesses 624 immobilized anti-bodies (208 different antibodies in triplicate). Despite thisdifference, these two kinds of microarrays are useful andprovide different but complementary informations. DNAmicroarrays are a powerful approach for the analysis of globaltranscriptional response. They are a suitable approach tostudy changes in gene expression and regulation [13,14], andresponses to changing environment conditions [15]. Effectsof diseases [16], drug treatment [17], virulence and evolutionof pathogens [18] or chemotherapy medications [4] can bedetected by these tools allowing insights into the dynamicsof the genome. Protein microarrays provide post-translationalinformation and protein activity levels through phosphoryla-tion states. Functional protein microarrays are used in thefield of drug target identification/validation [19], studies ofprotein interactions [20,21] and signalling pathways [22,23],biochemical activity and immune responses [24,25]. Proteinmicroarrays also promise diagnosis capacities [5,26–28].
The evolution of gene regulation during environmentalchanges can be studied by both DNA and protein microar-rays. The two approaches are more or less complementary andcan lead to a full understanding of regulation steps and events.DNA microarrays provide direct information on the gene reg-ulation by methylation level but also on the transcription reg-ulation level (positive or negative) through the transcriptionfactor, DNA cluttering, miRNA (micro RNA) or other tran-scription regulation events. Protein microarrays allow study-ing both the level of protein expression and protein activitythrough their post-translational modifications (phosphory-lation, lipidation, glycosylation). This leads to the estab-lishment and best understanding of diseases deregulationsignalling pathways and thus facilitates the creation of newtherapy approaches based on different effectors and targets.
2.1. DNA microarrays
The DNA microarray technology is the parallel hybridiza-tion of a mixture of labelled nucleic acids usually called
targets, with thousands of individual nucleic acid speciescalled probes (or features), that can be identified by theirspatial position in a single experiment. Whereas the probesare immobilized on the chips, the targets are labelled andthen incubated in solution onto the chips for hybridization[29] (Fig. 1A). Historically, the targets were radioactivelylabelled [30], thereby allowing only one-channel experiment(usually called one-colour experiment now). One-channelexperiments suffer from experimental variations betweeneach single DNA microarray. This problem was solved byusing fluorescent labels. Indeed, they allow two-channelexperiments (or two-colour experiments) in which twomRNA populations are labelled with different fluores-cent dyes and are simultaneously assayed on the samechip.
DNA microarrays can be made using cDNA (comple-mentary DNA) [31,32], miRNA [33] or genomic DNA [34].An amplification step can be performed to minimize sampleconsumption. During this step, fluorescent nucleotides canbe randomly incorporated into the resulting amplified targetprobe. This procedure is called body-labelling. Alternatively,the end-labelling allows the addition of a fluorescent labelonly at the end of the target probe. Of the two strategies,the body-labelling method is more commonly used becauseit provides a much higher fluorescence signal for the sametarget sample.
For body-labelling, there are two main strategies for labelincorporation in cDNA by reverse transcription of RNA.The direct labelling incorporates label-modified nucleotidetriphosphates like dUTP or dCTP. The nucleotide triphos-phate selected to support the label is provided at alower concentration to counterbalance the amount of label-modified nucleotide triphosphates. This allows the insertionof dye into the resulting cDNA. If a two-colour experimentis performed, the labelling step of cDNA of the two differentconditions with the dyes is done separately. Then the freelabel-modified nucleotide triphosphates are removed and theassay can be done. This method has a critical limit: the num-ber of dyes incorporated is different between dye/probe dueto the difference in size of each label molecules. In practice,the smaller label is preferentially incorporated by the reversepolymerase. This experimental bias must be corrected by anormalization step to obtain relevant biological data. How-ever, this normalization step needs some calibration studiesfor each new label used for two-colour DNA microarrayexperiments.
The indirect labelling is a good alternative method to avoidthe effects of size on the incorporation rate. In this method,the nucleotide triphosphate incorporated is modified by tar-get molecules such as biotin, aminoallyl or digoxigenin. Inthis case, the two preparations are labelled separately butusing the same molecule thereby avoiding size biases. Fur-thermore, these molecules are often smaller than labels thusthe incorporation rate of this modified nucleotide triphos-phate is higher. Then, the fluorescent labels coupled tothe correspondent ligand molecule are separately assessed

Author's personal copy
4 G. Rousserie et al. / Critical Reviews in Oncology/Hematology 74 (2010) 1–15
on the probes for a fluorescent labelling of nucleotidetriphosphates.
Genomic DNA is usually labelled by direct incorpora-tion of fluorescent labelled nucleotides by nick translationor by random priming with the Klenow fragment of DNApolymerase. Genomic DNA is used for comparative genomicstudies as a reference target in normalization or for slidequality control.
2.2. Protein microarrays
2.2.1. Types of protein microarraysTwo types of protein microarray analyses are currently
available: analytical and functional microarrays. Analyticalmicroarrays, also called quantitative microarrays are used toprofile a complex mixture of proteins in order to measure theprotein expression level of a specific protein in the mixture.Typically antibodies are coated onto the chip followed byincubation with the protein sample. The captured moleculesare then detected using labelled antibodies specific of thesame protein. This type of assay is particularly suitable tocompare molecular profiles (e.g. protein content and pro-tein phosphorylation state) between healthy and diseased orstressed cells and tissues [35]. For sensitive detection of pro-tein alterations, the so-called reverse phase microarray canbe performed. In this type of analytical microarray, a lysateprotein sample is arrayed on the solid-state chip and thereforeantibodies are used to label the protein of interest on the chip[36].
Functional microarrays differ from analytical microarraysin that they are composed of full-length functional proteinsor protein domains. These microarrays are used to study thebiochemical activities of an entire proteome in a single exper-iment and protein interactions with proteins, DNA, RNA,small molecules or phospholipids [37,38].
For protein microarray assays, the target can be labelledaccording to one of these two approaches: the direct labellingof the target or the use of a specific antibody. The secondapproach is most often chosen because it does not require amodification of the target (Fig. 1B) which makes possible todetect proteins directly from patient samples. Another possi-bility is to indirectly label the sample with a small moleculesuch as biotin, thus enabling the later recognition of thisprotein through streptavidin.
2.2.2. Solid supports and surface chemistry for arrayingproteins
One of the key steps of the development of proteinarrays is the choice of a solid support considering three keyrequirements: an optimal binding condition with a uniformcoating, high-throughput manufacturing and non-denaturingenvironment [39]. This choice is the first step in the devel-opment of protein arrays [40,41]. A number of differentslide surfaces can be used for protein chips. These sup-ports must satisfy such strict requirements as immobilizingthe protein on the chip, maintaining the conformation and
the functionality of this protein, achieving maximum bind-ing capacity, providing good quality spots, low background,simplicity of manipulation and compatibility with detectionsystems.
The direct and random immobilization of proteins on solidphase limits their number, often causes their denaturation anddecreases of interaction specificity. It is also important to con-sider that either a random or a uniform orientation of proteinsis desired. The oriented immobilization of target proteinsenables a considerably greater quantity, and more functionalcapture proteins deposited [42].
Glass slides are currently the most common support forbiochips because of their easy handling, low cost, low vari-ability, low fluorescent background and greater durability.Glass is an inert and mechanically stable support, whichrequires a chemical coating to make it functional. The chem-istry used to immobilize target proteins on glass slides isbased on either non-covalent binding of proteins or covalentbonding between amino acids or carbohydrates attached tothe proteins and functional groups of chemical agents previ-ously fixed on the slide. This modified glass surfaces can bealdehyde, epoxy, poly-l-lysine, silane or nickel coated slides[43].
Another technique that can increase the efficiency of pro-tein immobilization consists in covering the glass slide witha layer of a polymer, such as polyacrylamide [44], agaroseor gelatine which provides a porous structure. A film of gel,which is 70–95% water, ensures that the three-dimensionalstructure of the immobilized proteins is maintained andtheir accessibility is favoured without them having to beoriented. Moreover, the low background of fluorescenceof this type of support leads to a greater sensitivity ofdetection.
The nitrocellulose membrane is also proved to be an appro-priate support for the immobilization of different proteinsand to be easy to manipulate [45]. Attachment of nitrocel-lulose membranes to glass slides combines the advantagesof microarrays with the protein binding capacity and thelong-term stability of printed proteins. Although hydropho-bic interactions are generally considered to be responsiblefor the immobilization of proteins, the actual forces involvedin their binding are not yet known. Due to its microporoussurface, the nitrocellulose is able to retain a greater numberof capture proteins than the planar surfaces such as a glassslide. Moreover, its porosity contains, under appropriate con-ditions, aqueous microspaces that allow proteins to maintaintheir active configuration [46]. In addition, the nitrocellulosemembranes FAST-type slides, for example, have a highersignal-to-noise ratio which notably improves the detectionby fluorescence.
Proteins are usually purified before being deposited. How-ever, porous supports, like nitrocellulose or hydrogel, areequally compatible with crude cell extracts containing non-purified over expressed proteins [42].
An alternative method is the use of plastic slidesor microplates. Maxisorp (Nunc) slides are primar-

Author's personal copy
G. Rousserie et al. / Critical Reviews in Oncology/Hematology 74 (2010) 1–15 5
ily intended for the immobilization of biomoleculesby electrostatic forces and ionic bonds. A chemicallymodified surface of conventional microplate wells canalso be used to fabricate protein microarrays [37]. Thebenefit of microwells is the ability to perform experi-ments in an aqueous environment while preventing crosscontamination.
2.2.3. Capture moleculesAvailability of a large number of specific capture
molecules showing a high affinity to their targets is a pre-requisite for the identification and quantification of proteinsusing an array-based approaches. Microarrays are generatedby immobilizing specific capture molecules on a slide, allow-ing the analysis of complex samples. Capture molecules canbe proteins to analyse specific protein–protein interactions.Affinity tag surfaces can be used for the uniform orien-tation of proteins on the chip surface. One popular slidechoice is the nickel coated slide for use with HisX6 taggedproteins [47]. It is also possible to immobilize probes viaC-terminal affinity tags such as C-myc upon pre-arrayedmonoclonal anti-tag antibodies [42]. Finally a very popu-lar method consists in capturing biotinylated proteins onstreptavidin-coated slides. Synthetic oligonucleotides or pep-tides, named aptamers, selected from random combinatorialsynthetic libraries for high affinity and selectivity for theirtarget molecules, are also useful molecules for the design ofcapture microarrays [48]. Enzymatic processing of immobi-lized substrates on microarray can also be monitored in amicroarray format [49]. Immobilization of receptor ligands(oligosaccharides, hormones . . .) can be used for receptorbinding studies.
However, and so far, the most popular capture moleculesfor arrays are still antibodies. Although monoclonal anti-bodies have become key research tool in a various fieldsof biology, they have some disadvantages in terms of gen-eration, cost, and overall applications. To bypass theseproblems, antibody fragments are now used as capturemolecules. The development of Fab (Fragment antigen bind-ing), scFv (single chain variable Fragment) [50], affibodies[51] and VHHs (variable domain of heavy chain antibody)[52] for antibody arrays leads to easier fabrication pro-cesses. VHHs have many advantages for biotechnologicalapplications such as their high microbial production andtheir ability to recognize antigenic sites that are normallynot recognized by conventional antibodies such as enzymeactive sites. Furthermore, contrary to conventional antibod-ies or others antibody fragments, VHHs have been shownto remain functional after incubation at high temperatures[53]. This high stability is mainly attributed to their efficientrefolding after chemical or thermal denaturation [54]. Con-sidering stability, selectivity and high affinity to ligand aswell as conserved structure and conferring similar physicaland chemical properties, antibody arrays remain the methodof choice and VHH arrays might lead to a high potentialalternative.
2.2.4. Applications of protein microarraysMiniaturized and paralleled immunoassays are gener-
ally interesting for all diagnostic applications, where severalparameters in an individual sample have to be determinedsimultaneously from a limited amount of material. In diag-nostics, protein and antibody microarrays are applied forthe detection of antigens and antibodies in blood samplesas well as in the profiling of sera to discover new diseasemarkers. The development of fully validated biomarkers intoa clinical diagnostic test involves two steps: the first phaseinvolves multiplexed immunoassays development for vali-dated biomarkers and the next stage is in vitro diagnosticdevelopment [50]. In the area of cancer research, a recom-binant scFv antibody microarray has been used to classifyfemale, post menopausal, age-matched metastatic breast can-cer patients versus healthy controls based on differentialserum protein profiling [55]. This array of 129 scFv allowedprofiling at picomolar range analytes while consuming onlymicroliters of clinical samples. Other protein microarrays,generated for the diagnostic of autoimmune diseases such aslupus erythematosus [55] and allergy tests have already beenmade and proved the potential of this technique. Microar-rays have enormous potential to become robust and reliablediagnostic assays.
Although first experiments were made to apply proteinand antibody arrays in the field of diagnostics, the majorapplication area is still basic proteome research. The focusof basic proteome research is to target identification and dis-covery, functional analysis of proteins and cellular expressionprofiling. Protein phosphorylation is an especially importantregulator of many processes inside cells. For instance, con-stitutive Notch activation is required for the proliferation ofa subgroup of T-cell acute lymphoblastic leukemia. Down-stream pathways that transmit pro-oncogenic signals are notwell characterized. To explore these issues, a reverse phaseprotein microarray has been used to profile the phosphoryla-tion state of 108 distinct epitopes on 82 signalling proteins ina panel of 13 human T-cell leukemia lines [23]. The authorsfound that gamma-secretase inhibitor treatment suppressedthe phosphorylation of multiple signalling proteins in themTOR pathway in a Notch-specific manner, indicating thatthe mTOR pathway receives activating signals from Notch.This discovery might lead to a novel therapeutic approach forNotch-dependent cancers.
Another important aspect is the studies of membrane pro-teins. A membrane protein array has been developed for theanalysis of the ligand binding properties of receptors [56].These microarrays consisted of immobilized G protein cou-pled receptors that were capable of demonstrating the specificbinding of their respective targets. Membrane microarraysallow multiplexed screening models of the cell surface andshould also enable highly parallel studies of fundamentalprocesses such as multivalent interactions and cell–cell com-munication. Most biological processes are driven at somelevel by enzymes, and the states of those processes are deter-mined by the activity level of the enzymes. An antibody

Author's personal copy
6 G. Rousserie et al. / Critical Reviews in Oncology/Hematology 74 (2010) 1–15
microarray method was developed to permit isolation, detec-tion and identification of the functional state of probe-labelledenzymes in a complex proteome in a single step [57]. Thistechnology will facilitate the characterization of new mark-ers and targets for the diagnosis and treatment of humandiseases.
The wide variety of different applications in which proteinand antibody microarrays are employed reflects the versatil-ity of the technology. Although several limitations currentlyhinder their use, it can be expected that advances such as pro-tein production on the chip will facilitate the generation ofprotein arrays. Recently, high-density self-assembling pro-tein microarrays have been developed based on the nucleicacid programmable protein array (NAPPA) concept. Thisapproach allows the display of thousands of proteins thatare freshly produced and captured in situ from immobilizedcDNA templates using cell-free lysates [58]. The authorsarrayed up to 1000 unique human cDNAs and obtained highyields of protein expression and capture. This next generationNAPPA method allows making fresh proteins in situ to pro-duce high-content protein microarray. This will promote theapplication of protein arrays for qualitative measurements,such as interaction or modification screening.
Protein and antibody microarrays still require modifica-tions and optimization to overcome several limitations suchas sensitivity and cross reactivity. Until then, the benefits ofmicroarrays such as low analyte consumption should helpto facilitate the analysis of complex samples in small-scaleapplications.
2.2.5. NanoarraysUsing the previously described approaches, microarrays,
often of less than 1 cm2, have been fabricated with about1000 proteins, at a density <2000 probes/cm2. In some cases,arrays composed of about 10 000 proteins have been man-ufactured. Low to medium density antibody microarrays(<1000 probes) and low- to high-density protein arrays(<10 000 protein) have already been used for a variety ofapplications. However, a complex proteome is composed of>100 000 proteins, requiring the use of high-density array(>10 000 probes/array) [59]. For this purpose, nanotechnolo-gies must be implemented to generate miniaturized array ata high density. Different nanopattern techniques are avail-able to create nanoarrays, such as microfluidics technology[60], dip-pen nanolithography [61] and microcontact print-ing. The choice of design will be dependent on several factors,such as nanopatterning techniques, properties of the substrateand the probes, as well as compatibility with the detectionmethod. Detection methods for nanoarrays are either basedon fluorescent label-dependent or label-free detection. Sev-eral types of labelling reagent are available and recentlynon-organic fluorophores such as metallic (Au), magneticor silica nanoparticles [62] and QDs (see below) have beendeveloped to provide multiple possibilities for highly sen-sitive detection under different conditions. For label-freedetection methods, different methodologies have been devel-
oped such as atomic force microscopy, microcantilever [63],surface plasmon resonance [64], and nanowires, as biologi-cally gated transistors, transducing molecular binding eventsinto real-time electrical signals [65]. An example of micro-cantilever is a study of Backmann et al. [66] where theyreported a microcantilever-based immunosensor operated instatic deflection mode with a performance comparable withsurface plasmon resonance technique, using scFv antibodyfragments as receptor molecules. It has been demonstratedthat molecular adsorption also results in measurable mechan-ical forces [66]. In this study, the differential deflectionsignal revealed specific antigen binding and was propor-tional to the antigen concentration in solution. Using smalland oriented scFv fragments as receptor molecules theyincreased the sensitivity of microcantilever to 1 nM. Detect-ing biomolecular interactions by measuring nanomechanicalforces offers an exciting opportunity for the developmentof highly sensitive, miniature and label-free biologicalsensors.
3. Choices of the labelling strategies
Although the detection on the microarrays can be per-formed without any label, traditionally the detection of targetsis done with the use of several labels. The most commonlyused approaches employ radioactive labels, immunoperox-ydase reaction and fluorescent labels including lanthanidechelates and organic dyes.
Contrary to fluorescent organic dyes, immunoperoxy-dase labelling does not suffer of tissue autofluorescenceand the peroxydase is durable and does not quench. Thusthe stain is durable and can be reviewed at a later time.However immunoperoxydase labelling presents some dis-advantages in that realistically only one staining can bedone on one sample. Additionally, multistep enzyme-basedimmunoperoxydase stain is inherently not stochiometric andis dependent on experimental conditions such as pH, tem-perature, concentration, which makes it not suitable forquantitative analysis. Because the number of patient sam-ples are usually limited (generally four needle biopsies forpatient) immunoperoxydase staining may not be efficientlyused for microarrays-based quantitative detections anddiagnosis.
Lanthanide chelates is an important and special group ofluminescent molecules. These labels contain an organic dyes(commonly used compounds are EDTA, beta-diketonates,DTPA, etc.), which serves as a sensitizers to absorb theexcitation light and to transfer this energy to the lanthanideions which are usually trivalent cations [67,68]. Conse-quently, lanthanide chelates exhibit broad excitation spectraand narrow emission spectra. The lanthanide chelates maybe coupled to a wide variety of compounds to create specificlabels, probes, diagnostic and/or therapeutic reagents. How-ever, despite the excellent spectral properties of lanthanidechelates, their photochemical stability is limited.

Author's personal copy
G. Rousserie et al. / Critical Reviews in Oncology/Hematology 74 (2010) 1–15 7
Fluorescence labelling is sensitive, safe, quantitative,allows multicolour staining but suffers from photobleach-ing of organic dyes and from the contribution of backgroundautofluorescence generated by immobilized proteins and sup-port. Although fluorescence is a sensitive detection technique,traditional organic dyes exhibit many limitations, especiallywhen the multiplexed detections need to be performed. Theselimitations can be reconsidered with the use of inorganicfluorescent nanoparticles named quantum dots [7].
4. Optical and physico-chemical properties ofquantum dots: advantages and limits
Quantum dots are semiconductor nanocrystals generallycomposed of elements from groups II–IV or III–V of thechemical periodic table, such as CdSe, CdTe and InAs. So-called core/shell QDs are usually composed by a fluorescentsemiconductor core (CdSe, for example) coated with a shellof another semiconductor with a larger bandgap (CdS or ZnS)[69,70]. The presence of the shell is almost essential todaybecause its introduction increases significantly the chemical
and fluorescent stabilities of QDs. The most widespread usedQDs are composed of CdSe core covered with a ZnS shell[71]. This composition has proved to be the best choice interms of QDs brightness and photo- and mechanical stabilityso far. The absorption and emission spectra of QDs dependon their chemical composition and it is actually possible toprepare QDs with the wavelengths of the fluorescence emis-sion covering all visible and nearly-infra-red (NIR) regionsof optical spectrum. Moreover, the size and shape of QDs canbe controlled precisely by the time, temperature and ligandmolecules used during their synthesis. Importantly, QDs ofthe same chemical composition absorb light in the UV andvisible region of the optical spectrum but emit the fluores-cence in the very narrow and ideally symmetric fluorescenceemission bands of the wavelengths determined by their diam-eter. This possibility to excite QDs of different diameters(fluorescent colours) with a light of the same wavelengthopens unique possibilities for multiplexing. Additionally, thesurface chemistry of as-synthesized QDs permits the appli-cation of different approaches to QDs functionalisation andtagging with capture and other biomolecules thus allowingvarious biomedical applications (Fig. 1) [72–74].
Fig. 1. DNA and protein microarrays. (A) Scheme of a multiplexed DNA microarray. Target nucleotides were coated on the slide and biotinylated sampleprobe nucleotides are tagged with QDs separately before being assessed on microarray. (B) Scheme of reversed phase microarray employing QDs. (C) Schemeof a multiplexed protein microarray. Here antibodies were coated on the slide then proteins are revealed with the use of different QDs coated with the sameantibodies. (D) Schematic representation of some ligands which can be conjugated with the QDs. (E) Multiplexed QD profiling of four tumour biomarkersusing two FFPE prostate cancer cell lines with distinct bone-metastasis behaviours. The four markers, all associated with EMT, are N-cadherin, EF (elongationfactor)-1alpha, E-cadherin and vimentin, and their corresponding QD colours are 565, 605, 655 and 705 nm. The cell nuclei were counterstained blue by DAPI,and the QD data were captured under blue excitation. High-left panel: colour fluorescence image of highly metastatic prostate cancer cells (clone ARCaPm);high-right panel: single-cell QD data obtained from the image presented on the high-right panel; low-left panel: colour fluorescence image of benign prostatecancer cells (clone ARCaPe); low-right panel: single-cell QD data obtained from the image presented on the low-right panel. The relative abundance of thesemarkers is consistent with western blotting data (not shown). Note that individual cancer cells have heterogeneous expression patterns; the single-cell data inb and d are representative of a heterogeneous cell population. The images are raw data from a colour CCD camera. Adapted with permission from MacmillanPublishers Ltd.: Nature Protocols, Xing Y, Chaudry Q, Shen C, Kong KY, Zhau HE, Chung LW, Petros JA, O’Regan RM, Yezhelyev MV, Simons JW, WangMD, Nie S. Bioconjugated quantum dots for multiplexed and quantitative immunohistochemistry 2007;2(5):1152–65 © 2007.

Author's personal copy
8 G. Rousserie et al. / Critical Reviews in Oncology/Hematology 74 (2010) 1–15
Table 1Comparative efficiency of the mostly often used labels.
Technologies Detectionsensitivity
Multiplexingcapability
Quantificationcapability
Organic fluorophores + +++ +++Quantum dots +++++ ++++ +++++Immunoenzymes assays +++++ +a +
Number of signs “+” reflects relative degree of efficiency of the label.a Only single parameter may be measured.
The organic dyes currently in use for biomoleculelabelling suffer from several limitations. We will discusssome of them now and the relative advantages for use QDs toovercome these limitations (Table 1). One of the key param-eters for detection sensitivity – the brightness of the label– is determined by the product of the label’s quantum yieldby the extinction coefficient. Due to the fact that the QDshave similar quantum yields (around 70%) but much big-ger extinction coefficients compared with the organic dyes(Table 2), their brightness is shown to be 20–100 times higher.This makes possible to achieve the QDs detection limit downto single-QD level and to ensure their ultrasensitive detec-tion over the autofluorescence of cells, tissues or microarraysupports. This high brightness also enables to decrease thequantity of fluorescent labels at a minimal quantity in orderto limit the non-specific binding which occurs upon the use ofhighly concentrated QD conjugates applied for revelation onmicroarrays [75]. Moreover, it is worth to mention that QDsare 50–1000 times more stable against photobleaching thanthe best organic dyes [76]. This property enables to burn theautofluorescence by just illumination of the microarrays withthe light of high intensity before the acquisition. The high sta-bility of quantum dots also allows a retrospective reviewingof the experiments.
The organic dyes are not realistically suitable for multi-plexed staining with more than four different labels. Indeed,the fact that they present a narrow absorption spectrum and a
Table 2Comparison of key optical properties of quantum dots and organic dyes.
Quantum dots Organic fluorophores
Excitation Quasi-continuumsuperposition ofabsorption bands fromUV to visible regionof optical spectrum.UV light excites theQDs of all sizes(emission colours)
Narrow excitationspectra are locatedvery close to thefluorescence emissionwavelengths (smallStokes shift)
Emission band width 20–40 nm 50–100 nmFluorescence lifetime 10–40 ns Few nanosecondsPhotostability 50–10,000 times more
photostable than thatfor organic dyes
Depends on the typeof fluorophores.
Molar extinctioncoefficients
∼105–107 M−1 cm−1 100–1000 times lessthan that forCdSe/ZnS QDs
broad red-tailed emission spectrum makes difficult to avoidoverlapping of absorption/emission spectra between the dif-ferent fluorescent dyes. Moreover, when different organicdyes are used, practically the same number of excitationwavelengths should be applied thus making experimentalset-ups complex and expensive. For these reasons, organicfluorochromes are until now not too suitable for high-throughput multiplexed microarrays. In a marked contrast,QDs have a broadband absorption spectrum and narrow sym-metric emission spectrum (the emission peak width of QDsin solution is typically about 20–25 nm at room temperature[77]) and QD of any size can be excited with the excita-tion light of the same wavelength from UV to blue-violetregion of the optical spectrum [75] (Fig. 1D). These charac-teristics make them particularly interesting for multiplexedanalysis because they allow the excitation of all quantum dotpopulations with the same exciting light using such sourcesas diodes, lasers or lamps, and to collect non overlappingspecific emission peaks just with different filters. Moreover,although most of autofluorescence from cells and tissuesis excitable by UV light, the large Stokes shifts (the shiftbetween excitation and emission wavelengths) of QDs pro-vide a mean to easily separate the QDs fluorescence from thebackground autofluorescence even in the case of the use ofUV light for sample fluorescence excitation. Fig. 2 providesan example of multiplexed recognition of four prostate can-cer biomarkers using QDs as labels and Table 1 summarizesrelative comparison of properties of QDs, classical organicdyes and immunoenzyme assays. Some of optical character-istics of quantum dots and organic dyes are also compared inTable 2.
Although all these promise of multiplexing, labelling withQDs still needs several improvements. The QD anatomy isnot perfect yet. The size and stability of QDs strongly dependon the core/shell components chosen and on their function-alisation strategy. The “perfect” QD must be fully stable inaqueous solutions at a wide range of pH and ionic strengthsbut it must also be as tiny as possible. Today, one may coverQDs by an additional organic shell to increase significantlytheir stability but such stabilization procedure increases theirsize up to 20 nm or even more. Future work should find thecompromise between the QDs stability and size in order todevelop the smallest nanoparticles which will be sufficientlystable in crude biological fluids and tissues. Additionally, theQDs fluorescence randomly blinks, this point may be partic-ularly important for single-molecule detection and accuratefluorescence intensity quantification. Surface defects in theQD crystal structure act as the temporary “traps” for the elec-tron or hole, preventing their radiative recombination (whichleads to the QD fluorescence emission). The alternation oftrapping and entrapping events results in QD blinking beingvisible at the single-molecule level [78,79]. This blinking canbe greatly decreased in ambient and biologically relevant con-ditions by QDs surface passivation, thus making them ideallabels detectable on the single-molecule level for a variety ofapplications [80].

Author's personal copy
G. Rousserie et al. / Critical Reviews in Oncology/Hematology 74 (2010) 1–15 9
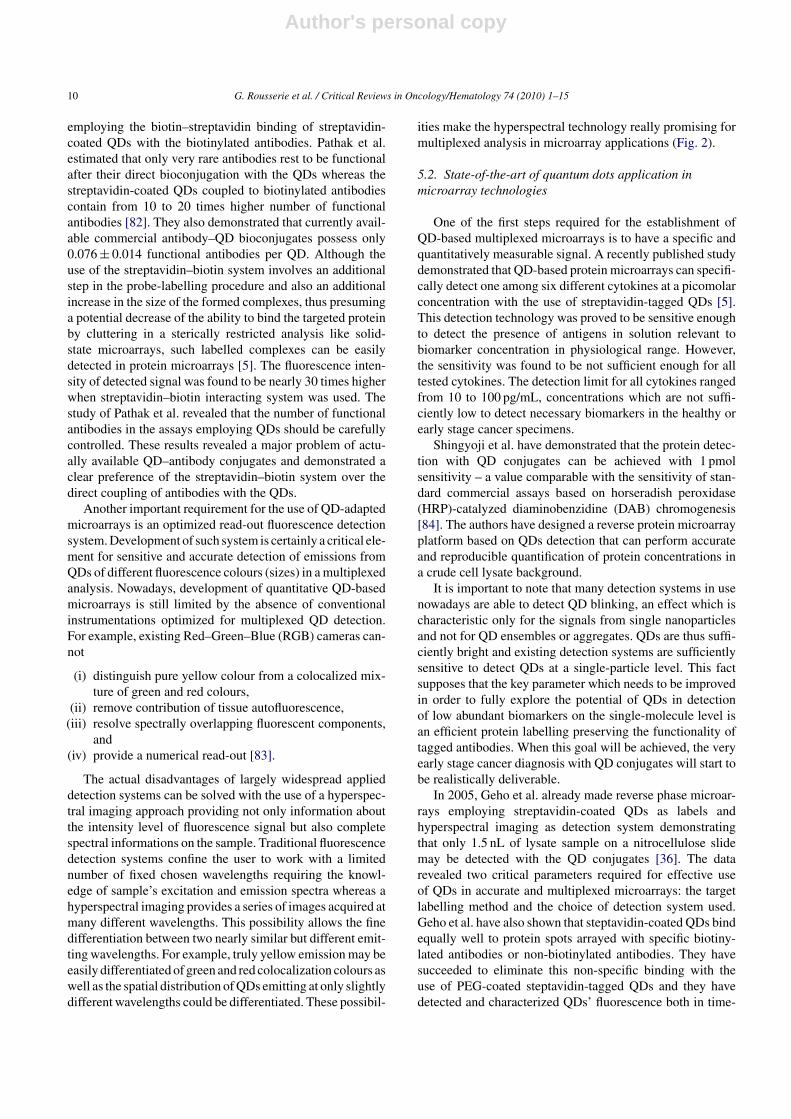
Fig. 2. Schematic illustration of hyperspectral imaging of multicolour QD-labelled tissue specimens. Conventional RGB cameras display images in threecolour channels (red, blue and green) and thus cannot distinguish spectrally overlapping fluorophores. By contrast, hyperspectral imaging works in a waysimilar to spectroscopy in that it samples the emission spectra of every pixel in a series of wavelengths (thus creating an image cube). For example, blueQDs appear only the images taken at shorter wavelength, whereas red QDs appear at longer wavelengths. Based on the spectral information obtained for eachpixel, the fluorescent components (multicolour QDs and autofluorescence) can be unmixed into separate images for quantification or merged together with theautofluorescence removed. The use of QDs and hyperspectral imaging enhances the ability of each technique in multicolour imaging. Reproduced from Ref.[76] with permission from the American Society for Investigative Pathology and the Association for Molecular Pathology.
5. Use of quantum dots in microarray applications
5.1. Technical requirements for quantum dotsapplications
The use of the quantum dot labelling in microarray analy-sis is relatively new, so, for an accurate multiplexed analysis,the quantitative comparison of traditional, based on the use oforganic dyes, and newly developing QDs-based approachesneeds to be realized. Some recent studies have alreadydemonstrated the advantages and key shortcomings for QDsapplication to microarray technologies thus establishing thebasic technical requirements.
For DNA microarrays the best choice for labelling withQDs seems to be the body-labelling approach which allowsa uniform incorporation of the labels between the targets.Moreover, as QDs are bigger than organic dyes, the com-plexes of QDs with modified nucleotides seem to be toobulky for correct uptake by polymerases and thus their inser-tion rate is both low and not uniformed. For this reason,an indirect labelling methodology of body-labelling tech-nique, with the use of a tiny intermediate molecule, is themost suitable. In a very recent study, Vora et al. [81] raisedthe need of comparative analysis of the different labellingtechniques and necessity of exact determination of the sizelimit for correct labelling of the probe. Although the authorshave succeeded in comparing different labelling techniquesapplied to the DNA microarrays [81], they do not provide an
overview of systematic studies in standardized conditions.The procedures of application of different labels to variousdetection systems have been discussed thus leading to exper-imental biases for comparison of detection sensitivity anddifferences of label repartition for each labelling technique,due to the labels differential brightness and size.
For protein microarrays, it is much more difficult to estab-lish the best labelling technology employing QDs. As theoptical properties of QDs in solution ultimately depend onthe nature and the number of ligands present on their sur-face, these parameters need to be carefully controlled duringQDs solubilisation and conjugation steps. Additionally, thefunctionality of the surface ligands should also be controlledin order to improve additionally the QD stability in solu-tion. Proceeding in this way, Geho et al. [36] have usedthe multifunctional polyethyleneglycol (PEG)-based poly-mers to solubilise and functionalise the QDs in order toavoid unspecific binding of them when applied to a reversephase protein microarray. It should also be underlined thatthe QDs conjugation step is not perfect yet. Indeed, Pathaket al. have recently demonstrated that the number of func-tional antibodies conjugated with QDs, i.e. those antibodieswhich are sterically available for functional binding to targetprotein, is much lower than expected. They have comparedthe number of functional antibodies in the context of thetwo general models for protein labelling with QDs: (1)direct coupling of functionalised QDs with the monoclonalantibodies using standard bioconjugation techniques, or (2)
Author's personal copy
10 G. Rousserie et al. / Critical Reviews in Oncology/Hematology 74 (2010) 1–15
employing the biotin–streptavidin binding of streptavidin-coated QDs with the biotinylated antibodies. Pathak et al.estimated that only very rare antibodies rest to be functionalafter their direct bioconjugation with the QDs whereas thestreptavidin-coated QDs coupled to biotinylated antibodiescontain from 10 to 20 times higher number of functionalantibodies [82]. They also demonstrated that currently avail-able commercial antibody–QD bioconjugates possess only0.076 ± 0.014 functional antibodies per QD. Although theuse of the streptavidin–biotin system involves an additionalstep in the probe-labelling procedure and also an additionalincrease in the size of the formed complexes, thus presuminga potential decrease of the ability to bind the targeted proteinby cluttering in a sterically restricted analysis like solid-state microarrays, such labelled complexes can be easilydetected in protein microarrays [5]. The fluorescence inten-sity of detected signal was found to be nearly 30 times higherwhen streptavidin–biotin interacting system was used. Thestudy of Pathak et al. revealed that the number of functionalantibodies in the assays employing QDs should be carefullycontrolled. These results revealed a major problem of actu-ally available QD–antibody conjugates and demonstrated aclear preference of the streptavidin–biotin system over thedirect coupling of antibodies with the QDs.
Another important requirement for the use of QD-adaptedmicroarrays is an optimized read-out fluorescence detectionsystem. Development of such system is certainly a critical ele-ment for sensitive and accurate detection of emissions fromQDs of different fluorescence colours (sizes) in a multiplexedanalysis. Nowadays, development of quantitative QD-basedmicroarrays is still limited by the absence of conventionalinstrumentations optimized for multiplexed QD detection.For example, existing Red–Green–Blue (RGB) cameras can-not
(i) distinguish pure yellow colour from a colocalized mix-ture of green and red colours,
(ii) remove contribution of tissue autofluorescence,(iii) resolve spectrally overlapping fluorescent components,
and(iv) provide a numerical read-out [83].
The actual disadvantages of largely widespread applieddetection systems can be solved with the use of a hyperspec-tral imaging approach providing not only information aboutthe intensity level of fluorescence signal but also completespectral informations on the sample. Traditional fluorescencedetection systems confine the user to work with a limitednumber of fixed chosen wavelengths requiring the knowl-edge of sample’s excitation and emission spectra whereas ahyperspectral imaging provides a series of images acquired atmany different wavelengths. This possibility allows the finedifferentiation between two nearly similar but different emit-ting wavelengths. For example, truly yellow emission may beeasily differentiated of green and red colocalization colours aswell as the spatial distribution of QDs emitting at only slightlydifferent wavelengths could be differentiated. These possibil-
ities make the hyperspectral technology really promising formultiplexed analysis in microarray applications (Fig. 2).
5.2. State-of-the-art of quantum dots application inmicroarray technologies
One of the first steps required for the establishment ofQD-based multiplexed microarrays is to have a specific andquantitatively measurable signal. A recently published studydemonstrated that QD-based protein microarrays can specifi-cally detect one among six different cytokines at a picomolarconcentration with the use of streptavidin-tagged QDs [5].This detection technology was proved to be sensitive enoughto detect the presence of antigens in solution relevant tobiomarker concentration in physiological range. However,the sensitivity was found to be not sufficient enough for alltested cytokines. The detection limit for all cytokines rangedfrom 10 to 100 pg/mL, concentrations which are not suffi-ciently low to detect necessary biomarkers in the healthy orearly stage cancer specimens.
Shingyoji et al. have demonstrated that the protein detec-tion with QD conjugates can be achieved with 1 pmolsensitivity – a value comparable with the sensitivity of stan-dard commercial assays based on horseradish peroxidase(HRP)-catalyzed diaminobenzidine (DAB) chromogenesis[84]. The authors have designed a reverse protein microarrayplatform based on QDs detection that can perform accurateand reproducible quantification of protein concentrations ina crude cell lysate background.
It is important to note that many detection systems in usenowadays are able to detect QD blinking, an effect which ischaracteristic only for the signals from single nanoparticlesand not for QD ensembles or aggregates. QDs are thus suffi-ciently bright and existing detection systems are sufficientlysensitive to detect QDs at a single-particle level. This factsupposes that the key parameter which needs to be improvedin order to fully explore the potential of QDs in detectionof low abundant biomarkers on the single-molecule level isan efficient protein labelling preserving the functionality oftagged antibodies. When this goal will be achieved, the veryearly stage cancer diagnosis with QD conjugates will start tobe realistically deliverable.
In 2005, Geho et al. already made reverse phase microar-rays employing streptavidin-coated QDs as labels andhyperspectral imaging as detection system demonstratingthat only 1.5 nL of lysate sample on a nitrocellulose slidemay be detected with the QD conjugates [36]. The datarevealed two critical parameters required for effective useof QDs in accurate and multiplexed microarrays: the targetlabelling method and the choice of detection system used.Geho et al. have also shown that steptavidin-coated QDs bindequally well to protein spots arrayed with specific biotiny-lated antibodies or non-biotinylated antibodies. They havesucceeded to eliminate this non-specific binding with theuse of PEG-coated steptavidin-tagged QDs and they havedetected and characterized QDs’ fluorescence both in time-

Author's personal copy
G. Rousserie et al. / Critical Reviews in Oncology/Hematology 74 (2010) 1–15 11
and concentration-dependent manners [36]. Moreover, Gehoet al. have detected fluorescence of QD-labels with sensitiv-ity that is at least comparable to standard commercial assaysbased on horseradish peroxides analysed DAB chromogen-esis. An important advantage for future biomedical use ofQDs-based microarrays in diagnostics for detection of rarebiomarkers/proteins/nucleotide transcripts is that QDs weresufficiently bright for a very long time to be detected in thestandard microarray format on the nitrocellulose slide. Gehoet al. have demonstrated that QD labelling can be reviewed atleast 6 months after the staining experiment with just a slightchange in emission spectra during this time. Although onlyone QD population (colour) was tested in their work, Gehoet al. have also demonstrated that QD labelling in proteinmicroarrays can be effectively detected with hyperspectralimaging system. Further studies are required to prove thepossibility to recognize simultaneously several QDs popula-tions in order to validate multiplexed microarray detectionapproaches based on the hyperspectral imaging analysisparticularly suitable for detection of several biomarkers insingle-shot diagnostics.
In one of the most promising examples of QD applicationsto cancer diagnosis with low quantity of patient samples,Ghazani et al. have detected three biomarkers (cytokera-tine, epidermal cadherin and epidermal grown factor receptor(EGFR)) in protein microarrays specifically labelled withthree different QDs (565, 605 and 655 nm, respectively)using FFPE (formalin-fixed paraffin-embedded) lung car-cinoma xenografts [85]. Due to the known fact that theEGFR expression level varies between the different FFPE,the authors validated their detection system through compar-ison of EGFR expression levels detected by QD fluorescenceand by quantitative reverse transcriptase polymerase chainreaction (RT-PCR). Determined with QD fluorescence tech-nique expression levels were found to have a strong statisticalcorrelation reaching the correlation coefficient 0.90 with theresults of RT-PCR control. The authors further compared thefluorescence intensity detected for these three biomarkers(labelled by respective QDs) in single-parameter and mul-tiplexed conditions. They observed a decrease of QD565 andQD605 fluorescence intensities accompanied by an increaseof QD655 fluorescence intensity in multiplexed assays. Thisfact revealed that the multiplexed conditions provoked acrosstalk between the different QDs of different colours thusleading to changes of their relative fluorescence intensities.The authors supposed an appearance of the FRET (FörsterResonance Energy Transfer) effect between the different pop-ulations of quantum dots. This problem is supposed to beimportant to solve for an establishment of the multiplexedcancer diagnostics employing microarray technology andQDs of different colours.
5.3. Future directions
Existing methodologies for QD labelling and QD fluo-rescence detection in DNA and protein microarrays are not
perfect yet. In order to provide a most discriminatory QDfluorescence detection, the hyperspectral imaging should beused to enable the spectral differentiation and quantificationof labels fluorescence (Fig. 2).
A standard hyperspectral imaging set-up includes a band-pass controlling device (such as acousto-optic tuneable filtersor diffraction grating) and a scientific-grade monochromeCCD camera. Despite the acousto-optic tuneable filters allowto electronically change both the wavelength and the band-width, their low quality imaging hindered their use duringseveral years. Recently, this major problem was solved byusing both innovative transducer design and long inter-action length crystals. Among the different hyperspectralimaging systems, the acousto-optic tuneable filter systemseems to be the most suitable through the high speed ofwavelength change (∼50 �s), the high quality of fluores-cence detection and the relatively fast treatment of acquireddata. Although additional comparative work is still neededto evaluate real potential of such systems against tradi-tional fluorescence detection systems, the combination of theunique QD optical characteristics and hyperspectral imag-ing will certainly enhance their respective advantages andcapabilities.
Another powerful technology for detection with QDs is thesurface plasmon enhanced fluorescence spectroscopy [86].Robelek et al. have successfully measured the spectrallyresolved surface plasmon enhanced fluorescence signalsderived from the probes of hybridized QD–DNA conjugateson the surface of the solid-state microarray chip [86].
Although the use of streptavidin-tagged QDs instead ofthe QD conjugates with monoclonal antibodies provides big-ger amount of functional antibodies on the surface of QDs[78], their number is still too low. This parameter shouldbe definitively improved for the future because it is criti-cal for sensitivity and specificity of detection on the proteinmicroarrays. Indeed, it is very important to be able to under-stand if the absence of label signal means the absence ofdetecting protein or is determined by the non-sufficient quan-tity of functional antibodies tagged with the quantum dot.Although the streptavidin-tagged QDs were shown to be effi-cient enough for labelling biotinylated antibodies [36], theirapplication may be limited since the size of streptavidin-tagged QD conjugates is too big. Therefore, the size ofdetecting QD-conjugates may be decreased if the function-ality of the ligands directly tagged with the QD can beimproved. This may be done by development of optimizedconjugation protocols preserving the ligand function andalso providing the conjugates where the ligands are ori-ented in a manner to be fully exposed to interaction with thetargets.
Ghazani et al. have demonstrated that the multiplexedassays employing QDs of different colours may suffer fromFRET effect [85]. This major problem for multiplexedassays should be addressed by careful selection of quan-tum dot fluorescence colours and variations of the capturemolecules bound to their surface. Indeed, quantum yield

Author's personal copy
12 G. Rousserie et al. / Critical Reviews in Oncology/Hematology 74 (2010) 1–15
and extinction of QDs (and thus their brightness) are size-and composition-dependents. Another potential solution tocompensate the decrease of fluorescence detected for theQDs of smaller diameters (lower wavelengths) is the useof “quantum rods”, nanocrystals which are rod-shaped andtheir brightness depends of their length whereas their wave-length emission characteristics depend on their diameter andchemical composition. Finally the QDs-encoded polymericbeads can be also used to increase the distance between thequantum dots of different populations embedded within thepolymeric matrices. Although the protocols of bead encodingwith the QDs of different colours always need to be improved,Eastman et al. have demonstrated a breakthrough ultrasen-sitive multiplexed application of such QDs-nanobarcodes[87].
Although the FRET effect may be a problem for multi-plexed detection with the QDs of different colours, it may beefficiently employed for detection of immune complex for-mation between the molecules labelled with QDs or organicdyes with carefully selected fluorescence colours. FRETtechnology involves the transfer of energy from a donorto an acceptor particle whenever the distance between thedonor and the acceptor is smaller than the Förster radius(<10 nm) and fluorescence emission of donor is stronglyoverlapping with the absorption of acceptor [88]. In suchassays, QDs of different colours and organic dyes may beused as the donors and as the acceptors. Indeed the QDsemission spectra are much narrower and more symmetricthan that for emission of organic dyes, making much eas-ier to distinguish the emission of QD-donor from that of theacceptor. Several studies have shown the potential of QDsin the FRET approach for measuring the subtle changes indistances between the donor and acceptor labels [89], proteinconformational changes [90] and analysing protein interac-tions [91,92]. The use of quantum dots in FRET studiesprovides many advantages over organic fluorophores. Thecombination of quantum dots and organic dyes labels shouldresult in a FRET-based immunoassay technique applicable toprotein microarrays.
The cancer research is a field which will greatly takeadvantage of QD-based labelling method in microarrays[93]. Indeed, microarrays are already developed as diagnos-tic approaches and the critical limit for efficient diagnosis isits sensitivity because an early detection is the key for can-cer survival [28]. Up to now, almost all tumour diagnosticsdetect tumours at an advanced stage, sometimes too advancedto start an efficient therapy. An increase in sensitivity permitsto push diagnosis limits, which have many consequences:cancers could be detected early thus therapy would be moreeffective and shorter and thus less restrictive and expensivefor the patient. A best therapy also leads to an importantdecrease in the number of potential metastasis and thus therelapse likelihood. Furthermore, the paralleling capacities ofmicroarrays allow a best understanding of cellular eventsrequired for tumour development in allowing the comparisonof genes expression, genes regulation and proteins activity
between metastatic and healthy tissues which might allowthe discovery of some new drugs, biomarkers and potentialdrug targets. All these discoveries raise exciting opportunitiesfor adapted and personalized cancer therapies based on theindividual molecular profile of each patient and early diag-nosis of cancers. However, the identification and selectionof biomarkers that can be tested in a diagnostic assay is acritical point to make accurate diagnostics. Microarrays are agood approach to find new cancer biomarkers and to establishwhich one should be chosen for clinical use [94].
Microarrays with quantum dot labelling present interest-ing promises in such areas as rapid detection of pathogens[95] or discovery of natural common antibody targets fol-lowing a pathogen invasion. This can lead to new therapyapproaches for drug delivery and target. As an example,Li et al. used QDs on protein microarrays against 144 pro-teins to study the antibody response of plague patients [24].This study permitted to provide information on commonantibody targets, made fine patient groups through their anti-body response and increased the understanding of the lack ofimmune responses to eradicate pathogen agents in order toimprove therapy.
6. Concluding remarks
During the last decades, the paralleling capacities ofmicroarrays have already provided a global view of patholog-ical states at a molecular level through better understandingof mechanisms of gene regulations, expressions and patientimmune responses. These points are particularly importantfor an efficient therapy. However, organic dyes regularly usedas labels in microarrays technologies are not easily suitablefor multiplexed approaches. We have demonstrated in thisreview that the microarray analysis will be more efficient,sensitive and specific with the use of quantum dot labelling.Employment of quantum dots should ensure orders of mag-nitude improvement of the target detection limit, gain ofaccuracy and time, reduction of assay costs and breakthroughincrease in multiplexing capabilities.
Acknowledgements
This work was supported by the French National ResearchAgency (Agence Nationale de Recherche – ANR) programs‘Nanosciences and Nanotechnologies’ under the grant ANR-07-PNANO-051-01 and by the ANR program “Research andInnovations in Biotechnology” under the grant ANR-07-RIB-012-03. Partial supports from the Ligue Contre le Cancer,NATO SfP-983207, RFBR/CNRS (07-04-92164/PICS3868)and RFBR 07-04-01421 projects are also acknowledged. Thestudy sponsors had no involvement in the study design, in thecollection, analysis and interpretation of data, in the writingof the manuscript or in the decision to submit the manuscriptfor publication.

Author's personal copy
G. Rousserie et al. / Critical Reviews in Oncology/Hematology 74 (2010) 1–15 13
Reviewers
Dr. Andrey L. Rogach, Ludwig-Maximilians-UniversitätMünchen, Lehrstuhl für Photonik und Optoelektronik,Amalienstrasse 54, D-80799 Munich, Germany.
Dr. Yuri Volkov, Trinity College Dublin, Institute ofMolecular Medicine, Department of Clinical Medicine,James’s Street, Dublin, 8, Ireland.
Prof. Bernard Desoize, Faculte de Pharmacie, IFR53Biomolecules, 51 Rue Cognacq-Jay, F-51096 Reims, France.
References
[1] Ehrenreich A. DNA microarray technology for the microbiologist: anoverview. Appl Microbiol Biotechnol 2006;73:255–73.
[2] Stoll D, Templin MF, Schrenk M, Traub PC, Vöhringer CF, Joos TO.Protein microarray technology. Front Biosci 2002;7:c13–32.
[3] Gracey AY, Cossins AR. Application of microarray technologyin environmental and comparative physiology. Annu Rev Physiol2003;65:231–59.
[4] Park HG, Song JY, Park KH, Kim MH. Fluorescence-based assay for-mats and signal amplification strategies for DNA microarray analysis.Chem Engen Sci 2006;61:954–65.
[5] Zajac A, Song D, Qian W, Zhukov T. Protein microarrays and quantumdot probes for early cancer detection. Colloids Surf B Biointerfaces2007;58:309–14.
[6] Resch-Genger U, Grabolle M, Cavaliere-Jaricot S, Nitschke R, Nann T.Quantum dots versus organic dyes as fluorescent labels. Nat Methods2008;5:763–75.
[7] Nabiev I, Sukhanova A, Artemyev M, Oleinikov V. Fluorescent col-loidal particles as a detection tools in biotechnology systems. In:Elaissari A, editor. Colloidal Nanoparticles in Biotechnology, pp. 376.Wiley & Sons Inc.; 2008. p. 133–68.
[8] Sukhanova A, Nabiev I. Fluorescent nanocrystal quantum dots as med-ical diagnostic tools. Exp Opin Med Diagn 2008;2:429–47.
[9] Sukhanova A, Nabiev I. Liquid-phase chips based on the fluorescentnanocrystal-encoded microbeads for cancer diagnostics. Crit Rev OncolHematol 2008;68:39–59.
[10] Ling MM, Ricks C, Lea P. Multiplexing molecular diagnostics andimmunoassays using emerging microarray technologies. Expert RevMol Diagn 2007;7:87–98.
[11] Blohm DH, Guiseppi-Elie A. New developments in microarray tech-nology. Curr Opin Biotechnol 2001;12:41–7.
[12] McGall G, Labadie J, Brock P, Wallraff G, Nguyen T, HinsbergW. Light-directed synthesis of high-density oligonucleotide arraysusing semiconductor photoresists. Proc Natl Acad Sci U S A1996;93:13555–60.
[13] Hoek KS. DNA microarray analyses of melanoma gene expression: adecade in the mines. Pigment Cell Res 2007;20:466–84.
[14] Duncan R. DNA microarray analysis of protozoan parasite geneexpression: outcomes correlate with mechanisms of regulation. TrendsParasitol 2004;20:211–5.
[15] Yamakawa H, Hirose T, Kuroda M, Yamaguchi T. Comprehensiveexpression profiling of rice grain filling-related genes under high tem-perature using DNA microarray. Plant Physiol 2007;144:258–77.
[16] Wakamatsu E, Nakamura Y, Matsumoto I, et al. DNA microarray anal-ysis of labial salivary glands of patients with Sjogren’s syndrome. AnnRheum Dis 2007;66:844–5.
[17] Feferman T, Aricha R, Menon R, Souroujon MC, Berrih-Aknin S, FuchsS. DNA microarray in search of new drug targets for myasthenia gravis.Ann N Y Acad Sci 2007;1107:111–7.
[18] Dorrell N, Hinchliffe SJ, Wren BW. Comparative phylogenomicsof pathogenic bacteria by microarray analysis. Curr Opin Microbiol2005;8:620–6.
[19] Tao SC, Chen CS, Zhu H. Applications of protein microarray technol-ogy. Comb Chem High Throughput Screen 2007;10:706–18.
[20] Lee Y, Lee EK, Cho YW, et al. ProteoChip: a highly sensitiveprotein microarray prepared by a novel method of protein immobiliza-tion for application of protein–protein interaction studies. Proteomics2003;3:2289–304.
[21] Sasakura Y, Kanda K, Yoshimura-Suzuki T, Matsui T, Fukuzono S,Shimizu T. Investigation of the relationship between protein–proteininteraction and catalytic activity of a heme-regulated phosphodiesterasefrom Escherichia coli (Ec DOS) by protein microarray. Biochemistry2005;44:9598–605.
[22] Zha H, Raffeld M, Charboneau L, et al. Similarities of prosurvivalsignals in Bcl-2-positive and Bcl-2-negative follicular lymphomasidentified by reverse phase protein microarray. Lab Invest 2004;84:235–44.
[23] Chan SM, Weng AP, Tibshirani R, Aster JC, Utz PJ. Notch signalspositively regulate activity of the mTOR pathway in T-cell acute lym-phoblastic leukemia. Blood 2007;110:278–86.
[24] Li B, Zhou D, Wang Z, et al. Antibody profiling in plague patients byprotein microarray. Microbes Infect 2008;10:45–51.
[25] Xu R, Gan X, Fang Y, Zheng S, Dong Q. A simple, rapid, andsensitive integrated protein microarray for simultaneous detectionof multiple antigens and antibodies of five human hepatitis viruses(HBV, HCV, HDV, HEV, and HGV). Anal Biochem 2007;362:69–75.
[26] Yuk CS, Lee HK, Kim HT, Choi YK, Lee BC, Chun BH, Chung N.Development and evaluation of a protein microarray chip for diagnosisof hepatitis C virus. Biotechnol Lett 2004;26:1563–8.
[27] Zhu H, Hu S, Jona G, et al. Severe acute respiratory syndrome diag-nostics using a coronavirus protein microarray. Proc Natl Acad Sci US A 2006;103:4011–6.
[28] Smith AM, Dave S, Nie S, True L, Gao X. Multicolor quantumdots for molecular diagnostics of cancer. Expert Rev Mol Diagn2006;6(March):231–44.
[29] Brown PO, Botstein D. Exploring the new world of the genome withDNA microarrays. Nat Genet 1999;21:33–7.
[30] Granjeaud S, Bertucci F, Jordan BR. Expression profiling: DNA arraysin many guises. Bioessays 1999;21:781–90.
[31] Saitou M, Yabuta Y, Kurimoto K. Single-cell cDNA high-densityoligonucleotide microarray analysis: detection of individual cell typesand properties in complex biological processes. Reprod Biomed Online2008;16:26–40.
[32] Zekri AR, Hafez MM, Bahnassy AA, et al. Genetic profile of Egyptianhepatocellular-carcinoma associated with hepatitis C virus Genotype4 by 15 K cDNA microarray: preliminary study. BMC Res Notes2008;1:106.
[33] Liang RQ, Li W, Li Y, et al. An oligonucleotide microarray formicroRNA expression analysis based on labeling RNA with quantumdot and nanogold probe. Nucleic Acids Res 2005;33:e17.
[34] Williams BA, Gwirtz RM, Wold BJ. Genomic DNA as a cohybridiza-tion standard for mammalian microarray measurements. Nucleic AcidsRes 2004;32:e81.
[35] Kader HA, Tchernev VT, Satyaraj E, et al. Protein microarray analysisof disease activity in pediatric inflammatory bowel disease demon-strates elevated serum PLGF, IL-7, TGF-beta1, and IL-12p40 levelsin Crohn’s disease and ulcerative colitis patients in remission versusactive disease. Am J Gastroenterol 2005;100:414–23.
[36] Geho D, Lahar N, Gurnani P, et al. Pegylated, steptavidin-conjugatedquantum dots are effective detection elements for reverse-phase proteinmicroarrays. Bioconjug Chem 2005;16:559–66.
[37] Hall DA, Ptacek J, Snyder M. Protein microarray technology. MechAgeing Dev 2007;128:161–7.
[38] Zhu H, Bilgin M, Bangham R, et al. Global analysis of protein activitiesusing proteome chips. Science 2001;293:2101–5.
[39] Angenendt P, Glökler J, Murphy D, Lehrach H, Cahill DJ. Towardoptimized antibody microarrays: a comparison of current microarraysupport materials. Anal Biochem 2002;309:253–60.

Author's personal copy
14 G. Rousserie et al. / Critical Reviews in Oncology/Hematology 74 (2010) 1–15
[40] Wingren C, Ingvarsson J, Dexlin L, Szul D, Borrebaeck CA. Designof recombinant antibody microarrays for complex proteome anal-ysis: choice of sample labeling tag and solid support. Proteomics2007;7:3055–65.
[41] Seurynck-Servoss SL, White AM, Baird CL, Rodland KD, ZangarRC. Evaluation of surface chemistries for antibody microarrays. AnalBiochem 2007;371:105–15.
[42] Wingren C, Steinhauer C, Ingvarsson J, Persson E, Larsson K, Bor-rebaeck CA. Microarrays based on affinity-tagged single-chain Fvantibodies: sensitive detection of analyte in complexe proteomes. Pro-teomics 2005;5:1281–91.
[43] Grainger DW, Greef CH, Gong P, Lochhead MJ. Current microarraysurface chemistries. Methods Mol Biol 2007;381:37–57.
[44] Arenkov P, Kukhtin A, Gemmell A, Voloshchuk S, Chupeeva V, Mirz-abekov A. Protein microchips: use for immunoassay and enzymaticreactions. Anal Biochem 2000;278:123–31.
[45] Mircean C, Shmulevich I, Cogdell D, et al. Robust estimation of proteinexpression ratios with lysate microarray technology. Bioinformatics2005;21:1935–42.
[46] Sakanyan V. High-throughput and multiplexed protein array technol-ogy: protein–DNA and protein–protein interactions. J Chromatogr BAnalyt Technol Biomed Life Sci 2005;815:77–95.
[47] Wingren C, Borrebaeck CA. Progress in miniaturization of proteinarrays-a step closer to high-density nanoarrays. Drug Discov Today2007;12:813–9.
[48] Lesaicherre ML, Uttamchandani M, Chen GY, Yao SQ. Developing sitespecific immobilization strategies of peptides in a microarray. BioorgMed Chem Lett 2002;12:2079–83.
[49] Evans D, Johnson S, Laurenson S, Davies AG, Ferrigno PK, Wälti C.Electrical protein detection in cell lysates using high-density peptide-aptamer microarrays. J Biol 2008;7:3.
[50] Houseman BT, Huh JH, Kron SJ, Mrksich M. Peptide chips forthe quantitative evaluation of protein kinase activity. Nat Biotechnol2002;20:270–4.
[51] Carlsson A, Wingren C, Ingvarsson J, et al. Serum proteome profilingof metastatic breast cancer using recombinant antibody microarrays.Eur J Cancer 2008;44:472–80.
[52] Renberg B, Nordin J, Merca A, et al. Affibody molecules in proteincapture microarrays: evaluation of multidomain ligands and differentdetection formats. J Proteome Res 2007;6:171–9.
[53] Harmsen MM, De Haard HJ. Properties, production, and applicationsof camelid single-domain antibody fragments. Appl Microbiol Technol2007;77:13–22.
[54] Van der Linden RH, Frenken LG, de Geus B, et al. Comparisonof physical chemical properties of llama VHH antibody fragmentsand mouse monoclonal antibodies. Biochim Biophys Acta 1999;1431:37–46.
[55] Kingsmore SF. Multiplexed protein measurement: technologies andapplications of protein and antibody arrays. Nat Rev Drug Discov2006;5:310–20.
[56] Robinson WH, DiGennaro C, Hueber W, et al. Autoantigen microarraysfor multiplexed characterization of autoantibody responses. Nat Med2002;8:295–301.
[57] Fang Y, Frutos AG, Lahiri J. Membrane protein microarrays. J AmChem Soc 2002;124:2394–5.
[58] Sieber SA, Mondala TS, Head SR, Cravatt BF. Microarray platformfor profiling enzyme activities in complex proteomes. J Am Chem Soc2004;126:15640–1.
[59] Ramachandran N, Raphael JV, Hainsworth E, et al. Next-generationhigh-density self-assembling functional protein arrays. Nat Methods2008;5:535–8.
[60] Situma C, Hashimoto M, Soper SA. Merging microfluidics withmicroarray-based bioassays. Biomol Eng 2006;23:213–31.
[61] Lee KB, Park SJ, Mirkin CA, Smith JC, Mrksich M. Protein nanoarraysgenerated by dip-pen nanolithography. Science 2002;295:1702–5.
[62] Yan J, Estévez MJ, Smith JE, et al. Dye-doped nanoparticles for bio-analysis. Nanotoday 2007;2:44–50.
[63] Huber F, Hegner M, Gerber C, Güntherodt HJ, Lang HP. Label freeanalysis of transcription factors using microcantilever arrays. BiosensBioelectron 2006;21:1599–605.
[64] Klenkar G, Liedberg B. A microarray chip for label-free detection ofnarcotics. Anal Bioanal Chem 2008;391:1679–88.
[65] Cheng MMC, Cuda G, Bunimovich YL, et al. Nanotechnologies forbiomolecular detection and medical diagnostics. Curr Opin Chem Biol2006;10:11–9.
[66] Backmann N, Zahnd C, Huber F, et al. A label-free immunosensorarray using single-chain antibody fragments. Proc Natl Acad Sci U SA 2005;102:14587–92.
[67] Yuan J, Sueda S, Somazawa R, Matsumoto K, MatsumotoK. Structure and luminescence properties of the tetradentate�-diketonate–europium(III) complexes. Chem Lett 2003;32:492–3.
[68] Wang F, Tan WB, Zhang Y, Fan X, Wang M. Luminescent nanomate-rials for biological labelling. Nanotechnology 2006;17:1–13.
[69] Bruchez Jr M, Moronne M, Gin P, Weiss S, Alivisatos AP. Semi-conductor nanocrystals as fluorescent biological labels. Science1998;281(5385):2013–6.
[70] Chan WC, Nie S. Quantum dot bioconjugates for ultrasensitive non-isotopic detection. Science 1998;25(281 (5385)):2016–8.
[71] Baranov AV, Rakovich YP, Donegan JF, et al. Effect of ZnS shellthickness on the phonon spectra in CdSe quantum dots. Phys Rev B2003;68:1653061–7.
[72] Azzazy HME, Mansour MMH, Kazmierczak SC. From diagnos-tics to therapy: prospects of quantum dots. Clin Biochem 2007;40:917–27.
[73] Shi C, Zhu Y, Cerwinka WH, et al. Quantum dots: emerging applica-tions in urologic oncology. Urol Oncol 2008;26(1):86–92.
[74] Alivisatos AP, Gu W, Larabell C. Quantum dots as cellular probes.Annu Rev Biomed Eng 2005;7:55–76.
[75] Karlin-Neumann G, Sedova M, Falkowski M, Wang Z, Lin S, Jain M.Application of quantum dots to multicolor microarray experiments:four-color genotyping. Methods Mol Biol 2007;374:239–51.
[76] Sukhanova A, Devy J, Venteo L, et al. Biocompatible fluorescentnanocrystals for immunolabeling of membrane proteins and cells. AnalBiochem 2004;324:60–7.
[77] Zhong X, Feng Y, Knoll W, Han M. Alloyed ZnxCd1−xS nanocrys-tals with highly narrow luminescence spectral width. J Am Chem Soc2003;125:13559–63.
[78] Nirmal M, Dabbousi BO, Bawendi MG, et al. Fluorescenceintermittency in single cadmium selenide nanocrystals. Nature1996;383:802–4.
[79] Empedocles SA, Neuhauser R, Shimizu K, Bawendi MG. Photolu-minescence from single semiconductor nanostructures. Adv Mater1999;15(11):243–56.
[80] Hohng S, Ha T. Near complete suppression of quantum dot blinking inambient condition. J Am Chem Soc 2004;126:1324–5.
[81] Vora GJ, Meador CE, Anderson GP, Taitt CR. Comparison of detec-tion and signal amplification methods for DNA microarrays. Mol CellProbes 2008;22(5–6):294–300.
[82] Pathak S, Davidson MC, Silva GA. Characterization of the functionalbinding properties of antibody conjugated quantum dots. Nano Lett2007;7:1839–45.
[83] True LD, Gao X. Quantum dots for molecular pathology: their time hasarrived. J Mol Diagn 2007;9:7–11.
[84] Shingyoji M, Gerion D, Pinkel D, Gray JW, Chen F. Quan-tum dots-based reverse phase protein microarray. Talanta 2005;67:472–8.
[85] Ghazani AA, Lee JA, Klostranec J, et al. High throughput quantificationof protein expression of cancer antigens in tissue microarray usingquantum dot nanocrystals. Nano Lett 2006;6:2881–6.
[86] Robelek R, Niu L, Schmid EL, Knoll W. Multiplexed hybridizationdetection of quantum dot-conjugated DNA sequences using surfaceplasmon enhanced fluorescence microscopy and spectrometry. AnalChem 2004;76:6160–5.

Author's personal copy
G. Rousserie et al. / Critical Reviews in Oncology/Hematology 74 (2010) 1–15 15
[87] Eastman PS, Ruan W, Doctolero M, et al. Qdot nanobarcodes for mul-tiplexed gene expression analysis. Nano Lett 2006;6:1059–64.
[88] Murata S, Herman P, Mochizuki K, et al. Spatial distribution analysisof AT- and GC-rich regions in nuclei using corrected fluores-cence resonance energy transfer. J Histochem Cytochem 2003;51:951–8.
[89] Schwartz DE, Gong P, Shepard KL. Time-resolved Förster-resonance-energy-transfer DNA assay on an active CMOS microarray. BiosensBioelectron 2008;24:383–90.
[90] Schuler B, Eaton WA. Protein folding studied by single-moleculeFRET. Curr Opin Struct Biol 2008;18:16–26.
[91] Gertler A, Biener E, Ramanujan KV, Djiane J, Herman B. Fluorescenceresonance energy transfer (FRET) microscopy in living cells as a noveltool for the study of cytokine action. J Dairy Res 2005;72:14–9.
[92] Hallworth R, Currall B, Nichols MG, Wu X, Zuo J. Studying innerear protein–protein interactions using FRET and FLIM. Brain Res2006;1091:122–31.
[93] Jain KK. Applications of nanobiotechnology in clinical diagnostics.Clin Chem 2007;53:2002–9.
[94] Phan JH, Young AN, Wang MD. Selecting clinically-driven biomark-ers for cancer nanotechnology. Conf Proc IEEE Eng Med Biol Soc2006;1:3317–20.
[95] Goldschmidt MC. The use of biosensor and microarray techniquesin the rapid detection and identification of salmonellae. J AOAC Int2006;89:530–7.
Biographies
Gilles Rousserie graduated from Université de la Méditer-ranée in Marseille in 2007 and is preparing actually hisPh.D. Thesis under direction of Prof. Nabiev in the framesof research program developing introduction of the quantumdots technology within the technology of protein microarraysand immunological assays.
Igor Nabiev pioneered, in the early 80s, together withthe groups of Prof. Therese Cotton (US) and Dr. EckhardKoglin (Germany), development of the new method of ultra-sensitive analysis of biomolecules, surface-enhanced Ramanscattering (SERS). He has started to develop, at the end of90s, functional surface modification and biological applica-tions of quantum dots as fluorescent labels for ultrasensitivedetection and biomedical diagnosis. Prof. Nabiev actuallycoordinates National and International research programsdeveloping nanotechnological tools for ultrasensitive non-isotopic detection and diagnosis with the solid-state andliquid-state chips.
Copyright © 2022 FDOKUMEN