Heterogeneous Face Attribute Estimation: A Deep Multi-Task ...
Upload
khangminh22Category
view
2download
0
IDENTIFYING ATTRIBUTE IMPORTANCE IN EARLY PRODUCT DEVELOPMENT
– EXEMPLIFIED BY INTERACTIVE TECHNOLOGIES AND AGE –
vorgelegt von Diplom-Psychologin
Anna Elisabeth Pohlmeyer
von der Fakultät V Verkehrs- und Maschinensysteme der Technischen Universität Berlin
zur Erlangung des akademischen Grades Doktorin der Ingenieurwissenschaften (Dr.-Ing.)
genehmigte Dissertation Promotionsausschuss
Vorsitzender: Prof. Dr.-Ing. Henning Meyer
Gutachterin: Prof. Dr.-Ing. Luciënne Blessing
Gutachter: Prof. Dr. sc. nat. Hartmut Wandke
Gutachter: Prof. Dr.-Ing. Matthias Rötting
Gutachter: Prof. Dr. rer. nat. Dieter Ferring
Gutachter: Prof. Dr.-Ing. Marc Kraft
Tag der wissenschaftlichen Aussprache: 28.10.2011
PhD-FSTC-2011-20 Berlin 2012
D83
et de la Faculté des Sciences, de laTechnologie et de la Communication
de l’Université du Luxembourg
Docteur enSciences de l‘Ingénieur
ABSTRACT I
ABSTRACT
Decisions made in the early phases of product development have a great impact on all subsequent phases of the design process. Modifications will be increasingly difficult and costly to make as the design process advances. It is therefore crucial to place pronounced emphasis on strategic planning and the development of the design specification. The merits of a prospective design approach are especially apparent in the domain of human-technology interaction. As end-users will engage with the system, a thorough understanding of the product itself, of the user, and of the resulting interaction is needed.
This thesis is concerned with the early phases in product development, as well as with the early phases of a user experience. The anticipation and perception of relevant attributes of a product or of its use, weighted by importance, affect the emotional as well as behavioral consequences of a user. The user’s attitude toward a product (the favorable or unfavorable outcome of a product evaluation) is said to influence the intention to use the product and thereby the likelihood of use.
It is less the objective quality of a product than the user’s subjective evaluation, based on the perception of quality attributes that determines whether a product will be eventually used. Consequently, in order to design interactive products in a way that increases the likelihood of use (technology adoption), relevant attributes and their respective importance need to be considered from a user’s point of view. This necessitates an active involvement of users, preferably throughout the entire design process. Attribute importance measures from a user’s perspective are particularly valuable when designing for a novel user group that has not been the target group before. For instance, as demographic trends document, declining birth rates and prolonged longevity are leading to an aging of our society. As a result, an increasing number of older adults qualify as potential users of interactive systems. Despite observing a recent increase in usage, older adults are still lagging behind other age groups in technology adoption.
Findings from research on technology adoption have been difficult to apply in product development, because the considered attributes do not easily translate into engineering characteristics for system design. Furthermore, studies on instrumental, i.e. task-oriented attributes of interactive technologies have dominated the field. Recently, the relevance of non-instrumental attributes, such as the aesthetic appeal of a product, has received increased attention under the heading of user experience. However, to this day, knowledge regarding the relative importance of different attributes and for different age groups when anticipating use is scarce.
Two parallel research aims are pursued in this thesis. Firstly, as an empirical aim, attributes of interactive technologies are identified and weighted in importance by young and older adults. Secondly, from a methodological standpoint, a variety of different methods to assess attribute
ABSTRACT II
importance are applied and extended. Their applicability for early product development and for differentiating between user groups is being discussed.
Three empirical studies that built on each other were conducted. In study 1, attributes were identified in a field study via self-documentation of participants. Participants provided general reasons for technology adoption and rejection, respectively, and listed product-specific statements as to why they liked or disliked a product. Reasons and statements were analyzed through qualitative as well as quantitative content analyses. Derived attributes were explicitly presented to participants in studies 2 and 3. Independent, self-stated importance ratings were compared to importance indices determined by full-profile conjoint analysis, by a questionnaire based on the Kano Model of Satisfaction (Kano, Seraku, Takahashi, & Tsuji, 1984), and by an extension of the constant sum scale. One objective of study 3 was to introduce an engaging and efficient method that improves the assignment of importance weights. In order to investigate the relative contribution of each attribute, trade-offs were taken into account during assessment. However, at the same time, participants were able to indicate attribute importance directly. In addition, products that are associated with different values (hedonic vs. utilitarian) were included.
The diversity of identified attributes illustrates the relevance of instrumental and non-instrumental aspects for both age groups. Valence differences have been found with respect to motivating and de-motivating reasons of technology adoption. The Kano method in study 2 generally confirms the valence effects found in study 1. According to the conjoint analysis, most attributes can be seen as significant predictors with regard to likelihood of use. Overall, instrumental attributes – in particular ergonomics and quality – are regarded as more important, while the aesthetic appeal of a product and the emotional involvement associated with its use have a less substantial impact. This observation holds true for all three studies. However, as shown in study 3, non-instrumental attributes are more important for hedonic than for utilitarian products. With regards to age differences, it has been repeatedly shown that ergonomics is more important for older adults, while quality is more important for young adults. Only when trade-offs have to be made between attributes (relative importance), aesthetics appears to be less important to older users compared to younger ones. The newly introduced method in study 3 needs to be validated in the course of future studies, but already shows great potential for identifying attribute importance in early product development and to distinguish between user groups and product classes.
Finally, a conceptual framework on Continuous User Experience (ContinUE) has been developed that illustrates the dynamics of a user experience and discusses changes in attribute importance with prolonged use. A product’s full lifecycle is taken into consideration.
To conclude, this thesis’ contributions can be seen on a theoretical, empirical, as well as methodological level. Recommendations are made on how to identify attribute importance of different user groups in early product development, and first indications are obtained on how to set priorities in design from an older user’s perspective.
ZUSAMMENFASSUNG III
ZUSAMMENFASSUNG
Entscheidungen, die in frühen Phasen der Produktentwicklung getroffen werden, haben einen großen Einfluss auf den weiteren Verlauf des Entwicklungsprozesses. In späteren Phasen wird es zunehmend schwieriger und kostspieliger, Änderungen umzusetzen. Folglich sollte der Produktplanung und dem Erarbeiten der Anforderungsliste eine besondere Beachtung beigemessen werden. Die Vorteile eines prospektiven Ansatzes sind besonders bei der Gestaltung von Mensch-Technik-Interaktionen erkennbar, da hier Endnutzer mit dem System interagieren werden. Dies erfordert nicht nur ein Verständnis des Produktes, sondern auch des Nutzers und der resultierenden Interaktion.
Die vorliegende Arbeit behandelt sowohl frühe Phasen der Produktentwicklung als auch frühe Phasen des Nutzungserlebens. Die Erwartung und Wahrnehmung relevanter Eigenschaften (Attribute) eines Produktes bzw. dessen Nutzung – gewichtet nach der zugewiesenen Wichtigkeit – wirkt sich auf die emotionalen Reaktionen und das Verhalten eines Nutzers aus. Es wird angenommen, dass die Einstellung (wertende Einschätzung) des Nutzers gegenüber einem Produkt seine Handlungsabsicht und damit die Wahrscheinlichkeit einer Nutzung beeinflusst.
Ob ein Produkt genutzt wird, hängt weniger von seiner objektiven Qualität ab, als von der subjektiven Wahrnehmung durch den Nutzer. Es ist folglich notwendig, relevante Eigenschaften aus Sicht des Nutzers zu berücksichtigen und zu gewichten, um die Wahrscheinlichkeit einer späteren Akzeptanz zu erhöhen. Der Nutzer sollte aktiv in den – idealerweise gesamten – Produktentwicklungsprozess eingebunden werden. Subjektive Eigenschaftswichtigkeiten können insbesondere beim Gestalten für eine neue Zielgruppe, beispielsweise die Gruppe älterer Personen, strategisch entscheidend sein. Aufgrund niedrigerer Geburtenraten und verlängerter Lebensdauer wird es in Zukunft immer mehr ältere Nutzer interaktiver Systeme geben. Noch nutzen ältere Menschen technische Systeme weniger als andere Altersgruppen, obgleich eine vermehrte Nutzung beobachtet wird. Es stellt sich die Frage, wie sich junge und ältere Nutzer in der Beurteilung von Produkteigenschaften unterscheiden.
Die Integration von Forschungsergebnissen zur Technikakzeptanz in die Produktentwicklung hat sich als schwierig herausgestellt, da sich die berücksichtigten Eigenschaften nicht ohne Weiteres in Produktanforderungen übertragen lassen. Hinzu kommt eine starke Konzentration auf aufgabenbezogene Eigenschaften, die die Berücksichtigung nicht-aufgabenbezogener Eigenschaften (z.B. Ästhetik) vernachlässigt. Letztgenannte haben jedoch in jüngster Zeit zunehmend Beachtung im Rahmen des Forschungsfeldes Nutzungserleben (user experience) erfahren. Erkenntnisse über die relative Wichtigkeit unterschiedlicher Eigenschaften – insbesondere für unterschiedliche Altersgruppen bei der Antizipation einer Nutzung – sind noch rar.
ZUSAMMENFASSUNG IV
Die vorliegende Arbeit verfolgt zwei Forschungsziele. Das empirische Ziel ist es, relevante Eigenschaften interaktiver Technologien und deren Wichtigkeiten für junge sowie ältere Nutzer zu ermitteln. Als methodologischer Beitrag werden mehrere Verfahren zur Messung von Eigenschaftswichtigkeiten eingesetzt und erweitert. Ihre Anwendbarkeit in frühen Phasen der Produktentwicklung sowie zur Unterscheidung von Nutzergruppen wird diskutiert.
Drei aufeinander aufbauende, empirische Studien wurden durchgeführt. In Studie 1 wurden in einer Felduntersuchung relevante Eigenschaften mittels Selbstdokumentation durch die Teilnehmer identifiziert. Teilnehmer nannten allgemeine Gründe, die die Techniknutzung fördern bzw. hemmen, sowie Argumente, weshalb ihnen ein Produkt gefällt bzw. nicht gefällt. Diese Gründe und Argumente wurden anhand qualitativer und quantitativer Inhaltsanalysen untersucht. Eine Auswahl der identifizierten Eigenschaften wurde den Teilnehmern in Studie 2 und 3 explizit präsentiert. Die Wichtigkeitseinschätzungen durch unabhängige Ratingskalen wurden mit den Ergebnissen einer Conjoint-Analyse, einer auf dem Kano-Modell der Kundenzufriedenheit basierenden Fragebogentechnik (Kano, Seraku, Takahashi, & Tsuji, 1984), sowie einer Erweiterung der Konstantsummenskala verglichen. Ein Ziel der dritten Studie war es, eine neue Methode zur Messung von Eigenschaftswichtigkeiten einzuführen, die Teilnehmern ermöglicht, Wichtigkeit – unter zeitgleicher Berücksichtigung von Trade-Offs (relative Wichtigkeiten) – direkt auszudrücken. Darüber hinaus wurden Produkte, die mit verschiedenen Werten assoziiert werden (hedonisch vs. utilitaristisch), in die Untersuchung aufgenommen.
Die Vielfalt der identifizierten Eigenschaften verdeutlicht die Relevanz aufgabenbezogener sowie nicht-aufgabenbezogener Aspekte für beide Altersgruppen. Valenzunterschiede hinsichtlich motivierender und demotivierender Gründe der Techniknutzung werden aufgezeigt. Ergebnisse der Kano Methode aus Studie 2 konnten diese Ergebnisse generell bestätigen. Der Conjoint-Analyse zufolge können fast alle ausgewählten Eigenschaften als signifikante Prädiktoren der Wahrscheinlichkeit einer Techniknutzung angenommen werden. Im Allgemeinen scheinen aufgabenbezogene Eigenschaften, insbesondere Ergonomie und Qualität, als bedeutsamer eingeschätzt zu werden. Ein deutlich geringeres Gewicht wird Aspekten wie Ästhetik oder dem Einbezug emotionaler Faktoren (z.B. Freude) beigemessen. Dies wird über alle drei Studien hinweg beobachtet. Die Ergebnisse der dritten Studie legen jedoch den Schluss nahe, dass nicht-aufgabenbezogene Eigenschaften für hedonische Produkte wichtiger sind als für utilitaristische. Hinsichtlich der Altersgruppenunterschiede stellt sich wiederholt heraus, dass Älteren Ergonomie wichtiger ist als Jüngeren, während Jüngeren Qualität wichtiger ist als Älteren. Nur wenn Eigenschaften in Relation zueinander gewichtet werden müssen (relative Wichtigkeit), erscheint Ästhetik älteren Nutzern weniger wichtig zu sein als jüngeren Nutzern. Die neu vorgestellte Methode muss in zukünftigen Untersuchungen validiert werden. Sie lässt aber bereits Potential als Alternative zur Messung von Eigenschaftswichtigkeiten und zur Differenzierung zwischen Nutzergruppen und Produktklassen erkennen.

ZUSAMMENFASSUNG V
Schließlich wurde ein Rahmenmodell eines fortdauernden Nutzungserlebens entwickelt: das ContinUE-Modell (Continuous User Experience). Es veranschaulicht Dynamiken des Nutzungserlebens und diskutiert zeitlich bedingte Veränderungen von Eigenschaftswichtigkeiten, die über den Verlauf eines gesamten Produktlebenszyklus zu betrachten sind.
Zusammenfassend liefert diese Arbeit Beiträge auf theoretischer, empirischer sowie methodologischer Ebene. Es werden praktische Empfehlungen zur Ermittlung von Eigenschaftswichtigkeiten aus Sicht unterschiedlicher Nutzergruppen in frühen Phasen der Produktentwicklung gegeben. Des Weiteren werden erste Anhaltspunkte einer Schwerpunktsetzung für die Gestaltung interaktiver Systeme aus Sicht älterer Nutzer aufgezeigt.
ACKNOWLEDGEMENTS VI
ACKNOWLEDGEMENTS
This work would not have been the same without all the productive discussions I had with numerous people along the way – I regard every answer given and every question raised as a contribution and wish I could thank each and everyone in person.
First and foremost I am indebted to Prof. Dr.-Ing. Blessing for her tremendous amount of support and encouragement, as well as for introducing and welcoming me as a psychologist to the world of engineering design. Sincere thanks go to Prof. Dr. Wandke for his guidance throughout the entire process. He has always been an invaluable source of advice and inspiration and I truly appreciated his genuine interest in my work. Prof. Dr.-Ing. Rötting supervised my research at the Technische Universität Berlin. I am deeply grateful for his continuous support, in particular with respect to the interdisciplinary as well as international nature of this thesis.
The opportunity to conduct this research project under joint supervision of the Technische Universität Berlin and the University of Luxembourg also gave me the opportunity to draw on the expertise of a somewhat greater doctoral committee: I would like to express my profound gratitude to Prof. Dr. Ferring and Prof. Dr.-Ing. Kraft for contributing their time and expertise, as well as to Prof. Dr.-Ing. Meyer for chairing the doctoral committee.
The present project was supported by the German Research Foundation (DFG) and by the National Research Fund Luxembourg (FNR). It was embedded in the DFG Research Training Group prometei – Prospective Design of Human-Technology Interaction. In this context I would like to thank Prof. Dr. Thüring, first spokesman of prometei, who enabled us to work and learn in such an exceptionally inspiring environment. Superb technical and administrative support was provided by Karin Scherrinsky-Pingel, Sandra Widera, and Steffen Hartwig.
I had the privilege to go on this academic journey (not to mention the ones around the world) together with Christian Stößel (my ‘doctoral brother’), Nina Gérard, Sascha Mahlke, Michael Minge, Nele Rußwinkel, Stefanie Huber, Janna Protzak, Johann Habakuk Israel, and Jeronimo Dzaack. Thank you for all the lively discussions – be it on matters of science or on any other aspect of life. You have been wonderful colleagues.
A number of student assistants and interns contributed to this project. Namely I would like to thank Julia Maue, Martin Hecht, Franziska Machens, and Carina Kuhr for their help in conducting the studies. Clearly, without the engaged and committed participation of all study volunteers this work would not have been possible – thank you!
With regards to actually writing this dissertation, I would like to thank Jakob Lehr for helping me with the visual design, and Ragna Runkel, Nina Gérard, Martin Hecht, Richard Holmes, and Roland Pohlmeyer for their valuable comments and suggestions when proofreading my thesis.
ACKNOWLEDGEMENTS VII
Needless to say, I also owe this work to the incredible support I received outside universities. Thank you, my year-long friends and housemates, Ragna, Adrienne, Andie, Sarah, and Mara, simply for being there ... and for being who you are my parents for always fostering my curiosity and education – be it inside or outside our home my partner, Jakob Lehr, for your loving support and for all the joy you bring to even the toughest of days: thank you for every soup and every chuckle.
TABLE OF CONTENTS
ABSTRACT .............................................................................................................................. I
ZUSAMMENFASSUNG ........................................................................................................... III
ACKNOWLEDGEMENTS ....................................................................................................... VI
TABLE OF CONTENTS ...................................................................................................... VIII
ABBREVIATIONS ................................................................................................................. XII
1 INTRODUCTION .............................................................................................................. 1
1.1 Research Background .......................................................................................................................... 1
1.2 Research Problems ............................................................................................................................... 2
1.3 Research Aims ...................................................................................................................................... 3
1.4 Research Questions and Contributions ............................................................................................ 4
1.5 Overview of Content of Thesis.......................................................................................................... 4
2 THEORETICAL AND METHODOLOGICAL BACKGROUND ................................................. 6
2.1 Product Development ......................................................................................................................... 6
2.1.1 Systematic Engineering Design Process .......................................................................... 6
2.1.2 User-Centered Design of Interactive Technologies ....................................................... 8
2.1.3 Attributes from a User’s Perspective .............................................................................. 10
2.1.4 Early Phases in Product Development .......................................................................... 14
2.1.5 User Integration ................................................................................................................. 20
2.2 Technology Adoption and Acceptance ........................................................................................... 24
2.3 Attributes of Interactive Technologies ........................................................................................... 29
2.4 Gerontechnology ................................................................................................................................ 35
2.4.1 Technology Adoption and Acceptance – Older Adults .............................................. 36
2.4.2 Age-Related Changes and Design Implications ............................................................ 38
2.4.3 Attributes of Interactive Technologies – Older Adults ............................................... 42
2.5 Methods to Support User-Centered Design .................................................................................. 45
2.5.1 Method Classifications ...................................................................................................... 46
2.5.2 Attribute Identification ..................................................................................................... 51
2.5.3 Attribute Importance ........................................................................................................ 54
3 RESEARCH APPROACH .................................................................................................. 62
3.1 Aims ..................................................................................................................................................... 62
3.2 Specification of Research Approach ............................................................................................... 63
TABLE OF CONTENTS IX
4 STUDY 1 :: IDENTIFYING ATTRIBUTES :: SELF-DOCUMENTATION AND CONTENT
ANALYSIS ............................................................................................................................. 68
4.1 Background ......................................................................................................................................... 68
4.2 Method ................................................................................................................................................. 71
4.2.1 Participants ......................................................................................................................... 71
4.2.2 Material ............................................................................................................................... 72
4.2.3 Procedure ............................................................................................................................ 73
4.2.4 Procedure – Analysis ........................................................................................................ 74
4.2.5 Qualitative Content Analysis [and Results] ................................................................... 75
4.2.6 Quantitative Content Analysis ......................................................................................... 82
4.3 Results .................................................................................................................................................. 83
4.3.1 Additional Measure ........................................................................................................... 83
4.3.2 General Reasons ................................................................................................................ 83
4.3.3 Product-Specific Statements ............................................................................................ 87
4.3.4 Products .............................................................................................................................. 89
4.4 Discussion of Empirical Results ...................................................................................................... 91
4.5 Methodological Reflections .............................................................................................................. 96
4.5.1 Study Design ...................................................................................................................... 96
4.5.2 Experience & Feedback ................................................................................................... 97
4.5.3 Limitations .......................................................................................................................... 98
4.5.4 Practical Implications ........................................................................................................ 98
5 STUDY 2 :: WEIGHTING ATTRIBUTES :: KANO AND CONJOINT ANALYSIS ................... 100
5.1 Background ....................................................................................................................................... 100
5.2 Method ............................................................................................................................................... 105
5.2.1 Participants ....................................................................................................................... 105
5.2.2 Material ............................................................................................................................. 105
5.2.3 Procedure .......................................................................................................................... 112
5.2.4 Analysis ............................................................................................................................. 112
5.3 Results ................................................................................................................................................ 115
5.3.1 Additional Measures ....................................................................................................... 115
5.3.2 Conjoint Analysis ............................................................................................................ 117
5.3.3 Kano Method ................................................................................................................... 119
5.3.4 Comparison of Conjoint and Kano Analyses ............................................................. 122
5.4 Discussion of Empirical Results .................................................................................................... 124
5.5 Methodological Reflections ............................................................................................................ 128
5.5.1 Study Design .................................................................................................................... 128
5.5.2 Experience & Feedback ................................................................................................. 131
5.5.3 Limitations ........................................................................................................................ 131
5.5.4 Practical Implications ...................................................................................................... 132
TABLE OF CONTENTS X
6 STUDY 3 :: WEIGHTING ATTRIBUTES :: COLORING THE BLACK BOX .......................... 135
6.1 Background ....................................................................................................................................... 135
6.2 Pre-Study :: Selection of Products ................................................................................................. 140
6.2.1 Method .............................................................................................................................. 140
6.2.2 Results ............................................................................................................................... 141
6.3 Method [Main Study] ....................................................................................................................... 142
6.3.1 Participants ....................................................................................................................... 142
6.3.2 Material ............................................................................................................................. 143
6.3.3 Procedure .......................................................................................................................... 148
6.3.4 Analysis ............................................................................................................................. 150
6.4 Results ................................................................................................................................................ 151
6.4.1 Additional Measures ....................................................................................................... 153
6.4.2 Importance Indices ......................................................................................................... 153
6.4.3 Construction Task ........................................................................................................... 156
6.4.4 Control Variables ............................................................................................................. 158
6.4.5 Evaluation of Task Demands ........................................................................................ 161
6.4.6 Comparison with Study 2 [Conjoint Analysis] ............................................................ 161
6.5 Discussion of Empirical Results .................................................................................................... 162
6.5.1 Age Differences ............................................................................................................... 162
6.5.2 Product Differences ........................................................................................................ 164
6.5.3 Note on Functionality ..................................................................................................... 166
6.6 Methodological Reflections ............................................................................................................ 167
6.6.1 Study Design .................................................................................................................... 167
6.6.2 Experience & Feedback ................................................................................................. 170
6.6.3 Limitations ........................................................................................................................ 170
6.6.4 Practical Implications ...................................................................................................... 171
7 CONTINUE :: CONTINUOUS USER EXPERIENCE ........................................................ 174
7.1 Diversity of Attributes and Dynamics of User Experience ....................................................... 174
7.2 User Experience Lifecycle Model ContinUE [Continuous User Experience] ....................... 176
7.3 Implications for Engineering Design ............................................................................................ 180
8 GENERAL DISCUSSION ................................................................................................ 182
8.1 Integration of Empirical Results .................................................................................................... 182
8.2 Integration of Methodological Reflections ................................................................................... 188
8.3 Outlook .............................................................................................................................................. 191
REFERENCES ..................................................................................................................... 194
LIST OF FIGURES ................................................................................................................ 213
LIST OF TABLES ................................................................................................................. 215
TABLE OF CONTENTS XI
APPENDIX .......................................................................................................................... 218
A.1 Theoretical and Methodological Background .............................................................................. 218
A.2 Study 1 :: Identifying Attributes :: Self-Documentation and Content Analysis ...................... 220
A.2.1 Instructions ...................................................................................................................... 220
A.2.2 Detailed Results ............................................................................................................... 220
A.2.3 Feedback ........................................................................................................................... 231
A.3 Study 2 :: Weighting Attributes :: Kano and Conjoint Analysis ................................................ 232
A.3.1 Instructions ...................................................................................................................... 232
A.3.2 Detailed Results ............................................................................................................... 236
A.3.3 Feedback ........................................................................................................................... 243
A.4 Study 3 :: Weighting Attributes :: Coloring The Black Box ....................................................... 243
A.4.1 Pre-study ........................................................................................................................... 243
A.4.2 Instructions [Main Study] ............................................................................................... 245
A.4.3 Detailed Results ............................................................................................................... 250
A.4.4 Feedback ........................................................................................................................... 255
ABBREVIATIONS XII
ABBREVIATIONS
GENERAL A Attitude BI Behavioral Intention HCI Human-Computer Interaction QFD Quality Function Deployment SSI Self-Stated Importance TAM Technology Acceptance Model TPB Theory of Planned Behavior TRA Theory of Reasoned Action UTAUT Unified Theory of Acceptance and Use of Technology UX User Experience
STUDIES Y Young Adults O Older Adults Y_O Young and Older Adults
RQ Research Question H Hypothesis
ATTRIBUTES US Usefulness FU Functionality US_FU Usefulness and Functionality EA Ease of Use ER Ergonomics QU Quality AE Aesthetics EM Emotional Involvement U-P Match User-Product CO Costs RE Rest
KANO MODEL OF CUSTOMER SATISFACTION M Must-Be Requirement O One-Dimensional Requirement A Attractive Requirement I Indifferent Requirement R Reversed Requirement Q Questionable Requirement CS Coefficient of Satisfaction CD Coefficient of Dissatisfaction
1 INTRODUCTION
1.1 RESEARCH BACKGROUND
If you were to have one wish regarding the design of an interactive product come true – let’s say you could improve your mobile phone – what would you like to change? Increase the battery life? Add more functionality? Improve the looks? Or rather the usability of the device?
Certainly, each attribute is important, but not to the same degree. Moreover, different people have different priorities. Would your grandmother have made the same choice as you or would she have favored a different attribute?
“Design is a series of tradeoffs […] The design choices depend on the technology being used, the class of users, and the goals of the design” (Norman, 1986, p. 56).
It was the aim of this thesis to identify attribute importance with respect to technology adoption in early product development – exemplified by interactive technologies and age.
Attributes can be defined as aspects of a product itself or of its use, which form the basis for comparing product alternatives (Grunert, 1989). The subjective perception of attributes by a user shapes the judgment of appeal or – in general – the user’s attitude toward the product. In turn, it also affects the behavioral consequences of the user, e.g. the likelihood to use the product (technology adoption) (Blackwell, Miniard, & Engel, 2006; Davis, 1989; Davis, Bagozzi, & Warshaw, 1989; Hassenzahl, 2001, 2003; Hassenzahl, Platz, Burmester, & Lehner, 2000). The more an attribute’s perception is able to influence a user’s attitude toward the product, the more important the respective attribute is thought to be (attribute importance) (Jaccard, Brinberg, & Ackerman, 1986). Mahlke and Thüring (2007) suggest that the appraisal of a system is influenced by different components of user experience: the perception of instrumental, as well as of non-instrumental attributes and emotional consequences. In order to design products that appeal to potential users in a way that furthers technology adoption, it is crucial to know which attributes are important to the user and how these might differ in their respective importance.
Systematic approaches to engineering design generally start with a phase of strategic planning (Archer, 1971; Pahl, Beitz, Feldhusen, & Grote, 2007; Ulrich & Eppinger, 2008). Knowledge of attribute importance from a user’s perspective can inform and guide the strategic direction of a user-centered product development process. For example, it can play an essential part in deciding
1 INTRODUCTION 2
on the allocation of limited resources (Elliott, Swain, & Wright, 2003; Ulrich & Eppinger, 2008) but also in supporting the specification of requirements and is therefore central to evaluating solution alternatives in general (Roozenburg & Eekels, 1995).
A design specification is a list of requirements that details the intended objectives and properties of a design solution in early product development and thereby affects the entire development process and consequently the success of the solution (Pahl, et al., 2007). It is recommended that the end-user should receive a ‘voice’ in order to state which attributes (what) are perceived to be important already in the preparation of the design specification. The translation of such attributes from a user’s perspective into engineering characteristics (how) and eventually into requirements that are being considered in the design specification is a valuable approach of quality management in product development, which is likely to increase acceptance of the design solution by the users (Clausing, 1994; Griffin & Hauser, 1993; Hauser & Clausing, 1988; Roozenburg & Eekels, 1995; Wheelwright & Clark, 1992). In particular when designing interactive systems, an early and continued user involvement should be pursued (Gould & Lewis, 1985; ISO, 2010; Kujala, 2003).
As mentioned previously, attribute importance is likely to vary between user groups. Knowing these differences can provide guidance with respect to strategic planning when expanding the range of target groups in order to meet or even exceed the expectations of a new user group, for example of older adults.
The population of older adults is increasing world-wide (United Nations, 2009). At the same time, a dissemination of interactive technologies into our everyday lives can be observed (Charness & Boot, 2009). As a consequence, there is a growing need to design interactive products in such a way that older users are able and willing to use them. Currently, older adults still lag behind their younger counterparts with respect to adopting interactive technologies. Even though this gap has been decreasing in recent years (Czaja, Lee, Nair, & Sharit, 2008; PEW, 2009) it is unlikely to disappear completely (Charness & Boot, 2009).
The user group of older adults is not only an important group that increases in size, but also one that poses specific challenges to designers due to a number of age-related differences affecting design implications (Fisk, Rogers, Charness, Czaja, & Sharit, 2004; Schieber, 2003). In this line, much work has been carried out regarding instrumental aspects of an interaction, but little is known about the appreciation of non-instrumental qualities by older adults (Hirsch et al., 2000).
1.2 RESEARCH PROBLEMS
As early as 1984, Garvin proposed to study the relative importance of various attributes (e.g. performance, features, reliability, aesthetics) and the resulting effect on behavior as a direction for

1 INTRODUCTION 3
future research on product quality. Unfortunately, to this date, insights are only fragmentary with respect to the design and adoption of interactive technologies.
Despite an abundance of work on technology adoption and acceptance (K. Chen & Chan, 2011; Davis, et al., 1989; King & He, 2006; Venkatesh, Morris, Davis, & Davis, 2003), applying research findings to system design has proven to be difficult because the concrete attributes that could have helped guide the design process had not been taken into consideration (Benbasat & Barki, 2007). Most research also tends to focus primarily on instrumental aspects of an interaction (e.g. usability) and might thereby oversee other – non-instrumental – attributes that are also relevant to the user. This bias is especially pronounced in the design for the elderly.
“Using appropriate human-centred methods can reduce the risk of the product failing to meet stakeholder requirements or being rejected by its users” (ISO, 2010, p. 4). Unfortunately, in product development it is not always the case that adequate user-centered methods are used (Reinicke, 2004; Schmidt, 1996). For example, importance values are frequently derived from simple rating scales separately for each attribute and computed to relative weights afterwards (e.g. Elliott, et al., 2003). However, this does not truly account for trade-offs between attributes. Moreover, it is left open, whether attribute importance should be obtained externally by involving real users, or internally on the basis of team consensus (Hauser & Clausing, 1988; Roozenburg & Eekels, 1995; Ulrich & Eppinger, 2008). However, in order to obtain information on the user’s priorities, an active involvement of users is irreplaceable. Value-based design decisions for an identifiable group of users should not simply be decreed by experts or based on internal team consensus, in terms of a ‘design for users’ approach. Instead, a ‘design for users with users’ seems more appropriate (Eason, 1995).
1.3 RESEARCH AIMS
The thesis pursued two research aims.
Firstly, the empirical aim was to identify relevant attributes of interactive technologies with regards to technology adoption and to assess their importance. It was of particular interest to study what is important to older adults and whether these priorities differ from those of a younger user group.
Secondly, as a variety of methods have been applied in the course of this thesis, a methodological objective was to critically reflect on the applicability of different assessment methods of attribute importance for early product development. Appropriate methods should take attribute trade-offs into account already during assessment, involve users directly, preferably in an engaging way, and be able to differentiate between different user groups.
1 INTRODUCTION 4
1.4 RESEARCH QUESTIONS AND CONTRIBUTIONS
The following research questions were addressed in this thesis:
What attributes are relevant with respect to technology adoption? (Study 1)
Do attributes differ in importance between age groups? (Studies 1, 2, 3)
Are attributes equally important for technology adoption as for rejection? (Studies 1, 2)
Do attributes differ in importance between products? (Study 3)
What user-centered methods are suitable to assess attribute importance in early product development? (Studies 1, 2, 3)
Is there an efficient and engaging way to assess relative attribute importance directly? (Study 3)
These research questions were the starting points for this dissertation resulting in contributions on a number of levels:
EMPIRICAL. Three studies were conducted to identify attribute importance across age groups and between products.
METHODOLOGICAL. Different methods were applied, compared, extended, and developed.
THEORETICAL. A conceptual framework on ‘Continuous User Experience’ was introduced. It extends existing frameworks of user experience by a temporal perspective that takes the entire product lifecycle into consideration.
1.5 OVERVIEW OF CONTENT OF THESIS
Chapter 2 provides the theoretical as well as methodological background for this dissertation. It is divided into three main blocks. First (Section 2.1), the topic of attribute importance will be embedded in general frameworks of product development from an engineering design perspective as well as from a user-centered perspective with respect to the design of interactive systems. In particular, the relevance of user integration already in early phases of product development will be emphasized. Section 2.2, 2.3, and 2.4 are devoted to the empirical research aim. Upon a review of existing models on technology adoption, potentially relevant attributes of interactive technologies will be discussed, highlighting the joint consideration of instrumental and non-instrumental attributes. Lastly, specifics of an older user group will be touched on. The third block (Section 2.5) relates to the methodological focus of the thesis. In a critical review of user-centered methods for the identification of attributes and the accordant importance values the research approach will be prepared.
1 INTRODUCTION 5
Chapter 3 describes the research approach conducted in this thesis.
Chapters 4, 5, and 6 present the empirical studies. Study 1 was a field study with a self-documentation task to identify relevant attributes of interactive technologies through structured qualitative content analyses. Subsequent quantitative content analyses served as first indicators of attribute importance. The attributes identified in study 1 were further used in studies 2 and 3. Study 2 investigated attribute importance using different methodological approaches, i.e. a full-profile conjoint analysis, the Kano method, and importance ratings for each attribute separately. Again, two age groups were compared. Study 3 introduced a novel method to assess relative attribute importance. It accounted for trade-offs but also allowed a direct rating by the users. Age group differences from study 2 could be generally confirmed. Furthermore, the method’s sensitivity allowed a differentiation between different product classes. Practical recommendations for method combinations are given.
Chapter 7 proposes a conceptual model of continuous user experience [ContinUE].
Chapter 8 integrates and critically discusses the findings of the three studies, summarizes the thesis’ contributions, and offers an outlook for future empirical work as well as for practical applications.
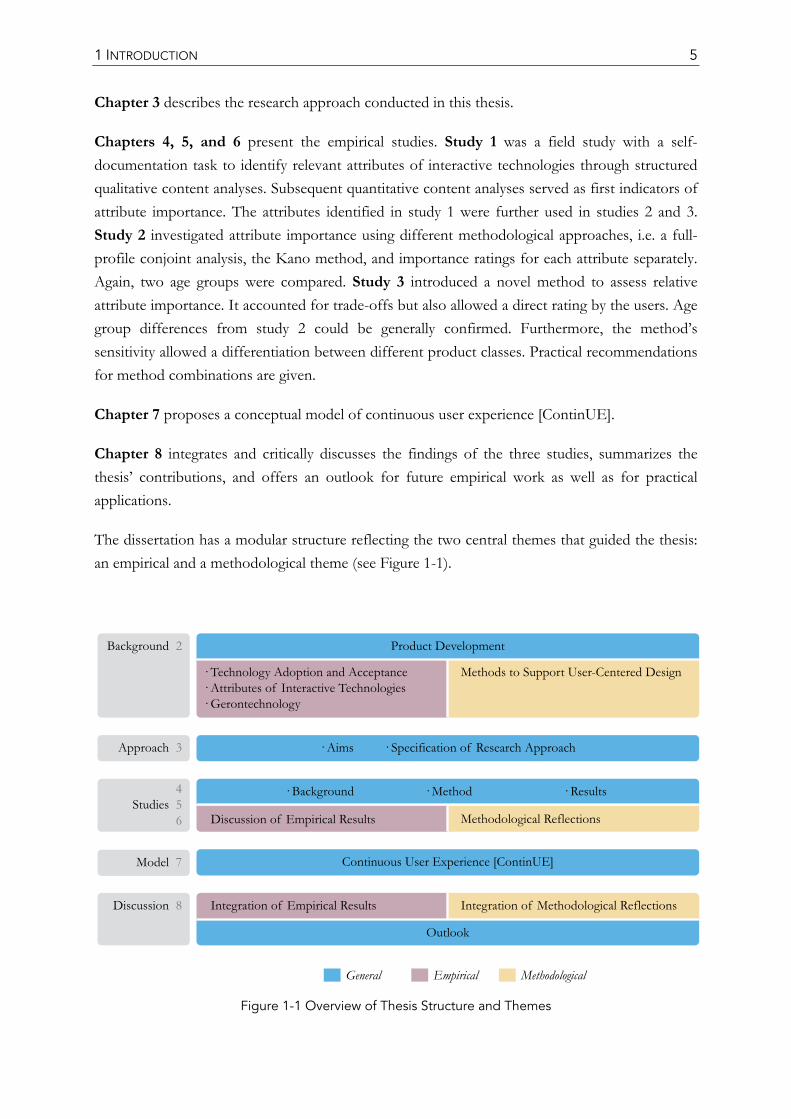
The dissertation has a modular structure reflecting the two central themes that guided the thesis: an empirical and a methodological theme (see Figure 1-1).
Figure 1-1 Overview of Thesis Structure and Themes
2 THEORETICAL AND METHODOLOGICAL BACKGROUND
2.1 PRODUCT DEVELOPMENT
This section will present general frameworks of engineering design and user-centered design of interactive systems (2.1.1 and 2.1.2). After a brief introduction to and definition of the term ‘attributes’ (2.1.3), aspects of the early stages in product development (2.1.4) will be outlined, i.e. strategic planning, the design specification, weighting of criteria in evaluations along the development process, and the House of Quality as an example of a user-centered approach to translate attributes from a user’s perspective into engineering characteristics. The section on product development will conclude with a differentiation of user integration (2.1.5).
2.1.1 SYSTEMATIC ENGINEERING DESIGN PROCESS
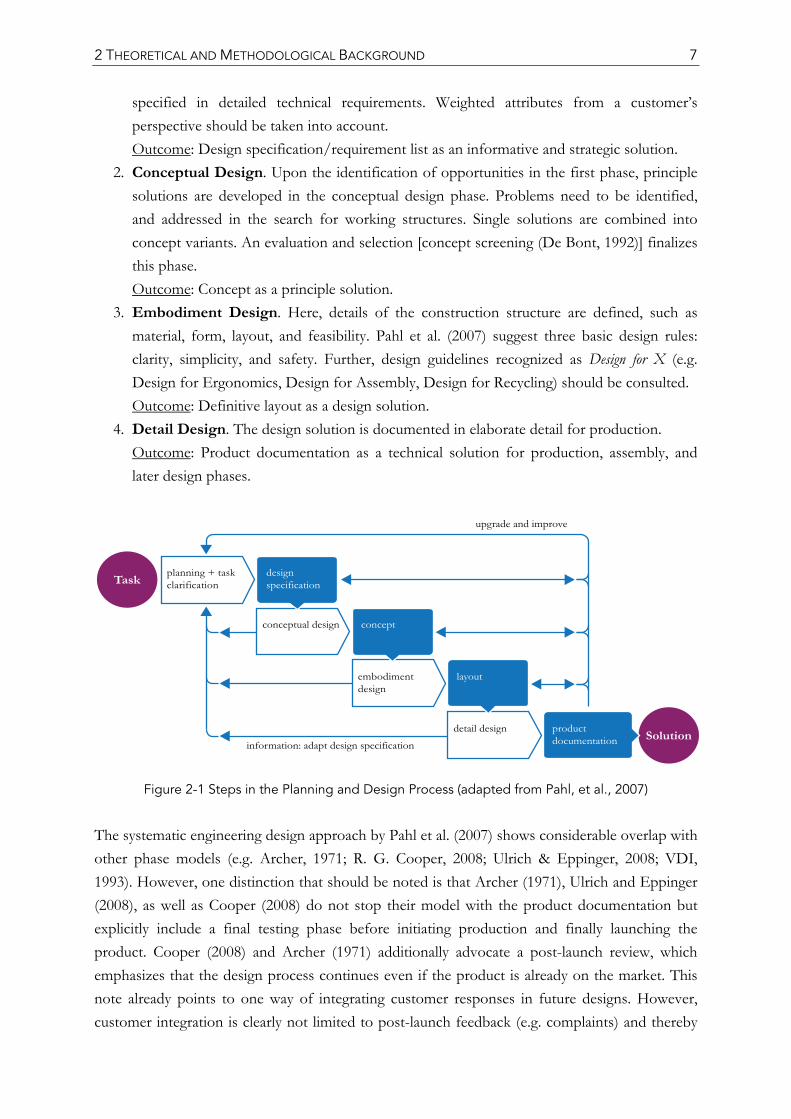
The translation of a vague idea into a concrete product can be facilitated and even enhanced by a systematic approach to design (Pahl, et al., 2007). Guidance through different phases of the development process with deliverables at the end of each phase (Pahl, et al., 2007; VDI, 1993) will improve the quality of the end result while reducing development time and cost (Clausing, 1994; Griffin & Hauser, 1993; VDI, 1994). Phase outcomes (e.g. design specification, concept, layout) tailor possible solutions and requirements that have been generated, explored, tested, and selected in one stage into actionable starting points for the next phase (see Figure 2-1). Systematic product development processes are, however, not to be seen as rigid sequential models with ‘points of no return’. Iterative steps are included (Roozenburg & Eekels, 1995) and a flexible use of the schemes suggested (R. G. Cooper, 2008). Focusing on the process instead of merely on the product appears to be a promising path to successful design (Blessing, 1994).
General phases of a product development process will be illustrated by the wide-spread approach proposed by Pahl et al. (2007). It is divided into four major phases:
1. Planning and Task Clarification. Three ‘stimuli’ can affect product plans: the market (e.g. competing products, new target groups), the environment (e.g. new technologies), and the company itself (e.g. internal research results, new production methods). After a situation analysis including all three stimuli, product ideas are generated and those to be further developed are selected and elaborated to a product proposal. This, in turn, needs to be
2 THEORETICAL AND METHODOLOGICAL BACKGROUND 7
specified in detailed technical requirements. Weighted attributes from a customer’s perspective should be taken into account.
Outcome: Design specification/requirement list as an informative and strategic solution. 2. Conceptual Design. Upon the identification of opportunities in the first phase, principle
solutions are developed in the conceptual design phase. Problems need to be identified, and addressed in the search for working structures. Single solutions are combined into concept variants. An evaluation and selection [concept screening (De Bont, 1992)] finalizes this phase.
Outcome: Concept as a principle solution. 3. Embodiment Design. Here, details of the construction structure are defined, such as
material, form, layout, and feasibility. Pahl et al. (2007) suggest three basic design rules: clarity, simplicity, and safety. Further, design guidelines recognized as Design for X (e.g. Design for Ergonomics, Design for Assembly, Design for Recycling) should be consulted.
Outcome: Definitive layout as a design solution. 4. Detail Design. The design solution is documented in elaborate detail for production. Outcome: Product documentation as a technical solution for production, assembly, and
later design phases.
Figure 2-1 Steps in the Planning and Design Process (adapted from Pahl, et al., 2007)
The systematic engineering design approach by Pahl et al. (2007) shows considerable overlap with other phase models (e.g. Archer, 1971; R. G. Cooper, 2008; Ulrich & Eppinger, 2008; VDI, 1993). However, one distinction that should be noted is that Archer (1971), Ulrich and Eppinger (2008), as well as Cooper (2008) do not stop their model with the product documentation but explicitly include a final testing phase before initiating production and finally launching the product. Cooper (2008) and Archer (1971) additionally advocate a post-launch review, which emphasizes that the design process continues even if the product is already on the market. This note already points to one way of integrating customer responses in future designs. However, customer integration is clearly not limited to post-launch feedback (e.g. complaints) and thereby
2 THEORETICAL AND METHODOLOGICAL BACKGROUND 8
to a stage when it is too late to make changes. On the contrary, as will be shown, customers should be involved over the entire product lifecycle and in particular in the crucial front-end phases of planning. This holds especially when the customer is not merely a passive consumer, but rather an active user. For the design of interactive systems, early and continued involvement of users cannot be overstated (Gould & Lewis, 1985).
2.1.2 USER-CENTERED DESIGN OF INTERACTIVE TECHNOLOGIES
With the increasing presence of technology in our lives, the use of interactive systems is not a task for specialists anymore. Thus, increased attention needs to be placed on the development of these systems with a user-centered design approach. An interactive system is defined as a “combination of hardware, software and/or services that receives input from, and communicates output to, users” (ISO, 2010, p. 2). The design of interactive systems can be seen as a special case of product development with special standards and guidelines for user interface design, and with a distinct need of multidisciplinary cooperation. In this thesis, perspectives from the Human-Computer Interaction (HCI) community shall be embedded in the broader view of engineering design.
The international standard ISO 9241-210 (2010) on human-centered design for interactive systems, recently replaced the wide-spread ISO 13407 (1999). The standard is an internationally agreed recommendation for the design of interactive systems. A number of stakeholders are involved in a design process and in the subsequent distribution and usage (e.g. retailers, caregivers). For this reason, the term ‘human-centered’ was favored over ‘user-centered’ in the ISO definition. However, this thesis focuses exclusively on end-users and will therefore use the more specific expression of user-centered.
User-centered design approaches result in more usable systems. These, in turn, tend to be more successful regarding adoption, acceptance and commitment as well as with respect to commercial benefits (Bias & Mayhew, 2005; Clausing, 1994; ISO, 2010; Maguire, 2001; Shackel, 1991): if users are able to understand and use a system, less training and support costs will be necessary. The risks of product failure and liability are decreased as a result of ongoing evaluations throughout the design process and the knowledge of user requirements. As a result, the risk of not meeting the user’s expectations is minimized.
Principles of user-centered design include (Gould & Lewis, 1985; ISO, 2010):
basis for design proposals is an explicit understanding of the context of use (user, task, environment)
iterative loops
user involvement throughout the entire process (early and continual focus on users)
user-centered evaluations
2 THEORETICAL AND METHODOLOGICAL BACKGROUND 9
empirical measurement
a design that meets the requirements of an entire user experience
multidisciplinary expertise.
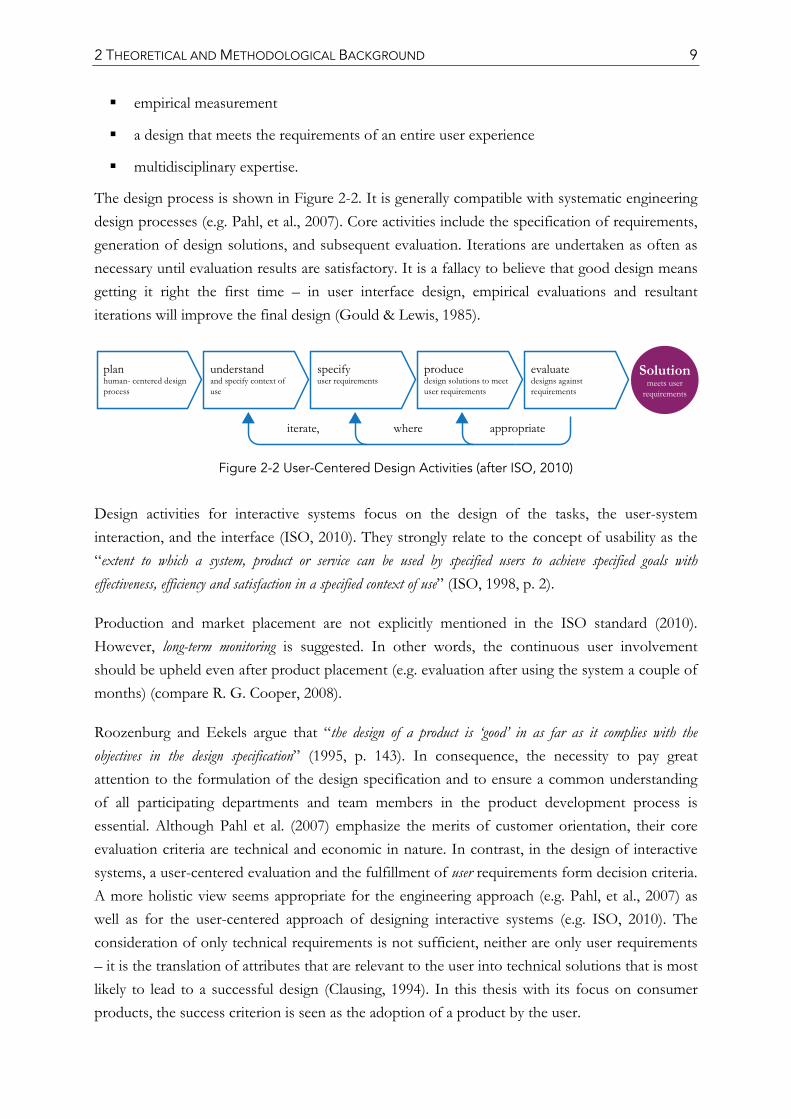
The design process is shown in Figure 2-2. It is generally compatible with systematic engineering design processes (e.g. Pahl, et al., 2007). Core activities include the specification of requirements, generation of design solutions, and subsequent evaluation. Iterations are undertaken as often as necessary until evaluation results are satisfactory. It is a fallacy to believe that good design means getting it right the first time – in user interface design, empirical evaluations and resultant iterations will improve the final design (Gould & Lewis, 1985).
Figure 2-2 User-Centered Design Activities (after ISO, 2010)
Design activities for interactive systems focus on the design of the tasks, the user-system interaction, and the interface (ISO, 2010). They strongly relate to the concept of usability as the “extent to which a system, product or service can be used by specified users to achieve specified goals with effectiveness, efficiency and satisfaction in a specified context of use” (ISO, 1998, p. 2).
Production and market placement are not explicitly mentioned in the ISO standard (2010). However, long-term monitoring is suggested. In other words, the continuous user involvement should be upheld even after product placement (e.g. evaluation after using the system a couple of months) (compare R. G. Cooper, 2008).
Roozenburg and Eekels argue that “the design of a product is ‘good’ in as far as it complies with the objectives in the design specification” (1995, p. 143). In consequence, the necessity to pay great attention to the formulation of the design specification and to ensure a common understanding of all participating departments and team members in the product development process is essential. Although Pahl et al. (2007) emphasize the merits of customer orientation, their core evaluation criteria are technical and economic in nature. In contrast, in the design of interactive systems, a user-centered evaluation and the fulfillment of user requirements form decision criteria. A more holistic view seems appropriate for the engineering approach (e.g. Pahl, et al., 2007) as well as for the user-centered approach of designing interactive systems (e.g. ISO, 2010). The consideration of only technical requirements is not sufficient, neither are only user requirements – it is the translation of attributes that are relevant to the user into technical solutions that is most likely to lead to a successful design (Clausing, 1994). In this thesis with its focus on consumer products, the success criterion is seen as the adoption of a product by the user.
2 THEORETICAL AND METHODOLOGICAL BACKGROUND 10
Product development is not an end in itself, it is rather a process to create and offer a product (system or service) to users that will add value to their daily lives. For this, it is necessary to know what users want and whether the design solution that is being developed will comply with their preferences, consequently leading to adoption. Regarding user expectations, the users themselves are the experts, and not the engineers. It is therefore only reasonable to listen to what they have to say. Meeting or even exceeding users’ expectations (ISO, 2005) will increase the acceptance of the final product, while reducing development time and costs (Clausing, 1994).
2.1.3 ATTRIBUTES FROM A USER’S PERSPECTIVE
Unfortunately, there is no unequivocal use of terminology across disciplines to describe what users want. Concepts such as needs, requirements, attributes, wants, benefits, characteristics, associations, preferences, perceptions, desires, expectations, qualities, demands, and wishes have been used interchangeably (see also Clausing, 1994; Schmidt, 1996). All of them refer to perceived product qualities from a user’s point of view that influence the evaluation of the product and consequently the likelihood of technology acceptance (see also Figure 2-8, p. 30). For clarity, these qualities will be referred to as attributes in this thesis.
Grunert’s (1989) definition of attributes will be used:
“An attribute can be defined as any aspect of the product itself or its use that can be used to compare product alternatives.” (Grunert, 1989, p. 229)
In line with a user-centered orientation, attributes are regarded in this thesis as the evaluative criteria of a product (or its use) from a user’s perspective.
The term ‘attribute’ is also generally favored in consumer research (Hauser & Clausing, 1988; Roozenburg & Eekels, 1995). It incorporates what users need as well as what they simply want, but does not conflict with associated meanings in other disciplines. Most importantly, the term does not coincide with the meaning of requirements in engineering design, or with the meaning of psychological needs as described below.
In product development, requirements have a distinct meaning (Almefelt, 2005; Hull, Jackson, & Dick, 2002): documented in the design specification, a requirement is a condition or capability needed in order to meet an objective or a mandatory standard (IEEE, 1998). Attributes that are requested by users can be used as a starting point for a design specification, however, might as well be discarded if they are not sufficiently important or relevant for competitive advantages (for further details regarding a design specification see p. 15).
In the psychology literature, needs are regarded as the driving forces of human behavior. For example, Maslow (1954) proposed five hierarchically distinct universal needs: physiological needs, safety needs, belongingness needs, esteem needs, and the need for self-actualization. People are
2 THEORETICAL AND METHODOLOGICAL BACKGROUND 11
motivated to satisfy these needs. The more recent self-determination theory highlights competence, autonomy, and relatedness (Ryan & Deci, 2000). Although there have been some research efforts lately to identify (Sheldon, Elliot, Kim, & Kasser, 2001) and design interactive technologies for these psychological needs (Hassenzahl, Diefenbach, & Göritz, 2010), here, the focus lies not on the question of why people use technology, but rather on what they expect regarding the attributes of a product. This is an essential source of information to generate appropriate design solutions that will enhance the likelihood of system adoption and acceptance (Davis, et al., 1989; Dillon & Morris, 1996; Shackel, 1991; Venkatesh, et al., 2003).
Ericson (2007) proposes the following sequence for a (psychological-) need-based approach to product development:
needs > ideas > requirements > products Attributes can be located in this sequence between the identification of psychological needs and the definition of requirements as follows:
needs > ideas > attributes > requirements > products
Attributes differ in their hierarchical structure. Griffin and Hauser (1993) elaborate that primary attributes are strategic. Knowledge of primary attributes helps the design team to decide on a strategic direction. Secondary attributes are tactical, giving a more defined indication of what has to be fulfilled in order to address the primary attribute. Tertiary attributes are rather concrete and indicate possible starting points for appropriate technical metrics. They are also called operational. Hauser and Clausing (1988) provide an example of different hierarchical attributes∗ for a car door – a primary attribute could be ‘good operation and use’, the secondary level could include ‘easy to open and close door’, and finally on a tertiary level, attributes such as ‘easy to close door from outside’ are detailed.
Such a hierarchy seems to not only facilitate requirement engineering but can also be related to a user’s product evaluation (De Bont, 1992). In his model of hierarchical information integration, Louviere (1984) suggests that in complex multi-attribute judgments, people might structure attributes into bundles of lower-level attributes and then evaluate these combinations in terms of cluster judgments. The final overall judgment of a product is a result of the intermediate cluster evaluations. “Such grouping into sets represents a cognitive simplification strategy and would enable individuals to consider a larger set of attributes than might be possible if he/she had to deal with all of them simultaneously”(Louviere, 1984, p. 148).
However, not all attributes are equally important to the user. Thus, the next step after identifying attributes and bringing them into a hierarchal order is to assign attribute weights that account for each attribute’s contribution (relative importance) to overall judgment (Ulrich & Eppinger, 2008).
∗ Hauser and Clausing (1988) use the term ‘customer attributes’, which is avoided here as this might be misunderstood as ‘attributes of the customer’. The simple expression ‘attributes’ will be used in this thesis.
2 THEORETICAL AND METHODOLOGICAL BACKGROUND 12
The subjective importance judgment combined with the perceived or anticipated level of attribute fulfillment in a product shape a user’s attitude toward a product.
In social psychology, overall evaluative judgments are called attitudes (Fishbein, 1963; Fishbein & Ajzen, 1975). They are the general positive or negative response to a given object (Fishbein & Ajzen, 1975), i.e. whether the object is liked or disliked. Attitudes influence behavioral intentions and subsequently behavior itself (Fishbein & Ajzen, 1975):
beliefs (about attributes) > attitude > intention > behavior
“Whereas attitude refers to a person’s favorable or unfavorable evaluation of an object, beliefs represent the information he has about the object. Specifically, a belief links an object to some attribute” (Fishbein & Ajzen, 1975, p. 12). Consequently, overt behavior is influenced by the trilogy of cognition (beliefs), affect (attitude), and conation (behavioral intentions) (Fishbein & Ajzen, 1975).
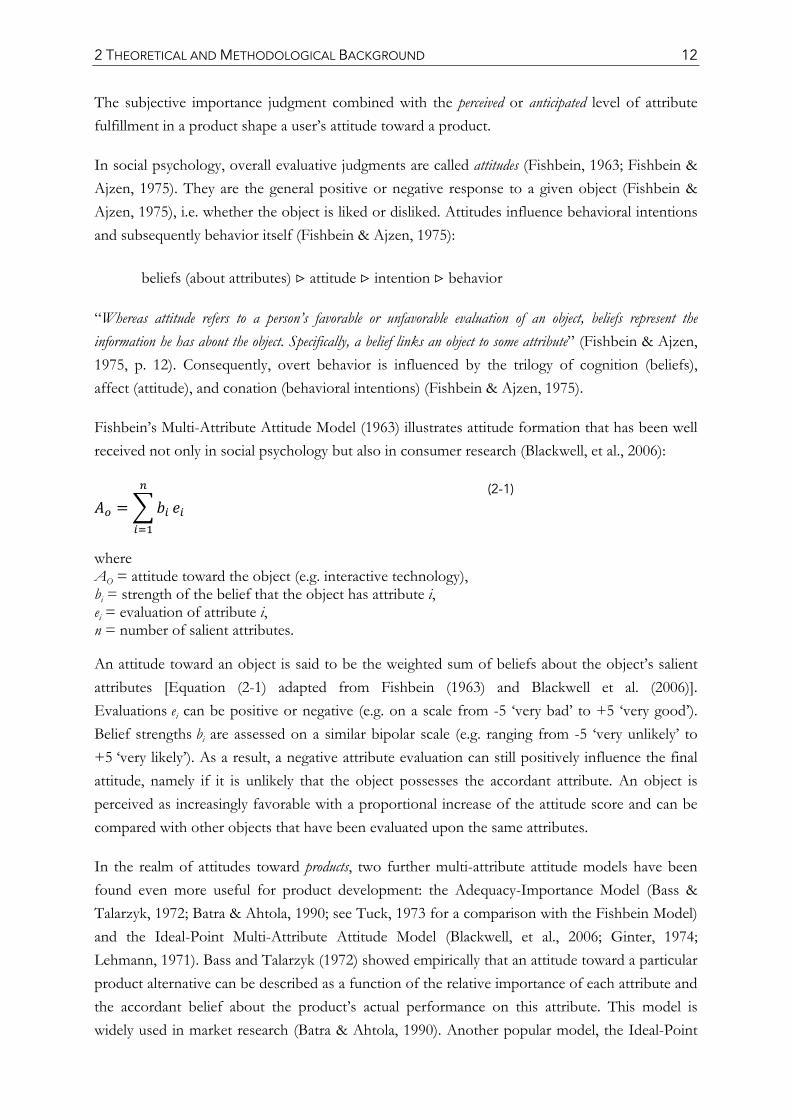
Fishbein’s Multi-Attribute Attitude Model (1963) illustrates attitude formation that has been well received not only in social psychology but also in consumer research (Blackwell, et al., 2006):
(2-1)
where AO = attitude toward the object (e.g. interactive technology), bi = strength of the belief that the object has attribute i, ei = evaluation of attribute i, n = number of salient attributes.
An attitude toward an object is said to be the weighted sum of beliefs about the object’s salient attributes [Equation (2-1) adapted from Fishbein (1963) and Blackwell et al. (2006)]. Evaluations ei can be positive or negative (e.g. on a scale from -5 ‘very bad’ to +5 ‘very good’). Belief strengths bi are assessed on a similar bipolar scale (e.g. ranging from -5 ‘very unlikely’ to +5 ‘very likely’). As a result, a negative attribute evaluation can still positively influence the final attitude, namely if it is unlikely that the object possesses the accordant attribute. An object is perceived as increasingly favorable with a proportional increase of the attitude score and can be compared with other objects that have been evaluated upon the same attributes.
In the realm of attitudes toward products, two further multi-attribute attitude models have been found even more useful for product development: the Adequacy-Importance Model (Bass & Talarzyk, 1972; Batra & Ahtola, 1990; see Tuck, 1973 for a comparison with the Fishbein Model) and the Ideal-Point Multi-Attribute Attitude Model (Blackwell, et al., 2006; Ginter, 1974; Lehmann, 1971). Bass and Talarzyk (1972) showed empirically that an attitude toward a particular product alternative can be described as a function of the relative importance of each attribute and the accordant belief about the product’s actual performance on this attribute. This model is widely used in market research (Batra & Ahtola, 1990). Another popular model, the Ideal-Point
2 THEORETICAL AND METHODOLOGICAL BACKGROUND 13
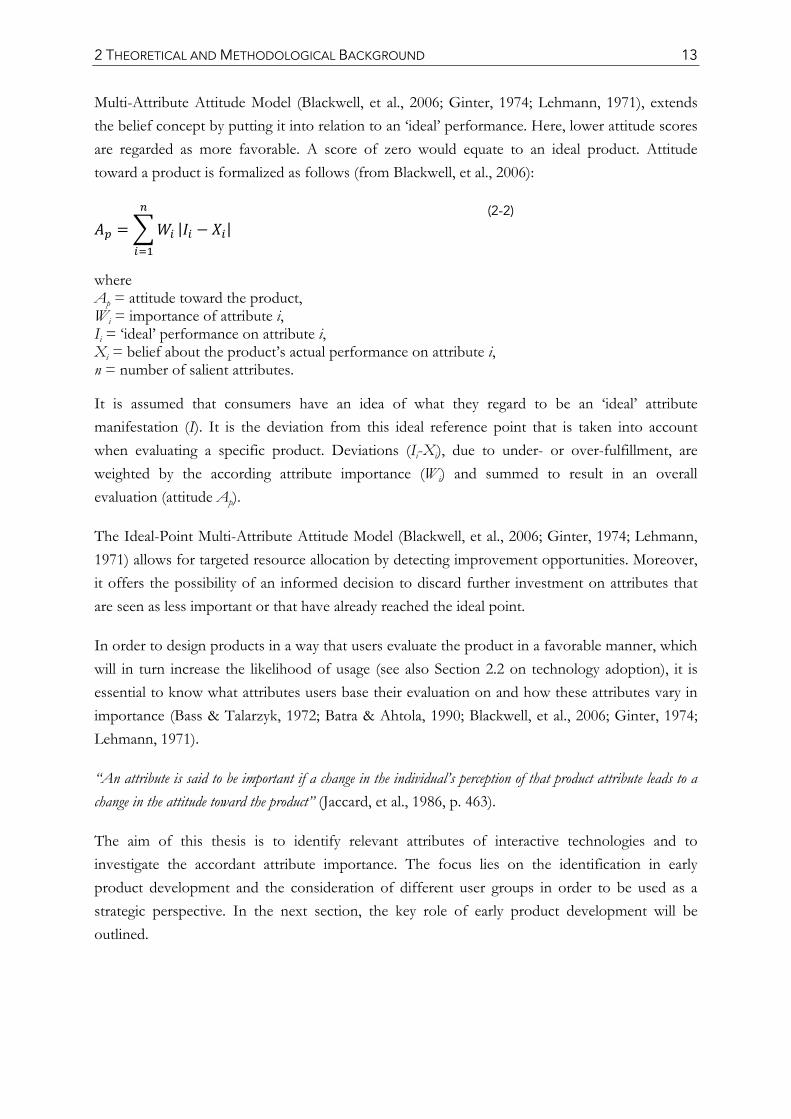
Multi-Attribute Attitude Model (Blackwell, et al., 2006; Ginter, 1974; Lehmann, 1971), extends the belief concept by putting it into relation to an ‘ideal’ performance. Here, lower attitude scores are regarded as more favorable. A score of zero would equate to an ideal product. Attitude toward a product is formalized as follows (from Blackwell, et al., 2006):
| | (2-2)
where Ap = attitude toward the product, Wi = importance of attribute i, Ii = ‘ideal’ performance on attribute i, Xi = belief about the product’s actual performance on attribute i, n = number of salient attributes.
It is assumed that consumers have an idea of what they regard to be an ‘ideal’ attribute manifestation (I). It is the deviation from this ideal reference point that is taken into account when evaluating a specific product. Deviations (Ii-Xi), due to under- or over-fulfillment, are weighted by the according attribute importance (Wi) and summed to result in an overall evaluation (attitude Ap).
The Ideal-Point Multi-Attribute Attitude Model (Blackwell, et al., 2006; Ginter, 1974; Lehmann, 1971) allows for targeted resource allocation by detecting improvement opportunities. Moreover, it offers the possibility of an informed decision to discard further investment on attributes that are seen as less important or that have already reached the ideal point.
In order to design products in a way that users evaluate the product in a favorable manner, which will in turn increase the likelihood of usage (see also Section 2.2 on technology adoption), it is essential to know what attributes users base their evaluation on and how these attributes vary in importance (Bass & Talarzyk, 1972; Batra & Ahtola, 1990; Blackwell, et al., 2006; Ginter, 1974; Lehmann, 1971).
“An attribute is said to be important if a change in the individual’s perception of that product attribute leads to a change in the attitude toward the product” (Jaccard, et al., 1986, p. 463).
The aim of this thesis is to identify relevant attributes of interactive technologies and to investigate the accordant attribute importance. The focus lies on the identification in early product development and the consideration of different user groups in order to be used as a strategic perspective. In the next section, the key role of early product development will be outlined.
2 THEORETICAL AND METHODOLOGICAL BACKGROUND 14
2.1.4 EARLY PHASES IN PRODUCT DEVELOPMENT
Blessing (1994) documents in a prescriptive as well as descriptive literature review the importance of the early problem definition (planning and task clarification) phase, in particular, the necessity of an unambiguous design specification, which should be as complete as possible. It is here that a product idea arises, strategic directions are being formulated and the design specified to a degree that will already determine the likelihood of a product’s success (Roozenburg & Eekels, 1995). Decisions made in the early stages of product development will affect all following decisions, activities, and results in the design process (see Figure 2-1, p. 7 and Figure 2-2, p. 9). They can be adapted and modified also later in the process as information increases. However, development time and the number cost-consuming modifications are reduced if the task has been sufficiently clarified and requirements accordingly specified prior to the subsequent design phases (Pahl, et al., 2007), i.e. prior to producing design solutions (ISO, 2010). “Certainly, careful design work pays off, and the need to iterate is not a license to be sloppy” (Gould & Lewis, 1985, p. 304).
In early stages, modifications can still be made relatively easy. Any modifications that will be necessary later as development proceeds increase in cost and time (Bias & Mayhew, 2005; ISO, 2010; VDI, 1994). Generally, the ability to influence the outcome decreases as development progresses (Wheelwright & Clark, 1992). Moreover, despite the considerable amount of time invested in early stages as required by systematic design methodology the overall project time is expected to decrease (Clausing, 1994; Pahl, et al., 2007).
In the remainder of this section, a number of aspects relating to early phases in product development will be touched upon. After a brief introduction to strategic and resource planning, specifics of a design specification as well as of evaluation processes in general will be described and exemplified by the House of Quality. Finally, possibilities to integrate users in different design settings will be discussed.
Strategic and Resource Planning
According to Blackwell et al. (2006), the aim of (strategic) marketing is sometimes misunderstood as the attempt to manipulate customers. However, when applied successfully it is in fact the company itself that needs to adapt. Strategy as “a decisive allocation of resources (capital, technology, and people) in a particular direction is essential to this process” (Blackwell, et al., 2006, p. 34). A user-centered approach would imply that the direction is co-established by the users.
The strategic objective as established in the planning phase (Archer, 1971) is derived from a situation analysis of the market (for example, whether the market is already saturated or still maturing) and of the company’s own standing with regards to external competitors as well as internal competences. Pahl et al. (2007) present a variety of methods to (1) analyze the situation, (2) formulate search strategies, (3/4) find and select product ideas, (5/6) define, clarify, and elaborate products (see also VDI, 1993 for a method overview). Attribute importance from a
2 THEORETICAL AND METHODOLOGICAL BACKGROUND 15
user’s perspective becomes relevant to identify trends on a general level (2) as well as priorities on a detailed level (5/6) that should be considered in the design specification.
In their general introduction on product design and development, Ulrich and Eppinger (2008, p. 6) list a number of challenges of product development, starting with trade-offs. The allocation of limited resources, thus the necessity of trade-offs between as well as within projects, is no easy task. Knowing attributes that are relevant to the user and their relative importance is an essential source of information that can guide resource planning (Blackwell, et al., 2006; Elliott, et al., 2003; Gustafsson & Johnson, 2004). In order to define, clarify, and elaborate products [(5/6) above], user-valued attributes (what) as well as engineering characteristics (how) need to be harmoniously combined and weighted in a design specification to provide direction for all later stages.
Strategic knowledge is used to make informed decisions. This is realized by giving each attribute an accordant importance weight that results in a unique product profile. Thus, attribute importance affects the evaluation and thereby the selection of requirements, of concepts, and consequently of the final solution (see section on evaluation p. 16).
Strategic and resource planning are not only relevant when designing new products or the next generation of a product, but also when designing for a new user group, even if the product stays the same. Attribute importance can be used as a segmentation tool (Blackwell, et al., 2006) when groups have not yet been identified. However, it also serves as a strategic differentiation index for pre-defined groups. Differences can give rise to a re-evaluation of a set resource allocation and to the communication strategy of a product.
Design Specification
“A design specification is the elaboration of the goal of a product development project” (Roozenburg & Eekels, 1995, p. 136). It is the deliverable at the end of the first phase of Pahl et al.’s process model (2007) (see Figure 2-1, p. 7) and is also called ‘requirement list’. Terminology varies with respect to the requirements of product properties: ‘product specifications’, ‘metrics’, ‘product or corporate expectations’, ‘engineering measures or characteristics’, ‘design attributes’, ‘design parameters’, ‘technical requirements’, ‘target values’ (Clausing, 1994; Griffin & Hauser, 1993; Hauser & Clausing, 1988; Ulrich & Eppinger, 2008; Wheelwright & Clark, 1992). However, there is general agreement that a design specification is a precise description of how the product should behave regarding individual product characteristics.
According to Hull et al. (2002), every statement of a requirement should be clear and precise, legal and feasible, unique and atomic (carrying a single traceable element), verifiable, but still abstract (solution-free). Requirements serve as evaluation criteria of a solution, but are not a solution itself. For example, a requirement could be that a cell phone should weigh less than 400g. Solutions for this requirement will be explored in the stages of conceptual, embodiment,
2 THEORETICAL AND METHODOLOGICAL BACKGROUND 16
and detail design. As much as possible, requirements should be quantified with an according metric and target value given as an absolute number, a relative number such as an inequality, or a range (Ulrich & Eppinger, 2008). In the example above, gram is the metric with a value of ‘<400’.
Two types of requirements are differentiated: optional wishes and mandatory demands (Pahl, et al., 2007). A design solution is unacceptable if demands are not met. For this reason, minimum fulfillment of a demand must be recorded. If design compromises need to be made, wishes are considered last. Thus, in trade-off scenarios, these will be allocated the least amount of resources. Attribute importance as seen by the users can serve as a classification aid concerning what should be documented as a demand and what as a wish. The fulfillment of wishes can enhance an acceptable variant to a desirable variant (Roozenburg & Eekels, 1995).
A design specification should be as exhaustive as possible. The initial list of obvious requirements (e.g. of the current product) are refined and extended by attributes that are expected by users, and by using checklists, guidelines, forms and creating scenarios along the product lifecycle (Pahl, et al., 2007). Hence, requirements are not to be seen as deterministic. They are likely to change as the project proceeds. As information knowledge increases, the design specification should be adapted, updated, and refined accordingly (Almefelt, 2005; Pahl, et al., 2007; VDI, 1993). This stepwise evolution of the list leads to an increasingly precise specification.
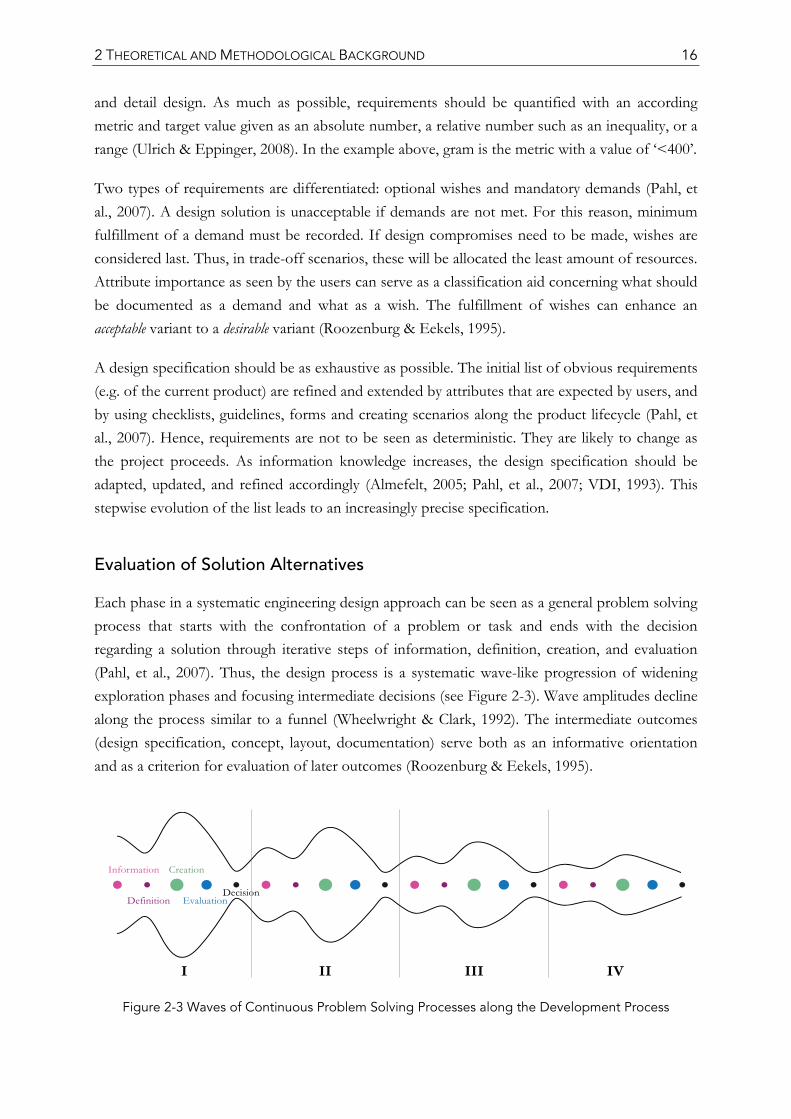
Evaluation of Solution Alternatives
Each phase in a systematic engineering design approach can be seen as a general problem solving process that starts with the confrontation of a problem or task and ends with the decision regarding a solution through iterative steps of information, definition, creation, and evaluation (Pahl, et al., 2007). Thus, the design process is a systematic wave-like progression of widening exploration phases and focusing intermediate decisions (see Figure 2-3). Wave amplitudes decline along the process similar to a funnel (Wheelwright & Clark, 1992). The intermediate outcomes (design specification, concept, layout, documentation) serve both as an informative orientation and as a criterion for evaluation of later outcomes (Roozenburg & Eekels, 1995).
Figure 2-3 Waves of Continuous Problem Solving Processes along the Development Process
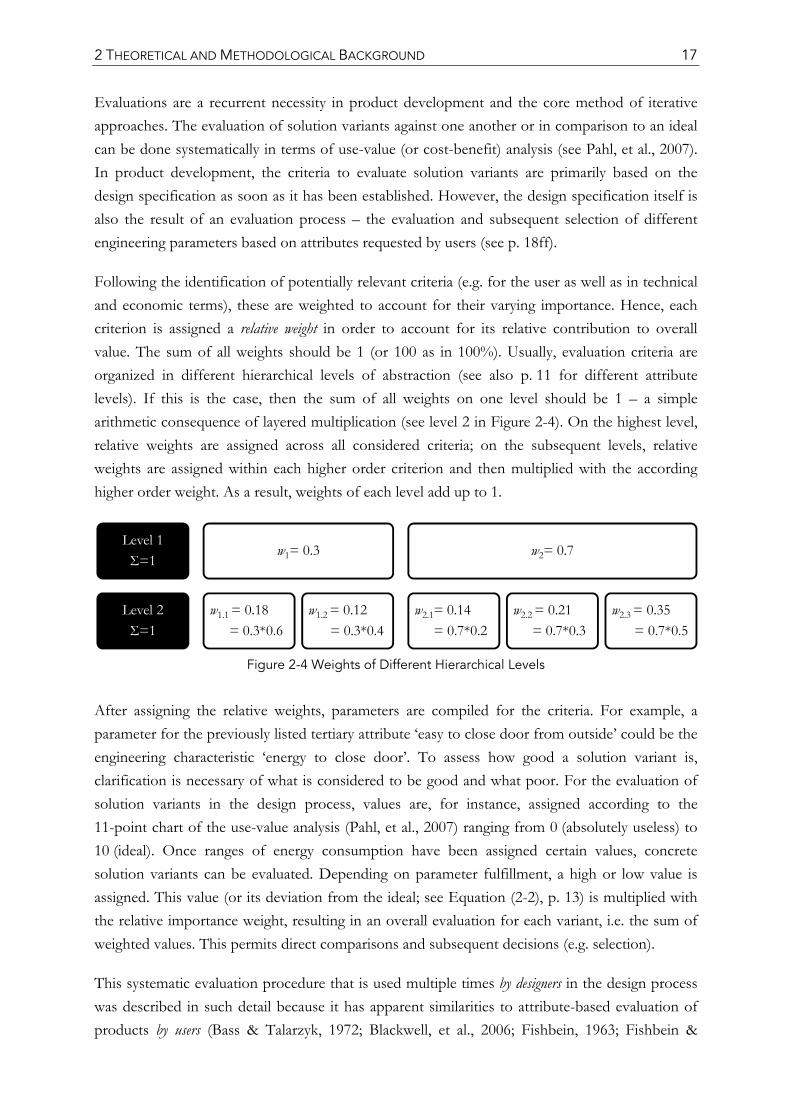
2 THEORETICAL AND METHODOLOGICAL BACKGROUND 17
Evaluations are a recurrent necessity in product development and the core method of iterative approaches. The evaluation of solution variants against one another or in comparison to an ideal can be done systematically in terms of use-value (or cost-benefit) analysis (see Pahl, et al., 2007). In product development, the criteria to evaluate solution variants are primarily based on the design specification as soon as it has been established. However, the design specification itself is also the result of an evaluation process – the evaluation and subsequent selection of different engineering parameters based on attributes requested by users (see p. 18ff).
Following the identification of potentially relevant criteria (e.g. for the user as well as in technical and economic terms), these are weighted to account for their varying importance. Hence, each criterion is assigned a relative weight in order to account for its relative contribution to overall value. The sum of all weights should be 1 (or 100 as in 100%). Usually, evaluation criteria are organized in different hierarchical levels of abstraction (see also p. 11 for different attribute levels). If this is the case, then the sum of all weights on one level should be 1 – a simple arithmetic consequence of layered multiplication (see level 2 in Figure 2-4). On the highest level, relative weights are assigned across all considered criteria; on the subsequent levels, relative weights are assigned within each higher order criterion and then multiplied with the according higher order weight. As a result, weights of each level add up to 1.
Figure 2-4 Weights of Different Hierarchical Levels
After assigning the relative weights, parameters are compiled for the criteria. For example, a parameter for the previously listed tertiary attribute ‘easy to close door from outside’ could be the engineering characteristic ‘energy to close door’. To assess how good a solution variant is, clarification is necessary of what is considered to be good and what poor. For the evaluation of solution variants in the design process, values are, for instance, assigned according to the 11-point chart of the use-value analysis (Pahl, et al., 2007) ranging from 0 (absolutely useless) to 10 (ideal). Once ranges of energy consumption have been assigned certain values, concrete solution variants can be evaluated. Depending on parameter fulfillment, a high or low value is assigned. This value (or its deviation from the ideal; see Equation (2-2), p. 13) is multiplied with the relative importance weight, resulting in an overall evaluation for each variant, i.e. the sum of weighted values. This permits direct comparisons and subsequent decisions (e.g. selection).
This systematic evaluation procedure that is used multiple times by designers in the design process was described in such detail because it has apparent similarities to attribute-based evaluation of products by users (Bass & Talarzyk, 1972; Blackwell, et al., 2006; Fishbein, 1963; Fishbein &
Level 1Σ=1
Level 2Σ=1
w1= 0.3
w1.1 = 0.18= 0.3*0.6
w1.2 = 0.12= 0.3*0.4
w2= 0.7
w2.1= 0.14= 0.7*0.2
w2.2 = 0.21= 0.7*0.3
w2.3 = 0.35= 0.7*0.5
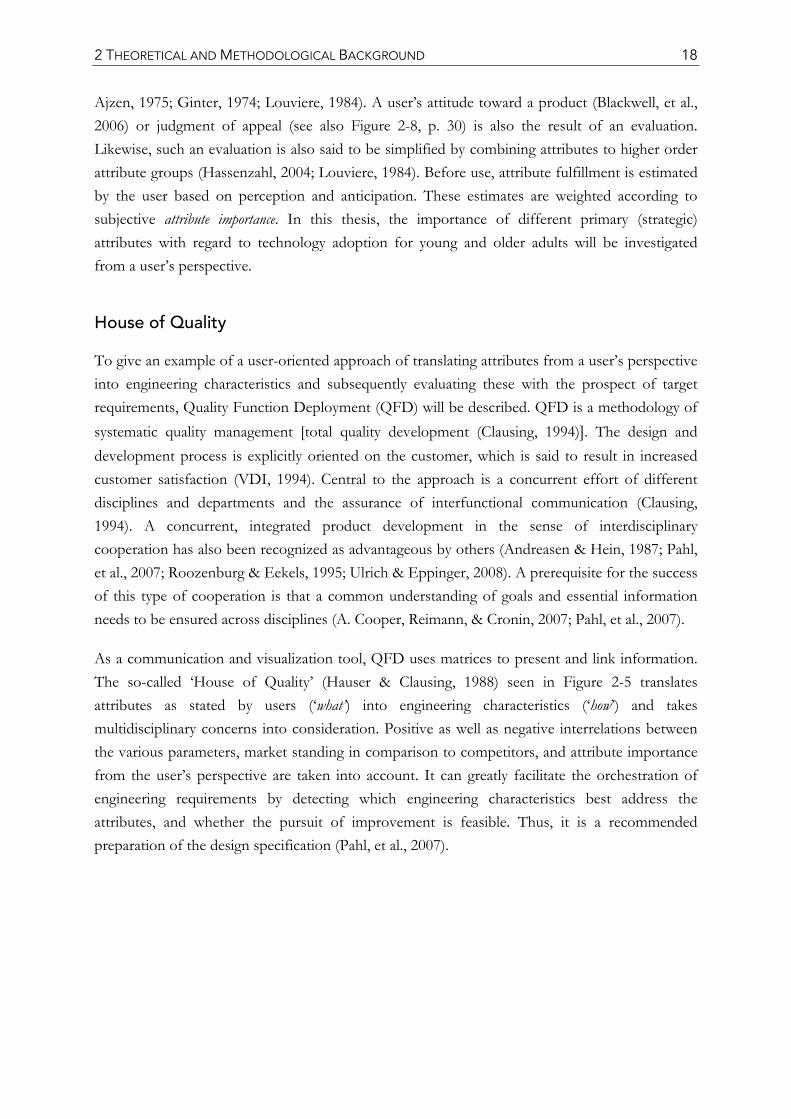
2 THEORETICAL AND METHODOLOGICAL BACKGROUND 18
Ajzen, 1975; Ginter, 1974; Louviere, 1984). A user’s attitude toward a product (Blackwell, et al., 2006) or judgment of appeal (see also Figure 2-8, p. 30) is also the result of an evaluation. Likewise, such an evaluation is also said to be simplified by combining attributes to higher order attribute groups (Hassenzahl, 2004; Louviere, 1984). Before use, attribute fulfillment is estimated by the user based on perception and anticipation. These estimates are weighted according to subjective attribute importance. In this thesis, the importance of different primary (strategic) attributes with regard to technology adoption for young and older adults will be investigated from a user’s perspective.
House of Quality
To give an example of a user-oriented approach of translating attributes from a user’s perspective into engineering characteristics and subsequently evaluating these with the prospect of target requirements, Quality Function Deployment (QFD) will be described. QFD is a methodology of systematic quality management [total quality development (Clausing, 1994)]. The design and development process is explicitly oriented on the customer, which is said to result in increased customer satisfaction (VDI, 1994). Central to the approach is a concurrent effort of different disciplines and departments and the assurance of interfunctional communication (Clausing, 1994). A concurrent, integrated product development in the sense of interdisciplinary cooperation has also been recognized as advantageous by others (Andreasen & Hein, 1987; Pahl, et al., 2007; Roozenburg & Eekels, 1995; Ulrich & Eppinger, 2008). A prerequisite for the success of this type of cooperation is that a common understanding of goals and essential information needs to be ensured across disciplines (A. Cooper, Reimann, & Cronin, 2007; Pahl, et al., 2007).
As a communication and visualization tool, QFD uses matrices to present and link information. The so-called ‘House of Quality’ (Hauser & Clausing, 1988) seen in Figure 2-5 translates attributes as stated by users (‘what’) into engineering characteristics (‘how’) and takes multidisciplinary concerns into consideration. Positive as well as negative interrelations between the various parameters, market standing in comparison to competitors, and attribute importance from the user’s perspective are taken into account. It can greatly facilitate the orchestration of engineering requirements by detecting which engineering characteristics best address the attributes, and whether the pursuit of improvement is feasible. Thus, it is a recommended preparation of the design specification (Pahl, et al., 2007).
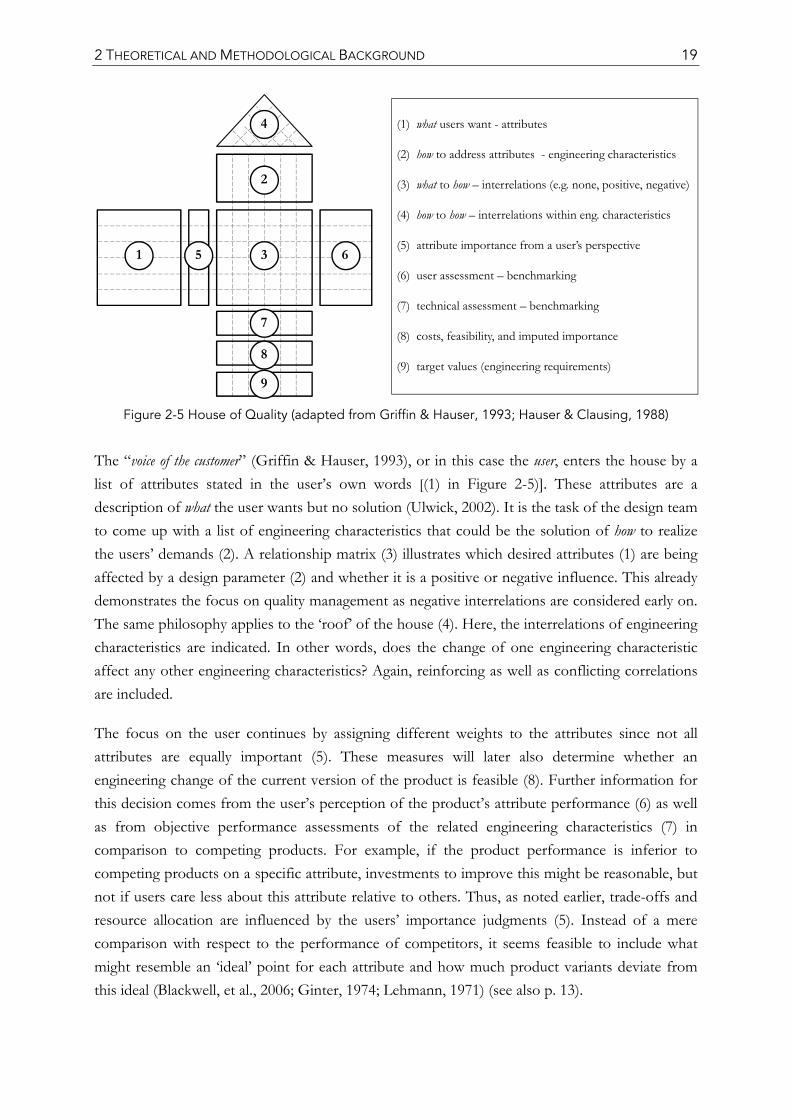
2 THEORETICAL AND METHODOLOGICAL BACKGROUND 19
Figure 2-5 House of Quality (adapted from Griffin & Hauser, 1993; Hauser & Clausing, 1988)
The “voice of the customer” (Griffin & Hauser, 1993), or in this case the user, enters the house by a list of attributes stated in the user’s own words [(1) in Figure 2-5)]. These attributes are a description of what the user wants but no solution (Ulwick, 2002). It is the task of the design team to come up with a list of engineering characteristics that could be the solution of how to realize the users’ demands (2). A relationship matrix (3) illustrates which desired attributes (1) are being affected by a design parameter (2) and whether it is a positive or negative influence. This already demonstrates the focus on quality management as negative interrelations are considered early on. The same philosophy applies to the ‘roof’ of the house (4). Here, the interrelations of engineering characteristics are indicated. In other words, does the change of one engineering characteristic affect any other engineering characteristics? Again, reinforcing as well as conflicting correlations are included.
The focus on the user continues by assigning different weights to the attributes since not all attributes are equally important (5). These measures will later also determine whether an engineering change of the current version of the product is feasible (8). Further information for this decision comes from the user’s perception of the product’s attribute performance (6) as well as from objective performance assessments of the related engineering characteristics (7) in comparison to competing products. For example, if the product performance is inferior to competing products on a specific attribute, investments to improve this might be reasonable, but not if users care less about this attribute relative to others. Thus, as noted earlier, trade-offs and resource allocation are influenced by the users’ importance judgments (5). Instead of a mere comparison with respect to the performance of competitors, it seems feasible to include what might resemble an ‘ideal’ point for each attribute and how much product variants deviate from this ideal (Blackwell, et al., 2006; Ginter, 1974; Lehmann, 1971) (see also p. 13).
1
2
3
4
65
7
8
9
(1) what users want - attributes
(2) how to address attributes - engineering characteristics
(3) what to how – interrelations (e.g. none, positive, negative)
(4) how to how – interrelations within eng. characteristics
(5) attribute importance from a user’s perspective
(6) user assessment – benchmarking
(7) technical assessment – benchmarking
(8) costs, feasibility, and imputed importance
(9) target values (engineering requirements)
2 THEORETICAL AND METHODOLOGICAL BACKGROUND 20
Finally, engineering characteristics are quantified regarding target values (9). Depending on the previously outlined comparisons, decisions will be made as to whether a modification from the current design is worth pursuing or not, whether a strategic shift is aimed for with respect to competing products, and whether benefits of a solution outweigh possible conflicts with others. The targets specify the engineering requirements.
QFD goes beyond the first House of Quality. After the initial step, three more houses follow: Parts Deployment, Process Planning, and Production Planning (Hauser & Clausing, 1988). The ‘how’ of one house enters the following one as the ‘what’. In this vein, the initial voice of the user is carried on all the way to the definition of production requirements. QFD convinces through time and cost reductions, mainly because fewer design changes are necessary which is said to be the result of the pronounced investment in the crucial early phases (Hauser & Clausing, 1988).
In this thesis, economic concerns are of lesser interest – the optimum design despite limited resources for different user groups calls for a different kind of positioning. Rather than comparing a product with those of the competitors (bench-marking), the focus lies on comparing different user groups. Product modifications might become necessary if a new target group perceives improvement potential in attributes that are of high importance to them.
Unfortunately, the strong user orientation of QFD does not necessarily coincide with actual user integration. For example, with respect to attribute importance, commonly two assessment options are recommended: an internal weighting by members of the design team or an external weighting on the basis of further user research (Roozenburg & Eekels, 1995; Ulrich & Eppinger, 2008). Schmidt (1996) objects to the frequent suggestion of internal weightings as it contradicts the appreciation of the user’s voice. The independence of user-centered design methodologies and requirements engineering in theory as well as in practice have been criticized by Lindgaard et al. (2006). Similarly, Mayhew (2008) concludes from her practical experience that project teams often have a misleading perception of their users’ capabilities and preferences. In order to avoid inappropriate design solutions, the actual integration of users in the design process seems indispensable.
2.1.5 USER INTEGRATION
According to data from the Standish Group in 1995 and 1996 and from the Scientific American in 1994, as reported in Hull et al. (2002), user involvement is the most influential factor regarding project success (15.9%), and a lack of user involvement is the second most common (12.4%) reason for project failure (after incomplete requirements with 13.1%). A meta-analysis of 45 empirical studies on end-user satisfaction conducted by Mahmood et al. (2000) revealed similar results. The authors investigated the relationship of end-user satisfaction with nine variables (perceived usefulness, ease of use, user expectations, user experience, user skills, user involvement in system development, organizational support, perceived attitude of top

2 THEORETICAL AND METHODOLOGICAL BACKGROUND 21
management toward the project, and user attitude toward information systems). All variables were found to have a positive influence, however the strongest support was found for ‘user involvement in system development’.
User-centered design (ISO, 2010) per se can have many shades of user involvement (Kujala, 2003). For example, differences can be observed regarding the number of users involved. While some approaches focus on a select number of ‘lead users’ (von Hippel, 1986), others, e.g. large-scale market surveys, aim for quantity. User-based testing as conducted traditionally in the fields of interactive technologies should include representative samples of target users. For quantitative methods, sample sizes depend on the (estimated) size of the investigated effect and the statistical power of the test (Field, 2009). Qualitative approaches usually have smaller sample sizes, as the aim is often not a representative description but rather an in-depth, idiosyncratic understanding.
A further differentiator is the frequency and duration of involvement along the design process. Often, users are only involved in the final evaluation, basically, to give approval to a near-finished design. This however, bears the risk of product failure if users’ expectations are not met. At this stage, major modifications are likely to be too costly, which is one of the reasons why it is suggested to apply continuous user evaluations from the start (Bias & Mayhew, 2005; ISO, 2010). The opposite is also common: users might only be involved in the very beginning, either through market research or directly as a source of initial inspiration. However, to achieve later acceptance, user involvement from the early stages throughout the entire design and development is most promising (Gould & Lewis, 1985; ISO, 2010).
Most importantly, user-centered design approaches differ with respect to the degree of actual involvement and the roles assigned to users. Approaches range from a focus on the user without actual involvement, to the extreme of the user becoming a designer. Eason (1995) proposes an intriguing classification of user-centeredness with application recommendations depending on the design setting (see Figure 2-6). Eason compares two approaches: a design for users vs. a design by users. In the ‘design for users’ approach, the designer∗ can decide on the basis of theories and previous findings regarding human behavior on behalf of the user. In a ‘design by users’ approach, on the other hand, users participate in the design process (Ehn, 1993; Sanders, 2008).
A user-centered ‘design for users’ can work even without the integration of real users. Examples on the more passive end of the scale would be inspection-based evaluation such as the consultation of scientific literature, secondary data, standards and design guidelines, heuristics, as well as expert appraisal or consensus within a design team (ISO, 2010; Jordan, 2000; Nielsen, 1993; Shackel, 1991; Wheelwright & Clark, 1992). Another possibility to consider users without their actual participation is the development of personas – different user groups are each represented by a prototypical user, who is described in elaborate detail, however, these users are imagined representatives who do not exist in real life (A. Cooper, et al., 2007). Furthermore, user
∗ Eason (1995) refers to the ‘ergonomist’
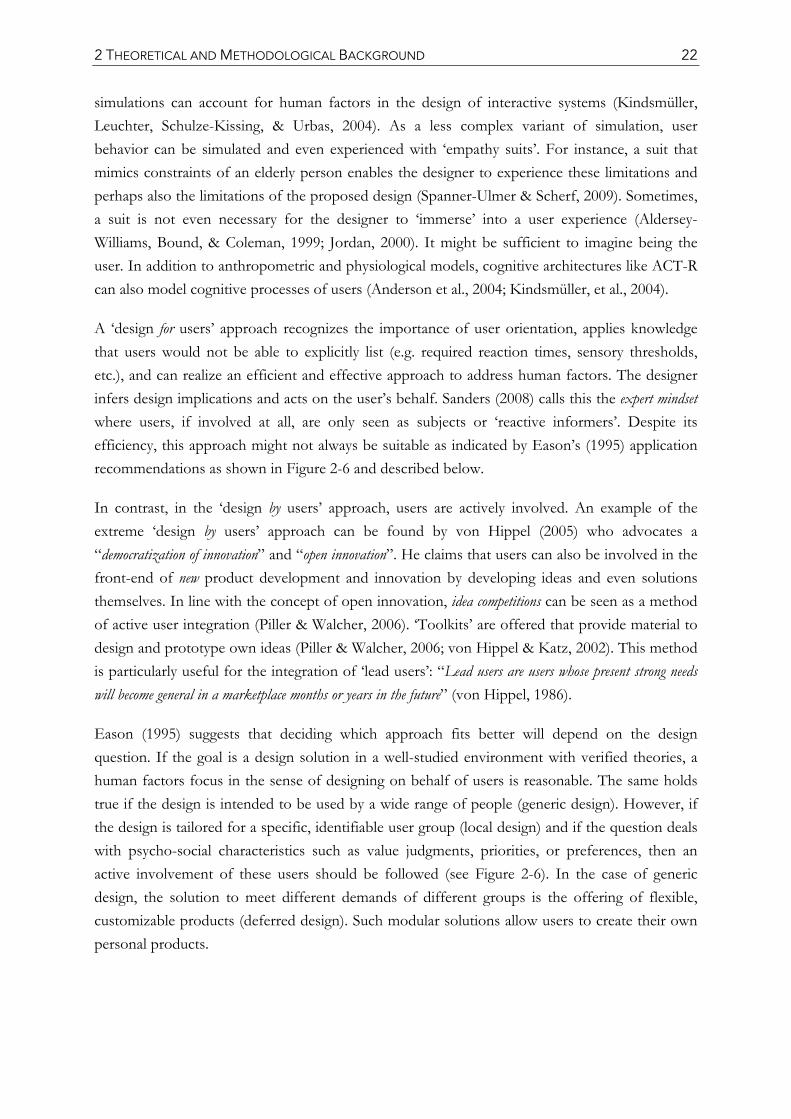
2 THEORETICAL AND METHODOLOGICAL BACKGROUND 22
simulations can account for human factors in the design of interactive systems (Kindsmüller, Leuchter, Schulze-Kissing, & Urbas, 2004). As a less complex variant of simulation, user behavior can be simulated and even experienced with ‘empathy suits’. For instance, a suit that mimics constraints of an elderly person enables the designer to experience these limitations and perhaps also the limitations of the proposed design (Spanner-Ulmer & Scherf, 2009). Sometimes, a suit is not even necessary for the designer to ‘immerse’ into a user experience (Aldersey-Williams, Bound, & Coleman, 1999; Jordan, 2000). It might be sufficient to imagine being the user. In addition to anthropometric and physiological models, cognitive architectures like ACT-R can also model cognitive processes of users (Anderson et al., 2004; Kindsmüller, et al., 2004).
A ‘design for users’ approach recognizes the importance of user orientation, applies knowledge that users would not be able to explicitly list (e.g. required reaction times, sensory thresholds, etc.), and can realize an efficient and effective approach to address human factors. The designer infers design implications and acts on the user’s behalf. Sanders (2008) calls this the expert mindset where users, if involved at all, are only seen as subjects or ‘reactive informers’. Despite its efficiency, this approach might not always be suitable as indicated by Eason’s (1995) application recommendations as shown in Figure 2-6 and described below.
In contrast, in the ‘design by users’ approach, users are actively involved. An example of the extreme ‘design by users’ approach can be found by von Hippel (2005) who advocates a “democratization of innovation” and “open innovation”. He claims that users can also be involved in the front-end of new product development and innovation by developing ideas and even solutions themselves. In line with the concept of open innovation, idea competitions can be seen as a method of active user integration (Piller & Walcher, 2006). ‘Toolkits’ are offered that provide material to design and prototype own ideas (Piller & Walcher, 2006; von Hippel & Katz, 2002). This method is particularly useful for the integration of ‘lead users’: “Lead users are users whose present strong needs will become general in a marketplace months or years in the future” (von Hippel, 1986).
Eason (1995) suggests that deciding which approach fits better will depend on the design question. If the goal is a design solution in a well-studied environment with verified theories, a human factors focus in the sense of designing on behalf of users is reasonable. The same holds true if the design is intended to be used by a wide range of people (generic design). However, if the design is tailored for a specific, identifiable user group (local design) and if the question deals with psycho-social characteristics such as value judgments, priorities, or preferences, then an active involvement of these users should be followed (see Figure 2-6). In the case of generic design, the solution to meet different demands of different groups is the offering of flexible, customizable products (deferred design). Such modular solutions allow users to create their own personal products.
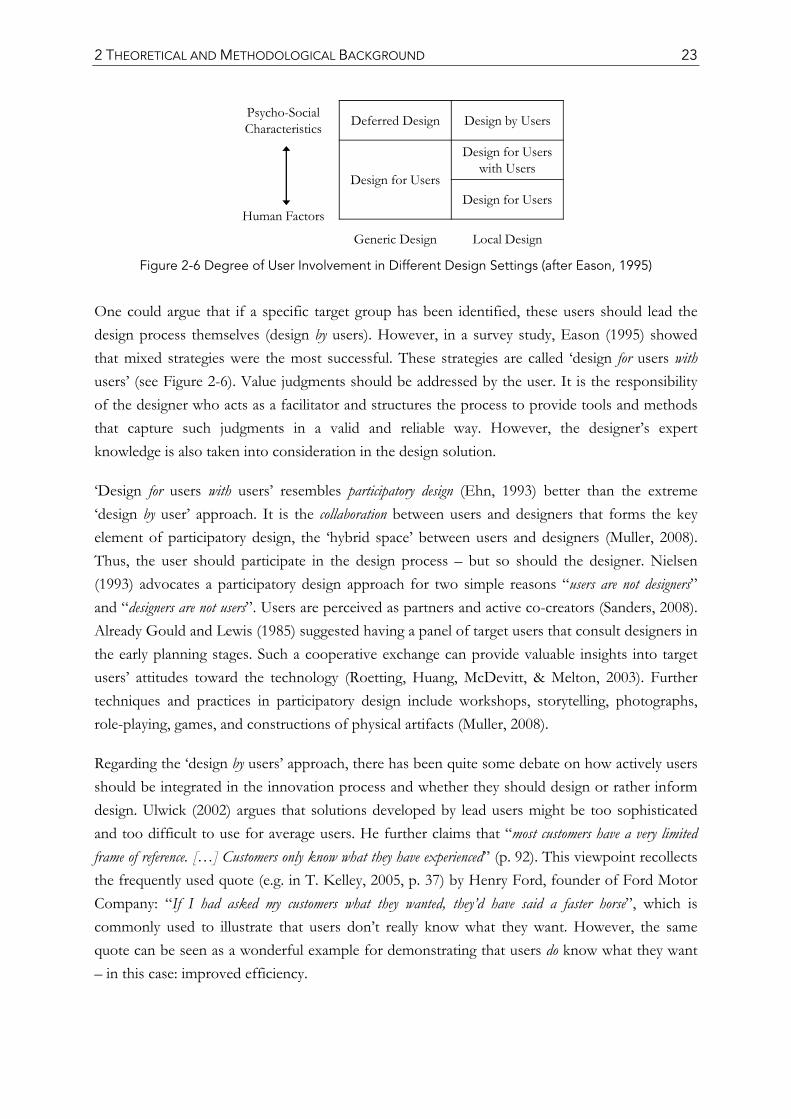
2 THEORETICAL AND METHODOLOGICAL BACKGROUND 23
Figure 2-6 Degree of User Involvement in Different Design Settings (after Eason, 1995)
One could argue that if a specific target group has been identified, these users should lead the design process themselves (design by users). However, in a survey study, Eason (1995) showed that mixed strategies were the most successful. These strategies are called ‘design for users with users’ (see Figure 2-6). Value judgments should be addressed by the user. It is the responsibility of the designer who acts as a facilitator and structures the process to provide tools and methods that capture such judgments in a valid and reliable way. However, the designer’s expert knowledge is also taken into consideration in the design solution.
‘Design for users with users’ resembles participatory design (Ehn, 1993) better than the extreme ‘design by user’ approach. It is the collaboration between users and designers that forms the key element of participatory design, the ‘hybrid space’ between users and designers (Muller, 2008). Thus, the user should participate in the design process – but so should the designer. Nielsen (1993) advocates a participatory design approach for two simple reasons “users are not designers” and “designers are not users”. Users are perceived as partners and active co-creators (Sanders, 2008). Already Gould and Lewis (1985) suggested having a panel of target users that consult designers in the early planning stages. Such a cooperative exchange can provide valuable insights into target users’ attitudes toward the technology (Roetting, Huang, McDevitt, & Melton, 2003). Further techniques and practices in participatory design include workshops, storytelling, photographs, role-playing, games, and constructions of physical artifacts (Muller, 2008).
Regarding the ‘design by users’ approach, there has been quite some debate on how actively users should be integrated in the innovation process and whether they should design or rather inform design. Ulwick (2002) argues that solutions developed by lead users might be too sophisticated and too difficult to use for average users. He further claims that “most customers have a very limited frame of reference. […] Customers only know what they have experienced” (p. 92). This viewpoint recollects the frequently used quote (e.g. in T. Kelley, 2005, p. 37) by Henry Ford, founder of Ford Motor Company: “If I had asked my customers what they wanted, they’d have said a faster horse”, which is commonly used to illustrate that users don’t really know what they want. However, the same quote can be seen as a wonderful example for demonstrating that users do know what they want – in this case: improved efficiency.
Psycho-SocialCharacteristics Deferred Design Design by Users
Human Factors
Design for Users
Design for Users with Users
Design for Users
Generic Design Local Design
2 THEORETICAL AND METHODOLOGICAL BACKGROUND 24
There is general agreement that the identification of user-valued attributes is an essential source for design specifications that will increase later product acceptance (Hull, et al., 2002; ISO, 2010; Kujala, 2003). Even Ulwick (2002) recommends a participatory approach, however looking for outcomes instead of solutions. This approach is in accordance with other recommendations (Griffin & Hauser, 1993; Ulrich & Eppinger, 2008) and supports the notion that user integration is indispensable in product development, however, in line with a ‘design for users with users’ approach. Users should receive the opportunity to express what they want, the question of how to design it should then again be a challenge for the design team (Ulrich & Eppinger, 2008).
To conclude, designers need to listen carefully in order to be able to correctly translate the voice of the user (i.e. stated attributes) into product requirements. When designing for a local group of users, importance ratings should be given by users (Schmidt, 1996; Ulwick, 2002) and not derived from common consensus of the design team as is often done in practice (Roozenburg & Eekels, 1995; Ulrich & Eppinger, 2008; Wheelwright & Clark, 1992). These ratings together with technical and economic criteria (Pahl, et al., 2007) form the basis of a user-centered design specification.
The next three sections (2.2-2.4) are devoted to the empirical aim of this thesis – the investigation of attributes that are relevant for technology adoption. It is of interest which attributes need to be considered, how these differ in importance in relation to one another, and whether they differ in importance between young and older users. For this, existing models on technology adoption and acceptance will be discussed and attributes of interactive technology will be introduced as studied in the field of HCI with a subsequent focus on the emerging target group of older adults.
2.2 TECHNOLOGY ADOPTION AND ACCEPTANCE
There are three ‘Us’ of a successful product (Dix, 2008). It should be useful, usable, but it should also be used. Although the three factors are interlinked they do not necessitate one another. For example, a product can be useful and used, despite its poor usability, or it can also be useful and usable, but not used. Usage as a success criterion touches the field of technology adoption and acceptance. Previously (Section 2.1.3), it was shown that an attitude toward a product is a global evaluative judgment of a product that depends on beliefs about salient attributes (Bass & Talarzyk, 1972; Blackwell, et al., 2006; Fishbein, 1963). Attitudes can be seen as antecedents of behavioral intentions and consequently of behavior (Fishbein & Ajzen, 1975), which is the equivalent of usage in the realm of interactive technologies. Consequently, technology (product) acceptance can be predicted on the basis of attitudes and expectations (De Sanctis, 1983).
Originating from social psychology, Ajzen and Fishbein (1980; Fishbein & Ajzen, 1975) developed the Theory of Reasoned Action (TRA). The theory is useful in predicting a behavioral intention, and consequently the behavior itself, based on attitudes toward the behavior
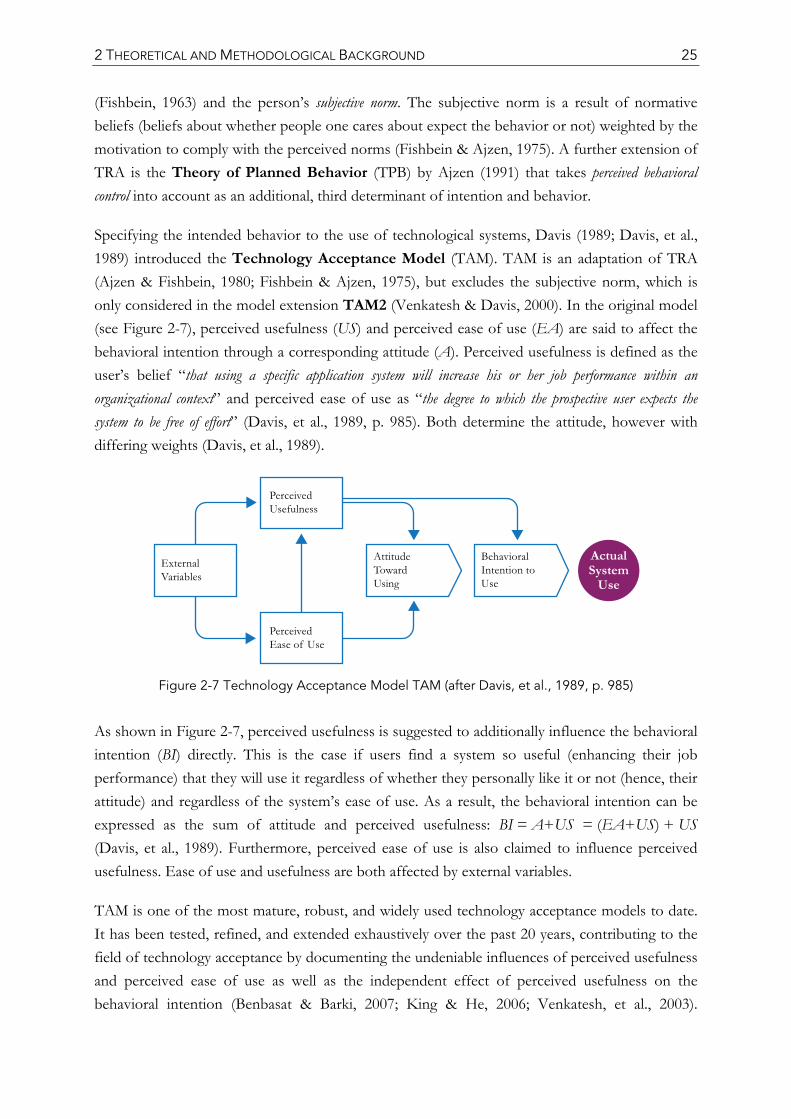
2 THEORETICAL AND METHODOLOGICAL BACKGROUND 25
(Fishbein, 1963) and the person’s subjective norm. The subjective norm is a result of normative beliefs (beliefs about whether people one cares about expect the behavior or not) weighted by the motivation to comply with the perceived norms (Fishbein & Ajzen, 1975). A further extension of TRA is the Theory of Planned Behavior (TPB) by Ajzen (1991) that takes perceived behavioral control into account as an additional, third determinant of intention and behavior.
Specifying the intended behavior to the use of technological systems, Davis (1989; Davis, et al., 1989) introduced the Technology Acceptance Model (TAM). TAM is an adaptation of TRA (Ajzen & Fishbein, 1980; Fishbein & Ajzen, 1975), but excludes the subjective norm, which is only considered in the model extension TAM2 (Venkatesh & Davis, 2000). In the original model (see Figure 2-7), perceived usefulness (US) and perceived ease of use (EA) are said to affect the behavioral intention through a corresponding attitude (A). Perceived usefulness is defined as the user’s belief “that using a specific application system will increase his or her job performance within an organizational context” and perceived ease of use as “the degree to which the prospective user expects the system to be free of effort” (Davis, et al., 1989, p. 985). Both determine the attitude, however with differing weights (Davis, et al., 1989).
Figure 2-7 Technology Acceptance Model TAM (after Davis, et al., 1989, p. 985)
As shown in Figure 2-7, perceived usefulness is suggested to additionally influence the behavioral intention (BI) directly. This is the case if users find a system so useful (enhancing their job performance) that they will use it regardless of whether they personally like it or not (hence, their attitude) and regardless of the system’s ease of use. As a result, the behavioral intention can be expressed as the sum of attitude and perceived usefulness: BI = A+US = (EA+US) + US (Davis, et al., 1989). Furthermore, perceived ease of use is also claimed to influence perceived usefulness. Ease of use and usefulness are both affected by external variables.
TAM is one of the most mature, robust, and widely used technology acceptance models to date. It has been tested, refined, and extended exhaustively over the past 20 years, contributing to the field of technology acceptance by documenting the undeniable influences of perceived usefulness and perceived ease of use as well as the independent effect of perceived usefulness on the behavioral intention (Benbasat & Barki, 2007; King & He, 2006; Venkatesh, et al., 2003).
2 THEORETICAL AND METHODOLOGICAL BACKGROUND 26
Venkatesh et al. (2003) demonstrate TAM’s strength in comparison to seven other models (including TRA and TPB) in a comprehensive review.
Venkatesh et al. (2003) further propose a Unified Theory of Acceptance and Use of Technology (UTAUT) as an integration of the eight models. UTAUT was able to explain 70% of the variance (adjusted R2) in two studies (Venkatesh, et al., 2003). Behavioral intention is directly predicted by performance expectancy (similar to US), effort expectancy (similar to EA), and social influence (similar to subjective norm). System use is further affected by facilitating conditions, and moderating factors are included. In this model, TAM reconnects with its origins of TRA (Ajzen & Fishbein, 1980; Fishbein & Ajzen, 1975): the inclusion of social influence and facilitating conditions makes UTAUT and TPB (Ajzen, 1991) quite similar (see also Benbasat & Barki, 2007).
TAM can make fairly good predictions regarding the intention to use a system (Davis, et al., 1989; King & He, 2006; Venkatesh, et al., 2003). The model is helpful in introducing and communicating new technology and information systems to employees, however, it does not provide practical information with respect to system design or resource allocation for development. Neither does it specify what it is that makes a system useful or easy to use, nor does it include other attributes that are clearly also qualities of a product and therefore also need to be considered in product development. For instance, TAM has a strong focus on job performance and thereby on instrumental attributes (Davis, et al., 1989). Its applicability to interactive consumer products should be interpreted with caution. Here, relevant attributes are particularly likely to go beyond instrumental aspects.
For example, does the outer appearance of a device have any effect on the user’s attitude toward the product? Several studies point this way (Ben-Bassat, Meyer, & Tractinsky, 2006; Bloch, Brunel, & Arnold, 2003; De Angeli, Sutcliffe, & Hartmann, 2006; Hartmann, Sutcliffe, & de Angeli, 2008; Hassenzahl, 2001, 2004; Jordan, 2000; Mahlke & Thüring, 2007), yet, aesthetics is not included in TAM. It seems short-sighted to assume that other attributes of a system do not matter or are fully mediated as external variables by usefulness and ease of use. Generally, a more differentiated perspective on relevant attributes is necessary for a translation into actionable implications in the design process (see House of Quality p. 18). On the other hand, the vast amount of research conducted to extend and modify the TAM model “has lead to a state of theoretical chaos and confusion in which it is not clear which version of the many iterations of TAM is the commonly accepted one” (Benbasat & Barki, 2007, p. 211).
There have been some attempts to include enjoyment in TAM (Al-Gahtani & King, 1999; Davis, Bagozzi, & Warshaw, 1992; Igbaria, Parasuraman, & Baroudi, 1996; Igbaria, Schiffman, & Wieckowski, 1994). However, it has been eliminated again from subsequent investigations where it did not seem appropriate for the context under investigation (e.g. workplace, adoption of methodologies) (Riemenschneider, Hardgrave, & Davis, 2002). Then again, there is a growing body of evidence that emotional aspects play a crucial role in the prediction of technology
2 THEORETICAL AND METHODOLOGICAL BACKGROUND 27
acceptance for leisure usage activities and consumer electronics (Brown & Venkatesh, 2005; Kulviwat, Bruner II, Kumar, Nasco, & Clark, 2007; van der Heijden, 2004; Venkatesh & Brown, 2001). For example, van der Heijden (2004) found that in a pleasure-oriented (hedonic) system, in contrast to productivity-oriented (utilitarian) systems, perceived enjoyment and perceived ease of use are stronger predictors of usage intentions than perceived usefulness.
Benbasat and Barki (2007) acknowledge TAM’s value and its contributions, but also have a critical opinion regarding the model’s dominance in this field of research: by re-confirming the influence of usefulness and ease of use over and over again, research starts to stagnate. Venkatesh et al. (2007) partly share Benbasat and Barki’s concern that “an excessive focus on replication and minor “tweaking” of existing models can hinder progress both in the area of technology adoption and in information systems in general” (Venkatesh, et al., 2007, p. 279). It might be time to move on and consider other attributes, to follow other research approaches, and especially to link research on technology acceptance back to system design and product development (Benbasat & Barki, 2007; Goodhue, 2007).
A different effort to tackle the concept of user acceptance has been made by Shackel (1991). He argues that user acceptance can be seen as the result of a trade-off between usability, utility, likeability, and costs. Utility refers to functionality and costs are not limited to financial investments, but also to personal, social, and organizational consequences. It is assumed that acceptance depends on whether expected utility, usability, and likeability can outweigh related costs. The author points out that as technology is becoming cheaper and more powerful, usability will gain dominance as a decisive acceptance factor (Shackel, 1991).
Innovation Diffusion Theory by Rogers (1995) looks at acceptance from a broader perspective. Instead of predicting the behavior of an individual user, Rogers investigates how a new product (innovation) diffuses from the time of being available to the time of wide-spread adoption. Diffusion is defined as “the process by which an innovation is communicated through certain channels over time among the members of a social system” (E. M. Rogers, 1995, p. 5). Five characteristics of innovations have been identified which influence the rate of adoption: (1) relative advantage in comparison to existing ideas and products, (2) compatibility with existing values, (3) complexity in terms of how difficult the innovation is to use and to understand, (4) trialability as the opportunity to test an innovation without commitment, and finally (5) observability as the visibility of the innovation’s outputs to others. Importantly, Rogers (1995) emphasizes that what counts is not the objective quality but the subjective evaluation, i.e. how users perceive these attributes.
Depending on the speed of adoption, five adopter categories can be differentiated: innovators, early adopters, early majority, late adopters, and laggards (E. M. Rogers, 1995). Not surprisingly, technology acceptance is also influenced by user characteristics (see Dillon & Morris, 1996). After all, it has been highlighted several times that the subjective take on things matters – and subjectivity, by its very nature, varies.
2 THEORETICAL AND METHODOLOGICAL BACKGROUND 28
In accordance with the above-mentioned theories and models, user acceptance of technology can be seen as the “demonstrable willingness” to use a system (Dillon & Morris, 1996). Kollmann (2004) goes one step further and disentangles the concepts of attitude, adoption, and acceptance. The inner readiness to buy or use a system, thus, the intended behavior, is the user’s attitude toward the product; adoption refers to the dichotomous distinction between adoption (act of purchase or initial usage) and rejection, while user acceptance should be viewed as continued usage. In other words, acceptance is “to permanently integrate a product into everyday life and to use it more or less intensively” (Kollmann, 2004, p. 138). The concepts are intertwined in a sequential scheme of an acceptance process (Kollmann, 2004):
attitude (intention) > adoption (initial use) > acceptance (continued use)
assessment phase > action phase > use phase
This view has important implications for the evaluation of a product’s success and the assessment measures of acceptance. The evaluation of a product’s success should not be limited to sales figures. For example, in the telecommunication business, purchasing a mobile phone (act of adoption) does not necessarily go hand in hand with frequent and continued usage (Kollmann, 2004). Furthermore, even in situations that do not involve the purchase of a product, the differentiation between adoption and acceptance seems appropriate and could result in a more precise definition (and assessment) of product success.
For instance, if the acceptance process terminates with the act of adoption, it might even be an indicator of product failure. A product might never receive a second chance, if the first interaction was unsuccessful or dissatisfying. Thus, although the product has been adopted, it has not been accepted. This highlights the importance to meet a user’s expectation right from the start and emphasizes once more the necessity to integrate users in the design process. Knowledge of what users want and how they evaluate a product is a pivotal component of technology adoption and acceptance.
Usually, the terms acceptance and adoption are used synonymously (e.g. Venkatesh, et al., 2007). In particular, in research on TAM, the distinction might seem unnecessary because the assessed variable is typically ‘intention to use’ as a representative predictor of technology acceptance. Technology acceptance, in turn, comprises previous adoption. Thus, if acceptance can be predicted, adoption is included. However, the reverse inference does not hold. The discussion does not have to be overly stressed, but Kollmann’s (2004) differentiation could prove fruitful both in research contexts as well as in industry.
This section on technology adoption and acceptance has shown that there are numerous factors that affect human behavior and product success. Different models emphasize different factors such as social influences, facilitating conditions, user characteristics, performance of competing products, and accessibility. Yet, they all agree on the key role of attributes in the product evaluation by users, which will also be the focus of this thesis. Unfortunately, the presented
2 THEORETICAL AND METHODOLOGICAL BACKGROUND 29
models lack practicability for system design. The selection of considered attributes is limited, mostly to productivity-oriented (instrumental) attributes, and neglects other facets of products that are essential in development. An overview of possibly relevant attributes of interactive technologies and research streams will be given in the next section.
2.3 ATTRIBUTES OF INTERACTIVE TECHNOLOGIES
“The quality of a product is the customer’s perception of and evaluation of the properties of the product […] together with the set of his or her value norms used as a basis for evaluation of the product” (Andreasen & Hein, 1987, p. 171). This definition of quality is comparable to the previously introduced models of attitude formation. It is a customer-centered approach, highlighting the customer’s perception of salient attributes.
Garvin (1984) identifies five different approaches to define quality: (1) transcendent (universally recognizable as excellent), (2) product-based (performance precisely measurable by engineering characteristics), (3) user-based (“lies in the eye of the beholder”), (4) manufacturing-based (conformance to design specification), and (5) value-based (in relation to price; ‘affordable excellence’). In product development, the author proposes following a sequence from the identification of user-based attributes in early phases to product- and manufacturing-based requirements for implementation in later stages. All three types of quality are necessary to realize a high quality product. Similarly, Mørup (1992) distinguishes ‘Big Q’, quality that relates to those attributes that are experienced by the user, and ‘Little q’, quality efficiency as experienced by the company’s internal stakeholders (see also VDI, 1994). An interdependence of attributes is further formulated in the quality model of ISO standard 9126 (2001): internal quality attributes influence external quality attributes that in turn influence ‘quality in use’ attributes. “Quality in use is the combined effect of internal and external quality for the user” (ISO, 2001, p. 15): effectiveness, productivity, safety, and satisfaction.
Objective qualities as intended by the designer and subjective qualities as perceived by the user should be seen as distinct concepts even if they refer to the same attributes (Garvin, 1984; Hassenzahl, 2001; Hornbæk & Law, 2007; ISO, 2001; Mørup, 1992; Oliver, 1993; E. M. Rogers, 1995; Shackel, 1991) (see Figure 2-8). For the aim of technology acceptance, it is primarily necessary to know relevant qualities and their contribution regarding overall evaluation from a user’s perspective. The terms attributes and qualities have been used interchangeably when referring to aspects of a product that serve users as evaluation criteria (e.g. Hassenzahl, 2003, 2004). For the sake of consistency, the expression attributes will be used here.
Hassenzahl et al. (2000) propose an integrative research model (see Figure 2-8) that offers a holistic framework for the design of interactive systems. Two intriguing aspects of the model are especially noteworthy here. Firstly, the authors recognize that whatever the designer intended
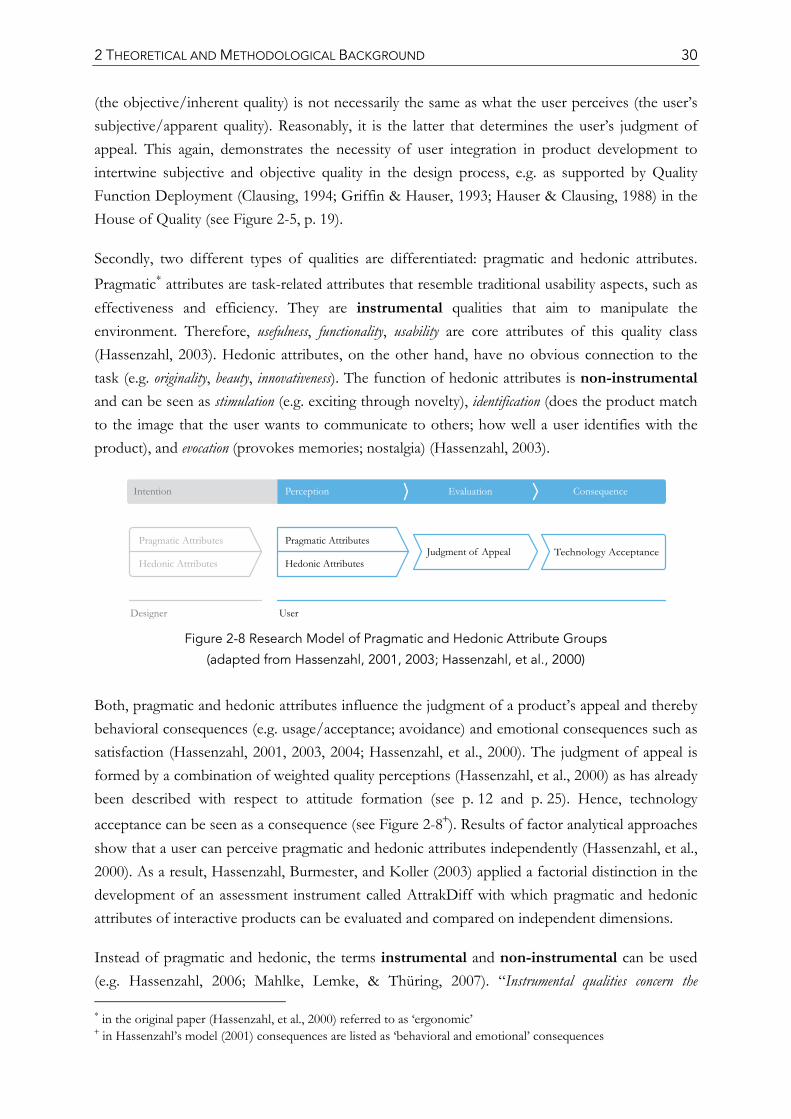
2 THEORETICAL AND METHODOLOGICAL BACKGROUND 30
(the objective/inherent quality) is not necessarily the same as what the user perceives (the user’s subjective/apparent quality). Reasonably, it is the latter that determines the user’s judgment of appeal. This again, demonstrates the necessity of user integration in product development to intertwine subjective and objective quality in the design process, e.g. as supported by Quality Function Deployment (Clausing, 1994; Griffin & Hauser, 1993; Hauser & Clausing, 1988) in the House of Quality (see Figure 2-5, p. 19).
Secondly, two different types of qualities are differentiated: pragmatic and hedonic attributes. Pragmatic∗ attributes are task-related attributes that resemble traditional usability aspects, such as effectiveness and efficiency. They are instrumental qualities that aim to manipulate the environment. Therefore, usefulness, functionality, usability are core attributes of this quality class (Hassenzahl, 2003). Hedonic attributes, on the other hand, have no obvious connection to the task (e.g. originality, beauty, innovativeness). The function of hedonic attributes is non-instrumental and can be seen as stimulation (e.g. exciting through novelty), identification (does the product match to the image that the user wants to communicate to others; how well a user identifies with the product), and evocation (provokes memories; nostalgia) (Hassenzahl, 2003).
Figure 2-8 Research Model of Pragmatic and Hedonic Attribute Groups
(adapted from Hassenzahl, 2001, 2003; Hassenzahl, et al., 2000)
Both, pragmatic and hedonic attributes influence the judgment of a product’s appeal and thereby behavioral consequences (e.g. usage/acceptance; avoidance) and emotional consequences such as satisfaction (Hassenzahl, 2001, 2003, 2004; Hassenzahl, et al., 2000). The judgment of appeal is formed by a combination of weighted quality perceptions (Hassenzahl, et al., 2000) as has already been described with respect to attitude formation (see p. 12 and p. 25). Hence, technology acceptance can be seen as a consequence (see Figure 2-8+). Results of factor analytical approaches show that a user can perceive pragmatic and hedonic attributes independently (Hassenzahl, et al., 2000). As a result, Hassenzahl, Burmester, and Koller (2003) applied a factorial distinction in the development of an assessment instrument called AttrakDiff with which pragmatic and hedonic attributes of interactive products can be evaluated and compared on independent dimensions.
Instead of pragmatic and hedonic, the terms instrumental and non-instrumental can be used (e.g. Hassenzahl, 2006; Mahlke, Lemke, & Thüring, 2007). “Instrumental qualities concern the ∗ in the original paper (Hassenzahl, et al., 2000) referred to as ‘ergonomic’ + in Hassenzahl’s model (2001) consequences are listed as ‘behavioral and emotional’ consequences
2 THEORETICAL AND METHODOLOGICAL BACKGROUND 31
experienced amount of support the system provides and the ease of its use. […] Non-instrumental qualities, on the other hand, concern the look and feel of the system” (Mahlke & Thüring, 2007, p. 916).
In the following, examples of instrumental and non-instrumental attributes will be provided.
Instrumental Attributes
If a product has a physical (hardware) component (in contrast to services or, for example, ambient devices that are operated via speech), ergonomics is a crucial attribute that clearly needs to be addressed. “Classical ergonomics, sometimes referred to as ‘industrial ergonomics’ or ‘occupational biomechanics’, concentrates on the physical aspects of work and human capabilities such as force, posture, and repetition” (Hollnagel, 1997, p. 1170). Ergonomics and the study of human factors have the two main goals of optimizing human well-being (health), which is closely linked to anthropometry/physiology, and optimizing overall system performance (ISO, 2010). For all human-system interactions, hence also for non work-related appliances, the most basic design principle is to ensure that an interaction is safe (Hancock, Pepe, & Murphy, 2005). Physical ergonomics seeks the prevention of pain and/or other health problems, also of long-term issues caused by a suboptimal fit of user and system (e.g. distance and alignment of the user’s head to monitor; range of motion). The adaptation of a system’s physical characteristics (e.g. size, weight) to meet a user’s anthropometric and physiological constraints is the essence of physical ergonomics.
As systems move from supporting mere mechanical tasks to more complex, intellectual tasks, cognitive demands also need to be addressed. “We must master an ergonomics of the mind if we want to design interfaces that are likely to work well” (Raskin, 2000, p. 10). In other words, physical ergonomics alone does not suffice but necessitates an equivalent discipline that addresses mental abilities and constraints of users: cognitive ergonomics (Hollnagel, 1997). Cognitive ergonomics emphasizes the comprehensibility of system use and is therefore closely related to the concepts of usability (ISO, 1998) and ease of use (e.g. Davis, 1989). In line with an ergonomic mindset of preventing pain, interactive products are said to be designed so that their use is free of effort (Davis, et al., 1989) and free of discomfort (ISO, 1998).
Sharp et al. (2007) summarize that, in terms of usability goals, interactive products should be effective, efficient, and safe to use, easy to learn, easy to remember how to use, and should finally ensure good functionality. Regarding the interaction itself, the seven dialogue principles outlined in ISO 9241-110 (2006) literally have become a quality standard: (1) suitability for the task, (2) self descriptiveness, (3) conformity with user expectations, (4) suitability for learning, (5) controllability, (6) error tolerance, (7) suitability for individualization. On a more general level of software engineering, the following six (internal and external) attributes are seen as influential: functionality, reliability, usability, efficiency, maintainability, and portability (ISO, 2001).
2 THEORETICAL AND METHODOLOGICAL BACKGROUND 32
The attributes listed here have dominated the field of HCI for years with their exclusive instrumental focus on task achievement and productivity. While this might be reasonable in a work context, where a persuasive usefulness of a system can outweigh drawbacks regarding ease of use or pleasure of use, it certainly does not cover the entire spectrum of relevant attributes for a voluntary use (e.g. in a leisure or home context).
Non-Instrumental Attributes
A user’s attitude toward a product is likely to be influenced by more than just instrumental concerns such as reaction times and error rates or a product’s functionality. Next to effectiveness and efficiency, satisfaction is the third pillar of usability in the ISO standard 9241-11 (1998). Here, satisfaction is defined as “freedom from discomfort, and positive attitudes towards the use of the product” (ISO, 1998, p. 2). Hassenzahl interprets satisfaction as an “emotional consequence of goal-directed product use” (Hassenzahl, 2004, p. 345). It is important to note that satisfaction should not be regarded as the same but rather as a distinct concept to pleasure and enjoyment: while satisfaction is the positive emotional consequence of attribute fulfillment as desired and expected by the user (Blackwell, et al., 2006; ISO, 2005; Oliver, 1997), enjoyment is a quality of emotional responses in its own right and not bound to anticipated product performance (Carroll & Thomas, 1988; Davis, et al., 1992). In other words, emotional involvement is not limited to an evaluative consequence in terms of satisfaction, but can rather be regarded as an influencing factor itself.
Logan (1994) was one of the first to acknowledge emotional involvement and pleasure as a crucial part of interface design. He suggested a conceptual differentiation of usability into behavioral usability on the one hand and emotional usability on the other. Emotional usability goes beyond a ‘functional objective’ and is in particular appropriate for consumer goods (Logan, Augaitis, & Renk, 1994). However, even for (serious) information appliances, Norman (1998) includes emotional involvement as one of three design axioms: (1) simplicity, (2) versatility (encouragement of novel interactions), and (3) pleasurability.
Hancock et al. (2005) coined the term of hedonomics as the part of the human factors discipline that should be devoted to “the promotion of pleasurable human-technology interaction” (p. 8). One could also call it ‘positive design’ as it intends to focus on human strengths and pleasure as a counterpart to the prevailing approach of damage limitation. As an example, while satisfaction as defined in the ISO 9241-11 standard (1998) has the goal to reduce discomfort, hedonomics would aim for enhanced comfort (or even pleasure). The authors argue, with reference to Maslow’s hierarchy of needs (Maslow, 1954), that once safety and functionality are ensured, pleasure and means of individuation (individual customization) should be promoted.
Similarly, Jordan (2000) proposed a hierarchy of consumer needs: Level 1 comprises functionality as a prerequisite of usefulness. Once appropriate functionality is provided, users will want a product that is easy to use, and they will therefore request usability (Level 2). Finally, on Level 3
2 THEORETICAL AND METHODOLOGICAL BACKGROUND 33
(pleasure), users will appreciate products that “bring not only functional benefits but also emotional ones” (Jordan, 2000, p. 6). Hierarchical frameworks are helpful in conceptual terms but should not be seen as rigid, mandatory conditions. For example, as shown by van der Heijden (2004), enjoyment (pleasure) might be more important than usefulness for a product that serves recreational purposes and is more pleasure-oriented than productivity-oriented. Thus, products with limited usefulness and inferior usability might still be enjoyable. In fact, enjoyment might actually be seen as the usefulness of certain products, depending on the values they fulfill for the user (Hirschman & Holbrook, 1982; Holbrook, 1999).
Some authors view affective responses that have been elicited through product use, such as fun, pleasure, or joy, as hedonic attributes (Batra & Ahtola, 1990), others see emotional responses rather as a consequence of the perception of hedonic and pragmatic attributes (Hassenzahl, 2001; Mahlke & Thüring, 2007). Either way, emotional involvement has been recognized as a key aspect in interaction design [for an exhaustive review on affective and pleasurable design see Helander and Khalid (2006)].
In the elaborate CUE (Components of User Experience) model, Mahlke and Thüring (2007) suggest that emotional reactions are a consequence of perceiving instrumental and non-instrumental attributes. Yet, all three components influence the user’s overall judgment and subsequent usage behavior. Thus, whether emotions are seen as hedonic attributes (Batra & Ahtola, 1990) or not, the perception or even expectation of emotional reactions is regarded to be an antecedent of a user’s attitude toward a product. Therefore, emotional involvement qualifies as an important attribute of interactive technologies with respect to technology acceptance (Davis, et al., 1992; Igbaria, et al., 1994), as attributes relate to aspects of the product itself or its use (Grunert, 1989). Emotions are clearly not a property of a product, but can be elicited through it (Desmet, 2002).
In addition to a hierarchy of consumer needs, Jordan (2000) further suggests that over time, usability has turned from an ‘attractive requirement’ that can delight and surprise users into a ‘must-be requirement’ that is now been taken for granted (Kano, Seraku, Takahashi, & Tsuji, 1984; Matzler, Hinterhuber, Bailom, & Sauerwein, 1996; Oliver, 1997). If good usability is expected, it will not be explicitly appreciated, whilst poor usability will lead to complaints by the user. The question arises what then can delight users of interactive systems and which attributes can additionally increase the likelihood of usage.
“Traditional usability factors determine whether a device can be used; aesthetic factors determine whether a device will be used, and what the emotional, psychological, and social outcomes of the user-product interaction will be” (Forlizzi, Hirsch, Hyder, & Goetz, 2001). Technology acceptance is certainly more multi-faceted than simply relying on aesthetic factors. However, this statement highlights that whether a product is used or not goes beyond the instrumental. Aesthetic (visual, haptic, acoustic) and symbolic (e.g. identification, evocation) aspects are prototypical non-instrumental attributes (Mahlke, et al., 2007).
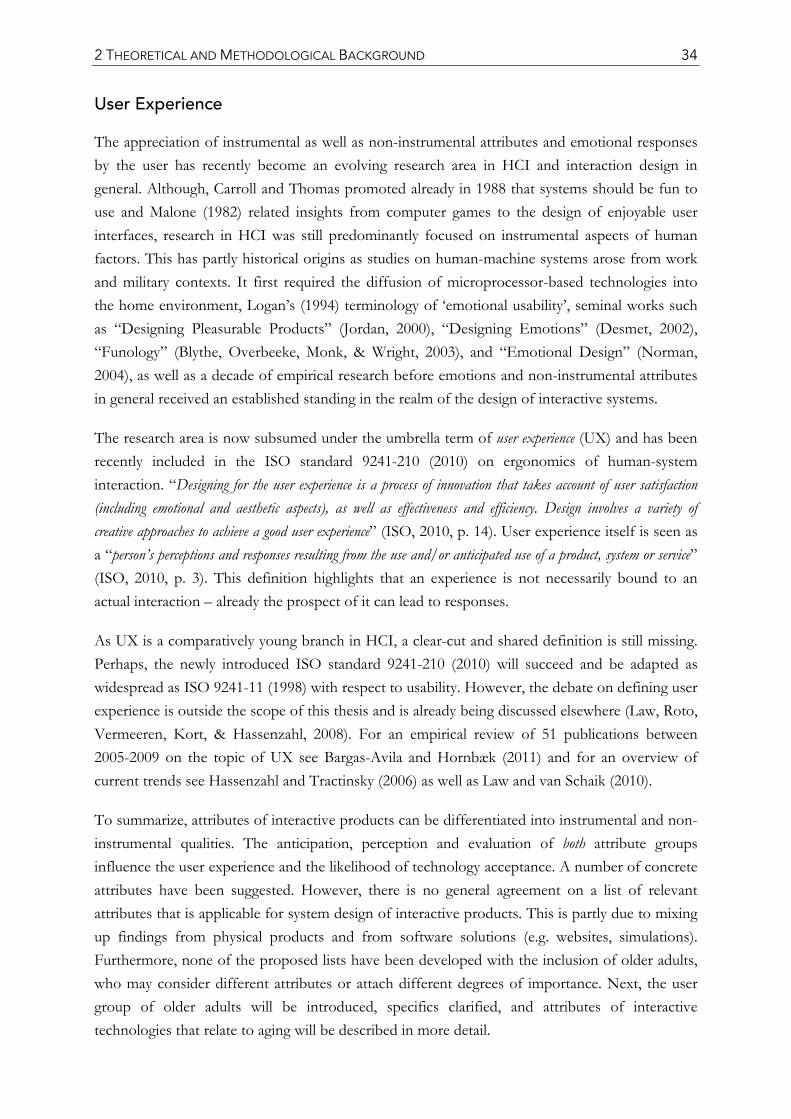
2 THEORETICAL AND METHODOLOGICAL BACKGROUND 34
User Experience
The appreciation of instrumental as well as non-instrumental attributes and emotional responses by the user has recently become an evolving research area in HCI and interaction design in general. Although, Carroll and Thomas promoted already in 1988 that systems should be fun to use and Malone (1982) related insights from computer games to the design of enjoyable user interfaces, research in HCI was still predominantly focused on instrumental aspects of human factors. This has partly historical origins as studies on human-machine systems arose from work and military contexts. It first required the diffusion of microprocessor-based technologies into the home environment, Logan’s (1994) terminology of ‘emotional usability’, seminal works such as “Designing Pleasurable Products” (Jordan, 2000), “Designing Emotions” (Desmet, 2002), “Funology” (Blythe, Overbeeke, Monk, & Wright, 2003), and “Emotional Design” (Norman, 2004), as well as a decade of empirical research before emotions and non-instrumental attributes in general received an established standing in the realm of the design of interactive systems.
The research area is now subsumed under the umbrella term of user experience (UX) and has been recently included in the ISO standard 9241-210 (2010) on ergonomics of human-system interaction. “Designing for the user experience is a process of innovation that takes account of user satisfaction (including emotional and aesthetic aspects), as well as effectiveness and efficiency. Design involves a variety of creative approaches to achieve a good user experience” (ISO, 2010, p. 14). User experience itself is seen as a “person’s perceptions and responses resulting from the use and/or anticipated use of a product, system or service” (ISO, 2010, p. 3). This definition highlights that an experience is not necessarily bound to an actual interaction – already the prospect of it can lead to responses.
As UX is a comparatively young branch in HCI, a clear-cut and shared definition is still missing. Perhaps, the newly introduced ISO standard 9241-210 (2010) will succeed and be adapted as widespread as ISO 9241-11 (1998) with respect to usability. However, the debate on defining user experience is outside the scope of this thesis and is already being discussed elsewhere (Law, Roto, Vermeeren, Kort, & Hassenzahl, 2008). For an empirical review of 51 publications between 2005-2009 on the topic of UX see Bargas-Avila and Hornbæk (2011) and for an overview of current trends see Hassenzahl and Tractinsky (2006) as well as Law and van Schaik (2010).
To summarize, attributes of interactive products can be differentiated into instrumental and non-instrumental qualities. The anticipation, perception and evaluation of both attribute groups influence the user experience and the likelihood of technology acceptance. A number of concrete attributes have been suggested. However, there is no general agreement on a list of relevant attributes that is applicable for system design of interactive products. This is partly due to mixing up findings from physical products and from software solutions (e.g. websites, simulations). Furthermore, none of the proposed lists have been developed with the inclusion of older adults, who may consider different attributes or attach different degrees of importance. Next, the user group of older adults will be introduced, specifics clarified, and attributes of interactive technologies that relate to aging will be described in more detail.
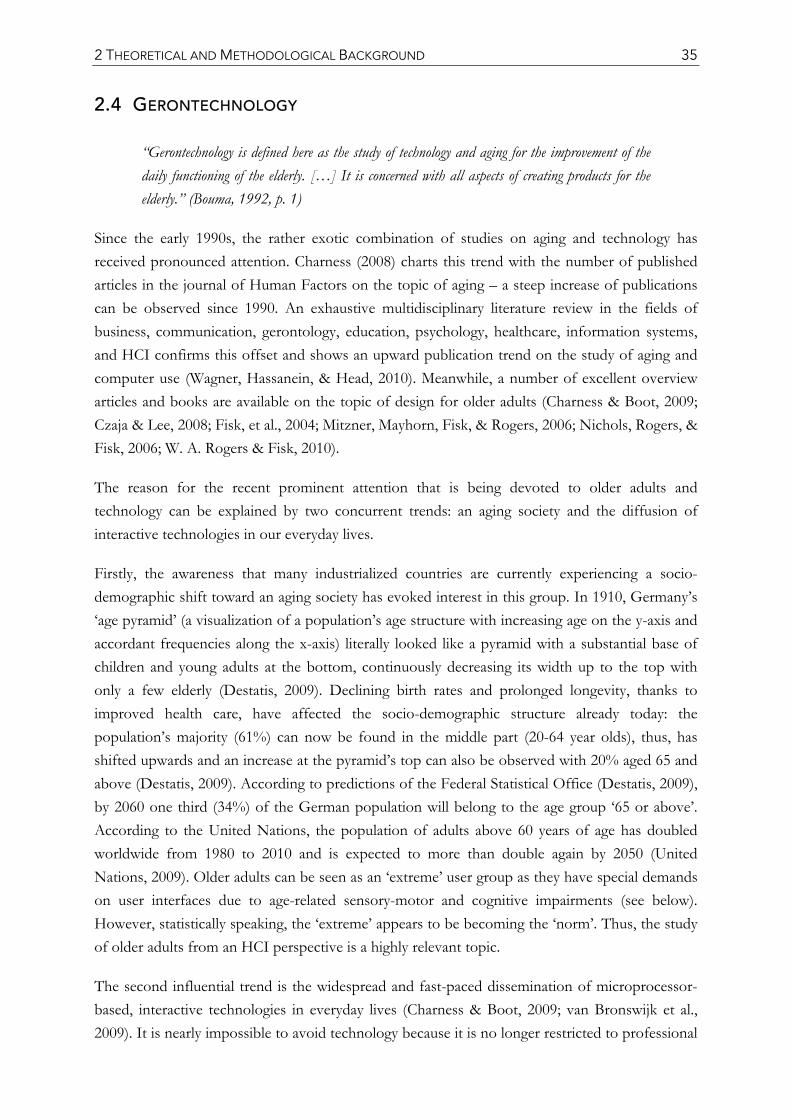
2 THEORETICAL AND METHODOLOGICAL BACKGROUND 35
2.4 GERONTECHNOLOGY
“Gerontechnology is defined here as the study of technology and aging for the improvement of the daily functioning of the elderly. […] It is concerned with all aspects of creating products for the elderly.” (Bouma, 1992, p. 1)
Since the early 1990s, the rather exotic combination of studies on aging and technology has received pronounced attention. Charness (2008) charts this trend with the number of published articles in the journal of Human Factors on the topic of aging – a steep increase of publications can be observed since 1990. An exhaustive multidisciplinary literature review in the fields of business, communication, gerontology, education, psychology, healthcare, information systems, and HCI confirms this offset and shows an upward publication trend on the study of aging and computer use (Wagner, Hassanein, & Head, 2010). Meanwhile, a number of excellent overview articles and books are available on the topic of design for older adults (Charness & Boot, 2009; Czaja & Lee, 2008; Fisk, et al., 2004; Mitzner, Mayhorn, Fisk, & Rogers, 2006; Nichols, Rogers, & Fisk, 2006; W. A. Rogers & Fisk, 2010).
The reason for the recent prominent attention that is being devoted to older adults and technology can be explained by two concurrent trends: an aging society and the diffusion of interactive technologies in our everyday lives.
Firstly, the awareness that many industrialized countries are currently experiencing a socio-demographic shift toward an aging society has evoked interest in this group. In 1910, Germany’s ‘age pyramid’ (a visualization of a population’s age structure with increasing age on the y-axis and accordant frequencies along the x-axis) literally looked like a pyramid with a substantial base of children and young adults at the bottom, continuously decreasing its width up to the top with only a few elderly (Destatis, 2009). Declining birth rates and prolonged longevity, thanks to improved health care, have affected the socio-demographic structure already today: the population’s majority (61%) can now be found in the middle part (20-64 year olds), thus, has shifted upwards and an increase at the pyramid’s top can also be observed with 20% aged 65 and above (Destatis, 2009). According to predictions of the Federal Statistical Office (Destatis, 2009), by 2060 one third (34%) of the German population will belong to the age group ‘65 or above’. According to the United Nations, the population of adults above 60 years of age has doubled worldwide from 1980 to 2010 and is expected to more than double again by 2050 (United Nations, 2009). Older adults can be seen as an ‘extreme’ user group as they have special demands on user interfaces due to age-related sensory-motor and cognitive impairments (see below). However, statistically speaking, the ‘extreme’ appears to be becoming the ‘norm’. Thus, the study of older adults from an HCI perspective is a highly relevant topic.
The second influential trend is the widespread and fast-paced dissemination of microprocessor-based, interactive technologies in everyday lives (Charness & Boot, 2009; van Bronswijk et al., 2009). It is nearly impossible to avoid technology because it is no longer restricted to professional
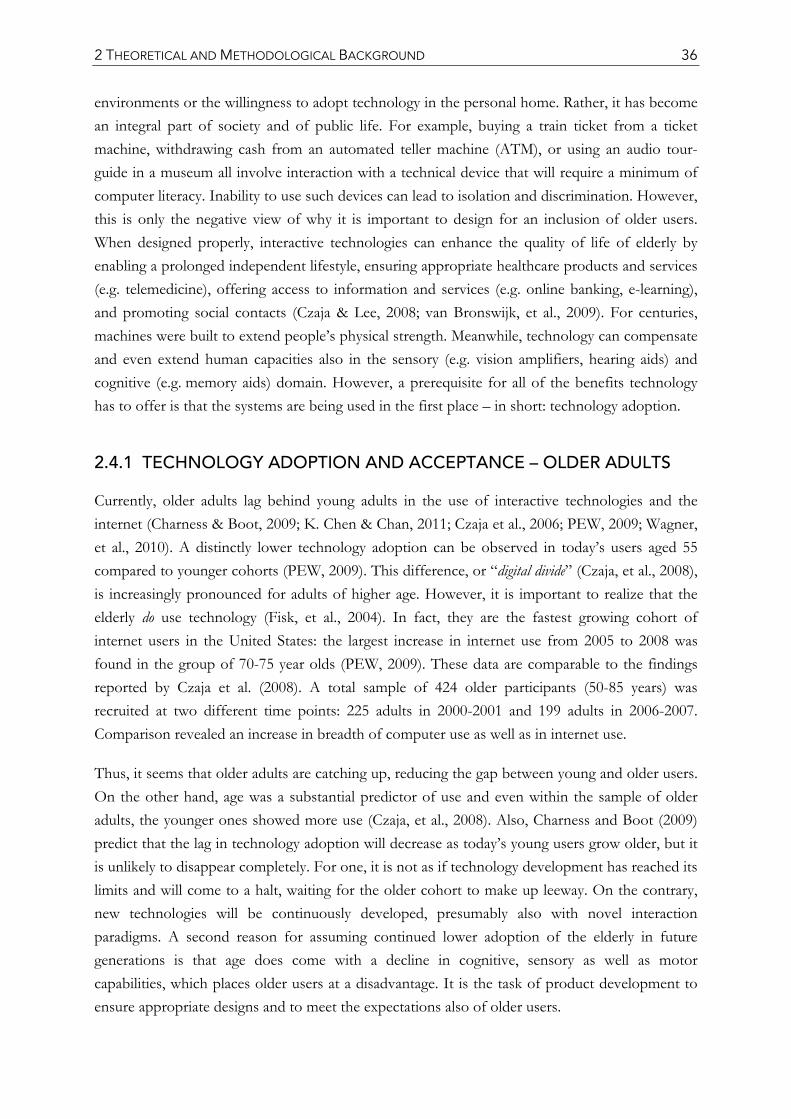
2 THEORETICAL AND METHODOLOGICAL BACKGROUND 36
environments or the willingness to adopt technology in the personal home. Rather, it has become an integral part of society and of public life. For example, buying a train ticket from a ticket machine, withdrawing cash from an automated teller machine (ATM), or using an audio tour-guide in a museum all involve interaction with a technical device that will require a minimum of computer literacy. Inability to use such devices can lead to isolation and discrimination. However, this is only the negative view of why it is important to design for an inclusion of older users. When designed properly, interactive technologies can enhance the quality of life of elderly by enabling a prolonged independent lifestyle, ensuring appropriate healthcare products and services (e.g. telemedicine), offering access to information and services (e.g. online banking, e-learning), and promoting social contacts (Czaja & Lee, 2008; van Bronswijk, et al., 2009). For centuries, machines were built to extend people’s physical strength. Meanwhile, technology can compensate and even extend human capacities also in the sensory (e.g. vision amplifiers, hearing aids) and cognitive (e.g. memory aids) domain. However, a prerequisite for all of the benefits technology has to offer is that the systems are being used in the first place – in short: technology adoption.
2.4.1 TECHNOLOGY ADOPTION AND ACCEPTANCE – OLDER ADULTS
Currently, older adults lag behind young adults in the use of interactive technologies and the internet (Charness & Boot, 2009; K. Chen & Chan, 2011; Czaja et al., 2006; PEW, 2009; Wagner, et al., 2010). A distinctly lower technology adoption can be observed in today’s users aged 55 compared to younger cohorts (PEW, 2009). This difference, or “digital divide” (Czaja, et al., 2008), is increasingly pronounced for adults of higher age. However, it is important to realize that the elderly do use technology (Fisk, et al., 2004). In fact, they are the fastest growing cohort of internet users in the United States: the largest increase in internet use from 2005 to 2008 was found in the group of 70-75 year olds (PEW, 2009). These data are comparable to the findings reported by Czaja et al. (2008). A total sample of 424 older participants (50-85 years) was recruited at two different time points: 225 adults in 2000-2001 and 199 adults in 2006-2007. Comparison revealed an increase in breadth of computer use as well as in internet use.
Thus, it seems that older adults are catching up, reducing the gap between young and older users. On the other hand, age was a substantial predictor of use and even within the sample of older adults, the younger ones showed more use (Czaja, et al., 2008). Also, Charness and Boot (2009) predict that the lag in technology adoption will decrease as today’s young users grow older, but it is unlikely to disappear completely. For one, it is not as if technology development has reached its limits and will come to a halt, waiting for the older cohort to make up leeway. On the contrary, new technologies will be continuously developed, presumably also with novel interaction paradigms. A second reason for assuming continued lower adoption of the elderly in future generations is that age does come with a decline in cognitive, sensory as well as motor capabilities, which places older users at a disadvantage. It is the task of product development to ensure appropriate designs and to meet the expectations also of older users.
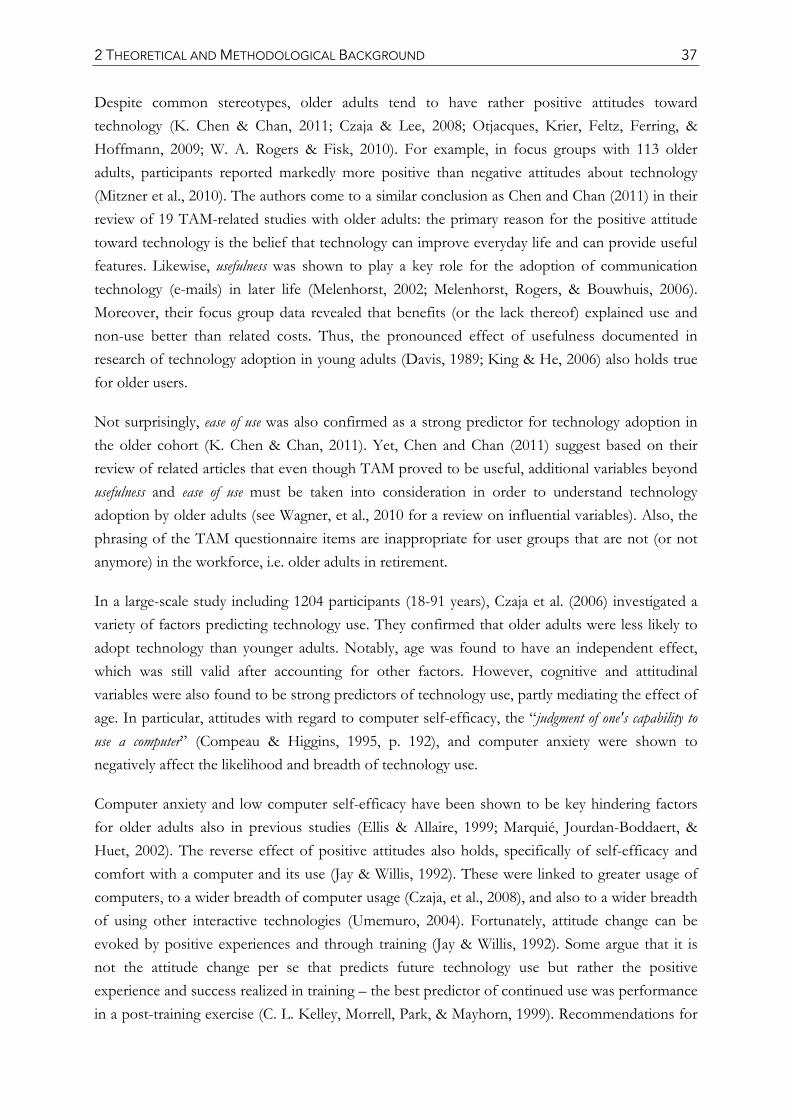
2 THEORETICAL AND METHODOLOGICAL BACKGROUND 37
Despite common stereotypes, older adults tend to have rather positive attitudes toward technology (K. Chen & Chan, 2011; Czaja & Lee, 2008; Otjacques, Krier, Feltz, Ferring, & Hoffmann, 2009; W. A. Rogers & Fisk, 2010). For example, in focus groups with 113 older adults, participants reported markedly more positive than negative attitudes about technology (Mitzner et al., 2010). The authors come to a similar conclusion as Chen and Chan (2011) in their review of 19 TAM-related studies with older adults: the primary reason for the positive attitude toward technology is the belief that technology can improve everyday life and can provide useful features. Likewise, usefulness was shown to play a key role for the adoption of communication technology (e-mails) in later life (Melenhorst, 2002; Melenhorst, Rogers, & Bouwhuis, 2006). Moreover, their focus group data revealed that benefits (or the lack thereof) explained use and non-use better than related costs. Thus, the pronounced effect of usefulness documented in research of technology adoption in young adults (Davis, 1989; King & He, 2006) also holds true for older users.
Not surprisingly, ease of use was also confirmed as a strong predictor for technology adoption in the older cohort (K. Chen & Chan, 2011). Yet, Chen and Chan (2011) suggest based on their review of related articles that even though TAM proved to be useful, additional variables beyond usefulness and ease of use must be taken into consideration in order to understand technology adoption by older adults (see Wagner, et al., 2010 for a review on influential variables). Also, the phrasing of the TAM questionnaire items are inappropriate for user groups that are not (or not anymore) in the workforce, i.e. older adults in retirement.
In a large-scale study including 1204 participants (18-91 years), Czaja et al. (2006) investigated a variety of factors predicting technology use. They confirmed that older adults were less likely to adopt technology than younger adults. Notably, age was found to have an independent effect, which was still valid after accounting for other factors. However, cognitive and attitudinal variables were also found to be strong predictors of technology use, partly mediating the effect of age. In particular, attitudes with regard to computer self-efficacy, the “judgment of one's capability to use a computer” (Compeau & Higgins, 1995, p. 192), and computer anxiety were shown to negatively affect the likelihood and breadth of technology use.
Computer anxiety and low computer self-efficacy have been shown to be key hindering factors for older adults also in previous studies (Ellis & Allaire, 1999; Marquié, Jourdan-Boddaert, & Huet, 2002). The reverse effect of positive attitudes also holds, specifically of self-efficacy and comfort with a computer and its use (Jay & Willis, 1992). These were linked to greater usage of computers, to a wider breadth of computer usage (Czaja, et al., 2008), and also to a wider breadth of using other interactive technologies (Umemuro, 2004). Fortunately, attitude change can be evoked by positive experiences and through training (Jay & Willis, 1992). Some argue that it is not the attitude change per se that predicts future technology use but rather the positive experience and success realized in training – the best predictor of continued use was performance in a post-training exercise (C. L. Kelley, Morrell, Park, & Mayhorn, 1999). Recommendations for
2 THEORETICAL AND METHODOLOGICAL BACKGROUND 38
the design of training for older users can be found in Fisk et al. (2004) and in Bruder, Blessing, and Wandke (2007).
Prior experience is not limited to recent experience with a specific device, but also includes prior experience across the lifespan. Foremost, experience in early adulthood (before the age of 25) is regarded as formative and will influence following behavior, preferences, and attitudes (Docampo Rama, de Ridder, & Bouma, 2001; Schindler & Holbrook, 2003). When today’s elderly were young, other paradigms of technology and technology use existed. A study in the Netherlands showed that based on the kind of interfaces that were available in the formative period, two generations can be broadly distinguished: the electro-mechanical generation (birth cohorts between 1918 and 1959) and the software-generation (born in or after 1960) (Docampo Rama, 2001; Docampo Rama, et al., 2001). The software-generation can be further differentiated into the display generation (born between 1960-1970) and the menu-generation (born in or after 1970) (Docampo Rama, 2001). In empirical studies the authors could separate an age-related effect that caused longer task durations (reduced speed) and a technology-generation effect in error performance (Docampo Rama, 2001; Docampo Rama, et al., 2001). Stewart (1992) already pointed out that it is not only that older adults have to learn more than younger adults when interacting with modern technology but they also have to unlearn more. They have to distance themselves from their previous experience with more mechanically based systems.
In sum, research on technology adoption by older adults has shown that older adults use technology less than young adults (despite the increase in usage observed in recent years) and that numerous factors predict the likelihood of usage (e.g. age, cognitive and attitudinal variables, perceived benefits/usefulness, prior experience). The emphasis on external factors rather than on internal attributes of system design makes it difficult to draw practical conclusions for product development. Next, developmental changes associated with aging and design implications will be outlined before discussing what is known regarding the role of instrumental and non-instrumental attributes.
2.4.2 AGE-RELATED CHANGES AND DESIGN IMPLICATIONS
Various sources describe the process of aging in detail (see Birren & Schaie, 2001; Craik & Salthouse, 2000). Here, age-related changes that affect the design of interactive systems are summarized and examples of resultant design implications will be presented (for reviews see Charness & Boot, 2009; Czaja & Lee, 2008; Fisk, et al., 2004; Mitzner, et al., 2006; Nichols, et al., 2006; Schieber, 2003) as “if it cannot be seen, heard, or manipulated, it cannot be used” (Fisk, et al., 2004, p. 144). It is important to note that older adults are a very heterogeneous group. There is substantial inter- and intra-individual variability with respect to the impairments listed below. Not everyone is affected by these changes to the same extent, nor in every situation.
2 THEORETICAL AND METHODOLOGICAL BACKGROUND 39
Sensory/Perceptual Processes
As we age, a number of sensory processes change. With respect to the design of interactive technologies, vision and hearing receive the greatest attention.
Vision Visual impairments include (Schieber, 2003):
declines in visual acuity (ability to discriminate fine spatial details)
decrements in contrast sensitivity
reduced color discrimination of shorter wavelength light (blue and green)
susceptibility to glare
slowing of dark adaptation
reduction of peripheral vision (width of visual field)
inferior sensitivity regarding perception of motion and/or accuracy of speed perception.
Some straight-forward design implications are adequate font size (especially in the periphery), screens positioned at optimal reading distance, careful use of color coding (in particular of blue and green), minimization of glare, avoidance of an animated display of information, and sufficient contrast (Czaja & Lee, 2008; Fisk, et al., 2004; Nichols, et al., 2006; Schieber, 2003).
Hearing Auditory signals are usually an important information channel in interactive technologies. They can be the primary source of information and/or used to convey feedback and alarm the user in case of a potentially endangering situation or erroneous system status. Thus, design elements must be appropriately adapted to the following age-related impairments in order to avoid missed information and moreover missed alarms (Nichols, et al., 2006; Schieber, 2003):
decreased auditory acuity, in particular for higher frequencies
difficulty filtering out background noise
problems localizing sounds, specifically front/back discriminations.
Sounds with a high pitch (frequencies beyond 4000 Hz) should be avoided as they might not be detected (Fisk, et al., 2004). Background noise should be minimized and volume control provided. Auditory stimuli that need to be localized should not be presented directly in front of or behind the user and should be presented long enough to permit head movement (Nichols, et al., 2006). In general, redundant information presentation across modalities (visual and auditory) is advisable in order to reduce the likelihood of missed information (Fisk, et al., 2004; Nichols, et al., 2006).
2 THEORETICAL AND METHODOLOGICAL BACKGROUND 40
Movement Control
The physical handling of a device by an older adult is challenged due to
reduced muscle strength (Chaparro et al., 2000; Nichols, et al., 2006)
deteriorating dexterity (Smith, Sharit, & Czaja, 1999; Stewart, 1992)
decline in range of motion of joints (e.g. of the wrist) (Chaparro, et al., 2000)
slowing of motor functions and difficulties regarding coordination (Ketcham & Stelmach, 2004; Vercruyssen, 1997)
the initiation of movement is delayed and
the performance itself is less precise than that of young adults (Fisk, et al., 2004; Ketcham & Stelmach, 2004).
These aspects are especially relevant for hardware components such as input devices (Chaparro, et al., 2000). A study by Smith, Sharit, and Czaja (1999) demonstrated inferior performance of older adults in comparison with younger participants when using a mouse for pointing, clicking, double-clicking, and dragging. Especially time-critical actions (e.g. double clicking) should be avoided or at least adapted to older users’ response times. Buttons should be sufficiently wide apart and tactile feedback reinforced (Fisk, et al., 2004).
Some of these problems can be addressed using advanced software solutions. For example, icon size could be increased and ‘sticky icons’ that attract the cursor might prove beneficial to facilitate fine motor movement control (Nichols, et al., 2006).
Cognition
Regarding cognitive processes, it is important to distinguish between crystallized and fluid intelligence, as only the latter declines with increased age (Craik & Bialystok, 2006). Crystallized intelligence, also called ‘cognitive pragmatics’ (Craik & Bialystok, 2006), represents accumulated knowledge and is therefore dependent on prior experience (e.g. education, cultural factors). Crystallized intelligence increases with age and is basically maintained at a high level. This can be exemplified by maintained semantic memory, i.e. declarative knowledge of facts, while most other memory subsystems deteriorate with age (Nichols, et al., 2006). The concept of crystallized intelligence is often associated with ‘wisdom’ of older adults (Craik & Bialystok, 2006). Unfortunately, this upheld strength of older users is rarely made use of in interface design. Instead, the design focus is usually devoted to age-related decline and inferior efficiency as exposed by declining fluid intelligence.
2 THEORETICAL AND METHODOLOGICAL BACKGROUND 41
Fluid intelligence, also called ‘cognitive mechanics’, refers to the speed and complexity of cognitive control and the ability to draw inferences in situations where general knowledge (representations in terms of crystallized intelligence) is of little help (Craik & Bialystok, 2006). Well-studied age-related impairments with respect to attention, executive functions, memory, and general slowing are summarized in the following:
slowing of processing speed and consequently of response times (Salthouse, 1996; Schaie, 2004)
problems to access stored information (free recall) (Craik & Bialystok, 2006)
difficulties in goal maintenance and planning (prospective memory) (Nichols, et al., 2006; Schieber, 2003)
decrease in working memory capacity (Schieber, 2003)
deficits to inhibit attention to irrelevant stimuli (selective attention) (Hasher & Zacks, 1988)
difficulties carrying out and coordinating multiple tasks simultaneously (divided attention) (McDowd & Shaw, 2000)
decreased vigilance, the detection of rare events (sustained attention) (Schaie, 2004)
inferior problem solving and inference formation (Czaja & Lee, 2008).
These difficulties are not knock-out criteria regarding the use of interactive technologies. Many of them can be evaded or compensated by providing sufficient time for the user to process the information as well as by following simple rules to reduce interface complexity and working memory load.
Interactive products should be patient with older users. General slowing (Salthouse, 1996) of processing speed and of motor execution with increasing age, requires a system that can wait. Thus, time-critical actions should be reduced or thresholds adapted. In two quasi-experimental eye-tracking studies on information search tasks with typical web search engines, older adults took longer to complete the searches than young adults (Hanson, 2010). However, in the end, young and older adults did not differ regarding their accuracy in completing the tasks.
Ziefle and Bay (2005) showed that although young adults outperformed their older counterparts on average regarding the operation of mobile phones with differing complexity (defined by the number of necessary production rules), older adults using the low complex phone performed equally well or even better than young adults using the complex variant. Hence, complexity affects users of all age groups and it would be inappropriate to assume that older adults are unable to use a mobile phone per se. It is the challenge of the design team to find a usable solution of manageable complexity.
2 THEORETICAL AND METHODOLOGICAL BACKGROUND 42
A rather flat menu hierarchy is preferred over a complex depth that requires the user to remember numerous menu items at each level (Mitzner, et al., 2006). Relevant information should be displayed instead of requiring the user to remember and update the information in working memory (Nichols, et al., 2006). In contrast, the presentation of irrelevant information (stimulus clutter) should be minimized and important data highlighted (Czaja & Lee, 2008; Schieber, 2003). If possible, the concurrent execution of multiple tasks should be avoided.
Cued recall or recognition of information is favored over the necessity to recall information without ‘environmental support’ for retrieval (Charness, 2008). Environmental support can be achieved through enhanced perceptual and/or semantic cues (Schieber, 2003) and thereby drawing upon the maintained semantic memory (crystallized intelligence). However, knowledge of the user’s prior experience is needed to select appropriate cues (e.g. metaphors for icons). Self-descriptive dialogues and conformity with user expectations as suggested by ISO standard 9241-110 (2006) need to be identified and defined for each user group and are not necessarily valid for all users. For example, different technology generations (Docampo Rama, 2001) might make different associations.
Prompts as reminder aids can compensate for problems regarding prospective memory (Schieber, 2003). In general, system layout should convey a comprehensible structure and similar functions should be realized in a consistent manner (Fisk, et al., 2004).
Implications for Research Studies Involving Older Adults
Note that age-related changes also need to be taken into consideration when involving older users in the design process and conducting research in general (e.g. adapting the pace to the participant’s capabilities, providing memory cues, reducing working memory load, ensuring a sufficiently big font size). For more elaborate descriptions see Fisk et al. (2004) and Reinicke (2004).
2.4.3 ATTRIBUTES OF INTERACTIVE TECHNOLOGIES – OLDER ADULTS
Instrumental Attributes – Older Adults
Accommodating a design to the requirements of user groups with increased demands due to age-related impairments or disabilities has also received great attention under the heading of ‘universal design’, ‘design for all’, or ‘inclusive design’. Inclusive design is not limited to the design for elderly, but has the goal to include as many users as possible (Macdonald & Lebbon, 2001). The underlying assumption is that by designing for an unimpaired group, those with impairments will be excluded. However, designing for those with disabilities or other constraints often leads to design solutions that are also beneficial for the unimpaired.
2 THEORETICAL AND METHODOLOGICAL BACKGROUND 43
Seven principles of universal design were formulated by the Center for Universal Design at North Carolina State University. They can be seen as heuristics of universal product design (not limited to interactive technologies) (Story, Mueller, & Mace, 1998, p. 34f):
1. Equitable Use: The design is useful and marketable to people with diverse abilities. 2. Flexibility in Use: The design accommodates a wide range of individual preferences and
abilities. 3. Simple and Intuitive Use: Use of the design is easy to understand, regardless of the user’s
experience, knowledge, language skills, or current concentration level. 4. Perceptible Information: The design communicates necessary information effectively to
the user, regardless of ambient conditions or the user’s sensory abilities. 5. Tolerance for Error: The design minimizes hazards and the adverse consequences of
accidental or unintended actions. 6. Low Physical Effort. The design can be used efficiently and comfortably and with a
minimum of fatigue. 7. Size and Space for Approach and Use: Appropriate size and space is provided for
approach, reach, manipulation, and use regardless of user’s body size, posture or mobility.
The seven principles confirm the main conclusion that can be drawn from the age-related changes and design implications described above: physical ergonomics as well as cognitive ergonomics are crucial attributes for an adequate design of interactive technologies for an older user group. Fortunately, a substantial amount of work has been conducted in this field that allows the formulation of design guidelines (Czaja & Lee, 2008; Fisk, et al., 2004; Nichols, et al., 2006). Together with perceived usefulness (K. Chen & Chan, 2011; Melenhorst, 2002; Melenhorst, et al., 2006), there is no doubt that instrumental attributes influence an older user’s judgment of appeal and in consequence the likelihood of adoption.
Unfortunately, a picture similar to the one observed for prominent technology acceptance models arises – all of the above-listed attributes have a strong instrumental focus, i.e. on task accomplishment, including ergonomics and ease of use. From a system design perspective, research on the importance of non-instrumental attributes for older adults has been widely neglected.
Non-Instrumental Attributes – Older Adults
As outlined for HCI research in general (see previous section, p. 29ff), much is known about performance-oriented issues in human factors to prevent potential health problems. However, the promotion of pleasure as requested by Hancock et al.’s (2005) concept of hedonomics and the emerging research efforts on user experience – including the appreciation of non-instrumental attributes (e.g. aesthetics) – remain to be taken seriously when designing interactive products for older adults.
2 THEORETICAL AND METHODOLOGICAL BACKGROUND 44
When discussing emotional involvement and older adults, a study conducted by Conci et al. (2009) should be mentioned. A modification of TAM (Davis, 1989) including enjoyment as a predictor of the behavioral intention to use a mobile phone was tested among 740 respondents aged 65 and above. Results showed that enjoyment was an important predictor, however, only mediated by instrumental aspects. In other words, enjoyment was important to the extent that it affected perceived usefulness (e.g. “if it is fun, then it is useful”) and/or ease of use (e.g. “if it is fun, it will be easier to use”). The strongest predictor of behavioral intention was usefulness.
Contradictory results are reported by Lee (2007) who tested a multiple regression model that was also inspired by TAM: here, the criterion of user satisfaction regarding mobile phone usage was to be predicted by ease of use, usefulness, and pleasure of use. Questionnaires of 154 older respondents (56-90 years old) were analyzed. All three predictors showed a significant influence on user satisfaction. Ranked by beta weights, ease of use had the greatest impact, followed by pleasure and lastly usefulness. An exploratory factor analysis revealed low convergent validity of the four items assessing pleasure of use. The composition of two dimensions seemed more appropriate, namely of aesthetics and entertainment. Lee conducted a second multiple regression analysis with the same data, this time including the sub-dimensions as predictors. Of the pleasure dimensions, only aesthetics proved to be a significant predictor.
Somehow, aesthetics appears to have been neglected or assumed unimportant when designing for an older user group. Apparently, little seems to have changed in the mindset of designers since Stewart’s (1992) contribution some 20 years ago. The chapter appeared in the pioneering book “Gerontechnology” (Bouma & Graafmans, 1992) and was entitled: Physical interfaces or “obviously it's for the elderly, it's grey, boring and dull” (Stewart, 1992, p. 197). Good ergonomics and design also means that “the product should be aesthetically pleasing in its appearance, form, use of materials and finishes” (Stewart, 1992, p. 206). However, products designed for older users often evoke associations with ‘disability’, ‘hospital’, or just generally being ‘dull’ and certainly not aesthetically pleasing. Such a stigmatizing appearance might decrease the appeal of a product and consequently reduce the likelihood of usage, regardless of its potential assistive value (Hirsch, et al., 2000).
This was an impression resulting from a study that included interviews with five older adults and self-documentation of another ten older adults (age range of entire sample: 75 to 92 years) as well as interviews with five caregivers (Forlizzi, et al., 2001; Hirsch, et al., 2000). Several older users of assistive technologies did not use the devices outside the home environment because they feared embarrassment, i.e. the emotional consequences. Hence, in their outer appearance technologies need to convey a positive emotional outlook and should match the impression that the user might want to communicate through the device [identification (Hassenzahl, 2003)]. Hirsch et al. (2000) discuss a second consideration regarding aesthetics (of assistive technologies) and older adults: context of use. If the product is to be used at home it should be designed in a way that it does not disturb the interior or, even better, can match the home environment.
2 THEORETICAL AND METHODOLOGICAL BACKGROUND 45
To conclude, despite the stated importance of considering non-instrumental attributes in the design of products for older adults (e.g. Forlizzi, et al., 2001; Hirsch, et al., 2000; Stewart, 1992), empirical work in this field is scarce. Moreover, studies comparing the importance of non-instrumental attributes between young and older adults are still lacking. With regards to attribute importance for product development, few implications can be drawn from the existing research on technology adoption by older adults (K. Chen & Chan, 2011). Most studies focused exclusively on the instrumental qualities of usefulness and ease of use or on the mediating influences of the users’ characteristics and prior experiences. These are, without question, important research areas. However, for product development, the identification of relevant attributes of technologies by older users, the joint consideration of those attributes for strategic planning and the comparison with the currently predominant user group of young adults is still missing. These deficiencies will be addressed in this thesis.
In order to successfully integrate users in product development, appropriate methods have to be selected. Therefore, in the final section of this chapter methods aimed to support user-centered design will be presented and critically discussed with regard to their suitability to identify and weight attributes.
2.5 METHODS TO SUPPORT USER-CENTERED DESIGN
As outlined previously (see Section 2.1.5 on User Integration), user-centered design need not necessarily involve real users. Also, passive user integration applies to approaches that involve users, but only view them as ‘reactive informers’ (Sanders, 2008). In this case, a design on behalf of the user is pursued, thus, a ‘design for users’ approach (Eason, 1995), which Sanders (2008) calls an expert mindset. On the contrary, a participatory mindset appreciates users as ‘active co-creators’.
For an identifiable, ‘local’ user group, Eason (1995) recommends an approach for users but also with them when value judgments are of concern, i.e. how important attributes are to the users. Thus, an active involvement of users that gives them the opportunity to state their priorities directly seems suitable for the topic under investigation in this thesis. Therefore, in contrast to the frequent practice in industry, in this thesis, only user-centered design methods that include real users were considered.
The methodological focus of this thesis can be located between market research with its abundance of methods to analyze and predict market demands and to plan a tailored promotion, pricing, and distribution of products and services on the one hand (Aaker, Kumar, & Day, 1995; Blackwell, et al., 2006; Kumar, Aaker, & Day, 2002) and design methods, which relate to methods used by designers in product development to design (Pahl, et al., 2007; VDI, 1993) on the other hand. In contrast, design research methods, as understood and used in this thesis, are methods that help designers to understand how to design. This means, in relation to a user-centered design approach,
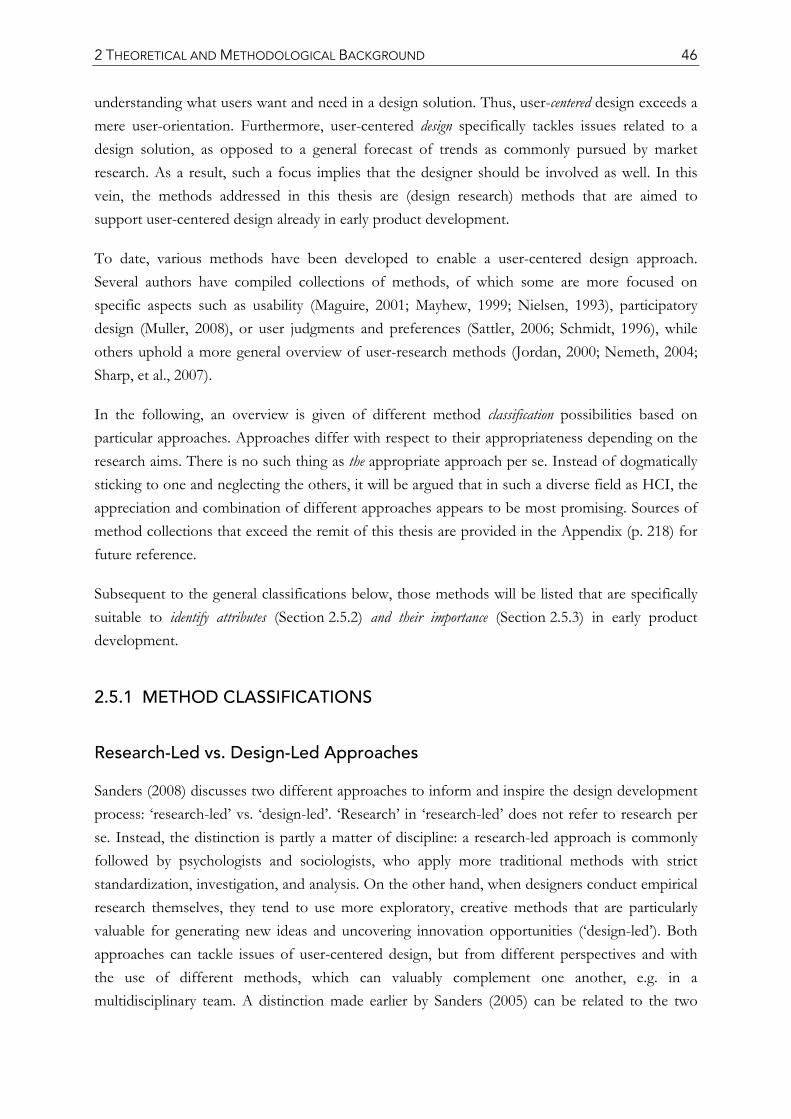
2 THEORETICAL AND METHODOLOGICAL BACKGROUND 46
understanding what users want and need in a design solution. Thus, user-centered design exceeds a mere user-orientation. Furthermore, user-centered design specifically tackles issues related to a design solution, as opposed to a general forecast of trends as commonly pursued by market research. As a result, such a focus implies that the designer should be involved as well. In this vein, the methods addressed in this thesis are (design research) methods that are aimed to support user-centered design already in early product development.
To date, various methods have been developed to enable a user-centered design approach. Several authors have compiled collections of methods, of which some are more focused on specific aspects such as usability (Maguire, 2001; Mayhew, 1999; Nielsen, 1993), participatory design (Muller, 2008), or user judgments and preferences (Sattler, 2006; Schmidt, 1996), while others uphold a more general overview of user-research methods (Jordan, 2000; Nemeth, 2004; Sharp, et al., 2007).
In the following, an overview is given of different method classification possibilities based on particular approaches. Approaches differ with respect to their appropriateness depending on the research aims. There is no such thing as the appropriate approach per se. Instead of dogmatically sticking to one and neglecting the others, it will be argued that in such a diverse field as HCI, the appreciation and combination of different approaches appears to be most promising. Sources of method collections that exceed the remit of this thesis are provided in the Appendix (p. 218) for future reference.
Subsequent to the general classifications below, those methods will be listed that are specifically suitable to identify attributes (Section 2.5.2) and their importance (Section 2.5.3) in early product development.
2.5.1 METHOD CLASSIFICATIONS
Research-Led vs. Design-Led Approaches
Sanders (2008) discusses two different approaches to inform and inspire the design development process: ‘research-led’ vs. ‘design-led’. ‘Research’ in ‘research-led’ does not refer to research per se. Instead, the distinction is partly a matter of discipline: a research-led approach is commonly followed by psychologists and sociologists, who apply more traditional methods with strict standardization, investigation, and analysis. On the other hand, when designers conduct empirical research themselves, they tend to use more exploratory, creative methods that are particularly valuable for generating new ideas and uncovering innovation opportunities (‘design-led’). Both approaches can tackle issues of user-centered design, but from different perspectives and with the use of different methods, which can valuably complement one another, e.g. in a multidisciplinary team. A distinction made earlier by Sanders (2005) can be related to the two
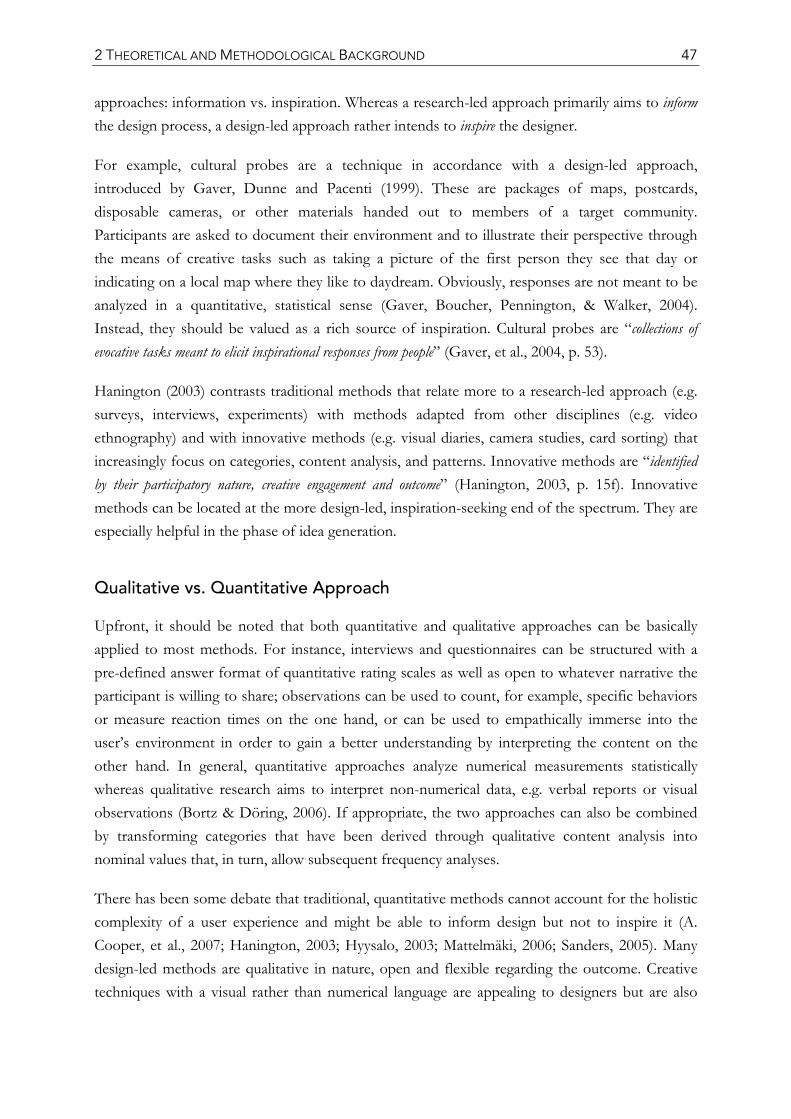
2 THEORETICAL AND METHODOLOGICAL BACKGROUND 47
approaches: information vs. inspiration. Whereas a research-led approach primarily aims to inform the design process, a design-led approach rather intends to inspire the designer.
For example, cultural probes are a technique in accordance with a design-led approach, introduced by Gaver, Dunne and Pacenti (1999). These are packages of maps, postcards, disposable cameras, or other materials handed out to members of a target community. Participants are asked to document their environment and to illustrate their perspective through the means of creative tasks such as taking a picture of the first person they see that day or indicating on a local map where they like to daydream. Obviously, responses are not meant to be analyzed in a quantitative, statistical sense (Gaver, Boucher, Pennington, & Walker, 2004). Instead, they should be valued as a rich source of inspiration. Cultural probes are “collections of evocative tasks meant to elicit inspirational responses from people” (Gaver, et al., 2004, p. 53).
Hanington (2003) contrasts traditional methods that relate more to a research-led approach (e.g. surveys, interviews, experiments) with methods adapted from other disciplines (e.g. video ethnography) and with innovative methods (e.g. visual diaries, camera studies, card sorting) that increasingly focus on categories, content analysis, and patterns. Innovative methods are “identified by their participatory nature, creative engagement and outcome” (Hanington, 2003, p. 15f). Innovative methods can be located at the more design-led, inspiration-seeking end of the spectrum. They are especially helpful in the phase of idea generation.
Qualitative vs. Quantitative Approach
Upfront, it should be noted that both quantitative and qualitative approaches can be basically applied to most methods. For instance, interviews and questionnaires can be structured with a pre-defined answer format of quantitative rating scales as well as open to whatever narrative the participant is willing to share; observations can be used to count, for example, specific behaviors or measure reaction times on the one hand, or can be used to empathically immerse into the user’s environment in order to gain a better understanding by interpreting the content on the other hand. In general, quantitative approaches analyze numerical measurements statistically whereas qualitative research aims to interpret non-numerical data, e.g. verbal reports or visual observations (Bortz & Döring, 2006). If appropriate, the two approaches can also be combined by transforming categories that have been derived through qualitative content analysis into nominal values that, in turn, allow subsequent frequency analyses.
There has been some debate that traditional, quantitative methods cannot account for the holistic complexity of a user experience and might be able to inform design but not to inspire it (A. Cooper, et al., 2007; Hanington, 2003; Hyysalo, 2003; Mattelmäki, 2006; Sanders, 2005). Many design-led methods are qualitative in nature, open and flexible regarding the outcome. Creative techniques with a visual rather than numerical language are appealing to designers but are also
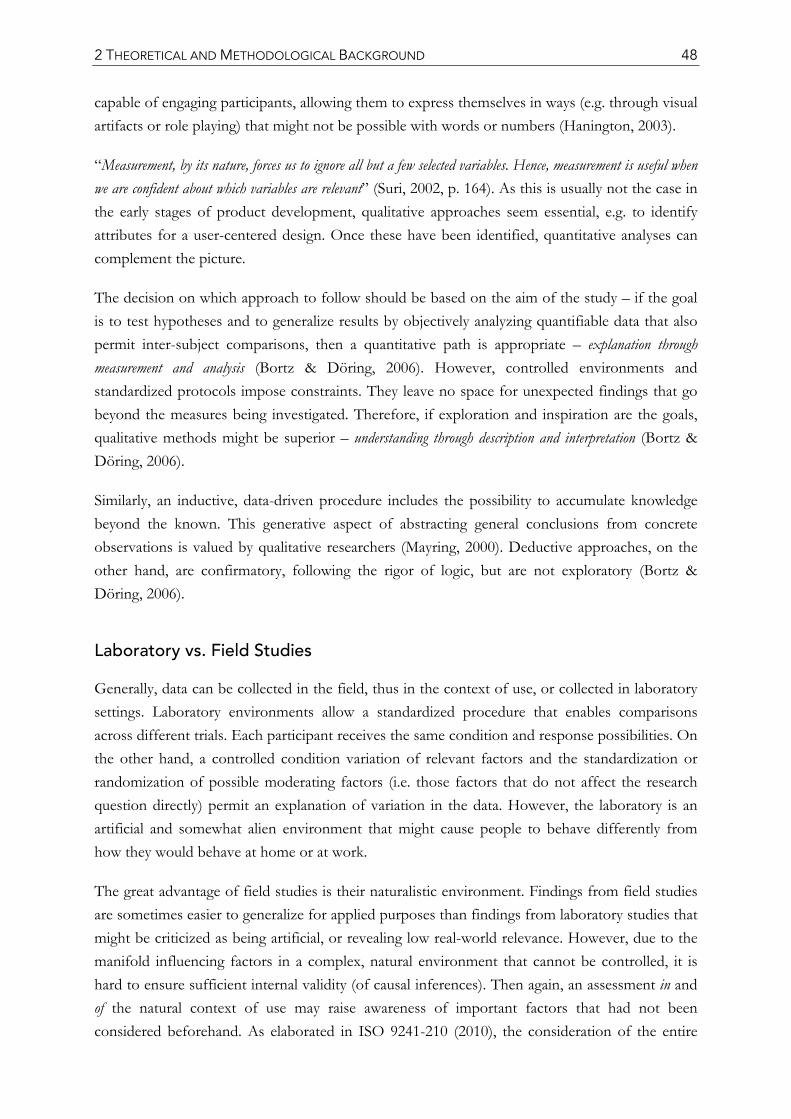
2 THEORETICAL AND METHODOLOGICAL BACKGROUND 48
capable of engaging participants, allowing them to express themselves in ways (e.g. through visual artifacts or role playing) that might not be possible with words or numbers (Hanington, 2003).
“Measurement, by its nature, forces us to ignore all but a few selected variables. Hence, measurement is useful when we are confident about which variables are relevant” (Suri, 2002, p. 164). As this is usually not the case in the early stages of product development, qualitative approaches seem essential, e.g. to identify attributes for a user-centered design. Once these have been identified, quantitative analyses can complement the picture.
The decision on which approach to follow should be based on the aim of the study – if the goal is to test hypotheses and to generalize results by objectively analyzing quantifiable data that also permit inter-subject comparisons, then a quantitative path is appropriate – explanation through measurement and analysis (Bortz & Döring, 2006). However, controlled environments and standardized protocols impose constraints. They leave no space for unexpected findings that go beyond the measures being investigated. Therefore, if exploration and inspiration are the goals, qualitative methods might be superior – understanding through description and interpretation (Bortz & Döring, 2006).
Similarly, an inductive, data-driven procedure includes the possibility to accumulate knowledge beyond the known. This generative aspect of abstracting general conclusions from concrete observations is valued by qualitative researchers (Mayring, 2000). Deductive approaches, on the other hand, are confirmatory, following the rigor of logic, but are not exploratory (Bortz & Döring, 2006).
Laboratory vs. Field Studies
Generally, data can be collected in the field, thus in the context of use, or collected in laboratory settings. Laboratory environments allow a standardized procedure that enables comparisons across different trials. Each participant receives the same condition and response possibilities. On the other hand, a controlled condition variation of relevant factors and the standardization or randomization of possible moderating factors (i.e. those factors that do not affect the research question directly) permit an explanation of variation in the data. However, the laboratory is an artificial and somewhat alien environment that might cause people to behave differently from how they would behave at home or at work.
The great advantage of field studies is their naturalistic environment. Findings from field studies are sometimes easier to generalize for applied purposes than findings from laboratory studies that might be criticized as being artificial, or revealing low real-world relevance. However, due to the manifold influencing factors in a complex, natural environment that cannot be controlled, it is hard to ensure sufficient internal validity (of causal inferences). Then again, an assessment in and of the natural context of use may raise awareness of important factors that had not been considered beforehand. As elaborated in ISO 9241-210 (2010), the consideration of the entire
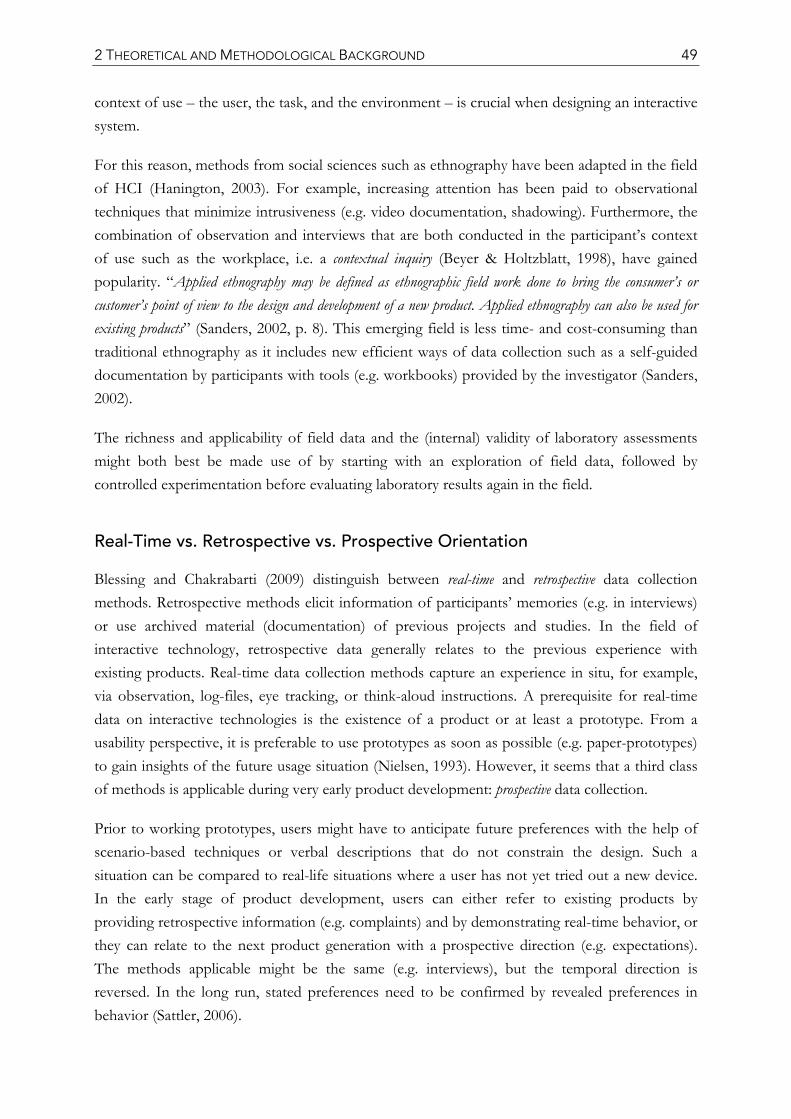
2 THEORETICAL AND METHODOLOGICAL BACKGROUND 49
context of use – the user, the task, and the environment – is crucial when designing an interactive system.
For this reason, methods from social sciences such as ethnography have been adapted in the field of HCI (Hanington, 2003). For example, increasing attention has been paid to observational techniques that minimize intrusiveness (e.g. video documentation, shadowing). Furthermore, the combination of observation and interviews that are both conducted in the participant’s context of use such as the workplace, i.e. a contextual inquiry (Beyer & Holtzblatt, 1998), have gained popularity. “Applied ethnography may be defined as ethnographic field work done to bring the consumer’s or customer’s point of view to the design and development of a new product. Applied ethnography can also be used for existing products” (Sanders, 2002, p. 8). This emerging field is less time- and cost-consuming than traditional ethnography as it includes new efficient ways of data collection such as a self-guided documentation by participants with tools (e.g. workbooks) provided by the investigator (Sanders, 2002).
The richness and applicability of field data and the (internal) validity of laboratory assessments might both best be made use of by starting with an exploration of field data, followed by controlled experimentation before evaluating laboratory results again in the field.
Real-Time vs. Retrospective vs. Prospective Orientation
Blessing and Chakrabarti (2009) distinguish between real-time and retrospective data collection methods. Retrospective methods elicit information of participants’ memories (e.g. in interviews) or use archived material (documentation) of previous projects and studies. In the field of interactive technology, retrospective data generally relates to the previous experience with existing products. Real-time data collection methods capture an experience in situ, for example, via observation, log-files, eye tracking, or think-aloud instructions. A prerequisite for real-time data on interactive technologies is the existence of a product or at least a prototype. From a usability perspective, it is preferable to use prototypes as soon as possible (e.g. paper-prototypes) to gain insights of the future usage situation (Nielsen, 1993). However, it seems that a third class of methods is applicable during very early product development: prospective data collection.
Prior to working prototypes, users might have to anticipate future preferences with the help of scenario-based techniques or verbal descriptions that do not constrain the design. Such a situation can be compared to real-life situations where a user has not yet tried out a new device. In the early stage of product development, users can either refer to existing products by providing retrospective information (e.g. complaints) and by demonstrating real-time behavior, or they can relate to the next product generation with a prospective direction (e.g. expectations). The methods applicable might be the same (e.g. interviews), but the temporal direction is reversed. In the long run, stated preferences need to be confirmed by revealed preferences in behavior (Sattler, 2006).
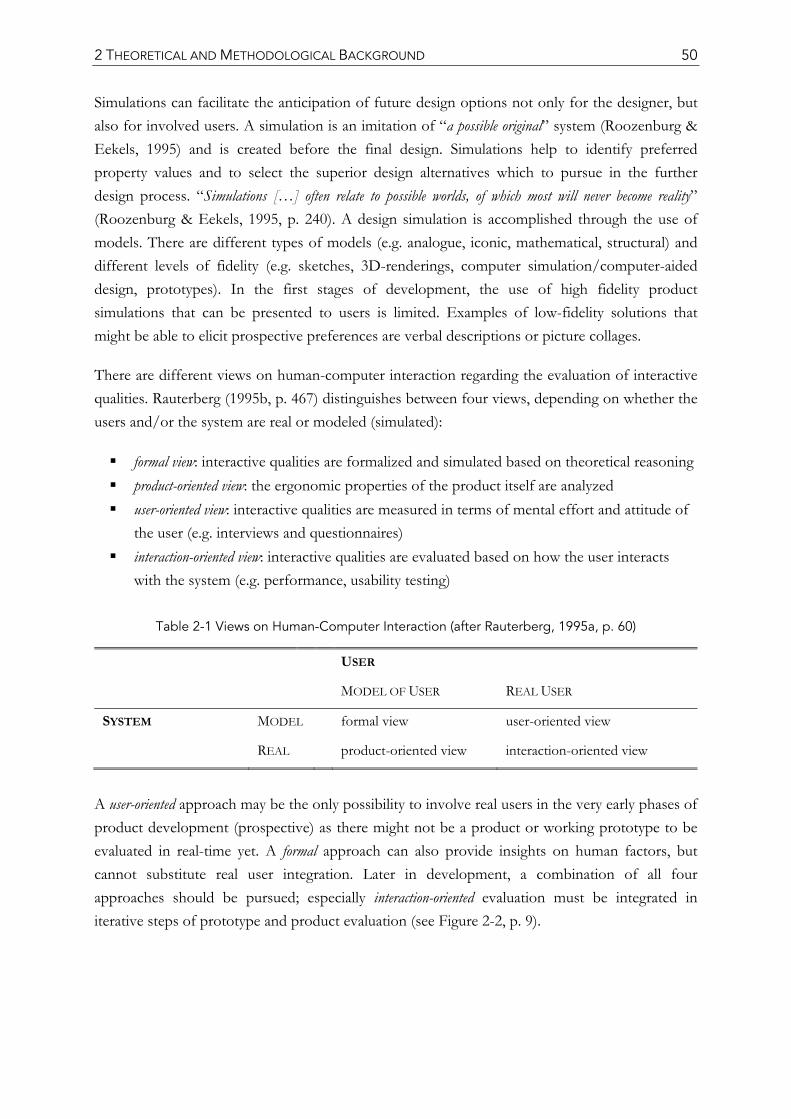
2 THEORETICAL AND METHODOLOGICAL BACKGROUND 50
Simulations can facilitate the anticipation of future design options not only for the designer, but also for involved users. A simulation is an imitation of “a possible original” system (Roozenburg & Eekels, 1995) and is created before the final design. Simulations help to identify preferred property values and to select the superior design alternatives which to pursue in the further design process. “Simulations […] often relate to possible worlds, of which most will never become reality” (Roozenburg & Eekels, 1995, p. 240). A design simulation is accomplished through the use of models. There are different types of models (e.g. analogue, iconic, mathematical, structural) and different levels of fidelity (e.g. sketches, 3D-renderings, computer simulation/computer-aided design, prototypes). In the first stages of development, the use of high fidelity product simulations that can be presented to users is limited. Examples of low-fidelity solutions that might be able to elicit prospective preferences are verbal descriptions or picture collages.
There are different views on human-computer interaction regarding the evaluation of interactive qualities. Rauterberg (1995b, p. 467) distinguishes between four views, depending on whether the users and/or the system are real or modeled (simulated):
formal view: interactive qualities are formalized and simulated based on theoretical reasoning product-oriented view: the ergonomic properties of the product itself are analyzed user-oriented view: interactive qualities are measured in terms of mental effort and attitude of
the user (e.g. interviews and questionnaires) interaction-oriented view: interactive qualities are evaluated based on how the user interacts
with the system (e.g. performance, usability testing)
Table 2-1 Views on Human-Computer Interaction (after Rauterberg, 1995a, p. 60)
USER
MODEL OF USER REAL USER
SYSTEM MODEL formal view user-oriented view
REAL product-oriented view interaction-oriented view
A user-oriented approach may be the only possibility to involve real users in the very early phases of product development (prospective) as there might not be a product or working prototype to be evaluated in real-time yet. A formal approach can also provide insights on human factors, but cannot substitute real user integration. Later in development, a combination of all four approaches should be pursued; especially interaction-oriented evaluation must be integrated in iterative steps of prototype and product evaluation (see Figure 2-2, p. 9).
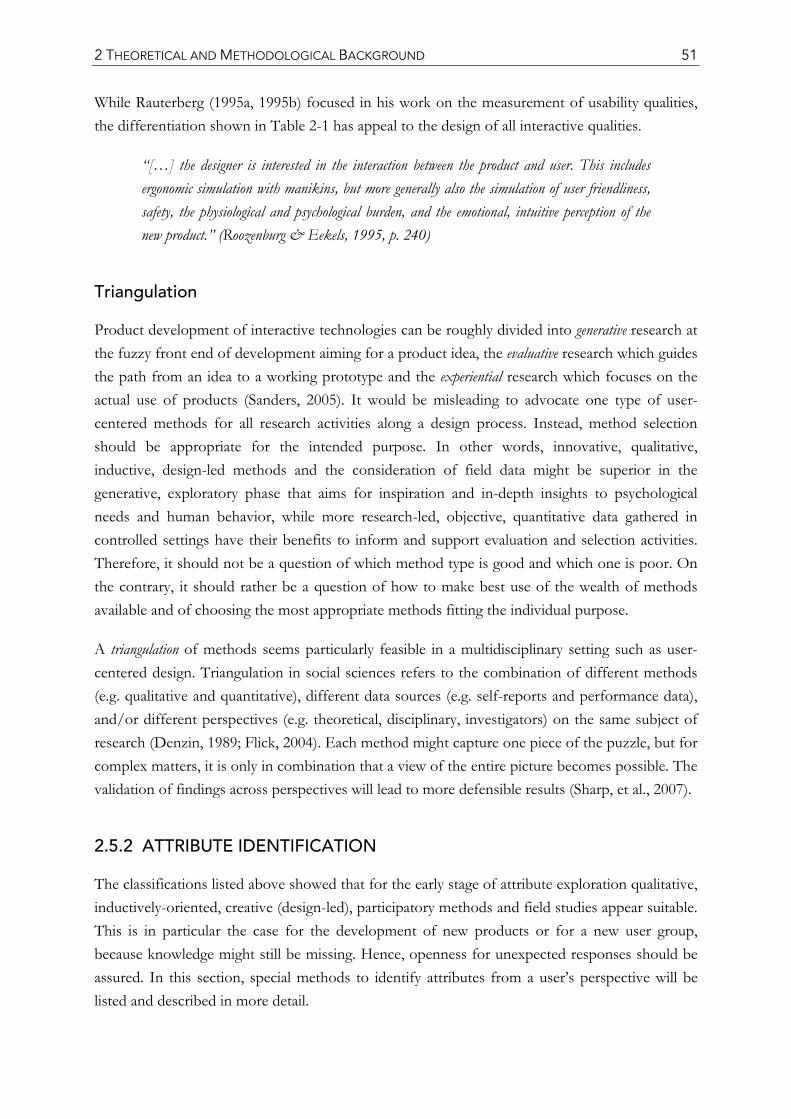
2 THEORETICAL AND METHODOLOGICAL BACKGROUND 51
While Rauterberg (1995a, 1995b) focused in his work on the measurement of usability qualities, the differentiation shown in Table 2-1 has appeal to the design of all interactive qualities.
“[…] the designer is interested in the interaction between the product and user. This includes ergonomic simulation with manikins, but more generally also the simulation of user friendliness, safety, the physiological and psychological burden, and the emotional, intuitive perception of the new product.” (Roozenburg & Eekels, 1995, p. 240)
Triangulation
Product development of interactive technologies can be roughly divided into generative research at the fuzzy front end of development aiming for a product idea, the evaluative research which guides the path from an idea to a working prototype and the experiential research which focuses on the actual use of products (Sanders, 2005). It would be misleading to advocate one type of user-centered methods for all research activities along a design process. Instead, method selection should be appropriate for the intended purpose. In other words, innovative, qualitative, inductive, design-led methods and the consideration of field data might be superior in the generative, exploratory phase that aims for inspiration and in-depth insights to psychological needs and human behavior, while more research-led, objective, quantitative data gathered in controlled settings have their benefits to inform and support evaluation and selection activities. Therefore, it should not be a question of which method type is good and which one is poor. On the contrary, it should rather be a question of how to make best use of the wealth of methods available and of choosing the most appropriate methods fitting the individual purpose.
A triangulation of methods seems particularly feasible in a multidisciplinary setting such as user-centered design. Triangulation in social sciences refers to the combination of different methods (e.g. qualitative and quantitative), different data sources (e.g. self-reports and performance data), and/or different perspectives (e.g. theoretical, disciplinary, investigators) on the same subject of research (Denzin, 1989; Flick, 2004). Each method might capture one piece of the puzzle, but for complex matters, it is only in combination that a view of the entire picture becomes possible. The validation of findings across perspectives will lead to more defensible results (Sharp, et al., 2007).
2.5.2 ATTRIBUTE IDENTIFICATION
The classifications listed above showed that for the early stage of attribute exploration qualitative, inductively-oriented, creative (design-led), participatory methods and field studies appear suitable. This is in particular the case for the development of new products or for a new user group, because knowledge might still be missing. Hence, openness for unexpected responses should be assured. In this section, special methods to identify attributes from a user’s perspective will be listed and described in more detail.
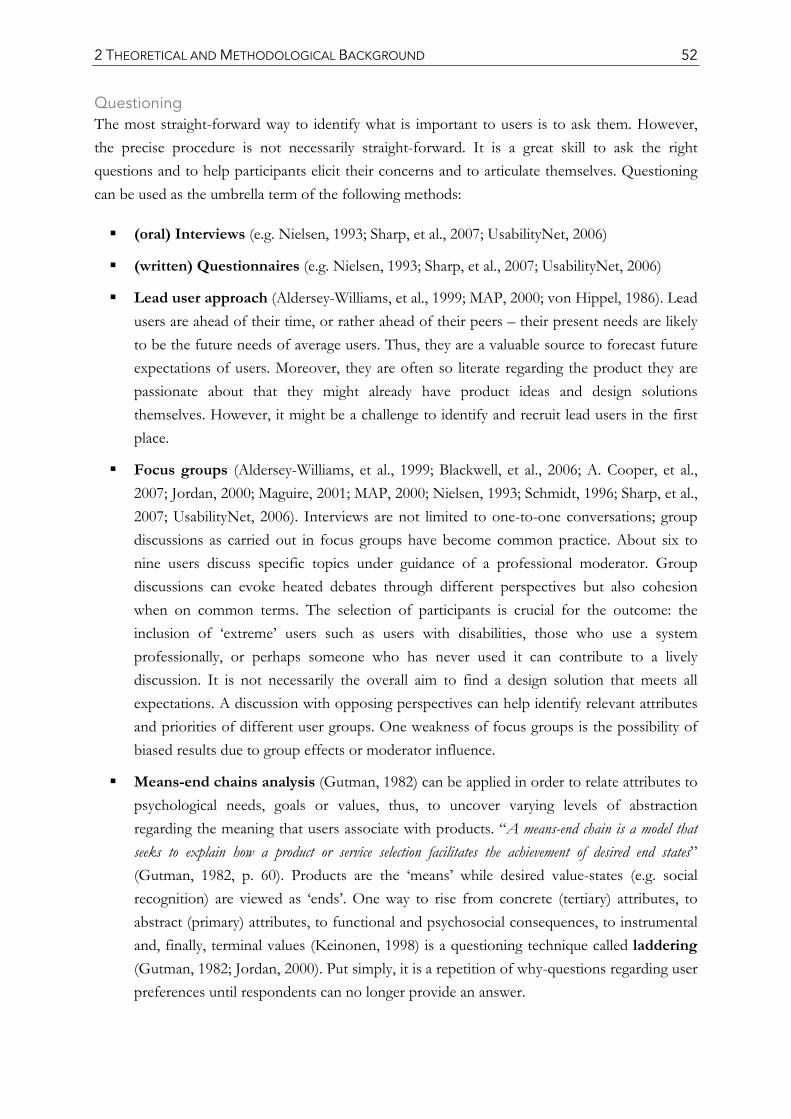
2 THEORETICAL AND METHODOLOGICAL BACKGROUND 52
Questioning The most straight-forward way to identify what is important to users is to ask them. However, the precise procedure is not necessarily straight-forward. It is a great skill to ask the right questions and to help participants elicit their concerns and to articulate themselves. Questioning can be used as the umbrella term of the following methods:
(oral) Interviews (e.g. Nielsen, 1993; Sharp, et al., 2007; UsabilityNet, 2006)
(written) Questionnaires (e.g. Nielsen, 1993; Sharp, et al., 2007; UsabilityNet, 2006)
Lead user approach (Aldersey-Williams, et al., 1999; MAP, 2000; von Hippel, 1986). Lead users are ahead of their time, or rather ahead of their peers – their present needs are likely to be the future needs of average users. Thus, they are a valuable source to forecast future expectations of users. Moreover, they are often so literate regarding the product they are passionate about that they might already have product ideas and design solutions themselves. However, it might be a challenge to identify and recruit lead users in the first place.
Focus groups (Aldersey-Williams, et al., 1999; Blackwell, et al., 2006; A. Cooper, et al., 2007; Jordan, 2000; Maguire, 2001; MAP, 2000; Nielsen, 1993; Schmidt, 1996; Sharp, et al., 2007; UsabilityNet, 2006). Interviews are not limited to one-to-one conversations; group discussions as carried out in focus groups have become common practice. About six to nine users discuss specific topics under guidance of a professional moderator. Group discussions can evoke heated debates through different perspectives but also cohesion when on common terms. The selection of participants is crucial for the outcome: the inclusion of ‘extreme’ users such as users with disabilities, those who use a system professionally, or perhaps someone who has never used it can contribute to a lively discussion. It is not necessarily the overall aim to find a design solution that meets all expectations. A discussion with opposing perspectives can help identify relevant attributes and priorities of different user groups. One weakness of focus groups is the possibility of biased results due to group effects or moderator influence.
Means-end chains analysis (Gutman, 1982) can be applied in order to relate attributes to psychological needs, goals or values, thus, to uncover varying levels of abstraction regarding the meaning that users associate with products. “A means-end chain is a model that seeks to explain how a product or service selection facilitates the achievement of desired end states” (Gutman, 1982, p. 60). Products are the ‘means’ while desired value-states (e.g. social recognition) are viewed as ‘ends’. One way to rise from concrete (tertiary) attributes, to abstract (primary) attributes, to functional and psychosocial consequences, to instrumental and, finally, terminal values (Keinonen, 1998) is a questioning technique called laddering (Gutman, 1982; Jordan, 2000). Put simply, it is a repetition of why-questions regarding user preferences until respondents can no longer provide an answer.
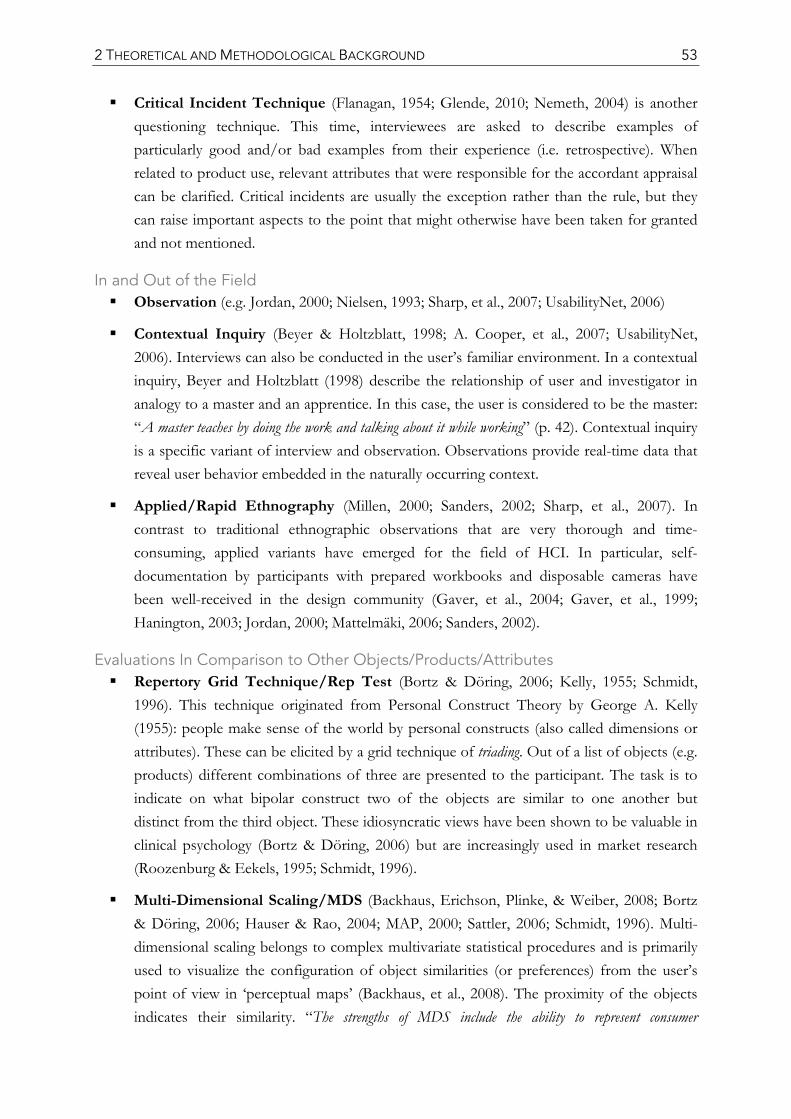
2 THEORETICAL AND METHODOLOGICAL BACKGROUND 53
Critical Incident Technique (Flanagan, 1954; Glende, 2010; Nemeth, 2004) is another questioning technique. This time, interviewees are asked to describe examples of particularly good and/or bad examples from their experience (i.e. retrospective). When related to product use, relevant attributes that were responsible for the accordant appraisal can be clarified. Critical incidents are usually the exception rather than the rule, but they can raise important aspects to the point that might otherwise have been taken for granted and not mentioned.
In and Out of the Field Observation (e.g. Jordan, 2000; Nielsen, 1993; Sharp, et al., 2007; UsabilityNet, 2006)
Contextual Inquiry (Beyer & Holtzblatt, 1998; A. Cooper, et al., 2007; UsabilityNet, 2006). Interviews can also be conducted in the user’s familiar environment. In a contextual inquiry, Beyer and Holtzblatt (1998) describe the relationship of user and investigator in analogy to a master and an apprentice. In this case, the user is considered to be the master: “A master teaches by doing the work and talking about it while working” (p. 42). Contextual inquiry is a specific variant of interview and observation. Observations provide real-time data that reveal user behavior embedded in the naturally occurring context.
Applied/Rapid Ethnography (Millen, 2000; Sanders, 2002; Sharp, et al., 2007). In contrast to traditional ethnographic observations that are very thorough and time-consuming, applied variants have emerged for the field of HCI. In particular, self-documentation by participants with prepared workbooks and disposable cameras have been well-received in the design community (Gaver, et al., 2004; Gaver, et al., 1999; Hanington, 2003; Jordan, 2000; Mattelmäki, 2006; Sanders, 2002).
Evaluations In Comparison to Other Objects/Products/Attributes Repertory Grid Technique/Rep Test (Bortz & Döring, 2006; Kelly, 1955; Schmidt,
1996). This technique originated from Personal Construct Theory by George A. Kelly (1955): people make sense of the world by personal constructs (also called dimensions or attributes). These can be elicited by a grid technique of triading. Out of a list of objects (e.g. products) different combinations of three are presented to the participant. The task is to indicate on what bipolar construct two of the objects are similar to one another but distinct from the third object. These idiosyncratic views have been shown to be valuable in clinical psychology (Bortz & Döring, 2006) but are increasingly used in market research (Roozenburg & Eekels, 1995; Schmidt, 1996).
Multi-Dimensional Scaling/MDS (Backhaus, Erichson, Plinke, & Weiber, 2008; Bortz & Döring, 2006; Hauser & Rao, 2004; MAP, 2000; Sattler, 2006; Schmidt, 1996). Multi-dimensional scaling belongs to complex multivariate statistical procedures and is primarily used to visualize the configuration of object similarities (or preferences) from the user’s point of view in ‘perceptual maps’ (Backhaus, et al., 2008). The proximity of the objects indicates their similarity. “The strengths of MDS include the ability to represent consumer
2 THEORETICAL AND METHODOLOGICAL BACKGROUND 54
multidimensional perceptions and consumer preferences relative to an existing set of products. MDS decomposes more holistic judgments to uncover these perceptions and preferences” (Hauser & Rao, 2004). For this, participants rate pairs of objects (with respect to similarity or preference). The investigator chooses the distance measure and also decides on the number of dimensions (attributes) to be considered. This is usually a trade-off of interpretability and statistical fit. In order to enable visualization, two or three dimensions are commonly chosen. Similar to factor analyses, the investigator provides labels for the dimensions. This can be seen as a weakness of the method for the purpose of attribute identification, because it deviates from the ‘voice of the user’ and is at risk of misinterpretation.
2.5.3 ATTRIBUTE IMPORTANCE
In contrast to the mostly qualitative focus regarding attribute identification, assessment methods of the respective importance measures are primarily quantitative. After all, the goal here is not the identification of what is important, but rather how much individual attributes matter – hence, a measure that can put attributes into relation by expressing their degree of importance. The aforementioned general data collection methods (interviews, questionnaires, observations) are also applicable to capture attribute importance. However, the precise assessment such as the question format differs. A variety of empirical user-centered methods has been proposed to assess attribute importance:
Elicitation (Jaccard, et al., 1986; Schmidt, 1996; van Ittersum, Pennings, Wansink, & van Trijp, 2007). Elicitation is the response of participants to the open-ended question “what is important to you?”. Answers are usually content-analyzed. Frequency statistics can signify attribute importance. Furthermore, for spontaneous responses, it is assumed that the order of reproduction indicates attribute importance (the first ones being the most important). This format does not include a presentation of attributes; instead it relies on salient attributes that are consciously accessible to users.
Information Search (Jaccard, et al., 1986; Jacoby, 1975; Keinonen, 1998; Schmidt, 1996). Information search behavior reveals how users approach a product and what attributes are relevant for making a judgment. A method called ‘information display board’ (or matrix) has been developed to assess information processing (Jacoby, 1975). Participants are shown a number of objects from which one is to be selected and a list of attributes that describe the objects. Information regarding specific attributes can be received on demand by the participants. However, only one piece of information (i.e. description of one attribute) is presented at a time. Again, frequency and order of information requests indicate attribute importance. A more advanced and subtle application of this approach can be realized in eye-tracking studies.
Ranking (Schmidt, 1996). Participants are presented a number of pre-defined attributes and are required to rank them in order of importance. The rankings are ordinal and can
2 THEORETICAL AND METHODOLOGICAL BACKGROUND 55
therefore be used for prioritization purposes but not for relative importance weights, because there is no information available regarding the distances between attributes. For this reason, trade-offs can only be considered to a certain extent – although attributes are ranked in relation to one another, relative weights cannot be determined.
Rating [Self-Stated Importance (SSI)] (Berger et al., 1993; Bortz & Döring, 2006; Griffin & Hauser, 1993; Jaccard, et al., 1986; Schmidt, 1996). Rating scales are a frequently used response format in questionnaires. They provide interval data when distances between answer option increments can be assumed to be equal. Participants are presented items and asked to select the most appropriate response option. Rating scales are a versatile instrument with numerous variants. They can be textual, numerical, or visual/symbolic. In order to indicate intensity, other means such as line drawing have also been found useful (‘magnitude scaling’). However, most commonly, participants rate importance values on pre-defined scales (e.g. ranging from 1 to 10 with the anchors ‘not at all important’ to ‘very important’). Berger et al. (1993) refer to these direct, independent values as self-stated importance.
Constant Sum Scale (Aaker, et al., 1995; Griffin & Hauser, 1993; Kumar, et al., 2002; Schmidt, 1996). The constant sum scale (or point allocation method) is the most immediate example of trade-offs: participants are requested to allocate points/percentages among a list of attributes while keeping the sum constant. In other words, the total importance is divided in relative shares among attributes – the more one is allocated, the less remains for the others. This approach is not intended to assess a product’s utility (all have the same neutral sum of 100%), but to identify relative attribute importance. Advantages are seen in the objectivity of analysis which is not dependent on interpretations of the investigator and in the ratio-scaled data that facilitates comparisons and permits parametric statistical procedures. However, an undeniable drawback is the cognitive strain imposed on participants, who have to compute and update the relative point allocation to ensure the constant sum.
Self-Explicated Method (Anchored Scales) (Griffin & Hauser, 1993; Huber, 1997; Sattler & Hensel-Börner, 2007; Srinivasan, 1988). ‘Self-Explicated Method’ stands for the directly derived counterpart of conjoint analyses (see below). It basically consists of a two-stage procedure. First, participants assign desirability ratings to different levels within an attribute (e.g. different color options, duration of guarantee, presence/absence of specific features). This is usually achieved through ranking, independent ratings, or anchored ratings. In the case of an anchored rating, the most desirable level is assigned a maximum rating (e.g. 100) and serves as a reference point for the remaining levels. In the second stage, attributes themselves are assigned importance weights. Both independent ratings as well as the constant sum scale can be used for this step. The utility of a product alternative is then predicted by a combination of attribute level desirability and attribute weight. The consideration of trade-offs depends on the actual methods used. Srinivasan (1988) suggests
2 THEORETICAL AND METHODOLOGICAL BACKGROUND 56
to start with the critical attribute as an anchor for the subsequent judgments – the critical attribute is the one where the difference between the least and the most preferred attribute level is most valuable to the user.
It should be noted that for the identification of attribute importance without the inclusion of different attribute levels, the method is no independent technique per se, but rather an application of the ones already introduced.
Conjoint Analysis (Aldersey-Williams, et al., 1999; Green, Krieger, & Wind, 2001; Green & Srinivasan, 1978, 1990; Jaccard, et al., 1986; MAP, 2000; Sattler, 2006; Schmidt, 1996). Conjoint analysis comprises a class of methods (e.g. full profile, choice, adapted, hybrid). Participants give an overall judgment (or make a choice) with respect to experimentally varied product profiles (unique combinations of attribute levels). The overall rating of products, which are always presented by an entire set of attributes (‘considered jointly’) is said to have high external (and therefore predictive) validity. Trade-offs are taken into account already during assessment. Weights are statistically de-composed afterwards, resulting in part-worth utilities for each level of the pre-selected attributes. The derived weights also allow overall utility predictions of product profiles that have not been presented. Profiles are not limited to verbal presentation. Visual material or even real products can be used, provided that attribute levels can be varied in a controlled manner.
A bias due to social desirability is rather unlikely. However, it is possible that participants disregard certain attributes. The method is rather time-consuming and requires considerable expertise from the researcher. It is a powerful tool for reaching detailed decisions regarding feature selection.
Paired Comparison (Bortz & Döring, 2006; Jaccard, et al., 1986; Schmidt, 1996). In paired comparison analysis, participants compare two attributes at a time and indicate which they view as being more important. Based on the relative frequencies of preferences, overall preference scores can be derived. The method can be extended to an analytic hierarchy process – here, paired comparisons are rated in relation to higher-order attributes.
Kano Method (Berger, et al., 1993; Kano, et al., 1984; Matzler, et al., 1996). The aim of a Kano classification is to distinguish attributes depending on their impact on satisfaction. For each attribute separately, pairs of questions with opposing levels of attribute fulfillment (e.g. presence vs. absence) are presented to participants. The combination of responses to those questions can be differentiated into three distinct patterns (see Figure 5-1, p. 102): (1) ‘must-be requirements’, which are usually taken for granted – such attributes will not delight a user, but will lead to dissatisfaction if missing; (2) ‘one-dimensional requirements’ show a proportional relationship of satisfaction and attribute
2 THEORETICAL AND METHODOLOGICAL BACKGROUND 57
fulfillment; (3) ‘attractive requirements’ are not expected but when present, are gratified with high user satisfaction.∗
The Kano method, in its original intent (Berger, et al., 1993; Kano, et al., 1984), does not measure importance in quantitative terms. Instead, it differentiates attributes depending on the consequences of fulfillment with respect to user satisfaction. Nonetheless, it is included here, as it is a recommended additional classification measure for attribute importance (in particular in the House of Quality) and further developments of the method suggest also quantitative indicators of attribute prioritization (Berger, et al., 1993; Matzler, et al., 1996; Mikulić, 2007; Tan & Shen, 2000; Tontini, 2007).
Jaccard et al. (1986) compared six methods for measuring attribute importance (elicitation, search task, direct ratings, conjoint analysis, paired comparison, and a measure similar to the Kano method) of two different products (cars and birth control). The authors found only low correlations among the different measures although the 110 participants were all engaged in all methods. Despite a critical discussion on practical implications – suggesting that studies using different importance measures are not necessarily comparable and the inclusion of more than one measure seems recommendable – the authors do not offer an explanation for the low convergence.
The methods used by Jaccard et al. (1986) varied with respect to the previously mentioned classification criteria (see Section 2.5.1, p. 46). Furthermore, attributes were not explicitly presented in the elicitation task, while the other five methods included the presentation of pre-selected attributes. Open-ended elicitation tasks capture those attributes that are salient in a person’s memory and are readily available. Myers and Alpert (1968, 1977) understand salience to be a facet of attribute importance. ‘Importance’ itself (referred ot as 'relevance' in van Ittersum, et al., 2007) is described as follows: “when a feature or attribute is "important" to people it presumably has some consequence or significance […] in forming overall evaluations or rankings of products” (Myers & Alpert, 1977). Methods that are closely related to this core dimension of ‘importance’ are direct ratings, rankings, constant sum scale, analytic hierarchy process, and information search (van Ittersum, et al., 2007). Finally, Myers and Alpert (1968, 1977) introduce ‘determinance’ as a final dimension of attribute importance, which is associated with the importance of attributes in choice (e.g. purchase) situations and depends on available attribute levels. Jaccard et al. (1986) unite the three dimensions – salience, importance, determinance – by conceptualizing the extent of ‘importance’ as a matter of change in attitude toward the product (Keinonen, 1998).
Van Ittersum et al. (2007) suggest, with reference to Myers and Alpert (1968, 1977), that the low correlations observed in Jaccard et al. (1986) might be a result of the circumstance that different
∗ It should be mentioned that Kano’s ‘requirements’ are not equivalent to requirements of a design specification (Almefelt, 2005; Hull, et al., 2002) – they are studied before finalizing the design specification. Thus, the term ‘attribute’ would be more appropriate. However, must-be, one-dimensional, and attractive attributes will be referred to as must-be, one-dimensional, and attractive requirements in this thesis when referring to the Kano method because those are the established terms (Berger, et al., 1993) in this context.
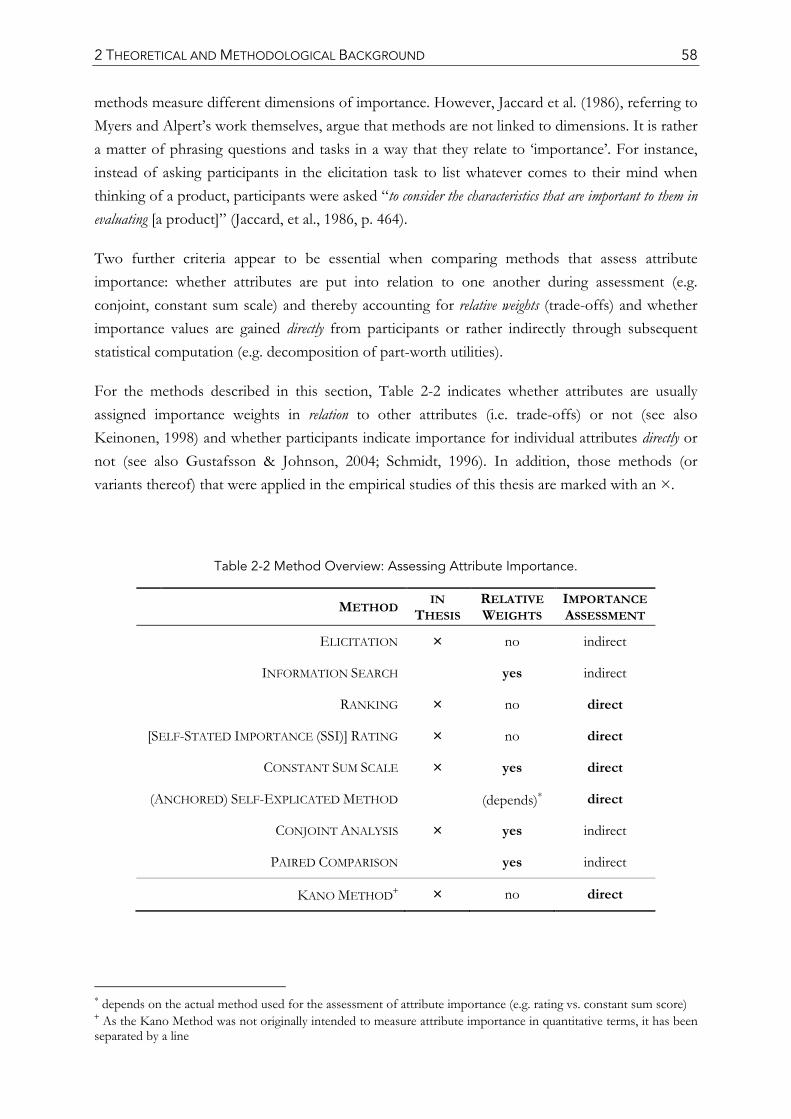
2 THEORETICAL AND METHODOLOGICAL BACKGROUND 58
methods measure different dimensions of importance. However, Jaccard et al. (1986), referring to Myers and Alpert’s work themselves, argue that methods are not linked to dimensions. It is rather a matter of phrasing questions and tasks in a way that they relate to ‘importance’. For instance, instead of asking participants in the elicitation task to list whatever comes to their mind when thinking of a product, participants were asked “to consider the characteristics that are important to them in evaluating [a product]” (Jaccard, et al., 1986, p. 464).
Two further criteria appear to be essential when comparing methods that assess attribute importance: whether attributes are put into relation to one another during assessment (e.g. conjoint, constant sum scale) and thereby accounting for relative weights (trade-offs) and whether importance values are gained directly from participants or rather indirectly through subsequent statistical computation (e.g. decomposition of part-worth utilities).
For the methods described in this section, Table 2-2 indicates whether attributes are usually assigned importance weights in relation to other attributes (i.e. trade-offs) or not (see also Keinonen, 1998) and whether participants indicate importance for individual attributes directly or not (see also Gustafsson & Johnson, 2004; Schmidt, 1996). In addition, those methods (or variants thereof) that were applied in the empirical studies of this thesis are marked with an ×.
Table 2-2 Method Overview: Assessing Attribute Importance.
METHODIN
THESISRELATIVE WEIGHTS
IMPORTANCE ASSESSMENT
ELICITATION × no indirect
INFORMATION SEARCH yes indirect
RANKING × no direct
[SELF-STATED IMPORTANCE (SSI)] RATING × no direct
CONSTANT SUM SCALE × yes direct
(ANCHORED) SELF-EXPLICATED METHOD (depends)∗ direct
CONJOINT ANALYSIS × yes indirect
PAIRED COMPARISON yes indirect
KANO METHOD+ × no direct
∗ depends on the actual method used for the assessment of attribute importance (e.g. rating vs. constant sum score) + As the Kano Method was not originally intended to measure attribute importance in quantitative terms, it has been separated by a line
2 THEORETICAL AND METHODOLOGICAL BACKGROUND 59
Relative Importance Weights (Trade-Offs) Attribute importance indices are especially useful when trade-offs have to be made with regard to competing resources (Elliott, et al., 2003; Ulrich & Eppinger, 2008). It is the varying level of attribute importance with reference to the other attributes, i.e. relative importance weights, that provides the necessary information in respect of resource allocation. There is general agreement, in particular in the QFD literature, that relative importance weights that indicate the relative contribution of each attribute should be considered for prioritization and selection purposes (Hauser & Clausing, 1988; Pahl, et al., 2007; Roozenburg & Eekels, 1995; Ulrich & Eppinger, 2008). Yet, surprisingly few methods integrate the necessity of trade-offs during assessment. Instead, relative weights are oftentimes computed afterwards on the basis of independent attribute ratings, i.e. the normalization of relative weights from independent attribute rating scales (Clausing, 1994; Elliott, et al., 2003; Jaccard, et al., 1986; Ulrich & Eppinger, 2008) and not captured in the assessment itself. This, however, does not necessarily go hand in hand with true trade-offs. For one, ceiling effects (or generally insufficient variance to differentiate attributes) might occur if users rate all attributes as equally important, i.e. everything is very important (or perhaps everything is ‘somewhat’ important if users are uncertain). Secondly, attributes of a real product are inseparable as they are all part of the product. Consequently, considering attributes jointly would lead to a more realistic evaluation of a product. Unfortunately, the ‘quick and easy’-approach of rating attributes on independent scales, which neglects the consideration of trade-offs during assessment is commonly used.
Direct vs. Indirect Importance Assessment Some methods request from participants a direct judgment of attribute importance, while others infer the individual weights indirectly from participants’ behavior (e.g. information search) or from overall judgments and/or paired comparisons (e.g. conjoint analysis) (Gustafsson & Johnson, 2004). In the literature on multi-attribute decision-making, the latter procedure is referred to as a decomposition of judgments, while direct methods follow a compositional approach (Backhaus, et al., 2008; Sattler, 2006; Schmidt, 1996). The distinction of direct vs. indirect refers to the assignment of attribute importance (weight) for each attribute and not to the response per se.
Three direct measures (direct rating, anchored scale, and constant sum scale) were all included in a study conducted by Griffin and Hauser (1993). High correlations were observed among the different measures as well as a strong linkage to concept evaluations (interest and preference indices). In contrast, statistically derived importance measures through multiple regression showed inferior predictive validity. Gustafsson and Johnson (2004) compared a direct rating of attribute importance with statistically derived (indirect) indices in the service domain. Contrary to Griffin and Hauser (1993), they could not find a general superiority of direct vs. indirect assessment. Furthermore, Sattler and Hensel-Börner (2007) compared the results of 23 empirical studies, including conjoint analysis (indirect) and self-explicated methods (direct). Even though conjoint analysis possesses theoretical advantages regarding predictive validity due to more realistic task requirements, i.e. overall preferences, and although it is the most popular
2 THEORETICAL AND METHODOLOGICAL BACKGROUND 60
sophisticated technique for preference assessment in market research (Green, et al., 2001; MAP, 2000; Sattler, 2006), the theoretical predominance could not be confirmed empirically (Sattler & Hensel-Börner, 2007).
Given that importance measures are a subjective indicator of the value that a user assigns to different attributes, a direct participation and consultation of the user’s preferences seem appropriate (Eason, 1995). A measure of revealed preferences (Sattler, 2006), i.e. observed real-life usage behavior, would be beneficial, in addition to stated judgments (Gustafsson & Johnson, 2004; Jaccard, et al., 1986). However, such data should not replace the opportunity of users to express their point of view directly but rather complement it. Furthermore, revealed preference data necessitate a certain degree of prototype fidelity or an already existing product which limits its applicability in early product development (Sattler, 2006).
General Remarks on Methods for Identifying and Weighting Attributes Despite the advantages of active user integration (Kujala, 2003; Mahmood, et al., 2000), it is not always incorporated in a design process (Schmidt, 1996). Reinicke (2004) lists a number of possible reasons for the lack of application, such as time pressure, cost pressure, lack of expertise, lack of communication between departments. However, these factors can have severe consequences for the design. For example, Reinicke (2004) argues that due to pressure of time and costs, outdated or inappropriate data might be consulted. Furthermore, misconceptions of user requirements or generally of evaluation results can arise if departments fail to communicate with each other or if designers are not involved in the research phase (Hanington, 2003). Cooper et al. (2007) criticize that current development processes overspecialize and separate the roles of key agents in different development phases. As a result, those conducting market research and identifying attributes are not likely to be those who will later develop and design the system, resulting in a “translation gap between research results and design details” (A. Cooper, et al., 2007, p. 19). This underlines the necessity of direct information flows between departments (Pahl, et al., 2007) and an integrated structure of the organization (Andreasen & Hein, 1987). In sum, the advantages of active user involvement are conclusive, but an appropriate application of methods and the communication of these need to be ensured.
As to the assessment of attribute importance, three scenarios appear most common: (1) statistically complex procedures are conducted by the market research team (e.g. conjoint analyses), which are generally resource intense and difficult to communicate to other departments. Furthermore, these methods are usually indirect procedures, not enabling a direct priority statement of attributes by the user. (2) The measures are derived internally by common consensus of the design team without further involvement of real users. (3) If the design team conducts data collection, frequently, only independent ratings without the consideration of relative weights during assessment are used at the risk of response biases. None of these scenarios is satisfactory. Two paths seem advisable to follow, preferably in combination: Firstly, integrated product development, with close cooperation and communication between
2 THEORETICAL AND METHODOLOGICAL BACKGROUND 61
departments (Andreasen & Hein, 1987), and the development of communication tools such as the House of Quality (Clausing, 1994; Hauser & Clausing, 1988) are important factors to increase quality. Secondly, efficient methods are needed to assess attribute importance, actively involving users without risking biased results. Such methods should also be applicable for companies with fewer resources (expertise, staff, time, money). The second path will be of concern in this thesis.
To conclude, the relevance of attribute importance as a strategic support in the design process, starting with the formulation of requirements and aiming for an enhanced acceptance by the users, calls for the necessity of appropriate assessment methods. It seems that a direct assessment of attribute importance, involving the users actively is worthwhile pursuing. In order to infer priorities for the design process, information on the relative importance is vital (Ulrich & Eppinger, 2008).
In the next chapter, method selection and research approach for this thesis will be specified.
3 RESEARCH APPROACH
3.1 AIMS
Three empirical studies were conducted in this thesis in order to investigate attribute importance from a user’s perspective with regard to technology adoption. Furthermore, it was of interest whether young and older adults assign attributes different importance values or not. A variety of methods was used (see marked methods in Table 2-2, p. 58) to study attribute importance from different angles. However, a focus on design research methods that support a user-centered design has always been upheld as these are most appropriate when aiming for an increase in technology adoption and acceptance (ISO, 2010).
The applicability and appropriateness of the used methods in early product development will be discussed upon each study (see Sections 4.5, 5.5, 6.6, as well as in Section 8.2).
Two user groups were included and compared (young vs. older adults) in all three studies. Therefore, the methods’ sensitivity to differentiate between groups received pronounced attention.
The primary aim of the first study was to identify attributes that are relevant with respect to technology adoption (not limited to a work-related environment) and that apply to young as well as to older adults. Inspired by methods from applied ethnography (Sanders, 2002) and innovative methods as described by Hanington (2003), participants self-documented verbally and visually examples of interactive technologies from their natural environment. Participants stated why they liked or disliked, respectively, the documented products. Furthermore, general reasons for technology adoption and rejection were provided. Attribute identification through qualitative content analysis was followed by quantitative content analysis of relative attribute frequencies as initial indicators of importance. However, this method, similar to an elicitation task, is an indirect estimation of relative importance that does not account for trade-offs during assessment.
The ultimate aim of the third study was to develop a method that allows direct and relative assessment of attribute importance in an engaging and efficient manner. Participants were given the opportunity to self-express their priorities via physical representatives related to the idea of a constant sum scale (Aaker, et al., 1995). For comparison purposes, the established method of conjoint analysis (Green, et al., 2001; Wittink, 1989) to unfold relative weights was applied in study 2.
3 RESEARCH APPROACH 63
One further aim of study 2 was to follow up on valence effects found in study 1. Hence, the Kano Method was included in order to test whether certain attributes are taken for granted while others might still be able to increase the attractiveness of a product.
Direct and independent self-stated importance ratings were considered in all three studies.
Very briefly, the consecutive sequence of the three studies can be summarized as:
study 1 > study 2 > study 3
attribute identification > importance weights (traditional) > importance weights (new)
3.2 SPECIFICATION OF RESEARCH APPROACH
What? – Variables
In design research one should be clear about what is considered to be a successful product (Blessing & Chakrabarti, 2009). The success criterion in this thesis was chosen to be technology adoption, thus, the question of whether or not users will adopt or reject a design solution. The term ‘technology adoption’ will be favored over ‘technology acceptance’ as a more conservative description of technology usage. Results might also be generalizable to Kollmann’s (2004) definition of acceptance (continued use), but this cannot be said with certainty as the focus was more on ‘likelihood of usage’ in general rather than on the ‘extent of usage’. This term is furthermore appropriate, because the user group of older adults is still more reluctant to adopt technology than young adults (Charness & Boot, 2009; Czaja, et al., 2006; PEW, 2009).
With technology adoption as the success criterion of product development, it is crucial to know what attributes are likely to affect a user’s attitude toward a product and consequently the likelihood of technology use (Blackwell, et al., 2006; Davis, 1989; Davis, et al., 1989; Fishbein, 1963; Venkatesh, et al., 2003). The practicability of research findings from the field of technology adoption is limited for product development purposes because the investigated factors cannot be easily translated into actionable, concrete priorities (Benbasat & Barki, 2007) (see Section 2.2 for a more elaborate discussion). Furthermore, the majority of studies were related to a work context, missing out on non-instrumental attributes (see Section 2.3). Lastly, older adults have not been included in the establishment of lists regarding relevant attributes (see Section 2.4.3). Consequently, study 1 had an exploratory character. For this reason, a qualitative, inductive identification of salient attributes in a field study involving young and older participants was conducted. Attributes that were identified in study 1 were then explicitly presented for the purpose of assessing their importance in studies 2 and 3. While technology adoption is regarded as the (success) criterion, attributes are seen as its predictors.
3 RESEARCH APPROACH 64
Of What? – Products
Interactive technology is still a very wide term. It basically includes all tangible and intangible systems that have an input and output channel and thus transport information in both directions, be it for work, leisure, entertainment, private concerns, or of public matter; be it for telecommunication, health assistance, mobility, or learning. The products selected in this thesis were everyday objects that can be classified as interactive technology. Examples of such products can range from television sets to washing machines, from digital cameras to mobile phones. Services and mere software solutions or websites were not included; there was a physical, hardware component to all examined products. The products under investigation are so-called platform products as they are already on the market and an established technological subsystem can be assumed (Ulrich & Eppinger, 2008). Consequently, in this case, early phases of product development focus on the task clarification, planning, and resource allocation for a specific system design, and less on innovation and the identification or generation of a brand new product idea (von Hippel, 2005).
In study 1, each participant documented 24 interactive products, which allows the assumption that the identified attributes are of general concern. It was only later, that the attributes were explicitly related to pre-selected products (a digital camera in study 2; TV, washing machine, digital camera and fax machine in study 3).
Who? – Participants
The description ‘older adult’ is without doubt vague. For research purposes, Nichols et al. (2006) recommend to differentiate young and older adults in ‘discrete chunks’: younger adults are seen as the age group between 18-30 years and older adults between 65-85 years. The authors also note that in aging research subgroups as ‘young-old (e.g. 56 to 64)’ and ‘oldest-old (85+)’ and an extension of the younger cohort up to 39 years may be further appropriate (Nichols, et al., 2006).
In this thesis, young adults were between 19-33 years old (study 1: 20-33; study 2: 20-30; study 3: 19-30) and older adults between 65-80 years old (study 1: 65-80; study 2: 65-75; study 3: 65-74).
In relation to the previously mentioned technology generations (Docampo Rama, 2001; Docampo Rama, et al., 2001), all of the young participants belong to the software-generation, to the menu-generation to be precise as all were born after 1970, and all of the older participants can be assigned to the electro-mechanical generation, because all were born before 1960 but after 1918.
3 RESEARCH APPROACH 65
When? – Early Phases
The focus is placed on methods that support user-centered design already in the early phase of task clarification and planning (Pahl, et al., 2007), in particular after the generation of an idea, i.e. the generative research phase (Sanders, 2005), yet before the actual design phases (Pahl, et al., 2007). At this early stage of product development, attribute importance cannot be derived from evaluating a final prototype and therefore neither with related questionnaires as the AttrakDiff (Hassenzahl, et al., 2003). On the other hand, as the focus of this thesis is grounded in the next generation development of platform products (Ulrich & Eppinger, 2008), users are able to articulate expectations and judgments based on previous experiences.
Verbal descriptions can serve as low-fidelity simulations (Roozenburg & Eekels, 1995). Consequently, the material used in the conjoint analysis (study 2) can be understood as models of a product. Similarly, the physical representatives that participants used as weighting tools in study 3 can be seen as means to construct a simulation by the user. The methods comply with a user-oriented view by Rauterberg (1995a, 1995b): the combination of real users with a simulation (or anticipation) of a system (see Table 2-1, p. 50). An iterative design process should grow from a user-oriented view to an increasingly interaction-oriented view in later phases.
How? – Methods
The methods that were included in the three studies will be described in some more detail with reference to the method classifications described in Section 2.5.1:
The argumentation that a combination of methods should be followed in product development as each method has its strengths and weaknesses, applied to the research approach chosen in this thesis as well. Accordingly, the variety of methods has been chosen – in line with the idea of triangulation (Denzin, 1989; Flick, 2004). Such an approach is not only recommended to validate empirical findings (Sharp, et al., 2007), but also allows a broader picture on the capability and applicability of methods that assess attribute importance in early product development from a methodological point of view.
The multi-method approach was a combination of field data (study 1) and standardized laboratory assessments (studies 2 and 3). The first study started out with an exploratory, inductive approach, because, to date, no recognized list of relevant attributes from the perspective of young as well as older users exists.
As a variant of the elicitation task (Jaccard, et al., 1986), participants in study 1 freely listed reasons for technology adoption and avoidance, as well as statements explaining product-specific attitudes. Thus, two temporal directions of information were included – prior experiences (retrospective) and the anticipation of future experiences (prospective). The prospective
3 RESEARCH APPROACH 66
perspective was in particular highlighted in study 2 (rating the ‘likelihood of usage’) and study 3 (anticipating ‘ideal’ attribute combinations).
With respect to the measurement of user experience, a “current trend seems to ascribe higher significance to qualitative data analysis methods. Conversely, a danger would be that lower importance, priority and attention may be given to statistical methods” (Law & van Schaik, 2010, p. 320). In this thesis, the attempt was made to bridge qualitative and quantitative research. For example, statements from study 1 were analyzed with a structured, qualitative content analysis (Mayring, 2000, 2007) to allow a classification of attributes and subsequently with quantitative content analyses (Bortz & Döring, 2006; Krippendorff, 1980) to reveal different statement frequencies between motivating and de-motivating reasons and between age groups.
Also, the Kano Method (Kano, et al., 1984; Mikulić, 2007) was included in study 2 to study whether attributes differ in terms of requirement types (e.g. ‘must-be requirements’), thus a qualitative distinction of attributes. However, in addition, the impact on (dis-)satisfaction was also expressed in quantitative terms (coefficients of satisfaction and dissatisfaction).
Attributes identified in study 1 were weighted by participants in studies 2 and 3 to account for their relative importance regarding technology adoption (see Relative Importance Weights, p. 59). In study 2 the well-established method of conjoint analysis was borrowed from consumer research. “Conjoint analysis is, by far, the most used marketing research method for analyzing consumer trade-offs” (Green, et al., 2001, p. S57). However, it is not integrated on a regular basis as part of a user-centered design process (Schmidt, 1996), possibly due to time pressure, cost pressure, lack of expertise, or lack of communication between departments (Reinicke, 2004). Furthermore, conjoint-analysis is a de-compositional procedure that statistically determines attribute importance indirectly (see also p. 59 and Table 2-2).
The practical advantages of direct measures – ease, time effort, cost (Sattler & Hensel-Börner, 2007), and comprehensibility of results – appear to be convincing arguments with respect to method selection in product development. However, the conclusion should not be to simply use direct rating scales – instead, a more advanced approach that captures relative importance weights during assessment should be favored. From Table 2-2 it can be seen, that only the constant sum scale fulfills these requirements. The major drawback of this approach is the high cognitive load for participants, who have to keep the numbers in mind in order to ensure the constant sum (Aaker, et al., 1995; Kumar, et al., 2002). Also, numeric values that need to be stated impromptu might not be the best way to consult users. A more engaging approach with facilitating means for users to express themselves is likely to improve the technique, as is seen in participatory design and innovative methods (Hanington, 2003; Muller, 2008; Sanders, 2008). Furthermore, in contrast to a spontaneous response, a dynamic establishment of such, as seen in card sorting (Maguire, 2001), seemed worthwhile pursuing. To address the above-mentioned issues, a novel version of the constant sum scale was introduced in study 3. Participants were provided physical artifacts to express attribute importance. The method is a direct approach, but
3 RESEARCH APPROACH 67
accounting for relative importance weights at the same time. It is also rather simple to apply and analyze.
Self-Stated Importance Ratings (SSI) (Berger, et al., 1993), i.e. ratings on separate scales for each attribute, were included in all studies. Such rating scales are ‘quick and easy’ to apply and therefore frequently used (Clausing, 1994; Kumar, et al., 2002; Schmidt, 1996; Ulrich & Eppinger, 2008), despite risking response biases (Schmidt, 1996), i.e. ceiling effects. Including them in the studies permitted a direct comparison with method alternatives.
While SSI ratings on interval scales are collected for each attribute separately, in study 3, participants were additionally asked to select the one attribute that they regarded to have the highest priority and also to select the one attribute, they were most willing to tolerate shortcomings (ordinal ranks). This very simplistic indicator of importance was included as an additional (control) variable for comparison purposes with the newly introduced method.
In Sander’s terminology (Sanders, 2008), the chosen approach in this thesis is located more on the research-led side of the spectrum, because the goal was primarily to inform designers in the development process (Sanders, 2005).
How? – General Note on Analysis for All Three Studies
P-values will be reported in terms of non-significant (> .05) or significant (< .05; < .01; < .001) effects. One-tailed probabilities will be indicated as such. α-level will be adjusted by a Bonferroni correction if multiple comparisons of one parameter were conducted. In the case that the assumption of homogeneity of variance of an independent samples t-test did not hold, a two-sample t-test was performed that does not assume equal variances. Degrees of freedom were reduced accordingly (Field, 2009).
Analysis of variance (ANOVA) is considered to be rather robust against violations of the normality assumption, especially when group samples are of comparable size and greater than ten (Bortz, 2005; Glass, Peckham, & Sanders, 1972; Stevens, 2002). This was the case in all three studies. Consequently, parametric analyses were applied even in the case of non-normality.
Partial eta-squared (η2) will be reported as the measure of effect-size for analyses of variance.
If the assumption of sphericity was violated for the within-factor in a mixed design ANOVA, degrees of freedom were adjusted using the conservative Greenhouse-Geisser correction (Field, 2009).
4 STUDY 1 :: IDENTIFYING ATTRIBUTES :: SELF-DOCUMENTATION AND CONTENT ANALYSIS
4.1 BACKGROUND
It was the aim of this study, to determine those attributes of interactive products that are important with regards to the prospective likelihood to use a product and to the retrospective evaluation of products already in use. A qualitative, inductive approach of self-documentation in the field was chosen to embed the findings into the context of relevance – the user’s natural environment.∗ Young and older adults participated in this study. Although the importance of designing for older adults has received increased awareness, little is known about what attributes the elderly rely on in product evaluation and whether these attributes differ in importance to young adults.
Due to the explorative nature of this study, hypotheses were not formulated in a directional way. Relevant research questions were:
What are salient attributes with respect to technology adoption?
Do these differ between young and older adults?
Do these go beyond instrumental qualities of a product?
Are motivating and de-motivating reasons/positive and negative statements opposites within the same dimensions?
Is the combination of self-documentation and subsequent content analyses recommendable to identify (and weight) attributes?
The study design was motivated by the assumption that people, when given the chance, report more than just usability-related aspects of interactive products. In laboratory settings, participants are often confronted with unfamiliar technology, which might result in a strong focus on the challenges of using the device. Thus, instrumental qualities would be of primary concern. ∗ This chapter is partially based on Pohlmeyer, A. E., Blessing, L., Wandke, H., & Maue, J. (2009). The Value of Answers Without Question[s]. A Qualitative Approach to User Experience and Aging. In M. Kurosu (Ed.), Human Centered Design, HCII 2009, LNCS 5619 (pp. 894–903). Berlin, Germany: Springer-Verlag. [the original publication is available at www.springerlink.com] Pohlmeyer, A. E., & Blessing, L. (2009). To Use Or Not To Use. Good Is Not Always the Opposite of Bad. 4th International Conference on Designing Pleasurable Products and Interfaces, DPPI09 (pp. 99-103). Compiègne, France.
4 STUDY 1 :: IDENTIFYING ATTRIBUTES :: SELF-DOCUMENTATION AND CONTENT ANALYSIS 69
However, the picture might be different, when it is up to the participant to choose the device. If allowed to reflect on more familiar devices less task-oriented themes might arise. Consequently, data was collected in the field and participants were asked to present their point of view in a very literal way.
Participants were provided with a disposable camera and a documentation booklet for one week. They were asked to document a selection of positive and negative examples of electronic, interactive products in their surrounding with a photograph and a list of product-specific statements regarding why they like or dislike the product, respectively – hence, the salient attributes that are responsible for the resultant attitude. Additionally, they provided lists of general reasons that motivate and de-motivate, respectively, the use of interactive technology.
An open question format, not restricting the participants, was chosen in order to see what is of relevance in real-life scenarios. Instead of providing a list of questions that just needed to be checked off, only two questions were asked with respect to specific products: (1) do you like this interactive product or not and (2) why? (see Figure 4-1). The answers given by the users were therefore not pre-determined by the experimenter. Otherwise, the answers might have been limited by the questions raised and by the answer-options provided.
After the week of evaluating existing products, participants named general reasons that would motivate them to use technology and that would result in avoidant behavior. A qualitative content analysis with an inductive development of attribute-categories∗ of these general reasons was conducted in order to identify salient attributes for technology adoption. The derived coding scheme of the general reasons was subsequently applied and modified in order to be also applicable to the product-specific statements. Thus, two sets of attribute-categories emerged – one with a general view (general reasons) and one based on a retrospective evaluation of specific products. Attribute-categories were further grouped to main attribute-categories, which allowed subsequent frequency analyses that revealed first indications of attribute importance. Main attribute-categories identified in this study can be interpreted as primary, strategic attributes (Griffin & Hauser, 1993; Hauser & Clausing, 1988).
In addition to the aim of compiling a user-based list of relevant attributes on a level that is applicable for young as well as for older adults, a differentiation of valence was included in order to get a better understanding of the broad field of technology adoption: statements relating to positive examples of interactive products were compared with those of negative examples and general reasons for use with those of non-use. Unfortunately, this within-subject factor of valence is a usually neglected focus when studying technology adoption.
According to Blackwell et al. (2006, p. 83), “Satisfaction occurs when consumers’ expectations are matched by perceived performance. When experiences and performance fall short of expectations, dissatisfaction occurs”. ∗ Because of common terminology in qualitative content analyses, attributes will be termed ‘attribute-categories’ when referring to the analyses.
4 STUDY 1 :: IDENTIFYING ATTRIBUTES :: SELF-DOCUMENTATION AND CONTENT ANALYSIS 70
However, satisfaction and dissatisfaction are more complex than they might appear at first sight. Some attributes might motivate usage (predict adoption) while others lead to a rather resistant behavior (predict avoidance). Both perspectives are relevant with respect to technology acceptance and consequently need to be considered in design, preferably as early on as possible. The consumer satisfaction literature offers the Kano Model of Customer Satisfaction (Kano, et al., 1984), expanding Herzberg’s two-factor theory of work motivation (Herzberg, Mausner, & Snyderman, 1959) by a third, one-dimensional, factor:
1. must-be requirements: dissatisfaction when missing, but no satisfaction when present 2. attractive requirements: satisfaction when present, but no dissatisfaction when missing 3. one-dimensional requirements: satisfaction is proportional to fulfillment.
When translated into an HCI context, the following questions arise: what is it, that attracts potential users, and moreover, what is it that might make them reluctant to use an interactive product? The explicit task of focusing on positive and on negative examples has similarities to the critical incident technique (Flanagan, 1954). Given the debate on the possible independence of positive and negative judgments and attitudes (Herr & Page, 2004; Herzberg, et al., 1959; Kano, et al., 1984; Oliver, 1997), prospective reasons for use and non-use of technology, as well as positive and negative examples of existing products were assessed separately.
In general, the task of self-documenting interactive products from the personal environment is a participatory method, actively involving participants and collecting data in the field (Hanington, 2003; Muller, 2008; Sanders, 2008). It shows some similarities to other methods such as diary studies (Jordan, 2000; Maguire, 2001; Sharp, et al., 2007) or ‘cultural probes’ (Gaver, et al., 1999; Mattelmäki, 2006). However, in contrast to diary studies, the temporal context was not of interest. The goal was not to collect experiences in situ. Instead, product appraisals were most likely a summary of past experiences. Therefore, it is also not a technique of event sampling (Reis & Gable, 2000), but rather of ‘technology sampling’. Nonetheless, it is a method adapted from ethnographic inquiry, but relying on self-documentation and not on the observation by the experimenter – hence, it is a method of applied ethnography (Sanders, 2002).
It should be noted that the present study is not a cultural probe study, despite also using disposable cameras and providing participants with a kit that enabled them to fulfill the study’s tasks on their own. The documentation booklet and task of photography had a straightforward goal in the present study, namely sampling real-life examples of interactive products and their associated appraisals in order to inform design. These data can be analyzed and compared across participants.
4 STUDY 1 :: IDENTIFYING ATTRIBUTES :: SELF-DOCUMENTATION AND CONTENT ANALYSIS 71
4.2 METHOD
4.2.1 PARTICIPANTS
The initial sample consisted of 40 participants, recruited from two age groups in order to draw cross-sectional comparisons: 20 young adults (Myoung= 25.15, SDyoung= 4.17), ranging from 20 to 33 years and 20 older adults (Molder= 70.80, SDolder= 5.10), ranging from 65 to 80 years; each group consisting of ten males and ten females.
Data from one older participant had to be excluded from the analyses, because he did not complete the task in accordance with the instructions of selecting positive and negative examples. He furthermore failed to provide any general reasons concerning de-/motivation of use. Therefore, the resulting older sample included 19 adults (65-80 years; Molder= 71.11, SDolder= 5.04; 9 male). The analysis of product-specific statements and their quantitative distribution was based on this sample of 39 participants.
All but two participants had German nationality (one young female had a dual German-Russian nationality and had lived in Germany for 13 years at the time of the study; one young male was Japanese but had lived in Germany for two years at the time of the study).
The sample was well-educated (M= 16.68 years of education, SD= 2.99) with no significant difference between the two age groups (Myoung= 16.61, SDyoung= 2.75; Molder= 16.74, SDolder= 3.28; t (35) = -.126, p > .05). Young and older adults did not differ significantly with respect to self-perceived physical well-being (Myoung= 4.25, SDyoung= .72; Molder= 4.00, SDolder= .67; t (37) = 1.13, p > .05) and self-perceived general well-being (Myoung= 4.15, SDyoung= .59; Molder= 3.95, SDolder= .71; t (37) = .98, p > .05); 5-point rating scales: (1) very poor - (5) very good.
Unfortunately, four of the 39 participants who completed the task of self-documenting interactive products and providing the according product-specific statements as to why they liked or disliked the product, respectively, did not provide general reasons of technology use (one older male; three young males). As a result, the attribute-category set of general reasons is based on a sample of 35 participants: 17 young adults between 20-33 years (Myoung= 25.71, SDyoung= 4.12; 10 women) and 18 older adults between 65-80 years (Molder= 70.72, SDolder= 4.90; 10 women).
Participants were recruited from a circle of friends, colleagues, and neighbors. They were approached directly or by word of mouth. Since participants were engaged in this study for one week, they could not be reimbursed on an hourly basis. Instead, vouchers were handed out as a thank you: a book voucher (10 €) for older and a cinema voucher (~10 €) for young participants.
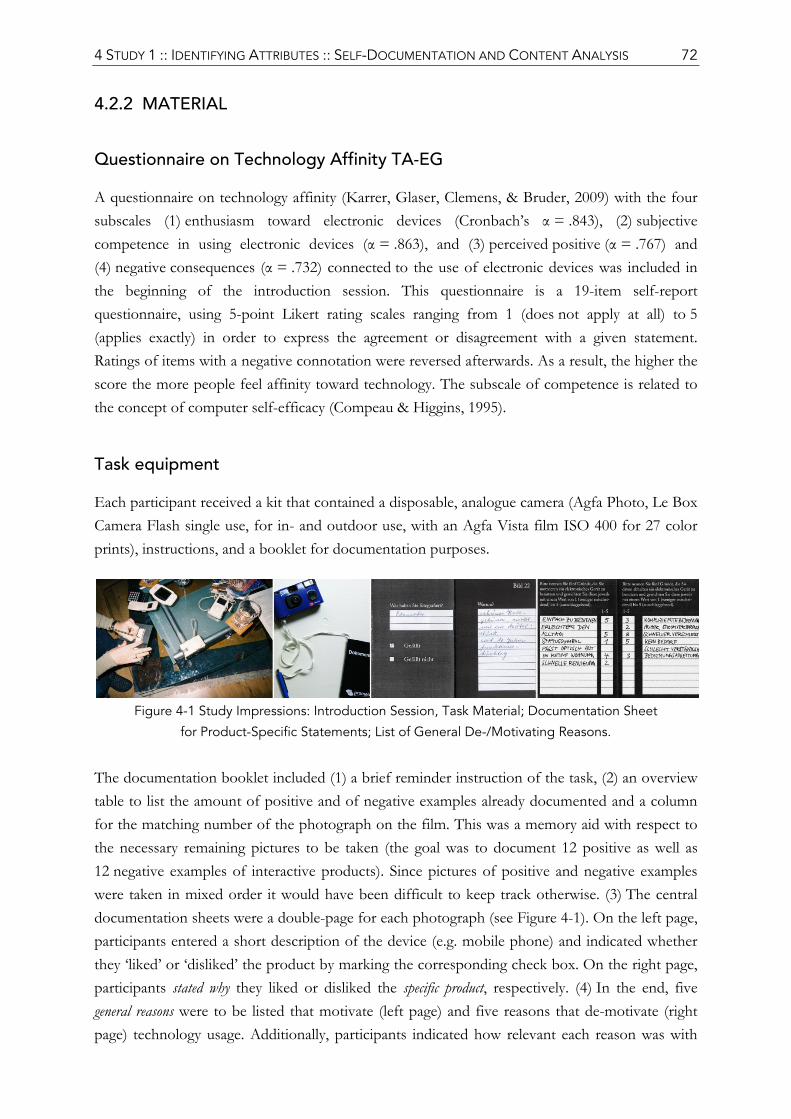
4 STUDY 1 :: IDENTIFYING ATTRIBUTES :: SELF-DOCUMENTATION AND CONTENT ANALYSIS 72
4.2.2 MATERIAL
Questionnaire on Technology Affinity TA-EG
A questionnaire on technology affinity (Karrer, Glaser, Clemens, & Bruder, 2009) with the four subscales (1) enthusiasm toward electronic devices (Cronbach’s α = .843), (2) subjective competence in using electronic devices (α = .863), and (3) perceived positive (α = .767) and (4) negative consequences (α = .732) connected to the use of electronic devices was included in the beginning of the introduction session. This questionnaire is a 19-item self-report questionnaire, using 5-point Likert rating scales ranging from 1 (does not apply at all) to 5 (applies exactly) in order to express the agreement or disagreement with a given statement. Ratings of items with a negative connotation were reversed afterwards. As a result, the higher the score the more people feel affinity toward technology. The subscale of competence is related to the concept of computer self-efficacy (Compeau & Higgins, 1995).
Task equipment
Each participant received a kit that contained a disposable, analogue camera (Agfa Photo, Le Box Camera Flash single use, for in- and outdoor use, with an Agfa Vista film ISO 400 for 27 color prints), instructions, and a booklet for documentation purposes.
Figure 4-1 Study Impressions: Introduction Session, Task Material; Documentation Sheet
for Product-Specific Statements; List of General De-/Motivating Reasons.
The documentation booklet included (1) a brief reminder instruction of the task, (2) an overview table to list the amount of positive and of negative examples already documented and a column for the matching number of the photograph on the film. This was a memory aid with respect to the necessary remaining pictures to be taken (the goal was to document 12 positive as well as 12 negative examples of interactive products). Since pictures of positive and negative examples were taken in mixed order it would have been difficult to keep track otherwise. (3) The central documentation sheets were a double-page for each photograph (see Figure 4-1). On the left page, participants entered a short description of the device (e.g. mobile phone) and indicated whether they ‘liked’ or ‘disliked’ the product by marking the corresponding check box. On the right page, participants stated why they liked or disliked the specific product, respectively. (4) In the end, five general reasons were to be listed that motivate (left page) and five reasons that de-motivate (right page) technology usage. Additionally, participants indicated how relevant each reason was with
4 STUDY 1 :: IDENTIFYING ATTRIBUTES :: SELF-DOCUMENTATION AND CONTENT ANALYSIS 73
respect to technology adoption with ratings ranging from one to five (1= not relevant; 5= crucial)∗. This was not an ordinal ranking, but an individual weighting of each statement. In other words, the same rating could be assigned multiple times. (5) The last page offered the possibility to give general feedback and comments regarding the study.
4.2.3 PROCEDURE
Prior to the week of self-documentation, participants were instructed by the experimenter. This introduction session took place at each participant’s home and lasted approximately 90 minutes. Participants were informed about the general aim and context of the study and signed a consent form. Afterwards, participants filled out the questionnaire on technology affinity (Karrer, et al., 2009) as well as supplementary information on their demographic background and two ratings regarding their self-perceived physical and general well-being. Finally, the documentation task for the week and the handling of camera and booklet were explained.
Step by step, participants were guided through the task demands and the written instructions that were left with the participant for the week. Participants were thoroughly trained how to use the disposable camera (e.g. activating flash, purpose of viewfinder, recommendations regarding appropriate distance and lighting). Additional directions were printed on the cameras themselves. To demonstrate the task of documentation, each participant went through a practice trial under guidance of the experimenter: five interactive products [an Apple iPod (20 GB, 2004), a digital camera (Lumix, Panasonic, DMX-LX1, 2006), a calculator (Casio SL 300, 1995), a Nintendo Gameboy Advance (2004), and a mobile phone (Nokia 2652, 2005)] were presented to the participant with the request to select two products (one that they liked and one that they disliked), photograph each one and explain the selection by listing keywords in a documentation booklet that was equivalent to the one they would use later on.
This short demonstration not only exemplified a realistic training of the task and its procedure, but it also served as a ‘framing’ with respect to what was considered and outlined to them as being electronic, interactive products. Interactive products were described to be technical devices that had some kind of higher order structure of interactive elements. In other words, it was not sufficient to just plug the device in with no further means of interaction or selection. Despite not being explicitly instructed, here, a product had the connotation of some hardware component to it (although for example a website can be seen as a product too).
Products were not constrained to a specific domain or to the home environment. Any electronic, interactive device (e.g. medical aid, kitchen tool, office and consumer electronics, vending machines) was appropriate. It was emphasized that participants would not have to own the
∗ „Bitte nennen Sie fünf Gründe, die Sie motivieren/davon abhalten, ein elektronisches Gerät zu benutzen und gewichten Sie diese jeweils mit einem Wert von 1 (weniger entscheidend) bis 5 (ausschlaggebend)“
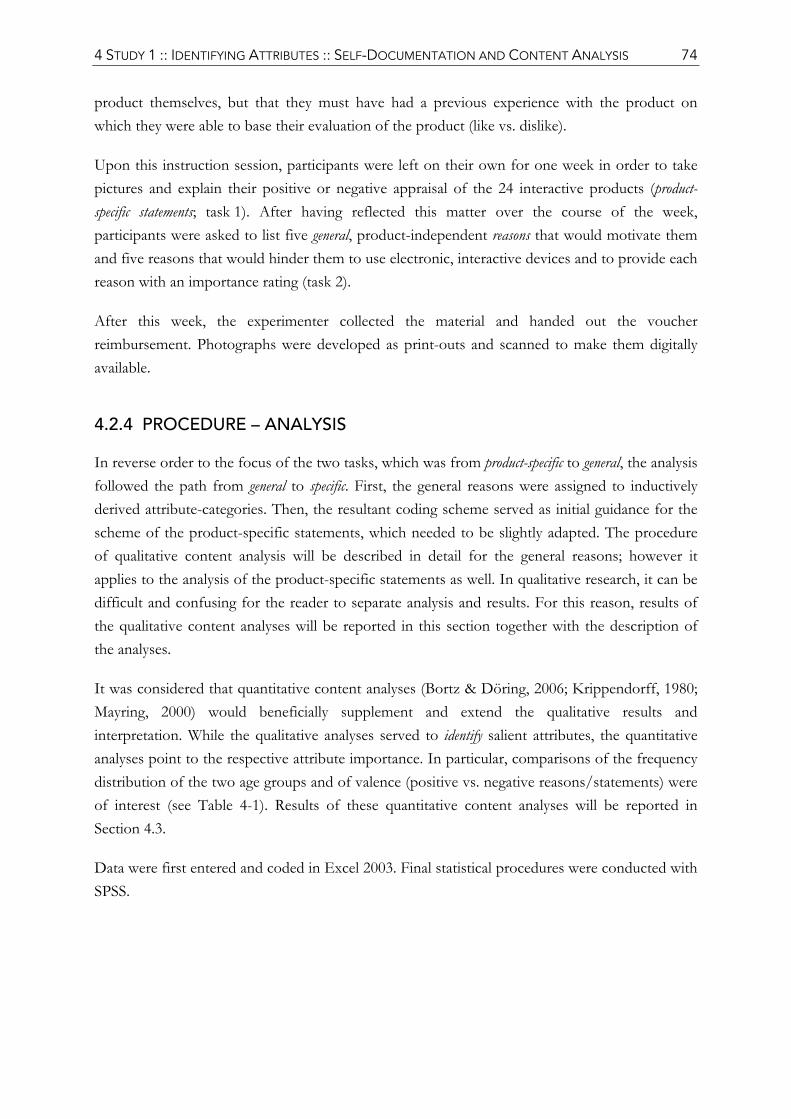
4 STUDY 1 :: IDENTIFYING ATTRIBUTES :: SELF-DOCUMENTATION AND CONTENT ANALYSIS 74
product themselves, but that they must have had a previous experience with the product on which they were able to base their evaluation of the product (like vs. dislike).
Upon this instruction session, participants were left on their own for one week in order to take pictures and explain their positive or negative appraisal of the 24 interactive products (product-specific statements; task 1). After having reflected this matter over the course of the week, participants were asked to list five general, product-independent reasons that would motivate them and five reasons that would hinder them to use electronic, interactive devices and to provide each reason with an importance rating (task 2).
After this week, the experimenter collected the material and handed out the voucher reimbursement. Photographs were developed as print-outs and scanned to make them digitally available.
4.2.4 PROCEDURE – ANALYSIS
In reverse order to the focus of the two tasks, which was from product-specific to general, the analysis followed the path from general to specific. First, the general reasons were assigned to inductively derived attribute-categories. Then, the resultant coding scheme served as initial guidance for the scheme of the product-specific statements, which needed to be slightly adapted. The procedure of qualitative content analysis will be described in detail for the general reasons; however it applies to the analysis of the product-specific statements as well. In qualitative research, it can be difficult and confusing for the reader to separate analysis and results. For this reason, results of the qualitative content analyses will be reported in this section together with the description of the analyses.
It was considered that quantitative content analyses (Bortz & Döring, 2006; Krippendorff, 1980; Mayring, 2000) would beneficially supplement and extend the qualitative results and interpretation. While the qualitative analyses served to identify salient attributes, the quantitative analyses point to the respective attribute importance. In particular, comparisons of the frequency distribution of the two age groups and of valence (positive vs. negative reasons/statements) were of interest (see Table 4-1). Results of these quantitative content analyses will be reported in Section 4.3.
Data were first entered and coded in Excel 2003. Final statistical procedures were conducted with SPSS.
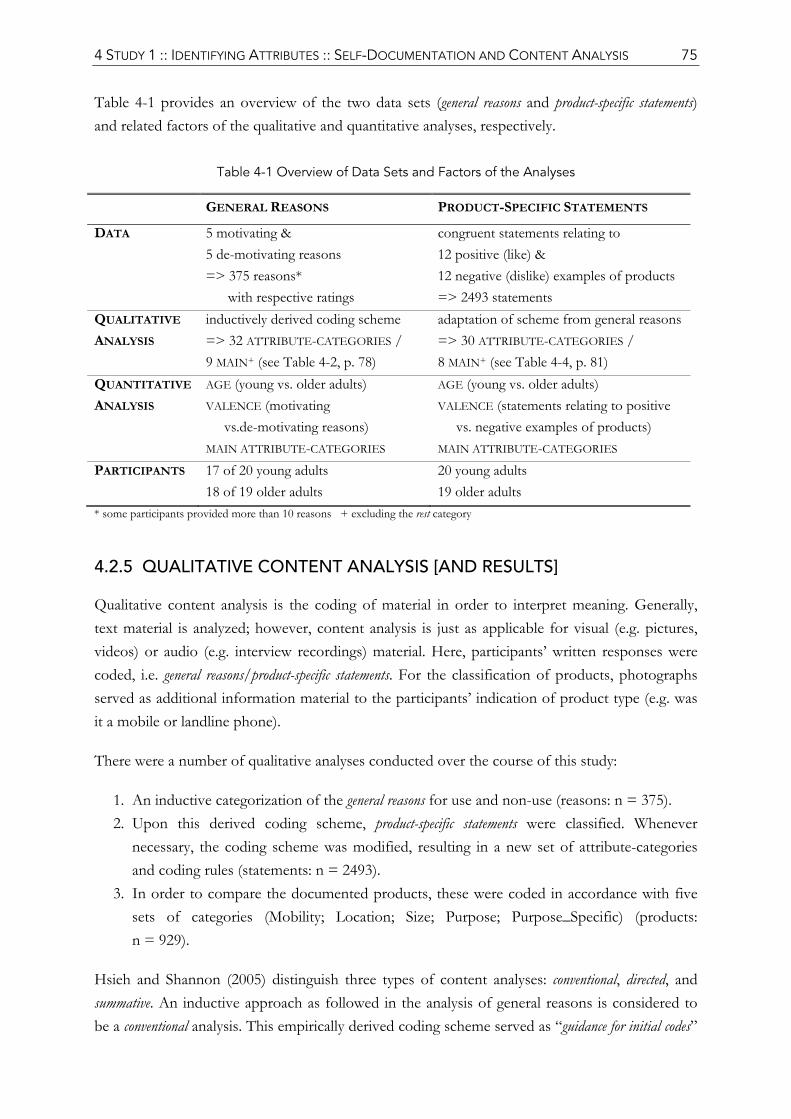
4 STUDY 1 :: IDENTIFYING ATTRIBUTES :: SELF-DOCUMENTATION AND CONTENT ANALYSIS 75
Table 4-1 provides an overview of the two data sets (general reasons and product-specific statements) and related factors of the qualitative and quantitative analyses, respectively.
Table 4-1 Overview of Data Sets and Factors of the Analyses
GENERAL REASONS PRODUCT-SPECIFIC STATEMENTS
DATA 5 motivating & 5 de-motivating reasons => 375 reasons* with respective ratings
congruent statements relating to 12 positive (like) & 12 negative (dislike) examples of products => 2493 statements
QUALITATIVE
ANALYSIS inductively derived coding scheme => 32 ATTRIBUTE-CATEGORIES / 9 MAIN+ (see Table 4-2, p. 78)
adaptation of scheme from general reasons => 30 ATTRIBUTE-CATEGORIES / 8 MAIN+ (see Table 4-4, p. 81)
QUANTITATIVE
ANALYSIS AGE (young vs. older adults) VALENCE (motivating vs.de-motivating reasons) MAIN ATTRIBUTE-CATEGORIES
AGE (young vs. older adults) VALENCE (statements relating to positive vs. negative examples of products) MAIN ATTRIBUTE-CATEGORIES
PARTICIPANTS 17 of 20 young adults 18 of 19 older adults
20 young adults 19 older adults
* some participants provided more than 10 reasons + excluding the rest category
4.2.5 QUALITATIVE CONTENT ANALYSIS [AND RESULTS]
Qualitative content analysis is the coding of material in order to interpret meaning. Generally, text material is analyzed; however, content analysis is just as applicable for visual (e.g. pictures, videos) or audio (e.g. interview recordings) material. Here, participants’ written responses were coded, i.e. general reasons/product-specific statements. For the classification of products, photographs served as additional information material to the participants’ indication of product type (e.g. was it a mobile or landline phone).
There were a number of qualitative analyses conducted over the course of this study:
1. An inductive categorization of the general reasons for use and non-use (reasons: n = 375). 2. Upon this derived coding scheme, product-specific statements were classified. Whenever
necessary, the coding scheme was modified, resulting in a new set of attribute-categories and coding rules (statements: n = 2493).
3. In order to compare the documented products, these were coded in accordance with five sets of categories (Mobility; Location; Size; Purpose; Purpose_Specific) (products: n = 929).
Hsieh and Shannon (2005) distinguish three types of content analyses: conventional, directed, and summative. An inductive approach as followed in the analysis of general reasons is considered to be a conventional analysis. This empirically derived coding scheme served as “guidance for initial codes”
4 STUDY 1 :: IDENTIFYING ATTRIBUTES :: SELF-DOCUMENTATION AND CONTENT ANALYSIS 76
with regard to the product-specific statements, which is then considered to be a directed analysis (Hsieh & Shannon, 2005). Categories for the third analysis (products) were defined for this study before coding, thus this analysis can also be considered as directed. Quantitative analyses were subsequently conducted (Mayring, 2000, 2007) in terms of attribute-category frequencies but not in terms of linguistic word count as done in summative analyses. As the categorization of products only served as a control measure for the quantitative analysis of the product-specific statements, it will be reported after the corresponding section (see p. 89).
General Reasons
Coding of the material was done in accordance with the systematic, iterative content analysis by Mayring (2000, 2007) as seen in Figure 4-2 and described in detail below. The material was structured by a data-driven, inductive approach in order to allow the appreciation and exploration of responses. As a result, codes were postdefined (Miles & Huberman, 1994).
In total, 375 general reasons were given, of which 188 were classed as motivating and 187 as de-motivating. This classification of valence had already been carried out by the participants themselves.
Figure 4-2 Process Model of Qualitative Content Analysis – Inductive Approach
(adapted from Mayring, 2000)
Usually, in content analyses, particularly of a text corpus, the first step is to reduce the material to a critical mass of content and to define the ‘unit of analysis’ (Mayring, 2007). This time-consuming task was not necessary with the present material because participants already stated their reasons in keywords. Therefore, there was no additional data processing required as one keyword was considered one unit of analysis (determination) and the analysis started directly by coding the given reasons to attribute-categories (Miles & Huberman, 1994).
Attribute-categories were formulated based on provided reasons. All reasons were classified into distinct attribute-categories that indicated unique characteristics not found in other categories.
If an item (reason) could not be classified as belonging to an existing attribute-category, a new one was generated (see iterative loop in Figure 4-2). Classification was revisited and revised multiple times (Formative Check).
4 STUDY 1 :: IDENTIFYING ATTRIBUTES :: SELF-DOCUMENTATION AND CONTENT ANALYSIS 77
Coding schemes were formulated, including definitions, anchor examples of positive as well as negative examples that fall into the respective attribute-category and, if appropriate, specific coding rules or exceptions were pointed out. Both, motivating and hindering, reasons were given the same chance of inclusion to an attribute-category; there were no categories developed that would not allow the consideration of a reason (or later statement) due to its valence (see Figure 4-3 on p. 82 for two product-specific examples). However, each reason was only allowed to be assigned to one attribute-category. The coding scheme met the quality criteria that it should be accurate (definition of attribute-categories, anchor examples, and coding rules), exclusive (an item can only be classified to one attribute-category), and exhaustive (items should be classifiable to one of the defined attribute-categories; a ‘rest’ category with non-classifiable items should be as small as possible) (Bortz & Döring, 2006; Frankfort-Nachmias & Nachmias, 1996).
A subsample of 20% (75 items) was presented to two colleagues together with the coding instructions. After a short introduction to the coding instructions they classified the 75 statements to the defined attribute-categories. Despite an agreement of over 90%, they were asked to critically comment their coding experience. Specifically, cases of disagreement were discussed and consensually classified (Bortz & Döring, 2006). The coding scheme was further refined and some instructions reformulated for improved clarity.
All 375 statements were classified accordingly (Summative Check).
The coding scheme of general reasons was aimed to be open to the participants’ answers, staying as close to the data as possible since it was also intended to be used as the initial scheme for the product-specific statements. Therefore, a higher number of attribute-categories than absolutely necessary seemed reasonable. Even in the case of small groupings, it was decided to keep them as separate categories if they were distinguishable from the others. However, in a following iteration, attribute-categories were subsumed to higher order, MAIN attribute-categories. The motivation for this step was twofold. Firstly, capturing differences in the material, i.e. between reasons, however with the smallest number of categories enhances the quality of a category set (Frankfort-Nachmias & Nachmias, 1996). Clearly, this is recommended only at the expense of a tenable loss of information. Basically, the inclusion of ‘attribute-categories’ and ‘main attribute-categories’ is what Miles and Huberman refer to as a “two-level scheme: a more general “etic” level […]; and a more specific “emic” level, close to participants’ categories but nested in the etic codes” (1994, p. 61). The second motivation for an aggregation was its necessity in order to meet the requirements for the subsequent quantitative content analysis (see p. 82).
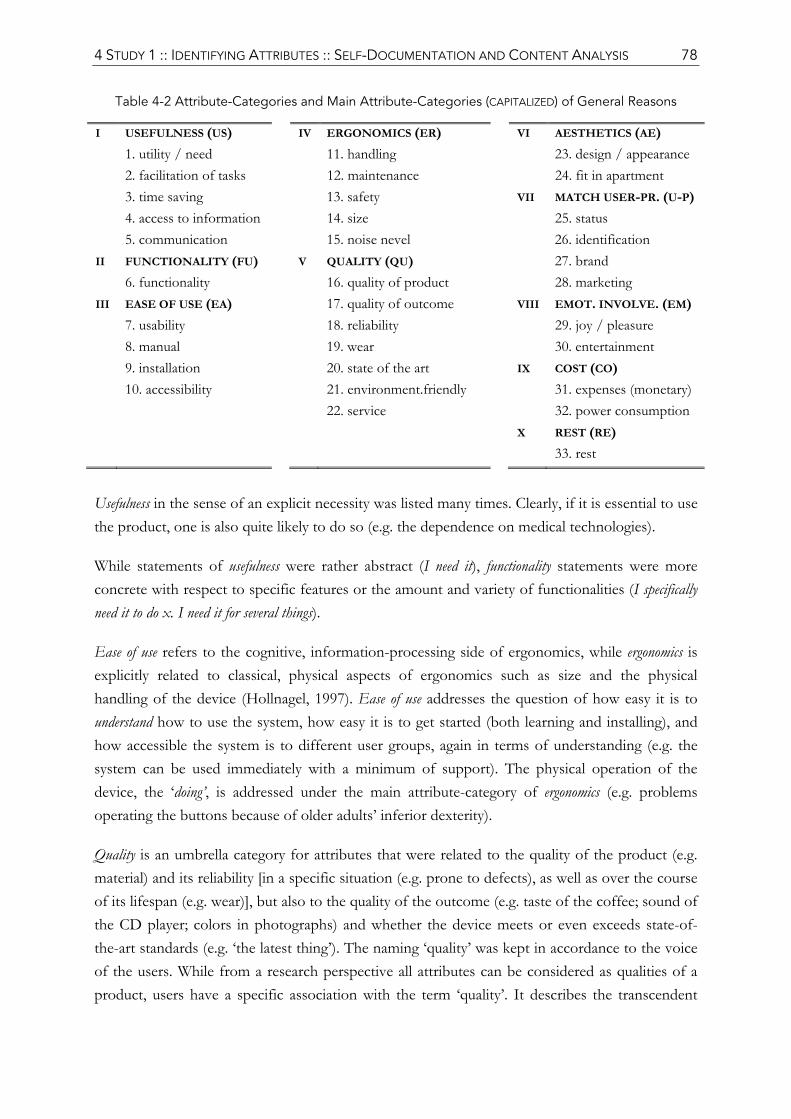
4 STUDY 1 :: IDENTIFYING ATTRIBUTES :: SELF-DOCUMENTATION AND CONTENT ANALYSIS 78
Table 4-2 Attribute-Categories and Main Attribute-Categories (CAPITALIZED) of General Reasons
I USEFULNESS (US) IV ERGONOMICS (ER) VI AESTHETICS (AE) 1. utility / need 11. handling 23. design / appearance 2. facilitation of tasks 12. maintenance 24. fit in apartment 3. time saving 13. safety VII MATCH USER-PR. (U-P) 4. access to information 14. size 25. status 5. communication 15. noise nevel 26. identification II FUNCTIONALITY (FU) V QUALITY (QU) 27. brand 6. functionality 16. quality of product 28. marketing III EASE OF USE (EA) 17. quality of outcome VIII EMOT. INVOLVE. (EM) 7. usability 18. reliability 29. joy / pleasure 8. manual 19. wear 30. entertainment 9. installation 20. state of the art IX COST (CO) 10. accessibility 21. environment.friendly 31. expenses (monetary) 22. service 32. power consumption X REST (RE) 33. rest
Usefulness in the sense of an explicit necessity was listed many times. Clearly, if it is essential to use the product, one is also quite likely to do so (e.g. the dependence on medical technologies).
While statements of usefulness were rather abstract (I need it), functionality statements were more concrete with respect to specific features or the amount and variety of functionalities (I specifically need it to do x. I need it for several things).
Ease of use refers to the cognitive, information-processing side of ergonomics, while ergonomics is explicitly related to classical, physical aspects of ergonomics such as size and the physical handling of the device (Hollnagel, 1997). Ease of use addresses the question of how easy it is to understand how to use the system, how easy it is to get started (both learning and installing), and how accessible the system is to different user groups, again in terms of understanding (e.g. the system can be used immediately with a minimum of support). The physical operation of the device, the ‘doing’, is addressed under the main attribute-category of ergonomics (e.g. problems operating the buttons because of older adults’ inferior dexterity).
Quality is an umbrella category for attributes that were related to the quality of the product (e.g. material) and its reliability [in a specific situation (e.g. prone to defects), as well as over the course of its lifespan (e.g. wear)], but also to the quality of the outcome (e.g. taste of the coffee; sound of the CD player; colors in photographs) and whether the device meets or even exceeds state-of-the-art standards (e.g. ‘the latest thing’). The naming ‘quality’ was kept in accordance to the voice of the users. While from a research perspective all attributes can be considered as qualities of a product, users have a specific association with the term ‘quality’. It describes the transcendent
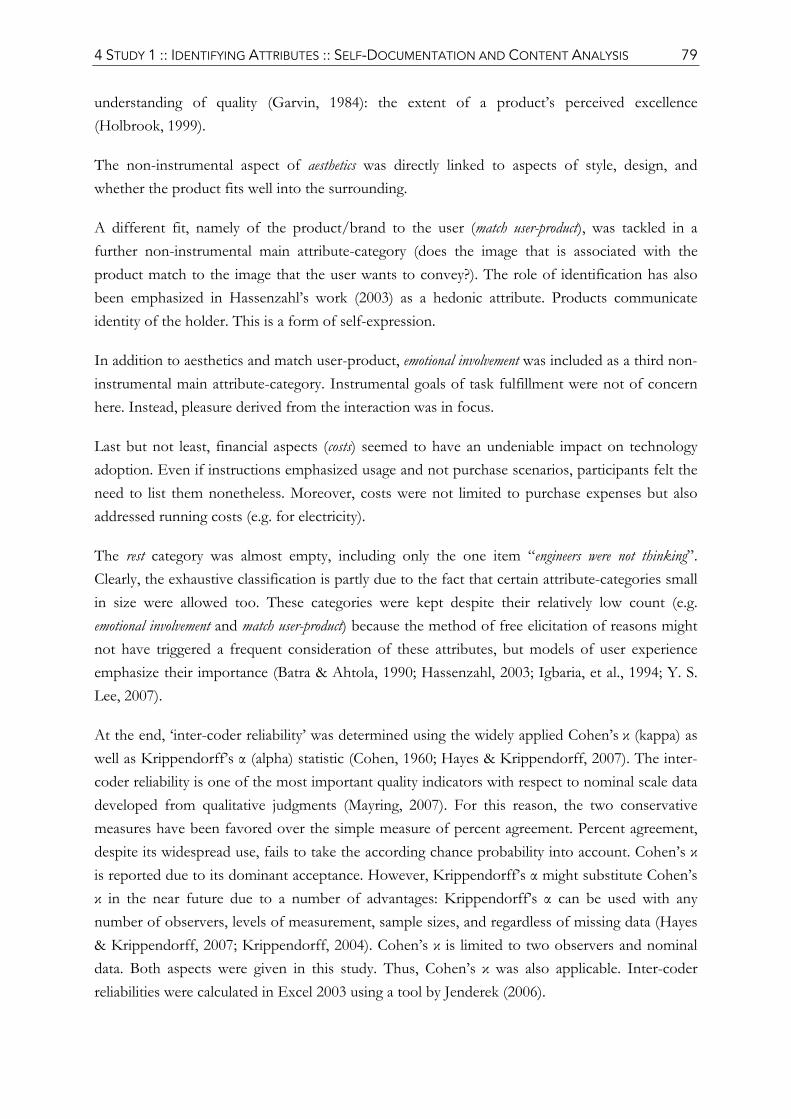
4 STUDY 1 :: IDENTIFYING ATTRIBUTES :: SELF-DOCUMENTATION AND CONTENT ANALYSIS 79
understanding of quality (Garvin, 1984): the extent of a product’s perceived excellence (Holbrook, 1999).
The non-instrumental aspect of aesthetics was directly linked to aspects of style, design, and whether the product fits well into the surrounding.
A different fit, namely of the product/brand to the user (match user-product), was tackled in a further non-instrumental main attribute-category (does the image that is associated with the product match to the image that the user wants to convey?). The role of identification has also been emphasized in Hassenzahl’s work (2003) as a hedonic attribute. Products communicate identity of the holder. This is a form of self-expression.
In addition to aesthetics and match user-product, emotional involvement was included as a third non-instrumental main attribute-category. Instrumental goals of task fulfillment were not of concern here. Instead, pleasure derived from the interaction was in focus.
Last but not least, financial aspects (costs) seemed to have an undeniable impact on technology adoption. Even if instructions emphasized usage and not purchase scenarios, participants felt the need to list them nonetheless. Moreover, costs were not limited to purchase expenses but also addressed running costs (e.g. for electricity).
The rest category was almost empty, including only the one item “engineers were not thinking”. Clearly, the exhaustive classification is partly due to the fact that certain attribute-categories small in size were allowed too. These categories were kept despite their relatively low count (e.g. emotional involvement and match user-product) because the method of free elicitation of reasons might not have triggered a frequent consideration of these attributes, but models of user experience emphasize their importance (Batra & Ahtola, 1990; Hassenzahl, 2003; Igbaria, et al., 1994; Y. S. Lee, 2007).
At the end, ‘inter-coder reliability’ was determined using the widely applied Cohen’s κ (kappa) as well as Krippendorff’s α (alpha) statistic (Cohen, 1960; Hayes & Krippendorff, 2007). The inter-coder reliability is one of the most important quality indicators with respect to nominal scale data developed from qualitative judgments (Mayring, 2007). For this reason, the two conservative measures have been favored over the simple measure of percent agreement. Percent agreement, despite its widespread use, fails to take the according chance probability into account. Cohen’s κ is reported due to its dominant acceptance. However, Krippendorff’s α might substitute Cohen’s κ in the near future due to a number of advantages: Krippendorff’s α can be used with any number of observers, levels of measurement, sample sizes, and regardless of missing data (Hayes & Krippendorff, 2007; Krippendorff, 2004). Cohen’s κ is limited to two observers and nominal data. Both aspects were given in this study. Thus, Cohen’s κ was also applicable. Inter-coder reliabilities were calculated in Excel 2003 using a tool by Jenderek (2006).
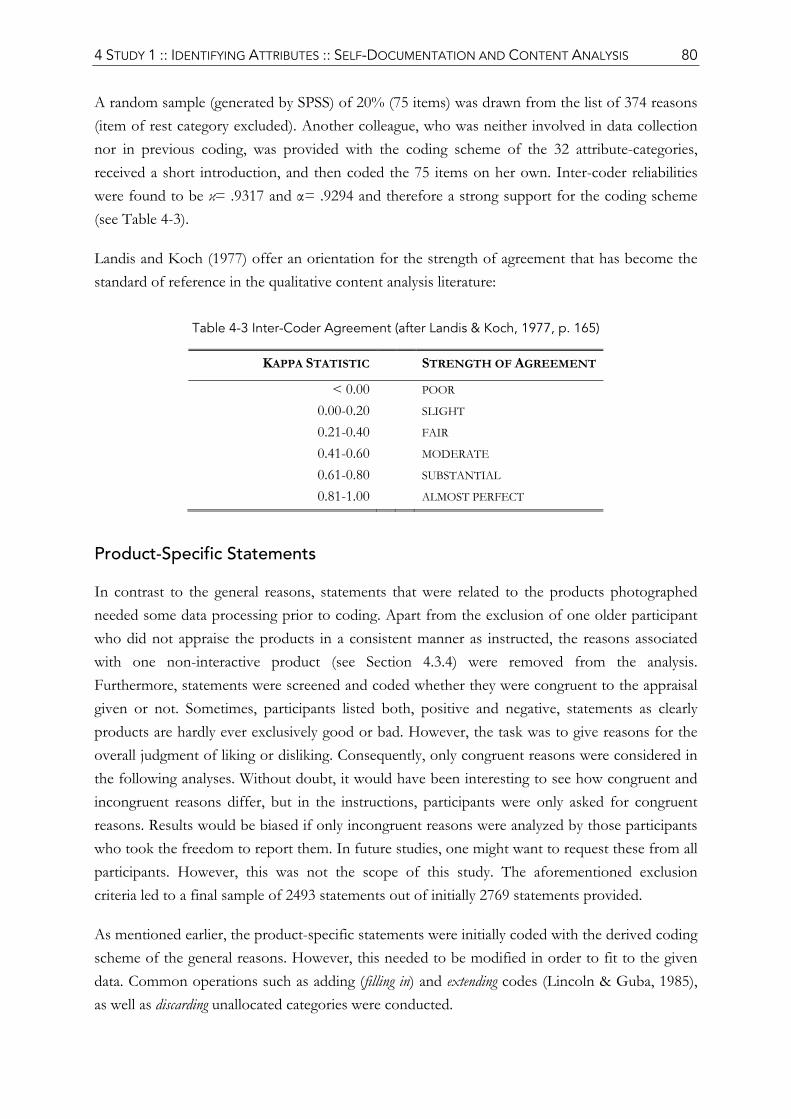
4 STUDY 1 :: IDENTIFYING ATTRIBUTES :: SELF-DOCUMENTATION AND CONTENT ANALYSIS 80
A random sample (generated by SPSS) of 20% (75 items) was drawn from the list of 374 reasons (item of rest category excluded). Another colleague, who was neither involved in data collection nor in previous coding, was provided with the coding scheme of the 32 attribute-categories, received a short introduction, and then coded the 75 items on her own. Inter-coder reliabilities were found to be κ= .9317 and α= .9294 and therefore a strong support for the coding scheme (see Table 4-3).
Landis and Koch (1977) offer an orientation for the strength of agreement that has become the standard of reference in the qualitative content analysis literature:
Table 4-3 Inter-Coder Agreement (after Landis & Koch, 1977, p. 165)
KAPPA STATISTIC STRENGTH OF AGREEMENT
< 0.00 POOR 0.00-0.20 SLIGHT 0.21-0.40 FAIR 0.41-0.60 MODERATE 0.61-0.80 SUBSTANTIAL 0.81-1.00 ALMOST PERFECT
Product-Specific Statements
In contrast to the general reasons, statements that were related to the products photographed needed some data processing prior to coding. Apart from the exclusion of one older participant who did not appraise the products in a consistent manner as instructed, the reasons associated with one non-interactive product (see Section 4.3.4) were removed from the analysis. Furthermore, statements were screened and coded whether they were congruent to the appraisal given or not. Sometimes, participants listed both, positive and negative, statements as clearly products are hardly ever exclusively good or bad. However, the task was to give reasons for the overall judgment of liking or disliking. Consequently, only congruent reasons were considered in the following analyses. Without doubt, it would have been interesting to see how congruent and incongruent reasons differ, but in the instructions, participants were only asked for congruent reasons. Results would be biased if only incongruent reasons were analyzed by those participants who took the freedom to report them. In future studies, one might want to request these from all participants. However, this was not the scope of this study. The aforementioned exclusion criteria led to a final sample of 2493 statements out of initially 2769 statements provided.
As mentioned earlier, the product-specific statements were initially coded with the derived coding scheme of the general reasons. However, this needed to be modified in order to fit to the given data. Common operations such as adding (filling in) and extending codes (Lincoln & Guba, 1985), as well as discarding unallocated categories were conducted.
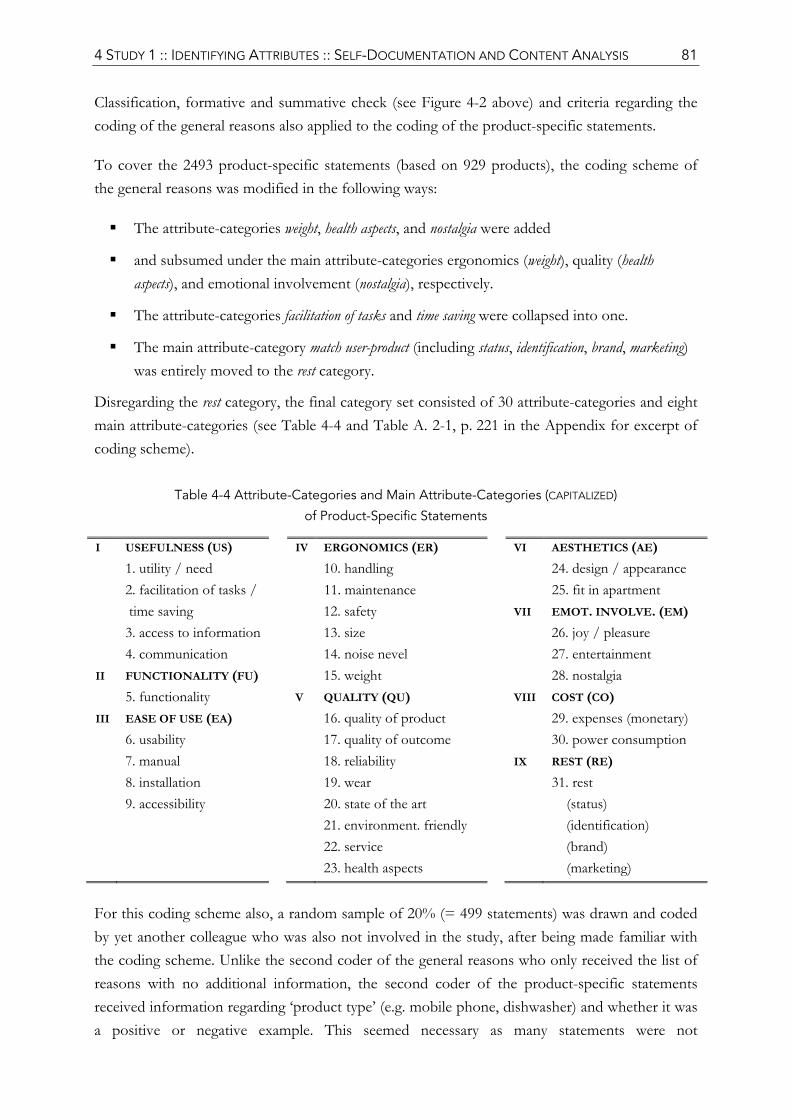
4 STUDY 1 :: IDENTIFYING ATTRIBUTES :: SELF-DOCUMENTATION AND CONTENT ANALYSIS 81
Classification, formative and summative check (see Figure 4-2 above) and criteria regarding the coding of the general reasons also applied to the coding of the product-specific statements.
To cover the 2493 product-specific statements (based on 929 products), the coding scheme of the general reasons was modified in the following ways:
The attribute-categories weight, health aspects, and nostalgia were added
and subsumed under the main attribute-categories ergonomics (weight), quality (health aspects), and emotional involvement (nostalgia), respectively.
The attribute-categories facilitation of tasks and time saving were collapsed into one.
The main attribute-category match user-product (including status, identification, brand, marketing) was entirely moved to the rest category.
Disregarding the rest category, the final category set consisted of 30 attribute-categories and eight main attribute-categories (see Table 4-4 and Table A. 2-1, p. 221 in the Appendix for excerpt of coding scheme).
Table 4-4 Attribute-Categories and Main Attribute-Categories (CAPITALIZED)
of Product-Specific Statements
I USEFULNESS (US) IV ERGONOMICS (ER) VI AESTHETICS (AE) 1. utility / need 10. handling 24. design / appearance 2. facilitation of tasks / 11. maintenance 25. fit in apartment time saving 12. safety VII EMOT. INVOLVE. (EM) 3. access to information 13. size 26. joy / pleasure 4. communication 14. noise nevel 27. entertainment II FUNCTIONALITY (FU) 15. weight 28. nostalgia 5. functionality V QUALITY (QU) VIII COST (CO) III EASE OF USE (EA) 16. quality of product 29. expenses (monetary) 6. usability 17. quality of outcome 30. power consumption 7. manual 18. reliability IX REST (RE) 8. installation 19. wear 31. rest 9. accessibility 20. state of the art (status) 21. environment. friendly (identification) 22. service (brand) 23. health aspects (marketing) For this coding scheme also, a random sample of 20% (= 499 statements) was drawn and coded by yet another colleague who was also not involved in the study, after being made familiar with the coding scheme. Unlike the second coder of the general reasons who only received the list of reasons with no additional information, the second coder of the product-specific statements received information regarding ‘product type’ (e.g. mobile phone, dishwasher) and whether it was a positive or negative example. This seemed necessary as many statements were not
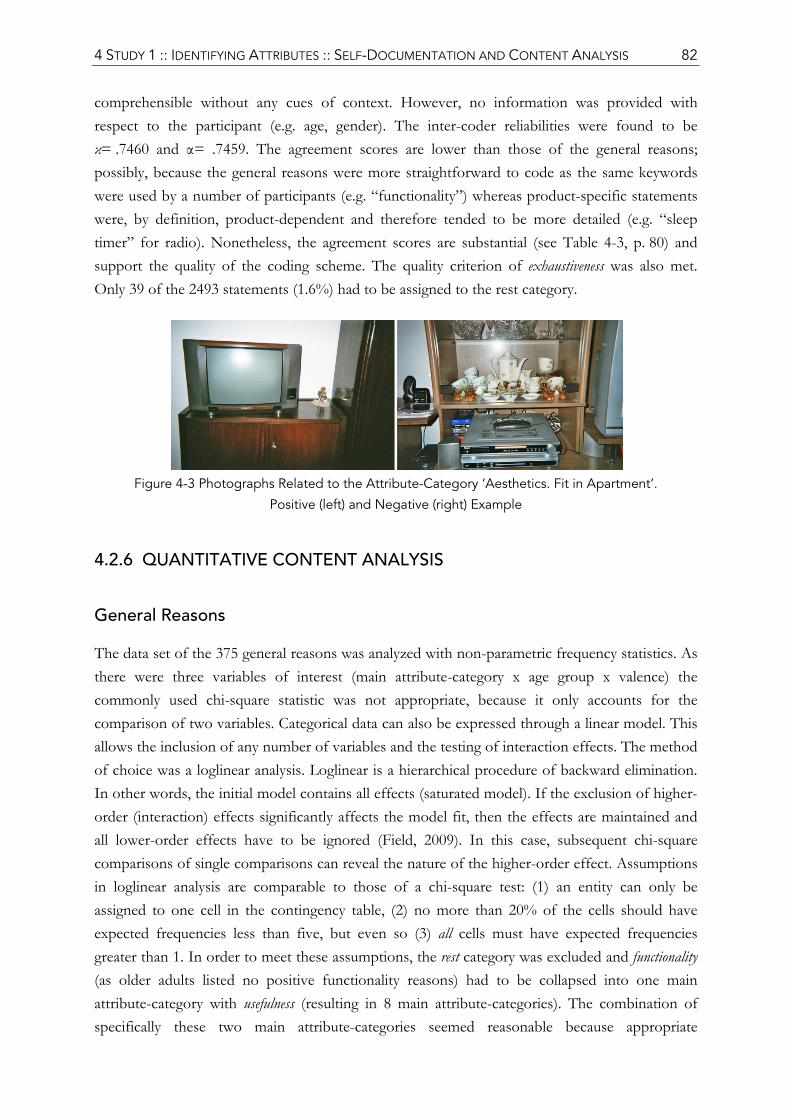
4 STUDY 1 :: IDENTIFYING ATTRIBUTES :: SELF-DOCUMENTATION AND CONTENT ANALYSIS 82
comprehensible without any cues of context. However, no information was provided with respect to the participant (e.g. age, gender). The inter-coder reliabilities were found to be κ= .7460 and α= .7459. The agreement scores are lower than those of the general reasons; possibly, because the general reasons were more straightforward to code as the same keywords were used by a number of participants (e.g. “functionality”) whereas product-specific statements were, by definition, product-dependent and therefore tended to be more detailed (e.g. “sleep timer” for radio). Nonetheless, the agreement scores are substantial (see Table 4-3, p. 80) and support the quality of the coding scheme. The quality criterion of exhaustiveness was also met. Only 39 of the 2493 statements (1.6%) had to be assigned to the rest category.
Figure 4-3 Photographs Related to the Attribute-Category ‘Aesthetics. Fit in Apartment’.
Positive (left) and Negative (right) Example
4.2.6 QUANTITATIVE CONTENT ANALYSIS
General Reasons
The data set of the 375 general reasons was analyzed with non-parametric frequency statistics. As there were three variables of interest (main attribute-category x age group x valence) the commonly used chi-square statistic was not appropriate, because it only accounts for the comparison of two variables. Categorical data can also be expressed through a linear model. This allows the inclusion of any number of variables and the testing of interaction effects. The method of choice was a loglinear analysis. Loglinear is a hierarchical procedure of backward elimination. In other words, the initial model contains all effects (saturated model). If the exclusion of higher-order (interaction) effects significantly affects the model fit, then the effects are maintained and all lower-order effects have to be ignored (Field, 2009). In this case, subsequent chi-square comparisons of single comparisons can reveal the nature of the higher-order effect. Assumptions in loglinear analysis are comparable to those of a chi-square test: (1) an entity can only be assigned to one cell in the contingency table, (2) no more than 20% of the cells should have expected frequencies less than five, but even so (3) all cells must have expected frequencies greater than 1. In order to meet these assumptions, the rest category was excluded and functionality (as older adults listed no positive functionality reasons) had to be collapsed into one main attribute-category with usefulness (resulting in 8 main attribute-categories). The combination of specifically these two main attribute-categories seemed reasonable because appropriate
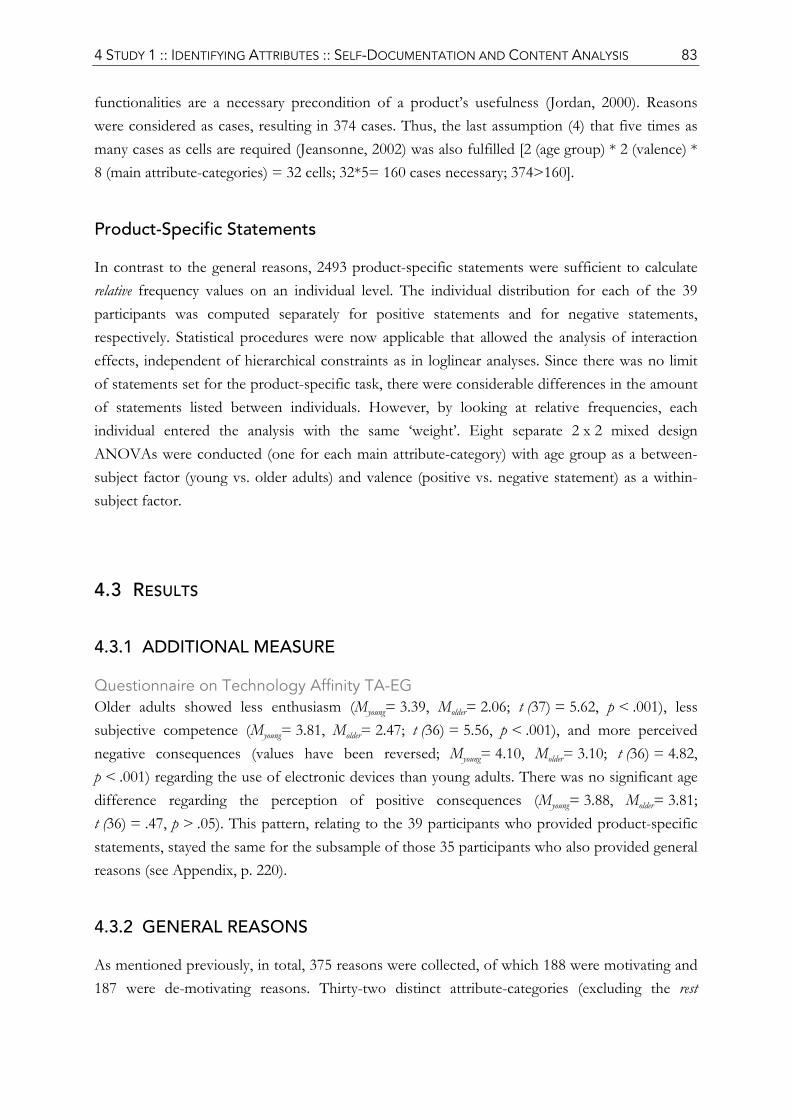
4 STUDY 1 :: IDENTIFYING ATTRIBUTES :: SELF-DOCUMENTATION AND CONTENT ANALYSIS 83
functionalities are a necessary precondition of a product’s usefulness (Jordan, 2000). Reasons were considered as cases, resulting in 374 cases. Thus, the last assumption (4) that five times as many cases as cells are required (Jeansonne, 2002) was also fulfilled [2 (age group) * 2 (valence) * 8 (main attribute-categories) = 32 cells; 32*5= 160 cases necessary; 374>160].
Product-Specific Statements
In contrast to the general reasons, 2493 product-specific statements were sufficient to calculate relative frequency values on an individual level. The individual distribution for each of the 39 participants was computed separately for positive statements and for negative statements, respectively. Statistical procedures were now applicable that allowed the analysis of interaction effects, independent of hierarchical constraints as in loglinear analyses. Since there was no limit of statements set for the product-specific task, there were considerable differences in the amount of statements listed between individuals. However, by looking at relative frequencies, each individual entered the analysis with the same ‘weight’. Eight separate 2 x 2 mixed design ANOVAs were conducted (one for each main attribute-category) with age group as a between-subject factor (young vs. older adults) and valence (positive vs. negative statement) as a within-subject factor.
4.3 RESULTS
4.3.1 ADDITIONAL MEASURE
Questionnaire on Technology Affinity TA-EG Older adults showed less enthusiasm (Myoung= 3.39, Molder= 2.06; t (37) = 5.62, p < .001), less subjective competence (Myoung= 3.81, Molder= 2.47; t (36) = 5.56, p < .001), and more perceived negative consequences (values have been reversed; Myoung= 4.10, Molder= 3.10; t (36) = 4.82, p < .001) regarding the use of electronic devices than young adults. There was no significant age difference regarding the perception of positive consequences (Myoung= 3.88, Molder= 3.81; t (36) = .47, p > .05). This pattern, relating to the 39 participants who provided product-specific statements, stayed the same for the subsample of those 35 participants who also provided general reasons (see Appendix, p. 220).
4.3.2 GENERAL REASONS
As mentioned previously, in total, 375 reasons were collected, of which 188 were motivating and 187 were de-motivating reasons. Thirty-two distinct attribute-categories (excluding the rest
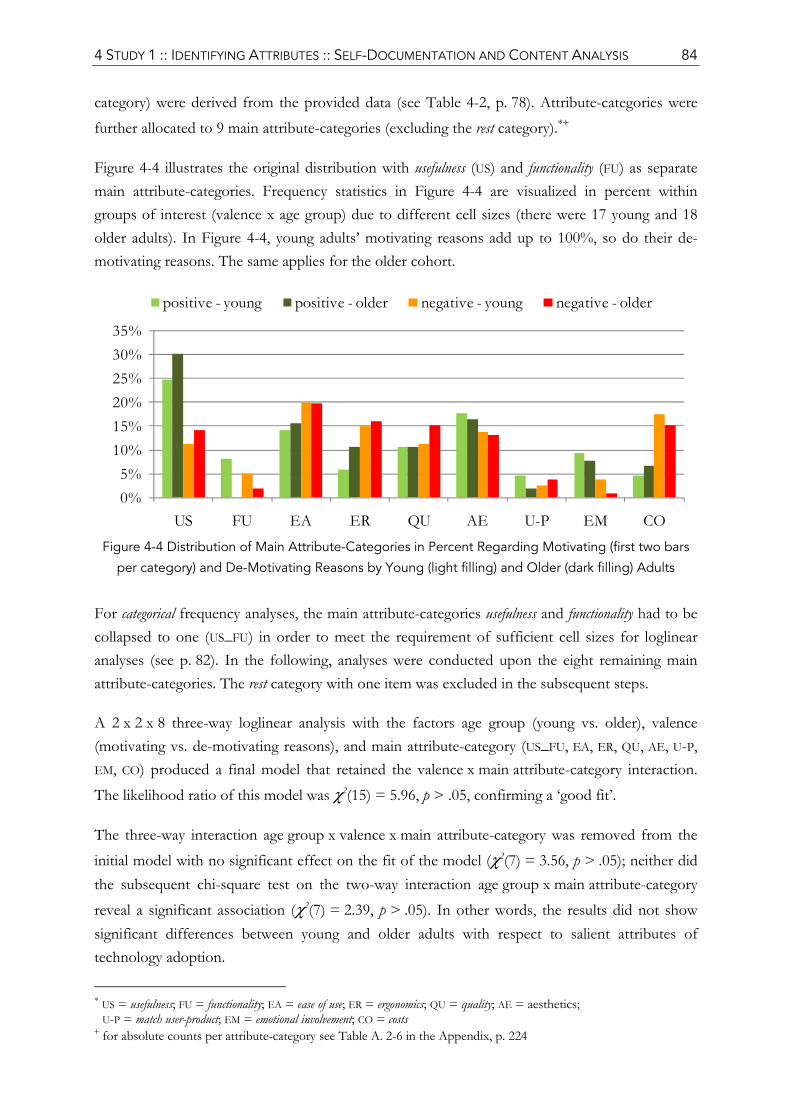
4 STUDY 1 :: IDENTIFYING ATTRIBUTES :: SELF-DOCUMENTATION AND CONTENT ANALYSIS 84
category) were derived from the provided data (see Table 4-2, p. 78). Attribute-categories were further allocated to 9 main attribute-categories (excluding the rest category).∗+
Figure 4-4 illustrates the original distribution with usefulness (US) and functionality (FU) as separate main attribute-categories. Frequency statistics in Figure 4-4 are visualized in percent within groups of interest (valence x age group) due to different cell sizes (there were 17 young and 18 older adults). In Figure 4-4, young adults’ motivating reasons add up to 100%, so do their de-motivating reasons. The same applies for the older cohort.
Figure 4-4 Distribution of Main Attribute-Categories in Percent Regarding Motivating (first two bars
per category) and De-Motivating Reasons by Young (light filling) and Older (dark filling) Adults
For categorical frequency analyses, the main attribute-categories usefulness and functionality had to be collapsed to one (US_FU) in order to meet the requirement of sufficient cell sizes for loglinear analyses (see p. 82). In the following, analyses were conducted upon the eight remaining main attribute-categories. The rest category with one item was excluded in the subsequent steps.
A 2 x 2 x 8 three-way loglinear analysis with the factors age group (young vs. older), valence (motivating vs. de-motivating reasons), and main attribute-category (US_FU, EA, ER, QU, AE, U-P, EM, CO) produced a final model that retained the valence x main attribute-category interaction. The likelihood ratio of this model was χ2(15) = 5.96, p > .05, confirming a ‘good fit’.
The three-way interaction age group x valence x main attribute-category was removed from the initial model with no significant effect on the fit of the model (χ2(7) = 3.56, p > .05); neither did the subsequent chi-square test on the two-way interaction age group x main attribute-category reveal a significant association (χ2(7) = 2.39, p > .05). In other words, the results did not show significant differences between young and older adults with respect to salient attributes of technology adoption.
∗ US = usefulness; FU = functionality; EA = ease of use; ER = ergonomics; QU = quality; AE = aesthetics; U-P = match user-product; EM = emotional involvement; CO = costs + for absolute counts per attribute-category see Table A. 2-6 in the Appendix, p. 224
0%5%
10%15%20%25%30%35%
US FU EA ER QU AE U-P EM CO
positive - young positive - older negative - young negative - older
4 STUDY 1 :: IDENTIFYING ATTRIBUTES :: SELF-DOCUMENTATION AND CONTENT ANALYSIS 85
On the other hand, the interaction valence x main attribute-category was significant χ2(7) = 31.86, p < .001, which indicates that the ratio of motivating and de-motivating reasons regarding the use of interactive products was different across the eight main attribute-categories. Table 4-5 further details the ratios within main attribute-categories and provides the according z-values of the z-test for two independent proportions (Sheskin, 2004). Z-scores greater than |1.96| indicate significant differences on a two-tailed α level of p < .05 (p < .01 for z-scores greater than |2.58| and p < .001 for z-scores greater than |3.29|).
Table 4-5 Z-Test for Two Independent Proportions: Motivating and De-Motivating Reasons
US_FU EA ER QU AE U-P EM CO
MOTIVATING 31% 15% 9% 11% 17% 3% 9% 6%
DE-MOTIVATING 16% 20% 16% 13% 13% 3% 3% 16%
Z -SCORE 3.47*** -1.28 -2.11* -0.83 0.97 0 - -3.16**
The combination of usefulness and functionality was stated significantly more frequently when participants were asked to name motivating reasons of technology use compared to de-motivating reasons (z = 3.47) despite the observation that none of the older adults mentioned functionality as a motivating reason. In contrast, poor ergonomics (z = -2.11) and high costs (z = -3.16) appeared to be more important factors when considering hindering reasons that might lead to avoidance of technology use.
Emotional involvement seemed to be a stronger motivator than hindering factor regarding technology adoption. However, this could not be tested statistically due to too small cell sizes (16 motivating : 4 de-motivating cases). Ease of use, quality, aesthetics, and match user-product showed comparable proportions of motivating and de-motivating reasons.
The superiority of one valence group over the other could indicate a disproportional relationship of attribute fulfillment and satisfaction. Therefore, significant valence differences are potential indicators of different requirement types. While the combination of usefulness and functionality yielded to a pattern of ‘attractive requirements’, ergonomics and costs appeared to be rather ‘must-be requirements’ – they were disproportionally listed more frequently as a de-motivating factor if performance was poor than as a motivating factor in the case of good performance.
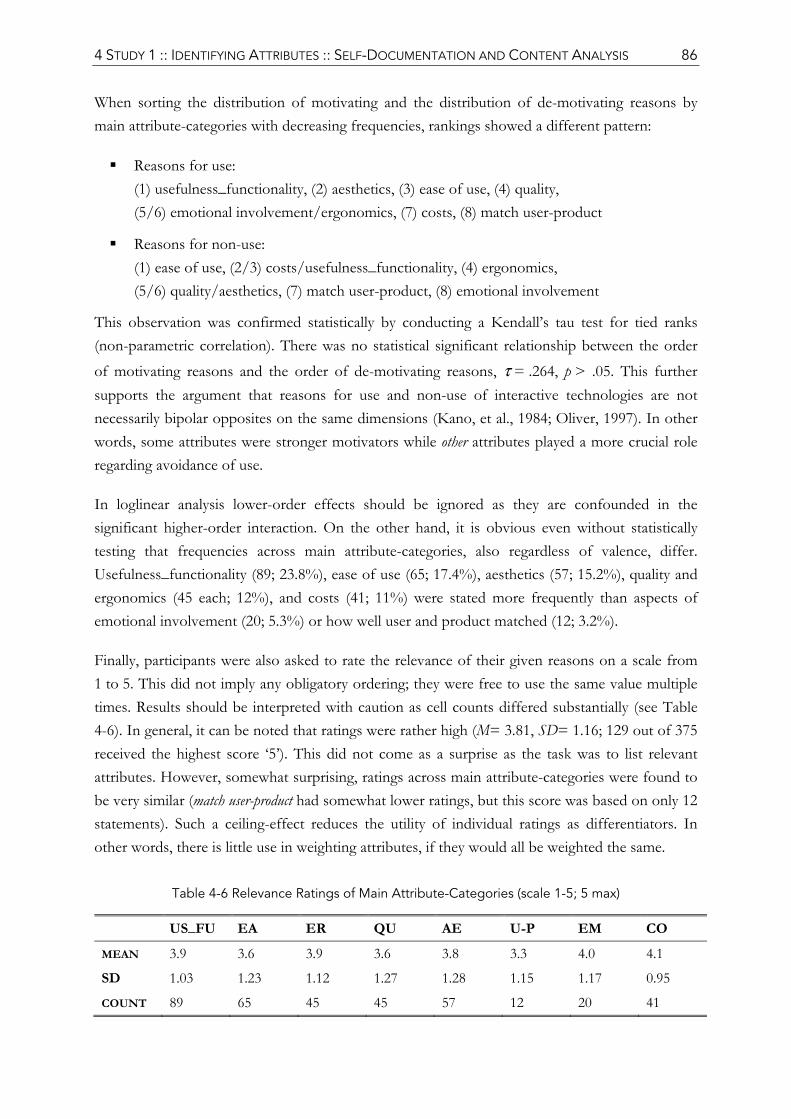
4 STUDY 1 :: IDENTIFYING ATTRIBUTES :: SELF-DOCUMENTATION AND CONTENT ANALYSIS 86
When sorting the distribution of motivating and the distribution of de-motivating reasons by main attribute-categories with decreasing frequencies, rankings showed a different pattern:
Reasons for use: (1) usefulness_functionality, (2) aesthetics, (3) ease of use, (4) quality, (5/6) emotional involvement/ergonomics, (7) costs, (8) match user-product
Reasons for non-use: (1) ease of use, (2/3) costs/usefulness_functionality, (4) ergonomics, (5/6) quality/aesthetics, (7) match user-product, (8) emotional involvement
This observation was confirmed statistically by conducting a Kendall’s tau test for tied ranks (non-parametric correlation). There was no statistical significant relationship between the order of motivating reasons and the order of de-motivating reasons, τ = .264, p > .05. This further supports the argument that reasons for use and non-use of interactive technologies are not necessarily bipolar opposites on the same dimensions (Kano, et al., 1984; Oliver, 1997). In other words, some attributes were stronger motivators while other attributes played a more crucial role regarding avoidance of use.
In loglinear analysis lower-order effects should be ignored as they are confounded in the significant higher-order interaction. On the other hand, it is obvious even without statistically testing that frequencies across main attribute-categories, also regardless of valence, differ. Usefulness_functionality (89; 23.8%), ease of use (65; 17.4%), aesthetics (57; 15.2%), quality and ergonomics (45 each; 12%), and costs (41; 11%) were stated more frequently than aspects of emotional involvement (20; 5.3%) or how well user and product matched (12; 3.2%).
Finally, participants were also asked to rate the relevance of their given reasons on a scale from 1 to 5. This did not imply any obligatory ordering; they were free to use the same value multiple times. Results should be interpreted with caution as cell counts differed substantially (see Table 4-6). In general, it can be noted that ratings were rather high (M= 3.81, SD= 1.16; 129 out of 375 received the highest score ‘5’). This did not come as a surprise as the task was to list relevant attributes. However, somewhat surprising, ratings across main attribute-categories were found to be very similar (match user-product had somewhat lower ratings, but this score was based on only 12 statements). Such a ceiling-effect reduces the utility of individual ratings as differentiators. In other words, there is little use in weighting attributes, if they would all be weighted the same.
Table 4-6 Relevance Ratings of Main Attribute-Categories (scale 1-5; 5 max)
US_FU EA ER QU AE U-P EM CO
MEAN 3.9 3.6 3.9 3.6 3.8 3.3 4.0 4.1
SD 1.03 1.23 1.12 1.27 1.28 1.15 1.17 0.95
COUNT 89 65 45 45 57 12 20 41
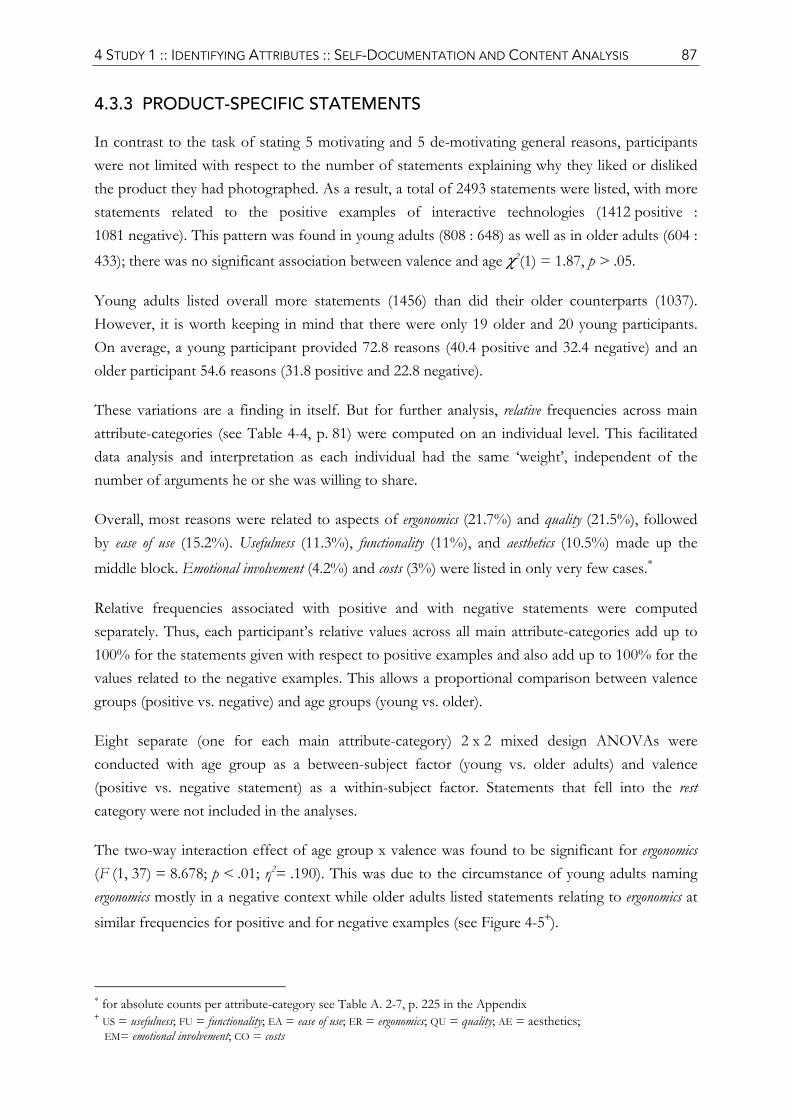
4 STUDY 1 :: IDENTIFYING ATTRIBUTES :: SELF-DOCUMENTATION AND CONTENT ANALYSIS 87
4.3.3 PRODUCT-SPECIFIC STATEMENTS
In contrast to the task of stating 5 motivating and 5 de-motivating general reasons, participants were not limited with respect to the number of statements explaining why they liked or disliked the product they had photographed. As a result, a total of 2493 statements were listed, with more statements related to the positive examples of interactive technologies (1412 positive : 1081 negative). This pattern was found in young adults (808 : 648) as well as in older adults (604 : 433); there was no significant association between valence and age χ2(1) = 1.87, p > .05.
Young adults listed overall more statements (1456) than did their older counterparts (1037). However, it is worth keeping in mind that there were only 19 older and 20 young participants. On average, a young participant provided 72.8 reasons (40.4 positive and 32.4 negative) and an older participant 54.6 reasons (31.8 positive and 22.8 negative).
These variations are a finding in itself. But for further analysis, relative frequencies across main attribute-categories (see Table 4-4, p. 81) were computed on an individual level. This facilitated data analysis and interpretation as each individual had the same ‘weight’, independent of the number of arguments he or she was willing to share.
Overall, most reasons were related to aspects of ergonomics (21.7%) and quality (21.5%), followed by ease of use (15.2%). Usefulness (11.3%), functionality (11%), and aesthetics (10.5%) made up the middle block. Emotional involvement (4.2%) and costs (3%) were listed in only very few cases.∗
Relative frequencies associated with positive and with negative statements were computed separately. Thus, each participant’s relative values across all main attribute-categories add up to 100% for the statements given with respect to positive examples and also add up to 100% for the values related to the negative examples. This allows a proportional comparison between valence groups (positive vs. negative) and age groups (young vs. older).
Eight separate (one for each main attribute-category) 2 x 2 mixed design ANOVAs were conducted with age group as a between-subject factor (young vs. older adults) and valence (positive vs. negative statement) as a within-subject factor. Statements that fell into the rest category were not included in the analyses.
The two-way interaction effect of age group x valence was found to be significant for ergonomics (F (1, 37) = 8.678; p < .01; η2= .190). This was due to the circumstance of young adults naming ergonomics mostly in a negative context while older adults listed statements relating to ergonomics at similar frequencies for positive and for negative examples (see Figure 4-5+).
∗ for absolute counts per attribute-category see Table A. 2-7, p. 225 in the Appendix + US = usefulness; FU = functionality; EA = ease of use; ER = ergonomics; QU = quality; AE = aesthetics; EM= emotional involvement; CO = costs
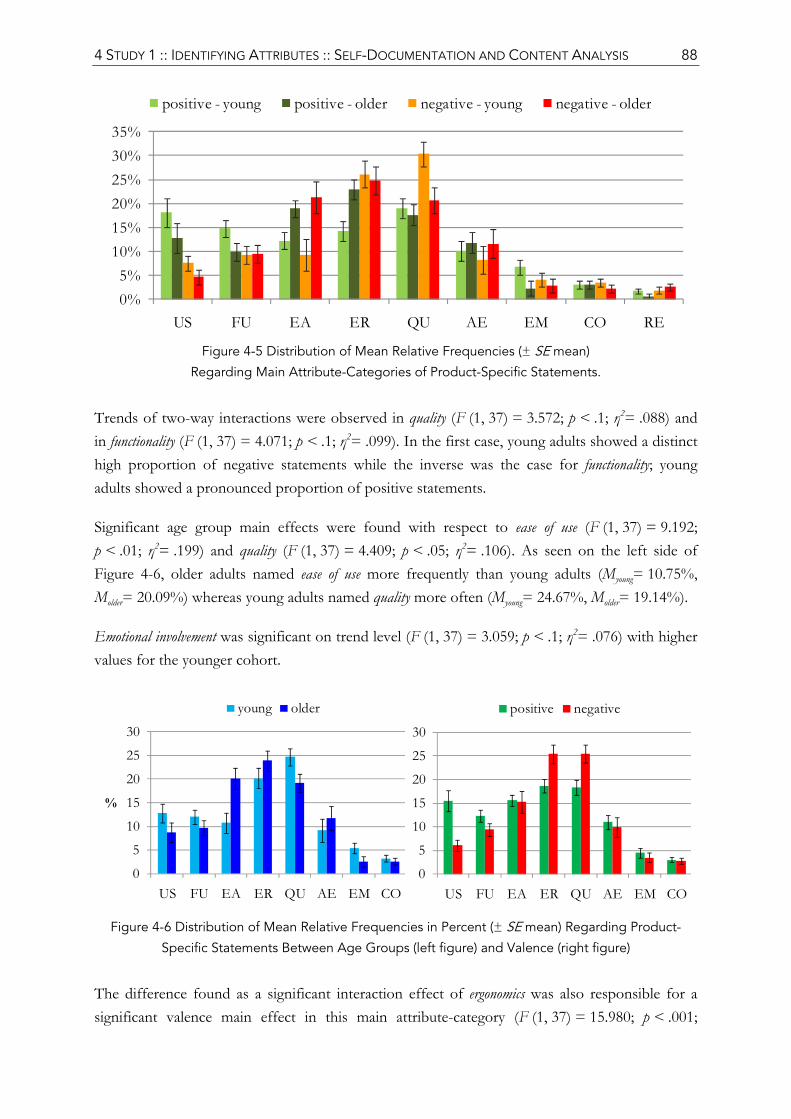
4 STUDY 1 :: IDENTIFYING ATTRIBUTES :: SELF-DOCUMENTATION AND CONTENT ANALYSIS 88
Figure 4-5 Distribution of Mean Relative Frequencies (± SE mean)
Regarding Main Attribute-Categories of Product-Specific Statements.
Trends of two-way interactions were observed in quality (F (1, 37) = 3.572; p < .1; η2= .088) and in functionality (F (1, 37) = 4.071; p < .1; η2= .099). In the first case, young adults showed a distinct high proportion of negative statements while the inverse was the case for functionality; young adults showed a pronounced proportion of positive statements.
Significant age group main effects were found with respect to ease of use (F (1, 37) = 9.192; p < .01; η2= .199) and quality (F (1, 37) = 4.409; p < .05; η2= .106). As seen on the left side of Figure 4-6, older adults named ease of use more frequently than young adults (Myoung= 10.75%, Molder= 20.09%) whereas young adults named quality more often (Myoung= 24.67%, Molder= 19.14%).
Emotional involvement was significant on trend level (F (1, 37) = 3.059; p < .1; η2= .076) with higher values for the younger cohort.
Figure 4-6 Distribution of Mean Relative Frequencies in Percent (± SE mean) Regarding Product-
Specific Statements Between Age Groups (left figure) and Valence (right figure)
The difference found as a significant interaction effect of ergonomics was also responsible for a significant valence main effect in this main attribute-category (F (1, 37) = 15.980; p < .001;
0%5%
10%15%20%25%30%35%
US FU EA ER QU AE EM CO RE
positive - young positive - older negative - young negative - older
0
5
10
15
20
25
30
US FU EA ER QU AE EM CO
%
young older
0
5
10
15
20
25
30
US FU EA ER QU AE EM CO
positive negative
4 STUDY 1 :: IDENTIFYING ATTRIBUTES :: SELF-DOCUMENTATION AND CONTENT ANALYSIS 89
η2= .302; Mpos= 18.64%, Mneg= 25.44%), resulting in overall more negative statements (see right side of Figure 4-6).
Further valence main effects were found with respect to quality (F (1, 37) = 10.615; p < .01; η2= .223), usefulness (F (1, 37) = 23.842; p < .001; η2= .392), and functionality (F (1, 37) = 5.351; p < .05; η2= .126).
Similar to the findings regarding general reasons, usefulness and functionality were listed more frequently as attributes for positive examples and ergonomics for negative examples, thus deviating from a balanced proportion that would have been expected for ‘one-dimensional requirements’ in the Kano Model (Berger, et al., 1993; Kano, et al., 1984). Quality is also stated more frequently in relation to negative examples than to positive ones.
Despite valence differences within some main attribute-categories, the overall orders sorted by relative frequency of positive and negative statements, respectively, seemed much more related than was the case for general reasons, which was also confirmed statistically (τ = .764, p < .01):
Positive statements: (1) quality, (2) ergonomics, (3) ease of use, (4) usefulness, (5) functionality, (6) aesthetics, (7) emotional involvement, (8) costs
Negative statements: (1/2) quality/ergonomics, (3) ease of use, (4) aesthetics, (5) functionality, (6) usefulness, (7) emotional involvement, (8) costs
4.3.4 PRODUCTS
As a prerequisite to interpret the conclusions concerning group and valence differences it is essential that the products themselves did not differ between groups.
Products were screened regarding the requirement of interactivity. One product (a display at a train station) had to be excluded, because it did not correspond to the definition of an interactive product: it has no input channel and therefore no means for interactivity. The corresponding statements were also excluded from the statement analyses.
In the end, 929 interactive products were photographed, assigned with an appraisal of either ‘like’ or ‘dislike’, and supplemented with congruent product-specific statements explaining the according appraisal.
Interestingly, all products had a hardware component. No websites or services had been selected.

4 STUDY 1 :: IDENTIFYING ATTRIBUTES :: SELF-DOCUMENTATION AND CONTENT ANALYSIS 90
The 929 products photographed by participants were listed in terms of 152 different product types (e.g. washing machine, video camera, stereo system). Hence, a higher-level classification was needed in order to test whether products differed between age groups or between valence groups. Five qualitative content analyses with subsequent transformation of absolute counts into relative frequencies and analyses were performed. No applicable category set was found in the literature that would have been able to include all products of this study and/or that would have made a categorization possible based on the limited information available (photograph and name of the product (type), e.g. microwave). Therefore, codes were formulated for the purpose of this study, however before actually coding the products (for further details see Appendix, p. 222).
All products were coded according to their:
Level of Mobility: (1) stationary; (2) locally mobile (within a house); (3) universally mobile
User-Centered Size: (1) 1 hand; (2) 2 hands (shoulder-width); (3) 2 arms; (4) greater than 2 arms
Location of Use: (1) kitchen; (2) bathroom; (3) office; (4) living room; (5) multiple places within housing (local mobility); (6) mobile (universal); (7) public area; (8) workshop/studio; (9) rest
Purpose: (1) communication; (2) entertainment; (3) information; (4) meal preparation; (5) hygiene product; (6) rest
Purpose_Specific: (1) communication_visual; (2) communication_auditory; (3) entertainment_visual; (4) entertainment_auditory; (5) information_permanent; (6) information_temporary; (7) meal preparation_food; (8) meal preparation_drinks; (9) hygiene product_domestic; (10) hygiene product_personal; (11) hygiene product_food; (12) rest
Very briefly, it can be said that the majority of products were stationary devices (595; 64%), roughly the size between one hand and shoulder width (‘2 hands’; 485; 52%), and primarily entertainment electronics (283; 31%), in particular visual entertainment electronics (159; 17%). Regarding location of use, most devices were usable in a mobile context (231; 25%); however, within the house, peaks were found in the kitchen (177; 19%), in the living room (151; 16%), and in ‘multiple places’ of use (133; 14%). For further details see Appendix, p. 227.
Finally, also for these classifications, inter-coder reliability of two coders was determined upon a random sample of 20% (186 products). This sample was used for all five product-related coding schemes. One of the coders had not been involved in the study, nor in the coding of the previous schemes of general reasons and product-specific statements. In order to code the product, the photograph and information concerning the product type as indicated by the participant were provided. No information regarding the assigned valence, nor about the participant were given. High agreement scores were achieved: Level of Mobility: κ= .9146 and α= .9149; Size: κ= .8828
4 STUDY 1 :: IDENTIFYING ATTRIBUTES :: SELF-DOCUMENTATION AND CONTENT ANALYSIS 91
and α= .8833; Location: κ= .9278 and α= .9289; Purpose κ= .9621 and α= .9664; Purpose_Specific: κ= .9550 and α= .9583.
Similar to the analysis of the product-specific statements, separate (for each product classification level) 2 x 2 mixed design ANOVAs were conducted upon relative frequencies per person. Again, age group entered the analysis as a between-subject factor and valence as a within-subject factor. As the same data underwent multiple comparisons (one for each coding scheme), Bonferroni corrections∗ were applied.
There were no significant main effects of age and no significant main effects of valence+.
To conclude, although participant selected different products, these did not differ significantly between young and older adults and between valence assignments. In other words, there were no indications that results of the frequency analyses indicating group differences in respect of main attribute-categories were confounded by different products.
4.4 DISCUSSION OF EMPIRICAL RESULTS
What are salient attributes with respect to technology adoption? Do these go beyond instrumental qualities of a product?
Notwithstanding the importance of useful and usable products with respect to technology acceptance (Davis, 1989; Davis, et al., 1989; King & He, 2006; Venkatesh, et al., 2003) which was also confirmed in the present findings, it seems that people relate to a number of additional attributes when considering the use or non-use of an interactive product and when evaluating specific products.
Eight main attribute-categories, i.e. ‘primary attributes’ (Hauser & Clausing, 1988), were identified in this study: usefulness (1) was supplemented by concrete functionality (2). Furthermore, instrumental attributes such as ease of use (3), physical ergonomics (4), and quality (5) were found to be relevant as well as non-instrumental attributes, i.e. aesthetics (6) and emotional involvement (7). Finally, in real life, financial aspects (costs) (8) could not be ignored.
These attributes show apparent similarity to the six software quality attributes defined in the quality model for external and internal quality of ISO standard 9126-1 (2001): functionality, reliability, usability, efficiency, maintainability, portability (see also Table 4-2 and Table 4-4).
∗ to ensure an overall α level of .05, significance was only considered for p < .01 + Only one main effect was observed in respect of valence, notable on trend level. There were more negative than positive examples regarding the location ‘multiple places within housing’ (F (1, 37) = 7.283; p < .02; η2= .164) However, this only affected 14% of the products (133 products; 56 positive : 77 negative).
4 STUDY 1 :: IDENTIFYING ATTRIBUTES :: SELF-DOCUMENTATION AND CONTENT ANALYSIS 92
Thus, it seems that the essential components with respect to software engineering have been captured. However, in interactive products, the hardware component (e.g. the input device) cannot be neglected. Hence, (physical) ergonomics needs to be considered additionally. The user-centered approach shown in the study presented in this chapter further revealed that the subjective quality of a product as perceived by the user further included non-instrumental attributes and very practical concerns such as related costs.
This diversity of attributes identified in this study demonstrates that from a user’s perspective numerous aspects lead to a positive or negative judgment of appeal. The data illustrates that user experience (ISO, 2010) does not simply equate to ‘usability plus aesthetics’. Although contributing greatly to this field of research, the expansion of the highly task-oriented research on usability into a field that also includes non-instrumental attributes of products as a pivotal component of human-technology interaction does not constitute the entire story (Hassenzahl & Tractinsky, 2006). Instead, a user’s attitude seems to be affected by aspects of the entire product lifecycle (e.g. purchase investment, installation, use, maintenance, defects) and, in turn, of a rich user-product lifespan. The user and the product grow on and with each other – this aspect will be further discussed in Chapter 7, introducing a conceptual model of continuous user experience.
A prominent focus in HCI has always been the interaction itself, evaluated, for example, with the means of usability tests. However, users do not stop evaluating and reflecting upon a product as they might do at the end of a test session. Instead, they usually accumulate more experiences leading to an adaptation of expectations. The extension of user experience from the use situation itself to the additional consideration of pre- and post-usage is also in line with the recently published ISO standard 9241-210 (2010).
Interestingly, the importance of attributes, indicated by frequencies, seems to be different when anticipating general reasons for using an interactive product and when retrospectively evaluating the appraisal of a specific product that has been used. On a general level, participants were primarily concerned with the usefulness of the product (do I need it at all?). If, however, one was already using a device the question of usefulness became somewhat obsolete and product-specific attributes of day-to-day handling such as functionality, ergonomics, and quality gained in importance. Likewise, a possible financial investment was crucial as a general reason regarding what would motivate or hinder technology use, but once the product was already in use (product-specific statements), initial costs seemed to be of lesser concern and only running costs were occasionally being reported.
4 STUDY 1 :: IDENTIFYING ATTRIBUTES :: SELF-DOCUMENTATION AND CONTENT ANALYSIS 93
Do attributes differ between young and older adults?
General Reasons Age, neither as a two-way interaction effect (age group x main attribute-category), nor as the three-way interaction effect (age group x valence x main attribute-category) was found to influence the model’s fit regarding general reasons of technology use. In other words, young and older adults did not seem to have different primary attributes in mind as to whether to adopt an interactive product or not.
In the analysis of the general reasons, the most prominent criterion was perceived usefulness of a device. However, ‘second runners-up’ were ease of use as well as aesthetics. This observation held true for older adults just like for their younger counterparts. Hence, elderly also paid attention to non-instrumental qualities which should be taken into account when designing for this age group: a design that goes beyond meeting users’ cognitive and physical needs. Similarities across age groups are even amplified when considering that the two groups significantly differed in technology affinity. In other words, one does not necessarily have to be overly enthusiastic about technology in order to care about non-instrumental qualities. Less interest might even sometimes lead to such a shift in expectations.
It might be that assumptions on age differences with respect to the importance of instrumental and non-instrumental attributes are more a matter of ageism than of reality (Stewart, 1992). Designers should bear in mind that there were no signs of older users relating to different attributes as their younger counterparts.
Within each attribute, preferences between age groups might differ nonetheless; for example regarding aesthetics, young and older adults are likely to prefer different styles (Schindler & Holbrook, 2003). Likewise, regarding ease of use, the two age groups might have different expectations on how a system works depending on their previous experiences (Docampo Rama, 2001). Furthermore, due to age-related changes in sensory-motor and cognitive abilities, different design implications arise for older users (Fisk, et al., 2004; Nichols, et al., 2006; Schieber, 2003) with regards to ease of use and ergonomics. Nonetheless, both considered aesthetics and ease of use as relevant attributes with respect to technology adoption. Translated to product development, both user groups might consider the same primary attributes but might still have different expectations regarding how to realize secondary and tertiary attributes in detail.
Product-Specific Statements The picture was slightly different when it came to the appraisal of concrete interactive products. These statements were based on prior experiences with the products.
Although the overall distribution of attributes was similar to the one of general reasons, it was only on the level of defined, existing products that age differences became apparent. No hypotheses were formulated before the study as the outcome of the qualitative content analysis
4 STUDY 1 :: IDENTIFYING ATTRIBUTES :: SELF-DOCUMENTATION AND CONTENT ANALYSIS 94
could not have been foreseen. However, one would, given known developmental changes (Birren & Schaie, 2001; Craik & Salthouse, 2000), expect older adults to put greater emphasis in the realm of ease of use and ergonomics due to decreasing physical and cognitive capabilities (Fisk, et al., 2004; Nichols, et al., 2006) and as a consequence of lower self-efficacy (competence) beliefs (Czaja, et al., 2006). This could be confirmed in this study. Older adults named aspects regarding ease of use significantly more often than did their younger counterparts (see Figure 4-6). In the case of ergonomics, young and older adults did not differ regarding complaints of poor ergonomics, but older adults reported good ergonomics significantly more often than young adults did (see Figure 4-5). It seems that with advancing age, ergonomics becomes an increasingly important differentiator that is also acknowledged when fulfilled in a satisfactory way. This pattern was also visible in the data of general reasons (see Figure 4-4).
Young adults on the other hand had a higher priority for aspects of quality. In particular, they criticized the lack of quality relatively more often than older adults did.
While it was predetermined to document 12 positive and 12 negative examples of interactive products, there were no constraints as to how many statements to include. Participants listed significantly more positive than negative statements. This finding held for both age groups. One older woman even wrote on the feedback sheet that it was harder to find negative examples of products than positive ones. This might come somewhat as a surprise as older adults are said to be rather critical about interactive technology. One explanation could be the so-called ‘endowment effect’ (Thaler, 1980). People become attached to the products they possess and value them more than they did before owning them. As participants were documenting examples from their personal environment, they might have tended to evaluate them more favorable. On the other hand, the finding is in line with other recent reported results that older adults show positive attitudes toward technology in general (Mitzner, et al., 2010; Otjacques, et al., 2009). This was further confirmed by the observation that older adults had rather high scores on the subscale ‘perceived positive consequences’, assessed with the questionnaire on technology affinity (Karrer, et al., 2009). Regarding this subscale, no significant age differences were found.
Are motivating and de-motivating reasons / positive and negative statements opposites within the same dimensions?
Differences were found between reasons that attract and reasons that discourage potential users and between statements relating to positive and negative attitudes toward a product. For example, a product’s usefulness seems to be more pronounced as a factor that motivates product use than the lack of it de-motivates. On the other hand, the consequences of an ill-designed product with respect to its physical ergonomics might be worse than the earnings of a well-designed version. In the present study, this negative contrast was most apparent for the ergonomic properties of a product, its associated financial costs (general), and its quality (product-specific). Such comparisons should be considered in product development processes. Specifications on minimal
4 STUDY 1 :: IDENTIFYING ATTRIBUTES :: SELF-DOCUMENTATION AND CONTENT ANALYSIS 95
tolerable target values of prominent de-motivating factors should be documented as demands in the design specification.
As indicated by the significant interaction effect valence x main attribute-category, some main attribute-categories seemed to be more crucial with respect to motivation while others were more relevant with respect to resistance of usage and/or a negative attitude toward the product. One consequence of this finding could be a rather conservative approach: designers could first try to get rid of hindering reasons, thus, to ensure that those critical attributes are fulfilled at least to the required minimum in order to prevent dissatisfaction. Then, given that no apparent dissatisfiers (or de-motivating characteristics) are obstructing the product’s use, designers could try to persuade users by including and/or improving especially motivating attributes. This approach would be in agreement with Jordan’s hierarchy of consumer needs (Jordan, 2000). First, issues of functionality and usability need to be resolved before one can succeed in designing for pleasure. Another, more risky, approach would be to outperform on the motivating attributes in order to compensate for possible de-motivating ones. In addition, some attributes are equally capable to take effect as appealing as well as hindering factors.
Recalling the three-factor theories of consumer satisfaction (Kano, et al., 1984; Oliver, 1997), those main attribute-categories with a significant higher proportion of motivating reasons as illustrated by the z-Test (see Table 4-5) for general reasons and in form of main effects of valence regarding product-specific statements (see Figure 4-6), thus usefulness_functionality, point toward being ‘attractive requirements’. The reverse could hold for higher levels of de-motivating reasons (or statements for negative examples), such as poor ergonomics or quality, and high costs. Accordingly, this could indicate a classification in terms of ‘must-be requirements’. This, however, is merely a speculation and will be investigated further with appropriate study setups in the next study.
Designing products that potential users are likely to adopt is something different than the mere attempt to avoid a dissatisfying solution. Such an argumentation is already known from ergonomics where the absence of discomfort is not necessarily the same as the presence of comfort (Hancock, et al., 2005). Results of the present study showed that good is not necessarily the opposite of bad.
4 STUDY 1 :: IDENTIFYING ATTRIBUTES :: SELF-DOCUMENTATION AND CONTENT ANALYSIS 96
4.5 METHODOLOGICAL REFLECTIONS
4.5.1 STUDY DESIGN
Is the combination of self-documentation and subsequent content analyses recommendable to identify (and weight) attributes?
‘Feed-back’ information on a pre-selected product with regard to its usefulness and usability does not necessarily imply corresponding real-life user behavior. It is ‘feed-forward’ information of users, thus, the communication of their needs, aspirations and preferences that can shed light onto the question of why certain products are used and others not used. The method presented here was intended to gather comprehensive information regarding real-life appliances in a standardized but unrestricted manner. Young and older adults were given the opportunity to express their take on things via self-documentation (Sanders, 2002). If these data were not collected in the field but in a laboratory setting using pre-selected products, it is possible that the information obtained would be biased by the perception and first impression of potentially unfamiliar products. Also, in this study, answers given were not constrained by the experimenter’s questions. The experimenter’s professional focus might have lead to neglecting relevant issues that are not part of his/her discipline (e.g. engineering, marketing, design). When given the chance, the user is the true expert with an overarching perspective as was shown in this study.
In consequence, the used approach proved to be appropriate and valuable for the identification of attributes that are relevant to users. Attributes for young and older adults were identified and compared over a wide range of interactive products that, in turn, facilitates generalization of the results. The first step of assessing attribute importance is to identify relevant attributes, which was addressed in this study. The derived attributes formed the basis for the studies described in Chapters 5 and 6. For industrial settings, the approach is also recommendable. However, a more focused selection of products seems more feasible regarding the applicability of results and efficiency of analysis (see also Section 4.5.4, p. 98). If the goal is to simply inspire, but not necessarily to inform design based on structured content analyses, the task of self-documentation can be recommended without hesitation.
With regard to weighting attributes, this study has already highlighted some methodological issues: the numerical rating of attributes (e.g. 1-5) as often done in practice (Ulrich & Eppinger, 2008) might be prone to ceiling effects (Kumar, et al., 2002). As seen in the ratings of the general reasons, differentiation between main attribute-categories was not practicable. On the other hand, when looking at the same main attribute-categories through the eyes of relative frequencies and therefore accounting for trade-offs, obvious main attribute-category and main attribute-category x valence effects became apparent. The comparison of absolute (independent) and relative ratings will also be addressed in the following studies.
4 STUDY 1 :: IDENTIFYING ATTRIBUTES :: SELF-DOCUMENTATION AND CONTENT ANALYSIS 97
The interpretation of frequencies hint to possible group differences, however, should be handled with caution. It is one result to interpret the frequency of freely elicited attributes, but yet another to look into the rating of these when explicitly presented to all participants (Jaccard, et al., 1986), hence, when trade-offs are part of the assessment itself. This was realized in the next two studies. Consequently, while the importance indicators (frequencies) in this study were affected by the attributes’ salience, amplified attention was devoted to the attributes’ importance (in terms of relevance) (Myers & Alpert, 1968, 1977; van Ittersum, et al., 2007) by explicitly presenting attributes in the following two studies.
4.5.2 EXPERIENCE & FEEDBACK
The open feedback by participants with regard to the study demonstrated two main themes (see selection of feedback in Appendix A.2.3, p. 231). On the one hand, the task was perceived as time-consuming and demanded a considerable amount of effort. One week for 24 pictures appears to be the minimum time necessary as some indicated that they would have appreciated more time. Then again, it might be more appropriate to reduce the number of required photographs than extending the task duration. However, the context should be more constrained (e.g. only office equipment) when including different user groups, because otherwise different products might be documented by different user groups, making a comparison difficult.
A second frequent comment was that participants enjoyed the study as it was engaging, thought-provoking, and perceived as a useful study. Most likely, the transparency of the study and the perception of its usefulness was a greater motivator than the compensation itself. Engdahl, Leclerc, and Loring (2009) report from their experience that older adults are highly committed to research studies and that often the value of participation for them was to feel needed and to help others with their contribution to research.
Participatory research methods necessitate, as the name already indicates, active participation. A prerequisite for the engagement is trust and motivation. Going to each participant’s home for the instruction session, in particular to visit the older participants in their familiar environment was worthwhile as it helped to establish trust (Engdahl, et al., 2009). Also, participants lost initial concerns that they were ‘not suitable’ for the study, as some thought that they did not have enough technology to document. However, pointing out a number of examples during the practice trial increased confidence. Some participants were pleasantly surprised to realize in the course of the study how much technology they actually did use in everyday life and that they underestimated their degree of technology usage before.
4 STUDY 1 :: IDENTIFYING ATTRIBUTES :: SELF-DOCUMENTATION AND CONTENT ANALYSIS 98
4.5.3 LIMITATIONS
A documentation of existing products is consequently also limited to existing products. For the aim of the present study, this was absolutely feasible. However, applicability for new product development (von Hippel, 2005) is limited.
Given the few statements on emotional involvement in this study, two inferences are plausible: emotional involvement is of no great concern to the users, or the method of free elicitation and self-documentation might not be apt to assess this type of reasons. People have a tendency of ‘lay rationalism’ (Diefenbach & Hassenzahl, 2009; Hassenzahl & Roto, 2007). Lay rationalism means that people downplay hedonistic factors and rationalize their choices; in particular as a case of ‘lay scientism’ they highlight ‘hard/objective’ over ‘soft/subjective’ attributes (Hsee & Hastie, 2006; Hsee, Zhang, Yu, & Xi, 2003). Participants might have thought that it would be more appropriate to stay with the ‘hard facts’. Also, as emotional involvement (e.g. enjoyment, entertainment, pleasure, anger) generally unfolds during interaction, participants might have focused more on attributes of the product, than on attributes of the product use. The reasons stated might in fact be more the arguments why they respond in emotionally one way or the other.
Also, the task required participants to critically reflect on reasons for positive and negative attitudes toward technology. This can be quite demanding and required furthermore the capability and also the willingness to express these reasons. Results therefore strongly depend on the participants’ ability and compliance to share their thoughts. In the present study, participants of both age groups were highly educated, which was supportive with respect to articulateness. On the other hand, this sample bias needs to be considered when generalizing the study’s results. Users with other social or academic backgrounds might have other preferences, interests, and concerns.
4.5.4 PRACTICAL IMPLICATIONS
As participants were by themselves during the week, it was mandatory to train the use of the camera and of the booklet as well as to provide additional written instructions in order to ensure correct task fulfillment.
Documenting the selected products by a photograph in addition to the verbal statements had a number of advantages: it ensured that participants really encountered the products in their surrounding; facing the product, instead of just remembering it, was meant to help the participants relive the experience and reflect on the appraisal; it helped the coder understand what kind of product it was in case the product type description itself was not sufficient, and sometimes increased comprehension of the reasons; it helped to understand the context of use. All in all, it was intended to increase validity and reliability of the provided statements by the participant as well as of the subsequent coding by the experimenter and was therefore preferred over the less time-intense alternative of listing products simply based on memories.
4 STUDY 1 :: IDENTIFYING ATTRIBUTES :: SELF-DOCUMENTATION AND CONTENT ANALYSIS 99
Fortunately for the interpretation of the results, the products upon which the statements were given did not differ between the two age groups. One contributing factor might have been that 24 examples needed to be documented. In order to reach this amount, young adults also included household appliances and older adults also considered office devices. Possibly, products would have been different between age groups if, for example, only three products were to be selected.
A balance between reliable and comparable data on the one hand, and the amount of effort, for participants and researchers alike, needs to be carefully considered. For targeted studies of a specific user group or of one specific product (type), the workload would decrease substantially. Also, directed qualitative content analyses (Hsieh & Shannon, 2005) with pre-defined codes would facilitate the procedure. However, this would transform the exploratory nature to a confirmatory format. In sum, for exploration purposes in a research context the chosen approach proved to be valuable. In industrial settings, a more focused approach might be more suitable if the goal is to receive applicable information for the respective company. On the other hand, if the primary goal is to obtain general inspiration, a more open and flexible interpretation of the material would be more appropriate.
Instructing participants to give reasons in form of keywords and to classify those themselves by valence simplified data preparation as no reduction of text corpus was necessary. This is an example of making field data collection more efficient. Moreover, this also led to an enhanced objectivity of the researcher and higher reliability of the results. The high scores of inter-coder reliability were likely to be due to the straightforward wording (keywords) and the detailed coding scheme. This study showed that with standardized and precise task instructions, a statistically comparable assessment in the field is possible.
5 STUDY 2 :: WEIGHTING ATTRIBUTES :: KANO AND CONJOINT ANALYSIS
5.1 BACKGROUND
The perception of attributes weighted by their respective attribute importance is said to affect the user’s attitude toward the product and consequently the likelihood of adoption (see also Sections 2.1.3, 2.2, and 2.3). It is therefore suggested to prioritize decisions, allocate resources, and evaluate alternatives in the product development process depending on attribute importance from a user’s perspective (Clausing, 1994; Griffin & Hauser, 1993; Hauser & Clausing, 1988; MAP, 2000; Schmidt, 1996; Ulrich & Eppinger, 2008). The aim of this study was to determine attribute importance for an interactive product, i.e. a digital camera, by young and older users.∗
As products combine multiple attributes and are therefore evaluated upon those as a whole in real life, attributes should also be rated in relation to one another instead of independently when anticipating their importance in early product development. For this reason, relevant attributes should be presented jointly – hence, describing a product in ‘full profile’ – for evaluation purposes, which would allow the consideration of trade-offs already during assessment. The simple, presumably straightforward approach of asking users to assign a value of importance to each attribute separately might be misleading. In the present study, this so-called self-stated importance rating (Berger, et al., 1993) was compared to the information gained from an established multi-attribute preference method of consumer research, conjoint analysis (Green, et al., 2001; Sattler, 2006) (see also Section 2.5.3, p. 54).
In conjoint analysis, an overall preference rating of participants is de-composed into a combination of weighted attributes. As in real life, all attributes are considered jointly.
Building on the evident valence effects found in the previous study, a second tool for assessing user priorities in product development was included: the Kano Method (Berger, et al., 1993; Mikulić, 2007). ∗ This chapter is partially based on Pohlmeyer, A. E., Machens, F., & Blessing, L. (2010). Attractive or Not - What's the Difference? Inter- and Intra- Group Comparisons in the Kano Model. In D. Marjanovic, M. Storga, N. Pavkovic & N. Bojcetic (Eds.), 11th International Design Conference - DESIGN 2010 (pp. 413-422). Zagreb, Croatia: University of Zagreb. Pohlmeyer, A. E., & Blessing, L. (2011). A Conjoint Analysis of Attributes Affecting the Likelihood of Technology Use. In A. Marcus (Ed.), Design, User Experience, and Usability, Pt II, HCII 2011, LNCS 6770 (pp. 303–312). Berlin, Germany: Springer-Verlag. [the original publication is available at www.springerlink.com]
5 STUDY 2 :: WEIGHTING ATTRIBUTES :: KANO AND CONJOINT ANALYSIS 101
A selection of the previously identified product-specific attributes (main attribute-categories) in study 1 was further investigated in this study: functionality, ease of use, ergonomics, quality, aesthetics, and emotional involvement – for a detailed description of attribute selection see p. 107f. This time, attributes were explicitly presented to all participants and the same six attributes were included in the independent ratings, in the conjoint analysis, as well as in the Kano method. Again, an age comparison was included. Specifically, differences with respect to ease of use, ergonomics, and quality were expected.
Conjoint Analysis
Conjoint analysis is a widely used tool in commercial marketing research and the dominating technique to assess consumer trade-offs (Green, et al., 2001; Green & Srinivasan, 1978, 1990; Wittink, 1989; Wittink, Vriens, & Burhenne, 1994).
The method used here was a full-profile rating in particular. A full-profile is a description of a product alternative including all attributes of investigation. Based on this information, participants rate several product alternatives (‘models’). This traditional conjoint analysis was chosen because it best mimics real life decisions. Alternatives, such as a ‘two-factor-at-a-time procedure’ where only two attributes of a set of attributes are presented per ranking, are simple to administer, but would result in “some sacrifice in realism” (Green & Srinivasan, 1978, p. 108). The full profile procedure, also referred to as ‘concept evaluation task’ (Green & Srinivasan, 1978), is favored as long as it is able to handle the potential information overload by limiting the attributes, levels, and profiles presented (Green, et al., 2001; Green & Srinivasan, 1978, 1990; Wittink, 1989). Popular choice-based procedures (Huber, 1997) are valuable in benchmarking studies. However, the interest in technology adoption leads to the focus being directed less on choice situations, but rather on expectations in general. Therefore, a full-profile rating, studying appraisal and not choice (Huber, 1997), was considered the best option for this study.
From the overall judgments, part-worth utilities are derived through regressional modeling. Thus, instead of computing a composite score of single attribute ratings, the path is a de-compositional calculation of attribute weights (part-worth utilities are the regression coefficients). Attention was focused on the relevance of attributes, rather than on differences between product models themselves (Huber, 1997). However, with the knowledge of part-worth utilities it is also possible to calculate the estimated utility of a new combination of attribute levels that was not part of the stimuli material tested. Part-worth utilities indicate how much each level of an attribute contributes to the prediction of the tested preference criterion (here: likelihood of use).
In conjoint analyses, ‘relative importance’ is a specific measure referring to the impact that a variation of attribute levels has on the preference score (Backhaus, et al., 2008). These are derived by dividing the range of the part-worth utilities for each attribute (highest to lowest) by the sum of all attribute utility ranges. This measure of variation effect can be relevant in product development as it
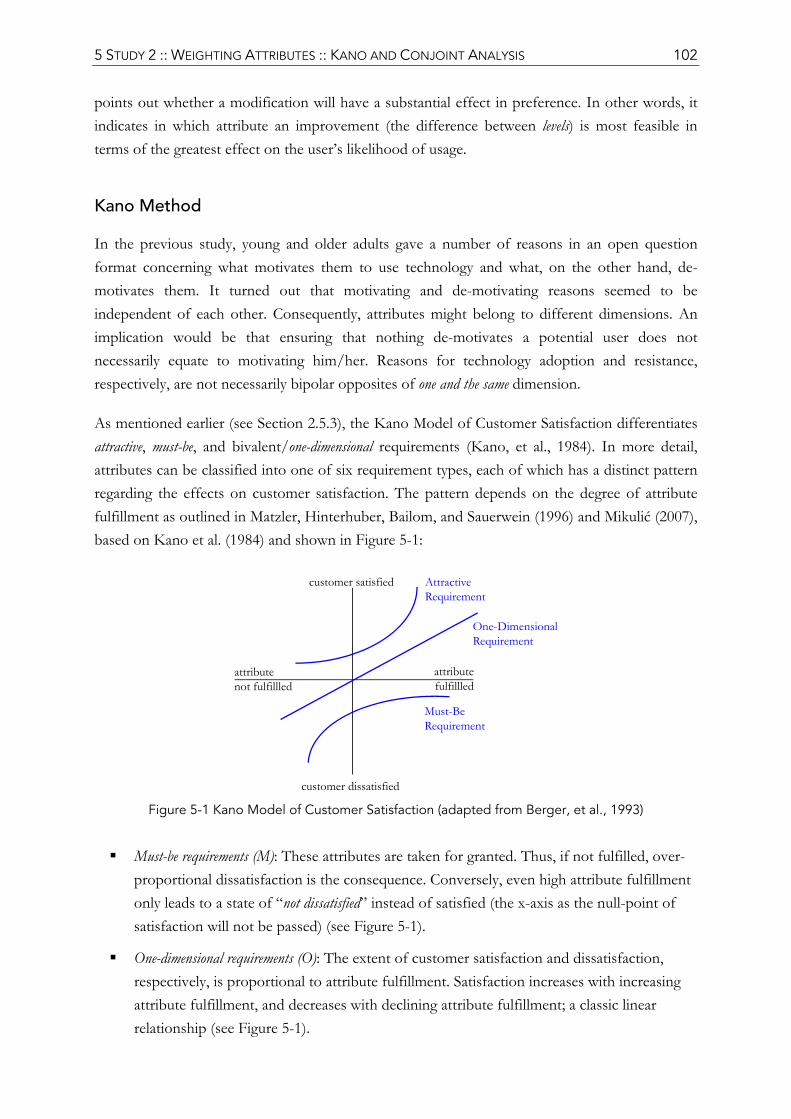
5 STUDY 2 :: WEIGHTING ATTRIBUTES :: KANO AND CONJOINT ANALYSIS 102
points out whether a modification will have a substantial effect in preference. In other words, it indicates in which attribute an improvement (the difference between levels) is most feasible in terms of the greatest effect on the user’s likelihood of usage.
Kano Method
In the previous study, young and older adults gave a number of reasons in an open question format concerning what motivates them to use technology and what, on the other hand, de-motivates them. It turned out that motivating and de-motivating reasons seemed to be independent of each other. Consequently, attributes might belong to different dimensions. An implication would be that ensuring that nothing de-motivates a potential user does not necessarily equate to motivating him/her. Reasons for technology adoption and resistance, respectively, are not necessarily bipolar opposites of one and the same dimension.
As mentioned earlier (see Section 2.5.3), the Kano Model of Customer Satisfaction differentiates attractive, must-be, and bivalent/one-dimensional requirements (Kano, et al., 1984). In more detail, attributes can be classified into one of six requirement types, each of which has a distinct pattern regarding the effects on customer satisfaction. The pattern depends on the degree of attribute fulfillment as outlined in Matzler, Hinterhuber, Bailom, and Sauerwein (1996) and Mikulić (2007), based on Kano et al. (1984) and shown in Figure 5-1:
Figure 5-1 Kano Model of Customer Satisfaction (adapted from Berger, et al., 1993)
Must-be requirements (M): These attributes are taken for granted. Thus, if not fulfilled, over-proportional dissatisfaction is the consequence. Conversely, even high attribute fulfillment only leads to a state of “not dissatisfied” instead of satisfied (the x-axis as the null-point of satisfaction will not be passed) (see Figure 5-1).
One-dimensional requirements (O): The extent of customer satisfaction and dissatisfaction, respectively, is proportional to attribute fulfillment. Satisfaction increases with increasing attribute fulfillment, and decreases with declining attribute fulfillment; a classic linear relationship (see Figure 5-1).
customer satisfied
attributenot fulfillled
attributefulfillled
customer dissatisfied
AttractiveRequirement
Must-BeRequirement
One-DimensionalRequirement
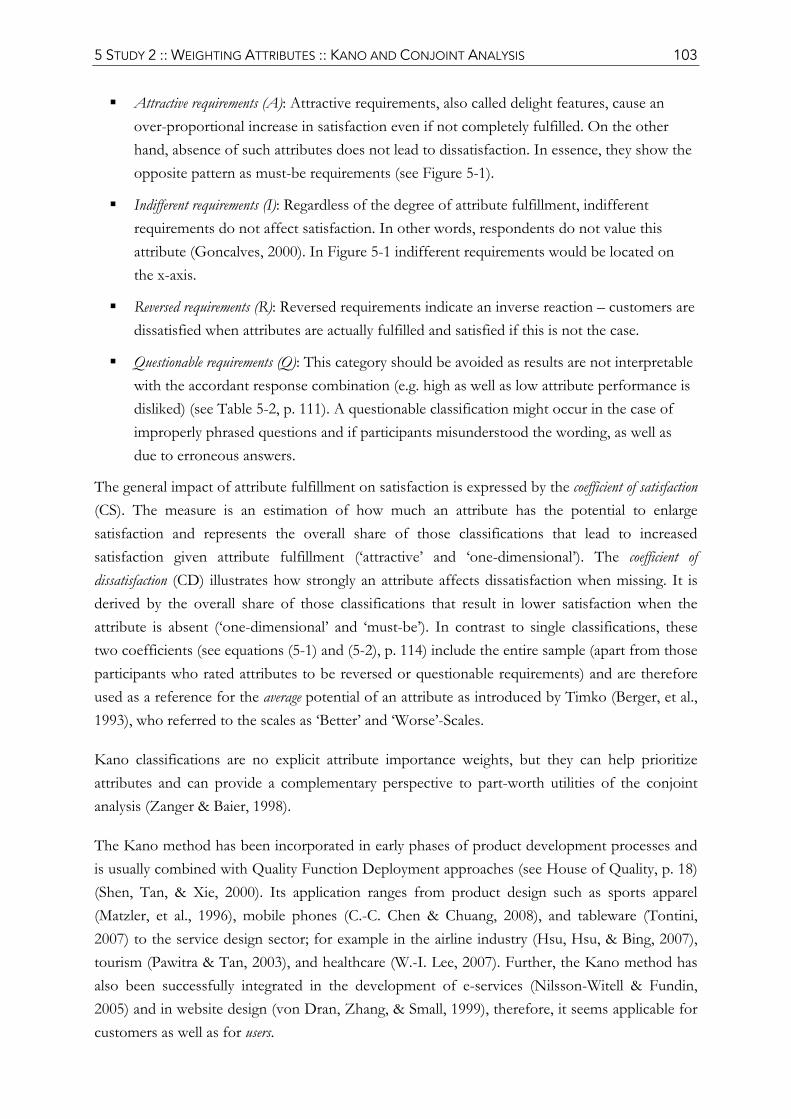
5 STUDY 2 :: WEIGHTING ATTRIBUTES :: KANO AND CONJOINT ANALYSIS 103
Attractive requirements (A): Attractive requirements, also called delight features, cause an over-proportional increase in satisfaction even if not completely fulfilled. On the other hand, absence of such attributes does not lead to dissatisfaction. In essence, they show the opposite pattern as must-be requirements (see Figure 5-1).
Indifferent requirements (I): Regardless of the degree of attribute fulfillment, indifferent requirements do not affect satisfaction. In other words, respondents do not value this attribute (Goncalves, 2000). In Figure 5-1 indifferent requirements would be located on the x-axis.
Reversed requirements (R): Reversed requirements indicate an inverse reaction – customers are dissatisfied when attributes are actually fulfilled and satisfied if this is not the case.
Questionable requirements (Q): This category should be avoided as results are not interpretable with the accordant response combination (e.g. high as well as low attribute performance is disliked) (see Table 5-2, p. 111). A questionable classification might occur in the case of improperly phrased questions and if participants misunderstood the wording, as well as due to erroneous answers.
The general impact of attribute fulfillment on satisfaction is expressed by the coefficient of satisfaction (CS). The measure is an estimation of how much an attribute has the potential to enlarge satisfaction and represents the overall share of those classifications that lead to increased satisfaction given attribute fulfillment (‘attractive’ and ‘one-dimensional’). The coefficient of dissatisfaction (CD) illustrates how strongly an attribute affects dissatisfaction when missing. It is derived by the overall share of those classifications that result in lower satisfaction when the attribute is absent (‘one-dimensional’ and ‘must-be’). In contrast to single classifications, these two coefficients (see equations (5-1) and (5-2), p. 114) include the entire sample (apart from those participants who rated attributes to be reversed or questionable requirements) and are therefore used as a reference for the average potential of an attribute as introduced by Timko (Berger, et al., 1993), who referred to the scales as ‘Better’ and ‘Worse’-Scales.
Kano classifications are no explicit attribute importance weights, but they can help prioritize attributes and can provide a complementary perspective to part-worth utilities of the conjoint analysis (Zanger & Baier, 1998).
The Kano method has been incorporated in early phases of product development processes and is usually combined with Quality Function Deployment approaches (see House of Quality, p. 18) (Shen, Tan, & Xie, 2000). Its application ranges from product design such as sports apparel (Matzler, et al., 1996), mobile phones (C.-C. Chen & Chuang, 2008), and tableware (Tontini, 2007) to the service design sector; for example in the airline industry (Hsu, Hsu, & Bing, 2007), tourism (Pawitra & Tan, 2003), and healthcare (W.-I. Lee, 2007). Further, the Kano method has also been successfully integrated in the development of e-services (Nilsson-Witell & Fundin, 2005) and in website design (von Dran, Zhang, & Small, 1999), therefore, it seems applicable for customers as well as for users.
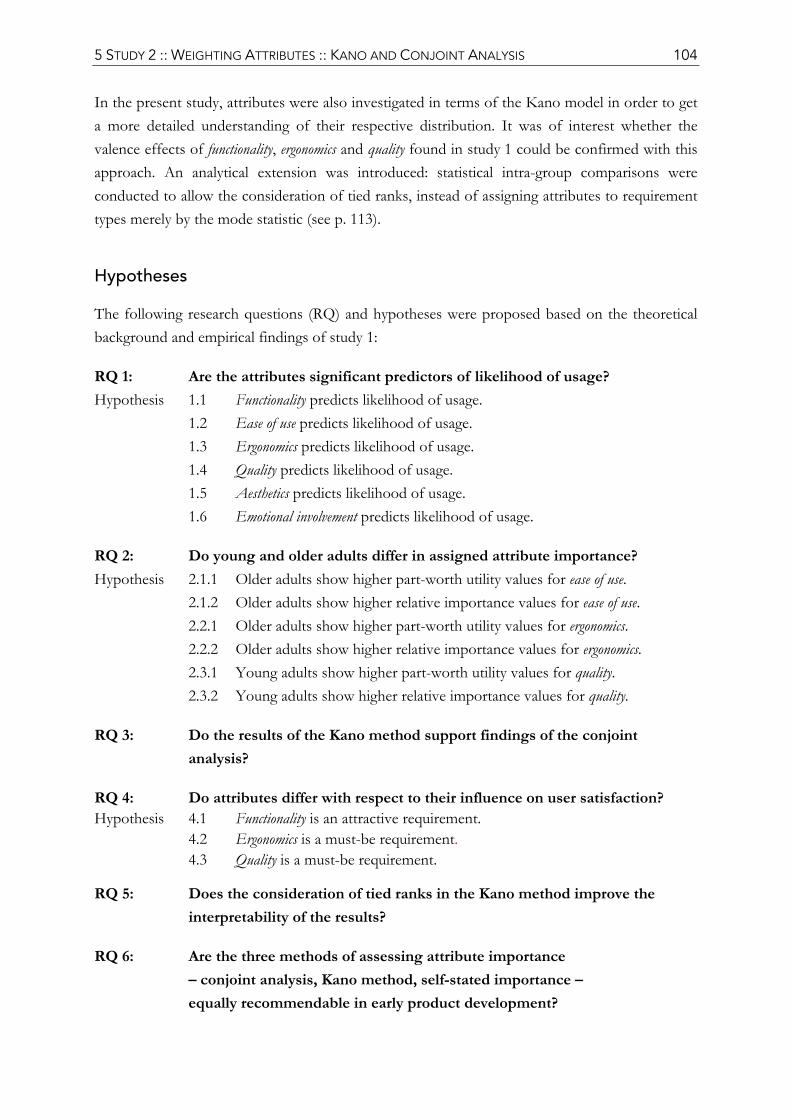
5 STUDY 2 :: WEIGHTING ATTRIBUTES :: KANO AND CONJOINT ANALYSIS 104
In the present study, attributes were also investigated in terms of the Kano model in order to get a more detailed understanding of their respective distribution. It was of interest whether the valence effects of functionality, ergonomics and quality found in study 1 could be confirmed with this approach. An analytical extension was introduced: statistical intra-group comparisons were conducted to allow the consideration of tied ranks, instead of assigning attributes to requirement types merely by the mode statistic (see p. 113).
Hypotheses
The following research questions (RQ) and hypotheses were proposed based on the theoretical background and empirical findings of study 1:
RQ 1: Are the attributes significant predictors of likelihood of usage? Hypothesis 1.1 Functionality predicts likelihood of usage. 1.2 Ease of use predicts likelihood of usage. 1.3 Ergonomics predicts likelihood of usage. 1.4 Quality predicts likelihood of usage. 1.5 Aesthetics predicts likelihood of usage. 1.6 Emotional involvement predicts likelihood of usage.
RQ 2: Do young and older adults differ in assigned attribute importance? Hypothesis 2.1.1 Older adults show higher part-worth utility values for ease of use. 2.1.2 Older adults show higher relative importance values for ease of use. 2.2.1 Older adults show higher part-worth utility values for ergonomics. 2.2.2 Older adults show higher relative importance values for ergonomics. 2.3.1 Young adults show higher part-worth utility values for quality. 2.3.2 Young adults show higher relative importance values for quality.
RQ 3: Do the results of the Kano method support findings of the conjoint analysis?
RQ 4: Do attributes differ with respect to their influence on user satisfaction? Hypothesis 4.1 Functionality is an attractive requirement. 4.2 Ergonomics is a must-be requirement. 4.3 Quality is a must-be requirement.
RQ 5: Does the consideration of tied ranks in the Kano method improve the interpretability of the results?
RQ 6: Are the three methods of assessing attribute importance – conjoint analysis, Kano method, self-stated importance – equally recommendable in early product development?
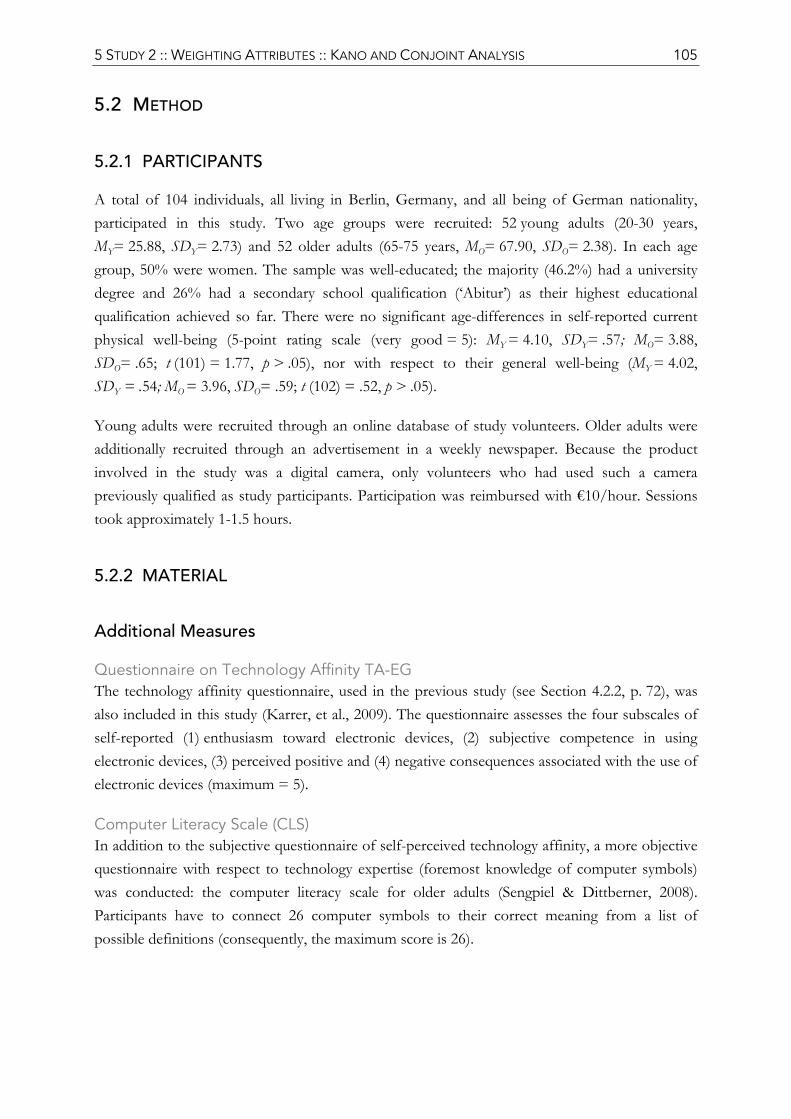
5 STUDY 2 :: WEIGHTING ATTRIBUTES :: KANO AND CONJOINT ANALYSIS 105
5.2 METHOD
5.2.1 PARTICIPANTS
A total of 104 individuals, all living in Berlin, Germany, and all being of German nationality, participated in this study. Two age groups were recruited: 52 young adults (20-30 years, MY= 25.88, SDY= 2.73) and 52 older adults (65-75 years, MO= 67.90, SDO= 2.38). In each age group, 50% were women. The sample was well-educated; the majority (46.2%) had a university degree and 26% had a secondary school qualification (‘Abitur’) as their highest educational qualification achieved so far. There were no significant age-differences in self-reported current physical well-being (5-point rating scale (very good = 5): MY = 4.10, SDY= .57; MO= 3.88, SDO= .65; t (101) = 1.77, p > .05), nor with respect to their general well-being (MY = 4.02, SDY = .54; MO = 3.96, SDO= .59; t (102) = .52, p > .05).
Young adults were recruited through an online database of study volunteers. Older adults were additionally recruited through an advertisement in a weekly newspaper. Because the product involved in the study was a digital camera, only volunteers who had used such a camera previously qualified as study participants. Participation was reimbursed with €10/hour. Sessions took approximately 1-1.5 hours.
5.2.2 MATERIAL
Additional Measures
Questionnaire on Technology Affinity TA-EG The technology affinity questionnaire, used in the previous study (see Section 4.2.2, p. 72), was also included in this study (Karrer, et al., 2009). The questionnaire assesses the four subscales of self-reported (1) enthusiasm toward electronic devices, (2) subjective competence in using electronic devices, (3) perceived positive and (4) negative consequences associated with the use of electronic devices (maximum = 5).
Computer Literacy Scale (CLS) In addition to the subjective questionnaire of self-perceived technology affinity, a more objective questionnaire with respect to technology expertise (foremost knowledge of computer symbols) was conducted: the computer literacy scale for older adults (Sengpiel & Dittberner, 2008). Participants have to connect 26 computer symbols to their correct meaning from a list of possible definitions (consequently, the maximum score is 26).
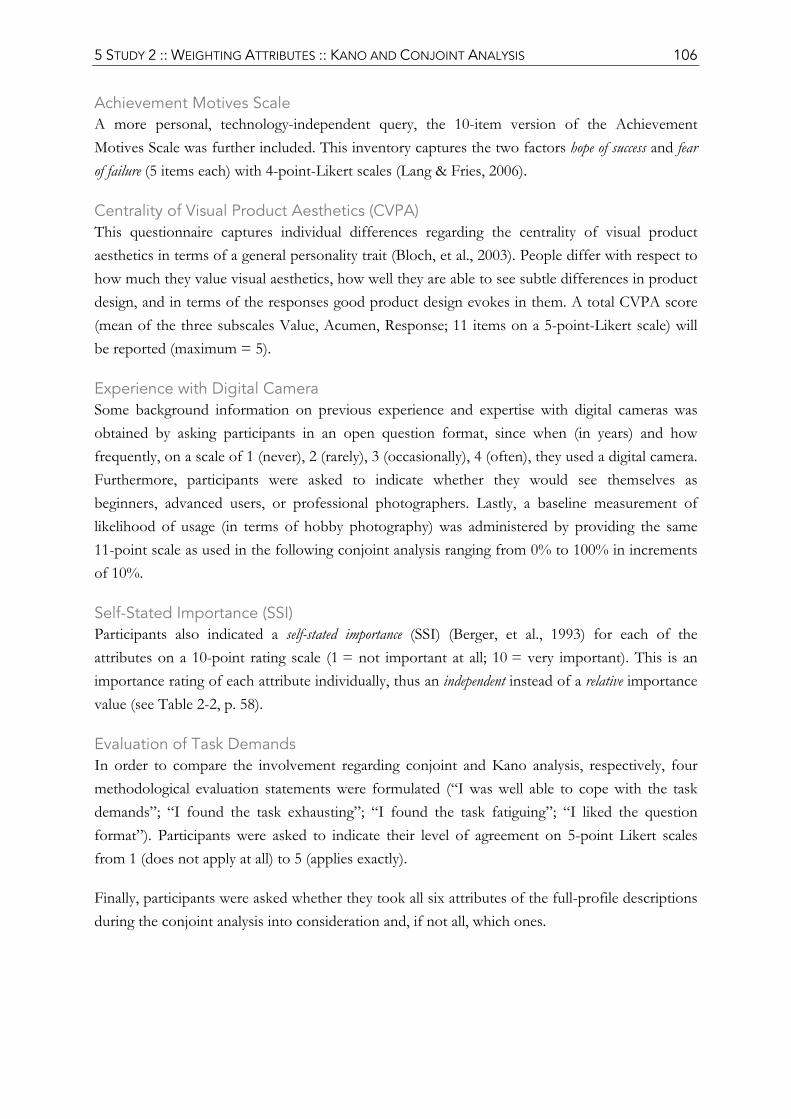
5 STUDY 2 :: WEIGHTING ATTRIBUTES :: KANO AND CONJOINT ANALYSIS 106
Achievement Motives Scale A more personal, technology-independent query, the 10-item version of the Achievement Motives Scale was further included. This inventory captures the two factors hope of success and fear of failure (5 items each) with 4-point-Likert scales (Lang & Fries, 2006).
Centrality of Visual Product Aesthetics (CVPA) This questionnaire captures individual differences regarding the centrality of visual product aesthetics in terms of a general personality trait (Bloch, et al., 2003). People differ with respect to how much they value visual aesthetics, how well they are able to see subtle differences in product design, and in terms of the responses good product design evokes in them. A total CVPA score (mean of the three subscales Value, Acumen, Response; 11 items on a 5-point-Likert scale) will be reported (maximum = 5).
Experience with Digital Camera Some background information on previous experience and expertise with digital cameras was obtained by asking participants in an open question format, since when (in years) and how frequently, on a scale of 1 (never), 2 (rarely), 3 (occasionally), 4 (often), they used a digital camera. Furthermore, participants were asked to indicate whether they would see themselves as beginners, advanced users, or professional photographers. Lastly, a baseline measurement of likelihood of usage (in terms of hobby photography) was administered by providing the same 11-point scale as used in the following conjoint analysis ranging from 0% to 100% in increments of 10%.
Self-Stated Importance (SSI) Participants also indicated a self-stated importance (SSI) (Berger, et al., 1993) for each of the attributes on a 10-point rating scale (1 = not important at all; 10 = very important). This is an importance rating of each attribute individually, thus an independent instead of a relative importance value (see Table 2-2, p. 58).
Evaluation of Task Demands In order to compare the involvement regarding conjoint and Kano analysis, respectively, four methodological evaluation statements were formulated (“I was well able to cope with the task demands”; “I found the task exhausting”; “I found the task fatiguing”; “I liked the question format”). Participants were asked to indicate their level of agreement on 5-point Likert scales from 1 (does not apply at all) to 5 (applies exactly).
Finally, participants were asked whether they took all six attributes of the full-profile descriptions during the conjoint analysis into consideration and, if not all, which ones.
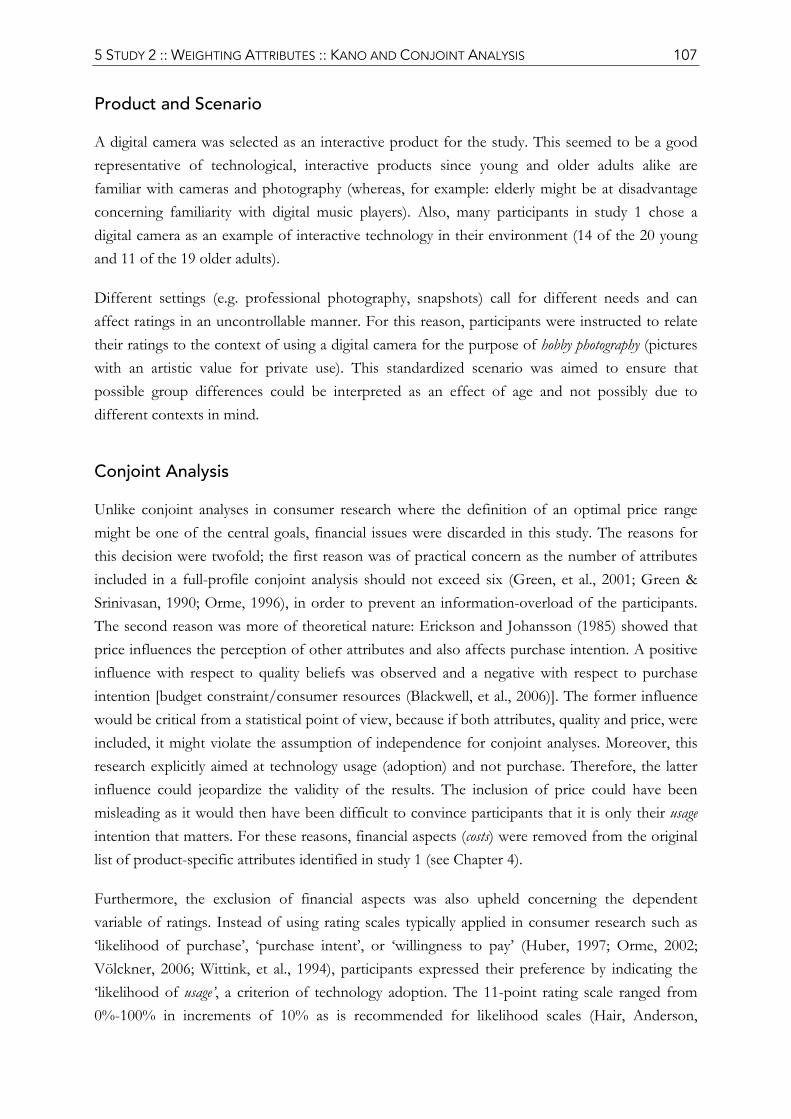
5 STUDY 2 :: WEIGHTING ATTRIBUTES :: KANO AND CONJOINT ANALYSIS 107
Product and Scenario
A digital camera was selected as an interactive product for the study. This seemed to be a good representative of technological, interactive products since young and older adults alike are familiar with cameras and photography (whereas, for example: elderly might be at disadvantage concerning familiarity with digital music players). Also, many participants in study 1 chose a digital camera as an example of interactive technology in their environment (14 of the 20 young and 11 of the 19 older adults).
Different settings (e.g. professional photography, snapshots) call for different needs and can affect ratings in an uncontrollable manner. For this reason, participants were instructed to relate their ratings to the context of using a digital camera for the purpose of hobby photography (pictures with an artistic value for private use). This standardized scenario was aimed to ensure that possible group differences could be interpreted as an effect of age and not possibly due to different contexts in mind.
Conjoint Analysis
Unlike conjoint analyses in consumer research where the definition of an optimal price range might be one of the central goals, financial issues were discarded in this study. The reasons for this decision were twofold; the first reason was of practical concern as the number of attributes included in a full-profile conjoint analysis should not exceed six (Green, et al., 2001; Green & Srinivasan, 1990; Orme, 1996), in order to prevent an information-overload of the participants. The second reason was more of theoretical nature: Erickson and Johansson (1985) showed that price influences the perception of other attributes and also affects purchase intention. A positive influence with respect to quality beliefs was observed and a negative with respect to purchase intention [budget constraint/consumer resources (Blackwell, et al., 2006)]. The former influence would be critical from a statistical point of view, because if both attributes, quality and price, were included, it might violate the assumption of independence for conjoint analyses. Moreover, this research explicitly aimed at technology usage (adoption) and not purchase. Therefore, the latter influence could jeopardize the validity of the results. The inclusion of price could have been misleading as it would then have been difficult to convince participants that it is only their usage intention that matters. For these reasons, financial aspects (costs) were removed from the original list of product-specific attributes identified in study 1 (see Chapter 4).
Furthermore, the exclusion of financial aspects was also upheld concerning the dependent variable of ratings. Instead of using rating scales typically applied in consumer research such as ‘likelihood of purchase’, ‘purchase intent’, or ‘willingness to pay’ (Huber, 1997; Orme, 2002; Völckner, 2006; Wittink, et al., 1994), participants expressed their preference by indicating the ‘likelihood of usage’, a criterion of technology adoption. The 11-point rating scale ranged from 0%-100% in increments of 10% as is recommended for likelihood scales (Hair, Anderson,
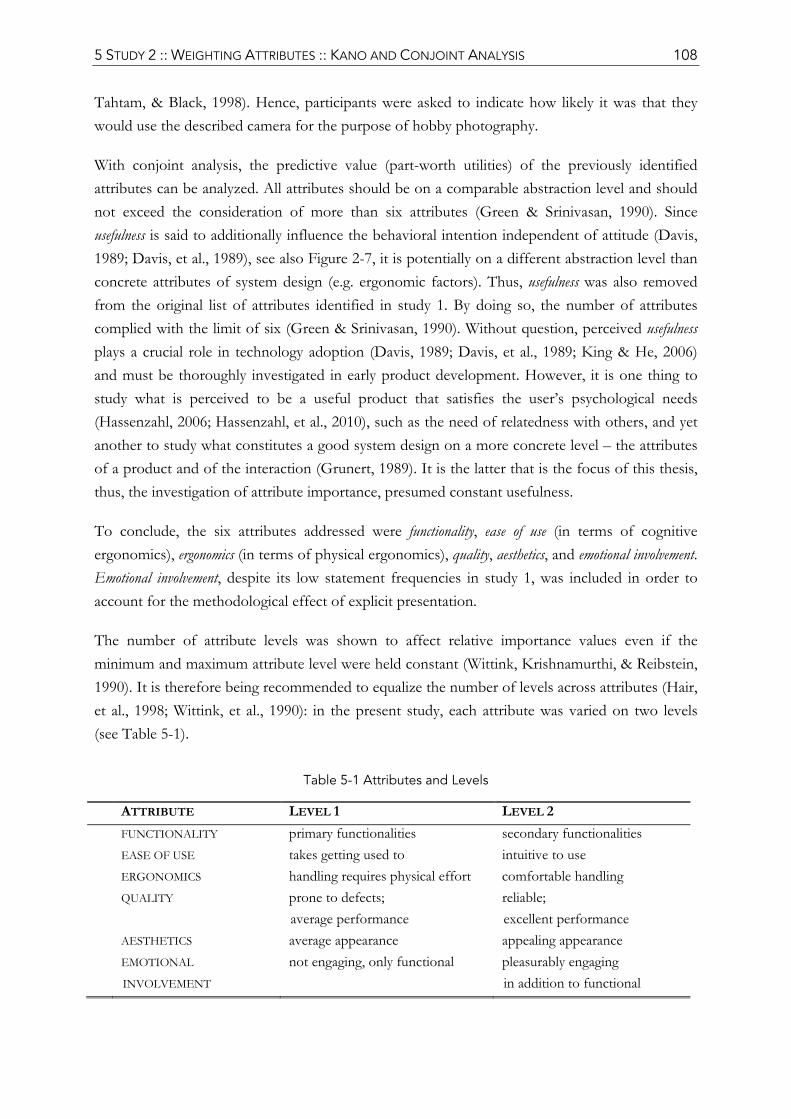
5 STUDY 2 :: WEIGHTING ATTRIBUTES :: KANO AND CONJOINT ANALYSIS 108
Tahtam, & Black, 1998). Hence, participants were asked to indicate how likely it was that they would use the described camera for the purpose of hobby photography.
With conjoint analysis, the predictive value (part-worth utilities) of the previously identified attributes can be analyzed. All attributes should be on a comparable abstraction level and should not exceed the consideration of more than six attributes (Green & Srinivasan, 1990). Since usefulness is said to additionally influence the behavioral intention independent of attitude (Davis, 1989; Davis, et al., 1989), see also Figure 2-7, it is potentially on a different abstraction level than concrete attributes of system design (e.g. ergonomic factors). Thus, usefulness was also removed from the original list of attributes identified in study 1. By doing so, the number of attributes complied with the limit of six (Green & Srinivasan, 1990). Without question, perceived usefulness plays a crucial role in technology adoption (Davis, 1989; Davis, et al., 1989; King & He, 2006) and must be thoroughly investigated in early product development. However, it is one thing to study what is perceived to be a useful product that satisfies the user’s psychological needs (Hassenzahl, 2006; Hassenzahl, et al., 2010), such as the need of relatedness with others, and yet another to study what constitutes a good system design on a more concrete level – the attributes of a product and of the interaction (Grunert, 1989). It is the latter that is the focus of this thesis, thus, the investigation of attribute importance, presumed constant usefulness.
To conclude, the six attributes addressed were functionality, ease of use (in terms of cognitive ergonomics), ergonomics (in terms of physical ergonomics), quality, aesthetics, and emotional involvement. Emotional involvement, despite its low statement frequencies in study 1, was included in order to account for the methodological effect of explicit presentation.
The number of attribute levels was shown to affect relative importance values even if the minimum and maximum attribute level were held constant (Wittink, Krishnamurthi, & Reibstein, 1990). It is therefore being recommended to equalize the number of levels across attributes (Hair, et al., 1998; Wittink, et al., 1990): in the present study, each attribute was varied on two levels (see Table 5-1).
Table 5-1 Attributes and Levels
ATTRIBUTE LEVEL 1 LEVEL 2 FUNCTIONALITY primary functionalities secondary functionalities EASE OF USE takes getting used to intuitive to use ERGONOMICS handling requires physical effort comfortable handling QUALITY prone to defects;
average performance reliable; excellent performance
AESTHETICS average appearance appealing appearance EMOTIONAL
INVOLVEMENT not engaging, only functional pleasurably engaging
in addition to functional
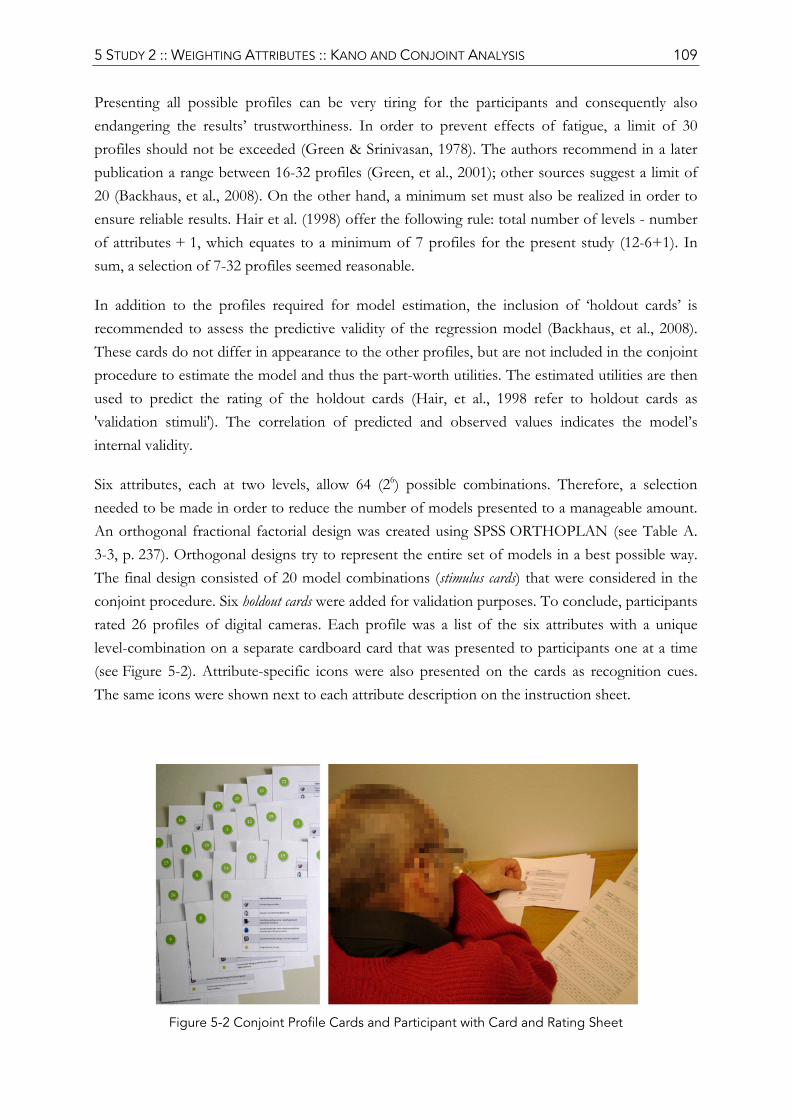
5 STUDY 2 :: WEIGHTING ATTRIBUTES :: KANO AND CONJOINT ANALYSIS 109
Presenting all possible profiles can be very tiring for the participants and consequently also endangering the results’ trustworthiness. In order to prevent effects of fatigue, a limit of 30 profiles should not be exceeded (Green & Srinivasan, 1978). The authors recommend in a later publication a range between 16-32 profiles (Green, et al., 2001); other sources suggest a limit of 20 (Backhaus, et al., 2008). On the other hand, a minimum set must also be realized in order to ensure reliable results. Hair et al. (1998) offer the following rule: total number of levels - number of attributes + 1, which equates to a minimum of 7 profiles for the present study (12-6+1). In sum, a selection of 7-32 profiles seemed reasonable.
In addition to the profiles required for model estimation, the inclusion of ‘holdout cards’ is recommended to assess the predictive validity of the regression model (Backhaus, et al., 2008). These cards do not differ in appearance to the other profiles, but are not included in the conjoint procedure to estimate the model and thus the part-worth utilities. The estimated utilities are then used to predict the rating of the holdout cards (Hair, et al., 1998 refer to holdout cards as 'validation stimuli'). The correlation of predicted and observed values indicates the model’s internal validity.
Six attributes, each at two levels, allow 64 (26) possible combinations. Therefore, a selection needed to be made in order to reduce the number of models presented to a manageable amount. An orthogonal fractional factorial design was created using SPSS ORTHOPLAN (see Table A. 3-3, p. 237). Orthogonal designs try to represent the entire set of models in a best possible way. The final design consisted of 20 model combinations (stimulus cards) that were considered in the conjoint procedure. Six holdout cards were added for validation purposes. To conclude, participants rated 26 profiles of digital cameras. Each profile was a list of the six attributes with a unique level-combination on a separate cardboard card that was presented to participants one at a time (see Figure 5-2). Attribute-specific icons were also presented on the cards as recognition cues. The same icons were shown next to each attribute description on the instruction sheet.
Figure 5-2 Conjoint Profile Cards and Participant with Card and Rating Sheet

5 STUDY 2 :: WEIGHTING ATTRIBUTES :: KANO AND CONJOINT ANALYSIS 110
The attempt was made to define the levels in a way that, firstly, made ranges between level 1 and level 2 comparable across factors, and, secondly, excluded knock-out criteria. There was no definite ‘good’ or ‘bad’ product description: each description was good with respect to some, but inferior with respect to other attributes. Participants received thorough instructions and examples regarding attribute levels and had written descriptions available at all times.
Full profile conjoint analysis can be administered by bringing the different models in a rank order or by rating each one individually. The latter approach was followed in this study because, firstly, ratings permit a metric conjoint procedure instead of a monotone regression of the rankings which concurs with a loss of information, and, secondly, because 26 models would not be feasible to rank, but are desirable in connection with reliability issues.
Kano Method
In order to assign attributes to requirement types (see Figure 5-1), pairs of questions are presented for each attribute (Berger, et al., 1993). Responses to attribute fulfillment are collected by so-called functional questions, while dysfunctional questions capture the user’s opinion if an attribute is not fulfilled. The respondent selects one of five answer-options: (1) I like it; (2) I expect it; (3) I am neutral; (4) I can live with it; (5) I dislike it (Berger, et al., 1993). These are not considered to represent a continuous rating scale (see Bolster in Berger, et al., 1993). They are rather seen as independent options, from which the most appropriate is to choose. Corresponding to the answers provided for the functional and dysfunctional question, attributes are assigned to the Kano requirement types with the help of the matrix shown in Table 5-2. The easiest Kano evaluation classifies each attribute in compliance with the requirement type of the maximum frequency of responses, i.e. the mode statistic (Berger, et al., 1993).
This classification where an attribute is simply allocated to the requirement type with the largest group of respondents regardless of how big or small the difference to the nearest runners-up might be, thus ignoring the classification of all other respondents, has been criticized (Berger, et al., 1993). In this study, this issue was addressed by statistically considering intra-group proportions and thereby taking tied ranks into consideration. This allowed for the possibility to detect different market segments that are represented similarly often (i.e. not of significantly different group size), but with different expectations (Goncalves, 2000; Matzler, et al., 1996).
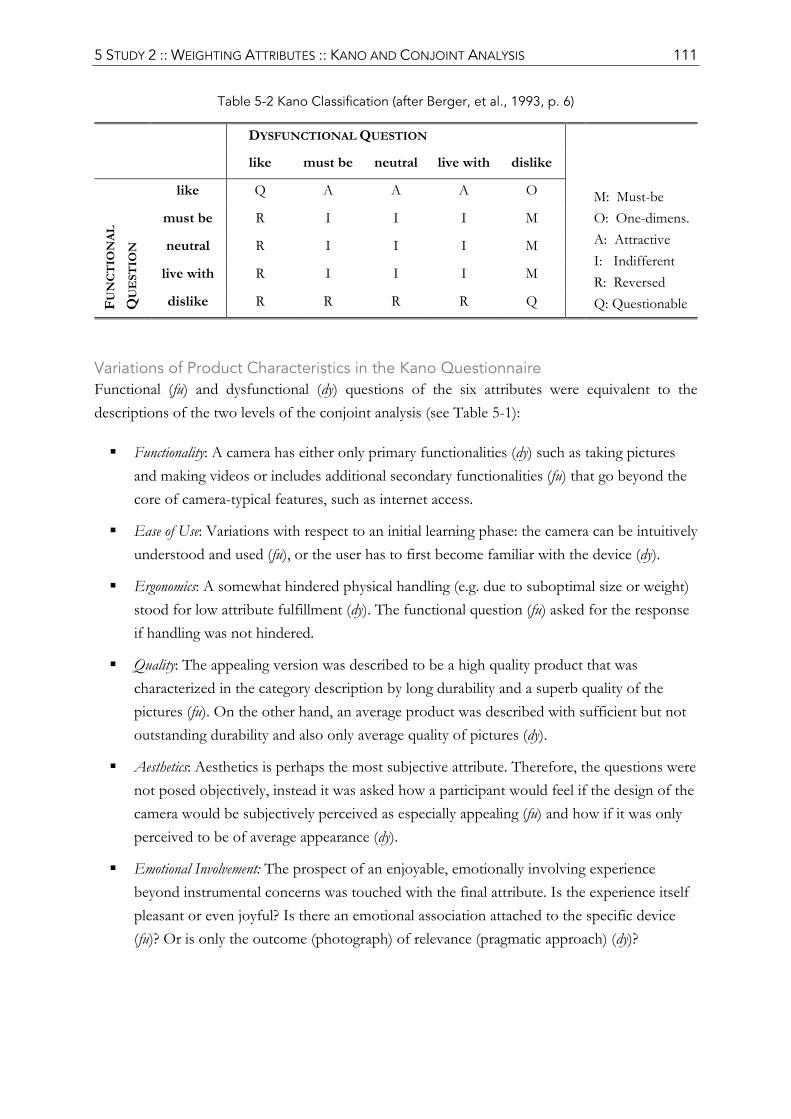
5 STUDY 2 :: WEIGHTING ATTRIBUTES :: KANO AND CONJOINT ANALYSIS 111
Table 5-2 Kano Classification (after Berger, et al., 1993, p. 6)
DYSFUNCTIONAL QUESTION
M: Must-be O: One-dimens.A: Attractive I: Indifferent R: Reversed Q: Questionable
like must be neutral live with dislike
FUN
CT
ION
AL
QU
EST
ION
like Q A A A O
must be R I I I M
neutral R I I I M
live with R I I I M
dislike R R R R Q
Variations of Product Characteristics in the Kano Questionnaire Functional (fu) and dysfunctional (dy) questions of the six attributes were equivalent to the descriptions of the two levels of the conjoint analysis (see Table 5-1):
Functionality: A camera has either only primary functionalities (dy) such as taking pictures and making videos or includes additional secondary functionalities (fu) that go beyond the core of camera-typical features, such as internet access.
Ease of Use: Variations with respect to an initial learning phase: the camera can be intuitively understood and used (fu), or the user has to first become familiar with the device (dy).
Ergonomics: A somewhat hindered physical handling (e.g. due to suboptimal size or weight) stood for low attribute fulfillment (dy). The functional question (fu) asked for the response if handling was not hindered.
Quality: The appealing version was described to be a high quality product that was characterized in the category description by long durability and a superb quality of the pictures (fu). On the other hand, an average product was described with sufficient but not outstanding durability and also only average quality of pictures (dy).
Aesthetics: Aesthetics is perhaps the most subjective attribute. Therefore, the questions were not posed objectively, instead it was asked how a participant would feel if the design of the camera would be subjectively perceived as especially appealing (fu) and how if it was only perceived to be of average appearance (dy).
Emotional Involvement: The prospect of an enjoyable, emotionally involving experience beyond instrumental concerns was touched with the final attribute. Is the experience itself pleasant or even joyful? Is there an emotional association attached to the specific device (fu)? Or is only the outcome (photograph) of relevance (pragmatic approach) (dy)?
5 STUDY 2 :: WEIGHTING ATTRIBUTES :: KANO AND CONJOINT ANALYSIS 112
5.2.3 PROCEDURE
Data was collected at Technische Universität Berlin. Participants gave written consent and provided information regarding demographics, general technology affinity (Karrer, et al., 2009), centrality in visual product aesthetics (Bloch, et al., 2003), computer literacy (Sengpiel & Dittberner, 2008), and previous experience with digital cameras. In single sessions, each participant was instructed individually, following a standardized protocol. Instructions were read out to the participants in addition to being provided in written format on the questionnaires in order to avoid missed information. Before rating each attribute’s importance (self-stated importance and subsequently the conjoint and Kano analyses), participants became familiar to the six attributes through pre-defined descriptions and examples, in particular with respect to digital cameras. A description of the attributes and their levels was provided and could be checked whenever necessary. Thus, participants were acquainted with the attributes that were the focus of evaluation. In the end, the achievement motives scale was conducted (Lang & Fries, 2006). Data was collected in paper-pencil format.
The order of the product descriptions (profiles in conjoint analysis) was randomized by shuffling the cards before rating.
All attribute ratings, were related to the context of hobby photography and to an anticipated usage situation. The instructions highlighted that all other possible attributes were supposed to be regarded as being constant (e.g. price). In respect of the SSI and Kano responses this even applied to the other five attributes that were not being rated at the moment. In other words, all attributes were specifically instructed to be rated independently.
Kano answer options were introduced as separate classifications and not as a continuous ranking (see Bolster’s concern regarding the order of, for example, ‘I like’ and ‘It must be’ in Berger, et al., 1993).
5.2.4 ANALYSIS
Conjoint Analysis
Metric conjoint analysis (ordinary least square regression) was employed to estimate part-worth utilities and ‘relative importance’ scores. In line with the specification of attribute levels, attributes were considered as linear predictors in the model.
Often, conjoint analyses are used for market segmentation purposes. Cluster analyses (Arabie & Hubert, 1994; Green, et al., 2001) are used post hoc to identify groups with homogenous preferences. However, in this thesis, the reverse approach was taken; instead of exploring possible groupings, groups that were of research interest were defined a priori, i.e. age groups. In order to compare the groups’ part-worth utilities, age groups were dummy coded (Backhaus, et
5 STUDY 2 :: WEIGHTING ATTRIBUTES :: KANO AND CONJOINT ANALYSIS 113
al., 2008; Bloch, et al., 2003; Field, 2009) – young adults were coded ‘zero’ (reference group) and older adults ‘one’. This procedure allows the consideration of categorical variables and defined group comparisons in a regression. Consequently, a model that included all attributes, age group, and the comparisons of the two age groups on each attribute as predictors was tested. With this approach, between-group comparisons of regression coefficients can be tested statistically (Bloch, et al., 2003 study 8; Field, 2009). The coefficient of an interaction of age group and a specific attribute is the same as the difference of the corresponding coefficients of young and older adults for this attribute. Thus, a significant interaction predictor indicates significant group differences concerning the specific attribute. The interpretation is straightforward as all attributes had two levels and two age groups were included. Part-worth utilities are equal to the unstandardized beta-coefficients and will be reported as such. Fortunately, the unstandardized coefficients in this study are comparable across attributes since they were measured on the same scale (two levels each). With two levels of each attribute, the part-worth utility of the lower level (LEVEL 1, see Table 5-1) is always set ‘zero’ and the part-worth utility of the higher level (LEVEL 2) consequently stands for the difference in prediction between the two levels and can be interpreted as the predictive value of the related attribute.
The ‘relative importance’ of each attribute is computed by calculating relative ranges, i.e. dividing the range of the part-worth utility values for each attribute by the sum of utility ranges of all attributes. These values are percentages and consequently add up to 100%. The size of the relative importance for each attribute indicates the impact that a level variation of this attribute has on the likelihood of use. Relative importance values can be interpreted in direct comparison because they are ratio-scaled. These values were first computed for each participant individually before aggregating on a group level as recommended by Orme (2002).
Kano Method
In addition to the classic Kano classification, which only considers the requirement type according to the mode statistic, the analysis was extended by testing whether the subsequent rankings differed significantly from the maximum with a ‘z test for a population proportion’ (Sheskin, 2004). If the intra-group pairwise comparisons were found not to differ significantly, then multiple Kano classifications were assigned to the associated attribute. It should be noted that if two groups do not differ significantly from one another, this does not mean that they are equal. However, in contrast to the classic approach that discards all classifications but the mode statistic, here only those will be considered negligible that are represented by significantly fewer respondents compared to the mode. This statistical consideration of tied ranks is a novel approach to a problem that has been known for quite some time (Berger, et al., 1993).
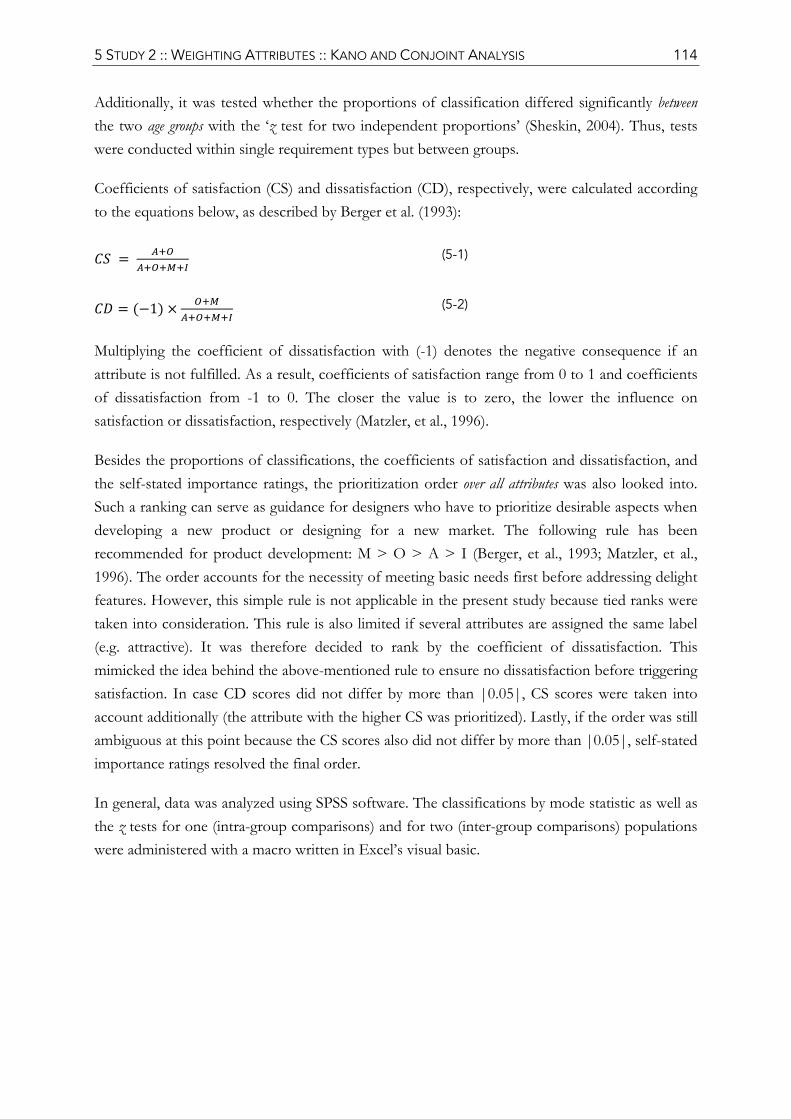
5 STUDY 2 :: WEIGHTING ATTRIBUTES :: KANO AND CONJOINT ANALYSIS 114
Additionally, it was tested whether the proportions of classification differed significantly between the two age groups with the ‘z test for two independent proportions’ (Sheskin, 2004). Thus, tests were conducted within single requirement types but between groups.
Coefficients of satisfaction (CS) and dissatisfaction (CD), respectively, were calculated according to the equations below, as described by Berger et al. (1993):
(5-1)
1 (5-2)
Multiplying the coefficient of dissatisfaction with (-1) denotes the negative consequence if an attribute is not fulfilled. As a result, coefficients of satisfaction range from 0 to 1 and coefficients of dissatisfaction from -1 to 0. The closer the value is to zero, the lower the influence on satisfaction or dissatisfaction, respectively (Matzler, et al., 1996).
Besides the proportions of classifications, the coefficients of satisfaction and dissatisfaction, and the self-stated importance ratings, the prioritization order over all attributes was also looked into. Such a ranking can serve as guidance for designers who have to prioritize desirable aspects when developing a new product or designing for a new market. The following rule has been recommended for product development: M > O > A > I (Berger, et al., 1993; Matzler, et al., 1996). The order accounts for the necessity of meeting basic needs first before addressing delight features. However, this simple rule is not applicable in the present study because tied ranks were taken into consideration. This rule is also limited if several attributes are assigned the same label (e.g. attractive). It was therefore decided to rank by the coefficient of dissatisfaction. This mimicked the idea behind the above-mentioned rule to ensure no dissatisfaction before triggering satisfaction. In case CD scores did not differ by more than |0.05|, CS scores were taken into account additionally (the attribute with the higher CS was prioritized). Lastly, if the order was still ambiguous at this point because the CS scores also did not differ by more than |0.05|, self-stated importance ratings resolved the final order.
In general, data was analyzed using SPSS software. The classifications by mode statistic as well as the z tests for one (intra-group comparisons) and for two (inter-group comparisons) populations were administered with a macro written in Excel’s visual basic.
5 STUDY 2 :: WEIGHTING ATTRIBUTES :: KANO AND CONJOINT ANALYSIS 115
5.3 RESULTS
5.3.1 ADDITIONAL MEASURES
Questionnaire on Technology Affinity TA-EG
Young and older adults showed no significant differences in three subscales of the TA-EG questionnaire: enthusiasm (MY = 3.38, SDY= .86; MO= 3.22, SDO = .99; t (102) = .86, p > .05), perceived positive consequences (MY = 3.85, SDY= .42; MO= 3.76, SDO = .59; t (102) = .89, p > .05), and perceived negative consequences (MY= 3.63, SDY= .57; MO= 3.49, SDO= .82; t (91.57) = 1.03, p > .05). However, young adults demonstrated significantly higher scores than older adults concerning perceived subjective competence (MY= 3.80, SDY= .68; MO= 3.34, SDO= .72; t (102) = 3.36, p < .01).
Computer Literacy Scale
The lower self-competence beliefs in older adults concerning the use of technology seem to be not only an effect of beliefs but also of real competence and knowledge deficits. Young adults outperformed the older sample in the computer literacy test (MY = 24.88, SDY= 1.25; MO= 17.88, SDO = 5.41; t (56.40) = 9.09, p < .001).
Achievement Motives Scale
However, the perceived lower competence beliefs of older adults in the realm of technology cannot be interpreted as general low self-efficacy beliefs. The young and the older sample showed rather high hope of success scores and did not differ significantly in this respect (MY = 3.27, SDY= .45; MO= 3.21, SDO = .44; t (101) = .66, p > .05). They further showed rather low fear of failure scores (MY = 2.38, SDY= .65; MO= 2.16, SDO = .54; t (101) = 1.93, p > .05) in the general achievement motives scale (Lang & Fries, 2006).
Centrality of Visual Product Aesthetics
No age group differences were observed with respect to the centrality of visual product aesthetics (Bloch, et al., 2003): MY = 3.20, SDY= .75; MO= 3.34, SDO = .78; t (102) = -.92, p > .05.
Experience with Digital Camera
Participants of the two age groups did not differ regarding their experience in years with digital photography (MY=5.33, SDY=2.05; MO= 5.23, SDO= 3.76; t (78.76) = .18, p > .05), nor with respect to reported frequency of usage. In fact, 20 participants of each age group reported that
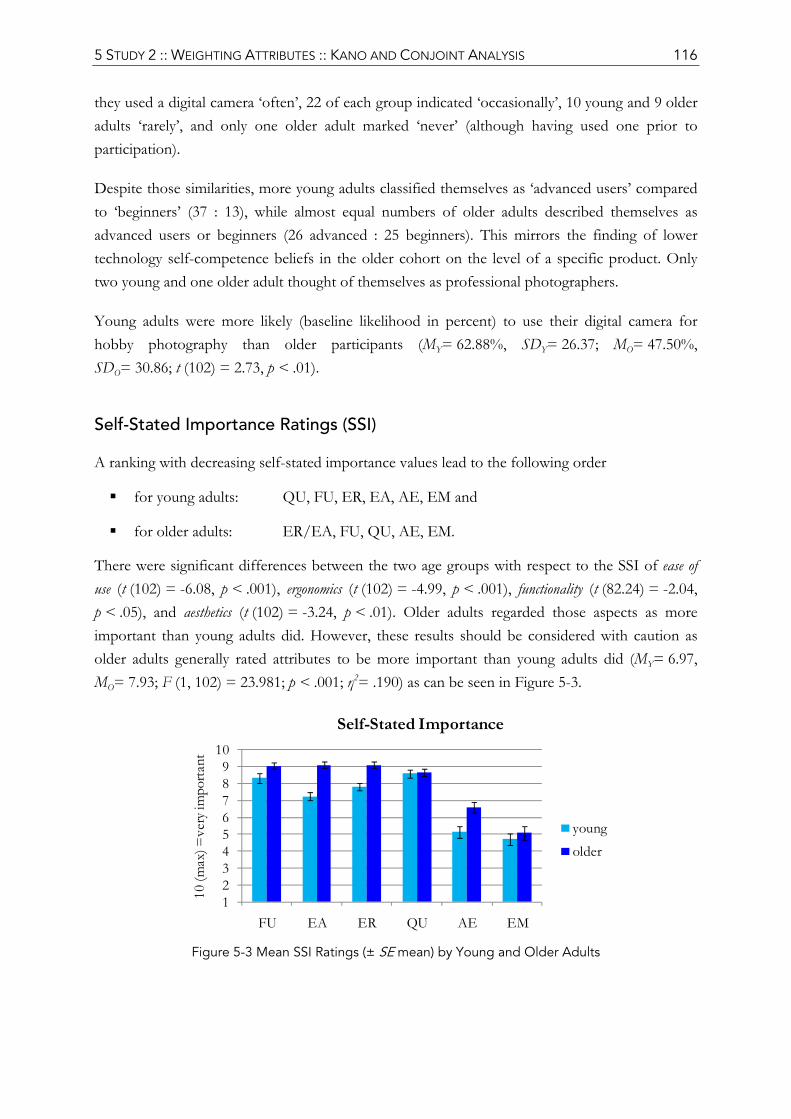
5 STUDY 2 :: WEIGHTING ATTRIBUTES :: KANO AND CONJOINT ANALYSIS 116
they used a digital camera ‘often’, 22 of each group indicated ‘occasionally’, 10 young and 9 older adults ‘rarely’, and only one older adult marked ‘never’ (although having used one prior to participation).
Despite those similarities, more young adults classified themselves as ‘advanced users’ compared to ‘beginners’ (37 : 13), while almost equal numbers of older adults described themselves as advanced users or beginners (26 advanced : 25 beginners). This mirrors the finding of lower technology self-competence beliefs in the older cohort on the level of a specific product. Only two young and one older adult thought of themselves as professional photographers.
Young adults were more likely (baseline likelihood in percent) to use their digital camera for hobby photography than older participants (MY= 62.88%, SDY= 26.37; MO= 47.50%, SDO= 30.86; t (102) = 2.73, p < .01).
Self-Stated Importance Ratings (SSI)
A ranking with decreasing self-stated importance values lead to the following order
for young adults: QU, FU, ER, EA, AE, EM and
for older adults: ER/EA, FU, QU, AE, EM.
There were significant differences between the two age groups with respect to the SSI of ease of use (t (102) = -6.08, p < .001), ergonomics (t (102) = -4.99, p < .001), functionality (t (82.24) = -2.04, p < .05), and aesthetics (t (102) = -3.24, p < .01). Older adults regarded those aspects as more important than young adults did. However, these results should be considered with caution as older adults generally rated attributes to be more important than young adults did (MY= 6.97, MO= 7.93; F (1, 102) = 23.981; p < .001; η2= .190) as can be seen in Figure 5-3.
Figure 5-3 Mean SSI Ratings (± SE mean) by Young and Older Adults
123456789
10
FU EA ER QU AE EM
10 (m
ax) =
very
impo
rtant
Self-Stated Importance
youngolder

5 STUDY 2 :: WEIGHTING ATTRIBUTES :: KANO AND CONJOINT ANALYSIS 117
5.3.2 CONJOINT ANALYSIS
First, a model, including all six attributes, however without age comparisons, was tested. The overall regression model was significant (F (6, 13) = 454.906, p < .001) and explained 99.5% of the variance. All attributes, except functionality (b= .90, t= 1.63, p > .05), were significant predictors of usage likelihood. As expected, the prospect of intuitive use (b= 12.92, t= 23.43, p < .001), good ergonomics (b= 18.68, t= 33.90, p < .001), high quality (b= 16.90, t= 30.65, p < .001), an appealing appearance (b= 4.34, t= 7.87, p < .001), and emotional involvement (b= 2.88, t= 5.22, p < .001) increased likelihood of usage. Base utility (the regression intercept) was b0= 26.87.
Validity measures were also very satisfactory: correlations between estimated and observed ratings were highly significant for the profiles within the model (r (20) = .998, p < .001) as well as concerning the prediction of the six holdout cards (r (6) = .995, p < .001).
Next, age group differences were addressed in the regression: A second model was estimated, including the six attributes, age group, and the interactions of each attribute with age group as predictors. This model was also significant (F (13, 26) = 245.375, p < .001) and explained 99.2% of the variance. Equivalent to the results mentioned above, all single attributes, except functionality, were significant predictors.
Significant interactions of attributes and age group could be observed with respect to ergonomics (b= 4.33, t= 4.11, p < .001, one-tailed), quality (b= -11.09, t= -10.53, p < .001, one-tailed), and aesthetics (b= -3.75, t= -3.56, p < .01) (see Figure 5-4, left side). Likelihood of usage increased significantly more for older than for young adults given an easy handling (physical ergonomics) (bYoung= 16.52 vs. bOlder= 20.85). On the other hand, young adults showed significantly higher part-worth utilities for high quality (bYoung= 22.44 vs. bOlder= 11.35) and for an appealing appearance (aesthetics) (bYoung= 6.21 vs. bOlder= 2.47). This means that the difference in beta weights of these attributes was significantly different between young and older adults. In contrast, there was no general main effect of age (b= 1.84, t= 1.32, p > .05). Base utility (the regression intercept) was b0_Young=25.95 in the young and b0_Older=27.79 in the older cohort. For further details see Table A. 3-4, p. 238 in the Appendix.
Part-worth utilities indicate to what degree each attribute affects the likelihood of usage if the effects of all other attributes are held constant. Ordered by decreasing prediction impact of the attributes, the following ranking can be reported (see Figure 5-4, left side):
for young adults: QU, ER, EA, AE, EM, FU and
for older adults: ER, EA, QU, AE, EM, FU.
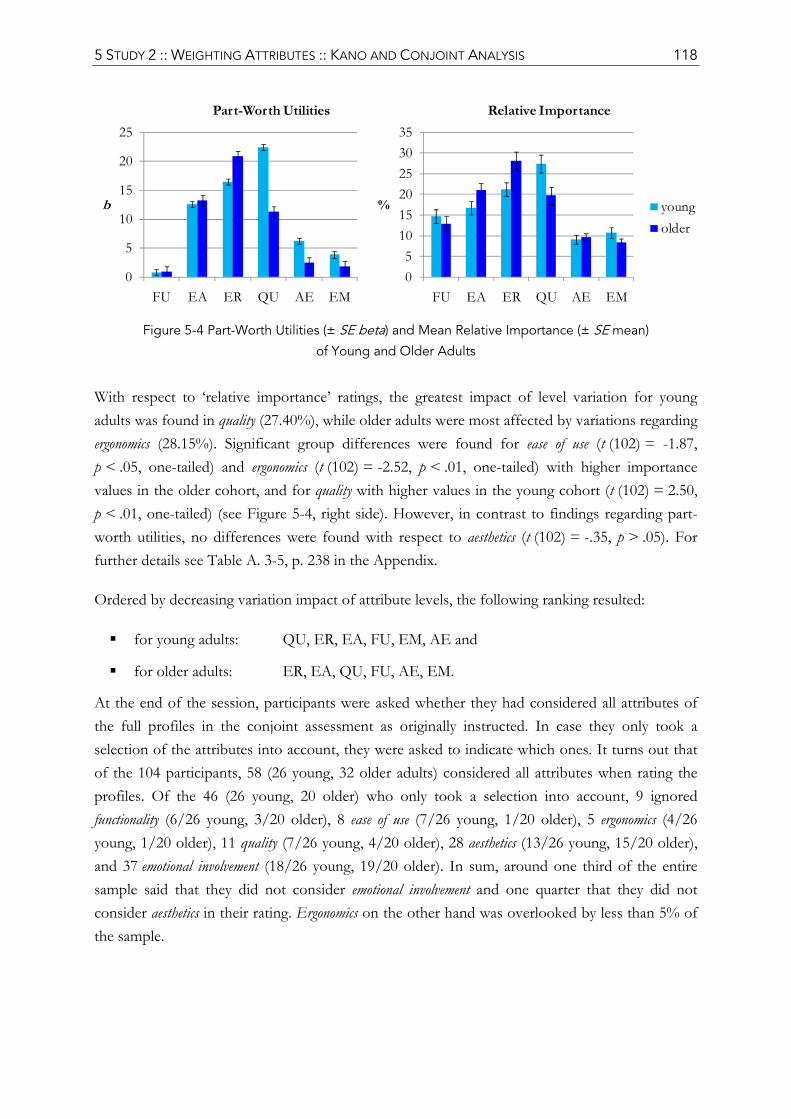
5 STUDY 2 :: WEIGHTING ATTRIBUTES :: KANO AND CONJOINT ANALYSIS 118
Figure 5-4 Part-Worth Utilities (± SE beta) and Mean Relative Importance (± SE mean)
of Young and Older Adults
With respect to ‘relative importance’ ratings, the greatest impact of level variation for young adults was found in quality (27.40%), while older adults were most affected by variations regarding ergonomics (28.15%). Significant group differences were found for ease of use (t (102) = -1.87, p < .05, one-tailed) and ergonomics (t (102) = -2.52, p < .01, one-tailed) with higher importance values in the older cohort, and for quality with higher values in the young cohort (t (102) = 2.50, p < .01, one-tailed) (see Figure 5-4, right side). However, in contrast to findings regarding part-worth utilities, no differences were found with respect to aesthetics (t (102) = -.35, p > .05). For further details see Table A. 3-5, p. 238 in the Appendix.
Ordered by decreasing variation impact of attribute levels, the following ranking resulted:
for young adults: QU, ER, EA, FU, EM, AE and
for older adults: ER, EA, QU, FU, AE, EM.
At the end of the session, participants were asked whether they had considered all attributes of the full profiles in the conjoint assessment as originally instructed. In case they only took a selection of the attributes into account, they were asked to indicate which ones. It turns out that of the 104 participants, 58 (26 young, 32 older adults) considered all attributes when rating the profiles. Of the 46 (26 young, 20 older) who only took a selection into account, 9 ignored functionality (6/26 young, 3/20 older), 8 ease of use (7/26 young, 1/20 older), 5 ergonomics (4/26 young, 1/20 older), 11 quality (7/26 young, 4/20 older), 28 aesthetics (13/26 young, 15/20 older), and 37 emotional involvement (18/26 young, 19/20 older). In sum, around one third of the entire sample said that they did not consider emotional involvement and one quarter that they did not consider aesthetics in their rating. Ergonomics on the other hand was overlooked by less than 5% of the sample.
0
5
10
15
20
25
FU EA ER QU AE EM
b
Part-Worth Utilities
05
101520253035
FU EA ER QU AE EM
%
Relative Importance
youngolder
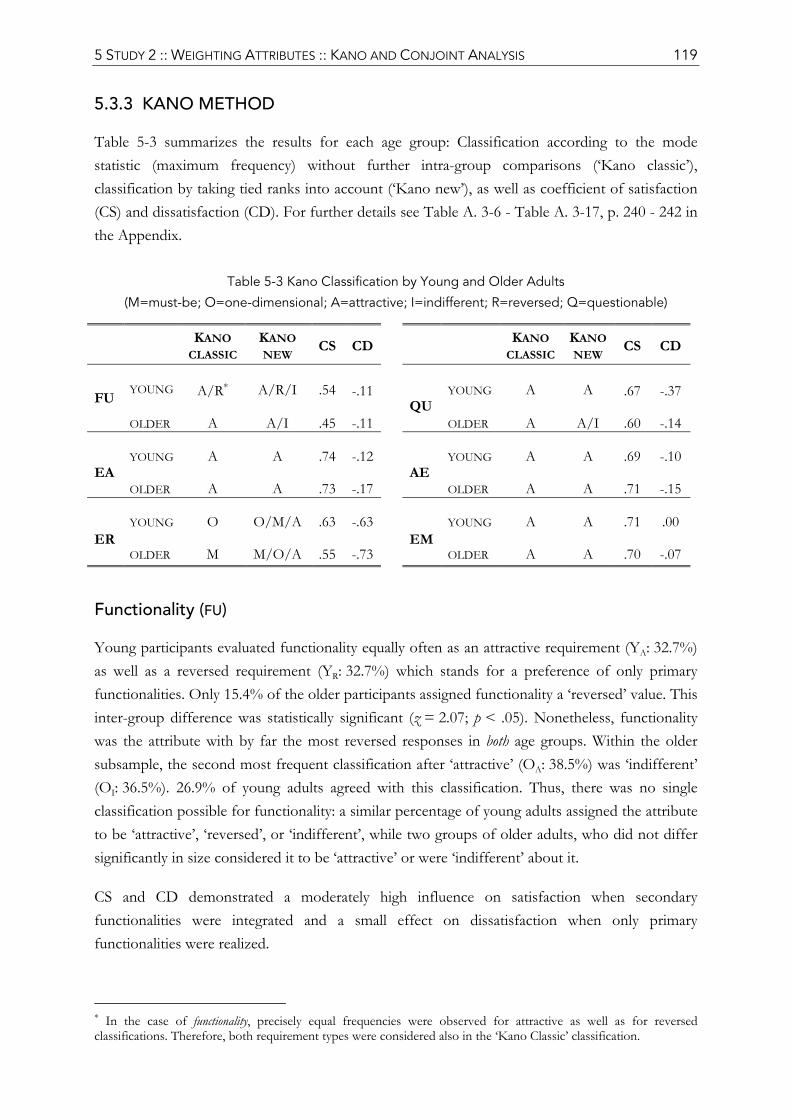
5 STUDY 2 :: WEIGHTING ATTRIBUTES :: KANO AND CONJOINT ANALYSIS 119
5.3.3 KANO METHOD
Table 5-3 summarizes the results for each age group: Classification according to the mode statistic (maximum frequency) without further intra-group comparisons (‘Kano classic’), classification by taking tied ranks into account (‘Kano new’), as well as coefficient of satisfaction (CS) and dissatisfaction (CD). For further details see Table A. 3-6 - Table A. 3-17, p. 240 - 242 in the Appendix.
Table 5-3 Kano Classification by Young and Older Adults
(M=must-be; O=one-dimensional; A=attractive; I=indifferent; R=reversed; Q=questionable)
KANO CLASSIC
KANO NEW CS CD KANO
CLASSICKANO NEW CS CD
FU YOUNG A/R∗ A/R/I .54 -.11 QU
YOUNG A A .67 -.37
OLDER A A/I .45 -.11 OLDER A A/I .60 -.14
EA YOUNG A A .74 -.12
AE YOUNG A A .69 -.10
OLDER A A .73 -.17 OLDER A A .71 -.15
ER YOUNG O O/M/A .63 -.63
EMYOUNG A A .71 .00
OLDER M M/O/A .55 -.73 OLDER A A .70 -.07
Functionality (FU)
Young participants evaluated functionality equally often as an attractive requirement (YA: 32.7%) as well as a reversed requirement (YR: 32.7%) which stands for a preference of only primary functionalities. Only 15.4% of the older participants assigned functionality a ‘reversed’ value. This inter-group difference was statistically significant (z = 2.07; p < .05). Nonetheless, functionality was the attribute with by far the most reversed responses in both age groups. Within the older subsample, the second most frequent classification after ‘attractive’ (OA: 38.5%) was ‘indifferent’ (OI: 36.5%). 26.9% of young adults agreed with this classification. Thus, there was no single classification possible for functionality: a similar percentage of young adults assigned the attribute to be ‘attractive’, ‘reversed’, or ‘indifferent’, while two groups of older adults, who did not differ significantly in size considered it to be ‘attractive’ or were ‘indifferent’ about it.
CS and CD demonstrated a moderately high influence on satisfaction when secondary functionalities were integrated and a small effect on dissatisfaction when only primary functionalities were realized.
∗ In the case of functionality, precisely equal frequencies were observed for attractive as well as for reversed classifications. Therefore, both requirement types were considered also in the ‘Kano Classic’ classification.
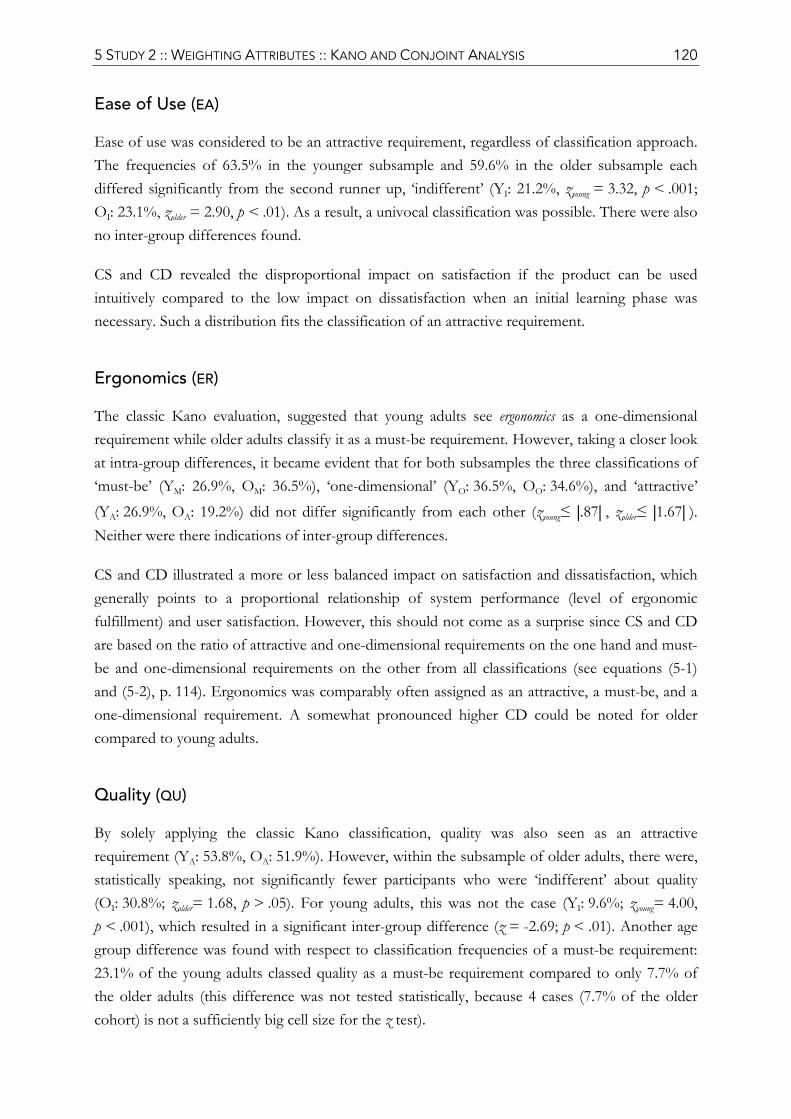
5 STUDY 2 :: WEIGHTING ATTRIBUTES :: KANO AND CONJOINT ANALYSIS 120
Ease of Use (EA)
Ease of use was considered to be an attractive requirement, regardless of classification approach. The frequencies of 63.5% in the younger subsample and 59.6% in the older subsample each differed significantly from the second runner up, ‘indifferent’ (YI: 21.2%, zyoung = 3.32, p < .001; OI: 23.1%, zolder = 2.90, p < .01). As a result, a univocal classification was possible. There were also no inter-group differences found.
CS and CD revealed the disproportional impact on satisfaction if the product can be used intuitively compared to the low impact on dissatisfaction when an initial learning phase was necessary. Such a distribution fits the classification of an attractive requirement.
Ergonomics (ER)
The classic Kano evaluation, suggested that young adults see ergonomics as a one-dimensional requirement while older adults classify it as a must-be requirement. However, taking a closer look at intra-group differences, it became evident that for both subsamples the three classifications of ‘must-be’ (YM: 26.9%, OM: 36.5%), ‘one-dimensional’ (YO: 36.5%, OO: 34.6%), and ‘attractive’ (YA: 26.9%, OA: 19.2%) did not differ significantly from each other (zyoung≤ |.87| , zolder≤ |1.67| ). Neither were there indications of inter-group differences.
CS and CD illustrated a more or less balanced impact on satisfaction and dissatisfaction, which generally points to a proportional relationship of system performance (level of ergonomic fulfillment) and user satisfaction. However, this should not come as a surprise since CS and CD are based on the ratio of attractive and one-dimensional requirements on the one hand and must-be and one-dimensional requirements on the other from all classifications (see equations (5-1) and (5-2), p. 114). Ergonomics was comparably often assigned as an attractive, a must-be, and a one-dimensional requirement. A somewhat pronounced higher CD could be noted for older compared to young adults.
Quality (QU)
By solely applying the classic Kano classification, quality was also seen as an attractive requirement (YA: 53.8%, OA: 51.9%). However, within the subsample of older adults, there were, statistically speaking, not significantly fewer participants who were ‘indifferent’ about quality (OI: 30.8%; zolder= 1.68, p > .05). For young adults, this was not the case (YI: 9.6%; zyoung= 4.00, p < .001), which resulted in a significant inter-group difference (z = -2.69; p < .01). Another age group difference was found with respect to classification frequencies of a must-be requirement: 23.1% of the young adults classed quality as a must-be requirement compared to only 7.7% of the older adults (this difference was not tested statistically, because 4 cases (7.7% of the older cohort) is not a sufficiently big cell size for the z test).
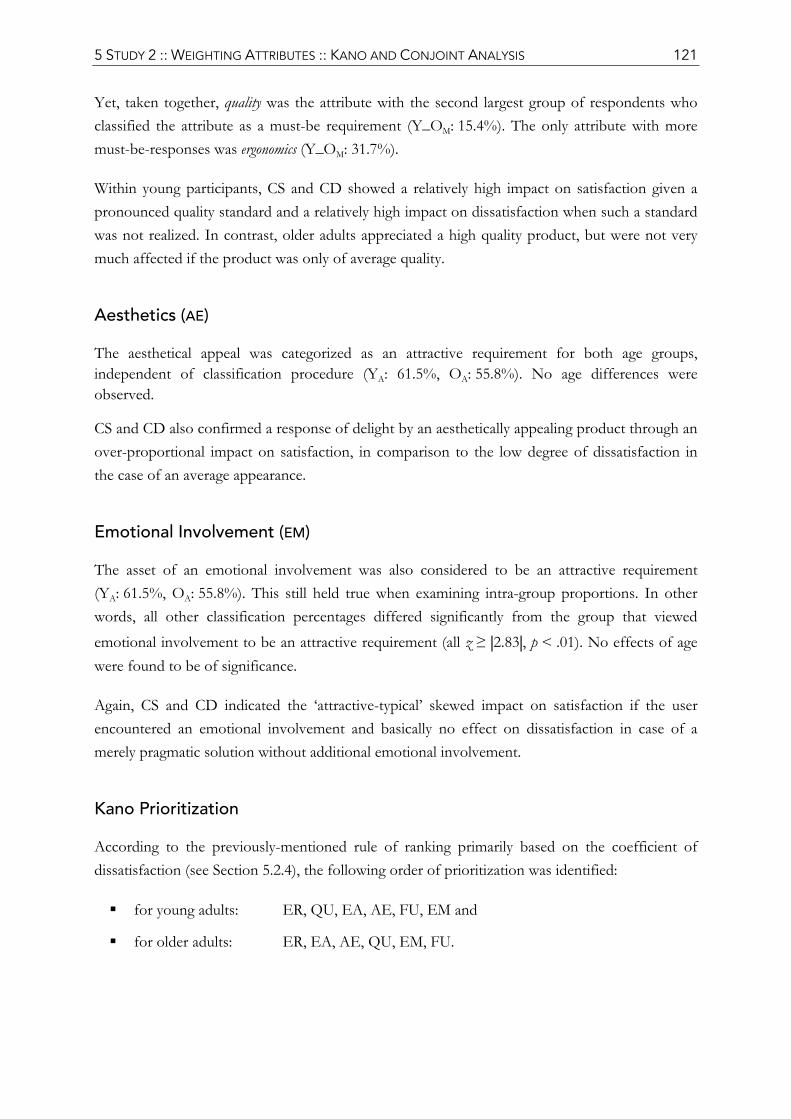
5 STUDY 2 :: WEIGHTING ATTRIBUTES :: KANO AND CONJOINT ANALYSIS 121
Yet, taken together, quality was the attribute with the second largest group of respondents who classified the attribute as a must-be requirement (Y_OM: 15.4%). The only attribute with more must-be-responses was ergonomics (Y_OM: 31.7%).
Within young participants, CS and CD showed a relatively high impact on satisfaction given a pronounced quality standard and a relatively high impact on dissatisfaction when such a standard was not realized. In contrast, older adults appreciated a high quality product, but were not very much affected if the product was only of average quality.
Aesthetics (AE)
The aesthetical appeal was categorized as an attractive requirement for both age groups, independent of classification procedure (YA: 61.5%, OA: 55.8%). No age differences were observed.
CS and CD also confirmed a response of delight by an aesthetically appealing product through an over-proportional impact on satisfaction, in comparison to the low degree of dissatisfaction in the case of an average appearance.
Emotional Involvement (EM)
The asset of an emotional involvement was also considered to be an attractive requirement (YA: 61.5%, OA: 55.8%). This still held true when examining intra-group proportions. In other words, all other classification percentages differed significantly from the group that viewed emotional involvement to be an attractive requirement (all z ≥ |2.83|, p < .01). No effects of age were found to be of significance.
Again, CS and CD indicated the ‘attractive-typical’ skewed impact on satisfaction if the user encountered an emotional involvement and basically no effect on dissatisfaction in case of a merely pragmatic solution without additional emotional involvement.
Kano Prioritization
According to the previously-mentioned rule of ranking primarily based on the coefficient of dissatisfaction (see Section 5.2.4), the following order of prioritization was identified:
for young adults: ER, QU, EA, AE, FU, EM and
for older adults: ER, EA, AE, QU, EM, FU.
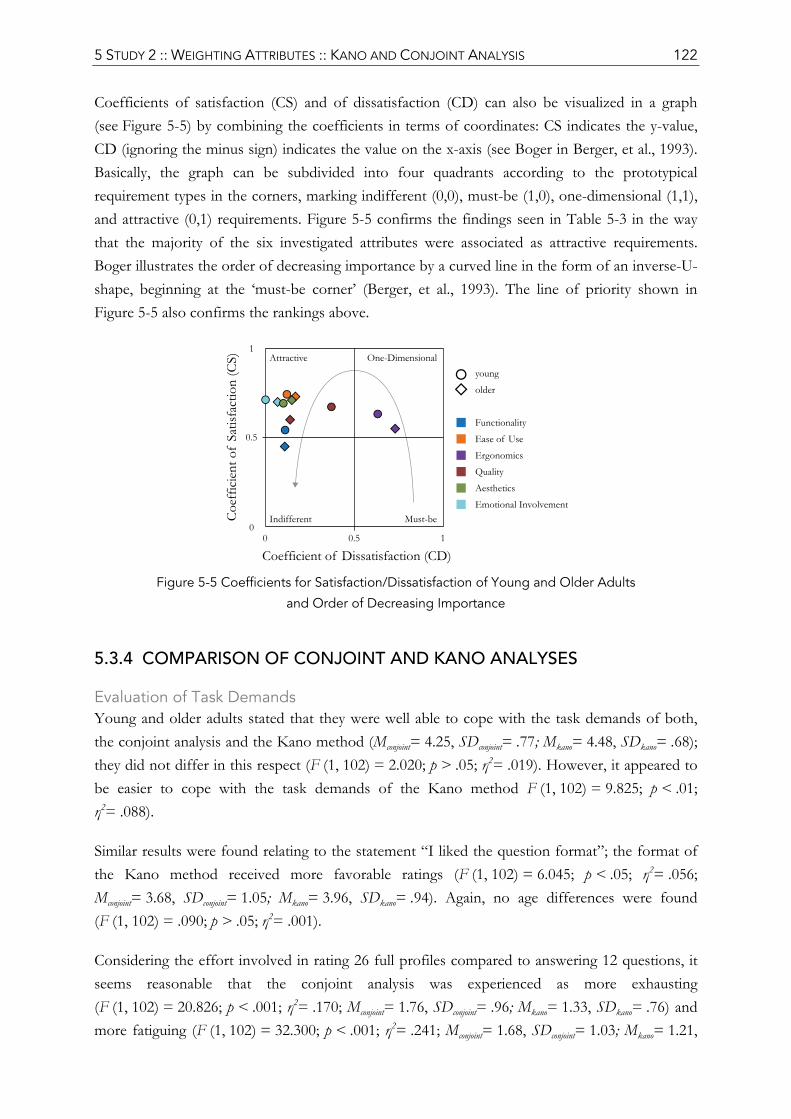
5 STUDY 2 :: WEIGHTING ATTRIBUTES :: KANO AND CONJOINT ANALYSIS 122
Coefficients of satisfaction (CS) and of dissatisfaction (CD) can also be visualized in a graph (see Figure 5-5) by combining the coefficients in terms of coordinates: CS indicates the y-value, CD (ignoring the minus sign) indicates the value on the x-axis (see Boger in Berger, et al., 1993). Basically, the graph can be subdivided into four quadrants according to the prototypical requirement types in the corners, marking indifferent (0,0), must-be (1,0), one-dimensional (1,1), and attractive (0,1) requirements. Figure 5-5 confirms the findings seen in Table 5-3 in the way that the majority of the six investigated attributes were associated as attractive requirements. Boger illustrates the order of decreasing importance by a curved line in the form of an inverse-U-shape, beginning at the ‘must-be corner’ (Berger, et al., 1993). The line of priority shown in Figure 5-5 also confirms the rankings above.
Figure 5-5 Coefficients for Satisfaction/Dissatisfaction of Young and Older Adults
and Order of Decreasing Importance
5.3.4 COMPARISON OF CONJOINT AND KANO ANALYSES
Evaluation of Task Demands Young and older adults stated that they were well able to cope with the task demands of both, the conjoint analysis and the Kano method (Mconjoint= 4.25, SDconjoint= .77; Mkano= 4.48, SDkano= .68); they did not differ in this respect (F (1, 102) = 2.020; p > .05; η2= .019). However, it appeared to be easier to cope with the task demands of the Kano method F (1, 102) = 9.825; p < .01; η2= .088).
Similar results were found relating to the statement “I liked the question format”; the format of the Kano method received more favorable ratings (F (1, 102) = 6.045; p < .05; η2= .056; Mconjoint= 3.68, SDconjoint= 1.05; Mkano= 3.96, SDkano= .94). Again, no age differences were found (F (1, 102) = .090; p > .05; η2= .001).
Considering the effort involved in rating 26 full profiles compared to answering 12 questions, it seems reasonable that the conjoint analysis was experienced as more exhausting (F (1, 102) = 20.826; p < .001; η2= .170; Mconjoint= 1.76, SDconjoint= .96; Mkano= 1.33, SDkano= .76) and more fatiguing (F (1, 102) = 32.300; p < .001; η2= .241; Mconjoint= 1.68, SDconjoint= 1.03; Mkano= 1.21,
5 STUDY 2 :: WEIGHTING ATTRIBUTES :: KANO AND CONJOINT ANALYSIS 123
SDkano= .55). However, unexpectedly, young adults thought the tasks were more fatiguing than older adults did (F (1, 102) = 4.945; p < .05; η2= .046), especially with respect to conjoint analysis (MY_conjoint= 1.96, SDY_conjoint= 1.03; MO_conjoint= 1.40, SDO_Conjoint= .96).
It should be noted that apart from method effects regarding fatigue and exhaustion, the effects were rather small and grand means showed that all in all, participants agreed that they were able to cope with the task demands (M= 4.37), that they somewhat liked the question formats (M= 3.82) and disagreed that the tasks were exhausting (M= 1.54) or fatiguing (M= 1.48).
Relationship between Conjoint and Kano Analysis The relationship between the independent ratings of self-stated importance, the predicted impact of attributes when considered jointly (part-worth utilities), and the prioritization according to the Kano model were analyzed by rank correlations (see rankings p. 116, 117, and 121) The order of part-worth utilities and of the Kano values showed strong, positive relationships in both age groups (τY= .733, p < .05; τO= .867, p < .01; both one-tailed). This relationship is also visible in Figure 5-6. Kano values were weighted in size by the part-worth utilities (Zanger & Baier, 1998). It can be seen that as attributes decrease in Kano prioritization (compare Figure 5-5), so does the according circle size.∗
Figure 5-6 Coefficients of Satisfaction/Dissatisfaction of Young and Older Adults
(weighted by part-worth utilities)
In contrast, the order of self-stated importance was neither significantly related to the order of part-worth utilities (τY= .467, p > .05; τO= .552, p > .05; both one-tailed), nor to the Kano prioritization order (τY= .467, p > .05; τO= .414, p > .05; both one-tailed).
∗ In case of a clutter along a horizontal line as found in the ‘attractive quadrant’, attributes further to the right, i.e. those with higher Coefficient of Dissatisfaction scores have greater priority.
5 STUDY 2 :: WEIGHTING ATTRIBUTES :: KANO AND CONJOINT ANALYSIS 124
5.4 DISCUSSION OF EMPIRICAL RESULTS
Are the attributes significant predictors of likelihood of usage? [RQ 1]
The likelihood of technology use, in this case a digital camera, depended on the combination of the product’s attributes. There was consensus in the sample that an intuitive interface (ease of use/cognitive ergonomics), easy handling of the device (physical ergonomics), high quality, an appealing appearance, and a pleasurable engagement increase the likelihood of usage. Contrary to expectations, functionality did not contribute significantly to the prediction of usage likelihood despite high self-stated importance (SSI) scores. Therefore, all attributes but functionality were significant predictors (H1.2, H1.3, H1.4, H1.5, and H1.6 confirmed; H1.1 not confirmed).
The model explained a near to perfect 99% of the variance. This score should not be over-interpreted as the objective of this study was not to test the model per se, but to compare relevant attributes. In this regard, significant group differences were found (see below). The high degree of explained variance can be regarded as a confirmation that participants were committed to the task, focused on the stimulus cards and based their rating on the information provided. As a result, random noise was minimal and internal validity therefore substantial. In a natural setting when information is presented in a different format (e.g. no concise list of attribute fulfillment) or when embedded in a social context, additional factors are likely to affect the user. However, for the controlled variation of attribute levels, findings appear to be valid.
Despite few counts of emotional involvement in study 1 and a small predictive impact compared to the other attributes in this study, it was shown to be a significant predictor of technology adoption nonetheless.
The non-significance of functionality can be explained by equal numbers of participants who preferred the camera to have only primary functions integrated, who preferred the addition of secondary functions, and who were indifferent about this matter, as revealed by the Kano method. The two levels of primary vs. secondary functions were equally attractive and thereby also for many (31.7%) indifferent. The problem with this variation was that it did not only differ in quantitative terms (addition of secondary functionalities results in overall more functionalities than just primary ones) but also qualitatively in the sense that secondary functionalities were described as those that are usually not integrated in a camera. The comparison with mobile phones might illustrate the distinction more clearly: placing a call is a primary function, while listening to music or watching videos on a phone would be considered as secondary functionalities. Hence, it might be a matter of taste, whether one prefers one product for each set of core functionalities or the integration of diverse features in a multi-functional device. This is what the results of the Kano method suggest by identifying groups that are comparable in size, however with opposing preferences. As interesting as this finding was, it consequently led to a reduction of the attribute’s predictive power in a regression model. According to the high self-
5 STUDY 2 :: WEIGHTING ATTRIBUTES :: KANO AND CONJOINT ANALYSIS 125
stated importance ratings (see Figure 5-3) and the substantial ‘relative importance’ values (see Figure 5-4 right), which indicated that a variation does affect users and that not all were indifferent about this matter, show that this attribute should not be ignored and that it could be a worthwhile endeavor to further investigate the identified market segments.
Thus, thanks to the indications from the Kano method, it could be assumed that the non-significance was more an effect of the particular operationalization of functionality in this study than due to non-relevance of the attribute per se. Future studies are needed to verify this assumption and to unfold the attribute’s ‘true’ importance.
Do young and older adults differ in assigned attribute importance? [RQ 2]
The conjoint analysis revealed that high quality and an appealing appearance (aesthetics) were stronger predictors of usage likelihood for young than for older adults (H2.3.1 and H2.3.2 confirmed). On the other hand, a comfortable physical handling (ergonomics) of the digital camera was a more important predictor of use for the older than for the young age group (H2.2.1 and H2.2.2 confirmed). The increase in ease of use had a greater relative impact on usage likelihood in the older cohort (H2.1.2 confirmed) while age groups did not differ regarding part-worth utility of this attribute (H2.1.1 not confirmed).
The present study was designed to determine relative weights for each attribute. For young adults, quality was the strongest predictor, followed by ergonomics, and ease of use. Older adults on the other hand considered ergonomics as the strongest predictor, followed by ease of use, and quality. These findings are in agreement with the relative frequencies found in study 1 (see Figure 4-6, p. 88).
In addition to the expected differences regarding ergonomics and quality, aesthetics had a greater weight (part-worth utility) in the young sample, suggesting that the aesthetic appeal of a camera had a greater impact on the likelihood of usage for young adults. However, when looking at the relative impact associated with the variation of an average to an appealing appearance, i.e. ‘relative importance’, the two age groups showed comparable scores. The two levels were a variation from neutral to positive. It would be interesting to see if the age effect would become apparent also regarding ‘relative importance’ given a negative variation of aesthetics (‘ugly looks’). One could hypothesize that with the set of the six attributes studied here young adults had some ‘unused resources’ as they were not as affected by concerns of for instance ergonomics as older adults are (e.g. Chaparro, et al., 2000). If, for example, only the attributes aesthetics and quality were investigated, one might predict equal weights of aesthetics for the two age groups. Relative weights must always be seen in relation to another. The higher weight could not be explained by a general higher appreciation regarding aesthetics in young adults as no age differences were found with respect to the centrality of visual product aesthetics (Bloch, et al., 2003). Neither did young adults show higher SSI scores of aesthetics. On the contrary, older adults rated this attribute as more
5 STUDY 2 :: WEIGHTING ATTRIBUTES :: KANO AND CONJOINT ANALYSIS 126
important, but it is difficult to interpret this result as the older group showed overall higher SSI scores.
The outlook of an intuitively usable interface (ease of use) did not predict likelihood of usage to a significantly different degree between the two age groups. However, response range to level variation was more pronounced in older adults, which was also in accordance with their lower self-competence beliefs concerning technology use and lower computer literacy performance and also corroborates design implications proposed in the literature (Czaja & Lee, 2008; Fisk, et al., 2004; Nichols, et al., 2006; Schieber, 2003).
Young participants were more likely to do hobby photography. This might be one reason for a greater interest in excellent picture quality and a reliable camera. However, the pronounced appreciation of quality in young adults was also observed in study 1 with a variety of interactive products. Therefore, it appears to be rather a product-independent age effect.
In sum, the triad of quality, ergonomics, and ease of use were the strongest predictors for the likelihood of using a digital camera in the context of hobby photography. Older adults were more susceptible to ergonomics and differences in ease of use. Usage likelihood of young adults was more affected by aspects of quality and aesthetics, underlined by a stronger relative response to differences in quality in comparison to older adults. For engineers, these findings could serve as priority guides in the development process. ‘Relative importance’ values can point to whether a variation would make a difference and whether a modification can be expected to be worth the investment.
Do the results of the Kano method support findings of the conjoint analysis? [RQ 3]
All in all, results of the Kano method confirmed the findings of the conjoint analysis.
The pronounced need of usable products in the older cohort was also evident in the results of the Kano method. Relatively speaking, older adults gave ergonomics the highest priority, followed by ease of use. Although both, young and older adults, classified ergonomics in comparable amounts as a must-be, one-dimensional, and attractive requirement, older adults still showed a somewhat stronger reaction of dissatisfaction (CD) to the dysfunctional option of a rather hindered handling (see Table 5-3, p. 119 and Figure 5-5, p. 122).
After ergonomics, young adults demanded high quality in a product. Quality was requested more strongly by young than by older adults. Elderly were equally often interested and indifferent concerning the quality standard. Not so young adults: significantly less young adults were indifferent about this attribute and significantly more classified high quality as a must-be requirement, resulting in a higher coefficient of dissatisfaction for this age group (see Table 5-3
5 STUDY 2 :: WEIGHTING ATTRIBUTES :: KANO AND CONJOINT ANALYSIS 127
and Figure 5-5). High quality combined with good ergonomics appears to constitute the basis for developing a satisfying product for young adults.
In relative terms of the ranking order, ease of use was the second most important attribute for older adults and on third place for young adults. However, when looking at the associated CS and CD scores, the two age groups appear very much alike. Moreover, both groups classified the attribute as an unequivocal attractive requirement. Again, it may be the case that the description of an intuitively usable interface was comparably appealing for both age groups and a previously required learning phase comparably acceptable. A more extreme and perhaps negative variation, such as the occasional inability to perform a task, might have resulted in the age difference known from previous studies (e.g. Ziefle & Bay, 2005) and from everyday experiences as also documented by the respective age effect of product-specific statements in study 1. Thus, this finding did not confirm the expected difference, but did, on the other hand, mimic the finding of the conjoint analysis (young and older adults did not differ with respect to the part-worth utility of ease of use).
When looking at the overall results of the Kano method, a bias toward attractive requirements is noteworthy. Differences were not as pronounced as they could have been, due to the aim to compare findings of the conjoint analysis and the Kano method. The wording was held constant. Now, while functional and dysfunctional questions are usually phrased as opposites, ‘knock-out-criteria’ are to be avoided in conjoint analysis (Backhaus, et al., 2008). Therefore, rather mild differences were chosen, that worked for the conjoint analysis but seem to have skewed the results of the Kano method in a positive direction. Possibly, the dysfunctional questions were formulated too positive to evoke dissatisfaction. If this was the case, then attractive and one-dimensional requirements are basically to be considered the same and cannot be distinguished from one another by using the Kano method as both increase with fulfillment and decrease only to more or less the point of origin (see Figure 5-1, p. 102). Ergonomics, the attribute with the most negative dysfunctional alternative also showed the highest CD score. The issue of a positive bias will be further elaborated in Section 5.5.
A strong relationship of prioritization rankings could be observed for Kano and conjoint results (see Figure 5-6, p. 123).
Do attributes differ with respect to their influence on user satisfaction? [RQ 4]
The findings of the current study were essentially consistent with those of study 1 where valence differences were found with respect to functionality, ergonomics, and quality as seen in Table 4-5, p. 84 and in Figure 4-6, p. 88 (usefulness and costs were not included in study 2). It was hypothesized that the over-proportional positive effect of functionality would result in an attractive requirement in the Kano model. The wording of this attribute with primary and secondary
5 STUDY 2 :: WEIGHTING ATTRIBUTES :: KANO AND CONJOINT ANALYSIS 128
functionalities, resulted in diverse responses of the participants. This makes an interpretation of valence effects difficult. Still, one third of the sample (35.6%) classified it as an attractive requirement, however, perhaps a better indication of its tendency to satisfaction fulfillment can be observed by its far distance to must-be requirements (see Figure 5-5) and low (-.11) score of CD (H4.1 partly confirmed).
Ergonomics and quality were not explicitly classified as must-be requirements. However, as mentioned, Kano classifications seemed to have been positively skewed. Keeping this in mind, it can be noted that from all classifications, ergonomics (31.7%) and quality (15.4%) were those with the highest rate of ‘must-be’ classifications and highest coefficients of dissatisfaction (H4.2 and H4.3 partly confirmed).
Limitations
As an example of interactive technology, a digital camera was evaluated. Consequently, results can only be generalized to digital cameras or, at most, to other tangible-digital devices with similar characteristics. Ergonomics, for instance, would be of lesser concern in the context of web design. However, with a rather small, mobile device as a digital camera, even young adults pay great attention to this attribute.
Participants of this study were well-educated and rated their physical and general well-being as rather positive. Also, all participants had used a digital camera before. Attribute importance might be different for user groups of a less fortunate education, without previous experience, or with an inferior physical or general state of well-being.
5.5 METHODOLOGICAL REFLECTIONS
5.5.1 STUDY DESIGN
Does the consideration of tied ranks in the Kano method improve the interpretability of the results? [RQ 5]
Classic Kano evaluation classifies an attribute to the requirement type with the majority of responses. In this study, this procedure was extended by considering multiple requirement types if frequencies did not differ significantly. Hence, instead of discarding all requirement types but the one of the mode statistic, only those were discarded that represented significantly fewer responses.
5 STUDY 2 :: WEIGHTING ATTRIBUTES :: KANO AND CONJOINT ANALYSIS 129
The consideration of intra- and inter-group proportions improved the interpretability of the results (see Table 5-3, p. 119):
Group differences became apparent that would have been covered otherwise [the likelihood of type II errors (β; false negative) was reduced] as seen in the case of quality (more older adults were ‘indifferent’ about this attribute than young adults).
Group similarities became apparent that would have been neglected otherwise [the likelihood of type I errors (α; false positive) was also reduced] as seen in the case of ergonomics.
The Kano method is useful in identifying different market segments (Berger, et al., 1993; Goncalves, 2000) but this has not been statistically embedded. Designers and marketers are likely to be interested to follow up on groups of comparable size and also on those that differ distinctly to investigate who wants what.
In the case of functionality, the different preferences were able to give an explanation as to why the attribute was not a significant predictor in the conjoint model. Although the classic categorization also revealed two comparably large groups of attractive and reversed requirements in the young sample, this was only because both groups were represented by precisely 17 respondents. If the distribution had differed even by only one response (e.g. 17 : 18), the similarity would have been overlooked in the classic categorization. Explicitly addressing the possibility of tied ranks discloses different preferences and patterns of influence on satisfaction.
The example of functionality further demonstrated that it is advisable to include ‘reversed’ (and ‘questionable’) responses in the analysis. Otherwise, a substantial group of users who have ‘reversed’ expectations in order to be satisfied with a product would have been missed, potentially leading to an inappropriate design.
Are the three methods of assessing attribute importance – conjoint analysis, Kano method, self-stated importance – equally recommendable in early product development? [RQ 6]
In theory, participants express their responses to fulfillment and absence of attributes in the Kano method. However, apart from perhaps secondary functionalities, the attributes considered here will never be truly absent. There will always be some sort of quality, some sort of ergonomics, some sort of aesthetics. Together with the rather positive descriptions corresponding to the two levels in the conjoint analysis, a high proportion of attractive requirements resulted, limiting the possibilities of differentiation. Coefficients of satisfaction and dissatisfaction, respectively, were somewhat more informative. The Kano method can be recommended, however, the opposing (‘functional’ and ‘dysfunctional’) questions should be preferably dichotomous opposites stating true presence or absence of an attribute and not variations on a continuous scale. Hence, the
5 STUDY 2 :: WEIGHTING ATTRIBUTES :: KANO AND CONJOINT ANALYSIS 130
method seems to be more appropriate for secondary and tertiary attributes than for primary, strategic attributes (Hauser & Clausing, 1988). Unfortunately, as attributes were not evaluated in full profile, i.e. not in relation to one another, but only in comparison within one attribute, the risk of low discrimination power remains.
Self-stated importance ratings were skewed by a main effect of age, which was caused by overall higher ratings of older adults. What inferences can be drawn from such scores? Should product developers design products for older adults that outperform the ones for young adults in almost every aspect? This is most likely not feasible, in particular not with limited resources. The question highlights the difficulties of interpretation that can arise. In general, when relying on independent attribute importance ratings, results should be interpreted with caution as these might show a tendency toward ceiling/floor effects or toward group differences due to an overall different answer behavior. Thus, a self-stated importance rating does not appear to be very useful in identifying intra- and inter-group preferences. In order to set priorities (e.g. in resource planning), an additional consideration of importance values that necessitate trade-offs is being recommended. In these cases equal resources are available for all groups that have to be split into individually preferred weights.
This claim can be supported by the detailed discrimination capabilities of a conjoint analysis, as outlined in Section 5.4, p. 125. Part-worth utilities and ‘relative importance’ values provide useful means of prioritization, also when comparing different user groups as these take trade-offs into account. One limitation of conjoint analysis as an indirect assessment of attribute importance is its possibility of simplification strategies (Green & Srinivasan, 1978). Participants might overlook attributes in their overall rating, which cannot be fully ruled out afterwards. This was also observed in the present study. Direct assessments for each attribute (e.g. SSI and Kano) on the other hand ensure that participants consider all attributes (Sattler & Hensel-Börner, 2007).
As all methods have their unique advantages, a combination of methods is being proposed: The Kano method could precede a conjoint analysis in order to reduce the number of attributes included in the conjoint model. For example, indifferent requirements are less relevant in the design process as they hardly affect user satisfaction. Or if an attribute that is already on a high performing level, is classified as a must-be requirement, further improvement is not likely to coincide with an increase of satisfaction.
The two methods (Kano and conjoint) can complement one another (Zanger & Baier, 1998) as they assess similar constructs but from different angles. Conjoint analysis considers a selection of attributes in dependency of each other and computes the contribution of each attribute regarding a preference rating and the associated relative importance values for each predictor. The Kano method on the other hand, classifies the attributes independent of each other and evaluates the responses within an attribute. People respond differently and might form different market segments. This distinction was valuable for the present study to offer an explanation for the non-
5 STUDY 2 :: WEIGHTING ATTRIBUTES :: KANO AND CONJOINT ANALYSIS 131
significance of functionality found in the conjoint analysis and to further verify observed age differences.
Some authors advise the use of self-stated importance scores to weight the results of the Kano method (Berger, et al., 1993). Given the findings of this study, this can only be recommended when studying one user group. It seems more advisable to use the derived part-worth utilities (or ‘relative importance’ scores) of a conjoint analysis as weights because these will not be skewed by ceiling effects or main group differences (Zanger & Baier, 1998) (see also Figure 5-6).
5.5.2 EXPERIENCE & FEEDBACK
Full profile conjoint analysis can put a high burden on study participants (Backhaus, et al., 2008; Green, et al., 2001). In this case, the maximum of six attributes was considered. With 26 models to evaluate, 46 of 104 participants reported using simplification strategies by disregarding some attributes. It is possible that this would have been the same with fewer models and/or attributes. It is even possible that this mirrored their true behavior, as simplification strategies are also seen in real-life behavior (Huber, 1997). However, the necessity of simplification strategies due to an information overload and perhaps time pressure should be minimized (Green & Srinivasan, 1978). The risk of overlooking attributes increases, the more information participants are confronted with. Therefore, the recommendation to limit the material to a manageable amount can only be underlined from the experience of this study.
The one-to-one context in single sessions ensured that participants did not miss instructions, were kept motivated as instructions preceded each new survey block, and that missing data was reduced to a minimum as interim checks of questionnaire completeness could be done.
The structured procedure and thorough instructions were appreciated by the participants, in particular by the older adults who did not feel rushed or under pressure (see selection of feedback in Appendix A.3.3).
5.5.3 LIMITATIONS
Attribute specifications needed to be simplified and were considered to reflect primary attributes (Hauser & Clausing, 1988). Ease of use, for instance, is certainly much more than the skipped necessity of a familiarization period. Such simplifications are commonly used in research settings (e.g. Davis, 1989). However, in an industrial setting, secondary and tertiary attributes need to be considered in addition in order to make sound decisions in the final design.
The Kano Model of Satisfaction is affected by temporal dynamics (Jordan, 2000). As time passes, originally attractive requirements that pleasantly surprised the user might shift to must-be requirements that are being taken for granted. Such dynamics demand re-evaluations of classifications as these should not be seen as set in stone. This also opens the opportunity to
5 STUDY 2 :: WEIGHTING ATTRIBUTES :: KANO AND CONJOINT ANALYSIS 132
follow up on the process of adoption as the product or service is introduced to the market (Nilsson-Witell & Fundin, 2005).
Likelihood of usage relates to the field of technology adoption of interactive products as was the scope of this study. However, adoption does not necessarily imply acceptance, which relates to the extent or frequency of usage (Kollmann, 2004). It is the first step to use a product for the first time (adoption). However, in future studies, the issue of continued usage should be addressed additionally. For this, conjoint analysis could also be used, for example by changing the preference criterion ‘likelihood of usage’ to a continuous variable as ‘frequency of usage’ with corresponding anchors.
Another limitation of the study that needs to be mentioned is that the dependent variable was only a theoretically stated likelihood of usage. This criterion creates the possibility to prospectively test expectations of user groups at very early stages of product development, but the link between such a predicted usage probability and actual behavior remains to be verified. Objective observations of behavior (revealed preferences) might lead to different results than verbal assessment of subjective evaluations (stated preferences) (Sattler, 2006). Complementing studies with different assessment methods should validate the present findings.
Marketing studies regarding purchase intention have found a ‘hypothetical bias’ that demonstrates higher stated preference data than could be observed in real behavior (Völckner, 2005). It is possible that a hypothetical bias also affects the results regarding stated usage likelihood. An increased realism in study setup (actual purchase behavior) can correct the bias to some extent (Völckner, 2006). Völckner (2006) showed that it might already suffice to instruct participants that some participants (e.g. 10%) will have to buy the product afterwards, without telling who this will be. Other economic methods, such as auctions (Ben-Bassat, et al., 2006) or performance-based reimbursement (Ben-Bassat, et al., 2006) have been successfully used in HCI research. However, these methods have a pronounced focus on performance and therefore on instrumental attributes. More realistic methods that mimic the true appeal of using a product, thus including an open consideration of non-instrumental attributes, are needed.
5.5.4 PRACTICAL IMPLICATIONS
Conjoint Analysis
Conjoint analysis is generally used on a very detailed level of attributes. Here, a more abstract level has been applied that can be transferred to other products in future work. The method proved to provide important insights for the domain of human-computer interaction. Despite its low prevalence in HCI research, the technique can be recommended for research studies in this field.
5 STUDY 2 :: WEIGHTING ATTRIBUTES :: KANO AND CONJOINT ANALYSIS 133
Conjoint analysis is also a valuable source to derive priority weights for the practical design process. However, the effort involved for participants as well as for the researcher by creating and analyzing the study material would seem slightly disproportionate if the only aim of the analysis should be the specification of attribute weights. Furthermore, as seen in the case of functionality, the method strongly relied on the precise wording (or presentation format in general) of the attributes. It was prone to strong effects based on small details. Unfortunately, these effects only became apparent afterwards and could only be revealed through additional empirical methods such as the Kano method that tests the effects of each level variation separately.
As the task was somewhat fatiguing and susceptible to overlook attributes, the number of models and attributes included should be selected carefully.
In the next study (see Chapter 6), a more efficient and engaging method will be introduced to assess relative weights while assuring that all attributes are taken into account by using a direct assessment for each attribute.
Kano Method
While in this study, it was tried to keep the material used in the Kano and conjoint analyses as comparable as possible, in an industrial setting, functional and dysfunctional questions should be presented at more extreme ends of the respective spectrum. This however, is more applicable on a concrete level of secondary or tertiary attributes that can be truly absent (e.g. a specific function and not functionality per se).
The introduced extension of the analysis by taking multimodal distributions into consideration improved data interpretability. It also proved to be valuable in identifying market segments of comparable size but with different responses to attribute fulfillment.
Special attention should be paid to reversed requirements. These can point to different expectations of users than originally anticipated by the design team.
Self-Stated Importance
A direct, independent rating of importance for each attribute is very easy to implement, to instruct and to analyze. However, caution must be applied when comparing different groups, as the results might be biased by a general group difference in answer behavior. One alternative would be to have one group of experts rate the importance for different groups. Then again, this option overrules the advantages of a user-centered, participatory design approach.
Even if only one group is studied, simple ratings might still be an inferior way to weight attributes as, without the necessity of trade-offs, equal weights might be assigned, possibly even resulting in

5 STUDY 2 :: WEIGHTING ATTRIBUTES :: KANO AND CONJOINT ANALYSIS 134
ceiling/floor effects. It seems more advisable to collect data from multi-attribute ratings in order to differentiate the relative contribution of each attribute.
Nonetheless, direct ratings do provide additional information. Perhaps they might serve as a screening criterion of attributes, upon which only the ones with the highest ratings will be included in further multi-attribute analyses. As this kind of data is easy and quick to assess, it can be included in surveys but should not be the only source of information.
6 STUDY 3 :: WEIGHTING ATTRIBUTES :: COLORING THE BLACK BOX
6.1 BACKGROUND
This study was motivated by three aims. Firstly, a new method was introduced that combined the opportunity to express attribute importance directly and considering trade-offs already during assessment. Secondly, age differences from the previous studies should be re-confirmed and, lastly, it was of interest whether attribute importance differs between product classes.
In the preceding study, attributes that had been identified in the first study where weighted in importance. Apart from separate, direct ratings [self-stated importance (Berger, et al., 1993)] and a classification using the Kano method (Kano, et al., 1984; Mikulić, 2007), a full-profile conjoint analysis (Green, et al., 2001) was applied to assess the relative weight of each attribute. For this purpose, two levels with contrasting attribute fulfillment were chosen.
Age differences were found with respect to ergonomics, quality, and aesthetics. In addition, the variation of levels was found to have a greater impact on the likelihood of usage for older adults with respect to ease of use. It was one aim of the present study to verify these age differences. However, it was not a one-to-one replication. For one, wording of the attribute functionality led to opposing preferences and consequently impeded the attribute’s predictive strength. Thus, a different investigation of relative importance weights became necessary, in order to correct for this conflicting attribute operationalization. Furthermore, methodological improvement potentials were detected and were consequently addressed in the following.
Difficulties with independent ratings (SSI and Kano) of attribute importance by different groups have been demonstrated: while a group response bias was observed with respect to SSI (older adults rated attributes generally higher), a response bias in terms of an overly high proportion of ‘attractive’ classifications might have skewed the results of the Kano method. Due to these observations, an indirect, post-hoc computation of relative importance scores based on independent ratings as widely applied in practice (Gustafsson & Johnson, 2004) seems critical (see p. 59 for previous discussion). It is argued that a relative importance measurement should be pursued already in the assessment itself. A full-profile conjoint analysis fulfills this demand of setting attributes into relation to other attributes during assessment. However, in early product
6 STUDY 3 :: WEIGHTING ATTRIBUTES :: COLORING THE BLACK BOX 136
development, simple ratings are often preferred nonetheless, presumably due to the complexity of conjoint analyses and the expertise necessary for administration (MAP, 2000; Schmidt, 1996).
Furthermore, empirical studies offer mixed results regarding the superiority of conjoint analysis in comparison to direct measurements, i.e. self-explicated method (Sattler & Hensel-Börner, 2007; Srinivasan, 1988). In fact, findings indicate that a direct measurement of preferences should be considered as an alternative to the indirect measurement of conjoint analysis because of “advantages in terms of ease, time effort and costs” (Sattler & Hensel-Börner, 2007).
A new method was introduced in this study to enable a direct and relative (considering trade-offs) rating (compare Table 2-2, p. 58). For the purpose of attribute importance estimation, it tried to be as efficient and easy to apply as the direct separate ratings, but considering all attributes jointly as the conjoint analysis does. The motivation for this work was manifold and exceeded the points raised by Sattler and Hensel-Börner (2007):
1. As participants have to make value (importance) judgments, a design approach in terms of ‘design for users with users’ appears most appropriate (Eason, 1995). This, in turn, entails a direct rating by participants. In conjoint analysis an overall rating is de-composed afterwards into its part-worth utilities. Thus, participants provide attribute ratings indirectly. Regarding users as active co-creators (Sanders, 2008), who express their priorities directly as accomplished with the method presented in this study enhances the participatory focus of a user-centered design approach.
2. However, as demonstrated previously, direct ratings like the self-stated importance scales are sub-optimal when comparing different groups because these might be skewed by a response bias (main group effects) as seen in study 2. Furthermore, in study 1, separate direct ratings across different attributes were very similar, probably because participants did not need to make trade-offs, as they would have to in a relative comparison. Hence, a direct rating is aimed for that assesses relative importance weights across all attributes.
3. The so-called ‘constant sum scale’ (Aaker, et al., 1995) known from market research fulfills the criterion of (1) directness as well as of (2) relativity (see Table 2-2, p. 58). Respondents document their relative preferences by dividing 100 points among a number of attributes. This arithmetic allocation of weights has the advantage of being ratio-scaled, thus allowing a direct comparison of weights. However, the continuous necessity of updating the numeric values in working memory or even on paper can be a potential source of errors (Kumar, et al., 2002), which amplifies as the number of attributes increases. Especially older adults are likely to encounter problems with the strain on working memory (Salthouse & Babcock, 1991). Furthermore, a numeric value gives the impression of being a precise measurement (e.g. should it be 37 : 63 or rather 36 : 64?). This impression is misleading as value judgments are mere estimates. It therefore seems desirable to distance the participant from exact numeric values.
6 STUDY 3 :: WEIGHTING ATTRIBUTES :: COLORING THE BLACK BOX 137
4. Thus, participants should be involved actively while prioritizing the different attributes. In other words, the act of prioritizing should give participants an opportunity to reflect upon their priorities, however, without the necessity of arithmetic operations. Consequently, the aim is rather a bottom-up reflection and creation than a top-down statement.
5. Physical representatives can be helpful means for such an approach and have been applied successfully in participatory design methods. For example, card sorting is a powerful tool to uncover information architecture from the user’s perspective (participants group and arrange cards according to their belief of a logical structure; data is analyzed for patterns) (Maguire, 2001). In participatory design methods, physical artifacts are commonly used as “thinking tools” (Sanders, 2008).
6. The method should further be easier in terms of data analysis and research design than conjoint analysis in order to make it also applicable for design teams who have less expertise than might be necessary for conjoint analysis or who might not be in possession of the needed software. An efficient approach is also important to avoid delays in the product development process.
To make a long story short, these thoughts resulted in the following method: the intangible 100 points (100%) of the constant sum scale were broken down in tangible bits and pieces. Real (physical) domino bricks were provided to allocate relative weights. Hence, it was not the product’s form that was being crafted, but it’s content. Different attributes were assigned different colors. Participants literally colored a black box with content – physical representatives of attributes (see Figure 6-1, p. 145). The resulting colored boxes can also be seen as simulations (Roozenburg & Eekels, 1995), however, this time created by the users themselves. The task was basically a construction task – constructing a subjectively ‘ideal’ combination of attribute weights, given limited resources and thereby considering trade-offs.
The same six attributes (functionality, ease of use, ergonomics, quality, aesthetics, emotional involvement) as addressed in study 2 were included. Again, usage and not purchase situations were of interest. As participants were recruited from almost the same age ranges (young adults 19-30 years, older adults 65-74) a comparison of age-related differences in attribute importance was possible across studies 2 and 3.
To widen the scope of interactive technologies again beyond a digital camera, additional products were included since the task was not as strenuous for the participants as the conjoint analysis previously. Elliott et al. (2003) showed that relative attribute importance varies across different products. Unfortunately, the authors did not vary product types systematically: their selected products were examples of use cases (e.g. medical implant device, railway infrastructure).
In contrast, consumer research literature offers a systematic distinction of product class: hedonic vs. utilitarian products (Hirschman & Holbrook, 1982). This classification results from the differing consumption motivations that these products aim to satisfy by providing the according value to the user. “While extrinsic motivation influences behavior due to the reinforcement value of outcomes,
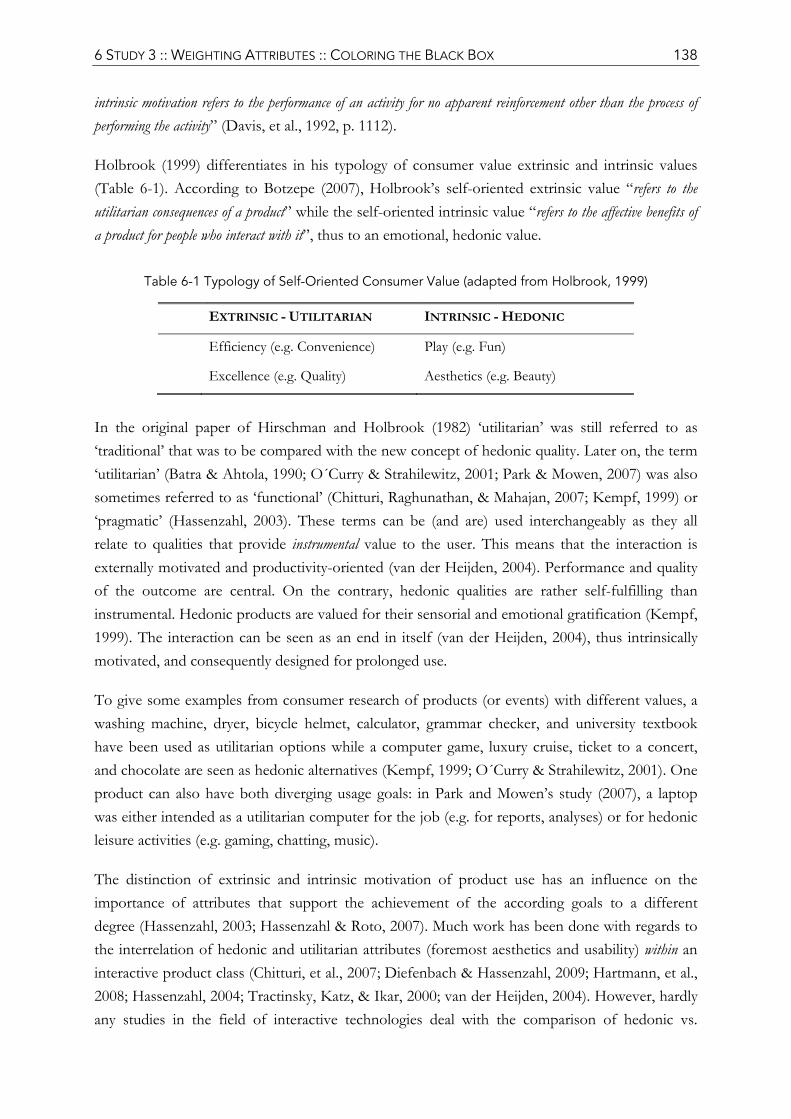
6 STUDY 3 :: WEIGHTING ATTRIBUTES :: COLORING THE BLACK BOX 138
intrinsic motivation refers to the performance of an activity for no apparent reinforcement other than the process of performing the activity” (Davis, et al., 1992, p. 1112).
Holbrook (1999) differentiates in his typology of consumer value extrinsic and intrinsic values (Table 6-1). According to Botzepe (2007), Holbrook’s self-oriented extrinsic value “refers to the utilitarian consequences of a product” while the self-oriented intrinsic value “refers to the affective benefits of a product for people who interact with it”, thus to an emotional, hedonic value.
Table 6-1 Typology of Self-Oriented Consumer Value (adapted from Holbrook, 1999)
EXTRINSIC - UTILITARIAN INTRINSIC - HEDONIC
Efficiency (e.g. Convenience) Play (e.g. Fun)
Excellence (e.g. Quality) Aesthetics (e.g. Beauty)
In the original paper of Hirschman and Holbrook (1982) ‘utilitarian’ was still referred to as ‘traditional’ that was to be compared with the new concept of hedonic quality. Later on, the term ‘utilitarian’ (Batra & Ahtola, 1990; O´Curry & Strahilewitz, 2001; Park & Mowen, 2007) was also sometimes referred to as ‘functional’ (Chitturi, Raghunathan, & Mahajan, 2007; Kempf, 1999) or ‘pragmatic’ (Hassenzahl, 2003). These terms can be (and are) used interchangeably as they all relate to qualities that provide instrumental value to the user. This means that the interaction is externally motivated and productivity-oriented (van der Heijden, 2004). Performance and quality of the outcome are central. On the contrary, hedonic qualities are rather self-fulfilling than instrumental. Hedonic products are valued for their sensorial and emotional gratification (Kempf, 1999). The interaction can be seen as an end in itself (van der Heijden, 2004), thus intrinsically motivated, and consequently designed for prolonged use.
To give some examples from consumer research of products (or events) with different values, a washing machine, dryer, bicycle helmet, calculator, grammar checker, and university textbook have been used as utilitarian options while a computer game, luxury cruise, ticket to a concert, and chocolate are seen as hedonic alternatives (Kempf, 1999; O´Curry & Strahilewitz, 2001). One product can also have both diverging usage goals: in Park and Mowen’s study (2007), a laptop was either intended as a utilitarian computer for the job (e.g. for reports, analyses) or for hedonic leisure activities (e.g. gaming, chatting, music).
The distinction of extrinsic and intrinsic motivation of product use has an influence on the importance of attributes that support the achievement of the according goals to a different degree (Hassenzahl, 2003; Hassenzahl & Roto, 2007). Much work has been done with regards to the interrelation of hedonic and utilitarian attributes (foremost aesthetics and usability) within an interactive product class (Chitturi, et al., 2007; Diefenbach & Hassenzahl, 2009; Hartmann, et al., 2008; Hassenzahl, 2004; Tractinsky, Katz, & Ikar, 2000; van der Heijden, 2004). However, hardly any studies in the field of interactive technologies deal with the comparison of hedonic vs.
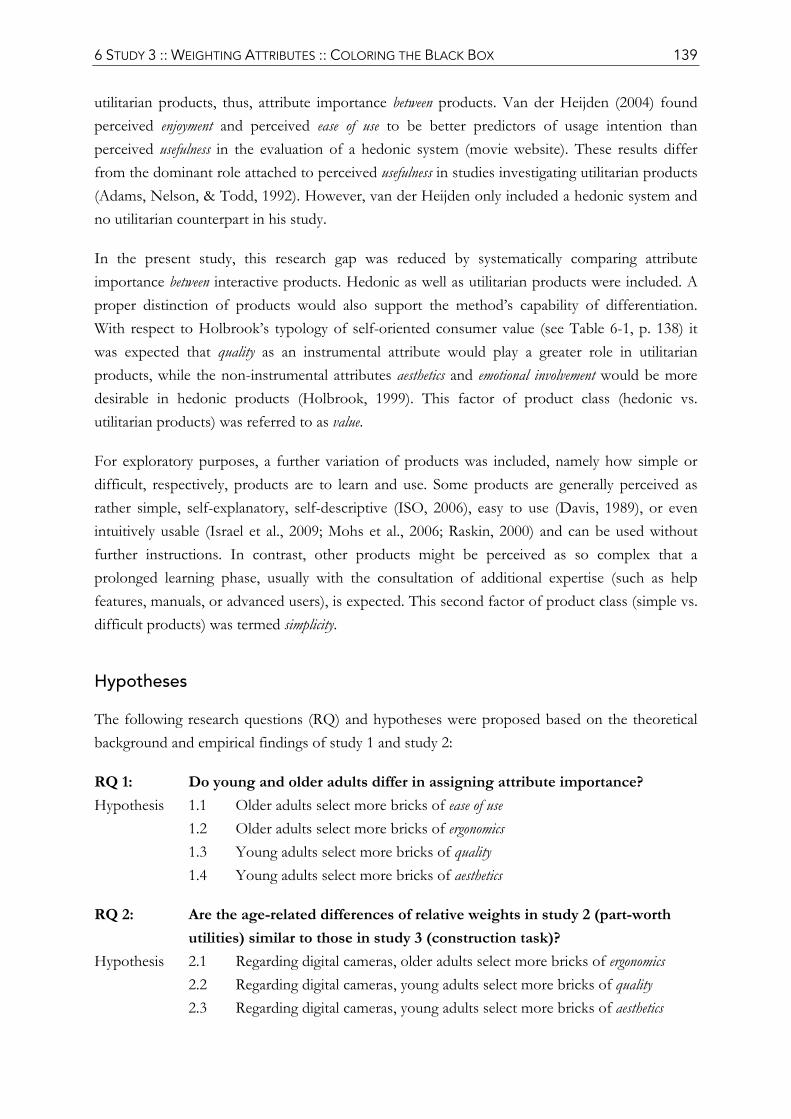
6 STUDY 3 :: WEIGHTING ATTRIBUTES :: COLORING THE BLACK BOX 139
utilitarian products, thus, attribute importance between products. Van der Heijden (2004) found perceived enjoyment and perceived ease of use to be better predictors of usage intention than perceived usefulness in the evaluation of a hedonic system (movie website). These results differ from the dominant role attached to perceived usefulness in studies investigating utilitarian products (Adams, Nelson, & Todd, 1992). However, van der Heijden only included a hedonic system and no utilitarian counterpart in his study.
In the present study, this research gap was reduced by systematically comparing attribute importance between interactive products. Hedonic as well as utilitarian products were included. A proper distinction of products would also support the method’s capability of differentiation. With respect to Holbrook’s typology of self-oriented consumer value (see Table 6-1, p. 138) it was expected that quality as an instrumental attribute would play a greater role in utilitarian products, while the non-instrumental attributes aesthetics and emotional involvement would be more desirable in hedonic products (Holbrook, 1999). This factor of product class (hedonic vs. utilitarian products) was referred to as value.
For exploratory purposes, a further variation of products was included, namely how simple or difficult, respectively, products are to learn and use. Some products are generally perceived as rather simple, self-explanatory, self-descriptive (ISO, 2006), easy to use (Davis, 1989), or even intuitively usable (Israel et al., 2009; Mohs et al., 2006; Raskin, 2000) and can be used without further instructions. In contrast, other products might be perceived as so complex that a prolonged learning phase, usually with the consultation of additional expertise (such as help features, manuals, or advanced users), is expected. This second factor of product class (simple vs. difficult products) was termed simplicity.
Hypotheses
The following research questions (RQ) and hypotheses were proposed based on the theoretical background and empirical findings of study 1 and study 2:
RQ 1: Do young and older adults differ in assigning attribute importance? Hypothesis 1.1 Older adults select more bricks of ease of use 1.2 Older adults select more bricks of ergonomics 1.3 Young adults select more bricks of quality 1.4 Young adults select more bricks of aesthetics
RQ 2: Are the age-related differences of relative weights in study 2 (part-worth utilities) similar to those in study 3 (construction task)? Hypothesis 2.1 Regarding digital cameras, older adults select more bricks of ergonomics 2.2 Regarding digital cameras, young adults select more bricks of quality 2.3 Regarding digital cameras, young adults select more bricks of aesthetics
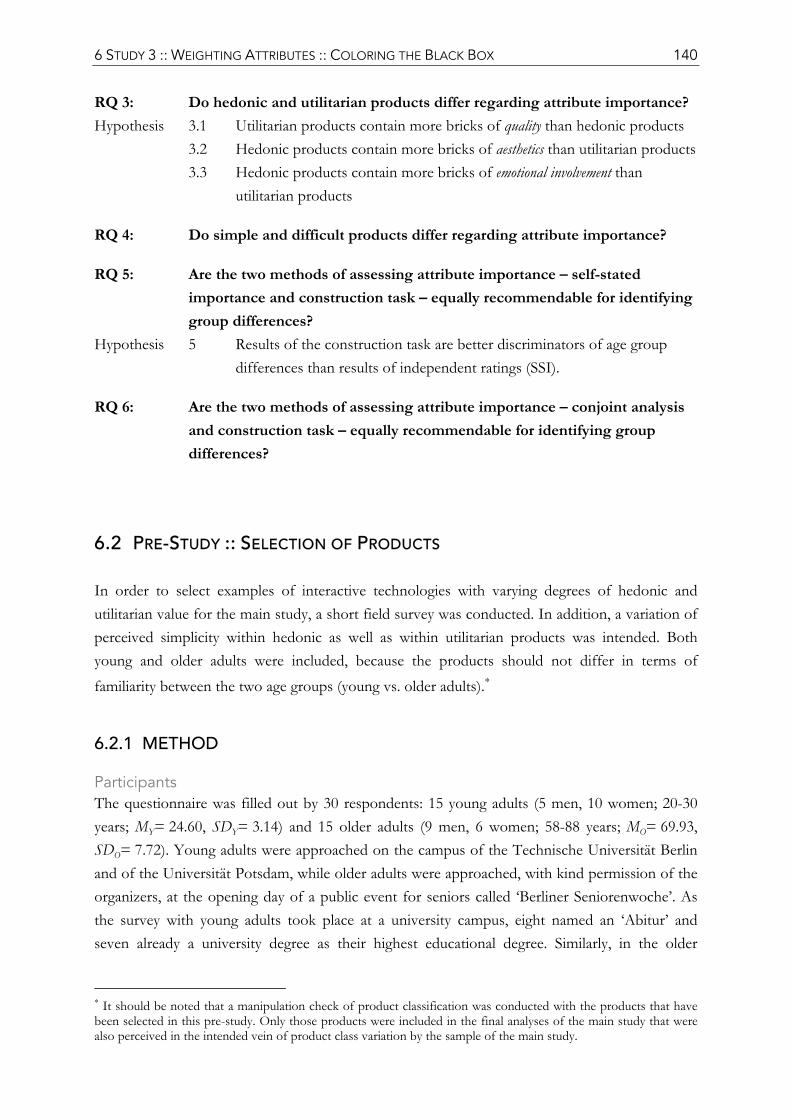
6 STUDY 3 :: WEIGHTING ATTRIBUTES :: COLORING THE BLACK BOX 140
RQ 3: Do hedonic and utilitarian products differ regarding attribute importance? Hypothesis 3.1 Utilitarian products contain more bricks of quality than hedonic products 3.2 Hedonic products contain more bricks of aesthetics than utilitarian products 3.3 Hedonic products contain more bricks of emotional involvement than utilitarian products
RQ 4: Do simple and difficult products differ regarding attribute importance?
RQ 5: Are the two methods of assessing attribute importance – self-stated importance and construction task – equally recommendable for identifying group differences? Hypothesis 5 Results of the construction task are better discriminators of age group differences than results of independent ratings (SSI).
RQ 6: Are the two methods of assessing attribute importance – conjoint analysis and construction task – equally recommendable for identifying group differences?
6.2 PRE-STUDY :: SELECTION OF PRODUCTS
In order to select examples of interactive technologies with varying degrees of hedonic and utilitarian value for the main study, a short field survey was conducted. In addition, a variation of perceived simplicity within hedonic as well as within utilitarian products was intended. Both young and older adults were included, because the products should not differ in terms of familiarity between the two age groups (young vs. older adults).∗
6.2.1 METHOD
Participants The questionnaire was filled out by 30 respondents: 15 young adults (5 men, 10 women; 20-30 years; MY= 24.60, SDY= 3.14) and 15 older adults (9 men, 6 women; 58-88 years; MO= 69.93, SDO= 7.72). Young adults were approached on the campus of the Technische Universität Berlin and of the Universität Potsdam, while older adults were approached, with kind permission of the organizers, at the opening day of a public event for seniors called ‘Berliner Seniorenwoche’. As the survey with young adults took place at a university campus, eight named an ‘Abitur’ and seven already a university degree as their highest educational degree. Similarly, in the older
∗ It should be noted that a manipulation check of product classification was conducted with the products that have been selected in this pre-study. Only those products were included in the final analyses of the main study that were also perceived in the intended vein of product class variation by the sample of the main study.
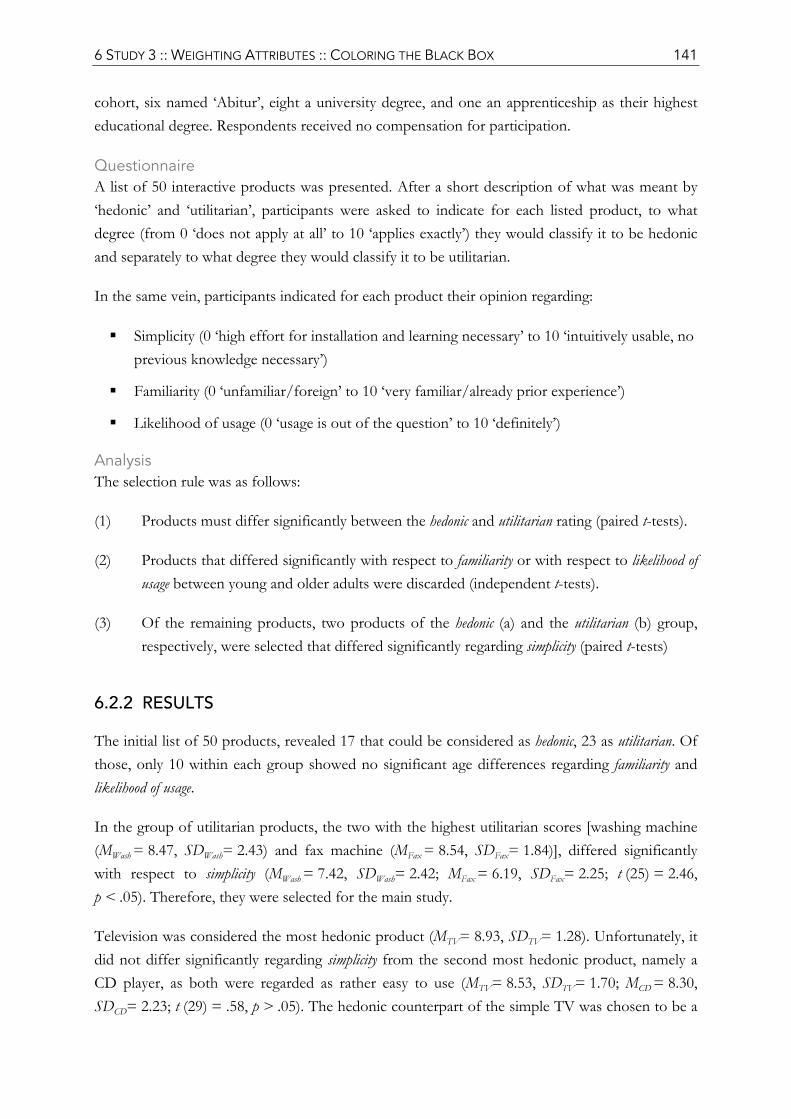
6 STUDY 3 :: WEIGHTING ATTRIBUTES :: COLORING THE BLACK BOX 141
cohort, six named ‘Abitur’, eight a university degree, and one an apprenticeship as their highest educational degree. Respondents received no compensation for participation.
Questionnaire A list of 50 interactive products was presented. After a short description of what was meant by ‘hedonic’ and ‘utilitarian’, participants were asked to indicate for each listed product, to what degree (from 0 ‘does not apply at all’ to 10 ‘applies exactly’) they would classify it to be hedonic and separately to what degree they would classify it to be utilitarian.
In the same vein, participants indicated for each product their opinion regarding:
Simplicity (0 ‘high effort for installation and learning necessary’ to 10 ‘intuitively usable, no previous knowledge necessary’)
Familiarity (0 ‘unfamiliar/foreign’ to 10 ‘very familiar/already prior experience’)
Likelihood of usage (0 ‘usage is out of the question’ to 10 ‘definitely’)
Analysis The selection rule was as follows:
(1) Products must differ significantly between the hedonic and utilitarian rating (paired t-tests).
(2) Products that differed significantly with respect to familiarity or with respect to likelihood of usage between young and older adults were discarded (independent t-tests).
(3) Of the remaining products, two products of the hedonic (a) and the utilitarian (b) group, respectively, were selected that differed significantly regarding simplicity (paired t-tests)
6.2.2 RESULTS
The initial list of 50 products, revealed 17 that could be considered as hedonic, 23 as utilitarian. Of those, only 10 within each group showed no significant age differences regarding familiarity and likelihood of usage.
In the group of utilitarian products, the two with the highest utilitarian scores [washing machine (MWash = 8.47, SDWash= 2.43) and fax machine (MFax = 8.54, SDFax= 1.84)], differed significantly with respect to simplicity (MWash = 7.42, SDWash= 2.42; MFax = 6.19, SDFax= 2.25; t (25) = 2.46, p < .05). Therefore, they were selected for the main study.
Television was considered the most hedonic product (MTV= 8.93, SDTV= 1.28). Unfortunately, it did not differ significantly regarding simplicity from the second most hedonic product, namely a CD player, as both were regarded as rather easy to use (MTV= 8.53, SDTV= 1.70; MCD = 8.30, SDCD= 2.23; t (29) = .58, p > .05). The hedonic counterpart of the simple TV was chosen to be a
6 STUDY 3 :: WEIGHTING ATTRIBUTES :: COLORING THE BLACK BOX 142
video recorder, which was perceived as significantly more difficult to learn and use (MVideo = 6.67, SDVideo= 2.57; t (26) = 4.03, p < .001).
It was thought that a digital camera would be seen as a hedonic product. However, this could not be verified statistically [no difference between hedonic and utilitarian ratings were found (MHed = 6.87, SDHed= 2.84; MUtil = 6.17, SDUtil= 3.23; t (29) = .83, p > .05)]. Nonetheless, a digital camera was included in the main study in order to compare results with those of study 2.
To conclude, four products were selected for the 2 value (hedonic vs. utilitarian) x 2 simplicity (simple vs. difficult) design of the main study. These were a television (hedonic, simple), a video recorder (hedonic, difficult), a washing machine (utilitarian, simple), and a fax machine (utilitarian, difficult). A digital camera was additionally included for comparison purposes with study 2.
6.3 METHOD [MAIN STUDY]
6.3.1 PARTICIPANTS
The sample of the main study included 60 participants (30 young and 30 older adults; gender balanced). Participants of the young age group were aged between 19 and 30 years (MY = 24.87, SDY= 3.40). The age of the older group ranged from 65 to 74 years (MO= 68.77, SDO= 3.03). All but one older participant were of German nationality. The older man had an Austrian nationality and had been living in Germany for 40 years. Again, the sample was fairly well-educated with 75.0% naming a university degree (36.7%) or ‘Abitur’ secondary school qualification (38.3%) as their highest educational degree. Older adults perceived their current physical well-being as rather well, however, in comparison to young adults as less favorable (MY = 4.13, SDY= .68; MO= 3.70, SDO= .54; t (58) = 2.74, p < .01; 5-point rating scale with 5 = ‘very well’). Accordingly, more older adults had a clinically diagnosed health issue (8 young, 16 older; χ2(1) = 4.44, p < .05). Nonetheless, the two age groups did not differ regarding their perceived general well-being (MY = 4.00, SDY= .64; MO= 3.87, SDO= .57; t (58) = .85, p > .05).
Young participants were recruited from an online research volunteer pool, administered by the Institute of Psychology of the Humboldt Universität zu Berlin. Older participants were recruited from an advertisement in a weekly newspaper that is distributed in the entire Berlin area. Young participants received a compensation of € 8/hour, older participants of € 10/hour. Session duration was on average two hours. None of the participants were involved in study 1, study 2, or the pre-study.
6 STUDY 3 :: WEIGHTING ATTRIBUTES :: COLORING THE BLACK BOX 143
6.3.2 MATERIAL
Additional Measures
Questionnaire on Technology Affinity TA-EG As in studies 1 and 2, participants filled out the questionnaire TA-EG on technology affinity (Karrer, et al., 2009) with the four subscales (1) enthusiasm for electronic devices, (2) self-perceived competence in using electronic devices, (3) perceived positive and (4) perceived negative consequences regarding the use of electronic devices. Items are presented as statements and responses given on 5-point Likert scales (see also p. 72).
Achievement Motives Scale Furthermore, as in study 2, the 10-Item Achievement Motives Scale was included, assessing hope of success and fear of failure with 5 items each on 4-point Likert scales (Lang & Fries, 2006).
Background Information
Manipulation Check of Product Classification In order to ensure the product classification according to the 2 (value) x 2 (simplicity) design, participants of the main study also classified the five previously selected products: television, video recorder, washing machine, fax machine, and digital camera. Similar to the questionnaire of the pre-study, it was indicated to what extent (on 10-point rating scales from 1 ‘does not apply at all’ to 10 ‘applies exactly’) a product was perceived to be hedonic and to what extent utilitarian. It was emphasized that the two scores were to be rated independently (thus, did not need to add to 10). Again, descriptions and keywords were provided; however, the terms ‘hedonic’ and ‘utilitarian’ were never mentioned. This was one consequence of the pre-study. Respondents in the pre-study, in particular of the older group, reacted negatively to the use of unfamiliar expressions (e.g. some said that they were “not intelligent enough” to participate because they did not know the terms). As a result, in the main study it was only referred to ‘Type A’ (hedonic) and ‘Type B’ (utilitarian) products.
Hedonic products: focus is on product and interaction (and less on the outcome); invite for prolonged usage; usage is not externally motivated but self-determined; keywords: fun, pleasure, entertainment, personal value, satisfaction
Utilitarian products: are meant to reach a goal efficiently and effectively; usage is motivated primarily externally keywords: productivity, outcome-oriented, usefulness, performance-oriented
Additionally, participants indicated how simple they thought it was for them to learn the usage of the device (from 1 ‘long phase of learning (including help features)’ to 10 ‘intuitive, without
6 STUDY 3 :: WEIGHTING ATTRIBUTES :: COLORING THE BLACK BOX 144
previous knowledge’). This and the aforementioned measure determined the final product selection.
Familiarity was reported by allocating a numeric value between 1 (no connection/unfamiliar/ foreign) and 10 (very familiar/already prior experience).
In order to compare general perceived usefulness of the device to that of the self-constructed version later on, at this point, a score of baseline (personal) usefulness was asked for (from 1 ‘no usefulness recognizable’ to 10 ‘personally useful, perhaps even necessary’).
Prior Experience For each product separately, participants indicated how frequently they used the device [(1) never, (2) rarely, (3) occasionally, (4) often] and whether they perceived themselves as a beginner, advanced, or professional user. Upon this measure of expertise, participants marked on an 11-point rating scale (from 0% to 100% in increments of 10%) – as used in study 2 – their baseline likelihood of usage. Only for the digital camera, an additional rating regarding the likelihood of using a digital camera for hobby photography was included (for comparison purposes with study 2).
Importance Indices
Self-Stated Importance On a scale from 1 (not important at all) to 10 (very important), participants marked how important they perceived each of the six attributes (functionality, ease of use, (physical) ergonomics, quality, aesthetics, emotional involvement) to be. This was assessed for each product separately. The self-stated importance scale is an ‘absolute’ (instead of ‘relative’) importance index. Attributes are rated independently of each other.
Priorities It was required that the six attributes were put into relation to one another by naming the one most important attribute, the attribute that shows the greatest need for optimization and the attribute that one was most willing to accept reduced fulfillment as a trade-off for optimizing other attributes. Such prioritizations are ordinal ranks. All three scores are product-specific and were therefore assessed for each product separately.
Construction Task
Colored, plastic domino bricks were chosen as units for the construction task. LEGO bricks were also considered, but it turned out that it is quite difficult to disassemble them once put together, which is potentially frustrating especially for older adults with fine motor deficiencies (Chaparro, et al., 2000; Ketcham & Stelmach, 2004; Mitzner, et al., 2006; Vercruyssen, 1997). Also, the arrangement of domino bricks in the black box proved to be much more time efficient.
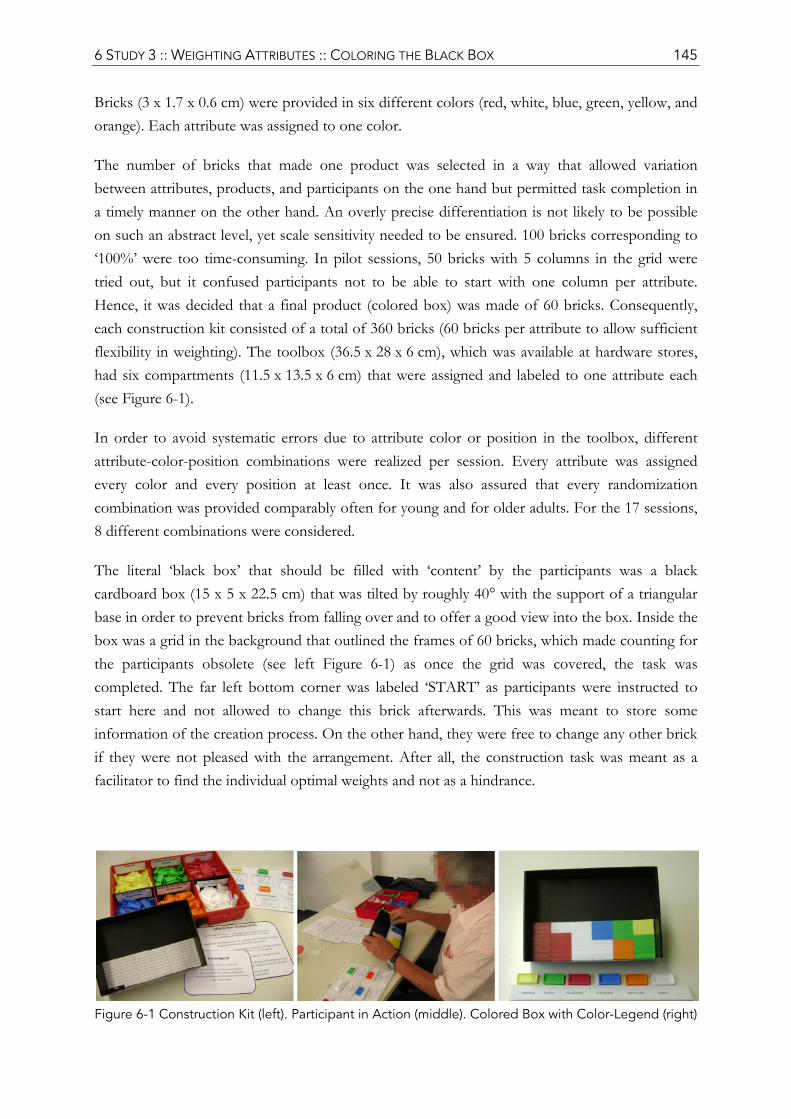
6 STUDY 3 :: WEIGHTING ATTRIBUTES :: COLORING THE BLACK BOX 145
Bricks (3 x 1.7 x 0.6 cm) were provided in six different colors (red, white, blue, green, yellow, and orange). Each attribute was assigned to one color.
The number of bricks that made one product was selected in a way that allowed variation between attributes, products, and participants on the one hand but permitted task completion in a timely manner on the other hand. An overly precise differentiation is not likely to be possible on such an abstract level, yet scale sensitivity needed to be ensured. 100 bricks corresponding to ‘100%’ were too time-consuming. In pilot sessions, 50 bricks with 5 columns in the grid were tried out, but it confused participants not to be able to start with one column per attribute. Hence, it was decided that a final product (colored box) was made of 60 bricks. Consequently, each construction kit consisted of a total of 360 bricks (60 bricks per attribute to allow sufficient flexibility in weighting). The toolbox (36.5 x 28 x 6 cm), which was available at hardware stores, had six compartments (11.5 x 13.5 x 6 cm) that were assigned and labeled to one attribute each (see Figure 6-1).
In order to avoid systematic errors due to attribute color or position in the toolbox, different attribute-color-position combinations were realized per session. Every attribute was assigned every color and every position at least once. It was also assured that every randomization combination was provided comparably often for young and for older adults. For the 17 sessions, 8 different combinations were considered.
The literal ‘black box’ that should be filled with ‘content’ by the participants was a black cardboard box (15 x 5 x 22.5 cm) that was tilted by roughly 40° with the support of a triangular base in order to prevent bricks from falling over and to offer a good view into the box. Inside the box was a grid in the background that outlined the frames of 60 bricks, which made counting for the participants obsolete (see left Figure 6-1) as once the grid was covered, the task was completed. The far left bottom corner was labeled ‘START’ as participants were instructed to start here and not allowed to change this brick afterwards. This was meant to store some information of the creation process. On the other hand, they were free to change any other brick if they were not pleased with the arrangement. After all, the construction task was meant as a facilitator to find the individual optimal weights and not as a hindrance.
Figure 6-1 Construction Kit (left). Participant in Action (middle). Colored Box with Color-Legend (right)
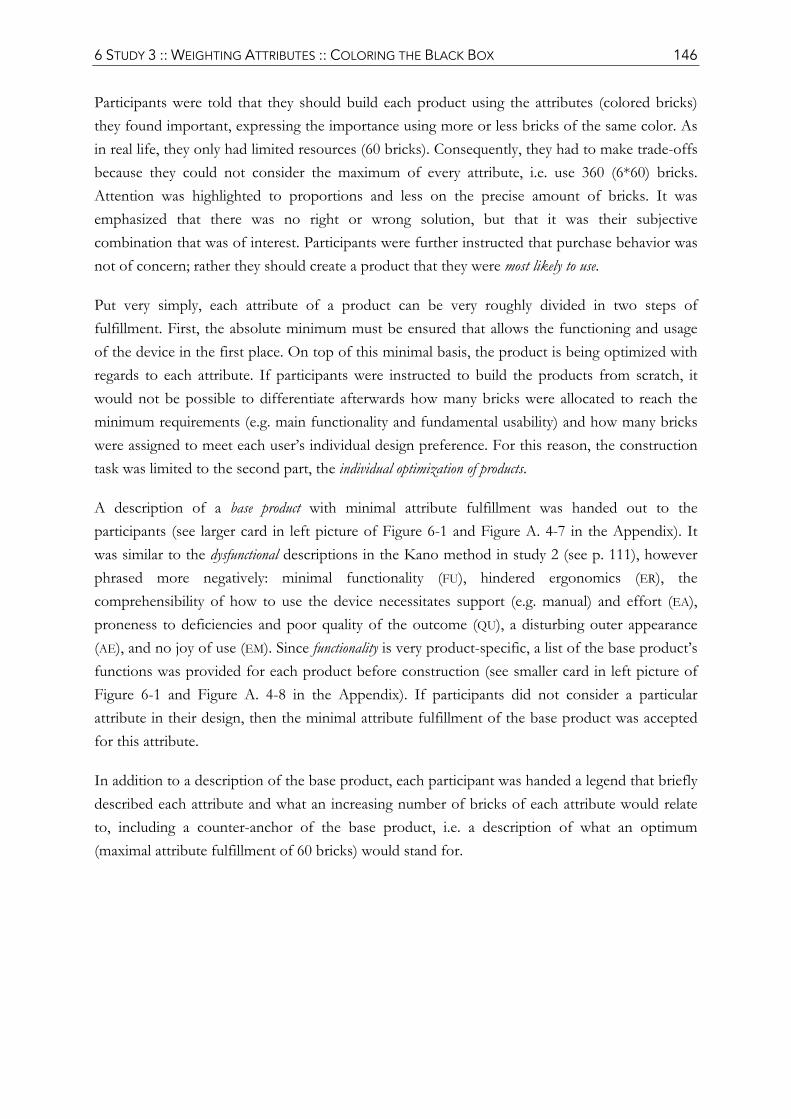
6 STUDY 3 :: WEIGHTING ATTRIBUTES :: COLORING THE BLACK BOX 146
Participants were told that they should build each product using the attributes (colored bricks) they found important, expressing the importance using more or less bricks of the same color. As in real life, they only had limited resources (60 bricks). Consequently, they had to make trade-offs because they could not consider the maximum of every attribute, i.e. use 360 (6*60) bricks. Attention was highlighted to proportions and less on the precise amount of bricks. It was emphasized that there was no right or wrong solution, but that it was their subjective combination that was of interest. Participants were further instructed that purchase behavior was not of concern; rather they should create a product that they were most likely to use.
Put very simply, each attribute of a product can be very roughly divided in two steps of fulfillment. First, the absolute minimum must be ensured that allows the functioning and usage of the device in the first place. On top of this minimal basis, the product is being optimized with regards to each attribute. If participants were instructed to build the products from scratch, it would not be possible to differentiate afterwards how many bricks were allocated to reach the minimum requirements (e.g. main functionality and fundamental usability) and how many bricks were assigned to meet each user’s individual design preference. For this reason, the construction task was limited to the second part, the individual optimization of products.
A description of a base product with minimal attribute fulfillment was handed out to the participants (see larger card in left picture of Figure 6-1 and Figure A. 4-7 in the Appendix). It was similar to the dysfunctional descriptions in the Kano method in study 2 (see p. 111), however phrased more negatively: minimal functionality (FU), hindered ergonomics (ER), the comprehensibility of how to use the device necessitates support (e.g. manual) and effort (EA), proneness to deficiencies and poor quality of the outcome (QU), a disturbing outer appearance (AE), and no joy of use (EM). Since functionality is very product-specific, a list of the base product’s functions was provided for each product before construction (see smaller card in left picture of Figure 6-1 and Figure A. 4-8 in the Appendix). If participants did not consider a particular attribute in their design, then the minimal attribute fulfillment of the base product was accepted for this attribute.
In addition to a description of the base product, each participant was handed a legend that briefly described each attribute and what an increasing number of bricks of each attribute would relate to, including a counter-anchor of the base product, i.e. a description of what an optimum (maximal attribute fulfillment of 60 bricks) would stand for.
6 STUDY 3 :: WEIGHTING ATTRIBUTES :: COLORING THE BLACK BOX 147
Control Variables
Due to the novelty of assessing relative weights by means of physically constructing products with desirable attribute-combinations, a number of control variables were included.
For instance, after each construction trial, a post-questionnaire was handed out, asking how confident participants were that they chose an ‘ideal’ attribute-combination (5-point scale from ‘not confident’ to ‘very confident’). Also, in order to test whether the self-constructed products were perceived as more desirable than baseline measures (scores referring to an average perception of the product class), the same scales of personal usefulness (1-10) and of likelihood of usage (0-100% in increments of 10%) were re-assessed with reference to the self-constructed product. Finally, in an open question format, participants were asked why they would consider the product to be ‘ideal’ (given the limited resources).
After the construction task, some general statements with respect to evaluation of task demand
I was well able to cope with the task demand
I did not understand the task demand
I found it difficult to imagine the attributes
I found it difficult to put attributes into proportion
I had fun constructing ideal products
and strategic behavior
I calculated how many bricks I will need per attribute
I oriented myself by the visual impression
Color coding influenced brick selection
The arrangement within the toolbox influenced brick selection
were listed. The degree of agreement was indicated by marks on 5-point Likert scales from ‘does not apply at all’ to ‘applies exactly’.
Without prior notice, participants were asked what determined the selection of the starting brick. Five answer options were provided: (1) position in toolbox, (2) color of brick, (3) always the same attribute, (4) always the most important attribute, (5) random.

6 STUDY 3 :: WEIGHTING ATTRIBUTES :: COLORING THE BLACK BOX 148
6.3.3 PROCEDURE
Two to five participants (M= 3.65, SD= .79) were present per session, however, each participant was working individually (see Figure 6-2∗). Everyone had their own desk with own material and it was not possible to see what the others were working on. Tables were positioned apart from one another, all facing to the front. Furthermore, each participant had an individual order of products for the construction task and for the importance indices. Participants per session were always of the same age group and of the same gender.
Figure 6-2 Room Setup (left). Individual Desk (middle). ‘End of Block’ Indicator (right).
As can be seen in Figure 6-3, one session was subdivided in seven blocks. Each block started with oral, PowerPoint-supported instructions of the experimenter in addition to the written instructions in the material. A ‘stop page’ (Figure 6-2, right) indicated the end of one block and the request to wait for the rest of the group to finish. A student assistant helped the experimenter to collect the forms after each block, to hand out product-specific descriptions of the respective functionality for each trial during the construction task, and to take pictures of the colored boxes.
Figure 6-3 Flowchart of Study Procedure
The session started (block 1) with a general welcome, introduction to the study, and rules for the session. Participants signed a consent form and provided some demographic background information and rating regarding their well-being before filling out the questionnaire on technology affinity. Block 2 was devoted to the classification of the products. The score chart (columns: hedonic, utilitarian value, ease of use, familiarity, and personal usefulness; rows:
∗ Sketches by Jade Kwan
6 STUDY 3 :: WEIGHTING ATTRIBUTES :: COLORING THE BLACK BOX 149
washing machine, fax machine, television, video recorder, digital camera) was introduced interactively with the examples of a vacuum cleaner and of a Nintendo Gameboy.
In block 3 participants provided background information concerning prior experience (frequency of use, expertise, likelihood of usage) for each product.
Participants were introduced to the six attributes for the first time in block 4. They were provided with an overview of central aspects of the attributes to ensure a common understanding and to subsequently facilitate importance ratings. The order of products was randomized and matched to the order of products in the construction task so as to keep the delay between initial importance rating and the construction task constant for each product.
In block 5, participants received in-depth instructions (verbally and in writing) before being asked to complete the construction task (brick selection). A print-out of the base product was handed out as well as an additional overview legend of attribute description that was prepared for each session individually: bricks, in the color and position arrangement according to the session’s randomization code, enhanced the written description and allowed a 1 : 1 mapping to the toolbox arrangement (see Figure 6-1). Each trial started with the distribution of the product-specific list of functionalities. It was then that participants found out which product to build next. The order of products was randomized for every participant individually. One trial lasted 5 minutes. The PowerPoint slides were timed in a way that they automatically indicated the remainder of two and of one minute after three and four minutes, respectively. In case someone finished ahead of time, he/she signaled this by turning the box around, facing the experimenter who would then hand out the post-questionnaire for the according product and take a picture of the colored box. In order to reproduce afterwards, whose box it was, which product it related to, and which color-attribute-coding was realized, a subject ID tag, product tag, and color-legend (annotated bricks as shown in the right picture of Figure 6-1) were photographed together with the colored box.
One entire practice trial with regards to a mobile phone was conducted prior to the actual products. This trial was necessary to become familiar with the task demands, the procedure, and to get a feeling for the duration of five minutes. After this practice round, any remaining questions the participants might have had were addressed and clarified.
Block 6 served to receive feedback on how well participants were able to handle and understand the (construction) task demands. In addition, some information with respect to strategic behavior was gathered and participants were asked directly whether they had the impression that color and/or position arrangement affected brick selection.
Finally, in block 7 some more personal, technology-independent responses were assessed with regards to general hope of success and fear of failure. The session ended with the opportunity to give feedback on the study itself, but also general feedback on the design of interactive technology.
6 STUDY 3 :: WEIGHTING ATTRIBUTES :: COLORING THE BLACK BOX 150
6.3.4 ANALYSIS
For the manipulation check of product classification, paired t-tests were carried out on the hedonic and utilitarian scores as well as in respect of the products’ perceived simplicity. Independent t-tests were conducted for the purpose of comparing familiarity and likelihood of usage between the two age groups.
Self-stated importance values were analyzed with a 6 (attribute) x 2 (age group) x 2 (value) x 2 (simplicity) mixed design ANOVA. Age group was entered as a between-subject factor, while attribute, value, and simplicity were within-subject factors.
Frequency statistics were used for the further importance indices (highest priority, need for optimization, and willingness for trade-off). Since cell sizes were too small to meet the assumptions of a chi-square test for highest priority and willingness for trade-off, those scores are only listed descriptively.
For the main analysis of the construction task, six separate 2 (age group) x 2 (value) x 2 (simplicity) mixed design ANOVAs were conducted, one for each attribute. Again, age group was included as a between-subject factor, while value and simplicity were within-subject factors.
Six separate 8 (randomization) x 4 (product) mixed design ANOVAs were performed with randomization as a between-subject factor and product as a within-subject factor.
Upon completion of the construction of each product, a short post-questionnaire included the open question “what makes this attribute combination ideal?”. Responses were screened whether any of the six attributes were listed to be a reason. Frequencies reported in the result section relate to the amount of participants who regarded the according attribute as relevant. In other words, even if a participant named more than one reason relating to an attribute, it was only considered once.
Scoring In order to facilitate interpretation, brick scores were converted into percent values through
multiplication with .
Response scores of negatively worded evaluation statements (“I did not understand the task demand”; “I found it difficult to imagine the attributes”; “I found it difficult to put attributes into proportion”) were reversed (5-point Likert scales). As a result, for all evaluation statements, high response scores indicated a positive evaluation.
Outlier Scores that deviated more than four standard deviations (z > |4|) from the mean were considered as outliers (Stevens, 2002). For small sample sizes, a z of three is more appropriate. However, with subgroups of N = 30, a z of 5.29 would be possible (Schiffler, 1988), which makes a cut-off at four reasonable. Scores were z-transformed separately for each age group. If groups, as age
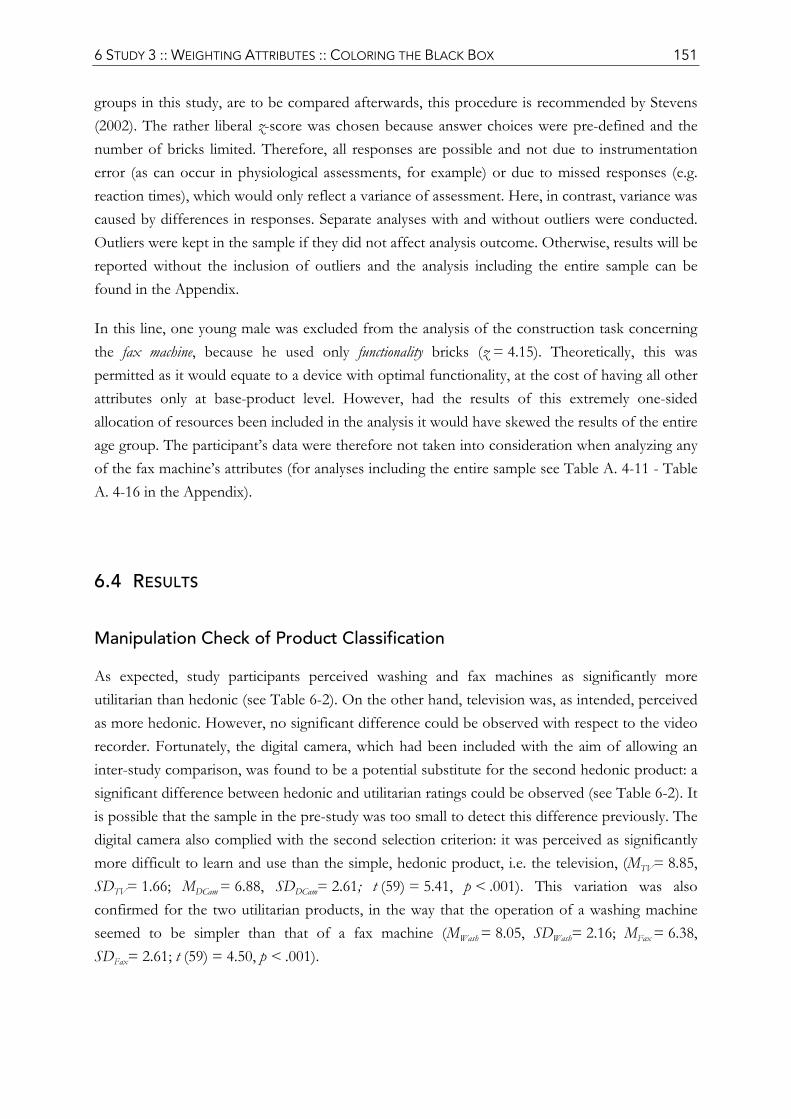
6 STUDY 3 :: WEIGHTING ATTRIBUTES :: COLORING THE BLACK BOX 151
groups in this study, are to be compared afterwards, this procedure is recommended by Stevens (2002). The rather liberal z-score was chosen because answer choices were pre-defined and the number of bricks limited. Therefore, all responses are possible and not due to instrumentation error (as can occur in physiological assessments, for example) or due to missed responses (e.g. reaction times), which would only reflect a variance of assessment. Here, in contrast, variance was caused by differences in responses. Separate analyses with and without outliers were conducted. Outliers were kept in the sample if they did not affect analysis outcome. Otherwise, results will be reported without the inclusion of outliers and the analysis including the entire sample can be found in the Appendix.
In this line, one young male was excluded from the analysis of the construction task concerning the fax machine, because he used only functionality bricks (z = 4.15). Theoretically, this was permitted as it would equate to a device with optimal functionality, at the cost of having all other attributes only at base-product level. However, had the results of this extremely one-sided allocation of resources been included in the analysis it would have skewed the results of the entire age group. The participant’s data were therefore not taken into consideration when analyzing any of the fax machine’s attributes (for analyses including the entire sample see Table A. 4-11 - Table A. 4-16 in the Appendix).
6.4 RESULTS
Manipulation Check of Product Classification
As expected, study participants perceived washing and fax machines as significantly more utilitarian than hedonic (see Table 6-2). On the other hand, television was, as intended, perceived as more hedonic. However, no significant difference could be observed with respect to the video recorder. Fortunately, the digital camera, which had been included with the aim of allowing an inter-study comparison, was found to be a potential substitute for the second hedonic product: a significant difference between hedonic and utilitarian ratings could be observed (see Table 6-2). It is possible that the sample in the pre-study was too small to detect this difference previously. The digital camera also complied with the second selection criterion: it was perceived as significantly more difficult to learn and use than the simple, hedonic product, i.e. the television, (MTV= 8.85, SDTV= 1.66; MDCam = 6.88, SDDCam= 2.61; t (59) = 5.41, p < .001). This variation was also confirmed for the two utilitarian products, in the way that the operation of a washing machine seemed to be simpler than that of a fax machine (MWash = 8.05, SDWash= 2.16; MFax = 6.38, SDFax= 2.61; t (59) = 4.50, p < .001).
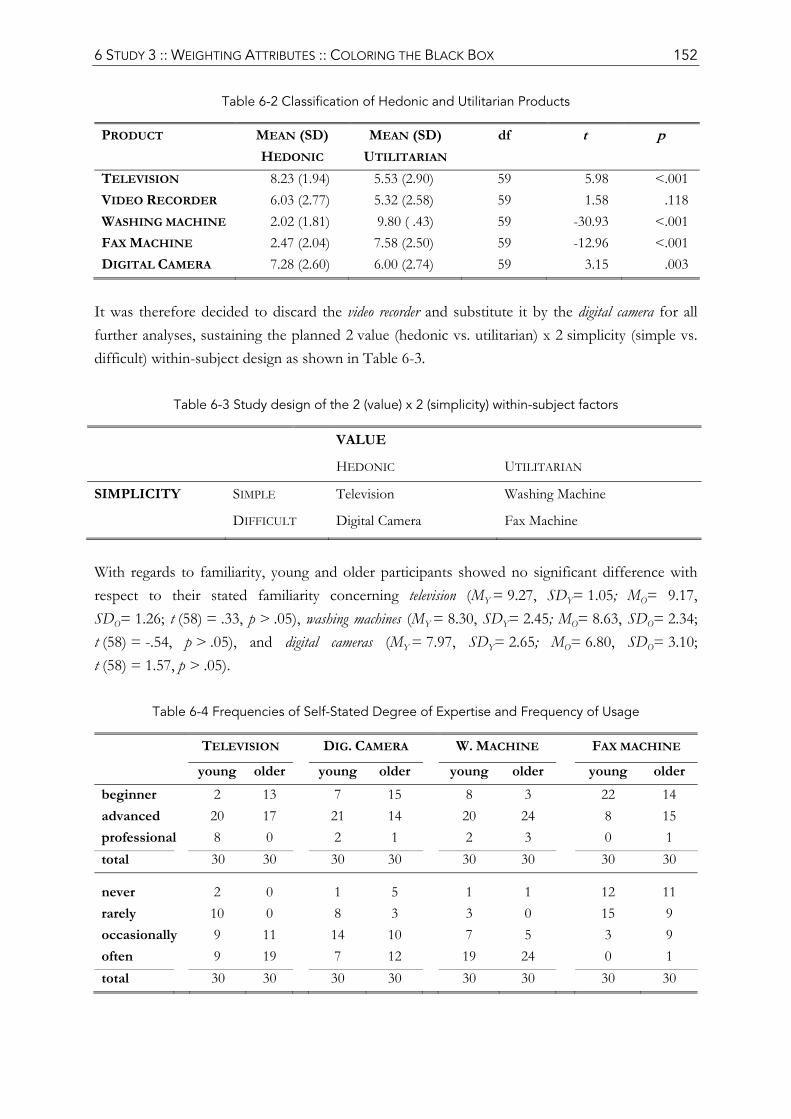
6 STUDY 3 :: WEIGHTING ATTRIBUTES :: COLORING THE BLACK BOX 152
Table 6-2 Classification of Hedonic and Utilitarian Products
PRODUCT MEAN (SD) HEDONIC
MEAN (SD) UTILITARIAN
df t p
TELEVISION 8.23 (1.94) 5.53 (2.90) 59 5.98 <.001 VIDEO RECORDER 6.03 (2.77) 5.32 (2.58) 59 1.58 .118 WASHING MACHINE 2.02 (1.81) 9.80 ( .43) 59 -30.93 <.001 FAX MACHINE 2.47 (2.04) 7.58 (2.50) 59 -12.96 <.001 DIGITAL CAMERA 7.28 (2.60) 6.00 (2.74) 59 3.15 .003
It was therefore decided to discard the video recorder and substitute it by the digital camera for all further analyses, sustaining the planned 2 value (hedonic vs. utilitarian) x 2 simplicity (simple vs. difficult) within-subject design as shown in Table 6-3.
Table 6-3 Study design of the 2 (value) x 2 (simplicity) within-subject factors
VALUE
HEDONIC UTILITARIAN
SIMPLICITY SIMPLE Television Washing Machine
DIFFICULT Digital Camera Fax Machine
With regards to familiarity, young and older participants showed no significant difference with respect to their stated familiarity concerning television (MY = 9.27, SDY= 1.05; MO= 9.17, SDO= 1.26; t (58) = .33, p > .05), washing machines (MY = 8.30, SDY= 2.45; MO= 8.63, SDO= 2.34; t (58) = -.54, p > .05), and digital cameras (MY = 7.97, SDY= 2.65; MO= 6.80, SDO= 3.10; t (58) = 1.57, p > .05).
Table 6-4 Frequencies of Self-Stated Degree of Expertise and Frequency of Usage
TELEVISION DIG. CAMERA W. MACHINE FAX MACHINE
young older young older young older young older beginner 2 13 7 15 8 3 22 14 advanced 20 17 21 14 20 24 8 15 professional 8 0 2 1 2 3 0 1 total 30 30 30 30 30 30 30 30
never 2 0 1 5 1 1 12 11 rarely 10 0 8 3 3 0 15 9 occasionally 9 11 14 10 7 5 3 9 often 9 19 7 12 19 24 0 1 total 30 30 30 30 30 30 30 30
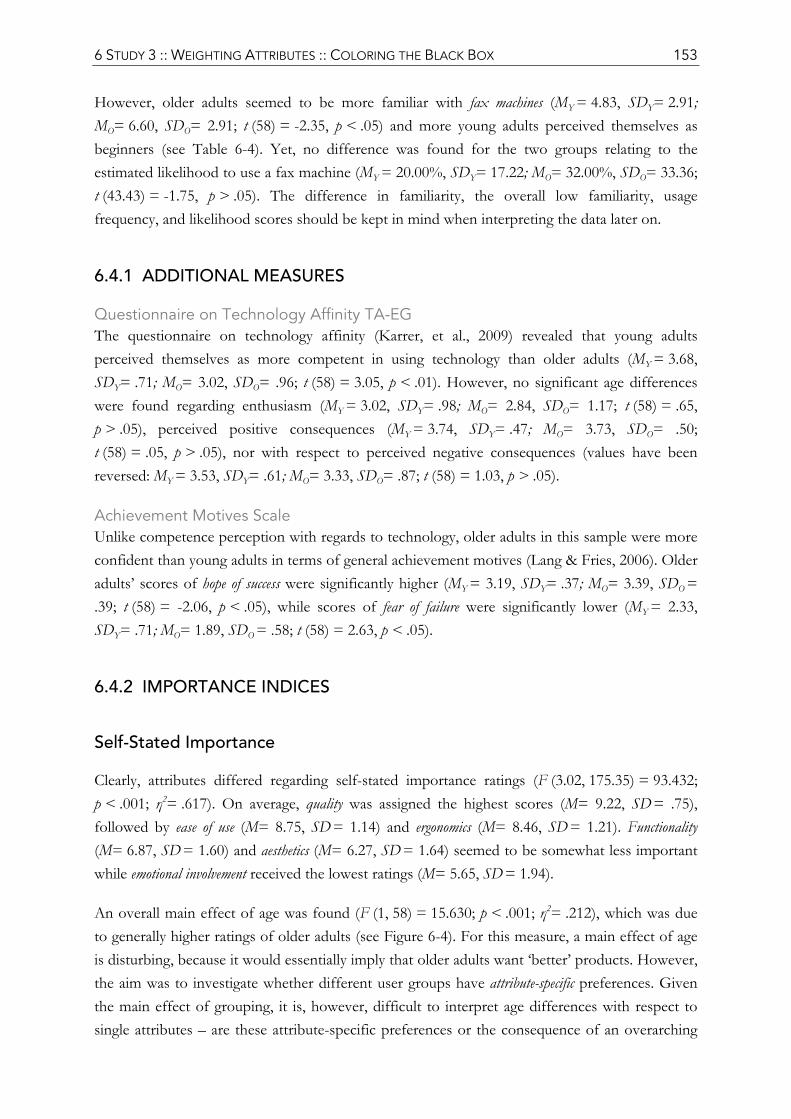
6 STUDY 3 :: WEIGHTING ATTRIBUTES :: COLORING THE BLACK BOX 153
However, older adults seemed to be more familiar with fax machines (MY = 4.83, SDY= 2.91; MO= 6.60, SDO= 2.91; t (58) = -2.35, p < .05) and more young adults perceived themselves as beginners (see Table 6-4). Yet, no difference was found for the two groups relating to the estimated likelihood to use a fax machine (MY = 20.00%, SDY= 17.22; MO= 32.00%, SDO= 33.36; t (43.43) = -1.75, p > .05). The difference in familiarity, the overall low familiarity, usage frequency, and likelihood scores should be kept in mind when interpreting the data later on.
6.4.1 ADDITIONAL MEASURES
Questionnaire on Technology Affinity TA-EG The questionnaire on technology affinity (Karrer, et al., 2009) revealed that young adults perceived themselves as more competent in using technology than older adults (MY = 3.68, SDY= .71; MO= 3.02, SDO= .96; t (58) = 3.05, p < .01). However, no significant age differences were found regarding enthusiasm (MY = 3.02, SDY= .98; MO= 2.84, SDO= 1.17; t (58) = .65, p > .05), perceived positive consequences (MY = 3.74, SDY= .47; MO= 3.73, SDO= .50; t (58) = .05, p > .05), nor with respect to perceived negative consequences (values have been reversed: MY = 3.53, SDY= .61; MO= 3.33, SDO= .87; t (58) = 1.03, p > .05).
Achievement Motives Scale Unlike competence perception with regards to technology, older adults in this sample were more confident than young adults in terms of general achievement motives (Lang & Fries, 2006). Older adults’ scores of hope of success were significantly higher (MY = 3.19, SDY= .37; MO= 3.39, SDO = .39; t (58) = -2.06, p < .05), while scores of fear of failure were significantly lower (MY = 2.33, SDY= .71; MO= 1.89, SDO = .58; t (58) = 2.63, p < .05).
6.4.2 IMPORTANCE INDICES
Self-Stated Importance
Clearly, attributes differed regarding self-stated importance ratings (F (3.02, 175.35) = 93.432; p < .001; η2= .617). On average, quality was assigned the highest scores (M= 9.22, SD = .75), followed by ease of use (M= 8.75, SD = 1.14) and ergonomics (M= 8.46, SD = 1.21). Functionality (M= 6.87, SD = 1.60) and aesthetics (M= 6.27, SD = 1.64) seemed to be somewhat less important while emotional involvement received the lowest ratings (M= 5.65, SD = 1.94).
An overall main effect of age was found (F (1, 58) = 15.630; p < .001; η2= .212), which was due to generally higher ratings of older adults (see Figure 6-4). For this measure, a main effect of age is disturbing, because it would essentially imply that older adults want ‘better’ products. However, the aim was to investigate whether different user groups have attribute-specific preferences. Given the main effect of grouping, it is, however, difficult to interpret age differences with respect to single attributes – are these attribute-specific preferences or the consequence of an overarching
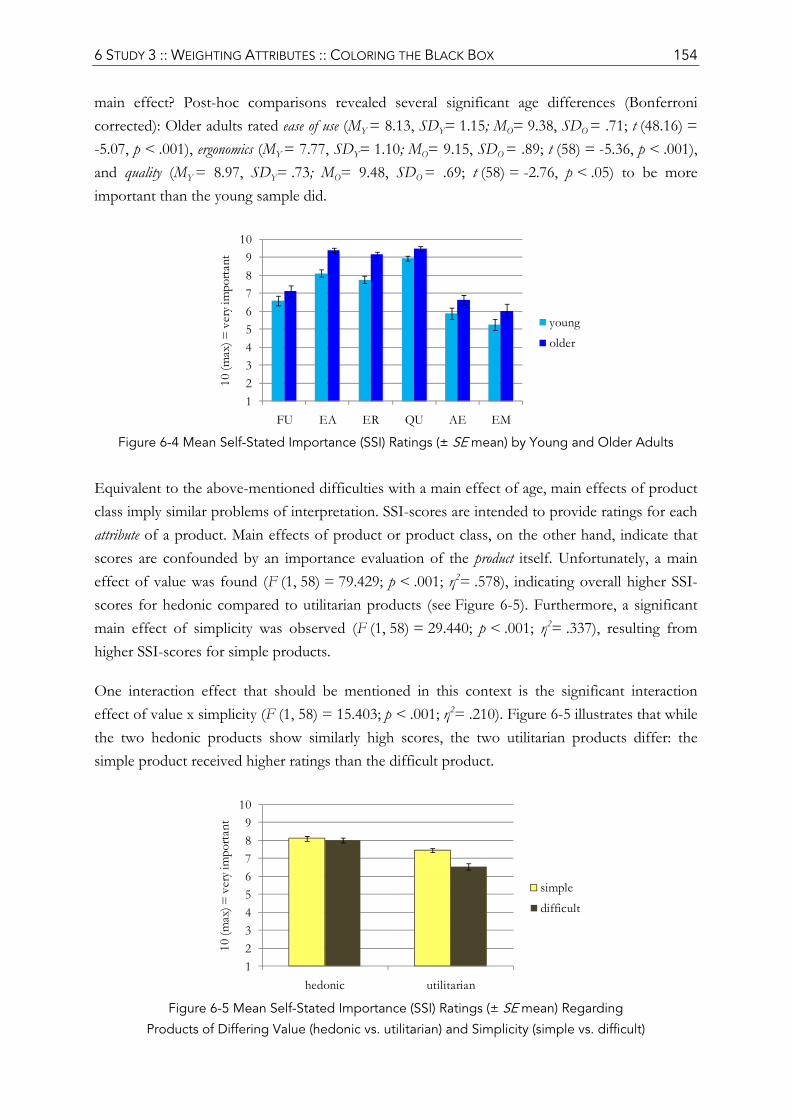
6 STUDY 3 :: WEIGHTING ATTRIBUTES :: COLORING THE BLACK BOX 154
main effect? Post-hoc comparisons revealed several significant age differences (Bonferroni corrected): Older adults rated ease of use (MY = 8.13, SDY= 1.15; MO= 9.38, SDO = .71; t (48.16) = -5.07, p < .001), ergonomics (MY = 7.77, SDY= 1.10; MO= 9.15, SDO = .89; t (58) = -5.36, p < .001), and quality (MY = 8.97, SDY= .73; MO= 9.48, SDO = .69; t (58) = -2.76, p < .05) to be more important than the young sample did.
Figure 6-4 Mean Self-Stated Importance (SSI) Ratings (± SE mean) by Young and Older Adults
Equivalent to the above-mentioned difficulties with a main effect of age, main effects of product class imply similar problems of interpretation. SSI-scores are intended to provide ratings for each attribute of a product. Main effects of product or product class, on the other hand, indicate that scores are confounded by an importance evaluation of the product itself. Unfortunately, a main effect of value was found (F (1, 58) = 79.429; p < .001; η2= .578), indicating overall higher SSI-scores for hedonic compared to utilitarian products (see Figure 6-5). Furthermore, a significant main effect of simplicity was observed (F (1, 58) = 29.440; p < .001; η2= .337), resulting from higher SSI-scores for simple products.
One interaction effect that should be mentioned in this context is the significant interaction effect of value x simplicity (F (1, 58) = 15.403; p < .001; η2= .210). Figure 6-5 illustrates that while the two hedonic products show similarly high scores, the two utilitarian products differ: the simple product received higher ratings than the difficult product.
Figure 6-5 Mean Self-Stated Importance (SSI) Ratings (± SE mean) Regarding
Products of Differing Value (hedonic vs. utilitarian) and Simplicity (simple vs. difficult)
123456789
10
FU EA ER QU AE EM
10 (m
ax) =
ver
y im
porta
nt
youngolder
123456789
10
hedonic utilitarian
10 (m
ax) =
ver
y im
porta
nt
simpledifficult
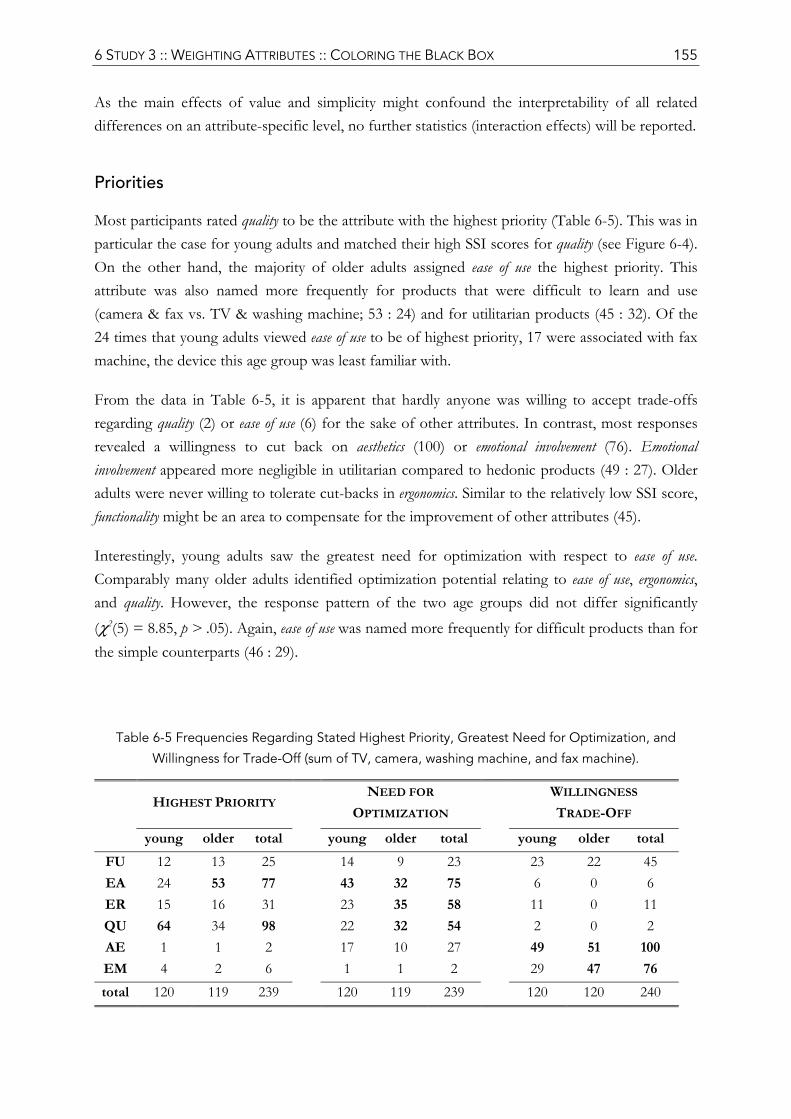
6 STUDY 3 :: WEIGHTING ATTRIBUTES :: COLORING THE BLACK BOX 155
As the main effects of value and simplicity might confound the interpretability of all related differences on an attribute-specific level, no further statistics (interaction effects) will be reported.
Priorities
Most participants rated quality to be the attribute with the highest priority (Table 6-5). This was in particular the case for young adults and matched their high SSI scores for quality (see Figure 6-4). On the other hand, the majority of older adults assigned ease of use the highest priority. This attribute was also named more frequently for products that were difficult to learn and use (camera & fax vs. TV & washing machine; 53 : 24) and for utilitarian products (45 : 32). Of the 24 times that young adults viewed ease of use to be of highest priority, 17 were associated with fax machine, the device this age group was least familiar with.
From the data in Table 6-5, it is apparent that hardly anyone was willing to accept trade-offs regarding quality (2) or ease of use (6) for the sake of other attributes. In contrast, most responses revealed a willingness to cut back on aesthetics (100) or emotional involvement (76). Emotional involvement appeared more negligible in utilitarian compared to hedonic products (49 : 27). Older adults were never willing to tolerate cut-backs in ergonomics. Similar to the relatively low SSI score, functionality might be an area to compensate for the improvement of other attributes (45).
Interestingly, young adults saw the greatest need for optimization with respect to ease of use. Comparably many older adults identified optimization potential relating to ease of use, ergonomics, and quality. However, the response pattern of the two age groups did not differ significantly (χ2(5) = 8.85, p > .05). Again, ease of use was named more frequently for difficult products than for the simple counterparts (46 : 29).
Table 6-5 Frequencies Regarding Stated Highest Priority, Greatest Need for Optimization, and
Willingness for Trade-Off (sum of TV, camera, washing machine, and fax machine).
HIGHEST PRIORITY NEED FOR
OPTIMIZATION
WILLINGNESS TRADE-OFF
young older total young older total young older total FU 12 13 25 14 9 23 23 22 45 EA 24 53 77 43 32 75 6 0 6 ER 15 16 31 23 35 58 11 0 11 QU 64 34 98 22 32 54 2 0 2 AE 1 1 2 17 10 27 49 51 100 EM 4 2 6 1 1 2 29 47 76 total 120 119 239 120 119 239 120 120 240
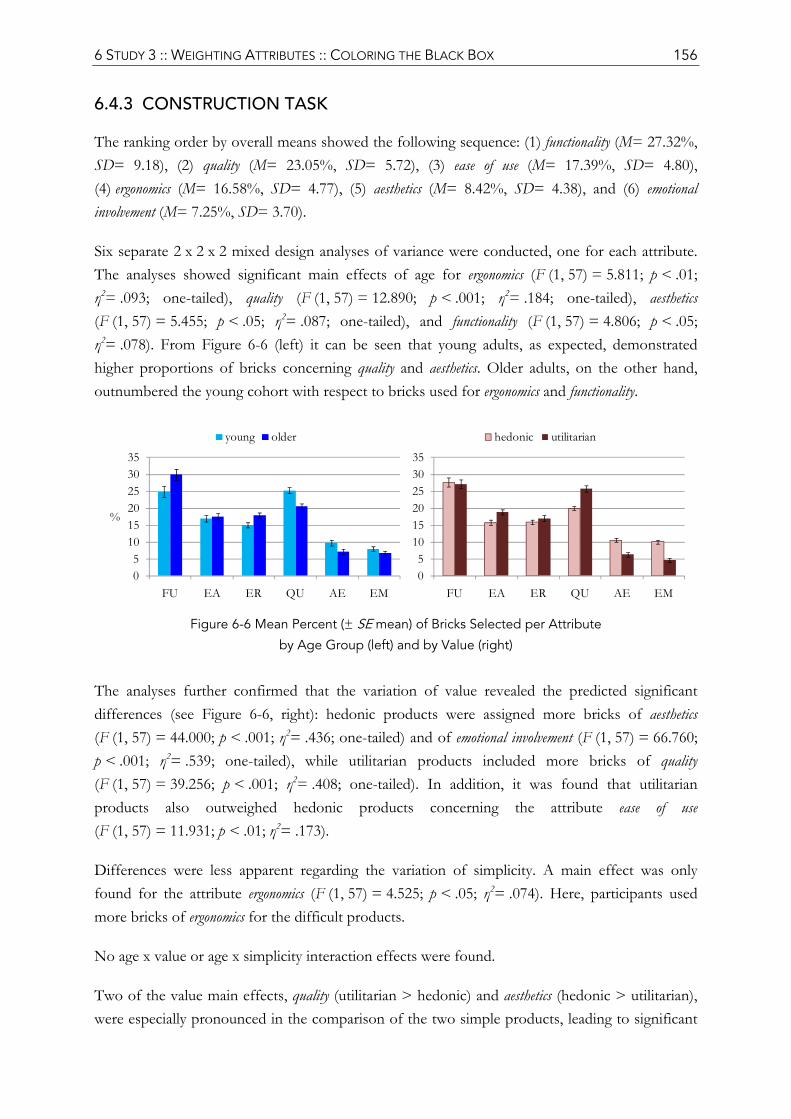
6 STUDY 3 :: WEIGHTING ATTRIBUTES :: COLORING THE BLACK BOX 156
6.4.3 CONSTRUCTION TASK
The ranking order by overall means showed the following sequence: (1) functionality (M= 27.32%, SD= 9.18), (2) quality (M= 23.05%, SD= 5.72), (3) ease of use (M= 17.39%, SD= 4.80), (4) ergonomics (M= 16.58%, SD= 4.77), (5) aesthetics (M= 8.42%, SD= 4.38), and (6) emotional involvement (M= 7.25%, SD= 3.70).
Six separate 2 x 2 x 2 mixed design analyses of variance were conducted, one for each attribute. The analyses showed significant main effects of age for ergonomics (F (1, 57) = 5.811; p < .01; η2= .093; one-tailed), quality (F (1, 57) = 12.890; p < .001; η2= .184; one-tailed), aesthetics (F (1, 57) = 5.455; p < .05; η2= .087; one-tailed), and functionality (F (1, 57) = 4.806; p < .05; η2= .078). From Figure 6-6 (left) it can be seen that young adults, as expected, demonstrated higher proportions of bricks concerning quality and aesthetics. Older adults, on the other hand, outnumbered the young cohort with respect to bricks used for ergonomics and functionality.
Figure 6-6 Mean Percent (± SE mean) of Bricks Selected per Attribute
by Age Group (left) and by Value (right)
The analyses further confirmed that the variation of value revealed the predicted significant differences (see Figure 6-6, right): hedonic products were assigned more bricks of aesthetics (F (1, 57) = 44.000; p < .001; η2= .436; one-tailed) and of emotional involvement (F (1, 57) = 66.760; p < .001; η2= .539; one-tailed), while utilitarian products included more bricks of quality (F (1, 57) = 39.256; p < .001; η2= .408; one-tailed). In addition, it was found that utilitarian products also outweighed hedonic products concerning the attribute ease of use (F (1, 57) = 11.931; p < .01; η2= .173).
Differences were less apparent regarding the variation of simplicity. A main effect was only found for the attribute ergonomics (F (1, 57) = 4.525; p < .05; η2= .074). Here, participants used more bricks of ergonomics for the difficult products.
No age x value or age x simplicity interaction effects were found.
Two of the value main effects, quality (utilitarian > hedonic) and aesthetics (hedonic > utilitarian), were especially pronounced in the comparison of the two simple products, leading to significant
05
101520253035
FU EA ER QU AE EM
%
young older
05
101520253035
FU EA ER QU AE EM
hedonic utilitarian
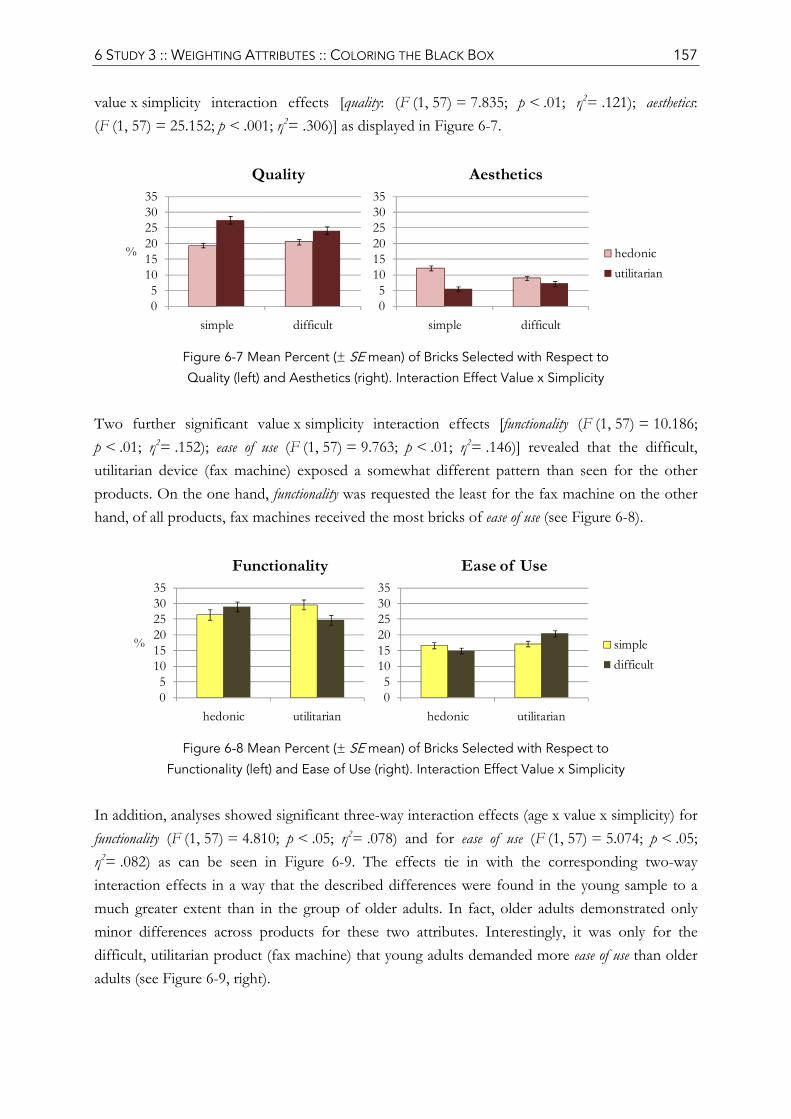
6 STUDY 3 :: WEIGHTING ATTRIBUTES :: COLORING THE BLACK BOX 157
value x simplicity interaction effects [quality: (F (1, 57) = 7.835; p < .01; η2= .121); aesthetics: (F (1, 57) = 25.152; p < .001; η2= .306)] as displayed in Figure 6-7.
Figure 6-7 Mean Percent (± SE mean) of Bricks Selected with Respect to
Quality (left) and Aesthetics (right). Interaction Effect Value x Simplicity
Two further significant value x simplicity interaction effects [functionality (F (1, 57) = 10.186; p < .01; η2= .152); ease of use (F (1, 57) = 9.763; p < .01; η2= .146)] revealed that the difficult, utilitarian device (fax machine) exposed a somewhat different pattern than seen for the other products. On the one hand, functionality was requested the least for the fax machine on the other hand, of all products, fax machines received the most bricks of ease of use (see Figure 6-8).
Figure 6-8 Mean Percent (± SE mean) of Bricks Selected with Respect to
Functionality (left) and Ease of Use (right). Interaction Effect Value x Simplicity
In addition, analyses showed significant three-way interaction effects (age x value x simplicity) for functionality (F (1, 57) = 4.810; p < .05; η2= .078) and for ease of use (F (1, 57) = 5.074; p < .05; η2= .082) as can be seen in Figure 6-9. The effects tie in with the corresponding two-way interaction effects in a way that the described differences were found in the young sample to a much greater extent than in the group of older adults. In fact, older adults demonstrated only minor differences across products for these two attributes. Interestingly, it was only for the difficult, utilitarian product (fax machine) that young adults demanded more ease of use than older adults (see Figure 6-9, right).
05
101520253035
simple difficult
%
Quality
05
101520253035
simple difficult
Aesthetics
hedonicutilitarian
05
101520253035
hedonic utilitarian
%
Functionality
05
101520253035
hedonic utilitarian
Ease of Use
simpledifficult
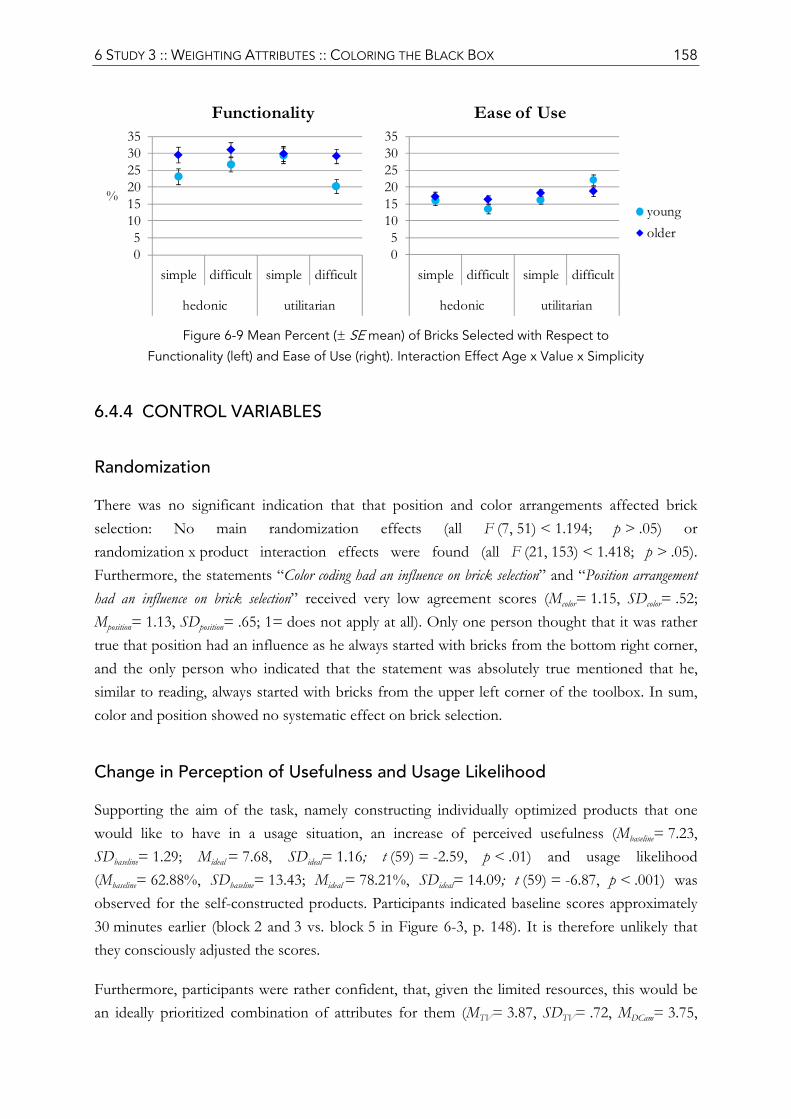
6 STUDY 3 :: WEIGHTING ATTRIBUTES :: COLORING THE BLACK BOX 158
Figure 6-9 Mean Percent (± SE mean) of Bricks Selected with Respect to
Functionality (left) and Ease of Use (right). Interaction Effect Age x Value x Simplicity
6.4.4 CONTROL VARIABLES
Randomization
There was no significant indication that that position and color arrangements affected brick selection: No main randomization effects (all F (7, 51) < 1.194; p > .05) or randomization x product interaction effects were found (all F (21, 153) < 1.418; p > .05). Furthermore, the statements “Color coding had an influence on brick selection” and “Position arrangement had an influence on brick selection” received very low agreement scores (Mcolor= 1.15, SDcolor= .52; Mposition= 1.13, SDposition= .65; 1= does not apply at all). Only one person thought that it was rather true that position had an influence as he always started with bricks from the bottom right corner, and the only person who indicated that the statement was absolutely true mentioned that he, similar to reading, always started with bricks from the upper left corner of the toolbox. In sum, color and position showed no systematic effect on brick selection.
Change in Perception of Usefulness and Usage Likelihood
Supporting the aim of the task, namely constructing individually optimized products that one would like to have in a usage situation, an increase of perceived usefulness (Mbaseline= 7.23, SDbaseline= 1.29; Mideal = 7.68, SDideal= 1.16; t (59) = -2.59, p < .01) and usage likelihood (Mbaseline= 62.88%, SDbaseline= 13.43; Mideal = 78.21%, SDideal= 14.09; t (59) = -6.87, p < .001) was observed for the self-constructed products. Participants indicated baseline scores approximately 30 minutes earlier (block 2 and 3 vs. block 5 in Figure 6-3, p. 148). It is therefore unlikely that they consciously adjusted the scores.
Furthermore, participants were rather confident, that, given the limited resources, this would be an ideally prioritized combination of attributes for them (MTV= 3.87, SDTV= .72, MDCam= 3.75,
05
101520253035
simple difficult simple difficult
hedonic utilitarian
%
Functionality
05
101520253035
simple difficult simple difficult
hedonic utilitarian
Ease of Use
youngolder
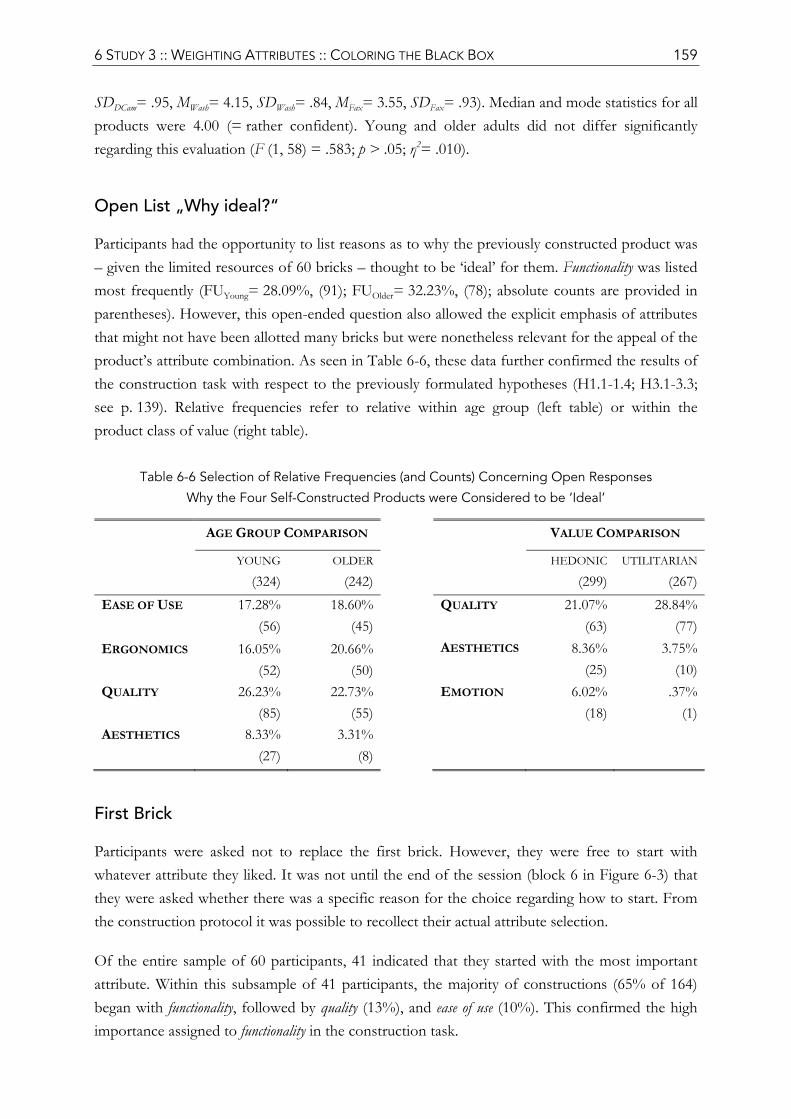
6 STUDY 3 :: WEIGHTING ATTRIBUTES :: COLORING THE BLACK BOX 159
SDDCam= .95, MWash= 4.15, SDWash= .84, MFax= 3.55, SDFax= .93). Median and mode statistics for all products were 4.00 (= rather confident). Young and older adults did not differ significantly regarding this evaluation (F (1, 58) = .583; p > .05; η2= .010).
Open List „Why ideal?“
Participants had the opportunity to list reasons as to why the previously constructed product was – given the limited resources of 60 bricks – thought to be ‘ideal’ for them. Functionality was listed most frequently (FUYoung= 28.09%, (91); FUOlder= 32.23%, (78); absolute counts are provided in parentheses). However, this open-ended question also allowed the explicit emphasis of attributes that might not have been allotted many bricks but were nonetheless relevant for the appeal of the product’s attribute combination. As seen in Table 6-6, these data further confirmed the results of the construction task with respect to the previously formulated hypotheses (H1.1-1.4; H3.1-3.3; see p. 139). Relative frequencies refer to relative within age group (left table) or within the product class of value (right table).
Table 6-6 Selection of Relative Frequencies (and Counts) Concerning Open Responses
Why the Four Self-Constructed Products were Considered to be ‘Ideal’
AGE GROUP COMPARISON VALUE COMPARISON
YOUNG (324)
OLDER
(242)
HEDONIC (299)
UTILITARIAN
(267)EASE OF USE 17.28%
(56) 18.60%
(45)
QUALITY 21.07% (63)
28.84%(77)
ERGONOMICS 16.05% (52)
20.66% (50)
AESTHETICS 8.36%
(25) 3.75%
(10)QUALITY 26.23%
(85) 22.73%
(55)
EMOTION 6.02% (18)
.37%(1)
AESTHETICS 8.33% (27)
3.31%(8)
First Brick
Participants were asked not to replace the first brick. However, they were free to start with whatever attribute they liked. It was not until the end of the session (block 6 in Figure 6-3) that they were asked whether there was a specific reason for the choice regarding how to start. From the construction protocol it was possible to recollect their actual attribute selection.
Of the entire sample of 60 participants, 41 indicated that they started with the most important attribute. Within this subsample of 41 participants, the majority of constructions (65% of 164) began with functionality, followed by quality (13%), and ease of use (10%). This confirmed the high importance assigned to functionality in the construction task.
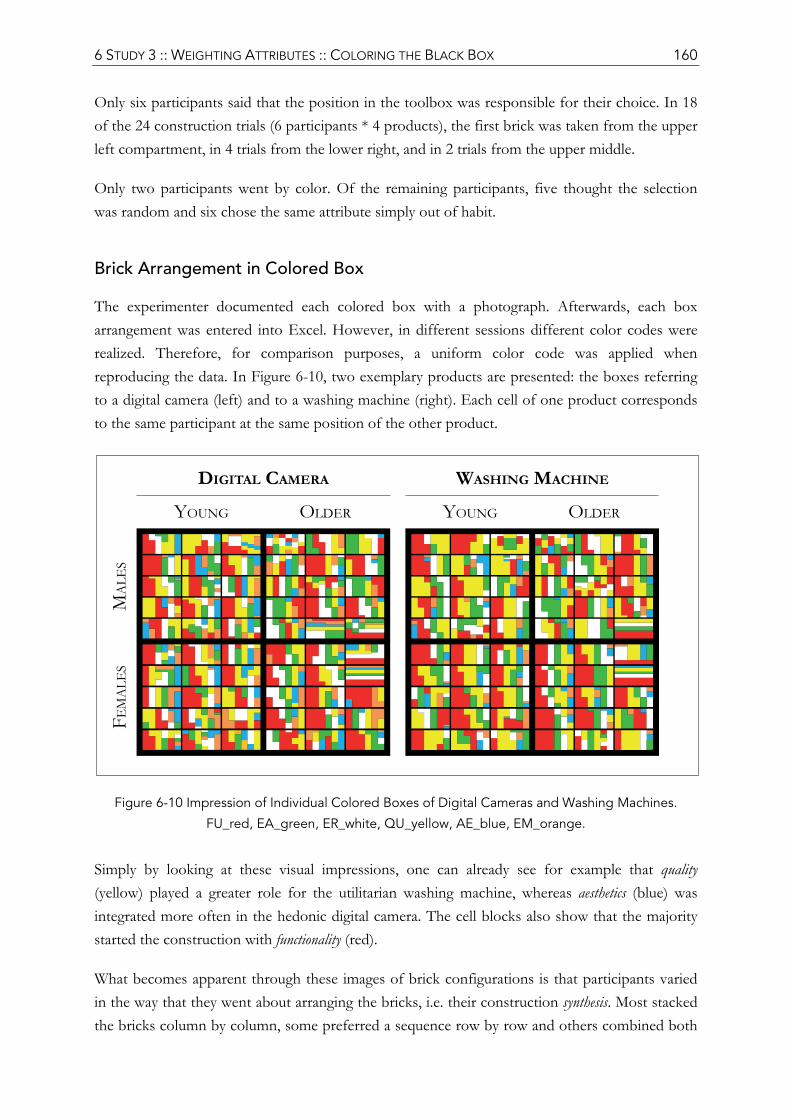
6 STUDY 3 :: WEIGHTING ATTRIBUTES :: COLORING THE BLACK BOX 160
Only six participants said that the position in the toolbox was responsible for their choice. In 18 of the 24 construction trials (6 participants * 4 products), the first brick was taken from the upper left compartment, in 4 trials from the lower right, and in 2 trials from the upper middle.
Only two participants went by color. Of the remaining participants, five thought the selection was random and six chose the same attribute simply out of habit.
Brick Arrangement in Colored Box
The experimenter documented each colored box with a photograph. Afterwards, each box arrangement was entered into Excel. However, in different sessions different color codes were realized. Therefore, for comparison purposes, a uniform color code was applied when reproducing the data. In Figure 6-10, two exemplary products are presented: the boxes referring to a digital camera (left) and to a washing machine (right). Each cell of one product corresponds to the same participant at the same position of the other product.
Figure 6-10 Impression of Individual Colored Boxes of Digital Cameras and Washing Machines.
FU_red, EA_green, ER_white, QU_yellow, AE_blue, EM_orange.
Simply by looking at these visual impressions, one can already see for example that quality (yellow) played a greater role for the utilitarian washing machine, whereas aesthetics (blue) was integrated more often in the hedonic digital camera. The cell blocks also show that the majority started the construction with functionality (red).
What becomes apparent through these images of brick configurations is that participants varied in the way that they went about arranging the bricks, i.e. their construction synthesis. Most stacked the bricks column by column, some preferred a sequence row by row and others combined both
6 STUDY 3 :: WEIGHTING ATTRIBUTES :: COLORING THE BLACK BOX 161
approaches freely without following a strict order. These inter-individual differences were rather consistent on an intra-individual level.
6.4.5 EVALUATION OF TASK DEMANDS
Participants evaluated the construction task consistently positive. They coped well with the task demand (M= 4.22, SD= .83, Mdn= 4, Mode= 4), were confident that they understood the task correctly (M= 4.83, SD= .42, Mdn= 5, Mode= 5), and thought that it was quite fun to construct their ‘ideal’ products (M= 4.02, SD= .93, Mdn= 4, Mode= 4). All in all, participants found it rather easy to imagine the attributes (M= 3.98, SD= 1.08, Mdn= 4, Mode= 5) and to put them into proportion (M= 3.60, SD= 1.06, Mdn= 4, Mode= 4). Young and older adults did not differ significantly in these agreement scores (F (1, 58) = .196; p > .05; η2= .003).
Strategy-wise, brick distribution was based more on the visual impression than on the calculation of exact numeric values (t (59) = 4.17, p < .001).
6.4.6 COMPARISON WITH STUDY 2 [CONJOINT ANALYSIS]
Results of this study with the focus on the evaluation of a digital camera can be compared to those of the previous study (see Chapter 5).
The two samples (study 2: N = 104; study 3: N = 60) were comparable regarding age grouping (study 2: 20-30 years and 65-75 years; study 3: 19-30 years and 65-74 years), physical well-being (M2= 3.99, SD2= .62; M3= 3.92, SD3= .65), and general well-being (M2= 3.99, SD2= .57; M3= 3.93, SD3= .61). Most importantly, the two samples were also similar concerning camera-specific variables such as expertise (study 2: 36% beginners; 61% advanced; 3% professionals; study 3: 37% beginners; 58% advanced; 5% professionals) and baseline likelihood to use a digital camera for the purpose of hobby photography (M2= 55.19%, SD2= 29.59; M3= 53.17%, SD3= 35.34).
The significant age differences found in study 2 regarding higher part-worth utilities in the sample of older adults with respect to ergonomics and higher values for young adults relating to quality and aesthetics could be confirmed in the study presented here: For the digital camera, older adults considered more bricks corresponding to ergonomics than young adults (MY= 14.94%, SDY= 4.05; MO= 18.11%, SDO= 8.48; t (41.55) = -1.85, p < .05; one-tailed). On the other hand, young adults devoted more bricks to quality (MY= 23.28%, SDY= 7.50; MO= 17.94%, SDO= 5.25; t (58) = 3.19, p < .01; one-tailed) and aesthetics (MY= 10.72%, SDY= 5.41; MO= 6.94%, SDO= 5.42; t (58) = 2.70, p < .01; one-tailed).
In contrast to the main effect of age when including all four products, older adults did not allocate significantly more bricks to functionality for the digital camera. However, it should be noted that while the two levels of (primary and secondary) functionality called for diverse reactions
6 STUDY 3 :: WEIGHTING ATTRIBUTES :: COLORING THE BLACK BOX 162
in study 2, which in turn led to extremely low part-worth utilities (compare Figure 5-4, p. 118), the open description of the attribute in the present study revealed a high request of functionality. To be precise, functionality was ranked first for both age groups. This shift in attribute weights was primarily compensated by a lower weight of ergonomics.
From a methodological point of view, both samples agreed that they coped rather well with the task demand (M2= 4.25, SD2= .77; M3= 4.22, SD3= .83). In study 2, participants only somewhat agreed that they ‘liked’ the question format of the conjoint analysis (M2= 3.68, SD2= 1.05), while the construction task of study 3 was considered to be actually rather ‘fun’ (M3= 4.02, SD3= .93).
6.5 DISCUSSION OF EMPIRICAL RESULTS
The method of coloring a black box with real (physical) domino bricks representing six previously identified attributes was used to assess relative importance weights for different user groups (young and older adults) and different products. It appears worthwhile pointing out that the presented data relies on the evaluation and anticipation of the four selected products: television, digital camera, washing machine, and fax machine. Consequently, results and their interpretation should be seen in association to these products. Furthermore, as this was the first study of its kind, replications will have to be carried out. The advantages of the newly introduced method (construction task) have been outlined in the introduction of this chapter and will be further discussed below (see p. 167).
6.5.1 AGE DIFFERENCES
Do young and older adults differ in assigning attribute importance? [RQ 1]
The results of the construction task confirmed the expected age differences regarding a pronounced consideration of ergonomics in older adults and higher values in the young sample for quality and aesthetics (H.1.2, H1.3, and H1.4 confirmed).
These differences can point to important strategic reconsiderations in product development when designing for older adults rather than young adults. For a young cohort, resources might be wisely invested in enhancing the excellence of the product (e.g. increasing the number of megapixel of a digital camera), but for an older target group, some of these resources might be better invested in a good ergonomic handling of the device. If trade-offs have to be made in product development – this would be one that seems recommendable from the present findings.
Older adults did not select significantly more bricks of ease of use despite their lower self-perceived competence with electronic devices (H1.1 not confirmed). Possibly, young adults consider ease of
6 STUDY 3 :: WEIGHTING ATTRIBUTES :: COLORING THE BLACK BOX 163
use to be an attribute of comparable importance as older adults do. After all, young adults also thought that this attribute had the greatest need for optimization. Furthermore, following quality, young adults regarded ease of use as the second most important attribute in the self-stated importance assessment and when selecting the highest priority. However, the findings should not be interpreted in the sense that both age groups have the same necessities or preferences regarding ease of use (e.g. usability). So far, it can only be said that in this study no significant age differences were found with respect to the relative weight that the two age groups assigned to the attribute.
Two lines of argumentation could try to explain reasons for the lack of a significant difference. For one, the description of the base product included a negative wording regarding ease of use. It was said that if no additional bricks were added, the resulting product would be difficult to understand (substantial effort and the necessity of help such as a manual or instructions). This might have motivated young adults to devote ease of use a generous weight as they want to be able to operate a device without additional support. Hence, the weight itself might be similar for young and older adults; however, in ‘real’ life young adults might encounter fewer problems nonetheless (compare with results of study 1, p. 84). Theoretical importance and experienced necessity in real life are two distinct concepts.
A second observation is that young adults were less familiar with fax machines and used those less frequently than older adults. Accordingly, fewer young adults considered themselves as ‘advanced’ users. This lack of prior experience and familiarity might have influenced the pronounced consideration of ease of use for fax machines in the young age group. For example, it was only for the fax machine and only for young adults, that ease of use was ranked first in the self-stated importance measure. As revealed in a significant age x value x simplicity interaction effect (see Figure 6-9, p. 158), young adults showed higher scores than their older counterparts for this device. Possibly, a main effect of age would have become apparent if the fourth product had been more familiar to young adults. However, this is only an assumption and remains, in particular with regards to the first reason mentioned, unresolved.
Unexpectedly, older adults demanded functionality to a greater extent than young adults. Partly, this distinction was influenced by the evidently lower inclusion of functionality for the difficult, utilitarian product (fax machine). As noted earlier, this value x simplicity interaction effect leveled to a three-way interaction effect, because particularly young adults, who were also less familiar with this device, used fewer functionality bricks for fax machines. However, it is not possible to fully explain the general main effect with the given data. Further research is needed. Then again, the finding is in accordance with the previous observation in study 2 (Kano method), which showed that significantly more young adults favored a device with only primary functionalities. It is possible that older adults are apt to use a number of functionalities if they can ensure that the device is still usable. Usually, usability tends to show a negative relationship to the amount of functionalities (Nielsen, 1993). However, if older adults felt that they used sufficient bricks of ease
6 STUDY 3 :: WEIGHTING ATTRIBUTES :: COLORING THE BLACK BOX 164
of use to ensure a good usability they might have been confident to follow their desire for high functionality. Another hypothesis could be that elderly considered functionality as a trigger for usefulness (Thompson, Hamilton, & Rust, 2005), which is known to play a crucial role for this age group (K. Chen & Chan, 2011; Melenhorst, et al., 2006). Usefulness was neither explicitly included in the attribute set of the present study nor in study 2. Consequently, older adults might have looked for an alternative way to address the issue and compensated the importance of usefulness through functionality. Again, these assumptions would need to be investigated in future studies.
Are the age-related differences of relative weights in study 2 (part-worth utilities) similar to those in study 3 (construction task)? [RQ 2]
Since a digital camera was also included in the present study, results could be compared to those found in study 2 (conjoint analysis). The construction task required participants to assign relative weights to a number of attributes, thus, taking trade-offs into account during assessment. These should relate to the part-worth utilities of the conjoint analysis. All significant age differences found in study 2 (ergonomics, quality, aesthetics) could be replicated with the current method (H2.1, H2.2, and H2.3 confirmed).
This underscores the assumption that the construction task is sensitive to detect group differences that have been found by established methods and thereby supports the method’s validity.
6.5.2 PRODUCT DIFFERENCES
Do hedonic and utilitarian products differ regarding attribute importance? [RQ 3]
As hypothesized, products with different values associated (hedonic vs. utilitarian) differed in attribute importance (Hirschman & Holbrook, 1982; Holbrook, 1999; van der Heijden, 2004). As predicted, quality received a larger relative weight in the utilitarian products (H3.1 confirmed). On the other hand, aesthetics and emotional involvement were considered to a greater extent (twice as much) in hedonic products (H3.2 and H3.3 confirmed). The practical implication is that careful consideration of the specific attribute composition should be taken not only when designing for different user groups as seen above, but also when designing products with different values associated. The designer should be aware of product-specific priorities early on in the development process.
In addition to the theoretical and practical interest, the observation of these differences using this method is also a support of the method’s sensitivity: explicitly allotting relative weights with physical representatives was able to differentiate attribute importance between user groups and between products.
6 STUDY 3 :: WEIGHTING ATTRIBUTES :: COLORING THE BLACK BOX 165
One unanticipated finding was the significant difference concerning ease of use. Utilitarian products appear to call for a higher consideration of this attribute. One could argue that ease of use reflects the utilitarian, extrinsic value of ‘efficiency’ in Holbrook’s Typology of Consumer Value (see Table 6-1, p. 138). However, it is also possible that the effect might have been caused rather by a single product that is noticeably less familiar (fax machine) than by utilitarian products per se (see Figure 6-8 and discussion below).
Do simple and difficult products differ regarding attribute importance? [RQ 4]
The variation of products with differing perceptions regarding simplicity was included for explorative purposes. Surprisingly few main effects were found. In fact, analyses only revealed a significant difference with respect to ergonomics.
It was assumed most likely to find differences in relation to ease of use since both, product variation and attribute, address aspects of cognitive ergonomics (Hollnagel, 1997), mental effort, ease of learning and comprehension. For those products that were difficult to learn and use an increased need of ease of use would have seemed reasonable and was also found with respect to the stated ‘needs for optimization’. Additionally, an interaction effect (age x simplicity) pointing to a greater need of older adults when dealing with difficult products would have made sense, but could not be found in the construction task.
As mentioned earlier, the construction task has to be seen with reference to the provided base product. Since, according to this description, even the simple products confront the user with comprehension problems that make additional help necessary, it seems plausible that all products were assigned a comparable amount of ease of use bricks. After all, one does not want inferior usability of a product where this aspect is usually taken for granted. Hence, the case might have been different if ‘average’ products were described which would have made the advantage of simple products more obvious, reducing the necessity to incorporate even more ease of use in the construction. It can be argued likewise as has been done for the corresponding age similarity: possibly, in ‘real’ life (with average products as a reference) ease of use would be emphasized as a crucial priority more for difficult products.
On the other hand, within utilitarian products, the variation pointed into the expected direction. Whether this effect is generally only apparent in utilitarian products or whether this was caused by the marked unfamiliarity of this product (fax machine) requires further work.
Interaction effects of value x simplicity were not anticipated and are therefore not easy to interpret. The pronounced value differences for quality and aesthetics found in the simple products (see Figure 6-7, p. 157) seem unlikely to have been caused by the variation of simplicity. Instead differences may have been due to the circumstance that the selected simple products (television and washing machine) were both the prototypical products of the corresponding value class:
6 STUDY 3 :: WEIGHTING ATTRIBUTES :: COLORING THE BLACK BOX 166
television received the highest hedonic scores and washing machine the highest utilitarian scores. Consequently, value differences were possibly more manifest for these (simple) products.
6.5.3 NOTE ON FUNCTIONALITY
The attribute of functionality deserves special attention. In study 2, functionality was defined by the two levels of primary and secondary functionalities. This resulted in unexpectedly low weights, because, as revealed by the Kano method, participants showed opposing preferences: some preferred primary, others secondary functionalities. As a result, the attribute entered the regression model as a non-significant predictor. In contrast, in the present study, a base product was offered as a reference point with a minimum of features. Since this below-average capability of a product was unlikely to satisfy users, they were given the chance to expand the spectrum of functionality by including according bricks in the construction task. It was therefore expected that functionality would be assigned a greater weight than was seen in the conjoint analysis of study 2. This was the case. However, it was not expected to become the most considered attribute (see also study 1, Figure 4-5, p. 88).
Thompson et al. (2005) showed that before use, users perceive a positive link of the amount of functionalities with the product’s capability and consequently utility. As usefulness was not included as an explicit attribute in this study, it may be that participants compensated its absence through the consideration of functionality – as functionality has been associated with a product’s usefulness/utility (see Jordan, 2000; Shackel, 1991; Sharp, et al., 2007). The central role of functionality in the construction task was further documented by the observation that the attribute was listed most frequently as a reason ‘why’ the self-selected attribute combination was ‘ideal’. Furthermore, two-third of the sample explained their choice for the first brick to be that it was the most important attribute. Of this group, the majority started with functionality.
However, a different picture arose from the initially assessed importance indices. Regarding self-stated importance scores, functionality ranked on fourth position for both age groups (see Figure 6-4, p. 154). It was considered less important than quality, ease of use, and ergonomics. Similarly, it could not compete with quality (or ease of use) as the ‘attribute with the highest priority’. Instead, functionality was chosen 45 times (total 240) as an attribute participants were willing to compromise in exchange for optimizing other attributes (‘Willingness Trade-Off’ in Table 6-5, p. 155). This finding cannot be explained with an orientation toward usefulness.
What accounts for the difference between the general importance rating and the concrete construction of a personally ‘ideal’ product? Rust et al. (2006) demonstrated the phenomenon of ‘feature fatigue’. Before use, consumers favor high-feature models, however, attribute preferences switch from a product’s capability to its usability after a usage experience. It can be hypothesized that participants in the present study related their importance ratings (self-stated importance,
6 STUDY 3 :: WEIGHTING ATTRIBUTES :: COLORING THE BLACK BOX 167
priorities) on previous experiences (‘retrospective’)∗ resulting in a rather hesitant prospective desire with regards to functionality. Quality and ease of use received more attention. However, when confronted with the task of composing an ideal product, participants might have over-emphasized the product’s capability (Thompson, et al., 2005). The task might be comparable to a pre-purchase situation (an ‘anticipated experience’). It would then be expected that if participants would construct products directly after using them (a ‘reflective experience’), functionality would lose some of its pronounced impact. Further data collection is required to determine how usage affects attribute importance.
6.6 METHODOLOGICAL REFLECTIONS
6.6.1 STUDY DESIGN
The logic behind the construction, allocating relative weights to pre-defined attributes that sum to one whole product (100%), is comparable to that of the constant sum scale (Aaker, et al., 1995). However, one disadvantage of the constant sum scale is the possibility that participants could make errors when calculating the relative weights (Kumar, et al., 2002). This potential source of error was avoided in the present study by providing a grid in the black box that needed to be filled. Thus, a visual cue indicated the total sum. The grid was also divided in six columns that facilitated the imagination of a balanced distribution of the six attributes. Strategically, participants relied more on the visual impression than on the numeric calculation of the proportions. As can also be seen in Figure 6-10, p. 160, a number of arrangements evolved during construction and were not computed beforehand (otherwise attributes would be arranged in single blocks and not considered at multiple steps in the construction). Thus, the construction task can be viewed as a work in process and is therefore an extension of data derived from constant sum scales. Here, physical artifacts (bricks) served as thinking tools (Sanders, 2008) that not only help participants to express themselves but also help them to structure their thoughts.
Control Variables
Due to the novelty of the study setup, a number of additional (control) variables were included to check for any inconsistencies, to get a feeling for product synthesis, and to enrich the data in order to verify interpretations. A number of these variables (e.g. priorities, ‘why ideal’, first brick, photographs of colored boxes, visual approach) have already been or will be mentioned elsewhere in the discussion. Here, the attention will be focused on potential contradictions or systematic influences. Fortunately, results were all very supporting.
∗ see Chapter 7 for further discussion on temporal influences affecting attribute importance from a user’s perspective
6 STUDY 3 :: WEIGHTING ATTRIBUTES :: COLORING THE BLACK BOX 168
For example, it could be shown that there was a significant increase in perceived usefulness and likewise perceived likelihood of usage when self-constructing an ‘ideal’ product.
Participants were also rather confident that the selection of attributes really mimics their ‘ideal’ combination (confidence scale in post-questionnaire for each product).
Attributes were assigned to different colors and different positions in the toolbox between sessions in order to prevent any systematic influence of color or position preference. Participants did not feel as if color or position influenced their choice (very low agreement scores to corresponding statements). Neither was an effect found when running the analyses with randomization condition as a between-subject factor. Hence, to be on the safe side, color and position association were altered in this study, but it seems as if this might not be necessary.
Lastly, the task was perceived as being somewhat demanding (evaluation statements); however, participants were very confident that they understood the task demands correctly and were also convinced that they were well able to cope the demands. Even more, participants agreed that they had fun constructing ‘ideal’ products.
Are the two methods of assessing attribute importance – self-stated importance and construction task – equally recommendable for identifying group differences? [RQ 5]
The direct rating of attribute importance was not a very good differentiator of age-specific attribute importance because an overall main effect of age was found (as was also the case in study 2). Older adults generally rated attributes to be more important than young adults. This response behavior has very limiting practical implications. Should the inference be that generally more effort should be invested in the design of products for older adults? Also with respect to attributes such as quality that was repeatedly shown to be more important for young adults? If a group shows an overall different answer behavior than another, attribute-specific differences need to be interpreted with great caution, if at all.
Furthermore, main effects of product value were also detected. The lower overall ratings of utilitarian, difficult products (see Figure 6-5, p. 154) hints to the assumption that, although instructed otherwise, participants adjusted their ratings depending on how relevant they perceived the product itself to be (with the lowest score for the least used product that had additionally the lowest perceived personal usefulness score: the fax machine). This however was not the aim of the rating and should be assessed separately. Only possible attribute-specific effects (between groups and between products) should be revealed with SSI ratings.
Thus, self-stated importance ratings as an independent measure without the necessity of trade-offs during assessment is not very recommendable for the identification of attribute importance, in particular not when comparing different groups.
6 STUDY 3 :: WEIGHTING ATTRIBUTES :: COLORING THE BLACK BOX 169
In contrast, the construction task was a method of assessing relative importance weights. Here, all products were handled equally (all were to be filled with 60 bricks, equating to 100%). The construction task served as a good discriminator as demonstrated by hypothesis-consistent differences of age as well as of product value (H5 confirmed).
Are the two methods of assessing attribute importance – conjoint analysis [full profile] and construction task – equally recommendable for identifying group differences? [RQ 6]
The construction task has been successfully introduced as a measure for relative attribute importance in this study. It was possible to reproduce the significant age group differences found in study 2 with the well-established method of conjoint analysis. The high effort for participants in the conjoint analysis has been mentioned critically (Backhaus, et al., 2008; Green, et al., 2001; Sattler & Hensel-Börner, 2007). The construction task of brick selection was an attempt to assess the importance weights in a more efficient and more engaging way. This goal has been achieved: firstly, in about the same time frame, five times as many products could be studied compared to the conjoint analysis (digital camera only) and the complexity of data analysis was reduced. Secondly, participants enjoyed the task more and gave encouraging feedback.
Both methods require a prior selection of attributes and are limited in the amount of attributes that can be included. Moreover, both showed superior discrimination capabilities compared to SSI ratings. If only the identification of relative weights is of interest, then the construction task appears to be advantageous. This method can also be applied numerous times along the development process. However, conjoint analyses have additional benefits such as the estimation of total utility values of products with different attribute level combinations, the calculation of part-worth utility values of various attribute levels, the evaluation of real products or graphic material, and the approximation of ‘relative importance’ that is based on the impact of level attribute variation. While in conjoint analysis the overall evaluation of a product is emphasized as being a realistic scenario, participants are only regarded indirectly as ‘co-designers’. Their ratings are de-composed afterwards. In the construction task on the other hand, participants provide direct proposals of priorities in line with a participatory mindset (Sanders, 2008), however in a less realistic set-up.
To conclude, a general method recommendation is not possible – it depends on the context and aim of investigation. Possibly, conjoint analysis is better suited to identify different user groups post-hoc, while the construction task is superior in comparing a priori separated user groups. Conjoint analysis might also be better applied at later stages of detail design (Macdonald & Lebbon, 2001), evaluating secondary or even tertiary attributes (Hauser & Clausing, 1988).
6 STUDY 3 :: WEIGHTING ATTRIBUTES :: COLORING THE BLACK BOX 170
6.6.2 EXPERIENCE & FEEDBACK
As already mentioned, the construction task was less time-consuming than the conjoint analysis. Moreover, participants gave very positive feedback (for selection of feedback see Table A. 4-17 in the Appendix). They especially appreciated the active involvement. According to the agreement scores of task evaluation, they even considered the task to be ‘fun’.
During the construction task, participants literally worked with the physical material of attribute bricks – arranging and re-arranging them until the final ‘picture’ seemed right. Participants paused the active construction once in a while to look at the state of their colored boxes, sometimes making changes before proceeding. Before giving the experimenter the signal that they were satisfied with the outcome and ready to fill out the post-questionnaire, it was visible that everyone took a last moment to check the arrangement. The visual representation of relative weights seemed to have guided the identification of attribute importance.
6.6.3 LIMITATIONS
The advantage of assessing relative weights instead of absolute importance values (e.g. self-stated importance) is a constraint at the same time. For one, the amount of attributes that can be included in one assessment is limited and will most likely require a careful pre-selection. This can be achieved, for example, with a prior Kano analysis or single rating. The selection criteria depend on the study goal – if the construction task is meant to mimic weight distribution within a more or less exhaustive description of the product, those attributes that are relevant but to a subordinate degree should be included nonetheless (e.g. aesthetics, emotional involvement). However, if the construction task is meant to promote the identification of the most important attribute, then it would be advisable to include only attributes that have already been recognized to be very important and to prioritize them in a second step.
Also, relative weights are by definition related to one another. Therefore, weights always have to be viewed as an integral part of the entire set of attributes. For example, imagine functionality had been discarded in the present study; the relationship of the remaining attributes might have changed, resulting in a different distribution pattern (e.g. ergonomics and quality receiving similar weights).
The task is less demanding in the sense that participants do not have to calculate the numeric values, however the abstract imagination of the attributes themselves and putting them into proportion is still demanding. Giving an overall rating for each product in the full profile conjoint analysis is easier on the participant as the relative weights will be de-composed arithmetically afterwards.
Deciding whether or not to use an interactive product based on the product’s attributes and selecting an optimal product model is a task known from everyday life. However, the explicit
6 STUDY 3 :: WEIGHTING ATTRIBUTES :: COLORING THE BLACK BOX 171
prioritization of attributes is not. Whether this conscious attribution of hypothetical weights truly mimics a user’s decision making process and whether it has behavioral consequences remain to be verified. For example, Tractinsky and Zmiri (2006) showed a discrepancy between users’ explicit statements regarding influences of preference (primarily usability) and their actual choices (aesthetic considerations). Furthermore, direct responses are endangered by socially desirable answers, which are somewhat less of a concern in indirect assessment such as conjoint analysis (Sattler & Hensel-Börner, 2007). However, the confirmed age differences of the full profile conjoint analysis in the present study provide first indication to trust the method’s validity.
6.6.4 PRACTICAL IMPLICATIONS
A number of implications emerged from this study and shall be discussed below. First, more practical implications with respect to the methodological procedure will be listed before daring an outlook of the method’s possible applications.
If possible, technical jargon should be avoided. Experience from the pre-study showed that participants can be offended by foreign terminology (‘hedonic’ and ‘utilitarian’ value). In the main study, those concepts were simply paraphrased with ‘Type A and Type B products’. Also, in questionnaire design, the ‘voice of the user (participant)’ should be used.
No systematic effect on brick selection was found for color and position arrangements of the attributes. However, if group sessions are conducted, a randomization of product order is recommended. Participants were previously informed that everyone had a different order and that commenting their product would disturb the rest of the group. This instruction was followed in all sessions.
In order to make calculation obsolete and thereby not only reducing the mental effort of the participants but also avoiding potential errors, a simple sum check was incorporated in the black box: a grid outlining the space that needed to be filled. By providing an equivalent number of columns as attributes, weight assignment was further facilitated. Regarding the number of attributes, in theory anything greater than two is possible. However, it is recommended to avoid exceeding seven attributes per assessment (Miller, 1956). After all, attributes need to be stored and accessed in working memory at all times. Particularly older adults might have attention difficulties if the required memory span is set too high (Salthouse & Babcock, 1991).
A practice trial and subsequent clarification of open questions was helpful for some participants and should be included by default.
The diverse arrangements signified that participants made use of their freedom regarding how to arrange the different attributes. Whether more limiting instructions would facilitate or hinder the process remain to be investigated in future studies. Also, different forms could be studied such as a circular arrangement or the literal weighing on a scale with as many arms as there are attributes.
6 STUDY 3 :: WEIGHTING ATTRIBUTES :: COLORING THE BLACK BOX 172
It would also be interesting to see if the resulting weights would differ if participants had to withdraw bricks instead of filling an empty box. For example, in the present study, 360 bricks (6 attributes * 60 bricks) could be offered as the optimum product, of which 300 would need to be removed. Furthermore, the tangible component (bricks) should be compared with the traditional numeric values of a constant sum scale and perhaps also to a virtual variant in a graphical (web) interface (e.g. arranging virtual sliders).
A methodological constraint that might be partly responsible for the prominent attention devoted to functionality was the circumstance that each new trial was introduced by handing out the list of product-specific functionalities on base-product level. This should not be a problem when implementing this method in product development as it is more likely that only one product will be analyzed at a time. Then, all information can be presented on the description of the base product. If the comparison of multiple products is of interest, a presentation of all attributes as product-specific regarding the base product might be suitable.
The definition of the base products sets the threshold for the information retrieved from the construction task. The inclusion of a common baseline seems necessary as otherwise it would be impossible to disentangle how many bricks were invested to ensure mandatory requirements and how many to reflect personal preferences. For theoretical research purposes it was appropriate to relate all products to the same base product (apart from functionality) with minimal attribute fulfillment even if the average product on the market is better (e.g. ease of use for television). However, for product development, one might receive more actionable results when referring to a base product that represents the average product on the market.
Furthermore, one could describe the best product on the market, the company’s own version, or benchmark it to the competitor’s alternative in order to detect future improvement potential. The colored box can serve as a starting point for discussion between user and designer, for example by subsequent ‘laddering’ of the weights (why questions; e.g. “why did you assign attribute x the greatest weight?” or “why is attribute X for product A greater than for product B?”). Thus, this technique can provide important and applicable feed-forward information in early phases of product development.
The method could also be used multiple times in the design process (ISO, 2010). For example, it could be re-applied after a usage experience with a prototype (or already existing product). Both is thinkable: for one, that participants take the usage experience as a reference and highlight space for optimization in their construction, or that participants evaluate the tried-out product by indicating their perception of attribute fulfillment.
Basically, the method could also be used within a design team to see if all have a common understanding of the priorities. This team estimate, the anticipation of attribute importance from a user’s perspective through the team, could be further compared with the actual importance values indicated by real users, thus, comparing top-down expectations with bottom-up data. This

6 STUDY 3 :: WEIGHTING ATTRIBUTES :: COLORING THE BLACK BOX 173
could be a valuable source of reflection, in particular when designing for a different group than oneself belongs to (e.g. different age, different culture, different context).
To conclude, the present study was the initial step to test a novel variant of assessing relative importance weights of attributes in an efficient as well as engaging way. Tangible representatives were used to support the rating process and to reduce the cognitive strain of participants. It was intended for a ‘design for but also with users’ approach (Eason, 1995), actively involving users for the assignment of value judgments. It was further aimed to combine a direct assessment of attribute importance and the consideration of trade-offs. Results are promising, but further research is mandatory to verify its validity, reliability, and potential.
7 CONTINUE :: CONTINUOUS USER EXPERIENCE
7.1 DIVERSITY OF ATTRIBUTES AND DYNAMICS OF USER EXPERIENCE
The combination of the diversity of attributes identified in study 1 and published findings indicating that attribute importance may be subject to change with increasing experience (Duke & Mount, 1996; Karapanos, Zimmerman, Forlizzi, & Martens, 2009; Lee & Koubek, 2010; Minge, 2008; Rust, et al., 2006) called for a conceptualization of user experience that extends the focus beyond mere usage situations and takes dynamics of user experience into account.∗
For example, pre- and post-use importance (SSI) ratings were compared in a study by Duke and Mount (1996). A distinct decrease in importance was observed for the product’s price, while the importance of ease of use increased after product trial. An increased impact of ease of use on user preferences after actual use has also been demonstrated for simulated systems with experimentally varied levels of aesthetics/attractiveness and usability. Lee and Koubek (2010) showed that before actual use, aesthetics – but not usability – significantly affected user preferences. It was only after use that both attributes had a significant influence. Similarly, while before use both ‘high-attractive’ versions of a simulated MP3 player were rated as more attractive than the two ‘low-attractive’ versions – regardless of usability – the picture changed after use (Minge, 2008). Post-use evaluations of attractiveness showed a decrease for the ‘high-attractive/low-usable’ variant on the one hand and an increase for the ‘low-attractive/high-usable’ system on the other hand. Another line of research illustrating the importance of usability after use contrasts it to the role of functionality.
Rust et al. (2006) demonstrated in one study that even though study participants were aware that an increase in functionality might result in a decrease in usability, most chose the high-feature model. In a second study, they could expand this finding of favoring a feature-overloaded product before use even when it was up the participants to select each feature. A fundamental shift in preference could be observed in a third study: of those participants who actually used a product (which was not the case in the first two studies), only few still chose the high-feature model and if they did, they were less confident about their choice. Thus after usage, usability increased in importance. ∗ This chapter is partially based on Pohlmeyer, A. E., Hecht, M., & Blessing, L. (2009). User Experience Lifecycle Model ContinUE [Continuous User Experience]. In A. Lichtenstein, C. Stößel & C. Clemens (Eds.), Der Mensch im Mittepunkt technischer Systeme. Fortschritt-Berichte VDI Reihe 22 Nr. 29 (pp. 314-317). Düsseldorf: VDI-Verlag. ISBN 978-3-18-302922-8
7 CONTINUE :: CONTINUOUS USER EXPERIENCE 175
HCI studies commonly focus only on the interaction itself and the subsequent evaluation of the usage experience. The examples listed above show that users might perceive and weight attributes differently before and after actual use. Consequently, all three phases – before, during, and after use – should be considered when designing for a positive user experience. In fact, the ISO standard 9241-210 (2010) has included this temporal perspective and thereby widened the predominant focus of usability studies on the interaction itself: “User experience includes all the users’ emotions, beliefs, preferences, perceptions, physical and psychological responses, behaviours and accomplishments that occur before, during and after use” (ISO, 2010, p. 3).
In a similar vein, Roto (2007) suggests that user experience (UX) can be differentiated into three phases: (1) expected UX, (2) UX during interaction, and (3) overall UX. ‘Expected UX’ refers to a user’s expectations relating to the product and anticipation of the interaction and its outcome before actual use, i.e. ‘anticipated use’ (ISO, 2010). ‘UX during interaction’ is obviously a central scope in HCI research. ‘Overall UX’ accounts for experiences and/or supplementary information outside the interaction that affect a user’s attitude toward the product. For example, reading a positive review about the product in a magazine or listening to a friend complaining about a dissatisfying experience will influence the user’s own user experience even without reference to self-experienced interactions.
Despite the important acknowledgment of temporal aspects (Hassenzahl & Tractinsky, 2006), the explicit consideration of prolonged use, i.e. the influence of repetitive experiences and of longer time periods, has not been addressed in the ISO standard 9241-210 (ISO, 2010) nor in Roto’s (2007) model. A longitudinal study and derived framework on ‘Temporality of Experience’, conducted by Karapanos, Zimmerman, Forlizzi, and Martens (2009) should be mentioned in this context. The experiences of six participants were observed over a 5-week period – one week before the purchase of an Apple iPhone and four weeks subsequent to purchase. The authors identified three phases of adoption following ‘anticipation’ in the week prior to purchase: (1) orientation, (2) incorporation, and (3) identification. Attribute importance was shown to vary with prolonged use – while in the orientation phase, the device’s ease of use (learnability) and stimulation (novelty) were dominant predictors of the product’s overall ‘goodness’, its usefulness gained in importance as the phone’s features/apps were increasingly incorporated in the user’s life. In the final phase of ‘identification’, ‘goodness’ was primarily influenced by ease of use (long-term usability) and identification. The transition across phases has been related to the three forces ‘familiarity’, ‘functional dependency’, and ‘emotional attachment’.
Integrating the findings of the studies described previously (Duke & Mount, 1996; Lee & Koubek, 2010; Minge, 2008; Rust, et al., 2006) with those of Karapanos et al. (2009) it seems that the pronounced appreciation of ease of use directly after using the product for the first time can be explained by two reasons. Firstly, ease of use is difficult to recognize before use (Lee & Koubek, 2010). Secondly, in an initial interaction, the user needs to become familiar with the device and needs to learn how to interact with it. The potentially strong instrumental focus in laboratory
7 CONTINUE :: CONTINUOUS USER EXPERIENCE 176
settings with unfamiliar devices has been discussed in the context of the design of study 1 where participants were able to evaluate familiar products. Once an orientation phase has been accomplished, long-term aspects such as the meaningfulness of the device and usefulness of its functionalities as well as emotional attachment receive greater attention (Karapanos, et al., 2009).
It appears possible that after a while, the three phases of orientation, incorporation, and identification enter a repetitive loop, e.g. if a new feature has been added or if the system’s software has been updated. A new context or a rarely used task might necessitate a phase of orientation again. Depending on the familiarity with the system and the context, the user can focus on the goal/task itself (overall problem) or needs to (re-)focus on the interaction problem (Streitz, 1986). One impression derived from the statements of study 1 was that the dynamics of user experience and the associated importance of certain attributes are not to be seen as a linear process but rather as a gradually evolving, iterative progression. Such a cyclic process might also have been intended by Karapanos et al. (2009) when choosing a round-shaped form to represent their model.
Long-term use certainly extends the first four weeks of owning a new product. Retrospective statements provided by participants in study 1 of this thesis illustrated that some attributes only become apparent after multiple interactions, sometimes even year-long usage. For example, the appreciation of durability, the frustration due to frequent repairs, the nostalgic attachment based on the device itself or on the design era that is associated with it, as well as the recognition of an environmentally friendly wastage solution are aspects of user experience that become relevant over time. Hence, the diversity of attributes was not only a matter of instrumental vs. non-instrumental qualities, as discussed previously, but also in terms of temporality. Likewise, attribute importance is likely to be subjected to change. For instance, the relative importance of a product’s quality (reliability) is bound to increase with prolonged use (Pahl, et al., 2007).
7.2 USER EXPERIENCE LIFECYCLE MODEL CONTINUE [CONTINUOUS USER EXPERIENCE]
An experience is said to have a beginning and an end (Forlizzi & Battarbee, 2004). But when does an experience start and when does it end? Should the experience be limited to the actual interaction with the product? Here, it is argued in accordance with ISO 9241-210 (ISO, 2010) that already the anticipation of a product or its use is part of a user experience. An anticipation includes associated beliefs, attitudes, and expectations that arise outside, perhaps even before an interaction (e.g. through advertising campaigns, peer recommendations, prior experience, contextual standards). With this in mind, user experience would also include the user’s intention to use a product.

7 CONTINUE :: CONTINUOUS USER EXPERIENCE 177
In respect of the end state, user experience is being suggested as a continuous process. Rather than considering an experience to end abruptly, an experience of a user with a product can be compared to a relationship between the two. First, the user needs to become familiar with the product. Through customization and perhaps adaptation the system also gets to know the user. Both change over time, e.g. through learning on the user’s side and wear on the product’s. Furthermore, their relationship is also likely to change. As indicated by Karapanos et al. (2009), the user might rely on the system (‘functional dependency’) and even become emotionally attached to it. Anticipation, perhaps purchase, a first interaction (possibly including system setup/installation), and – in the case of repetitive usage – multiple subsequent interactions, as well as maintenance and disposal are all examples of experiences that cumulate to an overall evaluation of the user experience. Parallels can be drawn to a product’s lifecycle (Pahl, et al., 2007) from manufacturing, marketing, sales, use, after-sales services, and disposal. Likewise, user experience can be viewed as a lifecycle – influenced by prior experiences and expectations, changes of the user, the system, and/or the context, the user evaluates the experience as a whole. Even if the product has already been disposed of or if it was only used once, the memories remain and will influence future expectations and behavior. Thus, a user experience continues as long as memories last. Perhaps, active and passive user experience can be distinguished: on the one hand, active user experience refers to actual use situations and can therefore be framed within definite start and end points. On the other hand, passive user experience continues even without actual interaction (i.e. beliefs, memories); thus, similar to Roto’s (2007) phase of ‘overall UX’. It might decrease in salience but will never end completely.
The User Experience Lifecycle Model ContinUE [continuous user experience], as proposed in the following section, aims to incorporate the aspects listed above. It illustrates sequential phases of a user experience lifecycle and influencing factors (see Figure 7-1). ContinUE extends existing models of user experience by integrating a prolonged temporal perspective, accounting for repetitive episodes, and highlighting the continuum of user experience.
Figure 7-1 User Experience Lifecycle Model ContinUE: Continuous User Experience
7 CONTINUE :: CONTINUOUS USER EXPERIENCE 178
Anticipated Experience
Even before interacting with a product or system, the user-to-be already has formed certain expectations. These can be positive (e.g. hopes) as well as negative (e.g. fears). If negative expectations outweigh the positive ones, it might never come to an actual trial of the system. Due to the uncertainty of the situation, expectations can be realistic as well as unrealistic. Expectations are based on prior experiences and the person’s attitude. The attitude is influenced by salient beliefs and by attribute importance from the user’s perspective. Furthermore, the person’s personality, skills and/or perceived competence will affect expectations (Beauregard & Corriveau, 2007; ISO, 2010). In the case of a new product type, with no prior experience of similar systems, information is gathered through peers and media; expectations might further arise through analogies made to other products, whether they may be appropriate or not. Anticipated experience is the person’s response to the imagined outlook of the experience before actual use.
In-Situ Experience
This phase is the core concern of usability and user experience – it relates to the actual use situation, i.e. the interaction. The interaction is influenced by characteristics of the user (e.g. skills, preferences), the system (instrumental as well as non-instrumental attributes), and the context (e.g. surrounding, time pressure)/task (ISO, 2010; Mahlke & Thüring, 2007; Roto, 2007). It was earlier referred to as the active experience of a user interacting with the product.
“UX is a consequence of a user’s internal state (predispositions, expectations, needs, motivation, mood, etc.), the characteristics of the designed system (e.g. complexity, purpose, usability, functionality, etc.) and the context (or the environment) within which the interaction occurs (e.g. organisational/social setting, meaningfulness of the activity, voluntariness of use, etc.)” (Hassenzahl & Tractinsky, 2006, p. 95).
Reflective Experience
After interacting with the product, the user reflects on the encountered experience. In particular, it is of relevance whether expectations have been fulfilled, exceeded, or disappointed. Oliver (1993, 1997; Oliver & Desarbo, 1988) calls the latter two outcomes positive and negative disconfirmation, leading to satisfaction and dissatisfaction, respectively. The evaluation of the interaction and the resulting behavioral and emotional consequences are not only a matter of success or of failure, but are also affected by the attribution of the outcome (Oliver, 1997; Oliver & Desarbo, 1988; Weiner, 1985). Attribution is the causal inference of an outcome; the interpretation of causality for the success or failure of an event (e.g. interaction), respectively, is linked to the perception of locality, stability, and controllability (Weiner, 1985). In other words, depending on whether the user perceives him-/herself or external factors (e.g. the system, the context) as being responsible for the success or failure (locality), whether the cause is perceived to be of stable or of variable nature (e.g. task difficulty vs. luck), and whether it is perceived as
7 CONTINUE :: CONTINUOUS USER EXPERIENCE 179
controllable or not (e.g. effort vs. mood), different behavioral and emotional responses are the consequence (‘immediate effects’). For instance, the combination of a successful interaction and an internal-stable-controllable attribution is likely to lead to affective responses such as ‘pride’ and ‘self-esteem’ while an external attribution might rather evoke ‘gratitude’. In case of an unsuccessful interaction that is attributed as internal and controllable, the user might respond with ‘guilt’ or ‘shame’. Such responses will in turn influence future expectations as well as future behavior.
Repetitive Experience
Some products might only be used once (e.g. a ticket machine in a foreign country while on travels). In this case, the active user experience terminates with the reflective phase and the memory of the interaction lasts in form of a passive, retrospective experience. In Figure 7-1 such a unique episode is visualized by considering only ‘filled’ phases. These core phases are indispensable elements of every user experience.
However, most products are used several times. This optional extension is illustrated in form of ‘dashed’ phases in Figure 7-1. While a prospective experience relates to the re-use of a similar, but essentially different product (e.g. considerations when buying a new mobile phone, choosing the model of a rental car), repetitive experience(s) apply to the same device that is being used several times. A repetitive experience is a repeated sequence of the first three phases, i.e. pre-use, use, post-use. In spite of recurrent phases, the influencing factors user, system, and context underlie contextual variability (e.g. preferences of the user when in public or at home, installation of system vs. use vs. disposal) and temporal dynamics with short-term and long-term effects (e.g. learning; expectations, durability, wear). Consequently, the user’s evaluations of the different interactions will vary. In addition to the variability and changes of each factor – user, system, and context – separately, their interdependencies will also evolve over time. Furthermore, features that initially surprised and delighted the user, i.e. attractive requirements (Kano, et al., 1984), might be perceived as a matter of course (‘must-be’) or even as annoying (‘reversed’) after a while. As mentioned above, the relationship between a user and a product matures and might undergo different phases of adoption as suggested by Karapanos et al. (2009), i.e. orientation, incorporation, identification. Resultant effects of prolonged use are ‘functional dependency’ and ‘emotional attachment’ that imply changes in attribute importance.
Repetitions of reflective experiences after each interaction can be seen as formative, ongoing evaluations.
Retrospective Experience
The summative evaluation of the product and its experience relies on the memories of past experiences and the appreciation of their consequences. In particular salient memories such as
7 CONTINUE :: CONTINUOUS USER EXPERIENCE 180
the experience of ‘peak affect intensity’ and the last interaction greatly influence the overall evaluation of the emotional consequences (Fredrickson, 2000). In the end, it is more lasting and influential for future behavior what the user remembers of the experience(s) than what he/she actually experienced during interaction (see Kahneman & Riis, 2005 for a differentiation between the 'experiencing self' and the 'remembering and evaluating self').
Clearly, in addition to an evaluation that is based on affective memories, the user reflects on the past use also in respect of overall instrumentality of the product and to what extent expectations have been fulfilled in general.
Prospective Experience
Past experiences and their evaluation by the user with one product are the prior experiences with regards to the next product. The likelihood of re-using a product of the same type (e.g. mobile phone, microwave) depends on the summative evaluation of previous experiences. Furthermore, the user’s expectations and preferences are likely to have concretized, which might lead to a re-use within a product type but with a different version (e.g. different brand, other features).
Whereas the repetitive loops of using the same product numerous times point to the dynamics within a product-lifecycle, the inclusion of a prospective experience illustrates a more overarching cycle of continuous user experience.
7.3 IMPLICATIONS FOR ENGINEERING DESIGN
From an engineering design perspective it was argued that all phases of a product’s lifecycle affect user experience. Hence, changes of the product, but also of the user, the context and their interdependencies should be considered in terms of a holistic, long-term view of the ‘user experience lifecycle’ in order to achieve designs for a positive evaluation of the experience and an enhanced likelihood of (re-)use.
Designing for an entire user experience lifecycle thereby widens the temporal focus of the interaction itself (in-situ experience). The anticipation of an interaction before actual use as well as the prospective outlook with regards to the possibility of re-using a similar system form the early phases of a new user experience. These are crucial with regards to technology adoption and need to be addressed in the design process as has been argued throughout this thesis.
The chosen methods have shown that there are multiple ways to integrate users actively in early product development, even in the strategic planning phase prior to prototype development (Gould & Lewis, 1985; Pahl, et al., 2007). Their subjective perception of attributes affects the likelihood of technology adoption or rejection. It is therefore reasonable and also feasible to
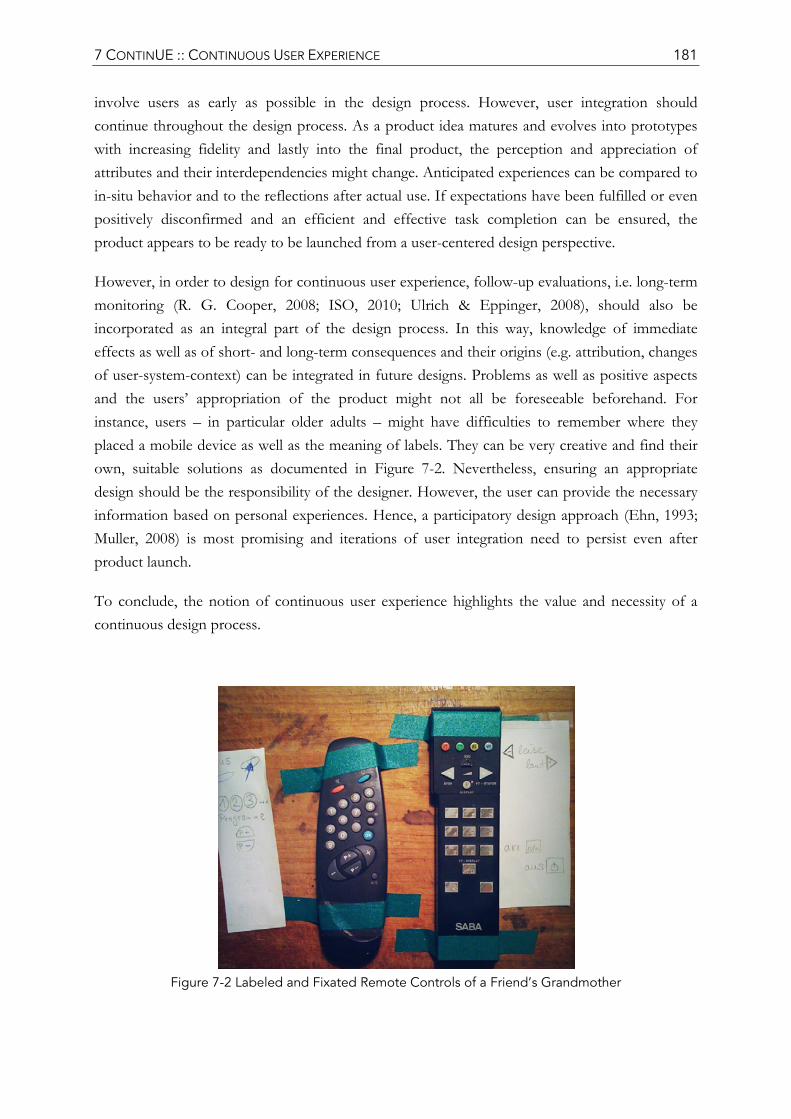
7 CONTINUE :: CONTINUOUS USER EXPERIENCE 181
involve users as early as possible in the design process. However, user integration should continue throughout the design process. As a product idea matures and evolves into prototypes with increasing fidelity and lastly into the final product, the perception and appreciation of attributes and their interdependencies might change. Anticipated experiences can be compared to in-situ behavior and to the reflections after actual use. If expectations have been fulfilled or even positively disconfirmed and an efficient and effective task completion can be ensured, the product appears to be ready to be launched from a user-centered design perspective.
However, in order to design for continuous user experience, follow-up evaluations, i.e. long-term monitoring (R. G. Cooper, 2008; ISO, 2010; Ulrich & Eppinger, 2008), should also be incorporated as an integral part of the design process. In this way, knowledge of immediate effects as well as of short- and long-term consequences and their origins (e.g. attribution, changes of user-system-context) can be integrated in future designs. Problems as well as positive aspects and the users’ appropriation of the product might not all be foreseeable beforehand. For instance, users – in particular older adults – might have difficulties to remember where they placed a mobile device as well as the meaning of labels. They can be very creative and find their own, suitable solutions as documented in Figure 7-2. Nevertheless, ensuring an appropriate design should be the responsibility of the designer. However, the user can provide the necessary information based on personal experiences. Hence, a participatory design approach (Ehn, 1993; Muller, 2008) is most promising and iterations of user integration need to persist even after product launch.
To conclude, the notion of continuous user experience highlights the value and necessity of a continuous design process.
Figure 7-2 Labeled and Fixated Remote Controls of a Friend’s Grandmother
8 GENERAL DISCUSSION
Elaborate discussions have followed the individual results of each of the three studies presented in this thesis (see p. 91, p. 124, and p. 162). In this section, findings will be discussed in terms of an integrative view across all three studies.
8.1 INTEGRATION OF EMPIRICAL RESULTS
The set of attributes derived from the first study proved the value of integrating real users. Users are concerned with user experiences on a daily basis and not constrained to the exploration of a new prototype in a one-hour laboratory session or to one specific discipline. As illustrated in the ContinUE model (see Chapter 7), user experience can be seen as a relationship between a user and a product that evolves over time and is subject to the dynamics of changes a user might undergo (e.g. learning to use the product), changes of the product (e.g. wear), and changes of context the product may be used in (e.g. at night, on vacation, in the subway, at work). Theoretically derived attributes are important, but in practice the user is the expert who can also point to simple, yet decisive aspects that might have not been included in theoretical concepts, such as whether a device is easy to maintain or whether it fits into one’s apartment. Many studies on user experience have focused on websites or used computer-based simulations of interactive products (e.g. MP3 players, ATMs) (e.g. Hartmann, et al., 2008; Hassenzahl, 2004; Mahlke & Thüring, 2007; Tractinsky, et al., 2000) and did not pay attention to the input devices (the hardware component of the system). If the same approach would have been followed here, the key role of physical ergonomics would have been missed out on. The identified strategic attributes (usefulness, functionality, ease of use, ergonomics, quality, aesthetics, emotional involvement, costs) are comparable to existing catalogs (Garvin, 1984; Hartmann, et al., 2008; ISO, 2001; Jordan, 2000; Shackel, 1991; Stewart, 1992). However, the list is more comprehensive, including instrumental as well as non-instrumental attributes and presumably the first that has been derived by including young and older users.
On a general, product-independent level (general reasons in study 1) no significant age differences could be observed. Furthermore, all attributes (with the exception of functionality – most likely due to a conflicting formulation of the two levels, see p. 124f for details) significantly
8 GENERAL DISCUSSION 183
predicted likelihood of use in the conjoint analysis (study 2). Age differences related to the predictive strength of specific attributes.
In all three studies, age differences were found with regard to quality and ergonomics. Quality was more important for young adults, whereas a good physical handling (ergonomics) of the device was more relevant to older adults than to young adults (in study 1 this difference was found for positive statements). These differences, in particular regarding the emphasis of quality in the young cohort, did not only become apparent in trade-off scenarios (construction task and priority rankings in study 3, conjoint analysis in study 2, and to some extent relative frequencies in study 1), but also for independent classifications as demonstrated with the Kano Method in study 2 as well as in the open statements of ‘why ideal’ in study 3.
The consistency of results with respect to age group comparisons, in particular given the diversity of methods used, can be taken as a support of their robustness. Given the low correlations of different attribute importance measures reported in the literature (Jaccard, et al., 1986; van Ittersum, et al., 2007) this is even more encouraging. However, this consistency should not be understood to mean that methods can be used interchangeably. To the contrary, as will be discussed in Section 8.2, a triangulation of methods should also be pursued in practice as each method was able to make its own unique contribution – for example, the role of aesthetics for older adults differed depending on whether they had to put it into relation to other attributes or were free to appreciate it in its own right.
In contrast to age differences in quality and ergonomics, differences regarding aesthetics seemed to be primarily a consequence of trade-offs: young adults had higher part-worth utilities in study 2 and used more bricks in study 3 than older adults, but demonstrated similar scores of satisfaction and dissatisfaction in the Kano Model, and lower self-stated importance ratings. However, self-stated importance ratings should be interpreted with caution, because a main effect of age (older adults gave generally higher ratings, both in study 2 and study 3) might have affected age x attribute interaction effects. Furthermore, in the second study, the group of young and the group of older adults showed no significant differences in the scale of Centrality of Visual Product Aesthetics (Bloch, et al., 2003). Also, when asked to freely list general motivating and de-motivating reasons of technology use in study 1, the two age groups did not differ in the amount of listed reasons relating to aesthetics. To conclude, the findings of the three studies suggest that older adults also care about aesthetics and that it should also be regarded as a predictor of technology adoption for this user group. However, in relation to attributes that are more urgent for the interaction, i.e. ergonomics, older adults seem to be forced to cut back on aesthetics more than young adults. The implication that arises for product development is that easy handling needs to be ensured for older adults, however, if this is taken care of or if there is generally no need for cut-backs, aesthetics should be taken seriously also for older users. It would be inappropriate to assume that elderly do not take this attribute into consideration (Stewart, 1992).
8 GENERAL DISCUSSION 184
Kano et al. (1984) view their model of customer satisfaction (see also Figure 5-1, p. 102) as a dynamic model. Over time, as people get used to attractive requirements, these might shift to must-be requirements (see also Jordan, 2000; Nilsson-Witell & Fundin, 2005). Interestingly, as we age, the temporal trend might reverse again – some requirements might be able to evoke satisfaction again. This might be the case for older adults and ergonomics, explaining the age x valence x main attribute-category interaction effect in study 1 (see Figure 4-5, p. 88). Possibly, this is because elderly do not take their own sensory and motor capabilities for granted anymore (see Section 2.4.2).
Overall, findings in this thesis suggest that instrumental attributes are of higher priority than non-instrumental attributes. This difference varies to some extent as a function of associated product value. As was shown in study 3, aesthetics and emotional involvement were more important in hedonic than utilitarian products, reducing the disparity from instrumental attributes. Furthermore, the dominance of instrumental attributes seems to be partly due to strong negative reactions regarding the outlook of an insufficient attribute fulfillment. For example, if ergonomics is so poor that one is not able to operate a device, everything else seems relatively negligible. This pattern was found by significant differences in valence in study 1 and confirmed by pronounced coefficients of dissatisfaction in the Kano Model of study 2. On the other hand, looking at the motivating reasons in study 1, non-instrumental attributes were named increasingly frequent, i.e. aesthetics was ranked second. Also, aesthetics and emotional involvement (together with an intuitively usable interface - ease of use) received the highest coefficients of satisfaction in the Kano Model. Thus, users are concerned to ensure a usable interface. However, non-instrumental attributes certainly have the potential to delight users and thereby to increase a product’s appeal. Their potential just might not become evident as long as one has to worry on an operational level. This argumentation can also explain findings in the third study. Here, the description of the base product was very limited, yet guaranteed that a device was at least usable (physically operable and understandable with support). This assurance might have given participants the confidence and freedom to reduce the emphasis on ergonomics and ease of use to fulfill their desire for increased functionality. Hence, technology adoption is not only a matter of approval but at the same time of non-rejection.
Attributes were presented and instructed to be seen as distinct attribute classes. In other words, it was assumed that the variation of one attribute would not affect the performance of the others. For example, an enjoyable interface was not necessarily also easy to understand and a reliable, high-quality product did not necessarily come with more functionalities. Such a controlled variation of attributes allowed the assignment of importance values for the contribution of each attribute in its own right. This kind of information separation can be found, for instance, in situations where users anticipate an experience based on written material (e.g. list of facts regarding product performance in shops or experience reports of previous users).
8 GENERAL DISCUSSION 185
However, even if attributes can be objectively separated in design, the user might have heuristics that lead to a perception of overlapping attributes when confronted with a real product (or prototype). For example, an increasing number of features is usually associated with decreasing usability (Rust, et al., 2006). Moreover, users’ perception of interdependencies between usability and aesthetics have been reported in empirical studies (Ben-Bassat, et al., 2006; De Angeli, et al., 2006; Hartmann, et al., 2008; Hassenzahl, 2004; Lee & Koubek, 2010; Minge, 2008). An effect similar to a Halo effect known from social psychology (inferring a positive characteristic from another positive characteristic, e.g. good looking people are more friendly) was also shown for the judgment of interactive products: “what is beautiful is usable” (Tractinsky, et al., 2000). Furthermore, the positive effect of aesthetics is not only limited to the judgment of usability, but can actually enhance task performance (Sonderegger & Sauer, 2010), which could be summarized as “aesthetically pleasing objects enable you to work better” (Norman, 2004, p. 10). It is therefore not only essential to know how users judge the importance of each attribute but also how their perception of attributes overlap.
Furthermore, the appreciation of attributes differs before and after use (Karapanos, et al., 2009; Lee & Koubek, 2010; Minge, 2008). Ease of use becomes an increasingly important attribute with direct experience (Hamilton & Thompson, 2007). As already discussed in study 3 (see Note on Functionality, p. 166), users might experience something like ‘feature fatigue’ (Rust, et al., 2006; Thompson, et al., 2005): despite pronounced request of many features before use, products with high capability (number of features) were evaluated more poorly after use, while those with good usability (ease of use) were evaluated more favorably. Thompson et al. (2005) conclude as a managerial implication that depending on the firm’s objective, one could maximize initial purchase by offering an excess on features, maximize repurchase by providing good usability at the cost of a minimum of features, or aim for a balanced optimum. A similar conclusion can be drawn for technology adoption and acceptance, irrespective of purchase. Anticipated attribute importance might be decisive regarding initial usage (adoption), however, attribute importance during and after usage might determine whether a system will be re-used (technology acceptance), see also Figure 7-1, p. 177. As mentioned in the presentation of the ContinUE model in Chapter 7, user experience should be seen over an entire user-product lifecycle, thus also over longer time periods.
As a result, all judgments – anticipated judgments, those based on perception, and those based on short-term as well as long-term experience – should be considered in product development. Neither relying solely on preferences of anticipation, nor solely on retrospective evaluations will be able to account for the entire spectrum of technology acceptance. The design process might start out with methods tackling a user’s anticipation, eventually shifting to the perception and interaction as prototypes become available. Possible differences should not be interpreted as contradictory and more recent findings must not substitute previous ones. On the contrary, results should be integrated and the design specification should be updated by adding information without deleting existing findings (Pahl, et al., 2007). It is the joint consideration of
8 GENERAL DISCUSSION 186
anticipation, perception, and eventually reflection upon an interaction that will also enable the transition from technology adoption to technology acceptance (Kollmann, 2004).
Limitations
Findings regarding age differences are subject to the general limitations of cross-sectional comparisons. As studies were no longitudinal investigation of the same participants over their lifespan, it cannot be assumed with certainty that the age-related differences found here were truly an effect of age. They might as well have been an effect of the particular cohort. Hence, different experiences and circumstances that people encountered in formative years and over a lifetime might have been responsible for group differences and not the factor of age per se (Docampo Rama, 2001; Docampo Rama, et al., 2001). In this thesis, the two age groups belonged to two distinct cohorts with regards to technology – the electro-mechanical generation vs. the software generation (Docampo Rama, 2001; Docampo Rama, et al., 2001). However, there were no technology-generation differences within age groups (all young adults belonged to the software-, all older adults to the electro-mechanical generation) and efforts were made to keep age groups as homogenous as possible – i.e. elderly were all over 65 years and therefore most likely in retirement; gender-balanced; all participants in the second study had prior experience with digital cameras. The most pronounced age difference was found for ergonomics, which was also expected to be more critical for older adults due to developmental changes (e.g. Mitzner, et al., 2006; Schieber, 2003).
Still, the possibility that the age group differences found were caused by an effect of cohort cannot be ruled out completely. However, it is unlikely that such differences will disappear entirely once the software-generation has grown old. There are reasons to assume that the elderly will keep lagging behind young adults in technology adoption also for the generations to come (Charness & Boot, 2009). The fast-paced development of new interactive paradigms and technological possibilities will probably uphold a gap between users experiencing these during their formative years and those of higher age.
Main Contributions and Findings
Set of strategic attributes relevant for the adoption of interactive technologies; for young as well as for older adults; including instrumental as well as non-instrumental attributes: Usefulness, Functionality, Ease of Use, Ergonomics, Quality, Aesthetics, Emotional Involvement, Costs.
Motivating and de-motivating reasons of technology use are distinct: Poor ergonomics and poor quality as well as high costs hinder technology adoption more than the reverse fosters use; poor ergonomics and poor quality lead to high levels of dissatisfaction.
8 GENERAL DISCUSSION 187
Valued usefulness_functionality motivates use more than the lack of it hinders use and it relates more to positive than to negative appraisal of interactive products; an appealing aesthetics and positive emotional involvement lead to high levels of satisfaction.
Age group differences in relative attribute importance were identified (different methodological approaches support the robustness of findings): Quality is more important for young adults than for older adults; Ergonomics is more important for older than for young adults; Aesthetics is less important for older adults if trade-offs have to be made.
Products differ in attribute importance: Quality is more important in utilitarian products; Aesthetics and emotional involvement are more important in hedonic products.
The conceptual framework ContinUE illustrates phases of a continued user experience.
Application
Possible application scenarios have been described in the introductory section on product development (Section 2.1, p. 6). Attribute importance from a user’s point of view is in particular valuable for the specification of a user-oriented requirement list as has been illustrated in the House of Quality (Clausing, 1994; Griffin & Hauser, 1993; Hauser & Clausing, 1988). Relative importance weights help to strategically decide whether the investment of time, money, and/or expertise is feasible for certain attributes and how to allocate limited resources, hence, how to make trade-offs in order to design a product that is likely to be accepted by potential users (Ulrich & Eppinger, 2008).
Foremost, products have to be usable – especially older adults, who might have increased difficulty with fine motor movement and dexterity (Chaparro, et al., 2000; Ketcham & Stelmach, 2004; Stewart, 1992) regarded ergonomics as a key attribute. While the threshold for young users might have been lower regarding tolerable ergonomics, they were consequently less concerned whether they were capable to use the device than rather how reliable the system was and of what quality the outcome could be expected. In other words, while older adults were more task-oriented, i.e. concerned with the ‘interaction problem’ (Streitz, 1986), young adults were more goal-oriented. This is certainly no optimal situation – hopefully, future products allow older users to focus on the goals with the same emphasis as young adults can. As long as this is not ensured, resources need to be devoted to the essentials of good ergonomics in the development of products for the elderly. Possible areas of compensation could be a less pronounced investment in quality and aesthetics.
If young adults are faced with the option of experiencing difficulties to understand the use of a product as was described in the conjoint analysis of study 2 and in the base product of study 3, no age differences in respect of ease of use could be found.
8 GENERAL DISCUSSION 188
Designers should be aware of the possible independence of motivating and de-motivating factors, possibly addressing must-be requirements first. However, a mere prevention of pain or other health problems without the promotion of pleasure seems to be of limited appeal (Hancock, et al., 2005), in particular for consumer products. In addition, it seems to be worthwhile to investigate the user’s responses to presence and absence of attributes. Reactions might differ across users, and might even lead to opposing preferences, as observed for the alternatives of primary and secondary functionalities in study 2. The targeted user group might be more diverse than initially assumed, perhaps even calling for an additional segmentation and specialization of the design.
As shown in study 3, attribute importance differed for products associated with different values. Ultimately, it is the triad of user-system-context that will determine attribute importance. In the design process, an exhaustive exploration of requirements relating to the user, the system, the context, and foremost to the interrelations among the three needs to be taken into consideration (ISO, 2010). Context can also be regarded as the temporal context – before, during, or after use. Thus, the dynamics of attribute importance can also help setting strategic priorities (Thompson, et al., 2005). The approach demonstrated here can serve as an initial point of reference for the design specification in early development phases. Along the design process, the design specification will need to be extended and updated as information increases (see Figure 2-1 and Figure 7-1).
8.2 INTEGRATION OF METHODOLOGICAL REFLECTIONS
A number of methods to support user-centered design have been applied across the three studies. Methods varied in multiple aspects, i.e. regarding the degree of user engagement, whether relative weights were captured directly or statistically derived afterwards, whether trade-offs needed to be taken into account during assessment or not, whether an experience needed to be anticipated or could be remembered relating to a specific product in the home environment.
Findings differed to some extent depending on the method of choice. Yet, differences were not perceived as contradictory. To the contrary, as each method tackled the issue from a slightly different angle, results were able to complement one another. The findings of study 2 are able to illustrate this point: the addition of the Kano method, which looked into each level variation of the conjoint analysis separately, revealed that the sample included two groups with opposing preferences regarding functionality. This might have been the reason why functionality did not succeed in significantly predicting likelihood of usage although high scores of self-stated importance pointed to a substantial effect of this attribute. Only the triangulation of methods could clarify the discrepancies.
8 GENERAL DISCUSSION 189
As reported in the review on user experience by Bargas-Avilla and Hornbæk (2011), in addition to the three temporal assessment points of user experience – before, during, and after a specific interaction – a fourth dimension can be included: imagined interaction. If it is not the evaluation of a concrete product that has just been tried out, but rather an abstract appraisal or anticipation of importance, it is essential to collect information on various levels. For example, in early product development, data on retrospective experiences as well as on prospective experiences can be collected as was the case in study 1. Likewise, the detailed presentation of product models in the conjoint analysis (i.e. stimulus cards) and description of the base product and its extensions in study 3 might have helped immerse participants into a real experience, attenuating the fact that it was only an imagined experience (Hamilton & Thompson, 2007). On the other hand, self-stated importance ratings that are held fairly abstract might be rather overall judgments. Similarly, Gustafsson and Johnson summarize “Our conclusion is that statistical estimates of importance identify those attributes that have had the greatest impact on a customer’s more recent consumption experiences, whereas direct ratings∗ capture what is more globally salient to customers and thus important over time” (Gustafsson & Johnson, 2004, p. 137). For product development, both views are essential and should therefore also be both captured in order to make sound strategic decisions.
In addition, main effects of products in the self-stated importance ratings of study 3 suggest that participants’ attribute ratings were influenced by judgments on how important they perceived the product itself to be. Consequently, it might be advisable to offer participants different levels of judgments, i.e. an overall preference score of the product in general, separate attribute ratings as well as relative attribute ratings. In this way, the chance of receiving confounded results might be reduced.
Caution should be exercised when interpreting attribute importance of different user groups based on SSI ratings that can be seen as representatives of simple rating scales. Such scales are frequently applied in user research because they are simple to administer and analyze. However, in studies 2 and 3 (age) group main effects were found. Such an overall difference skewed the interpretability of the results. One might take as a conclusion that older adults had higher expectations, however this is of little help if response deviations from the young user group were supposed to indicate how to allocate limited resources in product development. For this reason, if different groups are included, it is recommendable to limit their ‘resources’ too in order to compare relative attribute importance. Accordingly, an assessment of attribute importance that necessitates the assignment of relative weights already during assessment is being recommended.
In study 3, a physical variant of the constant sum scale (Aaker, et al., 1995; Kumar, et al., 2002) has been introduced for this purpose. Results were promising: expected age differences as well as product differences could be confirmed and participants also perceived the task format favorably. The method demonstrates that if participants have difficulties with certain techniques, such as the
∗ The direct ratings used in Gustafsson and Johnson (2004) were simple rating scales from 1 (not at all important) to 10 (very important) for each attribute separately, thus, equivalent to the self-stated importance scores in this thesis
8 GENERAL DISCUSSION 190
cognitive strain of doing the math constantly in the constant sum scenario, it is the responsibility of the person conducting the assessment (i.e. designer, researcher) to provide means that facilitate participants to express themselves. For example, the arrangement of physical bricks into a predefined grid enabled the inclusion of older participants who might have had difficulties with regard to the working memory load of the original variant. The Colored Boxes are not only appropriate for the assessment of attribute importance, but can be used for any kind of relative rating or indication of relative shares given a manageable amount of factors. The method seems particularly suitable to derive ratings that participants are not able to articulate immediately but that they need to think about. Bricks can serve as ‘thinking tools’ (Sanders, 2008) for participants that allow them to iteratively approximate their subjective rating. Furthermore, colored boxes could also be used as a communication tool in exchange with participants or even within a design team.
Previously, the merits of triangulation have been emphasized (Denzin, 1989; Flick, 2004) and also recommended for the identification of attribute importance in early product development. However, the findings and experiences in this thesis showed that not all methods are equally recommendable for all purposes. The appropriateness of methods appears to relate to three different levels of attribute abstraction. On the highest level, basically the ‘meta-bundle’ of attributes, namely the product itself, a single, direct rating, i.e. self-stated importance might be feasible. On the level of primary/strategic attributes (Griffin & Hauser, 1993; Hauser & Clausing, 1988), the physical version of the constant sum scale (Colored Boxes) appears to be an expedient solution that also allows the comparison of different groups, which can be essential for strategic planning. The conjoint analysis and the Kano method are somewhat less applicable on the abstract level of strategic attributes but are, on the other hand, the best option for assessing the importance of secondary/tactical or even tertiary/operational attributes (Griffin & Hauser, 1993; Hauser & Clausing, 1988), thus for the more detailed level of design. With this combination, a comprehensive investigation of stated attribute importance in early product development can be achieved. ‘Revealed preference data’ (Sattler, 2006) should complement the research to integrate what people say with how they behave.
Main Contributions and Findings
Analytical extension of the Kano classification: Statistical consideration of multi-modal classifications – only those classifications are discarded that significantly differ from the mode statistic; can indicate different market segments of similar size.
Methodological extension of the Constant Sum Scale: Coloring the Black Box. Direct and relative weighting of attribute importance with physical artifacts.
8 GENERAL DISCUSSION 191
Participants do not have to update numerical operations in memory. Instead, they can focus and reflect on the task of assigning relative weights. Engaging for participants; rather simple to administer and to analyze.
Independent self-stated importance ratings for each attribute appear to be prone to response biases such as general group differences and might be confounded by importance ratings of the product itself rather than merely expressing attribute importance.
Recommendation of multi-level assessment of importance (Triangulation).
8.3 OUTLOOK
A number of possible extensions in this area have already been mentioned. For example, further work needs to be devoted to the integration of prospective anticipation, real-time perception, and retrospective evaluation over short and longer time periods. This would help to elucidate the dynamics of attribute importance, in order to achieve a thorough understanding of how people evaluate interactive technologies and how to design products that are likely to be adopted and then ideally also used continuously, i.e. accepted (Kollmann, 2004).
The research presented in this thesis was motivated by the notion that models of technology adoption lacked an applicable system design perspective. Over the course of the three studies, a focus on actionable implications has been followed and a simple-yet-effective method was developed to support user-centered design in early product development. Much work is still left to be done. Findings need to be replicated, refined, and extended. Most importantly, as a long-term strategy, the isolated focus on attributes needs to open up again: the focus on concrete system design needs to be embedded in a natural context and a more holistic perspective and incorporating other influential variables should be pursued.
Attribute importance might vary as a function of situational context. Hartmann et al. (2008) developed and empirically validated a framework of user judgment with usability, content/functionality, aesthetics, customization, and engagement as relevant attributes. This framework relates to the evaluation of websites. Users indicated a rank order of attribute importance as follows: content > usability > aesthetics > customization. Interestingly, this order depends on the situational context: for serious scenarios usability is of primary concern, while general impressions of aesthetics and engagement dominate in less serious scenarios (Hartmann, et al., 2008). In this thesis, contextual influences were not explicitly addressed (apart from the framing of hobby photography in study 2). The situational impact on the perception and prioritization of attributes needs to be investigated in future studies of age group comparisons with respect to interactive products and always needs to be an integral part of product development (ISO, 2010).
8 GENERAL DISCUSSION 192
It cannot be stated often enough that to obtain an in-depth understanding of human-technology interaction, the individual components as well as the interactions between the triad of user, system, and context have to be considered. In addition to the impact of these factors on behavior (usage), the reciprocal impact of behavior on the person, and on a more global level, the impact of behavior on the context and the system is an intriguing field of research (Wagner, et al., 2010).
For example, it would be interesting to include control beliefs as suggested by the Theory of Planned Behavior (Ajzen, 1991) in order to contrast technology adoption in the workplace and in the home environment. Likewise, the role of social influences (i.e. subjective norm) in technology usage, particularly with respect to older adults, and how these might affect attribute importance, or the willingness of users to openly admit their relevance, appears to be a challenging but nonetheless essential research question (Ajzen, 1991; Fishbein & Ajzen, 1975; Venkatesh, et al., 2003). Also, the influence of other-oriented consumer values such as status (e.g. impression management), esteem (e.g. materialism), ethics (e.g. justice), and spirituality (e.g. faith) (Holbrook, 1999) should be seen in relation to the importance of a product’s attributes for technology adoption.
Financial aspects were discarded in studies 2 and 3 because the focus was on technology adoption independent of financial constraints. However, it would be interesting to see how priorities of interactive technologies change if monetary resources are involved; also, how these change from pre- to post-purchase (Gardial, Clemons, Woodruff, Schumann, & Burns, 1994; Oliver, 1997; Thompson, et al., 2005) and especially how purchase and ownership relate to the extent of technology usage.
Consistently, non-instrumental attributes were rated as less important compared to instrumental attributes. This might be partly due to the methods used. It was already mentioned that people display a phenomenon called ‘lay rationalism’ (Hsee & Hastie, 2006; Hsee, et al., 2003) which accounts for the observation that people tend to justify their choices on the basis of ‘rationalistic’ attributes and neglect the importance of ‘hedonistic’ attributes. This pattern of reasoning has also been found regarding the appreciation of instrumental and non-instrumental attributes of interactive products (Diefenbach & Hassenzahl, 2009). A possible constraint with regards to the self-stated importance ratings could be that although participants had been instructed to rate each attribute individually, they also saw the remaining attributes listed and might therefore have adjusted their ratings under consideration of the other attributes. Put differently, participants might have assigned emotional involvement the maximum score if this had been the only attribute to rate. However, the presence of also more ‘hard’ attributes (i.e. ergonomics) in the list might have amplified the contrast. Thus, self-stated importance ratings might not have been entirely independent after all. Emotional involvement and aesthetics [in terms of sensuous gratification (Hekkert, 2006)] are both experiential attributes (Boztepe, 2007; Hekkert, 2006) that are difficult to convey with mere imagination. While, for example, functionality or a product’s reliability are attributes that relate to the product itself, emotional involvement and aesthetics might only convey their
8 GENERAL DISCUSSION 193
full potential in experience. It will be a challenge to assess these in very early product development – however an undertaking that is likely to be appreciated by end-users. For this, a more qualitative, design-led approach seems a promising complement to the rather quantitative, research-led approach illustrated in this thesis (Sanders, 2008).
To literally broaden this outlook, it should not be left unmentioned that only longitudinal studies will be able to provide evidence regarding whether the assumed age effects are truly caused by aging as such. In particular, it would be interesting to follow the generation that grows up with digital devices and an ever-present internet as a matter of course and to observe possible changes to their prioritization of attributes as they reach old age.
In the meantime, some simple (quasi-)experimental variations can also be of help to disentangle the effects of age from other factors such as prior experience or generally familiarity. Groups should be similarly familiar with the product under investigation. A slightly different and somewhat more controlled approach would be to ensure equivalent unfamiliarity. Participants showed distinct trade-offs when facing the difficult, utilitarian product in study 3 (fax machine). In addition to the intended variation of product class (value as well as simplicity), the fax machine was also the product that was most unfamiliar. Presumably as a result, participants considered less bricks of functionality and more bricks of ease of use for this product than for the other three products. This was especially pronounced in young adults.
In this thesis, two age groups were compared regarding primary, strategic attributes that are relevant in respect of technology adoption. These are important criteria with respect to resource allocation in the development process (Ulrich & Eppinger, 2008). However, it cannot be inferred from the data what the two groups want on a detailed level of these attributes. For example, expectations of what is considered to be aesthetically appealing or what kind of functionalities are perceived to be desirable might differ regardless of an overall similar weight. Thus, in a next step, the underlying attributes of the secondary and finally tertiary attributes should be investigated (Griffin & Hauser, 1993; Hauser & Clausing, 1988; Louviere, 1984).
Finally, this thesis investigated methods that are aimed to support user-centered design in early product development of interactive technologies by identifying attribute importance from a user’s perspective. Methods that allow a design for but also with users approach (Eason, 1995) have been applied and recommendations on method triangulation have been proposed. As a practical outlook, these have to stand the test in real product development and verify their capability to increase the likelihood of technology adoption.
REFERENCES 194
REFERENCES
Aaker, D. A., Kumar, V., & Day, G. S. (1995). Marketing Research. New York, NY: John Wiley & Sons, Inc.
Adams, D. A., Nelson, R. R., & Todd, P. A. (1992). Perceived Usefulness, Ease of Use, and Usage of Information Technology: A Replication. MIS Quarterly, 227-247.
Ajzen, I. (1991). The theory of planned behavior. Organizational Behavior and Human Decision Processes, 50(2), 179-211.
Ajzen, I., & Fishbein, M. (1980). Understanding attitudes and predicting social behavior. Englewood Cliffs, NJ: Prentice-Hall.
Al-Gahtani, S., & King, M. (1999). Attitudes, satisfaction and usage: factors contributing to each in the acceptance of information technology. Behaviour & Information Technology, 18(4), 277-297.
Aldersey-Williams, H., Bound, J., & Coleman, R. (Eds.). (1999). The Methods Lab: User Research for Design. London, UK: Design for Ageing Network, Helen Hamlyn Research Centre, Royal College of Art.
Almefelt, L. (2005). Requirements-Driven Product Innovation. Methods and Tools Reflecting Industrial Needs. Chalmers University of Technology, Göteborg, Sweden, PhD thesis.
Anderson, J. R., Bothell, D., Byrne, M. D., Douglass, S., Lebiere, C., & Qin, Y. (2004). An integrated theory of the mind. Psychological Review, 111(4), 1036-1060.
Andreasen, M. M., & Hein, L. (1987). Integrated Product Development. Bedford, UK / Berlin, Germany: IFS (Publications) Ltd / Springer-Verlag.
Arabie, P., & Hubert, L. (1994). Cluster analysis in marketing research. In R. P. Bagozzi (Ed.), Advances in Marketing Research (pp. 160-189). Cambridge, MA: Blackwell.
Archer, L. B. (1971). Technological Innovation: a Methodology. Frimley: Inforlink.
Backhaus, K., Erichson, B., Plinke, W., & Weiber, R. (2008). Multivariate Analysemethoden. Eine anwendungsorientierte Einführung (12th ed.). Berlin: Springer.
Bargas-Avila, J. A., & Hornbæk, K. (2011). Old wine in new bottles or novel challenges: a critical analysis of empirical studies of user experience. CHI 2011 Proceedings (pp. 2689-2698). New York, NY: ACM Press.
Bass, F. M., & Talarzyk, W. W. (1972). An Attitude Model for the Study of Brand Preference. Journal of Marketing Research, 9(1), 93-96.
Batra, R., & Ahtola, O. T. (1990). Measuring the Hedonic and Utilitarian Sources of Consumer Attitudes. Marketing Letters, 2(2), 159-170.
Beauregard, R., & Corriveau, P. (2007). User Experience Quality: A Conceptual Framework for Goal Setting and Measurement. In V. G. Duffy (Ed.), Digital Human Modeling, HCII 2007, LNCS 4561 (pp. 325-332). Berlin, Germany: Springer.
REFERENCES 195
Ben-Bassat, T., Meyer, J., & Tractinsky, N. (2006). Economic and Subjective Measures of the Perceived Value of Aesthetics and Usability. Computer-Human Interaction, 13(2), 210-234.
Benbasat, I., & Barki, H. (2007). Quo vadis, TAM? Journal of the Association for Information Systems, 8(4), 212-218.
Berger, C., Blauth, R., Bolster, C., Burchill, G., DuMouchel, W., Pouliot, F., et al. (1993). Kano's Methods for Understanding Customer-defined Quality. Center for Quality of Management Journal 2(4), 3-36.
Bevan, N. (2003). UsabilityNet Methods for User Centred Design. Human-Computer Interaction: Theory and Practice (Part 1), Volume 1 of the Proceedings of HCI International 2003 (pp. 434-438): Lawrence Erlbaum.
Beyer, H., & Holtzblatt, K. (1998). Contextual Design. Defining Customer-Centered Systems. San Francisco, CA: Mogan Kaufmann Publishers.
Bias, R. G., & Mayhew, D. J. (Eds.). (2005). Cost-Justifying Usability. San Francisco, CA: Morgan Kaufmann Publishers.
Birren, J. E., & Schaie, K. W. (Eds.). (2001). Handbook of the Psychology of Aging (5th ed.). San Diego, CA: Academic Press.
Blackwell, R. D., Miniard, P. W., & Engel, J. F. (2006). Consumer Behavior. Mason, Ohio: Thomson/South-Western.
Blessing, L. T. M. (1994). Process-Based Approach to Computer-Supported Engineering Design. University of Twente, Enschede, The Netherlands, PhD thesis.
Blessing, L. T. M., & Chakrabarti, A. (2009). DRM, a Design Research Methodology. London: Springer-Verlag.
Bloch, P. H., Brunel, F. F., & Arnold, T. J. (2003). Individual Differences in the Centrality of Visual Product Aesthetics: Concept and Measurement. Journal of Consumer Research, 29, 551-565.
Blythe, M., Overbeeke, K., Monk, A., & Wright, P. (Eds.). (2003). Funology: From Usability to Enjoyment. Dordrecht, The Netherlands: Kluwer Academic Publishers.
Bortz, J. (2005). Statistik für Human- und Sozialwissenschaftler (6th ed.). Heidelberg, Germany: Springer.
Bortz, J., & Döring, N. (2006). Forschungsmethoden und Evaluation für Human- und Sozialwissenschaftler (4th ed.). Heidelberg, Germany: Springer Medizin Verlag.
Bouma, H. (1992). Gerontechnology: Making technology relevant for the elderly. In H. Bouma & J. A. M. Graafmans (Eds.), Gerontechnology (pp. 1-5). Amsterdam, The Netherlands: IOS Press.
Bouma, H., & Graafmans, J. A. M. (Eds.). (1992). Gerontechnology. Amsterdam, The Netherlands: IOS Press.
Boztepe, S. (2007). User Value: Competing Theories and Models. International Journal of Design, 1(2), 55-63.
REFERENCES 196
Brown, S. A., & Venkatesh, V. (2005). Model of Adoption of Technology in Households: A Baseline Model Test and Extension Incorporating Household Life Cycle. MIS Quarterly, 29(3), 399-426.
Bruder, C., Blessing, L., & Wandke, H. (2007). Training the Elderly in the Use of Electronic Devices. In C. Stephanidis (Ed.), Universal Access in HCI, Part I, HCII 2007, LNCS 4554 (pp. 637-646). Berlin, Germany: Springer.
Carroll, J. M., & Thomas, J. C. (1988). Fun. SIGCHI Bulletin, 19(3), 21-24.
Chaparro, A., Rogers, M., Fernandez, J., Bohan, M., Choi, S. D., & Stumpfhauser, L. (2000). Range of motion of the wrist: Implications for designing computer input devices for the elderly. Disability & Rehabilitation, 22(13), 633-637.
Charness, N. (2008). Aging and Human Performance. Human Factors, 50(3), 548-555.
Charness, N., & Boot, W. R. (2009). Aging and Information Technology Use. Current Directions in Psychological Science, 18(5), 253-258.
Chen, C.-C., & Chuang, M.-C. (2008). Integrating the Kano model into a robust design approach to enhance customer satisfaction with product design. International Journal of Production Economics, 114, 667-681.
Chen, K., & Chan, A. H. S. (2011). A review of technology acceptance by older adults. Gerontechnology, 10(1), 1-12.
Chitturi, R., Raghunathan, R., & Mahajan, V. (2007). Form Versus Function: How the Intensities of Specific Emotions Evoked in Functional Versus Hedonic Trade-Offs Mediate Product Preferences. Journal of Marketing Research, XLIV, 702–714.
Clausing, D. (1994). Total Quality Development: A Step-By-Step Guide to World-Class Concurrent Engineering. New York, NY: ASME Press.
Cohen, J. (1960). A coefficient of agreement for nominal scales. Educational and Psychological Measurement, 20(1), 37–46.
Compeau, D. R., & Higgins, C. A. (1995). Computer Self-Efficacy: Development of a Measure and Initial Test. MIS Quarterly, 19(2), 189-211.
Conci, M., Pianesi, F., & Zancanaro, M. (2009). Useful, Social and Enjoyable: Mobile Phone Adoption by Older People. In T. Gross, J. Gulliksen, P. Kotzé, L. Oestreicher, P. Palanque, R. O. Prates & M. Winckler (Eds.), Human-Computer Interaction - INTERACT 2009 (Vol. Part I, LNCS 5726, pp. 63–76). Berlin, Germany: Springer.
Cooper, A., Reimann, R., & Cronin, D. (2007). About Face 3: The Essentials of Interaction Design (3rd ed.). Indianapolis, IN: Wiley Publishing, Inc.
Cooper, R. G. (2008). The Stage-Gate Idea-to-Launch Process–Update, What’s New and NexGen Systems. Journal of Product Innovation Management, 25(3), 213-232.
Craik, F. I. M., & Bialystok, E. (2006). Cognition through the lifespan: mechanisms of change. TRENDS in Cognitive Sciences, 10(3), 131-138.
REFERENCES 197
Craik, F. I. M., & Salthouse, T. A. (Eds.). (2000). The Handbook of Aging and Cognition (2nd ed.). Mahwah, NJ: Lawrence Erlbaum Associates.
Czaja, S. J., Charness, N., Fisk, A. D., Hertzog, C., Nair, S. N., Rogers, W. A., et al. (2006). Factors Predicting the Use of Technology: Findings From the Center for Research and Education on Aging and Technology Enhancement (CREATE). Psychology and Aging, 21(2), 333–352.
Czaja, S. J., & Lee, C. C. (2008). Information technology and older adults. In A. Sears & J. A. Jacko (Eds.), The Human–Computer Interaction Handbook. Fundamentals, Evolving Technologies, and Emerging Applications (2nd ed., pp. 277-292). New York, NY: Taylor & Francis.
Czaja, S. J., Lee, C. C., Nair, S. N., & Sharit, J. (2008). Older Adults and Technology Adoption. Proceedings of the 52nd Human Factors and Ergonomics Society Annual Meeting (pp. 139-143). Santa Monica, CA: HFES.
Davis, F. D. (1989). Perceived Usefulness, Perceived Ease of Use, and User Acceptance of Information Technology. MIS Quarterly, 13(3), 319-340.
Davis, F. D., Bagozzi, R. P., & Warshaw, P. R. (1989). User Acceptance of Computer Technology: A Comparison of Two Theoretical Models. Management Science, 35(8), 982-1003.
Davis, F. D., Bagozzi, R. P., & Warshaw, P. R. (1992). Extrinsic and Intrinsic Motivation to Use Computers in the Workplace. Journal of Applied Social Psychology, 22(14), 1111-1132.
De Angeli, A., Sutcliffe, A., & Hartmann, J. (2006). Interaction, usability and aesthetics: what influences users' preferences? Proceedings of the 6th conference on Designing Interactive systems (pp. 271-280). New York, NY: ACM Press.
De Bont, C. J. P. M. (1992). Consumer evaluations of early product-concepts. Delft University of Technology, Delft, The Netherlands, PhD thesis.
De Sanctis, G. (1983). Expectancy Theory as an Explanation of Voluntary Use of a Decision-Support System. Psychological Reports, 52, 247-260.
Denzin, N. K. (1989). The Research Act: A Theoretical Introduction to Sociological Methods (3rd ed.). Englewood Cliffs, NJ: Prentice Hall.
Desmet, P. (2002). Designing Emotions. Delft University of Technology, Delft, The Netherlands, PhD thesis.
Destatis. (2009). Bevölkerung Deutschland bis 2060. 12. koordinierte Bevölkerungsvorausberechnung. Wiesbaden, Germany: Statistisches Bundesamt [Federal Statistical Office (Destatis)].
Diefenbach, S., & Hassenzahl, M. (2009). The "Beauty Dilemma": Beauty is Valued but Discounted in Product Choice. Proceedings of the CHI 2009 Conference on Human Factors in Computing Systems (pp. 1419-1426). New York, NY: ACM Press.
Dillon, A., & Morris, M. G. (1996). User Acceptance of Information Technology: Theories and Models. In M. Williams (Ed.), Annual Review of Information Science and Technology (Vol. 31, pp. 3-32). Medford, NJ: Information Today.
REFERENCES 198
Dix, A. (2008). Designing for adoption and designing for appropriation. Talk at Technische Universität Berlin, Germany. 12th February 2008.
Docampo Rama, M. (2001). Technology generations handling complex user interfaces. Eindhoven University of Technology, Eindhoven, PhD thesis.
Docampo Rama, M., de Ridder, H., & Bouma, H. (2001). Technology generation and Age in using layered user interfaces. Gerontechnology, 1(1), 25-40.
Duke, C. R., & Mount, A. S. (1996). Rediscovering performance-importance analysis of products. Journal of Product & Brand Management, 5(2), 43-54.
Eason, K. D. (1995). User-centred design: for users or by users? Ergonomics, 38(8), 1667-1673.
Ehn, P. (1993). Scandinavian design: On participation and skill. In D. Schuler & A. Namioka (Eds.), Participatory Design: Principles and Practices (pp. 41-77). Hillsdale, NJ: Lawrence Erlbaum.
Elliott, A. C., Swain, E., & Wright, I. C. (2003). Managing product development resources through the use of product quality attribute mapping. Proceedings of the Institution of Mechanical Engineers, 217(9), 1229-1241.
Ellis, R. D., & Allaire, J. (1999). Modeling Computer Interest in Older Adults: The Role of Age, Education, Computer Knowledge, and Computer Anxiety. Human Factors, 41(3), 345–355.
Engdahl, K., Leclerc, K., & Loring, B. (2009). Concucting Field Studies with Older Adults. User Experience, 8(1), 14-16.
Erickson, G. M., & Johansson, J. K. (1985). The Role of Price in Multi-Attribute Product Evaluations. Journal of Consumer Research, 12(2), 195-199.
Ericson, A. (2007). A Need-Based Approach to Product Development. Luleå University of Technology, Luleå, Sweden, PhD thesis.
Field, A. (2009). Discovering Statistics Using SPSS (3rd ed.). London: Sage Publications Ltd.
Fishbein, M. (1963). An Investigation of the Relationships between Beliefs about an Object and the Attitude toward that Object. Human Relations, 16(3), 233-239.
Fishbein, M., & Ajzen, I. (1975). Belief, Attitude, Intention, and Behavior: An Introduction to Theory and Research. Reading, MA: Addison-Wesley.
Fisk, A. D., Rogers, W. A., Charness, N., Czaja, S. J., & Sharit, J. (2004). Designing for Older Adults. Principles and Creative Human Factors Approaches. Boca Raton, FL: CRC Press LLC.
Flanagan, J. C. (1954). The Critical Incident Technique. Psychological Bulletin, 51(4), 327-358.
Flick, U. (2004). Triangulation. Eine Einführung. Wiesbaden, Germany: VS Verlag für Sozialwissenschaften.
Forlizzi, J., & Battarbee, K. (2004). Understanding Experience in Interactive Systems. Proceedings of the 5th conference on Designing Interactive Systems (pp. 261-268). New York, NY: ACM Press.
REFERENCES 199
Forlizzi, J., Hirsch, T., Hyder, E., & Goetz, J. (2001). Designing Pleasurable Technology for Elders. Proceedings of INCLUDE01 (International Conference on Inclusive Design and Communications).
Frankfort-Nachmias, C., & Nachmias, D. (1996). Research Methods in the Social Sciences (5th ed.). London: St. Martin's Press.
Fredrickson, B. L. (2000). Extracting meaning from past affective experiences: The importance of peaks, ends, and specific emotions. Cognition and Emotion, 14(4), 577-606.
Gardial, S. F., Clemons, D. S., Woodruff, R. B., Schumann, D. W., & Burns, M. J. (1994). Comparing Consumers' Recall of Prepurchase and Postpurchase Product Evaluation Experiences. Journal of Consumer Research, 20(4), 548-560.
Garvin, D. A. (1984). What Does "Product Quality" Really Mean? Sloan management review, 26(1), 25-43.
Gaver, B., Boucher, A., Pennington, S., & Walker, B. (2004). Cultural Probes and the Value of Uncertainty. interactions, 11(5), 53-56.
Gaver, B., Dunne, T., & Pacenti, E. (1999). Cultural probes. interactions, 6(1), 21-29.
Ginter, J. L. (1974). An Experimental Investigation of Attitude Change and Choice of a New Brand. Journal of Marketing Research, 11(1), 30-40.
Glass, G. V., Peckham, P. D., & Sanders, J. R. (1972). Consequences of Failure to Meet Assumptions Underlying the Fixed Effects Analyses of Variance and Covariance. Review of Educational Research, 42(3), 237-288.
Glende, S. (2010). Entwicklung eines Konzepts zur nutzergerechten Produktentwicklung - mit Fokus auf die „Generation Plus“. Technische Universität Berlin, Berlin, Germany, PhD thesis.
Goncalves, K. P. (2000). Working with the Kano Method Quirk´s Management research review.
Goodhue, D. L. (2007). Comment on Benbasat and Barki's "Quo Vadis TAM" article. Journal of the Association for Information Systems, 8(4), 220-222.
Gould, J. D., & Lewis, C. H. (1985). Designing for Usability: Key Principles and What Designers Think. Communications of the ACM, 28(3), 300-311.
Green, P. E., Krieger, A. M., & Wind, Y. J. (2001). Thirty Years of Conjoint Analysis: Reflections and Prospects. Interfaces, 31(3), S56-S73.
Green, P. E., & Srinivasan, V. (1978). Conjoint Analysis in Consumer Research: Issues and Outlook. Journal of Consumer Research, 5, 103-123.
Green, P. E., & Srinivasan, V. (1990). Conjoint Analysis in Marketing: New Developments with Implications for Research and Practice. Journal of Marketing, 54(4), 3-19.
Griffin, A., & Hauser, J. R. (1993). The Voice of the Customer. Marketing Science, 12(1), 1-27.
Grunert, K. G. (1989). Attributes, attribute values and their characteristics: A unifying approach and an example involving a complex household investment. Journal of Economic Psychology, 10, 229-251.
REFERENCES 200
Gustafsson, A., & Johnson, M. D. (2004). Determining Attribute Importance in a Service Satisfaction Model. Journal of Service Research, 7(2), 124-141.
Gutman, J. (1982). A Means-End Chain Model Based on Consumer Categorization Processes. Journal of Marketing, 46(2), 60-72.
Hair, J. F., Anderson, R. E., Tahtam, R. L., & Black, W. C. (1998). Multivariate Data Analysis (5th ed.). London: Prentice-Hall International.
Hamilton, R. W., & Thompson, D. V. (2007). Is There a Substitute for Direct Experience? Comparing Consumers' Preferences after Direct and Indirect Product Experiences. Journal of Consumer Research, 34(4), 546-555.
Hancock, P. A., Pepe, A. A., & Murphy, L. L. (2005). Hedonomics: The Power of Positive and Pleasurable Ergonomics. Ergonomics in Design, 13(1), 8-14.
Hanington, B. (2003). Methods in the Making: A Perspective on the State of Human Research in Design. Design Issues, 19(4), 9-18.
Hanson, V. (2010). Influencing technology adoption by older adults. Interacting with Computers, 22, 502-509.
Hartmann, J., Sutcliffe, A., & de Angeli, A. (2008). Towards a Theory of User Judgment of Aesthetics and User Interface Quality. Transactions on Computer-Human Interaction, 15(4).
Hasher, L., & Zacks, R. T. (1988). Working memory, comprehension, and aging: A review and a new view. In G. H. Bower (Ed.), The psychology of learning and motivation (Vol. 22, pp. 193-225). San Diego, CA: Academic Press.
Hassenzahl, M. (2001). The Effect of Perceived Hedonic Quality on Product Appealingness. International Journal of Human-Computer Interaction, 13(4), 481-499.
Hassenzahl, M. (2003). The thing and I: understanding the relationship between user and product. In M. A. Blythe, A. F. Monk, K. Overbeeke & P. C. Wright (Eds.), Funology: from usability to enjoyment (pp. 31-42). Dordrecht: Kluwer Academic Publishers.
Hassenzahl, M. (2004). The Interplay of Beauty, Goodness, and Usability in Interactive Products. Human-Computer Interaction, 19, 319-349.
Hassenzahl, M. (2006). The quality of interactive products: Hedonic needs, emotions and experience. In C. Ghaoui (Ed.), Encyclopedia of Human Computer Interaction (pp. 266-272). London, UK: Idea Group Publishing.
Hassenzahl, M., Burmester, M., & Koller, F. (2003). AttrakDiff: Ein Fragebogen zur Messung wahrgenommener hedonischer und pragmatischer Qualität. In J. Ziegler & G. Szwillus (Eds.), Mensch & Computer 2003. Interaktion in Bewegung (pp. 187-196). Stuttgart: Teubner.
Hassenzahl, M., Diefenbach, S., & Göritz, A. (2010). Needs, affect, and interactive products – Facets of user experience. Interacting with Computers, 22, 353–362.
Hassenzahl, M., Platz, A., Burmester, M., & Lehner, K. (2000). Hedonic and Ergonomic Quality Aspects Determine a Software's Appeal. CHI 2000 Proceedings (pp. 201-208). New York, NY: ACM Press.
REFERENCES 201
Hassenzahl, M., & Roto, V. (2007). Being and doing: A perspective on User Experience and its measurement. Interfaces, 72, 10-12.
Hassenzahl, M., & Tractinsky, N. (2006). User experience – a research agenda. Behaviour & Information Technology, 25(2), 91-97.
Hauser, J. R., & Clausing, D. (1988). The House of Quality. Harvard Business Review, 66(3), 63-73.
Hauser, J. R., & Rao, V. (2004). Conjoint Analysis, Related Modeling, and Applications. In Y. Wind & P. Green (Eds.), Market Research and Modeling: Progress and Prospects (pp. 141-168). Boston, MA: Kluwer Academic Publishers.
Hayes, A. F., & Krippendorff, K. (2007). Answering the call for a standard reliability measure for coding data. Communication Methods and Measures, 1(1), 77-89.
Hekkert, P. (2006). Design Aesthetics: Principles of Pleasure in Design. Psychology Science, 2, 157-172.
Helander, M. G., & Khalid, H. M. (2006). Affective and Pleasurable Design. In G. Salvendy (Ed.), Handbook of Human Factors and Ergonomics (3rd ed., pp. 543-572). Hoboken, NJ: John Wiley & Sons.
Herr, P. M., & Page, C. M. (2004). Asymetric Association of Liking and Disliking Judgments: So What's Not to Like? Journal of Consumer Research, 30(4), 588-601.
Herzberg, F., Mausner, B., & Snyderman, B. B. (1959). The Motivation to Work (2nd ed.). New York, NY: John Wiley & Sons.
Hirsch, T., Forlizzi, J., Hyder, E., Goetz, J., Stroback, J., & Kurtz, C. (2000). The ELDeR Project: Social and Emotional Factors in the Design of Eldercare Technologies Proceedings of the CUU 2000 Conference on Universal Usability (pp. 72-79). New York, NY: ACM Press.
Hirschman, E. C., & Holbrook, M. B. (1982). Hedonic Consumption: Emerging Concepts, Methods and Propositions. Journal of Marketing, 46(Summer 1982), 92-101.
Holbrook, M. B. (Ed.). (1999). Consumer value: A framework for analysis and research. New York, NY: Routledge.
Hollnagel, E. (1997). Cognitive ergonomics: it’s all in the mind. Ergonomics, 40(10), 1170 -1182.
Hornbæk, K., & Law, E. L.-C. (2007). Meta-analysis of correlations among usability measures. CHI 2007 Proceedings (pp. 617-626). New York, NY: ACM Press.
Hsee, C. K., & Hastie, R. (2006). Decision and experience: why don´t we choose what makes us happy? Trends in Cognitive Science, 10(1), 31-37.
Hsee, C. K., Zhang, J., Yu, F., & Xi, Y. (2003). Lay Rationalism and Inconsistency between Predicted Experience and Decision. Journal of Behavioral Decision Making, 16, 257–272.
Hsieh, H. F., & Shannon, S. E. (2005). Three approaches to qualitative content analysis. Qualitative Health Research, 15(9), 1277–1288.
REFERENCES 202
Hsu, Y.-L., Hsu, C.-C., & Bing, P.-C. (2007). Capturing Passenger`s Voices: The Application of Kano`s Model in the Aireline Industry. International Conference on Logistics, Shipping and Port Management. Taoyuan, Taiwan.
Huber, J. (1997). What We Have Learned from 20 Years of Conjoint Research: When to Use Self-Explicated, Graded Pairs, Full Profiles or Choice Experiments. Sawtooth Software Conference Proceedings, 243-256.
Hull, E., Jackson, K., & Dick, J. (2002). Requirements Engineering. London: Springer.
Hyysalo, S. (2003). Some Problems in the Traditional Approaches to Predicting the Use of a Technology-driven Invention. Innovation, 16(2), 117-137.
IEEE. (1998). IEEE Standard 1233: Guide for developing system requirements specifications. New York, NY: IEEE The Institute of Electrical and Electronics Engineers, Inc.
Igbaria, M., Parasuraman, S., & Baroudi, J. J. (1996). A Motivational Model of Microcomputer Usage. Journal of Management Information Systems, 13(1), 127-143.
Igbaria, M., Schiffman, S. J., & Wieckowski, T. J. (1994). The respective roles of perceived usefulness and perceived fun in the acceptance of microcomputer technology. Behaviour & Information Technology, 13(6), 349 - 361.
ISO. (1998). ISO 9241-11. Ergonomic requirements for office work with visual display terminals (VDTs) - Part 11 : Guidance on usability. Geneva: International Organization for Standardization.
ISO. (1999). ISO 13407: Human-centred design processes for interactive systems. Geneva: International Organization for Standardization.
ISO. (2001). ISO 9126-1: Software engineering - Product quality - Part 1: Quality model. Geneva: International Organization for Standardization.
ISO. (2005). ISO 9000. Quality management systems - Fundamentals and vocabulary. Geneva: International Organization for Standardization.
ISO. (2006). ISO 9241-110: Ergonomics of human-system interaction - Part 110: Dialogue principles. Geneva: International Organization for Standardization.
ISO. (2010). ISO 9241-210: Ergonomics of human-system interaction - Part 210: Human-centred design for interactive systems. Geneva: International Organization for Standardization.
Israel, J. H., Hurtienne, J., Pohlmeyer, A. E., Mohs, C., Kindsmüller, M. C., & Naumann, A. (2009). On intuitive use, physicality and tangible user interfaces. International Journal of Arts and Technology, 2(4), 348–366.
Jaccard, J., Brinberg, D., & Ackerman, L. J. (1986). Assessing Attribute Importance: A Comparison of Six Methods. Journal of Consumer Research, 12(March), 463-468.
Jacoby, J. (1975). Perspectives On a Consumer Information Processing Research Program. Communication Research, 2(3), 203-215.
Jay, G. M., & Willis, S. L. (1992). Influence of direct computer experience on older adults’ attitudes towards computers. Journal of Gerontology: Psychological Sciences, 47(4), 250-257.

REFERENCES 203
Jeansonne, A. (2002). Loglinear Models. Last Retrieved February, 2011, from http://userwww.sfsu.edu/~efc/classes/biol710/loglinear/Log%20Linear%20Models. htm
Jenderek, B. (2006). Tool für Reliabilitätskoeffizienten. Universität Leipzig, Germany.
Jordan, P. W. (2000). Designing Pleasurable Products. London, UK: Taylor & Francis.
Kahneman, D., & Riis, J. (2005). Living, and thinking about it: Two perspectives on life. In F. A. Huppert, N. Baylis & B. Keverne (Eds.), The science of well-being (pp. 285-304). Oxford, UK: Oxford University Press.
Kano, N., Seraku, N., Takahashi, F., & Tsuji, S. (1984). Attractive quality and must-be quality. The Journal of the Japanese Society for Quality Control, 14(2), 39-48.
Karapanos, E., Zimmerman, J., Forlizzi, J., & Martens, J.-B. (2009). User Experience Over Time: An Initial Framework. CHI 2009 Proceedings (pp. 729-738). New Yorl, NY: ACM Press.
Karrer, K., Glaser, C., Clemens, C., & Bruder, C. (2009). Technikaffinität erfassen – der Fragebogen TA-EG. In A. Lichtenstein, C. Stößel & C. Clemens (Eds.), Der Mensch im Mittelpunkt technischer Systeme. Fortschritt-Berichte VDI Reihe 22 Nr. 29 (pp. 196-201). Düsseldorf, Germany: VDI-Verlag.
Keinonen, T. (1998). One-dimensional usability – Influence of usability on consumers’ product preference. University of Art and Design Helsinki UIAH, Helsinki, Finland, PhD thesis.
Kelley, C. L., Morrell, R. W., Park, D. C., & Mayhorn, C. B. (1999). Predictors of electronic bulletin board system use in older adults. Educational Gerontology, 25, 19–35.
Kelley, T. (2005). The Ten Faces of Innovation. New York, NY: Doubleday.
Kelly, G. A. (1955). The Psychology of Personal Constructs (Vol. 1 & 2). New York, NY: Norton.
Kempf, D. S. (1999). Attitude formation from product trial: Distinct roles of cognition and affect for hedonic and functional products. Psychology and Marketing, 16(1), 35-50.
Ketcham, C. J., & Stelmach, G. E. (2004). Movement control in the older adult. In R. W. Pew & S. B. V. Hemel (Eds.), Technology for adaptive aging (pp. 64-92). Washington, DC: The National Academies Press.
Kindsmüller, M. C., Leuchter, S., Schulze-Kissing, D., & Urbas, L. (2004). Modellierung und Simulation menschlichen Verhaltens als Methode der Mensch-Maschine-System-Forschung. MMI-Interaktiv, 7, 4-16.
King, W. R., & He, J. (2006). A Meta-Analysis of the Technology Acceptance Model. Information and Management, 43(6), 740 - 755.
Kollmann, T. (2004). Attitude, adoption or acceptance? - measuring the market success of telecommunication and multimedia technology. International Journal of Business Performance Management, 6(2), 133-152.
Krippendorff, K. (1980). Content Analysis. An Introduction to Its Methodology (Vol. 5). Beverly Hills, CA: Sage.
REFERENCES 204
Krippendorff, K. (2004). Measuring the Reliability of Qualitative Text Analysis Data. Quality & Quantity, 38, 787–800.
Kujala, S. (2003). User Involvement: A Review of the Benefits and Challenges. Behaviour & Information Technology, 22(1), 1-16.
Kulviwat, S., Bruner II, G. C., Kumar, A., Nasco, S. A., & Clark, T. (2007). Toward a unified theory of consumer acceptance technology. Psychology and Marketing, 24(12), 1059-1084.
Kumar, V., Aaker, D. A., & Day, G. S. (2002). Essentials of Marketing Research (2nd ed.). New York, NY: John Wiley and Sons.
Landis, J. R., & Koch, G. G. (1977). The measurement of observer agreement for categorical data. Biometrics, 33(1), 159-174.
Lang, J. W. B., & Fries, S. (2006). A Revised 10-Item Version of the Achievement Motives Scale - Psychometric Properties in German-Speaking Samples. European Journal of Psychological Assessment, 22(3), 216-224.
Law, E., Roto, V., Vermeeren, A. P. O. S., Kort, J., & Hassenzahl, M. (2008). Towards a Shared Definition of User Experience. CHI 08 Extended Abstracts (pp. 2395-2398). New York, NY: ACM Press.
Law, E., & van Schaik, P. (2010). Modelling user experience – An agenda for research and practice. Interacting with Computers, 22(5), 313-322.
Lee, S., & Koubek, R. J. (2010). Understanding user preferences based on usability and aesthetics before and after actual use. Interacting with Computers, 22, 530-543.
Lee, W.-I. (2007). The Relationship between Quality of Healthcare Service and Customer Satisfaction - An Example of Hospitals in Taiwan. Journal of the Chinese Institute of Industrial Engineers, 24(1), 81-95.
Lee, Y. S. (2007). Older Adults' User Experiences with Mobile Phones: Identification of User Clusters and User Requirements. Virginia Polytechnic Institute and State University, Blacksburg, VA, PhD thesis.
Lehmann, D. R. (1971). Television Show Preference: Application of a Choice Model. Journal of Marketing Research, 8(1), 47-55.
Lincoln, Y. S., & Guba, E. G. (1985). Naturalistic Inquiry. Newbury Park, CA: Sage.
Lindgaard, G., Dillon, R., Trbovich, P., White, R., Fernandes, G., Lundahl, S., et al. (2006). User Needs Analysis and requirements engineering: Theory and practice. Interacting with Computers, 18, 47–70.
Logan, R. J. (1994). Behavioral and emotional usability: Thomson Consumer Electronics. In M. Wiklund (Ed.), Usability in practice (pp. 59-82). Cambridge, MA: Academic Press.
Logan, R. J., Augaitis, S., & Renk, T. (1994). Design of simplified television remote controls: a case for behavioral and emotional usability. Proceedings of the 38th Human Factors and Ergonomics Society Annual Meeting (pp. 365 – 369). Santa Monica, CA: HFES.
REFERENCES 205
Louviere, J. (1984). Hierarchical Information Integration: A New Method for the Design and Analysis of Complex Multiattribute Judgment Problems. Advances in Consumer Research, 11, 148-155.
Macdonald, A. S., & Lebbon, C. S. (2001). The Methods Lab - A User Research Method Typology for an Inclusive Design Process. International Conference on Engineering Design ICED 01 (pp. 221-228). Glasgow, UK.
Maguire, M. (2001). Methods to support human-centred design. International Journal of Human-Computer Studies, 55, 587-634.
Mahlke, S., Lemke, I., & Thüring, M. (2007). The Diversity of Non-Instrumental Qualities in Human-Technology Interaction. MMI-Interaktiv, 13, 55-64.
Mahlke, S., & Thüring, M. (2007). Studying Antecedents of Emotional Experiences in Interactive Contexts. CHI 2007 Proceedings (pp. 915-918). New York, NY: ACM Press.
Mahmood, M. A., Burn, J. M., Gemoets, L. A., & Jacquez, C. (2000). Variables affecting information technology end-user satisfaction: a meta-analysis of the empirical literature. International Journal of Human-Computer Studies, 52(4), 751-771.
Malone, T. W. (1982). Heuristics for Designing Enjoyable User Interfaces: Lessons from Computer Games. Proceedings of the 1982 conference on Human Factors in Computing Systems (pp. 63-68). Washington, DC: ACM, Addison-Wesley.
MAP. (2000). "Vom Markt zum Produkt". Last Retrieved May, 2011, from http://imihome.imi.uni-karlsruhe.de/map.html
Marquié, J. C., Jourdan-Boddaert, L., & Huet, N. (2002). Do older adults underestimate their actual computer knowledge? Behaviour and Information Technology, 21, 273-280.
Maslow, A. H. (1954). Motivation and Personality. New York, NY: Harper & Brothers.
Mattelmäki, T. (2006). Design Probes. University of Art and Design Helsinki, Helsinki, Finland, PhD thesis.
Matzler, K., Hinterhuber, H. H., Bailom, F., & Sauerwein, E. (1996). How to delight your customers. Journal of Product & Brand Management, 5(2), 6-18.
Mayhew, D. J. (1999). The Usability Engineering Lifecycle. London: Academic Press.
Mayhew, D. J. (2008). Requirements Specifications within the Usability Engineering Lifecycle. In A. Sears & J. A. Jacko (Eds.), The Human–Computer Interaction Handbook. Fundamentals, Evolving Technologies, and Emerging Applications (2nd ed.). New York, NY: Taylor & Francis.
Mayring, P. (2000). Qualitative Content Analysis. Forum: Qualitative Social Research, 1(2).
Mayring, P. (2007). Qualitative Inhaltsanalyse. Grundlagen und Techniken (9 ed.). Weinheim, Germany: Beltz Verlag.
McDowd, J. M., & Shaw, R. J. (2000). Attention and aging: A functional perspective. In F. I. M. Craik & T. A. Salthouse (Eds.), Handbook of aging and cognition (2nd ed., pp. 221-292). Mahwah, NJ: Lawrence Erlbaum Associates Publishers.
REFERENCES 206
Melenhorst, A.-S. (2002). Adopting communication technology in later life: The decisive role of benefits. Technische Universiteit Eindhoven, Eindhoven, The Netherlands, PhD thesis.
Melenhorst, A.-S., Rogers, W. A., & Bouwhuis, D. G. (2006). Older Adults’ Motivated Choice for Technological Innovation: Evidence for Benefit-Driven Selectivity. Psychology and Aging, 21(1), 190-195.
Mikulić, J. (2007). The Kano Model – A Review of its Application in Marketing Research from 1984 to 2006. International Conference Marketing Theory Challenges in Transitional Countries. Maribor, Slovenia.
Miles, M. B., & Huberman, A. M. (1994). Qualitative data analysis: An expanded sourcebook. Thousand Oaks, CA: Sage.
Millen, D. R. (2000). Rapid Ethnography: Time Deepening Strategies for HCI Fiel Research. Proceedings of the 3rd conference on Designing Interactive Systems (pp. 280-286). New York: ACM.
Miller, G. A. (1956). The magical number seven plus or minus two: Some limits on our capacity for processing information. Psychological Review, 63, 81–97.
Minge, M. (2008). Dynamics of User Experience Proceedings of the Workshop „Research Goals and Strategies for Studying User Experience and Emotion” at NordiCHI 2008. Lund, Sweden.
Mitzner, T. L., Boron, J. B., Fausset, C. B., Adams, A. E., Charness, N., Czaja, S. J., et al. (2010). Older Adults Talk Technology: Technology Usage and Attitudes. Computers in Human Behavior, 26(6), 1710-1721.
Mitzner, T. L., Mayhorn, C. B., Fisk, A. D., & Rogers, W. A. (2006). Ergonomics and Aging. In W. S. Marras & W. Karwowski (Eds.), Fundamentals and assessment tools for occupational ergonomics (pp. 17.11-17.22). Boca Raton, FL: CRC Press.
Mohs, C., Hurtienne, J., Israel, J. H., Naumann, A., Kindsmüller, M. C., Meyer, H. A., & Pohlmeyer, A. (2006). IUUI - Intuitive use of user interfaces. In T. Bosnick, M. Hassenzahl, M. Müller-Prove & M. Peissner (Eds.), Usability professionals 2006 (pp. 130-133). Stuttgart, Germany: German Chapter der Usability Professionals Association e.V.
Mørup, M. (1992). A New Design for Quality Paradigm. Journal of Engineering Design, 3(1), 63-80.
Muller, M. J. (2008). Participatory Design: The third space in HCI. In A. Sears & J. A. Jacko (Eds.), The Human–Computer Interaction Handbook. Fundamentals, Evolving Technologies, and Emerging Applications (2nd ed., pp. 1061-1081). New York, NY: Taylor & Francis.
Myers, J. H., & Alpert, M. I. (1968). Determinant Buying Attitudes: Meaning and Measurement. Journal of Marketing, 32:4 Part I, 13-20.
Myers, J. H., & Alpert, M. I. (1977). Semantic Confusion in Attitude Research: Salience vs. Importance vs. Determinance. In W. D. Perreault Jr. (Ed.), Advances in Consumer Research (Vol. 04, pp. 106-110). Atlanta, GA: Association for Consumer Research.
Nemeth, C. (2004). Human Factors Methods for Design. Boca Raton, FL: CRC Press.
Nichols, T. A., Rogers, W. A., & Fisk, A. D. (2006). Design for Aging. In G. Salvendy (Ed.), Handbook of Human Factors and Ergonomics (pp. 1418-1445). Hoboken, NJ: John Wiley and Sons, Inc.
REFERENCES 207
Nielsen, J. (1993). Usability Engineering. San Diego, CA: Academic Press.
Nilsson-Witell, L., & Fundin, A. (2005). Dynamics of Service Attributes: A Test of Kano’s Theory of Attractive Quality. International Journal of Service Industry Management, 16(2), 152-168.
Norman, D. A. (1986). Cognitive Engineering. In D. A. Norman & S. W. Draper (Eds.), User Centered System Design (pp. 31-61). Hillsdale, NJ: Lawrence Erlbaum Associates.
Norman, D. A. (1998). The Invisible Computer. Cambridge, MA: The MIT Press.
Norman, D. A. (2004). Emotional Design: Why We Love (or Hate) Everyday Things. New York, NY: Basic Books.
O´Curry, S., & Strahilewitz, M. (2001). Probability and Mode of Acquisition Effects on Choices Between Hedonic and Utilitarian Options. Marketing Letters, 12(1), 37-49.
Oliver, R. L. (1993). Cognitive, Affective, and Attribute Bases of the Satisfaction Response. Journal of Consumer Research, 20, 418-430.
Oliver, R. L. (1997). Satisfaction: A Behavioral Perspective on the Consumer. Boston, MA: McGraw-Hill.
Oliver, R. L., & Desarbo, W. S. (1988). Response Determinants in Satisfaction Judgments. Journal of Consumer Research, 14(4), 495-507.
Orme, B. (1996). Which Conjoint Method Should I Use? Sawtooth Software, Research Paper Series.
Orme, B. (2002). Interpreting Conjoint Analysis Data. Sawtooth Software, Research Paper Series.
Otjacques, B., Krier, M., Feltz, F., Ferring, D., & Hoffmann, M. (2009). User-Centered Activity Management System for Elderly People. Empowering Older People with Interactive Technologies to Manage their Activities at the Retirement Home. Proceedings of 3rd International Conference on Pervasive Computing Technologies for Healthcare (Pervasive Health) 2009 (pp. 1-4).
Pahl, G., Beitz, W., Feldhusen, J., & Grote, K. H. (2007). Engineering Design. A Systematic Approach (3rd ed.). London: Springer.
Park, S., & Mowen, J. C. (2007). Replacement purchase decisions: On the effects of trade-ins, hedonic versus utilitarian usage goal, and tightwadism. Journal of Consumer Behaviour, 6, 123–131.
Pawitra, T. A., & Tan, K. C. (2003). Tourist satisfaction in Singapore – a perspective from Indonesian tourists. Managing Service Quality, 13(5), 399-411.
PEW. (2009). Pew Internet & American Life Project: Generations online in 2009. Last Retrieved March, 2010, from http://www.pewinternet.org/~/media//Files/Reports/2009/PIP _Generations_2009.pdf
Piller, F. T., & Walcher, D. (2006). Toolkits for idea competitions: a novel method to integrate users in new product development. R&D Management, 36(3), 307–318.
REFERENCES 208
Pohlmeyer, A. E., & Blessing, L. (2009). To Use Or Not To Use. Good Is Not Always the Opposite of Bad. 4th International Conference on Designing Pleasurable Products and Interfaces, DPPI09 (pp. 99-103). Compiègne, France.
Pohlmeyer, A. E., & Blessing, L. (2011). A Conjoint Analysis of Attributes Affecting the Likelihood of Technology Use. In A. Marcus (Ed.), Design, User Experience, and Usability, Pt II, HCII 2011, LNCS 6770 (pp. 303–312). Berlin, Germany: Springer-Verlag.
Pohlmeyer, A. E., Blessing, L., Wandke, H., & Maue, J. (2009). The Value of Answers Without Question[s]. A Qualitative Approach to User Experience and Aging. In M. Kurosu (Ed.), Human Centered Design, HCII 2009, LNCS 5619 (pp. 894–903). Berlin, Germany: Springer-Verlag.
Pohlmeyer, A. E., Hecht, M., & Blessing, L. (2009). User Experience Lifecycle Model ContinUE [Continuous User Experience]. In A. Lichtenstein, C. Stößel & C. Clemens (Eds.), Der Mensch im Mittepunkt technischer Systeme. Fortschritt-Berichte VDI Reihe 22 Nr. 29 (pp. 314-317). Düsseldorf, Germany: VDI-Verlag.
Pohlmeyer, A. E., Machens, F., & Blessing, L. (2010). Attractive or Not - What's the Difference? Inter- and Intra-Group Comparisons in the Kano Model. In D. Marjanovic, M. Storga, N. Pavkovic & N. Bojcetic (Eds.), 11th International Design Conference - DESIGN 2010 (pp. 413-422). Zagreb, Croatia: University of Zagreb.
Raskin, J. (2000). The Humane Interface. New Directions for Designing Interactive Systems. Boston, MA: Addison-Wesley.
Rauterberg, M. (1995a). Ein Konzept zur Quantifizierung software-ergonomischer Richtlinien. ETH Zürich.
Rauterberg, M. (1995b). Usability evaluation: An empirical validation of different measures to quantify interface attributes. In T. Sheridan (Ed.), Analysis, Design and Evaluation of Man-Machine Systems (Vol. 2, pp. 467-472). Oxford: Pergamon Press.
Reinicke, T. (2004). Möglichkeiten und Grenzen der Nutzerintegration in der Produktentwicklung. Technische Universität Berlin, Berlin, Germany, PhD thesis.
Reis, H. T., & Gable, S. L. (2000). Event-sampling and other methods for studying everyday experience. In H. T. Reis & C. M. Judd (Eds.), Handbook of Research Methods in Social and Personality Psychology (pp. 190-222). Cambridge, UK: Cambridge University Press.
Riemenschneider, C. K., Hardgrave, B. C., & Davis, F. D. (2002). Explaining software developer acceptance of methodologies: A comparison of five theoretical models. IEEE Transactions on Software Engineering, 28(12), 1135–1145.
Roetting, M., Huang, Y. H., McDevitt, J. R., & Melton, D. (2003). When technology tells you how you drive - Truck drivers' attitudes towards feedback by technology. Transportation Research Part F: Traffic Psychology and Behaviour, 6(4), 275-287.
Rogers, E. M. (1995). Diffusion of Innovations (4th ed.). New York, NY: The Free Press.
Rogers, W. A., & Fisk, A. D. (2010). Toward a Psychological Science of Advanced Technology Design for Older Adults. Journal of Gerontology: Psychological Sciences, 65B(6), 645–653.
Roozenburg, N. F. M., & Eekels, J. (1995). Product Design: Fundamentals and Methods. Chichester, UK: John Wiley & Sons Ltd.
REFERENCES 209
Roto, V. (2007). User Experience from Product Creation Perspective. Towards a UX Manifesto Workshop, in Conjunction with HCI 2007. Lancaster, UK.
Rust, R. T., Thompson, D. V., & Hamilton, R. W. (2006). Defeating Feature Fatigue. Harvard Business Review, 84(2), 98-107.
Ryan, R. M., & Deci, E. L. (2000). Self-determination theory and the facilitation of intrinsic motivation, social development, and well-being. American Psychologist, 55, 68-78.
Salthouse, T. A. (1996). The processing-speed theory of adult age differences in cognition. Psychological Review, 103(3), 403-428.
Salthouse, T. A., & Babcock, R. L. (1991). Decomposing adult age differences in working memory. Developmental Psychology, 27(5), 763-776.
Sanders, E. (2002). How "applied ethnography" can improve your NPD research process. pdma Visions Magazine, 26(2), 8-12.
Sanders, E. B.-N. (2005). Information, Inspiration and Co-creation. 6th International Conference of the European Academy of Design. Bremen, Germany.
Sanders, L. (2008). An evolving map of design practice and design research. interactions, 15(6), 13-17.
Sattler, H. (2006) Methoden zur Messung von Präferenzen für Innovationen. Research Papers on Marketing and Retailing: Vol. 32: University of Hamburg.
Sattler, H., & Hensel-Börner, S. (2007). A Comparison of Conjoint Measurement with Self-Explicated Approaches. In A. Gustafsson, A. Herrmann & F. Huber (Eds.), Conjoint Measurement. Methods and Applications (4th ed., pp. 66-76). Heidelberg, Germany: Springer.
Schaie, K. W. (2004). Cognitive aging. In R. W. Pew & S. B. van Hemel (Eds.), Technology for adaptive aging (pp. 43-63). Washington, DC: The National Academies Press.
Schieber, F. (2003). Human Factors and Aging: Identifying and Compensating for Age-related Deficits in Sensory and Cognitive Function. In N. Charness & K. W. Schaie (Eds.), Impact of Technology on Successful Aging (pp. 42-84). New York, NY: Springer Publishing Company.
Schiffler, R. E. (1988). Maximum Z Scores and Outliers. The American Statistician, 42(1), 79-80.
Schindler, R. M., & Holbrook, M. B. (2003). Nostalgia for early experience as a determinant of consumer preferences. Psychology and Marketing, 20(4), 275-302.
Schmidt, R. (1996). Marktorientierte Konzeptfindung für langlebige Gebrausgüter. Wiesbaden, Germany: Gabler.
Sengpiel, M., & Dittberner, D. (2008). The computer literacy scale (CLS) for older adults - development and validation. In M. Herczeg & M. C. Kindsmüller (Eds.), Mensch & Computer 2008: Viel Mehr Interaktion (pp. 7-16). München, Germany: Oldenbourg Verlag.
Shackel, B. (1991). Usability – Context, Framework, Definition, Design and Evaluation. In B. Shackel & S. J. Richardson (Eds.), Human Factors for Informatics Usability (pp. 21-37). Cambridge, UK: Cambridge University Press.
REFERENCES 210
Sharp, H., Rogers, Y., & Preece, J. (2007). Interaction Design. West Sussex, UK: John Wiley & Sons, Ltd.
Sheldon, K. M., Elliot, A. J., Kim, Y., & Kasser, T. (2001). What Is Satisfying About Satisfying Events? Testing 10 Candidate Psychological Needs. Journal of Personality and Social Psychology, 30(2), 325-339.
Shen, X. X., Tan, K. C., & Xie, M. (2000). An integrated approach to innovative product development using Kano’s model and QFD. [Conceptual Paper]. European Journal of Innovation Management, 3(2), 91-99.
Sheskin, D. J. (2004). Handbook of parametric and nonparametric statistical procedures (3rd ed.). Boca Raton, FL: Chapman & Hall.
Smith, M. W., Sharit, J., & Czaja, S. J. (1999). Aging, Motor Control, and the Performance of Computer Mouse Tasks. Human Factors, 41(3), 389-396.
Sonderegger, A., & Sauer, J. (2010). The influence of design aesthetics in usability testing: Effects on user performance and perceived usability. Applied Ergonomics, 41, 403-410.
Spanner-Ulmer, B., & Scherf, C. (2009). Alter erleben - Alterssimulation mit MAX. In T. Maier (Ed.), Von der Usability zur nutzergerechten Gestaltung. Bericht Nr. 562 des Institutes für Konstruktionstechnik und Technisches Design, Human Machine Interaction Design (pp. 51 - 60). Stuttgart, Germany: IKTD.
Srinivasan, V. (1988). A Conjunctive-Compensatory Approach to the Self-Explication of Multiattributed Preferences. Decision Sciences, 19, 295-305.
Stevens, J. P. (2002). Applied Multivariate Statistics for the Social Sciences (4th ed.). Mahwah, NJ: Lawrence Erlbaum Associates.
Stewart, T. (1992). Physical interfaces or "obviously it's for the elderly, it's grey, boring and dull". In H. Bouma & J. A. M. Graafmans (Eds.), Gerontechnology (pp. 197-207). Amsterdam, The Netherlands: IOS Press.
Story, M. F., Mueller, J. L., & Mace, R. L. (1998). The Universal Design File: Designing for People of All Ages and Abilities. Raleigh, NC: NC State University. The Center for Universal Design.
Streitz, N. A. (1986). Cognitive ergonomics: an approach for the design of user-oriented interactive systems. In F. Klix & H. Wandke (Eds.), MACINTER I, Proceedings of the 1st Network Seminar of the International Union of Psychological Science (IUPsyS) on Man-Computer Interaction Research (pp. 21–33). Amsterdam, The Netherlands: North-Holland.
Suri, J. F. (2002). Designing Experience: Whether to Measure Pleasure or Just Tune In? In W. S. Green & P. W. Jordan (Eds.), Pleasure with Products. Beyond Usability (pp. 161–174). London, UK: Taylor & Francis.
Tan, K. C., & Shen, X. X. (2000). Integrating Kano’s model in the planning matrix of quality function deployment. Total Quality Management, 11(8), 1141-1151.
Thaler, R. (1980). Toward a positive theory of consumer choice. Journal of Economic Behavior & Organization, 1(1), 39-60.
REFERENCES 211
Thompson, D. V., Hamilton, R. W., & Rust, R. T. (2005). Feature Fatigue: When Product Capabilities Become Too Much of a Good Thing. Journal of Marketing Research, 42, 431–442.
Tontini, G. (2007). Integrating the Kano Model and QFD for Designing New Products. Total Quality Management, 18(6), 599-612.
Tractinsky, N., Katz, A. S., & Ikar, D. (2000). What is beautiful is usable. Interacting with Computers, 13(2), 127-145.
Tractinsky, N., & Zmiri, D. (2006). Exploring Attributes of Skins as Potential Antecedents of Emotion in HCI. In P. Fishwick (Ed.), Aesthetic Computing (pp. 405-422). Cambridge, MA: MIT Press.
Tuck, M. (1973). Fishbein Theory and the Bass-Talarzk Problem. Journal of Marketing Research, 10(3), 345-348.
Ulrich, K. T., & Eppinger, S. D. (2008). Product Design and Development (4th ed.). New York, NY: McGraw-Hill.
Ulwick, A. W. (2002). Turn Customer Input into Innovation. Harvard Business Review, 80(1), 92-97.
Umemuro, H. (2004). Computer attitudes, cognitive abilities, and technology usage among older Japanese adults. Gerontechnology, 3(2), 64-76.
United Nations. (2009). World Population Prospects, 2008 Revision. Last Retrieved June, 2011, http://social.un.org/index/Ageing/DataonOlderPersons/ADemographicsCharts.aspx
UsabilityNet. (2006). Methods Table. Last Retrieved May, 2011, from http://www.usabilitynet.org/tools/methods.htm
van Bronswijk, J. E. M. H., Bouma, H., Fozard, J. L., Kearns, W. D., Davison, G. C., & Tuan, P.-C. (2009). Defining gerontechnology for R&D purposes. Gerontechnology, 8(1), 3-10.
van der Heijden, H. (2004). User acceptance of hedonic information systems. MIS Quarterly, 28(4), 695-704.
van Ittersum, K., Pennings, J. M. E., Wansink, B., & van Trijp, H. C. M. (2007). The validity of attribute-importance measurement: A review. Journal of Business Research, 60, 1177–1190.
VDI. (1993). VDI 2221. Systematic Approach to the Development and Design of Technical Systems and Products. Düsseldorf: VDI-Verlag.
VDI. (1994). VDI 2247. Quality Management in Product Development (draft). Düsseldorf: VDI-Verlag.
Venkatesh, V., & Brown, S. A. (2001). A Longitudinal Investigation of Personal Computers in Homes: Adoption Determinants and Emerging Challenges. MIS Quarterly, 25(1), 71-102.
Venkatesh, V., & Davis, F. D. (2000). A Theoretical Extension of the Technology Acceptance Model: Four Longitudinal Field Studies. Management Science, 46(2), 186-204.
Venkatesh, V., Davis, F. D., & Morris, M. G. (2007). Dead Or Alive? The Development, Trajectory And Future Of Technology Adoption Research. Journal of the Association for Information Systems, 8(4), 268-286.
REFERENCES 212
Venkatesh, V., Morris, M. G., Davis, G. B., & Davis, F. D. (2003). User Acceptance of Information Technology: Toward a Unified View. MIS Quarterly, 27(3), 425-478.
Vercruyssen, M. (1997). Movement control and speed of behavior. In A. D. Fisk & W. A. Rogers (Eds.), Handbook of Human Factors and the Older Adult (pp. 55-86). San Diego, CA: Academic Press.
Völckner, F. (2005) Biases in Measuring Consumers’ Willingness to Pay. Research Papers on Marketing and Retailing: Vol. 25: University of Hamburg.
Völckner, F. (2006). An Empirical Comparison of Methods for Measuring Consumers’ Willingness to Pay. Marketing Letters, 17(2), 137-149.
von Dran, G. M., Zhang, P., & Small, R. (1999). Quality Websites: An Application of the Kano Model to Website Design. Proceedings of the Fifth Americas Conference on Information Systems (pp. 898-900). Milwaukee, WI.
von Hippel, E. (1986). Lead Users: A Source of Novel Product Concepts. Management Science, 32(7), 791-805.
von Hippel, E. (2005). Democratizing Innovation. Cambridge, MA: MIT Press.
von Hippel, E., & Katz, R. (2002). Shifting Innovation to Users via Toolkits. Management Science, 48(7), 821-833.
Wagner, N., Hassanein, K., & Head, M. (2010). Computer use by older adults: A multi-disciplinary review. Computers in Human Behavior, 26, 870–882.
Weiner, B. (1985). An Attributional Theory of Achievement Motivation and Emotion. Psychological Review, 92(4), 548-573.
Wheelwright, S. C., & Clark, K. B. (1992). Revolutionizing Product Development. Quantum Leaps in Speed, Efficiency, and Quality. New York, NY: The Free Press.
Wittink, D. R. (1989). Commercial Use of Conjoint Analysis: An Update. Journal of Marketing, 53(3), 91-96.
Wittink, D. R., Krishnamurthi, L., & Reibstein, D. J. (1990). The Effect of Differences in the Number of Attribute Levels on Conjoint Results. Marketing Letters, 1(2), 113-123.
Wittink, D. R., Vriens, M., & Burhenne, W. (1994). Commercial Use of Conjoint Analysis in Europe: Results and Critical Reflections. International Journal of Research in Marketing, 11(1), 41–52.
Zanger, C., & Baier, G. (1998). Händlerzufriedenheit mit Telekommunikationsgroßhändlern - Eine empirische Untersuchung zum Methodenvergleich zwischen Conjoint-Analyse und Kano-Modell. In V. Trommsdorff (Ed.), Handelsforschung 1998/99 – Innovation im Handel: Jahrbuch der Forschungsstelle für den Handel Berlin e.V. (pp. 407-432). Wiesbaden, Germany: Gabler Verlag.
Ziefle, M., & Bay, S. (2005). How older adults meet complexity: Aging effects on the usability of different mobile phones. Behaviour and Information Technology, 24(5), 375-389.
LIST OF FIGURES 213
LIST OF FIGURES
Figure 1-1 Overview of Thesis Structure and Themes ........................................................................... 5
Figure 2-1 Steps in the Planning and Design Process (adapted from Pahl, et al., 2007) ................... 7
Figure 2-2 User-Centered Design Activities (after ISO, 2010) .............................................................. 9
Figure 2-3 Waves of Continuous Problem Solving Processes along the Development Process ... 16
Figure 2-4 Weights of Different Hierarchical Levels ............................................................................ 17
Figure 2-5 House of Quality (adapted from Griffin & Hauser, 1993; Hauser & Clausing, 1988) . 19
Figure 2-6 Degree of User Involvement in Different Design Settings (after Eason, 1995) ........... 23
Figure 2-7 Technology Acceptance Model TAM (after Davis, et al., 1989, p. 985) ......................... 25
Figure 2-8 Research Model of Pragmatic and Hedonic Attribute Groups (adapted from Hassenzahl, 2001, 2003; Hassenzahl, et al., 2000) .............................................................. 30
Figure 4-1 Study Impressions: Introduction Session, Task Material; Documentation Sheet for Product-Specific Statements; List of General De-/Motivating Reasons. ....................... 72
Figure 4-2 Process Model of Qualitative Content Analysis – Inductive Approach (adapted from Mayring, 2000) ......................................................................................................................... 76
Figure 4-3 Photographs Related to the Attribute-Category ‘Aesthetics. Fit in Apartment’. Positive (left) and Negative (right) Example ...................................................................................... 82
Figure 4-4 Distribution of Main Attribute-Categories in Percent Regarding Motivating (first two bars per category) and De-Motivating Reasons by Young (light filling) and Older (dark filling) Adults ............................................................................................................................ 84
Figure 4-5 Distribution of Mean Relative Frequencies (± SE mean) Regarding Main Attribute-Categories of Product-Specific Statements. ......................................................................... 88
Figure 4-6 Distribution of Mean Relative Frequencies in Percent (± SE mean) Regarding Product-Specific Statements Between Age Groups (left figure) and Valence (right figure) ........................................................................................................................................ 88
Figure 5-1 Kano Model of Customer Satisfaction (adapted from Berger, et al., 1993) ................. 102
Figure 5-2 Conjoint Profile Cards and Participant with Card and Rating Sheet ............................ 109
Figure 5-3 Mean SSI Ratings (± SE mean) by Young and Older Adults ........................................ 116
Figure 5-4 Part-Worth Utilities (± SE beta) and Mean Relative Importance (± SE mean) of Young and Older Adults ...................................................................................................... 118
Figure 5-5 Coefficients for Satisfaction/Dissatisfaction of Young and Older Adults and Order of Decreasing Importance ......................................................................................................... 122
Figure 5-6 Coefficients of Satisfaction/Dissatisfaction of Young and Older Adults (weighted by part-worth utilities) ................................................................................................................ 123
Figure 6-1 Construction Kit (left). Participant in Action (middle). Colored Box with Color-Legend (right) ......................................................................................................................... 145
Figure 6-2 Room Setup (left). Individual Desk (middle). ‘End of Block’ Indicator (right). .......... 148
Figure 6-3 Flowchart of Study Procedure ............................................................................................ 148
LIST OF FIGURES 214
Figure 6-4 Mean Self-Stated Importance (SSI) Ratings (± SE mean) by Young and Older Adults .................................................................................................................................................. 154
Figure 6-5 Mean Self-Stated Importance (SSI) Ratings (± SE mean) Regarding Products of Differing Value (hedonic vs. utilitarian) and Simplicity (simple vs. difficult) ............... 154
Figure 6-6 Mean Percent (± SE mean) of Bricks Selected per Attribute by Age Group (left) and by Value (right) ...................................................................................................................... 156
Figure 6-7 Mean Percent (± SE mean) of Bricks Selected with Respect to Quality (left) and Aesthetics (right). Interaction Effect Value x Simplicity ................................................. 157
Figure 6-8 Mean Percent (± SE mean) of Bricks Selected with Respect to Functionality (left) and Ease of Use (right). Interaction Effect Value x Simplicity .............................................. 157
Figure 6-9 Mean Percent (± SE mean) of Bricks Selected with Respect to Functionality (left) and Ease of Use (right). Interaction Effect Age x Value x Simplicity ................................... 158
Figure 6-10 Impression of Individual Colored Boxes of Digital Cameras and Washing Machines. FU_red, EA_green, ER_white, QU_yellow, AE_blue, EM_orange. ............................ 160
Figure 7-1 User Experience Lifecycle Model ContinUE: Continuous User Experience .............. 177
Figure 7-2 Labeled and Fixated Remote Controls of a Friend’s Grandmother .............................. 181
Figure A. 2-1 Coding Hierarchy for Products – Purpose and Purpose_Specific ........................... 224
Figure A. 3-1 Self-Stated Importance Rating ....................................................................................... 232
Figure A. 3-2 Description of Attribute Levels ..................................................................................... 233
Figure A. 3-3 Example of a Conjoint Profile Card ............................................................................. 234
Figure A. 3-4 Rating Scale for Respective Conjoint Profile Card ..................................................... 234
Figure A. 3-5 Instruction Kano .............................................................................................................. 235
Figure A. 3-6 Kano Questionnaire ........................................................................................................ 235
Figure A. 3-7 Evaluation of Task Demands (Same Statements for Conjoint and Kano) ............. 236
Figure A. 3-8 Screenshots of Macro for Kano Classification – Aesthetics ..................................... 239
Figure A. 4-1 Instruction Pre-Study ...................................................................................................... 243
Figure A. 4-2 Survey Pre-Study .............................................................................................................. 244
Figure A. 4-3 Product Classification; Familiarity; Baseline Usefulness ............................................ 245
Figure A. 4-4 Priority Ranks ................................................................................................................... 245
Figure A. 4-5 Description of Attributes in Form of Questions ........................................................ 246
Figure A. 4-6 Legend for Construction Task (Including Optimum Anchor of 60 Bricks) ........... 246
Figure A. 4-7 Description of Base Product .......................................................................................... 247
Figure A. 4-8 Product-Specific Description of Base Functionality (Washing Machine) ............... 247
Figure A. 4-9 Written Instruction for Construction Task .................................................................. 248
Figure A. 4-10 Post-Questionnaire (Confidence; Usefulness; Likelihood; ‘Why Ideal’) ............... 248
Figure A. 4-11 Evaluation of Task Demands and Feedback on Strategy ........................................ 249
Figure A. 4-12 Influence of Color and Location. Reason for Selection of First Brick. ................. 249
LIST OF TABLES 215
LIST OF TABLES
Table 2-1 Views on Human-Computer Interaction (after Rauterberg, 1995a, p. 60) ...................... 50
Table 2-2 Method Overview: Assessing Attribute Importance. .......................................................... 58
Table 4-1 Overview of Data Sets and Factors of the Analyses ........................................................... 75
Table 4-2 Attribute-Categories and Main Attribute-Categories (CAPITALIZED) of General Reasons .................................................................................................................................................... 78
Table 4-3 Inter-Coder Agreement (after Landis & Koch, 1977, p. 165) ........................................... 80
Table 4-4 Attribute-Categories and Main Attribute-Categories (CAPITALIZED) of Product-Specific Statements ................................................................................................................................. 81
Table 4-5 Z-Test for Two Independent Proportions: Motivating and De-Motivating Reasons .... 85
Table 4-6 Relevance Ratings of Main Attribute-Categories (scale 1-5; 5 max) ................................. 86
Table 5-1 Attributes and Levels ............................................................................................................. 108
Table 5-2 Kano Classification (after Berger, et al., 1993, p. 6) .......................................................... 111
Table 5-3 Kano Classification by Young and Older Adults (M=must-be; O=one-dimensional; A=attractive; I=indifferent; R=reversed; Q=questionable) ........................................... 119
Table 6-1 Typology of Self-Oriented Consumer Value (adapted from Holbrook, 1999) ............. 138
Table 6-2 Classification of Hedonic and Utilitarian Products ........................................................... 152
Table 6-3 Study design of the 2 (value) x 2 (simplicity) within-subject factors ............................... 152
Table 6-4 Frequencies of Self-Stated Degree of Expertise and Frequency of Usage .................... 152
Table 6-5 Frequencies Regarding Stated Highest Priority, Greatest Need for Optimization, and Willingness for Trade-Off (sum of TV, camera, washing machine, and fax machine). .................................................................................................................................................. 155
Table 6-6 Selection of Relative Frequencies (and Counts) Concerning Open Responses Why the Four Self-Constructed Products were Considered to be ‘Ideal’ ..................................... 159
Table A. 2-1 Excerpt of Coding Scheme for Product-Specific Statements [Main Attribute-Category: Quality] .................................................................................................................. 221
Table A. 2-2 Coding Scheme for Products – Level of Mobility ........................................................ 222
Table A. 2-3 Coding Scheme for Products – Size ............................................................................... 222
Table A. 2-4 Excerpt of Coding Scheme for Products – Location .................................................. 223
Table A. 2-5 Excerpt of Coding Scheme for Products – Purpose ................................................... 223
Table A. 2-6 Attribute-Categories and Main Attribute-Categories (CAPITALIZED) of General Reasons (including absolute counts; total=375 reasons) ................................................ 224
Table A. 2-7 Attribute-Categories and Main Attribute-Categories (CAPITALIZED) of Product-Specific Statements (including absolute counts; total=2493 statements) ...................... 225
Table A. 2-8 Mixed Design ANOVA for Usefulness ......................................................................... 225
Table A. 2-9 Mixed Design ANOVA for Functionality ..................................................................... 225
LIST OF TABLES 216
Table A. 2-10 Mixed Design ANOVA for Ease of Use ..................................................................... 226
Table A. 2-11 Mixed Design ANOVA for Ergonomics .................................................................... 226
Table A. 2-12 Mixed Design ANOVA for Quality ............................................................................. 226
Table A. 2-13 Mixed Design ANOVA for Aesthetics ........................................................................ 226
Table A. 2-14 Mixed Design ANOVA for Emotional Involvement ............................................... 227
Table A. 2-15 Mixed Design ANOVA for Costs ................................................................................ 227
Table A. 2-16 Frequencies in Percent and Counts of Products (total= 929) – Level of Mobility .................................................................................................................................................. 227
Table A. 2-17 Frequencies in Percent and Counts of Products (total= 929) – Size ...................... 227
Table A. 2-18 Frequencies in Percent and Counts of Products (total= 929) – Location .............. 228
Table A. 2-19 Frequencies in Percent and Counts of Products (total= 929) – Purpose ............... 228
Table A. 2-20 Frequencies in Percent and Counts of Products (total= 929) – Purpose_Specific .................................................................................................................................................. 228
Table A. 2-21 Mixed Design ANOVA for Factor Age Group ......................................................... 229
Table A. 2-22 Mixed Design ANOVA for Factor Valence ............................................................... 230
Table A. 2-23 Selection of Participants’ Feedback .............................................................................. 231
Table A. 3-1 Overview Counts Highest Educational Degree Achieved .......................................... 236
Table A. 3-2 Comparison of Self-Stated Importance Ratings of Young and Older Adults ......... 237
Table A. 3-3 Excerpt of Orthoplan for Conjoint Analysis (20 Stimulus Cards + 6 Holdout Cards) Illustrates Attribute Level Combinations (0=Level 1; 1=Level 2) .............................. 237
Table A. 3-4 Comparison of Part-Worth Utility Scores of Young and Older Adults ................... 238
Table A. 3-5 Comparison of Mean ‘Relative Importance’ Scores of Young and Older Adults ... 238
Table A. 3-6 Kano Requirement Type Classifications – Functionality ............................................ 240
Table A. 3-7 Intra-Group Comparisons (z-Test) for Functionality .................................................. 240
Table A. 3-8 Kano Requirement Type Classifications – Ease of Use .............................................. 240
Table A. 3-9 Intra-Group Comparisons (z-Test) for Ease of Use .................................................... 240
Table A. 3-10 Kano Requirement Type Classifications – Ergonomics ........................................... 241
Table A. 3-11 Intra-Group Comparisons (z-Test) for Ergonomics ................................................. 241
Table A. 3-12 Kano Requirement Type Classifications – Quality .................................................... 241
Table A. 3-13 Intra-Group Comparisons (z-Test) for Quality .......................................................... 241
Table A. 3-14 Kano Requirement Type Classifications – Aesthetics ............................................... 242
Table A. 3-15 Intra-Group Comparisons (z-Test) for Aesthetics ..................................................... 242
Table A. 3-16 Kano Requirement Type Classifications – Emotional Involvement ....................... 242
Table A. 3-17 Intra-Group Comparisons (z-Test) for Emotional Involvement ............................ 242
Table A. 3-18 Selection of Participants’ Feedback .............................................................................. 243
Table A. 4-1 Products of Pre-Study Sorted by Product Classification of Value and With Regards to Age Differences in Familiarity and/or Likelihood of Use ......................................... 244
Table A. 4-2 Overview Counts Highest Educational Degree Achieved .......................................... 250
Table A. 4-3 Age Group Comparison of Construction Task for Digital Camera (independent t-tests) ......................................................................................................................................... 250
LIST OF TABLES 217
Table A. 4-4 Mean (SD) of Brick Selection in Construction Task for Video Recorder ................ 250
Table A. 4-5 Mixed Design ANOVA for Functionality ..................................................................... 251
Table A. 4-6 Mixed Design ANOVA for Ease of Use ....................................................................... 251
Table A. 4-7 Mixed Design ANOVA for Ergonomics ...................................................................... 251
Table A. 4-8 Mixed Design ANOVA for Quality ............................................................................... 252
Table A. 4-9 Mixed Design ANOVA for Aesthetics .......................................................................... 252
Table A. 4-10 Mixed Design ANOVA for Emotional Involvement ............................................... 252
Table A. 4-11 Mixed Design ANOVA for Functionality – Including Outlier .............................. 253
Table A. 4-12 Mixed Design ANOVA for Ease of Use – Including Outlier .................................. 253
Table A. 4-13 Mixed Design ANOVA for Ergonomics – Including Outlier ................................. 253
Table A. 4-14 Mixed Design ANOVA for Quality – Including Outlier .......................................... 254
Table A. 4-15 Mixed Design ANOVA for Aesthetics – Including Outlier ..................................... 254
Table A. 4-16 Mixed Design ANOVA for Emotional Involvement – Including Outlier ............ 254
Table A. 4-17 Selection of Participants’ Feedback .............................................................................. 255
Table A. 4-18 General Feedback for Engineers/Designers Regarding the Design of Interactive Technologies. Provided by Participants ............................................................................. 255
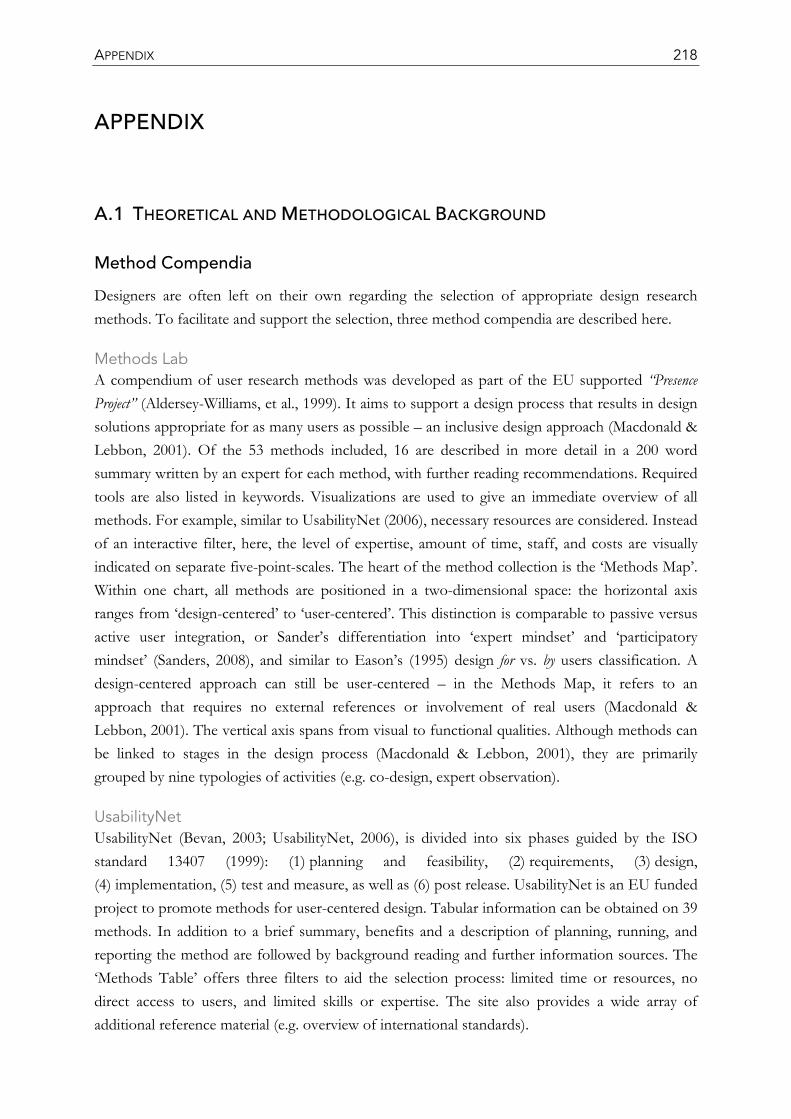
APPENDIX 218
APPENDIX
A.1 THEORETICAL AND METHODOLOGICAL BACKGROUND
Method Compendia
Designers are often left on their own regarding the selection of appropriate design research methods. To facilitate and support the selection, three method compendia are described here.
Methods Lab A compendium of user research methods was developed as part of the EU supported “Presence Project” (Aldersey-Williams, et al., 1999). It aims to support a design process that results in design solutions appropriate for as many users as possible – an inclusive design approach (Macdonald & Lebbon, 2001). Of the 53 methods included, 16 are described in more detail in a 200 word summary written by an expert for each method, with further reading recommendations. Required tools are also listed in keywords. Visualizations are used to give an immediate overview of all methods. For example, similar to UsabilityNet (2006), necessary resources are considered. Instead of an interactive filter, here, the level of expertise, amount of time, staff, and costs are visually indicated on separate five-point-scales. The heart of the method collection is the ‘Methods Map’. Within one chart, all methods are positioned in a two-dimensional space: the horizontal axis ranges from ‘design-centered’ to ‘user-centered’. This distinction is comparable to passive versus active user integration, or Sander’s differentiation into ‘expert mindset’ and ‘participatory mindset’ (Sanders, 2008), and similar to Eason’s (1995) design for vs. by users classification. A design-centered approach can still be user-centered – in the Methods Map, it refers to an approach that requires no external references or involvement of real users (Macdonald & Lebbon, 2001). The vertical axis spans from visual to functional qualities. Although methods can be linked to stages in the design process (Macdonald & Lebbon, 2001), they are primarily grouped by nine typologies of activities (e.g. co-design, expert observation).
UsabilityNet UsabilityNet (Bevan, 2003; UsabilityNet, 2006), is divided into six phases guided by the ISO standard 13407 (1999): (1) planning and feasibility, (2) requirements, (3) design, (4) implementation, (5) test and measure, as well as (6) post release. UsabilityNet is an EU funded project to promote methods for user-centered design. Tabular information can be obtained on 39 methods. In addition to a brief summary, benefits and a description of planning, running, and reporting the method are followed by background reading and further information sources. The ‘Methods Table’ offers three filters to aid the selection process: limited time or resources, no direct access to users, and limited skills or expertise. The site also provides a wide array of additional reference material (e.g. overview of international standards).
APPENDIX 219
MAP tool Under the heading “From Market to Product”, MAP tool (2000) is a result of a cooperative, interdisciplinary research project, based at Universität Karlsruhe, Germany. It aims to support an innovation process, but is not limited to early phases of product innovation, nor to user-centered design. On the contrary, the tool is oriented by a very detailed chronological structure of a systematic product development approach with over 70 activities. Five general phases are differentiated: (1) from market to product idea, (2) from product idea to product concept, (3) from product concept to product, (4) from product to market, and finally (5) from market to success. Within each phase, three further levels of detailing regarding process stage and activity precede a list of possible methods. Thus, an unambiguous positioning within the design process provides a list of relevant and appropriate methods. The entire process and all 143 different methods are displayed in one chart. If appropriate, methods are listed more than once. The strength of the MAP tool is a process-centered rather than method-centered overview, which appears to be well-suited for practical applications. Detailed information is provided for each method: a brief general description of the method, requirements, field of application, implementation, examples, advantages and disadvantages, method variants, as well as references for more information. For further method matrices that connect design activities (e.g. analysis, creativity techniques, selection and evaluation) with general phases of the development process see VDI 2221 (1993) and Glende (2010).
The Methods Lab provides an immediate overview of different methods. On the other hand, for selection purposes in an applied development context, UsabilityNet and the MAP tool seem advantageous due to interactive filters, navigation aids and a chronological order.
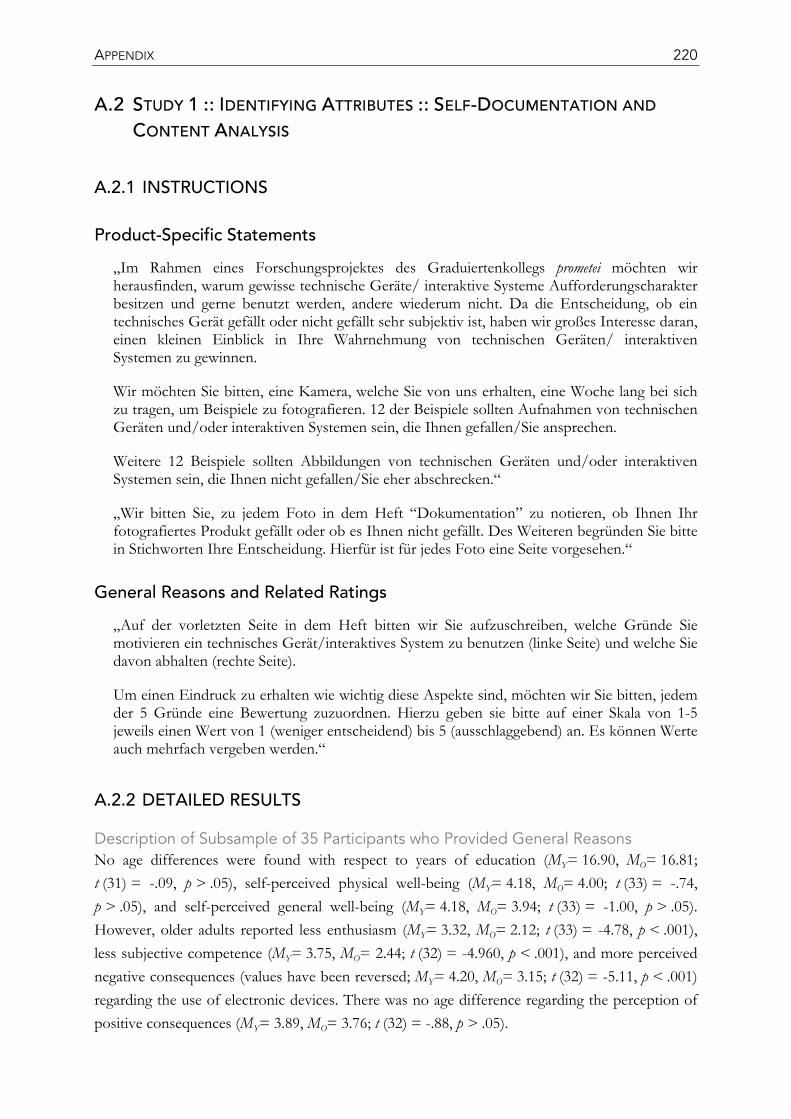
APPENDIX 220
A.2 STUDY 1 :: IDENTIFYING ATTRIBUTES :: SELF-DOCUMENTATION AND
CONTENT ANALYSIS
A.2.1 INSTRUCTIONS
Product-Specific Statements
„Im Rahmen eines Forschungsprojektes des Graduiertenkollegs prometei möchten wir herausfinden, warum gewisse technische Geräte/ interaktive Systeme Aufforderungscharakter besitzen und gerne benutzt werden, andere wiederum nicht. Da die Entscheidung, ob ein technisches Gerät gefällt oder nicht gefällt sehr subjektiv ist, haben wir großes Interesse daran, einen kleinen Einblick in Ihre Wahrnehmung von technischen Geräten/ interaktiven Systemen zu gewinnen.
Wir möchten Sie bitten, eine Kamera, welche Sie von uns erhalten, eine Woche lang bei sich zu tragen, um Beispiele zu fotografieren. 12 der Beispiele sollten Aufnahmen von technischen Geräten und/oder interaktiven Systemen sein, die Ihnen gefallen/Sie ansprechen.
Weitere 12 Beispiele sollten Abbildungen von technischen Geräten und/oder interaktiven Systemen sein, die Ihnen nicht gefallen/Sie eher abschrecken.“
„Wir bitten Sie, zu jedem Foto in dem Heft “Dokumentation” zu notieren, ob Ihnen Ihr fotografiertes Produkt gefällt oder ob es Ihnen nicht gefällt. Des Weiteren begründen Sie bitte in Stichworten Ihre Entscheidung. Hierfür ist für jedes Foto eine Seite vorgesehen.“
General Reasons and Related Ratings
„Auf der vorletzten Seite in dem Heft bitten wir Sie aufzuschreiben, welche Gründe Sie motivieren ein technisches Gerät/interaktives System zu benutzen (linke Seite) und welche Sie davon abhalten (rechte Seite).
Um einen Eindruck zu erhalten wie wichtig diese Aspekte sind, möchten wir Sie bitten, jedem der 5 Gründe eine Bewertung zuzuordnen. Hierzu geben sie bitte auf einer Skala von 1-5 jeweils einen Wert von 1 (weniger entscheidend) bis 5 (ausschlaggebend) an. Es können Werte auch mehrfach vergeben werden.“
A.2.2 DETAILED RESULTS
Description of Subsample of 35 Participants who Provided General Reasons No age differences were found with respect to years of education (MY= 16.90, MO= 16.81; t (31) = -.09, p > .05), self-perceived physical well-being (MY= 4.18, MO= 4.00; t (33) = -.74, p > .05), and self-perceived general well-being (MY= 4.18, MO= 3.94; t (33) = -1.00, p > .05). However, older adults reported less enthusiasm (MY= 3.32, MO= 2.12; t (33) = -4.78, p < .001), less subjective competence (MY= 3.75, MO= 2.44; t (32) = -4.960, p < .001), and more perceived negative consequences (values have been reversed; MY= 4.20, MO= 3.15; t (32) = -5.11, p < .001) regarding the use of electronic devices. There was no age difference regarding the perception of positive consequences (MY= 3.89, MO= 3.76; t (32) = -.88, p > .05).
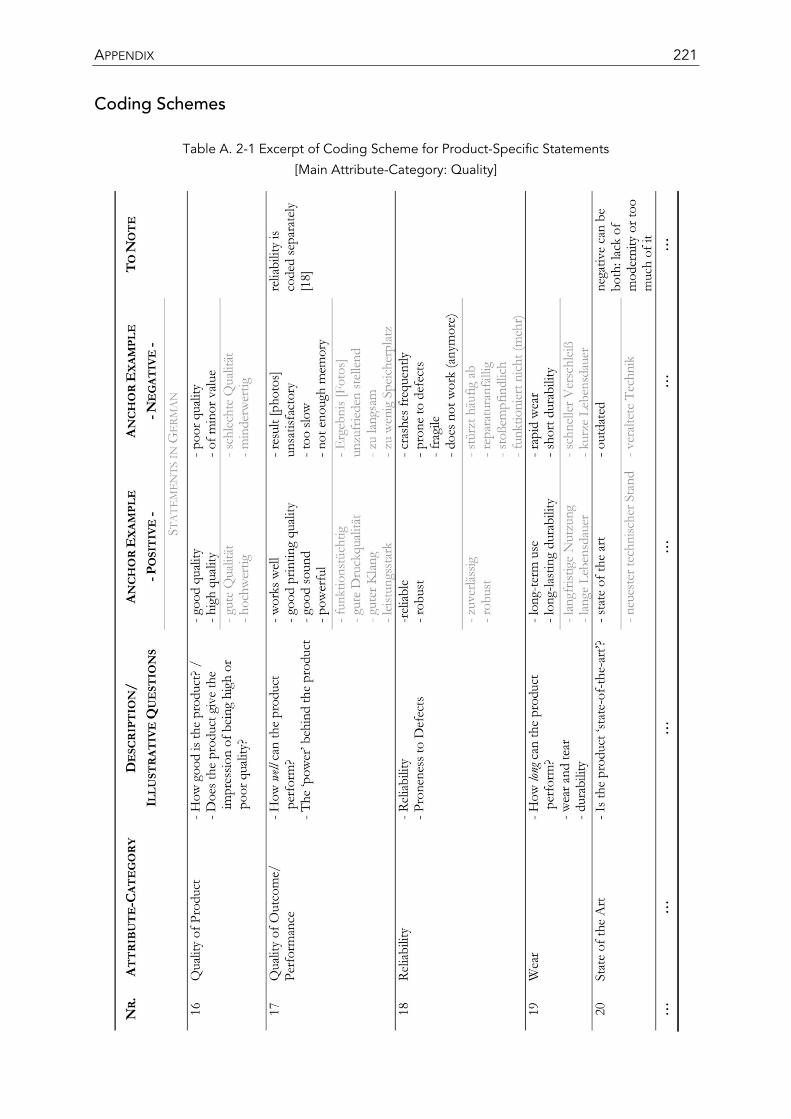
APPENDIX 221
Coding Schemes
Table A. 2-1 Excerpt of Coding Scheme for Product-Specific Statements
[Main Attribute-Category: Quality]
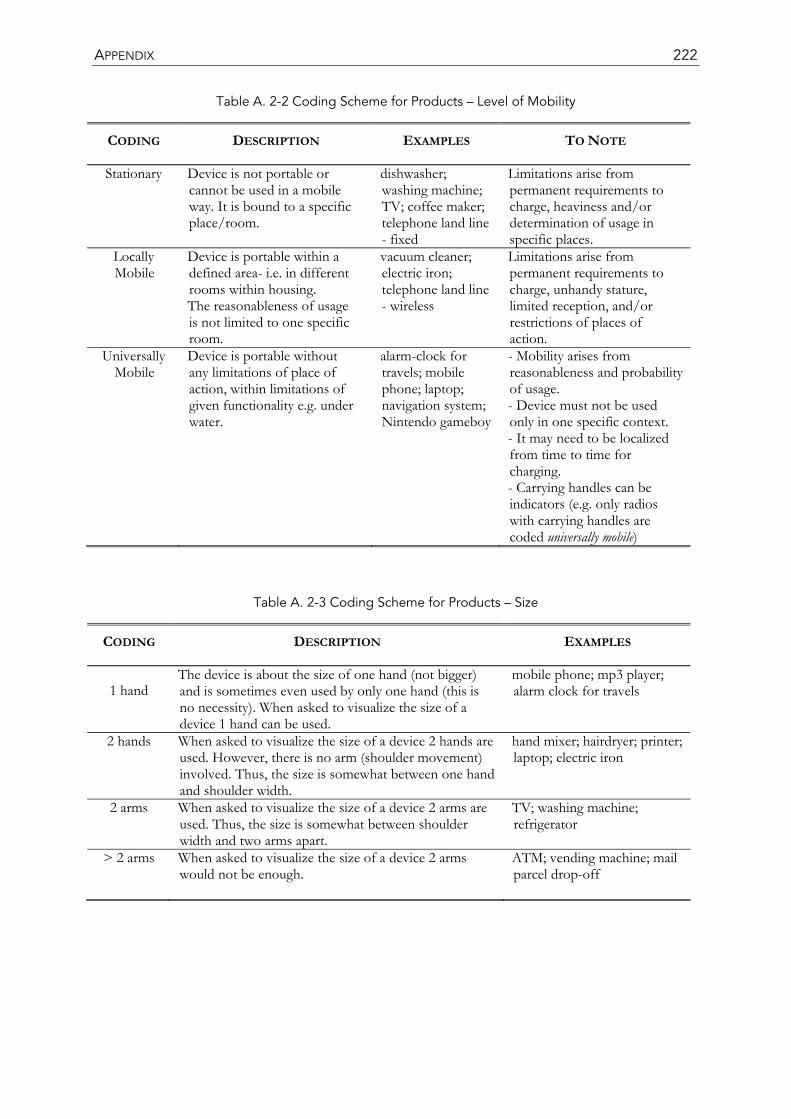
APPENDIX 222
Table A. 2-2 Coding Scheme for Products – Level of Mobility
Table A. 2-3 Coding Scheme for Products – Size
CODING DESCRIPTION EXAMPLES TO NOTE
Stationary Device is not portable or cannot be used in a mobile way. It is bound to a specific place/room.
dishwasher; washing machine; TV; coffee maker; telephone land line - fixed
Limitations arise from permanent requirements to charge, heaviness and/or determination of usage in specific places.
Locally Mobile
Device is portable within a defined area- i.e. in different rooms within housing. The reasonableness of usage is not limited to one specific room.
vacuum cleaner; electric iron; telephone land line - wireless
Limitations arise from permanent requirements to charge, unhandy stature, limited reception, and/or restrictions of places of action.
Universally Mobile
Device is portable without any limitations of place of action, within limitations of given functionality e.g. under water.
alarm-clock for travels; mobile phone; laptop; navigation system; Nintendo gameboy
- Mobility arises from reasonableness and probability of usage. - Device must not be used only in one specific context. - It may need to be localized from time to time for charging. - Carrying handles can be indicators (e.g. only radios with carrying handles are coded universally mobile)
CODING DESCRIPTION EXAMPLES
1 hand The device is about the size of one hand (not bigger) and is sometimes even used by only one hand (this is no necessity). When asked to visualize the size of a device 1 hand can be used.
mobile phone; mp3 player; alarm clock for travels
2 hands When asked to visualize the size of a device 2 hands are used. However, there is no arm (shoulder movement) involved. Thus, the size is somewhat between one hand and shoulder width.
hand mixer; hairdryer; printer; laptop; electric iron
2 arms When asked to visualize the size of a device 2 arms are used. Thus, the size is somewhat between shoulder width and two arms apart.
TV; washing machine; refrigerator
> 2 arms When asked to visualize the size of a device 2 arms would not be enough.
ATM; vending machine; mail parcel drop-off
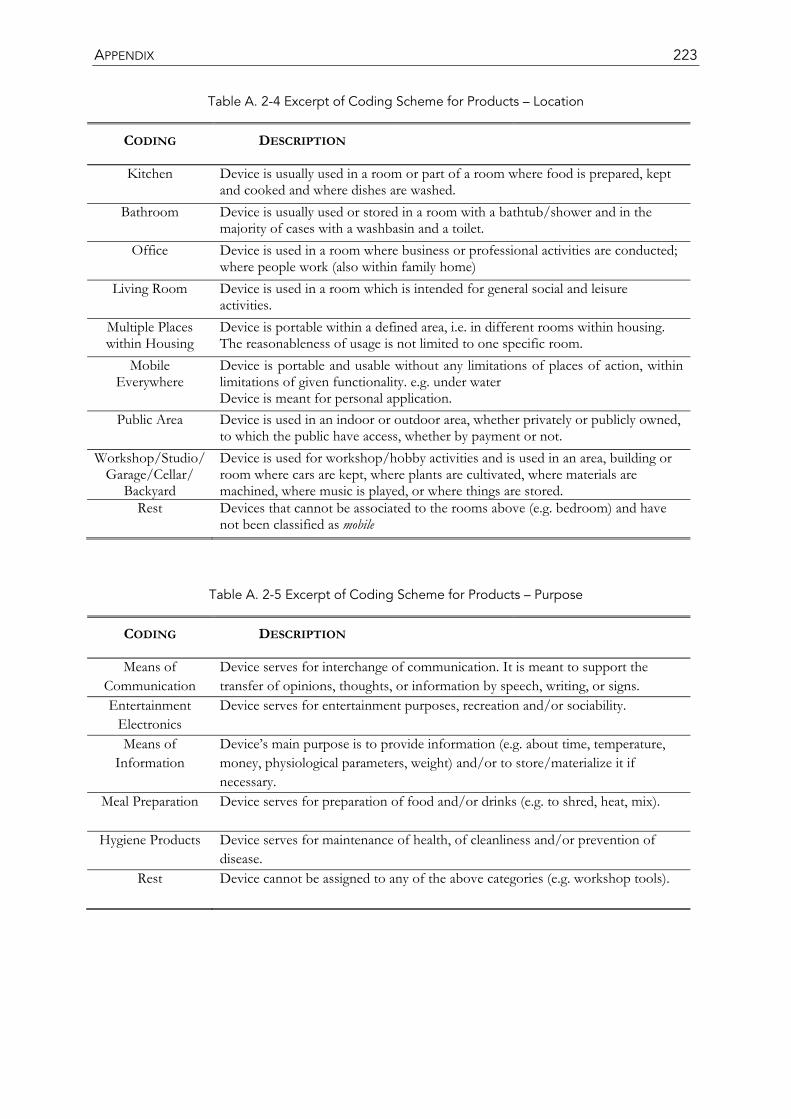
APPENDIX 223
Table A. 2-4 Excerpt of Coding Scheme for Products – Location
Table A. 2-5 Excerpt of Coding Scheme for Products – Purpose
CODING DESCRIPTION
Kitchen Device is usually used in a room or part of a room where food is prepared, kept and cooked and where dishes are washed.
Bathroom Device is usually used or stored in a room with a bathtub/shower and in the majority of cases with a washbasin and a toilet.
Office Device is used in a room where business or professional activities are conducted; where people work (also within family home)
Living Room Device is used in a room which is intended for general social and leisure activities.
Multiple Places within Housing
Device is portable within a defined area, i.e. in different rooms within housing. The reasonableness of usage is not limited to one specific room.
Mobile Everywhere
Device is portable and usable without any limitations of places of action, within limitations of given functionality. e.g. under water Device is meant for personal application.
Public Area Device is used in an indoor or outdoor area, whether privately or publicly owned, to which the public have access, whether by payment or not.
Workshop/Studio/ Garage/Cellar/
Backyard
Device is used for workshop/hobby activities and is used in an area, building or room where cars are kept, where plants are cultivated, where materials are machined, where music is played, or where things are stored.
Rest Devices that cannot be associated to the rooms above (e.g. bedroom) and have not been classified as mobile
CODING DESCRIPTION
Means of Communication
Device serves for interchange of communication. It is meant to support the transfer of opinions, thoughts, or information by speech, writing, or signs.
Entertainment Electronics
Device serves for entertainment purposes, recreation and/or sociability.
Means of Information
Device’s main purpose is to provide information (e.g. about time, temperature, money, physiological parameters, weight) and/or to store/materialize it if necessary.
Meal Preparation Device serves for preparation of food and/or drinks (e.g. to shred, heat, mix).
Hygiene Products Device serves for maintenance of health, of cleanliness and/or prevention of disease.
Rest Device cannot be assigned to any of the above categories (e.g. workshop tools).
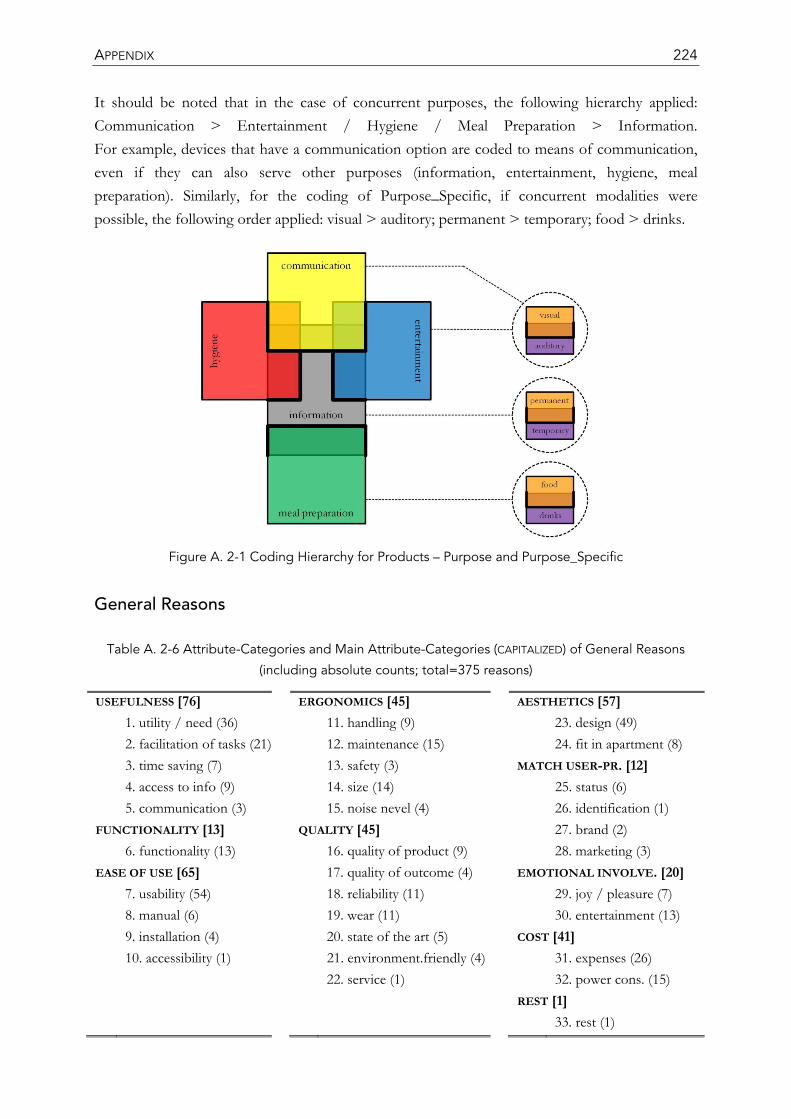
APPENDIX 224
It should be noted that in the case of concurrent purposes, the following hierarchy applied: Communication > Entertainment / Hygiene / Meal Preparation > Information. For example, devices that have a communication option are coded to means of communication, even if they can also serve other purposes (information, entertainment, hygiene, meal preparation). Similarly, for the coding of Purpose_Specific, if concurrent modalities were possible, the following order applied: visual > auditory; permanent > temporary; food > drinks.
Figure A. 2-1 Coding Hierarchy for Products – Purpose and Purpose_Specific
General Reasons
Table A. 2-6 Attribute-Categories and Main Attribute-Categories (CAPITALIZED) of General Reasons
(including absolute counts; total=375 reasons)
USEFULNESS [76] ERGONOMICS [45] AESTHETICS [57] 1. utility / need (36) 11. handling (9) 23. design (49) 2. facilitation of tasks (21) 12. maintenance (15) 24. fit in apartment (8) 3. time saving (7) 13. safety (3) MATCH USER-PR. [12] 4. access to info (9) 14. size (14) 25. status (6) 5. communication (3) 15. noise nevel (4) 26. identification (1) FUNCTIONALITY [13] QUALITY [45] 27. brand (2) 6. functionality (13) 16. quality of product (9) 28. marketing (3) EASE OF USE [65] 17. quality of outcome (4) EMOTIONAL INVOLVE. [20] 7. usability (54) 18. reliability (11) 29. joy / pleasure (7) 8. manual (6) 19. wear (11) 30. entertainment (13) 9. installation (4) 20. state of the art (5) COST [41] 10. accessibility (1) 21. environment.friendly (4) 31. expenses (26) 22. service (1) 32. power cons. (15) REST [1] 33. rest (1)
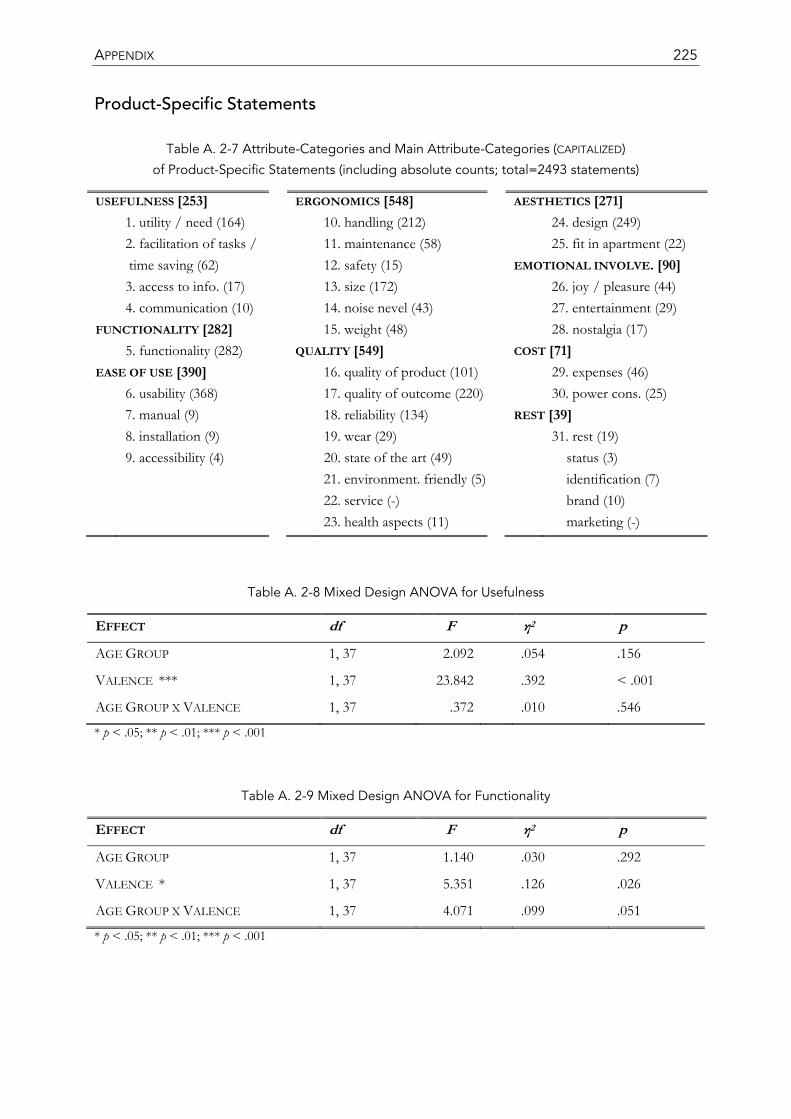
APPENDIX 225
Product-Specific Statements
Table A. 2-7 Attribute-Categories and Main Attribute-Categories (CAPITALIZED)
of Product-Specific Statements (including absolute counts; total=2493 statements)
USEFULNESS [253] ERGONOMICS [548] AESTHETICS [271] 1. utility / need (164) 10. handling (212) 24. design (249) 2. facilitation of tasks / 11. maintenance (58) 25. fit in apartment (22) time saving (62) 12. safety (15) EMOTIONAL INVOLVE. [90] 3. access to info. (17) 13. size (172) 26. joy / pleasure (44) 4. communication (10) 14. noise nevel (43) 27. entertainment (29) FUNCTIONALITY [282] 15. weight (48) 28. nostalgia (17) 5. functionality (282) QUALITY [549] COST [71] EASE OF USE [390] 16. quality of product (101) 29. expenses (46) 6. usability (368) 17. quality of outcome (220) 30. power cons. (25) 7. manual (9) 18. reliability (134) REST [39] 8. installation (9) 19. wear (29) 31. rest (19) 9. accessibility (4) 20. state of the art (49) status (3) 21. environment. friendly (5) identification (7) 22. service (-) brand (10) 23. health aspects (11) marketing (-)
Table A. 2-8 Mixed Design ANOVA for Usefulness
EFFECT df F η2 p
AGE GROUP 1, 37 2.092 .054 .156
VALENCE *** 1, 37 23.842 .392 < .001
AGE GROUP X VALENCE 1, 37 .372 .010 .546
* p < .05; ** p < .01; *** p < .001
Table A. 2-9 Mixed Design ANOVA for Functionality
EFFECT df F η2 p
AGE GROUP 1, 37 1.140 .030 .292
VALENCE * 1, 37 5.351 .126 .026
AGE GROUP X VALENCE 1, 37 4.071 .099 .051
* p < .05; ** p < .01; *** p < .001
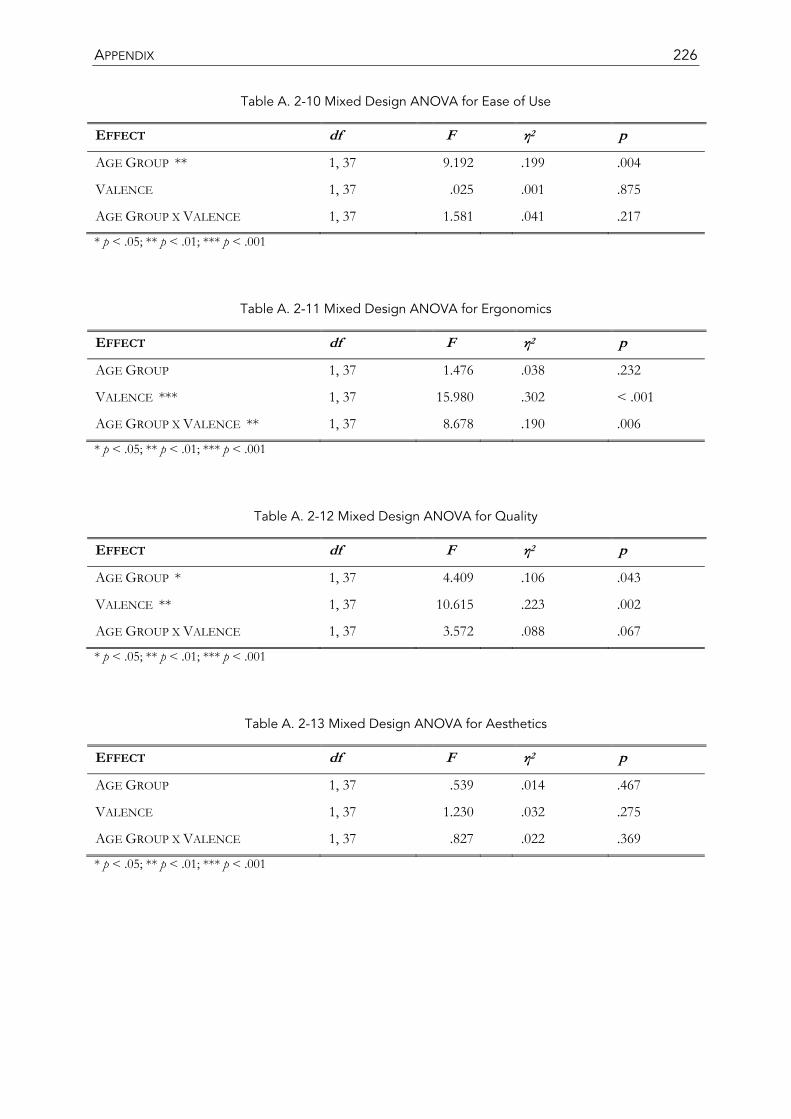
APPENDIX 226
Table A. 2-10 Mixed Design ANOVA for Ease of Use
EFFECT df F η2 p
AGE GROUP ** 1, 37 9.192 .199 .004
VALENCE 1, 37 .025 .001 .875
AGE GROUP X VALENCE 1, 37 1.581 .041 .217
* p < .05; ** p < .01; *** p < .001
Table A. 2-11 Mixed Design ANOVA for Ergonomics
EFFECT df F η2 p
AGE GROUP 1, 37 1.476 .038 .232
VALENCE *** 1, 37 15.980 .302 < .001
AGE GROUP X VALENCE ** 1, 37 8.678 .190 .006
* p < .05; ** p < .01; *** p < .001
Table A. 2-12 Mixed Design ANOVA for Quality
EFFECT df F η2 p
AGE GROUP * 1, 37 4.409 .106 .043
VALENCE ** 1, 37 10.615 .223 .002
AGE GROUP X VALENCE 1, 37 3.572 .088 .067
* p < .05; ** p < .01; *** p < .001
Table A. 2-13 Mixed Design ANOVA for Aesthetics
EFFECT df F η2 p
AGE GROUP 1, 37 .539 .014 .467
VALENCE 1, 37 1.230 .032 .275
AGE GROUP X VALENCE 1, 37 .827 .022 .369
* p < .05; ** p < .01; *** p < .001
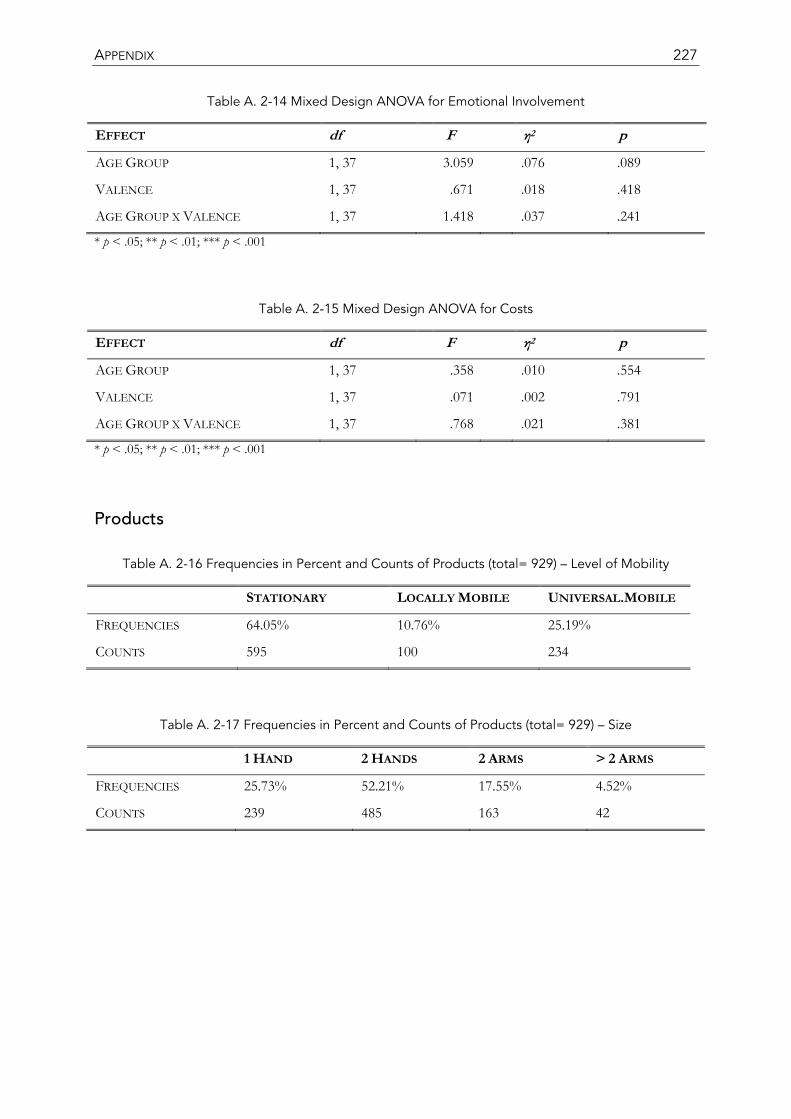
APPENDIX 227
Table A. 2-14 Mixed Design ANOVA for Emotional Involvement
EFFECT df F η2 p
AGE GROUP 1, 37 3.059 .076 .089
VALENCE 1, 37 .671 .018 .418
AGE GROUP X VALENCE 1, 37 1.418 .037 .241
* p < .05; ** p < .01; *** p < .001
Table A. 2-15 Mixed Design ANOVA for Costs
EFFECT df F η2 p
AGE GROUP 1, 37 .358 .010 .554
VALENCE 1, 37 .071 .002 .791
AGE GROUP X VALENCE 1, 37 .768 .021 .381
* p < .05; ** p < .01; *** p < .001
Products
Table A. 2-16 Frequencies in Percent and Counts of Products (total= 929) – Level of Mobility
STATIONARY LOCALLY MOBILE UNIVERSAL.MOBILE
FREQUENCIES 64.05% 10.76% 25.19%
COUNTS 595 100 234
Table A. 2-17 Frequencies in Percent and Counts of Products (total= 929) – Size
1 HAND 2 HANDS 2 ARMS > 2 ARMS
FREQUENCIES 25.73% 52.21% 17.55% 4.52%
COUNTS 239 485 163 42
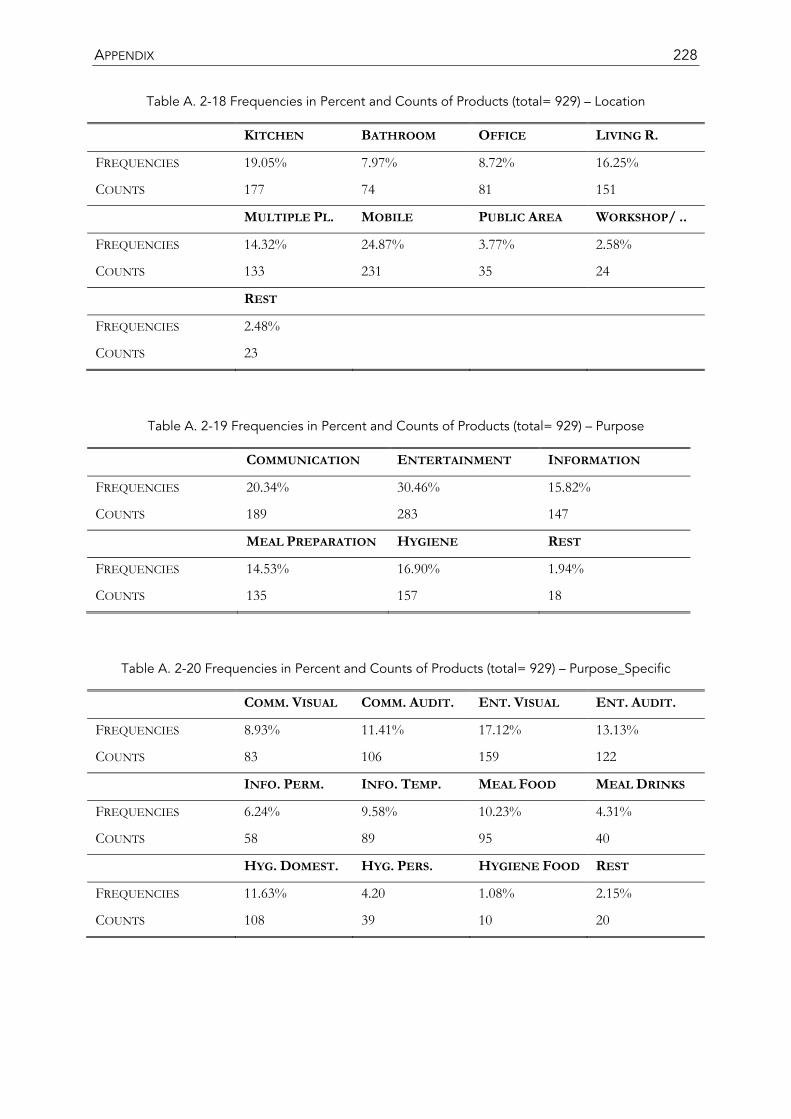
APPENDIX 228
Table A. 2-18 Frequencies in Percent and Counts of Products (total= 929) – Location
KITCHEN BATHROOM OFFICE LIVING R.
FREQUENCIES 19.05% 7.97% 8.72% 16.25%
COUNTS 177 74 81 151
MULTIPLE PL. MOBILE PUBLIC AREA WORKSHOP/ ..
FREQUENCIES 14.32% 24.87% 3.77% 2.58%
COUNTS 133 231 35 24
REST
FREQUENCIES 2.48%
COUNTS 23
Table A. 2-19 Frequencies in Percent and Counts of Products (total= 929) – Purpose
COMMUNICATION ENTERTAINMENT INFORMATION
FREQUENCIES 20.34% 30.46% 15.82%
COUNTS 189 283 147
MEAL PREPARATION HYGIENE REST
FREQUENCIES 14.53% 16.90% 1.94%
COUNTS 135 157 18
Table A. 2-20 Frequencies in Percent and Counts of Products (total= 929) – Purpose_Specific
COMM. VISUAL COMM. AUDIT. ENT. VISUAL ENT. AUDIT.
FREQUENCIES 8.93% 11.41% 17.12% 13.13%
COUNTS 83 106 159 122
INFO. PERM. INFO. TEMP. MEAL FOOD MEAL DRINKS
FREQUENCIES 6.24% 9.58% 10.23% 4.31%
COUNTS 58 89 95 40
HYG. DOMEST. HYG. PERS. HYGIENE FOOD REST
FREQUENCIES 11.63% 4.20 1.08% 2.15%
COUNTS 108 39 10 20
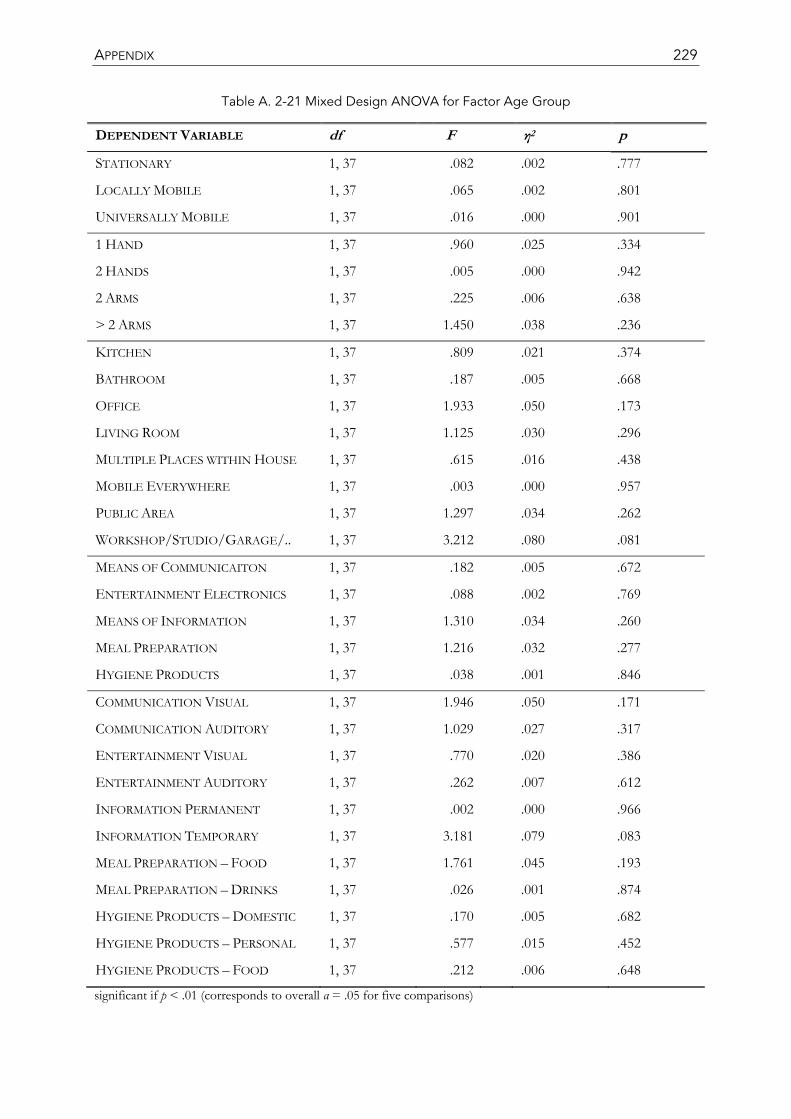
APPENDIX 229
Table A. 2-21 Mixed Design ANOVA for Factor Age Group
DEPENDENT VARIABLE df F η2 p
STATIONARY 1, 37 .082 .002 .777
LOCALLY MOBILE 1, 37 .065 .002 .801
UNIVERSALLY MOBILE 1, 37 .016 .000 .901
1 HAND 1, 37 .960 .025 .334
2 HANDS 1, 37 .005 .000 .942
2 ARMS 1, 37 .225 .006 .638
> 2 ARMS 1, 37 1.450 .038 .236
KITCHEN 1, 37 .809 .021 .374
BATHROOM 1, 37 .187 .005 .668
OFFICE 1, 37 1.933 .050 .173
LIVING ROOM 1, 37 1.125 .030 .296
MULTIPLE PLACES WITHIN HOUSE 1, 37 .615 .016 .438
MOBILE EVERYWHERE 1, 37 .003 .000 .957
PUBLIC AREA 1, 37 1.297 .034 .262
WORKSHOP/STUDIO/GARAGE/.. 1, 37 3.212 .080 .081
MEANS OF COMMUNICAITON 1, 37 .182 .005 .672
ENTERTAINMENT ELECTRONICS 1, 37 .088 .002 .769
MEANS OF INFORMATION 1, 37 1.310 .034 .260
MEAL PREPARATION 1, 37 1.216 .032 .277
HYGIENE PRODUCTS 1, 37 .038 .001 .846
COMMUNICATION VISUAL 1, 37 1.946 .050 .171
COMMUNICATION AUDITORY 1, 37 1.029 .027 .317
ENTERTAINMENT VISUAL 1, 37 .770 .020 .386
ENTERTAINMENT AUDITORY 1, 37 .262 .007 .612
INFORMATION PERMANENT 1, 37 .002 .000 .966
INFORMATION TEMPORARY 1, 37 3.181 .079 .083
MEAL PREPARATION – FOOD 1, 37 1.761 .045 .193
MEAL PREPARATION – DRINKS 1, 37 .026 .001 .874
HYGIENE PRODUCTS – DOMESTIC 1, 37 .170 .005 .682
HYGIENE PRODUCTS – PERSONAL 1, 37 .577 .015 .452
HYGIENE PRODUCTS – FOOD 1, 37 .212 .006 .648
significant if p < .01 (corresponds to overall α = .05 for five comparisons)
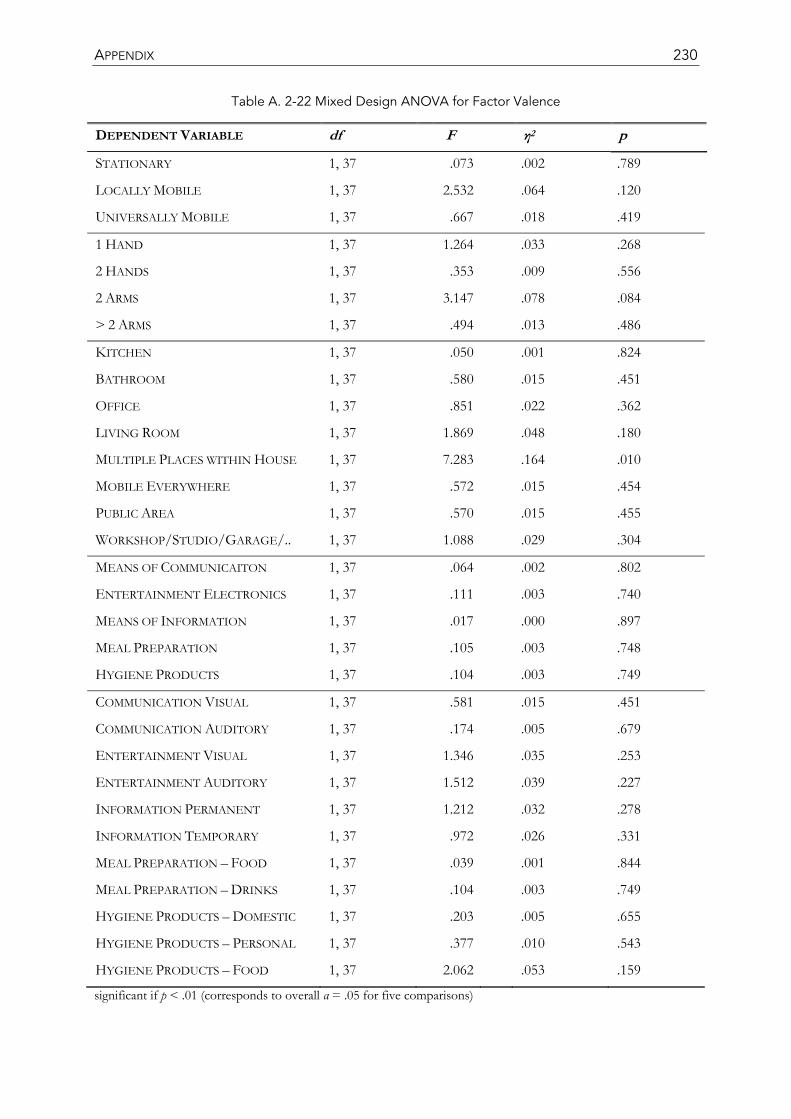
APPENDIX 230
Table A. 2-22 Mixed Design ANOVA for Factor Valence
DEPENDENT VARIABLE df F η2 p
STATIONARY 1, 37 .073 .002 .789
LOCALLY MOBILE 1, 37 2.532 .064 .120
UNIVERSALLY MOBILE 1, 37 .667 .018 .419
1 HAND 1, 37 1.264 .033 .268
2 HANDS 1, 37 .353 .009 .556
2 ARMS 1, 37 3.147 .078 .084
> 2 ARMS 1, 37 .494 .013 .486
KITCHEN 1, 37 .050 .001 .824
BATHROOM 1, 37 .580 .015 .451
OFFICE 1, 37 .851 .022 .362
LIVING ROOM 1, 37 1.869 .048 .180
MULTIPLE PLACES WITHIN HOUSE 1, 37 7.283 .164 .010
MOBILE EVERYWHERE 1, 37 .572 .015 .454
PUBLIC AREA 1, 37 .570 .015 .455
WORKSHOP/STUDIO/GARAGE/.. 1, 37 1.088 .029 .304
MEANS OF COMMUNICAITON 1, 37 .064 .002 .802
ENTERTAINMENT ELECTRONICS 1, 37 .111 .003 .740
MEANS OF INFORMATION 1, 37 .017 .000 .897
MEAL PREPARATION 1, 37 .105 .003 .748
HYGIENE PRODUCTS 1, 37 .104 .003 .749
COMMUNICATION VISUAL 1, 37 .581 .015 .451
COMMUNICATION AUDITORY 1, 37 .174 .005 .679
ENTERTAINMENT VISUAL 1, 37 1.346 .035 .253
ENTERTAINMENT AUDITORY 1, 37 1.512 .039 .227
INFORMATION PERMANENT 1, 37 1.212 .032 .278
INFORMATION TEMPORARY 1, 37 .972 .026 .331
MEAL PREPARATION – FOOD 1, 37 .039 .001 .844
MEAL PREPARATION – DRINKS 1, 37 .104 .003 .749
HYGIENE PRODUCTS – DOMESTIC 1, 37 .203 .005 .655
HYGIENE PRODUCTS – PERSONAL 1, 37 .377 .010 .543
HYGIENE PRODUCTS – FOOD 1, 37 2.062 .053 .159
significant if p < .01 (corresponds to overall α = .05 for five comparisons)
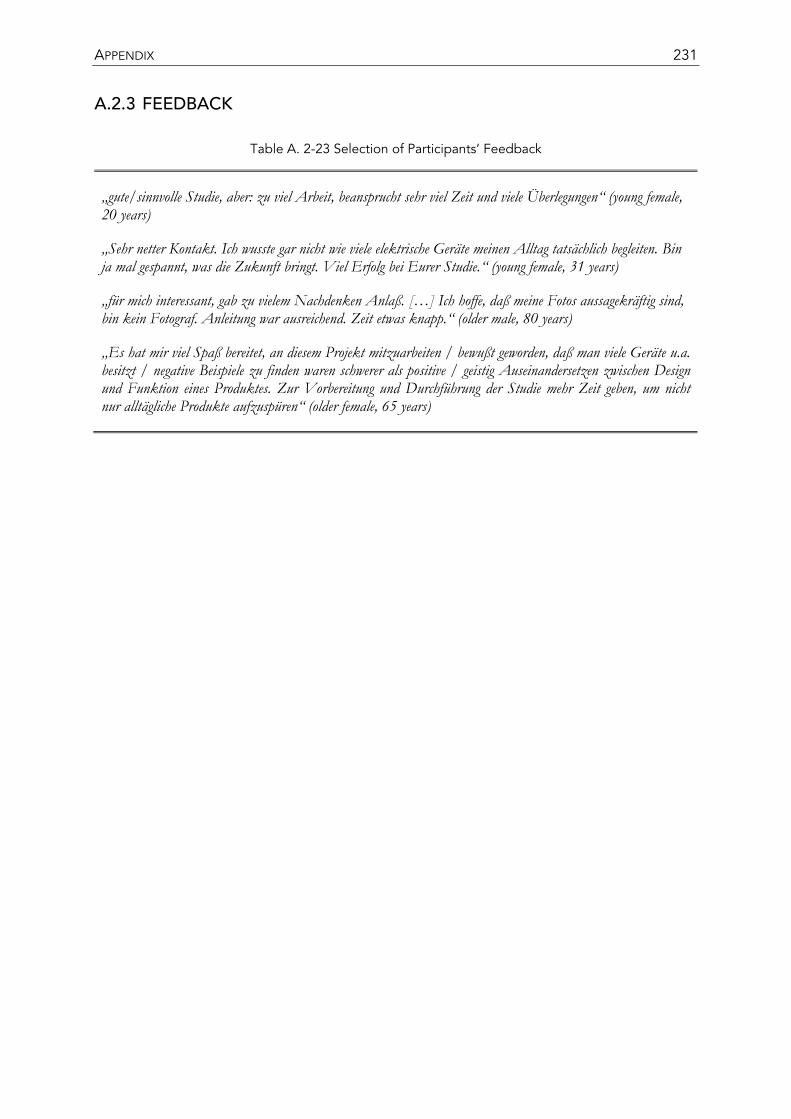
APPENDIX 231
A.2.3 FEEDBACK
Table A. 2-23 Selection of Participants’ Feedback
„gute/sinnvolle Studie, aber: zu viel Arbeit, beansprucht sehr viel Zeit und viele Überlegungen“ (young female, 20 years)
„Sehr netter Kontakt. Ich wusste gar nicht wie viele elektrische Geräte meinen Alltag tatsächlich begleiten. Bin ja mal gespannt, was die Zukunft bringt. Viel Erfolg bei Eurer Studie.“ (young female, 31 years)
„für mich interessant, gab zu vielem Nachdenken Anlaß. […] Ich hoffe, daß meine Fotos aussagekräftig sind, bin kein Fotograf. Anleitung war ausreichend. Zeit etwas knapp.“ (older male, 80 years)
„Es hat mir viel Spaß bereitet, an diesem Projekt mitzuarbeiten / bewußt geworden, daß man viele Geräte u.a. besitzt / negative Beispiele zu finden waren schwerer als positive / geistig Auseinandersetzen zwischen Design und Funktion eines Produktes. Zur Vorbereitung und Durchführung der Studie mehr Zeit geben, um nicht nur alltägliche Produkte aufzuspüren“ (older female, 65 years)
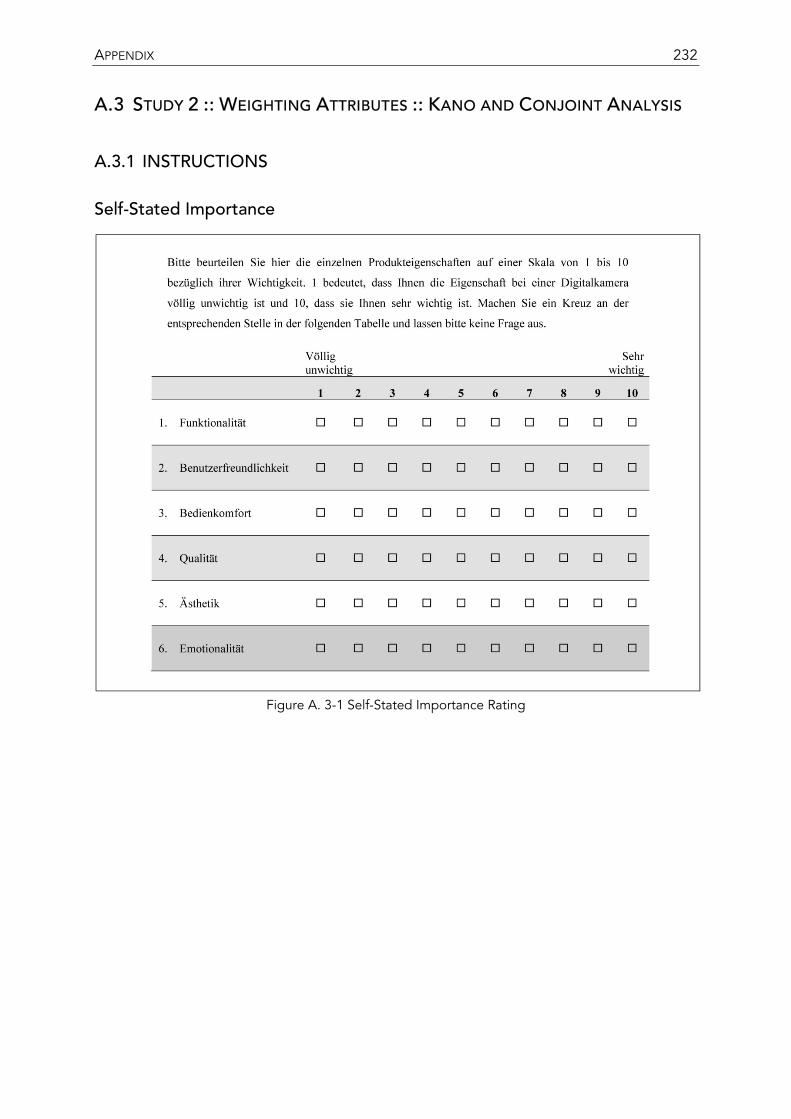
APPENDIX 232
A.3 STUDY 2 :: WEIGHTING ATTRIBUTES :: KANO AND CONJOINT ANALYSIS
A.3.1 INSTRUCTIONS
Self-Stated Importance
Figure A. 3-1 Self-Stated Importance Rating
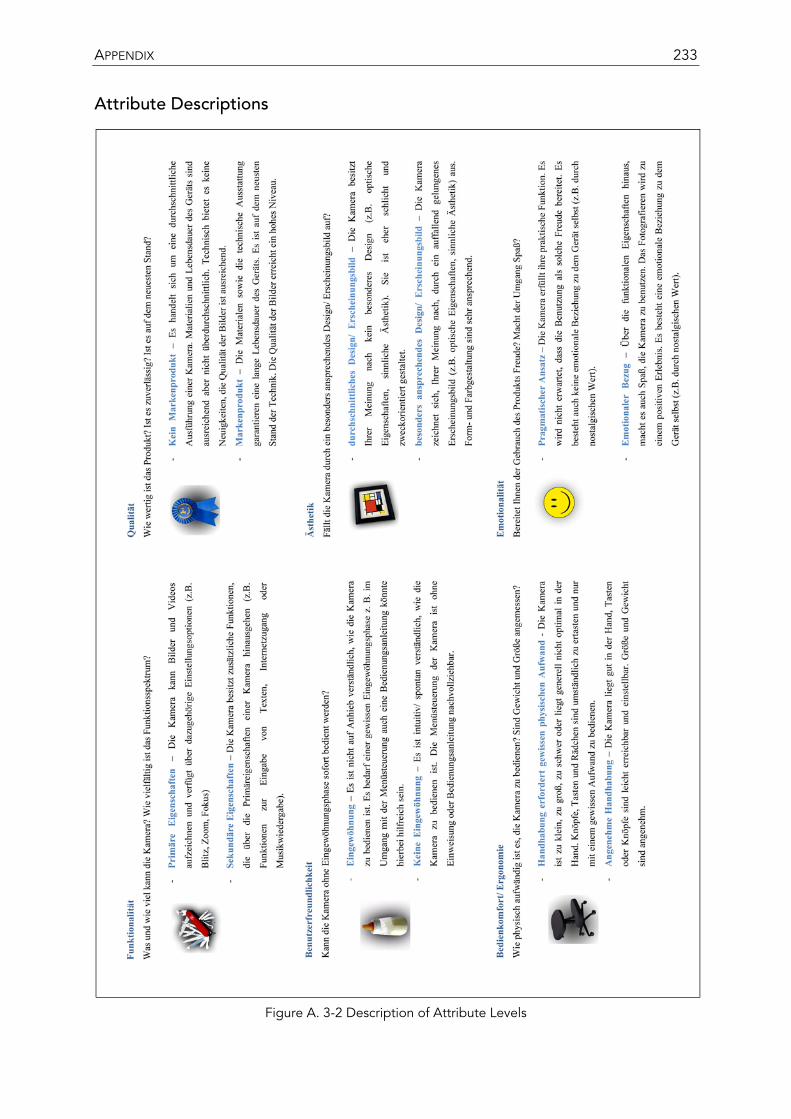
APPENDIX 233
Attribute Descriptions
Figure A. 3-2 Description of Attribute Levels
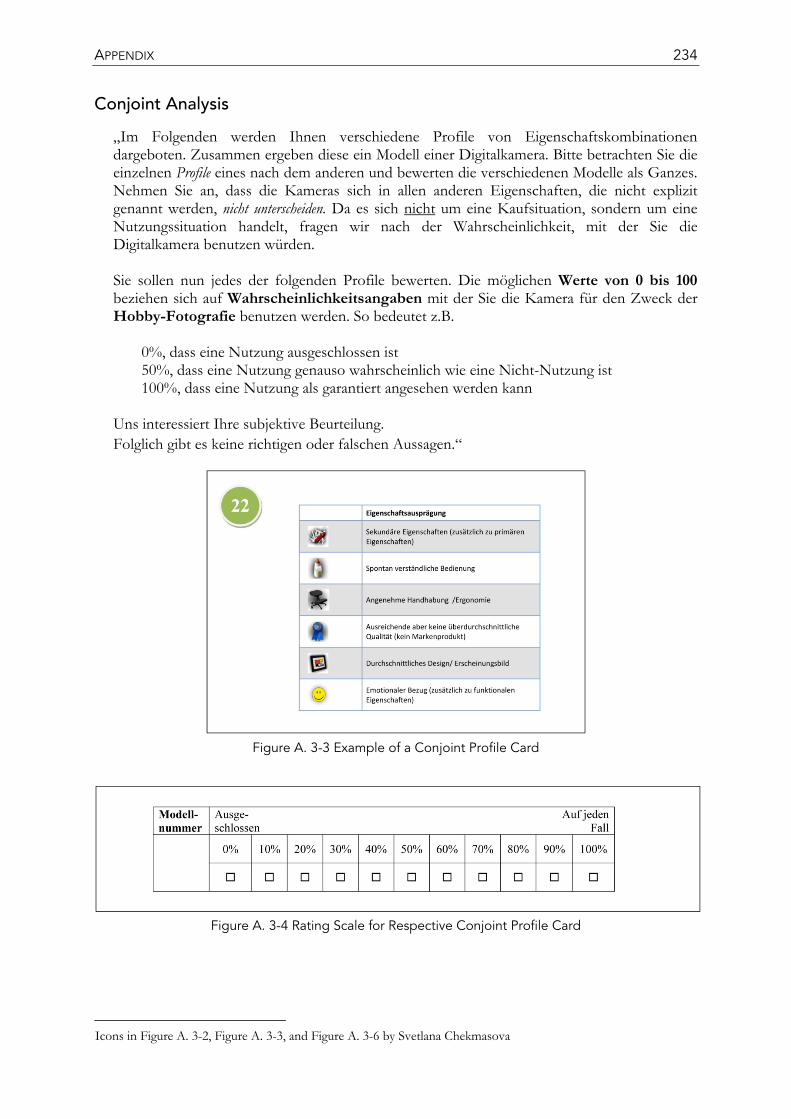
APPENDIX 234
Conjoint Analysis
„Im Folgenden werden Ihnen verschiedene Profile von Eigenschaftskombinationen dargeboten. Zusammen ergeben diese ein Modell einer Digitalkamera. Bitte betrachten Sie die einzelnen Profile eines nach dem anderen und bewerten die verschiedenen Modelle als Ganzes. Nehmen Sie an, dass die Kameras sich in allen anderen Eigenschaften, die nicht explizit genannt werden, nicht unterscheiden. Da es sich nicht um eine Kaufsituation, sondern um eine Nutzungssituation handelt, fragen wir nach der Wahrscheinlichkeit, mit der Sie die Digitalkamera benutzen würden. Sie sollen nun jedes der folgenden Profile bewerten. Die möglichen Werte von 0 bis 100 beziehen sich auf Wahrscheinlichkeitsangaben mit der Sie die Kamera für den Zweck der Hobby-Fotografie benutzen werden. So bedeutet z.B. 0%, dass eine Nutzung ausgeschlossen ist 50%, dass eine Nutzung genauso wahrscheinlich wie eine Nicht-Nutzung ist 100%, dass eine Nutzung als garantiert angesehen werden kann Uns interessiert Ihre subjektive Beurteilung. Folglich gibt es keine richtigen oder falschen Aussagen.“ ∗
Figure A. 3-3 Example of a Conjoint Profile Card
Figure A. 3-4 Rating Scale for Respective Conjoint Profile Card
∗Icons in Figure A. 3-2, Figure A. 3-3, and Figure A. 3-6 by Svetlana Chekmasova
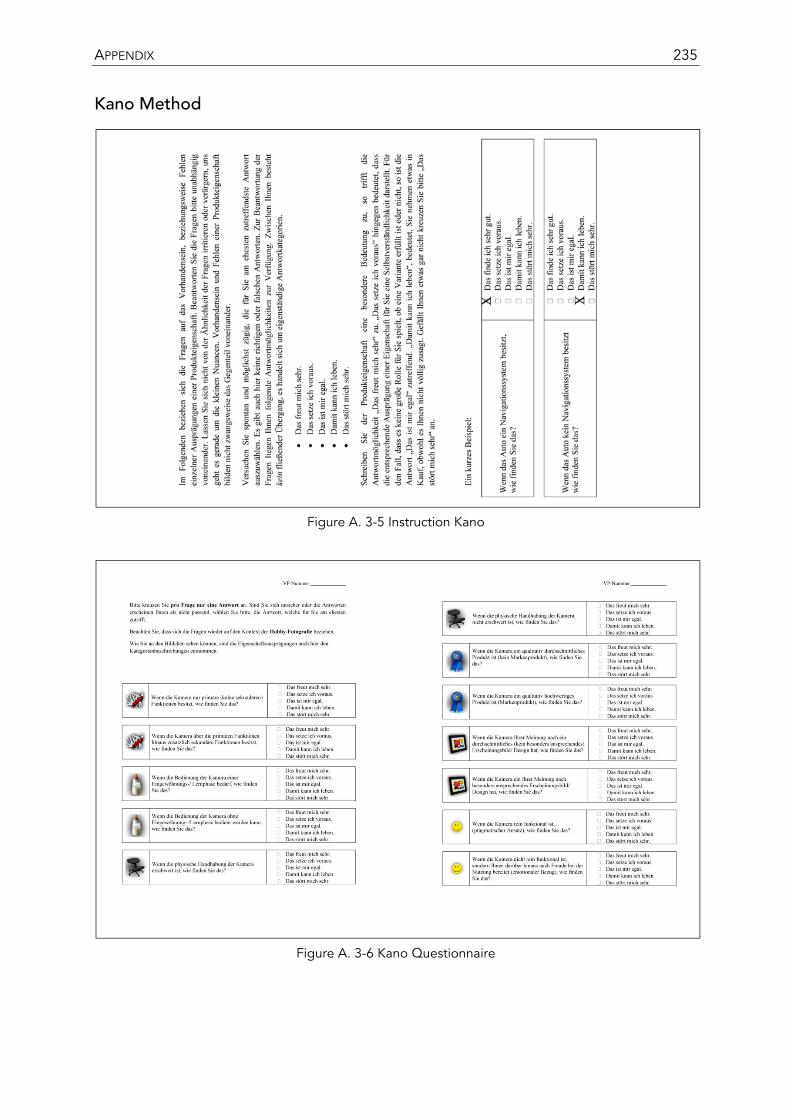
APPENDIX 235
Kano Method
Figure A. 3-5 Instruction Kano
Figure A. 3-6 Kano Questionnaire
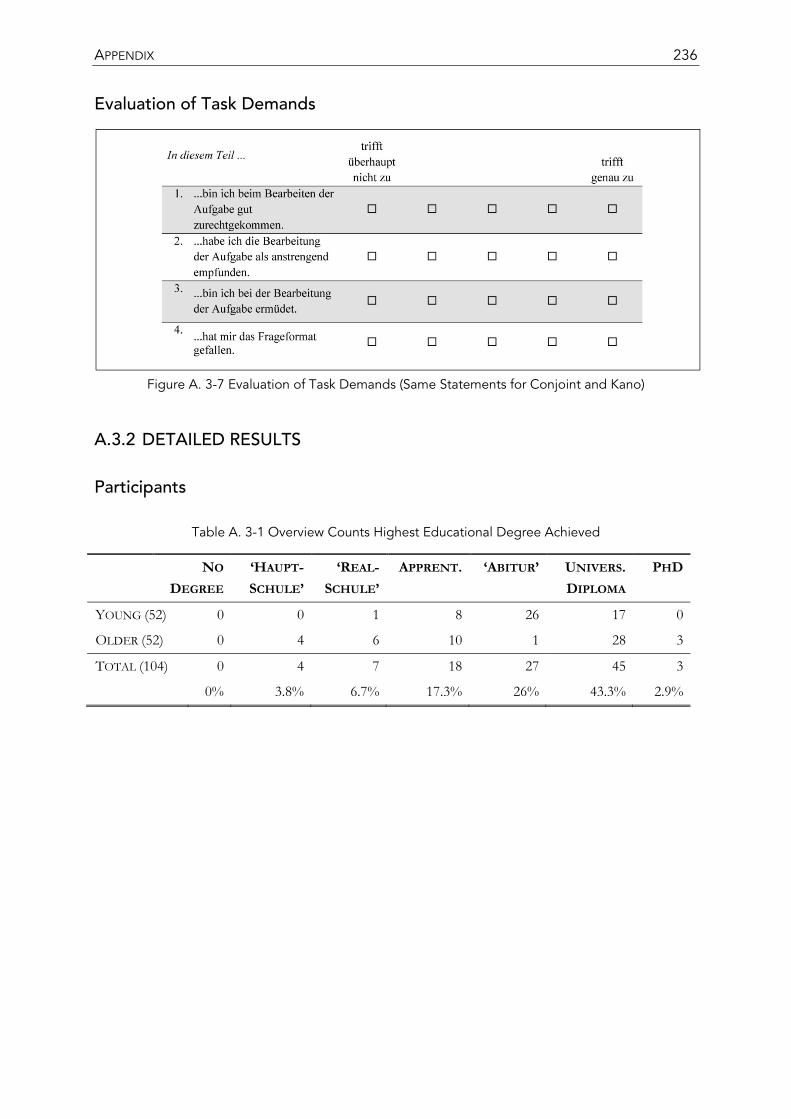
APPENDIX 236
Evaluation of Task Demands
Figure A. 3-7 Evaluation of Task Demands (Same Statements for Conjoint and Kano)
A.3.2 DETAILED RESULTS
Participants
Table A. 3-1 Overview Counts Highest Educational Degree Achieved
NO
DEGREE ‘HAUPT-SCHULE’
‘REAL-SCHULE’
APPRENT. ‘ABITUR’ UNIVERS. DIPLOMA
PHD
YOUNG (52) 0 0 1 8 26 17 0
OLDER (52) 0 4 6 10 1 28 3
TOTAL (104) 0 4 7 18 27 45 3
0% 3.8% 6.7% 17.3% 26% 43.3% 2.9%
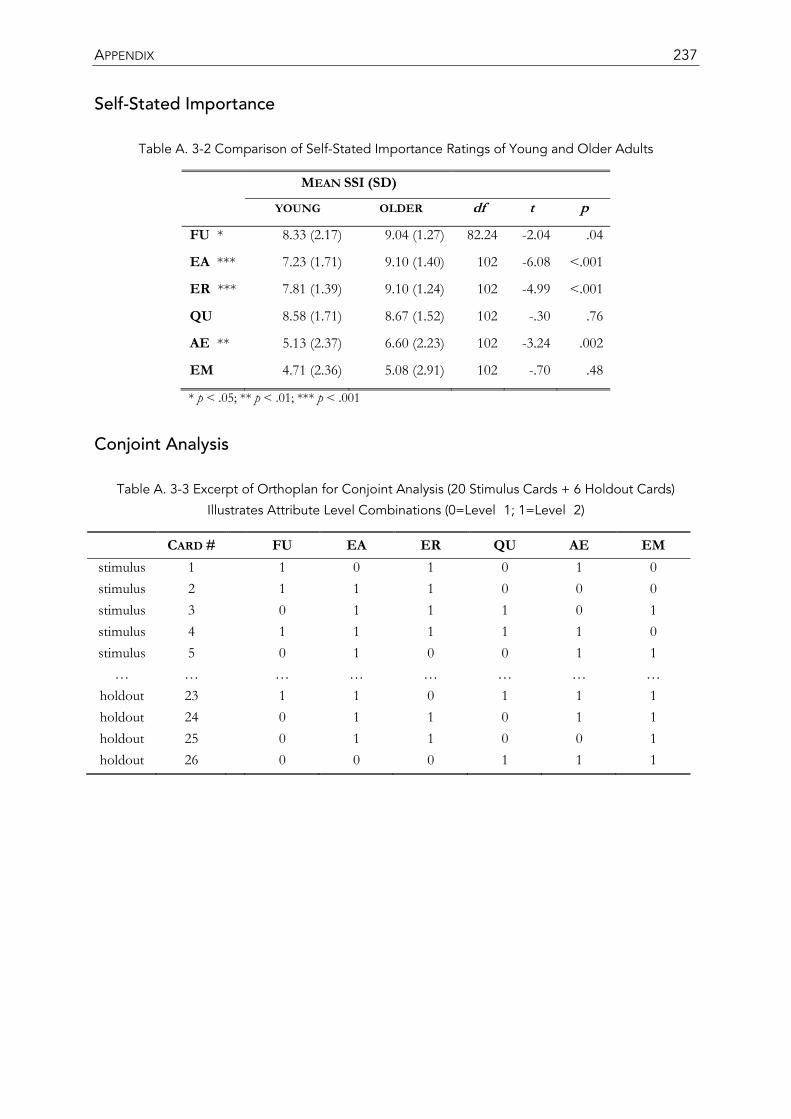
APPENDIX 237
Self-Stated Importance
Table A. 3-2 Comparison of Self-Stated Importance Ratings of Young and Older Adults
MEAN SSI (SD)
YOUNG OLDER df t p
FU * 8.33 (2.17) 9.04 (1.27) 82.24 -2.04 .04
EA *** 7.23 (1.71) 9.10 (1.40) 102 -6.08 <.001
ER *** 7.81 (1.39) 9.10 (1.24) 102 -4.99 <.001
QU 8.58 (1.71) 8.67 (1.52) 102 -.30 .76
AE ** 5.13 (2.37) 6.60 (2.23) 102 -3.24 .002
EM 4.71 (2.36) 5.08 (2.91) 102 -.70 .48
* p < .05; ** p < .01; *** p < .001
Conjoint Analysis
Table A. 3-3 Excerpt of Orthoplan for Conjoint Analysis (20 Stimulus Cards + 6 Holdout Cards)
Illustrates Attribute Level Combinations (0=Level 1; 1=Level 2)
CARD # FU EA ER QU AE EM stimulus 1 1 0 1 0 1 0 stimulus 2 1 1 1 0 0 0 stimulus 3 0 1 1 1 0 1 stimulus 4 1 1 1 1 1 0 stimulus 5 0 1 0 0 1 1
… … … … … … … … holdout 23 1 1 0 1 1 1 holdout 24 0 1 1 0 1 1 holdout 25 0 1 1 0 0 1 holdout 26 0 0 0 1 1 1
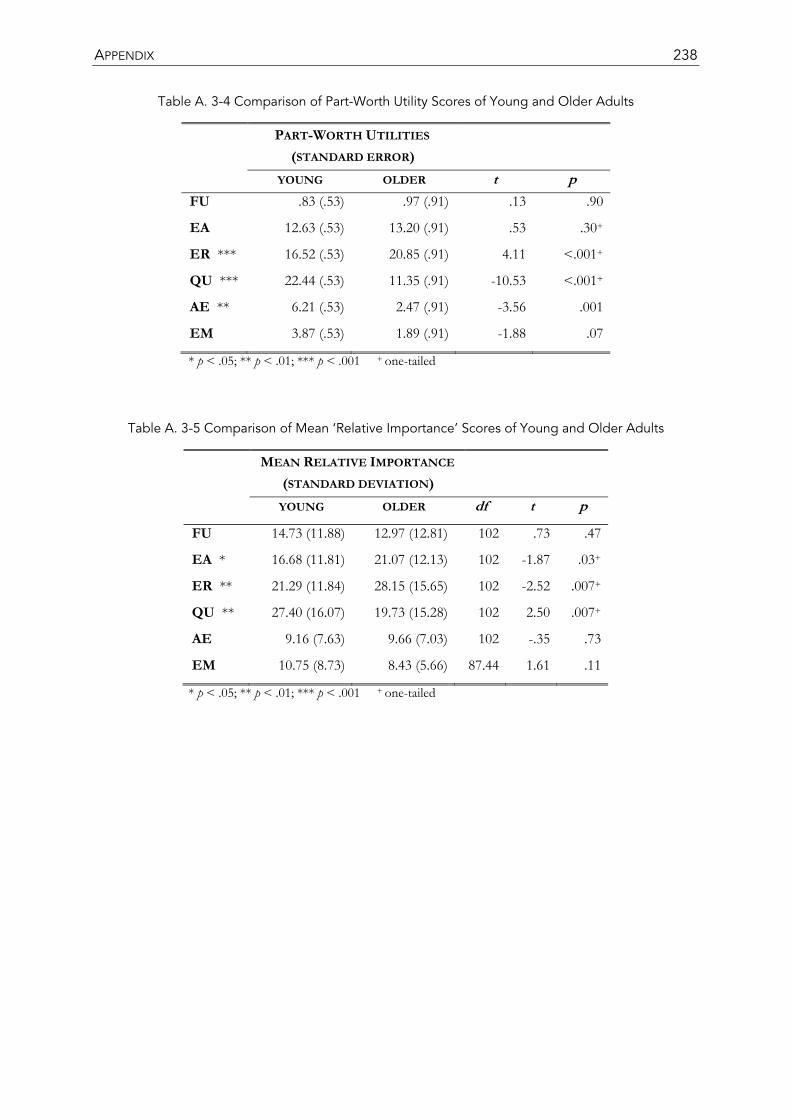
APPENDIX 238
Table A. 3-4 Comparison of Part-Worth Utility Scores of Young and Older Adults
PART-WORTH UTILITIES (STANDARD ERROR)
YOUNG OLDER t p FU .83 (.53) .97 (.91) .13 .90
EA 12.63 (.53) 13.20 (.91) .53 .30+
ER *** 16.52 (.53) 20.85 (.91) 4.11 <.001+
QU *** 22.44 (.53) 11.35 (.91) -10.53 <.001+
AE ** 6.21 (.53) 2.47 (.91) -3.56 .001
EM 3.87 (.53) 1.89 (.91) -1.88 .07
* p < .05; ** p < .01; *** p < .001 + one-tailed
Table A. 3-5 Comparison of Mean ‘Relative Importance’ Scores of Young and Older Adults
MEAN RELATIVE IMPORTANCE
(STANDARD DEVIATION)
YOUNG OLDER df t p
FU 14.73 (11.88) 12.97 (12.81) 102 .73 .47
EA * 16.68 (11.81) 21.07 (12.13) 102 -1.87 .03+
ER ** 21.29 (11.84) 28.15 (15.65) 102 -2.52 .007+
QU ** 27.40 (16.07) 19.73 (15.28) 102 2.50 .007+
AE 9.16 (7.63) 9.66 (7.03) 102 -.35 .73
EM 10.75 (8.73) 8.43 (5.66) 87.44 1.61 .11
* p < .05; ** p < .01; *** p < .001 + one-tailed
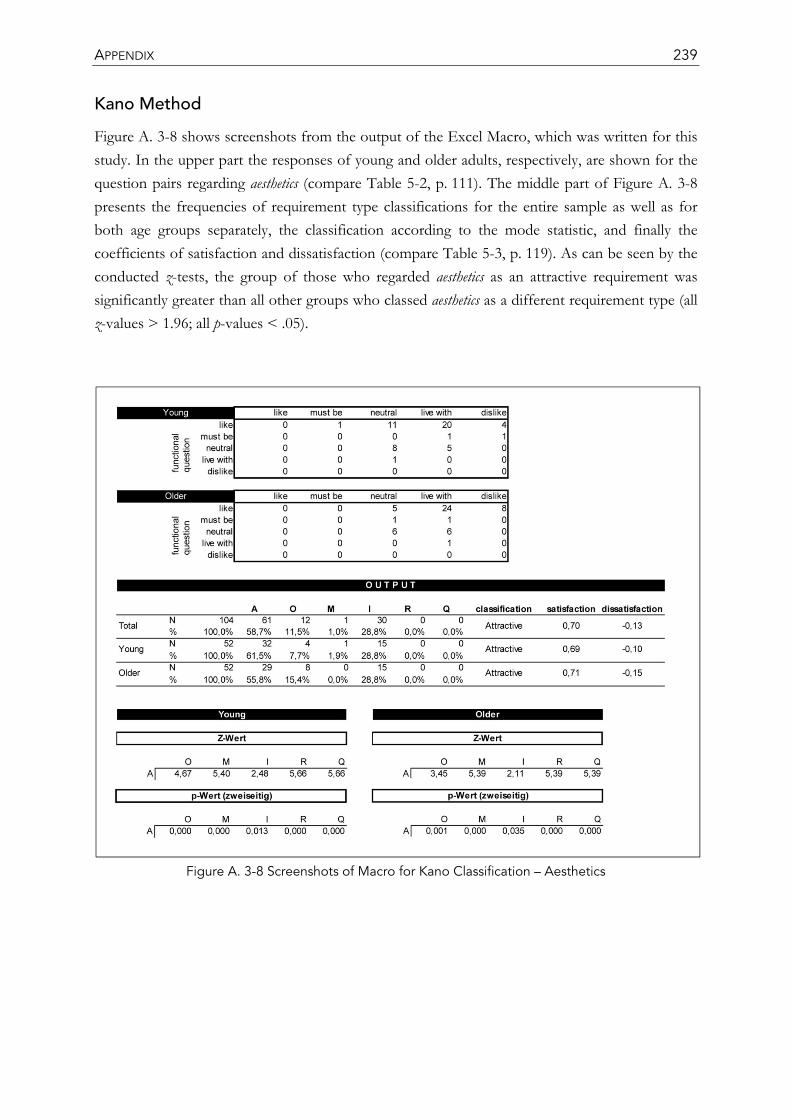
APPENDIX 239
Kano Method
Figure A. 3-8 shows screenshots from the output of the Excel Macro, which was written for this study. In the upper part the responses of young and older adults, respectively, are shown for the question pairs regarding aesthetics (compare Table 5-2, p. 111). The middle part of Figure A. 3-8 presents the frequencies of requirement type classifications for the entire sample as well as for both age groups separately, the classification according to the mode statistic, and finally the coefficients of satisfaction and dissatisfaction (compare Table 5-3, p. 119). As can be seen by the conducted z-tests, the group of those who regarded aesthetics as an attractive requirement was significantly greater than all other groups who classed aesthetics as a different requirement type (all z-values > 1.96; all p-values < .05).
Figure A. 3-8 Screenshots of Macro for Kano Classification – Aesthetics
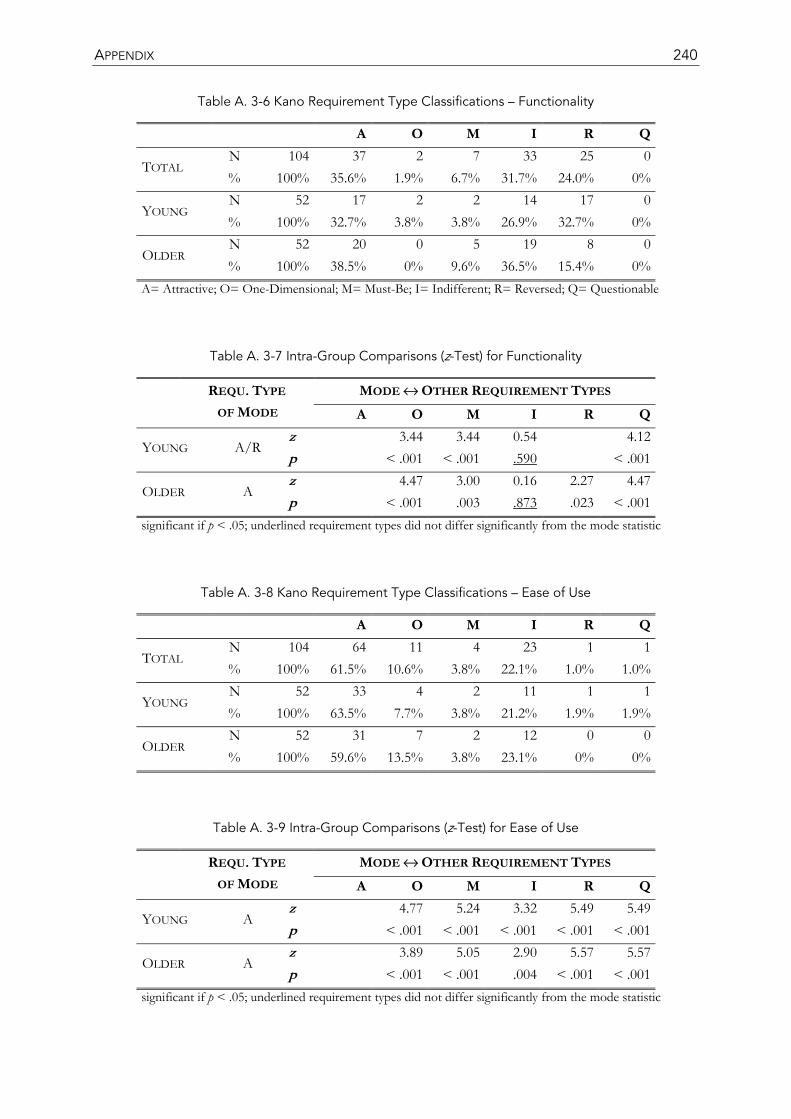
APPENDIX 240
Table A. 3-6 Kano Requirement Type Classifications – Functionality
A O M I R Q
TOTAL N 104 37 2 7 33 25 0 % 100% 35.6% 1.9% 6.7% 31.7% 24.0% 0%
YOUNG N 52 17 2 2 14 17 0 % 100% 32.7% 3.8% 3.8% 26.9% 32.7% 0%
OLDER N 52 20 0 5 19 8 0 % 100% 38.5% 0% 9.6% 36.5% 15.4% 0%
A= Attractive; O= One-Dimensional; M= Must-Be; I= Indifferent; R= Reversed; Q= Questionable
Table A. 3-7 Intra-Group Comparisons (z-Test) for Functionality
REQU. TYPE OF MODE
MODE ↔ OTHER REQUIREMENT TYPES A O M I R Q
YOUNG A/R z 3.44 3.44 0.54 4.12 p < .001 < .001 .590 < .001
OLDER A z 4.47 3.00 0.16 2.27 4.47 p < .001 .003 .873 .023 < .001
significant if p < .05; underlined requirement types did not differ significantly from the mode statistic
Table A. 3-8 Kano Requirement Type Classifications – Ease of Use
A O M I R Q
TOTAL N 104 64 11 4 23 1 1 % 100% 61.5% 10.6% 3.8% 22.1% 1.0% 1.0%
YOUNG N 52 33 4 2 11 1 1 % 100% 63.5% 7.7% 3.8% 21.2% 1.9% 1.9%
OLDER N 52 31 7 2 12 0 0 % 100% 59.6% 13.5% 3.8% 23.1% 0% 0%
Table A. 3-9 Intra-Group Comparisons (z-Test) for Ease of Use
REQU. TYPE OF MODE
MODE ↔ OTHER REQUIREMENT TYPES A O M I R Q
YOUNG A z 4.77 5.24 3.32 5.49 5.49 p < .001 < .001 < .001 < .001 < .001
OLDER A z 3.89 5.05 2.90 5.57 5.57 p < .001 < .001 .004 < .001 < .001
significant if p < .05; underlined requirement types did not differ significantly from the mode statistic
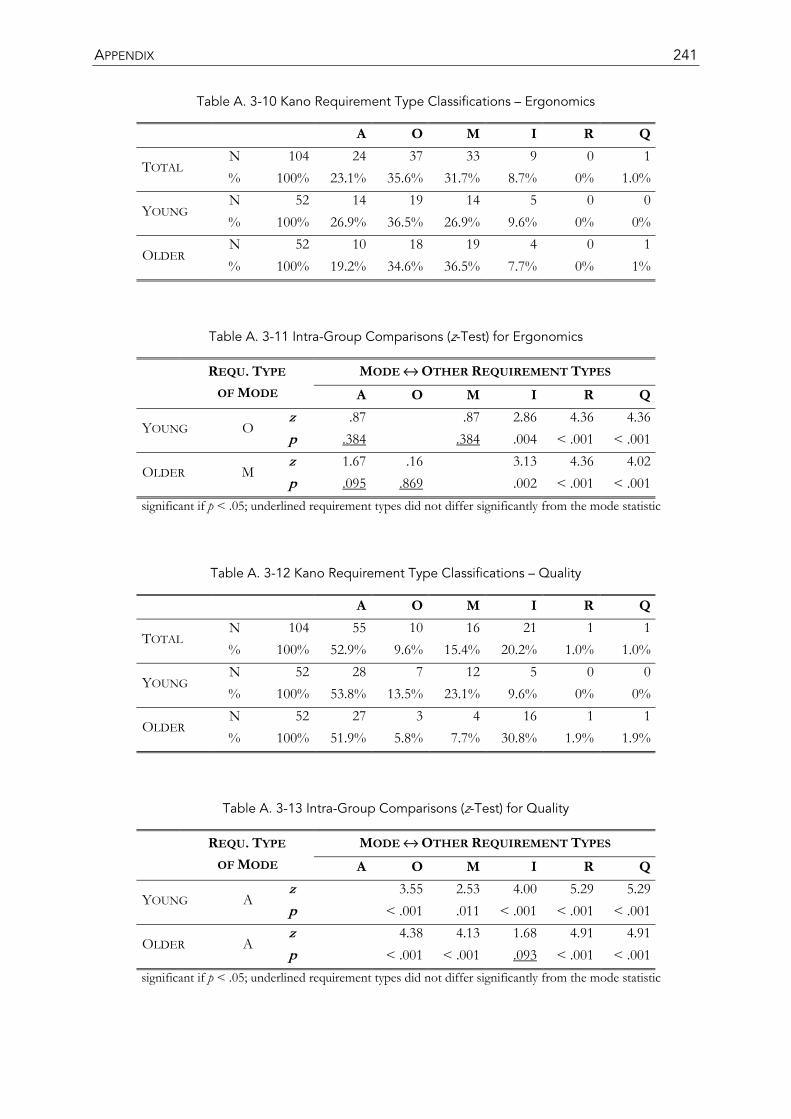
APPENDIX 241
Table A. 3-10 Kano Requirement Type Classifications – Ergonomics
A O M I R Q
TOTAL N 104 24 37 33 9 0 1 % 100% 23.1% 35.6% 31.7% 8.7% 0% 1.0%
YOUNG N 52 14 19 14 5 0 0 % 100% 26.9% 36.5% 26.9% 9.6% 0% 0%
OLDER N 52 10 18 19 4 0 1 % 100% 19.2% 34.6% 36.5% 7.7% 0% 1%
Table A. 3-11 Intra-Group Comparisons (z-Test) for Ergonomics
REQU. TYPE OF MODE
MODE ↔ OTHER REQUIREMENT TYPES A O M I R Q
YOUNG O z .87 .87 2.86 4.36 4.36 p .384 .384 .004 < .001 < .001
OLDER M z 1.67 .16 3.13 4.36 4.02 p .095 .869 .002 < .001 < .001
significant if p < .05; underlined requirement types did not differ significantly from the mode statistic
Table A. 3-12 Kano Requirement Type Classifications – Quality
A O M I R Q
TOTAL N 104 55 10 16 21 1 1 % 100% 52.9% 9.6% 15.4% 20.2% 1.0% 1.0%
YOUNG N 52 28 7 12 5 0 0 % 100% 53.8% 13.5% 23.1% 9.6% 0% 0%
OLDER N 52 27 3 4 16 1 1 % 100% 51.9% 5.8% 7.7% 30.8% 1.9% 1.9%
Table A. 3-13 Intra-Group Comparisons (z-Test) for Quality
REQU. TYPE OF MODE
MODE ↔ OTHER REQUIREMENT TYPES A O M I R Q
YOUNG A z 3.55 2.53 4.00 5.29 5.29 p < .001 .011 < .001 < .001 < .001
OLDER A z 4.38 4.13 1.68 4.91 4.91 p < .001 < .001 .093 < .001 < .001
significant if p < .05; underlined requirement types did not differ significantly from the mode statistic
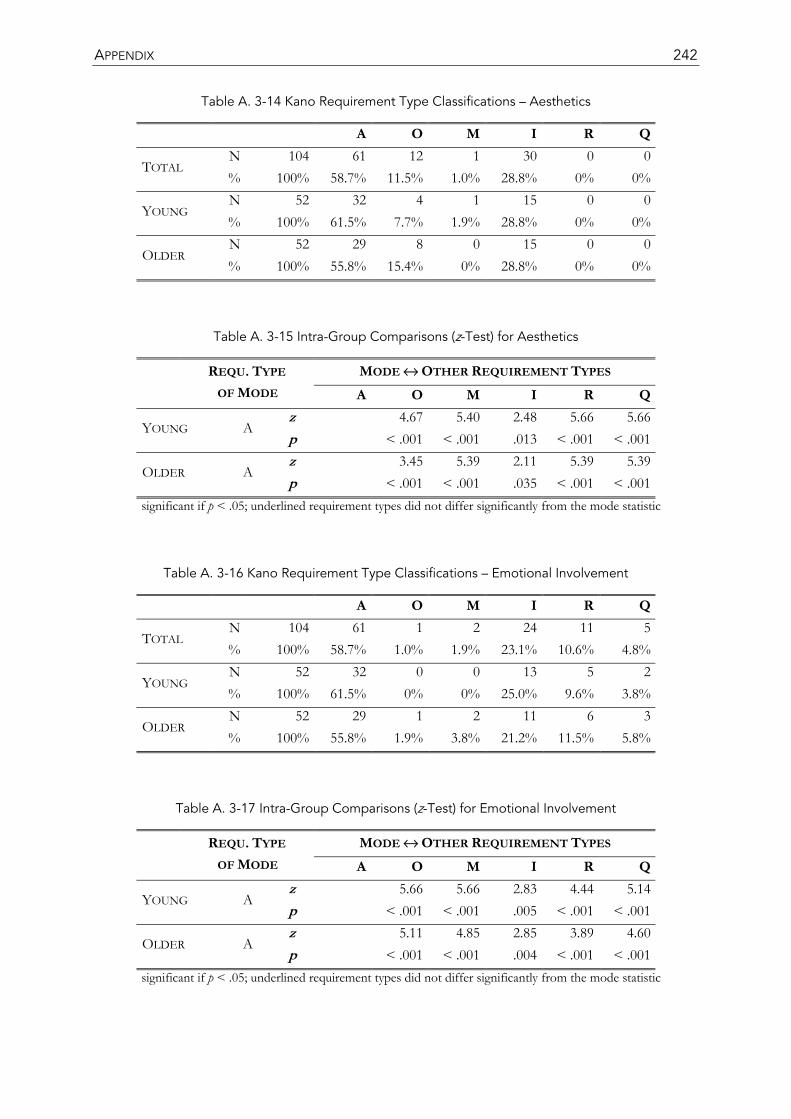
APPENDIX 242
Table A. 3-14 Kano Requirement Type Classifications – Aesthetics
A O M I R Q
TOTAL N 104 61 12 1 30 0 0 % 100% 58.7% 11.5% 1.0% 28.8% 0% 0%
YOUNG N 52 32 4 1 15 0 0 % 100% 61.5% 7.7% 1.9% 28.8% 0% 0%
OLDER N 52 29 8 0 15 0 0 % 100% 55.8% 15.4% 0% 28.8% 0% 0%
Table A. 3-15 Intra-Group Comparisons (z-Test) for Aesthetics
REQU. TYPE OF MODE
MODE ↔ OTHER REQUIREMENT TYPES A O M I R Q
YOUNG A z 4.67 5.40 2.48 5.66 5.66 p < .001 < .001 .013 < .001 < .001
OLDER A z 3.45 5.39 2.11 5.39 5.39 p < .001 < .001 .035 < .001 < .001
significant if p < .05; underlined requirement types did not differ significantly from the mode statistic
Table A. 3-16 Kano Requirement Type Classifications – Emotional Involvement
A O M I R Q
TOTAL N 104 61 1 2 24 11 5 % 100% 58.7% 1.0% 1.9% 23.1% 10.6% 4.8%
YOUNG N 52 32 0 0 13 5 2 % 100% 61.5% 0% 0% 25.0% 9.6% 3.8%
OLDER N 52 29 1 2 11 6 3 % 100% 55.8% 1.9% 3.8% 21.2% 11.5% 5.8%
Table A. 3-17 Intra-Group Comparisons (z-Test) for Emotional Involvement
REQU. TYPE OF MODE
MODE ↔ OTHER REQUIREMENT TYPES A O M I R Q
YOUNG A z 5.66 5.66 2.83 4.44 5.14 p < .001 < .001 .005 < .001 < .001
OLDER A z 5.11 4.85 2.85 3.89 4.60 p < .001 < .001 .004 < .001 < .001
significant if p < .05; underlined requirement types did not differ significantly from the mode statistic
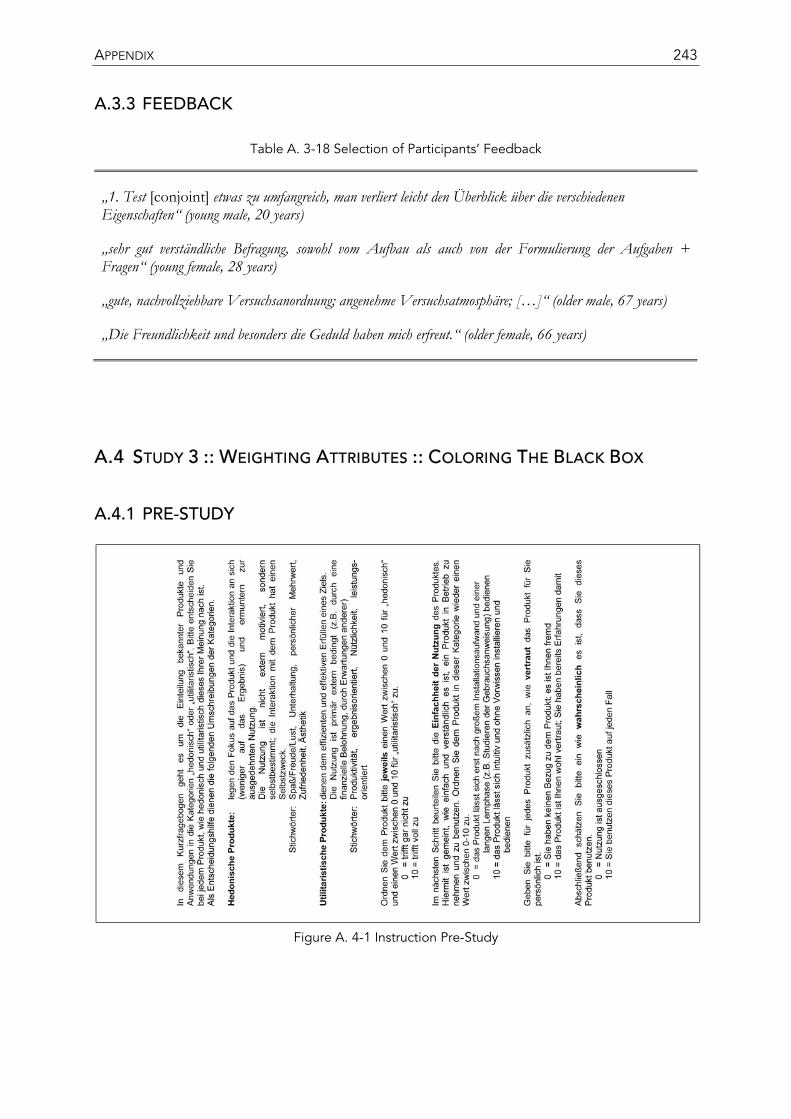
APPENDIX 243
A.3.3 FEEDBACK
Table A. 3-18 Selection of Participants’ Feedback
„1. Test [conjoint] etwas zu umfangreich, man verliert leicht den Überblick über die verschiedenen Eigenschaften“ (young male, 20 years)
„sehr gut verständliche Befragung, sowohl vom Aufbau als auch von der Formulierung der Aufgaben + Fragen“ (young female, 28 years)
„gute, nachvollziehbare Versuchsanordnung; angenehme Versuchsatmosphäre; […]“ (older male, 67 years)
„Die Freundlichkeit und besonders die Geduld haben mich erfreut.“ (older female, 66 years)
A.4 STUDY 3 :: WEIGHTING ATTRIBUTES :: COLORING THE BLACK BOX
A.4.1 PRE-STUDY
Figure A. 4-1 Instruction Pre-Study
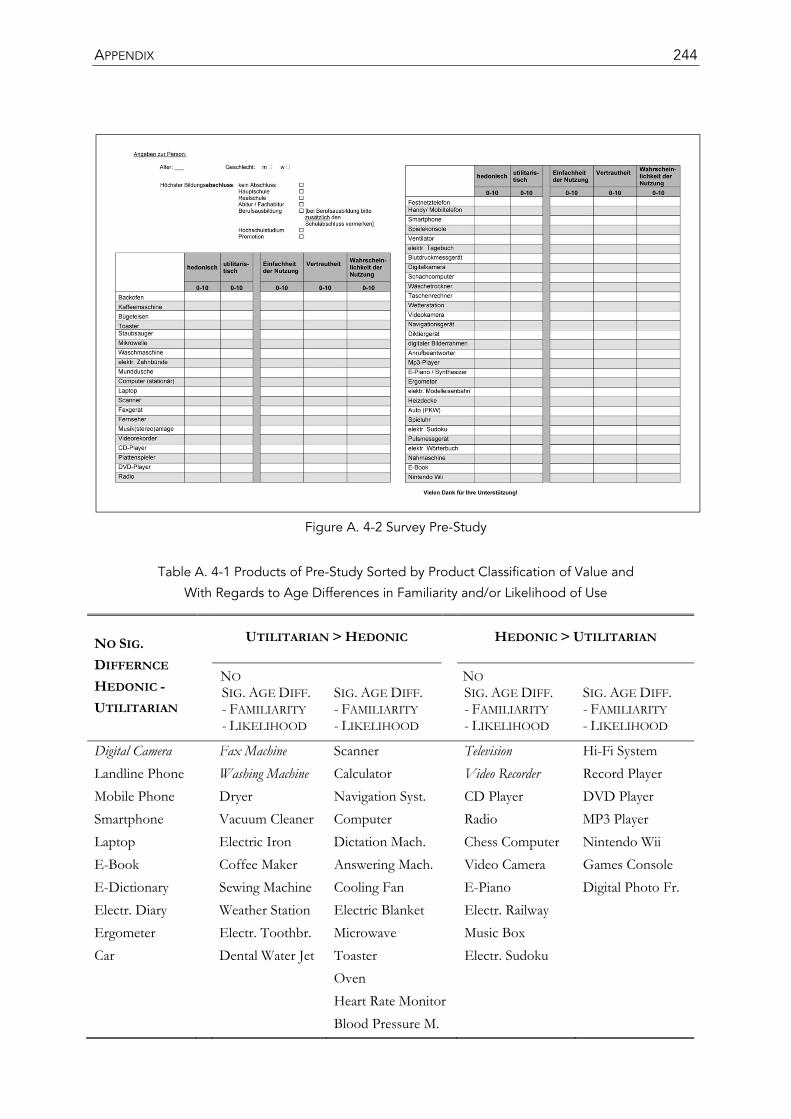
APPENDIX 244
Figure A. 4-2 Survey Pre-Study
Table A. 4-1 Products of Pre-Study Sorted by Product Classification of Value and
With Regards to Age Differences in Familiarity and/or Likelihood of Use
NO SIG. DIFFERNCE HEDONIC -
UTILITARIAN
UTILITARIAN > HEDONIC HEDONIC > UTILITARIAN
NO SIG. AGE DIFF. - FAMILIARITY - LIKELIHOOD
SIG. AGE DIFF. - FAMILIARITY - LIKELIHOOD
NO SIG. AGE DIFF. - FAMILIARITY - LIKELIHOOD
SIG. AGE DIFF. - FAMILIARITY - LIKELIHOOD
Digital Camera Fax Machine Scanner Television Hi-Fi System Landline Phone Washing Machine Calculator Video Recorder Record Player Mobile Phone Dryer Navigation Syst. CD Player DVD Player Smartphone Vacuum Cleaner Computer Radio MP3 Player Laptop Electric Iron Dictation Mach. Chess Computer Nintendo Wii E-Book Coffee Maker Answering Mach. Video Camera Games Console E-Dictionary Sewing Machine Cooling Fan E-Piano Digital Photo Fr. Electr. Diary Weather Station Electric Blanket Electr. Railway Ergometer Electr. Toothbr. Microwave Music Box Car Dental Water Jet Toaster Electr. Sudoku Oven Heart Rate Monitor Blood Pressure M.
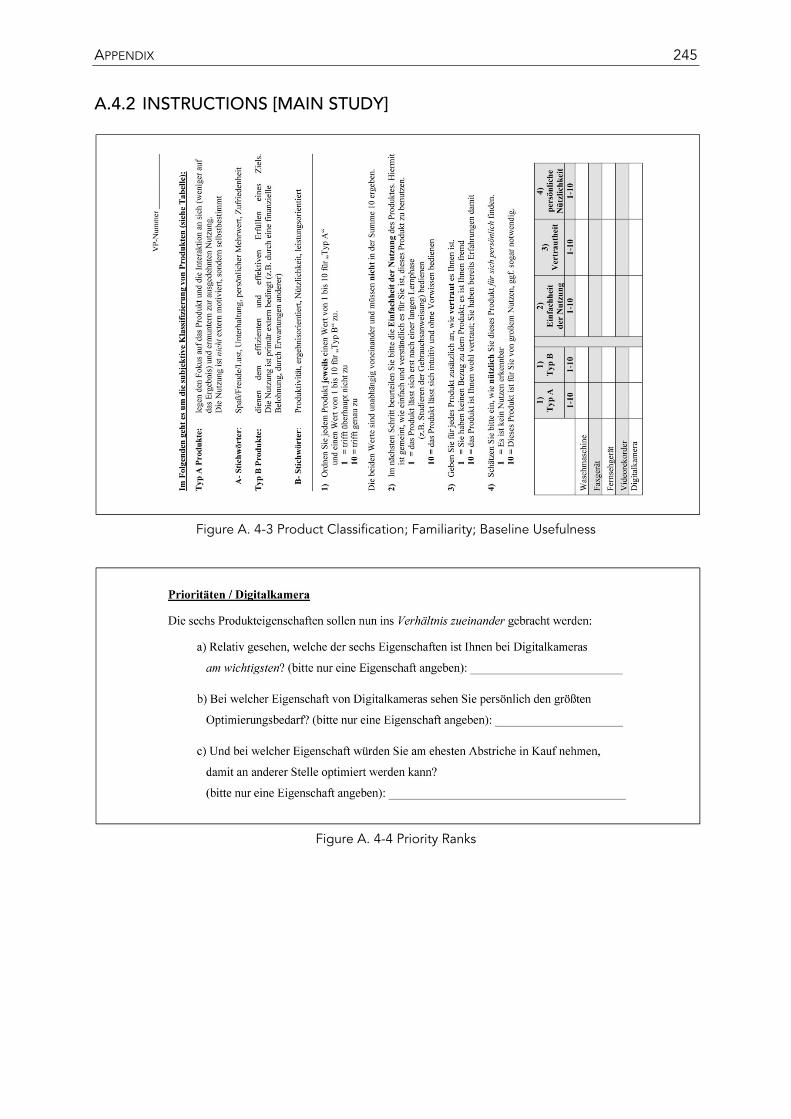
APPENDIX 245
A.4.2 INSTRUCTIONS [MAIN STUDY]
Figure A. 4-3 Product Classification; Familiarity; Baseline Usefulness
Figure A. 4-4 Priority Ranks
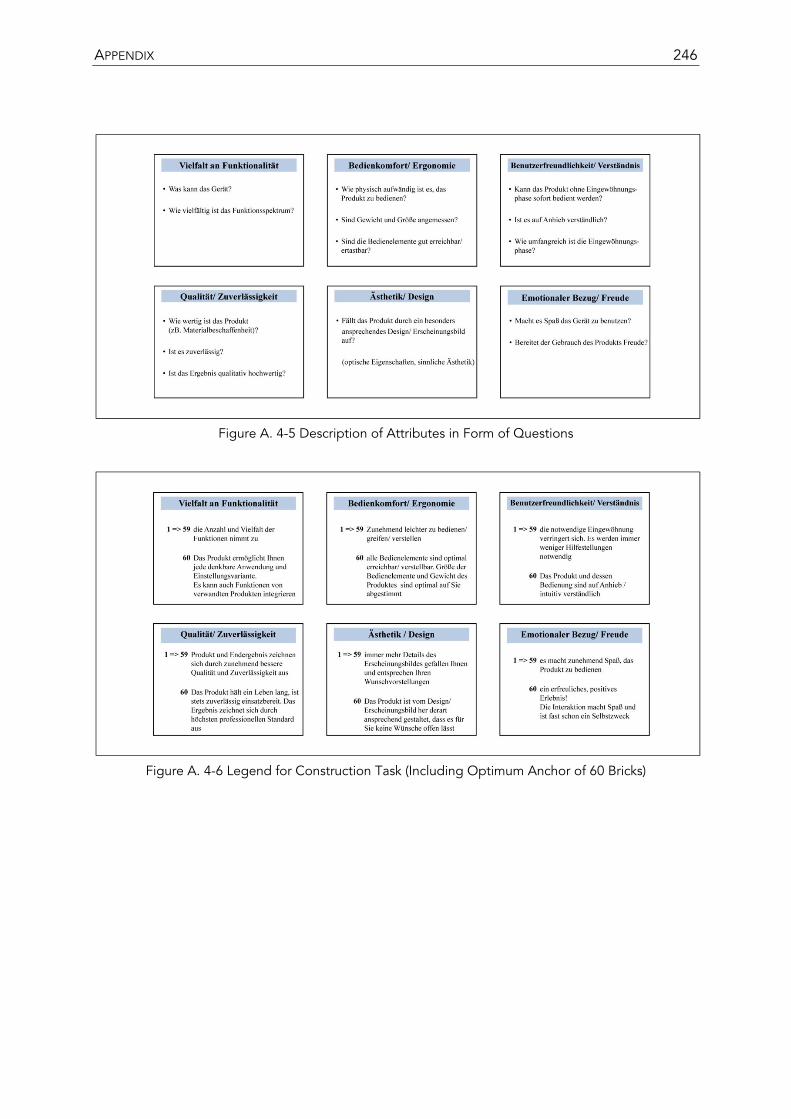
APPENDIX 246
Figure A. 4-5 Description of Attributes in Form of Questions
Figure A. 4-6 Legend for Construction Task (Including Optimum Anchor of 60 Bricks)
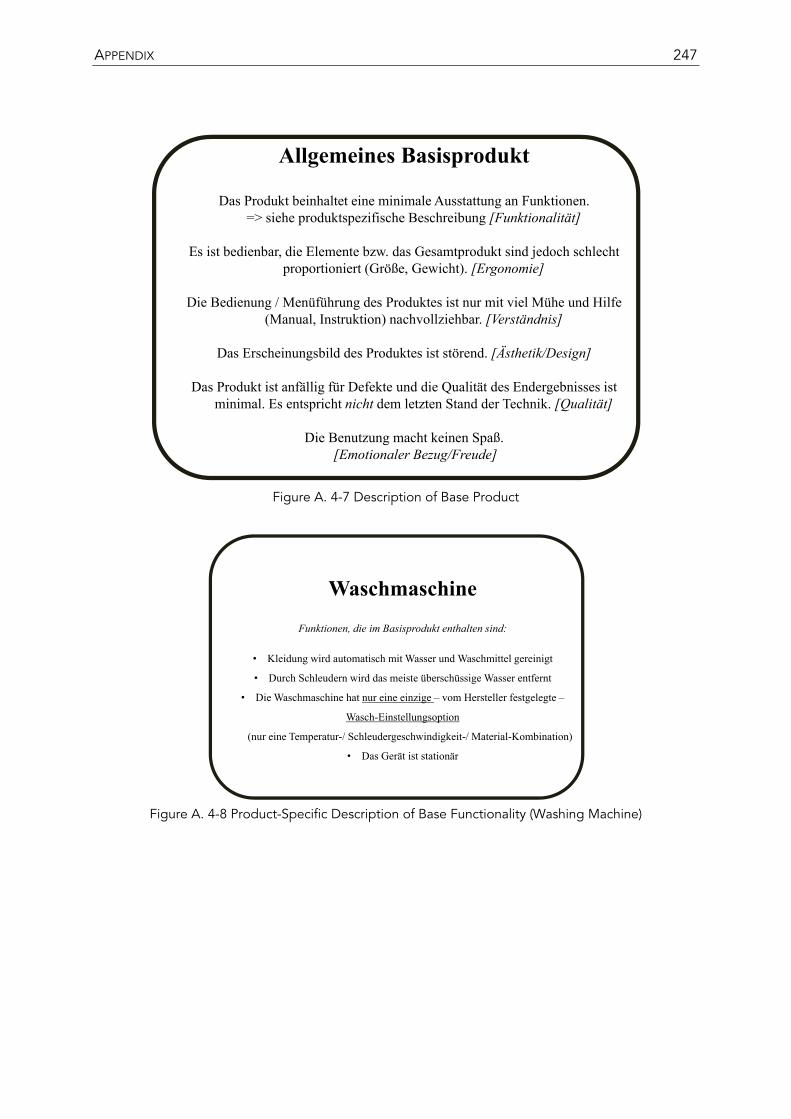
APPENDIX 247
Figure A. 4-7 Description of Base Product
Figure A. 4-8 Product-Specific Description of Base Functionality (Washing Machine)
Allgemeines Basisprodukt
Das Produkt beinhaltet eine minimale Ausstattung an Funktionen. => siehe produktspezifische Beschreibung [Funktionalität]
Es ist bedienbar, die Elemente bzw. das Gesamtprodukt sind jedoch schlecht proportioniert (Größe, Gewicht). [Ergonomie]
Die Bedienung / Menüführung des Produktes ist nur mit viel Mühe und Hilfe (Manual, Instruktion) nachvollziehbar. [Verständnis]
Das Erscheinungsbild des Produktes ist störend. [Ästhetik/Design]
Das Produkt ist anfällig für Defekte und die Qualität des Endergebnisses ist minimal. Es entspricht nicht dem letzten Stand der Technik. [Qualität]
Die Benutzung macht keinen Spaß. [Emotionaler Bezug/Freude]
Waschmaschine
Funktionen, die im Basisprodukt enthalten sind:
• Kleidung wird automatisch mit Wasser und Waschmittel gereinigt
• Durch Schleudern wird das meiste überschüssige Wasser entfernt
• Die Waschmaschine hat nur eine einzige – vom Hersteller festgelegte –
Wasch-Einstellungsoption
(nur eine Temperatur-/ Schleudergeschwindigkeit-/ Material-Kombination)
• Das Gerät ist stationär
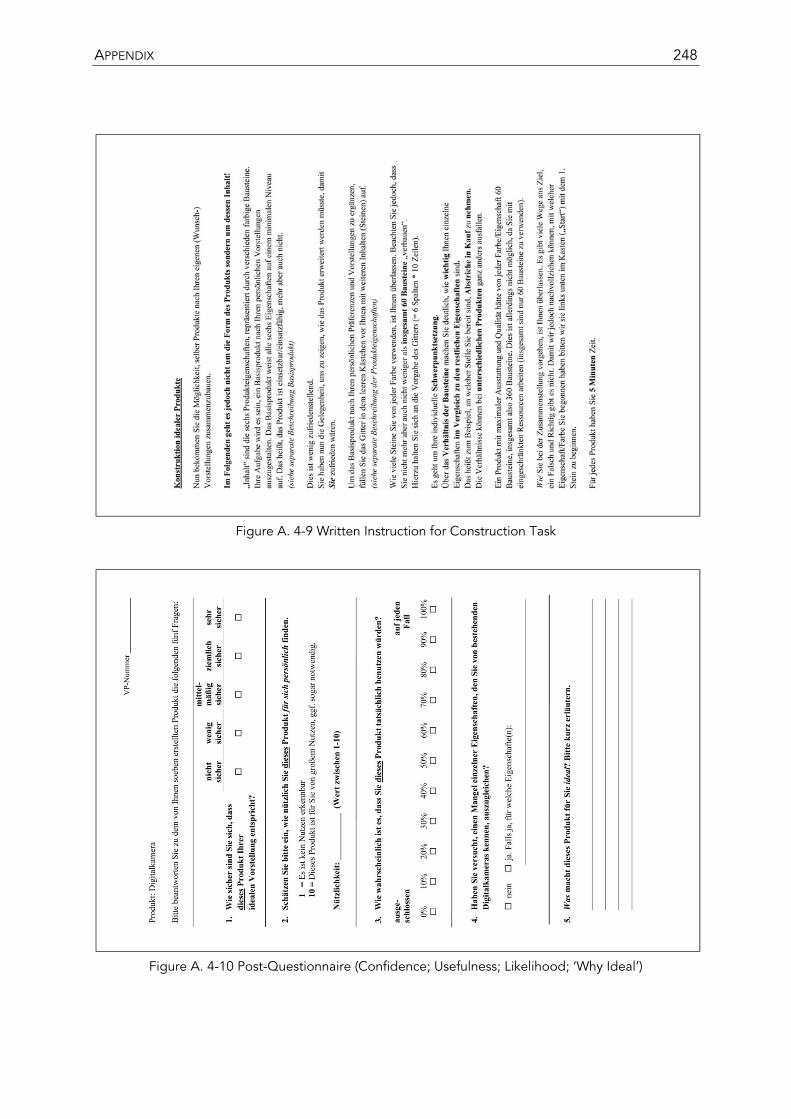
APPENDIX 248
Figure A. 4-9 Written Instruction for Construction Task
Figure A. 4-10 Post-Questionnaire (Confidence; Usefulness; Likelihood; ‘Why Ideal’)
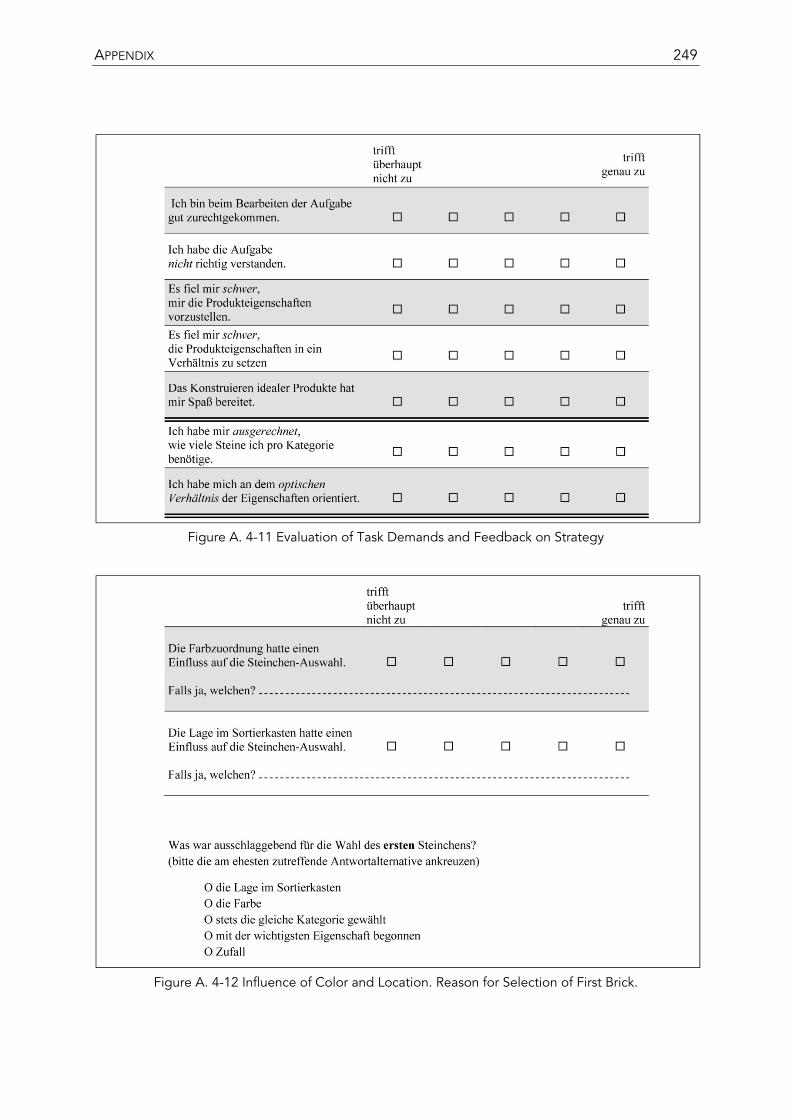
APPENDIX 249
Figure A. 4-11 Evaluation of Task Demands and Feedback on Strategy
Figure A. 4-12 Influence of Color and Location. Reason for Selection of First Brick.
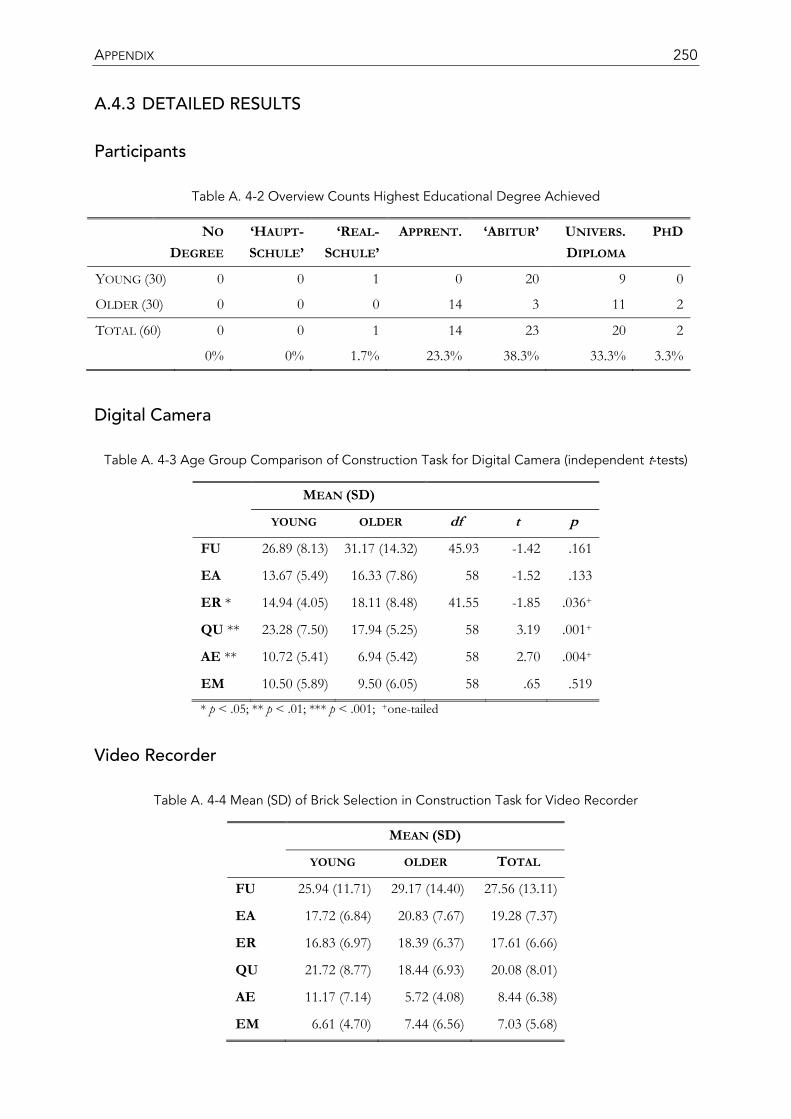
APPENDIX 250
A.4.3 DETAILED RESULTS
Participants
Table A. 4-2 Overview Counts Highest Educational Degree Achieved
NO
DEGREE ‘HAUPT-SCHULE’
‘REAL-SCHULE’
APPRENT. ‘ABITUR’ UNIVERS. DIPLOMA
PHD
YOUNG (30) 0 0 1 0 20 9 0
OLDER (30) 0 0 0 14 3 11 2
TOTAL (60) 0 0 1 14 23 20 2
0% 0% 1.7% 23.3% 38.3% 33.3% 3.3%
Digital Camera
Table A. 4-3 Age Group Comparison of Construction Task for Digital Camera (independent t-tests)
MEAN (SD)
YOUNG OLDER df t p
FU 26.89 (8.13) 31.17 (14.32) 45.93 -1.42 .161
EA 13.67 (5.49) 16.33 (7.86) 58 -1.52 .133
ER * 14.94 (4.05) 18.11 (8.48) 41.55 -1.85 .036+
QU ** 23.28 (7.50) 17.94 (5.25) 58 3.19 .001+
AE ** 10.72 (5.41) 6.94 (5.42) 58 2.70 .004+
EM 10.50 (5.89) 9.50 (6.05) 58 .65 .519
* p < .05; ** p < .01; *** p < .001; +one-tailed
Video Recorder
Table A. 4-4 Mean (SD) of Brick Selection in Construction Task for Video Recorder
MEAN (SD)
YOUNG OLDER TOTAL
FU 25.94 (11.71) 29.17 (14.40) 27.56 (13.11)
EA 17.72 (6.84) 20.83 (7.67) 19.28 (7.37)
ER 16.83 (6.97) 18.39 (6.37) 17.61 (6.66)
QU 21.72 (8.77) 18.44 (6.93) 20.08 (8.01)
AE 11.17 (7.14) 5.72 (4.08) 8.44 (6.38)
EM 6.61 (4.70) 7.44 (6.56) 7.03 (5.68)
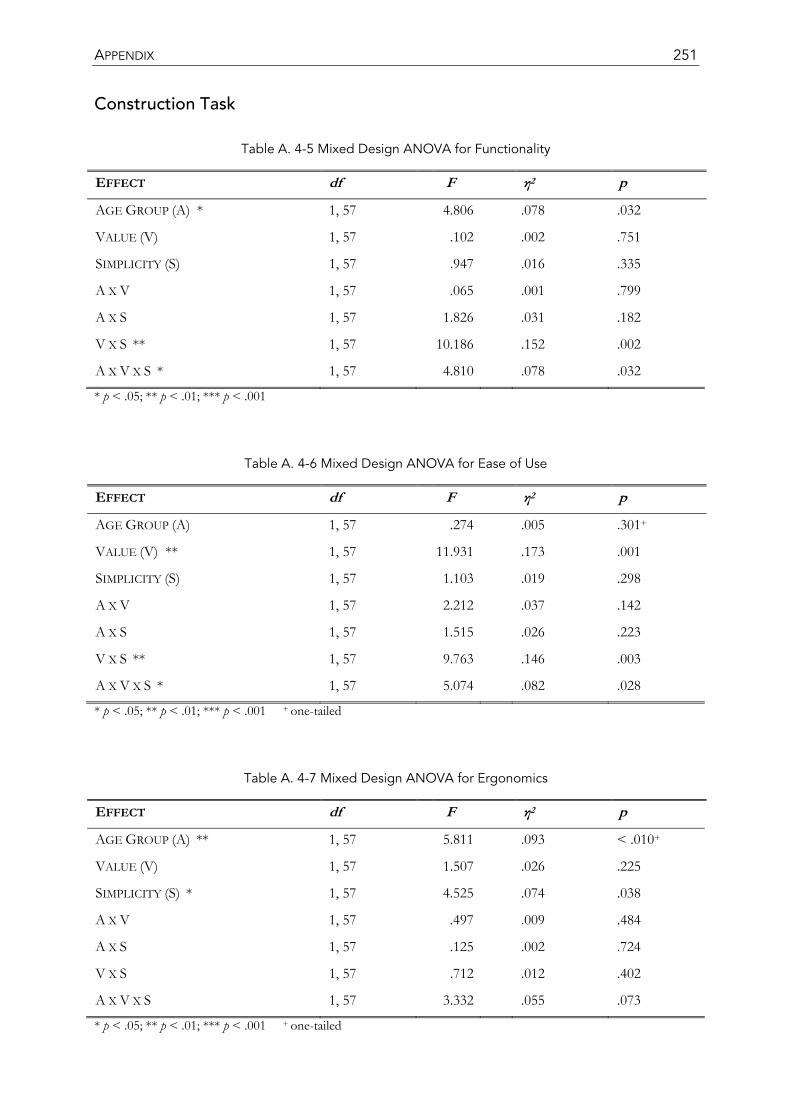
APPENDIX 251
Construction Task
Table A. 4-5 Mixed Design ANOVA for Functionality
EFFECT df F η2 p
AGE GROUP (A) * 1, 57 4.806 .078 .032
VALUE (V) 1, 57 .102 .002 .751
SIMPLICITY (S) 1, 57 .947 .016 .335
A X V 1, 57 .065 .001 .799
A X S 1, 57 1.826 .031 .182
V X S ** 1, 57 10.186 .152 .002
A X V X S * 1, 57 4.810 .078 .032
* p < .05; ** p < .01; *** p < .001
Table A. 4-6 Mixed Design ANOVA for Ease of Use
EFFECT df F η2 p
AGE GROUP (A) 1, 57 .274 .005 .301+
VALUE (V) ** 1, 57 11.931 .173 .001
SIMPLICITY (S) 1, 57 1.103 .019 .298
A X V 1, 57 2.212 .037 .142
A X S 1, 57 1.515 .026 .223
V X S ** 1, 57 9.763 .146 .003
A X V X S * 1, 57 5.074 .082 .028
* p < .05; ** p < .01; *** p < .001 + one-tailed
Table A. 4-7 Mixed Design ANOVA for Ergonomics
EFFECT df F η2 p
AGE GROUP (A) ** 1, 57 5.811 .093 < .010+
VALUE (V) 1, 57 1.507 .026 .225
SIMPLICITY (S) * 1, 57 4.525 .074 .038
A X V 1, 57 .497 .009 .484
A X S 1, 57 .125 .002 .724
V X S 1, 57 .712 .012 .402
A X V X S 1, 57 3.332 .055 .073
* p < .05; ** p < .01; *** p < .001 + one-tailed
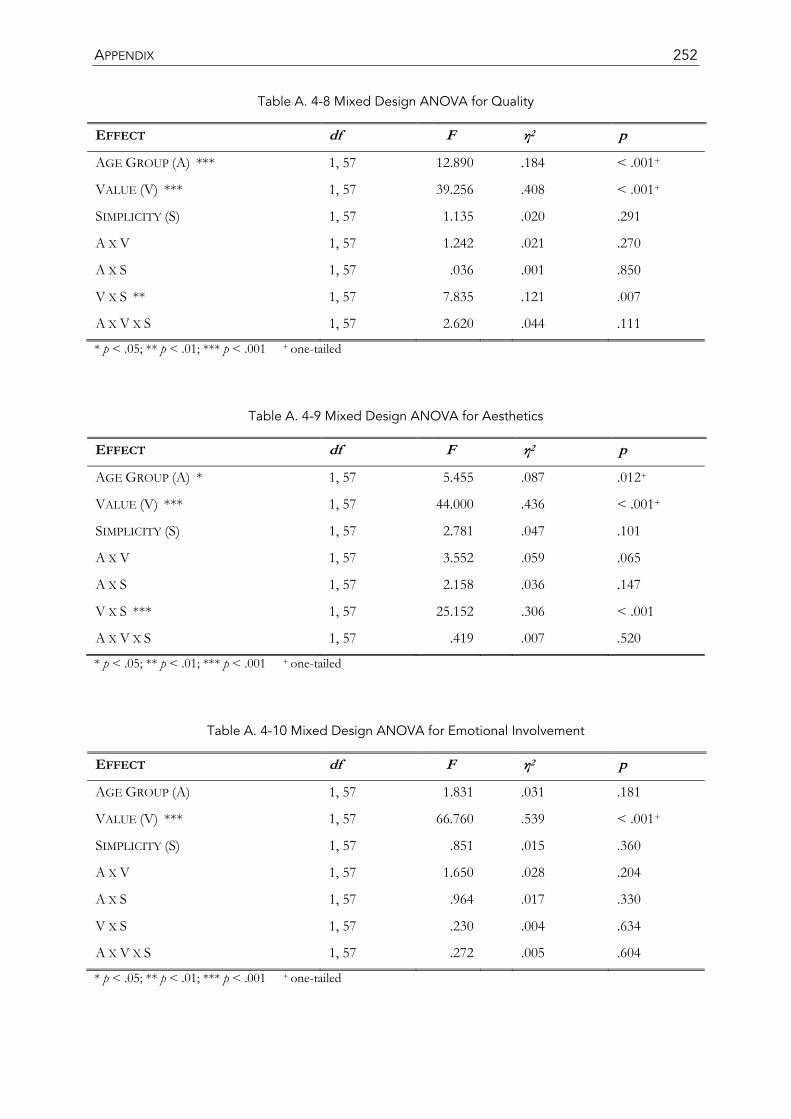
APPENDIX 252
Table A. 4-8 Mixed Design ANOVA for Quality
EFFECT df F η2 p
AGE GROUP (A) *** 1, 57 12.890 .184 < .001+
VALUE (V) *** 1, 57 39.256 .408 < .001+
SIMPLICITY (S) 1, 57 1.135 .020 .291
A X V 1, 57 1.242 .021 .270
A X S 1, 57 .036 .001 .850
V X S ** 1, 57 7.835 .121 .007
A X V X S 1, 57 2.620 .044 .111
* p < .05; ** p < .01; *** p < .001 + one-tailed
Table A. 4-9 Mixed Design ANOVA for Aesthetics
EFFECT df F η2 p
AGE GROUP (A) * 1, 57 5.455 .087 .012+
VALUE (V) *** 1, 57 44.000 .436 < .001+
SIMPLICITY (S) 1, 57 2.781 .047 .101
A X V 1, 57 3.552 .059 .065
A X S 1, 57 2.158 .036 .147
V X S *** 1, 57 25.152 .306 < .001
A X V X S 1, 57 .419 .007 .520
* p < .05; ** p < .01; *** p < .001 + one-tailed
Table A. 4-10 Mixed Design ANOVA for Emotional Involvement
EFFECT df F η2 p
AGE GROUP (A) 1, 57 1.831 .031 .181
VALUE (V) *** 1, 57 66.760 .539 < .001+
SIMPLICITY (S) 1, 57 .851 .015 .360
A X V 1, 57 1.650 .028 .204
A X S 1, 57 .964 .017 .330
V X S 1, 57 .230 .004 .634
A X V X S 1, 57 .272 .005 .604
* p < .05; ** p < .01; *** p < .001 + one-tailed
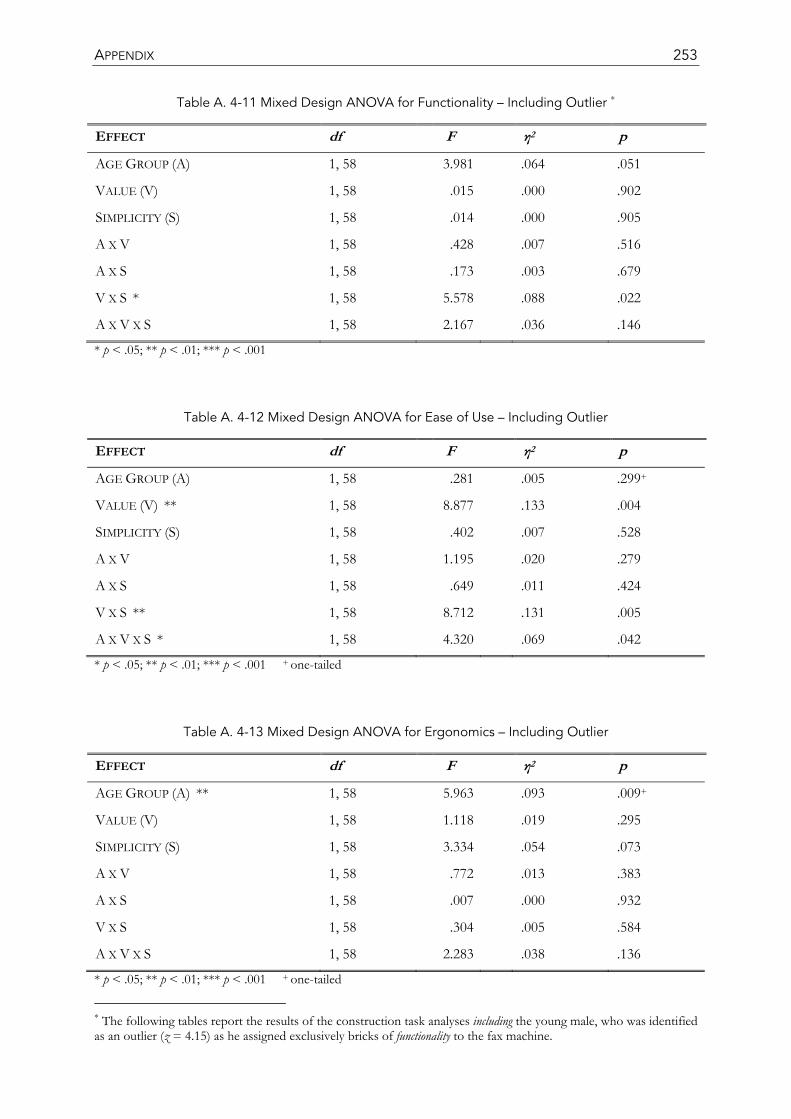
APPENDIX 253
Table A. 4-11 Mixed Design ANOVA for Functionality – Including Outlier ∗
EFFECT df F η2 p
AGE GROUP (A) 1, 58 3.981 .064 .051
VALUE (V) 1, 58 .015 .000 .902
SIMPLICITY (S) 1, 58 .014 .000 .905
A X V 1, 58 .428 .007 .516
A X S 1, 58 .173 .003 .679
V X S * 1, 58 5.578 .088 .022
A X V X S 1, 58 2.167 .036 .146
* p < .05; ** p < .01; *** p < .001
Table A. 4-12 Mixed Design ANOVA for Ease of Use – Including Outlier
EFFECT df F η2 p
AGE GROUP (A) 1, 58 .281 .005 .299+
VALUE (V) ** 1, 58 8.877 .133 .004
SIMPLICITY (S) 1, 58 .402 .007 .528
A X V 1, 58 1.195 .020 .279
A X S 1, 58 .649 .011 .424
V X S ** 1, 58 8.712 .131 .005
A X V X S * 1, 58 4.320 .069 .042
* p < .05; ** p < .01; *** p < .001 + one-tailed
Table A. 4-13 Mixed Design ANOVA for Ergonomics – Including Outlier
EFFECT df F η2 p
AGE GROUP (A) ** 1, 58 5.963 .093 .009+
VALUE (V) 1, 58 1.118 .019 .295
SIMPLICITY (S) 1, 58 3.334 .054 .073
A X V 1, 58 .772 .013 .383
A X S 1, 58 .007 .000 .932
V X S 1, 58 .304 .005 .584
A X V X S 1, 58 2.283 .038 .136
* p < .05; ** p < .01; *** p < .001 + one-tailed ∗ The following tables report the results of the construction task analyses including the young male, who was identified as an outlier (z = 4.15) as he assigned exclusively bricks of functionality to the fax machine.
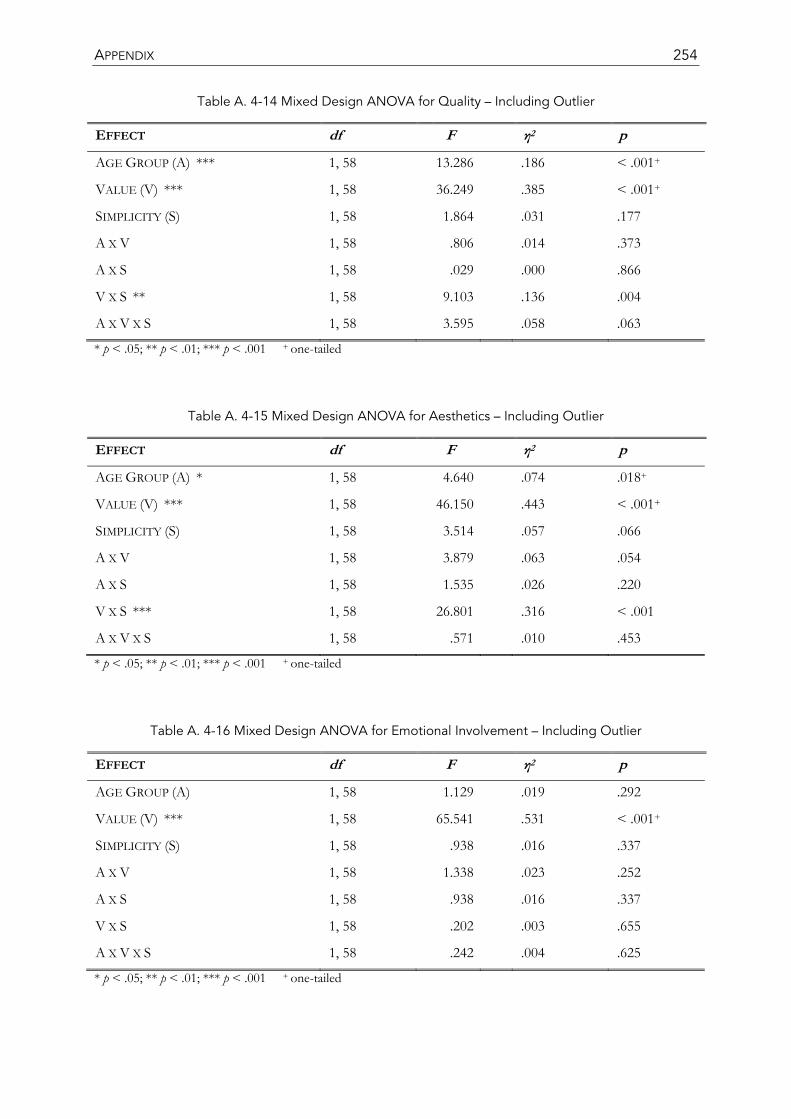
APPENDIX 254
Table A. 4-14 Mixed Design ANOVA for Quality – Including Outlier
EFFECT df F η2 p
AGE GROUP (A) *** 1, 58 13.286 .186 < .001+
VALUE (V) *** 1, 58 36.249 .385 < .001+
SIMPLICITY (S) 1, 58 1.864 .031 .177
A X V 1, 58 .806 .014 .373
A X S 1, 58 .029 .000 .866
V X S ** 1, 58 9.103 .136 .004
A X V X S 1, 58 3.595 .058 .063
* p < .05; ** p < .01; *** p < .001 + one-tailed
Table A. 4-15 Mixed Design ANOVA for Aesthetics – Including Outlier
EFFECT df F η2 p
AGE GROUP (A) * 1, 58 4.640 .074 .018+
VALUE (V) *** 1, 58 46.150 .443 < .001+
SIMPLICITY (S) 1, 58 3.514 .057 .066
A X V 1, 58 3.879 .063 .054
A X S 1, 58 1.535 .026 .220
V X S *** 1, 58 26.801 .316 < .001
A X V X S 1, 58 .571 .010 .453
* p < .05; ** p < .01; *** p < .001 + one-tailed
Table A. 4-16 Mixed Design ANOVA for Emotional Involvement – Including Outlier
EFFECT df F η2 p
AGE GROUP (A) 1, 58 1.129 .019 .292
VALUE (V) *** 1, 58 65.541 .531 < .001+
SIMPLICITY (S) 1, 58 .938 .016 .337
A X V 1, 58 1.338 .023 .252
A X S 1, 58 .938 .016 .337
V X S 1, 58 .202 .003 .655
A X V X S 1, 58 .242 .004 .625
* p < .05; ** p < .01; *** p < .001 + one-tailed
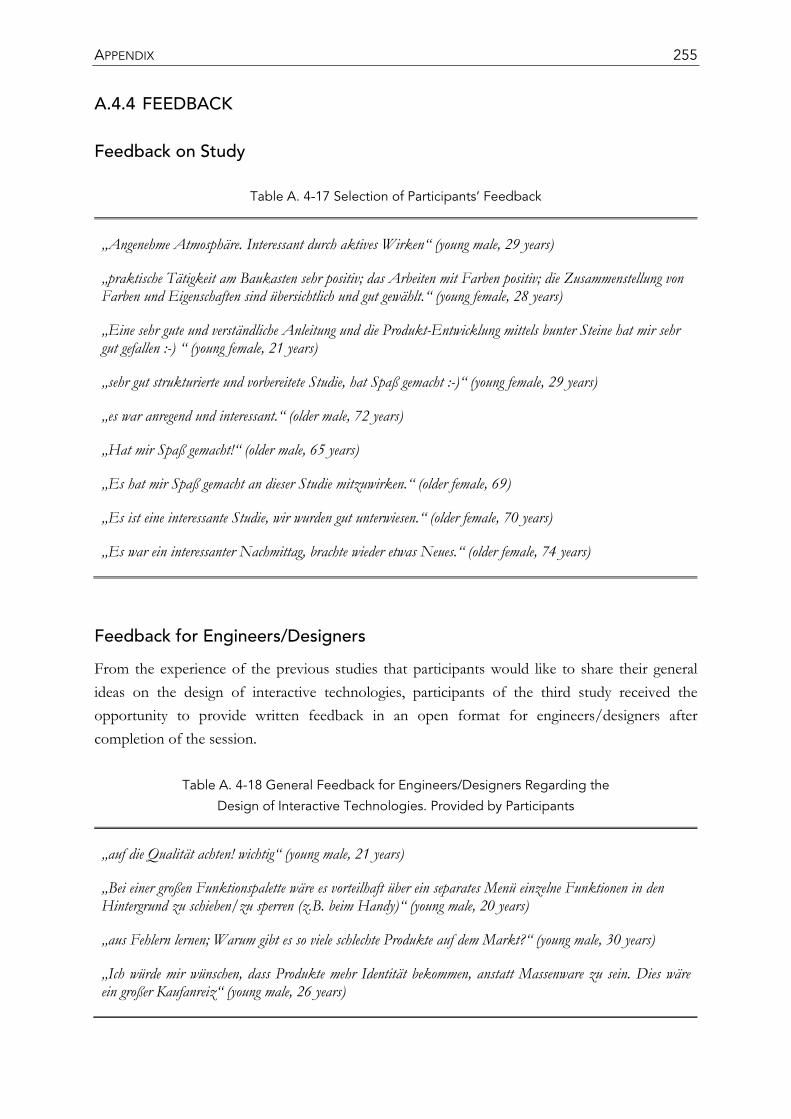
APPENDIX 255
A.4.4 FEEDBACK
Feedback on Study
Table A. 4-17 Selection of Participants’ Feedback
„Angenehme Atmosphäre. Interessant durch aktives Wirken“ (young male, 29 years)
„praktische Tätigkeit am Baukasten sehr positiv; das Arbeiten mit Farben positiv; die Zusammenstellung von Farben und Eigenschaften sind übersichtlich und gut gewählt.“ (young female, 28 years)
„Eine sehr gute und verständliche Anleitung und die Produkt-Entwicklung mittels bunter Steine hat mir sehr gut gefallen :-) “ (young female, 21 years)
„sehr gut strukturierte und vorbereitete Studie, hat Spaß gemacht :-)“ (young female, 29 years)
„es war anregend und interessant.“ (older male, 72 years)
„Hat mir Spaß gemacht!“ (older male, 65 years)
„Es hat mir Spaß gemacht an dieser Studie mitzuwirken.“ (older female, 69)
„Es ist eine interessante Studie, wir wurden gut unterwiesen.“ (older female, 70 years)
„Es war ein interessanter Nachmittag, brachte wieder etwas Neues.“ (older female, 74 years)
Feedback for Engineers/Designers
From the experience of the previous studies that participants would like to share their general ideas on the design of interactive technologies, participants of the third study received the opportunity to provide written feedback in an open format for engineers/designers after completion of the session.
Table A. 4-18 General Feedback for Engineers/Designers Regarding the
Design of Interactive Technologies. Provided by Participants
„auf die Qualität achten! wichtig“ (young male, 21 years)
„Bei einer großen Funktionspalette wäre es vorteilhaft über ein separates Menü einzelne Funktionen in den Hintergrund zu schieben/zu sperren (z.B. beim Handy)“ (young male, 20 years)
„aus Fehlern lernen; Warum gibt es so viele schlechte Produkte auf dem Markt?“ (young male, 30 years)
„Ich würde mir wünschen, dass Produkte mehr Identität bekommen, anstatt Massenware zu sein. Dies wäre ein großer Kaufanreiz“ (young male, 26 years)
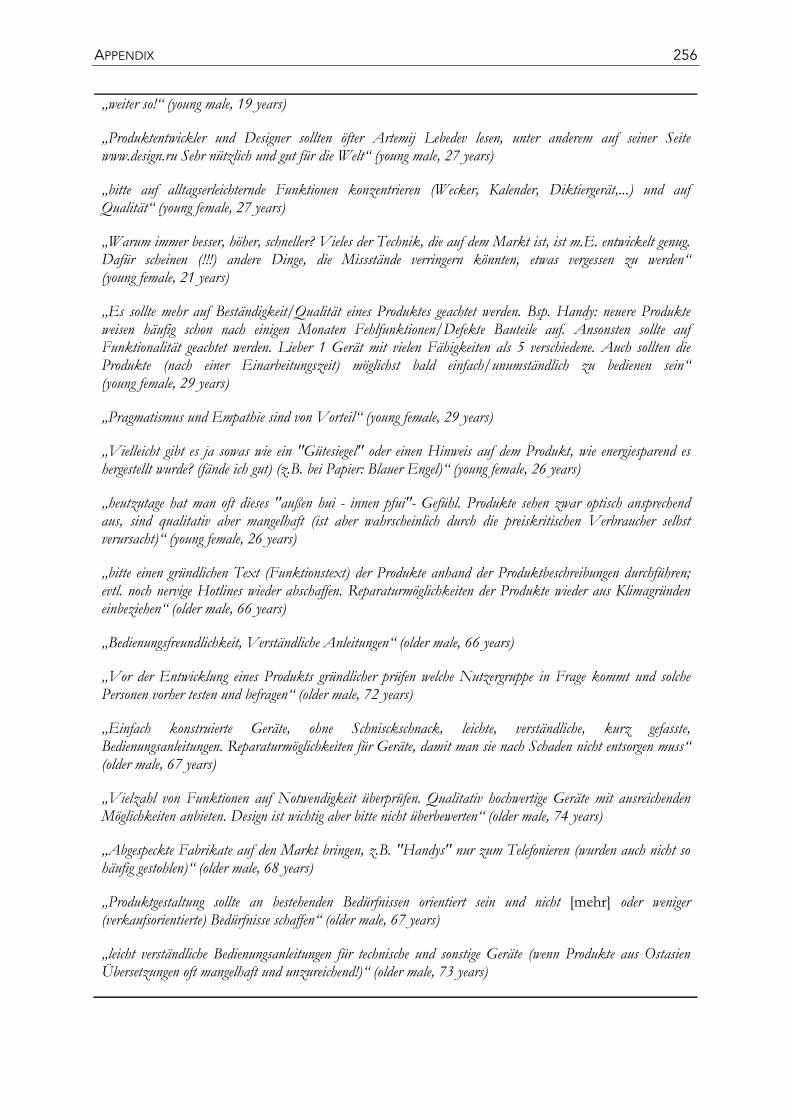
APPENDIX 256
„weiter so!“ (young male, 19 years)
„Produktentwickler und Designer sollten öfter Artemij Lebedev lesen, unter anderem auf seiner Seite www.design.ru Sehr nützlich und gut für die Welt“ (young male, 27 years)
„bitte auf alltagserleichternde Funktionen konzentrieren (Wecker, Kalender, Diktiergerät,...) und auf Qualität“ (young female, 27 years)
„Warum immer besser, höher, schneller? Vieles der Technik, die auf dem Markt ist, ist m.E. entwickelt genug. Dafür scheinen (!!!) andere Dinge, die Missstände verringern könnten, etwas vergessen zu werden“ (young female, 21 years)
„Es sollte mehr auf Beständigkeit/Qualität eines Produktes geachtet werden. Bsp. Handy: neuere Produkte weisen häufig schon nach einigen Monaten Fehlfunktionen/Defekte Bauteile auf. Ansonsten sollte auf Funktionalität geachtet werden. Lieber 1 Gerät mit vielen Fähigkeiten als 5 verschiedene. Auch sollten die Produkte (nach einer Einarbeitungszeit) möglichst bald einfach/unumständlich zu bedienen sein“ (young female, 29 years)
„Pragmatismus und Empathie sind von Vorteil“ (young female, 29 years)
„Vielleicht gibt es ja sowas wie ein "Gütesiegel" oder einen Hinweis auf dem Produkt, wie energiesparend es hergestellt wurde? (fände ich gut) (z.B. bei Papier: Blauer Engel)“ (young female, 26 years)
„heutzutage hat man oft dieses "außen hui - innen pfui"- Gefühl. Produkte sehen zwar optisch ansprechend aus, sind qualitativ aber mangelhaft (ist aber wahrscheinlich durch die preiskritischen Verbraucher selbst verursacht)“ (young female, 26 years)
„bitte einen gründlichen Text (Funktionstext) der Produkte anhand der Produktbeschreibungen durchführen; evtl. noch nervige Hotlines wieder abschaffen. Reparaturmöglichkeiten der Produkte wieder aus Klimagründen einbeziehen“ (older male, 66 years)
„Bedienungsfreundlichkeit, Verständliche Anleitungen“ (older male, 66 years)
„Vor der Entwicklung eines Produkts gründlicher prüfen welche Nutzergruppe in Frage kommt und solche Personen vorher testen und befragen“ (older male, 72 years)
„Einfach konstruierte Geräte, ohne Schnisckschnack, leichte, verständliche, kurz gefasste, Bedienungsanleitungen. Reparaturmöglichkeiten für Geräte, damit man sie nach Schaden nicht entsorgen muss“ (older male, 67 years)
„Vielzahl von Funktionen auf Notwendigkeit überprüfen. Qualitativ hochwertige Geräte mit ausreichenden Möglichkeiten anbieten. Design ist wichtig aber bitte nicht überbewerten“ (older male, 74 years)
„Abgespeckte Fabrikate auf den Markt bringen, z.B. "Handys" nur zum Telefonieren (wurden auch nicht so häufig gestohlen)“ (older male, 68 years)
„Produktgestaltung sollte an bestehenden Bedürfnissen orientiert sein und nicht [mehr] oder weniger (verkaufsorientierte) Bedürfnisse schaffen“ (older male, 67 years)
„leicht verständliche Bedienungsanleitungen für technische und sonstige Geräte (wenn Produkte aus Ostasien Übersetzungen oft mangelhaft und unzureichend!)“ (older male, 73 years)
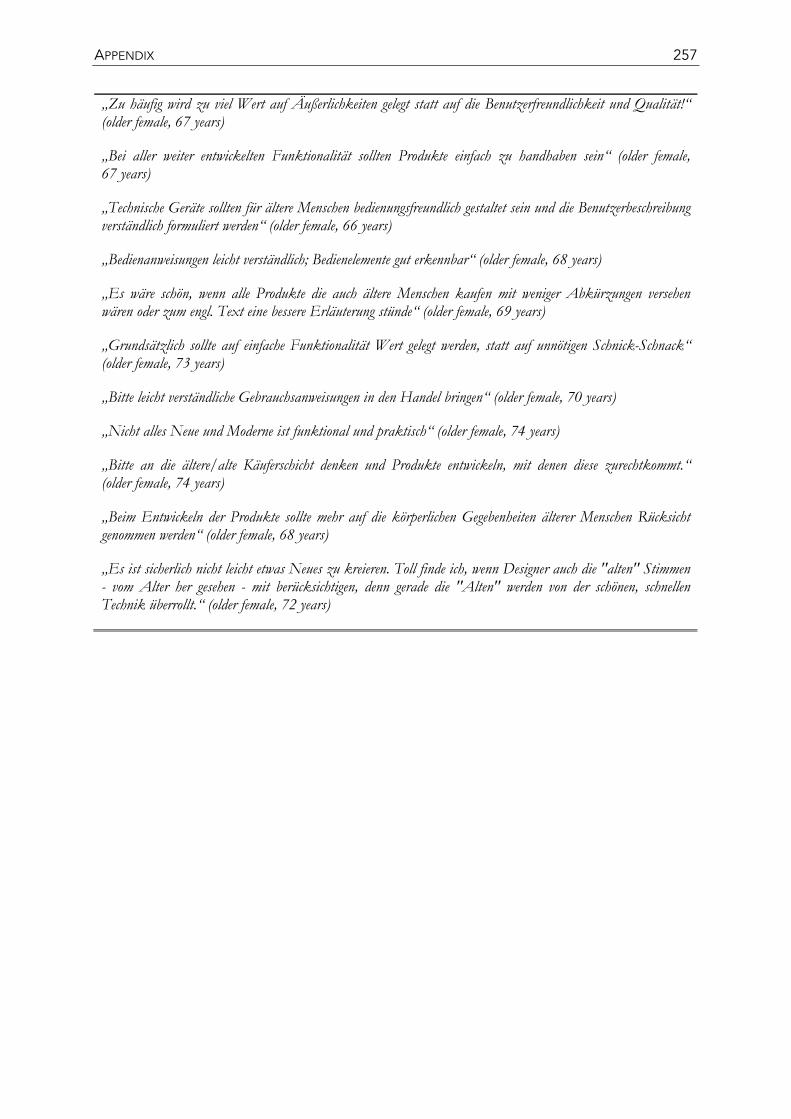
APPENDIX 257
„Zu häufig wird zu viel Wert auf Äußerlichkeiten gelegt statt auf die Benutzerfreundlichkeit und Qualität!“ (older female, 67 years)
„Bei aller weiter entwickelten Funktionalität sollten Produkte einfach zu handhaben sein“ (older female, 67 years)
„Technische Geräte sollten für ältere Menschen bedienungsfreundlich gestaltet sein und die Benutzerbeschreibung verständlich formuliert werden“ (older female, 66 years)
„Bedienanweisungen leicht verständlich; Bedienelemente gut erkennbar“ (older female, 68 years)
„Es wäre schön, wenn alle Produkte die auch ältere Menschen kaufen mit weniger Abkürzungen versehen wären oder zum engl. Text eine bessere Erläuterung stünde“ (older female, 69 years)
„Grundsätzlich sollte auf einfache Funktionalität Wert gelegt werden, statt auf unnötigen Schnick-Schnack“ (older female, 73 years)
„Bitte leicht verständliche Gebrauchsanweisungen in den Handel bringen“ (older female, 70 years)
„Nicht alles Neue und Moderne ist funktional und praktisch“ (older female, 74 years)
„Bitte an die ältere/alte Käuferschicht denken und Produkte entwickeln, mit denen diese zurechtkommt.“ (older female, 74 years)
„Beim Entwickeln der Produkte sollte mehr auf die körperlichen Gegebenheiten älterer Menschen Rücksicht genommen werden“ (older female, 68 years)
„Es ist sicherlich nicht leicht etwas Neues zu kreieren. Toll finde ich, wenn Designer auch die "alten" Stimmen - vom Alter her gesehen - mit berücksichtigen, denn gerade die "Alten" werden von der schönen, schnellen Technik überrollt.“ (older female, 72 years)
Copyright © 2022 FDOKUMEN