Towards an automatic construction of Contextual Attribute-Value Taxonomies
6
Towards an Automatic Construction of Contextual Attribute-Value Taxonomies Dino Ienco CEMAGREF, Montpellier, France LIRMM, Montpellier, France [email protected] Yoann Pitarch LIRMM, Montpellier, France [email protected] Pascal Poncelet LIRMM, Montpellier, France [email protected] Maguelonne Teisseire CEMAGREF, Montpellier, France LIRMM, Montpellier, France [email protected] ABSTRACT In many domains (e.g., data mining, data management, data warehouse), a hierarchical organization of attribute values can help the data analysis process. Nevertheless, such hi- erarchical knowledge does not always available or even may be inadequate or useless when exists. Starting from this consideration, in this paper we tackle the problem of the automatic definition of data-driven taxonomies.To do this we combine techniques coming from information theory and clustering to obtain a structured representation of the at- tribute values: the Contextual Attribute-Value Taxonomy (CAVT). The two main advantages of our method are to be fully unsupervised (i.e., without any knowledge provided by an expert) and parameter-free. We experiments the bene- fit of use CAVTs in the two following tasks: (i) the mul- tilevel multidimensional sequential pattern mining problem in which hierarchies are involved to exploit abstraction over the data, (ii) the table summarization problem, in which the hierarchies are used to aggregate the data to supply a sketch of the original information to the user. To validate our approach we use real world datasets in which we obtain appreciable results regarding both quantitative and qualita- tive evaluation. Categories and Subject Descriptors H.2 [Database Management]: Knowledge Management Applications—data exploration and discovery General Terms Algorithms, Data Management Permission to make digital or hard copies of all or part of this work for personal or classroom use is granted without fee provided that copies are not made or distributed for profit or commercial advantage and that copies bear this notice and the full citation on the first page. To copy otherwise, to republish, to post on servers or to redistribute to lists, requires prior specific permission and/or a fee. Copyright 200X ACM X-XXXXX-XX-X/XX/XX ...$10.00. Keywords Contextual Taxonomies, Clustering, Data Summarization 1. INTRODUCTION The hierarchical organization of values provided by At- tribute Value Taxonomies (AVTs) are widely used in many domains such as biological science [2], e-commerce [9], se- mantic web [14] and they are also used to support different types of data analysis like: anonymization [13], OLAP ex- ploration [11] and summarization [3]. For instance, data summarization can be very helpful to a marketing director to have a quick overview of a large sale table (e.g., for deci- sion making, it could be much more interesting to know sales in Europe than sales at a lower granularity such as cities). Usually this kind of hierarchies need to be specified by a do- main expert. Unfortunately this specification phase could be very time consuming and requires huge human resources (which are not always available), especially if the number of attributes of a dataset is very high. These considera- tions motivate the development of methods to infer these hierarchies in a completely unsupervised way (i.e., without any knowledge supplied by the expert). Consequently, they can fill the information gap when there are no available tax- onomies or when existing taxonomies are too general and thus lead to poor-quality data analysis. In some previous works [18, 5] the authors build contextual attribute hierar- chies to improve, for instance, the performance of the Naive Bayes classifier and the Bayesian network. These approaches are classification oriented which are thus human resource consuming and they build contextual attribute hierarchies related to the class attribute. Instead in our proposal we fo- cus on a fully unsupervised approach without requiring any class information over the data. To the best of our knowl- edge, very few approaches have tackled this problem despite the numerous applications that could benefit from an auto- matic definition of CAVTs. Considering our work, the main contributions are: • We introduce a method to automatically build con- textual attribute hierarchies that are useful in many domain of the data analysis • We do not require the class information to guide the
Transcript of Towards an automatic construction of Contextual Attribute-Value Taxonomies

Towards an Automatic Construction of ContextualAttribute-Value Taxonomies
Dino IencoCEMAGREF, Montpellier,
FranceLIRMM, Montpellier, France
Yoann PitarchLIRMM, Montpellier, France
Pascal PonceletLIRMM, Montpellier, France
Maguelonne TeisseireCEMAGREF, Montpellier,
FranceLIRMM, Montpellier, France
ABSTRACTIn many domains (e.g., data mining, data management, datawarehouse), a hierarchical organization of attribute valuescan help the data analysis process. Nevertheless, such hi-erarchical knowledge does not always available or even maybe inadequate or useless when exists. Starting from thisconsideration, in this paper we tackle the problem of theautomatic definition of data-driven taxonomies.To do thiswe combine techniques coming from information theory andclustering to obtain a structured representation of the at-tribute values: the Contextual Attribute-Value Taxonomy(CAVT). The two main advantages of our method are to befully unsupervised (i.e., without any knowledge provided byan expert) and parameter-free. We experiments the bene-fit of use CAVTs in the two following tasks: (i) the mul-tilevel multidimensional sequential pattern mining problemin which hierarchies are involved to exploit abstraction overthe data, (ii) the table summarization problem, in whichthe hierarchies are used to aggregate the data to supply asketch of the original information to the user. To validateour approach we use real world datasets in which we obtainappreciable results regarding both quantitative and qualita-tive evaluation.
Categories and Subject DescriptorsH.2 [Database Management]: Knowledge ManagementApplications—data exploration and discovery
General TermsAlgorithms, Data Management
Permission to make digital or hard copies of all or part of this work forpersonal or classroom use is granted without fee provided that copies arenot made or distributed for profit or commercial advantage and that copiesbear this notice and the full citation on the first page. To copy otherwise, torepublish, to post on servers or to redistribute to lists, requires prior specificpermission and/or a fee.Copyright 200X ACM X-XXXXX-XX-X/XX/XX ...$10.00.
KeywordsContextual Taxonomies, Clustering, Data Summarization
1. INTRODUCTIONThe hierarchical organization of values provided by At-
tribute Value Taxonomies (AVTs) are widely used in manydomains such as biological science [2], e-commerce [9], se-mantic web [14] and they are also used to support differenttypes of data analysis like: anonymization [13], OLAP ex-ploration [11] and summarization [3]. For instance, datasummarization can be very helpful to a marketing directorto have a quick overview of a large sale table (e.g., for deci-sion making, it could be much more interesting to know salesin Europe than sales at a lower granularity such as cities).Usually this kind of hierarchies need to be specified by a do-main expert. Unfortunately this specification phase couldbe very time consuming and requires huge human resources(which are not always available), especially if the numberof attributes of a dataset is very high. These considera-tions motivate the development of methods to infer thesehierarchies in a completely unsupervised way (i.e., withoutany knowledge supplied by the expert). Consequently, theycan fill the information gap when there are no available tax-onomies or when existing taxonomies are too general andthus lead to poor-quality data analysis. In some previousworks [18, 5] the authors build contextual attribute hierar-chies to improve, for instance, the performance of the NaiveBayes classifier and the Bayesian network. These approachesare classification oriented which are thus human resourceconsuming and they build contextual attribute hierarchiesrelated to the class attribute. Instead in our proposal we fo-cus on a fully unsupervised approach without requiring anyclass information over the data. To the best of our knowl-edge, very few approaches have tackled this problem despitethe numerous applications that could benefit from an auto-matic definition of CAVTs. Considering our work, the maincontributions are:
• We introduce a method to automatically build con-textual attribute hierarchies that are useful in manydomain of the data analysis
• We do not require the class information to guide the
process
• We supply a parameter free method that avoids human-expensive activity related to the manual construction
To validate our approach we use two different approaches:the first one is the multi-level multidimensional sequencepattern mining problem[12]. This method uses attribute hi-erarchies to extract sequence patterns from the data. Thesecond one is based on the privacy-preserving approach pre-sented in [13]. We adapt it to deal with the data summariza-tion problem. The remainder of this paper is organized asfollows. We first give a motivating example in Section 2. InSection 3 we describe our approach. The experimentationsare presented in Section 4 and the conclusions are drawn inSection 5.
2. MOTIVATING EXAMPLETo explain why deriving contextual attribute hierarchies
could be useful let us consider the toy dataset in Table 1. Inthis dataset, we consider information about persons whichare represented using three different attributes: City, Main
Sport and Type of cooking. We can assume that each at-tribute ranges over a discrete domain. For the attributeCity we use the following values {Turin (Italy), Porto (Por-tugal), Miami (USA), Denver (USA)}. The attribute Main
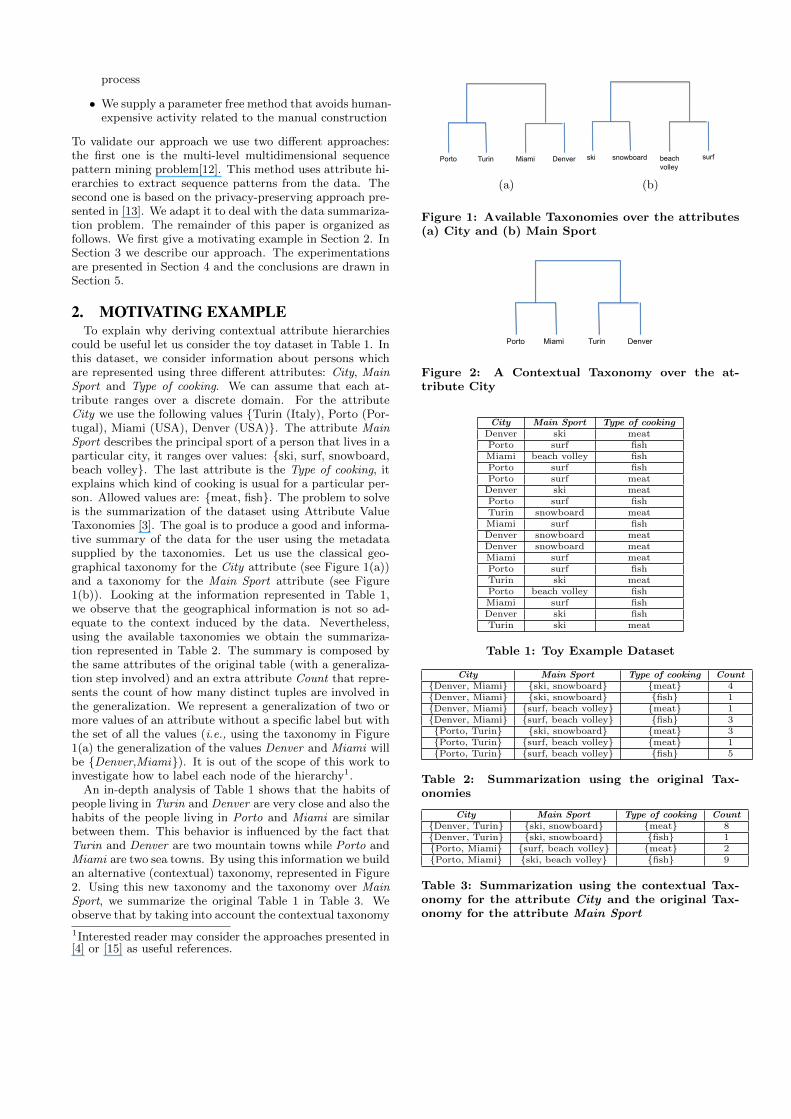
Sport describes the principal sport of a person that lives in aparticular city, it ranges over values: {ski, surf, snowboard,beach volley}. The last attribute is the Type of cooking, itexplains which kind of cooking is usual for a particular per-son. Allowed values are: {meat, fish}. The problem to solveis the summarization of the dataset using Attribute ValueTaxonomies [3]. The goal is to produce a good and informa-tive summary of the data for the user using the metadatasupplied by the taxonomies. Let us use the classical geo-graphical taxonomy for the City attribute (see Figure 1(a))and a taxonomy for the Main Sport attribute (see Figure1(b)). Looking at the information represented in Table 1,we observe that the geographical information is not so ad-equate to the context induced by the data. Nevertheless,using the available taxonomies we obtain the summariza-tion represented in Table 2. The summary is composed bythe same attributes of the original table (with a generaliza-tion step involved) and an extra attribute Count that repre-sents the count of how many distinct tuples are involved inthe generalization. We represent a generalization of two ormore values of an attribute without a specific label but withthe set of all the values (i.e., using the taxonomy in Figure1(a) the generalization of the values Denver and Miami willbe {Denver,Miami}). It is out of the scope of this work toinvestigate how to label each node of the hierarchy1.An in-depth analysis of Table 1 shows that the habits of
people living in Turin and Denver are very close and also thehabits of the people living in Porto and Miami are similarbetween them. This behavior is influenced by the fact thatTurin and Denver are two mountain towns while Porto andMiami are two sea towns. By using this information we buildan alternative (contextual) taxonomy, represented in Figure2. Using this new taxonomy and the taxonomy over Main
Sport, we summarize the original Table 1 in Table 3. Weobserve that by taking into account the contextual taxonomy
1Interested reader may consider the approaches presented in[4] or [15] as useful references.
Denver Turin Porto Miami
(a)
surf snowboard beach volley
ski
(b)
Figure 1: Available Taxonomies over the attributes(a) City and (b) Main Sport
Denver Miami Turin Porto
Figure 2: A Contextual Taxonomy over the at-tribute City
City Main Sport Type of cookingDenver ski meatPorto surf fishMiami beach volley fishPorto surf fishPorto surf meatDenver ski meatPorto surf fishTurin snowboard meatMiami surf fishDenver snowboard meatDenver snowboard meatMiami surf meatPorto surf fishTurin ski meatPorto beach volley fishMiami surf fishDenver ski fishTurin ski meat
Table 1: Toy Example Dataset
City Main Sport Type of cooking Count{Denver, Miami} {ski, snowboard} {meat} 4{Denver, Miami} {ski, snowboard} {fish} 1{Denver, Miami} {surf, beach volley} {meat} 1{Denver, Miami} {surf, beach volley} {fish} 3{Porto, Turin} {ski, snowboard} {meat} 3{Porto, Turin} {surf, beach volley} {meat} 1{Porto, Turin} {surf, beach volley} {fish} 5
Table 2: Summarization using the original Tax-onomies
City Main Sport Type of cooking Count{Denver, Turin} {ski, snowboard} {meat} 8{Denver, Turin} {ski, snowboard} {fish} 1{Porto, Miami} {surf, beach volley} {meat} 2{Porto, Miami} {ski, beach volley} {fish} 9
Table 3: Summarization using the contextual Tax-onomy for the attribute City and the original Tax-onomy for the attribute Main Sport
we obtain a more compressed and still informative table. Inparticular we observe that, intuitively, this summarizationcaptures the knowledge behind the data, and the contextdependent information coming from them.
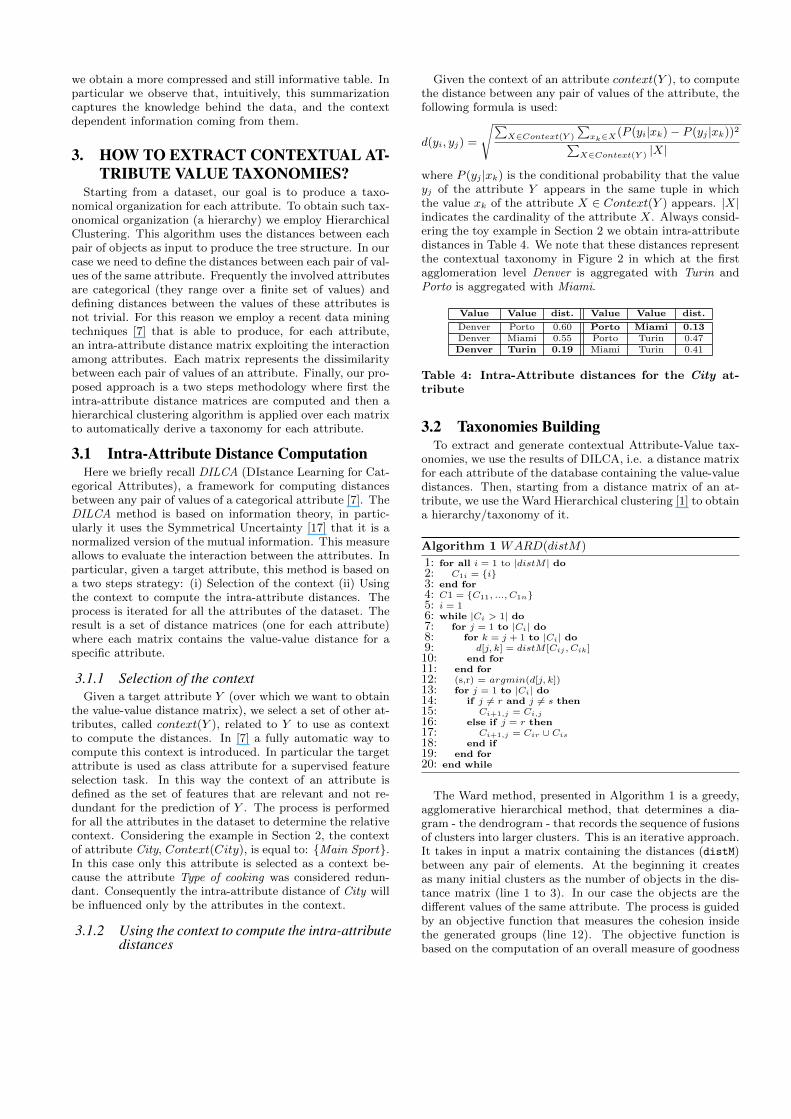
3. HOW TO EXTRACT CONTEXTUAL AT-TRIBUTE VALUE TAXONOMIES?
Starting from a dataset, our goal is to produce a taxo-nomical organization for each attribute. To obtain such tax-onomical organization (a hierarchy) we employ HierarchicalClustering. This algorithm uses the distances between eachpair of objects as input to produce the tree structure. In ourcase we need to define the distances between each pair of val-ues of the same attribute. Frequently the involved attributesare categorical (they range over a finite set of values) anddefining distances between the values of these attributes isnot trivial. For this reason we employ a recent data miningtechniques [7] that is able to produce, for each attribute,an intra-attribute distance matrix exploiting the interactionamong attributes. Each matrix represents the dissimilaritybetween each pair of values of an attribute. Finally, our pro-posed approach is a two steps methodology where first theintra-attribute distance matrices are computed and then ahierarchical clustering algorithm is applied over each matrixto automatically derive a taxonomy for each attribute.
3.1 Intra-Attribute Distance ComputationHere we briefly recall DILCA (DIstance Learning for Cat-
egorical Attributes), a framework for computing distancesbetween any pair of values of a categorical attribute [7]. TheDILCA method is based on information theory, in partic-ularly it uses the Symmetrical Uncertainty [17] that it is anormalized version of the mutual information. This measureallows to evaluate the interaction between the attributes. Inparticular, given a target attribute, this method is based ona two steps strategy: (i) Selection of the context (ii) Usingthe context to compute the intra-attribute distances. Theprocess is iterated for all the attributes of the dataset. Theresult is a set of distance matrices (one for each attribute)where each matrix contains the value-value distance for aspecific attribute.
3.1.1 Selection of the contextGiven a target attribute Y (over which we want to obtain
the value-value distance matrix), we select a set of other at-tributes, called context(Y ), related to Y to use as contextto compute the distances. In [7] a fully automatic way tocompute this context is introduced. In particular the targetattribute is used as class attribute for a supervised featureselection task. In this way the context of an attribute isdefined as the set of features that are relevant and not re-dundant for the prediction of Y . The process is performedfor all the attributes in the dataset to determine the relativecontext. Considering the example in Section 2, the contextof attribute City, Context(City), is equal to: {Main Sport}.In this case only this attribute is selected as a context be-cause the attribute Type of cooking was considered redun-dant. Consequently the intra-attribute distance of City willbe influenced only by the attributes in the context.
3.1.2 Using the context to compute the intra-attributedistances
Given the context of an attribute context(Y ), to computethe distance between any pair of values of the attribute, thefollowing formula is used:
d(yi, yj) =
��X∈Context(Y )
�xk∈X(P (yi|xk)− P (yj |xk))2�
X∈Context(Y ) |X|
where P (yj |xk) is the conditional probability that the valueyj of the attribute Y appears in the same tuple in whichthe value xk of the attribute X ∈ Context(Y ) appears. |X|indicates the cardinality of the attribute X. Always consid-ering the toy example in Section 2 we obtain intra-attributedistances in Table 4. We note that these distances representthe contextual taxonomy in Figure 2 in which at the firstagglomeration level Denver is aggregated with Turin andPorto is aggregated with Miami.
Value Value dist. Value Value dist.
Denver Porto 0.60 Porto Miami 0.13Denver Miami 0.55 Porto Turin 0.47Denver Turin 0.19 Miami Turin 0.41
Table 4: Intra-Attribute distances for the City at-tribute
3.2 Taxonomies BuildingTo extract and generate contextual Attribute-Value tax-
onomies, we use the results of DILCA, i.e. a distance matrixfor each attribute of the database containing the value-valuedistances. Then, starting from a distance matrix of an at-tribute, we use the Ward Hierarchical clustering [1] to obtaina hierarchy/taxonomy of it.
Algorithm 1 WARD(distM)
1: for all i = 1 to |distM | do2: C1i = {i}3: end for4: C1 = {C11, ..., C1n}5: i = 16: while |Ci > 1| do7: for j = 1 to |Ci| do8: for k = j + 1 to |Ci| do9: d[j, k] = distM [Cij , Cik]10: end for11: end for12: (s,r) = argmin(d[j, k])13: for j = 1 to |Ci| do14: if j �= r and j �= s then15: Ci+1,j = Ci,j
16: else if j = r then17: Ci+1,j = Cir ∪ Cis
18: end if19: end for20: end while
The Ward method, presented in Algorithm 1 is a greedy,agglomerative hierarchical method, that determines a dia-gram - the dendrogram - that records the sequence of fusionsof clusters into larger clusters. This is an iterative approach.It takes in input a matrix containing the distances (distM)between any pair of elements. At the beginning it createsas many initial clusters as the number of objects in the dis-tance matrix (line 1 to 3). In our case the objects are thedifferent values of the same attribute. The process is guidedby an objective function that measures the cohesion insidethe generated groups (line 12). The objective function isbased on the computation of an overall measure of goodness

of each candidate clustering solution. At each step i, the twoclusters that increase the overall global measure are merged(from line 13 to line 19). In the process, all the candidatesolutions are computed but the best one is determined bythe minimum increase in the objective function (line 12).At the end of the process a hierarchy of the original valuesis then obtained. Using this procedure we are able to ob-tain, in a fully unsupervised way, a hierarchical organizationof the values of an attribute. We perform the hierarchicalclustering for each attribute of the dataset.
4. EXPERIMENTAL STUDIESIn this section we validate our approach using two distinct
and complementary ways. Firstly, we exploit the CAVTsinto two different tasks: the sequential pattern mining prob-lem, for which we employ the M3SP method [12] and thedata summarization task in which we adapt the algorithmpresented in [13] to perform this analysis. In both tasks wecompare the results obtained using the original hierarchieswith the ones obtained using CAVTs. Secondly, in collab-oration with data experts, we analyzed the quality of theextracted CAVTs. Beforehand, we start this section witha description of the real datasets used for the experimenta-tions.
4.1 Description of the DatasetsThe Mali dataset represents 980 farmers in the Mali state.
For each farm, the dataset stores both time series informa-tion and static information. Time series information repre-sents typical measurement for agricultural surveillance overcultivated area. In this particular dataset five different in-dicators are considered. Each time series is built over 11different timestamps obtained by monitoring the differentzones for one year. For the static information associated toeach farm, 5 attributes are used (soil type, distance to thevillage, distance to the river, rainfall, ethnic group). TheCAVTs are derived over the 5 static attributes.
The Adult dataset comes from a publicly available repos-itory2. It is based on census data and has been widely usedto evaluate classification and k-anonymization algorithms.Here, the same settings as in [8] are used. We obtain adataset of 8 attributes. The attribute age is discretized in8 equal-size bins. Starting from this dataset we sample 10%of the original dataset obtaining 4 522 tuples. As originalhierarchies we use the taxonomies supplied in [8]. In thisdataset the CAVTs are derived over all the 8 attributes.
4.2 CAVT for the Sequential Pattern MiningHierarchies are more and more considered in frequent pat-
tern mining techniques since they allow to capture the gen-eral trends over a given dataset at different levels of granular-ities. In particular, recent works (e.g., [12],[10]) focused onexploiting hierarchies to enhance the multidimensional se-quential pattern mining problem. Here, it should be noticedthat we restrict the definition of sequential patterns sincewe considering sequences of (multidimensional) items onlyas input data. More precisely, manipulated sequences areon the form <(e1)...(el)> where ei represents a multidimen-sional item at time i. The pattern mining algorithms extractmultidimensional sequences that each represents a subset ofthe dataset. The minimum size of this subset is given by
2http://archive.ics.uci.edu/ml/
a numerical user-defined threshold: the minimum support
value, minSupp. The benefit of taking attribute hierarchiesinto account is to make possible the extraction of longerand more descriptive sequences. For instance, given the hi-erarchies defined in Figure 1, the item (Porto, Surf)3 maynot be considered as frequent and will be thus disregardedwhereas the item (Europe, Surf) could be frequent since itrepresents all the european cities where surf is played. Here,we consider the benefits of using CAVTs in order to extractsuch kinds of sequences. To extract multidimensional multi-level frequent sequences we use the M3SP algorithm [12].This algorithm is able to take into account the hierarchicalknowledge. In our experiments we compare two differentways to obtain such knowledge. The first one is supplied byour method and is denoted M3SPCAV T . The second one in-corporates hierarchies supplied by an expert and is denotedM3SPEXP . In the experiment we ran M3SP with a supportthreshold varying between 50% to 90% by step 10%. Toevaluate the obtained results we used two indicators. Thefirst employed measure is the number of extracted patterns.This is equivalent to the size of the result. The results aboutthis experiment are reported in Table 5. This is a good pointbecause we can observe that M3SPCAV T has a distribution,regarding the size of the results, very similar to the oneobtained by M3SPEXP . This underlines the fact that ourmethod supplies hierarchies that, for this experiment, are agood replacement w.r.t. hierarchies given by an expert.
# SequencesMinSupp M3SPEXP M3SPCAV T
50% 105 18360% 46 7570% 28 2780% 12 1890% 12 10
Table 5: Number of patterns extracted from M3SPwith different hierarchical knowledge
The aptitude, of a data mining algorithm, to only ex-tract meaningful and concise results from the data is alwaysan important issue [16]. To do this, the second measure isthe percentage of the sequential patterns with more thanone item over the whole extracted pattern. We considerthis quantity because it represents the true sequential infor-mation in the data. At the same time, with this analysis,we measure the ability of the used hierarchies to capturethe hidden sequential behavior inside the data. The find-ings about this experimentation are reported in Table 6.Comparing M3SPCAV T with M3SPEXP , we can note thatour proposal facilitates the process to mine sequences withmore than one element. This is an appreciable result for thisproblem because the goal is to extract hiding information re-garding the sequential nature of the data. This phenomenais particularly evident for high values of the support thresh-old. These results underline that the extracted CAVTs helpthe mining process performed by M3SP at least as well asthe original taxonomies.
4.3 CAVT for Data SummarizationIn this subsection we analyze the results obtained by CAV Ts
for the data summarization task. The goal of this task, asreported in [3], is to find a compressed representation of
3This item designates the fact that surf is played at Porto.

MinSupp M3SPEXP M3SPCAV T
50% 3.8% 5.46%60% 2.17% 5.33%70% 0% 0%80% 0% 27.77%90% 0% 20.0%
Table 6: Percentage of sequences extracted fromM3SP with different hierarchical knowledge
MinGenCAV T MinGenEXP
K Inf. Loss (x103) # tuples Inf. Loss (x103) # tuples10 28.78 67 30.44 5520 35.21 33 718.37 3730 35.21 33 35.36 2240 37.798 18 35.36 2250 34.66 20 35.36 2260 34.87 14 35.36 2270 34.87 14 723.29 1680 34.87 14 723.29 1690 37.25 10 723.29 16100 37.25 10 723.29 16
Table 7: Information Loss and Number of Tu-ples in the compressed table for MinGenCAV T andMinGenEXP
the original table using generalization supplied by the at-tribute value taxonomies. The only constraint is that eachtuple of the compressed table needs to represent at least k
tuples of the original table. Actually this task shares simi-larities to the k-anonymization problem, in which each tupleof the anonymized table needs to represent at least k tuplesof the original table. For this reason we used the algorithmMinGen presented in [13] and originally developed for thek-anonymity problem. We couple this algorithm with bothoriginal available taxonomies (MinGenEXP ) and with ourCAVTs automatically extracted (MinGenCAV T ). The al-gorithm needs two parameters. The first parameter k is theminimum number of tuples indistinguishable over the setof sensitive attributes (quasi-identifiers) [13]. The quasi-identifiers are the attributes for which the generalizationprocess is performed (and the attribute taxonomies is de-manded). In our context we consider all the attributes of theinput table as sensible attributes. We range the k parameterfrom 10 to 100 at step of 10. The second parameter is thesuppression coefficient sc standing for the maximum numberof tuples (in percentage w.r.t. the size of the table) that thealgorithm suppresses to obtain a k-anonymized table. Thisparameter is not common for the table summarization task,but it is a reasonable assumption that the final summaryrepresents the majority of the data and not the whole table.For all this reason we set the suppression coefficient equalsto 1%. To evaluate the quality of the compressed table weadopt the non-uniform entropy measure [6] to quantify theInformation Loss. This measure assumes that the differentvalues of an attribute do not have a uniform distribution.As suggested by the author, this is a more careful way tomeasure the Information Loss. The Information Loss rangesfrom 0 to infinity. The idea is that a good k-anonymization(for this reason also a good summary of an original table) isthe one that minimizes the Information Loss respecting thegiven constraints k and sc.
In Table 7 we show the findings of our analysis. Foreach type of taxonomical knowledge we report the Infor-mation Loss as well as the number of distinct tuples in
the k-anonymized (compressed) table. We can observe thatMinGenCAV T obtains interesting results w.r.t. the origi-nal taxonomies. For instance we notice that for values ofk equal to 20 and greater than 70 the Information Loss ofMinGenCAV T is 20 times lesser than the Information Lossof MinGenEXP . Even when our method obtains lower In-formation Loss compared to the original taxonomies (e.g., kequals to 40) the difference remains very small. About thenumber of different tuples obtained in the compressed table,we note that the number of tuples in MinGenCAV T is evenquite lower than MinGenEXP . In particular MinGenCAV T
obtains less tuples for values of k greater or equal to 40. In-terestingly we note that the Information Loss is not directlyproportional to the number of tuples in the compressed ta-ble. For instance for k = 30, MinGenCAV T produces a com-pressed table of 33 tuples (22 tuples for MinGenEXP ), butit obtains a better value of Information Loss. As a conclu-sion of our analysis, over this dataset, we can state that withthe produced CAV Ts we obtain results at least as well asto the original taxonomies. This means that our method isable to extract the taxonomical information of an attributeusing the whole dataset. This could be useful when: (i) theoriginal taxonomies are too general (i.e., the dataset rep-resents specific information that the original taxonomies donot take into account), (ii) there are no available taxonomiesassociated to the data.
4.4 Qualitative evaluationIn this subsection we describe some of the results about
the extracted CAV Ts from the MALI dataset, from a qual-itative point of view. To obtain hierarchies generated by theexpert we asked to scientist in the field of Agricultural andRemote Sensing Science. The collaboration with scientist inthe domain area allows to compare our CAV Ts with real hi-erarchies. We analyzed the hierarchies to understand if theycan help the analyst to extract some new knowledge from thedata or if the analyst is able to recognize some interestinginformations within the CAV Ts. An example of portion ofthe extracted hierarchy is reported in Figure 3. For visual-ization purpose, we retain only the first two levels of the hi-erarchy. When we supply this representation to the analyst,she has clearly recognized information about the correlationof culture type. For instance, she has recognized that thegroup (a) is correct (i.e., sorgho and mil are very similarplants). This means that they live in similar environment.cotton and corn co-occur in the same group (b) because theyare usually cultivated together. The analyst also recognizesthat in group (c) all the cultivation are related to the humannutrition. Another interesting result is obtained over the at-tribute describing the type of land. The whole contextualtaxonomy is depicted in Figure 4. This attribute can as-sume six different values EC (Drainage land), GR (Gravellyland), GR su (Superficial Gravelly land), SU (SuperficialLand), LIAR (Silty clay) and LISA (Silty sands). When wesupplying this taxonomy, the expert was initially surprisedbecause in spite the taxonomy is different from the classicaltaxonomy presented in the literature, it is always very infor-mative regarding the analyzed datset. This means that whenwe contextualize this hierarchy for the MALI dataset (rurallandscapes and agricultural study) this taxonomy capturesthe intrinsic relationship within the data. For instance, fromtheir structure point of view, the EC and GR types are verydifferent, but they were automatically grouped together be-

cause, in this context, we cannot find cultivation but onlygrass over there. Another automatically detected group isthe one composed by GR su and SU. Both type are charac-teristic of superficial lands and are well adapted to peanutsand rice cultivation. This example emphasizes the useful-ness of the contextual attribute-value taxonomies becausethey are able to structure the values of an attribute takinginto account the context in which this information is used.We obtained similar findings for all the other hierarchiesthat we extract with our approach. It confirms that we areable to extract interesting and meaningful hierarchies in afully automatic and unsupervised way.
MIL,NAT_VEG, SORGHUM
SUGAR_CANE, BLACK_EAYED_PEA, CALABASH, SESAME,
EUCALYPTUS, SWEET_POTATO, MARSH
BARE_SOIL,COTTON,CORN,RICE,GRAV_BARE_SOIL,PEANUT,FOREST,GROVE
(a) (b) (c)
Figure 3: Two levels of the CAV T over the type ofcultivations
Figure 4: CAVT for the type of lands
5. CONCLUSIONThis paper presents a new technique to automatically de-
rive Contextual Attribute-Value Taxonomy (CAVT) fromdata. Through our approach we are able to first extractexisting relationships from categorical data and then auto-matically build taxonomies for each attribute. The approachwas evaluated using a multilevel, multidimensional sequen-tial pattern mining method and a k-anonymity algorithm tosummarize a relational table. The experimentations com-pared with expert taxonomies underline the good qualityof the obtained CAVTs in both tasks. In this way we un-derlined that our approach is not biased by the involvedalgorithm. We also performed an in-depth analysis over theobtained taxonomies showing that our approach is able toextract taxonomies that are related to the hidden knowledgecontained in the data. As future work, we plan to investi-gate the usefulness of CAVTs with other approaches and we
investigate different way to build hierarchies developing newhierarchical clustering techniques driven by the characteris-tics of our method.
6. REFERENCES[1] M. R. Anderberg. Cluster analysis for applications,
1973.[2] M. Ashburner and al. Gene ontology: tool for the
unification of biology. The Gene Ontology Consortium.
Nat Genet., 25(1):25–29, 2000.[3] K. S. Candan, M. Cataldi, and M. L. Sapino.
Reducing metadata complexity for faster tablesummarization. In EDBT, pages 240–251, 2010.
[4] D. Carmel, H. Roitman, and N. Zwerdling. Enhancingcluster labeling using wikipedia. In SIGIR, pages139–146, 2009.
[5] M. desJardins, P. Rathod, and L. Getoor. Bayesiannetwork learning with abstraction hierarchies andcontext-specific independence. In ECML, pages485–496, 2005.
[6] A. Gionis and T. Tassa. K-anonymization withminimal loss of information. IEEE Trans. Knowl.
Data Eng., 21(2):206–219, 2009.[7] D. Ienco, R. G. Pensa, and R. Meo. From context to
distance: Learning dissimilarity for categorical dataclustering. TKDD, to appear, 2012.
[8] V. S. Iyengar. Transforming data to satisfy privacyconstraints. In KDD, pages 279–288, 2002.
[9] R. Kohavi and F. Provost. Applications of datamining to electronic commerce. Data Min. Knowl.
Discov., 5(1/2):5–10, 2001.[10] H. Pinto, J. Han, J. Pei, K. Wang, Q. Chen, and
U. Dayal. Multi-dimensional sequential patternmining. In CIKM, pages 81–88, 2001.
[11] Y. Pitarch, C. Favre, A. Laurent, and P. Poncelet.Context-aware generalization for cube measures. InDOLAP, pages 99–104, 2010.
[12] M. Plantevit, A. Laurent, D. Laurent, M. Teisseire,and Y. W. Choong. Mining multidimensional andmultilevel sequential patterns. TKDD, 4(1), 2010.
[13] P. Samarati. Protecting respondents’ identities inmicrodata release. IEEE Trans. Knowl. Data Eng.,13(6):1010–1027, 2001.
[14] J. H. T. Berners-Lee and O. Lassila. The semanticweb. Scientific American, 2001.
[15] P. Treeratpituk and J. P. Callan. An experimentalstudy on automatically labeling hierarchical clustersusing statistical features. In SIGIR, pages 707–708,2006.
[16] J. Vreeken, M. van Leeuwen, and A. Siebes. Krimp:mining itemsets that compress. Data Min. Knowl.
Discov., 23(1):169–214, 2011.[17] L. Yu and H. Liu. Feature selection for
high-dimensional data: A fast correlation-based filtersolution. In ICML, pages 856–863, 2003.
[18] J. Zhang and V. Honavar. Avt-nbl: An algorithm forlearning compact and accurate naıve bayes classifiersfrom attribute value taxonomies and data. In ICDM,pages 289–296, 2004.