Stated or inferred attribute non-attendance? A simulation approach
17
Economía Agraria y Recursos Naturales. ISSN: 1578-0732. e-ISSN: 2174-7350. Vol. 13, 1. (2013). pp. 51-67 Stated or inferred attribute non-attendance? A simulation approach Petr Mariel a , David Hoyos a and Jürgen Meyerhoff b 12 a Departamento de Economía Aplicada III (Econometría y Estadística), Universidad del País Vasco UPV/EHU. b Institute for Landscape Architecture and Environmental Planning, Technical University of Berlin. Acknowledgments: The authors acknowledge financial support from the Department of the Environment of the Basque Government, and from the Department of Education of the Basque Government, through grant IT-642-13 (UPV/EHU Econometrics Research Group), Universidad del País Vasco UPV/EHU un- der research grants UFI11/03, US12/09 and EHUA12/13, as well as from the German Federal Ministry of Education and Research, funding the research project, ‘Conflicts of interest over wind power: Part II choice experiments’ (Grant no. 01UN0601B). Dirigir correspondencia a: Petr Mariel. E-mail: [email protected]. Recibido en enero de 2013. Aceptado en mayo de 2013. ABSTRACT: In the last few years, there has been a growing body of literature on how to detect and deal with the fact that some respondents seem to ignore one or more attributes in a discrete choice experi- ments. This paper aims to analyse the performance of two econometric approaches devoted to solve this problem: the stated attribute non-attendance approach and the inferred attribute non-attendance approach. These approaches are examined further by two common ways of collecting information on attribute non- attendance: serial and choice task non-attendance. The results of the simulation experiments show firstly, that choice task non-attendance of one attribute causes biases in the estimation of all other parameters; and, secondly, that only serial non-attendance can be inferred successfully. The results are policy relevant because not treating, or treating this issue incorrectly may end up in biased welfare measures. KEYWORDS: Attribute non-attendance, choice modelling, environmental valuation, random parameter logit. JEL classification: Q51. ¿No-atención a atributos declarada o inferida? Un enfoque de simulación RESUMEN: Durante los últimos años se han publicado numerosos estudios sobre cómo detectar y tratar el hecho de que algunas personas encuestadas parecen ignorar uno o más atributos en experimentos de elección discreta. Este artículo pretende analizar la efectividad de dos enfoques econométricos propues- tos para resolver este problema: el enfoque de no-atención a atributos declarada, y el enfoque de no-aten- ción a atributos inferida. La fiabilidad de ambos enfoques es posteriormente comparada en dos modos habituales de recoger información sobre no-atención a atributos. Los resultados de los experimentos de simulación muestran en primer lugar, que la no atención específica a un atributo conlleva estimaciones sesgadas del resto de parámetros y, en segundo lugar, que tan sólo la no-atención serial puede ser inferida satisfactoriamente. Los resultados tienen relevancia de política económica puesto que no tratar o tratar incorrectamente este problema puede conllevar medidas de bienestar sesgadas. PALABRAS CLAVES: No-atención a atributos, modelos de elección, valoración medioambiental, logit de parámetros aleatorios. Clasificación JEL: Q51. DOI: 10.7201/earn.2013.01.03. DOI: 10.7201/earn.2013.01.03.
-
Upload
independent -
Category
Documents
-
view
1 -
download
0
Transcript of Stated or inferred attribute non-attendance? A simulation approach
Economía Agraria y Recursos Naturales. ISSN: 1578-0732. e-ISSN: 2174-7350. Vol. 13, 1. (2013). pp. 51-67
Stated or inferred attribute non-attendance? A simulation approach
Petr Mariela, David Hoyosa and Jürgen Meyerhoffb 12
a Departamento de Economía Aplicada III (Econometría y Estadística), Universidad del País Vasco UPV/EHU.b Institute for Landscape Architecture and Environmental Planning, Technical University of Berlin.
Acknowledgments: The authors acknowledge financial support from the Department of the Environment of the Basque Government, and from the Department of Education of the Basque Government, through grant IT-642-13 (UPV/EHU Econometrics Research Group), Universidad del País Vasco UPV/EHU un-der research grants UFI11/03, US12/09 and EHUA12/13, as well as from the German Federal Ministry of Education and Research, funding the research project, ‘Conflicts of interest over wind power: Part II choice experiments’ (Grant no. 01UN0601B).
Dirigir correspondencia a: Petr Mariel. E-mail: [email protected].
Recibido en enero de 2013. Aceptado en mayo de 2013.
ABSTRACT: In the last few years, there has been a growing body of literature on how to detect and deal with the fact that some respondents seem to ignore one or more attributes in a discrete choice experi-ments. This paper aims to analyse the performance of two econometric approaches devoted to solve this problem: the stated attribute non-attendance approach and the inferred attribute non-attendance approach. These approaches are examined further by two common ways of collecting information on attribute non-attendance: serial and choice task non-attendance. The results of the simulation experiments show firstly, that choice task non-attendance of one attribute causes biases in the estimation of all other parameters; and, secondly, that only serial non-attendance can be inferred successfully. The results are policy relevant because not treating, or treating this issue incorrectly may end up in biased welfare measures.
KEYWORDS: Attribute non-attendance, choice modelling, environmental valuation, random parameter logit.
JEL classification: Q51.
¿No-atención a atributos declarada o inferida? Un enfoque de simulación
RESUMEN: Durante los últimos años se han publicado numerosos estudios sobre cómo detectar y tratar el hecho de que algunas personas encuestadas parecen ignorar uno o más atributos en experimentos de elección discreta. Este artículo pretende analizar la efectividad de dos enfoques econométricos propues-tos para resolver este problema: el enfoque de no-atención a atributos declarada, y el enfoque de no-aten-ción a atributos inferida. La fiabilidad de ambos enfoques es posteriormente comparada en dos modos habituales de recoger información sobre no-atención a atributos. Los resultados de los experimentos de simulación muestran en primer lugar, que la no atención específica a un atributo conlleva estimaciones sesgadas del resto de parámetros y, en segundo lugar, que tan sólo la no-atención serial puede ser inferida satisfactoriamente. Los resultados tienen relevancia de política económica puesto que no tratar o tratar incorrectamente este problema puede conllevar medidas de bienestar sesgadas.
PALABRAS CLAVES: No-atención a atributos, modelos de elección, valoración medioambiental, logit de parámetros aleatorios.
Clasificación JEL: Q51.
DOI: 10.7201/earn.2013.01.03.
DOI: 10.7201/earn.2013.01.03.

52 P. Mariel, D. Hoyos and J. Meyerhoff
1. Introduction
The Choice Modelling (CM) methodology is a fast-growing environmental valua-tion technique, involving the generation and analysis of choice data through the con-struction of a hypothetical market using a survey. CM consists of several choice sets, each containing a set of mutually exclusive hypothetical alternatives, between which respondents are asked to choose their preferred one. Its theoretical basis can be found in Lancaster’s (1966) characteristics theory of demand. The approach to preference elicitation is similar to the choice-based approach to consumer theory, because it is assumed explicitly that respondents’ observed choices in the experiment reveal the preferences of the individuals. Finally, by applying different econometric models, the contribution that each attribute and level add to the overall utility of individuals can be estimated. Initially developed by Louviere and Hensher (1982) and Louviere and Woodworth (1983), the first application of a CM in the context of environmental resources was reported by Adamowicz et al. (1994). Since then, the number of ap-plications has increased significantly and CM has become a popular stated preference method for environmental valuation (see Hoyos, 2010 for a review).
In parallel with this development, several methodological questions have been raised in the literature, concerning the accuracy of willingness to pay (WTP) es-timates derived from CM. Among them, information-processing rules, including whether individuals take into account all attributes when choosing among alternatives –known as attribute non-attendance (AN-A)– have attracted increasing attention. Several studies have provided evidence that respondents do not take into account all attributes when making choices, and that this issue influences WTP estimates signifi-cantly. Hensher et al. (2005) were among the first to investigate the implications of ignored attributes explicitly. After a sequence of choice tasks, they asked respondents whether they had taken all attributes into account, or whether they had ignored some while choosing among alternatives. In line with the results obtained by Hensher et al. (2007) and Campbell et al. (2008), these authors found that not accounting for AN-A results in significantly higher WTP estimates. This first approach, where economet-ric models are informed about non-attended attributes by including the information given by respondents, is known as stated attribute non-attendance (SAN-A).
Subsequent studies have investigated whether asking respondents for stated at-tribute non-attendance is reliable or introduces another source of bias (Scarpa et al., 2009; Hensher and Greene, 2010; Campbell et al., 2011). In this body of literature, rather than using information provided explicitly by respondents, non-attendance is inferred by the data. Studies following this second approach –known as inferred attribute non-attendance (IAN-A)– have reported that the level of non-attendance found in both approaches differs, and that respondents might pay attention to at-tributes even if they state that they have not attended to them. Hess and Hensher (2010) have proposed an alternative approach for inferring non-attendance. They use mixed logit models with continuous distributions, and derive respondent-specific coefficients through conditioning on observed choices. Non-attendance is inferred by post-estimation conditioning approaches and it is found to be more accurate than

Stated or inferred attribute non-attendance? A simulation approach... 53
the SAN-A approach. Also, Alemu et al. (2012) found that respondents do not ignore attributes completely, even if they claimed so in the survey. In a recent comparison between Hess and Hensher’s (2010) and constrained latent class models approaches, Scarpa et al. (2012) found similar results, although the authors argue that, based on empirical fit, the constrained latent class model seems to outperform its competitor approach, based on continuous mixing of taste.
A second topic that emerged in parallel with the literature regarding AN-A is whether, when moving through a sequence of choice sets, respondents always ignore the same attributes (serial non-attendance), or whether the attributes ignored by re-spondents differ across choice situations (choice task non-attendance). Although all available studies indicate that respondents do not always ignore the same attributes in a choice experiment (Puckett and Hensher, 2009; Meyerhoff and Liebe, 2009; Scarpa et al., 2010), this topic has not received specific attention in the context of the stated and inferred approaches to AN-A.
This paper aims to contribute to the literature on attribute non-attendance by ana-lysing the performance of two econometric approaches for solving this issue: incor-porating stated information from the respondents (i.e. SAN-A approach); or inferring from the data that an attribute has not been attended to (i.e. IAN-A approach). The performance of these two approaches is further tested by using two common ways of collecting information on attribute non-attendance: serial and choice task non-attendance. Starting with the SAN-A approach, simulated data is generated and used to investigate the effects of choice task and serial non-attendance to one attribute, on the properties of all estimated parameters. Subsequently, the reliability of the IAN-A approach presented by Hess and Hensher (2010) is assessed both under serial and choice task non-attendance.
The remainder of the paper is structured as follows: Section 2 describes how the simulation experiments were designed; next, Section 3 reports the main results found in this research; and finally, Section 4 concludes by summarising the main findings of the paper.
2. Methodology
The analysis presented in this paper aims at addressing various issues related to AN-A in a typical choice model used in environmental valuation, through a set of simulation exercises. First of all, we explore the effects of not taking into account non-attended attributes on the properties of the estimator of the parameters. These results are compared to the case in which the stated information on choice task and on serial non-attendance is included in the estimation procedure.
As mentioned before, choice task non-attendance information refers to the case where, after each choice task, respondents are asked whether they have ignored any attribute in the choice set. Serial non-attendance, on the other hand, refers to the case where respondents are asked if they have ignored any attribute after having re-

54 P. Mariel, D. Hoyos and J. Meyerhoff
sponded all choice tasks. In this case, the possible structure of non-attendance is the same in all choice situations presented to each respondent.
The second issue analysed in this paper is the performance of the analytical approach to treat AN-A, proposed by Hess and Hensher (2010). In this IAN-A ap-proach, AN-A is inferred by the data through the use of econometric modelling. More specifically, the detection of attribute non-attendance is based on respondent-specific coefficient distributions, obtained through conditioning on observed choices.
The simulation experiments designed for this research are based on a model at-tempting to generate a typical choice model used in environmental valuation. For this purpose, it includes three alternatives, status quo (SQ) and two unlabelled alterna-tives (ALT1, ALT2), each containing four attributes (three environmental attributes and the cost attribute) with 5, 3, 3 and 4 levels, respectively. Table 1 summarises the attributes and levels considered in the design.
TABLE 1
Levels and attributes
Attribute 1 (ATTR1) Attribute 2 (ATTR2) Attribute 3 (ATTR3) Cost (COST)
0 -1 -1 0
20 0 0 30
40 1 1 60
60 90
80
Source: Own elaboration.
The utility functions are assumed to be linear in attributes and they are defined as:
[1]
where all e are iid random variables following Extreme Value distribution, with location parameter equal to 0 and scale parameter equal to 1. In the simplest setting analysed here, parameter 1β is random and the remaining parameters are fixed and set to the following values, taking into account the scale and range of the levels of all attributes:

Stated or inferred attribute non-attendance? A simulation approach... 55
β0 β1 β2 β3 β4
1.0 N(0.1,0.05) 1.0 1.0 -0.1
A factorial experimental design for the attributes and levels defined above, with 15 rows and divided into 3 blocks, was used for the simulation purposes. The goal of the first part of the simulation exercises is to analyse the effect of AN-A on parameter estimates under different non-attendance situations. For this purpose, it is assumed that the first attribute (ATTR1) is not attended by our hypothetical respondents, and the assumed non-attendance percentages are 20%, 40% and 60%. Therefore, we generate several non-attendance scenarios: in the first scenario, 20% of the respond-ents ignore attribute 1; in the second scenario, 40% of the respondents ignore this attribute; and in the last scenario, the percentage of non-attending respondents is 60%. AN-A is modelled by setting the parameter 1β to zero for 20%, 40% and 60% of individuals, as assumed by the SAN-A approach (i.e. as if 20%, 40% and 60% of the respondents would have stated that they were ignoring the first attribute). In all simulation exercises presented in this paper, 750 hypothetical responses were gener-ated 300 times, and each hypothetical respondent answered five choice tasks.
3. Results
We start our simulation experiments by specifying a random parameter logit (RPL) model based on 300 hypothetical data sets generated according to equation [1]. In this RPL setting, the effects of AN-A are analysed assuming that the re-searcher has collected stated information on the level of attendance by respondents. In the first subsection, the consequences of non-treating AN-A is analysed. Next, subsections 2 and 3 explore the performance of the SAN-A and IAN-A approaches aiming to solve, respectively, choice task and serial AN-A.
3.1. Non treating choice task and serial non-attendance
Figure 1 presents the results of the RPL model based on equation [1] when no action to treat the non-attendance is taken. These plots depict, in a convenient way, the five-number summaries (minimum, lower quartile, median, upper quartile and maximum) of the four coefficients’ estimations, corresponding to 300 different hypo-thetical data sets.
The five graphs in the upper part of the figure correspond to the case of choice task non-attendance to the first attribute. In this case, the 20%, 40% and 60% of not fully attended responses are distributed randomly among respondents. Thus, in a se-ries of five responses of one individual, there can be none, one or more choice tasks with a non-attended first attribute. In the case of 60% of non-attendance, almost all respondents present at least one choice task with a non-attended first attribute. As

56 P. Mariel, D. Hoyos and J. Meyerhoff
shown in this figure, the estimated parameters in the full attendance case are centred on their true values; that is, the darkest box-plots are centred on true values = 0.1, st.dev.( ) = 0.05, = 1.0, = 1.0, = -0.1. The lighter box-plots represent the empirical distributions of the estimated parameters when no action to treat the AN-A of the first attribute is taken. As can be observed, the bias increases with the percent-age of non-attendance. An important conclusion from this upper part of Figure 1 is that a choice task non-attendance of one attribute causes bias in estimation of all parameters.
In contrast, the five graphs in the lower part of Figure 1 correspond to serial non-attendance to the first attribute, which means that there are 20%, 40% and 60% of re-spondents not attending to the first attribute in all their responses. It basically shows that the empirical distributions of the estimated parameters corresponding to fully attended attributes are not biased in this case. In other words, the non-treated choice task non-attendance also causes bias in coefficients of fully attended attributes, but serial AN-A only biases the coefficient of the non-attended attribute. This result is explained by the different ways in which ignored attributes in the serial AN-A are distributed among respondents, as there are 20%, 40% and 60% of respondents not attending the first attribute in all their choice tasks.
In order to explain the difference between the upper and lower part of Figure 1 in-tuitively, let us assume a multiple regression model , where
0.2,0.2,1 210 === γγγ and )1,0(~ Niidui . Figure 2 presents 1,000 observations generated by this scheme, in which 0.01 =γ for 10% of observations (dark points). The true plane depicted in Figure 1, and defined as , will not be estimated correctly if we use all generated observations. Let us, therefore, as-sume that every ten observations belong to one individual (similar to panel data set-ting in the choice model described above). We use these ten observations of each in-dividual for estimation of individual coefficients, and then average these coefficients to get final estimations of our unknown coefficients.
We get completely different results if the observations are spread randomly among dark and light observations (choice task AN-A) to those obtained if all the dark observations only belong to a subset of individuals (serial AN-A). In the first case, the individual slope coefficients 1γ and 2γ will be estimated with bias, as the estimated individual planes would be adjusted to observations placed randomly in the two subsets (dark and light points).
However, if we estimate individual coefficients only using observations from one subset of data (dark or light), we would get unbiased estimates of the two slope coef-ficients for data from the light subset and unbiased estimation of 1γ , but biased esti-mation of 2γ for data from the dark subset of data. The averaging of these individual coefficients coming from the two subsets of data would lead to exactly the same results observed in Figure 1 for serial AN-A; that is, unbiased estimation of 2γ (fully attended attributes ATTR2, ATTR3 and ATTR4 in Figure 1) and biased estimation of
1γ (non-attended attribute ATTR1 in Figure 1).

Stated or inferred attribute non-attendance? A simulation approach... 57
Cho
ice
task
non
-att
enda
nce
0.04
0.06
0.08
0.10
0.12
ATTR1 60
%40
%20
%Fu
ll atte
ndan
ce
0.01
0.02
0.03
0.04
0.05
0.06
ATTR1(st.dev.)
0.0
0.5
1.0
ATTR2
0.0
0.2
0.4
0.6
0.8
1.0
1.2
1.4
ATTR3
-0.1
2-0
.10
-0.0
8-0
.06
-0.0
4
COST
Seri
al n
on-a
tten
danc
e
0.00
0.05
0.10
0.15
ATTR1
60%
40%
20%
Full a
ttend
ance
0.03
0.04
0.05
0.06
0.07
0.08
0.09
ATTR1(st.dev.)
0.4
0.6
0.8
1.0
1.2
1.4
ATTR2
0.6
0.8
1.0
1.2
1.4
ATTR3
-0.1
2-0
.11
-0.1
0-0
.09
-0.0
8
COST
FIG
UR
E 1
RPL
, AT
TR
1 no
n-at
tend
ed, N
o no
n-at
tend
ance
cor
rect
ion
Sour
ce: O
wn
elab
orat
ion.

58 P. Mariel, D. Hoyos and J. Meyerhoff
FIGURE 2
Multiple regression model data with one zero slope coefficient for 10% of data
Source: Own elaboration.
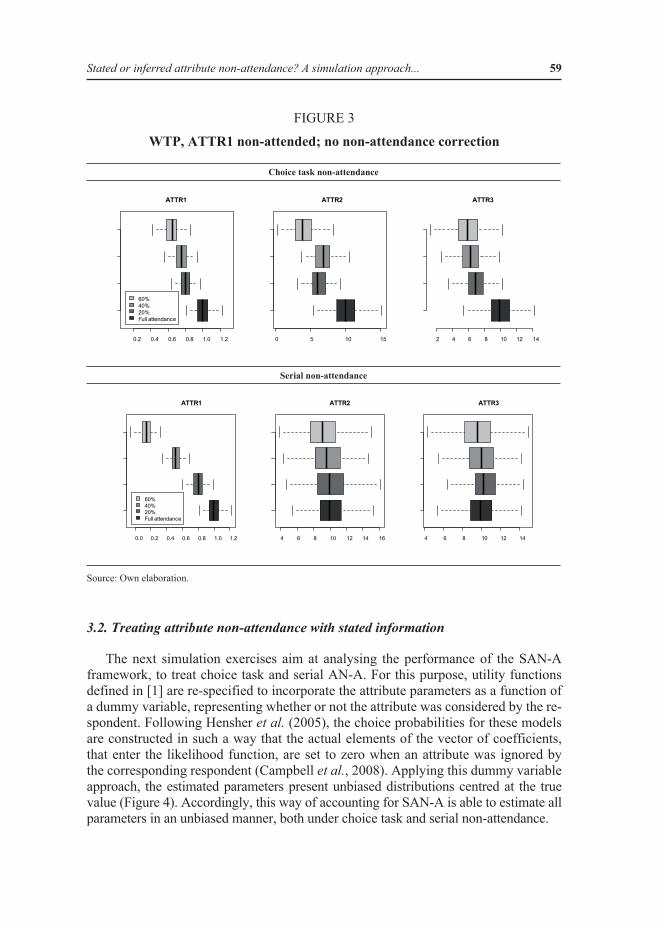
The previous results can be discussed further in terms of their implications for the calculation of welfare measures. Figure 3 presents willingness-to-pay (WTP) values corresponding to the estimations presented in Figure 1. It can be clearly seen that the empirical distribution of the three WTP values are biased, and that they are not centred on the true values 1, 10, and 10, respectively, in the case of choice task AN-A. The bias obviously increases with the percentage of AN-A, similar to the bias observed for the coefficient estimations. In the case of serial AN-A, WTP values of fully attended attributes are centred on true values, whilst bias is observed only for the non-attended attribute.
X1
0246810
X2
02
4
6
8
10
Y
10
20
30
40
Stated or inferred attribute non-attendance? A simulation approach... 59
FIGURE 3
WTP, ATTR1 non-attended; no non-attendance correction
Choice task non-attendance
0.2 0.4 0.6 0.8 1.0 1.2
ATTR1
60%40%20%Full attendance
0 5 10 15
ATTR2
2 4 6 8 10 12 14
ATTR3
Serial non-attendance
0.0 0.2 0.4 0.6 0.8 1.0 1.2
ATTR1
60%40%20%Full attendance
4 6 8 10 12 14 16
ATTR2
4 6 8 10 12 14
ATTR3
Source: Own elaboration.
3.2. Treating attribute non-attendance with stated information
The next simulation exercises aim at analysing the performance of the SAN-A framework, to treat choice task and serial AN-A. For this purpose, utility functions defined in [1] are re-specified to incorporate the attribute parameters as a function of a dummy variable, representing whether or not the attribute was considered by the re-spondent. Following Hensher et al. (2005), the choice probabilities for these models are constructed in such a way that the actual elements of the vector of coefficients, that enter the likelihood function, are set to zero when an attribute was ignored by the corresponding respondent (Campbell et al., 2008). Applying this dummy variable approach, the estimated parameters present unbiased distributions centred at the true value (Figure 4). Accordingly, this way of accounting for SAN-A is able to estimate all parameters in an unbiased manner, both under choice task and serial non-attendance.

60 P. Mariel, D. Hoyos and J. Meyerhoff
Cho
ice
task
non
-att
enda
nce
0.08
0.10
0.12
ATTR1
60%
40%
20%
Full a
tt.
0.02
0.04
0.06
0.08
ATTR1(st.dev.)
0.4
0.8
1.2
1.6
ATTR2
0.4
0.8
1.2
1.6
ATTR3
-0.1
3-0
.11
-0.0
9-0
.07
COST
Seri
al n
on-a
tten
danc
e
0.06
0.10
0.14
ATTR1
60%
40%
20%
Full a
tt.
0.02
0.04
0.06
0.08
ATTR1(st.dev)
0.4
0.8
1.2
1.6
ATTR2
0.4
0.8
1.2
1.6
ATTR3
-0.1
3-0
.11
-0.0
9-0
.07
COST
FIG
UR
E 4
RPL
, AT
TR
1 no
n-at
tend
ed, a
ccou
ntin
g fo
r SA
N-A
Sour
ce: O
wn
elab
orat
ion.

Stated or inferred attribute non-attendance? A simulation approach... 61
3.3. Treating attribute non-attendance with inferred information
This last subsection focuses on the performance of the IAN-A approach, both under serial and choice task AN-A. Data sets used for these exercises are the same as in the previous section. However, the objective now is to infer non-attendance in the first at-tribute and compare it to the true non-attendance generated in hypothetical data sets.
The analytical approach for inferring AN-A is the method proposed by Hess and Hensher (2010). These authors propose the use of a coefficient of variation –i.e., the ratio between the standard deviation and the mean of the conditional distribution (which is an inverse of classical t-statistics for the testing of parameter significance)– in order to infer the existence of a non-attended attribute. The rationale is that a high coefficient of variation related to a low conditional mean indicates non-attendance of a particular attribute. Hess and Hensher (2010) propose a trial and conservative threshold value of 2 for the coefficient of variation, so that individuals with a coef-ficient of variation above this value are assumed to have ignored the attribute.
Our simulation experiment is devoted to analysing the validity of the proposed trial value of 2 in a hypothetical choice experiment. The added value of this exercise lies in the fact that, besides applying it to serial non-attendance such as Hess and Hensher (2010), we also apply it to choice task non-attendance, and compare the ef-fects on both.
In order to analyse the performance of this approach, as well as the validity of the proposed threshold value of 2, model [1] is used again to generate hypothetical re-sponses under the same conditions as described above. In each of the 300 iterations, the ratio between the mean of the conditional distribution and the standard deviation of the estimated random parameter of ATTR1 is computed (that is, the coefficient of variation is inversed here), and used to decide whether the particular respondent is allocated to the section of the sample that is ignoring the attribute. According to Hess and Hensher (2010), values lower than 0.5 (inverse of the proposed threshold of 2) indicate that the respondent ignored the corresponding attribute. To check the validity of the critical value 2, we assume different values in the range of 0.5 and 3.5, and assess their influence on the performance of this approach. Subsequently, we compute the number of times that the inferred approach predicts a non-attended attribute correctly (see Table 2). If this procedure performs well, we would expect the coincidence rate to be close to 100%. The highest percentage value in each row is highlighted in bold.

62 P. Mariel, D. Hoyos and J. Meyerhoff
TABLE 2
Coincidence between true and inferred non-attendance (Serial A-NA)
%Critical Value
0.5 1.0 1.5 2.0 2.5 3.0 3.5
Full attendance 96.98 94.07 92.19 89.13 85.16 77.37 61.72
20% of non-att. 88.96 90.17 89.90 88.13 84.35 69.69 58.15
40% of non-att. 67.30 84.63 90.28 89.98 85.79 75.22 65.07
60% of non-att. 43.14 75.50 92.55 93.11 89.49 84.47 78.70
Source: Own elaboration.
The percentages of coincidence between true and inferred serial non-attendance indicate that the critical values depend on the level of non-attendance of a given attribute. Obviously, in order to find out more precise critical values, a denser grid would be required, but that is not the goal of this simulation experiment. The goal is rather to examine the stability of the threshold value in different choice experiment settings. Correspondingly, the above results indicate that accurate critical values are case-specific (i.e. they depend on the actual level of non-attendance).
A general conclusion that can be drawn from Table 2 is thus that the critical val-ues for the ratio between the mean of the conditional distribution and the standard deviation, leading to maximum coincidence, gets bigger with an increasing percent-age of non-attendance. Thus, the threshold value 0.5 proposed by Hess and Hensher (2010) seems to be valid only for low levels of AN-A, but it should be higher if the level of AN-A increases.
The last set of simulation exercises, presented in Table 3, analyses whether the performance of the IAN-A approach is similar under choice task and serial AN-A. In this case, in order to infer the choice task non-attendance, the panel data structure is not considered in the estimation, and only a cross-sectional RPL model is estimated. As part of the information (the number of responses) is discarded by the estimation, the percentages of coincidence of the true and inferred non-attendance are lower than before. While the inferred approach under serial non-attendance would predict between 90% and 95% of the cases correctly, the inferred approach under choice task non-attendance cannot predict more than 80% of the cases correctly. So, according to our simulation results, the performance of this procedure under choice-task non-attendance is limited.

Stated or inferred attribute non-attendance? A simulation approach... 63
TABLE 3
Coincidence between true and inferred non-attendance (Choice task AN-A)
%Critical Value
0.5 1.0 1.5 2.0 2.5 3.0 3.5Full attendance 77.94 77.94 76.16 71.75 64.78 51.28 36.6620% of non-att. 79.62 79.62 76.01 72.79 60.01 40.11 28.6040% of non-att. 73.60 73.60 77.67 76.76 64.01 51.71 44.8160% of non-att. 55.62 55.62 78.41 80.86 73.98 66.52 63.82
Source: Own elaboration.
Finally, the above simulation exercises were generalised for the case of two or more simultaneously non-attended attributes, and the results obtained were in line with those presented in Tables 2 and 3.
4. Discussion and conclusions
The recent literature on attribute non-attendance in the context of discrete choice modelling for environmental valuation has shown that this phenomenon does indeed take place. The issue is important in terms of the reliability of the CM valuation tech-nique, because ignoring one or more attributes implies non-compensatory behaviour among respondents, and thus challenges the continuity axiom of the neoclassical the-ory. The reasons for not attending one or more attributes can be manifold. One reason might be that some of the attributes are not equally important for all respondents. As this can be caused, among other things, by taste heterogeneity it is likely to hap-pen in most CM applications. A special form of this would occur when respondents have lexicographic preferences and are thus only considering those attributes that are meaningful for expressing their lexicographic preferences. An example might be an attribute that is connected to the protection of endangered species that attracts the main, or even the whole attention of the respondents, while the other attributes are less or not attended to. Moreover, the dimensionality of the choice sets may also trigger AN-A. If choice sets comprise too many attributes or too many alternatives, for example, this may increase the complexity of the choice task to such an extent that some respondents choose to not attend to some of the attributes as a processing strategy. So far, to the authors’ knowledge, no study has investigated systematically the association of the dimensionality of the choice tasks and frequency of non-attend-ance, using, for example, a design-of-designs approach (Hensher, 2004). Alemu at al. (2012) have presented the only study that has investigated the reasons for attribute non-attendance explicitly. They found that motives for AN-A are indeed manifold. Some respondents ignored an attribute because it does not affect their utility, while other respondents wanted to simplify choices. Further research would have to show whether this applies to other contexts as well, and to what extent the reasons vary

64 P. Mariel, D. Hoyos and J. Meyerhoff
with respect to the good in question, or with respect to socio-demographics, such as age or education. However, even when the reasons and motives behind AN-A are not yet fully understood, the majority of studies show that AN-A is policy relevant, because not treating or treating incorrectly non-attended attributes is likely to result in biased welfare measures.
Our simulation experiments show that when AN-A takes place at a serial level (so there is a uniform pattern of respondents’ ignored attributes across choice tasks) both stated and analytical approaches provide unbiased parameter estimates and, consequently, reliable welfare measures. However, when non-attendance takes place at a choice task level (i.e. there is no clear pattern for the attributes that each respondent has ignored in each choice situation), the performance of the inferred non-attendance is limited.
Moreover, our results show that accounting for SAN-A can solve the problem. However, there are many applications showing a model fit improvement when non-attendance is inferred rather than stated, showing the discrepancy between what re-spondents seem to do and what they say they do (e.g. Campbell and Lorimer, 2009; Hensher and Rose, 2009; Louviere et al., 2009; Giergiczny et al., 2010). Therefore, if SAN-A information is collected in the survey, the stated serial non-attendance should be compared to the inferred serial non-attendance, in order to check whether respond-ents actually do what they say, given that we have shown that serial non-attendance can be inferred with a certain level of guarantee. On the contrary, according to our results, if non-attendance takes place at the choice task level, analytical approaches, such as the inferred approach proposed by Hess and Hensher (2010), do not seem to be able to predict the true AN-A correctly.
Furthermore, there is also an ongoing debate in the literature regarding the valid-ity of stated non-attendance information collected in discrete choice surveys. The use of information on stated choice-task and even serial non-attendance can lead to endogeneity bias, given the likely correlation between the answers to non-attendance questions and other unobserved components (Hess, 2011; Beck et al., 2011). How to treat this possible endogeneity is still an open question. One possible way to avoid it may be the use of latent variables in hybrid choice models (Ben-Akiva et al., 2002; Glerum et al., 2011; Hess and Beharry-Borg, 2012).
It is, therefore, still an open question how choice task AN-A can be investigated. One option could be a latent class model that captures all possible combinations of non-attended attributes at the choice task level (Scarpa et al., 2009). Such a model would probably comprise a very large number of classes, while many classes would have only a few members. Future studies might show whether such an approach is a reliable alternative to asking people about their attendance after each choice task.
The previous results seem to be independent of the number of choice tasks an-swered by each individual in our sample. Given that a higher number of choice tasks per individual appears quite often in the literature (see e.g. Paulrud and Laitila, 2004; Tinch et al., 2010; Czajkowski et al., 2012; Cicia et al., 2012), all simulation exer-

Stated or inferred attribute non-attendance? A simulation approach... 65
cises were repeated for a panel of fifteen hypothetical choice tasks. However, the results obtained from these simulation exercises were very similar to the five choice task settings discussed above.
Finally, it is important to bear in mind that the above results are based on a simu-lation study with specific attributes, levels and values of the parameters, and their extrapolation to other data sets is not straightforward. Further research using real data is, therefore, needed in order to further corroborate the findings of the present paper.
References
Adamowicz, W., Louviere, J. and Williams, M. (1994). “Combining revealed and stated preference methods for valuing environmental amenities”. Journal of Envi-ronmental Economics and Management, 26: 271-292. http://doi.org/c9jxsm.
Alemu, M.H., Morback, M.R., Olsen, S.B. and Jensen, C.L. (2012). “Attending to the Reasons for Attribute Non-attendance in Choice Experiments”. Environmental and Resource Economics, 54(3): 333-359. http://doi.org/mp4.
Beck, M.J., Rose J.M. and Hensher, D.A. (2011). Consistently inconsistent: The role of certainty, acceptability and scale in automobile choice. Working Paper ITLS-WP-11-07. The University of Sydney, Sydney.
Ben-Akiva, M., McFadden, D., Train, K., Walker, J., Bhat, C., Bierlaire, M., Bolduc, D., Boersch-Supan, A., Brownstone, D., Bunch, D.S., Daly, A., De Palma, A., Gopinath, D., Karlstrom, A. and Munizaga, M. (2002). “Hybrid choice models: Progress and challenges”. Marketing Letters, 13(3): 163-175. http://doi.org/bfgp8d.
Campbell, D., Hensher, D.A. and Scarpa, R. (2011). “Non-attendance to attributes in environmental choice analysis: A latent class specification”. Journal of Environ-mental Planning and Management, 54(8): 1061-1076, http://doi.org/b7tzsj.
Campbell, D., Hutchinson, W.G. and Scarpa, R. (2008). “Incorporating discontinu-ous preferences into the analysis of discrete choice experiments”. Environmental and Resource Economics, 41(3): 401-417. http://doi.org/cngj53.
Campbell, D. and Lorimer, V.S. (2009). “Accommodating attribute processing strat-egies in stated choice analysis: Do respondents do what they do?” Paper presented at the 17th Annual EAERE Conference, Amsterdam.
Cicia, G., Cembalo, L., Del Giudice, T. and Palladino, A. (2012). “Fossil energy ver-sus nuclear, wind, solar and agricultural biomass: Insights from an Italian national survey”. Energy Policy, 42: 59-66. http://doi.org/fzspdp.

66 P. Mariel, D. Hoyos and J. Meyerhoff
Czajkowski, M., Giergiczny, M. and Greene, W. (2012). Learning and fatigue effects revisited. The impact of accounting for unobservable preference and scale het-erogeneity on perceived ordering effects in multiple choice task discrete choice experiments. Working paper No. 8/2012 (74). Faculty of Economic Sciences, University of Warsaw, Warsaw.
Giergiczny, M., Valasiuk, S. and Żylicz, T. (2010). Irregular behaviour in stating preferences for nature protection. A choice experiment in Belarus. Working Paper No. 8/2010 (31). Faculty of Economic Sciences, University of Warsaw, Warsaw.
Glerum, A., Atasoy, B., Monticone, A. and Bierlaire, M. (2011). “Adjectives quali-fying individuals’ perceptions impacting on transport mode preferences”. Paper presented at the Second International Choice Modelling Conference, Leeds.
Hensher, D.A. (2004). “Identifying the influence of stated choice design dimension-ality on willingness to pay for travel time savings”. Journal of Transport Eco-nomics and Policy, 38(3): 425-446.
Hensher, D. and Greene, W. (2010). “Non-attendance and dual processing of com-mon-metric attributes in choice analysis: a latent class specification”. Empirical Economics, 39(2): 413-426. http://doi.org/bmmcbf.
Hensher, D.A. and Rose, J.M. (2009). “Simplifying choice through attribute preser-vation or non-attendance: implications for willingness to pay”. Transportation Research Part E, 45: 583-590. http://doi.org/dm3zjg.
Hensher, D.A., Rose, J.M. and Bertoia, T. (2007). “The Implications on willingness to pay of a stochastic treatment of attribute processing in stated choice studies”. Transportation Research Part E, 43: 73-89. http://doi.org/cj63cf.
Hensher, D.A., Rose, J.M. and Greene, W.H. (2005). “The implications of willing-ness to pay of respondents ignoring specific attributes”. Transportation, 32: 203-222. http://doi.org/d8qhpz.
Hess, S. (2011). Impact of unimportant attributes in stated choice surveys. Working paper. Institute for Transport Studies, University of Leeds, Leeds.
Hess, S. and Beharry-Borg, N. (2012). “Accounting for latent attitudes in willing-ness-to-pay studies: The case of coastal water quality improvements in Tobago”. Environmental and Resource Economics, 52(1): 109-131. http://doi.org/bwpsd9.
Hess, S. and Hensher, D. (2010). “Using conditioning on observed choices to retrieve individual-specific attribute processing strategies”. Transportation Research Part B, 44: 781-790. http://doi.org/bf6qg4.
Hoyos, D. (2010). “The state of the art of environmental valuation with discrete choice experiments”. Ecological Economics, 69(2): 2372-2381. http://doi.org/djgxf6.
Lancaster K. (1966). “A new approach to consumer theory”. Journal of Political Economy, 74: 132-157.
Louviere, J. and Hensher, D.A. (1982). “On the design and analysis of simulated choice or allocation experiments in travel choice modelling”. Transportation Re-search Record, 890: 11-17.

Stated or inferred attribute non-attendance? A simulation approach... 67
Louviere J., Street, D.J. and Burgess, L. (2009). “Modelling the choices of individual decision-makers by combining efficient choice experiment designs with extra preference information”. Journal of Choice Modelling, 1(1): 128-163.
Louviere, J. and Woodworth, G. (1983). “Design and analysis of simulated consumer choice or allocation experiments: an approach based on aggregate data”. Journal of Marketing Research, 20: 350-367.
Meyerhoff, J. and Liebe, U. (2009). “Discontinuous preferences in choice experi-ments: Evidence at the choice task level”. Paper presented at the 17th Annual EAERE Conference, Amsterdam.
Paulrud, A. and Laitila, T. (2004). “Valuation of management policies for sport-fish-ing on Sweden’s Kaitum river”. Journal of Environmental Planning and Manage-ment, 47: 863-879. http://doi.org/fw9rz5.
Puckett, S.M. and Hensher, D.A. (2009). “Revealing the extent of process heteroge-neity in choice analysis: An empirical assessment”. Transportation Research A, 43: 117-126. http://doi.org/fwjf43.
Scarpa, R., Gilbride, T.J., Campbell, D. and Hensher, D.A. (2009). “Modelling at-tribute non-attendance in choice experiments for rural landscape valuation.” Eu-ropean Review of Agricultural Economics, 36(2): 151-174. http://doi.org/bbjxjh.
Scarpa, R., Thiene, M. and Hensher, D.A. (2010). “Monitoring choice task attribute attendance in non-market valuation of multiple park management services: Does it matter?” Land Economics, 86: 817-839.
Scarpa, R., Zanoli, R., Bruschi, V. and Naspetti, S. (2012). “Inferred and stated at-tribute non-attendance in food choice experiments”. American Journal of Agricul-tural Economics, 95(1): 165-180. http://doi.org/mp5.
Tinch, D., Colombo, S. and Hanley, N. (2010). Experienced utility, decision utility and remembered utility: A choice experiment. Discussion paper in Economics, University of Stirling, Stirling.