Are Stated Preferences Good Predictors of Market Behavior?
12
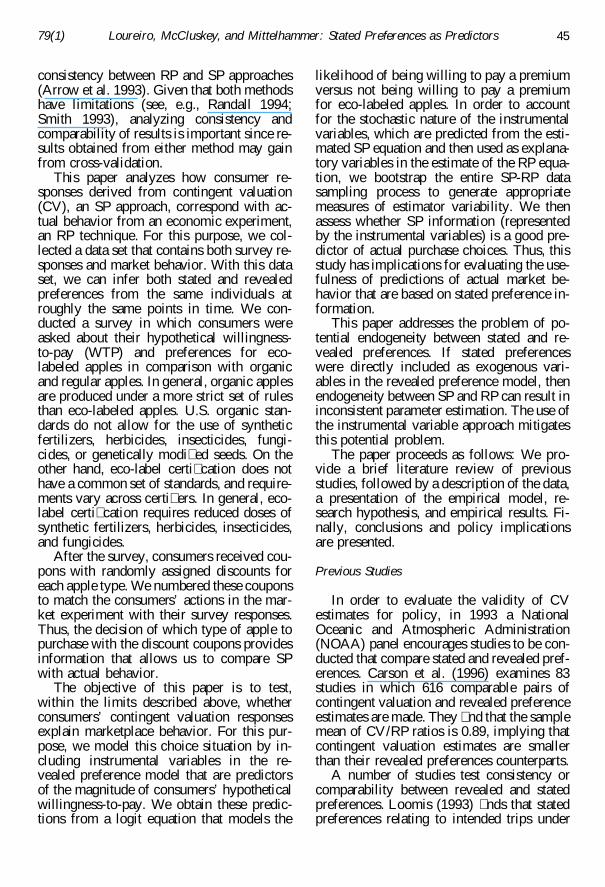
Are Stated Preferences Good Predictors of Market Behavior? Maria L. Loureiro, Jill J. McCluskey, and Ron C. Mittelhammer ABSTRACT. Using an economic experiment in conjunction with a survey, we analyze whether consumers’ hypothetical willingness-to-pay re- sponses are effective predictors of actual mar- ket behavior. We model revealed preferences as a function of socio-demographic characteristics and instrumental variables that represent the in- tensity of stated preferences. Our ndings show that consumers who state that they are willing to pay a premium, which is equal to or greater than a positive lower bound, have a higher likelihood of actually buying the product in question. This implies that consumers’ actions in the economic experiment validate their survey responses. ( JEL Q13, Q26) I. INTRODUCTION Policymakers often must make decisions based on non-market valuation estimates ob- tained from either revealed preference (RP) or stated preference (SP) techniques. Ques- tions may vary widely, such as: How much money should be spent to avoid global warming? How much are Americans willing to pay to keep Lake Tahoe blue? 1 How much money should be spent on cleaning and maintaining ocean beaches? RP techniques, such as hedonic price analysis and the travel cost method, use actual consumer decisions to model consumer preferences and exploit the fact that consumer decisions reveal pref- erences for goods, in both market and non- market contexts. SP techniques, such as con- tingent valuation, contingent behavior, and choice experiments, ask people questions that are intended to elicit their preferences for a good or amenity, without requiring that the consumer act accordingly. If the RP and SP results are consistent, then from a policy perspective with limited budget resources, data can be collected in the Land Economics February 2003 79(1): 44–55 ISSN 0023-7639 ã 2003 by the Board of Regents of the University of Wisconsin System least costly way and still provide results that are consistent with other more costly meth- ods. Further, sometimes it will only be possi- ble to collect SP data. This will be the case when obtaining data on the valuation of cer- tain endangered species. Cross validation of approaches provides support for policy deci- sions that are based solely on results from SP data. SP methods are commonly criticized be- cause of the hypothetical nature of the ques- tions and the fact that actual behavior is not observed (Cummings, Brookshire, and Schulze 1986; Mitchell and Carson 1989). Adamowicz, Louviere, and Williams (1994) 2 criticize RP methods on the basis that the models of behavior developed constitute a maintained hypothesis about the structure of preferences that may not be testable. They also point out that RP methods can suffer from collinearity among attributes, preclud- ing identi cation of the marginal impact of factors that affect choice. Given these criti- cisms of both RP and SP approaches and that both are commonly used for policy formation and as evidence in courts of law, it is surpris- ing how relatively few studies analyze the The authors are, respectively, assistant professor, Department of Agricultural and Resource Economics, Colorado State University; assistant professor, Depart- ment of Agricultural and Resource Economics, Wash- ington State University; and professor, Department of Agricultural and Resource Economics and Program in Statistics, Washington State University. The authors wish to thank, without implicating, Phil Wandschneider, John Loomis, Paul Barkley, Tom Schotzko, and an anonymous reviewer for helpful ad- vice. The authors gratefully acknowledge the nancial support from the Federal-State Marketing Improvement Program (FSMIP) of the U.S. Department of Agricul- ture. 1 ‘‘Keep Tahoe Blue’’ is a popular bumper sticker referring to the degradation of the formerly crystal clear blue waters of Lake Tahoe on the California-Nevada border. 2 This study uses a multinomial logit, in which the structure of preference is far more complex.
Transcript of Are Stated Preferences Good Predictors of Market Behavior?
Are Stated Preferences Good Predictorsof Market BehaviorMaria L Loureiro Jill J McCluskey and Ron C Mittelhammer
ABSTRACT Using an economic experiment inconjunction with a survey we analyze whetherconsumersrsquo hypothetical willingness-to-pay re-sponses are effective predictors of actual mar-ket behavior We model revealed preferences asa function of socio-demographic characteristicsand instrumental variables that represent the in-tensity of stated preferences Our ndings showthat consumers who state that they are willing topay a premium which is equal to or greater thana positive lower bound have a higher likelihoodof actually buying the product in question Thisimplies that consumersrsquo actions in the economicexperiment validate their survey responses (JELQ13 Q26)
I INTRODUCTION
Policymakers often must make decisionsbased on non-market valuation estimates ob-tained from either revealed preference (RP)or stated preference (SP) techniques Ques-tions may vary widely such as How muchmoney should be spent to avoid globalwarming How much are Americans willingto pay to keep Lake Tahoe blue1 How muchmoney should be spent on cleaning andmaintaining ocean beaches RP techniquessuch as hedonic price analysis and the travelcost method use actual consumer decisionsto model consumer preferences and exploitthe fact that consumer decisions reveal pref-erences for goods in both market and non-market contexts SP techniques such as con-tingent valuation contingent behavior andchoice experiments ask people questionsthat are intended to elicit their preferencesfor a good or amenity without requiring thatthe consumer act accordingly
If the RP and SP results are consistentthen from a policy perspective with limitedbudget resources data can be collected in the
Land Economics February 2003 79(1) 44ndash55ISSN 0023-7639 atilde 2003 by the Board ofRegents of the University of Wisconsin System
least costly way and still provide results thatare consistent with other more costly meth-ods Further sometimes it will only be possi-ble to collect SP data This will be the casewhen obtaining data on the valuation of cer-tain endangered species Cross validation ofapproaches provides support for policy deci-sions that are based solely on results from SPdata
SP methods are commonly criticized be-cause of the hypothetical nature of the ques-tions and the fact that actual behavior is notobserved (Cummings Brookshire andSchulze 1986 Mitchell and Carson 1989)Adamowicz Louviere and Williams (1994)2
criticize RP methods on the basis that themodels of behavior developed constitute amaintained hypothesis about the structure ofpreferences that may not be testable Theyalso point out that RP methods can sufferfrom collinearity among attributes preclud-ing identi cation of the marginal impact offactors that affect choice Given these criti-cisms of both RP and SP approaches and thatboth are commonly used for policy formationand as evidence in courts of law it is surpris-ing how relatively few studies analyze the
The authors are respectively assistant professorDepartment of Agricultural and Resource EconomicsColorado State University assistant professor Depart-ment of Agricultural and Resource Economics Wash-ington State University and professor Department ofAgricultural and Resource Economics and Program inStatistics Washington State University
The authors wish to thank without implicatingPhil Wandschneider John Loomis Paul Barkley TomSchotzko and an anonymous reviewer for helpful ad-vice The authors gratefully acknowledge the nancialsupport from the Federal-State Marketing ImprovementProgram (FSMIP) of the US Department of Agricul-ture
1 lsquolsquoKeep Tahoe Bluersquorsquo is a popular bumper stickerreferring to the degradation of the formerly crystal clearblue waters of Lake Tahoe on the California-Nevadaborder
2 This study uses a multinomial logit in which thestructure of preference is far more complex
79(1) Loureiro McCluskey and Mittelhammer Stated Preferences as Predictors 45
consistency between RP and SP approaches(Arrow et al 1993) Given that both methodshave limitations (see eg Randall 1994Smith 1993) analyzing consistency andcomparability of results is important since re-sults obtained from either method may gainfrom cross-validation
This paper analyzes how consumer re-sponses derived from contingent valuation(CV) an SP approach correspond with ac-tual behavior from an economic experimentan RP technique For this purpose we col-lected a data set that contains both survey re-sponses and market behavior With this dataset we can infer both stated and revealedpreferences from the same individuals atroughly the same points in time We con-ducted a survey in which consumers wereasked about their hypothetical willingness-to-pay (WTP) and preferences for eco-labeled apples in comparison with organicand regular apples In general organic applesare produced under a more strict set of rulesthan eco-labeled apples US organic stan-dards do not allow for the use of syntheticfertilizers herbicides insecticides fungi-cides or genetically modi ed seeds On theother hand eco-label certi cation does nothave a common set of standards and require-ments vary across certi ers In general eco-label certi cation requires reduced doses ofsynthetic fertilizers herbicides insecticidesand fungicides
After the survey consumers received cou-pons with randomly assigned discounts foreach apple type We numbered these couponsto match the consumersrsquo actions in the mar-ket experiment with their survey responsesThus the decision of which type of apple topurchase with the discount coupons providesinformation that allows us to compare SPwith actual behavior
The objective of this paper is to testwithin the limits described above whetherconsumersrsquo contingent valuation responsesexplain marketplace behavior For this pur-pose we model this choice situation by in-cluding instrumental variables in the re-vealed preference model that are predictorsof the magnitude of consumersrsquo hypotheticalwillingness-to-pay We obtain these predic-tions from a logit equation that models the
likelihood of being willing to pay a premiumversus not being willing to pay a premiumfor eco-labeled apples In order to accountfor the stochastic nature of the instrumentalvariables which are predicted from the esti-mated SP equation and then used as explana-tory variables in the estimate of the RP equa-tion we bootstrap the entire SP-RP datasampling process to generate appropriatemeasures of estimator variability We thenassess whether SP information (representedby the instrumental variables) is a good pre-dictor of actual purchase choices Thus thisstudy has implications for evaluating the use-fulness of predictions of actual market be-havior that are based on stated preference in-formation
This paper addresses the problem of po-tential endogeneity between stated and re-vealed preferences If stated preferenceswere directly included as exogenous vari-ables in the revealed preference model thenendogeneity between SP and RP can result ininconsistent parameter estimation The use ofthe instrumental variable approach mitigatesthis potential problem
The paper proceeds as follows We pro-vide a brief literature review of previousstudies followed by a description of the dataa presentation of the empirical model re-search hypothesis and empirical results Fi-nally conclusions and policy implicationsare presented
Previous Studies
In order to evaluate the validity of CVestimates for policy in 1993 a NationalOceanic and Atmospheric Administration(NOAA) panel encourages studies to be con-ducted that compare stated and revealed pref-erences Carson et al (1996) examines 83studies in which 616 comparable pairs ofcontingent valuation and revealed preferenceestimates are made They nd that the samplemean of CVRP ratios is 089 implying thatcontingent valuation estimates are smallerthan their revealed preferences counterparts
A number of studies test consistency orcomparability between revealed and statedpreferences Loomis (1993) nds that statedpreferences relating to intended trips under
46 Land Economics February 2003
alternative quality levels are valid and reli-able indicators of actual behavior by compar-ing data on stated preferences to actual tripdata Loomis et al (1996) rejects the equalityhypothesis of revealed and stated WTP basedon comparing an open-ended question withan actual market outcome for an art printStudies that use economic experiments (par-ticularly laboratory experiments) to validatecontingent valuation estimates are more com-mon Cummings Harrison and Rutstron(1995) conduct three economic experimentscomparing real purchasing behavior for pri-vate goods with dichotomous choice (DC)contingent valuation questions They ndthat the proportion of DC yes responses ex-ceeds the proportion of actual purchases Ina recent study Cummings et al (1997) re-jects that results from a laboratory experi-ment and hypothetical donations for a lsquolsquogoodcausersquorsquo are incentive compatible suggestingthat subjects answered the hypothetical CVMquestion in a different way than they behavedin the experimental situation Results ob-tained from Johannesson Liljas and Johans-son (1998) show that hypothetical lsquolsquoyesrsquorsquo re-sponses overestimate the real purchases butthe lsquolsquoabsolutely sure yesrsquorsquo responses under-estimate the real yes responses In a differentlab experiment Blumenschein et al (1998)are unable to reject the hypothesis that thelsquolsquode nitely sure yesrsquorsquo responses correspondto the actual yes responses
Among the studies that compare revealedand stated preferences most have been con-ducted in an experimental laboratory ratherthan in an actual purchasing environment Insuch studies the experimental procedurehelps to conduct an individual comparisonbetween survey responses and actions (seeeg Cummings Harrison and Rutstrom1995 and Cummings et al 1997 to name afew) In the current study the revealed pref-erence data comes from an economic experi-ment conducted in an actual market settingWe match individualrsquos survey responses withhis or her actual purchase decisions We ob-serve that respondents who state that theywould choose eco-labeled apple as their rstchoice and in addition they would be will-ing to pay a premium to obtain eco-labeledapples are three times more likely to buy the
eco-labeled apples in the experiment thanthose who said that they would not buy eco-labeled apples at equal prices nor if theywere offered at a discount Empirical estima-tion of the RP behavior equation allows forthe identi cation of factors that may or maynot affect the choice of eco-labeled apples inthe market experiment outside the statedWTP
II DATA
We collected data using in-person inter-views and an economic experiment with ac-tual purchase decisions in grocery stores Wedesigned data collection methods to elicit SPand RP information from the same individu-als at roughly the same points in time Wesolicited shoppers to participate in the surveyin the vicinity of the produce section of twogrocery stores in Portland Oregon After theshoppers completed the survey they receivedthree discount coupons one coupon for or-ganic apples one for eco-labeled apples andone for regular apples The coupons had arandomly assigned value between ten and fty cents off per pound of apples Based onthe value of these coupons the relative pricesof the three types of apples were effectivelyvaried randomly across consumers althoughthe prices remained positive We numberedcoupons to correspond to each survey par-ticipantrsquos numbered questionnaire Conse-quently we obtain survey responses and ob-serve actual behavior from the exercise of thediscount coupons (the economic experiment)from the same person at roughly the samepoint in time
The survey was conducted during January2000 in cooperation with The Food Alliance(TFA) a Portland Oregon-based non-pro tthird-party certifying organization TFA hasthe only labeling program in the Northwestthat is based on farm practices TFA certi esfarmers who reduce or eliminate pesticidesconserve the soil and water and providesafe and fair working conditions TFA usesmarket-oriented initiatives to promote sus-tainable agricultural practices in the Paci cNorthwest By market-oriented initiativeswe mean that farmers who enroll in the TFAprogram expect to bene t from consumer de-
79(1) Loureiro McCluskey and Mittelhammer Stated Preferences as Predictors 47
mand for environmentally friendly productsWhen a farmer gets certi ed TFA will actnotonly as a third-party monitoring agency butalso as a food broker and distributor of theproduct Thus in addition to obtaining higherprices in the market place for their productTFAcerti edfarmers have easieraccess to re-tail stores and distribution centers
The survey participants could inspect theactual products that they were being asked toconsider An interesting characteristic of thegrocery stores where we surveyed was thelarge variety of produce they offered includ-ing regular TFA eco-label and organicapples3 This allowed consumers to considermany substitutes among apple types Thesurvey respondents were asked about theirconsumption of apples their attitudes aboutthe environment and food safety their famil-iarity and perceptions about the TFA eco-label and socio-demographic informationThose consumers who indicated that theywere familiar with the TFA certi cation pro-gram were offered additional information ifdesired while those who indicated that theywere not knowledgeable about TFA wereread a short paragraph (see the appendix forthe actual text) about what TFA stands for
Contingent valuation questions regardingwillingness to pay for TFA-approved appleswere asked using a double-bounded formatemploying a sequence of two discrete choicequestions An initial question about the pref-erences for eco-labeled apples was askedwith the intent of removing the effects ofprice and size from the response Speci -cally consumers were asked to choose fromamong organic eco-labeled and regularapples all offered at the same price and sizeIf the consumer initially chose the eco-labeledapples thentheywereaskedadichoto-mous choice willingness-to-pay question re-lating to whether they would be willing tobuy eco-labeled apples at a premium If theconsumer did not initially choose eco-labeledapples they were asked a willingness-to-compensate question relating to whetherthey would buy eco-labeled apples at a dis-count (see the appendix for question details)More speci cally if the individual respondslsquolsquoyesrsquorsquo meaning that he or she chooses eco-labeled apples if offered at equal prices then
the individual must answer lsquolsquoyesrsquorsquo or lsquolsquonorsquorsquoto whether he or she will choose eco-labeledapples when they cost more than the alterna-tives On the other hand if the individual re-sponds lsquolsquonorsquorsquo meaning that he or she is notwilling to buy eco-labeled apples if offered atequal prices then the individual must answerlsquolsquoyesrsquorsquo or lsquolsquonorsquorsquo to whether he or she willchoose eco-labeled apples when they are of-fered at a discount This questioning schemeresults in four potential preference intensityobservations relating to the hypothetical de-cision to purchase eco-label apples including(no-no) (no-yes) (yes-no) and (yes-yes)
In total 289 consumers were surveyedThe turndown rate was about 50 The ma-jority of respondents were the primary foodshopper of the household (87) white(92) and female (79) The respondentsrsquoaverage age was 46 years and 36 of all re-spondents had children under the age of 18years old living in their household The aver-age household income of the sample was be-tween $50000 and $700004 for the 1999 scal year and their average education wassome years of college Our sample is compa-rable to the Portland City Statistics (USCensus Bureau 2000) in terms of educa-tion number of children per household andhousehold size However this sample in-cludes fewer minorities The high percentageof female respondents was expected and de-sirable since we were targeting actual shop-pers Summary statistics and variable de-scriptions are presented in Table 1
Regarding food safety attitudes 33 ofthe consumers placed more importance onfood safety issues rather than appearance ofthe fruit Note that information about foodsafety preferences was obtained by present-ing a trade-off situation between food safetylevel and fruit appearance This trade-offquestion is presented in the Appendix Ac-
3 Although a polychotomous framework would beideal to model this multiple choice set among appletypes we are only able to estimate a dichotomouschoice model because of data limitations
4 In order to obtain a high response rate respondentswere asked to place themselves in income intervalsrather than give their exact income amount Survey re-spondents are typically reluctant to divulge income in-formation
48 Land Economics February 2003
TABLE 1Summary Statistics for Socio-Demographic Characteristics
Variable Description Min Max Mean Std Deviation
Female Dummy that equals 1 if the re- (0 1) 079 0407spondent is a female
Children Dummy that equals 1 if children (0 1) 0362 0481under eighteen are present inthe household
Education Consumerrsquos Education Level (2 5) 3734 08941 5 some school2 5 high school3 5 some college4 5 Bachelorrsquos degree5 5 Advanced degree
Income Householdrsquos Income Level (1 6) 4073 12011 5 $150002 5 $15000ndash $300003 5 $30000ndash $500004 5 $50000ndash $700005 5 $70000ndash $1000006 $100000
cording to the survey data 50 of the con-sumers did not perceive any difference inquality between TFA-approved apples andthe rest of the apples available in the store
Following the survey each consumer re-ceived three randomly valued discount cou-pons valid for each of the three apple typesregular organic and eco-labeled These cou-pons were valid only for one day and carriedrandomly assigned discounts ranging fromten cents per pound to fty cents per poundfor each of the three types of apples Of the289 surveyed consumers 98 individuals ex-
TABLE 2Summary Statistics for Survey and Experimental Variables
Variable Description Min Max Mean Std Deviation
Bid Bid (positive or negative) amount offered to (250 50) 4547 26961the consumer after the rst screening ques-tion
Discount Shifter variable that equals the bid amount if (250 0) 29808 15318this is negative and 0 otherwise
TFA Quality Perceived quality of TFA apples in comparison (21 2) 1425 0620with the rest of the apples
Regular Discount Ratio of discount coupons given for eco- (02 5) 1715 1450labeled and regular apples
Organic Discount Ratio of discount coupons given for eco- (013 5) 2018 1872labeled and organic apples
Food Safety Natural log of consumerrsquos food safety attitudes (0001 23) 1812 0604(in the survey from 1 to 10)
ercised the discount coupons Summary sta-tistics and variable descriptions for the atti-tude survey bids and experimental variablesare presented in Table 2
The purchases that were made using thediscount coupons constitute an economic ex-periment Economic experiments that takeplace in a laboratory suffer from a series ofcriticisms including that the market scenariosare made to be unrealistic or too simplistic inorder for the valuation decision to be under-standable A second criticism is that anchor-ing may occur implying that if the same in-
79(1) Loureiro McCluskey and Mittelhammer Stated Preferences as Predictors 49
dividuals are intercepted for the survey andthe experiment some of them will act ac-cording to how they said they would act inthe survey rather than how they would be-have in a real market situation Our experi-ment avoids both of these criticisms First itis not unrealistic or too simplistic because ithas the advantage of being an actual marketscenario rather than a laboratory experimentSecond it is unlikely that anchoring occurredbecause consumers were not told that theircoupon use would be compared with theirsurvey answers The coupons were given aspart of the incentive provided for taking partin the survey However we acknowledgethat since the discount coupons were validfor only one day it is possible that a lsquolsquonowrsquorsquobias may have been introduced because someof the respondents who stated they wouldpay a premium for eco-labeled apples maynot have done so that particular day becausethey did not need to buy apples that dayNevertheless as a mitigating factor it is rea-sonable to assume that the set of people whowere already fully stocked with apples repre-sents a set of preferences that are randomlydistributed among apple types
The data set used in this analysis is espe-cially interesting because it deals with con-sumer response and WTP for a lsquolsquosocially cor-rectrsquorsquo product eco-labeled apples The issueof the intervieweersquos concern for what the in-terviewer might think may come into playOne might expect that a considerable major-ity of respondents would want the inter-viewer to believe that they favor a cleanenvironment ceteris paribus In addition or-ganic and eco-labeled products contain bothprivate and public good bene ts derivedfrom their production methods5 Private goodattributes include for example health bene- ts associated with the reduced use (or nonuse) of synthetic pesticides while publicgood attributes are related to the positiveexternalities generated by low-impact pro-duction processes such as better soils andhigher water quality levels When a productincludes both public and private good at-tributes there is an incentive for some con-sumers to free ride on the public good attri-butes
Finally we acknowledge that our data al-
though collected in an actual retail store set-ting suffers from some limitations Firstonly a third of the survey participants tookpart in the subsequent market experimentwhich limits the potential alternative estima-tion approaches available to assess how wellsurvey responses predict market behaviorSecond a multinomial approach would be alogically appropriate alternative methodol-ogy given that the choice set in the marketingexperiment consists of three apple types (reg-ular organic and eco-labeled) Neverthelesswe are restricted by the small sample sizeand the fact that the majority of participantsbought eco-labeled apples in the experimentresulting in limited degrees of freedom re-lating to the two alternative apple types Wethus model the market behavior with a binaryprobit (the choice alternatives being whetheror not the consumer purchased the eco-la-beled apples) We acknowledge that some ofthe consumers may not have bought eco-la-beled apples in the experiment because theirenvironmental and quality standards are lowin comparison with the organic apples Thisfact reduces the overall t of the RP modelin which we used the predictions of behaviorobtained from the SP model as explanatoryvariables However our research hypothesisis still valid in spite of the mentioned datalimitations
III EMPIRICAL MODEL
Since the elicitation method used in oursurvey is notably different from the processby which data was gathered in our economicexperiment we do not directly compare re-vealed and stated willingness-to-pay esti-mates In the survey we use bid amounts thatcan be either positive or negative dependingon the response to the initial question whilein the market experiment we use only dis-count coupons which always have a positivediscount value (eg a negative effect onprice) Therefore we do not follow the estab-lished data-pooling methods for testing con-sistency of preferences that test the hypothe-sis of equality of parameters across models
5 We would like to thank a reviewer for suggestingthis point
50 Land Economics February 2003
of SP and RP behavior We offer the alterna-tive approach of including predictions ofstated willingness to pay directly in the re-vealed preference model which also controlsfor the endogeneity of stated and revealedpreferences through the use of instrumentalvariables
We employ a probit model for represent-ing the SP responses of survey participantsregarding whether they will pay a premiumThe predictions from this probit equation arethen used as instrumental variables in a sub-sequent probit RP model used to representactual purchase behavior The variables usedin estimating the SP probit model include theconsumerrsquos perception of the quality of theeco-labeled apples compared with the otherapples in the store whether the respondent isfemale the bid presented to the consumerand the discount variable The bid variable isthe hypothetical premium or discountappliedto the eco-labeled apple price which fol-lowed his or her response to an initial surveyquestion regarding whether he or she wouldchoose eco-labeled apples when all apple al-ternatives were priced equally This ques-tioning scheme with follow-up is commonwhen researchers plan to elicit preferencesusing a double-bounded model In the classi-cal double-bounded model each participantis presented with two bids The level of thesecond bid is contingent upon the responseto the rst bid If the individual respondslsquolsquoyesrsquorsquo meaning that he or she will be buyingeco-labeled apples if offered at equal prices)then the individual is presented with a secondbid which is greater than the rst bid by someamount On the other hand if the individual
TABLE 3Stated P reference Equation Estimation
Dependent variable Z 5 Choice of Eco-labeled Apple (01)
Parameters Coef cients T-ratio P-value
Constant 20344 20950 0342Discount 0185 4885 0000Bid 20009 21128 0259TFA Quality 0305 2021 0043Female 0363 1625 0104
Notes Percentage of correct predictions 7491 Restricted log-likelihood function 2187346Unrestricted log-likelihood function 2124434
() The coef cient is signi cant at a 5 005 () The coef cient is signi cant at a 5 010
responds lsquolsquonorsquorsquo meaning that he or she is notwilling to buy eco-labeled apples if offeredat equal prices then heshe is presented witha second lower bid or discount in this case
The discount variable is de ned as theproduct of an indicator variable and the nega-tive of the bid variable with the indicatorvariable equaling 1 if the bid represents adiscount and 0 if the bid represents a pre-mium For example if a survey participantresponded lsquolsquonorsquorsquo to buying eco-labeledapples at the same price as the alternativechoices and then was offered eco-labeledapples at a 30 cents per pound discount thebid variable equals 2$030 and the discountvariable equals $030 On the other hand ifa survey participant responded lsquolsquoyesrsquorsquo tobuying eco-labeled apples at the same priceas the alternative choices and then was askedif heshe would choose eco-labeled apples ata 50 cents per pound premium the bid vari-able equals $050 and the discount variableequals $000 In effect the discount variableacts as a slope shifter on the bid variableallowing for the possibility of asymmetry inresponses to a bid depending on whether itis a premium or discount relative to the equalprice base-level scenario See Table 3 for re-sults obtained from the SP probit
Based on the predictions generated by theSP probit two binary instrumental variables(Ii1 and Ii2) were created that represent cate-gorical predictions of the intensity of hypo-thetical WTP for eco-labeled apples Notethat Ii1 5 1 if the SP model predicts that thei th consumer is not willing to pay at least alower-bound premium and 0 otherwise andIi2 5 1 if the SP model predicts that the con-
79(1) Loureiro McCluskey and Mittelhammer Stated Preferences as Predictors 51
sumer is willing to pay at least a lower-boundpremium 0 otherwise Owing to the fact thatthe predictions generated from the statedpreference probit model are used to form in-strumental variables it is important that thespeci cation chosen resulted in a reasonablyhigh level of correct predictions from amongthe alternatives examined The percentage ofcorrect predictions that results from thisspeci cation is 7491
Assessing the variability of parameter es-timates in the current model is complicatedby the stochastic nature of the predicted in-strumental variables obtained from the esti-mated SP model and their functional interre-lationship with the speci cation of the RPmodel Any method of evaluating the vari-ability of parameter estimates in the currentmodel context will depend on asymptoticsfor its validity We used the bootstrap whichis a general asymptotically valid approachfor assessing the variability of complicatedfunctions of sample data (see Efron 1979and Efron and Tibshirami 1993 on the gen-eral bootstrap procedure see also Arconesand Gine 1992 and references therein for ap-plications speci c to M-estimation)6 Follow-ing the standard bootstrapping approach theoriginal sample data was treated as a popula-tion from which repeated samples weredrawn randomly with replacement and theparameters of both the SP and RP modelswere reestimated for each of the resulting re-sampled data sets The variability in the pa-rameters estimates observed across the re-peated samples and in particular the samplecovariance matrix associated with these pa-rameter estimates was used to estimate vari-ances and covariances in all subsequent hy-pothesis testing applications7
The speci cation of the latent variablemodel underlying the RP purchasing deci-sion has been speci ed as a function of threetypes of variables socio-economic character-istics and attitudes of the respondent a rela-tive coupon (value) variable and the categor-ical predictions regarding consumerrsquos WTPintensities for eco-labeled apples Below Re-gularDiscounti represents the value of theeco-labeled discount divided by the value ofthe regular apples discount OrganicDis-counti represents the value of the eco-labeled
discount divided by the value of the organicdiscount Childreni indicates the presence ofchildren under eighteen years old in thehousehold FoodSafetyi represent attitudestowards food safety and Educationi is thelevel of education obtained by the respon-dent In equation 1 depicting the latent vari-able model the Iijrsquos are the previously de-scribed binary instrumental variables thatrepresent the prediction of the intensity cate-gory of hypothetical WTP for eco-labeledapples obtained from survey responses andis the error term which for purposes of anexplicit likelihood speci cation is assumedto follow a standard normal distributionSince the latent Zi rsquos are unobservable theobservable Zirsquos are used in a probit context toestimate the parameters of [1] Note that Zi
5 1 if the consumer purchases eco-labeledapples in the experiment and 0 otherwise
6 M-estimators encompass the class of extremum-type estimators which includes maximum likelihood
7 The observed sample data set underlying the SPand RP equations was treated as a population and wasrandomly sampled 1000 times with replacement (pro-ducing 1000 lsquolsquoresamplesrsquorsquo of the data in bootstrappingparlance) Then 1000 bootstrap estimates of the modelparameters based on the resamples of data were usedto calculate the sample covariance matrix The resam-pling was designed to coincide with the fact that therevealed preference equation was estimated using thesub-sample of survey respondents who also participatedin the economic experiment while the SP equation wasestimated based on the overall sample of survey respon-dents Therefore to be consistent in bootstrapping thecomplete model the sampling was designed so that anybootstrapped resample of data that applied to the RPequation was contained within the overall bootstrappedresample of data applied to the SP equation Spe-ci cally the sampling scheme used was analogous tostrati ed random sampling in which the population isdivided into two strata consisting of the survey par-ticipants who did and did not participate in the eco-nomic experiment subsequent to the survey and ran-dom sampling was applied to each of the strata Thenumber of outcomes randomly sampled from eachstrata coincidedwith the number of original data obser-vations that occurred in each strata
For each new data set that was produced accordingto the preceding resampling method estimates of theparameters of the SP equation were generated and cor-responding estimates of the instrumental variables weregenerated based on the SP estimates Then these esti-mated values of the indicator variables were used to es-timate the parameters of the RP equation based on theappropriate resampled data for the RP equation
52 Land Economics February 2003
Zi 5 b1RegularDiscounti 1 b2OrganicDiscount i
1 b3Children i 1 b4FoodSafetyi
1 b5Education i 1 d1Ii1 1 d2Ii2 1 eRi
and
Zi 5 1 if Zi 0
Zi 5 0 if Zi 0 [1]
IV RESEARCH HYPOTHESIS
We are interested in assessing whether thehypothetical responses are good predictors ofactual market behavior Our research hypoth-esis is the following consumers who statedin the survey that were not willing to pay apremium for eco-labeled apples are lesslikely to buy eco-labeled apples in the marketexperiment than those consumers who statedthat they were willing to pay a premium foreco-labeled apples If this hypothesis holdsthe likelihood of a real market purchase willbe increased when moving from the low tothe high range of hypothetical valuation
In order to improve the precision of ourassessment we aggregate the rankings ofwillingness to pay for eco-labeled apples intoa dichotomy those who are willing to pay atleast a lower-bound premium (the yes-yesgroup represented by the indicator variableassociated with parameter d2) and those whoare not willing to pay at least the lower-bound premium for eco-labeled apples (therest of the sample and represented by the in-dicator variable with parameter d1) We rec-
TABLE 4Revealed P reference Equation
Dependent variable Z 5 Choice of Eco-labeled Apple (01)
Parameters Coef cients T-ratio P-values
Regular Discount 0300 2048 0041Organic Discount 0037 0345 0730Education 0485 2253 0024Children 20794 22356 0019Log(Food Safety) 0397 1472 0141d1 22154 22143 0032d2 21549 21688 0092
Notes Percentage of correct predictions 8061 Restricted log-likelihood 25091 Unrestricted log-likelihood 24323
() The coef cient is signi cant at a 5 005 () the coef cient is signi cant at a 5 010
ognize that other aggregation types are possi-ble However we expect that consumers withthe highest ranking or preference of statedWTP would be more likely to purchase theproduct in the market experiment This be-havioral hypothesis follows past studies con-ducted by Johanneson Liljas and Johansson(1998) who test whether the lsquolsquode nitivelyyesrsquorsquo responses are a good predictor of realpurchase decisions Note that this is a conser-vative approach since the analysis is lesslikely to reject the null hypothesis given thatthe lower category (d1) includes people withsome positive WTP
We test this hypothesis based on the re-sults obtained from estimating (1) Formallythe RP model [1] is used to test the followingnull hypothesis on model parameters
H0d1 2 d2 5 0 [2]
Given the assessment as stated above ouralternative hypothesis is the following
H1d1 2 d2 0 [3]
V EMPIRICAL RESULTS
The results from the estimation of the RPmodel [1] are presented in Table 4 All coef- cients with the exception of the coef cientassociated with the discount for organicapples relative to the discount for eco-labeledapples are statistically signi cant to at leastthe 010 level of type I error and the signsmake economic sense The fact that the dis-
79(1) Loureiro McCluskey and Mittelhammer Stated Preferences as Predictors 53
count for organic apples relative to the dis-count for TFA apples is not statistically sig-ni cant is somewhat unexpected This maybe due to the fact that many devoted organicconsumers would not switch to eco-labeledapples even if large discounts were given forthe latter resulting in no signi cant substitu-tion effect between organic and eco-labeledapples for this type of consumer The sig-ni cant factors in the actual purchase deci-sion for eco-labeled apples are the relativediscount (with a positive effect) the presenceof children under 18 years old in the house-hold (with a negative effect) the educationlevel (with a positive effect) and food safetyattitudes (with a positive effect) The resultthat the presence of children in the householdnegatively affects the probability that a con-sumer will choose eco-labeled apples may besomewhat surprising at rst One might ex-pect that consumers with children would buythe eco-labeled product because they maycare about giving their children foods withfewer pesticides and also care about the envi-ronmental quality that their children will ex-perience in the future Getting the oppositeresult suggests that many of the consumersthat would be expected to buy eco-labeledproducts will instead buy organic if they areoffered as a substitute This may be causedby the perception that organic products aresafer for children owing to the association ofthe term organic with no pesticide usage asopposed to only reduced pesticide usage thatis associated with the TFA eco-label
Regarding the value of stated preferencesas predictors of revealed preferences the co-ef cient for the instrumental variable associ-ated with the low range of the WTP (d1) hasa negative effect on the choice of the eco-la-beled apples and is statistically signi cantThe coef cient for the instrumental variableassociated with the high range of stated WTP(d2) is also negative although not statisticallysigni cant Because it is the difference be-tween the former and the latter coef cientsthat represents the marginal impact on pur-chase probabilities the estimated overall ef-fect of higher WTP intensity is positive com-pared with the low range of stated WTP
The estimated coef cients suggest thatstated preferences provide information that
predicts purchase behavior and support thepreceding research hypothesis In order toevaluate the statistical signi cance of this re-sult we test the null hypothesis representedin [2] against the alternative hypotheses in[3] by a t-test of the difference of the instru-mental variable coef cients The calculatedt-value was 22304 with an associated p-value of 0009 providing statistical evidencein favor of rejecting the null hypothesis at a5 001 Coupled with the values of the esti-mated d irsquos satisfying the relationship de-picted in [3] we conclude that consumersrsquostated preferences are effective in predictingactual market behavior
VI CONCLUSIONS AND POLICYIMPLICATIONS
The goal of this paper is to assess whethersurvey responses underlying certain statedpreference (SP) are effective predictors ofmarket behavior For this purpose we col-lected a data set that contains both survey re-sponses and actual purchase decisions fromthe same individuals at roughly the samepoints in time In the revealed preferencemodel we include instrumental variablesthat re ect the magnitude of consumersrsquo hy-pothetical willingness-to-pay We derivethese instrumental variables from consumersrsquostated preferences obtained from a consumersurvey We then analyze the relationship be-tween the hypothetical willingness-to-pay in-tensity and the actual purchase choices
From the results of our analysis of ob-served purchase behavior we nd that thecoef cient associated with the low range ofthe stated WTP variable has a negative andsigni cant effect on the actual purchase deci-sion and the overall marginal impact of thehigh range of stated WTP is positive We testthe statistical signi cance of the different ef-fects of stated WTP on actual purchase be-havior using a t-test The result of this testsupports our research hypothesis that a con-sumer who states that they would pay a pre-mium for a product is more likely to actuallypurchase the product
Our results have implications for policyThe NOAA panel (see Arrow et al 1993) en-courages studies that can validate CV esti-
54 Land Economics February 2003
mates using an RP framework Our resultsshow that those consumers with lower statedpreference rankings are less likely to buy thegood while those with the highest ranking ofstated preferences (the yes-yes group) aremore likely in comparison with the previousgroup to actually pay for the good Howeverdue to the limitations of our data set broadgeneralizations of our results should not bemade
Since there are ndings both for andagainst consistency of RP and SP studies inthe literature more empirical work is neededto better understand under what conditionsand why researchers have come to these dif-fering conclusions The results may dependnot only on whether both sets of preferencesare identical but also on how SP and RP aremeasured and monitored
APPENDIXP aragraph Read to Respondents About
What TFA Stands For
lsquolsquoThe Food Alliance seal of approval identi esproducts that are grown in ways that are environ-mentally and socially responsible including a)protecting and enhancing natural resources b)emphasizing alternatives to pesticides and c) car-ing for the health and well-being of farm workersand rural communitiesrsquo rsquo
Questions Related to P roduce Choice andWilligness to P ay
If you were to buy your favorite apple varietyand you could choose at equal prices and sizesbetween organic TFA-approved and regularapples which one would you choose1 Organic2 TFA-Approved3 Regular
[If TFA apples were the respondentrsquos rst choicethen ask] Now if the price of TFA-apples wereraised [$ centspound] and other apple pricesstayed the same which one would you choose1 Organic2 TFA-Approved3 Regular
[If TFA apples were not the respondentrsquos rstchoice then ask] Now if the price of TFA-appleswere lowered [$ centspound] and other apple
prices stayed the same which one would youchoose1 Organic2 TFA-Approved3 Regular
Questions Related to P erceived Qualityof TFA Apples
How do you think the TFA apples look todaywith respect to the rest of apples in this store1 Above average2 Average3 Below average4 I donrsquot know
Questions Related to Elicitation of FoodSafety P references
When you are purchasing apples and other fruitswhat is the importance of food safety versus ap-pearance and taste on a scale of 1 to 10 where 1means food safety is all important and 10 meansappearance and taste is all important (CIRCLEJUST ONE)
1 2 3 4 5 6 7 8 9 10
References
Adamowicz W L J Louviere M Williams1994 lsquolsquoCombining Revealed and Stated Pref-erence Methods for Valuing EnvironmentalAmenitiesrsquo rsquo Journal of Environmental Eco-nomics and Management 26 (3) 271ndash92
Arcones M A and E Gine 1992 lsquolsquoOn theBootstrap of M-Estimators and Others Statisti-cal Functionalsrsquorsquo In Exploring the Limits ofthe Bootstrap ed R LePage and L BillardNew York John Wiley and Sons
Arrow K J R Solow P R Portney E ELeamer R Radner and E Howard Schuman1993 Report of the NOAA Panel on Contin-gent Valuation Federal Register 58 (10)4601ndash14
Blumenschein K Johannesson M G C Blom-quist B Liljas and R M OrsquoConor 1998lsquolsquoExperimental Results on Expressed Certaintyand Hypothetical Bias in Contingent Valua-tionrsquo rsquo Southern Economic Journal 65 (1)169ndash77
Carson R T N E Flores K M Martin and JL Wright 1996 lsquolsquoContingent Valuation andRevealed Preferences Methodologies Com-paring the Estimates for Quasi-Public GoodsrsquorsquoLand Economics 72 (Feb) 80ndash99
79(1) Loureiro McCluskey and Mittelhammer Stated Preferences as Predictors 55
Cummings R G D S Brookshire and W DSchulze eds 1986 Valuing EnvironmentalGoods A State of the Arts Assessment of theContingent Method Totowa NJ Rowmanand Allanheld
Cummings R G Harrison G W and E E Rut-strom 1995 lsquolsquoHomegrown Values and Hypo-thetical Surveys Is the Dichotomous ChoiceApproach Incentive-Compatible rsquorsquo AmericanEconomic Review 85 (1) 260ndash66
Cummings R G S Elliott G W Harrison andJ Murphy 1997 lsquolsquoAre Hypothetical Refer-enda Incentive Compatiblersquo rsquo Journal of Polit-ical Economy 105 (3) 609ndash21
Efron B 1979 lsquolsquoBootstrap Methods AnotherLook at the Jackknifersquo rsquo Annals of Statistics 7(1) 1ndash26
Efron B and R J Tibshirani 1993 An Intro-duction to the Bootstrap London Chapmanand Hall
Johannesson M B Liljas and PO Johans-son 1998 lsquolsquoAn Experimental Comparison ofDichotomous Choice Contingent Valuation
Questions and Real Purchase Decisionsrsquo rsquo Ap-plied Economics 30 (5) 643ndash47
Loomis J 1993 lsquolsquoAn Investigation into the Reli-ability of Intended Visitation Behaviorrsquo rsquo Envi-ronmental and Resource Economics 3 (2)183ndash91
Loomis J T Brown B Lucero and George Pe-terson 1996 lsquolsquoImproving Validity Experi-ments of Contingent Valuation Methods Re-sults of Efforts to Reduce the Disparity ofHypothetical and Actual Willingness to Payrsquo rsquoLand Economics 72 (Nov) 450ndash61
Mitchell R C and R T Carson 1989 UsingSurveys to Value Public Goods The Contin-gent Valuation Method Baltimore Johns Hop-kins University Press for Resources for the Fu-ture
Randall A 1994 lsquolsquoA Dif culty with the TravelCost Methodrsquo rsquo Land Economics 70 (Feb)88ndash96
Smith V 1993 lsquolsquoNonmarket Valuation of Envi-ronmental Resources An Interpretive Ap-praisalrsquo rsquo Land Economics 69 (Feb) 1ndash26
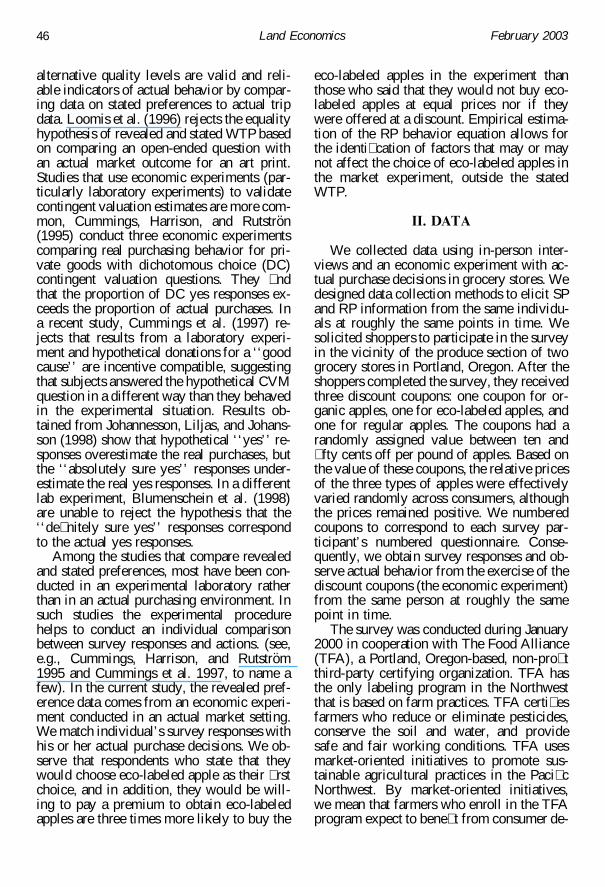
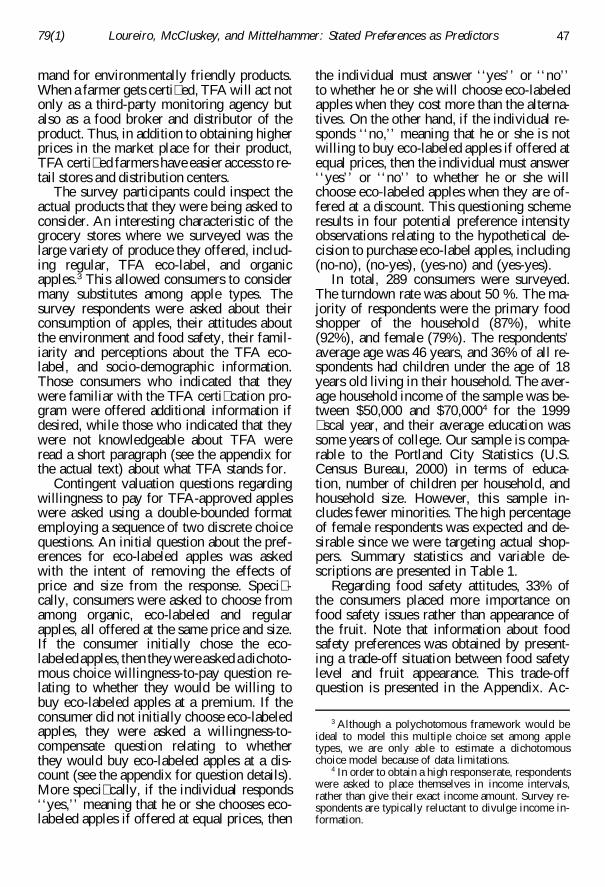
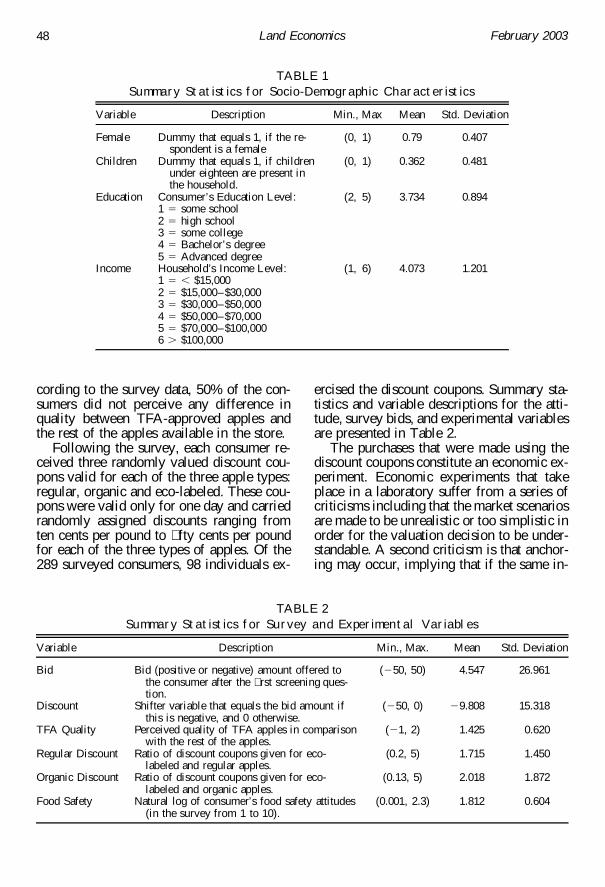
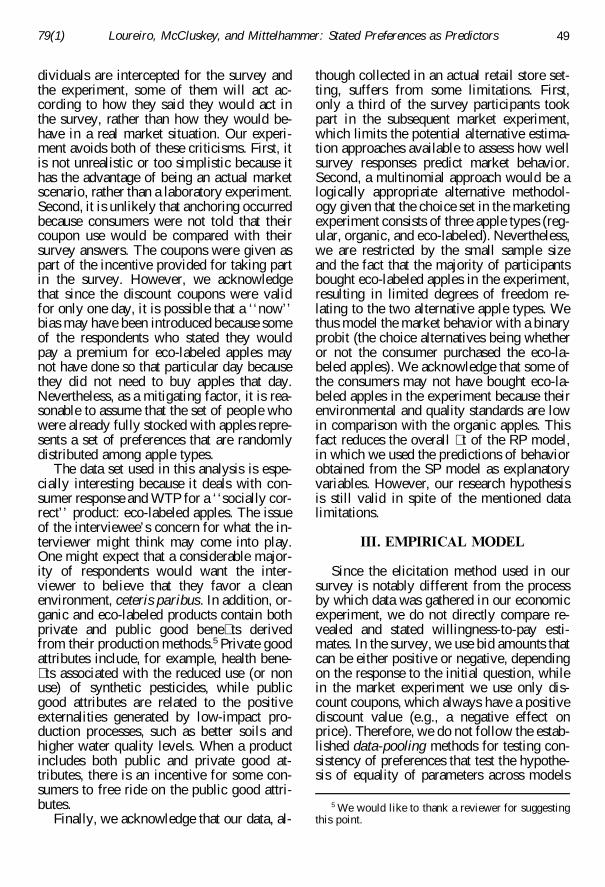
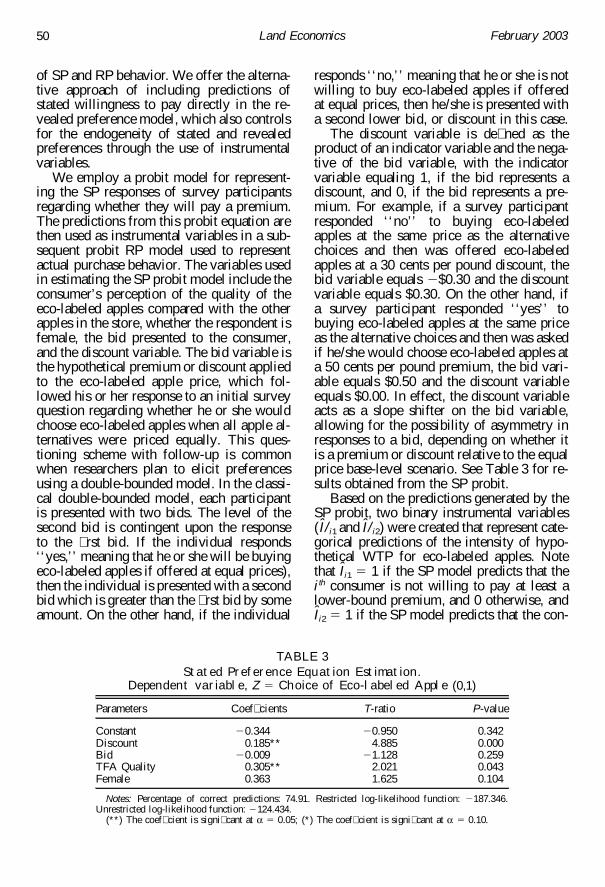
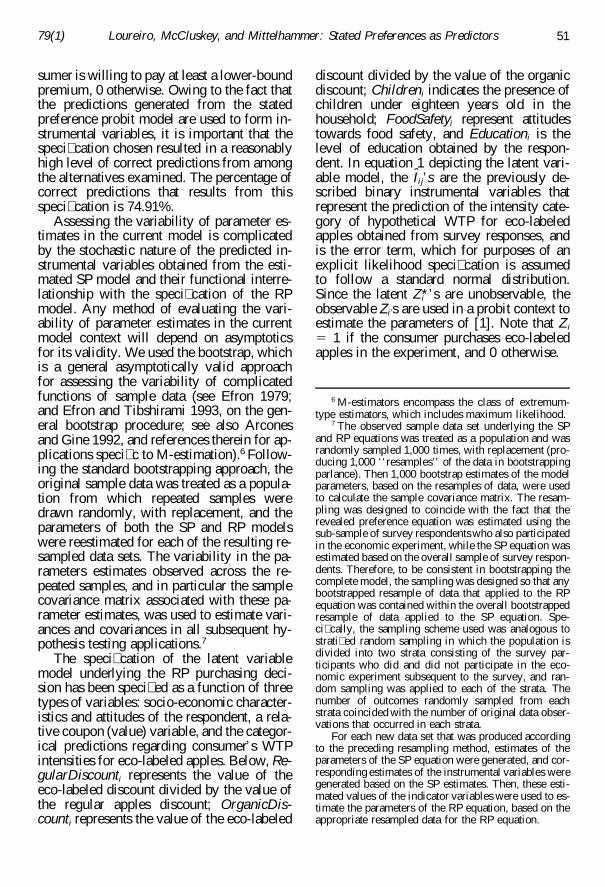
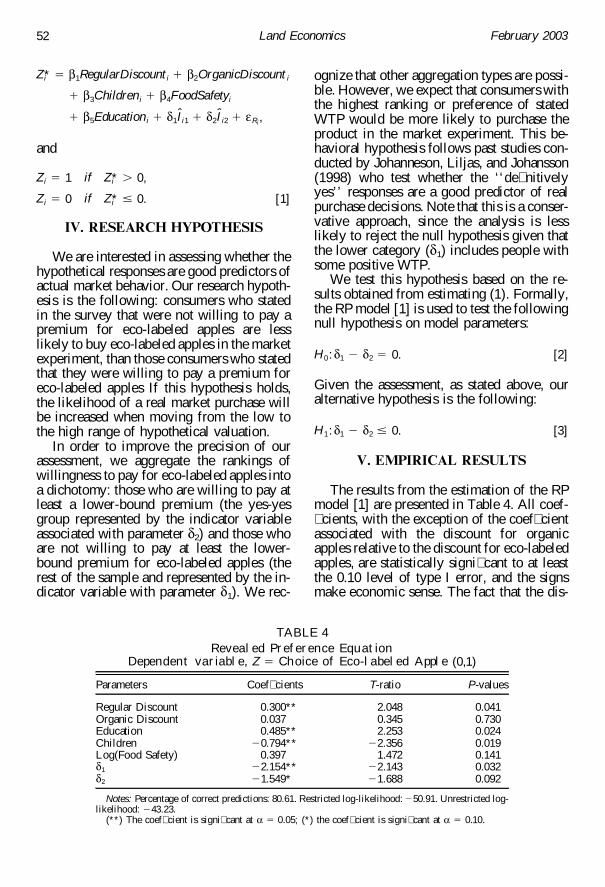