
Identifying transdiagnostic predictors and mechanisms of ...
488
Identifying transdiagnostic predictors and mechanisms of treatment response to repetitive transcranial magnetic stimulation over the dorsomedial prefrontal cortex by Katharine Dunlop A thesis submitted in conformity with the requirements for the degree of Doctor of Philosophy Institute of Medical Science University of Toronto © Copyright by Katharine Dunlop, 2018
-
Upload
khangminh22 -
Category
Documents
-
view
0 -
download
0
Transcript of Identifying transdiagnostic predictors and mechanisms of ...
Identifying transdiagnostic predictors and mechanisms of treatment response to repetitive transcranial magnetic
stimulation over the dorsomedial prefrontal cortex
by
Katharine Dunlop
A thesis submitted in conformity with the requirements for the degree of Doctor of Philosophy
Institute of Medical Science University of Toronto
© Copyright by Katharine Dunlop, 2018
ii
Identifying transdiagnostic predictors and mechanisms of treatment response to repetitive transcranial magnetic stimulation
over the dorsomedial prefrontal cortex Katharine Dunlop
Doctor of Philosophy Institute of Medical Science
University of Toronto 2018
Abstract
There are new treatment options, such as repetitive transcranial magnetic stimulation
(rTMS), for patients with longstanding, treatment-resistant mental illness. Identifying brain
markers predictive of, and changes associated with, rTMS treatment response could improve
patient selection and thus outcomes to this intervention. Transdiagnostic abnormalities in brain
networks for attention (e.g., salience network, SN) and cognitive control have been described,
and the dorsomedial prefrontal cortex (dmPFC) as a potential therapeutic target. The aim of this
thesis was to identify pre-treatment abnormalities of the SN and dmPFC that predicted and
changed with response to dmPFC-rTMS, across three psychiatric disorders: eating disorders
(ED), obsessive-compulsive disorder (OCD), and treatment-resistant depression (TRD). All three
patient groups showed significant clinical benefit following dmPFC-rTMS, although TRD
response was not superior to placebo. Baseline dmPFC resting state functional MRI functional
connectivity (FC) in the SN correlated with the clinical response to dmPFC-rTMS across all
three disorders. FC change in the SN also accompanied symptomatic improvement in OCD and
ED. In TRD patients who received either active or placebo dmPFC-rTMS, clinical response was
associated with normalized between-network functional connectivity between the SN and the
ventromedial network (VMN), implicated in emotion processing. These findings emphasize the
role of the SN as a transdiagnostic substrate of psychiatric disorders, while at the same time

iii
underscoring the significance of inter-individual variability in SN FC for predicting response and
characterizing mechanisms of improvement on rTMS. These findings also highlight the
importance of FC changes between networks responsible for emotion processing and cognitive
control associated with treatment-non-specific symptom improvement. Looking forward, these
results have important implications for understanding common elements of psychopathology
across many psychiatric disorders, and the neurobiological mechanisms of rTMS and other focal
non-invasive brain stimulation techniques.

iv
Acknowledgments I would like to extend my deepest gratitude to my supervisor, Jonathan Downar, for his patience,
generous support and mentorship. I feel privileged to have worked alongside you, and you have
given me every opportunity to learn, collaborate with others, and grow into my own as an
academic. I would also like to acknowledge my committee members, Drs. Karen Davis and
Blake Woodside, for their guidance and unwavering support throughout my degree and in
preparation of this thesis. Thank you for everything!
Translational and clinical research takes a village, and so I am forever indebted to the
outstanding clinical team at the TWH MRI-Guided rTMS Clinic. Huge thank-yous to Sunny for
tirelessly booking and rebooking patients; to Jack, Mike and Iggy for treating all of the patients
in the RCT; and to Terri, Eileen, and Vanathy for managing the administrative aspects of my
research.
I am grateful for the support of the Canadian Institutes of Health Research in awarding me with a
Vanier Canada Graduate Scholarship, and the support of the University of Toronto Collaborative
Program in Neuroscience in awarding me the Jonathan Dostrovsky Award in Neuroscience.
I must also thank my neuroimaging mentors, Drs. Tim Salomons, Adrian Crawley, and Massieh
Moayedi for their support. It was such an honour to have worked alongside you.
To my “Zappies” – thank you and love you guys! It was such a pleasure to have worked with
each of you.
To the patients and healthy controls who dedicated their time in these studies, I thank you for
your kindness, your time, and your support.
Finally, I must acknowledge my cheerleaders: my husband (Sam), parents (Hamish and Martha),
and brother (Graeme) for their unfaltering love and support throughout my degree. Sam – thank
you for your patience, for challenging me through lively discussion and debate, and for your
support in editing my writing.
v
Contributions This project was possible thanks to the contribution of the following individuals:
Dr. Jonathan Downar (supervisor), who provided mentorship and guidance well before my
acceptance into the Institute of Medical Science; oversaw and guided my academic progress;
directed the UHN MRI-Guided rTMS Clinic; recruited and assessed patients involved in this
research; assisted me with the successful completion of this thesis.
Drs. Karen Davis and Blake Woodside (committee members), who offered their support and
mentorship as committee members and collaborators; oversaw the progress of my thesis and
development as an independent scientist.
Drs. Peter Giacobbe, Jeff Daskalakis, Daniel Blumberger, Fidel Vila-Rodriguez, Sidney
Kennedy, Ray Lam, Alastair Flint, Marion Olmsted, and Patricia Colton (PI’s and co-I’s),
who provided guidance as principal investigators and co-investigators for the studies in this
project; referred patients to the UHN MRI-Guided rTMS Clinic.
Drs. Tim Salomons, Massieh Moayedi, Adrian Crawley, and Aaron Kucyi (neuroimaging
mentors), who generously shared their expertise on neuroimaging.
Ms. Terri Cairo and Ms. Eileen Lam (clinical research managers), who helped develop the
clinical framework for Study 1; managed the research lab’s administrative duties.
Ms. Sunny Hong (clinic administrative assistant), who painstakingly scheduled all patients
involved in this research.
Ms. Vanathy Niranjan, Ms. Aisha Dar, Mr. Bernard Ma, Mr. Jack Shen, Mr. Michael
Aiello, Mr. Iggy Uwadiae, and Dr. Umar Dar (rTMS treatments), who provided rTMS
treatments for patients involved in these studies.
Mr. Keith Ta and Mr. Eugen Hlasny (MRI technicians), who acquired neuroimaging data
from all patients and healthy controls.

vi
Dr. Nathan Bakker, Ms. Sarah Peters, Ms. Laura Schulze, Mr. Farrokh Mansouri, Mr.
Peter Fettes, and Mr. Arsalan Mir-Moghtadaei (current and former graduate students), who
assisted with data collection, particularly with all healthy control recruitment and as back-up
assessors for Study 1.
My own contributions included: Study design and data collection for patients and healthy
controls in study 1; healthy control data collection in study 2; neuroimaging, psychometric, and
behavioural data analysis design for all studies 1-3; quality control and inspection for all
anatomical and functional scans, quality control of all clinical and psychometric data;
preprocessing all neuroimaging data using FSL, SPM and MATLAB; performing statistical tests
for all clinical, behavioural, psychometric, and neuroimaging data from all three studies;
visualizing and interpreting all results; and writing this thesis.
This work was funded in part by the Canadian Institutes of Health Research Vanier Scholarship
(2015 - 2018), a School of Graduate Studies Conference Grant, the Collaborative Program in
Neuroscience Jonathan Dostrovsky Award in Neuroscience, a UHN Office of Research Trainees
Conference Travel Award, a Society for Neuroscience Trainee Professional Development
Award, and a WCBR Travel Fellowship.

vii
Table of Contents ACKNOWLEDGMENTS........................................................................................................................................IV
CONTRIBUTIONS.................................................................................................................................................V
TABLEOFCONTENTS.........................................................................................................................................VII
LISTOFTABLES..................................................................................................................................................XII
LISTOFFIGURES...............................................................................................................................................XIII
LISTOFABBREVIATIONS...................................................................................................................................XVI
LITERATUREREVIEW...................................................................................................................................1
INTRODUCTION&GENERALAIMS......................................................................................................................1 INTRINSICFUNCTIONALNETWORKSOFTHEBRAIN.................................................................................................3
HistoricalandPhilosophicalPerspectivesofBrainConnectivity............................................................3
WhatareIntrinsicBrainNetworks?.......................................................................................................5 RelationshipofFunctionalNetworkstoBrainStructure........................................................................5 RelationshipofFunctionalNetworkstoHumanBehaviour...................................................................6 RelationshipofFunctionalNetworkstoElectrophysiologicalStudies...................................................7
FunctionalNetworksPertinenttotheNeurobiologyofPsychiatricDisorders.......................................9 HowdoIBNsIntegrateInformationAcrossNetworks?.......................................................................23
PSYCHIATRICDISORDERSINTHECONTEXTOFBRAINNETWORKCONNECTIVITY.........................................................30
DefiningAbnormalBrainConnectivity.................................................................................................30 TransdiagnosticAlterationsofBrainNetworks...................................................................................31
PSYCHOPATHOLOGY1:MAJORDEPRESSIVEDISORDER.........................................................................................34
MDDDiagnosis....................................................................................................................................35 MDDPrevalence..................................................................................................................................36 MDDEtiology.......................................................................................................................................36 MDDComorbidity................................................................................................................................37
AssessmentofTreatmentSeverity......................................................................................................37 StructuralandFunctionalDisruptionsinMDD....................................................................................39
PSYCHOPATHOLOGY2:OBSESSIVE-COMPULSIVEDISORDER...................................................................................42
OCDDiagnosis.....................................................................................................................................43 OCDPrevalence...................................................................................................................................43 OCDEtiology........................................................................................................................................44 OCDComorbidity.................................................................................................................................44
AssessmentofSymptomSeverity........................................................................................................45
viii
StructuralandFunctionalAbnormalitiesofOCD.................................................................................45 PSYCHOPATHOLOGY3:ANOREXIANERVOSAANDBULIMIANERVOSA......................................................................47
DiagnosisofAnorexiaandBulimiaNervosa........................................................................................48 ANandBNPrevalence.........................................................................................................................49 EtiologyofANandBN.........................................................................................................................50 ANandBNComorbidity.......................................................................................................................50
AssessmentofSymptomSeverity........................................................................................................51 StructuralandFunctionalAbnormalitiesinANandBN.......................................................................52
TRANSCRANIALMAGNETICSTIMULATIONASAPROBEOFIBNS..............................................................................55
WhatisTranscranialMagneticStimulation?......................................................................................55 ApplicationsofrTMSasaNetwork-Probe...........................................................................................60 TherapeuticApplicationsofrTMS........................................................................................................63
CLINICALAPPLICATIONSOFRTMS....................................................................................................................64 TreatmentResistantMDD...................................................................................................................64 Obsessive-CompulsiveDisorder...........................................................................................................71 AnorexiaandBulimiaNervosa............................................................................................................75
IMPROVINGRTMSRESPONSE.........................................................................................................................79 NumberofTotalTreatmentSessions..................................................................................................80 NumberofDailyTreatmentSessions...................................................................................................80
NeuronavigationDuringrTMS.............................................................................................................81 NovelStimulatoryProtocols................................................................................................................82 NovelrTMSStimulationTargetsinPsychiatricIllness.........................................................................84 Summary:PsychiatricIllness,IBNs,andrTMSTreatments..................................................................85
PREDICTINGTREATMENTRESPONSE..................................................................................................................85 WhyPredictTreatmentResponse?.................................................................................................85 ClinicalPredictorsofResponsetoConventionalInterventions.......................................................86
IBNPredictorsofResponsetoConventionalInterventions.............................................................89 PredictorsofResponsetorTMS......................................................................................................91
CHARACTERIZINGMECHANISMSOFTREATMENTRESPONSE...................................................................................94
WhyCharacterizeMechanismsofTreatmentResponse?...............................................................94 IBNChangesinResponsetoConventionalInterventions................................................................95 MechanismsofClinicalResponsetoDLPFC-rTMS..........................................................................97
MRIANDRESTING-STATEFUNCTIONALMRIMETHODS.....................................................................................100
Blood-OxygenLevelDependentfMRIPhysiology.........................................................................100 Resting-StateFunctionalMRI.......................................................................................................104 rs-fMRIPreprocessing...................................................................................................................106
ix
StatisticalMethodstoCharacterizeIBNs......................................................................................111 ConsiderationsforSelectingtheOptimalrsFCMethod................................................................120
AssessingGroup-LevelComparisonsAcrossSubjects...................................................................121 SUMMARY.................................................................................................................................................123
RATIONALE,SPECIFICAIMS&HYPOTHESES.............................................................................................128
GENERALAIMS&APPROACH........................................................................................................................128
RATIONALEFORASEED-TO-VOXEL-BASEDRSFCAPPROACH................................................................................129 STUDYI.BASELINEPREDICTORSANDMECHANISMSOFDMPFC-RTMSRESPONSEINANOREXIAANDBULIMIANERVOSA134
RationaleofStudyI............................................................................................................................134
SpecificAimsofStudyI......................................................................................................................135 HypothesesofStudyI........................................................................................................................136
STUDYII.BASELINEPREDICTORSANDMECHANISMSOFDMPFC-RTMSRESPONSEINOBSESSIVE-COMPULSIVEDISORDER....
136 StudyRationale..................................................................................................................................136 SpecificAimsofStudyII.....................................................................................................................137 HypothesesofStudyII.......................................................................................................................137
STUDYIII:BASELINEPREDICTORSANDMECHANISMSOFHIGH-ANDLOW-FREQUENCYDMPFC-RTMSINTRDUNDER
TRIPLE-BLINDSHAMCONTROLLEDSETTINGS....................................................................................................................138 RationaleofStudyIII..........................................................................................................................138
SpecificAimsofStudyIII....................................................................................................................139 HypothesesofStudyIII......................................................................................................................139
GENERALMETHODS................................................................................................................................140
PROJECTOVERVIEW....................................................................................................................................140
SUBJECTRECRUITMENT................................................................................................................................141 MRIANDRS-FMRIACQUISITION...................................................................................................................142 MOTORTHRESHOLDASSESSMENT..................................................................................................................143
DMPFC-RTMSTREATMENT..........................................................................................................................143
STUDYI:BASELINEPREDICTORSANDMECHANISMSOFDMPFC-RTMSRESPONSEINANOREXIAAND
BULIMIANERVOSA...........................................................................................................................................147
INTRODUCTION...........................................................................................................................................147 AIMS&HYPOTHESES...................................................................................................................................149
SpecificAimsofStudyI......................................................................................................................149 HypothesesofStudyI........................................................................................................................149
METHODS..................................................................................................................................................150

x
Subjects..............................................................................................................................................150 ClinicalOutcomes..............................................................................................................................151
NeuroimagingAcquisition.................................................................................................................151 NeuronavigationandrTMSTreatment..............................................................................................152 MRIPreprocessing,SeedSelection&StatisticalAnalysis..................................................................152
RESULTS....................................................................................................................................................153
PrimaryClinicalOutcomes.................................................................................................................153 SecondaryClinicalOutcomes.............................................................................................................156 FunctionalConnectivityPredictorsofResponse................................................................................157
FunctionalConnectivityChangesAssociatedwithResponse.............................................................159 DISCUSSION&CONCLUSION.........................................................................................................................162
STUDYII:BASELINEPREDICTORSANDMECHANISMSOFDMPFC-RTMSRESPONSEINOCD......................168
INTRODUCTION...........................................................................................................................................168 AIMS&HYPOTHESES...................................................................................................................................170
SpecificAimsofStudyII.....................................................................................................................170 HypothesesofStudyII.......................................................................................................................170
METHODS..................................................................................................................................................171 Subjects..............................................................................................................................................171 ClinicalMeasures...............................................................................................................................172
Intervention.......................................................................................................................................172 NeuroimagingAcquisitionandAnalysis............................................................................................173
RESULTS....................................................................................................................................................177 ClinicalOutcomes..............................................................................................................................177
Resting-StatefMRIPredictorsofTreatmentResponse......................................................................180 Resting-StatefMRICorrelatesofTreatmentResponse.....................................................................186
DISCUSSION&CONCLUSION.........................................................................................................................191
STUDYIII:BASELINEPREDICTORSANDMECHANISMSOFHIGH-ANDLOW-FREQUENCYDMPFC-RTMSIN
TRDUNDERTRIPLE-BLINDSHAMCONTROLLEDSETTINGS................................................................................196
INTRODUCTION...........................................................................................................................................196
AIMS&HYPOTHESES...................................................................................................................................198 SpecificAimsofStudyIII....................................................................................................................198 HypothesesofStudyIII......................................................................................................................199
METHODS..................................................................................................................................................199
PatientRecruitment...........................................................................................................................200 PrimaryClinicalMeasures.................................................................................................................201
xi
RandomizationandrTMSTreatment................................................................................................201 MRIAcquisitionandAnalysis.............................................................................................................203
SupplementaryClinicalMeasures......................................................................................................206 HealthyControlRecruitment&StudyVisits......................................................................................207
RESULTS....................................................................................................................................................208 DemographicandPrimaryClinicalResults........................................................................................208
SupplementaryClinicalResults..........................................................................................................216 BaselineDifferencesinrs-fMRIfunctionalconnectivity.....................................................................218 Changesinrs-fMRI............................................................................................................................227
DISCUSSION&CONCLUSION.........................................................................................................................230
GENERALDISCUSSION.............................................................................................................................236
SUMMARYOFRESULTSANDCOMPARISONTOHYPOTHESES................................................................................236
IMPLICATIONSFORTHETREATMENTOFPSYCHIATRICDISORDERS..........................................................................243 COMPARINGTHECLINICALEFFICACYOFDMPFC-RTMSTODLPFC-RTMS............................................................249 DMPFC-RTMSASATRANSDIAGNOSTICINTERVENTIONINPSYCHIATRICILLNESS......................................................251 TRANSDIAGNOSTICEFFICACYOFDMPFC-RTMS:ABIOLOGICALPERSPECTIVE.........................................................252
FRONTOSTRIATALFUNCTIONALCONNECTIVITYASAPOTENTIALTRANSDIAGNOSTICBIOMARKEROFDMPFC-RTMS
RESPONSE................................................................................................................................................................255 DMPFC-RTMSRESPONSECORRELATESWITHCSTCCONNECTIVITYCHANGE.........................................................258
TREATMENTNON-SPECIFICCLINICALRESPONSEINTRDISRELATEDTOEMOTIONREGULATIONANDIMPULSIVITY.........260 LIMITATIONSANDCHALLENGES......................................................................................................................262
CONCLUSION...........................................................................................................................................268
FUTUREDIRECTIONS...............................................................................................................................269
REFERENCES.....................................................................................................................................................274
APPENDICES.....................................................................................................................................................390
COPYRIGHTACKNOWLEDGEMENTS..................................................................................................................470
xii
List of Tables Table 4-1: Descriptive Statistics for all patients, rTMS responders and non-responders. .......... 154
Table 4-2: Brain regions where pre-treatment functional connectivity to dmPFC and dACC seeds
differed significantly between rTMS responders and non-responders. ...................................... 159
Table 4-3: Brain regions where the change in functional connectivity to dACC and dmPFC seed
from pre- to post-treatment differed significantly between rTMS responders and non-responders.
..................................................................................................................................................... 162
Table 5-1: Centre of gravity coordinates for regions of interest created from parcellation atlases,
and MNI coordinates for sphere-based regions of interest. ........................................................ 175
Table 5-2: Summary of Primary and Secondary Clinical Measures in All Patients, and in Y-
BOCS Responders and Non-Responders. ................................................................................... 179
Table 5-3: Brain regions where baseline resting-state functional connectivity to exploratory seed
regions differed significantly between responders and non-responders. .................................... 184
Table 5-4: Brain regions where the pre-to-post treatment change in functional connectivity to the
dmPFC that differed significantly between rTMS responders and non-responders. .................. 187
Table 5-5: Brain regions where the pre-to-post treatment change in functional connectivity to
exploratory ROIs that differed significantly between rTMS responders and non-responders ... 189
Table 6-1: Summary of demographic and primary clinical outcomes for healthy controls and
TRD treatment arms. ................................................................................................................... 211
Table 6-2: Summary of concomitant medications by treatment intervention. ............................ 212
Table 6-3: Summary of psychiatric comorbidities. ..................................................................... 213
Table 6-4: Summary of Baseline Secondary Clinical Outcomes ................................................ 215
Table 6-6: Summary of Post-Treatment Secondary Clinical Outcomes. .................................... 220
xiii
List of Figures
Figure 1-1: The Default Mode Network. ...................................................................................... 10
Figure 1-2: The Salience Network. ............................................................................................... 14
Figure 1-3: The Central Executive Network. ................................................................................ 19
Figure 1-4: The Affective Ventromedial Network. ...................................................................... 21
Figure 1-5: Overview of the general structural and pathways of cortico-striato-thalamo-cortical
circuits. .......................................................................................................................................... 25
Figure 1-6: Regions of frontal cortex that have cortico-striatal projections. ................................ 26
Figure 1-7: Rostrocaudal organization of frontostriatal inputs. .................................................... 27
Figure 1-8: Schematic of the Triple Network Theory of Psychopathology. ................................. 34
Figure 1-9: Example of a TMS system. ........................................................................................ 56
Figure 1-10: Configuration of an angled figure-of-eight rTMS head coil. ................................... 57
Figure 1-11: Areas of striatal dopamine release following active dmPFC-rTMS.. ...................... 62
Figure 1-12: Decreases in cerebral blood flow following active dmPFC-rTMS. ......................... 62
Figure 1-13: Targeting the dmPFC and dACC with rTMS. ......................................................... 71
Figure 4-1: Probability distribution function of binge and purge percent improvement across all
patients following dmPFC-rTMS. .............................................................................................. 156
Figure 4-2: Baseline functional connectivity differences between dmPFC-rTMS Responders and
Non-Responders. ......................................................................................................................... 159
Figure 4-3: Changes in functional connectivity in dmPFC-rTMS Responders and Non-
Responders. ................................................................................................................................. 162
xiv
Figure 5-1: Regions of interest created from parcellation atlases and coordinates. ................... 177
Figure 5-2: Probability distribution function (a) and ranked individual-patient plot (b) of
treatment outcomes for dmPFC-rTMS in OCD.. ........................................................................ 179
Figure 5-3: High baseline frontal-striatal-thalamic-subthalamic connectivity predicts response to
dmPFC-rTMS in OCD. ............................................................................................................... 183
Figure 5-4: Reductions in cortical-striatal-thalamic connectivity correlate to improvements in
OCD symptoms following dmPFC-rTMS. ................................................................................. 189
Figure 6-1: The custom MagVenture active/placebo coil. .......................................................... 204
Figure 6-2: Regions of interest used for seed-to-voxel based analyses. ..................................... 206
Figure 6-3: CONSORT diagram of patients enrolled in the study. ............................................ 211
Figure 6-4: Mean HAMD scores across the three treatment interventions. ............................... 214
Figure 6-5: Mean BDI-II scores across the three treatment interventions. ................................. 215
Figure 6-6: Mean BAI scores across the three treatment intervention. ...................................... 215
Figure 6-7: DERS improvement is significantly correlated with antidepressant response on the
BDI-II across all subjects. ........................................................................................................... 218
Figure 6-8: DERS improvement is significantly correlated with antidepressant response on the
BDI-II in the active 20 Hz arm. .................................................................................................. 219
Figure 6-9: Regions showing significantly lower resting-state functional connectivity to the
inferior ventral striatal seed in controls versus all MDD patients. ............................................. 222
Figure 6-10: Regions showing significantly lower resting-state functional connectivity to the
VMPFC seed in controls versus all MDD patients. .................................................................... 223
Figure 6-11: Regions showing significantly higher resting-state functional connectivity to the
dorsal caudate seed in the 20 Hz versus other MDD treatment arms. ........................................ 224
xv
Figure 6-12: Regions where baseline rsFC to ventral striatum showing significantly different
correlations to BDI-II improvement across the three treatment groups. .................................... 225
Figure 6-13: Regions where baseline rsFC to VMPFC showed significant correlations to BDI-II
improvement in all three treatment groups. ................................................................................ 226
Figure 6-14: Regions where baseline rsFC to Superior VS showed significant correlations to
HAMD improvement to 20 Hz dmPFC-rTMS. .......................................................................... 227
Figure 6-15: Regions where baseline rsFC to Inferior VS showed significant correlations to BDI-
II improvement to 20 Hz dmPFC-rTMS. .................................................................................... 228
Figure 6-16: Regions of dACC rsFC change showing significantly different correlations to
HAMD improvement across the three treatment groups. ........................................................... 230
Figure 6-17: Regions of VMPFC rsFC change showing a significant positive correlation to BDI-
II improvement in all three treatment groups. ............................................................................ 231
Figure 7-1: Summary of differences in pre-treatment resting-state functional connectivity
differences between dmPFC-rTMS responders and non-responders for AN-BP/BN, OCD and
TRD............................................................................................................................................. 240
Figure 7-2: Summary of pre- to post-treatment changes in resting-state functional connectivity
that accompany dmPFC-rTMS response in AN-BP/BN, OCD and TRD. ................................. 243
xvi
List of Abbreviations ACC Anterior Cingulate Cortex AI Anterior Insula ALFF Amplitude of Low Frequency Fluctuations AN Anorexia Nervosa AN-BP Anorexia Nervosa, Binge/Purge Subtype AN-R Anorexia Nervosa, Restricting Subtype BA Brodmann Area BAI Beck Anxiety Inventory BDI-II Beck Depression Inventory II BDNF Brain-Derived Neurotrophic Factor BIS-11 Barratt Impulsiveness Scale BIS/BAS Behavioural Inhibition Scale/Behavioural Approach Scale BMI Body Mass Index BN Bulimia Nervosa BOLD Blood Oxygen Level Dependent CBT Cognitive Behavioural Therapy CEN Central Executive Network CSTC Cortico-Striato-Thalamo-Cortical cTBS Continuous Theta Burst Stimulation dACC Dorsal Anterior Cingulate Cortex DAN Dorsal Attention Network DBS Deep Brain Stimulation DERS Difficulties in Emotion Regulation Scale DLPFC Dorsolateral Prefrontal Cortex DMN Default Mode Network dmPFC Dorsomedial Prefrontal Cortex DSM-IV Diagnostic and Statistical Manual, fourth edition DSM-5 Diagnostic and Statistical Manual, fifth edition dTMS Deep Transcranial Magnetic Stimulation ECoG Electrocorticography ECT Electroconvulsive Therapy ED Eating Disorders EDE Eating Disorder Examination EDE-Q Eating Disorder Example - Questionnaire EEG Electroencephalography ERP Exposure and Response Prevention fALFF Fractional Amplitude of Low Frequency Fluctuations FC Functional Connectivity FDG-PET Fludeoxyglucose Positron Emission Tomography FDR False Discovery Rate fMRI Functional Magnetic Resonance Imaging FOV Field of View FSL FMRIB Software Library FWE Family-Wise Error FWHM Full Width Half Maximum GABA γ-Aminobutyric Acid
xvii
GPe Globus Pallidus, External Segment GPi Globus Pallidus, Internal Segment GSR Global Signal Regression HAMD Hamilton Rating Scale for Depression IBN Intrinsic Brain Network ICA Independent Component Analysis ICD-10 International Statistical Classification of Behavioral Disorders, tenth edition IDS Inventory of Depressive Symptoms IFG Inferior Frontal Gyrus IPL Inferior Parietal Lobule IPT Interpersonal Therapy lOFC Lateral Orbitofrontal Cortex ISI Inter-Stimulus Interval iTBS Intermittent Theta Burst Stimulation LFP Local Field Potential LTD Long-Term Depression LTP Long-Term Potentiation M1 Primary Motor Cortex MAO Monoamine Oxidase Inhibitors MBCT Mindfulness-Based Cognitive Therapy MCQ Monetary-Choice Questionnaire MDD Major Depressive Disorder MDT Medial Dorsal Thalamus MEG Magnetoencephalography MEP Motor-Evoked Potential MINI Mini International Neuropsychiatric Interview MNI Montreal Neurological Institute mOFC Medial Orbitofrontal Cortex mPFC Medial Prefrontal Cortex MPS Multidimensional Perfectionism Scale MRI Magnetic Resonance Imaging MSN Medium Spiny Neuron MST Magnetic Seizure Therapy NAc Nucleus Accumbens NDRI Norepinephrine-Dopamine Reuptake Inhibitors NEO Revised NEO Questionnaire OCD Obsessive-Compulsive Disorder OFC Orbitofrontal Cortex PCC Posterior Cingulate Cortex PET Positron Emission Tomography PHQ-9 Patient Health Questionnaire-9 QIDS Quick Inventory of Depressive Symptoms QPS Quadripulse Stimulation rACC Rostral Anterior Cingulate Cortex rCBF Regional Cerebral Blood Flow RDoC Research Domain Criteria ReHo Regional Homogeneity rs-FC Resting-State Functional Connectivity

xviii
rs-fMRI Resting-State Functional Magnetic Resonance Imaging ROI Region of Interest RRS Rumination Responses Scale rTMS Repetitive Transcranial Magnetic Stimulation RTPJ Right Temporoparietal Junction SCID-I Structured Clinical Interview for DSM-IV-Axis-I Disorders SD Standard Deviation sgACC Subgenual Anterior Cingulate Cortex SMA Supplementary Motor Area SN Salience Network SNc Substantia Nigra, Pars Compacta SNr Substantia Nigra, Pars Reticulata SNRI Serotonin-Norepinephrine Reuptake Inhibitors SSRI Selective Serotonin Reuptake Inhibitors STAR*D Sequenced Treatment Alternatives to Relieve Depression STN Subthalamic Nucleus TBS Theta Burst Stimulation TCA Tricyclic Antidepressants tDCS Transcranial Direct Current Stimulation TE Echo Time TI Inversion Time TMS Transcranial Magnetic Stimulation TR Repetition Time TRD Treatment-Resistant Depression UPPS-P UPPS Impulsive Behaviour Scale VAN Ventral Attention Network VLPFC Ventrolateral Prefrontal Cortex VMN Ventromedial Affective Network VMPFC Ventromedial Prefrontal Cortex VNS Vagal Nerve Stimulation VRP Ventral Rostral Putamen VS Ventral Striatum VSi Inferior Ventral Striatum VSs Superior Ventral Striatum VTA Ventral Tegmental Area Y-BOCS Yale-Brown Obsessive-Compulsive Scale II
Literature Review
Introduction & General Aims In 2013, Statistics Canada reported that approximately 1 in 10 Canadians (2.8 million
people) met criteria for at least one mental illness or substance use disorder in the past 12
months, while approximately 1 in 3 Canadians (9.1 million people) met the lifetime criteria for a
mental illness or substance use disorder (Pearson et al, 2013). Given this high prevalence, the
burden of these illnesses is likewise remarkably high. In Canada, the total economic burden of all
mental illness was estimated at $51 billion in 2003 (Lim et al, 2008), and in Ontario, the
economic burden for major depressive disorder alone was greater than the burden of breast,
colorectal, lung, and prostate cancer combined (Ratnasingham et al, 2013). Despite the
substantial prevalence of these disorders and their associated personal and economic costs, there
has been limited progress in developing new treatment options, and even more limited progress
in improving long-term clinical outcomes, over the past 50 years. New treatment approaches, and
methods to select the optimal treatment for any given patient, are urgently needed – especially
for those patients who are unresponsive to conventional pharmacotherapy and psychotherapy.
In the 1990s, non-invasive neuromodulation emerged as a potential novel treatment for
psychiatric patients who do not respond to conventional medications or psychotherapies. One
such intervention, repetitive transcranial magnetic stimulation (rTMS), uses focused, powerful
magnetic field pulses to induce changes in the activity of targeted and downstream brain regions.
A course of several weeks of daily stimulation can achieve therapeutic effects in patients
unresponsive to conventional psychotherapy and pharmacotherapy. Following the first
demonstrations of the efficacy of rTMS for major depression in the mid-1990s (George et al,
1995; Pascual-Leone et al, 1996b), subsequent studies suggested that other disorders including
mood, anxiety, and eating disorders, may be improved by rTMS (Lefaucheur et al, 2014). Given
the favorable safety and tolerability profile of rTMS, the hope was that this intervention might at
last deliver a meaningful improvement in outcomes over our longstanding, conventional
approaches of pharmacotherapy and psychotherapy.
However, despite 20 years of research into therapeutic rTMS, response rates have
remained low compared to more intensive neuromodulation treatments such electroconvulsive
2
therapy (Micallef-Trigona, 2014; Xie et al, 2013), and only a subset of patients who undergo
rTMS achieve full remission. This limited efficacy may arise in part from the substantial
heterogeneity of clinical features and neurobiological abnormalities seen among patients who
ostensibly meet the formal diagnostic criteria for any given psychiatric disorder (Drysdale et al,
2017). This heterogeneity could impose a ceiling of efficacy on any ‘one-size-fits-all’ rTMS
treatment protocol for a given disorder. As such, a better understanding is needed of the
neurobiological mechanisms of rTMS, and the neurobiological features of those patients for
whom these mechanisms are most effective.
To improve the overall remission rates for rTMS in the clinical setting, it is key to
identify neurobiological predictors and correlates of rTMS treatment response. Neurobiological
markers that can reliably predict which patients will respond to treatment could lead to a
predictive test for clinical treatment planning, reduce the incidence of futile treatment, and
thereby improve remission rates among those patients who undergo rTMS. Similarly,
neurobiological markers that show reliably different changes over the course of treatment in
responders versus non-responders can reveal the neural mechanisms of successful treatment.
Thus, the problem of identifying neural predictors and correlates of rTMS response in psychiatric
illness has important and direct translational significance.
In the early 1990s, functional magnetic resonance imaging (fMRI) and later resting-state
functional MRI (rs-fMRI) arose as a novel, safe, non-invasive, and readily accessible tool to
study and localize task-evoked and spontaneous patterns of activity in the human brain in vivo
(Ogawa et al, 1990; Snyder and Raichle, 2012). To date, over 10,000 studies involving fMRI
have been published, with many of these studies focused on individuals with psychiatric
disorders (Raichle, 2009a). fMRI has provided a groundbreaking tool for characterizing the
abnormalities of brain activity, as well as the abnormalities of connectivity within or between
functional brain networks, that underlie the many varieties of psychiatric illness (for a review,
see (Menon, 2011)). From a translational perspective, the hope is that neuroimaging techniques
such as fMRI might lead to a better understanding of the pathophysiology of psychiatric
illnesses, and eventually to new treatments that might better target these underlying disease
mechanisms.
3
Although there are many tools to study the neurobiological predictors and correlates of
treatment response, rs-fMRI offers several advantages that are specific to the intervention of
rTMS in the psychiatrically ill population. First, fMRI is widely accessible, safe, and non-
invasive. Second, fMRI has relatively good spatial resolution– a key advantage for anatomically
focal interventions. Third, rs-fMRI can be used to track the coordinated activity of networks of
regions across the whole brain. This is important because network activity plays a central role
both in psychopathology (Greicius et al, 2007; Menon, 2011) and in the neurobiological effects
of rTMS (Eldaief et al, 2011; Fox et al, 2013a). As such, rs-fMRI is uniquely well-positioned to
predict rTMS response, and to characterize neural mechanisms of successful versus
unsuccessful rTMS treatment.
Therefore, the goal of this thesis is to identify rs-fMRI predictors and correlates of
treatment response to rTMS across three different categories of psychiatric disorder: eating
disorders, obsessive-compulsive disorder, and major depressive disorder. The potential
translational significance of the work, is to inform the development of predictive tests to reduce
the rates of non-response among patients who undergo treatment, and toward novel treatment
strategies to treat non-responders.
Intrinsic Functional Networks of the Brain “The fact that the body is lying down is no reason for supposing that the mind is
at peace. Rest is… far from restful” – Seneca, ~60 A. D.
Historical and Philosophical Perspectives of Brain Connectivity
Major neuroscientific paradigm shifts are preceded by methodological and technological
advances. A classical example is in Cajal and Sherrington’s reconstruction of neuron histology,
and their proposal that the neuron is the structural and functional unit of the nervous system.
Arguably, this neuron doctrine is a consequence of the development of the light microscope and
Golgi stain (as reviewed by (Yuste, 2015)). Yet in spite of the impact this doctrine had on
4
modern neuroscience, the study of individual neurons alone is necessary but not sufficient for a
holistic understanding of brain function.
Theories surrounding the functional importance of neural networks arose as early as the
1940s, positing that brain function arises as a result of the activation of populations of neurons,
(Hebb, 1949; McCulloch and Pitts, 1943). At the time, models of neuron networks were
strengthened by evidence for structural and and extensive and complex neuronal connectivity,
and the discovery of local cortical processing ‘units’ called cortical columns (Hubel, 1988;
Mountcastle, 1957).
Two opposing views of brain function were conceived alongside the development of the
neuron doctrine by Cajal and Sherrington (as reviewed by (Raichle, 2010)). On one hand,
Sherrington theorized that brain function is reflexively driven by momentary demands in the
environment (bottom-up). Arguably, much of the field of cognitive neuroscience, including its
offshoots within functional neuroimaging, is implicitly underpinned by this theory. For example,
task-based functional neuroimaging involves measuring brain responses to carefully designed
and controlled stimuli. On the other hand, Brown posited that brain activity and function are
intrinsic, meaning that brain function involves the acquisition of information from the
environment and the integration of this information with endogenous ongoing brain activity, with
the purpose of interpreting it, predicting future environmental demands, and responding to
current demands in a top-down fashion.
The discovery of electroencephalography (EEG) and the Berger Block (Berger, 1929)
gave empirical support to the idea that populations of neurons might be associated with
spontaneous, intrinsic oscillations involved with the aforementioned functions. With the further
development of EEG techniques and the advent of fMRI and rs-fMRI in the 1990s and 2000s (as
reviewed by (Raichle, 2009b, 2009a)), spontaneous fluctuations in intrinsic brain networks have
become a mainstream topic of study, aligning well with Brown’s alternative, intrinsic-activity
account of brain function (Buckner, 2012).
5
What are Intrinsic Brain Networks?
The ongoing activity of the human brain as a whole may be organized into a set of brain
networks consisting of regions that are highly functionally connected, meaning that they activate
and deactivate at roughly the same time (Beckmann et al, 2005; Sporns, 2011). In other words,
the two regions possess synchronous activity. While these networks are often labelled as
‘resting-state’ networks (Beckmann et al, 2005), this term is somewhat misleading, as these
networks can be discerned within ongoing brain activity not only while the participant is not
actively engaged in a particular task (from spontaneous fluctuations in brain activity, or at ‘rest’)
(Beckmann et al, 2005; Damoiseaux et al, 2006; Greicius et al, 2003), but also while the
participant is engaged actively in a cognitive or behavioural task (Cole et al, 2014; Krienen et al,
2014). Consequently, this thesis will refer to these networks as intrinsic brain networks (IBNs):
distinct sets of functionally (and potentially structurally) coupled regions whose activity is
correlated over time, either at rest or on task (Yeo et al, 2011). The topological patterns of IBNs
are highly replicable, with general topology congruent both across subjects (Beckmann et al,
2005; Cole et al, 2010a; Damoiseaux et al, 2006) and within a single subject (Laumann et al,
2015).
Although the precise number of IBNs is still a matter of debate, 7-20 IBNs can be
distinguished consistently across large samples of. For example, one large scale study of
neuroimaging data from the Human Connectome Project in 000 individuals identified seven
reproducible cortical IBNs that could be further subdivided into 17 sub-IBNs (Yeo et al, 2011).
Studies from the same group also reported IBN-specific subdivisions in the striatum (Choi et al,
2012) and cerebellum (Buckner et al, 2011). This set of 7 or 17 IBNs provides a preliminary
reference ‘atlas’ of the major IBNs that can be used to understand the psychopathology and/or
the therapeutic mechanisms of rTMS.
Relationship of Functional Networks to Brain Structure
IBNs identified from the functional coupling of activity across distant brain regions are
hypothesized to reflect the underlying structural (white matter) architecture of the brain between
these regions. Multiple studies have found close coherence in terms of the underlying white
6
matter architecture of the brain and the functional coupling of cortical regions during various
task paradigms and during spontaneous fluctuations of brain activity (Greicius et al, 2009; van
den Heuvel et al, 2009). Moreover, one study reported that the relative strength of white matter
connections between two regions are indicative of how strong their functional coupling is at rest
(Hermundstad et al, 2013). However, other studies have reported that some strong IBN
connections exist despite no direct structural association; instead, these strong functional
relationships were related to indirect structural connections, potentially through intermediate
structures such as the thalamus, cerebellum, or striatum (Honey et al, 2009). One recent study
found that spontaneous interhemispheric electrophysiological activity displayed a temporal lag of
up to 50ms, likely suggesting that such brain-wide spontaneous fluctuations are constructed via
polysynaptic connections (Baek et al, 2016). Whether defined from white matter connections or
correlations of activity, the particular contributions of a given network to overall brain function
(sensory, motor, cognitive, or otherwise) may be considered to arise from the position of that
network within the overall ‘topology’ of connections across the brain as a whole (Bullmore and
Sporns, 2009).
Relationship of Functional Networks to Human Behaviour
While the architecture and brain-wide hierarchy of IBNs is not yet fully understood, IBN
functions have been linked to specific components of human perception, cognition, and
behaviour. Inter-individual variability in the functional coupling of resting-state IBNs is
associated with areas of association cortex (particularly those of recent evolutionary expansion),
and ongoing fluctuations in the coupling of these regions appears to be related to fluctuations in
cognitive demands, task performance, and even states of consciousness. First, one recent study
reported ‘common core’ spatial patterns of IBN activity across 14 different tasks, concluding that
distinct tasks harness reconfigurable IBN ‘modes’ to allow for flexible, rapidly adaptable modes
of behaviour (Krienen et al, 2014). Second, inter-individual variability in the functional coupling
of IBNs has been related to behavioural variability, as measured by response time variability
during a Flanker task (Kelly et al, 2008). Such inter-individual variability has also been related
to behavioural variability in other tasks; for example, stronger within-network IBN coupling in
cortical regions responsible for motor and language function were associated with higher
7
performance on a reading task (Koyama et al, 2011), and higher rates of behavioural impulsivity
were related to the coupling of attentional and executive control regions to premotor regions
(Shannon et al, 2011). Finally, IBNs persist during sleep, and their relative strength is more
variable during light sleep than during wakefulness (Larson-Prior et al, 2009). IBN strength is
correlated with levels of consciousness, such that less network functional coupling is observed in
patients with brain damage at different levels of consciousness (for example, locked-in syndrome
versus coma) (Vanhaudenhuyse et al, 2010). Consequently, the overall consensus is that IBNs
act as functional ‘modules’ that operate in concert to facilitate complex cognitive and
behavioural processes, and that variability in IBNs reflect the overall integrity of brain-wide
functional networks.
Relationship of Functional Networks to Electrophysiological Studies
IBNs extracted from spontaneous fluctuations in neuronal signal have been associated
with electrophysiological sources; however, the relationship between IBNs and
electrophysiological properties remains elusive. Numerous studies have reported that spatial
patterns of frequency-specific power correlate with patterns of IBNs generated from rs-fMRI.
For example, the spatial network organization of electrocorticography (ECoG) in epilepsy
patients correlates with the spatial organization of IBNs generated using rs-fMRI (He et al, 2008;
Nir et al, 2008), and reflect opposing (anti-correlated) relationships between IBNs (Keller et al,
2013). Studies of simultaneous EEG and fMRI have demonstrated that fMRI-generated IBNs
have distinct patterns of frequency-specific power and phase synchrony (Mantini et al, 2007;
Sadaghiani et al, 2012). Similarly, rs-fMRI IBNs are also associated with distinct frequency-
specific power patterns on magnetoencephalography (MEG) (Brookes et al, 2011; Hipp et al,
2012; de Pasquale et al, 2010, 2012; Wens et al, 2014).
Co-activity between IBN brain regions is associated with covariation in gamma power
(50-100 Hz) (Fox and Raichle, 2007; Schölvinck et al, 2010, 2013). For example, spontaneous
gamma fluctuations in monkey visual cortex, as measured by local field potentials (LFP),
correlate with spontaneous fluctuations of rs-fMRI signal (Shmuel and Leopold, 2008). In
humans, spontaneous gamma oscillations correlate between brain regions that are highly
functionally connected on rs-fMRI (Nir et al, 2008). Keller et al. also showed that regional
8
ECoG gamma power correlates with distinct IBNs (Keller et al, 2013). Studies of intracranial
EEG IBNs rs-fMRI connectivity have also supported the idea that IBNs are generated by
synchronous increases in gamma power that reflect increased local spiking in nodes of IBNs
(Logothetis et al, 2001; Manning et al, 2009; Mukamel et al, 2005; Nir et al, 2007; Ray and
Maunsell, 2011).
IBNs are also characterized by activity in other frequency bands. Recent research has
suggested that IBNs are also related to infraslow cortical potentials (<0.1 Hz) (He et al, 2008)
and have been found to be more tightly correlated to spontaneous fluctuations in brain activity
relative to gamma (Lu et al, 2016). Spontaneous fluctuations in infraslow LFPs using EEG and
MEG have been shown to be related to spontaneous fluctuations in rs-fMRI (Hiltunen et al,
2014). In rodents, infraslow LFPs are state-dependent, as infraslow activity and phase coupling
differ between wakefulness and anesthesia (Mitra et al, 2018), and can differ depending on the
kind of anesthesia used (Thompson et al, 2014a). Interhemispheric infraslow activity also
directly associated with neuronal activity as this activity is attenuated by voltage-gated sodium
channel or glutamate receptor antagonists (Chan et al, 2015). Other frequency-limited power
bands, including alpha, theta and beta, have also been shown to resemble functional connections
of brain regions (Brookes et al, 2011; Hipp et al, 2012; de Pasquale et al, 2010, 2012; Wens et
al, 2014). Consequently, it has been proposed that IBNs and their functional connections are
related to a complex interaction of multiple frequency bands (Buzsáki and Draguhn, 2004; Fox
and Raichle, 2007) (Buzsaki & Draguhn, 2004; Fox & Raichle, 2007).
The relationship between infraslow LFPs, gamma power and other frequency bands
might be related to attentional processes and network architecture, as fluctuations in infraslow
LFPs correlate with gamma (Vanhatalo et al, 2004). He and colleagues demonstrated that IBNs
generated using ECoG have a similar spatial structure to IBNs in the gamma band, but only
during wakefulness and during rapid-eye movement sleep. Infraslow potentials, however,
exhibited consistent spatial correlation structure to that of IBNs during wakefulness, rapid-eye
movement sleep, and during slow-wave sleep (He et al, 2008). However, a recent study using
intracranial EEG reported that both infraslow and high frequency oscillations representing IBNs
are reproducible both during wakeful rest and sleep (Kucyi et al, 2018).
9
Functional Networks Pertinent to the Neurobiology of Psychiatric Disorders
1.2.6.1 Default Mode Network
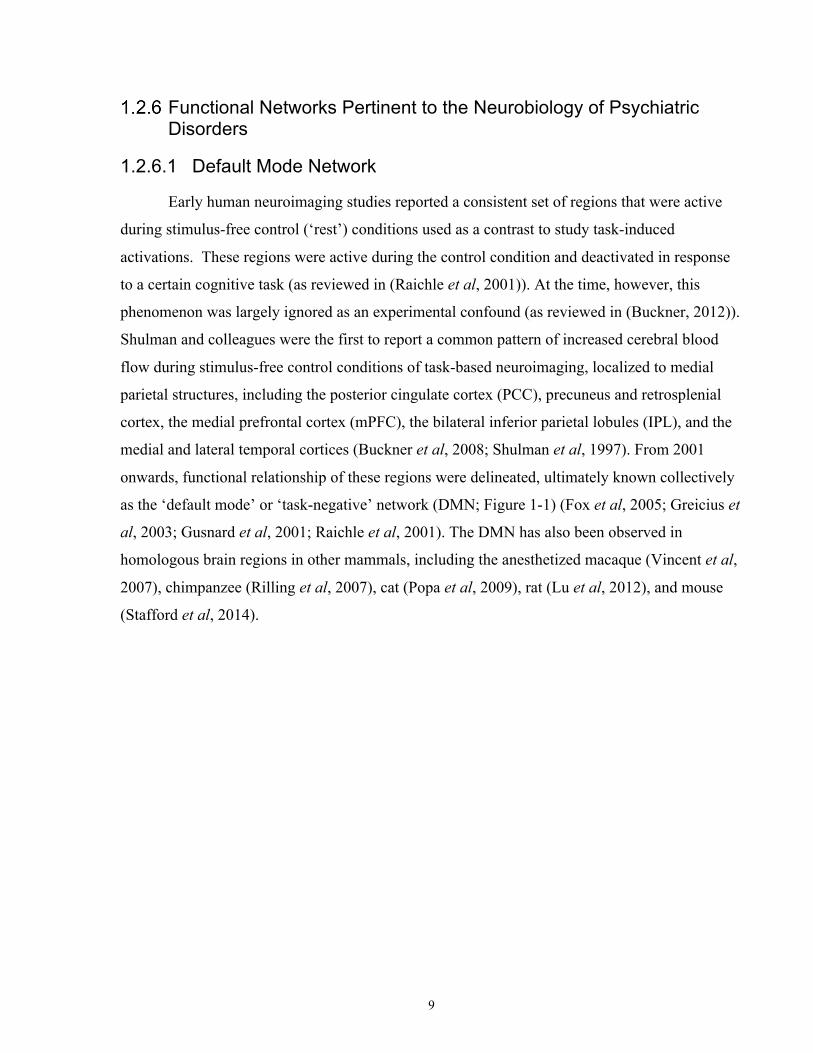
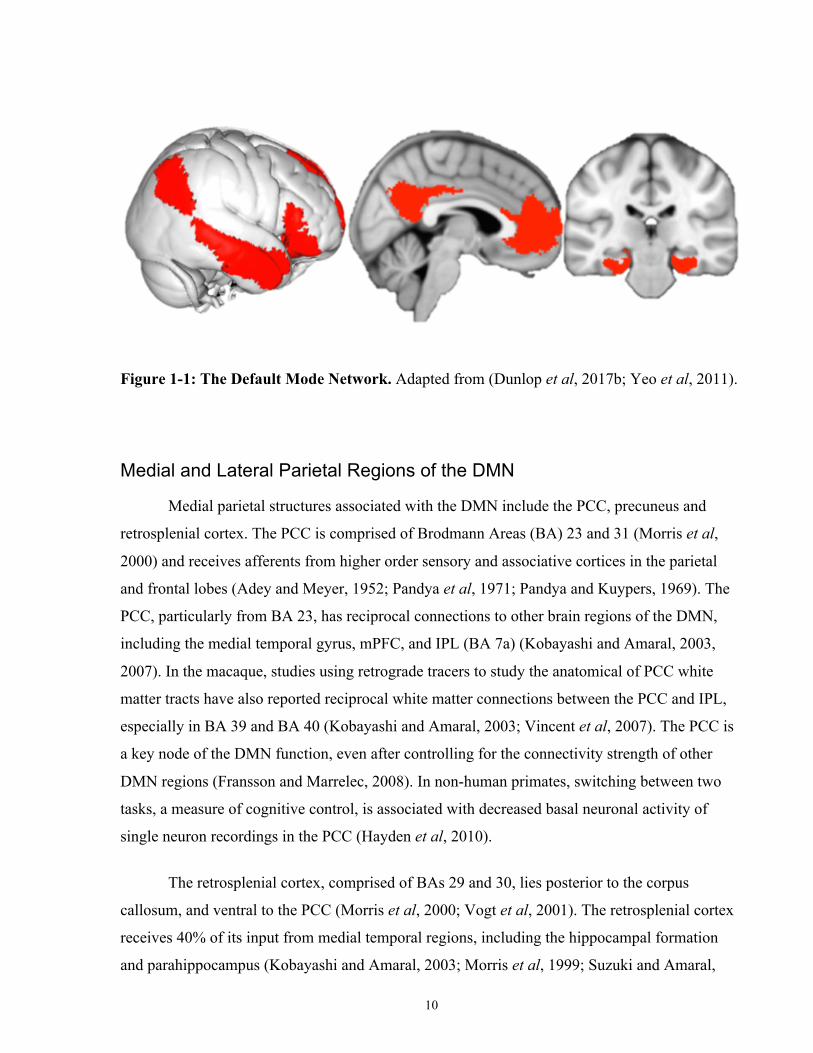
Early human neuroimaging studies reported a consistent set of regions that were active
during stimulus-free control (‘rest’) conditions used as a contrast to study task-induced
activations. These regions were active during the control condition and deactivated in response
to a certain cognitive task (as reviewed in (Raichle et al, 2001)). At the time, however, this
phenomenon was largely ignored as an experimental confound (as reviewed in (Buckner, 2012)).
Shulman and colleagues were the first to report a common pattern of increased cerebral blood
flow during stimulus-free control conditions of task-based neuroimaging, localized to medial
parietal structures, including the posterior cingulate cortex (PCC), precuneus and retrosplenial
cortex, the medial prefrontal cortex (mPFC), the bilateral inferior parietal lobules (IPL), and the
medial and lateral temporal cortices (Buckner et al, 2008; Shulman et al, 1997). From 2001
onwards, functional relationship of these regions were delineated, ultimately known collectively
as the ‘default mode’ or ‘task-negative’ network (DMN; Figure 1-1) (Fox et al, 2005; Greicius et
al, 2003; Gusnard et al, 2001; Raichle et al, 2001). The DMN has also been observed in
homologous brain regions in other mammals, including the anesthetized macaque (Vincent et al,
2007), chimpanzee (Rilling et al, 2007), cat (Popa et al, 2009), rat (Lu et al, 2012), and mouse
(Stafford et al, 2014).
10
Figure 1-1: The Default Mode Network. Adapted from (Dunlop et al, 2017b; Yeo et al, 2011).
Medial and Lateral Parietal Regions of the DMN
Medial parietal structures associated with the DMN include the PCC, precuneus and
retrosplenial cortex. The PCC is comprised of Brodmann Areas (BA) 23 and 31 (Morris et al,
2000) and receives afferents from higher order sensory and associative cortices in the parietal
and frontal lobes (Adey and Meyer, 1952; Pandya et al, 1971; Pandya and Kuypers, 1969). The
PCC, particularly from BA 23, has reciprocal connections to other brain regions of the DMN,
including the medial temporal gyrus, mPFC, and IPL (BA 7a) (Kobayashi and Amaral, 2003,
2007). In the macaque, studies using retrograde tracers to study the anatomical of PCC white
matter tracts have also reported reciprocal white matter connections between the PCC and IPL,
especially in BA 39 and BA 40 (Kobayashi and Amaral, 2003; Vincent et al, 2007). The PCC is
a key node of the DMN function, even after controlling for the connectivity strength of other
DMN regions (Fransson and Marrelec, 2008). In non-human primates, switching between two
tasks, a measure of cognitive control, is associated with decreased basal neuronal activity of
single neuron recordings in the PCC (Hayden et al, 2010).
The retrosplenial cortex, comprised of BAs 29 and 30, lies posterior to the corpus
callosum, and ventral to the PCC (Morris et al, 2000; Vogt et al, 2001). The retrosplenial cortex
receives 40% of its input from medial temporal regions, including the hippocampal formation
and parahippocampus (Kobayashi and Amaral, 2003; Morris et al, 1999; Suzuki and Amaral,
11
1994), and has efferent white matter connections to both the medial temporal lobe and mPFC
(Kobayashi and Amaral, 2007). The precuneus is comprised of BA 7m and lies in the
dorsomedial portion of the parietal lobe (Cavanna and Trimble, 2006; Parvizi et al, 2006).
Precuneus connectivity is unlike other posteromedial structures of the DMN, in that BA 7m
predominantly has white matter connections with occipital and parietal regions responsible for
visual processing and with frontal motor planning regions (Cavada and Goldman-Rakic, 1989;
Leichnetz, 2001). Consequently, the membership of the precuneus in the DMN proper has been
debated extensively (see (Buckner et al, 2008; Scheperjans et al, 2008; Utevsky et al, 2014;
Vogeley et al, 2004)). The IPL node of the DMN consists of inferior regions of the lateral
parietal cortex, including BA 7a, BA 39 (the angular gyrus) and BA 40 (the supramarginal
gyrus), and has reciprocal white matter connections to the PCC (Kobayashi and Amaral, 2003,
2007; Vincent et al, 2007), and to medial temporal lobe via BA 7a (Clower et al, 2001; Lavenex
et al, 2002; Suzuki and Amaral, 1994).
Medial Prefrontal Cortex and the DMN.
Many regions of the mPFC are thought to be of relatively recent evolutionary origin, and
as a result are significantly larger in humans relative to nonhuman primates. This is especially
the case for prelimbic regions (BA 32pl), the dorsal anterior cingulate cortex (BA 32ac; dACC),
and frontopolar cortex (BA 10) (Ongür et al, 2003; Semendeferi et al, 2001). mPFC regions of
the DMN include the frontopolar cortex (BA 10m, 10r and 10p), rostral ACC (rACC) (BA 24,
32a and 32c) and medial superior frontal gyrus (BA 9) (Buckner et al, 2008). The nonhuman
primate homologues of these structures have nearly no afferent or efferent white matter
connections to low-level sensory regions; instead, the mPFC has reciprocal connections with the
PCC, retrosplenial cortex, superior temporal gyrus, hippocampal formation, and
perirhinal/parahippocampal regions (Barbas et al, 1999; Price, 2007). Of note in the psychiatric
context, electrical stimulation of the dACC induces a will to persevere in the face of a
psychological or physical challenge (Parvizi et al, 2013).
12
Temporal and Hippocampal Regions of the DMN.
As reviewed in detail in Section 2.5.1.2, the hippocampal formation and surrounding
limbic medial temporal lobe brain regions are connected to key posterior nodes of the DMN,
including retrosplenial cortex (Kobayashi and Amaral, 2003, 2007; Morris et al, 1999; Suzuki
and Amaral, 1994), PCC (Kobayashi and Amaral, 2003, 2007) and IPL (Clower et al, 2001;
Lavenex et al, 2002; Suzuki and Amaral, 1994). In humans, functional coherence between these
parietal and hippocampal structures has been associated with successful episodic memory
recollection (Vincent et al, 2006).
As a functional network, early neuroimaging studies reported that the DMN deactivation
was associated with increasing task difficulty or task switching, possibly suggesting a
reallocation of resources from ‘passive, resting-state’ processing to ‘active’ attentional or
cognitive control processes (McKiernan et al, 2003; Raichle et al, 2001; Shulman et al, 1997).
However, more recent studies have reported that DMN activation is related to a number of
behaviours related to internally-generated cognition and self-referential processing (Crittenden et
al, 2015; Dixon et al, 2014), including mind wandering (Mason et al, 2007), hippocampal-
dependent autobiographical memory retrieval (Addis et al, 2007; Svoboda et al, 2006), spatial
navigation, and thinking about the thoughts of others (Spreng et al, 2009).
The strength of DMN functional coupling is also related to levels of consciousness. In a
study of individuals with differing levels of consciousness due to brain damage (i.e., vegetative
and coma patients), DMN coupling was negatively correlated with the level of consciousness
(Vanhaudenhuyse et al, 2010). Some neuroimaging studies have also reported that the DMN
consists of at least three sub-IBNs: (1) a midline ‘core’ network comprised of the mPFC and
PCC that is consistently activated for all DMN-relevant functions; (2) a dmPFC subnetwork
comprised of the dmPFC, angular gyrus and temporal pole that is active for self-referential or
affective processes; and (3) a temporoparietal lobe network comprised of the bilateral IPL,
medial temporal and lateral temporal cortices for memory retrieval and scene reconstruction
from memory (Andrews-Hanna et al, 2010; Kim, 2012; Maillet and Rajah, 2014; Shapira-Lichter
et al, 2013; Yeo et al, 2011). Consequently, more recent theories of DMN function posit that
DMN activity has a role in self-referential, internally-generated cognition opposed to simply a
‘default mode’ of the brain.
13
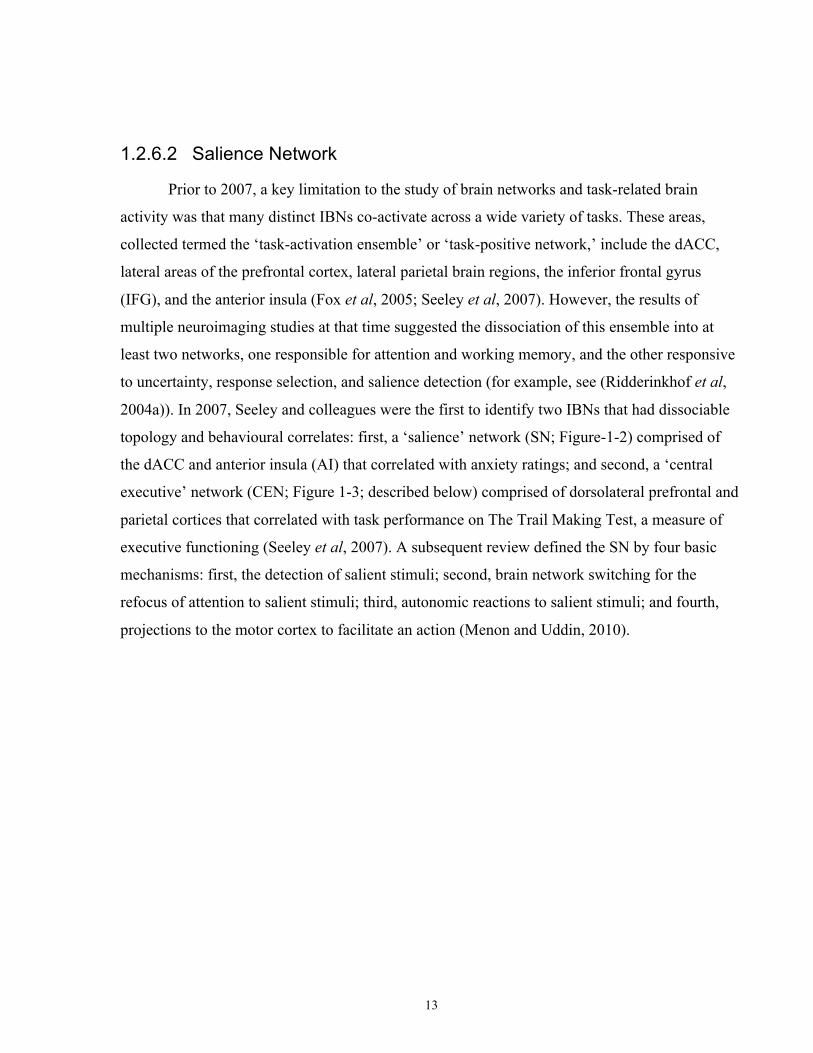
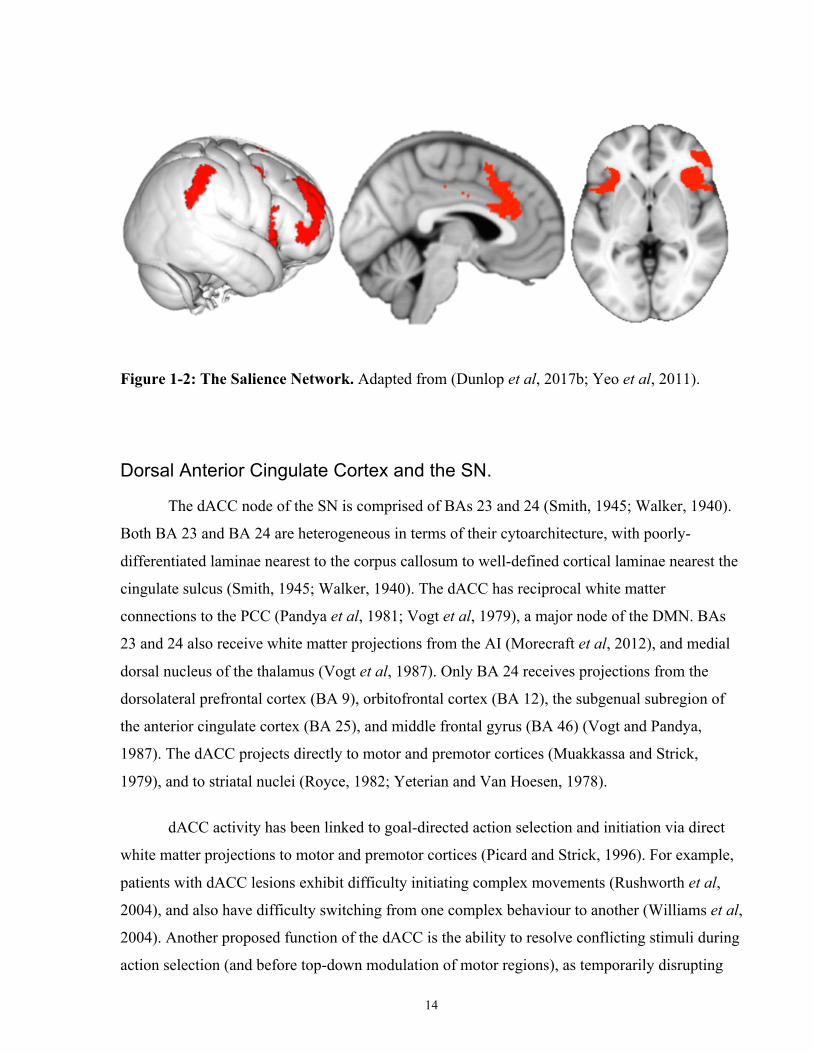
1.2.6.2 Salience Network
Prior to 2007, a key limitation to the study of brain networks and task-related brain
activity was that many distinct IBNs co-activate across a wide variety of tasks. These areas,
collected termed the ‘task-activation ensemble’ or ‘task-positive network,’ include the dACC,
lateral areas of the prefrontal cortex, lateral parietal brain regions, the inferior frontal gyrus
(IFG), and the anterior insula (Fox et al, 2005; Seeley et al, 2007). However, the results of
multiple neuroimaging studies at that time suggested the dissociation of this ensemble into at
least two networks, one responsible for attention and working memory, and the other responsive
to uncertainty, response selection, and salience detection (for example, see (Ridderinkhof et al,
2004a)). In 2007, Seeley and colleagues were the first to identify two IBNs that had dissociable
topology and behavioural correlates: first, a ‘salience’ network (SN; Figure-1-2) comprised of
the dACC and anterior insula (AI) that correlated with anxiety ratings; and second, a ‘central
executive’ network (CEN; Figure 1-3; described below) comprised of dorsolateral prefrontal and
parietal cortices that correlated with task performance on The Trail Making Test, a measure of
executive functioning (Seeley et al, 2007). A subsequent review defined the SN by four basic
mechanisms: first, the detection of salient stimuli; second, brain network switching for the
refocus of attention to salient stimuli; third, autonomic reactions to salient stimuli; and fourth,
projections to the motor cortex to facilitate an action (Menon and Uddin, 2010).
14
Figure 1-2: The Salience Network. Adapted from (Dunlop et al, 2017b; Yeo et al, 2011).
Dorsal Anterior Cingulate Cortex and the SN.
The dACC node of the SN is comprised of BAs 23 and 24 (Smith, 1945; Walker, 1940).
Both BA 23 and BA 24 are heterogeneous in terms of their cytoarchitecture, with poorly-
differentiated laminae nearest to the corpus callosum to well-defined cortical laminae nearest the
cingulate sulcus (Smith, 1945; Walker, 1940). The dACC has reciprocal white matter
connections to the PCC (Pandya et al, 1981; Vogt et al, 1979), a major node of the DMN. BAs
23 and 24 also receive white matter projections from the AI (Morecraft et al, 2012), and medial
dorsal nucleus of the thalamus (Vogt et al, 1987). Only BA 24 receives projections from the
dorsolateral prefrontal cortex (BA 9), orbitofrontal cortex (BA 12), the subgenual subregion of
the anterior cingulate cortex (BA 25), and middle frontal gyrus (BA 46) (Vogt and Pandya,
1987). The dACC projects directly to motor and premotor cortices (Muakkassa and Strick,
1979), and to striatal nuclei (Royce, 1982; Yeterian and Van Hoesen, 1978).
dACC activity has been linked to goal-directed action selection and initiation via direct
white matter projections to motor and premotor cortices (Picard and Strick, 1996). For example,
patients with dACC lesions exhibit difficulty initiating complex movements (Rushworth et al,
2004), and also have difficulty switching from one complex behaviour to another (Williams et al,
2004). Another proposed function of the dACC is the ability to resolve conflicting stimuli during
action selection (and before top-down modulation of motor regions), as temporarily disrupting
15
dACC activity using non-invasive brain stimulation increased errors rates to ambiguous stimuli
(e.g., incongruent trials on a flanker task) (Taylor et al, 2007).
Insular Regions of the SN.
The insular cortex, BA 13, is located within the lateral fissure and hidden below the
frontal, parietal, and temporal opercula. Broadly speaking, the insula is associated with wide-
ranging functions including homeostatisis, interoception and sensorimotor processing, and the
integration of interoceptive, autonomic, affective and cognitive processing (Craig, 2009a). The
insula is subdivided into three subregions based on cytoarchitecture: an agranular region located
on the anterior ventral field of the insular cortex; a granular region located in the dorsal and
posterior insular cortex; and a transitional dysgranular field between these two subregions (Jones
and Burton, 1976; Mesulam and Mufson, 1982; Morel et al, 2013). Some cytoarchitectural
studies report that four insular subregions exist, as the anterior agranular insula can be further
subdivided into dorsal and ventral anterior insula subregions (Preuss and Goldman-Rakic, 1989).
Furthermore, the insula has been subdivided based on its white matter connectivity, revealing
anterior, dorsomedial and posterior subregions (Cloutman et al, 2012; Jakab et al, 2012), while
subdivisions based on insular function have yielded two to four subregions (Cauda et al, 2012;
Chang et al, 2013; Kurth et al, 2010; Mutschler et al, 2009). The function of the insula and the
inter-relationships of its subregions are not fully understood, although multiple studies have
described the role of the posterior insula in interoception, urges related to interoception such as
hunger and thirst, and sensorimotor processing (Craig, 2002; Del Parigi et al, 2002; Tataranni et
al, 1999; Wager et al, 2004).
The AI is the key insular node of the SN (see (Craig, 2009b, 2010a, 2010b)). The AI has
widespread afferent connections from and efferent connections to frontal and parietal cortices,
and the posterior insula (Mufson and Mesulam, 1982). The AI also has efferent projections to the
dACC (van den Heuvel et al, 2009; Morecraft et al, 2012). Functionally, the AI has a role in
decision-making and stimulus identification independent from the sensory modality of the
stimulus (Ho et al, 2009), and is active during auditory object identification (Binder et al, 2004),
and audio-visual timing discrimination (Kosillo and Smith, 2010). AI activity is also associated
with the integration of perceptual information from multiple sensory modalities, such that higher
16
AI activation is associated with greater difficulty discriminating items associated with
ambiguous stimuli from two sensory modalities (for example, with asynchronous auditory and
visual stimuli) (Bushara et al, 2001; Calvert, 2001; Kosillo and Smith, 2010; Lewis et al, 2000).
The AI is also involved in the anticipatory response to potential rewards or losses (Grosenick et
al, 2008; Knutson et al, 2007) that is correlated to decision ambiguity and risk prediction rather
than the value of expected rewards or losses (Huettel et al, 2006; Preuschoff et al, 2006, 2008).
The AI is also active during anticipatory responses to rewards that evoke positive or negative
arousal (Knutson and Greer, 2008), during error commission, and in task paradigms where
performance monitoring is required (Klein et al, 2007; Preuschoff et al, 2006, 2008). In line with
these studies, patients with insular lesions report intense positive or negative images as less
arousing (Berntson et al, 2011), and are insensitive to changes in the expected value of rewards
when making a decision under uncertainty (Weller et al, 2009).
Lateral Parietal and Frontal Regions of the SN.
The right temporoparietal junction (RTPJ, BA 40 and 22), a region of the lateral parietal
cortex, and the bilateral dorsolateral prefrontal cortex (DLPFC), are coactive with other regions
of the SN (Jakobs et al, 2012). Before the existence of the SN was proposed by Seeley et al.
(Seeley et al, 2007), research by Downar and colleagues demonstrated that the RTPJ activates
together with the dACC and AI during the detection of external, salient stimuli irrespective of its
sensory modality (Downar et al, 2000, 2001, 2002). Patients with right parietal lesions that
include the RTPJ exhibit impaired ability to attend to the sensory stimuli (Halligan et al, 2003;
Halligan and Marshall, 1998; Vallar, 1998). Lateral areas of the parietal cortex are also active
during other forms of SN-dependent perceptual decision-making, including during the
assessment of the relatedness of words (Kuperberg et al, 2008) and value-based decisions, such
as during the evaluation of costs and benefits (Kahnt and Tobler, 2013). Other studies
demonstrate that RTPJ and DLPFC activity are related to the integration of multimodal sensory
information, including temporal order judgment (Adhikari et al, 2013). RTPJ activity has also
been associated with social cognition, including during Theory-of-Mind paradigms (Young et al,
2010). However, a recent publication by Krall et al. demonstrated that the RTPJ can be divided
into two sub-regions: an anterior RTPJ active during sensory integration, attentional/social
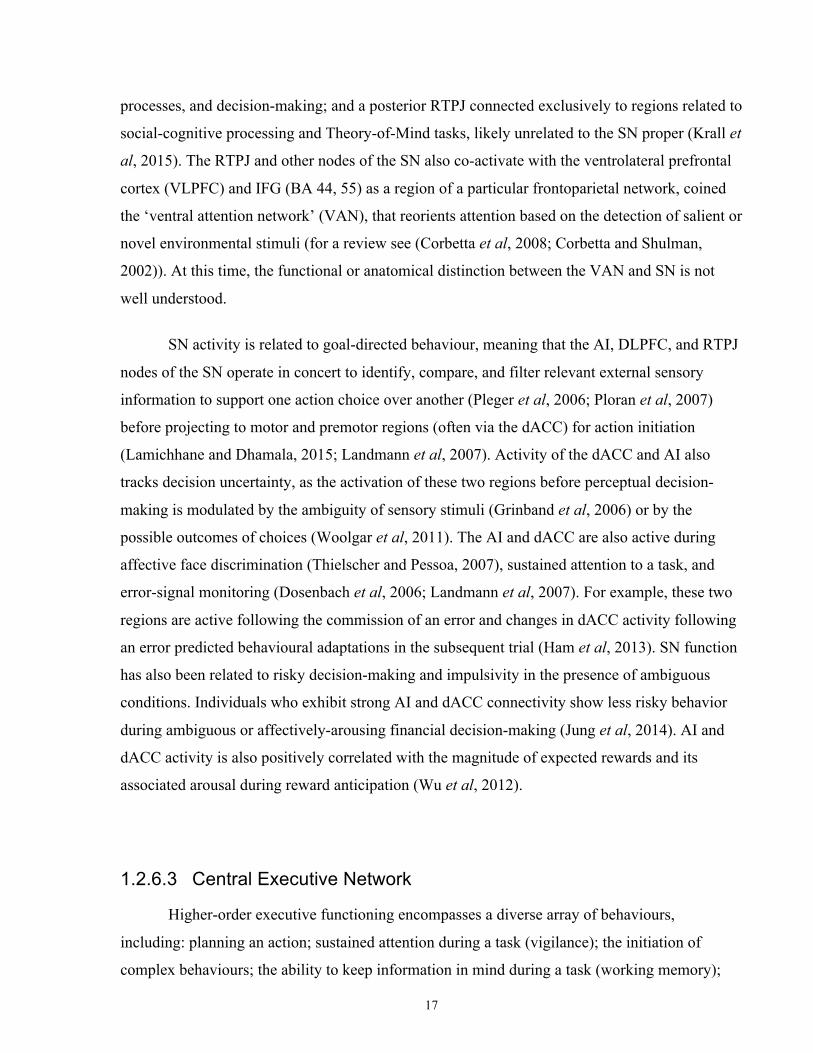
17
processes, and decision-making; and a posterior RTPJ connected exclusively to regions related to
social-cognitive processing and Theory-of-Mind tasks, likely unrelated to the SN proper (Krall et
al, 2015). The RTPJ and other nodes of the SN also co-activate with the ventrolateral prefrontal
cortex (VLPFC) and IFG (BA 44, 55) as a region of a particular frontoparietal network, coined
the ‘ventral attention network’ (VAN), that reorients attention based on the detection of salient or
novel environmental stimuli (for a review see (Corbetta et al, 2008; Corbetta and Shulman,
2002)). At this time, the functional or anatomical distinction between the VAN and SN is not
well understood.
SN activity is related to goal-directed behaviour, meaning that the AI, DLPFC, and RTPJ
nodes of the SN operate in concert to identify, compare, and filter relevant external sensory
information to support one action choice over another (Pleger et al, 2006; Ploran et al, 2007)
before projecting to motor and premotor regions (often via the dACC) for action initiation
(Lamichhane and Dhamala, 2015; Landmann et al, 2007). Activity of the dACC and AI also
tracks decision uncertainty, as the activation of these two regions before perceptual decision-
making is modulated by the ambiguity of sensory stimuli (Grinband et al, 2006) or by the
possible outcomes of choices (Woolgar et al, 2011). The AI and dACC are also active during
affective face discrimination (Thielscher and Pessoa, 2007), sustained attention to a task, and
error-signal monitoring (Dosenbach et al, 2006; Landmann et al, 2007). For example, these two
regions are active following the commission of an error and changes in dACC activity following
an error predicted behavioural adaptations in the subsequent trial (Ham et al, 2013). SN function
has also been related to risky decision-making and impulsivity in the presence of ambiguous
conditions. Individuals who exhibit strong AI and dACC connectivity show less risky behavior
during ambiguous or affectively-arousing financial decision-making (Jung et al, 2014). AI and
dACC activity is also positively correlated with the magnitude of expected rewards and its
associated arousal during reward anticipation (Wu et al, 2012).
1.2.6.3 Central Executive Network
Higher-order executive functioning encompasses a diverse array of behaviours,
including: planning an action; sustained attention during a task (vigilance); the initiation of
complex behaviours; the ability to keep information in mind during a task (working memory);
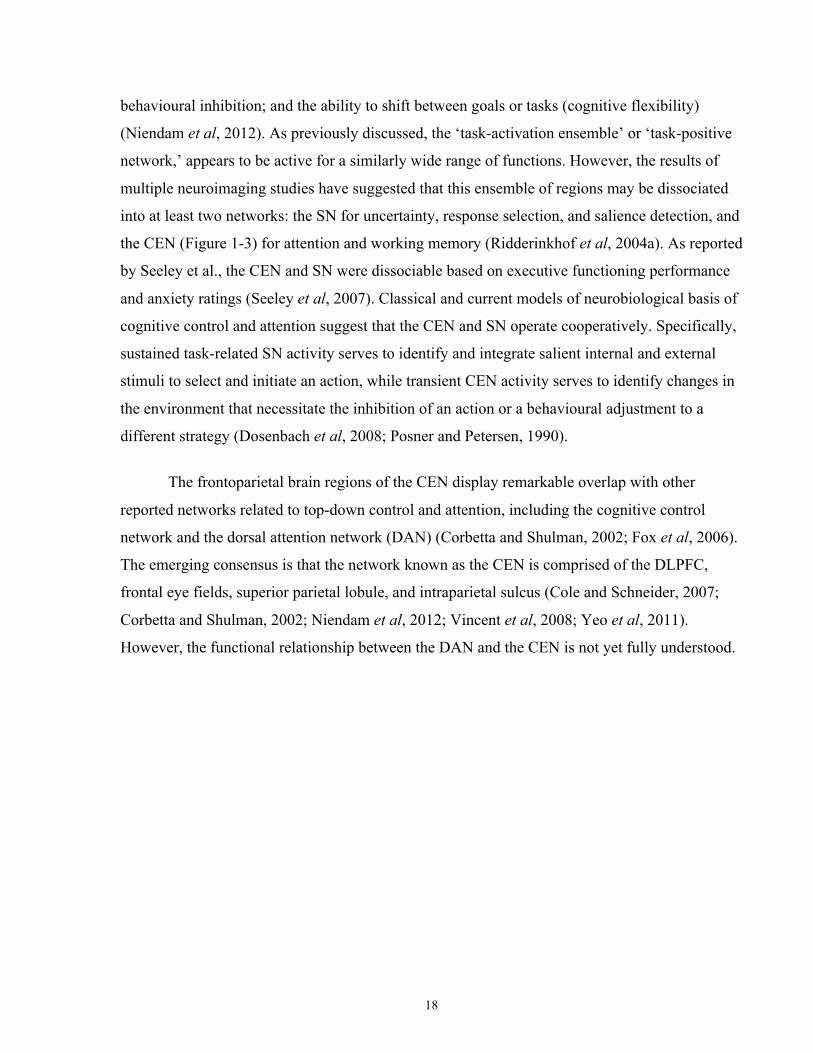
18
behavioural inhibition; and the ability to shift between goals or tasks (cognitive flexibility)
(Niendam et al, 2012). As previously discussed, the ‘task-activation ensemble’ or ‘task-positive
network,’ appears to be active for a similarly wide range of functions. However, the results of
multiple neuroimaging studies have suggested that this ensemble of regions may be dissociated
into at least two networks: the SN for uncertainty, response selection, and salience detection, and
the CEN (Figure 1-3) for attention and working memory (Ridderinkhof et al, 2004a). As reported
by Seeley et al., the CEN and SN were dissociable based on executive functioning performance
and anxiety ratings (Seeley et al, 2007). Classical and current models of neurobiological basis of
cognitive control and attention suggest that the CEN and SN operate cooperatively. Specifically,
sustained task-related SN activity serves to identify and integrate salient internal and external
stimuli to select and initiate an action, while transient CEN activity serves to identify changes in
the environment that necessitate the inhibition of an action or a behavioural adjustment to a
different strategy (Dosenbach et al, 2008; Posner and Petersen, 1990).
The frontoparietal brain regions of the CEN display remarkable overlap with other
reported networks related to top-down control and attention, including the cognitive control
network and the dorsal attention network (DAN) (Corbetta and Shulman, 2002; Fox et al, 2006).
The emerging consensus is that the network known as the CEN is comprised of the DLPFC,
frontal eye fields, superior parietal lobule, and intraparietal sulcus (Cole and Schneider, 2007;
Corbetta and Shulman, 2002; Niendam et al, 2012; Vincent et al, 2008; Yeo et al, 2011).
However, the functional relationship between the DAN and the CEN is not yet fully understood.
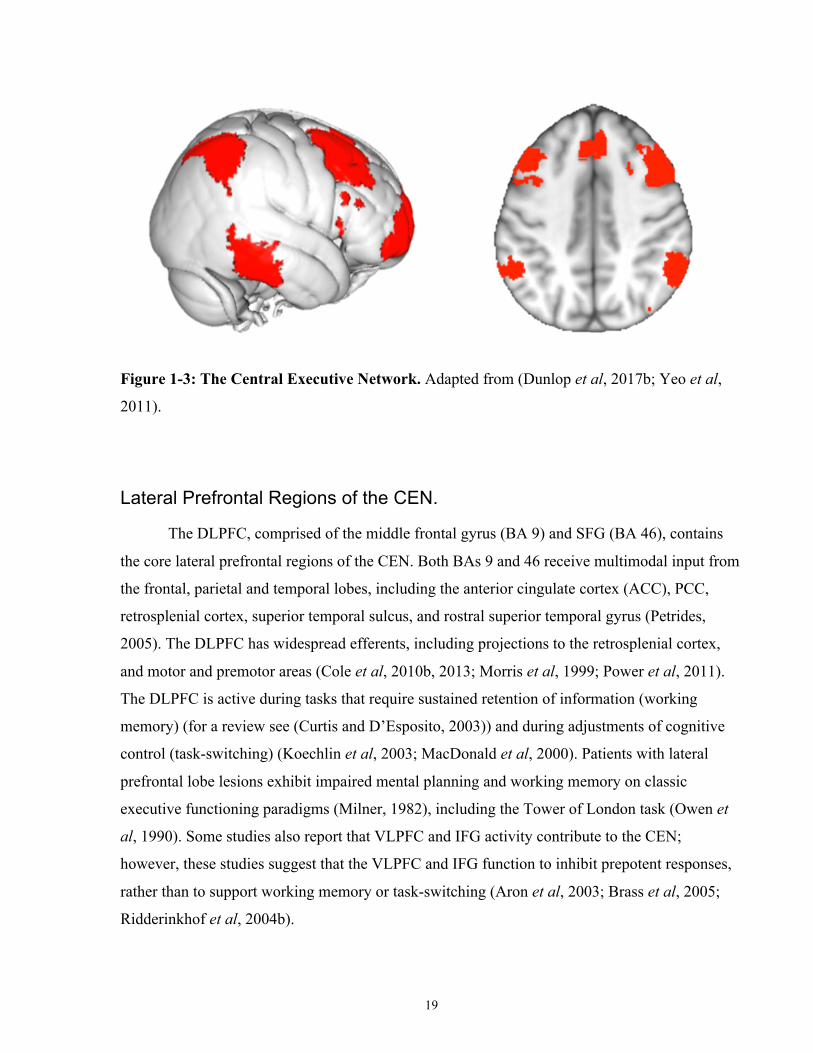
19
Figure 1-3: The Central Executive Network. Adapted from (Dunlop et al, 2017b; Yeo et al,
2011).
Lateral Prefrontal Regions of the CEN.
The DLPFC, comprised of the middle frontal gyrus (BA 9) and SFG (BA 46), contains
the core lateral prefrontal regions of the CEN. Both BAs 9 and 46 receive multimodal input from
the frontal, parietal and temporal lobes, including the anterior cingulate cortex (ACC), PCC,
retrosplenial cortex, superior temporal sulcus, and rostral superior temporal gyrus (Petrides,
2005). The DLPFC has widespread efferents, including projections to the retrosplenial cortex,
and motor and premotor areas (Cole et al, 2010b, 2013; Morris et al, 1999; Power et al, 2011).
The DLPFC is active during tasks that require sustained retention of information (working
memory) (for a review see (Curtis and D’Esposito, 2003)) and during adjustments of cognitive
control (task-switching) (Koechlin et al, 2003; MacDonald et al, 2000). Patients with lateral
prefrontal lobe lesions exhibit impaired mental planning and working memory on classic
executive functioning paradigms (Milner, 1982), including the Tower of London task (Owen et
al, 1990). Some studies also report that VLPFC and IFG activity contribute to the CEN;
however, these studies suggest that the VLPFC and IFG function to inhibit prepotent responses,
rather than to support working memory or task-switching (Aron et al, 2003; Brass et al, 2005;
Ridderinkhof et al, 2004b).
20
Lateral Parietal Regions of the CEN.
Regions of the superior parietal lobule and intraparietal sulcus are also associated with
the CEN. The superior parietal lobule is comprised of lateral portions of BAs 5 and 7, and
receives and integrates input from higher-order somatosensory and visuomotor cortices
(Scheperjans et al, 2008). The superior parietal lobule is thought to monitor shifts in the spatial
coordinates of salient external objects (Molenberghs et al, 2007). The intraparietal sulcus serves
as the anatomical border between the superior and inferior parietal lobules, and is activated by
visuomotor and visuospatial information and projects to ventral and dorsal prefrontal and
premotor cortex, including the frontal eye fields (Grefkes and Fink, 2005). The medial and
lateral intraparietal sulcus subregions are considered part of the CEN and are preferentially
active during behavioural planning, action initiation, and during task monitoring (Bisley and
Goldberg, 2003; Desmurget and Grafton, 2000; Grefkes and Fink, 2005; Kalaska et al, 2003).
1.2.6.4 Ventromedial Affective Network
The ventromedial affective network (VMN; Figure 1-4) is comprised of the rostroventral
portion of the ACC and the medial orbitofrontal cortex (for a review, see (Dunlop et al, 2017b;
Fettes et al, 2017b)). The ventral aspect of the prefrontal cortex is thought to have a role in three
major functions (Hiser and Koenigs, 2018). First, the VMN contributes to reward processing,
prediction, and reward-based reversal learning (Boorman et al, 2013; Fellows, 2007;
Kringelbach, 2005; Montague and Berns, 2002); second, the VMN has a role in generating
negative affective states and during emotional appraisal (Johnstone et al, 2007; Wager et al,
2008); and third, the VMN is active during social cognition (Rushworth et al, 2007).
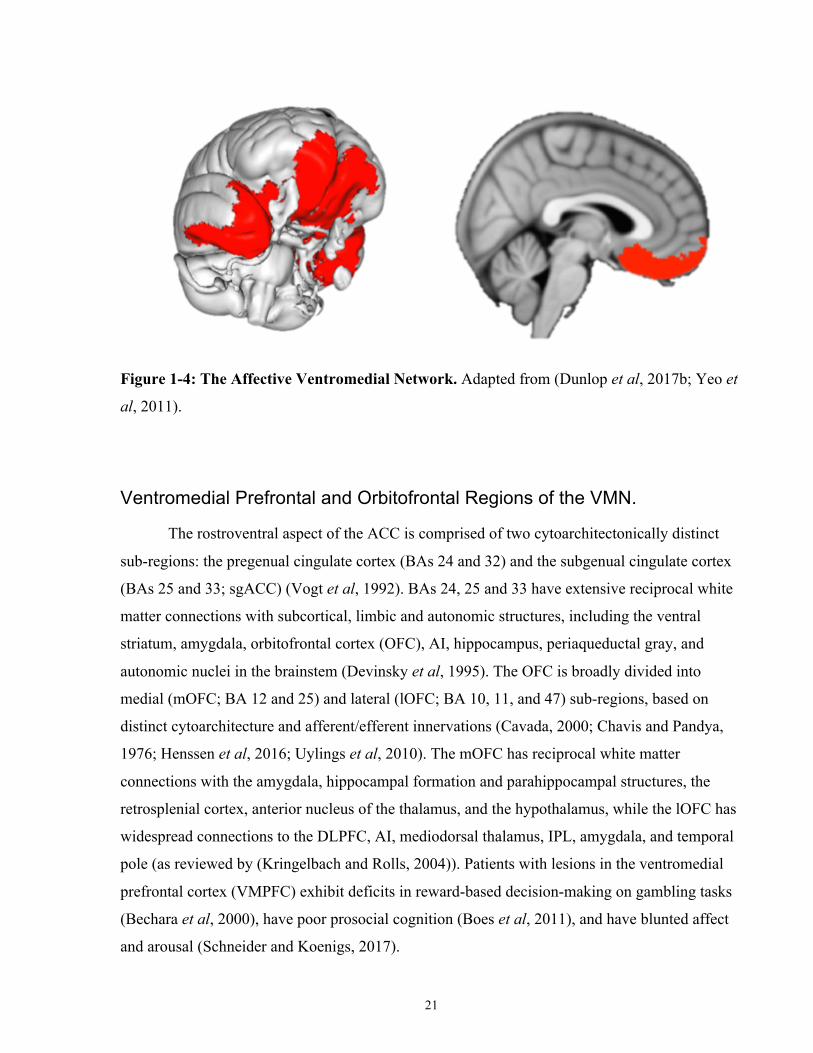
21
Figure 1-4: The Affective Ventromedial Network. Adapted from (Dunlop et al, 2017b; Yeo et
al, 2011).
Ventromedial Prefrontal and Orbitofrontal Regions of the VMN.
The rostroventral aspect of the ACC is comprised of two cytoarchitectonically distinct
sub-regions: the pregenual cingulate cortex (BAs 24 and 32) and the subgenual cingulate cortex
(BAs 25 and 33; sgACC) (Vogt et al, 1992). BAs 24, 25 and 33 have extensive reciprocal white
matter connections with subcortical, limbic and autonomic structures, including the ventral
striatum, amygdala, orbitofrontal cortex (OFC), AI, hippocampus, periaqueductal gray, and
autonomic nuclei in the brainstem (Devinsky et al, 1995). The OFC is broadly divided into
medial (mOFC; BA 12 and 25) and lateral (lOFC; BA 10, 11, and 47) sub-regions, based on
distinct cytoarchitecture and afferent/efferent innervations (Cavada, 2000; Chavis and Pandya,
1976; Henssen et al, 2016; Uylings et al, 2010). The mOFC has reciprocal white matter
connections with the amygdala, hippocampal formation and parahippocampal structures, the
retrosplenial cortex, anterior nucleus of the thalamus, and the hypothalamus, while the lOFC has
widespread connections to the DLPFC, AI, mediodorsal thalamus, IPL, amygdala, and temporal
pole (as reviewed by (Kringelbach and Rolls, 2004)). Patients with lesions in the ventromedial
prefrontal cortex (VMPFC) exhibit deficits in reward-based decision-making on gambling tasks
(Bechara et al, 2000), have poor prosocial cognition (Boes et al, 2011), and have blunted affect
and arousal (Schneider and Koenigs, 2017).
22
VMN Function and Reward Processing.
The activity of the VMPFC and mOFC is thought to track the relative value of expected
rewards. For example, one meta-analysis reviewing 142 human neuroimaging studies on reward-
related decision-making concluded that the mOFC and VMPFC preferentially activate during the
presentation of positive stimuli and receipt of rewards (Liu et al, 2011). VMPFC-dependent
reward value encoding is also conserved in monkeys (Tremblay and Schultz, 1999), and mice
(Lopatina et al, 2016). The VMPFC also has strong reciprocal connections with the ventral
striatum, such that coactivation of these regions is related to dopamine-dependent bottom-up
reward evaluation and reward anticipation, and glutaminergic top-down processing over the
striatum for reward learning and adaptive decision-making (Cauda et al, 2011; Christakou et al,
2004; Richard and Berridge, 2013; Sesack et al, 1989; Smith and Graybiel, 2013). In humans,
non-human primates, and mice, the central nucleus of the amygdala also projects to VMPFC to
mediate reward value encoding (Baxter et al, 2000; Fiuzat et al, 2017; Hampton et al, 2007;
Rudebeck et al, 2013; Seo et al, 2016a).
Some studies suggest that medial and lateral OFC sub-regions differentially encode
appetitive (rewarding) and aversive stimuli. For example, Small et al. (2001) fed healthy
individuals pieces of chocolate in a sequential fashion, and demonstrated that the mOFC is active
while individuals eat pleasurable foods prior until satiety. However, once satiety is reached, the
same chocolate stimuli that were once pleasurable then switched to preferentially activating the
lOFC over the mOFC, signifying a reappraisal of the chocolate from a pleasant to an aversive
stimulus (Small et al, 2001). Similar distinctions between mOFC/lOFC and appetitive/aversive
neural representations have been reported in some (Cheng et al, 2016; Hornak et al, 2004;
O’Doherty et al, 2001), but not all (Small et al, 2003) studies. The lOFC also plays a role in
adapting choice to favour a previously unrewarded stimulus (reversal learning) or to the most
rewarding outcome (as reviewed by (Fettes et al, 2017b; Kringelbach and Rolls, 2004)).
23
VMN Function During Emotion Regulation and Negative Affect.
Activity in the mOFC and pregenual cingulate activity has been associated with,
amongst other functions, inhibition of negative affect. For example, a number of studies have
reported that mOFC stimulation reduces conditioned fear responses via direct inhibitory
connections to the amygdala (Ghashghaei and Barbas, 2002; LeDoux, 2003; Likhtik et al, 2005;
Mcdonald et al, 1996; Quirk et al, 2003; Rosenkranz et al, 2003). Increased mOFC and
decreased amygdala activity has also been demonstrated during the voluntary suppression of
negative emotions (Delgado et al, 2008; Johnstone et al, 2007; Urry et al, 2006). Top-down
VMPFC activity to regions related to visceromotor function, including the hypothalamus and
periaqueductal gray, is also thought to reflect inhibitory regulation of autonomic responses to
negative stimuli and affect (Atlas and Wager, 2014; Barbas et al, 2003; Eippert et al, 2009).
Unlike the mOFC and other areas of the VMPFC, increased sgACC (BA 25) activity is
associated with the generation of negative mood and sadness (Mayberg et al, 1999; Ramirez-
Mahaluf et al, 2018), while increased DLPFC, dmPFC, and VLPFC/lOFC activity is correlated
with successful negative emotion regulation (Wager et al, 2008). Taken together, it appears that
individual nodes of VMPFC and VLPFC are involved with the regulation of negative affect
(mOFC, pregenual ACC, and VLPFC/lOFC in concert with dorsal cognitive regions), and the
generation of negative affect (sgACC).
How do IBNs Integrate Information Across Networks?
1.2.7.1 Corticocortical Connections
At present, the functional architecture and hierarchical arrangement of IBNs necessary to
execute complex and diverse behaviour is not fully understood. Fox, Raichle, and colleagues
originally proposed the existence of two broad functional networks: a task-positive network that
was activated, and an anticorrelated task-negative (default mode) network that was deactivated
(i.e, suppressed, inactive) during a wide range of tasks, stimuli, and overt behaviours (Fox et al,
2005). This interpretation of Fox et al.’s results is likely a somewhat oversimplified model of
brain network architecture, as it is now established that regions associated with a ‘task-negative’
network are active during a variety of internally-initiated tasks such as episodic memory retrieval
and spatial navigation (Spreng and Grady, 2010). More recently, a seminal publication by Power

24
and colleagues demonstrated that the brain regions of many IBNs cluster together based on
similar function and connectivity to form relatively self-contained and self-integrated ‘processing
units.’ IBNs that clustered in this way included the visual, sensorimotor and default mode
networks, while the frontoparietal CEN instead exhibited widespread inter-network connectivity
indicative of a higher-level control network linking lower-level, self-contained IBN ‘processing
units’ (Power et al, 2011). Building on these results, Cole and colleagues (2014) found that the
IBN structure described by Power et al. appears consistent across many task states (Cole et al,
2014). Of note, at least one study reported a method to generate single-participant level maps of
brain architecture across multiple tasks by taking into account dynamic shifts of brain
connectivity (Saggar et al, 2018).
Irrespective of the whole-brain functional architecture and interactions of all IBNs, a
number of human neuroimaging studies signify the importance of IBN cross-communication for
complex cognition and behaviour. For example, a study by Menon et al. demonstrated that the
SN plays a causal role in ‘switching’ between DMN- and CEN-specific states during an auditory
attention task, a visual attention task, and a task-free condition (Sridharan et al, 2008). Cognitive
load on a working memory task was also found to be correlated with the strength of within- and
between-network connectivity of the DMN and CEN (Newton et al, 2011). Communication
within and between the DMN and CEN is also correlated with successful emotion regulation
(Pan et al, 2018) and individual differences in creative thinking (Beaty et al, 2015).
1.2.7.2 Corticostriatal Connections
Loop-like circuits from regions of the cortex to the basal ganglia operate with the
thalamus and brainstem to prepare and implement planned, goal-directed behaviour (Figure 1-5;
as reviewed by (Haber, 2016)). Historically, studies of corticostriatal circuitry originally focused
on the cortico-striatal-thalamic loop serving the primary motor cortex, and its role in the control
of movement (Künzle, 1975), as well its association with neurodegenerative movement
disorders, including Huntington’s and Parkinson’s Disease. However, subsequent studies over
the last 40 years have found that basal ganglia loop circuits of similar architecture also serve
most of the cortical regions beyond primary motor cortex, and these do not have solely motor
functions, but also play a key role in motivational, affective, and cognitive functions. These
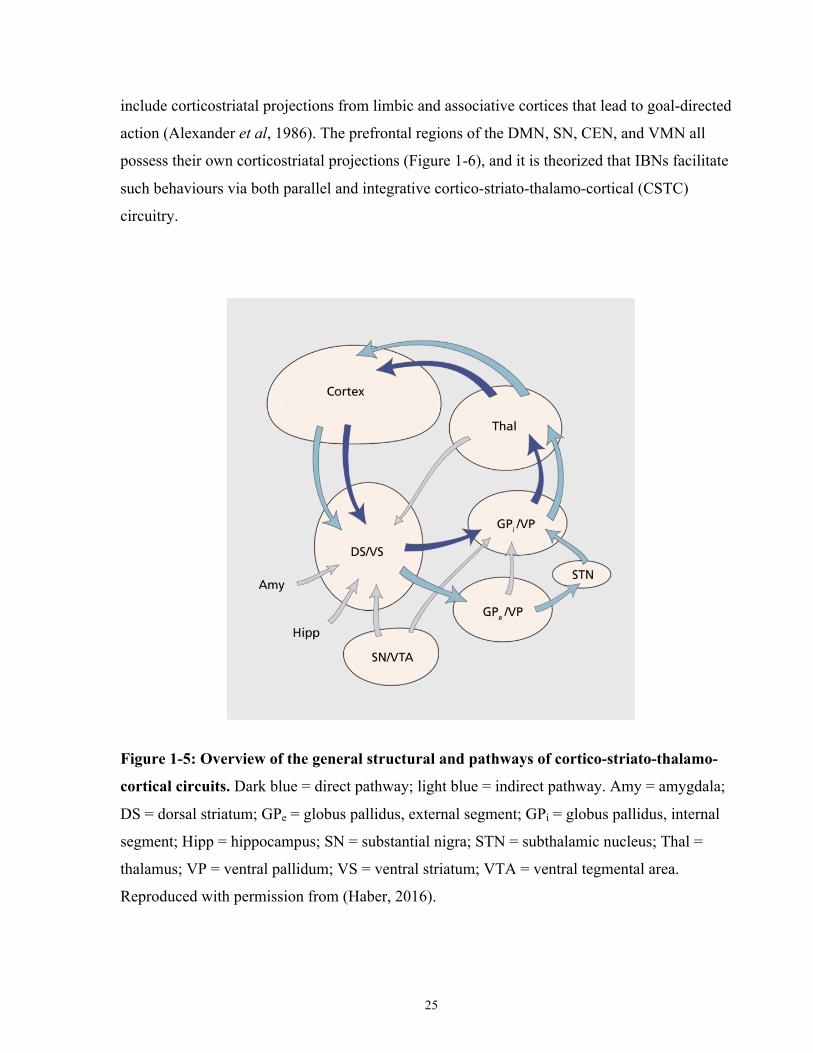
25
include corticostriatal projections from limbic and associative cortices that lead to goal-directed
action (Alexander et al, 1986). The prefrontal regions of the DMN, SN, CEN, and VMN all
possess their own corticostriatal projections (Figure 1-6), and it is theorized that IBNs facilitate
such behaviours via both parallel and integrative cortico-striato-thalamo-cortical (CSTC)
circuitry.
Figure 1-5: Overview of the general structural and pathways of cortico-striato-thalamo-
cortical circuits. Dark blue = direct pathway; light blue = indirect pathway. Amy = amygdala;
DS = dorsal striatum; GPe = globus pallidus, external segment; GPi = globus pallidus, internal
segment; Hipp = hippocampus; SN = substantial nigra; STN = subthalamic nucleus; Thal =
thalamus; VP = ventral pallidum; VS = ventral striatum; VTA = ventral tegmental area.
Reproduced with permission from (Haber, 2016).
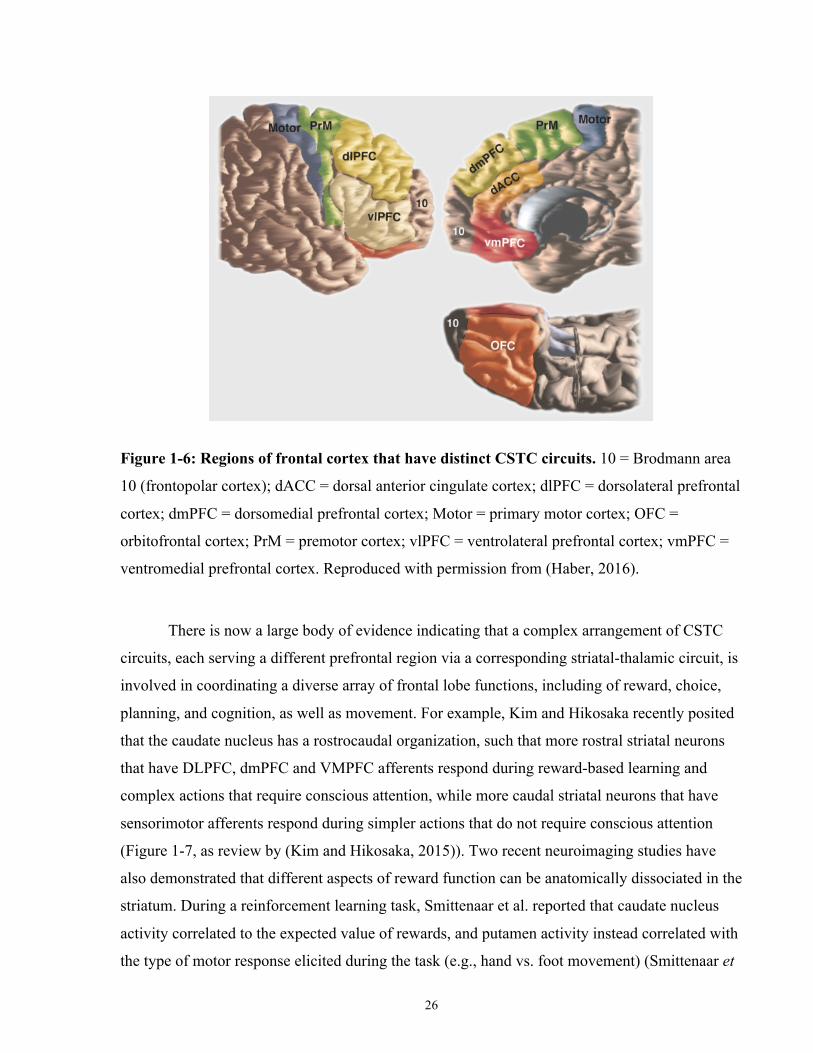
26
Figure 1-6: Regions of frontal cortex that have distinct CSTC circuits. 10 = Brodmann area
10 (frontopolar cortex); dACC = dorsal anterior cingulate cortex; dlPFC = dorsolateral prefrontal
cortex; dmPFC = dorsomedial prefrontal cortex; Motor = primary motor cortex; OFC =
orbitofrontal cortex; PrM = premotor cortex; vlPFC = ventrolateral prefrontal cortex; vmPFC =
ventromedial prefrontal cortex. Reproduced with permission from (Haber, 2016).
There is now a large body of evidence indicating that a complex arrangement of CSTC
circuits, each serving a different prefrontal region via a corresponding striatal-thalamic circuit, is
involved in coordinating a diverse array of frontal lobe functions, including of reward, choice,
planning, and cognition, as well as movement. For example, Kim and Hikosaka recently posited
that the caudate nucleus has a rostrocaudal organization, such that more rostral striatal neurons
that have DLPFC, dmPFC and VMPFC afferents respond during reward-based learning and
complex actions that require conscious attention, while more caudal striatal neurons that have
sensorimotor afferents respond during simpler actions that do not require conscious attention
(Figure 1-7, as review by (Kim and Hikosaka, 2015)). Two recent neuroimaging studies have
also demonstrated that different aspects of reward function can be anatomically dissociated in the
striatum. During a reinforcement learning task, Smittenaar et al. reported that caudate nucleus
activity correlated to the expected value of rewards, and putamen activity instead correlated with
the type of motor response elicited during the task (e.g., hand vs. foot movement) (Smittenaar et
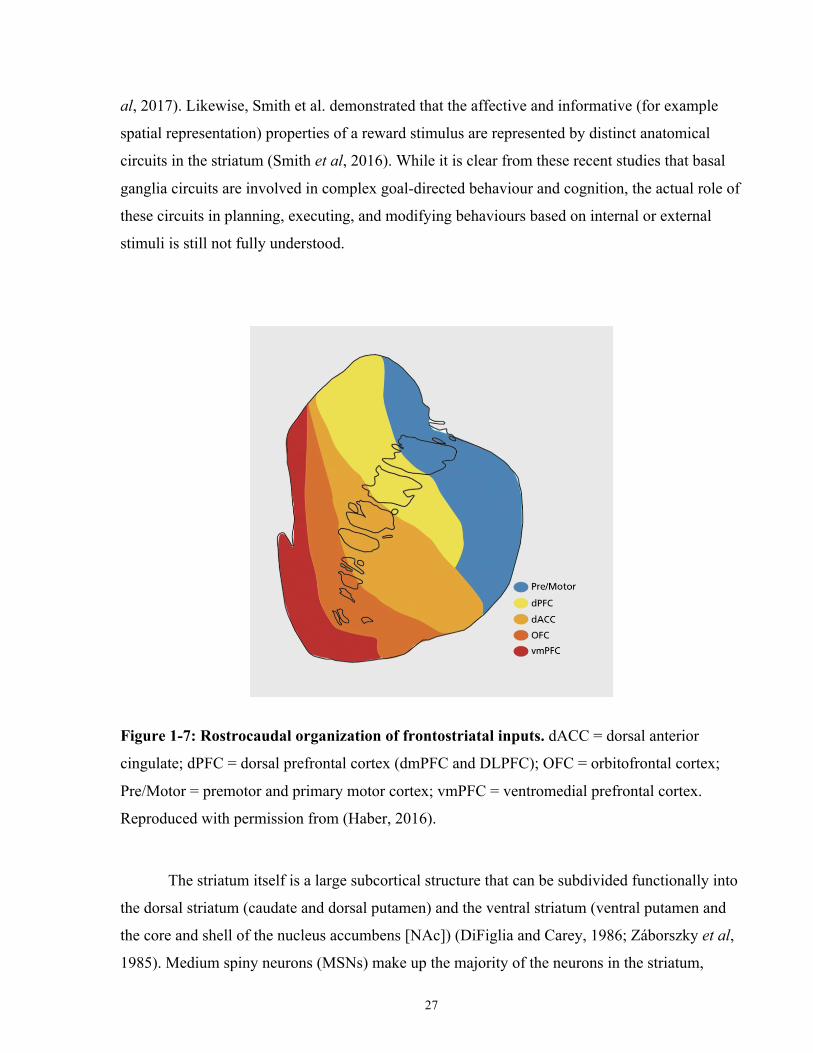
27
al, 2017). Likewise, Smith et al. demonstrated that the affective and informative (for example
spatial representation) properties of a reward stimulus are represented by distinct anatomical
circuits in the striatum (Smith et al, 2016). While it is clear from these recent studies that basal
ganglia circuits are involved in complex goal-directed behaviour and cognition, the actual role of
these circuits in planning, executing, and modifying behaviours based on internal or external
stimuli is still not fully understood.
Figure 1-7: Rostrocaudal organization of frontostriatal inputs. dACC = dorsal anterior
cingulate; dPFC = dorsal prefrontal cortex (dmPFC and DLPFC); OFC = orbitofrontal cortex;
Pre/Motor = premotor and primary motor cortex; vmPFC = ventromedial prefrontal cortex.
Reproduced with permission from (Haber, 2016).
The striatum itself is a large subcortical structure that can be subdivided functionally into
the dorsal striatum (caudate and dorsal putamen) and the ventral striatum (ventral putamen and
the core and shell of the nucleus accumbens [NAc]) (DiFiglia and Carey, 1986; Záborszky et al,
1985). Medium spiny neurons (MSNs) make up the majority of the neurons in the striatum,

28
while the rest consist of interneurons (Graveland and DiFiglia, 1985), forming clusters of cells
called cell islands (Goldman-Rakic, 1982). Striatal MSNs receive excitatory (glutamatergic)
inputs from pyramidal neurons in layers V and III of the prefrontal cortex (McFarland and
Haber, 2000), the thalamus, and dopaminergic inputs from brainstem nuclei (Haber et al, 2006;
Selemon and Goldman-Rakic, 1985; Somogyi et al, 1981) that each play distinct roles to regulate
striatal circuitry (Ding et al, 2008; Moss and Bolam, 2008; Smith et al, 2004). MSNs are also
phasically active, meaning that their firing rate is highest during execution of behavioural tasks
and their spontaneous firing rate is low (Crutcher and DeLong, 1984; Kimura, 1990; Kimura et
al, 1996).
Prefrontal projections to the striatum generally also follow a rostrocaudal topology
(Figure 1-7), although there is considerable overlap among the frontostriatal projections of
neighbouring cortical regions (Selemon and Goldman-Rakic, 1985). The primary sensorimotor
cortices innervate the caudal regions of the striatum, including the dorsolateral and central
putamen (Haber, 2016), and follow a somatotopic organization linked to specific patterns of
movements (Flaherty and Graybiel, 1994; Nambu, 2011; Yin et al, 2009). Prefrontal regions,
such as the ACC and OFC, project to the rostral striatum, including the medial caudate, ventral
rostral putamen, and the NAc (Chikama et al, 1997; Haber et al, 1995; Kunishio and Haber,
1994; Pandya et al, 1981). Some prefrontal regions project to distinct striatal structures. For
example, the NAc shell primarily receives input from the VMPFC (BA 25 and 32) (Haber et al,
1995). Other regions, such as those from the dACC and DLPFC, have extensive frontostriatal
connections, likely indicating crosstalk or integration with the CSTC circuitry of nearby nodes of
IBNs (Arikuni and Kubota, 1986; Calzavara et al, 2007). Medial and inferior temporal cortex
and limbic structures also innervate the striatum, and are thought to be responsible for integrating
memories and behavioural goals with sensorimotor and affective frontostriatal inputs (Friedman
et al, 2002).
Inhibitory striatal MSNs (Rav-Acha et al, 2005) project topographically to the pallidal
structures (internal and external globus pallidus [GPi and GPe, respectively], and ventral
pallidum) (Cummings, 1993) and substantial nigra (both the pars reticulata [SNr] and pars
compacta [SNc]) (Carpenter et al, 1976; Haber et al, 1990; Lynd-Balta and Haber, 1994; Parent
and Hazrati, 1995; Smith et al, 1998). Generally, the GPe and GPi receive input from the
putamen and caudate, while the ventral pallidum receives its input from the ventral striatum and

29
NAc (Haber et al, 1993; Lyons et al, 1996). Outputs from the pallidal structures form two
parallel yet functionally distinct pathways (as reviewed by (Haber, 2016)): first, the GPi and SNr
output to nuclei of the thalamus that, in turn, project back to the cortex (the ‘direct’ pathway,
considered to serve an excitatory role in regulating cortical activity); and second, the GPe and
ventral pallidum output first to the subthalamic nucleus (STN). The STN then projects to the
thalamus via the GPi (the ‘indirect’ pathway, considered to serve an inhibitory role in regulating
cortical activity). Alongside these two classical striatal pathways, the STN also receives
widespread cortical input from the frontal cortex via the more recently described ‘hyperdirect’
pathway (Haynes and Haber, 2013). Brainstem dopaminergic neurons from the SNc and ventral
tegmental area (VTA) also project to the dorsal and ventral striatum, respectively, modulating
the activity of corticostriatal projections (for a review, see (Haber, 2014)). The modulatory
effects of dopamine on cognitive and affective frontostriatal circuitry are thought to be involved
in reward-based learning and directing attention to relevant stimuli (Schultz, 1998; Wise and
Rompre, 1989).
Early studies reported that motor and cognitive/affective CSTC circuitry formed distinct,
functionally segregated loops. For example, Alexander et al. described five separable CSTC
loops stemming from the motor cortex, oculomotor cortex, DLPFC, lOFC and ACC (Alexander
et al, 1986). While there is a general rostrocaudal separation between cognitive/affective
(prefrontal) and motor (sensorimotor) projections in the striatum (Hanakawa et al, 2017;
Lehéricy et al, 2004; Di Martino et al, 2008; Parent and Hazrati, 1995), more recent evidence
from white matter tracing in monkeys (Averbeck et al, 2014; Haber et al, 2006) and mice
(Hintiryan et al, 2016), and neuroimaging in humans (Pauli et al, 2016; Tziortzi et al, 2014)
supports the existence of both parallel and integrative CSTC loops (Haber, 2003; Voorn et al,
2004). Early theories on integrative CSTC loops posited that the basal ganglia acts as a ‘funnel,’
integrating widespread inputs of diverse function and outputting to the motor cortex via the
ventrolateral thalamus to update or initiation behaviour (Allen and Tsukahara, 1974; Evarts and
Wise, 1984; Kemp and Powell, 1971). More recently, the thalamus has been proposed as an
integrative hub of IBNs (for a review see (Hwang et al, 2017)). However, the notion of a single
site acting as a universal ‘integrative’ hub is likely an overly simplistic model of CSTC function,
as there is considerable crosstalk within and between basal ganglia circuits.
30
Psychiatric Disorders in the Context of Brain Network Connectivity
Defining Abnormal Brain Connectivity
Neurobiological disturbances are typically identified by comparing individuals with a
particular psychiatric disorder relative to sex- and age-matched healthy individuals. There have
been two proposed ways to describe disturbances in IBNs related to psychiatric disorders: either
as abnormalities associated within a brain region itself, or abnormalities in how one brain region
connects to or interacts with other regions (as reviewed by (Menon, 2011)). Considering regional
abnormalities, these can include structural alterations (such as in cortical thickness or volume)
and/or functional disruptions to a brain region within an IBN, which could give rise to abnormal
behavior; lesion studies, examining the impact of focal lesions on behavior (for example,
(Robinson et al, 1984)), are a common example of this approach. Considering inter-regional
abnormalities, the study of the behavior of large-scale networks of regions and their interactions
within and amongst one another, can also contribute to our understanding of abnormal
behaviour. For example, psychiatric disorders can be characterized by abnormal white matter or
functional connections of a brain region to other regions (either to regions within the same IBN
or between different IBNs). Regional structural alterations or functional disruptions also appear
to have functional implications across widely distributed regions connected to the disrupted
region; thus, functional or behavioural deficits ‘downstream’ from structural abnormalities can
arise. For example, focal lesions following stroke cause contralateral structural and functional
abnormalities (Crofts et al, 2011) and inter-individual differences in the gray matter volume have
been correlated with behavioural performance on tasks (McTeague et al, 2016).
Another major consideration in defining abnormal brain connectivity is whether to search
for abnormalities associated with traditional, categorical psychiatric diagnoses (MDD, ED, OCD,
etc.), or instead to search for abnormalities that are associated trans-diagnostically with broad
categories of neurocognitive deficits that are apparent across diverse psychiatric disorders. As an
example of the latter approach, the National Institute of Mental Health’s Research Domain
Criteria (RDoC) offers a research framework to characterize broad dimensions of normal
behaviour, such as cognitive control or positive valence systems (Insel, 2014). The RDoC
approach works on the assumption that psychopathology is best understood not via categorical
disorders, but as the result of neurobiological abnormalities that lead to broader dimensions of
31
cognitive and behavioural abnormalties, which in turn interact to give rise to diverse patterns of
psychopathology associated transdiagnostically with a wide range of psychiatric disorders.
Transdiagnostic Alterations of Brain Networks
Consistent with the principles of RDoC, a number of studies have identified common
dimensions of abnormal behaviour, brain structure, and brain function across a wide range of
psychiatric disorders. This raises the possibility that IBN dysfunction contributes
transdiagnostically to psychiatric illness. In particular, abnormalities in the domain of cognitive
control may be a common element across many psychiatric disorders (as reviewed by
(McTeague et al, 2016)), because deficits in tasks related to cognitive control are observed
irrespective of psychiatric disorder class (Snyder et al, 2015). Additionally, large phenotypic
epidemiological studies across disorders have demonstrated that specific patterns of clinical
symptoms are strongly related to an underlying ‘general psychopathology’ factor (Carragher et
al, 2016; Krueger, 1999; Lahey et al, 2012). Notably, recent twin studies have reported that this
general psychopathology dimension has a strong genetic component, and consequently acute
disorder-specific clinical phenotypes are product of environmental influences (Kendler et al,
2003, 2011; Rhee et al, 2015). It also appears that heritable cognitive control deficits are distinct
from psychopathology, as these behavioural deficits often precede clinical disorder diagnosis,
worsen with disorder chronicity, and persist after remission. This phenomenon has been
observed across many different disorders, including major depression (Shilyansky et al, 2016),
psychosis (Bora and Murray, 2014), and substance abuse (Boelema et al, 2016; Peeters et al,
2014). Taken together, trait-like (genetic) deficits in cognitive control in combination with
environmental influences may be a risk factor for acute, state-like impairments specific to a
particular disorder class. The relationship between these broad cognitive control deficits and the
specific forms of psychopathology encountered in conventional psychiatric disorders such as
major depression, OCD, or eating disorders is not well understood.
It is likely that common structural and functional neural abnormalities underlie these
common broad behavioural deficits across disorders. Regarding structural abnormalities, three
large neuroimaging studies have reported that abnormalities of SN regions are common to many
diverse psychiatric disorders. Goodkind and colleagues (2015) were the first to demonstrate, in a
32
meta-analysis of 193 publications and 15,892 participants, that smaller gray matter volume
relative to healthy individuals in dACC and bilateral AI (regions of the SN) was a common
element across six disorders (schizophrenia, bipolar disorder, depression, addiction, obsessive-
compulsive disorder, and anxiety), and that gray matter loss in these regions correlated with poor
cognitive control (Goodkind et al, 2015). This result was replicated in a meta-analysis of 86
datasets and 6,508 individuals by Wise et al., who showed that gray matter loss in the bilateral
AI and dACC was common to both unipolar and bipolar depression (Wise et al, 2017). Finally
and most recently, Chang and colleagues have replicated this finding in a sample of 329
individuals with either schizophrenia, bipolar or unipolar depression and 156 healthy controls
(Chang et al, 2018). Structural abnormalities of the SN across diverse forms of psychopathology
thus appears to be a robust finding in current literature.
Regarding functional abnormalities, a number of studies have reported abnormal SN
activity during task-based and task-free fMRI, albeit there is considerably more heterogeneity in
their findings. Shanmugan and colleagues were the first to show that SN hypoactivity during a
working memory task was associated with overall psychopathology in 1,129 youth (including
individuals with phobias, depression and anxiety, behavioural disturbances such as attention-
deficit hyperactivity disorder, and psychosis) (Shanmugan et al, 2016). This group also reported
that youth with these same psychopathologies exhibited abnormally elevated cerebral blood flow
and abnormally low frontostriatal connectivity at rest in the dACC (Kaczkurkin et al, 2017).
Similarly, McTeague and colleagues recently demonstrated in a meta-analysis that SN hypo- or
hyperactivity was present across a variety of disorders during various cognitive control tasks
relative to controls (McTeague et al, 2017). Two other publications have examined
transdiagnostic abnormalities related to SN connectivity. First, patients with psychotic disorders
(either in bipolar disorder or schizophrenia-spectrum disorders) were found to exhibit SN
impairments in integrating information from the rest of the brain (global efficiency) (Sheffield et
al, 2017). Second, impaired reward processing was associated with hyperconnectivity between
the SN and VMN and hypoconnectivity between the SN and DMN across 5 different disorders
(Sharma et al, 2017). Like structural SN deficits, functional SN abnormalities appear to be
associated transdiagnostically with psychopathology, although there is substantial heterogeneity
in terms of whether this abnormality is related high versus low activity or connectivity.
33
Three extant theories attempt to integrate these transdiagnostic deficits in cognitive
control and SN dysfunction in terms of abnormal crosstalk to other IBNs. McTeague and
colleagues have proposed that transdiagnostic abnormalities in SN structure, function, and in
cognitive control relate to this network’s close relationship with the CEN (as discussed in
(McTeague et al, 2016)). As previously discussed, the SN and CEN co-activate during a wide
variety of tasks and are sometimes collectively grouped into a ‘task-positive network’ (although
McTeague and colleagues refer to this network as the ‘multiple demand network’). Studies of
causal interactions between these networks during cognitive tasks demonstrate that causal
interactions from the AI to the dACC during tasks requiring salience detection are proportionate
to task cognitive demand, and, in turn, lead to activations in CEN regions in the lateral frontal
and parietal cortex (Cai et al, 2016; Chen et al, 2015; Jiang et al, 2015). Consequently,
McTeague et al. posit that the deficits in cognitive control across diverse forms of
psychopathology represent disruptions in the relationship between the SN and CEN (McTeague
et al, 2016). Alternatively, Menon’s ‘unifying triple network’ hypothesis relates to the SN’s
possible role as a functional ‘switch’ between the CEN during externally-driven cognition, and
DMN during internally-driven cognition (Figure 1-8; as discussed in (Menon, 2011; Menon and
Uddin, 2010)). Consequently, SN dysfunction may lead to aberrant activity in these other
networks, resulting in difficulties integrating salient external or physiological events, as well as
difficulties accessing networks for attention and working memory or self-
referential/autobiographical thought. Finally, a theory proposed by Marsh and colleagues reviews
the possible transdiagnostic role of frontostriatal circuits and cognitive control (as discussed in
(Marsh et al, 2009a)). Briefly, they theorize that deficits in self-regulatory control across diverse
forms of psychopathology (including obsessive-compulsive disorder and eating disorders) are
related to either dysregulated parallel (distinct) or integrated frontostriatal circuits in medial and
lateral prefrontal cortex and orbitofrontal cortex.
To summarize, structural or functional abnormalities, either of specific brain regions or of
the brain-wide connections of IBNs, appear to underlie a common broad set of deficits in
cognition and behaviour evident transdiagnostically across a diverse range of psychiatric
disorders. The next three sections will discuss three psychiatric disorders of direct relevance to
this thesis, reviewing currently available evidence on structural and functional neuroimaging
abnormalities from a disorder-specific perspective.

34
Figure 1-8: Schematic of the Triple Network Theory of Psychopathology. ACC = dorsal
anterior cingulate cortex; DLPFC = dorsolateral prefrontal cortex; Ins = insula; mPFC = medial
prefrontal cortex; PCC = posterior cingulate cortex; PPC = posterior parietal cortex. Reproduced
with permission from (Nekovarova et al, 2014).
Psychopathology 1: Major Depressive Disorder Major depressive disorder (MDD) is a psychiatric condition characterized by depressed
mood and/or a marked reduction in one’s interest in, or one’s pleasure of derived from, daily
activities, often with associated disruptions of sleep, appetite, concentration, motivation, and
movement, as well as guilty, hopeless, or suicidal thoughts (American Psychiatric Association,
2013). MDD is also characterized by a profound impairment of day-to-day function, and
therefore the personal and economic burden of MDD is extremely high: MDD is the leading
cause of years lived with a disability (Ferrari et al, 2013), and is the fourth largest contributor to
35
the global burden of disease (Murray and Lopez, 1997). Quality of life is significantly impaired
in individuals with MDD, and this impairment increases with MDD severity (Ishak et al, 2013).
In the United States, MDD is associated with US$2 billion per month in direct workplace
productivity losses (Birnbaum et al, 2010), and the broader economic burden of MDD in the
USA accounted for US$210.5 billion in 2010 (Greenberg et al, 2015). MDD is also related to
increased short-term disability and more days out of work (Alonso et al, 2011; Kessler et al,
1999). In Canada, the total economic burden of all mental illness was $51 billion in 2003 (Lim et
al, 2008), and in Ontario, MDD-attributed burden was greater than the burden of breast,
colorectal, lung, and prostate cancer combined (Ratnasingham et al, 2013).
MDD Diagnosis
Current diagnostic criteria for MDD are specified in the fifth edition of the American
Psychiatric Association’s Diagnostic and Statistical Manual (DSM-5) (American Psychiatric
Association, 2013), and the tenth edition of the World Health Organization’s International
Statistical Classification of Behavioral Disorders (ICD-10) (World Health Organization, 1992).
There are a number of studies comparing the diagnostic performance of the DSM-IV, the fourth
edition of the DSM, versus the ICD-10; these studies reported subtle differences in assessing
disorder severity but overall concordance in those with moderate-to-severe MDD (Saito et al,
2010). Since the DSM-5 is predominantly used by clinicians in North America, this thesis will
focus on the DSM-5 diagnostic criteria for MDD.
According to the DSM-5, MDD is characterized by the near daily presence of a number
of symptoms during the same 2-week period that trigger a decline from the patient’s normal
functioning. These symptoms must not be attributable to another medical condition, and at least
one of the symptoms must be either depressed mood or a reduction in interest or pleasure. Other
symptoms can include: significant weight and appetite change; insomnia or hypersomnia;
psychomotor increases or decreases; fatigue; excessive worthlessness or guilt; impaired
concentration or decision-making; and recurrent suicidal ideation or thoughts of death (American
Psychiatric Association, 2013). Multiple subtypes of MDD are considered to exist because of the
diverse presentation of these symptoms (Insel and Cuthbert, 2015). Small, but meaningful,
differences exist between the diagnostic criteria of MDD between the fourth and fifth editions of
36
the DSM; for example, a definition of hopelessness has been introduced to the core depressed
mood criterion (for a review, see (Uher et al, 2014)).
A number of instruments can be used to support a MDD diagnosis, including clinician-
administered semi-structured interviews such as Structured Clinical Interview for DSM-IV-Axis-
I Disorders (SCID-I) (First et al, 2002), the Mini International Neuropsychiatric Interview
(MINI) (Sheehan et al, 1998), as well as self-administered questionnaires such as the Patient
Health Questionnaire-9 (PHQ-9) (Kroenke et al, 2001). In a recent meta-analysis, all three
batteries demonstrated good sensitivity and specificity (>80%) to diagnose and assess the
severity of MDD (Pettersson et al, 2015).
MDD Prevalence
In the United States, the lifetime prevalence of MDD is 13-16.2%, while the 12-month
prevalence is approximately 5-6.6% (Hasin et al, 2005; Kessler et al, 2003). Of these MDD
cases, 10.4% are mild, 38.6% are moderate, 38.0% are severe, and 12.9% are very severe using
standard reference ranges (Kessler et al, 2003). The mean age of onset of MDD is 30.4 years
(Hasin et al, 2005). The mean duration of a MDD episode is approximately 16 weeks (Kessler et
al, 2003); however 26.5% experience episodes lasting at least two years (Rubio et al, 2011). In
Canada, the 12-month prevalence of MDD is between 4.9-8.2% (Patten et al, 2015; Vasiliadis et
al, 2007), and the lifetime prevalence is 11.3% (Patten et al, 2015). Women are at approximately
double the risk of developing MDD compared to men, and, as is also true in the USA, most
Canadian cases of MDD are episodic in course; 50% of episodes will resolve within 3 months
(Patten et al, 2015). Furthermore, about one third of remitted participants will experience a
subsequent episode within 3 years of remission (Hasin and Grant, 2015), and the mean number
of lifetime episodes is 4.7 (Hasin et al, 2005).
MDD Etiology
MDD is a complex and heterogeneous disorder thought to arise from an interaction of
genetic, biological, environmental, and psychosocial influences. MDD is a somewhat familial
37
disorder, being 2.84 times more common among first-degree relatives of an individual with
MDD (Sullivan et al, 2000). Furthermore, twin and sibling studies have found that
approximately one-third of the risk for developing MDD is heritable, while the remaining two-
thirds are attributable to environmental sources (Sullivan et al, 2000). The remaining variability
in MDD risk is likely attributable to individual-specific environmental factors, including early
life trauma and other stressors (Mullins et al, 2016). Notably, predominant gene-environment
interaction models highlight the role of genotypes related to monoamine function, including
serotonin, norepinephrine, and dopamine systems, and their interaction with environmental
stressors and early life trauma (for a review, see (Saveanu and Nemeroff, 2012) and (Lopizzo et
al, 2015)).
MDD Comorbidity
72.1% of lifetime and 78.5% of 12-month cases of MDD have a comorbid DSM-IV
diagnosis (Kessler et al, 2003). In the 2003 National Comorbidity Survey Replication Study,
59.2% of MDD patients had a comorbid anxiety disorder and 24% had a comorbid substance-use
disorder (Kessler et al, 2003). Personality disorders (most commonly, obsessive-compulsive
personality disorder) are also frequently comorbid with MDD (Hasin et al, 2005) (37.9% of
cases). Furthermore, the presence of somatic abnormalities such as chronic fatigue and pain are
often comorbid with MDD (for a review, see (Bair et al, 2003)). MDD patients with
comorbidities show poorer treatment outcomes relative to MDD patients unaffected by such
comorbidities. For example, MDD patients with comorbid anxiety tend to have higher suicide
rates and disorder chronicity, and poorer response to first-line treatments relative to MDD cases
without comorbid anxiety (Seo et al, 2011).
Assessment of Treatment Severity
The symptom severity of MDD can be assessed through standardize clinician- or self-
administered instruments. In clinician-administered batteries such as the Hamilton Rating Scale
for Depression (HAMD) (Hamilton, 1960) or Inventory of Depressive Symptoms (IDS) (Rush et
al, 2003), trained assessors or clinicians assess the severity of MDD using a semi-structured
38
interview that asks directed questions on the severity or frequency of a given symptom,
supplanted by direct observations of the patient’s appearance and behaviour. Self-administered
questionnaires such as the Beck Depression Inventory II (BDI-II) (Beck et al, 1961, 1996) and
Quick Inventory of Depressive Symptoms (QIDS) (Rush et al, 2003) are an alternative to
clinician-administered scales that quicker to administer and positively correlate to clinician-
administered metrics (Enns et al, 2000; Schneibel et al, 2012). However, multiple studies have
noted factors that bias scoring on both self-reported and clinical-administered scales. For
example, more severe scores on self-reported measures are significantly correlated with
personality traits, such that individuals who report high neuroticism and low extraversion also
report higher severity on the BDI-II (Enns et al, 2000; Schneibel et al, 2012). Clinician-
administered assessments such as the HAMD also show a greater reduction of symptoms scores
during treatment relative to patient-reported questionnaires (Schneibel et al, 2012).
The HAMD is a clinician-administered assessment that is one of the most commonly
used metrics assessing MDD severity over the period of one week (Hamilton, 1960). The 17-
item version of the scale assesses the following items: 1) Depressed mood; 2) Feelings of guilt
and self-criticism; 3) Suicidal thoughts and ideation; 4-6) Disturbances in sleep (early, middle,
late insomnia); 7) Interest and pleasure of daily activities, including social activities and self-
care; 8) psychomotor slowing; 9) Agitation; 10) Anxious thoughts and irritability; 11) Somatic
symptoms of nervousness; 12) Loss of appetite; 13) Fatigue and loss of energy; 14) Interest in
sex; 15) Hypochondriasis; 16) Weight loss; and 17) Acknowledgment or insight of depression.
The scale contains additional items to assess MDD subtypes, but they are not as widely used
(Hamilton, 1960). Each item is rated on a scale of 0-2 or 0-4 and item ratings are summed to
generate a score. The total HAMD score has reference ranges from subclinical/minimal
depression (0-7 HAMD score), mild depression (8-16 HAMD score), moderate depression (17-
23 HAMD score), and severe depression (24-52 HAMD score) (Zimmerman et al, 2013).
Response to a given intervention is conventionally defined as a >50% reduction in symptom
score, and remission is typically defined at a 17-item HAMD score <8 (O’Donovan, 2004).
The BDI-II is a 21-item patient-administered questionnaire that assesses MDD severity
(Beck et al, 1961, 1996). Patients rate the following symptoms on a 0-3 scale: 1) Sadness; 2)
Pessimism; 3) Past failures; 4) Loss of pleasure; 5) Guilty feelings; 6) Feelings of punishment; 7)
Self-dislike; 8) Self-Criticalness; 9) Suicidal thoughts or wishes; 10) Crying; 11) Agitation; 12)
39
Loss of interest; 13) Indecisiveness; 14) Worthlessness; 15) Loss of energy; 16) Changes in
sleeping pattern; 17) Irritability; 18) Changes in appetite; 19) Concentration difficulty; 20)
Tiredness or fatigue; and 21) Loss of interest in sex. Item ratings are summed to indicate overall
depression severity. A BDI-II score of 0-13 indicates no or minimal depression; 14-19 indicates
mild depression; 20-28 indicates moderate depression; 29-63 reflects severe depression (Beck et
al, 1996). Response to a given treatment on the BDI-II is defined as a >50% reduction, and
remission is typically defined at a BDI-II score <12 (Riedel et al, 2010).
Structural and Functional Disruptions in MDD
The neuroimaging literature on MDD is extensive, beginning in the late 1980s with early
PET studies and growing steadily to hundreds of articles a year as of the present day. This
section will focus on structural and functional neuroimaging findings in MDD that are of
particular relevance to the experimental work of the present thesis.
Abnormal gray matter volume of both cortical and subcortical regions has been linked to
MDD. Studies have consistently found that, relative to healthy controls, MDD patients exhibit
reduced gray matter volumes in cortical regions of the VMN and SN, including the dACC,
dmPFC, mOFC, sgACC, and in striatal regions such as the caudate and putamen (Bora et al,
2012c; Webb et al, 2014; Zhao et al, 2014). Other recent studies have reported lower gray matter
volume in paralimbic regions, including the inferior hippocampus (Zou et al, 2010), and in
dorsolateral prefrontal regions, including the DLPFC and IFG (Du et al, 2012). In terms of the
effects of gender, one meta-analysis found that the proportion of women in each study included
in the meta-analysis negatively correlated with gray matter volume in the right hippocampus
(Zhao et al, 2014). Such structural abnormalities highlight the prominent role of prefrontal CSTC
and paralimbic gray matter abnormalities in MDD pathophysiology (Bora et al, 2012c;
Shepherd, 2013).
Functional abnormalities have also been reported since the earliest days of neuroimaging
studies in MDD, with classic and widely-cited examples being observations of hyperactivity in
the ventromedial prefrontal cortex and specifically in the subgenual cingulate cortex (reviewed in
(Drevets et al, 2008)). Subsequent work highlighted the important role of altered functional
40
network connections from this region to other cortical networks in the pathophysiology of MDD
(Mayberg, 2003). In perhaps the most widely-cited example, Grecius and colleagues (2007)
reported increased functional connectivity between the subgenual cingulate cortex and the
DMN’s CSTC in patients with MDD (Greicius et al, 2007). More recently, abnormalities in
terms of local fMRI signal synchrony and oscillatory power have also been observed in MDD
patients relative to healthy controls. For example, MDD is associated with less local oscillatory
synchrony in the SN left insula (Li et al, 2014b) and ACC (Xue et al, 2016), and higher local
synchrony in the DMN mPFC region (Iwabuchi et al, 2015; Xue et al, 2016). MDD is also
characterized by low oscillatory power in the superior and middle frontal gyri (Zhang et al,
2017), left DLPFC (Wang et al, 2012a), sgACC (Lai and Wu, 2015), bilateral mOFC (Wang et
al, 2012a), inferior and middle temporal cortices (Shen et al, 2014) and the parahippocampal
gyrus (Liu et al, 2013). The relative amplitude of oscillations of different frequencies also
significantly differs in MDD relative to controls in the VMPFC, IFG and PCC (Wang et al,
2016). From a network perspective, there is abnormal oscillatory power in low frequency
fluctuations in the brain regions of the DMN, VMN, and corticostriatal circuits (Guo et al, 2013;
Tadayonnejad et al, 2015).
Maladaptive, self-referential rumination, a hallmark clinical feature of MDD, is
associated with a functional imbalance between IBNs. Rumination in adolescent, adult, and late-
life MDD is associated with hyperactivity localized to regions affiliated with the VMN and
DMN, and hypoactivity localized to regions affiliated with the SN and CEN (Alexopoulos et al,
2012; Bartova et al, 2015; Belleau et al, 2015; Hamilton et al, 2011b; Lemogne et al, 2012;
Rzepa and McCabe, 2016; Sheline et al, 2009; Zhu et al, 2017). For example, one resting-state
fMRI study reported that sgACC (VMN) and hippocampal (DMN) hyperactivity was inversely
correlated to hypoactivity localized to the dmPFC/dACC (SN) and DLPFC (CEN) (Hamilton et
al, 2011a). In another resting-state fMRI study from the same group, DMN hyperactivity was
positively correlated with levels of maladaptive rumination in MDD, while the onset of SN and
CEN activity was correlated with reflective, adaptive rumination (Hamilton et al, 2011b). The
authors interpret this maladaptive relationship to poorer top-down SN and CEN processes over
the DMN.
Similarly, MDD patients, relative to healthy controls, exhibit abnormal DMN and VMN
hyperactivity to aversive stimuli and negative affect. For example, the ACC and ventral striatum
41
are hyperactive during negative self-referential rumination (Wagner et al, 2013, 2015). Striatal
nodes of the VMN are similarly hyperactive while viewing aversive images (McCabe et al,
2009). Hyperactivity from regions of the DMN, the sgACC, and the lOFC have also been related
to heightened levels of negative self-focus and negative affect (Cooney et al, 2010; Mayberg et
al, 1999; Philippi et al, 2015). For example, MDD patients exhibit hyperconnectivity between
the PCC and the lOFC region of the VMN relative to healthy controls; the authors interpret this
finding that negative affect and rumination is associated with abnormally high connectivity
between regions associated with non-reward and autobiographical memory (Cheng et al, 2018).
Furthermore, the sgACC appears to play a clear role in generating negative affect in healthy
controls. One study recently reported that, in healthy controls, the sgACC regulates interactions
dorsal cognitive and ventral affective networks during sadness provocation (Ramirez-Mahaluf et
al, 2018).
Conversely, mesocorticolimbic hypoactivity of the SN and VMN have also been linked
to poor incentive salience and anhedonia, another hallmark clinical feature of MDD (Nestler and
Carlezon, 2006; Tremblay et al, 2005). During task-based fMRI, MDD patients display ACC and
nucleus accumbens hypoactivity to reward feedback relative to healthy controls (Knutson et al,
2008; Pizzagalli et al, 2009; Robinson et al, 2012), and also display an absence of VMN activity
for pleasant sights and tastes (McCabe et al, 2009). Relative to controls, MDD patients also
exhibit hypoactivity in the OFC, ACC and ventral striatum during the receipt of a reward, and
during the reward anticipation phase of monetary incentive delay tasks (Admon et al, 2015;
Chantiluke et al, 2012; Manelis et al, 2016; Schiller et al, 2013; Smoski et al, 2011).
MDD patients also display deficits in cognitive control compared to their non-depressed
counterparts, and this deficiency has been attributed to abnormal functioning of the SN and CEN.
For example, MDD patients exhibit dACC hyperactivity to tasks that assess working memory
and cognitive control, including the n-back (Harvey et al, 2005) and Stroop tasks (Holmes and
Pizzagalli, 2008; Wagner et al, 2006). Volumetric reductions in SN nodes have also been related
to behavioural deficits on such cognitive tasks (Li et al, 2010a). Furthermore, MDD patients
display higher connectivity at rest between the striatum and DLPFC relative to controls;
frontostriatal hyperconnectivity also positively correlated with disease severity (Kerestes et al,
2015). Abnormal CEN and SN frontostriatal connectivity has also been attributed to
42
inappropriate top-down processing of negative affect and aversive stimuli (Furman et al, 2011;
Kerestes et al, 2015).
It is important to note that a substantial number of MDD neuroimaging studies report
considerable inter-individual variability in findings, perhaps reflecting the substantial clinical
heterogeneity of the disorder. To examine this inter-individual variability, two recent
neuroimaging publications have reported on MDD subtypes, or on MDD dimensions of illness,
characterized by distinct patterns of clinical presentation and/or functional connectivity. In one
study, patients with MDD were positioned along 3 RDoC-inspired dimensions of illness
encompassing reward sensitivity (positive valence systems), neuroticism (negative valence
systems), and cognitive control; each dimension was associated with a distinctive EEG signature,
with deficits in cognitive control being associated with low gamma power in Sn regions
including the DLPFC (Webb et al, 2016). In another notable study, a novel clustering method
was used to define robust MDD subtypes by shared patterns of abnormal resting-state
connectivity; the authors showed in a large multisite sample that MDD patients could be
partitioned into four functional connectivity-based subtypes. The biotypes showed that the
variability in patients’ functional signatures was associated with two important dimensions of
clinical symptoms: anhedonia and anxiety, each with a distinctive pattern of whole-brain
functional connectivity. Of particular clinical relevance, the authors also showed that biotype
diagnoses were longitudinally stable over a one-month period in actively depressed patients, and
that the biotypes could be used to predict response rates to rTMS treatment (Drysdale et al,
2017).
Psychopathology 2: Obsessive-Compulsive Disorder Obsessive-compulsive disorder (OCD) is characterized by intrusive, distressing thoughts,
and repetitive behaviours aimed at reducing the aforementioned distress (American Psychiatric
Association, 2013). OCD tends to begin in childhood or early adulthood, and is a chronic and
often treatment-refractory condition (Ruscio et al, 2010). OCD is a severely disabling disorder
for both the sufferer and their family in terms of social and work functioning (for a review, see
(Steketee, 1997)). Even mild-to-moderate symptoms of OCD can lead to severe reductions in
43
quality of life (Moritz et al, 2005), and OCD is related to reductions in virtually all dimensions
of quality of life measures (Fontenelle et al, 2010).
OCD Diagnosis
As with MDD, the diagnosis of OCD in North America is typically made using DSM-5
criteria. OCD falls under the obsessive-compulsive disorders section of the DSM-5, which also
encompasses related disorders such as body dysmorphic disorder, trichotillomania and
excoriation disorder (American Psychiatric Association, 2013). According to the DSM-5
guidelines, OCD is defined by two criteria: first, the presence of obsessions, compulsions, or
both; and second, that the obsessions or compulsions are present for more than 1 hour daily or
cause clinically-significant distress in some important area of functioning. The DSM-5 defines
obsessions using two criteria: first, that the recurrent thoughts or urges are intrusive and
unwanted, and cause marked anxiety or distress; and second, that the patient tries to suppress
these thoughts or dispel them with some action, referred to as a compulsion. The DSM-5 defines
two criteria for a behaviour to be considered a compulsion: first, compulsions must be repetitive
behaviours or thoughts, including washing, checking, or counting, that the patient is driven to
perform in response to an obsession; and second, these acts are aimed at reducing or preventing
or reducing the distress associated with an obsession notwithstanding that they are not
realistically connected (American Psychiatric Association, 2013). According to one study, most
people with OCD tend to have both obsessions and compulsions (Foa et al, 1995).
A number of instruments can be employed by a clinician to support a OCD diagnosis,
including clinical-administered semi-structured interviews like the SCID-I (First et al, 2002), the
MINI (Sheehan et al, 1998), and patient-rated questionnaires like the PHQ-9 (Kroenke et al,
2001).
OCD Prevalence The lifetime prevalence of OCD is approximately 1-3% (Abramowitz et al, 2009), while
the 12-month prevalence of OCD in the United States and internationally is 1.2% and 1.1-1.8%,
44
respectively (Kessler et al, 2005; Ruscio et al, 2010). The lifetime and annual prevalence of
OCD is comparable in Canada (Weissman et al, 1994). The mean age of onset for OCD is 19.5
years, and a quarter of patients’ OCD onset begins by 14 (Kessler et al, 2005; Ruscio et al,
2010). Males tend to have an earlier onset of OCD relative to females, as nearly a quarter of
males have an onset of OCD before the age of 10 (Weissman et al, 1994). Disease prevalence is
approximately equal between the two sexes (Ruscio et al, 2010).
OCD Etiology Akin to MDD, OCD is a fairly heritable disorder, and its etiology likely involves an
interaction effect of genetic and biopsychosocial factors (Taylor and Jang, 2011). In one review,
the prevalence of OCD among individuals with adult relatives affected by OCD was two times
higher relative to controls, and the OCD prevalence rate among individuals with adolescent or
child relatives with OCD was nearly 10 times higher than that of controls (Pauls, 2010). Genetic
factors are often linked to a number of polymorphisms in genes associated with serotonin and
catecholamine function (Taylor, 2016). Additionally, environmental insults like perinatal insults
and physical abuse are associated with an increased risk of OCD onset (Grisham et al, 2011).
OCD Comorbidity OCD is often comorbid with other psychiatric disorders. The most common
psychopathologies include an anxiety disorder in 76% of OCD cases, MDD or bipolar disorder
in 41% of cases (Ruscio et al, 2010), and obsessive-compulsive personality disorder in 23-32%
of cases (Eisen et al, 2010). Another disorder commonly comorbid with OCD is tic disorder (in
30% of OCD cases); patients with this comorbidity are predominately male, and tend to differ in
symptom prevalence and prognosis compared to those without tic disorder (Leckman et al,
2010). This difference is suggestive of OCD subtypes reflected potentially by an etiological
difference.
45
Assessment of Symptom Severity The Yale-Brown Obsessive-Compulsive Scale II (Y-BOCS) is considered the gold
standard measure of OCD symptom severity (Storch et al, 2010). The Y-BOCS is a clinician-
rated symptom checklist assessing past or current obsessions and compulsions. The symptom
checklist contains 14 items: 1) Aggressive obsessions, such as a fear of harming oneself or
others; 2) Contamination obsessions, such as a concern with environmental contaminants or
animals; 3) Sexual obsessions; 4) Religious obsessions; 5) Obsession with need for symmetry or
exactness; 6) Somatic obsessions like a concern with illness or disease; 6) Hoarding or saving
obsessions; 7) Miscellaneous obsessions like a fear of saying certain things or other
superstitions; 8) Cleaning or washing compulsions like excessive handwashing; 9) Checking
compulsions like repeatedly checking locks; 10) Repeated rituals; 11) Counting compulsions;
12) Ordering or arranging compulsions; 13) Hoarding/collecting compulsions; and 14)
Miscellaneous compulsions like excessive list making or other mental rituals. Y-BOCS scores
range between 0-40, with scores over 7 indicating clinically significant OCD symptoms.
Multiple studies report high reliability and construct validity for this measure (Goodman et al,
1989; Goodman and Price, 1992; Woody et al, 1995). Signal detection analyses suggest that a
reduction of at least 25-35% on the Y-BOCS is required to demonstrate OCD treatment
response, while treatment remission is often defined by a score of less than 13 on the Y-BOCS
(Farris et al, 2013).
Structural and Functional Abnormalities of OCD
As with MDD, neuroimaging studies in OCD report structural and functional
abnormalities in the DMN, SN and VMN and to affiliated frontostriatal circuitry related to the
self-regulation of thoughts, emotions, and behaviour (van den Heuvel et al, 2010; Lipsman et al,
2013a; Marsh et al, 2009a). Structurally, OCD patients have smaller gray matter volume in SN
and VMN cortical nodes like the ACC and OFC (Gilbert et al, 2008; Kühn et al, 2013; Reess et
al, 2016) and fronto-parietal regions (Rotge et al, 2010), and poorer white matter integrity
between these networks (Hoexter et al, 2012; Rotge et al, 2010). OCD patients also have
increased basal ganglia grey matter volume in regions like the thalamus and ventral striatum
(Atmaca et al, 2016; Hou et al, 2013).
46
Hyperactive VMN and orbitofrontal frontostriatal circuits are often associated with
aversive, obsessive thoughts and compulsive behaviours. OCD patients display VMN-striatal
hyperconnectivity to punishments during a monetary incentive delay task (Beucke et al, 2012),
during symptom provocation, and at rest (Anticevic et al, 2014; Cocchi et al, 2012; Figee et al,
2013; Harrison et al, 2009). While VMN-CSTC hyperconnectivity has been replicated in many
studies, one study found VMN-CSTC hypoconnectivity during the absence of a rest task
condition in unmedicated OCD patients relative to controls (Posner et al, 2014). Abnormal
frontostriatal hyperactivity from the VMPFC and OFC is thought to underlie dysfunctional
negative or aversive obsessive thoughts and ritualistic behaviours (Graybiel and Rauch, 2000;
Nakamae et al, 2014). Most strikingly, one study reported that OCD patients have DMN and
VMN hyperconnectivity related to abnormal reward processing and the inability to inhibit
compulsive behaviours (Koch et al, 2018). The role of these circuits in the etiology of OCD is
further supported by one recent animal study: optogenetically-induced chronic medial PFC
CSTC hyperactivity has produced repetitive grooming and other OCD behaviours in mice
(Ahmari et al, 2013).
The SN and CEN, and their frontostriatal connections are also linked to deficits in
cognitive control in OCD. For example, relative to controls, in OCD patients, the dACC is
abnormally hyperactive during symptom provocation and while committing errors in cognitive
control tasks (Bourne et al, 2012). Frontostriatal abnormalities related to the SN and CEN also
appear to be hyper-connected or hyperactive at rest; hyperconnectivity relative to controls has
been observed in OCD between the medial dorsal nucleus of the thalamus, dACC (Bourne et al,
2012; Rauch et al, 2006), caudate (Graybiel and Rauch, 2000) and DLPFC (Figee et al, 2013).
Furthermore, DLPFC frontostriatal connectivity and insulo-striatal connectivity is positively
correlated to OCD symptom severity (Bernstein et al, 2016; Vaghi et al, 2017).
The local function of brain regions in terms of oscillation synchrony and power is also
abnormal in OCD patients relative to controls. Local temporal synchrony is abnormally high in
the right ACC, OFC, bilateral middle frontal gyrus and precuneus, and is abnormally low in the
bilateral caudate and PCC (Chen et al, 2016; Yang et al, 2010, 2015). The amplitude of low-
frequency fluctuations of fMRI activity is also abnormal in OCD relative to controls. OCD
patients exhibit decreased amplitude in the mOFC and dmPFC (Giménez et al, 2017), and in
CSTC circuits (Qiu et al, 2017) relative to controls. Furthermore, the amplitude of low frequency
47
fluctuations in the DMN is also disrupted, with higher amplitude found in the ACC and
decreased in the PCC (Cheng et al, 2013).
Many OCD neuroimaging studies report substantial inter-individual variability, and this
variability is thought to represent the diverse clinical presentations and symptom severity of the
disorder (Piras et al, 2015). However, only a handful of studies attempt to parse this clinical
heterogeneity into underlying neurobiological substrates. Two MRI studies compared OCD
patients with intact versus poor insight. One study found that OCD patients with poor insight had
a significantly higher frequency of morphological abnormalities (Aigner et al, 2005). Another
more recent resting-state fMRI study reported a positive correlation in the activity between the
right anterior insula (SN) and right OFC (VMN), and the level of insight (Fan et al, 2017). Other
studies have attempted to differentiate functional or structural differences by clusters of OCD
symptoms. For example, two recent publications have reported volumetric and functional
connectivity differences between patients with reactive (i.e., contamination or asymmetry) versus
autogenous (aggressive or religious) obsessions (Harrison et al, 2013; Subirà et al, 2013).
Another structural MRI study found differences in gray matter volume of the cerebellum and
insula in patients with aggression/checking obsessions versus those with contamination
obsessions (Okada et al, 2015). Further research is necessary to further disentangle the complex
cognitive and behavioural underpinnings of OCD symptomatology.
Psychopathology 3: Anorexia Nervosa and Bulimia Nervosa Eating disorders such as anorexia nervosa (AN) and bulimia nervosa (BN) carry a
disproportionately high burden of illness, both socially and individually (reviewed in further
detail below). Eating disorders are also associated with a high mortality rate. For example, one
study reported that approximately 10% of AN sufferers die within 10 years of disease onset
(Sullivan, 1995); more recent reports suggest that the current crude mortality rate is
approximately 5% and 2% per decade for AN and BN respectively; death is most often
associated with disorder-associated complications or suicide (Arcelus et al, 2011; Hoek, 2006).
According to a recent meta-analysis, the overall standard mortality ratio for AN is 5.86,
substantially higher than schizophrenia (2.8), MDD (1.6) and bipolar disorder (2.1) (Arcelus et
al, 2011). More broadly, high eating disorder symptom severity and low weight are indicators of
48
low quality of life (Bamford and Sly, 2010). Specialized eating disorder treatment programs
currently lack adequate capacity to meet demand (Hart et al, 2011). Patients who can access
these programs are often met with high out-of-pocket costs and economic hardship that impedes
treatment adherence, highlighting the need for more accessible and effective treatment options
(Gatt et al, 2014).
Diagnosis of Anorexia and Bulimia Nervosa AN and BN are categorized in the Feeding and Eating Disorders section of the DSM-5,
amongst pica, rumination disorder, and binge-eating disorder (American Psychiatric Association,
2013). AN is diagnosed using three criteria: first, the patient restricts energy intake to less than
what they require, leading to a significantly low body weight for the individual’s age, sex,
developmental trajectory, and physical health; second, the patient has an intense fear of gaining
weight, despite their significantly low weight or continued weight loss; and third, the patient
experiences some disturbance in the way they perceive their body weight or shape, or do not
recognize the seriousness of their current low body weight (American Psychiatric Association,
2013). The DSM-5 also distinguishes between two subtypes of AN: restricting (AN-R) and
binge-eating/purging (AN-BP) (American Psychiatric Association, 2013). These two subtypes
differ depending on whether the patient has engaged in recurrent binge eating or purging
behaviour, including self-induced purging or laxative misuse, in the last three months. AN can be
in partial remission if the patient no longer meets the low body weight criteria for a sustained
period of time, but meets one of the two other criteria for AN.
The DSM-5 provides the following five diagnostic criteria for BN: first, recurrent
episodes of binge eating; second, recurrent compensatory purging behaviours, like self-induced
purging or laxative misuse, to prevent weight gain; third, both binge-eating and compensatory
purging behaviours occur, on average, at least once a week for three months; fourth, the patient’s
self-evaluation is excessively influenced by body shape or weight; and fifth, these disturbances
in binge-eating and purging do not occur during episodes of AN. The DSM-5 defines an episode
of binge-eating as a discrete period of time in which the patient eats an amount of food larger
than what most other individuals would eat in a similar period of time. This rapid eating is
49
accompanied by a feeling that they cannot stop or control what or how much they were eating
(American Psychiatric Association, 2013).
A number of clinical measures are in use to assess AN or BN symptom severity. One of
the primary measures for AN is the body mass index (BMI) as a measure of expected body
weight for height (American Psychiatric Association, 2013). However, weight assessment in AN
is challenging, because healthy weights vary across individuals substantially and cut-offs for
underweight and normal weight statuses are debated (Thomas et al, 2009). Nevertheless, the
World Health Organization and United States Centers for Disease Control defines a low weight
as a BMI lower than 18.5 kg/m2. As with MDD and OCD, the semi-structured, clinician-
administered MINI can be used to establish a diagnosis for both AN and BN (Golden et al, 2003;
Sheehan et al, 1998). The Eating Disorder Examination and Questionnaire, discussed below, can
also be used to determine an eating disorder diagnosis and assess elements of symptom severity,
such as the frequency of food binge episodes, or compensatory behaviours such as purging
episodes.
AN and BN Prevalence The lifetime prevalence of all eating disorders has been reported at 5.7% for females and
1.2% in males (Hudson et al, 2007). By diagnosis, the lifetime prevalence of AN is 0.9% for
females and 0.3% for males, and the lifetime prevalence of BN is 1.5% among females, and
0.5% among males (Hudson et al, 2007). In a more recent study amongst female adolescents, the
reported lifetime prevalence was 1.7% for AN, and 0.8% for BN (Smink et al, 2014). The 12-
month prevalence of AN among adolescent females is 0.4%, and 1% for BN (Hoek, 2006). As
indicated by disparities in prevalence, AN and BN predominantly affect females; studies report
an estimated 10:1 female-to-male ratio in AN clinical populations (Götestam et al, 1998; Lucas
et al, 1991). A 10:1 female-to-male ratio is also reported in BN (Keski-Rahkonen et al, 2009;
Swanson et al, 2011).
50
Etiology of AN and BN Like other psychiatric disorders, the etiologies of both AN and BN are theorized to
involve a complex interaction of genetic and environmental factors (for a review, see (Pinheiro et
al, 2009)). First-degree relatives of those with AN have a 10 times higher lifetime risk of AN
than relatives of unaffected individuals (Lilenfeld et al, 1998; Strober et al, 2000, 2001). In a
large twin study, it was reported that the heritability of AN was 0.56; the remaining variance was
attributed to shared (0.05) and unique environmental factors (0.38) (Bulik et al, 2006; Klump et
al, 2001; Kortegaard et al, 2001; Wade et al, 2000). Genotype linkage analyses of AN suggest a
number of susceptible loci, particularly so among serotonergic and opioid receptor genes
associated with AN psychopathology or feeding behaviour (Devlin et al, 2002; Grice et al,
2002). Likewise, trait neuroticism is associated with an increased risk of AN (Bulik et al, 2006).
It is also worthwhile to note that the prevalence and presentation of AN and BN varies by
socioeconomic status and culture, further emphasizing the role of environmental factors in
disorder etiology (Hoek et al, 2005; Keel and Klump, 2003). Similarly, BN is also proposed to
have a strong familial component (for a review, see (Striegel-Moore and Bulik, 2007)), with twin
studies in BN reporting heritability estimates between 28-83% (Bulik et al, 1998b; Lilenfeld et
al, 1998; Thornton et al, 2011). In one large family study, first-degree female relatives of those
with AN or BN had at least a fourfold increased risk of developing BN (Strober et al, 2000).
AN and BN Comorbidity Comorbidities are common in AN and BN. One survey found that 56.2% of patients with
AN and 94.5% of patients with BN met criteria for another psychiatric disorder (Hudson et al,
2007). The lifetime prevalence of at least one comorbid anxiety disorder in AN and BN is
approximately 71% (Godart et al, 2003). Personality disorders such as obsessive-compulsive
personality disorder and borderline personality disorder are also frequently comorbid in AN and
BN (for a review, see ((Bruce and Steiger, 2005; Crane et al, 2007)). Mood disorders such as
MDD and dysthymia are present in 42.1% of AN and 70.7% of BN patients (Hudson et al,
2007). Impulse control disorders and substance use disorder are also present in 30.8% and 27%
of AN patients, respectively, and in 63.8% and 36.8% of BN patients, respectively (Hudson et al,
2007). The presence of any comorbidity is frequently associated with poorer treatment outcomes
51
and high relapse rates (up to 90% of recovered patients) in AN and BN (Keel and Brown, 2010;
Mischoulon et al, 2011).
Assessment of Symptom Severity The DSM-5 assesses the degree of symptom severity with the aid of the BMI for AN, and
by considering the frequency of compensatory/purging episodes for BN (American Psychiatric
Association, 2013). BMI ranges are defined according to World Health Organization norms for
body mass by height; however, the level of AN severity on this metric can also reflect other
clinical symptoms or functional disabilities. Typically, mild, moderate, severe and extreme AN
are defined by at BMI ranges of >16.99, 16-16.99, 15-15.99, and <15, respectively. Mild,
moderate, severe and extremely severe BN are typically defined at ranges of 1-3, 4-7, 8-13, and
14 or more episodes of compensatory behaviour per week, respectively.
The Eating Disorder Examination (EDE) is a semi-structured clinician-assessed interview
widely considered to be the leading technique for assessing eating disorder symptom severity
(Fairburn and Cooper, 1993), as it is extensively validated in adults (Berg et al, 2012; Cooper et
al, 1989; Rizvi et al, 2000; Rosen et al, 1990). The Eating Disorders Examination –
Questionnaire (EDE-Q) is a supplementary self-administered version of the EDE that is also
well-validated and widely used (Berg et al, 2012; Fairburn and Cooper, 1993). Both the EDE and
EDE-Q assess the frequency and severity of eating disorders using the following subscales:
restraint over eating, eating concern, shape concern, and weight concern. Restraint over eating
refers to avoidance of food and eating, dietary rules and the desire to have an empty stomach.
Eating concern refers to a preoccupation with food, eating or calories, a fear of losing control
over eating, eating in secret, and guilt after eating. Shape concern refers to a preoccupation with
shape or weight, a fear of gaining weight, dissatisfaction and discomfort with shape or body,
avoidance of body exposure or seeing one’s body, and a feeling of fatness. Weight concern refers
to the importance, dissatisfaction or preoccupation of weight, reaction to a prescribed weighing,
and a desire to lose weight. Scoring on individual EDE items vary – questions assessing
symptom frequency are reported on a 6-point scale based on a 28-day month, whereas severity-
based questions score the item on a 7-point severity scale (0-6). To obtain an overall score for a
particular subscale, the scores from the relevant items are summed and divided by the total
52
number of items forming the subscale. To obtain an overall severity rating on the EDE or EDE-
Q, the four subscale scores are summed and divided by the number of subscales (four). In a
community-based sample of 243 young women, the mean global EDE score was 0.93±0.81, and
the mean global EDE-Q score was 1.40±1.13 (Fairburn and Beglin, 1994).
Response and remission are ill-defined endpoints for AN and BN. The most conservative
definition of BN treatment remission is an absence of binge-eating and compensatory purging
behaviours for a minimum of 8 weeks (Herzog et al, 1999; Keller et al, 1992; Mitchell et al,
1985), or, less stringently, for a minimum of 4 weeks (Agras et al, 2000; Fairburn et al, 1993;
Field et al, 1997; Halmi et al, 2002). Another definition of BN remission is 1 weekly symptom
episode or less over a 4-week period (Maddocks et al, 1992; Olmsted et al, 1994) or two week
period (Pyle et al, 1990). Generally, BN treatment response is characterized by a >50% reduction
in weekly binge-eating and compensatory purging behaviours (Agüera et al, 2013).
Definitions of AN treatment response and remission take into account the following four
items: first, the patient’s weight should be restored to a normal BMI given their age and sex;
second, restriction, binge-eating or purging should significantly improve (by >50% for response
or to relapse levels defined above); third, cognitive distortions such as body/shape dysmorphia
should meaningfully improve; and finally, medical stabilization of cardiac or other medical
problems should normalize due to weight restoration (Pike, 1998).
Structural and Functional Abnormalities in AN and BN
The neuroimaging literature on structural and functional abnormalities in AN and BN is
substantially less extensive than that for MDD, bipolar disorder, or other common Axis I
disorders. In addition, standard neuroimaging measures in AN and BN can be affected by
confounding factors, such as global volumetric changes in brain size associated with starvation
or caloric insufficiency. Notwithstanding these issues, an emerging neuroimaging literature does
exist regarding the substrates of illness for both AN and BN, and its key findings are summarized
here.
53
Structurally, both AN and BN display abnormally small gray matter volumes in brain
regions affiliated with the SN and VMN. Generally, volumetric reductions are reported in the
striatum, ACC and insula (Coutinho et al, 2015; Frank et al, 2013; Friederich et al, 2012;
Schäfer et al, 2010; Titova et al, 2013). AN patients also display altered thalamic connectivity
and white matter integrity to the DLPFC and mPFC (Biezonski et al, 2016; Frieling et al, 2012;
Hayes et al, 2015). Similarly, SN structural connectivity alterations between the caudate and the
insula have also been reported in this population (Frank et al, 2016; Shott et al, 2016).
Relative to controls, AN patients display increased activation in SN and CEN nodes for
disease-relevant stimuli and aversive (punishment) stimuli, perhaps reflecting heightened
salience of these stimuli in AN patients. Studies also report hyperactivity in the AI and DLPFC
during pain anticipation, and hyperactivity to monetary losses and pain in the DLPFC and ACC
(Bailer et al, 2017; Bär et al, 2015; Bischoff-Grethe et al, 2013; Strigo et al, 2013). AN patients
also display exaggerated responses to food stimuli and aversive tastes in the insula, striatum and
ACC (Cowdrey et al, 2011). AN patients exhibit hyperactivity for food stimuli in limbic regions
that activate for fear-responses, such the amygdala, instead of VMN reward regions such as the
OFC and ventral striatum (Vocks et al, 2010). Similarly, symptom provocation in AN elicits
hyperactivity in limbic regions like the amygdala and hippocampus, and in SN nodes like the
dACC, insula and medial PFC (Ellison et al, 1998; Frank et al, 2002, 2012b; Friederich et al,
2010; Seeger et al, 2002; Uher et al, 2004; Vocks et al, 2010). One study by Friederich and
colleagues in AN reported insular hyperactivation and dACC hypoactivation while viewing
idealized female bodies, perhaps associated with altered goal-directed cognition or interoceptive
awareness related to abnormal SN function (Friederich et al, 2010). Finally, increased harm
avoidance in AN is associated with altered striatal dopamine and cingulate serotonergic binding
(Bailer et al, 2004, 2007; Frank et al, 2005), suggesting that there may be important
neurochemical alterations underlying the observed abnormalities in functional activation in this
population.
Relative to healthy controls, BN patients show a dual pattern of increased VMN activity
related to increased reward valuation and sensitivity, alongside altered SN activity related to
deficits in cognitive control and impulsivity. BN patients will work harder for food rewards
(Schebendach et al, 2013), and display higher rates of overall impulsivity on a number of clinical
scales and behavioural paradigms (Chan et al, 2014; Manwaring et al, 2011; Mole et al, 2015).
54
On fMRI, BN patients have exaggerated VMN and SN activity to rewards in the insula, medial
OFC and NAc (Frank et al, 2011, 2012a; Oberndorfer et al, 2013b; Radeloff et al, 2014;
Schienle et al, 2009; Weygandt et al, 2012). SN hypoactivity is also associated with food
impulsivity; for example, lower dACC activity in response to food reward anticipation predicts
how much a BN patient will overeat (Bohon and Stice, 2011; Frank et al, 2006). Also, SN
hypoactivity during a cognitive control (Stroop) task is associated with poor dietary restraint in
binge-eating patients (Balodis et al, 2013). Neurochemically, serotonergic and dopaminergic
binding is altered in SN and VMN nodes like the ventral striatum, PFC and insula relative to
healthy controls (Broft et al, 2012; Galusca et al, 2014).
In contrast to BN patients, AN patients display SN and CEN alterations suggestive of
enhanced cognitive control relative to healthy controls. For example, DLPFC hyperactivity to the
anticipation of rewards has been reported in restrictive AN, suggesting enhanced cognitive
control over food reward stimuli (Ehrlich et al, 2015; Sanders et al, 2015). AN-R patients also
exhibit a broader pattern of enhanced temporal delay discounting relative to healthy controls,
suggesting that the enhanced cognitive control reported for AN patients may represent a broader
trait that applies beyond food stimuli alone (Steinglass et al, 2012). Some studies, however, have
reported cognitive control deficits in AN for specific disease-relevant stimuli: for example, to
distorted images of the patient’s body (Lee et al, 2014), food stimuli (Oberndorfer et al, 2013a;
Sanders et al, 2015), social stimuli (Tapajóz P de Sampaio et al, 2015), and during cognitive
flexibility paradigms (Zastrow et al, 2009).
There is also mounting evidence that frontostriatal circuitry is abnormal in both AN and
BN, and these abnormalities contribute to deficits in cognitive control, the self-regulation of
emotional and motor responses, and goal-directed behaviour (for a review see (Berner and
Marsh, 2014)). BN-associated deficits in impulse control are related to abnormal functioning in
SN and VMN corticostriatal circuitry. For example, BN patients show hypoactivity in
frontostriatal circuitry during cognitive control tasks like the Simon Spatial Incompatibility task
(Celone et al, 2011; Marsh et al, 2009b, 2011) and the go/no-go task (Skunde et al, 2016).
Behavioural deficits and frontostriatal hypoconnectivity are also reported in AN patients during
cognitive control tasks, including during response inhibition (Oberndorfer et al, 2011; Wierenga
et al, 2014), the Wisconsin Card Sorting Task (Lao-Kaim et al, 2015), and delay discounting
(Decker et al, 2015; Wierenga et al, 2014).
55
Some research has also reported altered incentive salience for specific stimuli. For
example, AN-R patients report physical exercise as significantly more pleasant than primary
rewards, including food (Giel et al, 2013). While AN patients typically exhibit deficits in
cognitive control and frontostriatal hypoconnectivity to primary rewards (food and money), this
effect is reversed for physical exercise. For example, one study demonstrated that AN patients
exhibited frontostriatal hyperconnectivity and enhanced cognitive control during a response
inhibition task when exercise-related stimuli were used as cues. This result signifies the
importance of reward valuation and incentive salience in cognitive control processes (Kullmann
et al, 2014).
Finally, AN patients also exhibit abnormal SN and DMN connectivity in the absence of
task-evoked activations (at rest). For example, resting-state SN connectivity of the dACC and
insula is altered in BN relative to AN (Amianto et al, 2013). Cowdrey and colleagues recently
reported that AN patients have abnormal hyperconnectivity within the DMN and between the
DMN and DLPFC (Cowdrey et al, 2014). Insular resting-state connectivity is also abnormal in
AN; one study reported abnormal low functional connectivity between the insula and thalamus
(Geisler et al, 2016). In summary, AN and BN patients’ distinctive profiles of abnormality
within the RDoC domains of cognitive control and positive/negative valience systems appear to
be reflected in distinctive patterns of abnormality in the nodes of the SN, VMN, and their
respective CSTC loop circuits (Dunlop et al, 2016b).
Transcranial Magnetic Stimulation as a Probe of IBNs
What is Transcranial Magnetic Stimulation?
1.7.1.1 Transcranial Magnetic Stimulation Apparatus Overview
A transcranial magnetic stimulation (TMS) device has several key components. At
minimum, the device requires an electromagnetic inductor consisting of a wire coil inside a
protective housing (Figure 1-9A), placed on the participant’s head during stimulation. This
inductor is fed by a power system used to generate electrical pulses, which are converted into
brief (<1 ms) but powerful (1-2 Tesla) focal magnetic pulses by the inductor itself (Figure 1-9B).
Some hardware configurations include an air or liquid coolant (Figure 1-9C) intended to
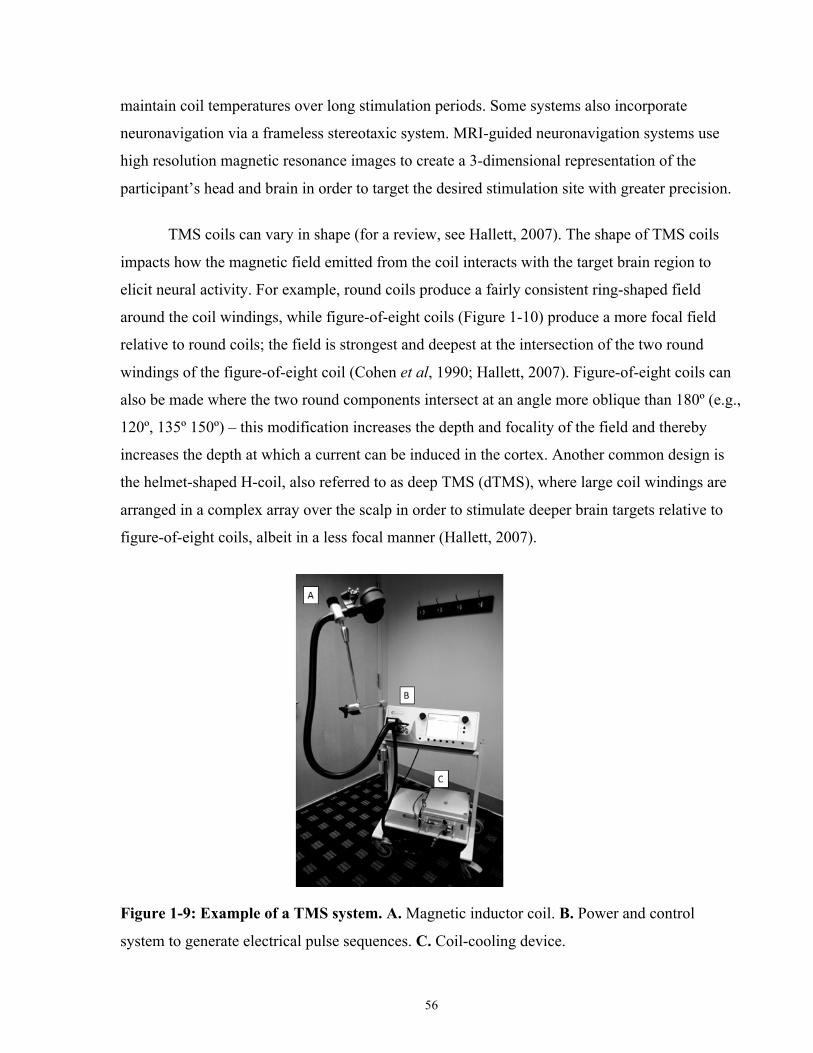
56
maintain coil temperatures over long stimulation periods. Some systems also incorporate
neuronavigation via a frameless stereotaxic system. MRI-guided neuronavigation systems use
high resolution magnetic resonance images to create a 3-dimensional representation of the
participant’s head and brain in order to target the desired stimulation site with greater precision.
TMS coils can vary in shape (for a review, see Hallett, 2007). The shape of TMS coils
impacts how the magnetic field emitted from the coil interacts with the target brain region to
elicit neural activity. For example, round coils produce a fairly consistent ring-shaped field
around the coil windings, while figure-of-eight coils (Figure 1-10) produce a more focal field
relative to round coils; the field is strongest and deepest at the intersection of the two round
windings of the figure-of-eight coil (Cohen et al, 1990; Hallett, 2007). Figure-of-eight coils can
also be made where the two round components intersect at an angle more oblique than 180º (e.g.,
120º, 135º 150º) – this modification increases the depth and focality of the field and thereby
increases the depth at which a current can be induced in the cortex. Another common design is
the helmet-shaped H-coil, also referred to as deep TMS (dTMS), where large coil windings are
arranged in a complex array over the scalp in order to stimulate deeper brain targets relative to
figure-of-eight coils, albeit in a less focal manner (Hallett, 2007).
Figure 1-9: Example of a TMS system. A. Magnetic inductor coil. B. Power and control
system to generate electrical pulse sequences. C. Coil-cooling device.
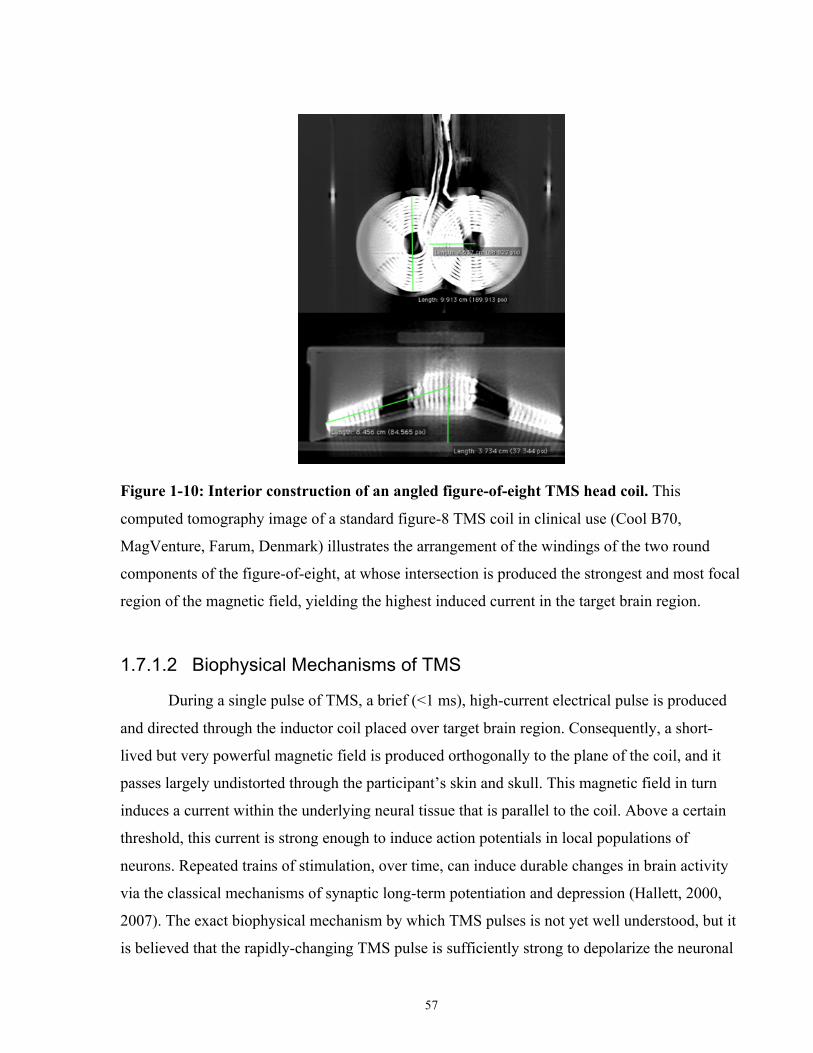
57
Figure 1-10: Interior construction of an angled figure-of-eight TMS head coil. This
computed tomography image of a standard figure-8 TMS coil in clinical use (Cool B70,
MagVenture, Farum, Denmark) illustrates the arrangement of the windings of the two round
components of the figure-of-eight, at whose intersection is produced the strongest and most focal
region of the magnetic field, yielding the highest induced current in the target brain region.
1.7.1.2 Biophysical Mechanisms of TMS
During a single pulse of TMS, a brief (<1 ms), high-current electrical pulse is produced
and directed through the inductor coil placed over target brain region. Consequently, a short-
lived but very powerful magnetic field is produced orthogonally to the plane of the coil, and it
passes largely undistorted through the participant’s skin and skull. This magnetic field in turn
induces a current within the underlying neural tissue that is parallel to the coil. Above a certain
threshold, this current is strong enough to induce action potentials in local populations of
neurons. Repeated trains of stimulation, over time, can induce durable changes in brain activity
via the classical mechanisms of synaptic long-term potentiation and depression (Hallett, 2000,
2007). The exact biophysical mechanism by which TMS pulses is not yet well understood, but it
is believed that the rapidly-changing TMS pulse is sufficiently strong to depolarize the neuronal
58
membrane, thereby generating an action potential in neurons that are near the TMS coil and
oriented optimally with respect to the field (as reviewed by (Cirillo et al, 2017).
1.7.1.3 Neurophysiological Effects of TMS and rTMS
Because a TMS pulse induces a brief disruption or excitation of population neural
activity in the target cortical region, it can be used to spatially or temporally localize brain
function. A common target of TMS is the primary motor cortex (M1) as stimulating M1 using
single pulses of TMS induces observable motor evoked potentials (MEPs) in the corresponding
muscles. For example, TMS-MEP studies have been used to generate complex maps of
overlapping muscle innervations (such as leg and arm muscles) in M1 (Wassermann et al, 1992).
Additionally, TMS studies targeting sensory and cognitive brain areas have been used localize
other functions. For example, TMS over the occipital cortex can induce temporary partial
functional scotomas. One early study of visual cortex-TMS found that TMS delivered at a delay
interval of 80-100ms from a visual stimulus was sufficient to interfere with perception of the
stimulus (Amassian et al, 1989).
The effects of repeated pulses of TMS at a specified frequency or pattern (repetitive
TMS; rTMS) can also be used as a tool to explore fundamental mechanisms of brain function.
For example, rTMS can be used to temporarily disrupt normal brain activity to localize the
cognitive or behavioural function of a target cortical region; this approach is referred to as a
“virtual lesion” technique. One such study investigated the role of the RTPJ on moral decision-
making and found that 10 Hz rTMS over the RTPJ during moral decision-making altered the
ratings participants made during certain moral scenarios (Young et al, 2010). rTMS can also be
used to study how repetitive high or low frequency stimulation produces long lasting
neuroplastic changes on cognition or behaviour. Classically, high frequency (>5 Hz) rTMS is
considered to induce long-term plasticity (LTP), or increased regional excitability and MEP
amplitude, while low frequency (1 Hz) rTMS induces long-term depression (LTD), or decreased
regional excitability and MEP amplitude (Chen et al, 1997; Pascual-Leone et al, 1994).
As with single TMS pulses, the short- and long-term neuronal effects of rTMS trains in
humans are similarly not yet fully characterized. In vitro studies of the effects of repetitive
59
magnetic stimulation on neuronal plasticity (LTP and LTD) suggest that rTMS affects the
balance of cortical excitation and inhibition (as reviewed by (Lenz and Vlachos, 2016)) and the
modulation of both excitatory (glutamatergic) and inhibitory (γ-aminobutyric acid [GABA];
GABAergic) neurotransmission via calcium-dependent signaling pathways (Huang et al, 2007;
Labedi et al, 2014; Lenz et al, 2015, 2016; Vlachos et al, 2012). Many of these studies support
the idea that rTMS increases or decreases the activity of glutamatergic cortical neurons that
possess long-range axons (principal neurons) (Gersner et al, 2011; Ghiglieri et al, 2012; Lenz et
al, 2015; Levkovitz et al, 1999; Ma et al, 2013; Sykes et al, 2013; Tang et al, 2017; Tokay et al,
2009; Vlachos et al, 2012; Volz et al, 2013). Repetitive magnetic stimulation also appears to
alter dendritic growth and sprouting related to LTP and LTD in in vitro hippocampal cell
cultures (Ma et al, 2013; Vlachos et al, 2012). Human in vivo studies suggest a neuroplastic
mechanism inovlving brain-derived neurotrophic factor (BDNF), a growth factor involved in
LTP; however, some studies report increases or decreases in serum BDNF levels with rTMS,
while other report no significant change (Gedge et al, 2012; Müller, 2000; Wang et al, 2011;
Yukimasa et al, 2006; Zanardini et al, 2006).
More recent theories on the mechanisms of rTMS posit that stimulation also modifies the
activity of GABAergic cortical interneurons that act to inhibit principal neurons. Briefly,
excitatory rTMS appears to reduce the inhibitory effect of GABAergic interneurons on principal
cells (called rTMS-induced disinhibition) (Lenz and Vlachos, 2016). Excitatory and inhibitory
rTMS protocols differentially alter populations of interneurons and consequently alter different
aspects of network activity or function (Funke and Benali, 2011; Mix et al, 2010; Volz et al,
2013). Excitatory magnetic stimulation protocols have been recently shown to include LTD-like
effects on inhibitory interneurons for somatic inhibition, while inhibitory protocols alter the
activity of interneurons for dendritic inhibition (Benali et al, 2011; Funke and Benali, 2011;
Labedi et al, 2014; Mix et al, 2015; Trippe et al, 2009; Volz et al, 2013).
Another proposal draws upon studies of rTMS in animal models, and posits that rTMS
has neuroprotective effects, enhancing neurogenesis, and inhibiting neuronal cell death
(apoptosis). For example, two studies reported that high frequency magnetic stimulation
increased neurogenesis in in vitro mouse hippocampal slices (May, 2011; May et al, 2007).
Other studies studying the effects of rTMS in ischemic stroke mouse models have also
demonstrated that high frequency stimulation aids in the recovery of limb function post-stroke
60
(Feng et al, 2005), and inhibits apoptosis in the infarct zone (Fujiki et al, 2003; Gao et al, 2010;
Ogiue-Ikeda et al, 2005; Yoon et al, 2011).
The neuroplastic effects following nominally ‘excitatory’ or ‘inhibitory’ rTMS pulse
sequences can vary considerably in magnitude or in the direction of effect (increased or
decreased excitability) across individuals. One study reported substantial inter-individual
variability of rTMS on motor evoked potentials at 1, 10, 15, and 20 Hz, with the greatest
variability in the direction of effect at 1 Hz and 10 Hz, and the most consistent excitatory effects
at 20 Hz (Maeda et al, 2000). Similar findings have emerged with functional MRI, where both
‘excitatory’ 20 Hz and ‘inhibitory’ 1 Hz rTMS induced changes in connectivity to the target site,
but the direction of effect widely varied across subjects, particularly for 1 Hz rTMS (Eldaief et
al, 2011). Furthermore, the two rTMS protocols modified different kinds of connections to the
target site: 20 Hz rTMS engaged corticocortical circuits, while 1 Hz rTMS altered corticolimbic
circuits (Eldaief et al, 2011). This difference in network effects of inhibitory and excitatory
rTMS could potentially be related to the different populations of inhibitory interneurons through
which rTMS exerts its effects, thereby differentially altering the excitatory/inhibitory balance of
principal cells.
Applications of rTMS as a Network-Probe
One of the advantages of TMS is that it can focally alter the activity of cortical brain
regions to causally test brain structure-function relationships. For example, publications using
single-pulse TMS have elucidated the specific role of motor and premotor structures in
behaviour (for a review, see (Chouinard and Paus, 2010)). TMS and rTMS have also been shown
to modulate monosynaptic downstream targets, allowing for the study of not only the stimulated
brain region, but also the network that region interconnects with (for a review, see (Ruff et al,
2009)). For example, different rTMS protocols have been reported to modulate different kinds of
functional connectivity. Eldaief et al. demonstrated that excitatory and inhibitory rTMS over the
left IPL elicited different patterns of inter-regional change in network connectivity, and not
simply changes in the strength of rsFC: excitatory rTMS decreased corticocortical IPL rsFC
between nodes of the DMN, while inhibitory rTMS increased corticolimbic IPL rsFC with the
hippocampal formation (Eldaief et al, 2011).
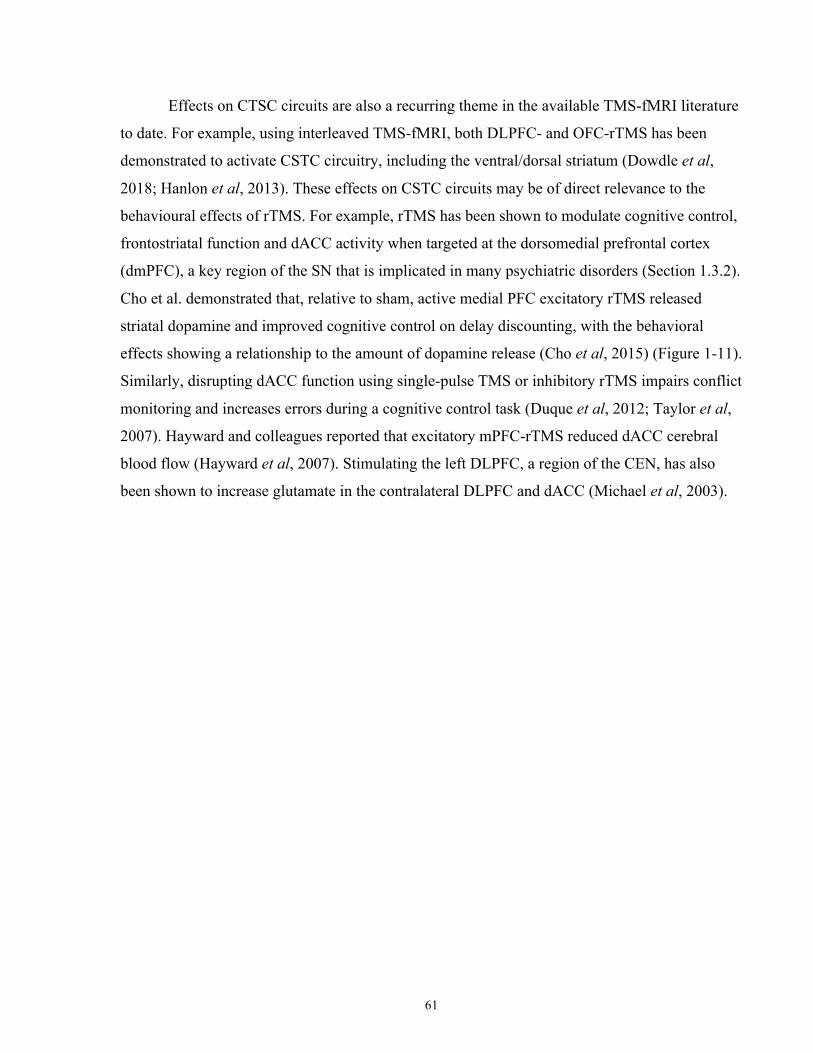
61
Effects on CTSC circuits are also a recurring theme in the available TMS-fMRI literature
to date. For example, using interleaved TMS-fMRI, both DLPFC- and OFC-rTMS has been
demonstrated to activate CSTC circuitry, including the ventral/dorsal striatum (Dowdle et al,
2018; Hanlon et al, 2013). These effects on CSTC circuits may be of direct relevance to the
behavioural effects of rTMS. For example, rTMS has been shown to modulate cognitive control,
frontostriatal function and dACC activity when targeted at the dorsomedial prefrontal cortex
(dmPFC), a key region of the SN that is implicated in many psychiatric disorders (Section 1.3.2).
Cho et al. demonstrated that, relative to sham, active medial PFC excitatory rTMS released
striatal dopamine and improved cognitive control on delay discounting, with the behavioral
effects showing a relationship to the amount of dopamine release (Cho et al, 2015) (Figure 1-11).
Similarly, disrupting dACC function using single-pulse TMS or inhibitory rTMS impairs conflict
monitoring and increases errors during a cognitive control task (Duque et al, 2012; Taylor et al,
2007). Hayward and colleagues reported that excitatory mPFC-rTMS reduced dACC cerebral
blood flow (Hayward et al, 2007). Stimulating the left DLPFC, a region of the CEN, has also
been shown to increase glutamate in the contralateral DLPFC and dACC (Michael et al, 2003).
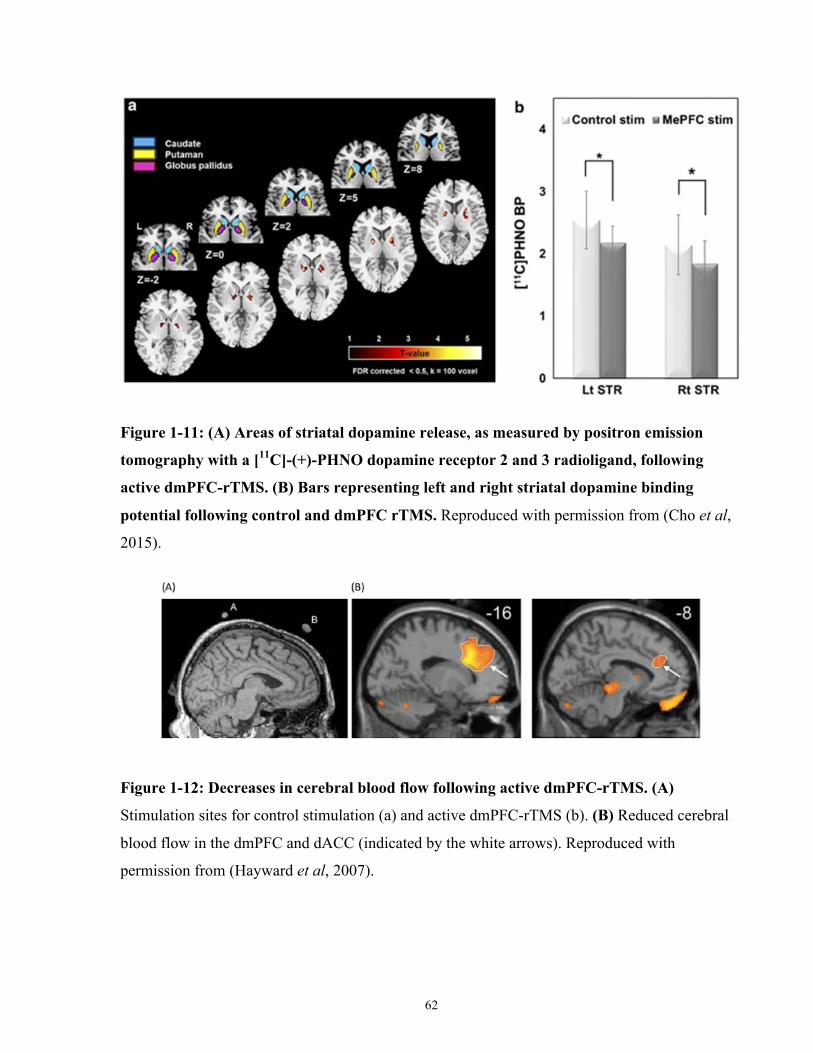
62
Figure 1-11: (A) Areas of striatal dopamine release, as measured by positron emission
tomography with a [11C]-(+)-PHNO dopamine receptor 2 and 3 radioligand, following
active dmPFC-rTMS. (B) Bars representing left and right striatal dopamine binding
potential following control and dmPFC rTMS. Reproduced with permission from (Cho et al,
2015).
Figure 1-12: Decreases in cerebral blood flow following active dmPFC-rTMS. (A)
Stimulation sites for control stimulation (a) and active dmPFC-rTMS (b). (B) Reduced cerebral
blood flow in the dmPFC and dACC (indicated by the white arrows). Reproduced with
permission from (Hayward et al, 2007).
63
Therapeutic Applications of rTMS
Psychiatric disorders are often associated with IBN dysfunction, and so it is reasonable to
posit that rTMS might induce its therapeutic effects via focal synaptic plasticity and neuronal
excitability at the cellular scale, and via modifications to downstream cortico-cortical, cortico-
limbic or cortico-striatal connections at the macroscopic, whole-brain scale of IBNs. In support
of this perspective, recent studies reporting on resting-state IBNs suggest that psychiatric and
neurological disorders can be characterized as ‘network disorders’ (as reviewed in Sections 1.4,
1.5, and 1.6). If so, this implies that by perturbing the function of one node of an IBN, rTMS
may be capable of achieving therapeutic effects via anatomical and functional connections with
other nodes of the same IBN, or connections with related IBNs.
In a well-cited study supporting this proposal, Fox and colleagues recently demonstrated
that clinically effective targets for invasive brain stimulation (i.e., deep brain stimulation, DBS)
belong to the same IBN as the known effective targets for non-invasive brain stimulation (i.e.,
rTMS), across a range of 19 neurological and psychiatric disorders including MDD, OCD,
Tourette’s Disorder, Parkinson’s Disease, chronic pain, and Alzheimer’s Disease (Fox et al,
2014). Although beyond the scope of this thesis, rTMS has been been explored as a therapeutic
intervention for a variety of neurological conditions, including post-stroke aphasia (Naeser et al,
2010), tinnitus (Lehner et al, 2016), and Alzheimer’s Disease (Rutherford et al, 2015). However,
as of this writing, the majority of therapeutic rTMS sessions worldwide are still used for
psychiatric disorders: most commonly major depression, alongside less common and usually off-
label treatment of a limited number of other psychiatric illnesses.
In order to provide background for further discussion of potential IBN mechanisms for
therapeutic rTMS, the following three sections will first review current treatments, and novel
stimulatory treatments for three psychiatric disorders, MDD, OCD and AN/BN, as well as the
available literature from published clinical trials of invasive and non-invasive brain stimulation
for all three of these disorders.
64
Clinical Applications of rTMS
Treatment Resistant MDD
1.8.1.1 First Line Treatments for MDD Pharmacological and psychotherapeutic interventions have been the mainstays of
conventional treatment strategies for MDD over the last six decades. Medications for MDD that
have proven efficacy in placebo-controlled studies include selective serotonin reuptake inhibitors
(SSRI) (Hieronymus et al, 2016), serotonin-norepinephrine reuptake inhibitors (SNRI)
(Montgomery et al, 2015), tricyclic antidepressants (TCA), monoamine oxidase inhibitors
(MAO) and norepinephrine-dopamine reuptake inhibitors (NDRI) (Rosenblat et al, 2015).
Psychotherapies including cognitive behavioural therapy (CBT) (Parikh et al, 2016),
interpersonal therapy (IPT) (van Hees et al, 2013; Jakobsen et al, 2012) and mindfulness-based
cognitive therapy (MBCT) (Kuyken et al, 2015; van der Velden et al, 2015) have also shown
superior efficacy rates in acute MDD and relapse prevention. Recent studies have found that
conventional psychotherapies can be as effective as medication in appropriate populations of
MDD patients (Cuijpers, 2015), but a combination of both treatment modalities is superior to
either monotherapy (Cuijpers et al, 2013; de Maat et al, 2007; Wiles et al, 2016).
MDD patients often do not respond to the first treatment they receive. One landmark
study, the Sequenced Treatment Alternatives to Relieve Depression (STAR*D) trial
(ClinicalTrials.gov ID: NCT00021528), assessed the efficacy of a sequence of up to four
successive antidepressant trials in achieving remission, in a sample of 4041 adults with MDD
(Rush et al, 2006). The results of the trial showed that approximately one third of patients
achieved remission with their first trial of antidepressant medication, and that the probability of
remission declined markedly with successive medication trials (Rush et al, 2006). The STAR*D
remission rates, defined as a score of >6 on the QIDS, for four successive pharmacotherapy
attempts were 36.8%, 30.6%, 13.7% and 13%, and the overall remission rate was 67%.
Medication non-adherence is common in MDD, and may be an important factor
underlying treatment non-response. In one study, almost 20% of participants did not properly
adhere to their medication, as indicated by a blood sample (Roberson et al, 2016). Another study
showed that up to 20% of patients missed up to four consecutive days of treatment
65
(Demyttenaere et al, 2001). Medication adherence is strongly associated with better response
rates (Akerblad et al, 2006; Demyttenaere et al, 2001).
1.8.1.2 Treatment-Resistant Depression
Those who do not respond to two or more trials (of adequate dose and duration) of
conventional pharmaco- and psychotherapies are considered to have treatment-resistant
depression (TRD) (Berlim and Turecki, 2007; Nemeroff, 2007). However, the exact definition of
TRD is contentious, because the TRD population is heterogeneous; ‘pseudo’-TRD may arise
from misdiagnosis, treatment non-adherence, or inadequate dose and duration of treatment
attempts (Souery et al, 2006); other ostensibly treatment-resistant patients may have experienced
a partial response to a past treatment (Kennedy et al, 2016). These inconsistencies make
assessing the prevalence of TRD challenging; however it is estimated that TRD, as defined
above, has a prevalence of approximately 2% of the general population (Nemeroff, 2007) and
approximately 35% of MDD patients (Trivedi et al, 2006). TRD may be addressed using
combination/augmentation therapies (for a review, see (Papakostas and Ionescu, 2015)), despite
relatively poor outcomes. However, an emerging and increasingly popular alternative is
therapeutic brain stimulation.
1.8.1.3 Brain Stimulation Treatments for TRD
One of the most potent available interventions in TRD is electroconvulsive therapy
(ECT). ECT involves the induction of a therapeutic generalized seizure under general anesthesia,
by applying a pulsed, square-wave electrical current of ~ 800 mA via electrodes that are placed
on the scalp in either a bilateral temporal, bilateral frontal or right unilateral montage (Milev et
al, 2016). Patients usually undergo 2-3 treatments per week for a total of 6-15 sessions of ECT to
achieve response or remission (Charlson et al, 2012; Daly et al, 2001). ECT is one of the most
effective treatments for TRD; recent randomized controlled trials report remission rates from
65% to as high as 90% in specific subpopulations, such as those with psychotic depression or
catatonia (Kellner et al, 2010). In one meta-analysis, higher response rates are seen in individuals
who are older, and are psychotic (Haq et al, 2015). A number of side effects and barriers to
66
treatment exist for ECT, however, including cognitive impairment post-ECT (for a review, see
(Fraser et al, 2008)), the use of general anesthesia, high associated stigma and limited resources
(predominately a lack of anesthesiologists and space to perform the procedure) (Andrade and
Thyagarajan, 2007; Delva et al, 2011). As a result of this stigma and the invasiveness of the
procedure, most TRD patients do not consent to ECT; fewer than 1% of TRD patients undergo
treatment in any given year (Delva et al, 2011).
Given the limitations and issues related to ECT, alternative brain stimulation treatments
for TRD are currently under investigation. For example, magnetic seizure therapy (MST) is a
treatment that, like ECT, induces a generalized seizure, albeit via large rTMS-type magnetic
inductors rather than electrodes. MST may have comparable efficacy rates (69% response, 46%
remission) (Kayser et al, 2011, 2015) and minimal cognitive adverse effects relative to ECT
(McClintock et al, 2011); however, this treatment is still considered investigational, and very few
devices are currently available worldwide.
More invasive therapies requiring surgical intervention are also currently under
investigation for TRD: vagus nerve stimulation (VNS) and deep brain stimulation (DBS). VNS is
delivered by a subdermal pulse generator that controls an electrode implanted around the vagus
nerve in the neck region. Stimulation of the vagus nerve is thought to activate areas of the
brainstem and brain via the nucleus tractus solitarius, which modulates activity in a variety of
monoaminergic brainstem regions to achieve symptom improvement (Nemeroff et al, 2006).
VNS is well-tolerated (Aaronson et al, 2013), and is associated with superior efficacy rates
compared to sham stimulation (Rush et al, 2005), albeit with modest response rates, estimated at
~31.8% in a recent review (Martin and Martín-Sánchez, 2012). Due to the modest results to date,
and the need for neurosurgical expertise for the implantation, uptake of VNS is substantially
lower than even that of ECT (<1%) in the TRD population.
DBS is delivered from an electrode implanted via MRI and stereotactic guidance into the
target brain region; the technique is uniquely capable of stimulating deeper brain regions and
smaller (<1 cm) brain regions in a focal and ongoing manner. DBS is most commonly used for
movement disorders such as Parkinson’s Disease, but is drawing increasing interest as an
intervention in psychiatric disorders resistant to other kinds of treatment (Lozano and Lipsman,
2013). Among the best-known examples is DBS for TRD, where an early report of successful
67
treatment in some patients following DBS of the sgACC (Mayberg et al, 2005) led to widespread
interest in DBS for refractory MDD cases. Long-term treatment outcomes of DBS for TRD
targeting the sgACC have been encouraging in early studies, with reported remission rates of
approximately 40-50% at 2 years post-implantation (Holtzheimer et al, 2012; Kennedy et al,
2011). Although some individual patients appear to show robust and reproducible benefit, a
recent study found that sgACC-DBS effects were not superior to sham for MDD patients overall
(Holtzheimer et al, 2017). Although promising, both VNS and DBS are limited by the
requirement for invasive surgical implantation, and have significant geographical barriers to
treatment access (including geographical barriers and resource limitations).
One other emerging non-invasive alternative to VNS, ECT, and DBS is transcranial
direct current stimulation (tDCS). tDCS delivers a low-amplitude (2 mA) electrical current over
a particular scalp target to modulate neuronal excitability in the underlying neural tissue, and
repeated use is thought to induce neuronal plasticity (Stagg and Nitsche, 2011). tDCS is also
portable, safe, well-tolerated, relatively easy to use, inexpensive, and suitable for home use.
Randomized controlled trials and meta-analyses have supported the efficacy of tDCS in MDD
relative to placebo tDCS (Brunoni et al, 2013), but evidence to date suggests that tDCS may
have limited efficacy in TRD populations (Brunoni et al, 2016).
1.8.1.4 rTMS as a Treatment for TRD
Aside from ECT, the most widely-used therapeutic brain stimulation technique at present
is rTMS. rTMS uses powerful, focused magnetic field pulses, delivered by an electromagnetic
induction coil applied to the scalp, to manipulate the excitability of target brain regions and their
associated IBNs (For a review, see (Hallett, 2007)). To date, medication-resistant MDD is the
best-studied therapeutic indication for rTMS. rTMS for depression was initially proposed in the
early 1990s after it was observed that stimulation of the motor cortex in healthy controls induced
an elevated mood in some individuals. Preclinical studies reported that prefrontal rTMS could
induce self-reported negative or positive mood in healthy individuals, depending on the
stimulation target (George et al, 1996; Pascual-Leone et al, 1996a). By 1994, the left prefrontal
cortex had been proposed as a stimulatory site for therapeutic rTMS in MDD (George and
Wassermann, 1994), based on early neuroimaging studies highlighting the role of left
68
dorsolateral prefrontal cortex (DLPFC) dysfunction in MDD. For example, MDD patients
displayed reduced glucose metabolism in the left DLPFC relative to controls (Baxter et al, 1989),
and left prefrontal lesions were reported to be associated with increased MDD incidence
(Robinson et al, 1984). The first rTMS studies in MDD reported only modest improvements in
depression severity; this is perhaps because these studies had small sample sizes, as well as
suboptimal stimulation targets and very short treatment courses compared to modern practice
(Höflich et al, 1993; Kolbinger et al, 1995).
The first randomized controlled trials of DLPFC-rTMS for TRD were conducted in the
mid-1990s using left high frequency rTMS (George et al, 1995, 1997; Pascual-Leone et al,
1996b). Low-frequency rTMS applied over the right DLPFC was introduced in the late 1990s,
and was found to be an approach of similar treatment efficacy relative to left DLPFC rTMS
(Klein et al, 1999). Since then, dozens of randomized controlled trials have supported the
efficacy DLPFC-rTMS for TRD, as summarized by recent meta-analyses (Berlim et al, 2014;
Kedzior et al, 2014). In one meta-analysis assessing the efficacy of 54 sham-controlled trials of
DLPFC-rTMS for TRD, Kedzior and colleagues found significant reductions in TRD severity
after left-high frequency, right-low frequency or bilateral DLPFC-rTMS (Kedzior et al, 2014).
Furthermore, data from 1371 subjects with TRD receiving high-frequency rTMS showed that
29.3% and 18.6% of patients were classified as responders and remitters, respectively (Berlim et
al, 2014). However, this statistic likely underestimates response and remission rates of DLPFC-
rTMS for TRD, as this meta-analysis included early sub-optimal trials discussed above, which
employed an average of only 10-15 sessions, versus the 20-36 sessions used in modern practice.
In the most recent generation of large trials, response and remission rates for TRD are between
50-55% and 30-35%, respectively (Brunelin et al, 2014; Fitzgerald et al, 2011).
Real-world efficacy rates for rTMS in naturalistic community practice are comparable to
add-on pharmacotherapies or a change in monotherapy (Berlim et al, 2014; Kedzior et al, 2014).
Response rates to rTMS may be further improved by adequate course length; at least 26-28
sessions of rTMS are required for maximum benefit (Carpenter et al, 2012). The most widely
used rTMS protocols involve 10 Hz left DLPFC-rTMS and/or 1 Hz right DLPFC-rTMS.
Unfortunately, these conventional protocols limit treatment capacities due to the long duration of
the treatment sessions; for example, a single session of left DLPFC-rTMS using the standard
69
FDA-approved 10 Hz rTMS protocol requires approximately 37.5 minutes (O’Reardon et al,
2007), rendering conventional rTMS treatment costly and low-volume.
One promising advance is the development of shorter theta-burst stimulation (TBS)
protocols to treat TRD (Huang et al, 2005). Intermittent theta burst stimulation (iTBS) delivers
600 pulses in 50 Hz triplet bursts, 5 bursts per second, 2 seconds on and 8 seconds off, for 20
trains in 3 minutes; this protocol has excitatory effects, as evidenced by increases in MEP
amplitude, matching or exceeding much longer conventional high-frequency protocols (Di
Lazzaro et al, 2011). Continuous theta burst (cTBS) uses the same theta burst pattern delivered
continuously over 600 pulses in 40 seconds; this protocol has inhibitory effects, as evidenced by
decreases in MEP amplitude, that may surpass those of longer conventional low-frequency
stimulation protocols (Di Lazzaro et al, 2011). In pilot studies in TRD, iTBS has been used for
left DLPFC rTMS, while cTBS has been employed for right DLPFC stimulation. Relative to
conventional rTMS protocols, both iTBS over the left DLPFC and cTBS over the right DLPFC
have shown comparable clinical efficacy in TRD (Blumberger et al, 2018; Chistyakov et al,
2010; Plewnia et al, 2014).
Limited efficacy rates and high relapse rates are among the limitations of rTMS for TRD.
For comparison’s sake, current rTMS protocols are not superior to ECT for response or
remission. A number of meta-analyses have found that the clinical efficacy of rTMS for TRD is
inferior to ECT (Micallef-Trigona, 2014; Xie et al, 2013). rTMS response is also poor in those
who have previously failed to respond to ECT (Downar et al, 2014), but it is not yet known
whether this relationship suggests that ECT and rTMS alter brain activity in similar ways.
Conversely, it is not known whether ECT response is poor in patients who have previously failed
rTMS. The median relapse time following rTMS in one naturalistic study was 120 days, with
relapse rates of 25%, 40%, 57%, and 77% at 2, 3, 4, and 6 months, respectively (Cohen et al,
2009). Notwithstanding these limitations, rTMS is attractive to patients and providers for the
absence of cognitive adverse effects, the rarity of serious side effects, and the lack of a need for
anesthesia during treatment. In current clinical practice, rTMS is beginning to occupy a
therapeutic niche in TRD treatment strategies, after >1-2 failed pharmacotherapy trials, but
before attempting ECT.
70
More recently, attention has turned to the potential of other target regions beyond the
conventional right or left DLPFC to improve response and remission rates in TRD (Downar and
Daskalakis, 2013). In particular, the dmPFC and dACC have been proposed as novel therapeutic
targets for rTMS in TRD, based on convergent evidence from neuroimaging, lesion, and
connectivity studies (Downar and Daskalakis, 2013).
Studies of the efficacy of dmPFC-rTMS are relatively few, however. One recent sham-
controlled trial of rTMS found a significant group-by-time interaction on depression severity in a
modest sample of TRD patients between active left DLPFC 10 Hz, active dmPFC 10 Hz, and
sham stimulation. Neither active rTMS treatment arms were superior to placebo, but there was a
significant clinical superiority of dmPFC-rTMS relative to left DLPFC-rTMS (Kreuzer et al,
2015). Furthermore, our group recently published the results of two studies involving 20 daily
sessions of open-label 10 Hz dmPFC-rTMS in treatment-refractory depression (Figure 1-11). In
one, HAMD scores decreased by 45%(± 31%) over the course of treatment (Salomons et al,
2014). Our group also recently published a chart review of 185 patients who received excitatory
(10 Hz or iTBS) dmPFC-rTMS in TRD, finding bimodal or trimodal patterns of response.
Response rates, as measured by the HAMD, for 10 Hz and iTBS over the dmPFC were 50.6%
and 48.5%, respectively, and remission rates were 38.5% and 27.9%, respectively, for 10 Hz and
iTBS protocols (Bakker et al, 2015).
These reported outcomes for dmPFC-rTMS overall did not appear to be markedly
superior to those previously reported for DLPFC-rTMS. However, a notable finding in another
second series of 47 subjects, was that the response to dmPFC-rTMS followed a bimodal
distribution, with individual patients showing either minimal or marked improvement over
treatment (Downar et al, 2014). The non-unimodal distribution suggests a heterogeneity among
the MDD population undergoing treatment, and leaves open the possibility that remission rates
could be improved by identifying and targeting a specific subpopulation of MDD patients. The
exploration of this possibility is central to the aims of the thesis, as outlined in detail in Section 2.
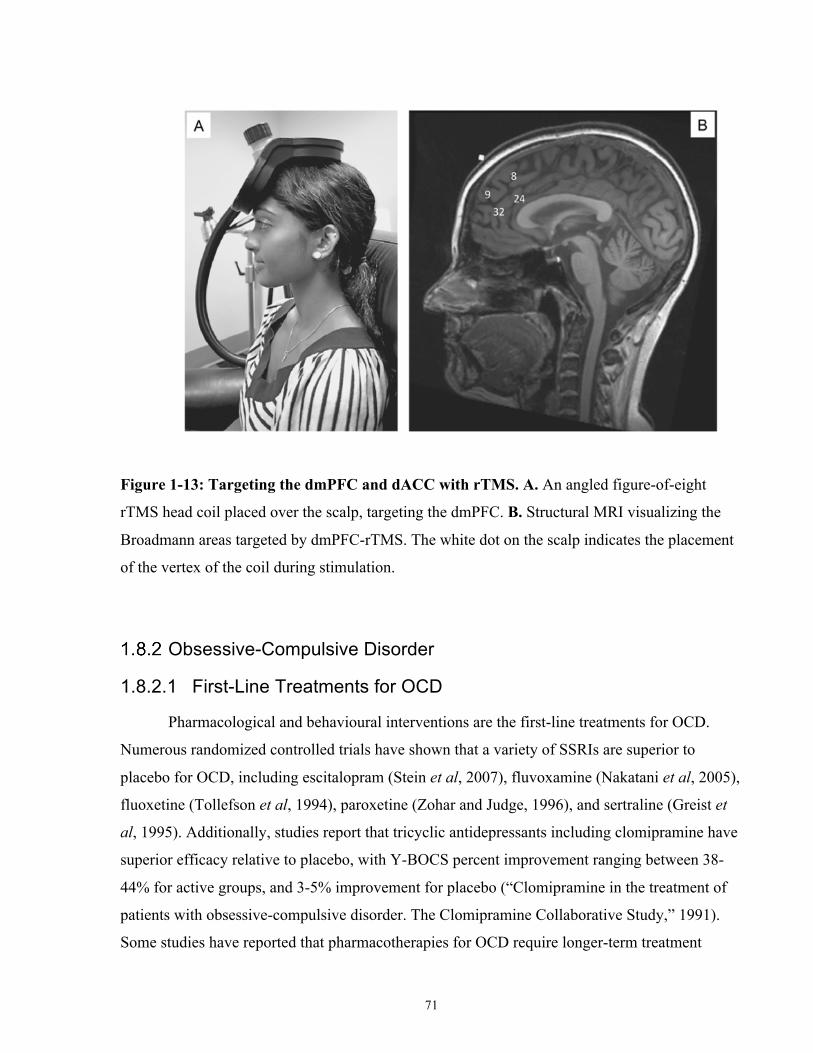
71
Figure 1-13: Targeting the dmPFC and dACC with rTMS. A. An angled figure-of-eight
rTMS head coil placed over the scalp, targeting the dmPFC. B. Structural MRI visualizing the
Broadmann areas targeted by dmPFC-rTMS. The white dot on the scalp indicates the placement
of the vertex of the coil during stimulation.
Obsessive-Compulsive Disorder
1.8.2.1 First-Line Treatments for OCD
Pharmacological and behavioural interventions are the first-line treatments for OCD.
Numerous randomized controlled trials have shown that a variety of SSRIs are superior to
placebo for OCD, including escitalopram (Stein et al, 2007), fluvoxamine (Nakatani et al, 2005),
fluoxetine (Tollefson et al, 1994), paroxetine (Zohar and Judge, 1996), and sertraline (Greist et
al, 1995). Additionally, studies report that tricyclic antidepressants including clomipramine have
superior efficacy relative to placebo, with Y-BOCS percent improvement ranging between 38-
44% for active groups, and 3-5% improvement for placebo (“Clomipramine in the treatment of
patients with obsessive-compulsive disorder. The Clomipramine Collaborative Study,” 1991).
Some studies have reported that pharmacotherapies for OCD require longer-term treatment
72
relative to other psychiatric disorders; OCD response rates may increase up to 70% after 24
weeks of medication treatment (Stein et al, 2007).
CBT and Exposure and Response Prevention (ERP) therapy are commonly-prescribed
psychotherapies with efficacy in OCD. For all anxiety disorders (among which OCD was
formerly classified), meta-analyses of randomized-controlled trials for CBT show that the pooled
odds ratio for response rates relative to placebo is 4.06, and that the strongest effect size was
seen in OCD. This suggests that across multiple studies CBT shows superior efficacy in treating
OCD relative to placebo (Hofmann and Smits, 2008). Studies of ERP therapy have also reported
superior efficacy relative to placebo, with response rates between 62-86% and 8-10% for ERP
therapy and placebo, respectively (Foa et al, 2005). The general consensus is that ERP therapy
and CBT are equally effective in terms of their efficacy in OCD (McLean et al, 2001; Whittal et
al, 2005), although one study found that CBT was superior to ERP therapy (van Oppen et al,
1995).
1.8.2.2 Treatment-Resistance in OCD Unfortunately, a substantial percentage of OCD sufferers receive no benefit from
conventional treatments. It is estimated that between 30-60% of OCD patients do not respond to
these therapies (Pallanti et al, 2002; Simpson et al, 2006). Alternative strategies like secondary
treatments or augmenting pharmacotherapies also do not usually achieve long-term improvement
(Matsunaga et al, 2009), and carry significant side effects. Even those whose symptoms initially
respond to conventional pharmaco- and behavioural therapies often show persistent functional
impairment (Steketee, 1997), and substantial future relapse rates (Simpson et al, 2005). This
problem is exacerbated by the fact that very severe and chronic OCD cases are the most
functionally disabling, and also the most difficult to treat (Bloch et al, 2010).
1.8.2.3 Brain Stimulation Treatments for OCD DBS targeting a number of different sites has been proposed for treatment-refractory
OCD, and many of these target regions were identified because of the clinical efficacy of
surgical ablations such as bilateral capsulotomy (Lippitz et al, 1999). The first DBS study for
73
treatment-refractory OCD targeted the same site used for ablative bilateral capsulotomy and
reported that 3 of 4 patients experienced significant improvements in their OCD severity and
quality of life (Nuttin et al, 1999). Subsequent randomized studies of DBS targeting the anterior
limb of the internal capsule reported that Y-BOCS severity significantly improved during the
postoperative stimulation-on condition and at 21-months relative to the stimulation-off condition
(Nuttin et al, 2003). Symptom improvements due to DBS for OCD are accompanied by long-
lasting, broad-spectrum improvements in quality of life (Ooms et al, 2014).
Other DBS targets have shown efficacy for treatment-resistant OCD, including the
ventral striatum (VS) and the inferior thalamic peduncle. One staggered-onset study using DBS
of the internal capsule and adjacent ventral striatum reported that two-thirds of patients achieved
response after 12-months of real stimulation compared to sham (Goodman et al, 2010).
Treatment response appears to persist years after electrode implantation. One study showed that
50% of participants maintained improvements over 36 months (Greenberg et al, 2006). Another
follow-up study of VS-DBS reported that the 67% of patients who achieved treatment response
over the first 12-months exhibited the same treatment response over 6-9 years of follow-up
(Fayad et al, 2016). One open-label study reported that DBS to the inferior thalamic peduncle
decreased Y-BOCS scores by 51% (Jiménez et al, 2013). More recent targets for OCD have been
proposed, notably the STN (for a review, see (Mulders et al, 2016)), and the medial
dorsal/ventral anterior thalamus, although the latter region was found ineffective for OCD
(Maarouf et al, 2016).
A number of critical limitations exist for DBS as a treatment for OCD. Most obviously,
DBS is an invasive procedure. One recent survey of adults with self-reported OCD showed that
DBS is the least accepted and least preferred novel treatment compared to other novel
behavioural therapies, possibly reflecting a lack of public awareness and evidence for this
intervention and indication (Patel et al, 2017). Only 2 of the aforementioned DBS studies were
blinded (crossover or staggered onset design) (Goodman et al, 2010; Nuttin et al, 2003), and all
of the aforementioned studies had small sample sizes (N ≤ 10), limiting the generalizability of
clinical results. Even assuming greater patient acceptance, however, the number of OCD patients
who might benefit from treatment likely exceeds by orders of magnitude the treatment capacity
of the specialized neurosurgical centres capable of performing DBS implantations.
74
To a lesser extent, tDCS and VNS have been successfully used to treat OCD, although
there are to date no randomized sham-controlled trials. The first case of tDCS for treatment-
resistant OCD is a case study in published in 2015 – the patient experienced a 40% reduction on
the Y-BOCS following 20 sessions of anodal supplemental motor area (SMA), cathodal supra-
orbital (brow bone) tDCS (Narayanaswamy et al, 2015). In the same year, another case report
showed that cathodal left OFC stimulation also induced 26% symptom severity reduction in
treatment-resistant OCD (Mondino et al, 2015). VNS has also shown some efficacy as a
treatment for OCD in one open-label study (George et al, 2008).
1.8.2.4 rTMS as a Treatment for OCD rTMS offers a non-invasive neurostimulatory alternative that could be offered to OCD
sufferers where conventional medication and pharmacotherapy fail. The first rTMS studies for
OCD targeted the DLPFC with limited success (Sachdev et al, 2001); earlier studies showed
some benefit to 20 Hz left DLPFC-rTMS in an open-label setting (Greenberg et al, 1997), while
other studies using 1 Hz right DLPFC-rTMS showed no differences relative to sham (Alonso et
al, 2001). High frequency right DLPFC-rTMS also does not appear to be effective for treatment-
resistant OCD (Mansur et al, 2011). Subsequent randomized sham-controlled trials of 1 Hz right
DLPFC-rTMS (Prasko et al, 2006) and 20 Hz left DLPFC-rTMS (Sachdev et al, 2007) have
confirmed the limited clinical efficacy of DLPFC-rTMS for OCD. However, two recent
randomized controlled trials have reported superior response rates to 1 Hz right DLPFC rTMS
over sham (Elbeh et al, 2016; Seo et al, 2016b).
Inhibitory bilateral SMA stimulation currently appears to be one of the few effective
rTMS targets available for treatment-resistant OCD (Berlim et al, 2013; Ruffini et al, 2009). In
2006, Mantovani and colleagues were the first to target the SMA with 1 Hz rTMS in an open-
label setting. In 4 OCD subjects, they found a >40% reduction in symptom severity, and this
improvement persisted at 3-months follow-up (Mantovani et al, 2006). A follow-up randomized
sham-controlled trial from the same group replicated these findings – patients in the active arm
experienced a nearly 50% reduction of symptom severity after 8 weeks of active rTMS
(Mantovani et al, 2010). Another randomized sham-controlled trial from a separate group saw
similar efficacy rates that persisted at 3-months follow-up (Gomes et al, 2012). Furthermore,
75
recent studies of low-frequency stimulation of the medial prefrontal cortex for OCD using deep
TMS acheived a mean reduction of 39% on the Y-BOCS in an open-label setting (Modirrousta et
al, 2015). One recent study saw limited efficacy for inhibitory 1 Hz rTMS over the SMA (Hegde
et al, 2016), although several others have replicated the long-term efficacy of this treatment
protocol (Hawken et al, 2016). The therapeutic mechanisms of rTMS in OCD remain poorly
characterized in the literature to date, however.
Anorexia and Bulimia Nervosa
1.8.3.1 First-Line Treatments for AN and BN To date, there is no single well-established treatment for eating disorders in general.
Treatments, or treatment-combinations, vary according to eating disorder type, severity, and
clinician experience (for a review, see (Halmi, 2005)). Treatments also take place in various
settings, including community programs, outpatient day hospital programs, hospitalization, and
group-based programs. Of note, much of the research on the efficacy of ED treatment strategies
is hampered by a lack of evidence from randomized-controlled trials.
For AN, a typical treatment course could incorporate medical management, behavioural
therapy, and cognitive therapy. Medical management refers to nutritional strategies to normalize
weight, either orally or via nasal gastric feeding tube. Recent research supports the relationship
between response and relapse rates to a patient’s BMI at discharge, indicating that the
achievement of a normal BMI throughout treatment may be a necessary component for long term
success (Kaplan et al, 2009; Rigaud et al, 2011). Cognitive and behavioural therapies aim to
reduce and prevent binge-eating and purging episodes, and also address distortions in body
image or weight and self-worth. Pharmacotherapies are more often used as adjunct therapies to
improve response rates or delay relapse. For example, adjunct fluoxetine after inpatient weight
gain was found to significantly reduce relapse rates one year after discharge in a double-blind
placebo-controlled study (Kaye et al, 2001).
Cognitive-behavioural therapy is also a conventional treatment for BN. In one
randomized controlled trial comparing CBT to IPT, it was found that individuals in the CBT arm
experienced faster and greater improvement by 6 weeks relative to individuals randomized to
76
IPT (Wilson et al, 2002). Group-based CBT also appears to be an effective treatment for BN,
although it is not yet clear whether it is as effective as, or superior to, individual CBT (Polnay et
al, 2014). Likewise, the methods of CBT trials vary widely, and studies often have modest
sample sizes (Hay et al, 2009). Pharmacotherapies are also associated with superior outcomes
relative to placebo for BN; for example, the World Federation of Societies of Biological
Psychiatry recommends tricyclic antidepressants and fluoxetine as effective treatments for BN
(Aigner et al, 2011). One other randomized-controlled trial of pharmacotherapies and
psychotherapies reported that concurrent pharmacotherapy and CBT has improved efficacy in
terms of binge reduction relative to monotherapies (Claudino et al, 2007), although these
findings have not been observed consistently (Walsh et al, 1997).
Response and remission rates for AN vary widely across studies and treatment
interventions. On average, studies that assess short-term treatment outcomes report the poorest
remission rate; in one study AN remission rates were 29% (Clausen, 2008). Other naturalistic
follow-up studies report that remission rates increase over time, with remission increasing from
68 to 84% between 8 and 16 year follow-up visits (Nilsson and Hägglöf, 2005). Another long-
term 2-year follow-up study of AN reported a recovery rate of 60.3%, a partial response rate of
25.8%, and a non-response rate of 12.8% (Rigaud et al, 2011).
1.8.3.2 Treatment-Resistance in AN and BN As indicated by the above studies with up to 20-years of follow-up data, both AN and BN
are chronic disorders. Only a third of AN patients will recover within 4 years of disease onset,
almost half will recover by 10-years after onset, and up to 75% after 10 years (Berkman et al,
2007; Steinhausen, 2002). Approximately 25% of AN patients will continuously relapse or
become chronic in their course of illness (Berkman et al, 2007; Steinhausen, 2002). While the
general consensus is that patients respond well to inpatient-based programs (Olmsted et al,
2010), many will relapse following discharge. The overall relapse rate following inpatient weight
restoration programs is 35%, and the median survival time of successful weight restoration is 18
months (Carter et al, 2004). Other studies report a range of rates of successful weight restoration
between 9 and 65% (Carter et al, 2004; Keel et al, 2005; Strober et al, 1997; Walsh et al, 2006).
As with AN, studies of BN report relapse rates between 25-63%, depending on the definition of
77
relapse and the duration of follow-up (Grilo et al, 2012; Halmi et al, 2002; Herzog et al, 1999;
Keel et al, 2005; Olmsted et al, 2005).
1.8.3.3 Brain Stimulation Treatments for AN and BN Given the limitations of current treatment strategies in AN and BN, novel treatment
options are needed, and brain stimulation treatments figure prominently in current research.
Particularly in the case of AN, where mortality rates are high, invasive options involving
neurosurgery may be considered worth pursuing if effective. Novel neurosurgical interventions
for intractable AN are well-documented, but these studies report mixed clinical results (for a
review, see (Lipsman et al, 2013c)). DBS is a promising invasive therapy more recently tested in
AN. In 2010, the first case study of successful sgACC-DBS in a TRD patient with comorbid AN
reported that the individual experienced weight restoration and eating disorder remission at 3-
years follow-up (Israël et al, 2010). Another target under study is the VS, with one case series of
VS-DBS reporting that 65% of patients achieved increased weight at 38-months follow-up (Wu
et al, 2013). The first phase 1 trial of DBS for AN was published in 2013 – 6 patients with
intractable AN underwent sgACC-DBS and were observed for 9 months in follow-up. Lipsman
and colleagues reported that 3/6 of these patients achieved and maintained a higher BMI than
baseline, and experienced significant improvements in mood, AN-associated obsessions and
compulsions, with benefits maintained at 1-year follow-up (Lipsman et al, 2013b, 2017). While
short- and long-term clinical outcomes appear promising, DBS studies in general are plagued by
extremely low sample sizes. DBS, as previously discussed, is an invasive treatment, and is only
available in specialized academic neurosurgical centres, focusing on the most refractory clinical
cases. To date, no DBS studies have been published investigating its efficacy in BN.
As previously mentioned, one non-invasive and more accessible alternative to DBS is
tDCS. To date, there are few published randomized sham-controlled trials of tDCS for either AN
or BN. An overwhelming majority of the published tDCS literature has recruited healthy female
patients with abnormally high food cravings, as opposed to individuals with a formal DSM-5
diagnosis (for a review see (Val-Laillet et al, 2015)). In four independent studies, a single session
of right DLPFC anodal/left DLPFC cathodal tDCS significantly reduced cue-induced craving,
78
food take, and improved the participants’ ability to control cravings relative to sham tDCS
(Fregni et al, 2008; Goldman et al, 2011; Kekic et al, 2014; Lapenta et al, 2014).
Only one randomized controlled trial of tDCS in BN has been published to date. In this
study, 39 BN subjects received 3 different sessions of tDCS: anode right/cathode left, anode
left/cathode right, and sham tDCS. In all three tDCS sessions, BN patients experienced
significant improvements in binge-purge behaviours 24-hours post-stimulation, but mood only
improved in the anode right/cathode left active condition (Kekic et al, 2017). The first open-label
tDCS study, in 7 AN participants, involved 10 sessions of anodal left DLPFC tDCS, reporting
significant improvements of symptom severity on the Eating Disorders Inventory and Eating
Attitude Test (Khedr et al, 2014).
1.8.3.4 rTMS as a Treatment for AN and BN rTMS offers the advantages of being non-invasive, safe, focal, and more accessible than
many other neuromodulation techniques – as such, it is a potentially attractive alternative
treatment for AN and BN patients who do not respond to tDCS or do not consent to ECT or
DBS. The earliest reported study of rTMS as a treatment for BN is a case report of an MDD
patient with comorbid BN; the patient experienced an unexpected remission of BN symptoms
after 10 sessions of 20 Hz rTMS over the left DLPFC (Hausmann et al, 2004). Subsequent
studies using high frequency left dorsolateral stimulation report mixed clinical outcomes: two
studies reported that a single active rTMS session reduced the urge to eat, reduced the number of
binges 24-hours post-stimulation, and reduced salivary cortisol (Claudino et al, 2011; Van den
Eynde et al, 2010), while another reported no difference between active- and sham-stimulation
after 15-sessions of 20 Hz rTMS (Walpoth et al, 2008). More recently, a single session of high
frequency left DLPFC-rTMS reduced subjective craving immediately post-rTMS in a small BN
sample (Sutoh et al, 2016). However, the most recent randomized double-blind sham-controlled
trial of 10 Hz left DLPFC-rTMS in 47 BN patients reported no significant improvement in
binge-eating and purging relative to placebo (Gay et al, 2016). Recently, the dmPFC has been
discussed as a potential novel rTMS target for BN. As with the first case report of DLPFC-rTMS
for BN, our group reported an unanticipated remission of binge-eating and purging in an MDD
patient with comorbid BN following 20 sessions of 10 Hz dmPFC-rTMS (Downar et al, 2012).

79
This effect on binge-eating and purging was rapid and was maintained for 9-weeks post-
treatment in the absence of booster rTMS sessions or other further interventions. However, as
with OCD, the therapeutic mechanisms of dmPFC-rTMS in BN remain poorly characterized in
current literature.
In the case of AN, the first open-label case study of left DLPFC-rTMS reported that 19-
20 sessions of high frequency rTMS elicited significant symptom and mood improvements that
persisted at 6-months follow-up (McClelland et al, 2013). One pre-clinical study in 10 AN
subjects found that a single session of 10 Hz left DLPFC-rTMS elicited less anxiety and
alleviated feelings of fatness immediately post-rTMS (Van den Eynde et al, 2013). More
recently, a randomized sham-controlled trial of one session of left DLPFC-rTMS was performed
on 60 AN individuals, reporting no significant group-by-time interaction between treatment arm
and core AN symptoms (McClelland et al, 2016). It also appears that a follow-up study of 20
sessions of 10 Hz left DLPFC-rTMS is currently ongoing (Bartholdy et al, 2015).
Improving rTMS Response Recent meta-analyses of rTMS as a treatment for TRD report that clinical response and
remission rates are superior to sham, although even the most successful randomized trials have
struggled to surpass remission rates of 35-40% for active treatment (Levkovitz et al, 2015).
rTMS also shows promise as a treatment for other psychiatric disorders, including AN, BN, and
OCD, although the evidence base to date is more limited.
One factor that may limit current remission rates is that the ‘parameter space’ of possible
rTMS protocols is very large, encompassing setting such as stimulation site, intensity, frequency,
pattern, duration, interval, and course length. At present, the influence of most of these rTMS
parameters on clinical response and remission rates are currently unknown. In the current
absence of any validated preclinical biomarker for the neuroplastic effects of rTMS outside
motor cortex, efforts at parameter optimization are of necessity empirical in nature.
The following section outlines five rTMS parameters and two additional protocols that
have the potential to improve rTMS treatment response and remission rates, if properly
optimized. Since TRD is most heavily studied in clinical rTMS studies, all of the results
80
summarized hereafter pertain to TRD, although it is likely that these parameters would similarly
influence response and remission rates in OCD and eating disorders.
Number of Total Treatment Sessions Early rTMS trials for TRD used once daily rTMS, and applied short courses of as few as
5 sessions, compared to current norms of 20-36 sessions or longer in current practice. As such,
the total number of treatment sessions employed in these earlier trials is now considered perhaps
sufficient to separate active from sham effects, but insufficient to characterize the truw effect
size for an adequate course of rTMS treatment (Carpenter et al, 2012; Connolly et al, 2012;
McDonald et al, 2011). Notably, TRD-rTMS studies with methods that include longer treatment
courses have reported an increase in response and remission rates, around 50% and 33%
respectively (Carpenter et al, 2012; Ciobanu et al, 2013; Connolly et al, 2012; Downar et al,
2014; Fitzgerald et al, 2011; McDonald et al, 2011). A recent meta-analysis also reported a
significant positive correlation between the clinical response rate and the number of rTMS
treatment sessions (Teng et al, 2017).
Number of Daily Treatment Sessions A typical course of rTMS treatment involves a once-daily treatment regimen. Given that
the number of treatment sessions needed for response or remission is between 20-30 sessions,
this would mean that patients are required to come to the clinic every day, typically Monday to
Friday, for between four and six weeks. This is a serious logistical inconvenience for patients,
especially those who are able to work or must commute a long distance for daily treatment. Long
treatment courses also render rTMS less practical for certain settings in which it might otherwise
be useful, such as inpatient wards.
One possible solution to these challenges is to perform multiple rTMS treatment sessions
in a single day. The first accelerated rTMS study for TRD was reported by Holtzheimer and
colleagues in 2010. TRD patients received 15 sessions of left DLPFC-rTMS over 2 days, and a
subgroup experienced full remission from depression and anxiety that persisted at 3- and 6-
weeks follow-up in an open-label setting (Holtzheimer et al, 2010). Subsequent sham-controlled
81
crossover trials of 5-times daily left DLPFC-rTMS protocols have reported superior response
rates relative to sham, albeit at lower response rates (35-38%) relative to once-daily rTMS
protocols (Baeken et al, 2013; Duprat et al, 2016). One open-label trial of twice-daily left
DLPFC-rTMS reported that the response and remission rates are comparable to once-daily
treatment, with response and remission rates of 55.6% and 37.0%, respectively (McGirr et al,
2015). Open-label accelerated low frequency right DLPFC-rTMS was also recently reported to
be tolerable and possibly efficacious in TRD (Tor et al, 2016). Similarly, a chart review of
patients who received once- or twice-daily dmPFC-rTMS reported improvement trajectories that
tracked the number of sessions rather than the number of pulses, such that patients who received
their daily dose of pulses in 2 sessions 80 min apart rather than a single session improved in 10-
15 days rather than the typical 20-30 days (Schulze et al, 2018).
As a caveat, accelerated treatment regimens have not clearly achieved higher remission
rates than once-daily sessions – instead, those who respond merely seem to show more rapid
response. Thus, it is less clear that multiple daily session protocols will deliver large
improvements in remission rate over existing techniques.
Neuronavigation During rTMS Another proposed approach to improve rTMS outcomes is to develop better techniques to
position and orient rTMS coil during treatment, so as to more effectively induce activity in the
target brain region, and thereby improve treatment outcomes. For DLPFC-rTMS, the original
approach to neuronavigation employed a ‘5 cm rule,’ in which the rTMS operator localizes the
primary motor ‘hotspot’ requiring the least intense stimulation to elicit movements of the
contralateral abductor pollicis brevis muscle, and subsequently positions the rTMS coil 5 cm
anterior to that location as a simple heuristic to target the DLPFC (George et al, 1995; Pascual-
Leone et al, 1996b). However, one difficulty with the ‘5 cm’ heuristic is that it may not be
reliable for localizing the DLPFC: one study using MRI to verify coil placement found that the 5
cm rule placed the coil outside (posterior) to DLPFC in 1/3 of individuals (George et al, 2010).
More recent studies have taken advantage of image-guided neuronavigation, which aids
the technician in placing the rTMS coil based on a structural MRI (Herwig et al, 2001b; Krings
et al, 2001; Schönfeldt-Lecuona et al, 2005). This approach can help to ensure that the
82
stimulation is aimed at the desired DLPFC site, rather than more posterior or dorsal stimulation
sites outside the DLPFC that have been associated with lower chances of remission (Herwig et
al, 2001a). Recent studies investigating DLPFC targeting in MDD reported that the more ventral
and anterior DLPFC targets were associated with better response to rTMS (Fitzgerald et al,
2009; Fox et al, 2012a). However, purely anatomical MRI-based navigation techniques are also
potentially problematic, as anatomical localization still does not always align adequately with
functional localization. Other approaches suggest that the optimal DLPFC site is characterized
by activity that is anticorrelated to that of the sgACC on rs-fMRI, highlighting the potential
importance of functional localization of the target TMS site to downstream or monosynaptic
regions (Fox et al, 2012a; Herbsman et al, 2009).
Although functional MRI-guided targeting may prove fruitful for improving remission
rates in future, other studies suggest that there exist scalp heuristics that can nearly match the
accuracy of MRI-guided neuronavigation for targeting the DLPFC and DMPFC. These include
the ‘BeamF3’ heuristic for DLPFC stimulation and 25% nasion-to-inion measurement for
DMPFC stimulation, which may provide a reasonable approximation to MRI, while avoiding the
added cost, complexity, and accessibility issues that arise when MRI-guided neuronavigation is
employed (Mir-Moghtadaei et al, 2015, 2016). To date, the available literature on therapeutic
rTMS has not been able to demonstrate a clear advantage in remission rates for neuroimage-
guided vs. scalp-heuristic navigational methods.
Novel Stimulatory Protocols The majority of rTMS studies to date in MDD have used ‘conventional’ stimulatory
protocols, such as 1 Hz for low frequency and between 5 and 20 Hz for high frequency
stimulation. Although well-supported by large studies and meta-analyses over the last 25 years,
these conventional rTMS protocols carry some disadvantages. First, these protocols have
traditionally been quite long in duration; the U.S. Food and Drug Administration-approved
protocol of high frequency left DLPFC stimulation lasts approximately 37.5 minutes (O’Reardon
et al, 2007). Long stimulation protocols limit the capacity of rTMS treatment facilities to only a
few patients per device per day, which impedes rTMS from making a meaningful reduction in
the high (2%) population prevalence of TRD overall. Shorter stimulation protocols could
83
therefore increase rTMS clinic capacity, lower treatment costs, and lessen patient commitment
throughout treatment, while also enabling rTMS to potentially reduce the population prevalence
of TRD.
Theta-burst stimulation (TBS) is one such protocol that could achieve similar potency to
standard protocols, while requiring several-fold less time to administer. TBS applies rTMS
pulses in bursts of 3 pulses at 50 Hz with such bursts repeated at 5 Hz (Huang et al, 2005).
Excitatory stimulation, called intermittent TBS (iTBS), is achieved by cyclically applying 2
second TBS bursts followed by an inter-train interval of 8 seconds, while inhibitory stimulation,
called cTBS. involves repeating TBS bursts with no inter-train interval ((Huang et al, 2005; Di
Lazzaro et al, 2011), for a review see (Cárdenas-Morales et al, 2010)). Both protocols consist of
only 600 pulses total, with iTBS and cTBS thus requiring approximately 3 minutes versus 40
seconds, respectively.
A number of studies demonstrate that response and remission rates of iTBS are
comparable to that of longer conventional rTMS protocols for TRD. Most recently, our group
published a large, multi-site non-inferiority trial comparing left DLPFC 10 Hz and iTBS, finding
nearly identical response and remission rates for the two interventions (Blumberger et al, 2018).
Another recent meta-analysis of randomized and sham-controlled TBS trials for MDD reported
that the response but not the remission rates of active TBS protocols are superior to that of sham
TBS (35.6% vs. 17.5% for response, and 18.6% vs. 10.7% for remission, respectively) (Berlim et
al, 2017). Although protocols included left DLPFC iTBS (Duprat et al, 2016) and right DLPFC
cTBS (Chistyakov et al, 2015), it appeared that bilateral TBS (left iTBS, right cTBS) was the
most promising protocol relative to placebo (Berlim et al, 2017; Li et al, 2014a; Plewnia et al,
2014; Prasser et al, 2015). Considering targets other than DLPFC, bilateral dmPFC-iTBS also
appears to be as effective as 10 Hz bilateral dmPFC-rTMS, with no significant difference in
response and remission rates between these two protocols (Bakker et al, 2015). Neither iTBS nor
cTBS have yet been investigated in eating disorders and OCD.
A potential shortcoming of all rTMS protocols in clinical use to date is that their
physiological effects on brain plasticity are highly heterogeneous across individuals. In
preclinical studies using markers such as MEPs or rs-fMRI, a substantial fraction of individuals
show inhibition on nominally ‘excitatory’ protocols and excitation on nominally ‘inhibitory’
84
protocols. This heterogeneity is apparent not only for conventional protocols like 1 Hz and 10 Hz
rTMS (Eldaief et al, 2011; Maeda et al, 2000) but also in newer protocols like iTBS and cTBS
(Cárdenas-Morales et al, 2014; Hamada et al, 2013; Nettekoven et al, 2015). One potentially
more reliable novel protocol that has yet to be clinically assessed is quadripulse stimulation
(QPS). QPS involves four monophasic (rather than conventional biphasic) pulses, and when the
inter-stimulus interval (ISI) is manipulated QPS can be made more consistently excitatory or
inhibitory than other protocols. Generally, short ISIs (1.5-10ms) result in in MEP facilitation
(LTP), while longer ISIs (50-100ms) generate MEP inhibition (LTD) (Hamada et al, 2007,
2008). A recent replication study demonstrated that QPS-induced MEP effects are consistent in
direction across 80% of subjects (Nakamura et al, 2016), substantially higher than the
corresponding rates of as little as 50% for standard 1 Hz, 10 Hz, or TBS protocols. While QPS
appears to be safe and well-tolerated, clinical studies assessing the benefits of QPS have yet to be
performed in any psychiatric disorder population (Nakatani-Enomoto et al, 2011).
Novel rTMS Stimulation Targets in Psychiatric Illness An emerging area of therapeutic exploration is the use of alternative neurostimulatory
targets other than the DLPFC or dmPFC to treat psychiatric disorders. Given the transdiagnostic
abnormalities of regions such as the anterior cingulate cortex and anterior insula (Goodkind et al,
2015), and given that a host of other brain regions are structurally or functional abnormal in
psychiatric illnesses (Downar and Daskalakis, 2013), novel targets may offer treatment options
for subsets of psychiatric patients where dmPFC- or DLPFC-rTMS has failed. The frontopolar
cortex, ventromedial prefrontal cortex, and ventrolateral prefrontal cortex have, for example,
been proposed as MDD-rTMS targets in addition to the DLPFC and dmPFC based on the
evidence of lesion, stimulation, connectivity and neuroimaging studies (for a review see (Downar
and Daskalakis, 2013)). For example, one recent case report, one open-label case series, and one
sham-controlled trial have reported preliminary clinical findings using orbitofrontal /
ventrolateral prefrontal rTMS targets in MDD and OCD. All studies reported significant clinical
improvements following 1 Hz rTMS over the orbitofrontal cortex, in some cases where DLPFC_
and dmPFC-rTMS had failed; such observations support the potential future utility of novel
therapeutic rTMS targets for improving overall remission rates (Feffer et al, 2018; Fettes et al,
2017a; Nauczyciel et al, 2014).
85
Summary: Psychiatric Illness, IBNs, and rTMS Treatments
To summarize the key points reviewed thus far, MDD, AN, BN, and OCD are psychiatric
disorders characterized by substantial heterogeneity in terms of clinical presentation and
symptomatic improvement. Given that there is considerable overlap of these disorders, in both
comorbid symptoms and in the pharmaco- and psychotherapeutic options available, it is likely
that these disorders are related to common neurobiological or cognitive disruptions.
Neuroimaging studies indeed suggest that there are common, transdiagnostic domains of
abnormal function that may span multiple traditional diagnostic categories. The RDoC domains
of cognitive control, positive and negative valence systems offer one model of such
transdiagnostic abnormalities. Of note, these domains appear to be associated with specific
neural substrates in the form of specific IBNs, including the SN and VMN. Since rTMS appears
to exert an effect not only at the stimulation site but also across its associated IBN, this
intervention may be suitable for therapeutic use transdiagnostically across a variety of
psychiatric disorders. However, remission rates still fall below 50% in even the most successful
randomized trials, and further efforts are needed to improve treatment outcomes. Parameter
optimization may deliver some improvements in the consistency of rTMS effects; however,
given the bimodal outcomes observed in some rTMS studies, improving remission rates above
50% will likely require techniques for i) predicting treatment response from pre-treatment
neurobiological measures, and ii) characterizing the changes from pre- to post-treatment that are
associated with successful versus unsuccessful treatment outcomes. We now turn to these goals
in the next section of this Introduction.
Predicting Treatment Response
Why Predict Treatment Response? One potentially fruitful strategy for improving remission rates is to select an optimal
treatment strategy based on the individual’s underlying biological markers. Individualizing
patient care using reliable biological predictors, or ‘biomarkers,’ may deliver benefits in three
possible ways. First, identifying treatment responders from non-responders prior to treatment
86
may avoid having patients undergo logistically onerous but futile courses of treatment, and
thereby accelerate the heretofore trial-and-error process of finding an effective treatment for a
given patient. A significant time-commitment is required of rTMS patients, especially since
rTMS requires patients to receive treatment at a clinic or hospital daily over many weeks, and so
avoiding futile treatments by predicting responders and non-responders to a given rTMS protocol
is a reasonable first step. Second, identifying reliable biomarkers of treatment response may help
to inform the search for new treatments for those who do not respond. For example, a
neuroimaging biomarker may reveal brain regions whose baseline activity or connectivity differs
between responders and non-responders to a given treatment. Brain regions that are abnormally
hyper- or hypo-active in non-responders, or that have a different pattern of network connectivity
in responders versus non-responders, may present neurostimulatory targets worthy of future
clinical investigation. Finally, on a more basic and mechanistic level, biomarkers that distinguish
individual differences in response to treatment may help to parse the heterogeneity of illness
within the diagnostic entities of MDD and other psychiatric disorders, and may thereby further
the field in terms of understanding the various pathways by which individuals may develop
superficially similar forms of illness.
Clinical Predictors of Response to Conventional Interventions
1.10.2.1 Predicting Treatment Response in MDD
Pre-treatment clinical characteristics may provide insights on which MDD patients
respond best to certain first-line treatments (for a review, see (El-Hage et al, 2013)). For
example, the presence of bipolar depression is related to poorer outcomes in general (Gijsman et
al, 2004). Similarly, MDD with comorbid anxiety is associated with poorer pharmacotherapy
outcomes (Fava et al, 2008). Heightened somatic symptoms, including pain, or energy and
autonomic deficits, also predict a lower chance of remission: in individuals with no or limited
somatic symptoms, remission rates correspond with the STAR*D trial (68% remission rate),
while in individuals with severe somatic symptoms remission rates dropped to 29.3% (Novick et
al, 2013). However, age, sex, and MDD ‘subtype’ (e.g., atypical versus melancholic) do not
appear to moderate outcomes for MDD patients on psychotherapies or pharmacotherapies
(Cuijpers et al, 2014; Driessen and Hollon, 2010; Simon and Perlis, 2010), although one meta-
87
analysis has shown lower response rates in older patients (Tedeschini et al, 2011). In one study
assessing demographic and clinical predictors of citalopram (an SSRI) response, individuals who
were employed, Caucasian, female, and of higher socioeconomic or education status had higher
remission rates, while individuals with comorbid psychiatric or other medication conditions and
lower quality of life had poorer remission rates (Trivedi et al, 2006). Also, modest sex
differences have been found to the response rates of some other SSRI and tricyclic
antidepressants, including fluvoxamine and imipramine (Vermeiden et al, 2010). It is important
to note that, although these clinical predictors show significance at the group level, none has yet
achieved the much higher bar of clinically meaningful predictive value at the individual level.
1.10.2.2 Predicting Treatment Response in OCD The prognosis of pharmacotherapy and behavioural therapies in OCD is hampered by the
natural course of OCD psychopathology, often characterized by a ‘waxing and waning’ course of
symptom severity (Bandelow et al, 2008), and by the heterogeneity of OCD in terms of its
clinical presentation (Ravizza et al, 1997). These two factors make the identification of a reliable
pathopsychological or clinical markers more challenging (Kellner, 2010). However, many
clinical factors are correlated with Y-BOCS improvement on pharmaco- and psychotherapies.
For example, comorbid personality disorders, poor insight into obsessions, and the
symmetry/hoarding and contamination/washing aspects of OCD are associated with poorer
response to clomipramine (for a review see (Hazari et al, 2016)). One systematic review of 69
psychotherapy trials reported that hoarding, anxiety and OCD symptom severity, and
demographic factors such as unemployment and marital status were associated with poorer
treatment outcomes (Knopp et al, 2013). Individuals who suffer from comorbid depression,
early-onset OCD, and individuals who suffer from chronic OCD (at least 30 years) are unlikely
to respond to psychotherapy (Jakubovski et al, 2013). In one 7-year follow-up study of OCD
patients treated with a combination of CBT and a SSRI, Rufer and colleagues reported that over
95% of participants required additional treatment throughout follow-up, suggesting the chronic
nature of OCD and the need for treatment maintenance to achieve long-lasting improvements
(Rufer et al, 2005). Again, however, clinical predictors in OCD have generally not yielded
meaningful predictive value at the individual level thus far.
88
1.10.2.3 Predicting Treatment Response in AN and BN A number of clinical factors are associated with poorer treatment outcomes in AN. In one
13-year follow-up study of 484 patients, 8 factors predicted poor outcome at 2-years follow-up:
first, low BMI at hospital discharge; second, low food intake; third, high desire for excessive
exercise; fourth, high perfectionism; fifth, high interpersonal distrust; sixth, severe anxiety;
seventh, use of tube-feeding during treatment; and eighth, adherence to treatment (Rigaud et al,
2011). Two other studies have reported that outstanding functional impairment after treatment
predicted poorer long-term response to conventional interventions (Bryant-Waugh et al, 1996;
Lask and Bryant-Waugh, 1992). Additionally, age is negatively correlated with AN response
(Steinhausen, 1997; Strober et al, 1997). Low body weight at AN onset and lowest minimum
BMI are also predictive of poorer outcomes to conventional interventions (Herpertz-Dahlmann et
al, 1996). A more recent study of 680 women with AN reported that self-induced purging and
higher trait anxiety significantly predicted poorer outcomes to treatment, whereas higher
impulsivity predicted positive improvement (Zerwas et al, 2013). Another study reported that the
binge-eating/purging AN subtype are more susceptible to relapse (Carter et al, 2012).
As with AN, a number of clinical factors also predict response and relapse rates in BN. In
one study assessing predictors of treatment response following CBT, a history of obesity, poor
pre-treatment global functioning, BN symptom severity, and comorbid depression predicted
poorer outcomes to CBT (Bulik et al, 1998a). Furthermore, post-treatment binge-eating and food
restriction, and high cue-induced food craving predicted poor outcomes at 1-year follow-up
(Bulik et al, 1998a). Less severe BN patients tend to improve more quickly and remit for longer
periods following CBT, relative to high-severity BN patients (Bulik et al, 1999). Another
predictor of BN response is an early change in purging frequency – BN patients who reported no
purging at 4-weeks into treatment were more likely to be responders (risk = 0.25) (Fairburn et al,
2004). Another recent study reported that acute depression symptom change is predictive of long
term BN response at 6-months follow-up (Thompson-Brenner et al, 2015). Patients who had
severe binge-eating and purging before day treatment also tend to relapse faster (Olmsted et al,
2015). Again, however, few of these group-level clinical predictors are capable of delivering
reliable individual-level predictions of treatment outcome.
89
IBN Predictors of Response to Conventional Interventions
1.10.3.1 Predicting Treatment Response in MDD Several studies have identified predictors of antidepressant response based on the
functional connectivity of IBNs, including predictors of response to CBT (Forbes et al, 2010;
Ritchey et al, 2011; Siegle et al, 2006), pharmacotherapy (Admon et al, 2015; Davidson et al,
2003; Forbes et al, 2010; Korgaonkar et al, 2014; Mayberg et al, 1997; Pizzagalli et al, 2001;
Spies et al, 2017; Taylor et al, 2014), ECT (van Waarde et al, 2015) and even to placebo (Sikora
et al, 2016). A recent meta-analysis of structural and functional predictors of response to
pharmaco- and psychotherapies reported that greater antidepressant response is associated with
relatively higher activity in the rACC (DMN) and lower activity in the AI and striatum (SN) (Fu
et al, 2013).
Three of these studies reported differences in DMN function that were predictive of
response to pharmacotherapies. Lower activity of the PCC during an emotional discrimination
task was correlated with HAMD improvement after 2 weeks of escitalopram (Spies et al, 2017),
while hyperactivity and hypermetabolism of the rACC (BA 24) at rest correlated with
antidepressant response to other pharmacotherapies, including SSRIs and nortriptyline (Mayberg
et al, 1997; Pizzagalli et al, 2001). Of special note, the functional connectivity of dmPFC to
other regions including the DLPFC, OFC, and PCC appears to achieve a higher bar of predicting
ECT treatment responders and nonresponders at the individual-patient level, with a sensitivity
and specificity of 84% and 85%, respectively (van Waarde et al, 2015).
Pre-treatment SN functioning has successful distinguished responders from non-
responders across a range of interventions including pharmacotherapy, psychotherapy, and
placebo. First, one study reported that high baseline dACC resting-state connectivity to SN
regions predicted antidepressant response to 2 weeks of placebo and 10 subsequent weeks of
pharmacotherapy, suggesting that SN integrity might serve as a common biological marker of
response irrespective of intervention (Sikora et al, 2016). Second, venlafaxine responders were
characterized by baseline dACC hyperactivity to negative versus neutral images (Davidson et al,
2003). Finally, a third study reported baseline insular resting-state connectivity that correlated
with the degree of improvement on pharmacotherapy (Crowther et al, 2015). Frontostriatal
90
connectivity through dACC during reward processing of a monetary incentive delay task also
appears to be predictive of antidepressant response across two different studies (Admon et al,
2015; Walsh et al, 2017).
Finally, sgACC function has been studied extensively as a potential predictor of
treatment outcome, given the prominence of this region in many neuroimaging studies of the
neural correlates of depression (as reviewed above). Two studies have reported that baseline
sgACC hyperactivity during emotional processing is correlated with antidepressant response to
CBT (Ritchey et al, 2011; Siegle et al, 2006). Furthermore, the amplitude of low-frequency
fluctuations of the sgACC appears to correlate positively with ECT response (Argyelan et al,
2016). Resting-state connectivity between left and right sgACC also appears to distinguish MDD
individuals who relapse from those who continue to remit (Workman et al, 2017).
1.10.3.2 Predicting Treatment Response in OCD
Few studies have identified differences in structural and functional connectivity between
treatment responders and non-responders (for a review on this issue, see (Frydman et al, 2016)).
In one notable example, bilateral mOFC cortical thickness successfully distinguished OCD
treatment responders and non-responders to with 77% sensitivity, 81% specificity, and an overall
80% classification accuracy. Thicker left mOFC and thinner right mOFC was also associated
with a higher probability of being a responder to either CBT or an SSRI. However, this model
was only able to correctly classify roughly 70% of non-responders in a subsequent independent
sample (Hoexter et al, 2015).
1.10.3.3 Predicting Treatment Response in AN and BN
To date, only one neuroimaging study has reported structural or functional differences
between treatment responders and non-responders in eating disorders. In one study, caudate
hyperactivity during prediction errors predicted poor weight gain in adolescent AN (DeGuzman
et al, 2017). As of yet, there are no studies that investigate neurobiological predictors of binge or
purge behaviours, or predictors of improvements to other maladaptive thoughts of eating, weight,
91
or shape. This absence of studies likely relates to the lack of consistent definitions of eating
disorder response and remission, and the substantial inter-individual variability of neuroimaging
and clinical correlates of AN and BN, as discussed earlier.
Predictors of Response to rTMS
1.10.4.1 Clinical Predictors of rTMS for TRD
A number of demographic and clinical features have been identified as predictive of
response to DLPFC-rTMS in TRD, at the group level. A recent meta-analysis reported that
females had higher response rates than males (Kedzior et al, 2014). Age also appears to
negatively predict response to high frequency and low frequency DLPFC protocols and to
relapse following rTMS, such that older patients do not respond as well to DLPFC-rTMS
compared to younger individuals (Aguirre et al, 2011; Fregni et al, 2006; Pallanti et al, 2012),
and older TRD patients have higher relapse rates relative to younger individuals (Cohen et al,
2009). Episode duration and treatment refractoriness also negatively predict treatment response,
such that patients with longer depressant episodes or more treatment-resistant MDD show poorer
responses to DLPFC-rTMS (Brakemeier et al, 2007; Fregni et al, 2006; Wu and Baeken, 2017).
A note of caution is warranted in interpreting clinical trials using rTMS, however, as much of the
available literature report low sample sizes, or sub-optimal rTMS protocols (for example, too
few rTMS sessions). Furthermore, very little is known about the clinical predictors of dmPFC-
rTMS; only one study from our group found that high baseline anhedonia predicted poorer
response to open-label dmPFC-rTMS (Downar et al, 2014). Thus far, no reliable individual-level
predictors of rTMS response in TRD have been identified.
1.10.4.2 Structural and Functional Predictors of DLPFC-rTMS Response Early neuroimaging predictors of DLPFC-rTMS used positron emission tomography
(PET) to measure baseline differences and/or changes in cerebral blood flow or metabolism
between rTMS responders and non-responders. For example, one early study found lower
baseline glutamate concentrations in DLPFC in the rTMS responder group, that increased over
the course of treatment (Luborzewski et al, 2007). Higher baseline DLPFC, dmPFC, and rostral
92
ACC metabolism on fluorodeoxyglucose(FDG)-PET have been correlated with better response
to once-daily, and to accelerated 5-times-daily DLPFC-rTMS (Baeken et al, 2009; Li et al,
2010b). DLPFC and VMPFC regional cerebral blood flow (rCBF) have been reported as
predictive of outcomes for both high-frequency left and low-frequency right DLPFC-rTMS
response (Kito et al, 2012a, 2012b). Again, all reported predictors to date are for group-level
rather than individual-level outcomes.
In line with previous findings linking VMN and sgACC hyperactivity, and CEN
hypoconnectivity to antidepressant response, Fox and colleagues found that differences in
resting-state functional connectivity between the DLPFC and sgACC predicted treatment
response to DLPFC-rTMS. Critically, anticorrelated functional connectivity between these two
regions predicted better responses to DLPFC-rTMS (Fox et al, 2012a, 2013b, 2014). Such
anticorrelated functional connectivity between the DLPFC and sgACC has been independently
replicated by other groups as a predictor of outcome (Baeken et al, 2014; Philip et al, 2018).
Similarly, one recent study reported that higher baseline sgACC metabolic activity was
predictive of response to accelerated high frequency left DLPFC-rTMS, and that this
hypermetabolism decreased post-treatment (Baeken et al, 2015).
1.10.4.3 Predictors of Response to dmPFC-rTMS Much less information is available about biological markers of dmPFC-rTMS than is
available about DLPFC-rTMS. Two recent resting-state fMRI studies performed by our group,
however, provide insights into who may best respond to 10 Hz dmPFC-rTMS in TRD.
The first study investigated the response to open-label 10 Hz dmPFC-rTMS in 25
subjects with treatment-resistant MDD (Salomons et al, 2014). The primary aim of the study was
whether resting-state functional connectivity of the stimulation target predicted response to
treatment. A secondary aim of the study was whether resting-state functional connectivity
change was associated with treatment response.
25 treatment-resistant MDD patients (10 male; mean age = 42.6 years, range = 19-70
years) with treatment resistant unipolar or bipolar depression were recruited for the study. The
rTMS protocol consisted of 3000 pulses per hemisphere, at 10 Hz, in 60 trains daily over 20
93
sessions (4 weeks). High baseline resting-state functional connectivity of the dmPFC and a
ventromedial prefrontal and subgenual cingulate region was associated with better treatment
response. Likewise, lower baseline functional connectivity between the dmPFC and right
putamen, right thalamus and right hippocampus/amygdala was associated with better treatment
response. sgACC functional connectivity was also predictive of dmPFC-rTMS treatment
response. High baseline functional connectivity between the sgACC and DLPFC and low
baseline functional connectivity between the sgACC and parahippocampus/amygdala were also
associated with better improvements. Decreased connectivity between the dmPFC and the
bilateral insula, and increased functional connectivity between the dmPFC and the bilateral
thalamus accompanied treatment response. Decreased functional connectivity between the
sgACC and the ventral striatum and middle cingulate cortex also accompanied treatment
response.
As previously reviewed, the cortico-cortical connectivity relationships of the sgACC
appear to be a critical component of antidepressant response. In terms of the cortico-cortical
relationships between the sgACC and the dmPFC more specifically, we postulated that the
interplay between these two regions could be related to goal-directed cognitive control over
affective responses typically associated with these regions (Simpson et al, 2001a, 2001b). Given
the role of the dmPFC in facilitating goal-directed behaviour via reward and punishment
integration (Shackman et al, 2011), the relationship between the dmPFC, the sgACC and clinical
response could be related to a difference in the capacity for executive control over core
emotional functions.
A second study from our our group used a graph theoretical metric of ‘hubness’ in
networks (betweenness centrality) to characterize differences in IBN organization and
architecture between dmPFC-rTMS responders and non-responders (Downar et al, 2014).
Among 47 patients diagnosed with treatment-resistant MDD (unipolar or bipolar) who
underwent 20 sessions of neuronavigated 10 Hz bilateral dmPFC-rTMS, 24 of 47 patients
achieved clinical response, while, of those, 20 met the remission criterion. The distribution of
clinical response on the HAMD was bimodal, indicating a heterogeneous response to dmPFC-
rTMS. Regarding clinical predictors, only three items emerged significant post-correction: the
BDI-II pessimism subscale; the BDI-II loss of pleasure subscale; and the QIDS general interest
subscale. A composite anhedonia scale of these measures was strongly correlated with response
94
(r = -0.61). On graph theoretical analysis of the resting-state fMRI data, responders displayed
significantly lower betweenness centrality in the VMPFC, the only region to survive Bonferroni
correction. Non-responders also showed a distinctively abnormal pattern of whole-brain
connectivity form this VMPFC region to other regions of the SN and VMN, compared to
responders. We interpreted this difference in VMPFC betweenness centrality, in combination
with the clinical anhedonia predictor, as different depression subtypes – one with preserved
hedonic function and responsive to dmPFC-rTMS and another with abnormal hedonic function,
visualized via abnormal functional connectivity and betweenness centrality from the VMPFC.
Characterizing Mechanisms of Treatment Response
Why Characterize Mechanisms of Treatment Response? Identifying the biological mechanisms by which an individual achieves response or
remission from a psychiatric disorder is valuable knowledge for both scientific and therapeutic
reasons. From a scientific standpoint, it is helpful to clarify whether abnormal markers (for
example, IBN structure or function) are state-dependent markers of the current depressed mood
state, or are stable trait-like features that persist during response or remission. For example, a
(hypothetical) finding that low SN integrity pre-treatment does not normalize with either
successful or unsuccessful rTMS treatment would have implications for the mechanisms by with
rTMS treats depressed mood. Thus, understanding the mechanism of treatment response will
allow for the characterization of which structural or functional features normalize as MDD
symptoms remit, and which persist. On a related point, understanding the biological mechanism
of treatment remission could clarify the biological mechanisms in which an individual will
relapse, possibly leading to robust biological predictors of treatment relapse. Additionally, from
a therapeutic and translational standpoint, identification of neural markers that change with
successful by not unsuccessful treatment could help lead to new treatments that might be more
effective in treatment non-responders in future.
95
IBN Changes in Response to Conventional Interventions
1.11.2.1 Network Changes Associated with Improvement in MDD
From currently available literature, changes in abnormal DMN and SN function appear to
accompany antidepressant response to a variety of conventional pharmaco- and psychotherapies;
a relatively recent meta-analysis of PET and fMRI characterizing antidepressant response to
medications highlights this general finding. Delaveau and colleagues demonstrated that
antidepressant response to pharmacotherapies was associated with increases in dmPFC, DLPFC
and VLPFC activity, and decreases in the activity of the amygdala, hippocampus, OFC, and all
regions of the DMN (Delaveau et al, 2011). Using PET, MDD patients treated with either an
SSRI or psychotherapy experienced decreases in sgACC hypermetabolism and increases in
dorsal ACC hypometabolism that correlated with antidepressant improvements (Brody et al,
2001; Drevets et al, 2002). During task-based fMRI, patients who successfully responded to
pharmacotherapies showed a normalization of dmPFC hyperactivity during affective processing
(Bermpohl et al, 2009). Normalized SN hypoactivity during negative mood (Fitzgerald et al,
2008) and incentive reward cues (Stoy et al, 2012), and normalized DMN hyperactivity during a
negative emotion task (Cullen et al, 2016) have been also reported following successful
pharmacotherapy. At rest, increases in dACC activity (Pizzagalli et al, 2001), and normalization
of DMN activity (Andreescu et al, 2013; Posner et al, 2013; Wang et al, 2015) have also been
observed following successful antidepressant intervention. Furthermore, on spectral analysis of
resting-state fMRI, abnormally high low-frequency amplitude fluctuations of the dmPFC and
striatum decreases with response to escitalopram (Wang et al, 2017).
Studies on the mechanisms of response to novel interventions, including DBS and VNS,
report similar mechanisms of response to that of conventional pharmaco- and psychotherapies.
Just as with the correlates of antidepressant response for conventional interventions, sgACC-
DBS responders experience metabolic increases in the DLPFC and dACC, and metabolic
decreases in the sgACC and OFC (Lozano et al, 2008; Mayberg et al, 2005), and decreases in the
amplitude of low-frequency fluctuations in the sgACC (Argyelan et al, 2016). DMN connectivity
is also modulated by VNS, such that increases in ACC and PCC resting-state functional
connectivity correlated with clinical improvement in active, but sham VNS (Fang et al, 2016).
96
1.11.2.2 Network Changes Associated with Improvement in OCD
SN and VMN corticostriatal structural and functional connectivity changes have been
linked to symptomatic OCD improvement. Conventional pharmacotherapies normalize ACC
corticostriatal or basal ganglia hyperconnectivity (Anticevic et al, 2014; Beucke et al, 2013;
Rauch et al, 2006), and have been shown to alter striatal and thalamic gray matter volume
(Atmaca et al, 2016; Hoexter et al, 2012). CBT-related symptom improvement has been
correlated with increases in OFC gray matter volume (Huyser et al, 2013). Symptomatic
improvement in these cases has been attributed to striatal and thalamic reductions in glucose
metabolism (Zuo et al, 2013). In DBS cases, symptomatic improvement was correlated with
decreases of dACC-ventral striatal hyperconnectivity (Figee et al, 2013). Examining the
complementary causal evidence of lesion studies, disrupting the structural integrity of the dACC
via cingulotomy causes improvement in some, but not all, cases of treatment-resistant OCD
(Dougherty et al, 2002).
1.11.2.3 Network Changes Associated with Improvement in AN and BN
Few studies to date have examined neural correlates of treatment response in AN or BN.
One systematic review reported that nodes of abnormal gray matter volume may normalize with
successful interventions, although there is substantial heterogeneity in existing publications (Van
den Eynde et al, 2012). Many other studies report neural changes associated with successful
weight restoration. Such studies report normalized nucleus accumbens and anterior insula
activity in response to the unexpected receipt of rewards in weight-restored AN (DeGuzman et
al, 2017), and changes in visual processing regions for self-images during self-perception
(McAdams et al, 2016). Similarly, abnormal delay discounting performance and abnormal
ACC/striatal activity normalizes after weight restoration in AN (Decker et al, 2015). However, it
is unclear whether structural or functional changes in response to weight restoration alone reflect
true psychiatric improvement, or rather metabolic and tissue-composition changes arising from
restored weight gain from a state of starvation.
97
Mechanisms of Clinical Response to DLPFC-rTMS Identifying and describing the biological mechanisms of rTMS treatment response is
critical to determining how to best optimize treatment parameters to improve further treatment
outcomes for non-responders. Unfortunately, there is limited evidence on the biological effects
of a full course of DLPFC-rTMS (as opposed to a single experimental session) in healthy
controls and psychiatric populations. Compounding this problem, the substantial variability of
rTMS protocols across clinical trials further hinders the discovery of reliable mechanisms of
response. Two recent publications review current knowledge regarding the biological
mechanisms of high-frequency left DLPFC-rTMS in TRD (Anderson et al, 2016; Noda et al,
2015). To summarize their findings, a number of studies have investigated the mechanism of
rTMS-induced clinical response on the following items: molecular factors, including
neurotransmitters and BDNF, electrophysiological factors, cerebral blood flow and metabolic
factors, and brain structure and function. The effects of DLPFC-rTMS in TRD on these measures
are inconsistent across individuals, and there are very few studies investigating the effects of
rTMS that characterize response. The literature has not yet achieved consensus on which
biological effects of a full course of rTMS are critical to treatment response, and which are
present but peripheral the mechanisms of treatment response in TRD; still less information is
available regarding treatment mechanisms for disorders other than TRD. Findings to date on
these issues are summarized below:
Effects of DLPFC-rTMS on Molecular Factors. There is some consistent evidence that the mechanism of DLPFC-rTMS in TRD involves
changes in concentrations of glutamate. Three studies have reported that glutamate levels in the
left DLPFC and ACC increase in treatment responders following 10 Hz left DLPFC-rTMS
(Croarkin et al, 2016; Luborzewski et al, 2007; Yang et al, 2014). Yang et al. also reported
significantly increased choline levels in the DLPFC following DLPFC-rTMS that was specific to
responders (Yang et al, 2014). Regarding BDNF, responders experience significant increases in
plasma BDNF levels relative to non-responders following 10 sessions of 20 Hz left DLPFC-
rTMS. Taken together, it appears that TRD responders to rTMS experience increased local and
plasma levels of neurotransmitters and factors that are related to neuronal plasticity and LTP.
98
rTMS may also induce symptomatic improvements via the release of other
neurotransmitters, such as dopamine and serotonin. rTMS induces striatal dopamine in rats
(Kanno et al, 2004; Zangen and Hyodo, 2002), and both dmPFC- (Cho et al, 2015) and DLPFC-
rTMS (Strafella et al, 2001) release striatal dopamine in a localized fashion (in the striatal
regions most closely connected to the cortical site of stimulation) in PET studies of healthy
human volunteers. Some (Pogarell et al, 2006, 2007), but not all (Kuroda et al, 2006, 2010;
Miniussi et al, 2005), studies report that DLPFC-rTMS increases striatal dopamine in patients
with TRD.
Effects of DLPFC-rTMS on Electrophysiological Factors. Two studies have reported significant changes on electrophysiological factors due to
DLPFC-rTMS, as measured by EEG and MEP, in treatment responders versus non-responders.
rTMS responders experience significant decreases in motor excitability, as measured by TMS-
evoked MEPs, following 10 sessions of 20 Hz DLPFC-rTMS (Bajbouj et al, 2005). On EEG,
prefrontal theta cordance, a quantitative measure related to the absolute and relative power in a
frequency band, significantly increases in DLPFC-rTMS responders relative to non-responders
(Ozekes et al, 2014). In sum, the clinical benefit of DLPFC-rTMS for TRD may be related to
oscillatory power and synchrony in prefrontal theta rhythms or changes in motor-evoked
excitability.
Effects of DLPFC-rTMS on Cerebral Blood Flow. Three publications report significant changes on regional cerebral blood flow in rTMS
responders relative to non-responders. However, the reported results are inconsistent, and this is
likely due to the fact that the treatment stimulation protocols also vary. Teneback and colleagues
reported increases in regional cerebral blood flow in the bilateral IFG and cingulate, but
decreases in the right medial temporal lobe, in responders of 10 sessions of 20 Hz left DLPFC-
rTMS (Teneback et al, 1999). However, Nadaeu et al. reported significant decreases on this
measure in the cingulate, OFC, bilateral insula and right amygdala in high frequency left, or low
frequency right DLPFC rTMS responders (Nadeau et al, 2002). More recently, decreased
cerebral blood flow in the perirhinal cortex was associated with TRD response to 20 sessions of
99
10 Hz left DLPFC (Richieri et al, 2012). Similar to the effects of conventional antidepressants,
sgACC cerebral blood flow significantly decreases after high frequency left DLPFC-rTMS in
responders (Takahashi et al, 2013).
Effects of DLPFC-rTMS in TRD on Brain Structure and Function. An important question concerns the effects of a course of rTMS on brain structure and
function overall, setting aside for the moment whether these effects reliably correlate with
response to rTMS. A number of studies have investigated the average effects of DLPFC-rTMS
on brain structure (gray matter volume, or white matter integrity) and functional connectivity.
Kozel et al. and Peng. et al. recently reported an increase in left PFC white matter integrity in
TRD patients who received active high frequency left DLPFC versus those who received sham
rTMS (Kozel et al, 2011; Peng et al, 2012). However, an earlier publication reported no change
in left PFC volume between active and sham rTMS.
On functional neuroimaging, two studies have reported average changes in brain activity
following active high frequency left DLPFC. One study reported that rostral ACC activity and
mOFC-ventral striatum connectivity increased during a DLPFC-dependent verbal fluency task
following active rTMS (Shajahan et al, 2002). Finally, Liston and colleagues recently reported
that DLPFC-rTMS normalized sgACC hyperconnectivity at rest, and re-established an
anticorrelation in activity between the CEN and DMN (Liston et al, 2014).
Effects of DLPFC-rTMS on Brain Structure and Function. A follow-on question concerns which effects of rTMS on brain structure and function are
apparent in responders but not in non-responders to treatment in TRD. Regarding this question, a
number of studies have reported changes in gray matter volume or activity associated with
DLPFC-rTMS response. Furtado et al. reported that left amygdala gray matter volume increased
(at trend-level) in DLPFC-rTMS responders compared to non-responders (Furtado et al, 2013).
Lan et al., however, demonstrated that increases in ACC gray matter volume correlated with
DLPFC-rTMS response (Lan et al, 2016).
100
On functional neuroimaging, Fitzgerald and colleagues reported that, during a planning
task, activation the bilateral middle frontal gyrus and left precuneus decreased in low frequency
right DLPFC-rTMS responders, but increased in the left middle frontal gyrus and right IFG in
high frequency left DLPFC-rTMS responders (Fitzgerald et al, 2007). Finally, Baeken et al.
recently reported increases in resting-state functional connectivity between the sgACC and
ACC/dmPFC in responders to accelerated left DLPFC-rTMS (Baeken et al, 2014). A recent
study of DLPFC-rTMS for TRD with comorbid post-traumatic stress disorder found that
response was correlated with decreased connectivity between the sgACC and the CEN (DLPFC),
and between the hippocampus and SN, again signifying the importance of between-network
connectivity in mediating treatment response to rTMS (Philip et al, 2018).
MRI and Resting-State Functional MRI Methods As noted earlier, resting-state functional MRI carries several practical advantages as a
tool for examining the neural predictors and correlates of rTMS response, including the lack of
radiation, ready accessibility, suitability for use in psychiatric populations, and suitability for
examining the behavior of IBNs that are central to psychiatric pathology and rTMS mechanisms
of effect. Yet the validity of resting-state fMRI as a tool for these purposes depends upon what
types of neural activity it serves to index, and under what circumstances it may be considered a
reliable versus an unreliable metric of brain functioning. This next section therefore provides a
concise review of the basic principles of resting-state fMRI physiology, acquisition and analysis.
Blood-Oxygen Level Dependent fMRI Physiology
The brain is a highly-vascularized organ with high levels of metabolic activity. The adult
brain represents approximately 2% of an individual’s body weight, and yet it accounts for over
20% of the body’s metabolic expenditure at rest (Kety and Schmidt, 1948; Raichle and Gusnard,
2002). The brain’s metabolic need stays relatively constant over time, even given the varying
metabolic demands of ongoing mental activity (Shulman et al, 2004; Sokoloff et al, 1955).
However, task/stimulus-evoked fMRI and resting-state fMRI rely on the complex interplay
between brain activity and the ratio of oxygenated and deoxygenated hemoglobin in the blood.
101
When ensembles of neurons in a given brain region become active, local vasodilation occurs,
increasing local blood flow and altering the concentration gradients of oxygenated and
deoxygenated hemoglobin between the capillaries and local tissue. Deoxyhemoglobin is a
paramagnetic substance, whose presence in a strong magnetic field produces subtle local field
distortions and inhomogeneities. The resultant changes in the spin resonance properties of local
hydrogen nuclei, and thus in the brightness of the signal intensity on certain types of MRI image,
is known as the blood oxygen-level dependent (BOLD) hemodynamic response.
To examine this point in slightly more detail, BOLD fMRI capitalizes on the intrinsic
properties of hydrogen (protons in the nuclei, 1H) in the presence of an applied magnetic field. 1H nuclei possess a property known as ‘spin’, which although not necessarily equivalent to the
spin of a macroscopic object, can nonetheless be treated similarly, can be treated similarly from
the perspective of mathematics and physics. The nuclear spin of atoms differs by element, and so 1H is an ideal choice for the study of organic tissue given its abundance in water and fat (Huettel
et al, 2004). Protons also have a magnetic moment, meaning that in the presence of a strong
magnetic field (typically 3 T for MRI, called the B0), their spins will act as if precessing around
the local magnetic field lines, and thereby creating a net magnetization vector preferentially
aligning with the longitudinal plane of B0. The spin precession frequency is proportional to the
strength of the magnetic field, and corresponds to radio-range frequencies of electromagnetic
radiation (e.g., MHz range). For this reason, protons can readily absorb energy from a
radiofrequency pulse at the rate at which protons precess (known as the Larmor frequency),
causing the magnetization vector of protons to ‘flip’ to transverse plane, which is anti-parallel to
the magnetic field of the B0 and is subsequently of higher energy but more unstable. When the
radiofrequency pulse terminates, the protons begin to emit the energy absorbed from the
radiofrequency pulse back to the ‘spin lattice’ of surrounding nuclei, and return to precessing
about the more stable longitudinal plane. This means that the magnetization vector generated by
the protons in the presence of the B0 returns to the longitudinal plane from the transverse plane.
T1 relaxation refers to amount of time for 63% (1-1/e) of protons to revert to the longitudinal
plane, and is a constant that differs by tissue type due to the mobility of atoms within the
molecule it comprises, which determine the rate at which the RF-energized protons can shed
their energy back to the spin lattice of surrounding protons. T2 relaxation refers to the amount of
time for the magnetization vector in the transverse plane to return to 37% (1/e) of its original
102
value (before the radiofrequency pulse). The value of T2 relaxation depends on rate at which the
precession of protons begin to de-phase after the radiofrequency pulse, and is again tissue-
specific – depending in part on local field inhomogeneities that cause the Larmor frequencies of
neighbouring protons to fall out of phase with one another slowly or rapidly, depending on tissue
type.
fMRI images have a contrast sensitive to T2* decay, which relates not only to spin de-
phasing related to random interactions between neighbouring protons (T2), but also local field
in-homogeneities (referred to as T2’). BOLD fMRI capitalizes on the fact that oxygenated and
deoxygenated hemoglobin display different magnetic properties – oxygenated hemoglobin is
diamagnetic while deoxygenated hemoglobin is paramagnetic in the presence of an external
magnetic field (Pauling and Coryell, 1936). In other words, deoxygenated hemoglobin interferes
with the local field homogeneity of another magnetic field, such as the B0, which therefore
decreases the overall intensity of T2*-weighted signal from that voxel (Poldrack et al, 2011).
The end result is that more oxygenated blood (with low concentrations of deoxyhemoglobin)
appears brighter on T2* images, while less oxygenated blood appears darker. During neural
activity, local vasodilation creates a rush of oxygenated hemoglobin, which then increases the
local field homogeneity and the intensity of the local T2* signal collected. Fast MRI gradients
can acquire a low-resolution image slice in 60-80 ms, such that a single whole-brain BOLD
image requires 2-3 seconds to acquire (known as the repetition time; TR).
The time course of the BOLD response has been described in detail elsewhere (see
(Poldrack et al, 2011)). Briefly, the BOLD response function has three components: the initial
dip in signal intensity, a slow increase to peak signal intensity, and the post-stimulus undershoot.
First, the initial dip refers to an initial decrease in T2*-weighted intensity within the first 1-2
seconds of stimulus onset. Some, but not all, fMRI studies have reported an initial dip, and it is
thought to be related to initial metabolic consumption prior to vasodilation (Brown et al, 2007).
Because the initial dip is not consistently observed, most omit it from statistical analysis and
BOLD modeling (Poldrack et al, 2011). However, more recent analyses of BOLD response
variability from trial-to-trial reported that the initial dip is reliably observable (Watanabe et al,
2013), and can vary by cortical layer under high-field (7 Tesla) fMRI (Siero et al, 2015). Second,
a slow increase in local signal intensity occurs as vasodilation increases local blood flow. As a
result of this cerebral blood flow change, and an influx of oxygenated hemoglobin in local
103
capillaries, increases in local field homogeneities cause increases in T2* signal intensity,
reaching to a peak intensity within 4-6 seconds of stimulus onset (Poldrack et al, 2011). Some
studies have reported substantial variability in the time it takes reach peak signal intensity, with
BOLD response peaks varying between 6-11 seconds across regions within the same subject
(Kruggel and von Cramon, 1999). The slow rise to peak signal intensity is thought to be due to
the sluggish replenishment of cerebral blood flow from arteries to local capillaries in response to
a stimulus (Logothetis, 2003). This signal increase is very small in relative terms – typically the
difference in signal between task and control conditions is less than 5% for paradigms involving
sensorimotor paradigms, and between 0.1 and 0.5% for cognitive paradigms (Poldrack et al,
2011). After the peak, the signal intensity begins to drop, decreasing below baseline signal
intensity over 10-14 seconds. Interestingly, a recent analysis on the variability in the peak and
post-stimulus undershoot reported significant variability in the signal intensity change of the
peak and the duration of the post-stimulus undershoot dependent on the depth of the cortex and
the stimulus duration (Siero et al, 2015).
It is currently thought that the changes to local cerebral blood flow in response to
neuronal activity deliver a substantial oversupply of oxygen to the local tissue compared to its
actual increased demand (or else no localized increase in oxygen concentration could be
visualized). This suggests that the canonical BOLD response could be due to factors other than
an increase in metabolic need related to neuronal activity. Reviewed in detail elsewhere, ongoing
theories suggest that changes in regional blood flow are mediated by astrocytes in additional to
neurons, perhaps as in relation to non-neuronal metabolic processes, or as a means to remove
chemical or thermodynamic waste that results from brain activity (Attwell et al, 2010; Heeger
and Ress, 2002; Raichle and Mintun, 2006). It is also possible that increases in BOLD are related
other aspects of aerobic metabolism, including glycolysis, and glial recycling of glutamate
following neuronal activity (for a review, see (Heeger and Ress, 2002; Raichle and Mintun,
2006). For example, slow astrocytic calcium dynamics following neuronal activity are correlated
with BOLD activity in mice, rats, and ferrets (Gurden, 2013; Petzold et al, 2008; Schulz et al,
2012; Schummers et al, 2008).
Numerous studies over the last three decades have established that the BOLD response is
related to electrophysiological signals related to neuronal activation, both in mice (Ogawa et al,
1990) and in humans. One seminal study by Logothetis and colleagues compared the local field
104
potentials of spiking activity in primates with visual cortex fMRI signal change to a visual
stimulus. They found that the largest fMRI signal changes were observed in areas that displayed
local field potential changes (Logothetis et al, 2001). Later studies of the BOLD response in cat
visual cortex demonstrated that these BOLD and local field potential changes were specific to
increases in gamma power (Niessing et al, 2005). Early human fMRI studies report similar
results – in one study, occipital fMRI signal increases were correlated to a visual stimulus,
further corroborating the importance of the relationship between the BOLD response and
neuronal activity (Belliveau et al, 1991; Kwong et al, 1992). More recent studies have used
ECoG to characterize the neural basis of the BOLD response. For example, as changes to local
field potential in animal models, BOLD activity correlates with the ECoG gamma oscillatory
power (He et al, 2008; Nir et al, 2008) associated with local neuronal activity (Hermes et al,
2012).
While it appears that LFPs and other measures that quantify neuronal activity of
populations of neurons, the relationship between the neuronal activity of individual neurons and
BOLD activity is not well understood. One study demonstrated in macaque neurons that only a
small subpopulation (~16%) of cortical neurons correspond with the BOLD response, meaning
that fMRI and the BOLD response may not reflect all of the true neuronal activity induced by a
task condition (Heeger and Ress, 2002). However, optogenetically-induced activity in the mouse
cortical layer V neurons increases local BOLD signal (Kahn et al, 2011, 2013).
Resting-State Functional MRI
Conventional task-/stimulus-based fMRI studies rely on minute differences in signal
intensity between task-induced brain activity versus a control condition. rs-fMRI, however, aims
to capture spontaneous neural activity in the absence of overt and experimentally-induced
responses (Snyder and Raichle, 2012). rs-fMRI offers an easy-to-implement complementary
technique to task-based fMRI, in which fMRI image volumes are collected in the absence of a
task condition. In a rs-fMRI study, participants are typically asked to stay still, let their mind
wander, and to try to stay awake. Resting-state scans are either collected with the participants’
eyes open or closed; differences in connectivity strength can be observed in primary sensory
networks such as the auditory and visual networks, and cognitive networks including the default
105
mode and attention networks, depending on the resting condition (eyes open versus eyes closed
versus eyes fixated) (Patriat et al, 2013). rs-fMRI studies are often considered logistically
simpler to implement in patient populations, particularly in patients with psychiatric disorders
that may render accurate task performance more challenging. he ease of implementation for rs-
fMRI explains in part its widespread presence as an investigational tool for studying whole-brain
neural function in patient populations.
As discussed in Section 1.12.1, task-evoked fMRI activity has a long history evidencing
its electrophysiological underpinnings. Resting-state fMRI activity is also most closely
associated with gamma power (50-100 Hz) (Fox and Raichle, 2007; Schölvinck et al, 2010,
2013) and infraslow activity (<0.1 Hz) (Lu et al, 2016). Spontaneous gamma fluctuations in
monkey visual cortex, as measured by LFP, correlate with spontaneous fluctuations of rs-fMRI
signal (Shmuel and Leopold, 2008). In humans, spontaneous gamma oscillations correlate
between brain regions that are highly functionally connected on rs-fMRI (Nir et al, 2008);
conversely, anticorrelated networks on rs-fMRI, such as the DMN and CEN, show similar
anticorrelations in ECoG gamma power (Keller et al, 2013). Studies of intracranial EEG IBNs
rs-fMRI connectivity also suppor the idea that IBNs are sustained by synchronous increases in
gamma power that reflect increased local spiking in nodes of IBNs (Logothetis et al, 2001;
Manning et al, 2009; Mukamel et al, 2005; Nir et al, 2007; Ray and Maunsell, 2011). Resting-
state IBNs are also related to infraslow cortical potentials (<0.1 Hz) (He et al, 2008) and have
been found to be more tightly correlated to spontaneous fluctuations in brain activity relative to
gamma (Lu et al, 2016). Spontaneous fluctuations in infraslow LFPs using EEG and MEG have
been shown to be related to spontaneous fluctuations in rs-fMRI (Hiltunen et al, 2014).
Spontaneous changes in cerebral blood flow are also tightly coupled with infraslow
ECoG fluctuations (Golanov et al, 1994). Spontaneous neuronal infraslow activity is attenuated
by voltage-gated sodium channel or glutamate receptor antagonists (Chan et al, 2015).
Spontaneous fluctuations in infraslow activity are also associated with apical dendritic
(Birbaumer et al, 1990; Mitzdorf, 1985) depolarization, suggesting that such activity contributes
to neuronal activity and therefore the BOLD signal (as reviewed by (Raichle and Mintun, 2006)).
However, widespread spontaneous changes in BOLD signal have been correlated with recorded
activity from single neurons in some (Shmuel and Leopold, 2008) but not all studies (Schölvinck
et al, 2013). It has therefore been proposed that spontaneous BOLD fluctuations are of neuronal
106
origin, and that non-neuronal factors such as respiration and cardiovascular factors (Birn et al,
2006; Shmueli et al, 2007; Wise et al, 2004) contribute to variability in this signal. Interestingly,
patterns of aerobic and anerobic metabolism differ in sensorimotor versus association cortices,
which might contribute to differential properties of IBN coupling and BOLD connectivity
(Vaishnavi et al, 2010).
rs-fMRI Preprocessing
The data generated from resting-state fMRI is inherently noisy, and is therefore
associated with a low signal-to-noise ratio (Biswal et al, 1995) and variable test-retest reliability
that is dependent on the acquisition parameters (for example, amount of scan time or TR) and
preprocessing techniques (Bennett and Miller, 2010). The time series of a rs-fMRI scan acquired
from each voxel represents a combination of ‘true’ physiological/neural signal, noise related to
participant motion, physiologically-induced noise from cardiac and respiratory sources, scanner
instabilities and drift, and random noise fluctuations. Aspects of these confounds can create
spurious correlations or mask neuronally-derived functional connections in the time series of
brain regions. Further complicating this issue is the fact that there is no ‘ground truth’ from
which one can model resting-state signal, and that the changes in ‘true’ resting-state signal are
very small. Consequently, one objective of resting-state fMRI preprocessing is, as best we can,
to remove data-inherent cofounds.
One major challenge to rs-fMRI preprocessing is that a consensus ‘gold-standard’
preprocessing pipeline for resting-state fMRI does not yet exist (Caballero-Gaudes and
Reynolds, 2017; Craddock et al, 2013), and there is considerable debate on which preprocessing
steps to include, and in what order. The decisions made about which preprocessing steps to
include, and in what order, can potentially impact the test-retest reliability of functional
connectivity and other measures of network strength or architecture (Zuo and Xing, 2014).
Resting-state fMRI pipelines vary substantially from study to study, but a number of
preprocessing steps are typically performed.
One often-used initial preprocessing step is to account for the temporal lags inherent
during the acquisition of the slices in a functional volume. The TR, the time it takes to collect
107
one volume (3D image) of the brain, is in the order of seconds, and so data from slices collected
at the beginning of the stack of slices comprising an image volume represent a different time and
location in the brain than data collected from later slices. One technique to mitigate the impact of
slice timing is to acquire successive slices in an interleaved manner. Additionally, slice-timing
correction during preprocessing aims to address this mismatched timing of slice acquisition by
interpolating voxelwise signal intensity data of each slice given some reference slice (typically in
the middle of the volume) (Craddock et al, 2013). While slice-timing correction is often
recommended for fMRI data, one study investigating its effects on rs-fMRI found that this
preprocessing step had a minimal effect on functional connectivity values, especially if rs-fMRI
volume data is collected in an interleaved fashion (Wu et al, 2011).
Two other commonly-implemented preprocessing steps are to spatially normalize each
individual scan to some template, and to spatially smooth the data. Both steps aim to increase the
reliability and generalizability of results by allowing for individuals’ scans of to be statistically
compared despite inter-individual variations in neuroanatomy (Mikl et al, 2008). Functional
scans are often first linearly co-registered to the participant’s own high resolution anatomical
scan, and then non-linearly normalized to a standard atlas such as the Montreal Neurological
Institute’s (MNI) template brain, which is an average of 152 non-linearly transformed high
resolution anatomical scans (Maintz and Viergever, 1998). Furthermore, smoothing improves the
functional correspondence of brain areas across individuals, especially as image co-registration
and normalization distorts the anatomical location of voxels to conform to the template image
(Worsley et al, 1996). Spatial smoothing is commonly performed using a Gaussian kernel (often
full-width, half maximum [FWHM]) about 1.5-2 times the voxel size acquired (thus, typically 6-
12 mm) (Bennett and Miller, 2010).
One of the largest sources of noise is head motion (Caballero-Gaudes and Reynolds,
2017) which generated strong signal fluctuations that are correlated in time between distant areas
of the head; left uncorrected, these correlated fluctuations can create spurious patterns of
apparent functional connectivity between distant brain regions in rs-fMRI data (Van Dijk et al,
2012; Power et al, 2014; Satterthwaite et al, 2013). Head motion is problematic for three
reasons: first, motion misaligns the brain between volume acquisitions (Craddock et al, 2013);
second, fMRI signal intensity derived from different tissues will change if the slice composition
108
changes due to movement; and third, fMRI signal intensity could drastically change due to
residual magnetization from prior slice excitations (Friston et al, 1996).
The first step to removing confounds related to head motion is to compute affine
transformations of each functional volume to some reference volume (typically the middle
volume in the scan) (Cox and Jesmanowicz, 1999; Friston et al, 1995; Jiang et al, 1995). More
recent motion correction algorithms leverage the spatial resolution acquired in the T1 anatomical
scan (Bhagalia and Kim, 2008; Ferrazzi et al, 2014; Kim et al, 1999), or perform slice-wise
motion correction to improve accuracy (Beall and Lowe, 2010; Zotev et al, 2012). The resultant
transformation from initial motion correction outputs a time series of the magnitude and
direction of required motion adjustments for each of the 3 translational and 3 rotational
directions. These time series can be used subsequently to remove temporally associated signal
fluctuations, using a regression analysis (Caballero-Gaudes and Reynolds, 2017). Nonlinear
expansions of each of these six-time series are also often included in this regression, most
commonly the first derivative of each time series. This step serves to remove spin history related
aspects of motion (due to prior slice excitations) (Friston et al, 1996).
Unfortunately, modeling and regressing movement-related confounds does not
completely remove motion-generated confounds (Power et al, 2012; Satterthwaite et al, 2012),
particularly ‘head jerks’ (Caballero-Gaudes and Reynolds, 2017). One way to mitigate these
issues is to remove volumes corrupted by significant motion; this process is called volume
censoring, or ‘scrubbing.’ There are two different ways to accomplish this step: first, through
volume removal and data interpolation the adjacent to the corrupted volume; and second, by
adding null regressors to an individual-level (first-level) general linear model, specifying
volumes in the time course one wishes to censor from any subsequent statistical analysis
(Lemieux et al, 2007; Satterthwaite et al, 2013; Yan et al, 2013).
There are also different techniques to identify problematic volumes, such as computing
their Euclidean norm (Jones et al, 2010), or framewise displacement (Power et al, 2012). In these
techniques, volumes that reach some arbitrary threshold of movement are subsequently censored.
While scrubbing is found to increase the signal-to-noise ratio and improve clarity of results
(Aurich et al, 2015; Power et al, 2012; Satterthwaite et al, 2013; Yan et al, 2013), removing
volumes also results in a reduction in the temporal degrees of freedom (Caballero-Gaudes and
109
Reynolds, 2017). Because of this, and because scrubbing typically identifies high frequency
confounds like abrupt head movements (Caballero-Gaudes and Reynolds, 2017), these methods
do have the potential to bias results, and in particular to affect measures related to temporal
dynamics (Craddock et al, 2013). One recently developed alternative is a censoring algorithm
that identifies wavelets of motion-based noise, rather than single spikes or outliers (Patel et al,
2014).
Another source of noise stems from physiological sources, such as cardiac pulsations and
respiration (Birn et al, 2006; Biswal et al, 1996). Cardiac function imposes pulsatile motion in
the brain via its pervasive network of blood vessels, while respiration and the subsequent
movement of the chest and abdomen can cause additional movement artifact, as well as localized
changes in magnetic susceptibility in certain head regions, with resultant fluctuations in signal
intensity (for a review see (Birn, 2012)). These confounds can once again cause spurious
correlations and anticorrelations, or mask ‘true’ neuronal signal in functional connectivity results
(Shmueli et al, 2007).
The most rigorous way to remove such confounds is to simultaneously measure the
participant’s heart rate via a pulse oximeter and respiratory rate using a chest bellows during the
fMRI scan, and include these time-series as null regressors or process them through signal-
adjustment algorithms like “RETROICOR” (Birn et al, 2006; Biswal et al, 1996; Glover et al,
2000; Shmueli et al, 2007). However, one alternative to measuring and regressing out
physiological confounds is to use non-neuronal signal derived from white matter and
cerebrospinal fluid as proxies for cardiac and respiratory noise. Averaged time series from voxels
of these regions are used as null regressors (Anderson et al, 2011; Hallquist et al, 2013; Jo et al,
2010; Power et al, 2012; Weissenbacher et al, 2009; Yan et al, 2013). The temporal derivatives
of these regressors are also included to maximize the impact of denoising (Fox et al, 2005;
Power et al, 2014; Satterthwaite et al, 2013). One limitation of this technique is that it does not
account for spatial variability in the time course of signal fluctuations in white matter and
cerebrospinal fluid (Caballero-Gaudes and Reynolds, 2017). Consequently, principal
components-based approaches like ‘aCompCor’ have been implemented to identify orthogonal
components of noise to use as null regressors; this technique allows for different timecourses of
signal fluctuation in different regions of cerebrospinal fluid and white matter, and has been
110
shown to be superior to simply regressing the mean time series of the entire white matter and
cerebrospinal fluid compartments (Behzadi et al, 2007a; Chai et al, 2012).
“True” resting-state signals that is associated with neuronal/synaptic acitivty is typically
considered to have the highest power at low frequencies, estimated at approximately 0.01 to 0.1
Hz (Cordes et al, 2001). Bandpass filtering is commonly applied to remove frequencies outside
of this band, including sources of noise like scanner drift (< 0.01 Hz), respiratory (0.1 to 0.5 Hz)
and cardiac confounds (0.6 to 1.2 Hz), and ‘aliasing’ of neuronal signal given the low sampling
rate of fMRI (Cordes et al, 2001). More recently, some have suggested that true neuronal sources
of resting-state fMRI signal may also lie below the 0.01 Hz lower limit and above the 0.1 Hz
upper limit (for a review see (Chen et al, 2017)); however, less is known about the nature and
quality of these signals, and how they relate to the physiological underpinnings of rs-fMRI
(Boubela et al, 2013; Boyacioglu et al, 2013; Chen and Glover, 2015; Niazy et al, 2011).
Furthermore, the width of a given bandpass filtering kernel can drastically alter the test-retest
reliability of functional connectivity measures (Liang et al, 2012) For this reason, most
preprocessing algorithms currently employ a bandpass filter in the range ~0.01-0.1 Hz.
One preprocessing step subject to considerable debate is whether to implement global
signal regression (GSR). GSR involves taking the whole-brain average signal intensity time
series and using it as a null regressor; this technique is intended to improve the spatial specificity
of functional connectivity (Fox et al, 2009) and increase functional connectivity strength in
certain analyses (Chang and Glover, 2009; Weissenbacher et al, 2009). However, there are a
number of critical issues associated with GSR. First, the global signal is posited to consist of a
spatially non-homogeneous combination of motion and respiratory noise (Power et al, 2017), and
neural signal (Van Dijk et al, 2010; Murphy et al, 2009). For example, one electrophysiology
study found that the global signal significantly correlated with the neural signal of gray matter
(Schölvinck et al, 2010). Second, some studies have found that GSR negatively impacts results
by reducing the reliability of findings (Liang et al, 2012), altering individual variability on
functional connectivity measures (Saad et al, 2012), and making datasets more susceptible to
motion (Jo et al, 2013). Finally, applying GSR essentially de-means signal intensity at the
voxelwise level; this means that GSR imposes a negative bias on the distribution of functional
connectivity strengths by forcing the data to be zero-centred, and therefore runs the risk of
creating spurious anticorrelations (Fox et al, 2009; Keller et al, 2013; Murphy et al, 2009). Even
111
more troublingly, GSR can bias functional connectivity (FC) and resting-state functional
connectivity (rsFC) correlations downwards in an unpredictable and non-uniform way (Saad et
al, 2012, 2013). FC anticorrelations do exist and are reproducible, even without GSR, so there is
much debate on which reported anticorrelations on rs-fMRI are of true neural origin, and which
are artefacts of GSR (Van Dijk et al, 2010; Keller et al, 2013; Shehzad et al, 2009). The current
consensus is that the appropriateness and usefulness of GSR depends on the dataset and the
scientific question (Murphy and Fox, 2017).
Statistical Methods to Characterize IBNs
Once preprocessing is complete, the next step is to characterize each rs-fMRI scan in
terms of the functional relationships between voxels or anatomical regions. There are two main
approaches that can be taken to at this stage of analysis: hypothesis-driven and data-driven.
Some techniques, discussed below, identify patterns of spontaneous BOLD fluctuation in a data-
driven approach, while others attempt to establish the functional connections of regions of
interest (ROIs) based on a priori hypotheses. More recent advances in rs-fMRI analysis harness
multivariate approaches combined with supervised machine learning, while others tackle the
dynamics of spontaneous BOLD fluctuations instead of static correlations to establish
connectivity. Furthermore, analyses can involve univariate or multivariate statistics. The
following section will briefly review these rs-fMRI analysis methodologies.
1.12.4.1 Seed-to-Voxel-Based rs-fMRI Analysis
The simplest and most widely employed technique to establish individual-level statistical
maps of whole-brain functional connectivity is seed-to-voxel-based. This approach begins by
first identifying an ROI relevant to the research question; this “seed” is typically a set of
contiguous voxels that represents an anatomically-specific region. Next, a mean time series is
extracted from the ROI. This step typically involves averaging the time series data of all voxels
within the seed, although the first principal component is sometimes used instead. The resultant
time series for the ROI is subsequently used as a regressor of interest in a general linear model fit
at every other voxel (or ROI) within the brain (for a review see (Lee et al, 2013)). Next, the
112
resultant whole-brain statistical map can be converted to a standardized parametric map, where
the statistic at each voxel represents the degree to which that voxel’s time series is correlated or
anticorrelated to that of the region of interest. The values of this map are typically reported as
“beta” weights (also known as contrast of parameter estimates), or z-scores.
Biswal and colleagues applied such a method in the first rs-fMRI study ever published; in
this study, the time series of the sensorimotor cortex were extracted and found to have a high
temporal correlation with other regions associated with motor function (Biswal et al, 1995).
Seed-based approaches have also been used to identify resting-state functional networks of the
brain. For example, Greicius and colleagues extracted the resting-state time series of the
posterior cingulate cortex, a node of the default mode network (described below), to establish the
existence of a functional network that is consistently active during rest (Greicius et al, 2003).
This resting-state technique has subsequently been applied to identify homologous IBNs in other
mammalian species: a similar topographic pattern for the DMN has been established in the
anesthetized macaque monkey (Vincent et al, 2007). Networks representing sensorimotor and
visual function have also been characterized in the rat using seed-based approaches (Kannurpatti
et al, 2008; Pawela et al, 2008).
A major challenge of seed-to-voxel-based approaches is seed selection as the location,
size, and shape of the ROI can influence which voxels are included in the average time series of
the seed (Margulies et al, 2010). This variation can therefore bias results; however, seed
selection can be optimized using data-driven techniques to identify temporally homogeneous and
anatomically contiguous sets of voxels (Golestani and Goodyear, 2011).
Another major limitation of seed-to-voxel-based approaches is that they can only suggest
bidirectional, correlation-based ‘functional connections’ rather than establishing causal,
directional links of information flow between regions. This means that the directionality of
functional connectivity between brain regions cannot be characterized by seed-to-voxel based rs-
fMRI alone. In contrast, ‘effective connectivity’ describes the directionality of functional
connectivity, most notably by employing techniques like Granger causality (Granger, 1969) that
seek correlations in timeseries that are present at successive temporal lags in one direction but
not in the opposite direction . Effective connectivity techniques have been successfully used to
characterize directions of information flow in resting-state networks like the default mode
113
network (Sridharan et al, 2008; Uddin et al, 2009), and to demonstrate the impact of age on
information flow in those resting-state networks (Stevens et al, 2009).
1.12.4.2 Independent Component Analysis and Dual Regression
Data-driven methodologies offer a way to establish whole-brain connectivity without the
need for an a priori region of interest. An advantage of data-driven approaches is that they make
no a priori assumptions about the spatial or temporal characteristics of brain networks.
Independent components analysis (ICA) (Jutten and Herault, 1991) is one popular method to
decompose a high-dimensional dataset into a lower-dimensional set of statistically independent
(but not necessarily fully orthogonal) spatial or temporal components. These independent
components can be linearly mixed to generate the original data (Beckmann, 2012; Kiviniemi et
al, 2003; van de Ven et al, 2004).
ICA is often applied to resting-state fMRI data because the resultant components
accurately model the spatial distributions of functional brain networks (Beckmann et al, 2005;
Damoiseaux et al, 2006). ICA also requires relatively minimal preprocessing, as some of the
resultant components can be deemed to represent non-neuronal noise based on their spatial
distribution (Margulies et al, 2010). Because ICA can efficiently separates ‘true’ functional
networks from spurious noise based on different spatially-distributed patterns of signal, ICA can
also be used for artifact detection (Feis et al, 2015; Perlbarg et al, 2007; Pruim et al, 2015), and
is occasionally used for task-based fMRI (Long et al, 2013).
‘Group ICA’ is often applied by concatenating the rs-fMRI image series across all
subjects in the dataset, to identify the spatial or temporal distributions of functional networks
emerging across all subjects (Calhoun et al, 2009; Du et al, 2016; Perlbarg et al, 2007; Schöpf et
al, 2010). The components and functional networks generated by ICA have high test-retest
reliability across multiple scan sessions (Chen et al, 2008; Zuo et al, 2010a) (Franco et al, 2009;
Meindl et al, 2010), and the spatially distributed functional networks generated by ICA are
consistent across participants (Damoiseaux et al, 2006). Once group-level ICA-derived
components have been identified, a technique known as dual regression is commonly used to
project the group-level spatial components as ‘whole-brain seeds’ back onto each individual
114
subject’s timeseries to obtain a set of subject-specific components for each individual, which
then allows for statistical comparisons across individual subjects in the dataset as a whole.
Briefly, dual regression involves two steps: first, a spatial regression step to estimate individual-
level temporal dynamics for each ICA component; and second, a temporal regression step to
estimate individual-level functional connectivity for each voxel and for each component (Smith
et al, 2014).
ICA also has a number of drawbacks. First, temporal ICA is computationally intensive,
and as a result this technique is less frequently used in comparison to spatial ICA (Calhoun et al,
2001). Second, the spatial components generated by different ICA algorithms often have poor
agreement (Zuo et al, 2010a). Additionally, ICA is sensitive to model order selection (i.e., the
number of components identified) (Abou-Elseoud et al, 2010; Abou Elseoud et al, 2011), such
that too few components will not reflect true neuronal networks, and too many components
might inappropriately subdivide IBNs too finely into apparently separate networks. Finally, a
major limitation of ICA is the somewhat subjective task of determining which components to
include for subsequent analysis, or to reject as an artifacts (Margulies et al, 2010). More recently,
machine learning approaches such as support vector machines have been trained on ICA
component data in the attempt to automate the identification of meaningful resting-state
functional networks (for example, (Wang and Li, 2015)).
1.12.4.3 Regional Homogeneity
The rs-fMRI analysis techniques reviewed thus far generally rely on correlations between
signals in at least two voxels or regions, meaning that they are less well-suited to measuring
brain activity in a voxelwise manner (as is possible, for example, with FDG-PET). Recently, a
series of newer methods have been devised that enable voxelwise analysis of rs-fMRI timeseries.
One way to characterize local fluctuations of a single voxel or brain region is by assessing the
synchrony of the local BOLD signal, or regional homogeneity (ReHo). ReHo calculates the
temporal synchrony between voxels of a given cluster (Zang et al, 2004). Kendall’s coefficient
concordance is used to measure the intra-cluster temporal homogeneity (Baumgartner et al,
1999). ReHo is associated with BOLD oscillations between 0.02-0.04 Hz in the cortex, and a
wide range of higher or lower frequency BOLD oscillations in limbic and subcortical regions
115
(Song et al, 2014), although other studies have reported that ReHo is not associated with cortical
gamma-band oscillations but local field potentials of lower frequency bands (unlike the BOLD
response, although IBNs can be replicated in multiple fMRI frequency bands (Gohel and Biswal,
2015)) (Canolty and Knight, 2010; Siegel et al, 2012; Wang et al, 2012b).
From an IBN perspective, the voxels within a given node/brain region of an IBN will
tend to have high local temporal synchrony. For example, nodes of the DMN and other networks
are reported to have high ReHo, meaning that in the case of the DMN, the voxels within the
mPFC, PCC and IPL have high within-cluster temporal concordance (Long et al, 2008). ReHo
measures have also been linked to variations in cognition and behaviour. For example, ReHo in
regions related to food reward, including the OFC, AI and DLPFC, significantly differs between
healthy controls exhibit unrestricted versus restricted eating (dieting) (Dong et al, 2014). ReHo
also differs between happy and unhappy healthy controls, such that unhappy individuals had
significantly decreased ReHo in DMN regions and increased ReHo in CEN and SN regions (Luo
et al, 2014). ReHo is sensitive to the magnitude of spatial smoothing, as a larger Gaussian
smoothing kernel increases the spatial extent of local synchrony (Zang et al, 2004). ReHo is also
sensitive to temporal bandpass filtering, as limbic or subcortical ReHo may be related to BOLD
oscillations outside of bandpass filters used for other rsFC analyses (Song et al, 2014).
1.12.4.4 Amplitude of Low Frequency Fluctuations
Another method to characterize local fluctuations in activity in a voxelwise manner is to
characterize low frequency oscillations of spontaneous BOLD activity in each voxel’s timeseries
in terms of its amplitude (Amplitude of Low Frequency Fluctuations; ALFF). ALFF is proposed
to represent the ‘regional intensity’ of resting-state signal, and is measured voxelwise as the
square power root of the power spectrum in the low-frequency (BOLD) range (Zang et al, 2007).
However, it is believed that ALFF is susceptible to non-neuronal artifacts, as the power of low
frequency BOLD fluctuations decreases with respiratory hypercapnia (Biswal et al, 1997; Zuo et
al, 2010a). An alternative, fractional ALFF (fALFF), assesses ALFF relative to the entire fMRI
frequency range, and is the ratio of ALFF to the power spectrum of the entire computed
frequency-band (Zou et al, 2008). ALFF and fALFF have also been used to characterize IBNs:
for example, healthy controls have high ALFF and fALFF in regions of the DMN, including the
116
PCC, precuneus and mPFC (Zou et al, 2008; Zuo et al, 2010a). However, the relationship
between ALFF/fALFF and more traditional and physiologically well-grounded measures of brain
activity, such as metabolic activity on FDG-PET, remains unclear at present.
1.12.4.5 Graph Theoretical Approaches
Graph theoretical techniques can be used to assess patterns of brain connectivity within
or between networks. These measures assess the functional connectivity structure of the whole
brain in a single analysis, rather than examining the functional connectivity profile of individual
brain networks independently (for a review see, (Bullmore and Sporns, 2009)). In such
approaches, complex brain networks are modeled as a graph, with voxels or regions represented
by ‘nodes,’ and the relationship (e.g., correlation/anticorrelation) between these nodes as ‘edges.’
Nodes of the brain can be represented by ROIs or individual voxels (Martuzzi et al, 2011). Edges
can be bidirectional or directional, meaning that they can convey information about the
directionality of information transfer. The edges can also be un-weighted (meaning that all the
edges in the graph are considered to represent a relationship of equivalent strength and
direction), or weighted (meaning that edges of different values represent different connectivity
strengths or directions) (for a review, see (Wang et al, 2010)). From this graph, metrics can be
calculated that describe the relationships between nodes and to gain insight into the organization
of the entire brain (Reijneveld et al, 2007; Stam and Reijneveld, 2007).
Graph theoretical measures in common use can include: how many edges a node has
(degree); the shortest distance between two nodes (path length); how sparsely or densely clusters
of nodes and edges are organized and how well-connected are the nodes of a network to each
other versus nodes of other networks (sparsity and modularity); how nodes cluster ‘locally’
versus globally (small-worldness); how ‘important’ a node within a network is, based on how
efficiently it is positioned to propagate information between nodes (nodal centrality/efficiency);
or how efficient a community of nodes is based on the ability of the network to propagate
information within nodes of the same network (local efficacy) or across many networks (global
efficiency) (for a review, see (Wang et al, 2010)). Graph theoretical measures are often applied
to resting-state fMRI data to describe the topological architecture of the brain’s resting-state
networks at the spatial and temporal scale (Palaniyappan et al, 2016; Wang et al, 2010). For
117
example, work by He and colleagues has characterized the topological architecture of resting-
state networks (He et al, 2009), such that resting-state networks have higher connectivity to
nodes within their network than they do to nodes outside of their network (high ‘modularity’).
Furthermore, some networks have nodes of high centrality, called hubs, that appear to be
necessary for efficient information flow (Latora and Marchiori, 2001; Margulies et al, 2010).
Deficits in the efficiency of nodes with high centrality has implications in both healthy aging and
neurodegenerative diseases (Achard and Bullmore, 2007; Buckner et al, 2009).
A potential limitation to graph theoretical approaches is how nodes are defined. Nodes
for graph theoretical analyses are often defined by a whole-brain atlas or by parcellation, and as a
result could introduce unwanted biases and substantially alter the network architecture of results
(Butts, 2009). Indeed, many studies have reported that different node selection alters graph
theoretical properties of resting-state networks substantially(Hayasaka and Laurienti, 2010;
Wang et al, 2009; Zalesky et al, 2010). Fortunately, a recent systematic review of test-retest
reliability reported that the reproducibility of several graph theoretical measures was good,
stating that of the 23 studies included in the systematic review, 16 showed reproducibility in the
‘excellent’ range (intra-class correlation > 0.74) (Welton et al, 2015).
1.12.4.6 Pattern Classification Analyses
Pattern classification analyses, including multi-voxel pattern analysis, harness
multivariate statistics to simultaneously take into account the connectivity patterns of multiple
voxels (for a review see (Haynes and Rees, 2006; Norman et al, 2006)). Pattern analyses
typically require the dataset to be divided into a ‘training’ and ‘test’ dataset, and a machine
learning algorithm is subsequently used to identify patterns (features) of brain connectivity that
accurately discriminate between cognitive states and/or a control condition, correlate with
continuous measures, or discriminate patient and control groups (Margulies et al, 2010). One
common type of machine learning algorithm used in multi-voxel pattern analysis is known as a
support vector machine; compared to univariate methods, SVM methods can sometimes achieve
higher prediction accuracy regarding the brain state, while being less sensitive to voxelwise noise
(Chen et al, 2006; LaConte et al, 2005; Mourão-Miranda et al, 2005). In the study of psychiatric
118
disorders, multi-voxel pattern analysis has been successfully used to accurately distinguish MDD
patients from healthy controls using distinct patterns of rsFC (Craddock et al, 2009).
1.12.4.7 Brain-Wide Association Analyses
Brain-wide association studies aim to characterize differences in resting-state networks
between phenotypes from whole-brain rsFC maps of individual voxels instead of ROIs, using an
analytic approach that is similar to that of genome-wide association studies (Cheng et al, 2015).
Given that the brain is comprised of tens of thousands of voxels, techniques that perform voxel-
wise statistics (including brain-wide association analysis) require robust multiple comparisons
correction to reduce the incidence of Type I (false-positive) error. A recent study addressed this
issue in detail, with the authors presenting a multiple comparisons correction tool for voxel-wise
functional connectivity using Random Field Theory (discussed in Section 1.12.6) (Gong et al,
2018). Similar to genome-wide association studies, brain-wide association analyses require a
large sample size to identify brain-wide rsFC variants (Cheng et al, 2015).
In the psychiatric context, brain-wide association analysis has been used to characterize
differences in rsFC in MDD relative to controls (Cheng et al, 2016). In this study, the authors
demonstrate the dissociable patterns of mOFC and lOFC differ in MDD relative to controls, and
that mOFC rsFC related to deficits in reward processing, while lOFC rsFC related to deficits in
non-reward processing (Cheng et al, 2016).
1.12.4.8 Dynamic Functional Connectivity
The aforementioned techniques to characterize brain connectivity (i.e. excluding ReHo,
ALFF and fALFF as typical applications of these techniques quantify regional dynamics) are
‘static’ measures of functional connectivity. This means that they ignore temporal fluctuations in
FC that occur during the scan. Such ‘static’ techniques might not be the optimal approach,
depending on the research question at hand, because the brain’s functional connectivity is
constantly changing. Thus, ‘dynamic’ FC approaches aim to quantify the temporal variability in
FC (Bassett et al, 2011; Cabral et al, 2011; Madhyastha et al, 2015).
119
A common approach of many dynamic FC techniques is know as the sliding window
technique. For this approach, the BOLD timeseries is subdivided into time segments
(“windows”) (Hindriks et al, 2016) of a pre-defined number of volumes. Functional connectivity
is then measured within the first window, often using a bivariate correlation, and then the
measurement is done over and over again, each time sequentially shifted by one TR at a time , to
compute a new time series representing the fluctuations in FC itself over the duration of the scan.
Other methods investigate time-frequency or phase synchronization between pairs of rs-fMRI
timeseries (Chang and Glover, 2010; Pan et al, 2013). As noted earlier, currently available
dynamic FC techniques are sensitive to bias related to preprocessing and residual physiological
noise, such that rigorous preprocessing algorithms are essential to avoid spurious observations
due to motion or physiological noise (Hutchison et al, 2013; Leonardi and Van De Ville, 2015).
A number of statistical strategies have been proposed to quantify dynamic FC, including
seed-based dynamic FC variability, ROI-to-ROI-based FC dynamic variability, and dynamic
ICA (as reviewed by (Preti et al, 2017). ROI-to-ROI-based dynamic FC is a method to establish
dynamic FC between a priori ROIs (Lindquist et al, 2014) and such variability has been recently
shown to reflect human behaviour. For example, Kucyi and Davis reported that FC variability
between nodes of the DMN was associated with the degree of mind wandering in healthy
individuals (Kucyi and Davis, 2014). Seed-based dynamic FC evaluates dynamic FC of a ROI to
every other voxel in the brain; such a technique been demonstrated to replicate IBNs generated
by static FC (Tagliazucchi et al, 2012, 2016). Finally, dynamic ICA incorporates information
generated from sliding windows and spatial-ICA to identify IBN FC variability, and was recently
shown to map DMN variability (Kiviniemi et al, 2011).
Regarding applications in the psychiatric research context, a dynamic FC approach was
recently used to characterize functional abnormalities in MDD relative to healthy controls. In this
study, Kaiser and colleagues demonstrated, using a seed-based approach, that MDD was
associated with less variable dynamic rsFC between the mPFC ROI and the parahippocampal
gyrus and more variable dynamic rsFC between the mPFC and the insula. Resting-state
variability between the mPFC and DLPFC also positively correlated with MDD severity (Kaiser
et al, 2016).
120
1.12.4.9 Inter-hemispheric Connectivity Analyses
Inter-hemispheric connectivity attempts to characterize the FC between corresponding
regions in each hemisphere. One such technique, voxel-mirrored homotopic connectivity,
assesses the FC of anatomically-corresponding brain regions by transforming one hemisphere of
the brain to be anatomically symmetrical and quantifying the rsFC of one voxel and its
contralateral, mirrored counterpart (Gee et al, 2011; Zuo et al, 2010b).
As an example of an application of this method to psychiatric research, Canna and
colleagues applied this technique in a recent study to examine differences in inter-hemispheric
connectivity in AN and BN relative to controls. In that study, AN exhibited less inter-
hemispheric connectivity between mirrored regions of the insula, while BN exhibited less inter-
hemispheric connectivity in the DLPFC and OFC (Canna et al, 2017).
Considerations for Selecting the Optimal rsFC Method
With a large toolbox of statistical analyses for rs-fMRI data, how should one select the
appropriate technique? As proposed by Dunlop and Downar (2017), a number of considerations
arise when selecting an rs-fMRI technique. First, the selected technique should be appropriate to
the research question; for example, in a study with a well-defined region of interest (e.g., a study
applying rTMS to a specific brain region), seed-to-voxel based approaches may be most
appropriate. Second, any inherent assumptions to the technique that could impact the validity of
findings should be discussed; for example, if the technique is highly sensitive to head motion,
and populations A and B show different degrees of head motion, then any reported differences
should be discussed in this context and compensatory analytical strategies should be deployed.
Third, the selected measure should reflect underlying neuronal physiology. For example, the
neurophysiological basis of BOLD power spectral analyses is not well-established, and so the
significance of findings using this measure may be difficult to interpret in a meaningful way.
Fourth, the technique chosen should be ideally a priori shown to have good construct validity
(i.e., the rs-fMRI technique should accurately measure brain function), as well as be reproducible
and reliable. For example, the reproducibility of graph theoretical measures has recently been
reported (Welton et al, 2015) and such measures have been related to neurophysiology via
electrophysiological recordings during seizure activity (Niso et al, 2015; Schmidt et al, 2014).
121
Finally, the technique should ideally demonstrate utility. In other words, the rs-fMRI technique
selected should be able to provide some novel or useful information about human behaviour, its
underlying neurobiological underpinnings, or about a particular clinical population. For example,
simply reporting that a given region shows weaker inter-hemispheric connectivity in population
A versus population B may not be particularly informative, unless that information can be
offered in a context that sheds light on pathophysiology, clinical symptoms, diagnostic or
prognostic markers, or potential treatment strategies.
Assessing Group-Level Comparisons Across Subjects
Once a metric has been chosen, the final stage of rs-fMRI analysis is to assess for group-
level differences between the individual subjects whose scans were acquired in the study.
Individual-level analyses typically generate a statistical parametric map that represents the FC or
other metric of interest for that subject. A second-level (group-level) general linear model is
typically used to generate voxel-wise statistics that could represent the more generalizable
average activation or functional connectivity seen across a group of individuals. Such voxel-wise
statistics could also be used to identify regional differences in activation or functional
connectivity between different groups (such as treatment responders and non-responders), or
correlations in activation to a continuous measure, such as participants’ percent improvement
from their baseline score. In more complex circumstances, a group-level general linear model
incorporating covariates of interest (or non-interest) can also be used to model and/or control for
the effects of confounding categorical or continuous variables (e.g. ANCOVA), such as gender
and sex. The resultant voxel-wise maps from these group-level analyses are commonly
represented as z-scores or beta-weights.
Whole-brain fMRI analysis techniques require some form of correction \to compensate
for the very large number of statistical tests performed across the parametric map as a whole, and
the resultant likelihood of false-positive (Type I) errors even when conservative p-value
thresholds are applied (Benjamini and Hochberg, 1995; Genovese et al, 2002). Such stringent
multiple comparisons correction is essential for the generalizability of fMRI results, because the
whole brain maps used in rs-fMRI typically consist of tens of thousands of voxels, and individual
122
statistical tests are performed at each voxel. At a Type I error rate of p < 0.05, 1 in 20 voxels
would be show apparent significance under the null hypothesis.
A number of methods can be used to correct for multiple comparisons, while at the same
minimizing Type II error (false negatives), including steps to account for the familywise error
(FWE; including Bonferroni correction and random field theory) or using the false discovery rate
(FDR) (Friston et al, 1994). The FWE rate is the probability of making a Type I error despite
accounting for the number of tests performed. The most conservative approach to minimizing
FWE is Bonferroni correction, in which a p-value is considered significant only if the value is
less than the base significance level (α) divided by the number of statistical tests performed.
Bonferroni correction is usually too conservative a multiple comparisons correction
technique for routine use in rs-fMRI, because tens of thousands of statistical tests are required to
compute voxelwise statistics, and spatial smoothing during preprocessing results in voxels and
clusters that are not statistically independent of each other. Consequently, random field theory
and other cluster-based approaches have been developed to address the fact that adjacent voxels
are not statistically independent of each other. The more alike voxels are, the less severe the
Type I error problem, and so correction for multiple comparisons can be performed with a less
stringent divisor. Random field theory corrects whole-brain analyses accounting for the
probability that volumetrically large activation clusters could have occurred by chance, based on
statistical significance of individual voxels (height threshold) and the size of the cluster in
question (extent), under the assumption that noise will follow a Gaussian distribution in space
(thus providing an additional rationale for applying Gaussian smoothing during preprocessing)
(Forman et al, 1995; Friston et al, 1994; Woo et al, 2014). There is an ongoing debate as to
whether random field theory adequately corrects for false positives, and at present, this issue is
not yet resolved (see (Eklund et al, 2016; Kessler et al, 2017; Slotnick, 2017)). Nonparametric
approaches to multiple comparisons correction (e.g., bootstrapping or permutation testing) have
been proposed as an alternative to Gaussian random field theory, thereby potentially offering a
less overly conservative multiple comparisons correction method that to control the false positive
rate (Hayasaka and Nichols, 2003; Nichols and Hayasaka, 2003; Nichols and Holmes, 2002).
Though more computationally intensive, non-parametric methods may become more practical
and even preferred as the cost of computation falls in future years.
123
Summary
In order to address the suboptimal response and remission rates associated with
conventional pharmacotherapy and psychotherapy for mental illness, there is a need for new
therapeutic interventions, as well as reliable, biologically-grounded tools to select the optimal
treatment for achieving remission. As a novel intervention, rTMS has recently emerged to offer
another chance at remission for those who have not responded to conventional psychotherapy
and pharmacotherapy. However, despite 20 years of research into rTMS treatments, response and
remission rates for rTMS still fall well below those of more invasive neuromodulation therapies
for treatment-resistant psychiatric illness, such as ECT. If our ultimate aim is to understand the
biological underpinnings of psychiatric disorders and thereby improve overall remission rates,
then a central research problem is to identify neurobiological predictors and correlates of
response for treatments such as rTMS. fMRI and rs-MRI are uniquely well-positioned to address
this problem, as these techniques are capable of characterizing the neurobiological effects of
rTMS over a course of treatment (the neural mechanisms or correlates of response), and also
characterizing neurobiological differences that might distinguish responders from non-
responders prior to treatment (the neural predictors of response).
When examined via fMRI, brain activity organizes into a set of fairly robustly
reproducible whole-brain functional networks or IBNs, each consisting of regions that are highly
functionally connected, meaning that they activate and deactivate in a correlated fashion, both
during task-evoked and during unconstrained ‘rest’ activity (Beckmann et al, 2005; Sporns,
2011). While the architecture, electrophysiology and brain-wide hierarchy of IBNs are not yet
fully understood, the neuroanatomy of IBNs is thought to reflect the underlying white matter
structure of the brain, and the correlated activity of their component regions is thought to be
sustained by high- and low-frequency electrophysiological oscillations in the coordinated activity
of neuronal populations. Fluctuations in IBN coherence have been linked to specific components
of human perception, cognition, and behaviour, including performance on cognitive control tasks
(Kelly et al, 2008) and impulsivity (Shannon et al, 2011).
Four IBNs may be of particular interest for the study of psychiatric disorders. First, the
DMN is related to internally-generated cognition and self-referential processing (Crittenden et al,
2015; Dixon et al, 2014), including mind wandering (Mason et al, 2007), hippocampal-
124
dependent autobiographical memory retrieval (Addis et al, 2007; Svoboda et al, 2006), spatial
navigation, and thinking about the thoughts of others (Spreng et al, 2009). Second, the SN is
related to cognitive control during goal-directed behaviour, such that nodes of the SN operate in
concert to identify, compare, and filter relevant external sensory information to support one
action choice over another (Pleger et al, 2006; Ploran et al, 2007), before projecting to motor and
premotor regions (often via the dACC) for action initiation (Lamichhane and Dhamala, 2015;
Landmann et al, 2007). Third, the CEN is associated with working memory and cognitive
control, and serves to identify changes in the environment that necessitate the inhibition of an
action or a behavioural adjustment to a different strategy (Dosenbach et al, 2008; Posner and
Petersen, 1990). Finally, the VMN contributes to reward processing, prediction, and reward-
based reversal learning (Boorman et al, 2013; Fellows, 2007; Kringelbach, 2005; Montague and
Berns, 2002), and in generating negative affective states and during emotional appraisal
(Johnstone et al, 2007; Wager et al, 2008). All four of these IBNs possess reciprocal
corticocortical connections between IBNs, as well as CSTC circuits to prepare and implement
planned, goal-directed behaviour (Haber, 2016).
SN dysfunction and its associated cognitive control deficits appear to be a central and
transdiagnostic abnormality across many psychiatric disorders (McTeague et al, 2016). Three
large neuroimaging studies have reported that structural abnormalities of the dACC and AI are
common to many diverse psychiatric disorders (Chang et al, 2018; Goodkind et al, 2015; Wise et
al, 2017). Alongside structural abnormalities of the SN, functional abnormalities of the SN
appear to be a transdiagnostic feature of many forms of mental illness, although there is
substantial heterogeneity in terms of whether this abnormality involves higher versus lower
activity or connectivity of the SN, across individuals and disorders (Kaczkurkin et al, 2017;
McTeague et al, 2017; Shanmugan et al, 2016). In light of this emerging evidence, multiple
‘unifying’ theories of SN-derived psychopathology have been proposed, generally agreeing on
the idea that SN dysfunction may lead to aberrant activity in other networks, resulting in
difficulties integrating salient external or physiological events, as well as difficulties accessing
networks for attention and working memory or self-referential/autobiographical thought. These
structural, functional, and behavioural deficits affecting cognitive control are consequently
apparent across a diverse set clinical disorders, including MDD, OCD and ED.
125
Given the transdiagnostic involvement of the SN in psychiatric illness, therapeutic
techqniues targeting the SN have the potential to achieve clinical benefits across multiple
categories of illness in psychiatry. rTMS is uniquely well-positioned for use as a focal
therapeutic intervention to remodel activity in the SN, as it is thought to induce its therapeutic
effects via synaptic plasticity and neuronal excitability at the local scale, and via modifications to
downstream cortico-cortical, cortico-limbic or cortico-striatal connections at the macroscopic,
whole-brain scale of IBNs. By altering the activity of one node of an IBN, rTMS may be capable
of achieving therapeutic effects via anatomical and functional connections with other nodes of
the same IBN, or connections with related IBNs.
As a network-probe, TMS can focally alter the activity of cortical brain regions to
causally test brain structure and function relationships. TMS and rTMS have been shown to
modulate monosynaptic downstream targets, allowing for the study of not only the stimulated
brain region, but also the network interconnected to that region (Ruff et al, 2009). rTMS
targeting the dmPFC can therefore be expected to modulate the activity of connected regions
such as the dACC and the SN circuitry in general. In healthy controls, excitatory dmPFC-rTMS,
reduces dACC rCBF, releases striatal dopamine in areas connected to medial frontal regions, and
improves cognitive control on behavioural measures (Cho et al, 2015), and (Hayward et al,
2007), thus demonstrating engagement of the target network and its functions. Conversely,
disrupting dACC function using single-pulse TMS or inhibitory rTMS impairs conflict
monitoring and increases errors during a cognitive control task (Duque et al, 2012; Taylor et al,
2007). Such preclinical findings provide a rational for therapeutic use of dmPFC-rTMS in
clinical populations with SN dysfunction.
To date, however, the dmPFC is not the best-studied rTMS target. Instead, the DLPFC is
the most common therapeutic target of rTMS, although this neurostimulatory target may be less
clearly beneficial for a wide range of clinical disorders other than MDD. DLPFC-rTMS does
appear to be most successful for TRD, with current response and remission rates between 50-
55% and 30-35%, respectively (Brunelin et al, 2014; Fitzgerald et al, 2011). However, current
rTMS protocols are not superior to ECT for response or remission, and a number of meta-
analyses have found that the clinical efficacy of rTMS for TRD is inferior to ECT (Micallef-
Trigona, 2014; Xie et al, 2013). For patients with OCD, randomized sham-controlled trials of 1
Hz right DLPFC-rTMS (Prasko et al, 2006) and 20 Hz left DLPFC-rTMS (Sachdev et al, 2007)
126
have reported that active stimulation is not superior to placebo. The most recent randomized
double-blind sham-controlled trial of 10 Hz left DLPFC-rTMS in 47 BN patients reported no
significant improvement in binge-eating and purging relative to placebo (Gay et al, 2016).
dmPFC-rTMS might be a promising alternative to DLPFC-rTMS for individuals with
diverse or complex clinical symptomatology for three reasons. First, numerous meta-analyses
have reported that behavioural, structural and functional deficits of the dACC and SN proper are
present across patients with a wide range of neuropsychiatric symptoms (Chang et al, 2018;
Goodkind et al, 2015; Kaczkurkin et al, 2017; McTeague et al, 2017; Shanmugan et al, 2016;
Snyder et al, 2015; Wise et al, 2017). Second, TMS and rTMS studies targeting the dmPFC have
shown to modulate behaviour on cognitive control tasks related to SN function (Cho et al, 2015;
Duque et al, 2012; Taylor et al, 2007) and alter brain function in the dACC (Hayward et al,
2007) and striatum (Cho et al, 2015). Third, early studies of dmPFC-rTMS have shown that
response and remission rates for TRD are comparable to that of DLPFC (Bakker et al, 2015).
One early study also reported that dmPFC-rTMS also appears to be beneficial for BN, suggesting
that this neurostimulatory target might be a better therapeutic site for a wider range of symptoms
(Downar et al, 2012). Nonetheless, dmPFC-rTMS still appears to be ineffective in a substantial
percentage of patients, leaving much room to further improve the rates of remission.
One potentially fruitful strategy for improving remission rates is to identify which
patients are most likely to benefit from treatment, using reliable biological predictors, or
predictive ‘biomarkers.’ A reliable method for distinguishing treatment responders from non-
responders prior to treatment may spare patients from having to undergo logistically onerous but
futile courses of treatment. Furthermore, if we consider dmPFC-rTMS as a probe as well as an
intervention, then biomarkers that distinguish responders from nonresponders may also shed
light on the heterogeneity of illness within the diagnostic entities of MDD and other psychiatric
disorders. This knowledge, in turn, may help to clarify the various subpopulations that are
suspected to exist in the heterogeneity of nominally unitary diagnostic entities such as MDD. To
date, however, there has been limited progress in identifying reliable predictive biomarkers for
rTMS, or indeed any kind of intervention, for MDD or any other psychiatric disorder.
Identifying the biological mechanisms by which an individual achieves response or
remission from a psychiatric disorder is also valuable knowledge for both scientific and
127
therapeutic reasons. From a scientific standpoint, it is helpful to clarify whether abnormal IBN
structure or function are state-dependent markers or are stable trait-like features that persist
during response or remission. On a related point, understanding the biological mechanism of
treatment remission could clarify the biological mechanisms in which an individual will relapse,
possibly leading to robust biological predictors of treatment relapse. Additionally, from a
therapeutic and translational standpoint, identification of neural markers that change with
successful by not unsuccessful treatment could help lead to new treatments that might be more
effective in treatment non-responders in future.
Grounded in the broader effort to improve remission rates for psychiatric illnesses, a
central problem in current research is to identify reliable biologically-based predictors and
correlates of treatment outcome for our available interventions. It is this central problem that
informs the specific aims, hypotheses, and methods of the studies described in this thesis.
128
Rationale, Specific Aims & Hypotheses
General Aims & Approach The goal of this thesis is to identify transdiagnostic predictors and mechanisms of
treatment response to rTMS over the dorsomedial prefrontal cortex across three categories of
psychiatric disorders. These three aims will be pursued through a set of three studies, in TRD,
OCD, and binge-purge behaviours in eating disorders. In each case, functional MRI and
standard clinical outcome scales will be used to assess the therapeutic effects of dmPFC-rTMS.
In addition, for each of these three patient populations, in addition to the assessment of
therapeutic effects, seed-to-voxel analyses will be conducted on rs-fMRI data acquired pre- and
post-treatment in order to identify neural predictors and correlates of treatment response, to
assess their similarities and differences across diagnostic categories.
Aim 1. To assess the clinical efficacy of dmPFC-rTMS as a treatment for TRD. A
secondary aim is to conduct preliminary assessments of therapeutic effects of dmPFC-
rTMS in OCD and eating disorders.
Approach: Clinical efficacy will be tested using a triple-blind, sham-controlled trial of dmPFC-
rTMS as a treatment for treatment-refractory MDD, and will be assessed using patient-rated
questionnaires and assessor-conducted interviews that quantify MDD symptom severity.
Additionally, two open-label trials of dmPFC-rTMS will be used to test the clinical efficacy of
this intervention for treatment-resistant OCD and BN/AN-BP.
Aim 2. To identify differences in pre-treatment resting-state functional connectivity
between dmPFC-rTMS responders and non-responders across 3 categories of mental
illness (TRD, OCD, and eating disorders).
Approach: Baseline rs-fMRI will be analyzed using a seed-to-voxel based approach to establish
differences in dmPFC functional connectivity between treatment responders and non-responders,
and regions whose baseline rsFC correlate with symptom improvement.
129
Aim 3. To identify pre- to post-treatment changes in resting-state functional connectivity
that accompany dmPFC-rTMS response for TRD, OCD, and eating disorders.
Approach: rs-fMRI will be conducted and the data analyzed at the pre- and post-treatment time
points. A seed-to-voxel based approach will be used to either identify differences in rsFC
change between dmPFC-rTMS responders and non-responders, and to identify regions whose
rsFC change correlates with symptom improvement.
Rationale for a Seed-to-Voxel-Based rsFC Approach As noted above, a variety of methods can be used to analyze resting-state fMRI data.
This thesis will use a seed-to-voxel-based rs-fMRI approach, with the general aim of identifying
transdiagnostic predictors of, and mechanisms of response to, dmPFC-rTMS across three
diagnostic categories of psychiatric illness. In light of the desiderata outlined in Section 1.12.5
for selection of interpretable, physiologically grounded, and clinically meaningful rs-fMRI
metrics (Dunlop and Downar, 2017), the following rationale is provided for using seed-to-voxel-
based analyses as the most appropriate rs-fMRI analysis technique to adequately address the
general aims of this thesis:
1. IBNs identified via seed-to-voxel-based analyses are physiologically well-grounded.
In other words, such rsFC patterns are established to be related to brain structure,
neuronal activity, and electrophysiology.
a. IBNs and rsFC generated by rs-fMRI relate to brain structure (Section 1.2.3).
Task-evoked and rs-FC are correlated to white matter connectivity (Greicius et al,
2009; van den Heuvel et al, 2009), and the rsFC strength between two brain
regions is correlated with the integrity of the white matter tracts between them
(Hermundstad et al, 2013). Some rsFC may be related to indirect structural
connections via an intermediary synapse, but nonetheless such rsFC reflects
anatomical pathways or key circuitry in the brain (Baek et al, 2016; Honey et al,
2009).
130
b. IBNs and rsFC generated by rs-fMRI relate to electrophysiology (Sections 1.2.5
and 1.12.2). Resting-state fMRI activity is also associated with gamma power (50-
100 Hz) (Fox and Raichle, 2007; Schölvinck et al, 2010, 2013) and infraslow
activity (Lu et al, 2016). The rsFC strength between two regions correlates with
their spontaneous gamma synchrony (Nir et al, 2008), and spatial patterns of
gamma oscillations differentiate between anticorrelated networks (Keller et al,
2013). Spontaneous gamma fluctuations in monkey visual cortex, as measured by
LFP, correlate with spontaneous fluctuations of rs-fMRI signal (Shmuel and
Leopold, 2008). Spontaneous fluctuations in infraslow LFPs using EEG and MEG
have been shown to be related to spontaneous fluctuations in rs-fMRI (Hiltunen et
al, 2014).
c. IBNs and rsFC generated by rs-fMRI relate to neuronal activity (Sections 1.2.5
and 1.12.2). rsFC is generated by synchronous increases in gamma power that
reflect increased local spiking (Logothetis et al, 2001; Manning et al, 2009;
Mukamel et al, 2005; Nir et al, 2007; Ray and Maunsell, 2011). Spontaneous
changes in cerebral blood flow are tightly coupled with infraslow ECoG
fluctuations (Golanov et al, 1994), and infraslow activity is attenuated by voltage-
gated sodium channel or glutamate receptor antagonists (Chan et al, 2015).
However, widespread spontaneous BOLD activity has been correlated with
recorded activity from single neurons in some (Shmuel and Leopold, 2008) but
not all studies (Schölvinck et al, 2013), and it is likely the case that all measures
of rs-fMRI are influenced by non-neuronal factors (Birn et al, 2006; Shmueli et
al, 2007; Wise et al, 2004) that contribute to variability in this signal.
2. rsFC maps generated via seed-to-voxel-based analyses provide meaningful
information about human behaviour. Section 1.2.4 provides evidence that rsFC and its
IBNs reflect aspects of human behaviour. First, rsFC-generated IBNs closely resemble
task-evoked IBNs (Krienen et al, 2014). Second, variability in the functional coupling of
IBNs has been related to behavioural variability, as measured by response time variability
during a Flanker task (Kelly et al, 2008). Such inter-individual variability has also been
related to behavioural variability in other tasks; for example, stronger within-network
IBN coupling in cortical regions responsible for motor and language function were
131
associated with higher performance on a reading task (Koyama et al, 2011), and higher
rates of behavioural impulsivity were related to the coupling of attentional and executive
control regions to premotor regions (Shannon et al, 2011). Therefore, differences in seed-
to-voxel-based rsFC maps are likely to be associated with the same cognitive or
behavioural processes that are associated with similar IBNs identified during task-based
fMRI studies.
3. rsFC maps identified via seed-to-voxel-based analyses provide meaningful
information about psychiatric disorders (Sections 1.3, 1.4, 1.5 and 1.6). Advances in
the understanding of corticocortical and corticostriatal rsFC across many disorders have
led to transdiagnostic, network-based models of the domains of pathology that underlie
psychiatric disorders. In other words, abnormalities in behaviour and clinical symptoms
are being now described in terms of dysfunction of specific IBNs, as opposed to more
general psychosocial constructs or biochemical imbalances. Section 1.3.2 highlights three
extant theories of such rsFC deficits extending across conventionally defined diagnostic
disorders, and all three specifically highlight the SN and its corticocortical/corticostriatal
connectivity as a key transdiagnostic substrate of illness (Marsh et al, 2009a; McTeague
et al, 2016; Menon, 2011; Menon and Uddin, 2010). Dysfunction in these transdiagnostic
IBNs is also linked to deficits in behaviour, cognition, and clinical symptom severity, and
has been shown to predict, and/or change with, response to clinical intervention (Sections
1.10 and 1.11).
4. rsFC maps identified via seed-to-voxel-based analyses are replicable. rsFC maps
generated from seed-based connectivity analyses show a close resemblance to maps
generated via other rs-fMRI techniques, such as ICA (Hale et al, 2015) and offer good
reproducibility (Franco et al, 2013). The neuroanatomical features of IBNs are also
highly replicable, with general topology congruent both across subjects and across
analysis techniques (Fox et al, 2005; Greicius et al, 2003).
5. Assumptions of seed-to-voxel-based rs-fMRI analysis are addressed. A major
assumption of seed-based connectivity analyses is ROI selection, as ROI location and
size can affect rsFC maps and therefore bias results (Margulies et al, 2010). A recent
systematic comparison of rsFC ROI methods demonstrated that there currently is no
132
optimal method to define ROIs for seed-based rsFC analyses, although ROIs derived
from resting-state data appear to more reliably capture rsFC compared to ROIs derived
from structural connectivity or cytoarchitecture (Arslan et al, 2018). Consequently, the
ROIs used in this thesis are derived from cortical and striatal parcellations of resting-state
fMRI connectivity (Craddock et al, 2012a; Di Martino et al, 2008). Another assumption
of seed-based analyses is that ROIs should ideally be defined a priori to avoid circularity
of analysis methods, and to minimize the impact of multiple comparisons across large
numbers of ROIs. Fortunately, in the setting of rTMS, both the stimulation site in dmPFC
(Avissar et al, 2017; Cárdenas-Morales et al, 2014), and the network of regions activated
by rTMS at the specific site (Cho et al, 2015; Dowdle et al, 2018; Hanlon et al, 2013;
Liston et al, 2014) are known in advance from previous work, and can therefore be
defined a priori as ROIs for analytical purposes. Similarly, ROI selection from DBS
targets is another evidence-driven technique that results in robust results (Fox et al,
2014), and this approach is consequently used to generate exploratory seeds in Study II.
6. rsFC observations from seed-to-voxel-based approaches in this thesis will generate
novel information about neurobiological processes, therapeutic interventions, and
clinical populations. Prior to the execution of the studies in this thesis, the existing
literature has offered very little evidence about the neurobiological predictors of response
to novel and conventional interventions for OCD and eating disorders (Section 1.11.2).
To date, there are no functional predictors of response for either conventional
interventions or rTMS in the setting of OCD and BN. Furthermore, there are no fMRI or
structural MRI studies that report correlates/mechanisms of response to any intervention
that correlates to binge/purge improvements in BN (Section 1.11.2), and very little
evidence on the neurobiological mechanisms of novel neurostimulatory interventions. For
TRD, dmPFC-rTMS is a relatively novel intervention, and consequently only two
previous studies have reported rsFC predictors and mechanisms of response to this
intervention in TRD (Downar et al, 2014; Salomons et al, 2014), both of which were
conducted under open-label rather than sham-controlled conditions and neither of which
can therefore inform us about whether observed changes were treatment-specific rather
than representative of nonspecific effects or regression-to-mean over time in the treated
population. Therefore, these studies to identify seed-based rsFC predictors and correlates
133
of response to dmPFC-rTMS in all three of these clinical populations will provide novel
information of potential importance for both basic-science and translational purposes.
7. rsFC observations from seed-to-voxel-based approaches in this thesis will
demonstrate useful information about neurobiological processes, therapeutic
interventions, and clinical populations.
a. Identifying baseline seed-based rsFC maps that distinguish between rTMS
responders and non-responders has utility for three reasons. First, reliable
methods for differentiating treatment responders from non-responders could spare
patients from undergoing futile treatments, and enable more individualized
approaches to treatment selection. A significant time commitment is required of
rTMS patients, especially since rTMS requires patients to receive treatment at a
clinic or hospital daily over many weeks, so avoiding futile treatments is an
important clinical objective. Second, identifying reliable biomarkers of treatment
response may yield insights into how we may develop new treatments for those
who do not respond to dmPFC-rTMS. For example, a fMRI-based rTMS
biomarker may reveal brain regions that differ between responders and non-
responders to a given treatment. Brain regions that are abnormally hyper- or
hypoactive in a group of non-responders may be promising candidate targets for
neurostimulation in future studies. Finally, biomarkers distinguishing individual
differences in response to treatment may help with the broader goal of
understanding more clearly the clinical and neurbiological heterogeneity that
underlies MDD and other psychiatric disorders; such biomarkers could also prove
informative about the etiology and pathophysiology of these disorders.
b. Identifying the biological mechanisms by which an individual achieves response
or remission from a psychiatric disorder is useful knowledge for both scientific
and therapeutic reasons. First, there is limited available evidence to date regarding
the biological effects of DLPFC- and dmPFC-rTMS in healthy controls and
psychiatric populations. Identifying changes in seed-based rsFC in patients treated
with excitatory dmPFC-rTMS may clarify the biological mechanisms of this
intervention, and may help us to understand the heterogeneity in its effects. Such
134
knowledge could help to develop more consistently effective rTMS protocols, or
help to develop new interventions for those who do not respond to dmPFC-rTMS.
Second, it is unknown whether alterations in rsFC are state-dependent markers of
current mood state or stable, trait-like features that persist during response or
remission. Thus, understanding the mechanisms of treatment response will allow
for a better understanding of which structural or functional features normalize as
MDD symptoms remit, and which persist. Finally, understanding the biological
mechanisms of treatment remission could help to clarify the biological
mechanisms by which an individual patient suffers relapse, possibly leading to
clinically useful biomarkers for predicting treatment relapse.
Study I. Baseline Predictors and Mechanisms of dmPFC-rTMS response in Anorexia and Bulimia Nervosa
Rationale of Study I AN and BN carry a disproportionately high burden of illness, and a high mortality rate.
Approximately 10% of AN sufferers will die within 10 years of disease onset (Sullivan, 1995).
According to a recent meta-analysis, the overall standard mortality ratio for AN is 5.86,
substantially higher than schizophrenia (2.8), MDD (1.6) and bipolar disorder (2.1) (Arcelus et
al, 2011). To date, there is no single well-established treatment for eating disorders; treatment or
treatment-combinations vary according to eating disorder type, severity, and clinician experience
(for a review, see (Halmi, 2005)). Further compounding this issue, only a third of AN patients
will recover within 4 years of disease onset (Berkman et al, 2007; Steinhausen, 2002), and
clinical studies of BN report relapse rates between 25-63% (Grilo et al, 2012; Halmi et al, 2002;
Herzog et al, 1999; Keel et al, 2005; Olmsted et al, 2005). Consequently, a substantial
proportion of patients are not adequately served by current treatments.
To date, previously published studies of DLPFC-rTMS in medically-unresponsive BN
have reported modest improvements (Section 1.8.3). However, there is one recently published
case of a patient with TRD and comorbid BN who unexpectedly remitted from binge eating and
purging following a course of 10 Hz dmPFC-rTMS for comorbid TRD (Downar et al, 2012). It is
possible that dmPFC-rTMS improved binge eating and purging symptoms via normalizing
135
effects on structural and functional abnormalities that are common to both TRD and eating
disorders, centring on the dmPFC and adjacent dACC (Sections 1.3.2, 1.4.56 and 1.6.6); a
follow-on case series in the same population, this time incorporating pre- and post-treatment
neuroimaging, would be required to clarify the mechanism of action.
There are also no studies to date that report pre-treatment neurobiological predictors of
binge eating or purge improvement, and no studies that report pre- to post-treatment changes in
neurobiological measures that accompany improvements in eating eating or purging (Sections
1.9.3 and 1.10.2). However, in the setting of TRD, two recent rs-fMRI publications have
reported baseline differences between dmPFC-rTMS responders and non-responders and
changes that correspond with clinical improvement in TRD symptoms (Section 1.9.4). These
studies reported that higher functional connectivity between the dmPFC and sgACC was
associated with better response to dmPFC-rTMS, and that TRD responders displayed lower
baseline dmPFC resting-state functional connectivity with the thalamus compared to rTMS non-
responders (Salomons et al, 2014). Given the common elements among the structural and
functional brain abnormalities seen for TRD and eating disorders, it could be the case that similar
rs-fMRI predictors and mechanisms of response would be associated with successful dmPFC-
rTMS treatment in BN and TRD. Consequently, the general aim of Study I is to establish
baseline predictors of, and neural correlates/mechanisms of, improvements in binge-eating and
purging behaviors with dmPFC-rTMS treatment, in BN and AN-BP.
Specific Aims of Study I 1. To determine whether 20-30 sessions of open-label 10 Hz dmPFC-rTMS improves binge
eating and purging in patients with AN-BP or BN.
2. To identify patterns of baseline dmPFC resting-state functional connectivity that
significantly differ between AN-BP/BN dmPFC-rTMS responders and non-responders.
3. To identify pre- to post-treatment changes in resting-state functional connectivity that
correlate with binge eating and purging frequency in patients with AN-BP and BN.
136
Hypotheses of Study I 1. Mean binge eating and purging frequency will significantly improve in AN-BP/BN
patients who receive 20-30 sessions of open-label 10 Hz dmPFC-rTMS.
2. Lower baseline dmPFC-CSTC and higher baseline dmPFC-sgACC resting-state
functional connectivity will be associated with better response to 10 Hz dmPFC-rTMS.
3. Increases in pre- to post-treatment CSTC-dmPFC rsFC after 10 Hz dmPFC-rTMS will
correlate with improvements in binge-eating and purge frequency.
Study II. Baseline Predictors and Mechanisms of dmPFC-rTMS response in Obsessive-Compulsive Disorder
Study Rationale OCD is a particularly challenging psychiatric disorder from a therapeutic perspective. It
is estimated that between 30-60% of OCD patients do not respond to conventional behavioural or
pharmacological treatments (Pallanti et al, 2002; Simpson et al, 2006), and even those who
initially respond to conventional pharmaco- and psychotherapies show persistent functional
impairment (Steketee, 1997), and substantial future relapse rates (Simpson et al, 2005). Novel
therapeutics are therefore critical to address the substantial population of OCD sufferers for
whom conventional interventions have limited efficacy.
Recent randomized, sham-controlled trials have demonstrated that DBS of the ventral
striatum is an effective treatment for medically-refractive OCD (Section 1.8.2). In these DBS
cases, symptomatic improvement was correlated with decreases of abnormal dACC frontostriatal
hyperconnectivity (Figee et al, 2013) (Section 1.10.2). However, DBS is the least accepted and
least preferred novel treatment compared to other novel behavioural therapies, possibly reflecting
a lack of evidence for this intervention and indication, in addition to its invasive nature and the
requirement for a costly device as well as specialized neurosurgical expertise for successful
implantation (Patel et al, 2017).
rTMS over the dACC is a more economical and less invasive intervention that can
modulate dACC function and frontostriatal connectivity (Sections 1.7.2). Previously published
studies have shown that other medial frontal sites may be effective rTMS targets in medically-
137
refractory OCD (Mantovani et al, 2010) (Section 1.8.2). However, high-frequency rTMS over
the dmPFC and dACC as a treatment for OCD has never before been studied, despite structural
and functional evidence that this region and its associated IBN is abnormal in this population
(Section 1.5.6). Furthermore, there are also no studies that report pre-treatment neurobiological
predictors of OCD symptom improvement to rTMS, and no studies that report pre- to post-rTMS
changes in neurobiological measures that accompany improvements in OCD symptom severity
(Sections 1.9.3 and 1.10.2). Due to the hypothesized neurobiological effects of dmPFC-rTMS on
frontostriatal connectivity, it could be the case that similar rs-fMRI predictors and mechanisms
of VS-DBS response would be associated with successful dmPFC-rTMS treatment in OCD.
Consequently, the general aim of Study II is to establish baseline predictors of, and neural
correlates/mechanisms of, OCD symptom improvements following 20-30 sessions of 10 Hz
dmPFC-rTMS.
Specific Aims of Study II 1. To determine whether 20-30 sessions of open-label 10 Hz dmPFC-rTMS improves the
severity of obsessive thoughts and compulsive behaviours in OCD.
2. To identify patterns of baseline dmPFC resting-state functional connectivity that
significant differ between OCD dmPFC-rTMS responders and non-responders.
3. To identify pre- to post-treatment changes in resting-state functional connectivity that
correlate with improvements in OCD symptom severity.
Hypotheses of Study II 1. The severity of obsessive thoughts and compulsive behaviours in OCD patients will
significantly improve in response to 20-30 sessions of open-label 10 Hz dmPFC-rTMS.
2. As with DBS, OCD patients with higher dmPFC-CSTC resting-state functional
connectivity will show better response to open-label 10 Hz dmPFC-rTMS.
3. As with DBS, OCD patients who show decreases in pre- to post-treatment dmPFC-CSTC
resting-state functional connectivity after dmPFC-rTMS will show more improvement in
OCD symptom severity.
138
Study III: Baseline Predictors and Mechanisms of High- and Low-Frequency dmPFC-rTMS in TRD under triple-blind sham controlled settings
Rationale of Study III
Three open-label case series from our research group have previous reported
improvements in TRD symptom severity following 20-30 sessions of once daily 10 Hz dmPFC-
rTMS (Bakker et al, 2015; Downar et al, 2014; Salomons et al, 2014). Only one other
independent study of dmPFC-rTMS in TRD currently exists. A preliminary randomized control
trial reported significant improvement following dmPFC-rTMS;however this study included a
very small number of patients (n = 40) who received only 15 sessions of rTMS in an inpatient
setting with concurrent medication regimen adjustments(Kreuzer et al, 2015). Given the modest
sample size and abbreviated dmPFC-rTMS treatment course (Section 1.8.1), further investigation
is warranted to determine whether the antidepressant effects of this intervention are superior to
those seen with placebo dmPFC-rTMS.
Two of the open-label case series of dmPFC-rTMS for TRD cited above (Downar et al,
2014; Salomons et al, 2014) examined rs-fMRI differences at baseline that predicted treatment
response. Baseline resting-state neuroimaging findings revealed differences in functional
connectivity between responders and non-responders to dmPFC-rTMS in TRD (Section 1.9.4).
Changes in dmPFC resting-state functional connectivity correlated with response to open-label
dmPFC-rTMS (Section 1.10.2). Generally, connectivity of the stimulation site with frontostriatal
CSTC circuitry and cortico-cortical VMN regions at baseline predicted response to dmPFC-
rTMS; connectivity change from pre- to post-treatment scans in these regions also correlated
with response to dmPFC-rTMS in TRD. However, the therapeutic effects of dmPFC-rTMS and
its rs-fMRI correlates were highly heterogeneous across individuals. To address this
heterogeneity and improve outcomes, rTMS protocols that theoretically elicit different cortical
responses could be compared in terms of both clinical efficacy and effects on neural activity;
such comparisons could help to identify mechanisms of response, and to optimize treatment
parameters (Section 1.8.4). Low-frequency (1 Hz) and high-frequency (20 Hz) protocols have
both been used in numerous studies of rTMS in TRD, comparing treatment outcomes in order to
139
optimize the treatment protocol at a given stimulation site, and determine mechanisms of
antidepressant response (e.g., Kim et al, 2014). In light of these findings, the general aim of
Study III is to establish baseline predictors of and mechanisms of improvements in TRD
symptom severity following 30 sessions of 20 Hz dmPFC-rTMS under placebo-controlled
conditions.
Specific Aims of Study III 1. To determine whether the clinical efficacy of active 20 Hz dmPFC-rTMS in TRD is
superior to that of 1 Hz active dmPFC and sham dmPFC-rTMS.
2. To replicate previously identified patterns of baseline dmPFC resting-state functional
connectivity that significantly differ between TRD dmPFC-rTMS responders and non-
responders.
3. To replicate previously identified patterns of pre- to post-treatment changes in resting-
state functional connectivity that correlate with improvements in TRD severity.
Hypotheses of Study III 1. Improvements in depression symptoms with 20 Hz dmPFC-rTMS will be significantly
higher than that achieved with 1 Hz dmPFC-rTMS or placebo dmPFC-rTMS.
2. TRD patients with lower dmPFC-CSTC and higher dmPFC-VMPFC resting-state
functional connectivity will show greater symptom improvement with active 20 Hz
dmPFC-rTMS, but not with active 1 Hz or placebo dmPFC-rTMS.
3. TRD patients showing greater increases in pre- to post-treatment dmPFC-CSTC resting-
state functional connectivity will show greater improvement in clinical symptoms, after
active 20 Hz dmPFC-rTMS but not after active 1 Hz or placebo dmPFC-rTMS.
140
General Methods
Project Overview This project was conducted with three independent cohorts of patients (n = 28 for Study I; n = 20
for Study II; and n = 123 for Study III), and two independent cohorts of healthy individuals (n =
40 for study II and n = 41 for Study III).
All study patients (n = 151) who met study inclusion and exclusion criteria (described in detail
below) underwent the following general experimental protocol:
1. Pre-rTMS and Post-rTMS Brain Imaging Session: This session included acquisition
of structural MRI and rs-fMRI scans with parameters detailed below. Patients’ scans
were acquired 1-week prior to a course of dmPFC-rTMS. For Study III, all patients also
completed a baseline battery of clinical questionnaires assessing symptomatology beyond
core TRD symptoms.
2. rTMS Treatment: All patients received 20-30 sessions of dmPFC-rTMS. All patients
recruited to Studies I and II received 20-30 sessions of once-daily, open-label dmPFC-
rTMS. All patients recruited to Study III were randomized assigned to 30 twice-daily
sessions (15 dayss) of either active 20 Hz dmPFC-rTMS, active 1 Hz dmPFC-rTMS, or
placebo dmPFC-rTMS using a sham rTMS coil customized for dmPFC stimulation.
All study controls who met study inclusion and exclusion criteria (n = 80) underwent two
experimental sessions:
1. Clinical Assessment and Baseline Questionnaires: All participants completed a battery
of neuropsychiatric questionnaires and clinical interview with a trained assessor as
detailed below.
2. Brain Imaging Session: This single session included acquisition of structural MRI and
rs-fMRI sequences that were identical that acquired in the patient cohort.
141
Subject Recruitment For all studies, male and female patients and healthy controls between the ages of 18 and
65 were recruited. All participants provided informed consent and study procedures were
approved by the University Health Network Research Ethics Board.
All patients were referred to MRI-Guided rTMS Clinic at Toronto Western Hospital
(typically by their general practitioner or psychiatrist) and were recruited into the aforementioned
studies by psychiatrists and trained clinical assessors at the Clinic. Patients’ psychiatric
diagnoses were verified by a Canadian Royal College-certified psychiatrist at the time of their
initial consultation assessment for rTMS treatment. Inclusion criteria in all three studies
included: competency to give voluntary, informed consent to treatment and participate in the
research study; and met DSM-5 diagnostic criteria for MDD, BN, AN-BP, or OCD at the time of
their consultation for rTMS. Patients were excluded from any of the three studies if they: were
pregnant; had a lifetime MINI diagnosis of bipolar I or II disorder, schizophrenia, schizoaffective
disorder, schizophreniform disorder, delusional disorder, or current psychotic symptoms; had a
MINI diagnosis of post-traumatic stress disorder (current or within the last year), anxiety
disorder (including generalized anxiety disorder, social anxiety disorder, panic disorder), or
dysthymia, assessed by a study investigator to be primary and causing greater impairment than
the primary diagnosis; had a diagnosis of any personality disorder, as assessed by a study
investigator to be primary and causing greater impairment than the primary diagnosis; had
previously received rTMS for any previous indication due to potential compromise of subject
blinding; had any significant neurological disorder or insult including, but not limited to: any
condition likely to be associated with increased intracranial pressure, space occupying brain
lesion, any history of seizure except those therapeutically induced by ECT, cerebral aneurysm,
Parkinson's disease, Huntington's chorea, multiple sclerosis, significant head trauma with loss of
consciousness for greater than or equal to 5 minutes; had an intracranial implant (e.g., aneurysm
clips, shunts, stimulators, cochlear implants, or electrodes) or any other metal object within or
near the head, excluding the mouth that could not be safely removed; or had a non-correctable
clinically significant sensory impairment (i.e., could not hear well enough to cooperate with
interview). If a patient was participating in psychotherapy, they were required to have been in
stable treatment for at least 3 months prior to entry to the study, with no anticipation of change in
the frequency of therapeutic sessions, or the therapeutic focus over the duration of the study. If a
142
patient was taking antidepressant or other psychotropic medication, they were required to have
been on a stable regimen for at least 4 weeks prior to entry to the study. Patients were also
required not to take more than 2 mg daily of lorazepam (or equivalent dosage of other
benzodiazepines), or any dose of an anticonvulsant due to the potential to limit rTMS efficacy.
All control participants were recruited using Research Ethics Board-approved poster
advertisements at Toronto Western and Toronto General Hospitals and word of mouth.
Exclusion criteria for control subjects included: a lifetime history of neurological or psychiatric
disease, including substance abuse or dependence, or cardiovascular disease; currently use of any
medications that could significantly affect brain perfusion or activity, including antidepressants,
mood stabilizers, neuroleptics, anxiolytics, hypnotics, stimulants, anticonvulsants, anti-migraine
agents, cognitive enhancing agents, opioids, anti-nausea agents or beta-blockers; any
contraindications to MRI (e.g., implanted medical devices, metallic foreign objects, epilepsy), or
a HAMD score ≥ 8.
MRI and rs-fMRI Acquisition For all studies, the structural and resting-state functional MRI scans of all participants
were acquired on the Toronto Western Hospital’s 3 Tesla GE HDx MRI system (General
Electric, Milwaukee, WI) with an eight-channel phased-array head coil. Scans were acquired
with participants positioned supine on the MRI table and their head was padded to reduce
movement.
A high-resolution, whole-brain, three-dimensional anatomical scan was acquired using a
T1-weighted fast spoiled gradient-echo sequence: echo time (TE) = 12 ms, inversion time (TI) =
300 ms, flip angle = 20°, 116 sagittal slices, thickness = 1.5 mm, no gap, 256 x 256 matrix, 0.78
x 0.78 x 1.5 mm3 voxels; field of view (FOV) = 240 mm.
Resting-state functional MRI was acquired for 10 minutes in the eyes-closed condition.
All patients were instructed to closed their eyes and ‘let their mind wander; do not fall asleep.’
rs-fMRI was acquired using a T2*-weighted echo-planar sequence: TE = 30 ms, TR = 2000 ms,
143
flip angle = 85°, 32 axial slices, thickness = 5 mm, no gap, 64 x 64 matrix, FOV = 220mm, 300
TRs/volumes).
Motor Threshold Assessment Resting motor thresholds for all patients were identified using stimulation of the medial
M1 and activation of the extensor hallucis longus muscle (resulting in movement of the great
toe). The focus of a Cool-DB80 rTMS coil (MagVenture, Farum, Denmark) was placed over the
interhemispheric fissure with lateral TMS coil orientation to preferentially stimulate the motor
cortex of the hemisphere contralateral to the direction of current flow, and thus the great toe
ipsilateral to the coil handle. Resting motor threshold was determined visually by a staff
psychiatrist according to a previously published motor threshold estimation procedure (Schutter
and van Honk, 2006). Briefly, this procedure involves four steps. First, the patient is seated in an
rTMS treatment chair and asked to remove footwear, and relax the legs. Second, the optimal site
for motor threshold is identified by five consistent motor-evoked hallux extensions. Identifying
the motor threshold is performed using the staircase method – TMS machine output begins at a
typically low, subthreshold intensity and is titrated upwards in increments of 1-5% to identify the
location at which minimal energy is needed to elicit motor responses. Third, after identifying the
this optimal M1 site, the intensity is gradually decreased to the lowest TMS output that evokes a
visibly detectable twitch in five of ten pulses. Fourth, the motor threshold is further optimized by
systematically searching for whether there is any an alternative M1 site that induces a response
for at least six of ten pulses; if such a site is identified, then the third and fourth steps are
repeated finalize the location and intensity of the resting motor threshold. This process is then
repeated with the coil handle oriented laterally in the opposite direction, to establish a motor
threshold for the other hemisphere’s lower limb M1 hotspot.
dmPFC-rTMS Treatment The intended dmPFC rTMS target on the cortex corresponded to the Talairach and
Tournoux stereotaxic coordinate (X+0, Y+30, Z+30) (Talairach and Tournoux, 1988). MRI-
144
guided neuronavigation was performed for Studies I and II. The nearest scalp point, at the
coordinate (X+0, Y+60, Z+60), was marked in the neuronavigation software (Visor, ANT Neuro,
Enschede, Netherlands) and used as the scalp site for stimulation. This scalp site was later
determined to correspond closely to a point at 25% of the distance of from the subject’s nasion to
inion (Mir-Moghtadaei et al, 2016), and so this scalp heuristic was used to orient the coil vertex
during all dmPFC-rTMS treatment sessions in Study III.
Neuronavigation involved a number of steps. The Visor 2.0 navigation system was used
to preprocess the patient’s T1 high-resolution anatomical scans for neuronavigation. Three MRI
processing steps were included: first, segmentation of the image into 2 components (scalp and
brain) and registration into the Talairach and Tournoux stereotactic space (Talairach and
Tournoux, 1988); second, landmarking of the tragus of the left and right ear, the anterior
commissure, posterior commissure, the interhemispheric point (between the two cortical
hemispheres), the anterior-most point of the brain, and the posterior-most point of the brain; and
finally, reconstruction of the surfaces of the patient’s brain and scalp into stereotactic space and
the overlaying of the dmPFC scalp coordinate to identify the stimulation target.
Neuronavigation involved a number of preparatory steps prior to stimulation. First,
patients were seated in a treatment chair that was positioned in clear view of the neuronavigation
camera. Next, a headband with a marker clip was attached around the patient’s head and placed
laterally (so as not to obstruct coil placement); the neuronavigation camera detected the marker
clip as a reference point to locate the patient’s head. Using the Visor system’s neuronavigation
pen, each of the scalp targets were highlighted on the patient (bilateral tragus, nasion, inion, and
scalp circumference) for calibration with the preprocessed MRI scan. After calibration, a second
marker clip was equipped to the rTMS head coil to ensure placement of the vertex of the coil at
(X+0, Y+60, Z+60).
For Study I and II, all open-label rTMS over the dmPFC was performed using a MagPro
R30 rTMS system (MagVenture, Farum, Denmark) and a Cool-DB80 TMS coil. Stimulation was
delivered under the following parameters: 10 Hz at 120% of resting motor threshold intensity, 5
second trains with an inter-train interval of 10 seconds off, 60 trains (3000 pulses) per
hemisphere . As during motor thresholding, the inductor coil was oriented laterally to achieve

145
preferential stimulation of the right and then the left hemisphere. For safety purposes, all patients
and the rTMS operator wore hearing protection during stimulation.
For Study III, all dmPFC-rTMS treatments (both active and sham) were performed using
a MagPro R30 rTMS System (MagVenture, Farum, Denmark) and a custom active/placebo
version of the Cool-DB80 TMS double-cone coil. Patients received 30 weekday sessions of
bilateral rTMS over the dmPFC, twice daily (60 minutes apart), over 15 days. For safety
purposes, all patients and the rTMS operator wore hearing protection during stimulation. Patients
randomized to excitatory active rTMS received 20 Hz stimulation at 120% of the resting motor
threshold, 2 s on 12 s off, 38 trains, for 1520 pulses per hemisphere, for a total of 3080 pulses per
session delivered over 8 min 40 s per hemisphere. Patients randomized to inhibitory active
stimulation received 1 Hz stimulation over the bilateral dmPFC at 120% resting motor threshold,
60 s on and 30 s off, for 360 total pulses, 8.5 minutes per hemisphere (Brunelin et al, 2014).
Sham rTMS used a custom active/placebo version of the DB80 coil, designed to maintain
blinding in clinical trial settings (MagVenture, Farum, Denmark). The double-sided stimulation
coil contained a set of windings on the active side, but not on the identically marked sham side.
Preprogrammed software controlled a switch within the rTMS device that instructed the
technician on which (externally indistinguishable) side of the coil to place over the scalp using
the instruction “flip coil” when appropriate. The allocation to active vs sham stimulation was
based on the patient’s study ID code, entered into the device by the technician and thereby
maintaining technician blinding. Patients randomized to the sham arm were randomly allocated
to receive either the 1 Hz or 20 Hz dmPFC-rTMS pattern above, again to maintain blinding; this
pulse pattern was delivered with the active coil in the upper position (oriented away from the
scalp), thus avoiding stimulation of the target region. The sensory and nociceptive side effects
were mimicked using adhesive electrodes placed bilaterally above the participant’s eyebrows.
These electrodes were connected to the custom DB80 coil, which synchronized superficial pulses
of electrical stimulation with the timing of rTMS pulses (at either 1 or 20 Hz). The pulse
intensity escalated with the rTMS stimulation intensity so as to preserve the impression of actual
stimulation with rTMS even in the sham condition.
The stimulation intensity for all treatments were titrated adaptively upward within the
limits of the patient’s maximum pain tolerance without distress, in order to ensure adequate
146
tolerability of dmPFC-rTMS. During the first week of treatment, patients continuously rated their
pain between rTMS trains on a verbal analogue scale from zero to ten (zero corresponding to no
pain, and ten corresponding to their maximal pain tolerability without emotional distress). The
intensity of stimulation was gradually titrated upwards, while maintaining a verbal analogue
score of nine or less, until the stimulator intensity output reached 120% of the patient’s resting
motor threshold.
During treatment, all patients in all studies were asked to defer any medication changes
throughout the course of rTMS to avoid confounding effects. Patients were also assessed for the
emergence of any adverse events (e.g., headache, seizure, worsening of symptoms) at each
session of treatment and at each follow-up assessment. Patients were withdrawn from the study if
they experienced a worsening in depression, defined as an increase in the HAMD from baseline
of >25% during two consecutive assessments, or the development of active suicidal intent, or
attempted suicide.
147
Study I: Baseline Predictors and Mechanisms of dmPFC-rTMS response in Anorexia and Bulimia Nervosa
Introduction This chapter contains the following manuscript: Dunlop, K., Woodside, B., Lam, E.,
Olmstead, M., Colton, P., Giacobbe, P., Downar, J. “Increases in frontostriatal connectivity are
associated with response to dorsomedial repetitive transcranial magnetic stimulation in refractory
binge/purge behaviors” NeuroImage: Clinical (2015) 8, 611-8.
Recurrent episodes of binge eating and purging behavior occur in both AN−BP and
bulimia nervosa BN. In women, the lifetime prevalence of AN and BN is 0.9% and 1.5%
respectively (Hudson et al, 2007). Eating disorders (ED), in particular AN, have among the
highest mortality rate of all psychiatric disorders (Sullivan, 1995) and treatment options are
limited for severe forms of AN and BN, particularly for AN−BP (Arcelus et al, 2011).
Conventional treatments include psychotherapy, pharmacotherapy and inpatient treatments, but
rates of treatment dropout, limited treatment response and relapse rates are substantial (Carter et
al, 2012; Hay et al, 2012; Mitchell et al, 2007; Olmsted et al, 2005; Shapiro et al, 2007). New
treatment options are urgently needed.
Therapeutic brain stimulation is a novel approach in treatment-refractory ED, as recently
demonstrated in a pilot study using DBS in AN (Lipsman et al, 2013b). Non-invasive techniques
such as rTMS would offer greater accessibility and lower medical risk than DBS, if suitable
stimulation targets could be identified. Neuroimaging research has identified a variety of
neuroanatomical substrates of ED pathophysiology. For example, on structural imaging, ED
patients show reductions in gray matter volume in regions involved in reward, impulse control,
and emotion regulation: the caudate nucleus, VS, ACC, and OFC (Van den Eynde et al, 2012;
Friederich et al, 2012; Schäfer et al, 2010; Titova et al, 2013). Likewise, fMRI studies in ED
reveal abnormal patterns of resting-state connectivity in the default-mode network (Cowdrey et
al, 2014) and other intrinsic brain networks incorporating the ACC and insula (Amianto et al,
2013). ED patients also show abnormal VS activation in response to rewarding and aversive
stimuli (Wagner et al, 2007, 2010). Patients with BN show hyperactivity in medial frontal lobe
148
regions during inhibition of prepotent actions (Lock et al, 2011), and hypoactivity in response to
food cues (Joos et al, 2011).
Among the various neural substrates implicated in ED pathology, a target of particular
interest that is accessible to rTMS is the dmPFC. The dmPFC plays an important role in forms of
self-control, including self-inhibition of movements (Brass and Haggard, 2007), self-cessation of
loss-chasing in pathological gamblers (Campbell-Meiklejohn et al, 2008), self-suppression of
emotional responses (Kühn et al, 2011), and impulse control (Cho et al, 2013). Likewise, non-
invasive stimulation of medial prefrontal areas, via rTMS, enhances inhibitory control over
prepotent responses (Obeso et al, 2013), improves subjective choice for delayed rewards in a
delayed discounting task, and interferes with striatal dopamine (Cho et al, 2015). In sum,
stimulation of the medial prefrontal cortex using rTMS may alter the top-down executive control
of the dmPFC to striatal regions associated with the urge to binge and purge, thereby improving
symptom severity.
Considering this literature on the role for the DMPFC in self-regulation, one potential
implication is that DMPFC-rTMS might be worth exploring as a therapeutic approach for
addressing self-regulatory deficits in ED. To date, most previous rTMS studies in ED have
focused on the conventional target, the left DLPFC. Although DLPFC-rTMS reduces cue-
induced food craving in BN (Van den Eynde et al, 2010; Uher et al, 2005), double-blind trial of
DLPFC-rTMS for binge−purge symptoms found no significant improvement over sham
(Walpoth et al, 2008).
There are few reported studies of dmPFC-targeted rTMS to date. However, we recently
investigated dmPFC-rTMS in TRD, finding efficacy rates comparable to DLPFC-rTMS, but with
sharply dichotomous outcomes of improvement (Downar et al, 2014). Using resting-state
functional MRI (rs-fMRI), we found that low dmPFC–subcortical connectivity predicted
successful outcome, and that symptomatic improvements were associated with increased dmPFC
connectivity. We also reported the serendipitous finding of full remission from binge−purge
symptoms during dmPFC-rTMS for comorbid depression, in a patient with treatment-refractory
BN (Downar et al, 2012). These observations suggested that dmPFC-rTMS might treat a subset
of BN patients, and that enhanced frontal−subcortical connectivity on rs-fMRI might accompany
symptomatic improvement.
149
Aims & Hypotheses The general aim of Study I is to establish baseline predictors of, and neural
correlates/mechanisms of, improvements in binge-eating and purging behaviors with dmPFC-
rTMS treatment, in BN and AN-BP.
Specific Aims of Study I 1. To determine whether 20-30 sessions of open-label 10 Hz dmPFC-rTMS improves binge
eating and purging in patients with AN-BP or BN.
2. To identify patterns of baseline dmPFC resting-state functional connectivity that
significantly differ between AN-BP/BN dmPFC-rTMS responders and non-responders.
3. To identify pre- to post-treatment changes in resting-state functional connectivity that
correlate with binge eating and purging frequency in patients with AN-BP and BN.
Hypotheses of Study I 1. Mean binge eating and purging frequency will significantly improve in AN-BP/BN
patients who receive 20-30 sessions of open-label 10 Hz dmPFC-rTMS.
2. Lower baseline dmPFC-CSTC and higher baseline dmPFC-sgACC resting-state
functional connectivity will be associated with better response to 10 Hz dmPFC-rTMS.
3. Increases in pre- to post-treatment CSTC-dmPFC resting-state functional connectivity
after 10 Hz dmPFC-rTMS will correlate with improvements in binge-eating and purge
frequency.
150
Methods
Subjects
28 subjects (26 female, age range = 20 − 56 years, mean = 31.0 ± 9.5 years) meeting
DSM-5 criteria for AN−BP (n = 11), BN (n = 17) participated in this proof-of-concept, open-
label study. Subjects included individuals with bingeing and purging behavior, both at a normal
and lower than normal weight. BMI ranged from 14.5–28.8. AN−BP participants displayed both
bingeing and purging behaviors. While there are certainly important differences in the clinical
features of these disorders (e.g., failure to maintain normal body weight, or the presence of
restricting symptoms), binge and purge behaviors were the specific target symptom for the
purposes of this pilot study. Subjects engaged in ≥ 2 cumulative objective binge/purge episodes
weekly at baseline to be included in the study. Diagnoses were established through interviews
conducted by independent, Canadian Royal College-certified psychiatrists. In recognition of the
high prevalence of psychiatric comorbidities in this population, and in order to characterize
rather than minimizing sample heterogeneity, common comorbidities were not excluded. This
inclusion of comorbidities is in line with our previous work in TRD (Downar et al, 2014).
Comorbid diagnoses included MDD (n = 16), OCD (n = 6), post-traumatic stress disorder (n =
8), and bipolar disorder (n = 6). Patients with a history of a psychotic disorder, neurological
disorder, active substance abuse, or contraindications to MRI or rTMS were excluded. All
subjects had no improvements in bingeing/purging to or were unable to tolerate at least 1
previous medication trial (n = 27), and had also not responded to previous inpatient/outpatient
treatment courses in terms of an improvement of binges and purges (n = 25). On average,
patients had not respond to 2.61 ± 2.44 SD inpatient/outpatient treatments, and 3.00 ± 2.37 SD
medication trials. Current medications included SSRIs (n = 11), antipsychotics (n = 11),
benzodiazepines (n = 8), trazodone (n = 5), and SNRIs (n = 3). As routinely stipulated (Salomons
et al, 2014), subjects were required to refrain from any medication changes during and for ≥4
weeks before rTMS.
151
Clinical Outcomes
The clinical outcome of interest, weekly frequency of binge and purge episodes, was
monitored via a structured clinical interview, the EDE (Fairburn and Cooper, 1993),
administered 1 week before treatment, at each week during treatment, and at 4-weeks post-
treatment. For the purposes of stratification, response was defined as ≥ 50% decrease in objective
binge (≥ 1000 calories per binge) and purge episode frequency from pre-rTMS to 4 weeks post-
rTMS (at follow-up). Pre-treatment EDE assessments acquired binge/purge frequency for the 4
weeks prior to treatment, and the post-treatment EDE acquired frequency for the 4 weeks
following treatment, and so the pre- and post-treatment scores were obtained from weeks outside
of the rTMS treatment sessions. Data on bingeing and purging frequencies derived from the EDE
was divided by 4 to generate a weekly frequency for bingeing and purging. To obtain weekly
scores, EDE frequencies (which measure severity over 4 weeks) were divided over the 4 weeks.
Although a more conservative criterion is sometimes used in clinical efficacy studies, our
primary aim was to characterize and distinguish the neural activity of subpopulations of patients
showing improvement versus non-improvement in this population. A set of clinical and
psychometric data, including the 17-item HAMD (Hamilton, 1960), BDI-II (Beck et al, 1961,
1996) and the Beck Anxiety Inventory (BAI) (Beck et al, 1988) were also collected as secondary
metrics. To assess the distribution of outcomes across the study sample, we employed kernel
density estimation by applying the Epanechnikov kernel (Epanechnikov, 1969) in Stata13
(StataCorp). Two-tailed t-tests (Bonferroni-adjusted) were performed to determine the
significance of differences in clinical measures between groups and between timepoints. The
nonparametric Mann–Whitney U test was performed for comparisons of binge and purge
frequency do to the markedly non-normal distribution of these data.
Neuroimaging Acquisition
All subjects underwent 3 Tesla MRI the week prior to and the week after rTMS, with a
T1-weighted (TE = 12 ms, TI = 300 ms, flip-angle = 20°, 0.94 × 0.94 × 1.5 mm voxels) and a
10-min eyes-open resting state functional MRI scan (TE = 30 ms, TR = 2000 ms, flip-angle =
85°, 3.4 × 3.4 × 5 mm voxels).
152
Neuronavigation and rTMS Treatment
Neuronavigation employed the Visor 2.0 system (Advanced Neuro Technologies,
Enschede, Netherlands) to target the stereotaxic coordinate (X = 0, Y = +30, Z = +30) in
Talairach space (Talairach and Tournoux, 1988). rTMS employed the MagPro-R30 system
(MagVenture, Farum, Denmark) and a Cool-DB80 coil. Motor thresholds were determined via
contractions of the extensor hallucis longus (Hayward et al, 2007). Stimulation of the dmPFC
was delivered at 120% resting motor threshold, at 10 Hz, 5s on, 10s off, 3000 pulses/
hemisphere, with left then right lateralized coil orientation (Terao et al, 2001). Unilateral
stimulation was achieved by orienting the coil vertex at the stereotactic target laterally, with
current flow oriented to- wards the desired hemisphere (Harmer et al, 2001). If a patient missed
an rTMS session for logistical reasons, an additional session was added at the end of the course
of treatment (no patient required more than 4 such sessions). Patients underwent 20 sessions of
dmPFC-rTMS on weekdays; responders with any residual binge/purge symptoms were extended
to 30 sessions (mean = 21.2 ± 3.7 sessions, range = 18–30).
MRI Preprocessing, Seed Selection & Statistical Analysis
Preprocessing of resting-state fMRI data from patients employed the FMRIB Software
Library (FSL) (Jenkinson et al, 2012). Preprocessing included: the removal of the first 5 volumes
to account for scanner instabilities; interleaved slice-timing correlation; segmentation; motion
correction via a linear affine transformation of each volume of the time-series to the middle
volume (reference) of the scan ; spatial smoothing using a 6 mm FWHM Gaussian kernel,
correction for white matter and cerebrospinal fluid signal artifacts using linear regression,
temporal bandpass filtering (0.009–0.09 Hz), and nonlinear co-registration to the MNI-152
template.
ROIs were defined a priori from the parcellation atlas of Craddock et al. (2012) for the
dmPFC and adjacent dACC based on proximity to the stimulation target, in line with previous
analyses of dmPFC-rTMS in TRD (Craddock et al, 2012a; Salomons et al, 2014). ROI centroids
were MNI = −4, 44, 42 for dmPFC and MNI = 0, 38, 24 for dACC. For first-level analysis, each
153
seed ROI was co-registered to each subjects’ brain via nonlinear transformation, then applied as
masks to extract the mean ROI time series. These time series were used to generate whole-brain
maps of positively and negatively correlated voxels with the seed ROI before and after treatment,
via a linear regression analysis using a fixed effects model at the individual-subject level.
Group level analysis was performed using FSL’s FLAME mixed effects model
(Beckmann et al, 2003). We first identified regions where the degree of correlation at baseline to
the ROIs differed significantly between responders and non-responders. To assess whether
differing changes in resting-state connectivity over treatment would be associated with different
outcomes, we then compared pre- and post-treatment scans to identify regions where the pre- to
post-treatment change in correlation to the seed ROIs differed significantly between responders
and non-responders. The results of these analyses were transformed into z-score maps, correcting
for multiple comparisons using a Gaussian random field theory cluster-based correction (z-score
> 1.96, cluster significance p < 0.05, corrected). Finally, the clusters previously obtained from
group-level baseline predictor and change analyses were co-registered to patients’ individual
scans, and connectivity values were extracted for each subject.
Results
Primary Clinical Outcomes
No serious or treatment-limiting adverse effects occurred, and subjects reported only the
localized scalp discomfort and transient headache routinely associated with rTMS treatment
sessions.
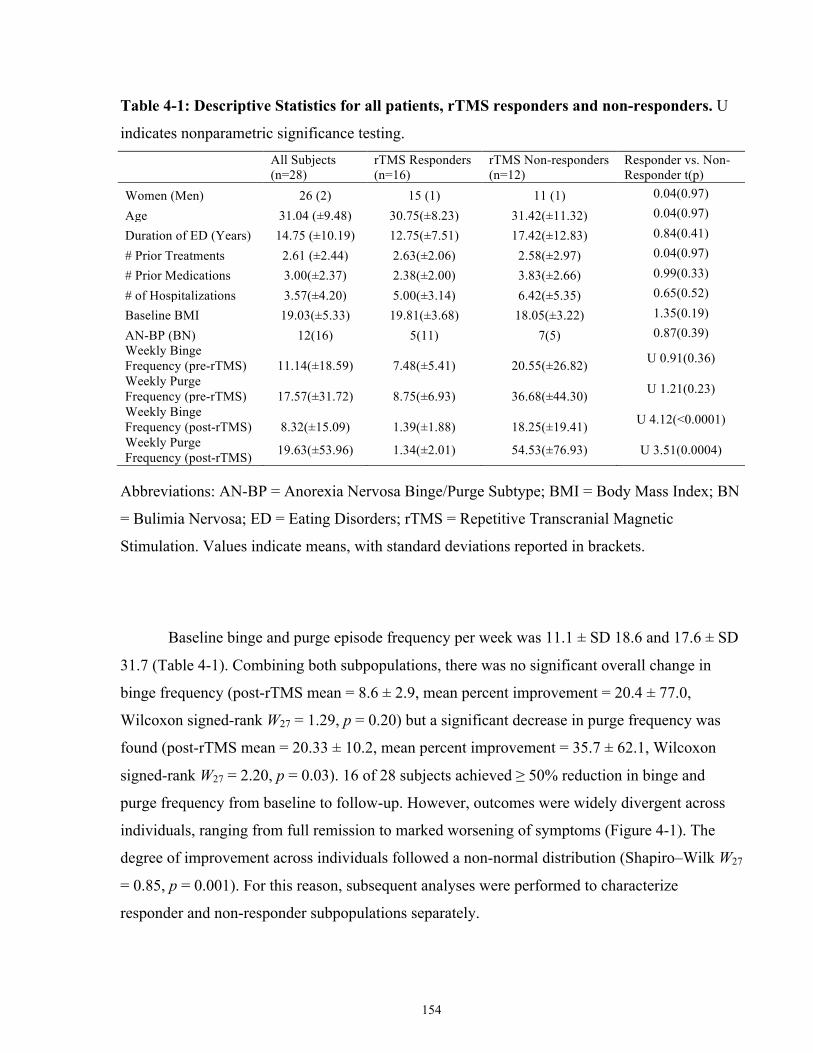
154
Table 4-1: Descriptive Statistics for all patients, rTMS responders and non-responders. U
indicates nonparametric significance testing.
All Subjects (n=28)
rTMS Responders (n=16)
rTMS Non-responders (n=12)
Responder vs. Non-Responder t(p)
Women (Men) 26 (2) 15 (1) 11 (1) 0.04(0.97)
Age 31.04 (±9.48) 30.75(±8.23) 31.42(±11.32) 0.04(0.97)
Duration of ED (Years) 14.75 (±10.19) 12.75(±7.51) 17.42(±12.83) 0.84(0.41)
# Prior Treatments 2.61 (±2.44) 2.63(±2.06) 2.58(±2.97) 0.04(0.97)
# Prior Medications 3.00(±2.37) 2.38(±2.00) 3.83(±2.66) 0.99(0.33)
# of Hospitalizations 3.57(±4.20) 5.00(±3.14) 6.42(±5.35) 0.65(0.52)
Baseline BMI 19.03(±5.33) 19.81(±3.68) 18.05(±3.22) 1.35(0.19)
AN-BP (BN) 12(16) 5(11) 7(5) 0.87(0.39) Weekly Binge Frequency (pre-rTMS) 11.14(±18.59) 7.48(±5.41) 20.55(±26.82) U 0.91(0.36)
Weekly Purge Frequency (pre-rTMS) 17.57(±31.72) 8.75(±6.93) 36.68(±44.30) U 1.21(0.23)
Weekly Binge Frequency (post-rTMS) 8.32(±15.09) 1.39(±1.88) 18.25(±19.41) U 4.12(<0.0001)
Weekly Purge Frequency (post-rTMS) 19.63(±53.96) 1.34(±2.01) 54.53(±76.93) U 3.51(0.0004)
Abbreviations: AN-BP = Anorexia Nervosa Binge/Purge Subtype; BMI = Body Mass Index; BN
= Bulimia Nervosa; ED = Eating Disorders; rTMS = Repetitive Transcranial Magnetic
Stimulation. Values indicate means, with standard deviations reported in brackets.
Baseline binge and purge episode frequency per week was 11.1 ± SD 18.6 and 17.6 ± SD
31.7 (Table 4-1). Combining both subpopulations, there was no significant overall change in
binge frequency (post-rTMS mean = 8.6 ± 2.9, mean percent improvement = 20.4 ± 77.0,
Wilcoxon signed-rank W27 = 1.29, p = 0.20) but a significant decrease in purge frequency was
found (post-rTMS mean = 20.33 ± 10.2, mean percent improvement = 35.7 ± 62.1, Wilcoxon
signed-rank W27 = 2.20, p = 0.03). 16 of 28 subjects achieved ≥ 50% reduction in binge and
purge frequency from baseline to follow-up. However, outcomes were widely divergent across
individuals, ranging from full remission to marked worsening of symptoms (Figure 4-1). The
degree of improvement across individuals followed a non-normal distribution (Shapiro–Wilk W27
= 0.85, p = 0.001). For this reason, subsequent analyses were performed to characterize
responder and non-responder subpopulations separately.
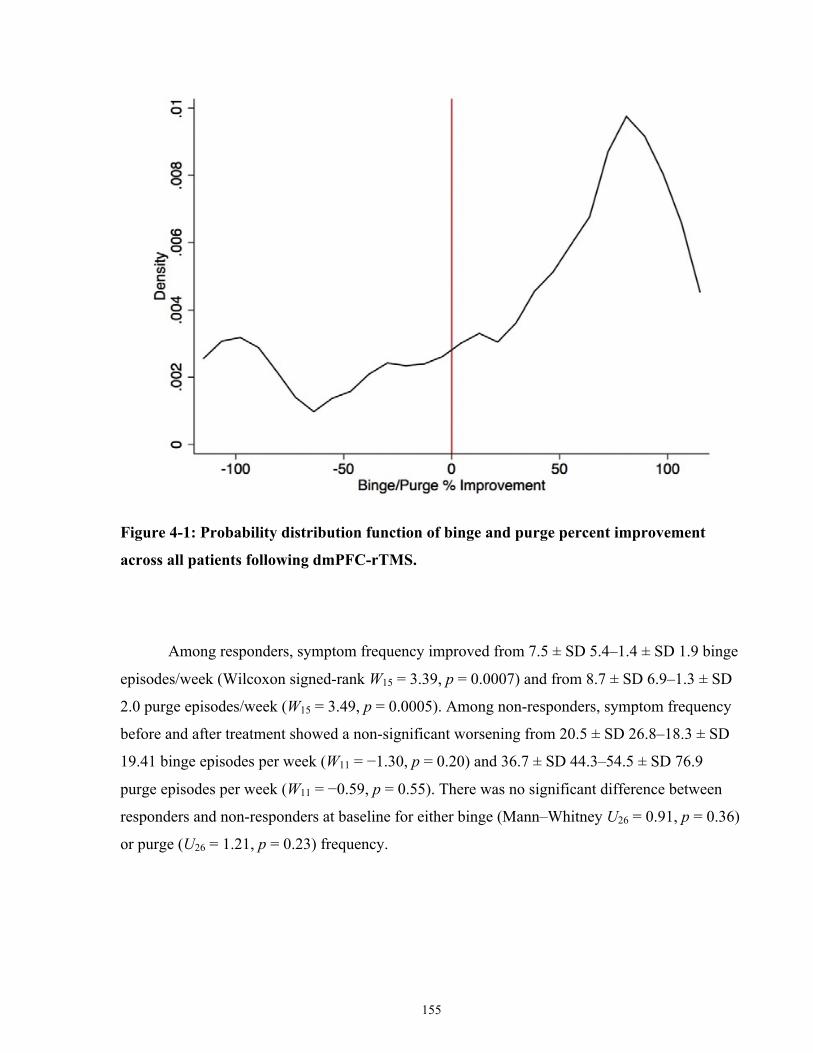
155
Figure 4-1: Probability distribution function of binge and purge percent improvement
across all patients following dmPFC-rTMS.
Among responders, symptom frequency improved from 7.5 ± SD 5.4–1.4 ± SD 1.9 binge
episodes/week (Wilcoxon signed-rank W15 = 3.39, p = 0.0007) and from 8.7 ± SD 6.9–1.3 ± SD
2.0 purge episodes/week (W15 = 3.49, p = 0.0005). Among non-responders, symptom frequency
before and after treatment showed a non-significant worsening from 20.5 ± SD 26.8–18.3 ± SD
19.41 binge episodes per week (W11 = −1.30, p = 0.20) and 36.7 ± SD 44.3–54.5 ± SD 76.9
purge episodes per week (W11 = −0.59, p = 0.55). There was no significant difference between
responders and non-responders at baseline for either binge (Mann–Whitney U26 = 0.91, p = 0.36)
or purge (U26 = 1.21, p = 0.23) frequency.
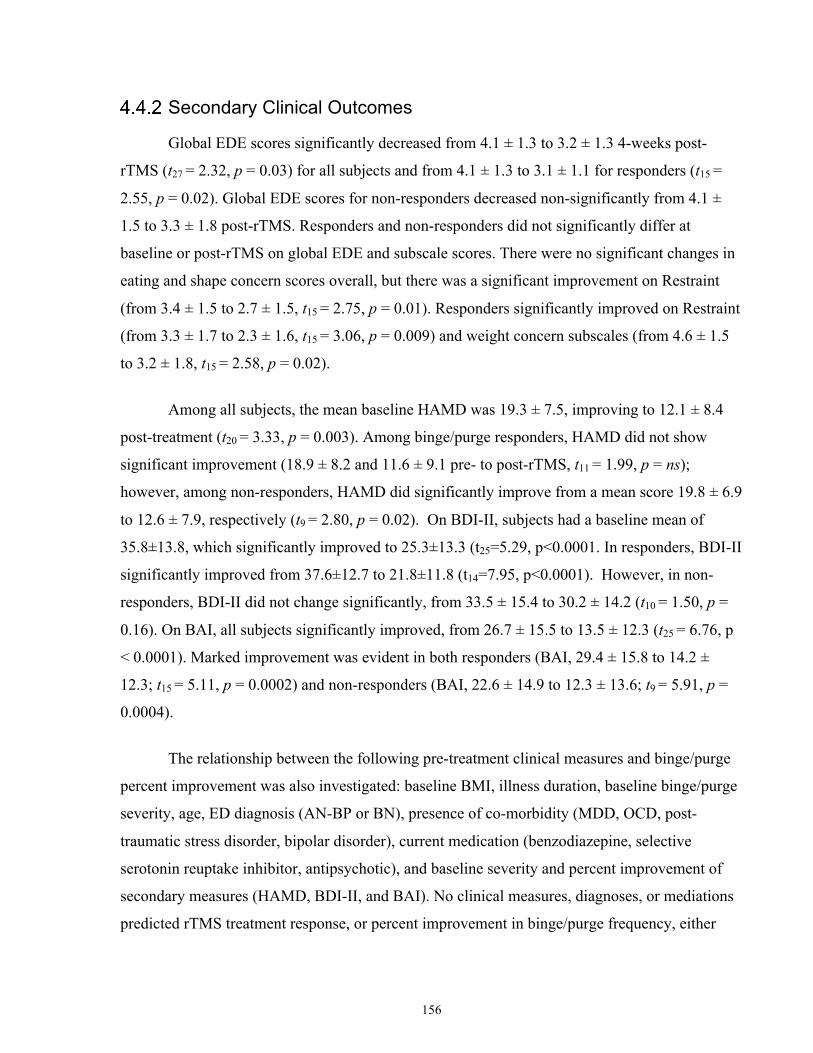
156
Secondary Clinical Outcomes
Global EDE scores significantly decreased from 4.1 ± 1.3 to 3.2 ± 1.3 4-weeks post-
rTMS (t27 = 2.32, p = 0.03) for all subjects and from 4.1 ± 1.3 to 3.1 ± 1.1 for responders (t15 =
2.55, p = 0.02). Global EDE scores for non-responders decreased non-significantly from 4.1 ±
1.5 to 3.3 ± 1.8 post-rTMS. Responders and non-responders did not significantly differ at
baseline or post-rTMS on global EDE and subscale scores. There were no significant changes in
eating and shape concern scores overall, but there was a significant improvement on Restraint
(from 3.4 ± 1.5 to 2.7 ± 1.5, t15 = 2.75, p = 0.01). Responders significantly improved on Restraint
(from 3.3 ± 1.7 to 2.3 ± 1.6, t15 = 3.06, p = 0.009) and weight concern subscales (from 4.6 ± 1.5
to 3.2 ± 1.8, t15 = 2.58, p = 0.02).
Among all subjects, the mean baseline HAMD was 19.3 ± 7.5, improving to 12.1 ± 8.4
post-treatment (t20 = 3.33, p = 0.003). Among binge/purge responders, HAMD did not show
significant improvement (18.9 ± 8.2 and 11.6 ± 9.1 pre- to post-rTMS, t11 = 1.99, p = ns);
however, among non-responders, HAMD did significantly improve from a mean score 19.8 ± 6.9
to 12.6 ± 7.9, respectively (t9 = 2.80, p = 0.02). On BDI-II, subjects had a baseline mean of
35.8±13.8, which significantly improved to 25.3±13.3 (t25=5.29, p<0.0001. In responders, BDI-II
significantly improved from 37.6±12.7 to 21.8±11.8 (t14=7.95, p<0.0001). However, in non-
responders, BDI-II did not change significantly, from 33.5 ± 15.4 to 30.2 ± 14.2 (t10 = 1.50, p =
0.16). On BAI, all subjects significantly improved, from 26.7 ± 15.5 to 13.5 ± 12.3 (t25 = 6.76, p
< 0.0001). Marked improvement was evident in both responders (BAI, 29.4 ± 15.8 to 14.2 ±
12.3; t15 = 5.11, p = 0.0002) and non-responders (BAI, 22.6 ± 14.9 to 12.3 ± 13.6; t9 = 5.91, p =
0.0004).
The relationship between the following pre-treatment clinical measures and binge/purge
percent improvement was also investigated: baseline BMI, illness duration, baseline binge/purge
severity, age, ED diagnosis (AN-BP or BN), presence of co-morbidity (MDD, OCD, post-
traumatic stress disorder, bipolar disorder), current medication (benzodiazepine, selective
serotonin reuptake inhibitor, antipsychotic), and baseline severity and percent improvement of
secondary measures (HAMD, BDI-II, and BAI). No clinical measures, diagnoses, or mediations
predicted rTMS treatment response, or percent improvement in binge/purge frequency, either
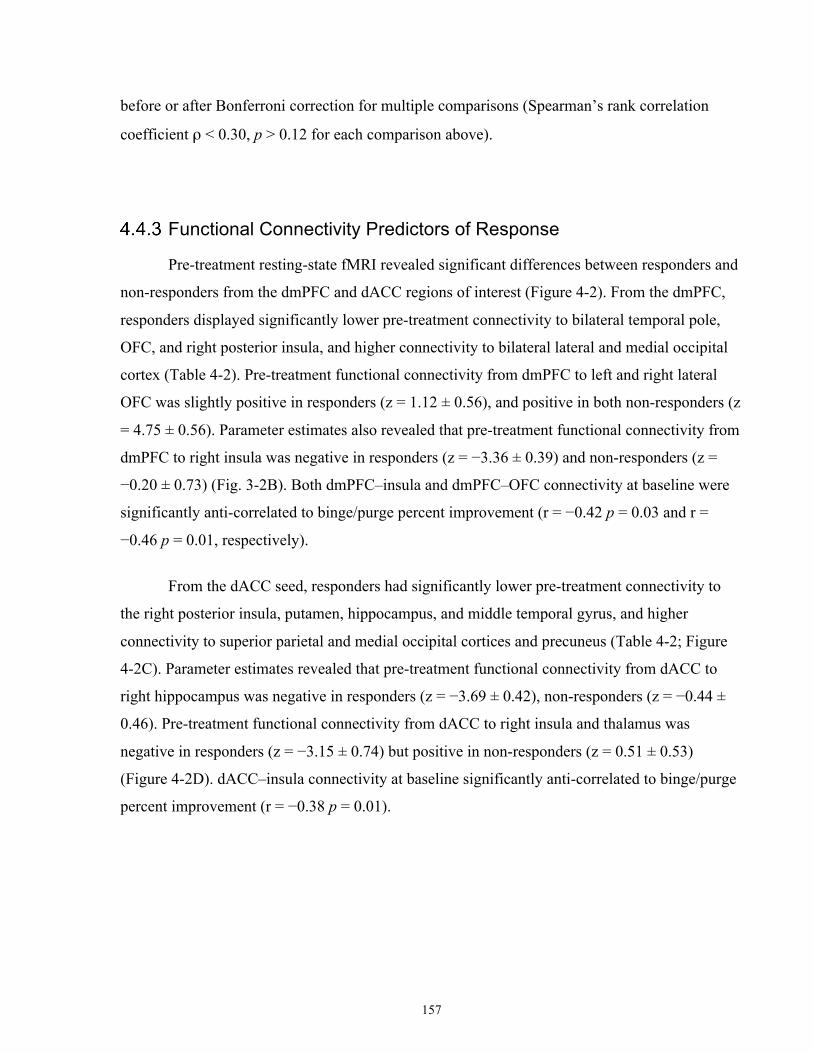
157
before or after Bonferroni correction for multiple comparisons (Spearman’s rank correlation
coefficient ρ < 0.30, p > 0.12 for each comparison above).
Functional Connectivity Predictors of Response
Pre-treatment resting-state fMRI revealed significant differences between responders and
non-responders from the dmPFC and dACC regions of interest (Figure 4-2). From the dmPFC,
responders displayed significantly lower pre-treatment connectivity to bilateral temporal pole,
OFC, and right posterior insula, and higher connectivity to bilateral lateral and medial occipital
cortex (Table 4-2). Pre-treatment functional connectivity from dmPFC to left and right lateral
OFC was slightly positive in responders (z = 1.12 ± 0.56), and positive in both non-responders (z
= 4.75 ± 0.56). Parameter estimates also revealed that pre-treatment functional connectivity from
dmPFC to right insula was negative in responders (z = −3.36 ± 0.39) and non-responders (z =
−0.20 ± 0.73) (Fig. 3-2B). Both dmPFC–insula and dmPFC–OFC connectivity at baseline were
significantly anti-correlated to binge/purge percent improvement (r = −0.42 p = 0.03 and r =
−0.46 p = 0.01, respectively).
From the dACC seed, responders had significantly lower pre-treatment connectivity to
the right posterior insula, putamen, hippocampus, and middle temporal gyrus, and higher
connectivity to superior parietal and medial occipital cortices and precuneus (Table 4-2; Figure
4-2C). Parameter estimates revealed that pre-treatment functional connectivity from dACC to
right hippocampus was negative in responders (z = −3.69 ± 0.42), non-responders (z = −0.44 ±
0.46). Pre-treatment functional connectivity from dACC to right insula and thalamus was
negative in responders (z = −3.15 ± 0.74) but positive in non-responders (z = 0.51 ± 0.53)
(Figure 4-2D). dACC–insula connectivity at baseline significantly anti-correlated to binge/purge
percent improvement (r = −0.38 p = 0.01).
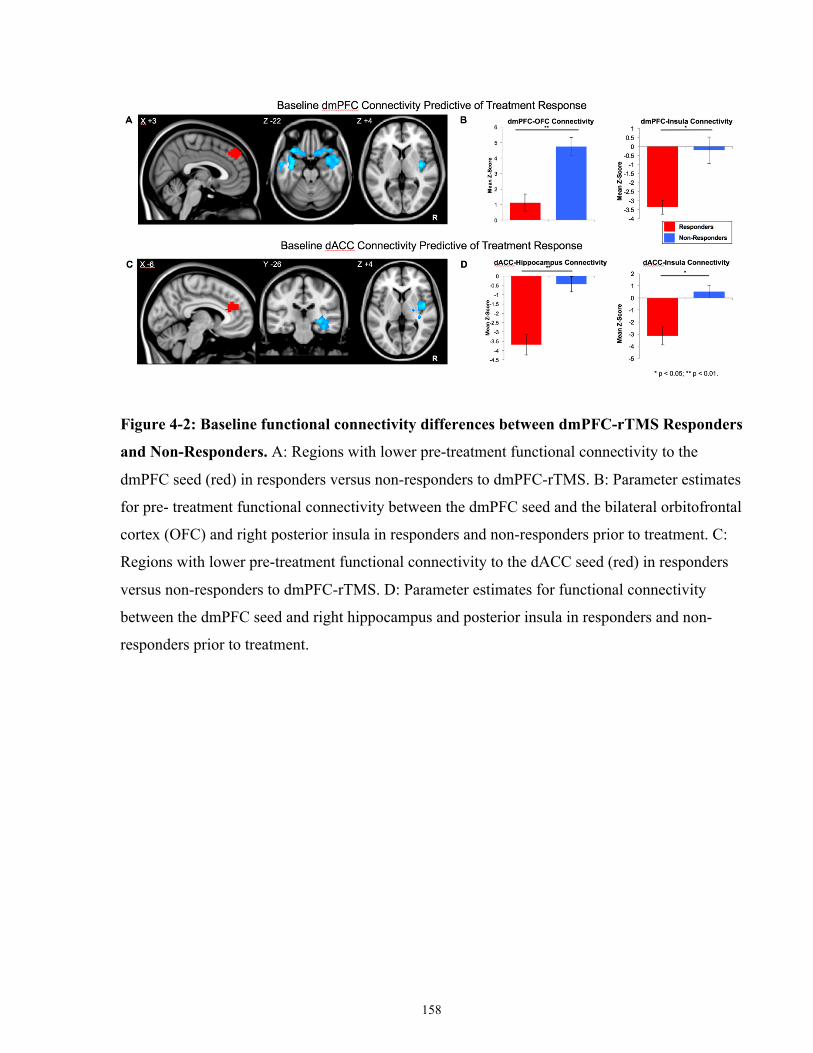
158
Figure 4-2: Baseline functional connectivity differences between dmPFC-rTMS Responders
and Non-Responders. A: Regions with lower pre-treatment functional connectivity to the
dmPFC seed (red) in responders versus non-responders to dmPFC-rTMS. B: Parameter estimates
for pre- treatment functional connectivity between the dmPFC seed and the bilateral orbitofrontal
cortex (OFC) and right posterior insula in responders and non-responders prior to treatment. C:
Regions with lower pre-treatment functional connectivity to the dACC seed (red) in responders
versus non-responders to dmPFC-rTMS. D: Parameter estimates for functional connectivity
between the dmPFC seed and right hippocampus and posterior insula in responders and non-
responders prior to treatment.
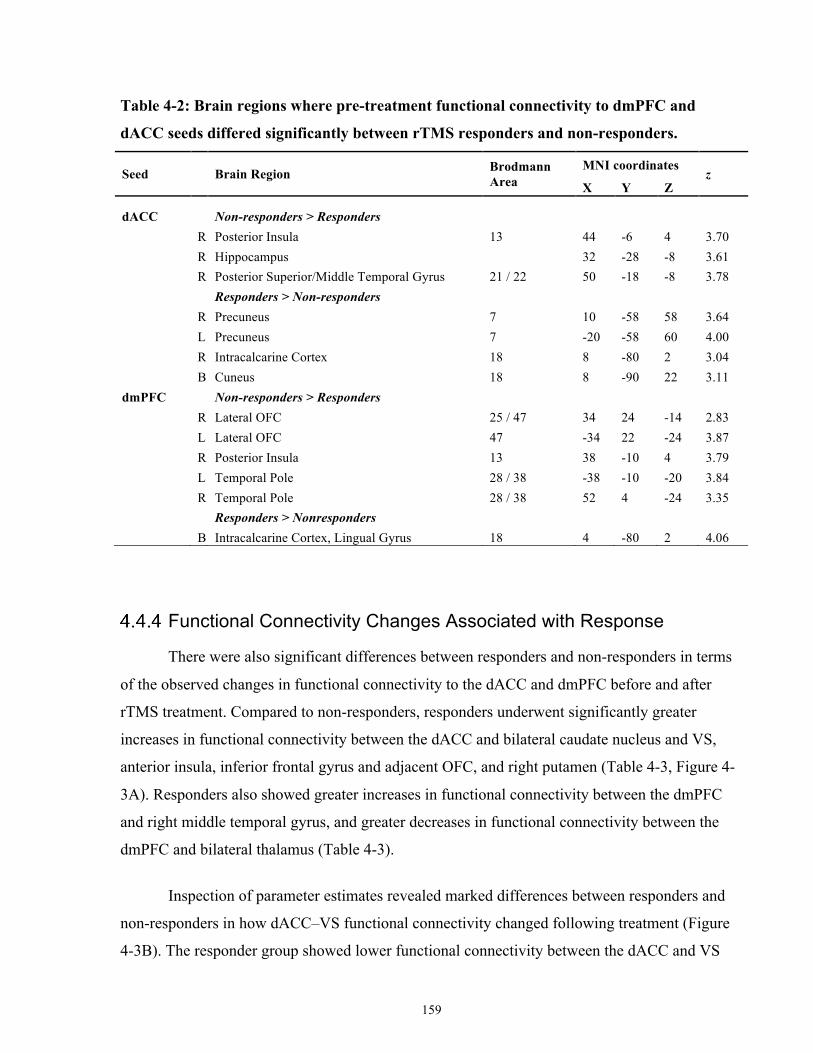
159
Table 4-2: Brain regions where pre-treatment functional connectivity to dmPFC and
dACC seeds differed significantly between rTMS responders and non-responders.
Seed Brain Region Brodmann Area
MNI coordinates z
X Y Z
dACC
Non-responders > Responders
R Posterior Insula 13 44 -6 4 3.70
R Hippocampus 32 -28 -8 3.61
R Posterior Superior/Middle Temporal Gyrus 21 / 22 50 -18 -8 3.78
Responders > Non-responders R Precuneus 7 10 -58 58 3.64
L Precuneus 7 -20 -58 60 4.00
R Intracalcarine Cortex 18 8 -80 2 3.04
B Cuneus 18 8 -90 22 3.11
dmPFC Non-responders > Responders
R Lateral OFC 25 / 47 34 24 -14 2.83
L Lateral OFC 47 -34 22 -24 3.87
R Posterior Insula 13 38 -10 4 3.79
L Temporal Pole 28 / 38 -38 -10 -20 3.84
R Temporal Pole 28 / 38 52 4 -24 3.35
Responders > Nonresponders
B Intracalcarine Cortex, Lingual Gyrus 18 4 -80 2 4.06
Functional Connectivity Changes Associated with Response
There were also significant differences between responders and non-responders in terms
of the observed changes in functional connectivity to the dACC and dmPFC before and after
rTMS treatment. Compared to non-responders, responders underwent significantly greater
increases in functional connectivity between the dACC and bilateral caudate nucleus and VS,
anterior insula, inferior frontal gyrus and adjacent OFC, and right putamen (Table 4-3, Figure 4-
3A). Responders also showed greater increases in functional connectivity between the dmPFC
and right middle temporal gyrus, and greater decreases in functional connectivity between the
dmPFC and bilateral thalamus (Table 4-3).
Inspection of parameter estimates revealed marked differences between responders and
non-responders in how dACC–VS functional connectivity changed following treatment (Figure
4-3B). The responder group showed lower functional connectivity between the dACC and VS
160
prior to treatment, increasing significantly following successful treatment (t12 = 2.37, p = 0.035).
Conversely, connectivity in non-responders decreased with a trend to significance (t8 = 2.316, p
= 0.05), becoming significantly lower than treatment responders post-treatment (t20 = 2.409, p =
0.03). A similar pattern of significant increases in functional connectivity in responders (t12 =
3.314, p = 0.006), but decreases in functional connectivity in non-responders, trending to
significance (t8 = 2.078, p = 0.07), was observed between the dACC and left anterior insula over
the course of treatment (Figure 4-3B). Binge/purge percent improvement was significantly
correlated with the change in dACC-left anterior insula connectivity (r = 0.45, p = 0.04) and
trended to significant correlation with the change in dACC-VS connectivity (r = 0.39, p = 0.07).
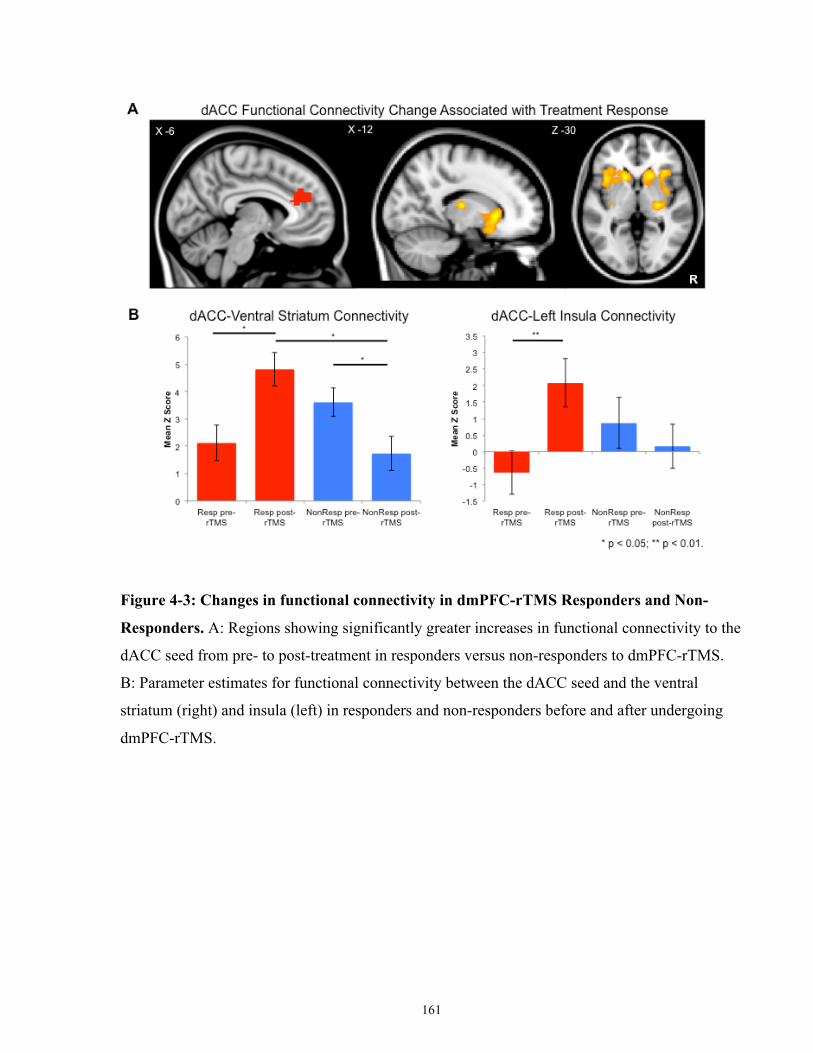
161
Figure 4-3: Changes in functional connectivity in dmPFC-rTMS Responders and Non-
Responders. A: Regions showing significantly greater increases in functional connectivity to the
dACC seed from pre- to post-treatment in responders versus non-responders to dmPFC-rTMS.
B: Parameter estimates for functional connectivity between the dACC seed and the ventral
striatum (right) and insula (left) in responders and non-responders before and after undergoing
dmPFC-rTMS.
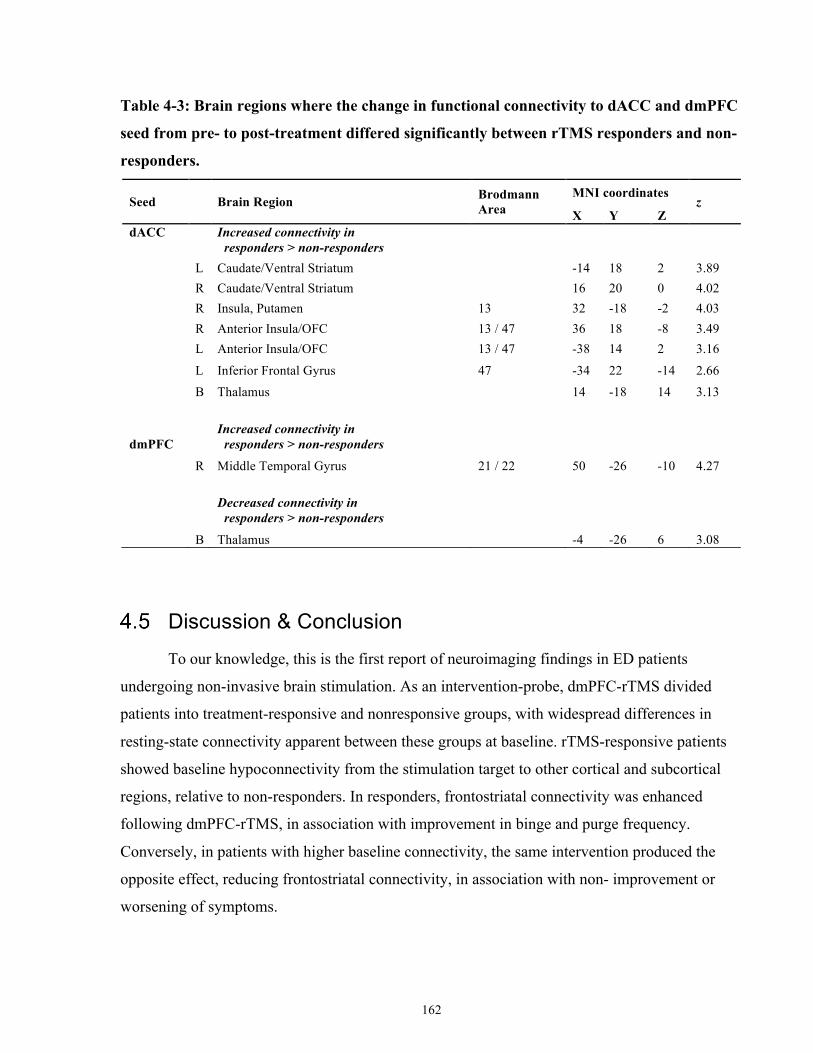
162
Table 4-3: Brain regions where the change in functional connectivity to dACC and dmPFC
seed from pre- to post-treatment differed significantly between rTMS responders and non-
responders.
Seed Brain Region Brodmann Area
MNI coordinates z
X Y Z dACC
Increased connectivity in responders > non-responders
L Caudate/Ventral Striatum
-14 18 2 3.89
R Caudate/Ventral Striatum
16 20 0 4.02
R Insula, Putamen 13 32 -18 -2 4.03
R Anterior Insula/OFC 13 / 47 36 18 -8 3.49
L Anterior Insula/OFC 13 / 47 -38 14 2 3.16
L Inferior Frontal Gyrus 47 -34 22 -14 2.66 B Thalamus 14 -18 14 3.13
dmPFC Increased connectivity in responders > non-responders
R Middle Temporal Gyrus 21 / 22 50 -26 -10 4.27
Decreased connectivity in responders > non-responders
B Thalamus -4 -26 6 3.08
Discussion & Conclusion To our knowledge, this is the first report of neuroimaging findings in ED patients
undergoing non-invasive brain stimulation. As an intervention-probe, dmPFC-rTMS divided
patients into treatment-responsive and nonresponsive groups, with widespread differences in
resting-state connectivity apparent between these groups at baseline. rTMS-responsive patients
showed baseline hypoconnectivity from the stimulation target to other cortical and subcortical
regions, relative to non-responders. In responders, frontostriatal connectivity was enhanced
following dmPFC-rTMS, in association with improvement in binge and purge frequency.
Conversely, in patients with higher baseline connectivity, the same intervention produced the
opposite effect, reducing frontostriatal connectivity, in association with non- improvement or
worsening of symptoms.
163
Of particular interest were the divergent trajectories of outcome across individuals. While
many subjects showed marked improvement, a large proportion of subjects did not improve, or
even showed deterioration, when exposed to the same intervention. The observation of divergent
responses to dmPFC-rTMS in ED is in keeping with our previous report of a sharply bimodal
distribution of responses to dmPFC-rTMS in TRD (Downar et al, 2014). Of note, similarly
dichotomous trajectories of improvement have been identified in clinical trials of duloxetine
(Gueorguieva et al, 2011) and escitalopram (Thase et al, 2011).
The possibility of a neurobiological basis for the responder–non-responder dichotomy in
the present study is supported by differences in resting-state functional connectivity observed
between the two groups before treatment. In keeping with our first hypothesis, responders had
significantly lower functional connectivity from the dmPFC and adjacent dACC to subcortical
and cortical areas involved in emotion generation and regulation: hippocampus, lateral
orbitofrontal cortex, and insula. These findings are consistent with several previous studies in
MDD patients, linking baseline resting-state hypoconnectivity to better rTMS response (Fox et
al, 2012b, 2013a; Liston et al, 2014; Salomons et al, 2014).
The observation of baseline hypoconnectivity to the target as a predictor of rTMS
response is notable for being consistent with recent findings from three independent groups:
better response to rTMS in trials using DLPFC targets that were more negatively correlated with
sg-ACC (Fox et al, 2013a), better response to DLPFC-rTMS in patients with baseline
hypoconnectivity from DLPFC and dmPFC to sg-ACC (Fox et al, 2012b), and better response to
dmPFC-rTMS in patients with baseline hypoconnectivity in cortico-striatal-thalamic circuits via
the stimulation target (Salomons et al, 2014). Given the consistency of this observation across
multiple rTMS targets in multiple populations, hypoconnectivity of the stimulation target to
limbic cortical or subcortical regions may be worth further investigation as a biomarker of rTMS
response in future trials with larger sample sizes.
Another key finding in the present study is that the same 10 Hz intervention had widely
divergent effects on functional connectivity across individuals: patients with high baseline
cortico-cortical and fronto-insular connectivity saw significant reductions after 10 Hz rTMS,
while patients with low baseline frontostriatal and fronto-insular connectivity saw significant
increases after stimulation at the same frequency. This phenomenon is unlikely to represent a
164
regression to the mean, as the groups showed divergence rather than convergence in both
symptomatology and functional connectivity over treatment. The results are also consistent with
our previously reported observations of markedly dichotomous effects on striatal, thalamic and
cortical functional connectivity from 10 Hz dmPFC-rTMS in patients with MDD (Salomons et
al, 2014). The results are also consistent with previous studies of DLPFC-rTMS in depression:
while some improved with high- frequency rTMS, others worsened on this regimen, and instead
responded better to low-frequency stimulation of the same target (Kimbrell et al, 1999; Speer et
al, 2000, 2009). These findings are consistent with mounting evidence that the physiological
effects of a given rTMS protocol can vary widely across individuals, not just in magnitude but
also in direction (Cárdenas-Morales et al, 2014; Eldaief et al, 2011; Hallett, 2007; Maeda et al,
2000).
The divergent effects of 10 Hz stimulation on fronto-insular and fronto-striatal
connectivity could potentially reflect pre-existing differences in impulsivity and cognitive
flexibility between responders and non-responders. For example, in healthy populations, higher
resting-state dACC-insula and dACC-striatal connectivity is correlated with better performance
on decision-making tasks, cognitive flexibility, and lower measures of impulsivity (Jung et al,
2014; Müller et al, 2015). Furthermore, impulsivity when experiencing negative affect is
positively correlated with bulimia severity (Fischer et al, 2003), and BN is associated with
deficits in executive functioning (as assessed, for example, on a gambling task) (Brand et al,
2007). Thus, significant increases in dACC-striatal functional connectivity in responders
following rTMS could potentially lead to improvements in impulsivity and executive
functioning, which in turn lead to symptom improvement. Conversely, symptom worsening in
non-responders may potentially be a result of the observed decreases in fronto-insular and
frontostriatal connectivity and concomitant worsening of impulsivity and executive functioning.
The present study unfortunately did not measure these cognitive functions directly. However, a
future study including behavioral measures of cognitive control and impulsivity would be useful
in testing a hypothesized mechanism of action in which rTMS-induced increases in dACC-
striatal/insular functional connectivity lead to improved impulse control and executive function,
and thus to symptomatic improvement.
The heterogeneity of observed rTMS effects at the neural and clinical level, speaks to the
unresolved issue of individual variability in the physiological effects of rTMS. Classically, 10 Hz

165
rTMS is considered to have an excitatory effect on neural activity, while low frequency rTMS is
thought to have an inhibitory effect (Hallett, 2007). However, marked inter-individual
variability in rTMS effects has been long been observed in electrophysiological, and
neuroimaging studies. For example, a large minority of subjects show paradoxical inhibition of
motor evoked potentials after 10 Hz rTMS, or enhancement from 1 Hz rTMS, and the effects of
the different frequencies are not reliably opposite within a given individual (Maeda et al, 2000).
On fMRI, 1 Hz rTMS enhances functional connectivity from the target to co-activating cortical
regions in some individuals, but reduces functional connectivity in others, with no consistent
direction of overall effect (Eldaief et al, 2011). Conversely, patterns of network connectivity to
the stimulation target have been reported to influence the magnitude of rTMS-induced motor
facilitation (Cárdenas-Morales et al, 2014). In light of such findings, it has been proposed that rs-
fMRI might provide a useful marker for individualizing the target of rTMS (Fox et al, 2013a).
The findings of the present study suggest that fMRI may also be useful for individualizing the
pattern of rTMS, as has previously been shown in studies using positron emission tomography
(Kimbrell et al, 1999; Speer et al, 2000, 2009). Once again, the potential utility of neuroimaging
biomarkers for rTMS parameter selection is an important topic for future study.
One limitation of this preliminary study involves its relatively small sample size. Though
the sample was slightly larger than those used in several recent rTMS-fMRI studies in more
prevalent disorders such as TRD (Baeken et al, 2014; Liston et al, 2014; Salomons et al, 2014),
the present study does not allow a more detailed characterization of potentially important clinical
markers that could help distinguish treatment subpopulations. Although the present investigation
did not find statistically significant pre-treatment differences between responders and non-
responders in terms of duration of illness, BMI, and binge/purge frequency, future studies with
higher power will be necessary to better assess whether those with more severe illness in general
are less likely to respond to treatment. Another caveat relates to the inclusion of multiple DSM-5
diagnostic categories in the current sample, which embraced ED patients with binge−purge
behaviors alongside common comorbidities. On this point, we note that the sample composition
was chosen to be representative of clinical populations presenting with refractory binge−purge
symptoms, and that no DSM-5 diagnosis significantly correlated with rTMS response. More
generally, it is unclear that current categorical nosologies map particularly well on to rTMS
responsiveness in general; the distinction between unipolar and bipolar depression had no

166
bearing on outcome in a recent meta-analysis of rTMS efficacy (Berlim et al, 2014). We are
aware that some of our subjects were underweight, and that improvements in bingeing and
purging represent a limited area of improvement for such individuals. However, given the
exploratory nature of this trial, and the notorious difficulty in treatment individuals with AN-BP,
we felt it was important to include such individuals in the trial. It is clear that the question of
whether dmPFC-rTMS aids other forms of disordered eating (including restrictive-type
behaviors) is still an important area for future investigation.
Another limitation is the lenient multiple comparisons correction. As more recent
publications have recommended stringent correction for multiple comparisons of resting-state
functional connectivity (Eklund et al, 2016), the risk for Type I errors in these studies is
potentially high. However, a number of factors mitigate concern regarding this methodological
limitation. Most importantly, the neuroimaging results across these three independent samples
are consistent. Second, the baseline frontostriatal predictor of treatment response is consistent
with Study III (which used more stringent correction). Finally, as evidenced in Sections 1.4, 1.5,
1.6, 1.8 and 1.9 of this thesis, the neuroimaging results are consistent with disorder etiology and
mechanisms of treatment response.
Another potential criticism relates to the use of an open-label design without sham
stimulation. Since no previous studies have examined dmPFC-rTMS in ED, and since the
primary aim of the study was to apply an intervention-probe and characterize neural predictors
and correlates of response (as in our recent work in depression), we opted for the present
approach in order to identify sources of heterogeneity that might confound a future sham-
controlled trial. The results suggest that three potentially critical confounds will need to be
accommodated in future trials: first, the presence of distinct neural endophenotypes, not readily
apparent on standard diagnostic criteria, but with differential responses to the intervention at both
the neural and the clinical level; second, the need to tailor rTMS parameters to the individual
patient in order to avoid paradoxical effects; third, whether predictors of improvement relate to
illness mechanism, or a capacity to change with rTMS treatment, or both. Our results suggest
that resting-state fMRI techniques help address both of these issues in any future randomized
controlled study of rTMS in ED.
167
In conclusion, dmPFC-rTMS shows promising therapeutic effects in a subset of ED
patients with refractory binge and purge behaviors. As in TRD, therapeutic effects are associated
with increases in initially low levels of frontostriatal functional connectivity, detectable on pre-
treatment rs-fMRI. However, a significant proportion of patients have initially higher baseline
frontostriatal connectivity, and in these patients, the same intervention produces paradoxical
decreases in frontostriatal connectivity after treatment, alongside non-response or worsening of
clinical symptoms. A randomized controlled trial of dmPFC-rTMS in ED would be a reasonable
next step. However, the results of this study join a growing body of evidence, suggesting that
future trials of rTMS will need to take into account both the heterogeneity of individual patients’
neural activity, and the heterogeneity of effects ensuing from the stimulation itself. Pre-treatment
neuroimaging may eventually play a crucial role in optimizing stimulation parameters, to
maximize the chances of success in each patient presenting for treatment.
168
Study II: Baseline Predictors and Mechanisms of dmPFC-rTMS response in OCD
Introduction The research in this chapter was originally published as Dunlop, K., Woodside, B.,
Olmsted, M., Colton, P., Giacobbe, P., Downar, J. “Reductions in Cortico-Striatal
Hyperconnectivity Accompany Successful Treatment of Obsessive-Compulsive Disorder with
Dorsomedial Prefrontal rTMS,” Neuropsychopharmacology. 41, 1395-403.
OCD is a severely disabling psychiatric disorder with a lifetime prevalence of 1–3%
(Abramowitz et al, 2009). OCD is characterized by intrusive, anxiety-provoking, ego-dystonic
thoughts (obsessions), and associated repetitive behaviors (compulsions) (American Psychiatric
Association, 2013). Of the OCD patients, 40– 60% are refractory to conventional
pharmacological and behavioral therapies (Pallanti et al, 2002). It is therefore crucial to develop
novel therapies through a better under- standing of the pathophysiology of OCD and the
mechanisms of successful treatment.
Previous human and animal studies suggest that abnormalities in the CSTC circuitry may
be central to OCD pathophysiology (Admon et al, 2015; Ahmari et al, 2013; Harrison et al,
2009; Menzies et al, 2008). In healthy humans, specific CSTC loop circuits are important for
self-regulation of affect, cognition, and behavior (van den Heuvel et al, 2010; Lipsman et al,
2013a; Marsh et al, 2009a). In OCD, these circuits display structural abnormalities relative to
controls: volumetric gray matter reductions and reduced white matter integrity in the anterior
cingulate cortex (Kühn et al, 2013), gray matter reductions in the orbitofrontal cortex (Rotge et
al, 2010), and gray matter increases in thalamus and ventral striatum (Hou et al, 2013). On
fMRI, abnormal cortical-ventral striatal hyperconnectivity has been observed in OCD during a
monetary incentive delay task (Beucke et al, 2012), during symptom provocation and during rest
in many studies (Anticevic et al, 2014; Cocchi et al, 2012; Figee et al, 2013; Harrison et al,
2009). One study has shown the opposite, corticostriatal hypoconnectivity, in a group of
unmedicated patients (Posner et al, 2014). In addition, altered anterior cingulate cortex metabolic
activity has been observed in OCD on fluorodeoxyglucose-positron emission tomography and
magnetic resonance spectroscopy (Ebert et al, 1997; O’Neill et al, 2013; Perani et al, 1995;
169
Saxena et al, 2004, 2009). Taken together, these observations delineate a possible
neuroanatomical substrate for OCD symptomatology.
Neuromodulation treatments offer a novel, anatomically targeted approach to refractory
psychiatric conditions. DBS has shown promising effects for OCD in recent studies (Greenberg
et al, 2010); several CSTC targets have been explored, including the anterior limb of the internal
capsule (Abelson et al, 2005), subthalamic nucleus (Mallet et al, 2008), and ventral striatum/
NAc (Denys et al, 2010; Figee et al, 2013). Regarding therapeutic mechanisms, a recent fMRI
study found that NAc-DBS normalized excessive functional connectivity between NAc and
dorsomedial and DLPFC in OCD patients; the degree of reduction correlated to the degree of
symptomatic improvement (Figee et al, 2013).
Although DBS has shown promising effects in severe, refractory OCD cases, noninvasive
forms of neuromodulation could be offered to a much wider range of patients. rTMS could
present a noninvasive alternative to DBS in OCD, if directed at a suitable stimulation target.
rTMS to the DLPFC, although successful in major depression (Berlim et al, 2014; O’Reardon et
al, 2007), has shown minimal clinical benefit over sham in double-blind trials for OCD (Alonso
et al, 2001; Sachdev et al, 2007). However, medial prefrontal targets appear more promising: 1
Hz rTMS of the SMA and pre-SMA has achieved substantial symptom improvement in case
reports and randomized controlled trials (Mantovani et al, 2006, 2010). Likewise, with
transcranial direct current stimulation, cathodal but not anodal stimulation of the SMA has been
reported to improve OCD symptoms (D’Urso et al, 2016).
A neighboring potential target is the dmPFC, just anterior to the pre-SMA. Abnormally
high resting state functional connectivity and gray matter volume reductions in dmPFC (Radua
et al, 2010) have been observed in OCD patients relative to controls. With NAc-DBS (Figee et
al, 2013), therapeutic efficacy correlated to reduction in excessive frontostriatal connectivity
through the dmPFC regions. dmPFC-rTMS has not yet been studied in OCD. However, in major
depressive disorder (MDD), a recent open-label study of 10Hz dmPFC-rTMS for treatment-
resistant MDD achieved ⩾50% symptom improvement in approximately half of the patients
(Downar et al, 2014). Notably, therapeutic effects correlated to change in CSTC connectivity
through the dmPFC on fMRI, as with NAc- DBS in MDD (Salomons et al, 2014). These
170
observations raise the possibility that dmPFC-rTMS might be able to engage a similar
therapeutic mechanism through noninvasive means in OCD.
In the current study, we used resting-state fMRI to characterize predictors and correlates
of treatment response to 20-30 sessions of open-label 10 Hz dmPFC-rTMS for treatment-
refractory OCD.
Aims & Hypotheses The general aim of Study II is to establish baseline predictors of, and neural
correlates/mechanisms of, OCD symptom improvements following 20-30 sessions of 10 Hz
dmPFC-rTMS.
Specific Aims of Study II 1. To determine whether 20-30 sessions of open-label 10 Hz dmPFC-rTMS improves the
severity of obsessive thoughts and compulsive behaviours in OCD.
2. To identify patterns of baseline dmPFC resting-state functional connectivity that
significant differ between OCD dmPFC-rTMS responders and non-responders.
3. To identify pre- to post-treatment changes in resting-state functional connectivity that
correlate with improvements in OCD symptom severity.
Hypotheses of Study II 1. The severity of obsessive thoughts and compulsive behaviours in OCD patients will
significantly improve in response to 20-30 sessions of open-label 10 Hz dmPFC-rTMS.
2. As with DBS, OCD patients with higher dmPFC-CSTC resting-state functional
connectivity will show better response to open-label 10 Hz dmPFC-rTMS.
3. As with DBS, OCD patients who show decreases in pre- to post-treatment dmPFC-CSTC
resting-state functional connectivity after dmPFC-rTMS will show more improvement in
OCD symptom severity.

171
Methods
Subjects
Twenty patients with a DSM-IV diagnosis of OCD participated in the study (males = 4;
mean age = 37.3 ± [standard deviation] 15.5; age range = 21 – 63 years). OCD and co-morbid
Axis I and Axis II disorders were diagnosed by a board-certified psychiatrist using the
aforementioned DSM-IV criteria during a semi-structured clinical psychiatric interview
incorporating the MINI. All patients reported at least one failed medication trial on clinical
interview, meaning that the individual was unable to tolerate or was clinically unresponsive to
the treatment (mean number of previously failed medication = 5.7 ± 4.1 trials). 19 of 20
participants reported at clinical interview that they had failed at least one attempt at cognitive or
behavioural invention, meaning that they did not complete the intervention, or that the individual
was nonresponsive clinical intervention. The mean OCD illness duration was 24.2 ± 15.2 years
(OCD illness duration range = 8 – 54), indicating that all patients enrolled in the study exhibited
chronic OCD. No patients exhibited hoarding symptomatology. Comorbidities including MDD
(n = 16), bipolar disorder (n = 2), anorexia nervosa (n = 5), bulimia nervosa (n = 4), post-
traumatic stress disorder (n = 4), and Tourette’s syndrome (n = 1). No patients had a history of
tics.
Patients were required to maintain a stable medication regimen for at least 4 weeks prior
to and throughout rTMS treatment. Current medications included neuroleptic agents (n = 12),
selective serotonin reuptake inhibitors (n = 8), serotonin-norepinephrine reuptake inhibitors (n =
3), trazodone (n = 2), lithium (n = 1) and benzodiazepines (n = 10). The maximum daily
benzodiazepine doses were 2mg clonazepam; 4.5mg bromazepam, and 0.75mg alprazolam.
Forty healthy controls (males = 17, mean age = 34.88 ± 11.76 years, age range = 18 – 66
years) were recruited as a comparator group for resting-state connectivity analyses. All controls
were screened by trained research staff. Participants were screened for current and previous
psychiatric illness including current substance abuse or dependence, contraindications to MRI,
and any psychotropic medications. There were no differences in age and sex between the OCD
and healthy control group (age t58 = 1.85; p = n.s.; sex χ2 = 2.97, p = n.s.). Healthy participants
underwent MRI, but did not undergo a course of rTMS.
172
All patients and healthy controls provided informed consent, and the study was approved
by the University Heath Network Research Ethics Board.
Clinical Measures
The primary clinical outcome measure was the Y-BOCS (Goodman et al, 1989), and was
collected at baseline (prior to rTMS treatment) and at 2-weeks post-treatment. In this study,
treatment response was defined as ⩾50% improvement on the Y-BOCS from baseline to 2-
weeks post-treatment.
Secondary clinical scales assessing comorbid depressive and anxiety symptomatology
were also collected, and included the 17-item HAMD (Hamilton, 1960), the BDI-II (Beck et al,
1961), and the BAI (Beck et al, 1988). Additional clinical variables collected included the
duration of illness, number of previous hospitalizations and outpatient treatment programs,
number of previous medication trials, and the current medication type and dosage. Kernel
density estimates of the distribution of clinical response on Y-BOCS was generated using
Stata13 (College Station, TX, USA).
Intervention
rTMS was delivered under MRI guidance using the MagPro R30 system equipped with a
Cool-DB80 coil (MagVenture, Farum, Denmark) and the Visor 2.0 neuronavigation system
(Advanced Neuro Technologies, Enschede, Netherlands). The Visor software was used for
anatomical landmarking and co-registration of the brain into the standard stereotaxic space of
Talairach and Tournoux, followed by segmentation of T1 images into scalp and brain
compartments, rendering of 3D surfaces for the scalp and brain, and co-registration of these
surfaces to the patient’s head for coil placement during treatment. As in our previous studies of
dmPFC-rTMS, we selected a dmPFC target region at the stereotaxic coordinate (X 0 Y+30 Z
+30) for stimulation and the scalp point closest to the coordinate (X 0 Y+60 Z+60) was used as
the focal point for coil placement during treatment. This point corresponds to approximately
25% of the distance from nasion to inion (slightly anterior to Fz according to the international
173
10-20 EEG electrode positioning system). By comparison, the dmPFC target is slightly anterior
to the location specified by previous authors targeting the pre-SMA for rTMS in OCD, which
was at 35% of the nasion-inion distance (Mantovani et al, 2010). The coil vertex was placed over
the interhemispheric fissure, immediately anterior to the central sulcus, under MRI guidance.
Preferential stimulation of left and right hemisphere was achieved by orienting the coil laterally,
with the current flow directed towards the hemisphere to be stimulated. Resting motor
thresholds were established based on activation of the contralateral extensor halluces longus,
determined by visual inspection.
During treatment, rTMS was delivered over the dmPFC scalp coordinate above, with
lateral coil orientation for preferential stimulation of the left then right dmPFC (Harmer et al,
2001; Terao et al, 2001) at 120% of the EHL resting motor threshold, at a stimulation frequency
of 10 Hz, with a duty cycle of 5 s on and 10s off, for 60 trains, resulting in 3000 pulses per
hemisphere in each session. Stimulation was delivered on weekdays for 20 daily sessions on
weekdays, with non-remitters offered extension to 30 sessions.
Neuroimaging Acquisition and Analysis
Patients underwent MRI sessions one week prior to and one week after rTMS treatment,
on a 3T GE Signa HDx scanner equipped with an 8-channel phased-array head coil, using a
protocol we have previously reported (Salomons et al, 2014). This comprised a T1-weighted fast
spoiled gradient-echo anatomical scan (TE = 12ms, TI = 300ms, flip angle=20°, 116 sagittal
slices, thickness = 1.5mm, no gap, 256 x 256 matrix, FOV = 240mm), followed by a 10-min
resting-state, eyes-closed T2* series (TE=30ms, TR = 2000ms, flip angle=85°, 32 axial slices,
thickness=5mm, no gap, 64x64 matrix, FOV=220mm, 300 TRs, 2 s temporal resolution).
MRI data preprocessing and seed-based region-of-interest analyses was implemented in
the FSL software package (Jenkinson et al, 2012), using FEAT (Beckmann et al, 2003) for the
following steps: discarding the first 5 volumes for signal stabilization, interleaved slice-timing
correction, tissue segmentation using BET (Jenkinson et al, 2002), motion correction using
MCFLIRT (Smith, 2002), and spatial smoothing (6 mm FWHM Gaussian kernel). A nuisance
linear regression analysis was conducted using 6 motion parameters and FAST (Zhang et al,
174
2001), extracted white matter and cerebrospinal fluid mean time series. Functional data was then
bandpass filtered (0.009-0.009 Hz) and co-registered to the MNI-152 standard atlas.
One a priori cortical and five exploratory subcortical ROIs were selected as seeds for
whole-brain functional connectivity analysis (Table 5-1, Figure 5-1). In cortex, a dmPFC ROI
were defined from a resting-state connectivity-based atlas (Craddock et al, 2012b), based on
proximity to the rTMS stimulation coordinate. Two other seeds were selected based on CSTC
connectivity in OCD and their therapeutic use in DBS: the medial dorsal thalamus (MDT), from
an thalamic connectivity atlas (Behrens et al, 2003), and the STN, from a probabilistic STN atlas
(Forstmann et al, 2012). Three exploratory bilateral ventral striatal sites (superior ventral
striatum [VSs], inferior ventral striatum [VSi] and ventral rostral putamen [VRP]) (Di Martino et
al, 2008) were selected to identify striatal connectivity associated with response. A medial dorsal
thalamus (MDT) ROI was created using the Oxford Thalamic Connectivity Atlas (Behrens et al,
2003), and a subthalamic nucleus (STN) ROI was created using a probabilistic subthalamic
nucleus atlas (Forstmann et al, 2012).
Each seed ROI was co-registered from standard space to each subject’s anatomical MRI
using the transformation matrix from the original registration to standard space in FLIRT, and its
mean time series was then extracted and used as a regressor in a first-level analysis to generate a
whole-brain map of voxels positively and negatively correlated to each ROI for each subject. To
localize regions where pre-treatment functional connectivity correlated to treatment response,
FSL’s FLAME mixed effects model (Beckmann et al, 2003) was then applied for the group-level
analysis using the responder/non-responder status of each subject as a categorical, group-level
regressor.
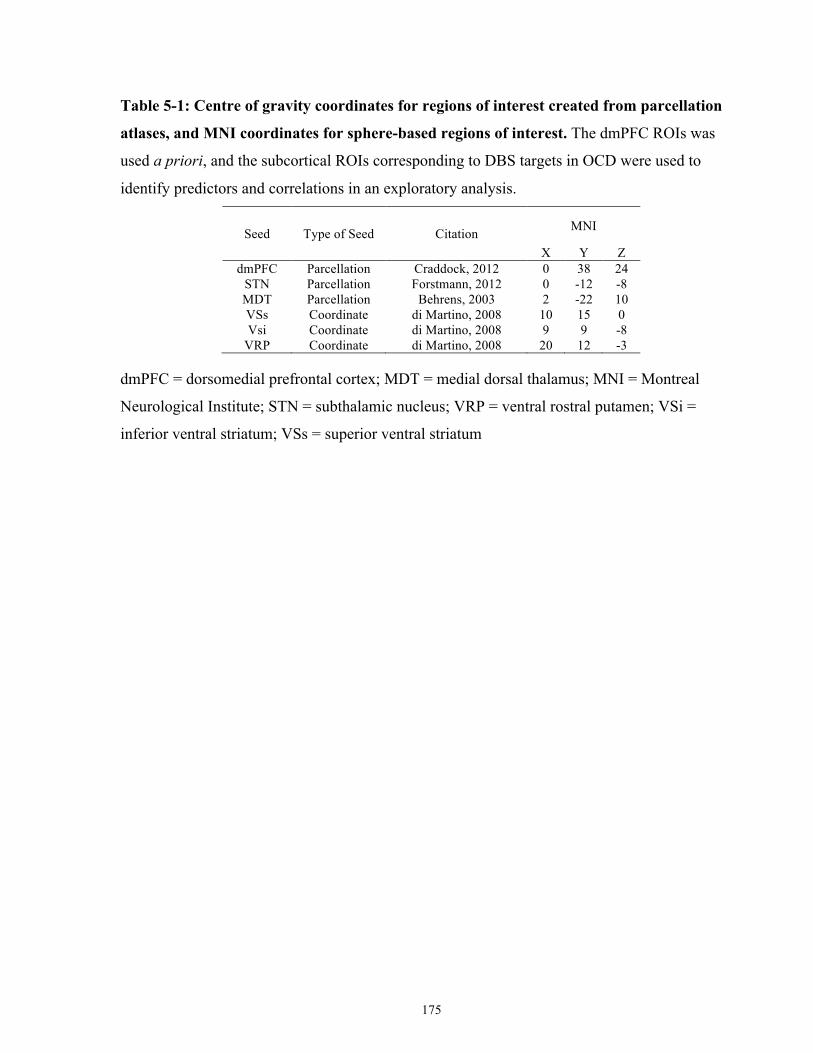
175
Table 5-1: Centre of gravity coordinates for regions of interest created from parcellation
atlases, and MNI coordinates for sphere-based regions of interest. The dmPFC ROIs was
used a priori, and the subcortical ROIs corresponding to DBS targets in OCD were used to
identify predictors and correlations in an exploratory analysis.
Seed Type of Seed Citation MNI
X Y Z dmPFC Parcellation Craddock, 2012 0 38 24
STN Parcellation Forstmann, 2012 0 -12 -8 MDT Parcellation Behrens, 2003 2 -22 10 VSs Coordinate di Martino, 2008 10 15 0 Vsi Coordinate di Martino, 2008 9 9 -8
VRP Coordinate di Martino, 2008 20 12 -3
dmPFC = dorsomedial prefrontal cortex; MDT = medial dorsal thalamus; MNI = Montreal
Neurological Institute; STN = subthalamic nucleus; VRP = ventral rostral putamen; VSi =
inferior ventral striatum; VSs = superior ventral striatum

176
Figure 5-1: Regions of interest created from parcellation atlases and coordinates. (A) The a
priori dmPFC parcellation-based region of interest derived from the Craddock (2012) atlas. (B)
The VSs (above) and VSi (below) regions of interest from the di Martino (2008) striatal
parcellation. (C) The MDT parcellation-based region of interest derived from the Behrens (2003)
thalamic parcellation. (D) The STN parcellation-based region of interest derived from the
Forstmann (2012) probabilistic parcellation of the STN. (E). The VRP region of interest from the
di Martino (2008) striatal parcellation.
To localize regions where the changes in functional connectivity from pre- to post-
treatment correlated to the degree of treatment response, a within-subjects, fixed-effects general
linear model analysis was performed for each subject and seed region. This resulted in a set of
first-level statistical parametric maps for each subject and each seed indicating regional increases
and decreases in functional connectivity to the seed from pre- to post-treatment. For group-level
analysis, these individual-subject change maps were then entered into a between-subjects mixed-
177
effects linear regression analysis, using the responder/non-responder status of each subject as a
categorical, group-level independent variable. Corrections for multiple comparisons were
performed using Gaussian random field theory (Z>1.96, cluster significance p<0.05 corrected).
Parameter estimates for individual subjects’ functional connectivity values (mean z-
score) of our seed and cluster regions were then extracted for post hoc analysis. An 8 mm sphere
centered at the peak cluster voxel (masked by the relevant cluster to ensure anatomical
specificity) was registered from standard space to each individual subject using the
transformation matrix from the original registration, extracting the mean z-score values from
relevant connectivity maps. Baseline z-scores were extracted from individual subjects’ baseline
functional connectivity maps. Change z-scores were extracted from individual subjects’ pre-
versus-post-treatment contrast maps.
Results
Clinical Outcomes
Subjects completed, on average, 21.3 ± 4.1 sessions of 10 Hz dmPFC-rTMS (range = 14
– 30 sessions). Treatment was well-tolerated, with no serious or treatment-limiting adverse
effects occurring. One subject discontinued treatment after 14 rTMS owing to non-response, and
was subsequently analyzed as a non-responder using baseline measures.
Across all subjects, baseline Y-BOCS scores significantly decreased from 30.5 ± 4.3 to
18.4 ± 10.8 (Wilcoxon rank-sum test, W18 = 3.41, p = 0.007) (Table 4-2). However, kernel
density estimation revealed a sharply bimodal response distribution, with distinct responder and
non-responder subpopulations (Figure 5-2); these subpopulations are therefore considered
separately hereafter. Ten of twenty subjects met the response criterion of greater than or equal to
50% of Y-BOCS improvement from baseline to 2-weeks post-treatment. Among responders, Y-
BOCS scores significantly decreased 67.2%, from a mean baseline score of 29.3 ± 4.6 to 9.6 ±
3.9 2 weeks post-treatment (W9 = 2.81, p = 0.005). Among non-responders, Y-BOCS scores
decreased non-significantly by 11.4%, from a mean baseline score of 31.7 ± 4.1 to 28.1 ± 7.8

178
(W8 = 1.45, p = 0.15). Of note, responders and non-responders did not differ in Y-BOCS severity
at baseline (29.3 ± 4.6 versus 31.7 ± 4.1; Mann-Whitney U18 = 1.21, p = 0.22).
Figure 5-2: Probability distribution function (a) and ranked individual-patient plot (b) of
treatment outcomes for dmPFC-rTMS in OCD. A bimodal distribution of treatment outcomes
is evident, suggesting distinct responder and non-responder subpopulations within the patient
sample. Outcomes are calculated as percent improvement in YBOCS scores from pre- to post-
treatment. One subject was a non-completer (14 rTMS sessions performed).
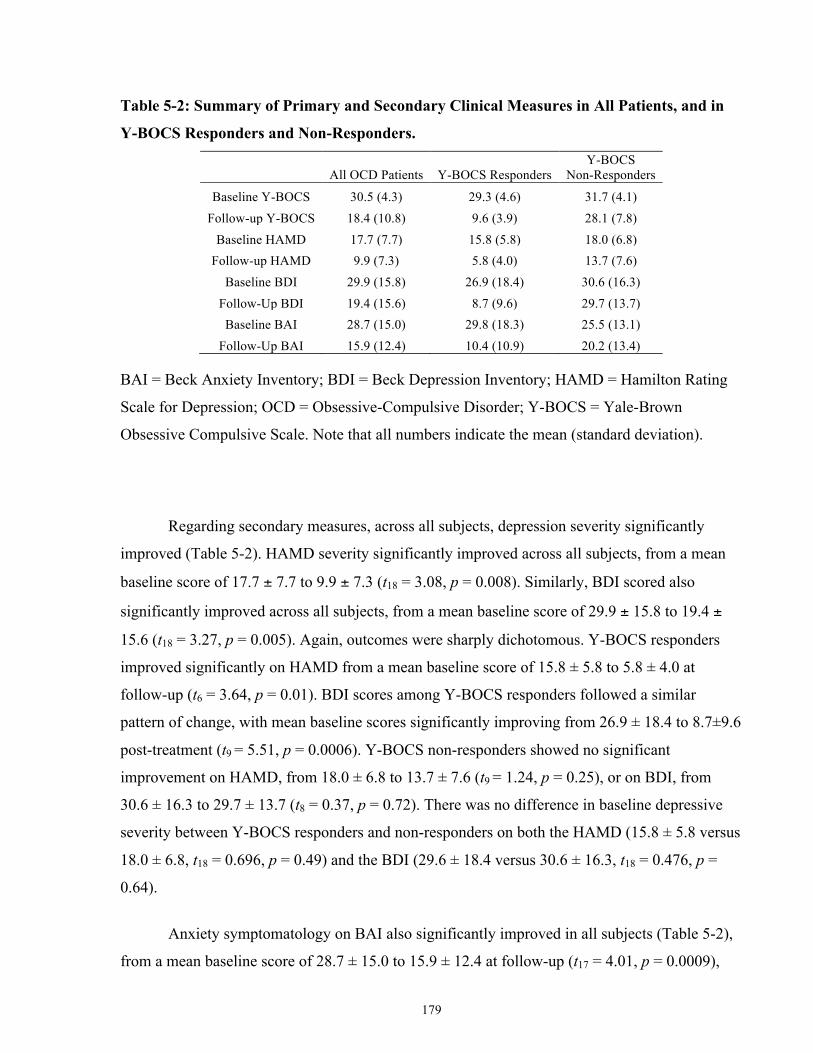
179
Table 5-2: Summary of Primary and Secondary Clinical Measures in All Patients, and in
Y-BOCS Responders and Non-Responders.
All OCD Patients Y-BOCS Responders
Y-BOCS Non-Responders
Baseline Y-BOCS 30.5 (4.3) 29.3 (4.6) 31.7 (4.1) Follow-up Y-BOCS 18.4 (10.8) 9.6 (3.9) 28.1 (7.8)
Baseline HAMD 17.7 (7.7) 15.8 (5.8) 18.0 (6.8) Follow-up HAMD 9.9 (7.3) 5.8 (4.0) 13.7 (7.6)
Baseline BDI 29.9 (15.8) 26.9 (18.4) 30.6 (16.3) Follow-Up BDI 19.4 (15.6) 8.7 (9.6) 29.7 (13.7) Baseline BAI 28.7 (15.0) 29.8 (18.3) 25.5 (13.1)
Follow-Up BAI 15.9 (12.4) 10.4 (10.9) 20.2 (13.4)
BAI = Beck Anxiety Inventory; BDI = Beck Depression Inventory; HAMD = Hamilton Rating
Scale for Depression; OCD = Obsessive-Compulsive Disorder; Y-BOCS = Yale-Brown
Obsessive Compulsive Scale. Note that all numbers indicate the mean (standard deviation).
Regarding secondary measures, across all subjects, depression severity significantly
improved (Table 5-2). HAMD severity significantly improved across all subjects, from a mean
baseline score of 17.7 ± 7.7 to 9.9 ± 7.3 (t18 = 3.08, p = 0.008). Similarly, BDI scored also
significantly improved across all subjects, from a mean baseline score of 29.9 ± 15.8 to 19.4 ±
15.6 (t18 = 3.27, p = 0.005). Again, outcomes were sharply dichotomous. Y-BOCS responders
improved significantly on HAMD from a mean baseline score of 15.8 ± 5.8 to 5.8 ± 4.0 at
follow-up (t6 = 3.64, p = 0.01). BDI scores among Y-BOCS responders followed a similar
pattern of change, with mean baseline scores significantly improving from 26.9 ± 18.4 to 8.7±9.6
post-treatment (t9 = 5.51, p = 0.0006). Y-BOCS non-responders showed no significant
improvement on HAMD, from 18.0 ± 6.8 to 13.7 ± 7.6 (t9 = 1.24, p = 0.25), or on BDI, from
30.6 ± 16.3 to 29.7 ± 13.7 (t8 = 0.37, p = 0.72). There was no difference in baseline depressive
severity between Y-BOCS responders and non-responders on both the HAMD (15.8 ± 5.8 versus
18.0 ± 6.8, t18 = 0.696, p = 0.49) and the BDI (29.6 ± 18.4 versus 30.6 ± 16.3, t18 = 0.476, p =
0.64).
Anxiety symptomatology on BAI also significantly improved in all subjects (Table 5-2),
from a mean baseline score of 28.7 ± 15.0 to 15.9 ± 12.4 at follow-up (t17 = 4.01, p = 0.0009),
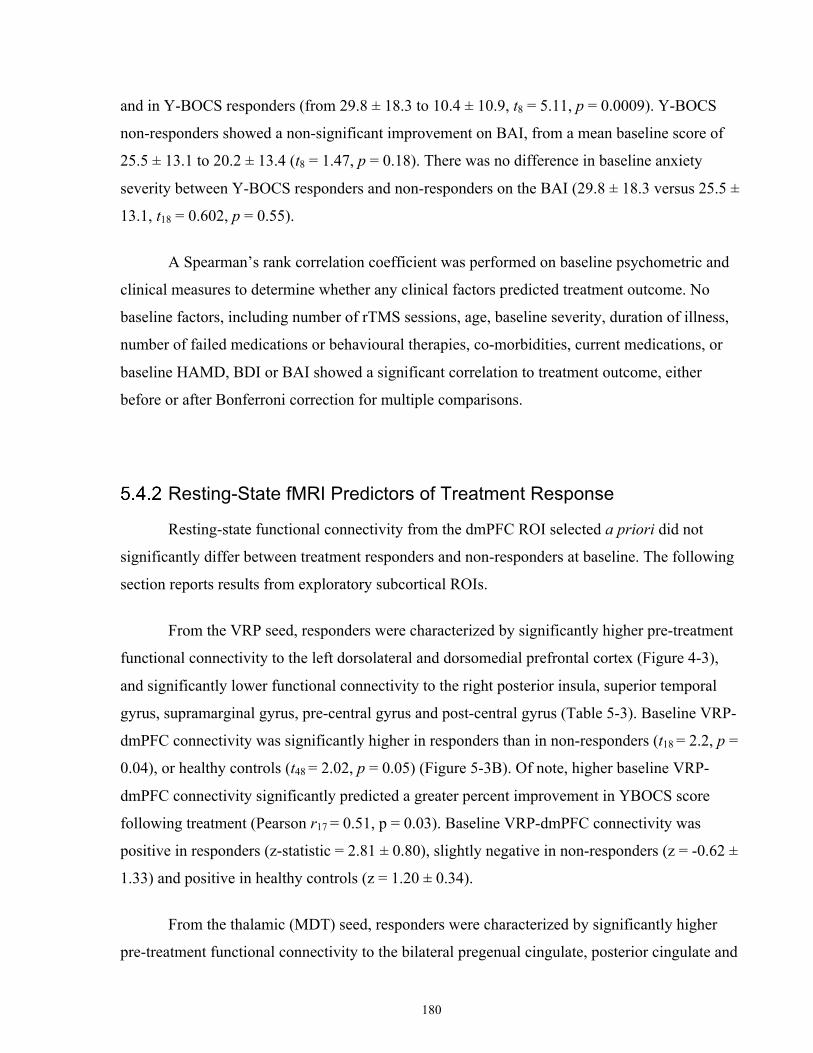
180
and in Y-BOCS responders (from 29.8 ± 18.3 to 10.4 ± 10.9, t8 = 5.11, p = 0.0009). Y-BOCS
non-responders showed a non-significant improvement on BAI, from a mean baseline score of
25.5 ± 13.1 to 20.2 ± 13.4 (t8 = 1.47, p = 0.18). There was no difference in baseline anxiety
severity between Y-BOCS responders and non-responders on the BAI (29.8 ± 18.3 versus 25.5 ±
13.1, t18 = 0.602, p = 0.55).
A Spearman’s rank correlation coefficient was performed on baseline psychometric and
clinical measures to determine whether any clinical factors predicted treatment outcome. No
baseline factors, including number of rTMS sessions, age, baseline severity, duration of illness,
number of failed medications or behavioural therapies, co-morbidities, current medications, or
baseline HAMD, BDI or BAI showed a significant correlation to treatment outcome, either
before or after Bonferroni correction for multiple comparisons.
Resting-State fMRI Predictors of Treatment Response
Resting-state functional connectivity from the dmPFC ROI selected a priori did not
significantly differ between treatment responders and non-responders at baseline. The following
section reports results from exploratory subcortical ROIs.
From the VRP seed, responders were characterized by significantly higher pre-treatment
functional connectivity to the left dorsolateral and dorsomedial prefrontal cortex (Figure 4-3),
and significantly lower functional connectivity to the right posterior insula, superior temporal
gyrus, supramarginal gyrus, pre-central gyrus and post-central gyrus (Table 5-3). Baseline VRP-
dmPFC connectivity was significantly higher in responders than in non-responders (t18 = 2.2, p =
0.04), or healthy controls (t48 = 2.02, p = 0.05) (Figure 5-3B). Of note, higher baseline VRP-
dmPFC connectivity significantly predicted a greater percent improvement in YBOCS score
following treatment (Pearson r17 = 0.51, p = 0.03). Baseline VRP-dmPFC connectivity was
positive in responders (z-statistic = 2.81 ± 0.80), slightly negative in non-responders (z = -0.62 ±
1.33) and positive in healthy controls (z = 1.20 ± 0.34).
From the thalamic (MDT) seed, responders were characterized by significantly higher
pre-treatment functional connectivity to the bilateral pregenual cingulate, posterior cingulate and
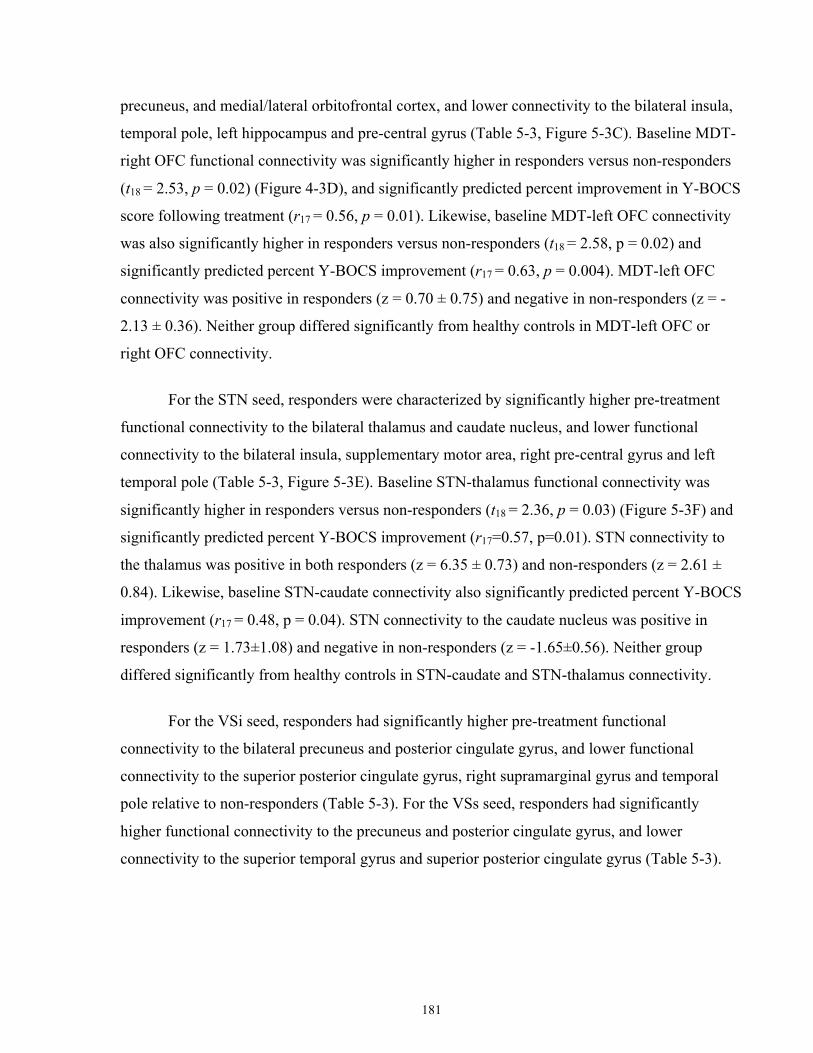
181
precuneus, and medial/lateral orbitofrontal cortex, and lower connectivity to the bilateral insula,
temporal pole, left hippocampus and pre-central gyrus (Table 5-3, Figure 5-3C). Baseline MDT-
right OFC functional connectivity was significantly higher in responders versus non-responders
(t18 = 2.53, p = 0.02) (Figure 4-3D), and significantly predicted percent improvement in Y-BOCS
score following treatment (r17 = 0.56, p = 0.01). Likewise, baseline MDT-left OFC connectivity
was also significantly higher in responders versus non-responders (t18 = 2.58, p = 0.02) and
significantly predicted percent Y-BOCS improvement (r17 = 0.63, p = 0.004). MDT-left OFC
connectivity was positive in responders (z = 0.70 ± 0.75) and negative in non-responders (z = -
2.13 ± 0.36). Neither group differed significantly from healthy controls in MDT-left OFC or
right OFC connectivity.
For the STN seed, responders were characterized by significantly higher pre-treatment
functional connectivity to the bilateral thalamus and caudate nucleus, and lower functional
connectivity to the bilateral insula, supplementary motor area, right pre-central gyrus and left
temporal pole (Table 5-3, Figure 5-3E). Baseline STN-thalamus functional connectivity was
significantly higher in responders versus non-responders (t18 = 2.36, p = 0.03) (Figure 5-3F) and
significantly predicted percent Y-BOCS improvement (r17=0.57, p=0.01). STN connectivity to
the thalamus was positive in both responders (z = 6.35 ± 0.73) and non-responders (z = 2.61 ±
0.84). Likewise, baseline STN-caudate connectivity also significantly predicted percent Y-BOCS
improvement (r17 = 0.48, p = 0.04). STN connectivity to the caudate nucleus was positive in
responders (z = 1.73±1.08) and negative in non-responders (z = -1.65±0.56). Neither group
differed significantly from healthy controls in STN-caudate and STN-thalamus connectivity.
For the VSi seed, responders had significantly higher pre-treatment functional
connectivity to the bilateral precuneus and posterior cingulate gyrus, and lower functional
connectivity to the superior posterior cingulate gyrus, right supramarginal gyrus and temporal
pole relative to non-responders (Table 5-3). For the VSs seed, responders had significantly
higher functional connectivity to the precuneus and posterior cingulate gyrus, and lower
connectivity to the superior temporal gyrus and superior posterior cingulate gyrus (Table 5-3).
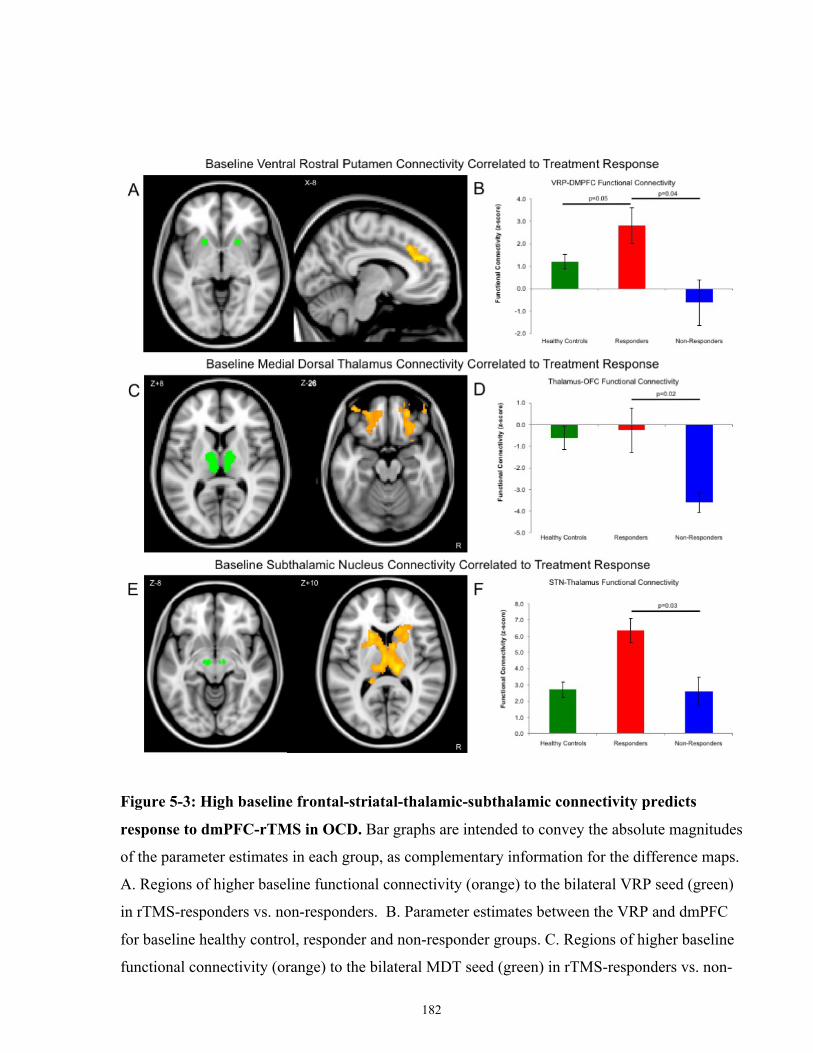
182
Figure 5-3: High baseline frontal-striatal-thalamic-subthalamic connectivity predicts
response to dmPFC-rTMS in OCD. Bar graphs are intended to convey the absolute magnitudes
of the parameter estimates in each group, as complementary information for the difference maps.
A. Regions of higher baseline functional connectivity (orange) to the bilateral VRP seed (green)
in rTMS-responders vs. non-responders. B. Parameter estimates between the VRP and dmPFC
for baseline healthy control, responder and non-responder groups. C. Regions of higher baseline
functional connectivity (orange) to the bilateral MDT seed (green) in rTMS-responders vs. non-

183
responders. D. Parameter estimates between the MDT and OFC for baseline healthy control,
responder and non-responder groups. E. Regions of higher baseline functional connectivity
(orange) to the bilateral STN in rTMS responders vs. non-responders. F. Parameter estimates
between the STN and Thalamus for baseline healthy control, responder and non-responder
groups.
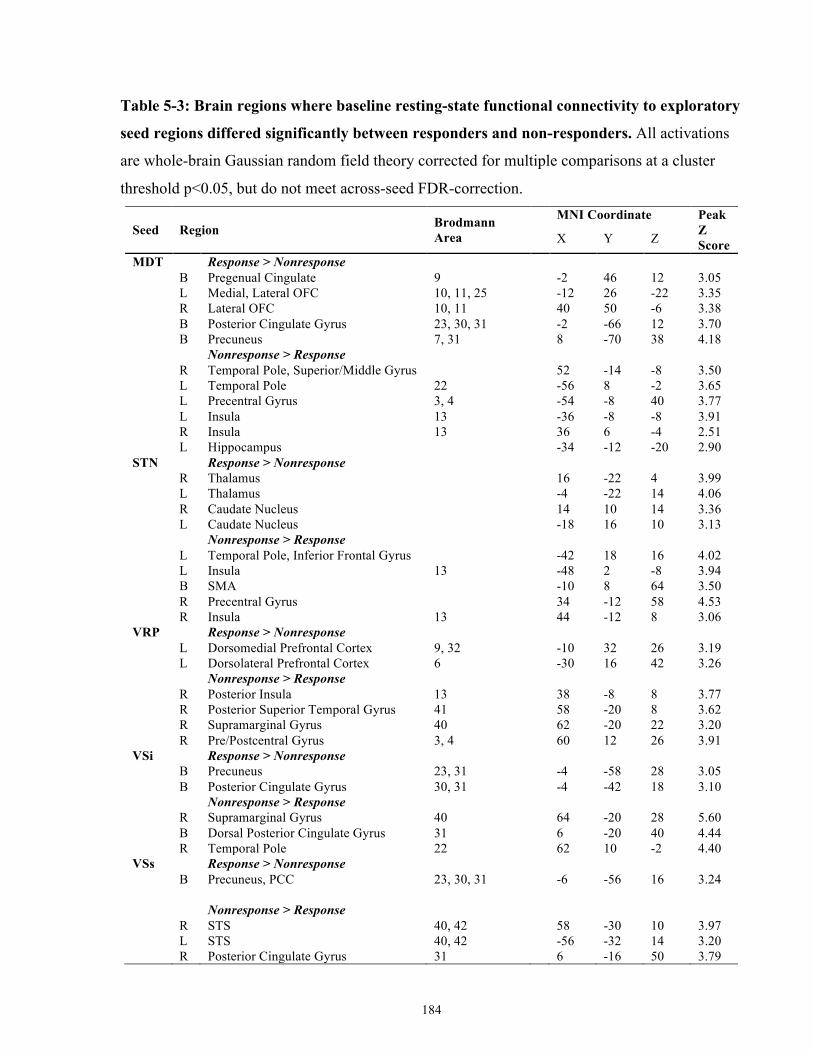
184
Table 5-3: Brain regions where baseline resting-state functional connectivity to exploratory
seed regions differed significantly between responders and non-responders. All activations
are whole-brain Gaussian random field theory corrected for multiple comparisons at a cluster
threshold p<0.05, but do not meet across-seed FDR-correction.
Seed Region Brodmann Area
MNI Coordinate Peak Z Score X Y Z
MDT Response > Nonresponse
B Pregenual Cingulate 9
-2 46 12 3.05
L Medial, Lateral OFC 10, 11, 25
-12 26 -22 3.35
R Lateral OFC 10, 11
40 50 -6 3.38
B Posterior Cingulate Gyrus 23, 30, 31
-2 -66 12 3.70
B Precuneus 7, 31
8 -70 38 4.18
Nonresponse > Response
R Temporal Pole, Superior/Middle Gyrus
52 -14 -8 3.50
L Temporal Pole 22
-56 8 -2 3.65
L Precentral Gyrus 3, 4
-54 -8 40 3.77
L Insula 13
-36 -8 -8 3.91
R Insula 13
36 6 -4 2.51
L Hippocampus
-34 -12 -20 2.90
STN Response > Nonresponse
R Thalamus
16 -22 4 3.99
L Thalamus
-4 -22 14 4.06
R Caudate Nucleus
14 10 14 3.36
L Caudate Nucleus
-18 16 10 3.13
Nonresponse > Response
L Temporal Pole, Inferior Frontal Gyrus
-42 18 16 4.02
L Insula 13
-48 2 -8 3.94
B SMA
-10 8 64 3.50
R Precentral Gyrus
34 -12 58 4.53
R Insula 13
44 -12 8 3.06
VRP Response > Nonresponse
L Dorsomedial Prefrontal Cortex 9, 32 -10 32 26 3.19
L Dorsolateral Prefrontal Cortex 6 -30 16 42 3.26
Nonresponse > Response
R Posterior Insula 13
38 -8 8 3.77
R Posterior Superior Temporal Gyrus 41
58 -20 8 3.62
R Supramarginal Gyrus 40
62 -20 22 3.20
R Pre/Postcentral Gyrus 3, 4
60 12 26 3.91
VSi Response > Nonresponse
B Precuneus 23, 31
-4 -58 28 3.05
B Posterior Cingulate Gyrus 30, 31
-4 -42 18 3.10
Nonresponse > Response
R Supramarginal Gyrus 40
64 -20 28 5.60
B Dorsal Posterior Cingulate Gyrus 31 6 -20 40 4.44
R Temporal Pole 22
62 10 -2 4.40
VSs Response > Nonresponse
B Precuneus, PCC 23, 30, 31
-6 -56 16 3.24
Nonresponse > Response
R STS 40, 42
58 -30 10 3.97
L STS 40, 42
-56 -32 14 3.20
R Posterior Cingulate Gyrus 31
6 -16 50 3.79

185
MDT = medial dorsal thalamus; MNI = Montreal Neurological Institute; OFC = orbitofrontal
cortex; SMA = supplementary motor area; STN = subthalamic nucleus; VRP = ventral rostral
putamen; VSi = inferior ventral striatum; VSs = superior ventral striatum.
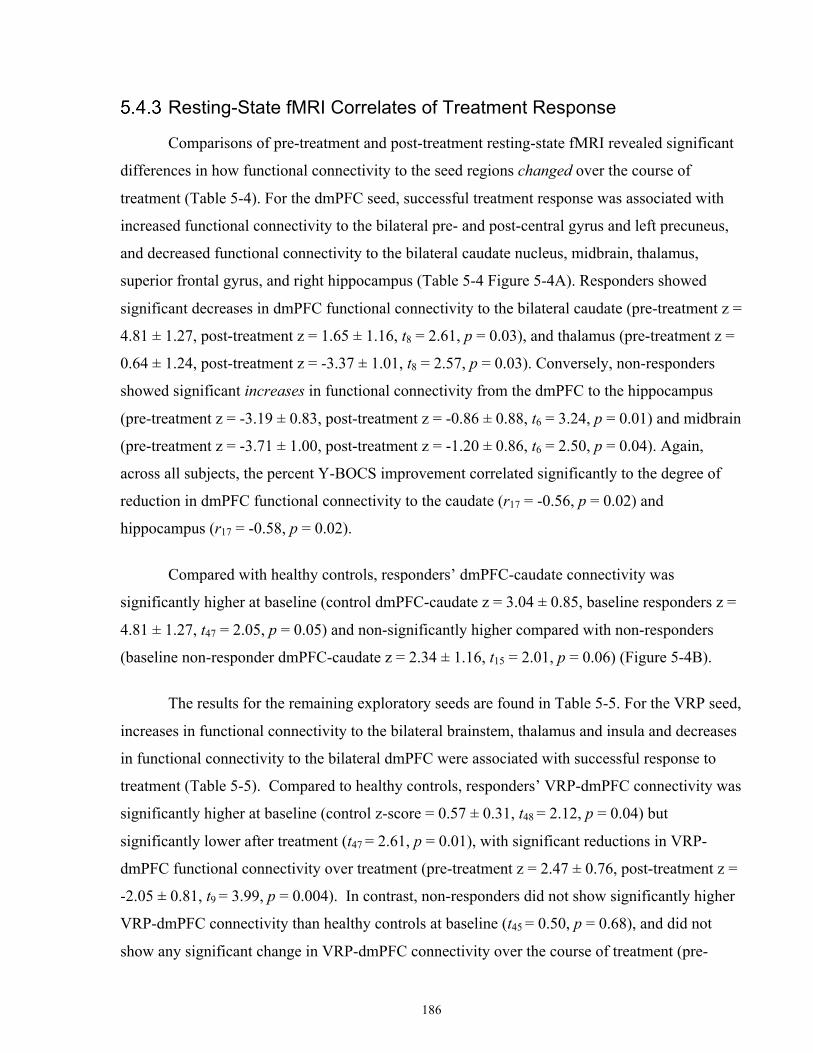
186
Resting-State fMRI Correlates of Treatment Response
Comparisons of pre-treatment and post-treatment resting-state fMRI revealed significant
differences in how functional connectivity to the seed regions changed over the course of
treatment (Table 5-4). For the dmPFC seed, successful treatment response was associated with
increased functional connectivity to the bilateral pre- and post-central gyrus and left precuneus,
and decreased functional connectivity to the bilateral caudate nucleus, midbrain, thalamus,
superior frontal gyrus, and right hippocampus (Table 5-4 Figure 5-4A). Responders showed
significant decreases in dmPFC functional connectivity to the bilateral caudate (pre-treatment z =
4.81 ± 1.27, post-treatment z = 1.65 ± 1.16, t8 = 2.61, p = 0.03), and thalamus (pre-treatment z =
0.64 ± 1.24, post-treatment z = -3.37 ± 1.01, t8 = 2.57, p = 0.03). Conversely, non-responders
showed significant increases in functional connectivity from the dmPFC to the hippocampus
(pre-treatment z = -3.19 ± 0.83, post-treatment z = -0.86 ± 0.88, t6 = 3.24, p = 0.01) and midbrain
(pre-treatment z = -3.71 ± 1.00, post-treatment z = -1.20 ± 0.86, t6 = 2.50, p = 0.04). Again,
across all subjects, the percent Y-BOCS improvement correlated significantly to the degree of
reduction in dmPFC functional connectivity to the caudate (r17 = -0.56, p = 0.02) and
hippocampus (r17 = -0.58, p = 0.02).
Compared with healthy controls, responders’ dmPFC-caudate connectivity was
significantly higher at baseline (control dmPFC-caudate z = 3.04 ± 0.85, baseline responders z =
4.81 ± 1.27, t47 = 2.05, p = 0.05) and non-significantly higher compared with non-responders
(baseline non-responder dmPFC-caudate z = 2.34 ± 1.16, t15 = 2.01, p = 0.06) (Figure 5-4B).
The results for the remaining exploratory seeds are found in Table 5-5. For the VRP seed,
increases in functional connectivity to the bilateral brainstem, thalamus and insula and decreases
in functional connectivity to the bilateral dmPFC were associated with successful response to
treatment (Table 5-5). Compared to healthy controls, responders’ VRP-dmPFC connectivity was
significantly higher at baseline (control z-score = 0.57 ± 0.31, t48 = 2.12, p = 0.04) but
significantly lower after treatment (t47 = 2.61, p = 0.01), with significant reductions in VRP-
dmPFC functional connectivity over treatment (pre-treatment z = 2.47 ± 0.76, post-treatment z =
-2.05 ± 0.81, t9 = 3.99, p = 0.004). In contrast, non-responders did not show significantly higher
VRP-dmPFC connectivity than healthy controls at baseline (t45 = 0.50, p = 0.68), and did not
show any significant change in VRP-dmPFC connectivity over the course of treatment (pre-
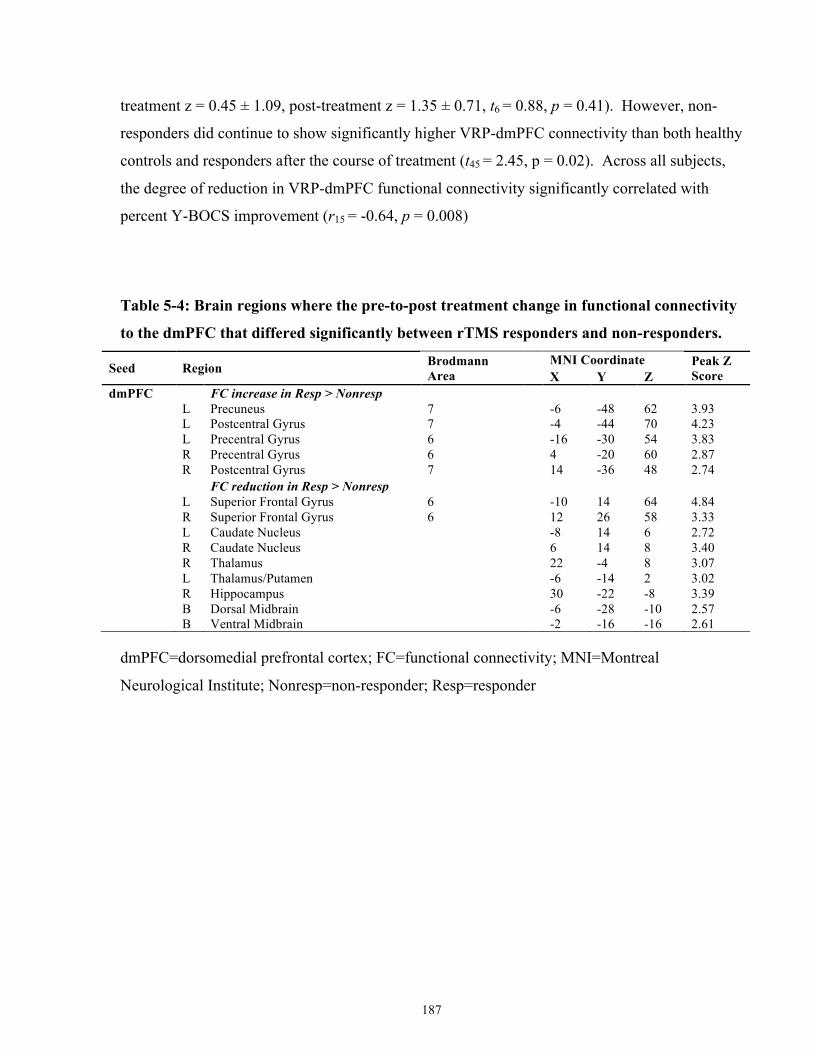
187
treatment z = 0.45 ± 1.09, post-treatment z = 1.35 ± 0.71, t6 = 0.88, p = 0.41). However, non-
responders did continue to show significantly higher VRP-dmPFC connectivity than both healthy
controls and responders after the course of treatment (t45 = 2.45, p = 0.02). Across all subjects,
the degree of reduction in VRP-dmPFC functional connectivity significantly correlated with
percent Y-BOCS improvement (r15 = -0.64, p = 0.008)
Table 5-4: Brain regions where the pre-to-post treatment change in functional connectivity
to the dmPFC that differed significantly between rTMS responders and non-responders.
Seed Region Brodmann Area MNI Coordinate Peak Z
Score X Y Z dmPFC
FC increase in Resp > Nonresp
L Precuneus 7
-6 -48 62 3.93
L Postcentral Gyrus 7
-4 -44 70 4.23
L Precentral Gyrus 6
-16 -30 54 3.83
R Precentral Gyrus 6
4 -20 60 2.87
R Postcentral Gyrus 7
14 -36 48 2.74
FC reduction in Resp > Nonresp
L Superior Frontal Gyrus 6
-10 14 64 4.84
R Superior Frontal Gyrus 6
12 26 58 3.33
L Caudate Nucleus
-8 14 6 2.72
R Caudate Nucleus
6 14 8 3.40
R Thalamus
22 -4 8 3.07
L Thalamus/Putamen
-6 -14 2 3.02
R Hippocampus
30 -22 -8 3.39
B Dorsal Midbrain
-6 -28 -10 2.57
B Ventral Midbrain
-2 -16 -16 2.61
dmPFC=dorsomedial prefrontal cortex; FC=functional connectivity; MNI=Montreal
Neurological Institute; Nonresp=non-responder; Resp=responder
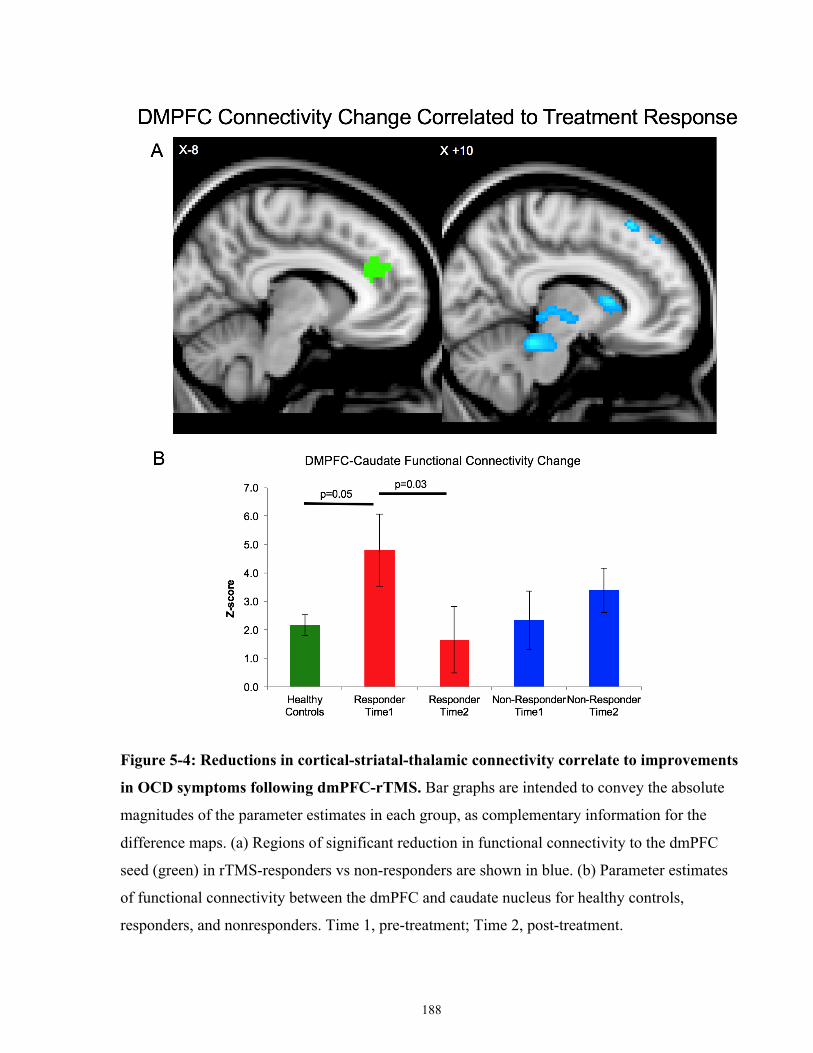
188
Figure 5-4: Reductions in cortical-striatal-thalamic connectivity correlate to improvements
in OCD symptoms following dmPFC-rTMS. Bar graphs are intended to convey the absolute
magnitudes of the parameter estimates in each group, as complementary information for the
difference maps. (a) Regions of significant reduction in functional connectivity to the dmPFC
seed (green) in rTMS-responders vs non-responders are shown in blue. (b) Parameter estimates
of functional connectivity between the dmPFC and caudate nucleus for healthy controls,
responders, and nonresponders. Time 1, pre-treatment; Time 2, post-treatment.
189
Table 5-5: Brain regions where the pre-to-post treatment change in functional connectivity
to exploratory ROIs that differed significantly between rTMS responders and non-
responders. All activations are Gaussian random field theory corrected for multiple comparisons
at a cluster threshold p<0.05, but do not meet across-seed FDR-correction.
Seed
Region BA MNI Coordinate Peak
Z Score X Y Z
MDT
FC increase in Resp > Nonresp
L Putamen
-32 -16 10 2.82
L Amygdala, Hippocampus
-26 -4 -16 2.8
L Parahippocampal Gyrus
-18 -24 -22 3.36
FC reduction in Resp > Nonresp
L Caudate Nucleus
-20 10 16 3.57
B Cuneus, Precuneus
0 -72 26 3.33
L Intracalcarine Cortex 30
-10 -70 16 3.29
STN
FC reduction in Resp > Nonresp
R Precuneus, PCC 31
12 -62 32 3.85
VRP
FC increase in Resp > Nonresp
B Brainstem
-2 -22 -24 3.1
L Thalamus
-8 -26 0 2.72
R Thalamus
12 -26 0 3.08
L Insula
-36 -4 2 3.04
R Insula
42 2 -10 3.57
FC reduction in Resp > Nonresp
B Dorsomedial Prefrontal Cortex 32
-10 18 42 3.62
L Supracalcarine Cortex 17
-4 -90 10 3.86
R Occipital Pole 19
-4 -98 -2 3.75
VSi
FC increase in Resp > Nonresp
R Middle Temporal Gyrus (Posterior) 12 62 -36 -10 3.76
R Posterior Insula 13
40 -4 -10 3.06
FC reduction in Resp > Nonresp
L Occipital Pole 18
-6 -96 -6 4.4
L Cuneus 7, 19
-8 -88 38 3.67
VSs
FC increase in Resp > Nonresp
L Insula 13
-38 0 -8 2.95
L Temporal Pole, Amygdala 34
-38 4 -20 3.64
R Temporal Pole, Inferior Temporal Gyrus 20 48 -32 -20 3.22
R Insula 13
40 2 -10 3.64
FC reduction in Resp > Nonresp
B Dorsomedial Prefrontal Cortex 32
-8 18 42 4.51
B Dorsomedial Prefrontal Cortex 9, 32 -10 30 30 4.35
FC=functionalconnectivity;MDT=medialdorsalthalamus;MNI=MontrealNeurologicalInstitute;OFC=orbitofrontalcortex;PCC=posteriorcingulatecortex;SMA=supplementary

190
motorarea;STN=subthalamicnucleus;VRP=ventralrostralputamen;VSi=inferiorventralstriatum;VSs=superiorventralstriatum
191
For the VSs seed, increased functional connectivity to the bilateral insula and temporal
pole and decreased functional connectivity to the bilateral dmPFC were associated with
successful treatment response (Table 5-5). In responders, VSs-dmPFC connectivity decreased
significantly from pre- to post-treatment (pre-treatment z=1.33±1.29, post-treatment z=-
1.92±0.80, t8=2.75, p=0.03), and was significantly lower than in healthy controls following
treatment (control z=1.03±0.39, t47=2.87, p=0.01).
Conversely, in non-responders, VSs-dmPFC functional connectivity showed a non-
significant trend toward increasing from pre- to post-treatment (pre-treatment z=0.21±1.05, post-
treatment z=1.79±0.60, t6=1.40, p=0.21), and did not differ significantly from healthy controls
following treatment (t45=0.54, p=0.61). Once again, across all subjects, the degree of reduction in
VSs-dmPFC functional connectivity significantly correlated to percent YBOCS improvement
(r15=-0.65, p=0.007).
For the VSi, treatment response was associated with increased connectivity to the right
middle temporal gyrus and posterior insula and decreased connectivity to the left occipital pole
and cuneus (Table 5-5). For the MDT, treatment response was associated with increased
functional connectivity to the left putamen, amygdala, hippocampus, and parahippocampal
gyrus, and decreased functional connectivity to the left caudate and bilateral cuneus and
precuneus (Table 5-5). For the STN, treatment response was associated with decreased
functional connectivity to the right precuneus and posterior cingulate cortex (Table 5-5).
Discussion & Conclusion To our knowledge, this is the first case series using fMRI to identify neural predictors and
correlates of response to any form of non-invasive brain stimulation in OCD. Previous studies of
rTMS in OCD have encountered little therapeutic benefit with stimulation of lateral prefrontal
targets such as the DLPFC (Alonso et al, 2001; Prasko et al, 2006; Sachdev et al, 2007; Sarkhel
et al, 2010), but somewhat more success with medial prefrontal targets such as the SMA or pre-
SMA (Kumar and Chadda, 2011; Mantovani et al, 2006, 2010). The results of the present study
are congruent with this latter literature in suggesting that rTMS of a slightly more anterior medial
prefrontal target, the dmPFC, can also yield substantial symptom reduction in a proportion of
192
OCD cases, even when multiple previous medication trials have failed. However, as previously
observed in patients with MDD (Downar et al, 2014), dmPFC-rTMS outcomes appear sharply
bimodal in OCD.
In keeping with our first hypothesis, responders showed significant differences from non-
responders in baseline dmPFC-striatal resting-state functional connectivity. Furthermore, in
keeping with our second hypothesis, the amount of symptomatic improvement correlated to the
degree of reduction in functional connectivity through a very similar frontal-striatal-thalamic-
subthalamic circuit connecting the dmPFC to VS, caudate nucleus, thalamus, and midbrain. In
relation to healthy controls, responders initially showed hyperconnectivity from dmPFC to
caudate before treatment, and this hyperconnectivity normalized following treatment; no such
pattern was evident in non-responders.
These observations are remarkably consistent with the recently reported results of an
fMRI study of therapeutic mechanisms in OCD, using ventral striatum-DBS rather than rTMS of
the dmPFC (Figee et al, 2013). In that study, OCD patients also showed baseline functional
hyperconnectivity from ventral striatum to a dmPFC region just immediately anterior to the
region identified in Figure 4-4 of the present study. DBS reduced functional connectivity from
ventral striatum to dmPFC, and the degree of reduction correlated well with the amount of
symptomatic improvement. The results of the present study suggest that similar therapeutic
effects in OCD might also be achieved via noninvasive stimulation of the more superficial
dmPFC, via a similar mechanism. Notably, the circuit identified in the present study also
includes nodes in lateral orbitofrontal cortex, ventral striatum, medial thalamus, and subthalamic
nucleus, each of which has shown promise as a therapeutic target for either DBS (Abelson et al,
2005; Denys et al, 2010; Lipsman et al, 2013a; Mallet et al, 2008), or in the case of lateral
orbitofrontal cortex, rTMS (Ruffini et al, 2009).
More generally, the observations of the present study support the growing body of
evidence that OCD pathophysiology may arise from functional hyperconnectivity through
specific cortico-striatal loop circuits projecting from ventral striatum to the medial PFC (Beucke
et al, 2013; Harrison et al, 2009; Sakai et al, 2011). Recent studies, in larger patient samples,
have even suggested that different OCD symptom dimensions may map on to anatomically
distinct corticostriatal pathways (Harrison et al, 2013). Animal studies also suggest that the
193
dynamics of the hyperactivation may be important. For example, a recent study showed that
repeated exposures to brief optogenetic hyperactivation of an orbitofrontal cortex-ventral striatal
circuit in mice led to progressively increased compulsive grooming behaviors that were
reversible by fluoxetine, a standard pharmacotherapy for OCD (Ahmari et al, 2013). These more
nuanced techniques could lead to a better understanding of the variability of response to current
neuromodulation therapies in OCD.
We also note that the fMRI predictors and correlates of successful 10 Hz dmPFC-rTMS
for OCD appear opposite to those we have previously reported for the same intervention in major
depression not directly but indirectly, by relieving intrusive thoughts, as suggested by a recent
study (Salomons et al, 2014). In the MDD patients, low baseline connectivity from dmPFC to the
putamen and thalamus predicted better response to treatment, and the degree of increase in
frontal-striatal-thalamic connectivity correlated to symptomatic improvement. The results of the
present study suggest that dmPFC-rTMS may exert therapeutic effects via a similar CSTC
pathway in both MDD and OCD, but via opposite mechanisms (ie, via reduction of a
pathologically high baseline CTSC connectivity in OCD, rather than via strengthening of a
pathologically low baseline CTSC connectivity in MDD). These seemingly contrary findings
could potentially be reconciled if dmPFC-rTMS exerts its therapeutic effects on OCD and MDD
not directly but indirectly, by relieving intrusive thoughts, as suggested by a recent study (Carew
et al, 2013). However, this issue will require further study.
One important difference in technique between the present study and previous studies of
rTMS in OCD targeting the medial wall is that the previous studies used 1 Hz rather than 10 Hz
stimulation. Classically, 1 Hz stimulation is considered inhibitory, and 10 Hz stimulation
excitatory (Hallett, 2007); suppression of overactive regions in SMA and pre-SMA provided a
rationale for using 1Hz stimulation in these previous studies (Mantovani et al, 2006, 2010). Yet
it is increasingly recognized that the effects of many rTMS protocols, including both 1 and 10 Hz
stimulation, can be quite heterogeneous: a substantial proportion of individuals show
‘paradoxical’ excitatory responses to 1 Hz stimulation or inhibitory responses to high-frequency
stimulation, both on motor evoked potentials (Hamada et al, 2013; Maeda et al, 2000) and on
resting-state fMRI (Eldaief et al, 2011). In the present study, as well as in our previous study of
dmPFC- rTMS in MDD, the effects of 10 Hz stimulation on cortical- striatal-thalamic activity
were in fact quite variable across individuals, with ‘paradoxical’ reductions in functional
194
connectivity appearing in up to 40% of MDD patients in the previous study and in more than half
of the OCD patients in the present study (Figure 3). Thus, it is possible that 1 Hz SMA-rTMS
and 10 Hz dmPFC-rTMS are achieving successful OCD treatment outcomes via similar
mechanisms, notwithstanding the differences in technique. Alternatively, individual patients may
require different sites or patterns of stimulation to achieve a therapeutic effect, as has been
reported for DLPFC-rTMS in depression (Speer et al, 2009). The question of whether 1 Hz
SMA-rTMS and 10 Hz dmPFC-rTMS treat similar or different subpopulations of OCD patients
will be an important topic for future study. In either case, resting-state fMRI is likely to have an
important role both in stratifying patients and in clarifying therapeutic mechanisms.
One limitation of the present study is use of an open-label design, leaving open the
possibility that the observed symptomatic improvements were due to non-specific or placebo
effects. However, it should be noted that in the setting of refractory OCD, previously reported
effects of sham rTMS are relatively minimal, ranging from 1% to ~20% improvement in
YBOCS scores; indeed, even active stimulation of lateral targets such as DLPFC has consistently
achieved less than 25% YBOCS improvement across several independent studies (Alonso et al,
2001; Mantovani et al, 2010; Sachdev et al, 2007; Sarkhel et al, 2010). Thus, it is unlikely that
placebo effects can fully account for the present observations of a ~ 40% overall improvement in
the present study, a bimodal outcome distribution, distinct patterns of functional connectivity
through the dmPFC-ventral striatal target circuit in responders vs non-responders (who were not
otherwise distinct on clinical measures), distinct patterns of change in this circuit in responders
and non-responders, and the concordance of these results with the previous findings of an
independent study using DBS rather than rTMS. Nonetheless, replication of the present findings
under sham-controlled conditions would be an important next step in this line of research.
Another limitation is the lenient multiple comparisons correction performed. As more
recent publications have recommended stringent correction for multiple comparisons of resting-
state functional connectivity (Eklund et al, 2016), the risk for Type I errors in these studies is
potentially high. However, a number of factors mitigate concern regarding this methodological
limitation. Most importantly, the neuroimaging results across these three independent samples
are consistent. Second, the baseline frontostriatal predictor of treatment response is consistent
with Study III (which used more stringent correction). Finally, as evidenced in Sections 1.4, 1.5,

195
1.6, 1.8 and 1.9 of this thesis, the neuroimaging results are consistent with disorder etiology and
mechanisms of treatment response.
Another potential criticism of the current study relates to the small sample size. Although
the sample size here is comparable with or larger than that in other dmPFC rTMS-MRI and
DBS-MRI studies (Figee et al, 2013; Salomons et al, 2014), open-label and randomized control
rTMS treatment studies for OCD (Mantovani et al, 2006, 2010) and neuroimaging studies for
OCD (Admon et al, 2012), it is nonetheless underpowered to capture the full heterogeneity of
OCD symptomatology, comorbidity, and treatment types. Hence, the present observations are as
yet insufficient to properly address the question as to whether dmPFC-rTMS response could also
be predicted on the basis of clinical features such as OCD subtype (eg, hoarding vs checking),
presence or absence of comorbid symptoms (eg, major depression, tics), or adjunctive treatment
types (eg, use of SSRIs or neuroleptics). They also cannot yet address the question of whether
dmPFC-rTMS might selectively improve some OCD symptom dimensions but not others, as
might be suspected if different symptom clusters map reliably on to distinct neural substrates.
Resolution of such issues must await a larger sample of patients.
In summary, 10 Hz dmPFC-rTMS may offer a promising, noninvasive therapeutic option
for medication-refractory OCD, achieving ⩾ 50% reductions in YBOCS scores in 50% of the
patients in the sample. In agreement with recent findings with ventral striatal DBS for OCD,
rTMS may be most effective in patients with greater hyperconnectivity between dmPFC and
ventral striatum on resting-state fMRI. Also in agreement with DBS findings, therapeutic effects
of dmPFC-rTMS correlated with reductions in dmPFC-ventral striatum functional connectivity.
A randomized controlled trial incorporating a sham rTMS arm would be a logical next step in
evaluating dmPFC-rTMS as a noninvasive alternative to DBS in medication-refractory OCD.
Future studies of rTMS in OCD may also benefit from using fMRI to characterize cortico-striatal
connectivity prior to treatment, in order to predict response and/or tailor the stimulation target
and parameters in individual patients (Fox et al, 2013a). Properly optimized, rTMS could evolve
into a potent, novel treatment option for patients faced with this challenging and crippling illness.
196
Study III: Baseline Predictors and Mechanisms of High- and Low-Frequency dmPFC-rTMS in TRD under triple-blind sham controlled settings
Introduction TRD is associated with high rates of disability and mortality (Furman et al, 2011;
Kerestes et al, 2015). Conventional treatment efficacy is also limited; approximately one third of
MDD patients will fully respond to an initial antidepressant medication treatment, another third
will respond to a subsequent pharmacotherapy intervention, while the remaining third of MDD
sufferers are considered treatment-resistant (Ferrari et al, 2013; Murray and Lopez, 1997). In
sum, further research must be done to identify targeted treatments for both MDD and treatment-
resistant MDD.
One novel, targeted treatment option is repetitive transcranial magnetic stimulation
(rTMS); rTMS stimulates specific cortical targets addressing pathological circuitry in MDD. One
proposed cortical target for MDD is the dmPFC. The dmPFC is active during cognitive control
(Rush et al, 2006), emotion regulation (Brass and Haggard, 2007; Campbell-Meiklejohn et al,
2008; Cho et al, 2013) and the inhibition of prepotent responses (Kühn et al, 2011). Furthermore,
non-invasive stimulation of the medial prefrontal wall enhances inhibition on impulsivity-related
tasks in healthy controls (Cho et al, 2015; Jung et al, 2014; Müller et al, 2015). Taken together,
the therapeutic mechanism across psychiatric disorders involving dmPFC dysregulation may
modulate cognitive or behavioural phenotypes of impulsivity or emotional regulation, thereby
improving clinical symptoms and quality of life.
Structural and functional MRI studies reveal that the volume of the dmPFC is reduced
relative to healthy controls in MDD (Cho et al, 2015; Obeso et al, 2013), bipolar disorder (Bora
et al, 2012a), OCD (Bora et al, 2012b), binge eating disorder (Radua et al, 2010), and post-
traumatic stress disorder (Schäfer et al, 2010). The neuroanatomical overlap provides a potential
explanation for the frequent comorbidity between AN/BN and OCD, and mood disorders. It also
suggests that neuromodulatory treatments targeted towards the dmPFC could be more effective
for a wider range of symptoms (Kühn and Gallinat, 2013).
197
In two open-label studies and two case series, we recently showed that 20-30 sessions of
high-frequency dmPFC-rTMS for MDD was a promising treatment for TRD (Bakker et al, 2015;
Downar et al, 2014; Salomons et al, 2014; Schulze et al, 2018). Our first case series reported on
dmPFC-rTMS as a treatment for 185 treatment-resistant MDD patients; the response and
remission rate on the Beck Depression Inventory (BDI-II) was 40.6% and 29.2%, respectively
(Bakker et al, 2015). Our more recent case series in 130 patients showed that the clinical efficacy
of twice-daily and once-daily sessions of open-label dmPFC-rTMS did not significantly differ
(Schulze et al, 2018). Clinical factors, such as primary diagnosis, age, antidepressant medication,
and comorbidity, did not significantly predict response in TRD.
We then proceeded to examine resting-state functional magnetic resonance imaging (rs-
fMRI) correlates at baseline that predicted treatment response. Baseline resting-state
neuroimaging findings revealed differences in functional connectivity between responders and
non-responders to dmPFC-rTMS in MDD. In MDD, higher baseline dmPFC-dgACC and lower
dmPFC-dorsomedial thalamus functional connectivity was associated with response to treatment
(Salomons et al, 2014). In addition, altered dorsomedial and ventromedial functional
connectivity on resting-state graph theory measures predicted treatment response and levels of
anhedonia (Downar et al, 2014). Baseline differences in responders and non-responders to
dmPFC-rTMS show functional differences in regions previously implicated in reward
processing, and emotion regulation.
We have also examined how changes in rs-fMRI connectivity correlated with response to
treatment in MDD. We found that increased dmPFC-mediodorsal thalamus connectivity and
decreased sgACC-caudate connectivity correlated treatment response (Salomons et al, 2014).
Generally, connectivity alterations from the stimulation site with sites in cortico-basal ganglia-
thalamic-cortical circuits potentially reflect increased top-down cognitive control over regions
associated with reward and emotion processing, and impulsivity.
The therapeutic effects of dmPFC-rTMS and its rs-fMRI correlates were highly
heterogeneous across individuals in the aforementioned studies. To address this heterogeneity
and improve outcomes, rTMS protocols that theoretically elicit different cortical responses could
be compared in terms of both clinical efficacy and effects on neural activity; such comparisons
could help to identify mechanisms of response, and to optimize treatment parameters.
198
Low-frequency (1 Hz) and high-frequency (20 Hz) protocols are conventionally
considered to have inhibitory and excitatory effects on neural activity, respectively (although a
substantial proportion of individuals show effects in the opposite direction: Maeda et al., 2000;
Eldaief et al, 2011). These protocols have both been used in numerous studies comparing
treatment outcomes in order to optimize the treatment protocol at a given stimulation site, and
determine mechanisms of clinical response (e.g., Kim et al, 2014). Functional MRI can also be
used to identify baseline differences that distinguish treatment response from non-response on a
given protocol. Here, we plan to use these two ‘opposite’ rTMS protocols to better characterize
the predictors and mechanisms of dmPFC-rTMS treatment response first identified in our pilot
findings.
This study also includes a sham arm, to build upon the open-label findings of our
previous work by assessing clinical efficacy and determining whether the neural predictors and
correlates of response are treatment-specific or non-specific. Currently, there is only one double-
blind placebo-controlled trial of dmPFC-rTMS, which included only 45 patients over 3 arms
(DLPFC-rTMS, dmPFC-rTMS, and sham), and applied only 15 sessions of treatment (Kreuzer et
al, 2015), which is insufficient to achieve full effect based on other case series of longer duration
(e.g., Bakker et al, 2015).
Aims & Hypotheses The general aim of Study III is to establish baseline predictors of and mechanisms of
improvements in TRD symptom severity following 30 sessions of 20 Hz dmPFC-rTMS under
placebo-controlled conditions.
Specific Aims of Study III 1. To determine whether the clinical efficacy of active 20 Hz dmPFC-rTMS is superior to
that of 1 Hz active dmPFC and sham dmPFC-rTMS.
199
2. To replicate previously identified patterns of baseline dmPFC resting-state functional
connectivity that significantly differ between TRD dmPFC-rTMS responders and non-
responders.
3. To replicate previously identified patterns of pre- to post-treatment changes in resting-
state functional connectivity that correlate with improvements in TRD severity.
Hypotheses of Study III 1. Improvements in depression symptoms with 20 Hz dmPFC-rTMS will be significantly
higher than that achieved with 1 Hz dmPFC-rTMS or placebo dmPFC-rTMS.
2. TRD patients with lower dmPFC-CSTC and higher dmPFC-VMPFC resting-state
functional connectivity will show greater symptom improvement with active 20 Hz
dmPFC-rTMS, but not with active 1 Hz or placebo dmPFC-rTMS.
3. TRD patients showing greater increases in pre- to post-treatment dmPFC-CSTC resting-
state functional connectivity will show greater improvement in clinical symptoms, after
active 20 Hz dmPFC-rTMS but not after active 1 Hz or placebo dmPFC-rTMS.
Methods In overview, this study compared the efficacy of two rTMS protocols over the dmPFC for
treatment-resistant MDD. Patients were randomized to 1 Hz, 20 Hz, or sham dmPFC-rTMS,
administered twice daily for 15 days. Patients who received sham-rTMS were subsequently
offered active rTMS upon trial withdrawal or completion. Structural and functional MRI were
acquired before and after treatment, along with a battery of clinical and psychometric measures
to characterize symptom severity and cognitive control. Age-, and sex-matched healthy controls
to the TRD cohort were recruited as a comparator group.
200
Patient Recruitment
The study screened 123 male and female patients who were referred from the community
to the MRI-Guided rTMS Clinic at Toronto Western Hospital. MDD diagnosis was verified by a
Canadian Royal College-certified psychiatrist at the time of their initial consultation assessment
for rTMS treatment. Patients were included in the study if: they were competent to give
voluntary consent to treatment and agreed to participate; met DSM-5 diagnostic criteria for
MDD at the time of their consultation for rTMS, and had a HAMD score of or at least 18 at the
time of their screening. Patients were excluded if they: were pregnant; had a lifetime MINI
diagnosis of bipolar I or II disorder, schizophrenia, schizoaffective disorder, schizophreniform
disorder, delusional disorder, or current psychotic symptoms; had a MINI diagnosis of OCD,
post-traumatic stress disorder (current or within the last year), anxiety disorder (including
generalized anxiety disorder, social anxiety disorder, panic disorder), or dysthymia, assessed by a
study investigator to be primary and causing greater impairment than MDD; had a diagnosis of
any personality disorder, as assessed by a study investigator to be primary and causing greater
impairment than MDD; had previously received rTMS for any previous indication due to
potential compromise of subject blinding; had any significant neurological disorder or insult
including, but not limited to: any condition likely to be associated with increased intracranial
pressure, space occupying brain lesion, any history of seizure except those therapeutically
induced by ECT, cerebral aneurysm, Parkinson's disease, Huntington's chorea, multiple sclerosis,
significant head trauma with loss of consciousness for greater than or equal to 5 minutes; had an
intracranial implant (e.g., aneurysm clips, shunts, stimulators, cochlear implants, or electrodes)
or any other metal object within or near the head, excluding the mouth that cannot be safely
removed; or had a non-correctable clinically significant sensory impairment (i.e., could not hear
well enough to cooperate with interview). If a patient was participating in psychotherapy, they
must have been in stable treatment for at least 3 months prior to entry to the study, with no
anticipation of change in the frequency of therapeutic sessions, or the therapeutic focus over the
duration of the study. If a patient was taking antidepressant medication, they must have received
stable dosage for at least 4 weeks prior to entry to the study. Patients were also required not to
take more than 2 mg daily of lorazepam (or equivalent dosage of other benzodiazepines), or any
dose of an anticonvulsant due to the potential to limit rTMS efficacy. Inclusion and exclusion
criteria were assessed in a pre-treatment interview administered by trained staff with clinical
supervision.

201
All randomized patients provided informed consent to participate, and the study was
approved by the University Heath Network Research Ethics Board.
Primary Clinical Measures
The HAMD (Kimbrell et al, 1999; Kreuzer et al, 2015; Padberg et al, 1999) and the BDI-
II (Hamilton, 1960) were the two primary clinical outcome measures for the study, as in previous
studies of dmPFC-rTMS in TRD (Bakker et al., 2015). Trained research staff blinded to
treatment arm administered these measures at pre-treatment, weekly (every 5 treatment days)
throughout treatment, immediately post-treatment, and at 1,- 4-, and 12-weeks post-treatment.
The BAI (Beck et al, 1988) was also included as a secondary outcome measure. The BAI
is a widely used and validated measure of anxiety symptoms. It is a 21-item self-report
questionnaire. This measure was assessed at pre-treatment, weekly throughout treatment,
immediately post-treatment, and at 1-, 4, and 12-weeks post-treatment.
For continuous outcome measures, a mixed effects model was used to assess the
significance of any differences in clinical ratings over the course of treatment and follow-up
across the 120 subjects in the group. The mixed effects model offers advantages in terms of
handling missing values, when compared to the fixed effects ANOVA with a last observation
carried forward (LOCF) approach. Time (baseline, weekly during treatment, and 1-week post-
treatment) was used as the explanatory variable in a mixed-effects, linear regression model for
the continuous outcomes (HAMD, BDI, BAI).
Randomization and rTMS Treatment
Upon entry into the study, all patients were randomized into one of three treatment arms:
active 1 Hz dmPFC-rTMS, active 20 Hz dmPFC-rTMS, or sham rTMS. Prior to the first session
of rTMS, each subject’s motor threshold was determined using single pulse TMS over the
medial primary motor cortex corresponding to the foot and toes (Hayward et al, 2007; Schutter
and van Honk, 2006).
202
Subjects underwent bilateral rTMS of the dmPFC either using the 1 Hz (inhibitory) or 20
Hz (excitatory) protocol. rTMS employed the MagPro R30 stimulator and a custom active/sham
variant of the DB80 fluid-cooled coil described below (MagVenture, Farum, Denmark). Patients
received 30 weekday sessions of bilateral rTMS over the dmPFC, twice daily (60 minutes apart),
over 3 weeks. Patients randomized to excitatory active rTMS received 20 Hz stimulation at
120% of the resting motor threshold, 2s on 12 s off, 38 trains, for 1520 pulses per hemisphere,
for a total of 3000 pulses per session delivered over 8 min 40 s per hemisphere. Patients
randomized to inhibitory active stimulation received 1 Hz stimulation over the bilateral dmPFC
at 120% resting motor threshold, 60s on and 30 s off, for 360 total pulses, 8.5 minutes per
hemisphere (Brunelin et al, 2014).
Sham rTMS employed a custom active/placebo version of the DB80 coil, designed to
maintain blinding in clinical trial settings (MagVenture, Farum, Denmark) (Figure 6-1). The
double-sided stimulation coil was positioned with one coil in contact with the scalp for active,
the other for sham. Preprogrammed software controlled a switch within the rTMS device that
determines which (externally indistinguishable) side of the coil was placed over the scalp, based
on the patient’s study ID code, thereby maintaining technician blinding. Patients randomized to
the sham arm were randomly allocated to receive either the 1 Hz or 20 Hz dmPFC-rTMS pattern
above, again to maintain blinding; this pulse pattern was delivered with the active coil in the
upper position (oriented away from the scalp), thus avoiding stimulation of the target region.
During treatment, patients were asked to defer any medication changes throughout the
course of rTMS to avoid confounding effects. Patients were also assessed for the emergence of
any adverse events (e.g., headache, seizure, worsening of symptoms) at each session of treatment
and at each follow-up assessment. Patients were withdrawn from the study if they experienced a
worsening in depression, defined as an increase in the HAMD from baseline of >25% during two
consecutive assessments, or the development of active suicidal intent, or attempted suicide.

203
Figure 6-1: The custom MagVenture active/placebo coil.
MRI Acquisition and Analysis
An MRI scan was acquired one week prior to and one week following treatment. Subjects
underwent a 30-minute MRI protocol consisting of a 6-minute high-resolution T1 anatomical
sequence, and a 10-minute T2* BOLD fMRI sequence during the resting state for assessment of
whole-brain functional connectivity. MRIs were performed using 3T GE Signa HDx scanner
equipped with an 8-channel phased-array head coil. This comprised a T1-weighted fast spoiled
gradient-echo anatomical scan (TE = 12 ms, TI = 300 ms, flip angle = 20°, 116 sagittal slices,
thickness = 1.5 mm, no gap, 256 x 256 matrix, FOV = 240 mm), followed by a 10-min resting-
state, eyes-closed T2* series (TE = 30 ms, TR = 2000 ms, flip angle = 85°, 32 axial slices,
thickness = 5 mm, no gap, 64 x 64 matrix, FOV = 220mm, 300 TRs, 2 s temporal resolution).
204
Resting-state fMRI was preprocessed and analyzed using SPM12
(http://www.fil.ion.ucl.ac.uk/spm/doc/) and the CONN FC toolbox (Whitfield-Gabrieli and
Nieto-Castanon, 2012), executed in Matlab v8.5.0.197613
(https://www.mathworks.com/products/matlab/). Before rs-fMRI preprocessing, the first five
volumes of each subject’s resting state fMRI scan were removed to account for scanner
instabilities. Preprocessing steps included the following: interleaved slice-time correction; affine
realignment and volume censorship (using the ARtifact detection Tools software package,
removing volumes exceeding the 95th percentile); linear affine registration of the functional
image to the anatomical T1 image and non-linear registration of the functional and anatomical
images to the MNI standard brain; and spatial smoothing with a 6 mm full-width half-maximum.
Skull-stripped anatomical T1 images were additionally segmented into gray matter, white matter,
and cerebrospinal fluid for the removal of physiological noise.
Motion (outputs from affine realignment), physiological noise and other non-neuronal
noise were removed via linear regression. To remove physiological noise, aCompCor (Behzadi et
al, 2007b) was performed using the segmented white matter and cerebrospinal fluid T1
anatomical images. The first five principal components of each tissue segment were removed in
addition to the 12 motion parameters, their first derivative, and the linear motion trend. Finally,
all resting-state functional data were then bandpass filtered at 0.008–0.09 Hz.
We applied a region-of-interest approach, using the dmPFC, VMPFC and striatal regions
of interest that were previously predictive of dmPFC-rTMS (Dunlop et al, 2015, 2016a;
Salomons et al, 2014). In total, 6 regions were used (Figure 6-2): two dmPFC ROIs (dmPFC and
anterior mid-cingulate cortex), a VMPFC ROI, and three striatal seeds (superior and inferior
ventral striatum, and the dorsal caudate). All cortical ROIs were extracted from the Craddock
and colleagues’ resting-state whole-brain parcellation (Craddock et al, 2012a), while striatal
ROIs were generated using coordinates described by Di Martino and colleagues (Di Martino et
al, 2008). Whole-brain seed-to-voxel-based FC was performed for each ROI for each subject.
This analysis step resulted in a bivariate correlation map for each subject; these maps were then
Fisher-transformed to normalized z-scores and were entered into a second-level mixed-effects
general linear model to identify group effects.
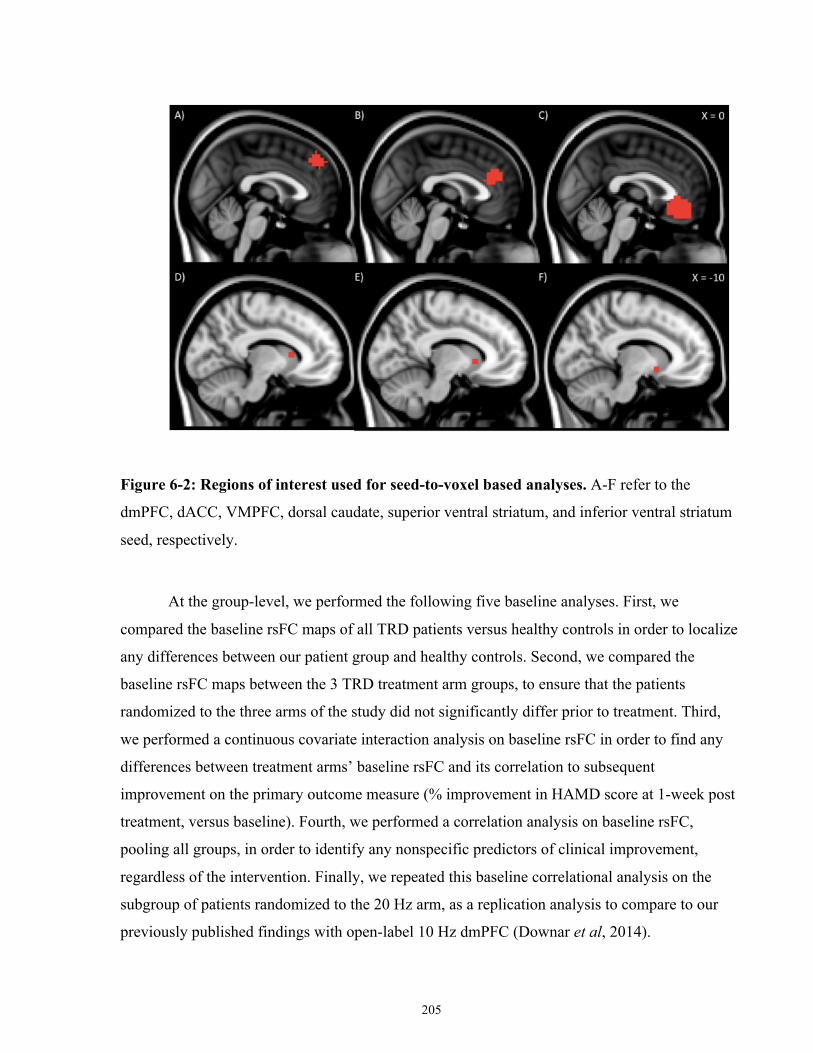
205
Figure 6-2: Regions of interest used for seed-to-voxel based analyses. A-F refer to the
dmPFC, dACC, VMPFC, dorsal caudate, superior ventral striatum, and inferior ventral striatum
seed, respectively.
At the group-level, we performed the following five baseline analyses. First, we
compared the baseline rsFC maps of all TRD patients versus healthy controls in order to localize
any differences between our patient group and healthy controls. Second, we compared the
baseline rsFC maps between the 3 TRD treatment arm groups, to ensure that the patients
randomized to the three arms of the study did not significantly differ prior to treatment. Third,
we performed a continuous covariate interaction analysis on baseline rsFC in order to find any
differences between treatment arms’ baseline rsFC and its correlation to subsequent
improvement on the primary outcome measure (% improvement in HAMD score at 1-week post
treatment, versus baseline). Fourth, we performed a correlation analysis on baseline rsFC,
pooling all groups, in order to identify any nonspecific predictors of clinical improvement,
regardless of the intervention. Finally, we repeated this baseline correlational analysis on the
subgroup of patients randomized to the 20 Hz arm, as a replication analysis to compare to our
previously published findings with open-label 10 Hz dmPFC (Downar et al, 2014).
206
We also completed the following two analyses to characterize changes in functional
connectivity associated with response to rTMS. First, we compared differences in the correlation
between rsFC change (baseline to post-treatment) and clinical improvement (% improvement in
HAMD score at 1-week post treatment, versus baseline) using a 3-way continuous covariate
interaction analysis. Second, we identified changes in rsFC that correlated with clinical
improvement across all 3 arms, regardless of treatment intervention.
Each of the resultant whole-brain group-level analyses were thresholded at p < 0.001
(cluster-corrected using the false discovery rate [FDR], with a height threshold of p < 0.05). An
adjusted peak p-value of 0.001/6 = 0.0002 was used to account for the number of ROIs included
for analysis. The resulting clusters were then displayed on the MNI brain. To determine any
significant statistical differences between groups, post hoc parameter estimates for the mean
effect size for each resulting cluster were extracted. For regions of interest arising in these
analyses, we also extracted the rsFC parameter estimates from the preprocessed control scans, as
a comparator group.
Supplementary Clinical Measures
The following subject-reported supplementary clinical measures were collected at
baseline and post-treatment: The Difficulties in Emotion Regulation Scale (DERS) (Gratz and
Roemer, 2004); the Rumination Responses Scale (RRS) (Treynor et al, 2003); the
Multidimensional Perfectionism Scale (MPS-II) (Hewitt et al, 1991); the UPPS Impulsive
Behaviour Scale (UPPS-P) (Whiteside and Lynam, 2001); the Behavioural Inhibition
Scale/Behavioural Approach Scale (BIS/BAS) (Carver and White, 1994); the Barratt
Impulsiveness Scale (BIS-11) (Patton et al, 1995); the Monetary-Choice Questionnaire (MCQ)
(Kirby and Marakovic, 1996); and the Revised NEO Questionnaire (NEO) (Costa and R., 1992).
The DERS is a self-report rating scale of 36 items measuring six separate dimensions of
emotion regulation: Nonacceptance of emotional responses; Difficulty in engaging in goal-
directed behaviour; Deficits in Impulse control; Poor emotional awareness; Limited access to
emotion regulation strategies; and Lack of emotional clarity. The measure has high internal
consistency, reliability, and validity (Gratz and Roemer, 2004). The RRS is a 22-item self-
207
reported scale that is a measure of rumination severity; higher scores indicate more severe
rumination. The MPS-II is a 45-item self-report questionnaire that assesses three dimensions of
perfectionism: self-oriented perfectionism, other-oriented perfectionism, and social prescribed
perfectionism. The UPPS-P is a 59-item self-report questionnaire that assesses five personality
subscales that are associated with impulsive behaviours: First, negative urgency, or the tendency
to act impulsively under negative emotions; Second, positive urgency, or the tendency to act
impulsive under positive emotions; Third, lack of premeditation, or the inability to think before
acting; Fourth, lack of perseverance, or difficulties in sustained focus on a task; and Finally,
sensation seeking, or the tendency to seek out novel or thrilling experiences (Whiteside and
Lynam, 2001). The BIS/BAS is a 24-item scale that assesses behavioural responses to reward
and punishment. This questionnaire groups questions into 4 categories: Drive, Fun-Seeking,
Reward Responsiveness, and Behavioural Avoidance. The BIS-11 is a 30-item self-report
questionnaire that assesses three constructs of impulsivity: Attentional, Motor, and Nonplanning
Impulsivity. The MCQ is a 27-item self-administered questionnaire. For each item, the
participant chooses either a lower value, immediate reward or a higher value, delayed reward.
Scores are calculated by fitting the respondent’s answers on reference discounting curves.
Placement on steeper discounting curves is indicative of higher impulsivity in decision-making
among rewards. The revised NEO personality inventory involves 240 questions that measure the
‘big five’ personality traits: extraversion, agreeableness, conscientiousness, neuroticism, and
openness to experience.
The same analyses as described above for clinical data were performed for these
supplementary psychometric measures. These analyses identify any group (20 Hz responder/20
Hz non-responder/1 Hz responder/1 Hz non-responder/sham/healthy control) by time
interactions that reflect changes in cognitive measures of impulsivity or perfectionism over the
course of treatment.
Healthy Control Recruitment & Study Visits
Forty-one healthy controls were recruited as a comparator group for TRD patients (n = 1
did not meet inclusion/exclusion criteria, n = 1 did not complete study visits). Healthy subjects
underwent an initial screening to assess medical and medication history, suitability for MRI, and
current/past psychiatric symptomatology. Healthy participants were excluded if they had: a
208
lifetime history of neurological or psychiatric disease, including substance abuse or dependence,
or cardiovascular disease; currently used any medications that may affect brain perfusion or
activity, including antidepressants, mood stabilizers, neuroleptics, anxiolytics, hypnotics,
stimulants, anticonvulsants, anti-migraine agents, cognitive enhancing agents, opioids, anti-
nausea agents or beta-blockers; had contraindications to MRI (e.g., implanted medical devices,
metallic foreign objects, epilepsy), or a HAMD score of at least 8. Healthy controls underwent
one visit in which all primary and secondary clinical measures were collected, and a second MRI
visit identical to that described above.
All controls provided informed consent, and the study was approved by the University
Heath Network Research Ethics Board.
Results
Demographic and Primary Clinical Results
Of the 123 patients referred to the study, n = 103 met the eligibility for the study (Figure
6-3, Table 6-1) and were randomized to one of the 3 study arms. Of these 103 subjects, 2 were
subsequently excluded due to potential unblinding during treatment, and 10 patients withdrew
prematurely from treatment (Figure 6-3). Consequently, of those that completed a full course of
treatment, 31 had been randomized into 1 Hz rTMS, 30 into 20 Hz rTMS, and 30 into placebo
rTMS (total n = 91 TRD patients). 39 healthy controls were also screened for the study; 38 met
the inclusion criteria and of those N = 37 completed the study. Healthy controls and the three
treatment groups did not significantly differ in terms of age (F (3, 124) = 0.540, p = 0.656) or sex
(χ2 = 0.604, p = 0.895). These controls and completers were included in the analyses below.
Comorbidities and concomitant medication of patients are included in Tables 6-2, and 6-
3. To summarize, only 4 patients had previously received ECT; all of those who received ECT
displayed full or partial benefit from that intervention. Concomitant medications, comorbidities,
and antidepressant history varied widely. An overwhelming majority of TRD participants were
stably on at least one concomitant psychotropic medication, most notably SRRIs, SNRIs,
atypical antipsychotics and benzodiazepines. Treatment groups did not significantly vary in
terms of the proportion of patients taking a particular medication class. TRD patients also
209
displayed a high level of non-response to conventional antidepressant pharmacotherapies. All
TRD patients did not respond or could not tolerate an average of 6.87±3.81 antidepressant
interventions in the current major depressive episode. The number of previous trials did not vary
by treatment intervention (F (2,86) = 0.66, p = 0.52; mean number 1 Hz = 7.40±4.34; 20 Hz =
6.93±3.31, Placebo = 6.27±3.75). Most patients had a current or remitted psychiatric
comorbidity.
At baseline, healthy controls displayed significantly lower HAMD, BAI and BDI-II
scores relative to all three treatment groups (Figures 6-4, 6-5 and 6-6, Table 6-1). On average,
controls displayed subclinical levels of depressive and anxiety symptoms (mean HAMD =
1.38±1.48 SD; BDI-II = 2.73±3.12; BAI = 3.00±4.51). On all three measures, all patient groups
displayed severe or very severe depressive and moderate-to-severe anxiety scores. The TRD
treatment groups did not differ in terms of depression or anxiety severity at baseline or at any
other time-point (F < 1.196, p > 0.307). Among the three TRD treatment arms, a mixed effects
model using HAMD revealed a significant effect of time (F = 27.85, p < 0.0000001) but no
group by time interactions (F = 0.36, p = 0.96). A similar effect was found in the BDI-II (effect
of time: F = 7.26, p = 0.000004; group x time: F = 0.17, p = 0.998), and BAI (effect of time: F =
3.18, p = 0.01; group x time: F = 0.12, p = 0.9996). This indicates that while the patients of all
three treatment arms exhibited significant improvements over the course of treatment and into
follow-ups, there was no significant difference in the degree of improvement on any primary
clinical measures between active versus the placebo arms of the study. Age, sex and baseline
severity did not significantly predict treatment response either across the entire sample, or within
each treatment group.
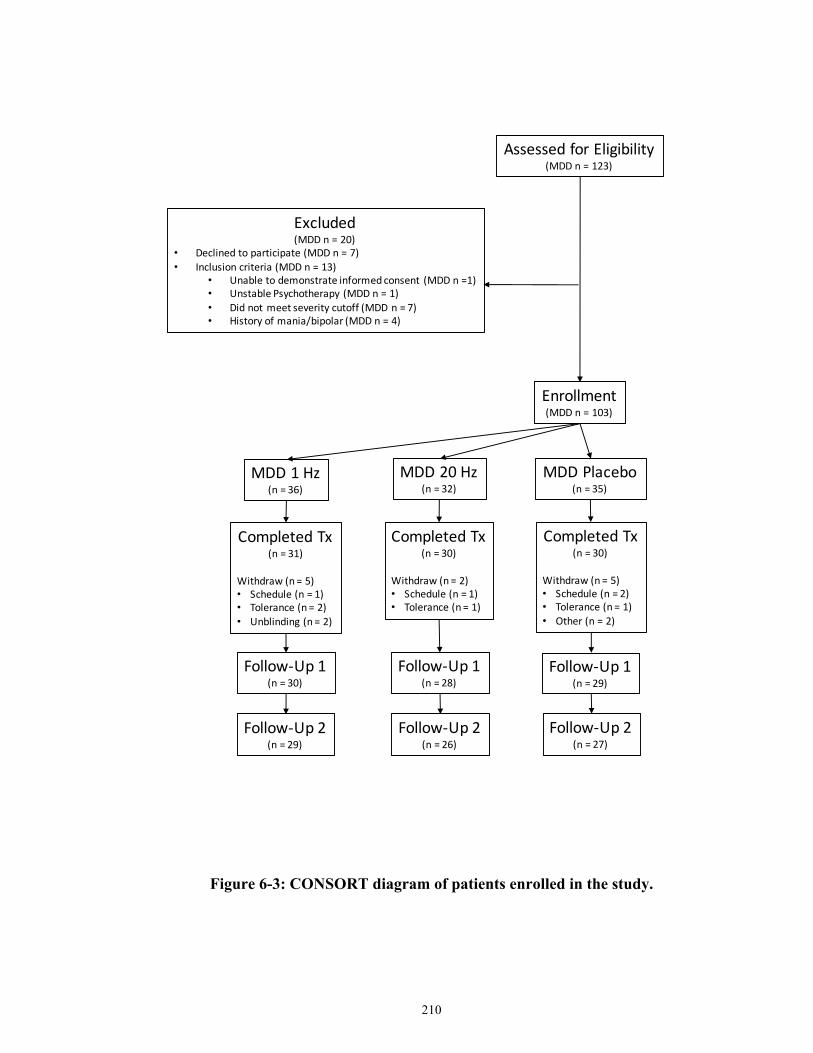
210
Figure 6-3: CONSORT diagram of patients enrolled in the study.
AssessedforEligibility(MDDn=123)
Excluded(MDDn=20)
• Declinedtoparticipate(MDDn=7)• Inclusioncriteria(MDDn=13)
• Unabletodemonstrateinformedconsent (MDDn=1)• UnstablePsychotherapy (MDDn=1)• Didnotmeetseveritycutoff(MDDn=7)• Historyofmania/bipolar(MDDn=4)
Enrollment(MDDn=103)
MDD1Hz(n=36)
MDD20Hz(n=32)
MDDPlacebo(n=35)
CompletedTx(n=31)
Withdraw(n=5)• Schedule(n=1)• Tolerance(n=2)• Unblinding (n=2)
CompletedTx(n=30)
Withdraw(n=2)• Schedule(n=1)• Tolerance(n=1)
CompletedTx(n=30)
Withdraw(n=5)• Schedule(n=2)• Tolerance(n=1)• Other(n=2)
Follow-Up1(n=30)
Follow-Up1(n=28)
Follow-Up1(n=29)
Follow-Up2(n=29)
Follow-Up2(n=26)
Follow-Up2(n=27)
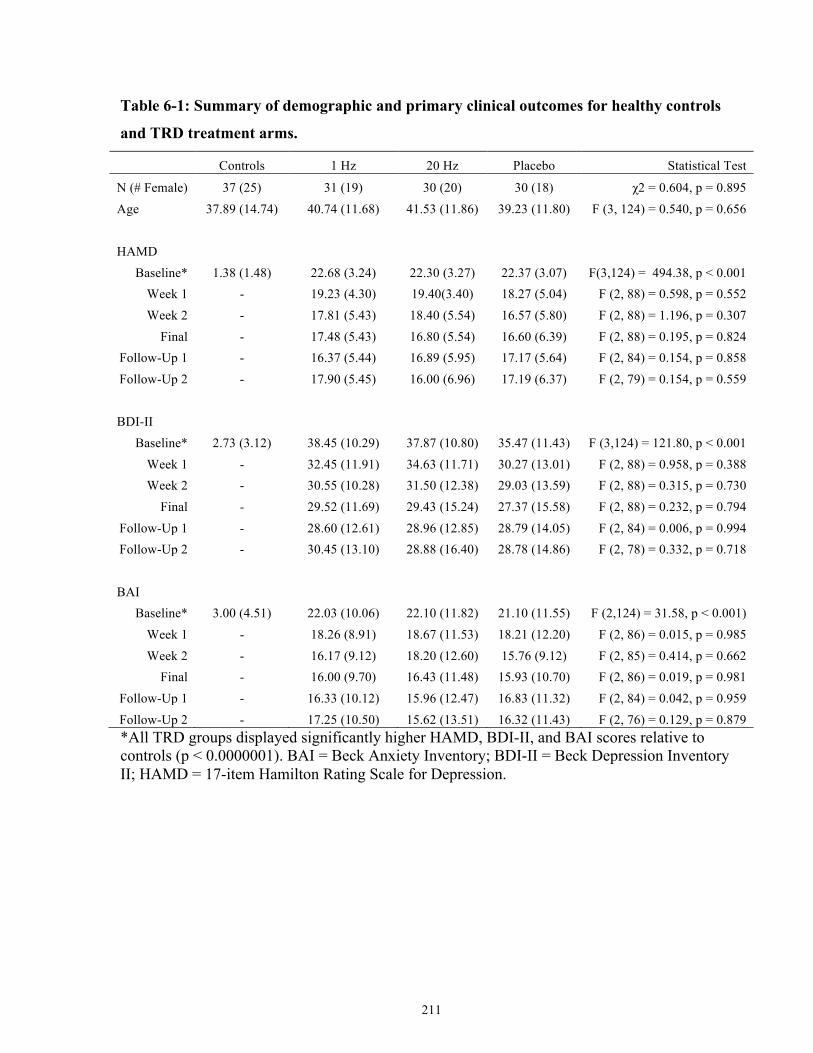
211
Table 6-1: Summary of demographic and primary clinical outcomes for healthy controls
and TRD treatment arms.
Controls 1 Hz 20 Hz Placebo Statistical Test
N (# Female) 37 (25) 31 (19) 30 (20) 30 (18) χ2 = 0.604, p = 0.895 Age 37.89 (14.74) 40.74 (11.68) 41.53 (11.86) 39.23 (11.80) F (3, 124) = 0.540, p = 0.656
HAMD Baseline* 1.38 (1.48) 22.68 (3.24) 22.30 (3.27) 22.37 (3.07) F(3,124) = 494.38, p < 0.001
Week 1 - 19.23 (4.30) 19.40(3.40) 18.27 (5.04) F (2, 88) = 0.598, p = 0.552 Week 2 - 17.81 (5.43) 18.40 (5.54) 16.57 (5.80) F (2, 88) = 1.196, p = 0.307
Final - 17.48 (5.43) 16.80 (5.54) 16.60 (6.39) F (2, 88) = 0.195, p = 0.824 Follow-Up 1 - 16.37 (5.44) 16.89 (5.95) 17.17 (5.64) F (2, 84) = 0.154, p = 0.858 Follow-Up 2 - 17.90 (5.45) 16.00 (6.96) 17.19 (6.37) F (2, 79) = 0.154, p = 0.559
BDI-II Baseline* 2.73 (3.12) 38.45 (10.29) 37.87 (10.80) 35.47 (11.43) F (3,124) = 121.80, p < 0.001
Week 1 - 32.45 (11.91) 34.63 (11.71) 30.27 (13.01) F (2, 88) = 0.958, p = 0.388 Week 2 - 30.55 (10.28) 31.50 (12.38) 29.03 (13.59) F (2, 88) = 0.315, p = 0.730
Final - 29.52 (11.69) 29.43 (15.24) 27.37 (15.58) F (2, 88) = 0.232, p = 0.794 Follow-Up 1 - 28.60 (12.61) 28.96 (12.85) 28.79 (14.05) F (2, 84) = 0.006, p = 0.994 Follow-Up 2 - 30.45 (13.10) 28.88 (16.40) 28.78 (14.86) F (2, 78) = 0.332, p = 0.718
BAI Baseline* 3.00 (4.51) 22.03 (10.06) 22.10 (11.82) 21.10 (11.55) F (2,124) = 31.58, p < 0.001)
Week 1 - 18.26 (8.91) 18.67 (11.53) 18.21 (12.20) F (2, 86) = 0.015, p = 0.985 Week 2 - 16.17 (9.12) 18.20 (12.60) 15.76 (9.12) F (2, 85) = 0.414, p = 0.662
Final - 16.00 (9.70) 16.43 (11.48) 15.93 (10.70) F (2, 86) = 0.019, p = 0.981 Follow-Up 1 - 16.33 (10.12) 15.96 (12.47) 16.83 (11.32) F (2, 84) = 0.042, p = 0.959 Follow-Up 2 - 17.25 (10.50) 15.62 (13.51) 16.32 (11.43) F (2, 76) = 0.129, p = 0.879 *All TRD groups displayed significantly higher HAMD, BDI-II, and BAI scores relative to controls (p < 0.0000001). BAI = Beck Anxiety Inventory; BDI-II = Beck Depression Inventory II; HAMD = 17-item Hamilton Rating Scale for Depression.
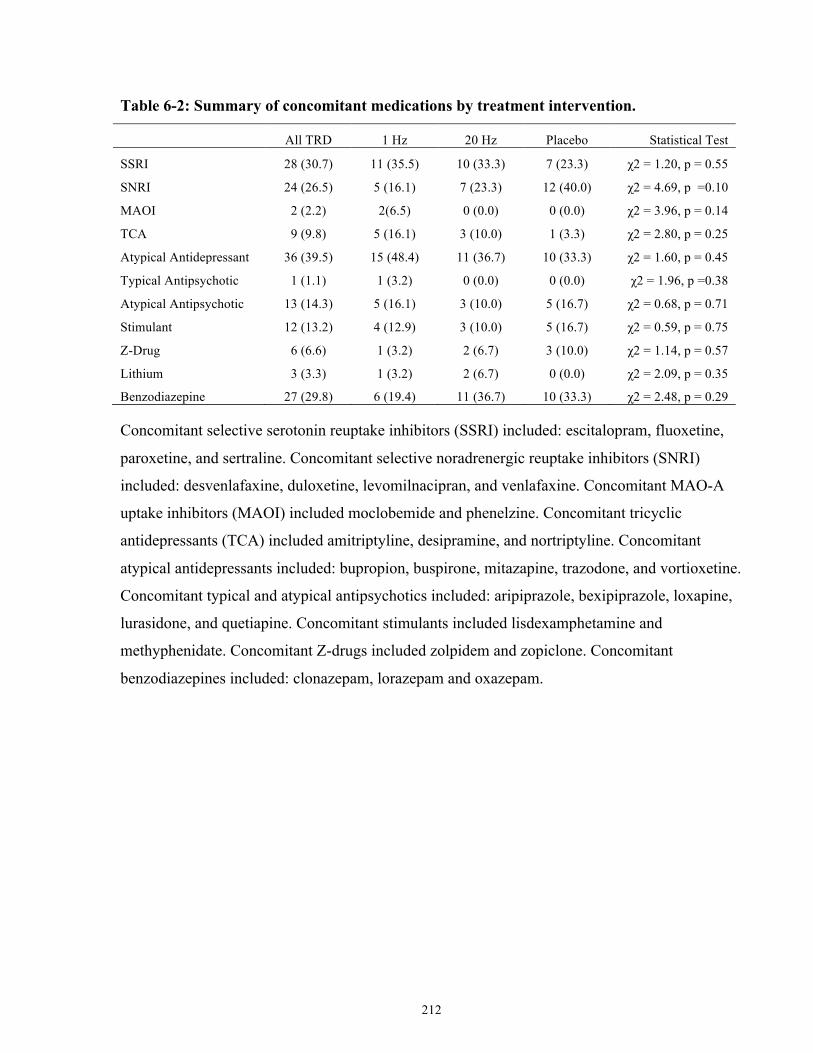
212
Table 6-2: Summary of concomitant medications by treatment intervention.
All TRD 1 Hz 20 Hz Placebo Statistical Test
SSRI 28 (30.7) 11 (35.5) 10 (33.3) 7 (23.3) χ2 = 1.20, p = 0.55
SNRI 24 (26.5) 5 (16.1) 7 (23.3) 12 (40.0) χ2 = 4.69, p =0.10
MAOI 2 (2.2) 2(6.5) 0 (0.0) 0 (0.0) χ2 = 3.96, p = 0.14
TCA 9 (9.8) 5 (16.1) 3 (10.0) 1 (3.3) χ2 = 2.80, p = 0.25
Atypical Antidepressant 36 (39.5) 15 (48.4) 11 (36.7) 10 (33.3) χ2 = 1.60, p = 0.45
Typical Antipsychotic 1 (1.1) 1 (3.2) 0 (0.0) 0 (0.0) χ2 = 1.96, p =0.38
Atypical Antipsychotic 13 (14.3) 5 (16.1) 3 (10.0) 5 (16.7) χ2 = 0.68, p = 0.71
Stimulant 12 (13.2) 4 (12.9) 3 (10.0) 5 (16.7) χ2 = 0.59, p = 0.75
Z-Drug 6 (6.6) 1 (3.2) 2 (6.7) 3 (10.0) χ2 = 1.14, p = 0.57
Lithium 3 (3.3) 1 (3.2) 2 (6.7) 0 (0.0) χ2 = 2.09, p = 0.35
Benzodiazepine 27 (29.8) 6 (19.4) 11 (36.7) 10 (33.3) χ2 = 2.48, p = 0.29
Concomitant selective serotonin reuptake inhibitors (SSRI) included: escitalopram, fluoxetine,
paroxetine, and sertraline. Concomitant selective noradrenergic reuptake inhibitors (SNRI)
included: desvenlafaxine, duloxetine, levomilnacipran, and venlafaxine. Concomitant MAO-A
uptake inhibitors (MAOI) included moclobemide and phenelzine. Concomitant tricyclic
antidepressants (TCA) included amitriptyline, desipramine, and nortriptyline. Concomitant
atypical antidepressants included: bupropion, buspirone, mitazapine, trazodone, and vortioxetine.
Concomitant typical and atypical antipsychotics included: aripiprazole, bexipiprazole, loxapine,
lurasidone, and quetiapine. Concomitant stimulants included lisdexamphetamine and
methyphenidate. Concomitant Z-drugs included zolpidem and zopiclone. Concomitant
benzodiazepines included: clonazepam, lorazepam and oxazepam.
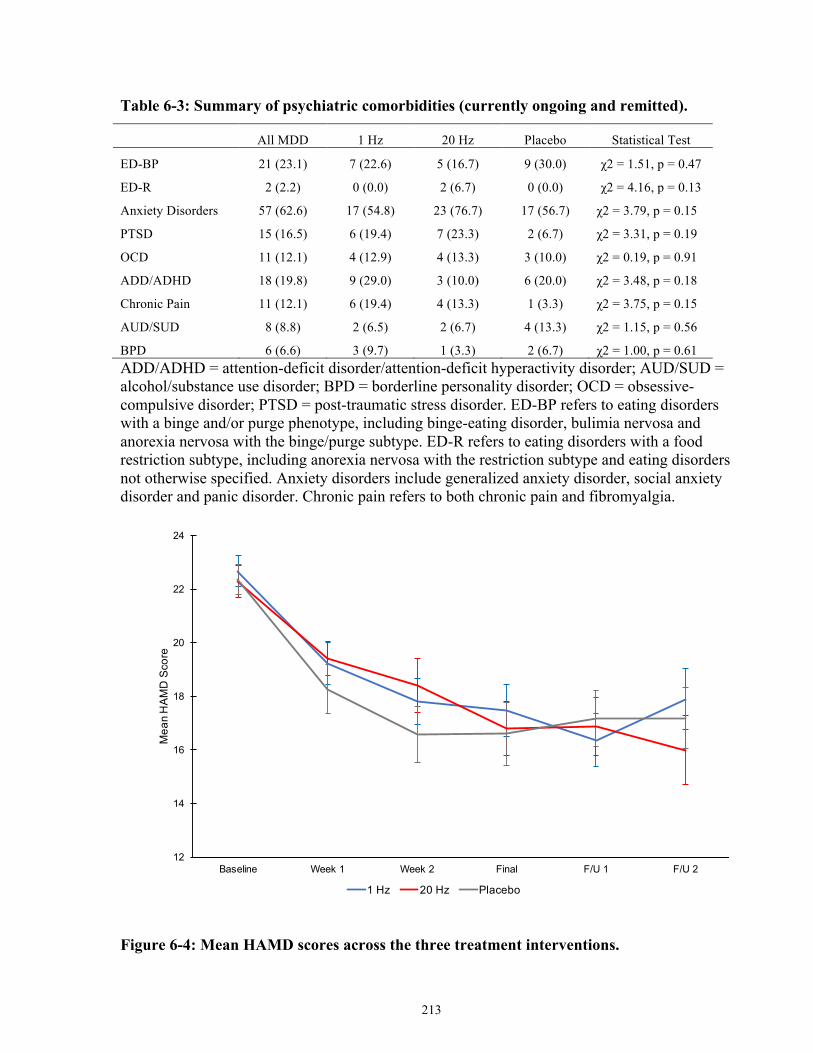
213
Table 6-3: Summary of psychiatric comorbidities (currently ongoing and remitted).
All MDD 1 Hz 20 Hz Placebo Statistical Test
ED-BP 21 (23.1) 7 (22.6) 5 (16.7) 9 (30.0) χ2 = 1.51, p = 0.47
ED-R 2 (2.2) 0 (0.0) 2 (6.7) 0 (0.0) χ2 = 4.16, p = 0.13
Anxiety Disorders 57 (62.6) 17 (54.8) 23 (76.7) 17 (56.7) χ2 = 3.79, p = 0.15
PTSD 15 (16.5) 6 (19.4) 7 (23.3) 2 (6.7) χ2 = 3.31, p = 0.19
OCD 11 (12.1) 4 (12.9) 4 (13.3) 3 (10.0) χ2 = 0.19, p = 0.91
ADD/ADHD 18 (19.8) 9 (29.0) 3 (10.0) 6 (20.0) χ2 = 3.48, p = 0.18
Chronic Pain 11 (12.1) 6 (19.4) 4 (13.3) 1 (3.3) χ2 = 3.75, p = 0.15
AUD/SUD 8 (8.8) 2 (6.5) 2 (6.7) 4 (13.3) χ2 = 1.15, p = 0.56
BPD 6 (6.6) 3 (9.7) 1 (3.3) 2 (6.7) χ2 = 1.00, p = 0.61 ADD/ADHD = attention-deficit disorder/attention-deficit hyperactivity disorder; AUD/SUD = alcohol/substance use disorder; BPD = borderline personality disorder; OCD = obsessive-compulsive disorder; PTSD = post-traumatic stress disorder. ED-BP refers to eating disorders with a binge and/or purge phenotype, including binge-eating disorder, bulimia nervosa and anorexia nervosa with the binge/purge subtype. ED-R refers to eating disorders with a food restriction subtype, including anorexia nervosa with the restriction subtype and eating disorders not otherwise specified. Anxiety disorders include generalized anxiety disorder, social anxiety disorder and panic disorder. Chronic pain refers to both chronic pain and fibromyalgia.
Figure 6-4: Mean HAMD scores across the three treatment interventions.
12
14
16
18
20
22
24
Baseline Week 1 Week 2 Final F/U 1 F/U 2
Mea
n H
AMD
Sco
re
1 Hz 20 Hz Placebo
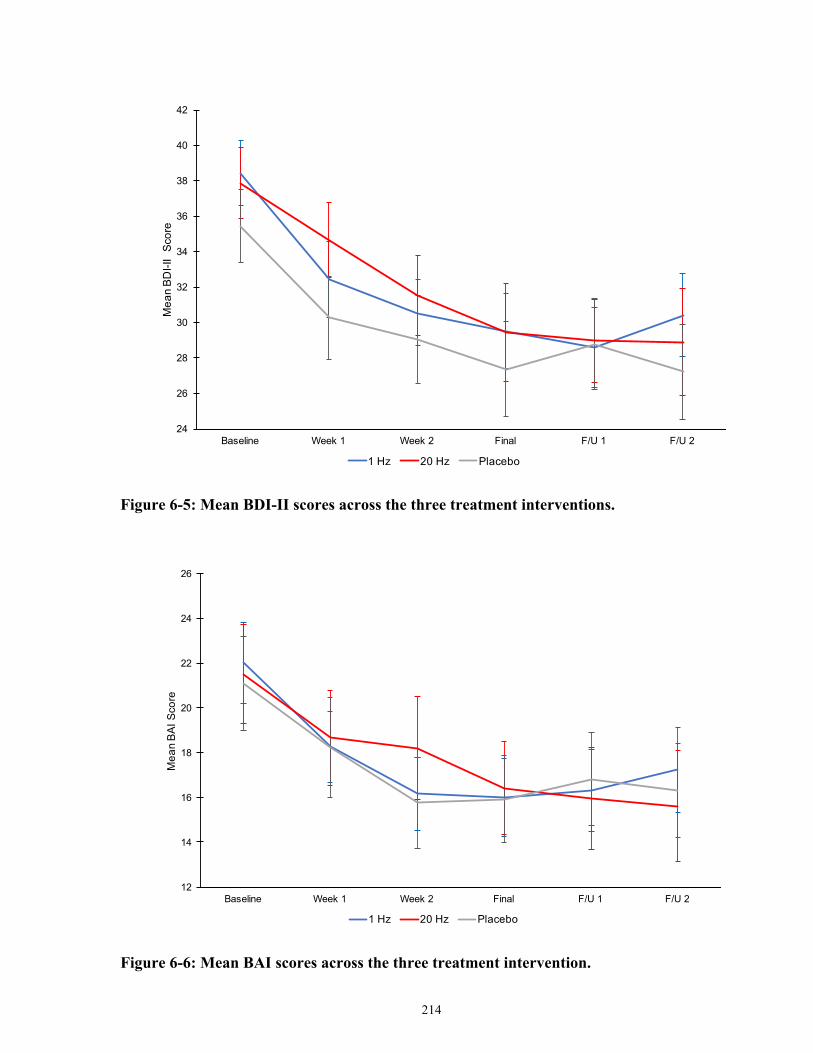
214
Figure 6-5: Mean BDI-II scores across the three treatment interventions.
Figure 6-6: Mean BAI scores across the three treatment intervention.
24
26
28
30
32
34
36
38
40
42
Baseline Week 1 Week 2 Final F/U 1 F/U 2
Mea
n BD
I-II
Scor
e
1 Hz 20 Hz Placebo
12
14
16
18
20
22
24
26
Baseline Week 1 Week 2 Final F/U 1 F/U 2
Mea
n BA
I Sco
re
1 Hz 20 Hz Placebo
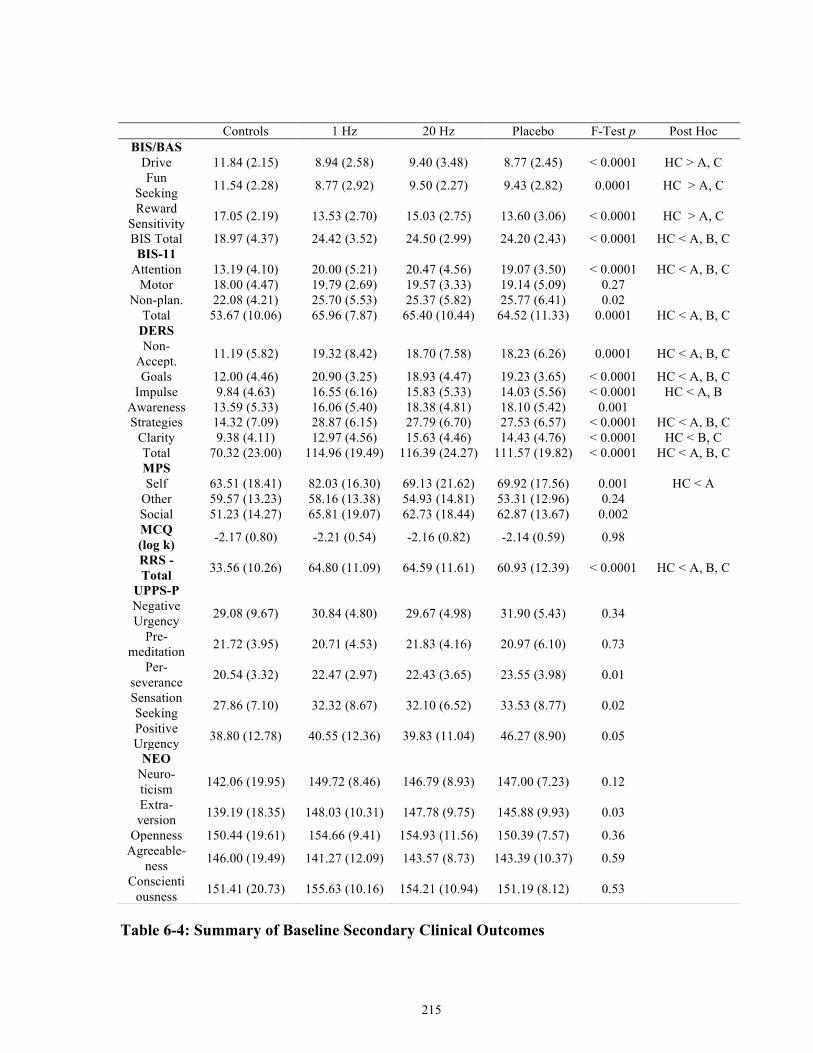
215
Table 6-4: Summary of Baseline Secondary Clinical Outcomes
Controls 1 Hz 20 Hz Placebo F-Test p Post Hoc BIS/BAS Drive 11.84 (2.15) 8.94 (2.58) 9.40 (3.48) 8.77 (2.45) < 0.0001 HC > A, C
Fun Seeking 11.54 (2.28) 8.77 (2.92) 9.50 (2.27) 9.43 (2.82) 0.0001 HC > A, C
Reward Sensitivity 17.05 (2.19) 13.53 (2.70) 15.03 (2.75) 13.60 (3.06) < 0.0001 HC > A, C
BIS Total 18.97 (4.37) 24.42 (3.52) 24.50 (2.99) 24.20 (2.43) < 0.0001 HC < A, B, C BIS-11 Attention 13.19 (4.10) 20.00 (5.21) 20.47 (4.56) 19.07 (3.50) < 0.0001 HC < A, B, C Motor 18.00 (4.47) 19.79 (2.69) 19.57 (3.33) 19.14 (5.09) 0.27 Non-plan. 22.08 (4.21) 25.70 (5.53) 25.37 (5.82) 25.77 (6.41) 0.02 Total 53.67 (10.06) 65.96 (7.87) 65.40 (10.44) 64.52 (11.33) 0.0001 HC < A, B, C DERS Non-Accept. 11.19 (5.82) 19.32 (8.42) 18.70 (7.58) 18.23 (6.26) 0.0001 HC < A, B, C
Goals 12.00 (4.46) 20.90 (3.25) 18.93 (4.47) 19.23 (3.65) < 0.0001 HC < A, B, C Impulse 9.84 (4.63) 16.55 (6.16) 15.83 (5.33) 14.03 (5.56) < 0.0001 HC < A, B
Awareness 13.59 (5.33) 16.06 (5.40) 18.38 (4.81) 18.10 (5.42) 0.001 Strategies 14.32 (7.09) 28.87 (6.15) 27.79 (6.70) 27.53 (6.57) < 0.0001 HC < A, B, C Clarity 9.38 (4.11) 12.97 (4.56) 15.63 (4.46) 14.43 (4.76) < 0.0001 HC < B, C Total 70.32 (23.00) 114.96 (19.49) 116.39 (24.27) 111.57 (19.82) < 0.0001 HC < A, B, C MPS Self 63.51 (18.41) 82.03 (16.30) 69.13 (21.62) 69.92 (17.56) 0.001 HC < A Other 59.57 (13.23) 58.16 (13.38) 54.93 (14.81) 53.31 (12.96) 0.24 Social 51.23 (14.27) 65.81 (19.07) 62.73 (18.44) 62.87 (13.67) 0.002 MCQ (log k) -2.17 (0.80) -2.21 (0.54) -2.16 (0.82) -2.14 (0.59) 0.98
RRS - Total 33.56 (10.26) 64.80 (11.09) 64.59 (11.61) 60.93 (12.39) < 0.0001 HC < A, B, C
UPPS-P Negative Urgency 29.08 (9.67) 30.84 (4.80) 29.67 (4.98) 31.90 (5.43) 0.34
Pre-meditation 21.72 (3.95) 20.71 (4.53) 21.83 (4.16) 20.97 (6.10) 0.73
Per-severance 20.54 (3.32) 22.47 (2.97) 22.43 (3.65) 23.55 (3.98) 0.01
Sensation Seeking 27.86 (7.10) 32.32 (8.67) 32.10 (6.52) 33.53 (8.77) 0.02
Positive Urgency 38.80 (12.78) 40.55 (12.36) 39.83 (11.04) 46.27 (8.90) 0.05
NEO Neuro-ticism 142.06 (19.95) 149.72 (8.46) 146.79 (8.93) 147.00 (7.23) 0.12
Extra-version 139.19 (18.35) 148.03 (10.31) 147.78 (9.75) 145.88 (9.93) 0.03
Openness 150.44 (19.61) 154.66 (9.41) 154.93 (11.56) 150.39 (7.57) 0.36 Agreeable-
ness 146.00 (19.49) 141.27 (12.09) 143.57 (8.73) 143.39 (10.37) 0.59
Conscientiousness 151.41 (20.73) 155.63 (10.16) 154.21 (10.94) 151.19 (8.12) 0.53
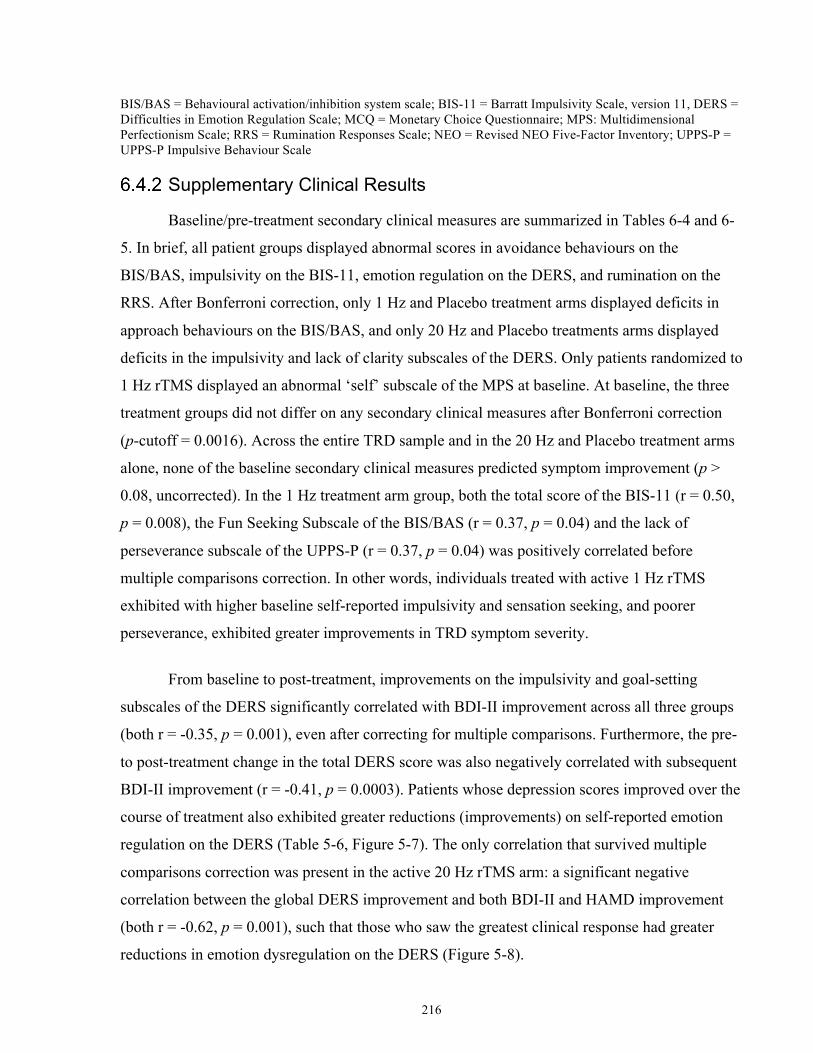
216
BIS/BAS = Behavioural activation/inhibition system scale; BIS-11 = Barratt Impulsivity Scale, version 11, DERS = Difficulties in Emotion Regulation Scale; MCQ = Monetary Choice Questionnaire; MPS: Multidimensional Perfectionism Scale; RRS = Rumination Responses Scale; NEO = Revised NEO Five-Factor Inventory; UPPS-P = UPPS-P Impulsive Behaviour Scale
Supplementary Clinical Results
Baseline/pre-treatment secondary clinical measures are summarized in Tables 6-4 and 6-
5. In brief, all patient groups displayed abnormal scores in avoidance behaviours on the
BIS/BAS, impulsivity on the BIS-11, emotion regulation on the DERS, and rumination on the
RRS. After Bonferroni correction, only 1 Hz and Placebo treatment arms displayed deficits in
approach behaviours on the BIS/BAS, and only 20 Hz and Placebo treatments arms displayed
deficits in the impulsivity and lack of clarity subscales of the DERS. Only patients randomized to
1 Hz rTMS displayed an abnormal ‘self’ subscale of the MPS at baseline. At baseline, the three
treatment groups did not differ on any secondary clinical measures after Bonferroni correction
(p-cutoff = 0.0016). Across the entire TRD sample and in the 20 Hz and Placebo treatment arms
alone, none of the baseline secondary clinical measures predicted symptom improvement (p >
0.08, uncorrected). In the 1 Hz treatment arm group, both the total score of the BIS-11 (r = 0.50,
p = 0.008), the Fun Seeking Subscale of the BIS/BAS (r = 0.37, p = 0.04) and the lack of
perseverance subscale of the UPPS-P (r = 0.37, p = 0.04) was positively correlated before
multiple comparisons correction. In other words, individuals treated with active 1 Hz rTMS
exhibited with higher baseline self-reported impulsivity and sensation seeking, and poorer
perseverance, exhibited greater improvements in TRD symptom severity.
From baseline to post-treatment, improvements on the impulsivity and goal-setting
subscales of the DERS significantly correlated with BDI-II improvement across all three groups
(both r = -0.35, p = 0.001), even after correcting for multiple comparisons. Furthermore, the pre-
to post-treatment change in the total DERS score was also negatively correlated with subsequent
BDI-II improvement (r = -0.41, p = 0.0003). Patients whose depression scores improved over the
course of treatment also exhibited greater reductions (improvements) on self-reported emotion
regulation on the DERS (Table 5-6, Figure 5-7). The only correlation that survived multiple
comparisons correction was present in the active 20 Hz rTMS arm: a significant negative
correlation between the global DERS improvement and both BDI-II and HAMD improvement
(both r = -0.62, p = 0.001), such that those who saw the greatest clinical response had greater
reductions in emotion dysregulation on the DERS (Figure 5-8).
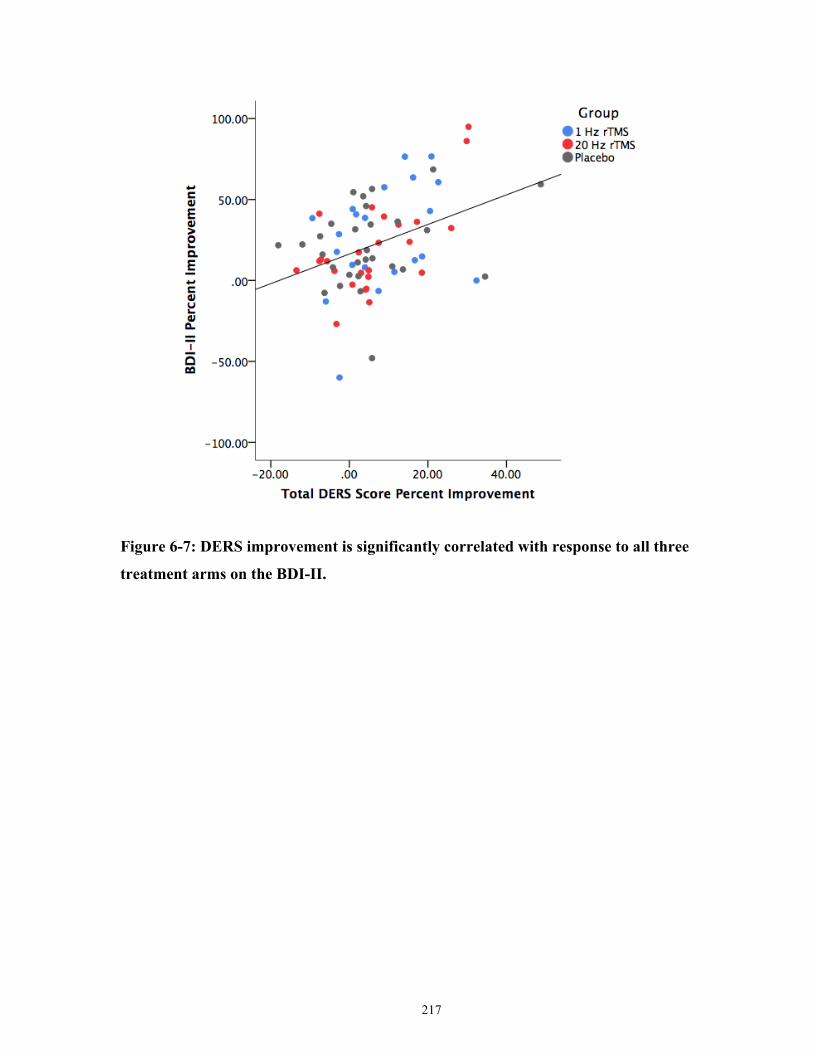
217
Figure 6-7: DERS improvement is significantly correlated with response to all three
treatment arms on the BDI-II.
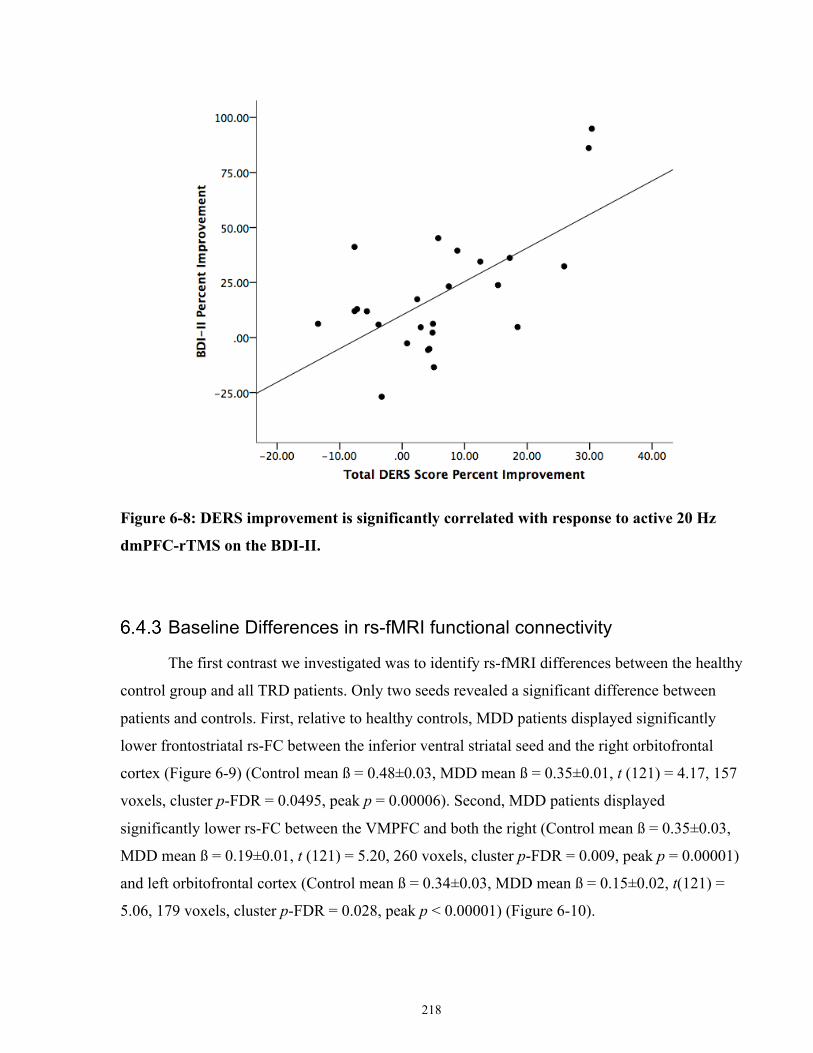
218
Figure 6-8: DERS improvement is significantly correlated with response to active 20 Hz
dmPFC-rTMS on the BDI-II.
Baseline Differences in rs-fMRI functional connectivity
The first contrast we investigated was to identify rs-fMRI differences between the healthy
control group and all TRD patients. Only two seeds revealed a significant difference between
patients and controls. First, relative to healthy controls, MDD patients displayed significantly
lower frontostriatal rs-FC between the inferior ventral striatal seed and the right orbitofrontal
cortex (Figure 6-9) (Control mean ß = 0.48±0.03, MDD mean ß = 0.35±0.01, t (121) = 4.17, 157
voxels, cluster p-FDR = 0.0495, peak p = 0.00006). Second, MDD patients displayed
significantly lower rs-FC between the VMPFC and both the right (Control mean ß = 0.35±0.03,
MDD mean ß = 0.19±0.01, t (121) = 5.20, 260 voxels, cluster p-FDR = 0.009, peak p = 0.00001)
and left orbitofrontal cortex (Control mean ß = 0.34±0.03, MDD mean ß = 0.15±0.02, t(121) =
5.06, 179 voxels, cluster p-FDR = 0.028, peak p < 0.00001) (Figure 6-10).
219
Second, an ANOVA was performed between the TRD treatment arms to determine
whether there were any significant differences in baseline rsFC (Figure 6-11). The only
significant difference between MDD groups was frontostriatal connectivity between the dorsal
caudate and right middle frontal gyrus (F (2,83) = 14.98, 147 voxels, cluster p-FDR = 0.033,
peak p = 0.00001). Further post-hoc testing revealed that this difference was largely driven by
patients in the 20 Hz treatment arm, such that they displayed significantly higher frontostriatal
rsFC relative to patients treated with active 1 Hz (20 Hz mean ß = 0.20±0.02, 1 Hz mean ß =
0.05±0.02, LSD-corrected p = 0.000001), placebo (Placebo mean ß = 0.08±0.01, LSD-corrected
p = 0.00009), and healthy controls (Control mean ß = 0.09±0.02, LSD-corrected p = 0.0001).
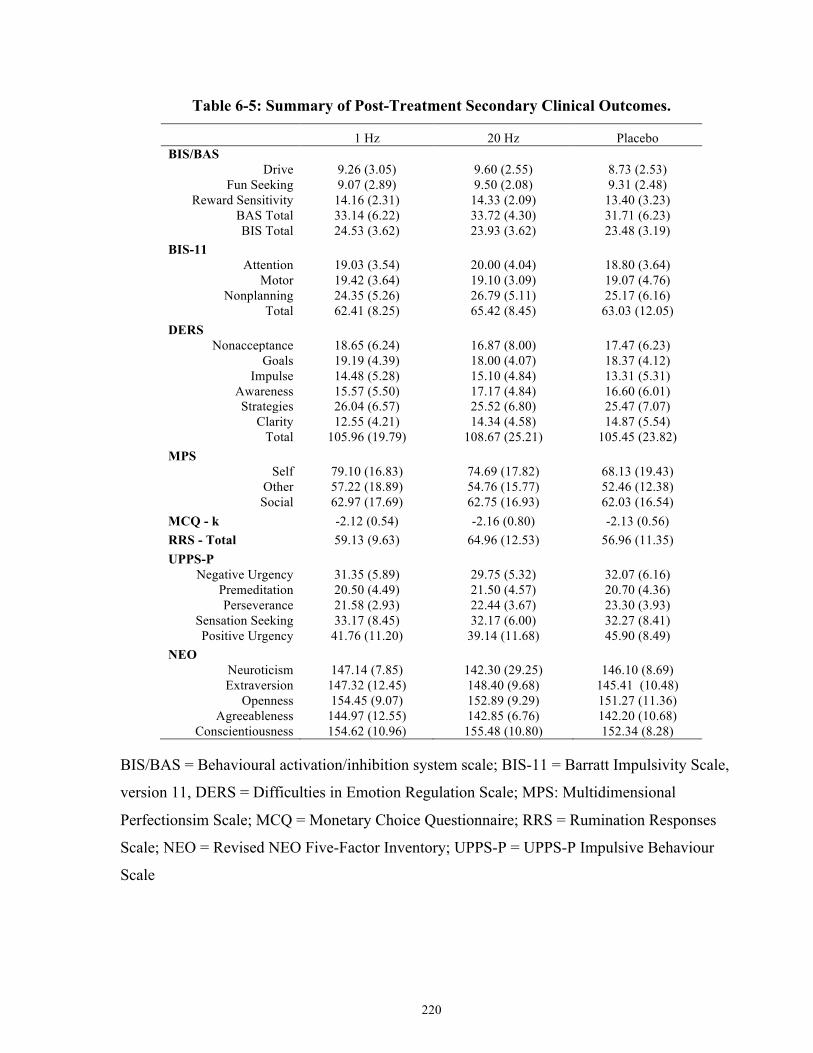
220
Table 6-5: Summary of Post-Treatment Secondary Clinical Outcomes.
1 Hz 20 Hz Placebo BIS/BAS
Drive 9.26 (3.05) 9.60 (2.55) 8.73 (2.53) Fun Seeking 9.07 (2.89) 9.50 (2.08) 9.31 (2.48)
Reward Sensitivity 14.16 (2.31) 14.33 (2.09) 13.40 (3.23) BAS Total 33.14 (6.22) 33.72 (4.30) 31.71 (6.23) BIS Total 24.53 (3.62) 23.93 (3.62) 23.48 (3.19)
BIS-11 Attention 19.03 (3.54) 20.00 (4.04) 18.80 (3.64)
Motor 19.42 (3.64) 19.10 (3.09) 19.07 (4.76) Nonplanning 24.35 (5.26) 26.79 (5.11) 25.17 (6.16)
Total 62.41 (8.25) 65.42 (8.45) 63.03 (12.05) DERS
Nonacceptance 18.65 (6.24) 16.87 (8.00) 17.47 (6.23) Goals 19.19 (4.39) 18.00 (4.07) 18.37 (4.12)
Impulse 14.48 (5.28) 15.10 (4.84) 13.31 (5.31) Awareness 15.57 (5.50) 17.17 (4.84) 16.60 (6.01) Strategies 26.04 (6.57) 25.52 (6.80) 25.47 (7.07)
Clarity 12.55 (4.21) 14.34 (4.58) 14.87 (5.54) Total 105.96 (19.79) 108.67 (25.21) 105.45 (23.82)
MPS Self 79.10 (16.83) 74.69 (17.82) 68.13 (19.43)
Other 57.22 (18.89) 54.76 (15.77) 52.46 (12.38) Social 62.97 (17.69) 62.75 (16.93) 62.03 (16.54)
MCQ - k -2.12 (0.54) -2.16 (0.80) -2.13 (0.56) RRS - Total 59.13 (9.63) 64.96 (12.53) 56.96 (11.35) UPPS-P
Negative Urgency 31.35 (5.89) 29.75 (5.32) 32.07 (6.16) Premeditation 20.50 (4.49) 21.50 (4.57) 20.70 (4.36) Perseverance 21.58 (2.93) 22.44 (3.67) 23.30 (3.93)
Sensation Seeking 33.17 (8.45) 32.17 (6.00) 32.27 (8.41) Positive Urgency 41.76 (11.20) 39.14 (11.68) 45.90 (8.49)
NEO Neuroticism 147.14 (7.85) 142.30 (29.25) 146.10 (8.69)
Extraversion 147.32 (12.45) 148.40 (9.68) 145.41 (10.48) Openness 154.45 (9.07) 152.89 (9.29) 151.27 (11.36)
Agreeableness 144.97 (12.55) 142.85 (6.76) 142.20 (10.68) Conscientiousness 154.62 (10.96) 155.48 (10.80) 152.34 (8.28)
BIS/BAS = Behavioural activation/inhibition system scale; BIS-11 = Barratt Impulsivity Scale,
version 11, DERS = Difficulties in Emotion Regulation Scale; MPS: Multidimensional
Perfectionsim Scale; MCQ = Monetary Choice Questionnaire; RRS = Rumination Responses
Scale; NEO = Revised NEO Five-Factor Inventory; UPPS-P = UPPS-P Impulsive Behaviour
Scale
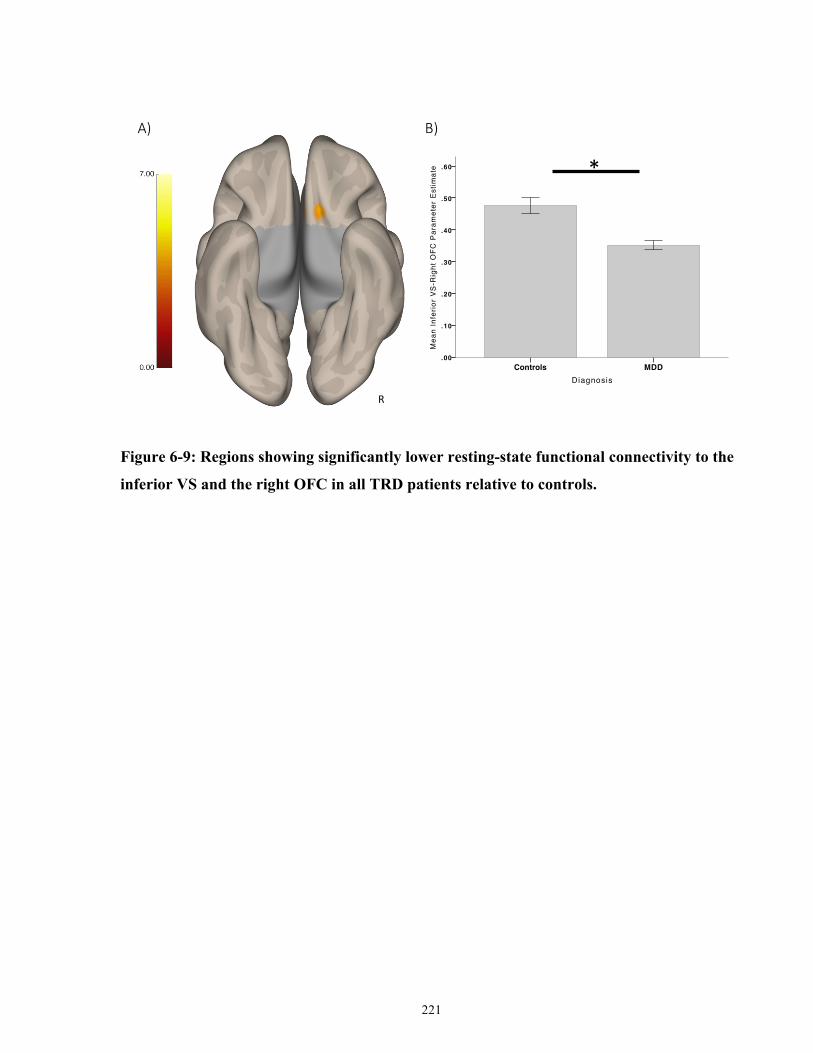
221
Figure 6-9: Regions showing significantly lower resting-state functional connectivity to the
inferior VS and the right OFC in all TRD patients relative to controls.
DiagnosisMDDControls
Mea
n In
ferio
r VS
-Rig
ht O
FC P
aram
eter
Est
imat
e .60
.50
.40
.30
.20
.10
.00
Page 1
R
A) B)
*
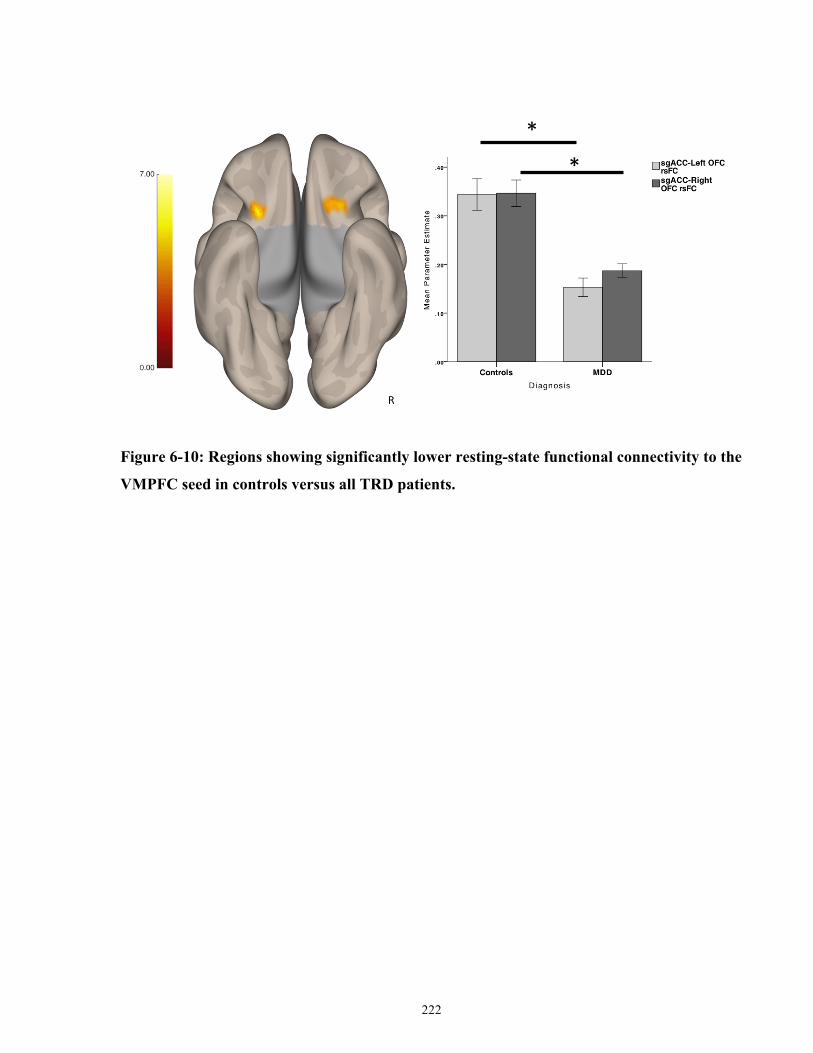
222
Figure 6-10: Regions showing significantly lower resting-state functional connectivity to the
VMPFC seed in controls versus all TRD patients.
*
*
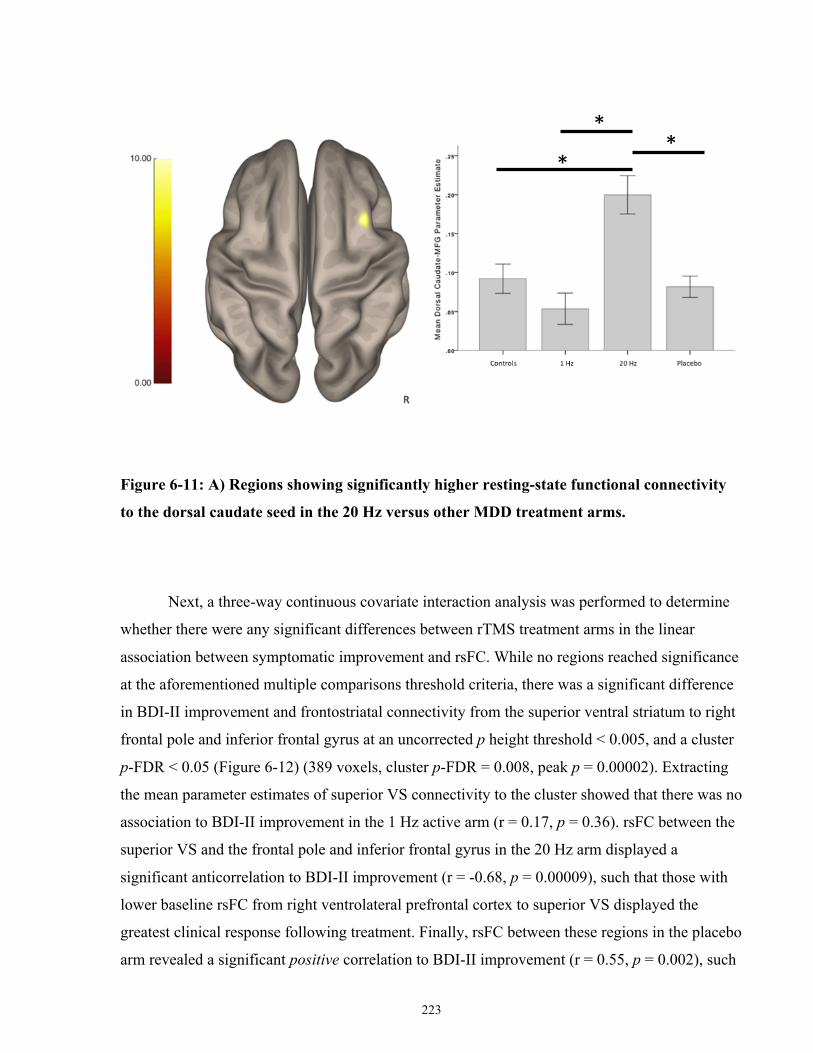
223
Figure 6-11: A) Regions showing significantly higher resting-state functional connectivity
to the dorsal caudate seed in the 20 Hz versus other MDD treatment arms.
Next, a three-way continuous covariate interaction analysis was performed to determine
whether there were any significant differences between rTMS treatment arms in the linear
association between symptomatic improvement and rsFC. While no regions reached significance
at the aforementioned multiple comparisons threshold criteria, there was a significant difference
in BDI-II improvement and frontostriatal connectivity from the superior ventral striatum to right
frontal pole and inferior frontal gyrus at an uncorrected p height threshold < 0.005, and a cluster
p-FDR < 0.05 (Figure 6-12) (389 voxels, cluster p-FDR = 0.008, peak p = 0.00002). Extracting
the mean parameter estimates of superior VS connectivity to the cluster showed that there was no
association to BDI-II improvement in the 1 Hz active arm (r = 0.17, p = 0.36). rsFC between the
superior VS and the frontal pole and inferior frontal gyrus in the 20 Hz arm displayed a
significant anticorrelation to BDI-II improvement (r = -0.68, p = 0.00009), such that those with
lower baseline rsFC from right ventrolateral prefrontal cortex to superior VS displayed the
greatest clinical response following treatment. Finally, rsFC between these regions in the placebo
arm revealed a significant positive correlation to BDI-II improvement (r = 0.55, p = 0.002), such
*
* *
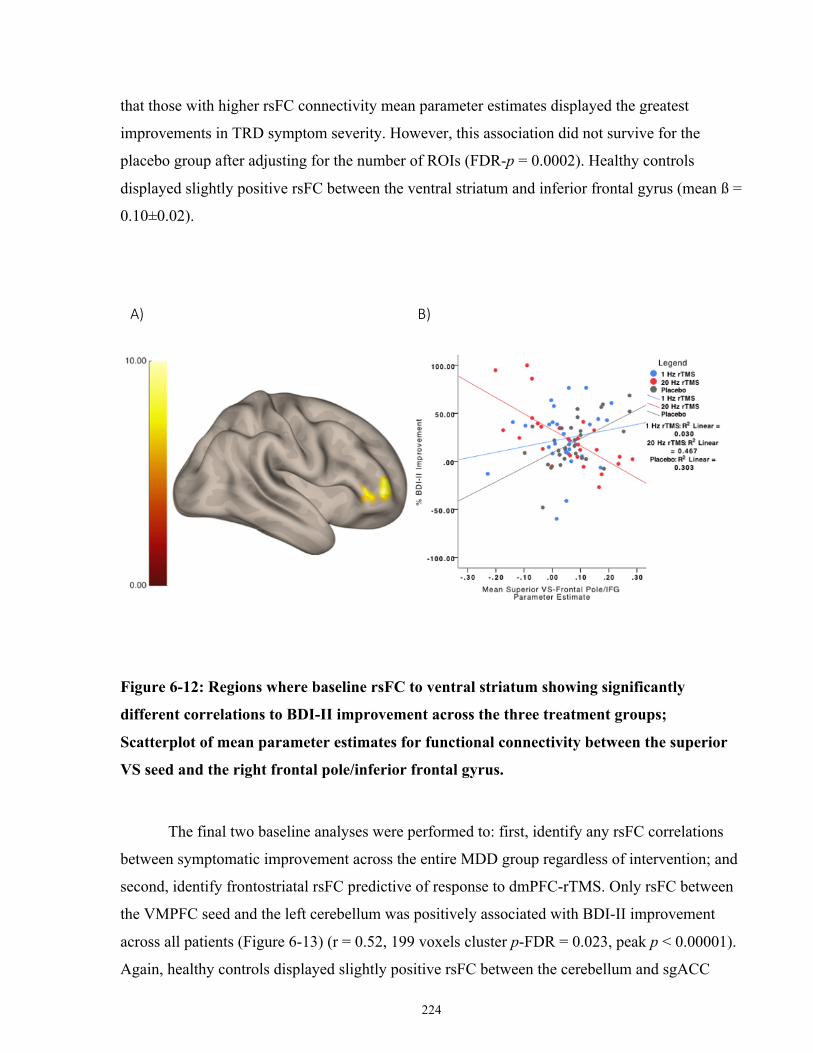
224
that those with higher rsFC connectivity mean parameter estimates displayed the greatest
improvements in TRD symptom severity. However, this association did not survive for the
placebo group after adjusting for the number of ROIs (FDR-p = 0.0002). Healthy controls
displayed slightly positive rsFC between the ventral striatum and inferior frontal gyrus (mean ß =
0.10±0.02).
Figure 6-12: Regions where baseline rsFC to ventral striatum showing significantly
different correlations to BDI-II improvement across the three treatment groups;
Scatterplot of mean parameter estimates for functional connectivity between the superior
VS seed and the right frontal pole/inferior frontal gyrus.
The final two baseline analyses were performed to: first, identify any rsFC correlations
between symptomatic improvement across the entire MDD group regardless of intervention; and
second, identify frontostriatal rsFC predictive of response to dmPFC-rTMS. Only rsFC between
the VMPFC seed and the left cerebellum was positively associated with BDI-II improvement
across all patients (Figure 6-13) (r = 0.52, 199 voxels cluster p-FDR = 0.023, peak p < 0.00001).
Again, healthy controls displayed slightly positive rsFC between the cerebellum and sgACC
A) B)
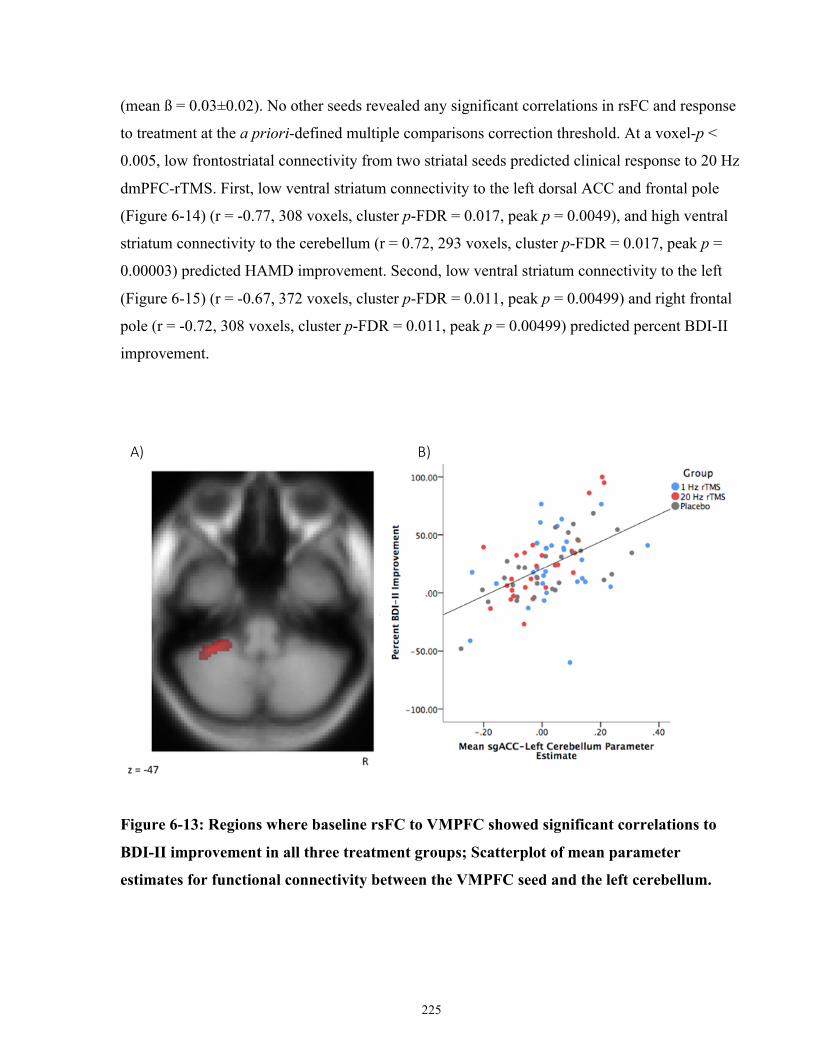
225
(mean ß = 0.03±0.02). No other seeds revealed any significant correlations in rsFC and response
to treatment at the a priori-defined multiple comparisons correction threshold. At a voxel-p <
0.005, low frontostriatal connectivity from two striatal seeds predicted clinical response to 20 Hz
dmPFC-rTMS. First, low ventral striatum connectivity to the left dorsal ACC and frontal pole
(Figure 6-14) (r = -0.77, 308 voxels, cluster p-FDR = 0.017, peak p = 0.0049), and high ventral
striatum connectivity to the cerebellum (r = 0.72, 293 voxels, cluster p-FDR = 0.017, peak p =
0.00003) predicted HAMD improvement. Second, low ventral striatum connectivity to the left
(Figure 6-15) (r = -0.67, 372 voxels, cluster p-FDR = 0.011, peak p = 0.00499) and right frontal
pole (r = -0.72, 308 voxels, cluster p-FDR = 0.011, peak p = 0.00499) predicted percent BDI-II
improvement.
Figure 6-13: Regions where baseline rsFC to VMPFC showed significant correlations to
BDI-II improvement in all three treatment groups; Scatterplot of mean parameter
estimates for functional connectivity between the VMPFC seed and the left cerebellum.
A) B)
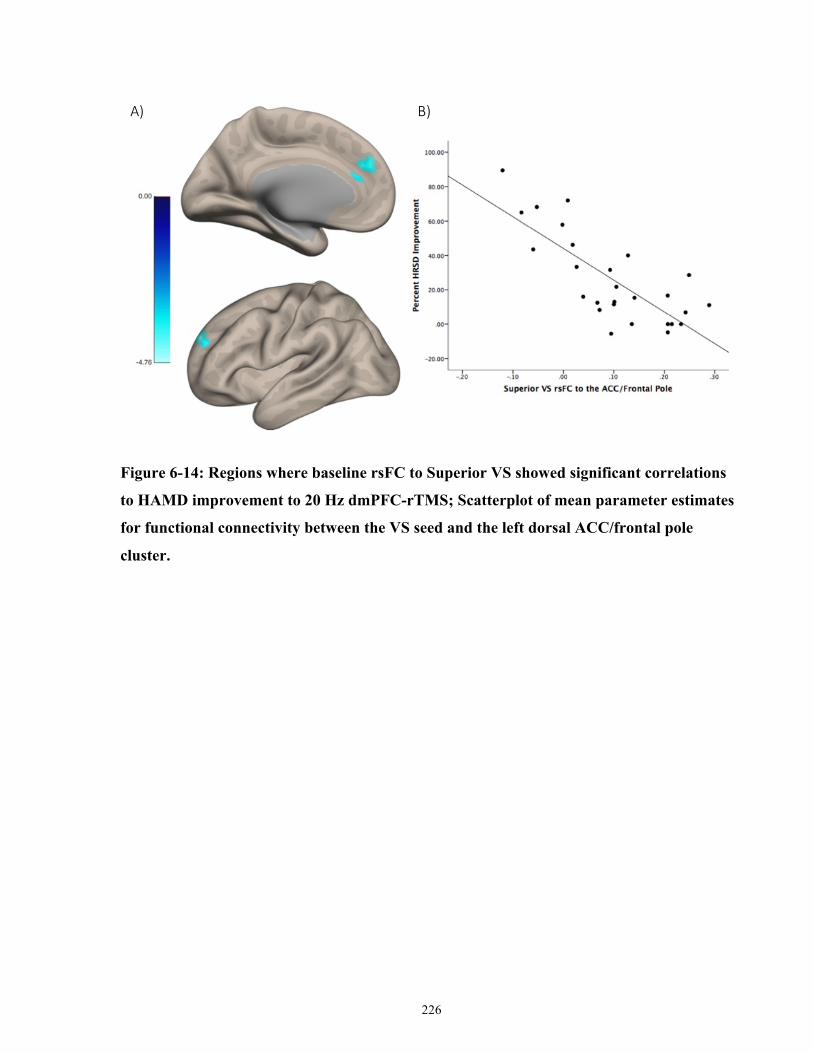
226
Figure 6-14: Regions where baseline rsFC to Superior VS showed significant correlations
to HAMD improvement to 20 Hz dmPFC-rTMS; Scatterplot of mean parameter estimates
for functional connectivity between the VS seed and the left dorsal ACC/frontal pole
cluster.
A) B)
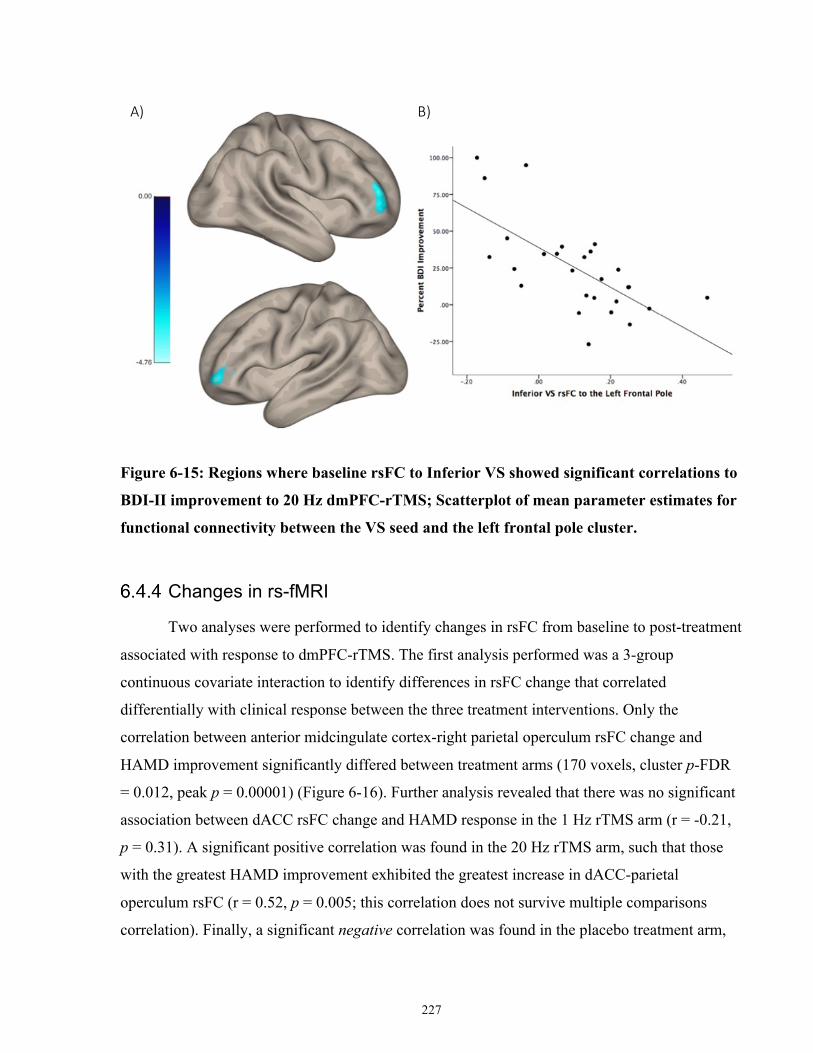
227
Figure 6-15: Regions where baseline rsFC to Inferior VS showed significant correlations to
BDI-II improvement to 20 Hz dmPFC-rTMS; Scatterplot of mean parameter estimates for
functional connectivity between the VS seed and the left frontal pole cluster.
Changes in rs-fMRI
Two analyses were performed to identify changes in rsFC from baseline to post-treatment
associated with response to dmPFC-rTMS. The first analysis performed was a 3-group
continuous covariate interaction to identify differences in rsFC change that correlated
differentially with clinical response between the three treatment interventions. Only the
correlation between anterior midcingulate cortex-right parietal operculum rsFC change and
HAMD improvement significantly differed between treatment arms (170 voxels, cluster p-FDR
= 0.012, peak p = 0.00001) (Figure 6-16). Further analysis revealed that there was no significant
association between dACC rsFC change and HAMD response in the 1 Hz rTMS arm (r = -0.21,
p = 0.31). A significant positive correlation was found in the 20 Hz rTMS arm, such that those
with the greatest HAMD improvement exhibited the greatest increase in dACC-parietal
operculum rsFC (r = 0.52, p = 0.005; this correlation does not survive multiple comparisons
correlation). Finally, a significant negative correlation was found in the placebo treatment arm,
A) B)
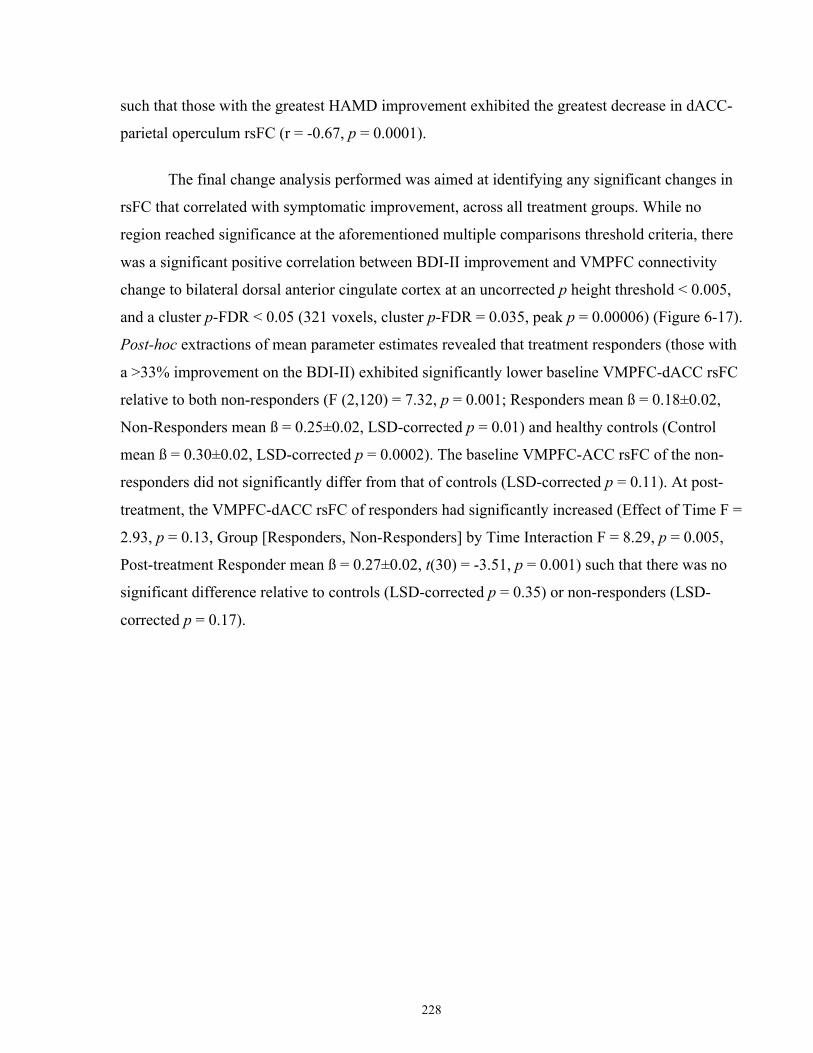
228
such that those with the greatest HAMD improvement exhibited the greatest decrease in dACC-
parietal operculum rsFC (r = -0.67, p = 0.0001).
The final change analysis performed was aimed at identifying any significant changes in
rsFC that correlated with symptomatic improvement, across all treatment groups. While no
region reached significance at the aforementioned multiple comparisons threshold criteria, there
was a significant positive correlation between BDI-II improvement and VMPFC connectivity
change to bilateral dorsal anterior cingulate cortex at an uncorrected p height threshold < 0.005,
and a cluster p-FDR < 0.05 (321 voxels, cluster p-FDR = 0.035, peak p = 0.00006) (Figure 6-17).
Post-hoc extractions of mean parameter estimates revealed that treatment responders (those with
a >33% improvement on the BDI-II) exhibited significantly lower baseline VMPFC-dACC rsFC
relative to both non-responders (F (2,120) = 7.32, p = 0.001; Responders mean ß = 0.18±0.02,
Non-Responders mean ß = 0.25±0.02, LSD-corrected p = 0.01) and healthy controls (Control
mean ß = 0.30±0.02, LSD-corrected p = 0.0002). The baseline VMPFC-ACC rsFC of the non-
responders did not significantly differ from that of controls (LSD-corrected p = 0.11). At post-
treatment, the VMPFC-dACC rsFC of responders had significantly increased (Effect of Time F =
2.93, p = 0.13, Group [Responders, Non-Responders] by Time Interaction F = 8.29, p = 0.005,
Post-treatment Responder mean ß = 0.27±0.02, t(30) = -3.51, p = 0.001) such that there was no
significant difference relative to controls (LSD-corrected p = 0.35) or non-responders (LSD-
corrected p = 0.17).
229
Figure 6-16: Regions of dACC rsFC change showing significantly different correlations to
HAMD improvement across the three treatment groups; Scatterplot of mean parameter
estimates for functional connectivity change between the dACC seed and the right parietal
operculum.
A) B)
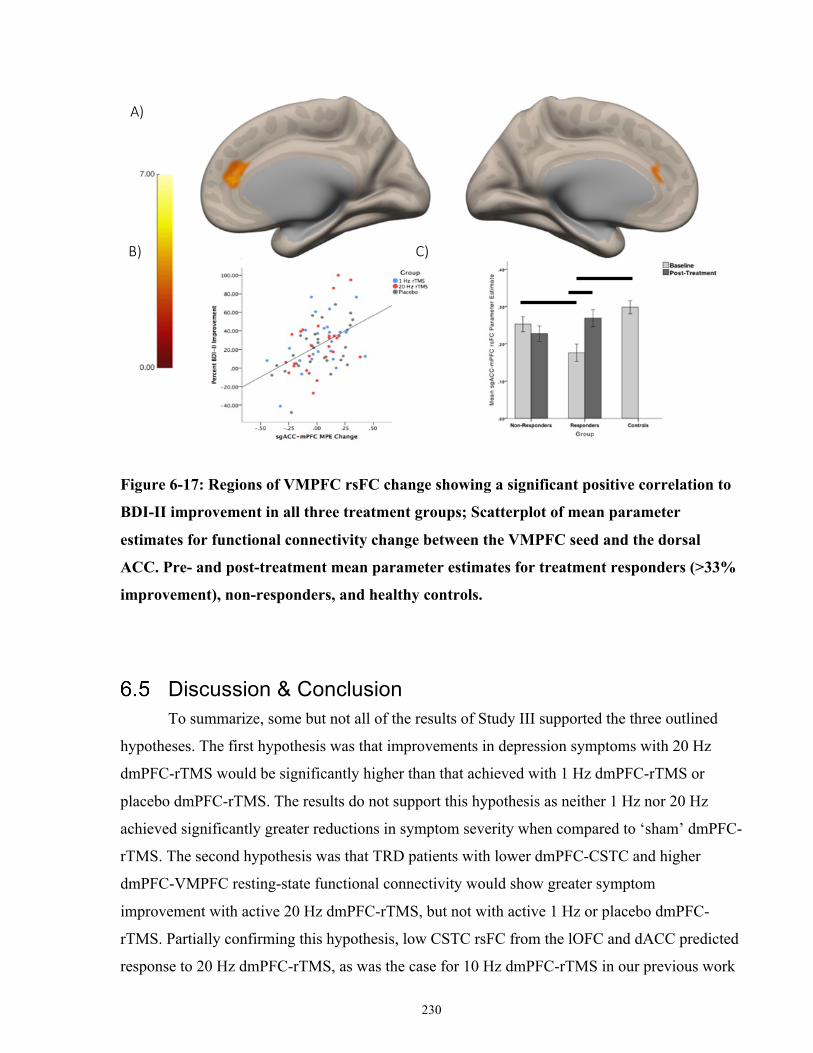
230
Figure 6-17: Regions of VMPFC rsFC change showing a significant positive correlation to
BDI-II improvement in all three treatment groups; Scatterplot of mean parameter
estimates for functional connectivity change between the VMPFC seed and the dorsal
ACC. Pre- and post-treatment mean parameter estimates for treatment responders (>33%
improvement), non-responders, and healthy controls.
Discussion & Conclusion To summarize, some but not all of the results of Study III supported the three outlined
hypotheses. The first hypothesis was that improvements in depression symptoms with 20 Hz
dmPFC-rTMS would be significantly higher than that achieved with 1 Hz dmPFC-rTMS or
placebo dmPFC-rTMS. The results do not support this hypothesis as neither 1 Hz nor 20 Hz
achieved significantly greater reductions in symptom severity when compared to ‘sham’ dmPFC-
rTMS. The second hypothesis was that TRD patients with lower dmPFC-CSTC and higher
dmPFC-VMPFC resting-state functional connectivity would show greater symptom
improvement with active 20 Hz dmPFC-rTMS, but not with active 1 Hz or placebo dmPFC-
rTMS. Partially confirming this hypothesis, low CSTC rsFC from the lOFC and dACC predicted
response to 20 Hz dmPFC-rTMS, as was the case for 10 Hz dmPFC-rTMS in our previous work
A)
B) C)
*
* *
231
(Salomons et al, 2014). The final hypothesis was that TRD patients showing greater increases in
pre- to post-treatment dmPFC-CSTC resting-state functional connectivity would show greater
improvement in clinical symptoms, after active 20 Hz dmPFC-rTMS but not after active 1 Hz or
placebo dmPFC-rTMS. This hypothesis was not supported by the results, and an increase in
corticocortical connectivity between the dmPFC and VMPFC across all three interventions was
significantly correlated with treatment arm-nonspecific clinical response. Improvements in
emotion regulation, particularly in goal setting and impulsivity, were also significantly correlated
with symptom improvement across all patients.
To date, this study is the second randomized controlled trial of mPFC rTMS for TRD
(Kreuzer et al, 2015). The first mPFC-rTMS trial, the ‘AC/DC’ study, recruited 40 subjects who
completed 15 once daily sessions (3 weeks) of either standard DLPFC-rTMS, active mPFC-
rTMS, or sham rTMS. While Kreuzer et al. (2015) reported a significant treatment group-by-
time interaction on the primary clinical measure of their study, post hoc comparisons of 21-item
HAMD improvement revealed that both active mPFC-rTMS and DLPFC-rTMS were not
superior to sham rTMS. Despite the findings from randomized controlled trials, open-label
studies have found that roughly half of patients respond and one third of patients remit following
dmPFC-rTMS; these rates are comparable to recent randomized controlled trials of DLPFC-
rTMS (Bakker et al, 2015; Downar et al, 2014; Salomons et al, 2014).
As with the ‘AC/DC’ randomized controlled trial, the clinical results of Study III support
the idea that active dmPFC-rTMS is not superior over ‘sham’ stimulation. However, there are
two methodological differences between the current study and previous trials of open-label and
double-blind sham-controlled dmPFC-rTMS that could warrant further study of dmPFC-rTMS
for TRD. First, unlike the ‘AC/DC’ trial and our previous open-label studies, the current study
employed 30 twice-daily 20 Hz rTMS sessions instead of 20-30 once daily 10 Hz sessions. If the
twice-daily stimulation did not achieve a twofold acceleration of effect in most patients, then the
overall course length may be inadequate at 15 days. Regarding this point, however, one recent
study from our group of once-daily 10 Hz versus twice-daily 20 Hz open-label dmPFC-rTMS
showed similar rates of improvement session-by-session, and no significant difference in
response or remission rates (Schulze et al, 2018). In light of that finding, it could be the case that
the rate of response to active rTMS in the current sample was otherwise influenced by genetic or
molecular factors related to neuronal plasticity, such as BDNF, thereby limiting the clinical
232
efficacy of active accelerated 20 Hz rTMS in some patients in the randomized controlled trial
(Hwang et al, 2015).
A second potential confound is whether the ‘sham’ stimulation electrodes, placed at
regions between the DLPFC and frontal pole, might have inadvertently delivered therapeutic
doses of transcranial electrical stimulation, or trigeminal nerve stimulation. Trigeminal nerve
stimulation is an emerging novel non-invasive brain stimulation treatment for major depression
that uses electrodes placed over the V1 subregion of the trigeminal nerve (forehead); backwards
propagation of trigeminal stimulation to the cortex is thought to elicit improvements in MDD
symptom severity. Three open-label trials (Cook et al, 2013; Schrader et al, 2011; Shiozawa et
al, 2014) have reported significant clinical benefit of trigeminal nerve stimulation. One
randomized controlled trial has also shown that trigeminal nerve stimulation is superior to
placebo stimulation; in this trial patients received 10 sessions of stimulation over 2 weeks, with
electrodes placed above the supraorbital foramen (Shiozawa et al, 2015). Although the
stimulation protocol is different from that of our placebo stimulation, it could be the case that by
mimicking the sensory and nociceptive effects of active rTMS, we have inadvertently induced a
clinical effect in the placebo arm via V1 trigeminal nerve stimulation from the electrodes.
Along similar lines, one other study has reported that ‘sham’ rTMS with simultaneous
electrical stimulation achieved similar effects to active rTMS, with therapeutic efficacy
dependent on the site of stimulation and not on whether stimulation was active or ‘sham’ (Triggs
et al, 2010). Patients who received right DLPFC rTMS (active or sham) experienced greater
clinical response than those who received rTMS over the left DLPFC (Triggs et al, 2010). In
light of this finding, it could be the case that different patterns of electrical stimulation (1 Hz and
20 Hz) of ‘sham’ dmPFC-rTMS also have differing clinical efficacy. Future work should test the
possibility that certain ‘sham’ electrical scalp stimulation protocols delivers therapeutic doses of
stimulation over the 30-session, 15-day course. Further research is also warranted to clarify the
clinical benefit of trigeminal nerve stimulation, or stimulation of the DLPFC/frontopolar region.
Future work is also necessary to quantify the clinical effects of 20 Hz dmPFC-rTMS using
another placebo method (for example, vertex stimulation with a shielded coil).
Consistent with previous research, TRD patients displayed significantly lower baseline
frontostriatal rsFC to the OFC, and lower cortico-cortical rsFC between the VMPFC and the
233
OFC, compared to healthy controls. In healthy controls, the ventral striatum, VMPFC, and OFC
all play an active role the ventromedial affective network function, including during dopamine-
dependent reward processing, and affective processing (Tremblay et al, 2005; Zhang et al,
2013). In MDD, lower VMN activity has also been observed during reward-related task
performance; for example, lower VMN activation has been related to anhedonic symptoms
during the unexpected receipt of rewards (Segarra et al, 2016).
Low baseline frontostriatal connectivity between the ventral striatum bilateral inferior
frontal gyrus, frontal pole and dACC predicted TRD response to active 20 Hz dmPFC-rTMS but
not to active 1 Hz dmPFC-rTMS or sham dmPFC-rTMS. Consistent with previous findings from
our group, frontostriatal connectivity between the ventral striatum and dACC predicted response
to 20 Hz dmPFC-rTMS (Dunlop et al, 2015, 2016a). Furthermore, previous studies from our
group have also reported the role of other frontostriatal circuits in predicting dmPFC-rTMS
response. For example, our group recently reported that baseline ventromedial and ventrolateral
PFC frontostriatal rsFC predicted response to dmPFC-rTMS in TRD, ED and OCD (Dunlop et
al, 2015, 2016a; Salomons et al, 2014).
Baseline frontostriatal rsFC has also shown promise in predicting response to DLPFC-
rTMS and conventional interventions in MDD. For 10 Hz DLPFC-rTMS, greater improvement
in TRD symptom severity is associated with higher baseline frontostriatal connectivity in dorsal
PFC regions (Avissar et al, 2017). For conventional pharmacotherapies and psychotherapies,
VLPFC CSTC connectivity differentially predicts response to CBT or antidepressant medication
(Dunlop et al, 2017a). Taken together, baseline frontostriatal connectivity shows promise as a
biological marker of clinical response to active 20 Hz dmPFC-rTMS, and further research is
therefore warranted to characterize the individual-level prediction accuracy of such biomarkers
in a large sample size.
Contrary to previous studies of dmPFC-rTMS response, pre- to post-treatment CSTC rFC
change did not significantly correlate with response. Previous studies reporting the mechanisms
of DPFC- and dmPFC-rTMS response support the idea that 20 Hz rTMS normalizes functional
connectivity between fronto-limbic regions and striatal, pallidal and thalamic components of a
CSTC loop (Anderson et al, 2016; Noda et al, 2015). The results of study III do not support the
234
idea that the therapeutic mechanism of dmPFC-rTMS response is related to CSTC rsFC change,
contrary to previous studies of dmPFC-rTMS response in TRD, ED, and OCD.
Instead, clinical response irrespective of rTMS treatment arm was correlated with
improvement in emotion regulation, particularly related to goal-directed behaviour and impulse
control on the DERS. Nonspecific improvements in TRD symptom severity was also associated
with increases in dACC-VMPFC rsFC from pre- to post-treatment. Previous research in healthy
controls indicates that the role of the VMPFC and its structural and functional connections to the
dmPFC and dorsal ACC in emotion regulation, the regulation of negative affect, and social
cognition processes like emotion recognition and theory-of-mind (Kühn et al, 2011). Low
VMPFC rsFC connectivity appears to be a hallmark of MDD (Murrough et al, 2016).
Although MDD-related abnormalities in VMPFC-dACC connectivity are consistent with
previous studies, increases in dmPFC-VMPFC connectivity are not consistent with previous
literature investigating changes in rsFC related to response in MDD and TRD. Instead,
significant reductions in sgACC resting-state connectivity to the ventral affective network has
been associated with response to either active or placebo DLPFC-rTMS (Taylor et al, 2018). The
authors attribute non-specific changes in sgACC activity as ‘common pathway of improvement
in MDD,’ as decreases in sgACC activity and rsFC accompanies response to conventional
interventions and to sgACC-DBS (Delaveau et al, 2011). Instead, the results of Study III indicate
that treatment nonspecific symptom improvement was associated with significant increases of
the VMPFC to the dorsal ACC, a node of the SN. It could be the case that increases in ventral
affective and dorsal salience network connectivity reflect improved top-down control of VMN-
related emotion processing and cognition.
To conclude, we found no clinical superiority in the active versus sham treatment in a three-arm
randomized controlled trial of 1 Hz, 20 Hz and placebo dmPFC-rTMS, although the possibility
that the ‘sham’ electrodes in fact delivered therapeutic doses of stimulation bears future
investigation. While there were no significant baseline clinical predictors of improvement,
response across all treatment arms was associated with improvements in emotion regulation, and
in particular the goal-setting and impulsivity subscales of the DERS. On rs-fMRI, baseline
frontostriatal connectivity differentially predicted treatment response to sham and 20 Hz rTMS.
Replicating our previous findings (Dunlop et al, 2015; Salomons et al, 2014), low baseline

235
frontostriatal rsFC predicted treatment response to 20 Hz rTMS. Increases in cortico-cortical
connectivity between the dmPFC and the VMPFC was correlated with intervention non-specific
improvements. A logical next step would be to implement another form of sham rTMS in a
randomized controlled trial to avoid trigeminal/transcranial electrical stimulation in the placebo
arm, and to further characterize the effects of dmPFC-rTMS using TMS-EEG or interleaved
TMS-fMRI. Properly optimized and tested under an adequate placebo condition, dmPFC-rTMS
may yet provide a new treatment option in the challenging setting of TRD.
236
General Discussion
Summary of Results and Comparison to Hypotheses The goal of this thesis was to identify transdiagnostic neural predictors and mechanisms
of treatment response to rTMS over the dmPFC. To this end, this thesis has presented three rs-
fMRI studies to identify predictors and mechanisms of response to dmPFC-rTMS in TRD, OCD,
and eating disorders (AN-BP and BN). All studies acquired resting-state fMRI scans at pre- and
post-treatment in order to identify baseline differences in dmPFC rsFC between rTMS
responders versus non-responders, and pre- to post-treatment changes in dmPFC rsFC that were
associated with symptom improvement.
The first general aim of this thesis was to assess the clinical efficacy of dmPFC-rTMS as a
treatment for TRD, and to conduct preliminary assessments of therapeutic effects of
dmPFC-rTMS in OCD and eating disorders.
The first hypothesis of Study I was that binge eating and purging frequency would
significantly improve in AN-BP/BN patients who received 20-30 sessions of open-label 10 Hz
dmPFC-rTMS. In line with this hypothesis, 16 of 28 subjects with AN-BP or BN experienced a
50% or greater reduction in weekly binges and purges, four weeks following 20-30 sessions of
10 Hz dmPFC-rTMS. These patients also had significant improvements in depressive and
anxiety symptoms, as measured by the HAMD, BDI-II and BAI. Symptomatic improvements in
mood and anxiety were not significantly associated with improvements in disordered eating and
purging, meaning that open-label dmPFC-rTMS modulated disordered eating behaviours
independent of its effect on depression severity.
The first hypothesis of Study II was that the severity of obsessive thoughts and
compulsive behaviours in OCD patients would significantly improve following 20-30 sessions of
open-label 10 Hz dmPFC-rTMS. In line with this hypothesis, 10 of 20 subjects with treatment-
refractory OCD experienced a 50% or greater reduction in obsessive thoughts and compulsive
behaviours, as measured by the Y-BOCS, following 20-30 sessions of open-label 10 Hz dmPFC-
rTMS. As in our ED case series, all OCD patients also had significant improvements in
depressive and anxiety symptom severity, but these improvements did not significantly differ
between rTMS responders and non-responders as defined by OCD symptom improvement.
237
The first hypothesis of Study III was that improvements in depression symptoms with 20
Hz dmPFC-rTMS would be significantly greater than that achieved with 1 Hz dmPFC-rTMS or
placebo dmPFC-rTMS. The clinical outcomes in this study showed a significant effect of time
for all primary clinical measures (HAMD, BDI-II and BAI), such that patients on average
experienced a significant improvement in symptom severity across all rTMS interventions.
However, there was no significant group by time interaction on any primary clinical measure,
meaning that the degree of symptom improvement from baseline to the first follow-up visit did
not significantly differ between treatment interventions. Thus, this study was not able to
demonstrate clinical efficacy for either 20 Hz or 1 Hz active dmPFC-rTMS over the sham
intervention employed. Baseline demographic factors, and primary clinical factors did not
significantly predict who would respond to dmPFC-rTMS. Furthermore, none of the secondary
clinical measures assessing emotion regulation, perfectionism, impulsivity, reward/punishment
processing, rumination, or the five personality factors predicted response to 20 Hz, 1 Hz or
placebo dmPFC-rTMS in Study III.
The second general aim of this thesis was to identify significant differences in pre-
treatment resting-state functional connectivity differences between dmPFC-rTMS
responders and non-responders for TRD, OCD, and eating disorders.
The second hypothesis of Study I was that lower baseline dmPFC-CSTC and higher
baseline dmPFC-sgACC resting-state functional connectivity would be associated with better
response to dmPFC-rTMS. In line with this hypothesis, AN-BP and BN dmPFC-rTMS
responders had significantly lower dACC rsFC to the right putamen, as well as the hippocampus
and posterior insula (Figure 7-1 A. and B.). However, contrary to this hypothesis, AN-BP and
BN dmPFC-rTMS responders also had significantly higher dmPFC rsFC to the and bilateral
lateral OFC, bilateral temporal pole and right posterior insula.
The second hypothesis of Study II was that, as with DBS, OCD patients with higher
dmPFC-CSTC resting-state functional connectivity would show better response to open-label 10
Hz dmPFC-rTMS. In line with this hypothesis, dmPFC-rTMS responders had displayed
significantly higher frontostriatal connectivity between the ventral rostral putamen ROI and
238
dACC relative to dmPFC-rTMS non-responders and healthy controls in an exploratory analysis
(Figure 7-1 C.). Furthermore, OCD dmPFC-rTMS responders also exhibited significantly higher
baseline rsFC between the dmPFC ROI and the ventral striatum in an a priori analysis. In
further exploratory analyses, OCD rTMS responders also displayed increased rsFC between the
medial dorsal thalamus ROI and lateral OFC (Figure 7-1 D.), and between the STN ROI,
thalamus and striatum relative to non-responders.
The second hypothesis of Study III was that TRD patients with lower dmPFC-CSTC and
higher dmPFC-VMPFC resting-state functional connectivity would show greater symptom
improvement with active 20 Hz dmPFC-rTMS, but not with active 1 Hz or placebo dmPFC-
rTMS. In line with this hypothesis, the results of a 3-way continuous covariate interaction
analysis showed that response specifically to the 20 Hz active dmPFC-rTMS intervention was
anti-correlated with baseline frontostriatal rsFC. Lower baseline frontostriatal connectivity
between the inferior VS ROI and right IFG and OFC was correlated with a greater response to
active 20 Hz dmPFC-rTMS (Figure 7-1 F.). Similarly, an analysis of baseline rs-fMRI predictors
focusing specifically on the 20 Hz active dmPFC-rTMS study arm found that clinical
improvement was correlated with lower baseline frontostriatal rsFC between the inferior VS and
the bilateral IFG and OFC, and between the superior VS and the dACC and dmPFC (Figure 7-1
E.).
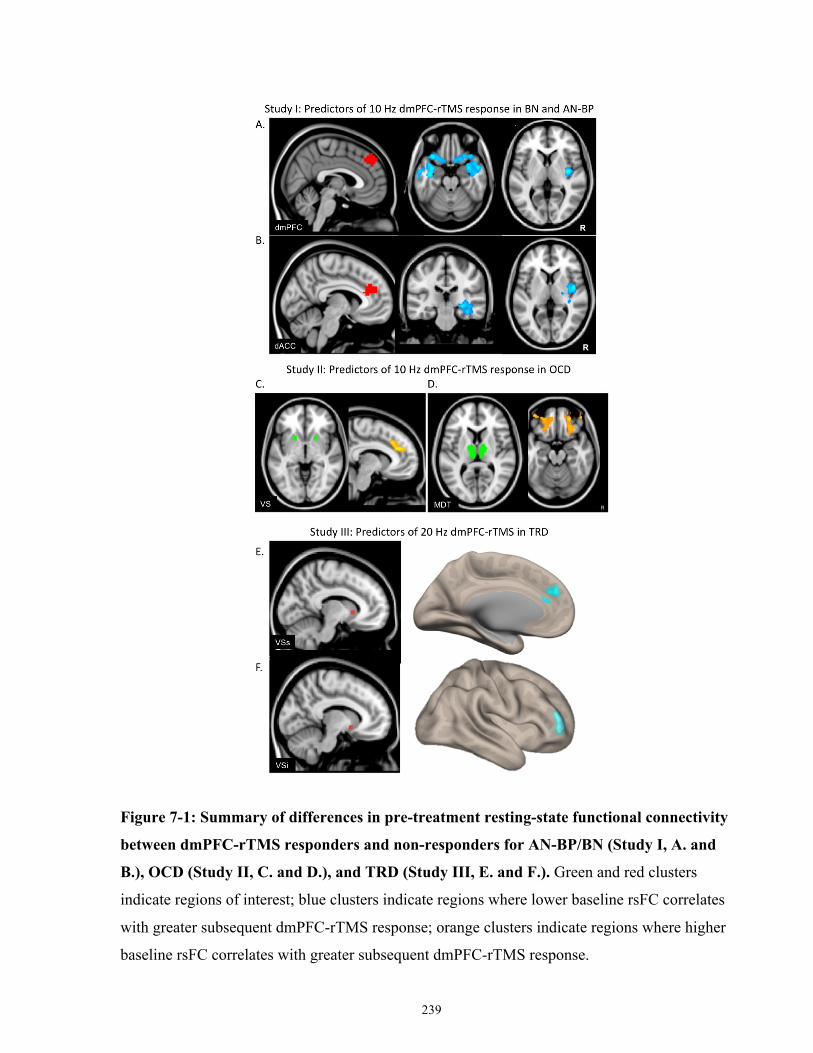
239
Figure 7-1: Summary of differences in pre-treatment resting-state functional connectivity
between dmPFC-rTMS responders and non-responders for AN-BP/BN (Study I, A. and
B.), OCD (Study II, C. and D.), and TRD (Study III, E. and F.). Green and red clusters
indicate regions of interest; blue clusters indicate regions where lower baseline rsFC correlates
with greater subsequent dmPFC-rTMS response; orange clusters indicate regions where higher
baseline rsFC correlates with greater subsequent dmPFC-rTMS response.
240
The third aim of this thesis was to identify pre- to post-treatment changes in resting-state
functional connectivity that accompany dmPFC-rTMS response for TRD, OCD, and eating
disorders.
The third hypothesis of Study I was that increases in pre- to post-treatment CSTC-
dmPFC resting-state functional connectivity after dmPFC-rTMS would correlate with
improvements in binge-eating and purge frequency. Consistent with this hypothesis, increased
dmPFC resting-state functional connectivity to the bilateral dorsal striatum was correlated with
improvements in weekly binge and purge frequency at 4-weeks follow-up (Figure 7-2 A.).
Furthermore, response to dmPFC-rTMS in AN-BP and BN was correlated with increases in rsFC
between the dACC and the bilateral AI, IFG and OFC.
The third hypothesis of Study II was that, as with DBS, OCD patients who show
decreases in pre- to post-treatment dmPFC-CSTC resting-state functional connectivity after
dmPFC-rTMS would show more improvement in OCD symptom severity. Consistent with this
hypothesis, decreases in rsFC between the dACC and the bilateral caudate nucleus and
mediodorsal thalamus was correlated with OCD symptom improvement (Figure 7-2 B.). OCD
dmPFC-rTMS responders had abnormally high baseline dmPFC-caudate rsFC relative to a
sample of healthy controls, and this hyperconnectivity significantly decreased with successful
treatment. We also observed that successful OCD rTMS response was associated with increased
dmPFC connectivity to the bilateral pre- and post-central gyrus and left precuneus, and decreased
connectivity to the midbrain, superior frontal gyrus, and right hippocampus.
The third hypothesis of Study III was that TRD patients showing greater increases in pre-
to post-treatment dmPFC-CSTC resting-state functional connectivity would show greater
improvement in clinical symptoms, after active 20 Hz dmPFC-rTMS but not after active 1 Hz or
placebo dmPFC-rTMS. A 3-group continuous covariate interaction analysis was used to identify
significant differences in the correlation between rsFC change and symptom improvement across
the three treatment arms. Contrary to this hypothesis, the between-arms differences in the change
in rs-FC associated with HAMD improvement were found not in the connectivity between
dmPFC and its associated CTSC regions, but rather in the connectivity between dACC and right
241
parietal operculum. For this functional connection, in the 20 Hz study arm, those with the
greatest response exhibited the greatest increase in dACC-parietal operculum rsFC. However,
there was no such association observed in the 1 Hz study arm. Finally, a negative correlation was
found in the sham treatment arm, such that those with the greatest improvement exhibited the
greatest decrease in dACC-parietal operculum rsFC. Thus, although between-arms differences
in the neural correlates of improvement were detected in Study III, they were found in a circuit
different from the expected dmPFC-CTSC circuit.
Regarding common correlates of change across all three study arms, there was a positive
correlation between symptom improvement and change in rsFC between the VMPFC and the
bilateral dACC and rostral ACC. Treatment responders, regardless of rTMS treatment arm,
displayed lower baseline VMPFC-dACC rsFC relative to both non-responders and healthy
controls (Figure 7-2 C.), and the rsFC between these regions increased significantly post-
treatment in a manner correlated with response. Post-treatment, among those who responded,
there was no longer a significant difference relative to controls or non-responders in this
VMPFC-dACC circuit, suggesting normalization of rsFC with treatment response in this circuit,
across all three study arms.
Regarding supplementary clinical measures, improvements on the impulsivity and goal-
setting subscales of the DERS and the total DERS score significantly correlated with symptom
improvement across all three groups of the randomized controlled trial. Across all three
interventions, patients who improved over the course of treatment exhibited greater
improvements in self-reported emotion regulation on the DERS. Examining outcomes within
each treatment arm separately, the only correlation that survived multiple comparisons correction
was present in the 20 Hz dmPFC-rTMS arm: a significant correlation between the global DERS
improvement and both BDI-II and HAMD improvement, such that those who saw the greatest
response had greater improvements in emotion dysregulation.

242
Figure 7-2: Summary of pre- to post-treatment changes in resting-state functional
connectivity that accompany dmPFC-rTMS response in AN-BP/BN (Study I, A.), OCD
(Study II, B), and TRD (Study III, C.). Green and red clusters indicate regions of interest; blue
clusters indicate decreases rsFC accompanying dmPFC-rTMS response; orange clusters indicate
increases in rsFC accompanying dmPFC-rTMS response.
243
Implications for the Treatment of Psychiatric Disorders Patients with treatment-resistant MDD, AN-BP/BN, and/or OCD commonly suffer a
profound impairment in day-to-day function. As noted in the Introduction, MDD is the leading
cause of years lived with a disability (Ferrari et al, 2013), and accounts for roughly US$2 billion
in workplace productivity losses per year (Birnbaum et al, 2010). In Ontario, the MDD-related
burden of illness was greater than the combined burden of breast, colorectal, lung, and prostate
cancer (Ratnasingham et al, 2013). Along similar lines, even OCD symptom scores in the ‘mild’
range on standard scales can result in severe deficits in a patient’s quality of life (Moritz et al,
2005). For patients with AN or BN, comprehensive treatment programs are costly, onerous, and
difficult to access, limiting their impact on the prevalence and overall burden of disease
(Bamford and Sly, 2010). Eating disorders also have a significant mortality rate: the overall
mortality rate for AN is substantially higher than that of schizophrenia and MDD (Arcelus et al,
2011). Effective interventions are therefore required to address the burden and mortality of these
illnesses.
Unfortunately, MDD, OCD and eating disorders are typically chronic disorders, with
many patients showing little or no response to conventional interventions. Only half of patients
in a current major depressive episode will remit in the first 3 months (Patten et al, 2015), and
another third will not remit following four sequential pharmacotherapy interventions (Rush et al,
2006). For OCD, between 30 and 60% of patients will not adequately respond to standard
pharmacotherapies or psychotherapies, and even those who show symptomatic improvement on
such treatments often continue to suffer persistent impairment in daily function (Steketee, 1997).
AN and BN are also chronic disorders; only a third of patients will recover within 4 years of
disease onset (Berkman et al, 2007; Steinhausen, 2002). Approximately 25% of AN patients will
continuously relapse or develop a chronic form of the illness (Berkman et al, 2007; Steinhausen,
2002). As with AN, BN shows relapse rates between 25-63%, depending on the definition of
relapse and follow-up length (Grilo et al, 2012; Halmi et al, 2002; Herzog et al, 1999; Keel et al,
2005; Olmsted et al, 2005). Novel interventions are therefore required for each of these
challenging illnesses.
244
As noted in the Introduction, neuromodulation techniques are emerging as promising new
treatments for cases resistant to medications and psychotherapy. In TRD, the oldest and most
potent of these is ECT. Yet despite its high remission rate, only a small proportion of treatment-
resistant psychiatric patients receive ECT. Less than 1% of TRD patients are treated with ECT
(Delva et al, 2011) due in part to capacity limitations, but equally due to other factors such as the
risk of cognitive impairment, the need for general anesthesia, the stigma associated with the
treatment, and logistical barriers to accessing treatment (Andrade and Thyagarajan, 2007; Delva
et al, 2011). ECT also offers limited benefit for OCD and eating disorders.
DBS is another invasive alternative for patients with severe intractable TRD, OCD or
AN. Studies of long-term treatment outcomes for sgACC-DBS show remission rates of
approximately 40-50% 2 years post-implantation (Holtzheimer et al, 2012; Kennedy et al, 2011).
DBS for OCD has also been clinically promising in preliminary studies: two-thirds of patients
achieved response after 12-months of active DBS compared to sham (Goodman et al, 2010), and
those who achieve initial benefit exhibit the same treatment response over up to 9-years of
follow-up (Fayad et al, 2016). Again, however, DBS is not a widely accessible or well-accepted
intervention: one recent survey of adults with self-reported OCD showed that DBS is the least
accepted and least preferred novel treatment (Patel et al, 2017). In addition, the evidence base to
date is still rather limited. Although some DBS studies are double-blind, most have extremely
small sample sizes. Finally, the resources and expertise needed to perform DBS are generally
confined to academic centres of research excellence, thereby limiting both the generalizability of
clinical results and the ability of patient access to care. Although it can be highly effective in
those individual cases where resources and expertise are available, in terms of population health,
DBS is not well-positioned to achieve large reductions in the overall prevalence or societal
burden of TRD, OCD or eating disorders.
Given the limited accessibility and acceptability of DBS and ECT, alternative
interventions are needed to serve the substantial population of patients who do not respond to
conventional psycho- and pharmacotherapies. rTMS is one such intervention that non-invasively
stimulates the brain, has minimal serious side effects, has high patient acceptability and
tolerability superior to antidepressant medications (Milev et al., 2016). rTMS is more scalable
than DBS, as it is non-invasive and does not require neurosurgical expertise; concurrently-run
treatment rooms can be operated by trained technicians under the supervision of a psychiatrist,
245
increasing capacity. rTMS is also an increasingly accepted tool for treatment-refractory
psychiatric cases given its advantages over ECT: less associated stigma, no need for general
anesthesia, and an absence of cognitive side-effects (Schulze et al, 2016). From an efficacy
standpoint, the main drawback to rTMS compared to ECT is a lower overall rate of remission.
Improving remission rates, by identifying predictors of outcome and mechanisms of treatment
effect, is thus an important goal for current rTMS research.
This thesis reports the first open-label series of dmPFC-rTMS for medically intractable
AN-BP/BN and OCD. dmPFC-rTMS showed promising therapeutic effects in a subset of
patients who report treatment-refractory obsessional thoughts and compulsive behaviours, or
binge and purge behaviours. As DLPFC stimulation has shown lesser efficacy for patients with
OCD or an eating disorder, dmPFC-rTMS appears to be a viable alternative worthy of future
study. Neural predictors and correlates appear to involve CSTC circuitry, and specifically
implicate the SN, which may help to explain the transdiagnostic therapeutic effects of dmPFC-
rTMS given the role of the SN in cognitive control, a domain in which deficits are seen
transdiagnostically in psychiatric disease.
This thesis also reports the second randomized controlled trial of dmPFC-rTMS for TRD,
and the first dmPFC-rTMS trial with a sample size >100 individuals. Although Study III did not
show clinical superiority of either the active 20 Hz or 1 Hz dmPFC-rTMS arm over the sham
intervention employed, some commonalities were observed among the neural correlates of
improvement in the sham and the active arms. As such, it remains to be clarified whether the
electrodes used to generate scalp sensations in the ‘sham’ intervention might actually have
delivered a therapeutic form of stimulation (transcranially or via the trigeminal nerve) over the
30 sessions of treatment. In future, additional double-blind randomized controlled trials with an
alternative form of sham intervention should be used to further assess the efficacy of dmPFC-
rTMS, and to optimize rTMS stimulatory parameters to maximize its therapeutic efficacy in
psychiatric disorders. Properly optimized, dmPFC-rTMS has the potential to become a potent
treatment for patients with debilitating and treatment refractory illnesses like TRD, BN or OCD.
Identifying and optimizing new treatments such as rTMS is crucial, given that treatment-resistant
MDD alone afflicts some 2% of the entire Canadian population. Effective, scalable treatment
options in TRD would also reduce health system and economic costs, such as those associated
with disability, caregiver burden, and direct costs of inpatient and outpatient care.
246
Clinical Implications of Identifying Baseline Predictors of dmPFC-rTMS Response.
To date, Study I and Study II are the first case series to report pre-treatment
neurobiological differences that differentiate dmPFC-rTMS responders from non-responders in
patients with OCD and eating disorders. Study III is third to report baseline biomarkers of
response to dmPFC-rTMS for TRD, and the first to report such biomarkers in a sham-controlled
clinical trial.
As previously discussed, identifying baseline biomarkers has two treatment implications
for patients suffering from mental illness. First, distinguishing treatment responders from non-
responders prior to treatment may avoid having patients undergo logistically onerous but futile
courses of treatment, and thereby accelerate the trial-and-error process of finding an effective
treatment for a given patient. A significant time-commitment is also required of rTMS patients,
especially since rTMS requires patients to receive treatment at a clinic or hospital every weekday
over many weeks; consequently, avoiding futile treatment and improving outcomes among
treated patients by predicting responders and non-responders to a given rTMS protocol is an
important goal.
A second implication of identifying reliable biomarkers of treatment response is that such
biomarkers may help to inform the search for new treatments for those who do not respond. For
example, a neuroimaging biomarker may reveal brain regions whose baseline activity or
connectivity differs between responders and non-responders to a given treatment. Brain regions
that are hyper- or hypo-active, or that have a different pattern of network connectivity in
responders versus non-responders, may present neurostimulatory targets worthy of future clinical
investigation. As an example, a recent ‘biotyping’ study in MDD found that one group of
patients who do not respond well to dmPFC-rTMS show a ‘nexus’ of abnormal connectivity in
the right lateral orbitofrontal cortex (lOFC) – an area amenable to rTMS intervention.
The neuroimaging biomarkers of dmPFC-rTMS reported in Study III likewise revealed
potential neurostimulatory targets worthy of future clinical investigation. In Study III, high
baseline frontostriatal connectivity from the right lOFC and IFG was associated with non-
247
response to active 20 Hz dmPFC-rTMS, but not to active 1 Hz dmPFC-rTMS or sham dmPFC-
rTMS. Consequently, the results of Study III provide an independent line of evidence supporting
the premise that inhibitory right lOFC stimulation could be a potential alternative intervention
for those who do not respond to dmPFC-rTMS.
Consistent with this premise, two preliminary studies from our group have recently
reported that inhibitory right lOFC rTMS may be an effective alternative for those who are non-
responsive to dmPFC-rTMS. First, we reported a case in which a TRD patient who had
previously failed both dmPFC- and DLPFC-rTMS achieved remission with 1 Hz right lOFC-
rTMS (Fettes et al, 2017a). A subsequent case series from our group in N=47 patients found that
patients who were initially non-responsive to dmPFC-rTMS and then went on to receive a course
of 1 Hz right OFC-rTMS achieved response and remission rates of 35.7% and 23.8%,
respectively (Feffer et al, 2018). Thus, preliminary clinical findings support the hypothesis
emerging from the findings of Study III that right OFC-rTMS may be worth pursuing in
dmPFC_rTMS non-responders. This implication from Study III is a direct demonstration of the
high potential translational value offered by baseline biological markers of response for the
identification of novel therapeutic strategies that may be useful in treatment non-responders.
Clinical Implications of Identifying the Neurobiological Mechanism of dmPFC-rTMS Response.
As noted earlier, Study I and II are the first case series to report pre- to post-treatment
changes in rsFC that accompany 10 Hz dmPFC-rTMS response in treatment refractory OCD and
eating disorders. Study III is also the first randomized sham-controlled trial of 20 Hz dmPFC-
rTMS for TRD to characterize pre- to post-treatment rsFC changes correlated with improvements
in depression severity. Understanding the biological mechanism of an intervention has
implications in two clinical areas. First, it is helpful to clarify whether abnormal markers (for
example, IBN structure or function) are state-dependent markers of the current depressed mood
state, or are stable trait-like features that persist during response or remission. In OCD, for
example, dACC frontostriatal hyperconnectivity normalized following 20-30 sessions of 10 Hz
dmPFC-rTMS. This mechanism of response was not only consistent with a previous VS-DBS
248
study in OCD, but also allows for characterization of which functional features normalize as
symptoms remit (i.e. which features represent states rather than traits).
On a related point, understanding the biological mechanism of treatment remission could
help clarify the biological mechanisms by which an individual may suffer relapse, and this
knowledge in turn may lead to robust biological predictors of treatment relapse. Hypothetically,
if dACC frontostriatal hyperconnectivity re-appears on a subsequent follow-up fMRI scan, it
could predict an impending relapse or worsening of obsessive-compulsive symptomatology.
Second, from a therapeutic and translational standpoint, the identification of neural
markers that change with successful but not unsuccessful treatment could help lead to new
treatments that might be more effective in treatment non-responders in future. For example, the
evidence from Studies I-III collectively suggests that dmPFC-rTMS acts to modulate the
integrity of the SN as a cohesive IBN, and additionally acts to modulate the connectivity in the
CSTC circuits serving the dmPFC site of stimulation. The former finding suggests that future
treatments for non-responders may need to target mechanisms other than cognitive control, such
as abnormal signalling in the positive or negative valence systems – a premise supported by
some preliminary evidence on rOFC-rTMS, as above. The latter finding suggests that treatment
effects might be enhanced by co-interventions that affect the activity and plasticity of CSTC
circuitry: for example, active engagement in a cognitive task during stimulation (Isserles et al,
2013), or co-administration of a dopaminergic medication during treatment, as supported by
recent evidence (Enomoto et al, 2015).
Taken together, Studies I-III have three main clinical implications for patients suffering
from treatment-resistant mental illness. First, properly optimized, dmPFC-rTMS has the potential
to become a potent treatment for patients with debilitating and treatment refractory illnesses.
Effective, non-invasive, scalable treatment options in TRD such as dmPFC-rTMS could also
reduce health system and economic costs, such as disability, caregiver burden, and direct costs of
inpatient and outpatient care. Second, reliable baseline biomarkers of dmPFC-rTMS response
have the potential to improve outcomes by individualizing treatment selection and circumventing
the trial-and-error process of finding an optimal treatment. Third, characterizing the biological
mechanisms of dmPFC-rTMS response has the potential to inform the development of new
treatment strategies, and to predict and avoid illness relapse. In the longer term, both the
249
biological predictors and neurobiological mechanisms of response may provide useful
information to help to develop new interventions that are more effective for treatment non-
responders.
Comparing the Clinical Efficacy of dmPFC-rTMS to DLPFC-rTMS The clinical results of this thesis suggest that dmPFC-rTMS might be beneficial for a
wide array of psychiatric symptoms, including disordered eating, obsessions, compulsions,
depression and anxiety. This finding diverges from the poorer outcomes previously reported for
OCD and ED in studies using DLPFC-rTMS rather than dmPFC-rTMS. For OCD, both open-
label and sham-controlled trials of DLPFC-rTMS have had inconsistent results in improving
clinical symptoms (Sachdev et al, 2001). Early studies showed that OCD patients experienced
some clinical benefit with 20 Hz left DLPFC-rTMS in an open-label setting (Greenberg et al,
1997), while other sham-controlled studies of 1 Hz right DLPFC-rTMS showed no clinical
difference relative to sham (Alonso et al, 2001). Subsequent randomized sham-controlled trials
of 1 Hz right DLPFC-rTMS (Prasko et al, 2006) and 20 Hz left DLPFC (Sachdev et al, 2007)
have confirmed that active DLPFC-rTMS is not clinically superior to placebo in OCD.
Consequently, Study I provide early evidence that dmPFC-rTMS might be a more favourable
treatment for OCD relative to DLPFC-rTMS.
As with OCD, individuals who present with binge eating and purging do not appear to
show consistent benefit from DLPFC-rTMS. Studies using high frequency left DLPFC-rTMS
show inconsistent clinical efficacy in eating disorders. Two open-label studies reported that a
single session reduced the urge to eat, reduced the number of binges 24-hours post-stimulation,
and reduced salivary cortisol (Claudino et al, 2011; Van den Eynde et al, 2010), while another
found no difference in efficacy between active- and sham-stimulation after 15-sessions of 20 Hz
DLPFC-rTMS (Walpoth et al, 2008). Furthermore, the only two randomized double-blind sham-
controlled trials of 10 Hz left DLPFC-rTMS found that this intervention was not superior to
placebo for BN (Gay et al, 2016) or AN (McClelland et al, 2016).
250
Relative to DLPFC-rTMS, dmPFC-rTMS may represent a favourable treatment strategy
for BN. An early case report from our group reported an unanticipated remission of binge-eating
and purging in a TRD patient with comorbid BN following 20 sessions of 10 Hz dmPFC-rTMS
(Downar et al, 2012). This effect on binge-eating and purging was robust and was maintained for
9-weeks post-treatment. The clinical results of Study II confirms the initial finding from our case
report, showing that 10 Hz dmPFC-rTMS can significantly reduce the frequency of binge and
purge episodes. Given this, a reasonable next step would be to assess the efficacy of 10 Hz
dmPFC-rTMS under double-blind, placebo-controlled conditions.
For TRD, the clinical efficacy of 20 Hz dmPFC-rTMS was not superior to that of sham in
Study III, suggesting that dmPFC may not be a preferable target for rTMS compared to left or
right DLPFC in overall terms. These results were consistent with one recent sham-controlled trial
of daily 10 Hz dmPFC-rTMS. In this study, Kreuzer and colleagues (2015) reported that there
was a significant group-time interaction on improvements in depression severity when
comparing active DLPFC-rTMS, active dmPFC-rTMS and sham stimulation (Kreuzer et al,
2015). However, subsequent post hoc tests assessing the difference in symptom improvement
between active dmPFC-rTMS and placebo did not show that active dmPFC-rTMS was clinically
superior to placebo rTMS. Thus, one interpretation of the clinical results of Study III is that the
improvements seen with dmPFC-rTMS are due to non-specific factors and not do the
neurobiological effects of the intervention. However, given that the sham arm in Study III did
indeed show some changes in rsFC similar to those in the active arms, another interpretation is
that the electrical stimuli delivered to patients in the sham arm actually did stimulate the brain in
a therapeutic manner, either transcranially or via the trigeminal nerve. This possibility requires
further investigation in future work.
Of note, despite the null findings of sham-controlled trials of dmPFC-rTMS, three open-
label studies of dmPFC-rTMS show comparable efficacy rates to DLPFC-rTMS. First, our group
published a chart review of 98 patients who received 10 Hz dmPFC-rTMS in MDD, finding
response and remission rates comparable to that of DLPFC-rTMS (50.6% and 38.5%,
respectively) (Bakker et al, 2015). Two other open-label case series from our group have also
reported significant improvements in depressive symptomatology following 20 sessions of 10 Hz
dmPFC-rTMS, with sharply bimodal rates of response and substantial improvement in
individuals who achieved response to treatment (Downar et al, 2014; Salomons et al, 2014).
251
In sum, Studies I and II provide early evidence that dmPFC-rTMS could be a preferable
and more clinically effective intervention relative to DPFC-rTMS for OCD and ED. Clinical
trials of dmPFC-rTMS for these indications is therefore warranted to confirm the efficacy of this
intervention under sham-controlled settings. Despite null findings in early sham-controlled trials
of dmPFC-rTMS for TRD, the results of open-label studies suggesting comparable response and
remission rates to DLPFC-rTMS support the need for further research, possibly employing an
alternative sham stimulation technique, to examine the clinical efficacy of this intervention for
TRD.
dmPFC-rTMS as a Transdiagnostic Intervention in Psychiatric Illness The results reported in Studies I, II and III provide early evidence that rTMS targeting the
dmPFC could serve as a transdiagnostic intervention with efficacy across a range of traditional
psychiatric diagnostic categories. 10 Hz dmPFC-rTMS appears to achieve significant
improvements in OCD symptom severity and binge-eating and purging in ED. Notably, OCD
and ED patients with comorbid depressive or anxiety symptoms also achieved significant
improvements in these clinical dimensions following dmPFC-rTMS. However, these
improvements in depression and anxiety symptom severity did not correlate with improvements
in obsessive thoughts and compulsive behaviours in OCD or with improvements in disordered
eating and purging in ED. This finding suggests that these clinical improvements following
dmPFC-rTMS occur independently of TRD response, and that dmPFC-rTMS might act as a
transdiagnostic intervention.
From a clinical perspective, why might dmPFC-rTMS induce benefit across a diverse
range of symptoms? For one, this transdiagnostic clinical efficacy is not unique to dmPFC-rTMS
as many interventions, including SSRIs and psychotherapy, have proven beneficial for all of
these disorders. One potential account for such transdiagnostic efficacy draws fron the
observation that MDD, AN, BN, and OCD have common comorbidity. MDD is rarely the only
or primary psychiatric disorder as 72.1% of lifetime and 78.5% of 12-month cases of MDD have
a comorbid DSM diagnosis (Kessler et al, 2003). Similarly, OCD is often comorbid with other
psychiatric disorders, and common comorbidities include anxiety disorders, MDD, bipolar
252
disorder (Ruscio et al, 2010), and obsessive-compulsive personality disorder (Eisen et al, 2010).
Another common disorder comorbid with OCD is tic disorder, present in 30% of OCD cases
(Leckman et al, 2010). 56.2% of patients with AN and 94.5% of patients with BN also meet
criteria for another psychiatric disorder (Hudson et al, 2007). Mood disorders like depression and
dysthymia are found in 42.1% of AN and 70.7% of BN patients (Hudson et al, 2007).
This overlap in comorbidity between MDD, OCD and ED is perhaps suggestive of sub-
dimensions of psychiatric illness that exist irrespective of DSM-5 diagnosis. Such sub-
dimensions that go beyond the DSM diagnosis are likely related to genetic, cognitive or
biological factors. Such similarities make sense given that many interventions, including SSRIs
and psychotherapy, have proven beneficial for all of these disorders. The possibility of non-
congruence between biological mechanisms and conventional diagnoses also suggests that
studies recruiting patients purely on the basis of DSM-5 or ICD-10 criteria may fail to achieve
homogeneity in the patient sample, and may instead capture a rather heterogeneous set of
subpopulations from a neurobiological perspective.
Transdiagnostic Efficacy of dmPFC-rTMS: A Biological Perspective The observation of transdiagnostic efficacy for dmPFC-rTMS across many psychiatric
disorders is suggestive of sub-dimensions of psychiatric illness that likely reflect cognitive or
neurobiological endophenotypes common across a wide spectrum of mental illness. In particular,
abnormalities in the domain of cognitive control may be a common element across many
psychiatric disorders (as reviewed by (McTeague et al, 2016)), as broad deficits in tasks related
to cognitive control are observed irrespective of psychiatric disorder class (Snyder et al, 2015).
Additionally, large phenotypic epidemiological studies across disorders have demonstrated that
specific patterns of clinical symptoms are strongly related to an underlying ‘general
psychopathology’ factor that may correspond in part to cognitive control deficits (Carragher et
al, 2016; Krueger, 1999; Lahey et al, 2012). However, the relationship between these broad
cognitive control deficits and the specific forms of psychopathology encountered in conventional
psychiatric disorders such as major depression, OCD, or eating disorders is not well understood.
253
Taken together, a common deficit in cognitive control might be the behavioural factor that
mediates the therapeutic effects of dmPFC-rTMS across multiple disorders.
As a notable point in support of the premise that cognitive control might be a
transdiagnostic factor of response, rTMS over the dmPFC has been previously shown to
modulate cognitive control in healthy controls. Cho et al. demonstrated that, relative to sham,
active medial PFC excitatory rTMS releases striatal dopamine and improves cognitive control on
a delay discounting delay (Figure 1-11) (Cho et al, 2015). Similarly, disrupting mPFC function
using single-pulse TMS or inhibitory rTMS impairs conflict monitoring and increases errors
during cognitive control tasks (Duque et al, 2012; Taylor et al, 2007). These observations
suggest that dmPFC-rTMS may act to enhance cognitive control in general, and that this effect
may have therapeutic value in some individuals with psychiatric illness, regardless of the specific
diagnostic category with which they present. On the other hand, Study III included secondary
clinical questionnaires assessing impulsivity and cognitive control, and no secondary clinical
outcomes of these domains predicted response to active dmPFC-rTMS at baseline, or
significantly changed with response to active rTMS. Further research in psychiatric populations
is therefore warranted to elucidate the cognitive and behavioural mechanisms of transdiagnostic
dmPFC-rTMS response.
The transdiagnostic structural and functional abnormalities of the dACC and SN
reviewed in the Introduction support the premise that dmPFC-rTMS could achieve clinical
benefit over a wide range of psychiatric symptoms. Regarding transdiagnostic structural
abnormalities, three large neuroimaging studies have reported that abnormalities of dACC are
common to many diverse disorders. Goodkind and colleagues demonstrated that dACC gray
matter loss relative to healthy controls was a common feature across six disorders, and that this
gray matter loss corresponded with poor cognitive control (Goodkind et al, 2015). This result
was replicated by two independent meta-analyses, reporting that dACC gray matter loss in the
dACC was common to both unipolar and bipolar depression (Wise et al, 2017), and
schizophrenia (Chang et al, 2018). Specific to the psychiatric disorders of the present study,
dACC volumetric abnormalities are reported in MDD, OCD and ED across a number of studies
in the literature. For MDD, dACC and SN volumetric reductions have been related to
behavioural deficits on such cognitive tasks relative to healthy controls(Li et al, 2010a). ACC
gray matter volume is also reduced relative to healthy controls in OCD (Gilbert et al, 2008;

254
Kühn et al, 2013; Reess et al, 2016), and in ED (Coutinho et al, 2015; Frank et al, 2013;
Friederich et al, 2012; Schäfer et al, 2010; Titova et al, 2013).
Regarding transdiagnostic functional abnormalities, functional SN and dACC
abnormalities appear to be associated with general psychopathology, although there is substantial
heterogeneity in terms of whether this abnormality is related high versus low activity or
connectivity. General psychopathology is associated with SN hypoactivity during a working
memory task (Shanmugan et al, 2016), as well as elevated cerebral blood flow and dACC
frontostriatal hypoconnectivity (Kaczkurkin et al, 2017). However, McTeague and colleagues
recently that SN hyperactivity was also present in a variety of disorders during various cognitive
control paradigms relative to controls (McTeague et al, 2017). Thus, the common element may
be more generally an abnormal functioning of the SN across disorders, rather than a universal
etiology of hypo- or hyper-functioning in this IBN across disorders.
Studies that separately examine MDD, OCD, and ED have also reported abnormal SN
and dACC activity relative to healthy controls. For OCD, dACC hyperactivity and
hyperconnectivity is observed related to controls: for example, dACC is abnormally hyperactive
during symptom provocation and while committing errors in cognitive control tasks (Bourne et
al, 2012). Frontostriatal hyperconnectivity from the dACC to other brain regions has also been
observed in OCD patients relative to controls (Bourne et al, 2012; Rauch et al, 2006).
In MDD, both SN hypo- and hyperactivity has been reported, albeit for different types of
cognition. SN and dACC hypoactivity is associated with maladaptive rumination, (Alexopoulos
et al, 2012; Bartova et al, 2015; Belleau et al, 2015; Hamilton et al, 2011b; Lemogne et al, 2012;
Rzepa and McCabe, 2016; Sheline et al, 2009; Zhu et al, 2017), deficits in incentive salience,
and with anhedonia (Admon et al, 2015; Chantiluke et al, 2012; Knutson et al, 2008; Manelis et
al, 2016; Nestler and Carlezon, 2006; Pizzagalli et al, 2009; Robinson et al, 2012; Schiller et al,
2013; Smoski et al, 2011; Tremblay et al, 2005). Conversely, MDD patients also exhibit dACC
hyperactivity on tasks that assess working memory and cognitive control, including the n-back
(Harvey et al, 2005) and Stroop (Holmes and Pizzagalli, 2008; Wagner et al, 2006). These
observations highlight the earlier point that psychopathology may emerge from abnormal SN
activity in either direction, rather than specifically hypo- or hyper-functioning.
255
Relative to controls, BN patients reliably have abnormal SN activity related to deficits in
cognitive control and impulsivity. Specifically, SN hypoactivity is associated with food
impulsivity. For example, lower dACC activity in response to food reward anticipation predicts
how much a BN patient will overeat (Bohon and Stice, 2011; Frank et al, 2006). Also, SN
hypoactivity during a cognitive control (Stroop) task is associated with poor dietary restraint in
patients who binge eat (Balodis et al, 2013). BN patients also have frontostriatal hypoactivity
circuitry during cognitive control tasks such as the Simon Spatial Incompatibility task (Celone et
al, 2011; Marsh et al, 2009b, 2011), and the go/no-go task (Skunde et al, 2016). Behavioural
deficits and frontostriatal hypoconnectivity are also reported in AN patients during cognitive
control tasks, including during response inhibition (Oberndorfer et al, 2011; Wierenga et al,
2014), the Wisconsin Card Sorting Task (Lao-Kaim et al, 2015), and delay discounting (Decker
et al, 2015; Wierenga et al, 2014).
Taken together, previous studies reporting transdiagnostic abnormalities of brain
structure and function in psychiatric illness provide a possible explanation for observations that
rTMS over the dmPFC may elicit improvements across a wide array of disorder-specific
symptoms, including TRD, OCD and ED. This transdiagnostic clinical benefit may be related to
illness-associated deficits in cognitive control, and structural/functional abnormalities localized
to the SN and dACC that are common across many clinical phenotypes. Further supporting this
interpretation, studies recruiting healthy controls have found that dmPFC-rTMS causally
modulates dACC function and behaviour during cognitive control paradigms.
Frontostriatal Functional Connectivity as a Potential Transdiagnostic Biomarker of dmPFC-rTMS Response
In all three studies, baseline frontostriatal connectivity differed between responders and
non-responders to excitatory dmPFC-rTMS. For patients with AN-BP, BN, or TRD, dmPFC-
rTMS responders displayed significantly lower frontostriatal rsFC relative to non-responders.
For patients with OCD, however, dmPFC-rTMS responders displayed significantly higher
frontostriatal rsFC.
256
These baseline frontostriatal rsFC markers identified as predictive of response are
somewhat similar to those in our first open-label case series of 25 TRD patients treated with 20
once-daily sessions of 10 Hz dmPFC-rTMS (Salomons et al, 2014). In this early study, we found
that high baseline resting-state functional connectivity between the dmPFC and the VMPFC and
sgACC was associated with better treatment response to dmPFC-rTMS. Likewise, lower baseline
rsFC between the dmPFC and right putamen, right thalamus and right hippocampus/amygdala
was associated with better treatment response. While Study III did not replicate our finding that
high dmPFC-sgACC connectivity was predictive of response in TRD (Salomons et al., 2014), it
is encouraging that frontostriatal connectivity was predictive of response in four independent
samples of patients treated with excitatory dmPFC-rTMS.
The connectivity patterns predictive of dmPFC-rTMS response were also qualitatively
similar to those reported in another recent publication identifying baseline rsFC predictors of
response in TRD to 10 Hz and iTBS dmPFC-rTMS (Drysdale et al, 2017). In this study, the
authors reported that TRD patients can be reliably classified into one of four biological subtypes,
on the basis of unique profiles of clinical symptoms alongside specific patterns of abnormal
resting-state functional connectivity. These subtypes were stable over time, and were associated
with depressive symptoms in another DSM-5 diagnosis (in other words, showed transdiagnostic
validity even in the presence of comorbidities). More importantly, these biological subtypes were
able to predict treatment outcomes among patients who received excitatory dmPFC-rTMS. The
most discriminant regions of abnormal resting-state functional connectivity in predicting
treatment response in the study of Drysdale and colleagues aligned well with the regions reported
in the present studies as predictive of response to dmPFC-rTMS, including rsFC of dACC,
globus pallidus, NAc, OFC and VLPFC (Drysdale et al, 2017).
There is also some preliminary evidence supporting the idea that pre-treatment dACC
frontostriatal connectivity may be predictive of response to other, non-rTMS interventions in
MDD, OCD, and AN. For example, in MDD, frontostriatal connectivity from the dACC during
reward processing of a monetary incentive delay task was predictive of antidepressant response
in two studies (Admon et al, 2015; Walsh et al, 2017). In OCD patients undergoing VS-DBS
implantation, pre-implantation resting-state hyperconnectivity was present in individuals who
responded (Figee et al, 2013). In the setting of ED, caudate hyperactivity during prediction errors
predicted poor weight gain in adolescent AN (DeGuzman et al, 2017).
257
Unlike with dmPFC-rTMS, response to DLPFC-rTMS and other interventions appears
more consistently associated with baseline functional activity of the sgACC. A series of
published reports by Fox and colleagues found that anti-correlated baseline rsFC between the left
DLPFC and sgACC predicted favourable response to DLPFC-rTM in TRDS (Fox et al, 2012a,
2013b, 2014). Furthermore, this resting-state predictor of DLPFC-rTMS outcome has been
independently replicated by other groups (Baeken et al, 2014; Philip et al, 2018). For non-rTMS
interventions, two studies have also showed that baseline sgACC hyperactivity during emotional
processing is correlated with response to CBT in MDD (Ritchey et al, 2011; Siegle et al, 2006),
and that baseline sgACC fALFF appears to correlate positively with ECT response (Argyelan et
al, 2016). This difference in patterns of dmPFC and sgACC connectivity predictive of response
is suggestive of the possibility that there may exist TRD subtypes that preferentially respond to
either conventional interventions, ECT, dmPFC- or DLPFC-rTMS.
Why might baseline frontostriatal rsFC differentiate treatment responders from non-
responders to dmPFC-rTMS? Studies spanning last 40 years have reported that frontostriatal
circuitry from regions of the DMN, SN, CEN, and VMN have a key role in motivational,
affective, and cognitive functions that are related to goal-directed action (for example,
(Alexander et al, 1986)). While there is substantial integration between CSTC loops, the caudate
also has a general rostrocaudal hierarchy to its functional architecture, such that rostral striatal
neurons that have DLPFC, dmPFC and VMPFC afferents are more active during reward-based
learning and actions that require conscious attention, while caudal striatal neurons that have
sensorimotor afferents are more active during actions that do not require conscious attention
(Kim and Hikosaka, 2015).
CSTC circuits serving the SN specifically are thought to play an etiological role in
cognitive control deficits consistent across a wide array of psychiatric disorders (as discussed in
(Marsh et al, 2009a)). Marsh and colleagues (2009a) reported that deficits in self-regulatory
control common across many psychopathologies, including OCD and ED, are related to both
dysregulated parallel and integrated frontostriatal circuits stemming from medial and lateral
prefrontal cortex and orbitofrontal cortex. Given the possible existence of parallel CSTC circuits
that give rise to different clinical phenotypes, it could therefore be the case that in dmPFC-rTMS
non-responders, the intervention was targeting the wrong frontostriatal circuit for the patient’s
underlying pathology.
258
dmPFC-rTMS Response Correlates with CSTC Connectivity Change In Studies I and II, CSTC connectivity change was associated with OCD and ED
symptom improvement following 20-30 sessions of open-label dmPFC-rTMS. However, the
while the circuit was similar, the direction of therapeutic effect was different: OCD treatment
responders saw a significant decrease in dACC frontostriatal connectivity associated with
improvement, whereas eating disorder treatment responders saw a significant increase in
connectivity with improvement. These observations support the premise (noted earlier above)
that psychopathology may be associated with either hypo- or hyper-functioning of SN regions.
Directionality aside, the brain regions in which change was associated with improvement
in Studies I and II align well with the findings in our first open-label case series of 25 TRD
patients treated with 20 once-daily sessions of 10 Hz dmPFC-rTMS (Salomons et al, 2014). In
this earlier study, pre- to post-treatment increases in functional connectivity between the dACC
and the bilateral medial dorsal thalamus accompanied dmPFC-rTMS response. Similarly,
decreases in resting-state functional connectivity between the sgACC, the ventral striatum and
middle cingulate cortex also accompanied treatment response to dmPFC-rTMS. Taken together,
it appears that changes in SN CSTC rsFC following dmPFC-rTMS are associated with symptom
improvements across a wide variety of disorders, signifying a possible transdiagnostic
mechanism of response to the same neurostimulatory intervention.
Previously studies that report neurobiological changes associated with improvements in
binge eating and purging are difficult to find in the literature. It is known, however, that bulimia-
related deficits in impulse control are related to SN corticostriatal circuitry. As previously
discussed, SN frontostriatal hypoactivity is associated with food impulsivity (Bohon and Stice,
2011; Frank et al, 2006) and deficits in cognitive control tasks such the Simon Spatial
Incompatibility task (Celone et al, 2011; Marsh et al, 2009b, 2011), and the go/no-go task
(Skunde et al, 2016). Increases in SN connectivity and its associated frontostriatal connections
following dmPFC-rTMS are perhaps a neural substrate for improvements in cognitive control
and impulsivity surrounding binge episodes. As negative affect and negative urgency are
significant predictors of binge eating (Fischer et al, 2003; Racine and Martin, 2017), it could also

259
be the case that dmPFC-rTMS caused improvements in emotion regulation and cognitive control
over negative urgency, which in turn allowed reductions in binge eating and purging.
For patients with OCD, dmPFC-rTMS responders had baseline dACC frontostriatal
hyperconnectivity that normalized following treatment. This finding is in line with previous
studies reporting that SN corticostriatal structural and functional connectivity changes
accompany symptomatic OCD improvement with both conventional and novel therapeutics.
Conventional OCD pharmacotherapies have been shown to normalize dACC corticostriatal
hyperactivity (Anticevic et al, 2014; Beucke et al, 2013; Rauch et al, 2006), and have been
shown to alter striatal and thalamic gray matter volume (Atmaca et al, 2016; Hoexter et al,
2012). Given that frontostriatal hyperconnectivity has been associated with symptom
provocation and deficits in emotion regulation in OCD, is it likely that normalized frontostriatal
hyperconnectivity is related to improvements in these cognitive abnormalities and associated
OCD symptoms.
Notably, the rsFC changes observed in OCD dmPFC-rTMS responders overlap closely
with the results reported by one study using rs-fMRI in patients treated with VS-DBS. In an
observation nearly identical to that reported for neural correlates of improvement in Study II,
Figee and colleagues (2013) reported that dACC resting-state hyperconnectivity normalized in
OCD VS-DBS responders (Figee et al, 2013). Given the close anatomical overlap of our findings
and those of Figee and colleagues, it is likely that the mechanisms of symptom improvement
may be similar for both VS-DBS and dmPFC-rTMS for OCD. This finding also agrees well with
previously reported rsFC cortical networks of DBS targets for OCD (Fox et al, 2014). In light of
these observations, it may be reasonable to conclude that dmPFC-rTMS achieves therapeutic
effects via a similar, or perhaps the same, mechanism as that of more invasive VS-DBS.
It is also worth noting that the direction of frontostriatal rs-fMRI predictors and correlates
of OCD response to excitatory dmPFC-rTMS are opposite to what we have previously observed
for TRD (Salomons et al, 2014) and eating disorders (Study I) (Dunlop et al, 2015). The
opposite-direction correlate of therapeutic effect could be related to inter-individual variability of
functional abnormalities in the SN across many disorders, or related to the variability reported in
the general neurobiological mechanisms of rTMS as reviewed in the Introduction.
260
Regarding the first possibility, the direction of rTMS-induced effect on rsFC might be
state-dependent. In other words, the direction of effect for 10 Hz rTMS might depend on whether
baseline rsFC of this circuit is abnormally hyper- or hypoactive at rest. The observations in Study
I of different directions of effect for 10 Hz stimulation in responders and non-responders,
depending on whether pre-treatment rsFC was high or low, supports this hypothesis. Similarly,
as previously discussed, while transdiagnostic neuroimaging studies report consistent volumetric
reductions in the dACC and AI, there is considerable heterogeneity of functional abnormalities in
the SN. Furthermore, studies report hyper- or hypoactivity in the SN depending on the
neuroimaging paradigm employed (McTeague et al, 2016, 2017).
Regarding the second possibility, variability in the direction of rTMS effect could be a
function of other genetic or neurobiological factors that influence synaptic plasticity. The actual
direction of effect for nominally ‘excitatory’ and ‘inhibitory’ rTMS protocols is extremely
heterogeneous across individuals, as a substantial proportion of healthy controls exhibit increases
in MEP amplitude on nominally inhibitory protocols such as 1 Hz rTMS, or decreases in MEP
amplitude on nominally excitatory protocols at 10, 15, and 20 Hz (Maeda et al, 2000). Likewise,
on functional MRI, there is substantial inter-individual variability in the direction of connectivity
change in response to excitatory and inhibitory rTMS (Eldaief et al, 2011). To date, however, the
neurobiological underpinnings of this heterogeneity in rTMS’ neuroplastic effects is not well-
understood. Consequently, it is possible that the direction of therapeutic effect of dmPFC-rTMS
may depend on either state-dependent SN abnormal function, or other neurobiological factors
that contribute to inter-individual variability in rTMS-induced synaptic plasticity.
Treatment Non-Specific Clinical Response in TRD is Related to Emotion Regulation and Impulsivity In Study III, changes in neural activity that were associated with clinical improvement
across all three study arms included increased rsFC between the VMPFC and the dACC. These
brain areas are divergent from those identified in previous similar studies of the rsFC correlates
of response for other interventions such as DLPFC-rTMS, or antidepressant medications. Both
conventional antidepressant medications and high frequency left DLPFC-rTMS have been
reported to increase rsFC in nodes of the CEN and SN, and decrease rsFC from the sgACC (as
261
reviewed in Section 1.11.2 and 1.11.3). For example, a relatively recent meta-analysis of PET
and fMRI studies reported that response to pharmacotherapies was associated with increases in
dmPFC, DLPFC and VLPFC activity, and decreases in the activity of all regions of the DMN
(Delaveau et al, 2011). Correlates of improvement for DBS of the sgACC were also very similar
to those for conventional interventions: sgACC-DBS responders show metabolic increases in the
DLPFC and dACC, and metabolic decreases in the sgACC and OFC (Lozano et al, 2008;
Mayberg et al, 2005). Reductions in sgACC-medial prefrontal hyperconnectivity have also been
associated with nonspecific response to either active or placebo DLPFC-rTMS as a ‘final
common pathway’ of improvement in TRD (Taylor et al, 2018).
Consistent with previous findings, increases in dACC rsFC accompanied clinical
improvement across all three of the interventions of Study III. This observation agrees with some
previously reported findings. For example, on FDG-PET, MDD patients treated with either an
SSRI or psychotherapy showed increases in ACC metabolism correlated with symptom
improvement (Brody et al, 2001). During task-fMRI, normalization of SN hypoactivity during
induced negative mood (Fitzgerald et al, 2008) and during incentive reward cues (Stoy et al,
2012) has been reported following successful pharmacotherapy.
At the same time, in contrast to these previous findings, the results of Study III indicate
that treatment non-specific clinical response was associated with significant increases of the rsFC
from the VMPFC to the dorsal ACC, a node of the SN. For DLPFC-rTMS, non-specific
correlates may be different. One previous study of mechanisms of treatment response reports
similar increases in functional connectivity between dorsal and ventral cortical structural with
response to rTMS. Baeken et al. (2014) reported that responders had increased rsFC between the
sgACC and perigenual ACC in responders to accelerated left DLPFC-rTMS (Baeken et al,
2014).
Study III also reported that intervention-nonspecific response was correlated with
improvements in self-reported emotion regulation. TRD responders showed significant
reductions on the impulsivity and goal-setting subscales, and the total score of the DERS.
Consequently, a reasonable interpretation is that a common pathway of improvement in
depression severity is related to an improved impulsive, dysregulated, persistent negative
thoughts and emotions, apparent across all three study arms. This behavioural change would
262
presumably occur via normalizing top-down dorsal prefrontal connectivity to ventral affective
regions, with resultant enhancements of cognitive control over negative thoughts and emotions.
Menon’s ‘Triple Network Theory’ may be helpful in interpreting the meaning of Study
III’s observed intervention-nonspecific increases in SN function that correlated with
improvements in depression symptoms and emotion regulation. Menon hypothesizes that the SN
has a possible role as a functional ‘switch’ between the CEN during externally-driven cognition,
and DMN during internally-driven cognition (as discussed in (Menon, 2011; Menon and Uddin,
2010)). Consequently, SN dysfunction may permit aberrant activity in these other networks,
leading to difficulties integrating salient external or physiological events and accessing networks
for attention and working memory or self-referential/autobiographical thought. Given that the
VMPFC ROI used in Study III overlaps with the mPFC node of the DMN, as well as the
VMPFC node of the VMN, it is therefore possible that increases in dACC-VMPFC functional
connectivity following treatment reflect a restored functional regulatory ‘switch’ in IBN network
connectivity between the SN and the DMN, accompanied clinically by an enhanced capacity for
emotional self-regulation.
Limitations and Challenges Several important limitations and challenges for the present Studies I-III bear discussion.
Of greatest note, the results of Study III did not find either 20 Hz or 1 Hz active dmPFC-rTMS to
be superior to the sham technique in reducing clinical symptoms. The lack of significant
difference was driven not by a lack of effect in the active arms but by an equal degree of
improvement in patients who received the ‘sham’ form of stimulation using scalp electrodes.
The most straightforward conclusion from this observation would be that there is no
specific therapeutic effect of active dmPFC-rTMS over the non-specific effects of attending
treatment sessions. However, there are some caveats that may render such a conclusion may be
premature. First, the response and remission rates of Study III’s active arms, as with previous
open-label dmPFC-rTMS, are comparable to that of DLPFC-rTMS in studies that did
demonstrate efficacy over sham(Bakker et al, 2015), and the degree of clinical improvement in
the sham arm of Study III is superior to that previously found in meta-analyses that report sham
263
response rates for DLPFC-rTMS as low as 10% in TRD cases (Berlim et al, 2013). Furthermore,
healthy control studies of excitatory medial PFC have reported significant behavioural and
neurobiological changes in response to active rTMS versus placebo, indicative of a potential
mechanism of dmPFC-rTMS in non-depressed individuals (Cho et al, 2015). The higher than
expected response to sham stimulation in Study III is therefore somewhat aberrant when
compared to previous literature, and further study may therefore be warranted to test the clinical
efficacy of dmPFC-rTMS for TRD, ED, and OCD.
Sham treatment technique is a major challenge in rTMS trial design. Many of the earlier
major randomized controlled trials assessing rTMS efficacy did not effectively blind the rTMS
technician during treatment, as separate coils or different placement techniques were used for
active and sham treatment. Older models of sham rTMS also did not effectively mimic the
somatosensory or nociceptive aspects of active rTMS during treatment by using a shielded rTMS
coil or placing an active rTMS coil at an angle that would insufficiently apply stimulation. While
more recent rTMS trials sometimes attempt to mimic the somatosensory and nocieptive
sensations of rTMS, the electrical stimuli used to do so may run the risk of being in themselves a
neurophysiological stimulus with therapeutic properties. In one notable sham-controlled study of
right versus left DLPFC-rTMS, ‘sham’ rTMS with simultaneous electrical stimulation via scalp
electrodes achieved similar effects to active rTMS at both sites, and the therapeutic efficacy
depended on the site of stimulation (right > left DLPFC efficacy) rather than whether the
stimulation was delivered by scalp electrodes or the ‘active’ rTMS coil (Triggs et al, 2010).
This observation may be pertinent to the sham techniques employed in the present Study
III. This trial of dmPFC-rTMS for TRD is the first randomized controlled trial to employ a
custom active/placebo double-sided double-cone coil that attempts to mimic the sensation of
rTMS, while at the same time attempting to blind the rTMS technician to the treatment being
given. As we previous described, however, it could also be the case that by mimicking the
sensory and nociceptive effects of active dmPFC-rTMS, the sham electrodes inadvertently
delivered a therapeutic form of electromagnetic stimulation to the brain, either transcranially
(since the electrodes were positioned between the DLPFC and frontal pole) or else via V1
trigeminal nerve stimulation. The observation of some commonalities in the change in pre- to
post-treatment rsFC for the active and sham arms supports this premise. Further research would
be required to elucidate the clinical effects of trigeminal nerve stimulation, and perhaps to
264
evaluate the clinical efficacy of excitatory dmPFC-rTMS using some other placebo method. For
example, other rTMS studies have used active rTMS over the vertex as an alternative control
intervention (Razza et al, 2018).
As a second issue affecting all 3 studies, relatively small sample sizes limit the
generalizability of clinical and neuroimaging findings, and could also contribute to the null
clinical finding of the randomized controlled trial in Study III. Despite this issue, the sample
sizes of each study are comparable to other neuromodulation studies involving rs-fMRI (Downar
et al, 2014; Figee et al, 2013; Salomons et al, 2014; Taylor et al, 2018). Furthermore, the sample
sizes of both open-label case series (Studies I and II) are comparable to other open-label rTMS
treatment studies for investigational indications such as OCD (Mantovani et al, 2006, 2010) and
eating disorders (Walpoth et al, 2008), and are also comparable to other non-interventional
neuroimaging studies in these populations (Admon et al, 2012; Cowdrey et al, 2011). Finally, the
sample size of our randomized controlled trial is substantially larger than the only other trial of
dmPFC-rTMS for TRD, which randomized N=45 patients (Kreuzer et al, 2015). Irrespective of
previous studies, the sample sizes of the present study are still somewhat underpowered to
adequately capture the clinical and neurobiological heterogeneity of these psychiatric
populations, and to identify generalizable biomarkers of treatment response. It is encouraging,
however, to see transdiagnostic agreement across the different disorders of Studies I-III in the
findings that dmPFC-rTMS achieved significant therapeutic effects, and that baseline
frontostriatal connectivity may differentiate treatment responders from non-responders.
Another limitation arises from the inherent clinical and neurobiological heterogeneity of
MDD, OCD and ED, which might obscure the efficacy of dmPFC-rTMS if only a subpopulation
of each study group had pathology congruent with the underlying mechanism of the intervention.
As noted earlier, the results suggest that dmPFC-rTMS may modulate the integrity of the SN and
its CSTC components, regardless of disorder. If only a subgroup of patients in each disorder
group actually have abnormalities of SN function, then the observed remission rate may be
proportional to the size of that subpopulation rather than the potency of the intervention itself.
The problem then shifts from enhancing the potency of the treatment to identifying the
subpopulation for which the treastment is appropriate.
265
If this premise is correct, then neurobiologically-based subtypes of psychiatric disorders,
irrespective of DSM-5 diagnosis, may be necessary to identify optimal candidates for dmPFC-
rTMS. To that end, as noted earlier, an important recent study developed a novel method to
define MDD subtypes by clustering subjects by distinct patterns of abnormal rsFC in
frontostriatal and limbic brain networks (Drysdale et al, 2017). We showed in a large multisite
sample that MDD patients could be subdivided into four rsFC-based subtypes that predicted
treatment responsiveness in individuals receiving dmPFC-rTMS. Furthermore, patients with
anxiety with comorbid depressive symptoms, but no formal MDD diagnosis, were also
successfully categorized into MDD subtypes based on rsFC. These findings suggest that these
endophenotypes are both useful for treatment prediction and potentially applicable
transdiagnostically; they may also help explain why there is considerable overlap in the set of
effective treatment interventions used across MDD, OCD, and ED. In the longer term,
identifying subtypes of psychiatric disorders may prove critical to optimizing rTMS clinical
efficacy.
A fourth challenge to the study and therapeutic use of dmPFC-rTMS is the inherent
heterogeneity in the effects of rTMS itself. At present, we have limited information about how
how manipulating individual rTMS parameters (such as stimulus frequency, pattern, or target
site) influences clinical response rates, or how these parameters interact with neurobiological
sources of variation among patients. The results from the present study indicate that the observed
neuroplastic changes following excitatory dmPFC-rTMS are not consistent across protocols,
disorders, or individuals: when given the same 10 Hz dmPFC-rTMS intervention, OCD
responders saw significant decreases in frontostriatal connectivity, while eating disorder
responders saw significant increases in the same frontostriatal connectivity.
Such heterogeneity is consistent with previous literature. For example, there is substantial
inter-individual variability in the magnitude and even direction of the neuroplastic effects of
rTMS at 1, 10, 15, and 20 Hz, as measured on motor evoked potentials (Maeda et al, 2000). On
functional MRI, there is significant inter-individual variability in both the magnitude and
direction of connectivity change in response to ‘excitatory’ 20 Hz and ‘inhibitory’ 1 Hz rTMS
(Eldaief et al, 2011). Furthermore, the two rTMS protocols engaged slightly different
neuroanatomical networks of connections to the target site: 20 Hz rTMS primarily engaged
corticocortical circuits, while 1 Hz rTMS altered corticolimbic circuits (Eldaief et al, 2011). It is
266
also worth mentioning that most of the studies that report on the neurobiological effects of rTMS
are restricted to motor cortex stimulation and plasticity in MEPs. Further research is needed to
better characterize the effects of rTMS over non-motor cortical regions, and to determine how
certain rTMS parameters - including stimulation intensity, intertrain interval, or the interval
between treatments - influence this plasticity.
A fifth limitation of the present set of studies is that the neuroimaging-based biomarkers
of treatment response are based on group-level differences between rTMS responders and non-
responders. In other words, these neuroimaging results assess differences in functional
connectivity between two groups (responders and non-responders) on average, instead of being
able to characterize more fully the differential distribution, overlap, or non-overlap of these
biomarkers across the full set of responder and non-responder individuals.
Significant average differences cannot always be translated into individual predictive
ability for a single metric, if the distributions have substantial overlap despite their difference in
means. Thus, the group-level neural predictors of the present study may or may not prove
suitable for individual-level prediction of treatment outcome in the clinical setting. For the
present set of studies, group-level differences were favoured over machine-learning classifiers
(which may achieve better individual-level classification by using large sets of metrics in a
multivariate rather than univariate predictive model), given that large training sets are needed to
develop robust machine-learning classifiers. The limited sample sizes in the present study would
negatively impact the accuracy, interpretability, and generalizability of automated prediction
models (for a review, see Patel et al, 2016). Furthermore, there are a number of methodological
challenges to training machine-learning classifiers on fMRI data that could influence a predictive
model’s accuracy and generalizability. For example, fMRI scans are composed of tens of
thousands of voxels, and the use of different, but equally valid, methods to parse these voxels
and select features to train a predictive model can lead to major differences in the model’s
predictive accuracy (for a systematic comparison of parcellation methods and their influence on
prediction model accuracy, see Arslan et al, 2018). Another example is cross-validation
methods: different cross-validation techniques can also substantially influence the accuracy and
generalizability of a prediction model (for a review, see Patel et al, 2016). As a result of these
limitations, substantial future work would be necessary to progress from the group-level
predictors identified in the present study to the eventual validation of robust individual-level
267
biomarkers of rTMS response, in large, multisite datasets, using machine-learning classifiers that
are uniquely designed to parse rs-fMRI data and that generalize beyond the initial training set.
Finally, regarding translational limitations, there are logistical constraints on the
scalability and accessibility of rTMS as a treatment for psychiatric disorders, and fMRI as a tool
to subtype patients or aid in treatment selection. First, rTMS treatments impose significant
logistical burdens on patients. As rTMS typically involves between 20-30 once daily sessions,
patients are required to come to the clinic every day, typically Monday to Friday, for between
four and six weeks. This is a considerable inconvenience for patients, especially those who are
able to work or must commute a long distance for daily treatment. It is also problematic for the
treatment capacity of rTMS clinics; long treatment courses mean that fewer patients can be
treated. Second, to date, rTMS clinics in Canada are largely found only in a handful of research
or clinical centres of excellence. This means that the current availability of rTMS in Canada is
limited to urban centres with teaching hospitals, requiring patients from underserved rural
communities to commute daily to the city or incur significant financial costs in short-term
housing downtown. As such, there is a need to decrease the overall logistical burden (i.e.,
number of required visits) on patients, perhaps via accelerated rTMS protocols using multiple
sessions per day (Holtzheimer et al, 2010). Even if rTMS clinics were to become widespread,
given the logistical burdens patients face in attending treatment sessions, treatment selection
techniques still need to be optimized so as to reliably identify patients for whom rTMS is likely
to be futile. Finally, the use of fMRI to identify biological markers of treatment response is not
readily scalable: MRI is not only expensive, but the number of MRI scanners per capita in
Canada significantly lags behind other developed countries like Japan and the United States
(Stein, 2005). It is therefore likely that even if a generalizable neuroimaging biomarker was
discovered, MRI wait times in Canada and abroad would drastically increase if it were
implemented in widespread practice. Again, 3 Tesla MRIs capable of scanning the brain at high
resolution are often localized to centres of excellence, which would require many patients to
commute from rural areas. Therefore, other techniques, such as EEG, or even a validated written
questionnaire, might be more cost effective, scalable, and appropriate tools to assess
neuropsychiatric endophenotypes, or aid in treatment selection in the future.
268
Conclusion In sum, this thesis provides novel evidence for the existence of transdiagnostic rsFC
predictors of, and mechanisms of response to, excitatory dmPFC-rTMS as a treatment for TRD,
ED, and OCD. Baseline SN frontostriatal rsFC significantly differed between treatment
responders and non-responders, such that TRD and ED rTMS responders had lower baseline
dACC frontostriatal rsFC and OCD rTMS responders had higher baseline dACC frontostriatal
rsFC relative to rTMS non-responders. Regarding mechanisms of response to excitatory dmPFC-
rTMS, treatment response in ED was significantly correlated with increased dACC frontostriatal
rsFC, while treatment response in OCD was significantly correlated with decreased dACC
frontostriatal rsFC. Furthermore, TRD patients who responded to active or placebo dmPFC-
rTMS showed a normalization of VMN and SN hypoconectivity, as well as improvements in
emotion regulation deficits following treatment. From a basic science perspective, these findings
shed light on a common underlying neurobiological etiology across multiple categories of mental
illness, and the neurobiological pathways through which individuals may recover from these
illnesses. From a clinical and translational perspective, the present study reveals new avenues for
the personalization of patient care strategies in psychiatric illness, and for the development of
novel treatment strategies that may one day prove effective in the most treatment-resistant
populations of patients.
269
Future Directions The findings from Study I-III point to several future clinical and neuroimaging questions
whose answers may further advance the field. These questions may be best addressed through a
series of randomized controlled trials, designed to clarify the clinical efficacy of dmPFC-rTMS
for treatment-refractory MDD, AN-BP, BN, and OCD. Such trials will also be well-positioned
to address the following questions for future study:
The first set of questions is related to the theme of demonstrating clinical efficacy under
randomized, placebo-controlled conditions, while employing an appropriate technique for sham
stimulation that does not directly modulate brain activity:
1) Does active dmPFC-rTMS achieve superior clinical outcomes to sham stimulation,
using a different sham technique? The results of Study III suggest that there is no
significant clinical difference between active and sham stimulation. However, this lack of
difference was driven by a substantially higher-than-expected sham rTMS response rate
rather than a lower-than-expected active rTMS response rate. As such, there are a number
of potential confounds in the sham stimulation design that warrant future study. For one, the
electrode montage over the frontal pole and DLPFC, used to mimic the somatosensory and
nociceptive qualities of dmPFC-rTMS, may have inadvertently induced an antidepressant
effect. Other recent sham-controlled studies of dmPFC-rTMS have used vertex stimulation
as an effective placebo that elicits no true antidepressant effect (Cho et al, 2015; Razza et al,
2018), and so a future study of dmPFC-rTMS should employ an alternative control
intervention involving either a shielded ‘placebo’ stimulation coil, or stimulation of a control
region not linked to the SN, to assess the efficacy of this dmPFC-rTMS for TRD.
2) What is the clinical efficacy of excitatory dmPFC-rTMS for treatment-refractory AN-
BP/BN, and OCD under placebo-controlled conditions? Given that the clinical results of
Studies I and II were under open-label conditions, a double-blind, sham-controlled trial is
necessary to establish the clinical efficacy of dmPFC-rTMS for AN-BP or BN, and OCD.
Given the potential confounding issues with the sham stimulation technique we used for our
MDD randomized controlled trial, it would be necessary to design the study to avoid any
inadvertent therapeutic effects from electromagnetic stimulation over the scalp aimed at
mimicking the somatosensation of rTMS. Given the recent advances in rTMS sham coil
270
design and increases in placebo response rates (Razza et al, 2018), it will be also important
for future studies to recruit a large sample size in order to achieve sufficient statistical power
to allow a demonstration of superiority at a clinically meaningful effect size. Such follow-up
studies may be conducted both for OCD and for ED patients – in the latter case, perhaps as a
useful adjunct intervention for patients who are completing an inpatient hospitalization or
enrolled in a day hospital program.
Another research theme of high importance for future investigation relates to the
optimization of rTMS parameters to maximize the clinical efficacy of this intervention.
3) Are there alternative rTMS targets that may be effective for patients who are non-
responsive to dmPFC- or DLPFC-rTMS? Observations from Study III suggest that rsFC
to the orbitofrontal cortex at baseline may be an important distinguishing feature of non-
responders versus responders to dmPFC-rTMS. If so, one potential alternative to dmPFC
stimulation is instead to stimulate the orbitofrontal cortex. OFC functional connectivity is
abnormal in MDD patients in general, compared to healthy controls (Fettes et al, 2018). The
OFC also has CSTC connections responsible for reward, non-reward, and affective
regulation; disturbances in this connectivity could lead to behavioural disturbances, and,
likewise, normalizing dysfunctional OFC CSTC connectivity could produce a therapeutic
effect in patients with abnormal network activity involving this region (for a review, see
Fettes et al, 2017b). Our group has recently published a case report where a patient who had
previously failed adequate courses of both dmPFC- and DLPFC-rTMS responded well to a
course of inhibitory OFC-rTMS (Fettes et al, 2017a). A subsequent case series on clinical
outcomes for 1 Hz right OFC-rTMS in N=42 patients who had already failed to respond to
dmPFC-rTMS found that 35.7% and 23.8% of TRD patients responded and remitted,
respectively (Feffer et al, 2018). Therefore, a randomized controlled trial of OFC-rTMS to
determine the efficacy of this intervention under placebo-controlled conditions is warranted.
4) Is there an alternative stimulatory protocol with more consistent neuroplastic effects
across individuals? ‘Conventional’ rTMS protocols are remarkably variable both in their
neurobiological effects on plasticity and their clinical efficacy. This heterogeneity is
apparent for both conventional protocols like 1 Hz and 10 Hz rTMS (Eldaief et al, 2011;
Maeda et al, 2000) and for newer protocols like iTBS and cTBS (Cárdenas-Morales et al,
2014; Hamada et al, 2013; Nettekoven et al, 2015). As such, even if the problem of reliable
271
individualized target selection could be reliably solved, the problem of failure to engage
plasticity as intended would remain, unless more consistent protocols can be developed.
QPS is one novel protocol that is reportedly more consistent in its neuroplastic effects than
previous stimulatory protocols; one recent study showed that the QPS-induced MEP effects
are consistent across 80% of subjects, for both its inhibitory and its excitatory forms
(Nakamura et al, 2016). While QPS appears to be safe and well-tolerated, clinical studies
involving QPS have yet to be performed in any psychiatric disorder (Nakatani-Enomoto et
al, 2011). Therefore, preliminary clinical studies of QPS versus conventional or theta-burst
protocols for the treatment of psychiatric disorders might be a worthwhile endeavour, to
maximize the intervention’s clinical efficacy and intended neurobiological effects.
5) Do the number of daily sessions and the interval between treatments impact treatment
efficacy to accelerated dmPFC-rTMS? While accelerated protocols of multiple daily
sessions of rTMS have seen increasing interest in the literature, the number of daily
treatments in a single course vary considerably between studies. For example, the first
accelerated rTMS study by Holtzheimer and colleagues administered 15 sessions of left
DLPFC-rTMS over 2 days (Holtzheimer et al, 2010), while others have successfully used
twice-daily (McGirr et al, 2015) or five times daily sessions (Baeken et al, 2013; Duprat et
al, 2016). Yet the optimal number and timing of rTMS sessions to balance treatment
efficacy and patient burden is still unclear. Are there any genetic or neurobiological factors
that could influence the optimal number of daily sessions for a particular patient? In
particular, does the interval between treatment sessions significantly influence clinical
efficacy or the direction of rTMS-induced neuronal plasticity? As the issues of optimal daily
session number and inter-session interval were not systematically explored in Study III, it
would be worthwhile to complete two randomized controlled trials: first, an rTMS study
evaluating the antidepressant effects and neurobiological predictors of once daily, twice
daily, and 5 times daily rTMS; and second, an rTMS study to establish the optimal interval
between multiple daily rTMS sessions. This work could help to reduce the logistical burden
on patients by reducing the number of clinic visits required to complete a course of rTMS
treatment.
6) Can rTMS be used in combination with other interventions to maximize its clinical
efficacy in psychiatric disorders? Most previous randomized controlled trials of rTMS for
psychiatric disorders like TRD and OCD have applied stimulation during resting conditions.
272
In other words, for most trials to date, during rTMS sessions the patient is in a seated
position, doing nothing in particular, without being instructed to engage in any particular
type of cognition or to keep any particular type of thought in mind. It could be the case that
the amplitude of rTMS effect over a cortical target, and therefore the clinical efficacy,
differs when the stimulation is delivered at rest compared to when that region is engaged in a
particular task. For example, Ruf and colleagues applied DLPFC-tDCS during working
memory training in a sample of healthy controls. They reported that individuals who
received task-relevant tDCS saw a steeper learning curve relative to those who received
placebo tDCS or task-irrelevant tDCS (Ruf et al, 2017). To the same point, the well-
established discrepancy between the ‘active’ and the ‘resting’ motor threshold during motor
cortex stimulation is a simple but clear illustration of the state-dependence of rTMS’ effects
on the brain. It would therefore be worthwhile to apply dmPFC-rTMS in the context of an
emotion regulation or impulsivity paradigm known to engage the SN, or during/before CBT
or mindfulness meditation, to see whether engaging the dmPFC with a task improves
clinical efficacy of this treatment.
Finally, there may be ways to improve the techniques with which we identify treatment
responders and distinguish them from non-responders prior to treatment.
7) Do transdiagnostic, biologically-derived subtypes of psychiatric disorders exist? Do
such biological subtypes differ in terms response to dmPFC-rTMS? The interpretation
of many previously-identified biomarkers of treatment response is limited, because many of
these studies have a modest sample size and offer only group-average predictive associations
rather than individual-patient predictive value. Many candidate biomarkers fail to replicate
in subsequent studies, and are therefore not generalizable to the population. Furthermore, as
this thesis has highlighted, psychiatric disorders are remarkably heterogeneous in terms of
their clinical presentation. As a result, many have pushed for new diagnostic approaches,
such as the Research Domain Criteria, to identify more biologically grounded ways to
categorize neurocognitive, affective, and behavioural abnormalities. Large, multi-site studies
involving hundreds or thousands of scans from individuals presenting with a variety of types
of abnormal cognition or behaviour, regardless of DSM-5 diagnosis, may be needed to
address this clinical heterogeneity, and to overcome the many challenges involved in
identifying generalizable biomarkers. In a well-cited example, Drysdale and colleagues
273
recently published such a study in a large dataset of individuals diagnosed with MDD, and
developed a novel method to define MDD subtypes by clustering subjects by distinct
patterns of abnormal rsFC in frontostriatal and limbic brain networks (Drysdale et al, 2017).
The four rsFC-based MDD subtypes predicted treatment responsiveness in individuals
receiving dmPFC-rTMS at superior accuracy rates compared to clinical or rsFC features
alone. Datasets that collect neuroimaging from patients afflicted with diverse psychiatric
conditions, such as the United Kingdom Biobank (Alfaro-Almagro et al, 2018), or the
Enhancing NeuroImaging Genetics through Meta-Analysis consortium (ENIGMA)
(Thompson et al, 2014b), will be necessary to classify transdiagnostic biological subtypes;
such markers will hopefully prove useful and generalizable for intervention selection and
prognosis in real-world clinical settings.
8) Are there more scalable biomarkers to predict dmPFC-rTMS treatment response or
monitor treatment mechanisms? fMRI has several major limitations for large-scale,
practical use in real-world clinical settings: it is costly, there are few scanners in Canada,
and it is technically challenging to simultaneously stimulate and image the brain, which
rules out real-time monitoring of brain activity during treatment sessions. However, TMS
coupled with EEG, if reliable, may be a more practical alternative to fMRI-based
biomarkers. EEG devices are relatively less expensive and plentiful, and some devices are
TMS compatible. Numerous studies have pointed to neurophysiologically-based biomarkers
of rTMS antidepressant response, including parietotemporal alpha power (Micoulaud-
Franchi et al, 2012), and frontal electrode power in multiple frequency bands (Arns et al,
2012). Changes in neurophysiological markers have also been identified as correlates of
rTMS treatment response, including changes in the P200 during an auditory oddball task
(Choi et al, 2014), and changes in gamma and theta at rest (Noda et al, 2017). Pellicciari and
colleagues found TMS-induced PFC asymmetry was restored following successful DLPFC-
iTBS in one case report (Pellicciari et al, 2017). Combining such techniques with dmPFC-
rTMS and transdiagnostic biomarker identification would potentially be a fruitful and
scalable alternative to rs-fMRI, if biomarkers are to be developed for use in real-world
settings in patients with MDD, OCD, ED, and other treatment-resistant psychiatric
disorders.
274
References Aaronson ST, Carpenter LL, Conway CR, Reimherr FW, Lisanby SH, Schwartz TL, et al
(2013). Vagus nerve stimulation therapy randomized to different amounts of electrical
charge for treatment-resistant depression: acute and chronic effects. Brain Stimul 6: 631–40.
Abelson JL, Curtis GC, Sagher O, Albucher RC, Harrigan M, Taylor SF, et al (2005). Deep
brain stimulation for refractory obsessive-compulsive disorder. Biol Psychiatry 57: 510–6.
Abou-Elseoud A, Starck T, Remes J, Nikkinen J, Tervonen O, Kiviniemi V (2010). The effect of
model order selection in group PICA. Hum Brain Mapp 31: 1207–16.
Abou Elseoud A, Littow H, Remes J, Starck T, Nikkinen J, Nissilä J, et al (2011). Group-ICA
Model Order Highlights Patterns of Functional Brain Connectivity. Front Syst Neurosci 5:
37.
Abramowitz JS, Taylor S, McKay D (2009). Obsessive-compulsive disorder. Lancet (London,
England) 374: 491–9.
Achard S, Bullmore E (2007). Efficiency and cost of economical brain functional networks.
PLoS Comput Biol 3: e17.
Addis DR, Wong AT, Schacter DL (2007). Remembering the past and imagining the future:
common and distinct neural substrates during event construction and elaboration.
Neuropsychologia 45: 1363–77.
Adey WR, Meyer M (1952). An experimental study of hippocampal afferent pathways from
prefrontal and cingulate areas in the monkey. J Anat 86: 58–74.
Adhikari BM, Goshorn ES, Lamichhane B, Dhamala M (2013). Temporal-order judgment of
audiovisual events involves network activity between parietal and prefrontal cortices. Brain
Connect 3: 536–45.
Admon R, Bleich-Cohen M, Weizmant R, Poyurovsky M, Faragian S, Hendler T (2012).
Functional and structural neural indices of risk aversion in obsessive-compulsive disorder
(OCD). Psychiatry Res 203: 207–13.
Admon R, Nickerson LD, Dillon DG, Holmes AJ, Bogdan R, Kumar P, et al (2015). Dissociable
cortico-striatal connectivity abnormalities in major depression in response to monetary
275
gains and penalties. Psychol Med 45: 121–31.
Agras WS, Walsh T, Fairburn CG, Wilson GT, Kraemer HC (2000). A multicenter comparison
of cognitive-behavioral therapy and interpersonal psychotherapy for bulimia nervosa. Arch
Gen Psychiatry 57: 459–66.
Agüera Z, Riesco N, Jiménez-Murcia S, Islam MA, Granero R, Vicente E, et al (2013).
Cognitive behaviour therapy response and dropout rate across purging and nonpurging
bulimia nervosa and binge eating disorder: DSM-5 implications. BMC Psychiatry 13: 285.
Aguirre I, Carretero B, Ibarra O, Kuhalainen J, Martínez J, Ferrer A, et al (2011). Age predicts
low-frequency transcranial magnetic stimulation efficacy in major depression. J Affect
Disord 130: 466–9.
Ahmari SE, Spellman T, Douglass NL, Kheirbek MA, Simpson HB, Deisseroth K, et al (2013).
Repeated cortico-striatal stimulation generates persistent OCD-like behavior. Science 340:
1234–9.
Aigner M, Treasure J, Kaye W, Kasper S, WFSBP Task Force On Eating Disorders (2011).
World Federation of Societies of Biological Psychiatry (WFSBP) guidelines for the
pharmacological treatment of eating disorders. World J Biol Psychiatry 12: 400–43.
Aigner M, Zitterl W, Prayer D, Demal U, Bach M, Prayer L, et al (2005). Magnetic resonance
imaging in patients with obsessive-compulsive disorder with good versus poor insight.
Psychiatry Res 140: 173–9.
Akerblad A-C, Bengtsson F, Knorring L von, Ekselius L (2006). Response, remission and
relapse in relation to adherence in primary care treatment of depression: a 2-year outcome
study. Int Clin Psychopharmacol 21: 117–24.
Alexander GE, DeLong MR, Strick PL (1986). Parallel organization of functionally segregated
circuits linking basal ganglia and cortex. Annu Rev Neurosci 9: 357–381.
Alexopoulos GS, Hoptman MJ, Kanellopoulos D, Murphy CF, Lim KO, Gunning FM (2012).
Functional connectivity in the cognitive control network and the default mode network in
late-life depression. J Affect Disord 139: 56–65.
Alfaro-Almagro F, Jenkinson M, Bangerter NK, Andersson JLR, Griffanti L, Douaud G, et al
(2018). Image processing and Quality Control for the first 10,000 brain imaging datasets
276
from UK Biobank. Neuroimage 166: 400–424.
Allen GI, Tsukahara N (1974). Cerebrocerebellar communication systems. Physiol Rev 54: 957–
1006.
Alonso J, Petukhova M, Vilagut G, Chatterji S, Heeringa S, Üstün TB, et al (2011). Days out of
role due to common physical and mental conditions: results from the WHO World Mental
Health surveys. Mol Psychiatry 16: 1234–46.
Alonso P, Pujol J, Cardoner N, Benlloch L, Deus J, Menchón JM, et al (2001). Right prefrontal
repetitive transcranial magnetic stimulation in obsessive-compulsive disorder: a double-
blind, placebo-controlled study. Am J Psychiatry 158: 1143–5.
Amassian VE, Cracco RQ, Maccabee PJ, Cracco JB, Rudell A, Eberle L (1989). Suppression of
visual perception by magnetic coil stimulation of human occipital cortex.
Electroencephalogr Clin Neurophysiol 74: 458–62.
American Psychiatric Association (2013). Diagnostic and Statistical Manual of Mental
Disorders, 5th Edition (DSM-5). Diagnostic Stat Man Ment Disord 4th Ed TR
doi:10.1176/appi.books.9780890425596.744053.
Amianto F, D’Agata F, Lavagnino L, Caroppo P, Abbate-Daga G, Righi D, et al (2013). Intrinsic
connectivity networks within cerebellum and beyond in eating disorders. Cerebellum 12:
623–31.
Anderson JS, Druzgal TJ, Lopez-Larson M, Jeong E-K, Desai K, Yurgelun-Todd D (2011).
Network anticorrelations, global regression, and phase-shifted soft tissue correction. Hum
Brain Mapp 32: 919–34.
Anderson RJ, Hoy KE, Daskalakis ZJ, Fitzgerald PB (2016). Repetitive transcranial magnetic
stimulation for treatment resistant depression: Re-establishing connections. Clin
Neurophysiol 127: 3394–3405.
Andrade C, Thyagarajan S (2007). The influence of name on the acceptability of ECT: the
importance of political correctness. J ECT 23: 75–7.
Andreescu C, Tudorascu DL, Butters MA, Tamburo E, Patel M, Price J, et al (2013). Resting
state functional connectivity and treatment response in late-life depression. Psychiatry Res
214: 313–21.
277
Andrews-Hanna JR, Reidler JS, Sepulcre J, Poulin R, Buckner RL (2010). Functional-anatomic
fractionation of the brain’s default network. Neuron 65: 550–62.
Anticevic A, Hu S, Zhang S, Savic A, Billingslea E, Wasylink S, et al (2014). Global resting-
state functional magnetic resonance imaging analysis identifies frontal cortex, striatal, and
cerebellar dysconnectivity in obsessive-compulsive disorder. Biol Psychiatry 75: 595–605.
Arcelus J, Mitchell AJ, Wales J, Nielsen S (2011). Mortality rates in patients with anorexia
nervosa and other eating disorders. A meta-analysis of 36 studies. Arch Gen Psychiatry 68:
724–31.
Argyelan M, Lencz T, Kaliora S, Sarpal DK, Weissman N, Kingsley PB, et al (2016). Subgenual
cingulate cortical activity predicts the efficacy of electroconvulsive therapy. Transl
Psychiatry 6: e789.
Arikuni T, Kubota K (1986). The organization of prefrontocaudate projections and their laminar
origin in the macaque monkey: a retrograde study using HRP-gel. J Comp Neurol 244: 492–
510.
Arns M, Drinkenburg WH, Fitzgerald PB, Kenemans JL (2012). Neurophysiological predictors
of non-response to rTMS in depression. Brain Stimul 5: 569–76.
Aron AR, Fletcher PC, Bullmore ET, Sahakian BJ, Robbins TW (2003). Stop-signal inhibition
disrupted by damage to right inferior frontal gyrus in humans. Nat Neurosci 6: 115–116.
Arslan S, Ktena SI, Makropoulos A, Robinson EC, Rueckert D, Parisot S (2018). Human brain
mapping: A systematic comparison of parcellation methods for the human cerebral cortex.
Neuroimage 170: 5–30.
Atlas LY, Wager TD (2014). A meta-analysis of brain mechanisms of placebo analgesia:
consistent findings and unanswered questions. Handb Exp Pharmacol 225: 37–69.
Atmaca M, Mermi O, Yildirim H, Gurok MG (2016). Orbito-frontal cortex and thalamus
volumes in obsessive-compulsive disorder before and after pharmacotherapy. Brain
Imaging Behav 10: 669–74.
Attwell D, Buchan AM, Charpak S, Lauritzen M, Macvicar BA, Newman EA (2010). Glial and
neuronal control of brain blood flow. Nature 468: 232–43.
Aurich NK, Alves Filho JO, Marques da Silva AM, Franco AR (2015). Evaluating the reliability
278
of different preprocessing steps to estimate graph theoretical measures in resting state fMRI
data. Front Neurosci 9: 48.
Averbeck BB, Lehman J, Jacobson M, Haber SN (2014). Estimates of projection overlap and
zones of convergence within frontal-striatal circuits. J Neurosci 34: 9497–505.
Avissar M, Powell F, Ilieva I, Respino M, Gunning FM, Liston C, et al (2017). Functional
connectivity of the left DLPFC to striatum predicts treatment response of depression to
TMS. Brain Stimul 10: 919–925.
Baek K, Shim WH, Jeong J, Radhakrishnan H, Rosen BR, Boas D, et al (2016). Layer-specific
interhemispheric functional connectivity in the somatosensory cortex of rats: resting state
electrophysiology and fMRI studies. Brain Struct Funct 221: 2801–15.
Baeken C, Marinazzo D, Everaert H, Wu G-R, Hove C Van, Audenaert K, et al (2015). The
Impact of Accelerated HF-rTMS on the Subgenual Anterior Cingulate Cortex in Refractory
Unipolar Major Depression: Insights From 18FDG PET Brain Imaging. Brain Stimul 8:
808–15.
Baeken C, Marinazzo D, Wu G-R, Schuerbeek P Van, Mey J De, Marchetti I, et al (2014).
Accelerated HF-rTMS in treatment-resistant unipolar depression: Insights from subgenual
anterior cingulate functional connectivity. World J Biol Psychiatry 15: 286–97.
Baeken C, Raedt R De, Hove C Van, Clerinx P, Mey J De, Bossuyt A (2009). HF-rTMS
treatment in medication-resistant melancholic depression: results from 18FDG-PET brain
imaging. CNS Spectr 14: 439–48.
Baeken C, Vanderhasselt M-A, Remue J, Herremans S, Vanderbruggen N, Zeeuws D, et al
(2013). Intensive HF-rTMS treatment in refractory medication-resistant unipolar depressed
patients. J Affect Disord 151: 625–31.
Bailer UF, Frank GK, Henry SE, Price JC, Meltzer CC, Mathis CA, et al (2007). Exaggerated 5-
HT1A but normal 5-HT2A receptor activity in individuals ill with anorexia nervosa. Biol
Psychiatry 61: 1090–9.
Bailer UF, Price JC, Meltzer CC, Mathis CA, Frank GK, Weissfeld L, et al (2004). Altered 5-
HT(2A) receptor binding after recovery from bulimia-type anorexia nervosa: relationships
to harm avoidance and drive for thinness. Neuropsychopharmacology 29: 1143–55.

279
Bailer UF, Price JC, Meltzer CC, Wagner A, Mathis CA, Gamst A, et al (2017). Dopaminergic
activity and altered reward modulation in anorexia nervosa-insight from multimodal
imaging. Int J Eat Disord 50: 593–596.
Bair MJ, Robinson RL, Katon W, Kroenke K (2003). Depression and pain comorbidity: a
literature review. Arch Intern Med 163: 2433–45.
Bajbouj M, Brakemeier E-L, Schubert F, Lang UE, Neu P, Schindowski C, et al (2005).
Repetitive transcranial magnetic stimulation of the dorsolateral prefrontal cortex and
cortical excitability in patients with major depressive disorder. Exp Neurol 196: 332–8.
Bakker N, Shahab S, Giacobbe P, Blumberger DM, Daskalakis ZJ, Kennedy SH, et al (2015).
rTMS of the dorsomedial prefrontal cortex for major depression: safety, tolerability,
effectiveness, and outcome predictors for 10 Hz versus intermittent theta-burst stimulation.
Brain Stimul 8: 208–15.
Balodis IM, Molina ND, Kober H, Worhunsky PD, White MA, Rajita Sinha, et al (2013).
Divergent neural substrates of inhibitory control in binge eating disorder relative to other
manifestations of obesity. Obesity (Silver Spring) 21: 367–77.
Bamford B, Sly R (2010). Exploring quality of life in the eating disorders. Eur Eat Disord Rev
18: 147–53.
Bandelow B, Zohar J, Hollander E, Kasper S, Möller H-J, WFSBP Task Force on Treatment
Guidelines for Anxiety O-C and P-TSD, et al (2008). World Federation of Societies of
Biological Psychiatry (WFSBP) guidelines for the pharmacological treatment of anxiety,
obsessive-compulsive and post-traumatic stress disorders - first revision. World J Biol
Psychiatry 9: 248–312.
Bär K-J, la Cruz F de, Berger S, Schultz CC, Wagner G (2015). Structural and functional
differences in the cingulate cortex relate to disease severity in anorexia nervosa. J
Psychiatry Neurosci 40: 269–79.
Barbas H, Ghashghaei H, Dombrowski SM, Rempel-Clower NL (1999). Medial prefrontal
cortices are unified by common connections with superior temporal cortices and
distinguished by input from memory-related areas in the rhesus monkey. J Comp Neurol
410: 343–67.
280
Barbas H, Saha S, Rempel-Clower N, Ghashghaei T (2003). Serial pathways from primate
prefrontal cortex to autonomic areas may influence emotional expression. BMC Neurosci 4:
25.
Bartholdy S, McClelland J, Kekic M, O’Daly OG, Campbell IC, Werthmann J, et al (2015).
Clinical outcomes and neural correlates of 20 sessions of repetitive transcranial magnetic
stimulation in severe and enduring anorexia nervosa (the TIARA study): study protocol for
a randomised controlled feasibility trial. Trials 16: 548.
Bartova L, Meyer BM, Diers K, Rabl U, Scharinger C, Popovic A, et al (2015). Reduced default
mode network suppression during a working memory task in remitted major depression. J
Psychiatr Res 64: 9–18.
Bassett DS, Wymbs NF, Porter MA, Mucha PJ, Carlson JM, Grafton ST (2011). Dynamic
reconfiguration of human brain networks during learning. Proc Natl Acad Sci U S A 108:
7641–6.
Baumgartner R, Somorjai R, Summers R, Richter W (1999). Assessment of cluster homogeneity
in fMRI data using Kendall’s coefficient of concordance. Magn Reson Imaging 17: 1525–
32.
Baxter LR, Schwartz JM, Phelps ME, Mazziotta JC, Guze BH, Selin CE, et al (1989). Reduction
of prefrontal cortex glucose metabolism common to three types of depression. Arch Gen
Psychiatry 46: 243–50.
Baxter MG, Parker A, Lindner CC, Izquierdo AD, Murray EA (2000). Control of response
selection by reinforcer value requires interaction of amygdala and orbital prefrontal cortex.
J Neurosci 20: 4311–9.
Beall EB, Lowe MJ (2010). The non-separability of physiologic noise in functional connectivity
MRI with spatial ICA at 3T. J Neurosci Methods 191: 263–76.
Beaty RE, Benedek M, Kaufman SB, Silvia PJ (2015). Default and Executive Network Coupling
Supports Creative Idea Production. Sci Rep 5: 10964.
Bechara A, Tranel D, Damasio H (2000). Characterization of the decision-making deficit of
patients with ventromedial prefrontal cortex lesions. Brain 123 ( Pt 1: 2189–202.
Beck AT, Epstein N, Brown G, Steer RA (1988). An inventory for measuring clinical anxiety:
281
Psychometric properties. J Consult Clin Psychol 56: 893–897.
Beck AT, Steer RA, Ball R, Ranieri W (1996). Comparison of Beck Depression Inventories -IA
and -II in psychiatric outpatients. J Pers Assess 67: 588–97.
Beck AT, Ward CH, Mendelson M, Mock J, Erbaugh J (1961). An inventory for measuring
depression. Arch Gen Psychiatry 4: 561–71.
Beckmann CF (2012). Modelling with independent components. Neuroimage 62: 891–901.
Beckmann CF, DeLuca M, Devlin JT, Smith SM (2005). Investigations into resting-state
connectivity using independent component analysis. Philos Trans R Soc Lond B Biol Sci
360: 1001–13.
Beckmann CF, Jenkinson M, Smith SM (2003). General multilevel linear modeling for group
analysis in FMRI. Neuroimage 20: 1052–63.
Behrens TEJ, Johansen-Berg H, Woolrich MW, Smith SM, Wheeler-Kingshott CAM, Boulby
PA, et al (2003). Non-invasive mapping of connections between human thalamus and
cortex using diffusion imaging. Nat Neurosci 6: 750–757.
Behzadi Y, Restom K, Liau J, Liu TT (2007a). A component based noise correction method
(CompCor) for BOLD and perfusion based fMRI. Neuroimage 37: 90–101.
Behzadi Y, Restom K, Liau J, Liu TT (2007b). A component based noise correction method
(CompCor) for BOLD and perfusion based fMRI. Neuroimage 37: 90–101.
Belleau EL, Taubitz LE, Larson CL (2015). Imbalance of default mode and regulatory networks
during externally focused processing in depression. Soc Cogn Affect Neurosci 10: 744–51.
Belliveau JW, Kennedy DN, McKinstry RC, Buchbinder BR, Weisskoff RM, Cohen MS, et al
(1991). Functional mapping of the human visual cortex by magnetic resonance imaging.
Science 254: 716–9.
Benali A, Trippe J, Weiler E, Mix A, Petrasch-Parwez E, Girzalsky W, et al (2011). Theta-Burst
Transcranial Magnetic Stimulation Alters Cortical Inhibition. J Neurosci 31: 1193–1203.
Benjamini Y, Hochberg Y (1995). Controlling the false discovery rate: a practical and powerful
approach to multiple testing. J R Stat Soc B 57: 289–300.
Bennett CM, Miller MB (2010). How reliable are the results from functional magnetic resonance
282
imaging? Ann N Y Acad Sci 1191: 133–55.
Berg KC, Peterson CB, Frazier P, Crow SJ (2012). Psychometric evaluation of the eating
disorder examination and eating disorder examination-questionnaire: a systematic review of
the literature. Int J Eat Disord 45: 428–38.
Berger H (1929). Über das Elektrenkephalogramm des Menschen. Arch Psychiatr Nervenkr 87:
527–570.
Berkman ND, Lohr KN, Bulik CM (2007). Outcomes of eating disorders: a systematic review of
the literature. Int J Eat Disord 40: 293–309.
Berlim MT, Eynde F van den, Tovar-Perdomo S, Daskalakis ZJ (2014). Response, remission and
drop-out rates following high-frequency repetitive transcranial magnetic stimulation (rTMS)
for treating major depression: a systematic review and meta-analysis of randomized,
double-blind and sham-controlled trials. Psychol Med 44: 225–39.
Berlim MT, McGirr A, Rodrigues Dos Santos N, Tremblay S, Martins R (2017). Efficacy of
theta burst stimulation (TBS) for major depression: An exploratory meta-analysis of
randomized and sham-controlled trials. J Psychiatr Res 90: 102–109.
Berlim MT, Neufeld NH, Eynde F Van den (2013). Repetitive transcranial magnetic stimulation
(rTMS) for obsessive-compulsive disorder (OCD): an exploratory meta-analysis of
randomized and sham-controlled trials. J Psychiatr Res 47: 999–1006.
Berlim MT, Turecki G (2007). Definition, assessment, and staging of treatment-resistant
refractory major depression: a review of current concepts and methods. Can J Psychiatry
52: 46–54.
Bermpohl F, Walter M, Sajonz B, Lücke C, Hägele C, Sterzer P, et al (2009). Attentional
modulation of emotional stimulus processing in patients with major depression--alterations
in prefrontal cortical regions. Neurosci Lett 463: 108–13.
Berner LA, Marsh R (2014). Frontostriatal circuits and the development of bulimia nervosa.
Front Behav Neurosci 8: 395.
Bernstein GA, Mueller BA, Schreiner MW, Campbell SM, Regan EK, Nelson PM, et al (2016).
Abnormal striatal resting-state functional connectivity in adolescents with obsessive-
compulsive disorder. Psychiatry Res 247: 49–56.
283
Berntson GG, Norman GJ, Bechara A, Bruss J, Tranel D, Cacioppo JT (2011). The insula and
evaluative processes. Psychol Sci 22: 80–6.
Beucke JC, Kaufmann C, Linnman C, Gruetzmann R, Endrass T, Deckersbach T, et al (2012).
Altered cingulostriatal coupling in obsessive-compulsive disorder. Brain Connect 2: 191–
202.
Beucke JC, Sepulcre J, Talukdar T, Linnman C, Zschenderlein K, Endrass T, et al (2013).
Abnormally high degree connectivity of the orbitofrontal cortex in obsessive-compulsive
disorder. JAMA psychiatry 70: 619–29.
Bhagalia R, Kim B (2008). Spin saturation artifact correction using slice-to-volume registration
motion estimates for fMRI time series. Med Phys 35: 424–34.
Biezonski D, Cha J, Steinglass J, Posner J (2016). Evidence for Thalamocortical Circuit
Abnormalities and Associated Cognitive Dysfunctions in Underweight Individuals with
Anorexia Nervosa. Neuropsychopharmacology 41: 1560–8.
Binder JR, Liebenthal E, Possing ET, Medler DA, Ward BD (2004). Neural correlates of sensory
and decision processes in auditory object identification. Nat Neurosci 7: 295–301.
Birbaumer N, Elbert T, Canavan AG, Rockstroh B (1990). Slow potentials of the cerebral cortex
and behavior. Physiol Rev 70: 1–41.
Birn RM (2012). The role of physiological noise in resting-state functional connectivity.
Neuroimage 62: 864–70.
Birn RM, Diamond JB, Smith MA, Bandettini PA (2006). Separating respiratory-variation-
related fluctuations from neuronal-activity-related fluctuations in fMRI. Neuroimage 31:
1536–48.
Birnbaum HG, Kessler RC, Kelley D, Ben-Hamadi R, Joish VN, Greenberg PE (2010).
Employer burden of mild, moderate, and severe major depressive disorder: mental health
services utilization and costs, and work performance. Depress Anxiety 27: 78–89.
Bischoff-Grethe A, McCurdy D, Grenesko-Stevens E, Irvine LEZ, Wagner A, Yau W-YW, et al
(2013). Altered brain response to reward and punishment in adolescents with Anorexia
nervosa. Psychiatry Res 214: 331–40.
Bisley JW, Goldberg ME (2003). Neuronal activity in the lateral intraparietal area and spatial
284
attention. Science 299: 81–6.
Biswal B, DeYoe EA, Hyde JS (1996). Reduction of physiological fluctuations in fMRI using
digital filters. Magn Reson Med 35: 107–13.
Biswal B, Hudetz AG, Yetkin FZ, Haughton VM, Hyde JS (1997). Hypercapnia reversibly
suppresses low-frequency fluctuations in the human motor cortex during rest using echo-
planar MRI. J Cereb Blood Flow Metab 17: 301–8.
Biswal B, Yetkin FZ, Haughton VM, Hyde JS (1995). Functional connectivity in the motor
cortex of resting human brain using echo-planar MRI. Magn Reson Med 34: 537–41.
Bloch MH, McGuire J, Landeros-Weisenberger A, Leckman JF, Pittenger C (2010). Meta-
analysis of the dose-response relationship of SSRI in obsessive-compulsive disorder. Mol
Psychiatry 15: 850–5.
Blumberger DM, Vila-Rodriguez F, Thorpe KE, Feffer K, Noda Y, Giacobbe P, et al (2018).
Effectiveness of theta burst versus high-frequency repetitive transcranial magnetic
stimulation in patients with depression (THREE-D): a randomised non-inferiority trial.
Lancet (London, England) 391: 1683–1692.
Boelema SR, Harakeh Z, Zandvoort MJE van, Reijneveld SA, Verhulst FC, Ormel J, et al
(2016). Executive functioning before and after onset of alcohol use disorder in adolescence.
A TRAILS study. J Psychiatr Res 78: 78–85.
Boes AD, Grafft AH, Joshi C, Chuang NA, Nopoulos P, Anderson SW (2011). Behavioral
effects of congenital ventromedial prefrontal cortex malformation. BMC Neurol 11: 151.
Bohon C, Stice E (2011). Reward abnormalities among women with full and subthreshold
bulimia nervosa: a functional magnetic resonance imaging study. Int J Eat Disord 44: 585–
95.
Boorman ED, O’Doherty JP, Adolphs R, Rangel A (2013). The behavioral and neural
mechanisms underlying the tracking of expertise. Neuron 80: 1558–71.
Bora E, Fornito A, Pantelis C, Yücel M (2012a). Gray matter abnormalities in Major Depressive
Disorder: a meta-analysis of voxel based morphometry studies. J Affect Disord 138: 9–18.
Bora E, Fornito A, Yücel M, Pantelis C (2012b). The effects of gender on grey matter
abnormalities in major psychoses: a comparative voxelwise meta-analysis of schizophrenia
285
and bipolar disorder. Psychol Med 42: 295–307.
Bora E, Harrison BJ, Davey CG, Yücel M, Pantelis C (2012c). Meta-analysis of volumetric
abnormalities in cortico-striatal-pallidal-thalamic circuits in major depressive disorder.
Psychol Med 42: 671–81.
Bora E, Murray RM (2014). Meta-analysis of cognitive deficits in ultra-high risk to psychosis
and first-episode psychosis: do the cognitive deficits progress over, or after, the onset of
psychosis? Schizophr Bull 40: 744–55.
Boubela RN, Kalcher K, Huf W, Kronnerwetter C, Filzmoser P, Moser E (2013). Beyond Noise:
Using Temporal ICA to Extract Meaningful Information from High-Frequency fMRI Signal
Fluctuations during Rest. Front Hum Neurosci 7: 168.
Bourne SK, Eckhardt CA, Sheth SA, Eskandar EN (2012). Mechanisms of deep brain
stimulation for obsessive compulsive disorder: effects upon cells and circuits. Front Integr
Neurosci 6: 29.
Boyacioglu R, Beckmann CF, Barth M (2013). An Investigation of RSN Frequency Spectra
Using Ultra-Fast Generalized Inverse Imaging. Front Hum Neurosci 7: 156.
Brakemeier E-L, Luborzewski A, Danker-Hopfe H, Kathmann N, Bajbouj M (2007). Positive
predictors for antidepressive response to prefrontal repetitive transcranial magnetic
stimulation (rTMS). J Psychiatr Res 41: 395–403.
Brand M, Franke-Sievert C, Jacoby GE, Markowitsch HJ, Tuschen-Caffier B (2007).
Neuropsychological correlates of decision making in patients with bulimia nervosa.
Neuropsychology 21: 742–50.
Brass M, Derrfuss J, Forstmann B, Cramon DY von (2005). The role of the inferior frontal
junction area in cognitive control. Trends Cogn Sci 9: 314–6.
Brass M, Haggard P (2007). To do or not to do: the neural signature of self-control. J Neurosci
27: 9141–5.
Brody AL, Saxena S, Mandelkern MA, Fairbanks LA, Ho ML, Baxter LR (2001). Brain
metabolic changes associated with symptom factor improvement in major depressive
disorder. Biol Psychiatry 50: 171–8.
Broft A, Shingleton R, Kaufman J, Liu F, Kumar D, Slifstein M, et al (2012). Striatal dopamine
286
in bulimia nervosa: a PET imaging study. Int J Eat Disord 45: 648–56.
Brookes MJ, Woolrich M, Luckhoo H, Price D, Hale JR, Stephenson MC, et al (2011).
Investigating the electrophysiological basis of resting state networks using
magnetoencephalography. Proc Natl Acad Sci U S A 108: 16783–8.
Brown GG, Perthen JE, Liu TT, Buxton RB (2007). A Primer on Functional Magnetic
Resonance Imaging. Neuropsychol Rev 17: 107–125.
Bruce KR, Steiger H (2005). Treatment implications of Axis-II comorbidity in eating disorders.
Eat Disord 13: 93–108.
Brunelin J, Jalenques I, Trojak B, Attal J, Szekely D, Gay A, et al (2014). The efficacy and
safety of low frequency repetitive transcranial magnetic stimulation for treatment-resistant
depression: the results from a large multicenter French RCT. Brain Stimul 7: 855–63.
Brunoni AR, Moffa AH, Fregni F, Palm U, Padberg F, Blumberger DM, et al (2016).
Transcranial direct current stimulation for acute major depressive episodes: meta-analysis of
individual patient data. Br J Psychiatry 208: 522–31.
Brunoni AR, Valiengo L, Baccaro A, Zanão TA, Oliveira JF de, Goulart A, et al (2013). The
sertraline vs. electrical current therapy for treating depression clinical study: results from a
factorial, randomized, controlled trial. JAMA psychiatry 70: 383–91.
Bryant-Waugh R, Hankins M, Shafran R, Lask B, Fosson A (1996). A prospective follow-up of
children with anorexia nervosa. J Youth Adolesc 25: 431–437.
Buckner RL (2012). The serendipitous discovery of the brain’s default network. Neuroimage 62:
1137–45.
Buckner RL, Andrews-Hanna JR, Schacter DL (2008). The brain’s default network: anatomy,
function, and relevance to disease. Ann N Y Acad Sci 1124: 1–38.
Buckner RL, Krienen FM, Castellanos A, Diaz JC, Yeo BTT (2011). The organization of the
human cerebellum estimated by intrinsic functional connectivity. J Neurophysiol 106:
2322–45.
Buckner RL, Sepulcre J, Talukdar T, Krienen FM, Liu H, Hedden T, et al (2009). Cortical hubs
revealed by intrinsic functional connectivity: mapping, assessment of stability, and relation
to Alzheimer’s disease. J Neurosci 29: 1860–73.
287
Bulik CM, Sullivan PF, Carter FA, McIntosh V V, Joyce PR (1999). Predictors of rapid and
sustained response to cognitive-behavioral therapy for bulimia nervosa. Int J Eat Disord 26:
137–44.
Bulik CM, Sullivan PF, Joyce PR, Carter FA, McIntosh V V (1998a). Predictors of 1-year
treatment outcome in bulimia nervosa. Compr Psychiatry 39: 206–14.
Bulik CM, Sullivan PF, Kendler KS (1998b). Heritability of binge-eating and broadly defined
bulimia nervosa. Biol Psychiatry 44: 1210–8.
Bulik CM, Sullivan PF, Tozzi F, Furberg H, Lichtenstein P, Pedersen NL (2006). Prevalence,
heritability, and prospective risk factors for anorexia nervosa. Arch Gen Psychiatry 63:
305–12.
Bullmore E, Sporns O (2009). Complex brain networks: graph theoretical analysis of structural
and functional systems. Nat Rev Neurosci 10: 186–98.
Bushara KO, Grafman J, Hallett M (2001). Neural correlates of auditory-visual stimulus onset
asynchrony detection. J Neurosci 21: 300–4.
Butts CT (2009). Revisiting the foundations of network analysis. Science 325: 414–6.
Buzsáki G, Draguhn A (2004). Neuronal oscillations in cortical networks. Science 304: 1926–9.
Caballero-Gaudes C, Reynolds RC (2017). Methods for cleaning the BOLD fMRI signal.
Neuroimage 154: 128–149.
Cabral J, Hugues E, Sporns O, Deco G (2011). Role of local network oscillations in resting-state
functional connectivity. Neuroimage 57: 130–9.
Cai W, Chen T, Ryali S, Kochalka J, Li C-SR, Menon V (2016). Causal Interactions Within a
Frontal-Cingulate-Parietal Network During Cognitive Control: Convergent Evidence from a
Multisite-Multitask Investigation. Cereb Cortex 26: 2140–53.
Calhoun VD, Adali T, Pearlson GD, Pekar JJ (2001). Spatial and temporal independent
component analysis of functional MRI data containing a pair of task-related waveforms.
Hum Brain Mapp 13: 43–53.
Calhoun VD, Liu J, Adali T (2009). A review of group ICA for fMRI data and ICA for joint
inference of imaging, genetic, and ERP data. Neuroimage 45: S163-72.
288
Calvert GA (2001). Crossmodal processing in the human brain: insights from functional
neuroimaging studies. Cereb Cortex 11: 1110–23.
Calzavara R, Mailly P, Haber SN (2007). Relationship between the corticostriatal terminals from
areas 9 and 46, and those from area 8A, dorsal and rostral premotor cortex and area 24c: an
anatomical substrate for cognition to action. Eur J Neurosci 26: 2005–24.
Campbell-Meiklejohn DK, Woolrich MW, Passingham RE, Rogers RD (2008). Knowing when
to stop: the brain mechanisms of chasing losses. Biol Psychiatry 63: 293–300.
Canna A, Prinster A, Monteleone AM, Cantone E, Monteleone P, Volpe U, et al (2017).
Interhemispheric functional connectivity in anorexia and bulimia nervosa. Eur J Neurosci
45: 1129–1140.
Canolty RT, Knight RT (2010). The functional role of cross-frequency coupling. Trends Cogn
Sci 14: 506–15.
Cárdenas-Morales L, Nowak DA, Kammer T, Wolf RC, Schönfeldt-Lecuona C (2010).
Mechanisms and applications of theta-burst rTMS on the human motor cortex. Brain
Topogr 22: 294–306.
Cárdenas-Morales L, Volz LJ, Michely J, Rehme AK, Pool E-M, Nettekoven C, et al (2014).
Network connectivity and individual responses to brain stimulation in the human motor
system. Cereb Cortex 24: 1697–707.
Carew CL, Milne AM, Tatham EL, MacQueen GM, Hall GBC (2013). Neural systems
underlying thought suppression in young women with, and at-risk, for depression. Behav
Brain Res 257: 13–24.
Carpenter LL, Janicak PG, Aaronson ST, Boyadjis T, Brock DG, Cook IA, et al (2012).
Transcranial magnetic stimulation (TMS) for major depression: a multisite, naturalistic,
observational study of acute treatment outcomes in clinical practice. Depress Anxiety 29:
587–96.
Carpenter MB, Nakano K, Kim R (1976). Nigrothalamic projections in the monkey
demonstrated by autoradiographic technics. J Comp Neurol 165: 401–15.
Carragher N, Teesson M, Sunderland M, Newton NC, Krueger RF, Conrod PJ, et al (2016). The
structure of adolescent psychopathology: a symptom-level analysis. Psychol Med 46: 981–
289
94.
Carter JC, Blackmore E, Sutandar-Pinnock K, Woodside DB (2004). Relapse in anorexia
nervosa: a survival analysis. Psychol Med 34: 671–9.
Carter JC, Mercer-Lynn KB, Norwood SJ, Bewell-Weiss C V, Crosby RD, Woodside DB, et al
(2012). A prospective study of predictors of relapse in anorexia nervosa: implications for
relapse prevention. Psychiatry Res 200: 518–23.
Carver CS, White TL (1994). Behavioral inhibition, behavioral activation, and affective
responses to impending reward and punishment: The BIS/BAS Scales. J Pers Soc Psychol
67: 319–333.
Cauda F, Cavanna AE, D’agata F, Sacco K, Duca S, Geminiani GC (2011). Functional
connectivity and coactivation of the nucleus accumbens: a combined functional connectivity
and structure-based meta-analysis. J Cogn Neurosci 23: 2864–77.
Cauda F, Costa T, Torta DME, Sacco K, D’Agata F, Duca S, et al (2012). Meta-analytic
clustering of the insular cortex: characterizing the meta-analytic connectivity of the insula
when involved in active tasks. Neuroimage 62: 343–55.
Cavada C (2000). The Anatomical Connections of the Macaque Monkey Orbitofrontal Cortex. A
Review. Cereb Cortex 10: 220–242.
Cavada C, Goldman-Rakic PS (1989). Posterior parietal cortex in rhesus monkey: I. Parcellation
of areas based on distinctive limbic and sensory corticocortical connections. J Comp Neurol
287: 393–421.
Cavanna AE, Trimble MR (2006). The precuneus: a review of its functional anatomy and
behavioural correlates. Brain 129: 564–83.
Celone KA, Thompson-Brenner H, Ross RS, Pratt EM, Stern CE (2011). An fMRI investigation
of the fronto-striatal learning system in women who exhibit eating disorder behaviors.
Neuroimage 56: 1749–57.
Chai XJ, Castañón AN, Ongür D, Whitfield-Gabrieli S (2012). Anticorrelations in resting state
networks without global signal regression. Neuroimage 59: 1420–8.
Chan AW, Mohajerani MH, LeDue JM, Wang YT, Murphy TH (2015). Mesoscale infraslow
spontaneous membrane potential fluctuations recapitulate high-frequency activity cortical
290
motifs. Nat Commun 6: 7738.
Chan TWS, Ahn W-Y, Bates JE, Busemeyer JR, Guillaume S, Redgrave GW, et al (2014).
Differential impairments underlying decision making in anorexia nervosa and bulimia
nervosa: a cognitive modeling analysis. Int J Eat Disord 47: 157–67.
Chang C, Glover GH (2009). Effects of model-based physiological noise correction on default
mode network anti-correlations and correlations. Neuroimage 47: 1448–59.
Chang C, Glover GH (2010). Time-frequency dynamics of resting-state brain connectivity
measured with fMRI. Neuroimage 50: 81–98.
Chang LJ, Yarkoni T, Khaw MW, Sanfey AG (2013). Decoding the role of the insula in human
cognition: functional parcellation and large-scale reverse inference. Cereb Cortex 23: 739–
49.
Chang M, Womer FY, Edmiston EK, Bai C, Zhou Q, Jiang X, et al (2018). Neurobiological
Commonalities and Distinctions Among Three Major Psychiatric Diagnostic Categories: A
Structural MRI Study. Schizophr Bull 44: 65–74.
Chantiluke K, Halari R, Simic M, Pariante CM, Papadopoulos A, Giampietro V, et al (2012).
Fronto-striato-cerebellar dysregulation in adolescents with depression during motivated
attention. Biol Psychiatry 71: 59–67.
Charlson F, Siskind D, Doi SAR, McCallum E, Broome A, Lie DC (2012). ECT efficacy and
treatment course: a systematic review and meta-analysis of twice vs thrice weekly
schedules. J Affect Disord 138: 1–8.
Chavis DA, Pandya DN (1976). Further observations on corticofrontal connections in the rhesus
monkey. Brain Res 117: 369–386.
Chen JE, Glover GH (2015). BOLD fractional contribution to resting-state functional
connectivity above 0.1 Hz. Neuroimage 107: 207–218.
Chen JE, Jahanian H, Glover GH (2017). Nuisance Regression of High-Frequency Functional
Magnetic Resonance Imaging Data: Denoising Can Be Noisy. Brain Connect 7: 13–24.
Chen R, Classen J, Gerloff C, Celnik P, Wassermann EM, Hallett M, et al (1997). Depression of
motor cortex excitability by low-frequency transcranial magnetic stimulation. Neurology
48: 1398–403.
291
Chen S, Ross TJ, Zhan W, Myers CS, Chuang K-S, Heishman SJ, et al (2008). Group
independent component analysis reveals consistent resting-state networks across multiple
sessions. Brain Res 1239: 141–51.
Chen T, Michels L, Supekar K, Kochalka J, Ryali S, Menon V (2015). Role of the anterior
insular cortex in integrative causal signaling during multisensory auditory-visual attention.
Eur J Neurosci 41: 264–74.
Chen X, Pereira F, Lee W, Strother S, Mitchell T (2006). Exploring predictive and reproducible
modeling with the single-subject FIAC dataset. Hum Brain Mapp 27: 452–61.
Chen Y, Meng X, Hu Q, Cui H, Ding Y, Kang L, et al (2016). Altered resting-state functional
organization within the central executive network in obsessive-compulsive disorder.
Psychiatry Clin Neurosci 70: 448–456.
Cheng W, Rolls ET, Gu H, Zhang J, Feng J (2015). Autism: reduced connectivity between
cortical areas involved in face expression, theory of mind, and the sense of self. Brain 138:
1382–93.
Cheng W, Rolls ET, Qiu J, Liu W, Tang Y, Huang C-C, et al (2016). Medial reward and lateral
non-reward orbitofrontal cortex circuits change in opposite directions in depression. Brain
139: 3296–3309.
Cheng W, Rolls ET, Qiu J, Xie X, Wei D, Huang C-C, et al (2018). Increased functional
connectivity of the posterior cingulate cortex with the lateral orbitofrontal cortex in
depression. Transl Psychiatry 8: 90.
Cheng Y, Xu J, Nie B, Luo C, Yang T, Li H, et al (2013). Abnormal resting-state activities and
functional connectivities of the anterior and the posterior cortexes in medication-naïve
patients with obsessive-compulsive disorder. PLoS One 8: e67478.
Chikama M, McFarland NR, Amaral DG, Haber SN (1997). Insular cortical projections to
functional regions of the striatum correlate with cortical cytoarchitectonic organization in
the primate. J Neurosci 17: 9686–705.
Chistyakov A V, Kreinin B, Marmor S, Kaplan B, Khatib A, Darawsheh N, et al (2015).
Preliminary assessment of the therapeutic efficacy of continuous theta-burst magnetic
stimulation (cTBS) in major depression: a double-blind sham-controlled study. J Affect
292
Disord 170: 225–9.
Chistyakov A V, Rubicsek O, Kaplan B, Zaaroor M, Klein E (2010). Safety, tolerability and
preliminary evidence for antidepressant efficacy of theta-burst transcranial magnetic
stimulation in patients with major depression. Int J Neuropsychopharmacol 13: 387–393.
Cho SS, Koshimori Y, Aminian K, Obeso I, Rusjan P, Lang AE, et al (2015). Investing in the
future: stimulation of the medial prefrontal cortex reduces discounting of delayed rewards.
Neuropsychopharmacology 40: 546–53.
Cho SS, Pellecchia G, Aminian K, Ray N, Segura B, Obeso I, et al (2013). Morphometric
correlation of impulsivity in medial prefrontal cortex. Brain Topogr 26: 479–87.
Choi EY, Yeo BTT, Buckner RL (2012). The organization of the human striatum estimated by
intrinsic functional connectivity. J Neurophysiol 108: 2242–63.
Choi KM, Jang K-M, Jang KI, Um YH, Kim M-S, Kim D-W, et al (2014). The effects of 3
weeks of rTMS treatment on P200 amplitude in patients with depression. Neurosci Lett 577:
22–7.
Chouinard PA, Paus T (2010). What have We Learned from “Perturbing” the Human Cortical
Motor System with Transcranial Magnetic Stimulation? Front Hum Neurosci 4: 173.
Christakou A, Robbins TW, Everitt BJ (2004). Prefrontal cortical-ventral striatal interactions
involved in affective modulation of attentional performance: implications for corticostriatal
circuit function. J Neurosci 24: 773–80.
Ciobanu C, Girard M, Marin B, Labrunie A, Malauzat D (2013). rTMS for pharmacoresistant
major depression in the clinical setting of a psychiatric hospital: Effectiveness and effects of
age. J Affect Disord 150: 677–681.
Cirillo G, Pino G Di, Capone F, Ranieri F, Florio L, Todisco V, et al (2017). Neurobiological
after-effects of non-invasive brain stimulation. Brain Stimul 10: 1–18.
Claudino AM, Eynde F Van den, Stahl D, Dew T, Andiappan M, Kalthoff J, et al (2011).
Repetitive transcranial magnetic stimulation reduces cortisol concentrations in bulimic
disorders. Psychol Med 41: 1329–36.
Claudino AM, Oliveira IR de, Appolinario JC, Cordás TA, Duchesne M, Sichieri R, et al (2007).
Double-blind, randomized, placebo-controlled trial of topiramate plus cognitive-behavior
293
therapy in binge-eating disorder. J Clin Psychiatry 68: 1324–32.
Clausen L (2008). Time to remission for eating disorder patients: a 2(1/2)-year follow-up study
of outcome and predictors. Nord J Psychiatry 62: 151–9.
Cloutman LL, Binney RJ, Drakesmith M, Parker GJM, Lambon Ralph MA (2012). The variation
of function across the human insula mirrors its patterns of structural connectivity: evidence
from in vivo probabilistic tractography. Neuroimage 59: 3514–21.
Clower DM, West RA, Lynch JC, Strick PL (2001). The inferior parietal lobule is the target of
output from the superior colliculus, hippocampus, and cerebellum. J Neurosci 21: 6283–91.
Cocchi L, Harrison BJ, Pujol J, Harding IH, Fornito A, Pantelis C, et al (2012). Functional
alterations of large-scale brain networks related to cognitive control in obsessive-
compulsive disorder. Hum Brain Mapp 33: 1089–106.
Cohen LG, Roth BJ, Nilsson J, Dang N, Panizza M, Bandinelli S, et al (1990). Effects of coil
design on delivery of focal magnetic stimulation. Technical considerations.
Electroencephalogr Clin Neurophysiol 75: 350–7.
Cohen RB, Boggio PS, Fregni F (2009). Risk factors for relapse after remission with repetitive
transcranial magnetic stimulation for the treatment of depression. Depress Anxiety 26: 682–
8.
Cole DM, Smith SM, Beckmann CF (2010a). Advances and pitfalls in the analysis and
interpretation of resting-state FMRI data. Front Syst Neurosci 4: 8.
Cole MW, Bassett DS, Power JD, Braver TS, Petersen SE (2014). Intrinsic and task-evoked
network architectures of the human brain. Neuron 83: 238–51.
Cole MW, Pathak S, Schneider W (2010b). Identifying the brain’s most globally connected
regions. Neuroimage 49: 3132–48.
Cole MW, Reynolds JR, Power JD, Repovs G, Anticevic A, Braver TS (2013). Multi-task
connectivity reveals flexible hubs for adaptive task control. Nat Neurosci 16: 1348–55.
Cole MW, Schneider W (2007). The cognitive control network: Integrated cortical regions with
dissociable functions. Neuroimage 37: 343–60.
Connolly KR, Helmer A, Cristancho MA, Cristancho P, O’Reardon JP (2012). Effectiveness of
Transcranial Magnetic Stimulation in Clinical Practice Post-FDA Approval in the United
294
States. J Clin Psychiatry 73: e567–e573.
Cook IA, Schrader LM, Degiorgio CM, Miller PR, Maremont ER, Leuchter AF (2013).
Trigeminal nerve stimulation in major depressive disorder: acute outcomes in an open pilot
study. Epilepsy Behav 28: 221–6.
Cooney RE, Joormann J, Eugène F, Dennis EL, Gotlib IH (2010). Neural correlates of
rumination in depression. Cogn Affect Behav Neurosci 10: 470–8.
Cooper Z, Cooper PJ, Fairburn CG (1989). The validity of the eating disorder examination and
its subscales. Br J Psychiatry 154: 807–12.
Corbetta M, Patel G, Shulman GL (2008). The reorienting system of the human brain: from
environment to theory of mind. Neuron 58: 306–24.
Corbetta M, Shulman GL (2002). Control of goal-directed and stimulus-driven attention in the
brain. Nat Rev Neurosci 3: 201–15.
Cordes D, Haughton VM, Arfanakis K, Carew JD, Turski PA, Moritz CH, et al (2001).
Frequencies contributing to functional connectivity in the cerebral cortex in “resting-state”
data. AJNR Am J Neuroradiol 22: 1326–33.
Costa PT, R. M (Psychological Assessment Resources: 1992). Revised NEO personality
inventory (NEO PI-R) and NEO five-factor inventory (NEO-FFI): Professional manual. .
Coutinho J, Ramos AF, Maia L, Castro L, Conceição E, Geliebter A, et al (2015). Volumetric
alterations in the nucleus accumbens and caudate nucleus in bulimia nervosa: a structural
magnetic resonance imaging study. Int J Eat Disord 48: 206–14.
Cowdrey FA, Filippini N, Park RJ, Smith SM, McCabe C (2014). Increased resting state
functional connectivity in the default mode network in recovered anorexia nervosa. Hum
Brain Mapp 35: 483–91.
Cowdrey FA, Park RJ, Harmer CJ, McCabe C (2011). Increased neural processing of rewarding
and aversive food stimuli in recovered anorexia nervosa. Biol Psychiatry 70: 736–43.
Cox RW, Jesmanowicz A (1999). Real-time 3D image registration for functional MRI. Magn
Reson Med 42: 1014–8.
Craddock RC, Holtzheimer PE, Hu XP, Mayberg HS (2009). Disease state prediction from
resting state functional connectivity. Magn Reson Med 62: 1619–28.
295
Craddock RC, James GA, Holtzheimer PE, Hu XP, Mayberg HS (2012a). A whole brain fMRI
atlas generated via spatially constrained spectral clustering. Hum Brain Mapp 33: 1914–28.
Craddock RC, James GA, Holtzheimer PE, Hu XP, Mayberg HS (2012b). A whole brain fMRI
atlas generated via spatially constrained spectral clustering. Hum Brain Mapp 33: 1914–28.
Craddock RC, Jbabdi S, Yan C-G, Vogelstein JT, Castellanos FX, Martino A Di, et al (2013).
Imaging human connectomes at the macroscale. Nat Methods 10: 524–39.
Craig AD (2002). How do you feel? Interoception: the sense of the physiological condition of the
body. Nat Rev Neurosci 3: 655–66.
Craig AD (2010a). Once an island, now the focus of attention. Brain Struct Funct 214: 395–6.
Craig ADB (2009a). Emotional moments across time: a possible neural basis for time perception
in the anterior insula. Philos Trans R Soc Lond B Biol Sci 364: 1933–42.
Craig ADB (2009b). How do you feel--now? The anterior insula and human awareness. Nat Rev
Neurosci 10: 59–70.
Craig ADB (2010b). The sentient self. Brain Struct Funct 214: 563–77.
Crane AM, Roberts ME, Treasure J (2007). Are obsessive-compulsive personality traits
associated with a poor outcome in anorexia nervosa? A systematic review of randomized
controlled trials and naturalistic outcome studies. Int J Eat Disord 40: 581–8.
Crittenden BM, Mitchell DJ, Duncan J (2015). Recruitment of the default mode network during
a demanding act of executive control. Elife 4: e06481.
Croarkin PE, Nakonezny PA, Wall CA, Murphy LL, Sampson SM, Frye MA, et al (2016).
Transcranial magnetic stimulation potentiates glutamatergic neurotransmission in depressed
adolescents. Psychiatry Res Neuroimaging 247: 25–33.
Crofts JJ, Higham DJ, Bosnell R, Jbabdi S, Matthews PM, Behrens TEJ, et al (2011). Network
analysis detects changes in the contralesional hemisphere following stroke. Neuroimage 54:
161–9.
Crowther A, Smoski MJ, Minkel J, Moore T, Gibbs D, Petty C, et al (2015). Resting-state
connectivity predictors of response to psychotherapy in major depressive disorder.
Neuropsychopharmacology 40: 1659–73.
296
Crutcher MD, DeLong MR (1984). Single cell studies of the primate putamen. II. Relations to
direction of movement and pattern of muscular activity. Exp brain Res 53: 244–58.
Cuijpers P (2015). Psychotherapies for adult depression: recent developments. Curr Opin
Psychiatry 28: 24–9.
Cuijpers P, Sijbrandij M, Koole SL, Andersson G, Beekman AT, Reynolds CF (2013). The
efficacy of psychotherapy and pharmacotherapy in treating depressive and anxiety
disorders: a meta-analysis of direct comparisons. World Psychiatry 12: 137–48.
Cuijpers P, Weitz E, Twisk J, Kuehner C, Cristea I, David D, et al (2014). Gender as predictor
and moderator of outcome in cognitive behavior therapy and pharmacotherapy for adult
depression: an “individual patient data” meta-analysis. Depress Anxiety 31: 941–51.
Cullen KR, Klimes-Dougan B, Vu DP, Westlund Schreiner M, Mueller BA, Eberly LE, et al
(2016). Neural Correlates of Antidepressant Treatment Response in Adolescents with Major
Depressive Disorder. J Child Adolesc Psychopharmacol 26: 705–712.
Cummings JL (1993). Frontal-subcortical circuits and human behavior. Arch Neurol 50: 873–80.
Curtis CE, D’Esposito M (2003). Persistent activity in the prefrontal cortex during working
memory. Trends Cogn Sci 7: 415–423.
D’Urso G, Brunoni AR, Anastasia A, Micillo M, Bartolomeis A de, Mantovani A (2016).
Polarity-dependent effects of transcranial direct current stimulation in obsessive-compulsive
disorder. Neurocase 22: 60–4.
Daly JJ, Prudic J, Devanand DP, Nobler MS, Lisanby SH, Peyser S, et al (2001). ECT in bipolar
and unipolar depression: differences in speed of response. Bipolar Disord 3: 95–104.
Damoiseaux JS, Rombouts SARB, Barkhof F, Scheltens P, Stam CJ, Smith SM, et al (2006).
Consistent resting-state networks across healthy subjects. Proc Natl Acad Sci U S A 103:
13848–53.
Davidson RJ, Irwin W, Anderle MJ, Kalin NH (2003). The neural substrates of affective
processing in depressed patients treated with venlafaxine. Am J Psychiatry 160: 64–75.
Decker JH, Figner B, Steinglass JE (2015). On Weight and Waiting: Delay Discounting in
Anorexia Nervosa Pretreatment and Posttreatment. Biol Psychiatry 78: 606–14.
DeGuzman M, Shott ME, Yang TT, Riederer J, Frank GKW (2017). Association of Elevated
297
Reward Prediction Error Response With Weight Gain in Adolescent Anorexia Nervosa. Am
J Psychiatry 174: 557–565.
Delaveau P, Jabourian M, Lemogne C, Guionnet S, Bergouignan L, Fossati P (2011). Brain
effects of antidepressants in major depression: a meta-analysis of emotional processing
studies. J Affect Disord 130: 66–74.
Delgado MR, Nearing KI, Ledoux JE, Phelps EA (2008). Neural circuitry underlying the
regulation of conditioned fear and its relation to extinction. Neuron 59: 829–38.
Delva NJ, Graf P, Patry S, Gosselin C, Milev R, Gilron I, et al (2011). Access to
electroconvulsive therapy services in Canada. J ECT 27: 300–9.
Demyttenaere K, Mesters P, Boulanger B, Dewe W, Delsemme MH, Gregoire J, et al (2001).
Adherence to treatment regimen in depressed patients treated with amitriptyline or
fluoxetine. J Affect Disord 65: 243–52.
Denys D, Mantione M, Figee M, Munckhof P van den, Koerselman F, Westenberg H, et al
(2010). Deep brain stimulation of the nucleus accumbens for treatment-refractory
obsessive-compulsive disorder. Arch Gen Psychiatry 67: 1061–8.
Desmurget, Grafton (2000). Forward modeling allows feedback control for fast reaching
movements. Trends Cogn Sci 4: 423–431.
Devinsky O, Morrell MJ, Vogt BA (1995). Contributions of anterior cingulate cortex to
behaviour. Brain 118 ( Pt 1: 279–306.
Devlin B, Bacanu S-A, Klump KL, Bulik CM, Fichter MM, Halmi KA, et al (2002). Linkage
analysis of anorexia nervosa incorporating behavioral covariates. Hum Mol Genet 11: 689–
96.
DiFiglia M, Carey J (1986). Large neurons in the primate neostriatum examined with the
combined Golgi-electron microscopic method. J Comp Neurol 244: 36–52.
Dijk KRA Van, Hedden T, Venkataraman A, Evans KC, Lazar SW, Buckner RL (2010).
Intrinsic functional connectivity as a tool for human connectomics: theory, properties, and
optimization. J Neurophysiol 103: 297–321.
Dijk KRA Van, Sabuncu MR, Buckner RL (2012). The influence of head motion on intrinsic
functional connectivity MRI. Neuroimage 59: 431–8.
298
Ding J, Peterson JD, Surmeier DJ (2008). Corticostriatal and thalamostriatal synapses have
distinctive properties. J Neurosci 28: 6483–92.
Dixon ML, Fox KCR, Christoff K (2014). A framework for understanding the relationship
between externally and internally directed cognition. Neuropsychologia 62: 321–30.
Dong D, Lei X, Jackson T, Wang Y, Su Y, Chen H (2014). Altered regional homogeneity and
efficient response inhibition in restrained eaters. Neuroscience 266: 116–26.
Dosenbach NUF, Fair DA, Cohen AL, Schlaggar BL, Petersen SE (2008). A dual-networks
architecture of top-down control. Trends Cogn Sci 12: 99–105.
Dosenbach NUF, Visscher KM, Palmer ED, Miezin FM, Wenger KK, Kang HC, et al (2006). A
core system for the implementation of task sets. Neuron 50: 799–812.
Dougherty DD, Baer L, Cosgrove GR, Cassem EH, Price BH, Nierenberg AA, et al (2002).
Prospective long-term follow-up of 44 patients who received cingulotomy for treatment-
refractory obsessive-compulsive disorder. Am J Psychiatry 159: 269–75.
Dowdle LT, Brown TR, George MS, Hanlon CA (2018). Single pulse TMS to the DLPFC,
compared to a matched sham control, induces a direct, causal increase in caudate, cingulate,
and thalamic BOLD signal. Brain Stimul 11: 789–796.
Downar J, Crawley AP, Mikulis DJ, Davis KD (2000). A multimodal cortical network for the
detection of changes in the sensory environment. Nat Neurosci 3: 277–83.
Downar J, Crawley AP, Mikulis DJ, Davis KD (2001). The effect of task relevance on the
cortical response to changes in visual and auditory stimuli: an event-related fMRI study.
Neuroimage 14: 1256–67.
Downar J, Crawley AP, Mikulis DJ, Davis KD (2002). A cortical network sensitive to stimulus
salience in a neutral behavioral context across multiple sensory modalities. J Neurophysiol
87: 615–20.
Downar J, Daskalakis ZJ (2013). New targets for rTMS in depression: a review of convergent
evidence. Brain Stimul 6: 231–40.
Downar J, Geraci J, Salomons T V, Dunlop K, Wheeler S, McAndrews MP, et al (2014).
Anhedonia and reward-circuit connectivity distinguish nonresponders from responders to
dorsomedial prefrontal repetitive transcranial magnetic stimulation in major depression.
299
Biol Psychiatry 76: 176–85.
Downar J, Sankar A, Giacobbe P, Woodside B, Colton P (2012). Unanticipated Rapid Remission
of Refractory Bulimia Nervosa, during High-Dose Repetitive Transcranial Magnetic
Stimulation of the Dorsomedial Prefrontal Cortex: A Case Report. Front psychiatry 3: 30.
Drevets WC, Bogers W, Raichle ME (2002). Functional anatomical correlates of antidepressant
drug treatment assessed using PET measures of regional glucose metabolism. Eur
Neuropsychopharmacol 12: 527–44.
Drevets WC, Savitz J, Trimble M (2008). The subgenual anterior cingulate cortex in mood
disorders. CNS Spectr 13: 663–81.
Driessen E, Hollon SD (2010). Cognitive behavioral therapy for mood disorders: efficacy,
moderators and mediators. Psychiatr Clin North Am 33: 537–55.
Drysdale AT, Grosenick L, Downar J, Dunlop K, Mansouri F, Meng Y, et al (2017). Resting-
state connectivity biomarkers define neurophysiological subtypes of depression. Nat Med
23: 28–38.
Du M-Y, Wu Q-Z, Yue Q, Li J, Liao Y, Kuang W-H, et al (2012). Voxelwise meta-analysis of
gray matter reduction in major depressive disorder. Prog Neuropsychopharmacol Biol
Psychiatry 36: 11–6.
Du W, Levin-Schwartz Y, Fu G-S, Ma S, Calhoun VD, Adalı T (2016). The role of diversity in
complex ICA algorithms for fMRI analysis. J Neurosci Methods 264: 129–35.
Dunlop BW, Rajendra JK, Craighead WE, Kelley ME, McGrath CL, Choi KS, et al (2017a).
Functional Connectivity of the Subcallosal Cingulate Cortex And Differential Outcomes to
Treatment With Cognitive-Behavioral Therapy or Antidepressant Medication for Major
Depressive Disorder. Am J Psychiatry 174: 533–545.
Dunlop K, Downar J (2017). Ensuring that novel resting-state fMRI metrics are physiologically
grounded, interpretable and meaningful (A commentary on Canna et al., 2017). Eur J
Neurosci 45: 1127–1128.
Dunlop K, Hanlon CA, Downar J (2017b). Noninvasive brain stimulation treatments for
addiction and major depression. Ann N Y Acad Sci 1394: 31–54.
Dunlop K, Woodside B, Lam E, Olmsted M, Colton P, Giacobbe P, et al (2015). Increases in
300
frontostriatal connectivity are associated with response to dorsomedial repetitive
transcranial magnetic stimulation in refractory binge/purge behaviors. NeuroImage Clin 8:
611–8.
Dunlop K, Woodside B, Olmsted M, Colton P, Giacobbe P, Downar J (2016a). Reductions in
Cortico-Striatal Hyperconnectivity Accompany Successful Treatment of Obsessive-
Compulsive Disorder with Dorsomedial Prefrontal rTMS. Neuropsychopharmacology 41:
1395–403.
Dunlop KA, Woodside B, Downar J (2016b). Targeting Neural Endophenotypes of Eating
Disorders with Non-invasive Brain Stimulation. Front Neurosci 10: 30.
Duprat R, Desmyter S, Rudi DR, Heeringen K van, Abbeele D Van den, Tandt H, et al (2016).
Accelerated intermittent theta burst stimulation treatment in medication-resistant major
depression: A fast road to remission? J Affect Disord 200: 6–14.
Duque J, Labruna L, Verset S, Olivier E, Ivry RB (2012). Dissociating the role of prefrontal and
premotor cortices in controlling inhibitory mechanisms during motor preparation. J
Neurosci 32: 806–16.
Ebert D, Speck O, König A, Berger M, Hennig J, Hohagen F (1997). 1H-magnetic resonance
spectroscopy in obsessive-compulsive disorder: evidence for neuronal loss in the cingulate
gyrus and the right striatum. Psychiatry Res 74: 173–6.
Ehrlich S, Geisler D, Ritschel F, King JA, Seidel M, Boehm I, et al (2015). Elevated cognitive
control over reward processing in recovered female patients with anorexia nervosa. J
Psychiatry Neurosci 40: 307–15.
Eippert F, Bingel U, Schoell ED, Yacubian J, Klinger R, Lorenz J, et al (2009). Activation of the
opioidergic descending pain control system underlies placebo analgesia. Neuron 63: 533–
43.
Eisen JL, Pinto A, Mancebo MC, Dyck IR, Orlando ME, Rasmussen SA (2010). A 2-year
prospective follow-up study of the course of obsessive-compulsive disorder. J Clin
Psychiatry 71: 1033–9.
Eklund A, Nichols TE, Knutsson H (2016). Cluster failure: Why fMRI inferences for spatial
extent have inflated false-positive rates. Proc Natl Acad Sci U S A 113: 7900–5.
301
El-Hage W, Leman S, Camus V, Belzung C (2013). Mechanisms of antidepressant resistance.
Front Pharmacol 4: 146.
Elbeh KAM, Elserogy YMB, Khalifa HE, Ahmed MA, Hafez MH, Khedr EM (2016). Repetitive
transcranial magnetic stimulation in the treatment of obsessive-compulsive disorders:
Double blind randomized clinical trial. Psychiatry Res 238: 264–269.
Eldaief MC, Halko MA, Buckner RL, Pascual-Leone A (2011). Transcranial magnetic
stimulation modulates the brain’s intrinsic activity in a frequency-dependent manner. Proc
Natl Acad Sci U S A 108: 21229–34.
Ellison Z, Foong J, Howard R, Bullmore E, Williams S, Treasure J (1998). Functional anatomy
of calorie fear in anorexia nervosa. Lancet (London, England) 352: 1192.
Enns MW, Larsen DK, Cox BJ (2000). Discrepancies between self and observer ratings of
depression. The relationship to demographic, clinical and personality variables. J Affect
Disord 60: 33–41.
Enomoto H, Terao Y, Kadowaki S, Nakamura K, Moriya A, Nakatani-Enomoto S, et al (2015).
Effects of L-Dopa and pramipexole on plasticity induced by QPS in human motor cortex. J
Neural Transm 122: 1253–61.
Epanechnikov V (1969). Non-parametric estimation of a multivariate probability density. Theory
Probab Its Appl 14: 153–158.
Evarts E V, Wise SP (1984). Basal ganglia outputs and motor control. Ciba Found Symp 107:
83–102.
Eynde F Van den, Claudino AM, Mogg A, Horrell L, Stahl D, Ribeiro W, et al (2010).
Repetitive transcranial magnetic stimulation reduces cue-induced food craving in bulimic
disorders. Biol Psychiatry 67: 793–5.
Eynde F Van den, Guillaume S, Broadbent H, Campbell IC, Schmidt U (2013). Repetitive
transcranial magnetic stimulation in anorexia nervosa: a pilot study. Eur Psychiatry 28: 98–
101.
Eynde F Van den, Suda M, Broadbent H, Guillaume S, Eynde M Van den, Steiger H, et al
(2012). Structural magnetic resonance imaging in eating disorders: a systematic review of
voxel-based morphometry studies. Eur Eat Disord Rev 20: 94–105.
302
Fairburn CG, Agras WS, Walsh BT, Wilson GT, Stice E (2004). Prediction of outcome in
bulimia nervosa by early change in treatment. Am J Psychiatry 161: 2322–4.
Fairburn CG, Beglin SJ (1994). Assessment of eating disorders: interview or self-report
questionnaire? Int J Eat Disord 16: 363–70.
Fairburn CG, Cooper Z (1993). The Eating Disorder Examination (12th edition). Binge Eat
Nature, assessment, Treat 317–360.
Fairburn CG, Peveler RC, Jones R, Hope RA, Doll HA (1993). Predictors of 12-month outcome
in bulimia nervosa and the influence of attitudes to shape and weight. J Consult Clin
Psychol 61: 696–8.
Fan J, Zhong M, Zhu X, Gan J, Liu W, Niu C, et al (2017). Resting-state functional connectivity
between right anterior insula and right orbital frontal cortex correlate with insight level in
obsessive-compulsive disorder. NeuroImage Clin 15: 1–7.
Fang J, Rong P, Hong Y, Fan Y, Liu J, Wang H, et al (2016). Transcutaneous Vagus Nerve
Stimulation Modulates Default Mode Network in Major Depressive Disorder. Biol
Psychiatry 79: 266–73.
Farris SG, McLean CP, Meter PE Van, Simpson HB, Foa EB (2013). Treatment response,
symptom remission, and wellness in obsessive-compulsive disorder. J Clin Psychiatry 74:
685–90.
Fava M, Rush AJ, Alpert JE, Balasubramani GK, Wisniewski SR, Carmin CN, et al (2008).
Difference in treatment outcome in outpatients with anxious versus nonanxious depression:
a STAR*D report. Am J Psychiatry 165: 342–51.
Fayad SM, Guzick AG, Reid AM, Mason DM, Bertone A, Foote KD, et al (2016). Six-Nine
Year Follow-Up of Deep Brain Stimulation for Obsessive-Compulsive Disorder. PLoS One
11: e0167875.
Feffer K, Fettes P, Giacobbe P, Daskalakis ZJ, Blumberger DM, Downar J (2018). 1Hz rTMS of
the right orbitofrontal cortex for major depression: Safety, tolerability and clinical
outcomes. Eur Neuropsychopharmacol 28: 109–117.
Feis RA, Smith SM, Filippini N, Douaud G, Dopper EGP, Heise V, et al (2015). ICA-based
artifact removal diminishes scan site differences in multi-center resting-state fMRI. Front
303
Neurosci 9: 395.
Fellows LK (2007). The role of orbitofrontal cortex in decision making: a component process
account. Ann N Y Acad Sci 1121: 421–30.
Feng H, Yan L, Guan Y, Cui L (2005). Effects of transcranial magnetic stimulation on motor
cortical excitability and neurofunction after cerebral ischemia-reperfusion injury in rats.
Chinese Med Sci J 20: 226–30.
Ferrari AJ, Charlson FJ, Norman RE, Patten SB, Freedman G, Murray CJL, et al (2013). Burden
of depressive disorders by country, sex, age, and year: findings from the global burden of
disease study 2010. PLoS Med 10: e1001547.
Ferrazzi G, Kuklisova Murgasova M, Arichi T, Malamateniou C, Fox MJ, Makropoulos A, et al
(2014). Resting State fMRI in the moving fetus: a robust framework for motion, bias field
and spin history correction. Neuroimage 101: 555–68.
Fettes P, Peters S, Giacobbe P, Blumberger DM, Downar J (2017a). Neural correlates of
successful orbitofrontal 1 Hz rTMS following unsuccessful dorsolateral and dorsomedial
prefrontal rTMS in major depression: A case report. Brain Stimul 10: 165–167.
Fettes P, Schulze L, Downar J (2017b). Cortico-Striatal-Thalamic Loop Circuits of the
Orbitofrontal Cortex: Promising Therapeutic Targets in Psychiatric Illness. Front Syst
Neurosci 11: 25.
Fettes PW, Moayedi M, Dunlop K, Mansouri F, Vila-Rodriguez F, Giacobbe P, et al (2018).
Abnormal Functional Connectivity of Frontopolar Subregions in Treatment-Nonresponsive
Major Depressive Disorder. Biol psychiatry Cogn Neurosci neuroimaging 3: 337–347.
Field AE, Herzog DB, Keller MB, West J, Nussbaum K, Colditz GA (1997). Distinguishing
recovery from remission in a cohort of bulimic women: how should asymptomatic periods
be described? J Clin Epidemiol 50: 1339–45.
Figee M, Luigjes J, Smolders R, Valencia-Alfonso C-E, Wingen G van, Kwaasteniet B de, et al
(2013). Deep brain stimulation restores frontostriatal network activity in obsessive-
compulsive disorder. Nat Neurosci 16: 386–7.
First MB, Spitzer RL, Gibbon M, Williams JBW (2002). Structured Clinical Interview for DSM-
IV-TR Axis I Disorders. New York State Psychiatr Inst .
304
Fischer S, Smith GT, Anderson KG (2003). Clarifying the role of impulsivity in bulimia nervosa.
Int J Eat Disord 33: 406–11.
Fitzgerald PB, Hoy K, Gunewardene R, Slack C, Ibrahim S, Bailey M, et al (2011). A
randomized trial of unilateral and bilateral prefrontal cortex transcranial magnetic
stimulation in treatment-resistant major depression. Psychol Med 41: 1187–96.
Fitzgerald PB, Hoy K, McQueen S, Maller JJ, Herring S, Segrave R, et al (2009). A Randomized
Trial of rTMS Targeted with MRI Based Neuro-Navigation in Treatment-Resistant
Depression. Neuropsychopharmacology 34: 1255–1262.
Fitzgerald PB, Laird AR, Maller J, Daskalakis ZJ (2008). A meta-analytic study of changes in
brain activation in depression. Hum Brain Mapp 29: 683–95.
Fitzgerald PB, Sritharan A, Daskalakis ZJ, Castella AR de, Kulkarni J, Egan G (2007). A
functional magnetic resonance imaging study of the effects of low frequency right
prefrontal transcranial magnetic stimulation in depression. J Clin Psychopharmacol 27:
488–92.
Fiuzat EC, Rhodes SE V, Murray EA (2017). The Role of Orbitofrontal-Amygdala Interactions
in Updating Action-Outcome Valuations in Macaques. J Neurosci 37: 2463–2470.
Flaherty AW, Graybiel AM (1994). Input-output organization of the sensorimotor striatum in the
squirrel monkey. J Neurosci 14: 599–610.
Foa EB, Kozak MJ, Goodman WK, Hollander E, Jenike MA, Rasmussen SA (1995). DSM-IV
field trial: obsessive-compulsive disorder. Am J Psychiatry 152: 90–6.
Foa EB, Liebowitz MR, Kozak MJ, Davies S, Campeas R, Franklin ME, et al (2005).
Randomized, placebo-controlled trial of exposure and ritual prevention, clomipramine, and
their combination in the treatment of obsessive-compulsive disorder. Am J Psychiatry 162:
151–61.
Fontenelle IS, Fontenelle LF, Borges MC, Prazeres AM, Rangé BP, Mendlowicz M V, et al
(2010). Quality of life and symptom dimensions of patients with obsessive-compulsive
disorder. Psychiatry Res 179: 198–203.
Forbes EE, Olino TM, Ryan ND, Birmaher B, Axelson D, Moyles DL, et al (2010). Reward-
related brain function as a predictor of treatment response in adolescents with major
305
depressive disorder. Cogn Affect Behav Neurosci 10: 107–18.
Forman SD, Cohen JD, Fitzgerald M, Eddy WF, Mintun MA, Noll DC (1995). Improved
assessment of significant activation in functional magnetic resonance imaging (fMRI): use
of a cluster-size threshold. Magn Reson Med 33: 636–47.
Forstmann BU, Keuken MC, Jahfari S, Bazin PL, Neumann J, Schäfer A, et al (2012). Cortico-
subthalamic white matter tract strength predicts interindividual efficacy in stopping a motor
response. Neuroimage 60: 370–375.
Fox MD, Buckner RL, Liu H, Chakravarty MM, Lozano AM, Pascual-Leone A (2014). Resting-
state networks link invasive and noninvasive brain stimulation across diverse psychiatric
and neurological diseases. Proc Natl Acad Sci U S A 111: E4367-75.
Fox MD, Buckner RL, White MP, Greicius MD, Pascual-Leone A (2012a). Efficacy of
transcranial magnetic stimulation targets for depression is related to intrinsic functional
connectivity with the subgenual cingulate. Biol Psychiatry 72: 595–603.
Fox MD, Buckner RL, White MP, Greicius MD, Pascual-Leone A (2012b). Efficacy of
Transcranial Magnetic Stimulation Targets for Depression Is Related to Intrinsic Functional
Connectivity with the Subgenual Cingulate. Biol Psychiatry 72: 595–603.
Fox MD, Corbetta M, Snyder AZ, Vincent JL, Raichle ME (2006). Spontaneous neuronal
activity distinguishes human dorsal and ventral attention systems. Proc Natl Acad Sci U S A
103: 10046–51.
Fox MD, Liu H, Pascual-Leone A (2013a). Identification of reproducible individualized targets
for treatment of depression with TMS based on intrinsic connectivity. Neuroimage 66: 151–
60.
Fox MD, Liu H, Pascual-Leone A (2013b). Identification of reproducible individualized targets
for treatment of depression with TMS based on intrinsic connectivity. Neuroimage 66: 151–
160.
Fox MD, Raichle ME (2007). Spontaneous fluctuations in brain activity observed with functional
magnetic resonance imaging. Nat Rev Neurosci 8: 700–11.
Fox MD, Snyder AZ, Vincent JL, Corbetta M, Essen DC Van, Raichle ME (2005). The human
brain is intrinsically organized into dynamic, anticorrelated functional networks. Proc Natl
306
Acad Sci U S A 102: 9673–8.
Fox MD, Zhang D, Snyder AZ, Raichle ME (2009). The global signal and observed
anticorrelated resting state brain networks. J Neurophysiol 101: 3270–83.
Franco AR, Mannell M V, Calhoun VD, Mayer AR (2013). Impact of analysis methods on the
reproducibility and reliability of resting-state networks. Brain Connect 3: 363–74.
Franco AR, Pritchard A, Calhoun VD, Mayer AR (2009). Interrater and intermethod reliability
of default mode network selection. Hum Brain Mapp 30: 2293–303.
Frank GK, Bailer UF, Henry SE, Drevets W, Meltzer CC, Price JC, et al (2005). Increased
dopamine D2/D3 receptor binding after recovery from anorexia nervosa measured by
positron emission tomography and [11c]raclopride. Biol Psychiatry 58: 908–12.
Frank GK, Kaye WH, Meltzer CC, Price JC, Greer P, McConaha C, et al (2002). Reduced 5-
HT2A receptor binding after recovery from anorexia nervosa. Biol Psychiatry 52: 896–906.
Frank GK, Shott ME, Hagman JO, Mittal VA (2013). Alterations in brain structures related to
taste reward circuitry in ill and recovered anorexia nervosa and in bulimia nervosa. Am J
Psychiatry 170: 1152–60.
Frank GK, Wagner A, Achenbach S, McConaha C, Skovira K, Aizenstein H, et al (2006).
Altered brain activity in women recovered from bulimic-type eating disorders after a
glucose challenge: a pilot study. Int J Eat Disord 39: 76–9.
Frank GKW, Reynolds JR, Shott ME, Jappe L, Yang TT, Tregellas JR, et al (2012a). Anorexia
nervosa and obesity are associated with opposite brain reward response.
Neuropsychopharmacology 37: 2031–46.
Frank GKW, Reynolds JR, Shott ME, O’Reilly RC (2011). Altered temporal difference learning
in bulimia nervosa. Biol Psychiatry 70: 728–35.
Frank GKW, Roblek T, Shott ME, Jappe LM, Rollin MDH, Hagman JO, et al (2012b).
Heightened fear of uncertainty in anorexia and bulimia nervosa. Int J Eat Disord 45: 227–
32.
Frank GKW, Shott ME, Riederer J, Pryor TL (2016). Altered structural and effective
connectivity in anorexia and bulimia nervosa in circuits that regulate energy and reward
homeostasis. Transl Psychiatry 6: e932.
307
Fransson P, Marrelec G (2008). The precuneus/posterior cingulate cortex plays a pivotal role in
the default mode network: Evidence from a partial correlation network analysis.
Neuroimage 42: 1178–84.
Fraser LM, O’Carroll RE, Ebmeier KP (2008). The effect of electroconvulsive therapy on
autobiographical memory: a systematic review. J ECT 24: 10–7.
Fregni F, Marcolin MA, Myczkowski M, Amiaz R, Hasey G, Rumi DO, et al (2006). Predictors
of antidepressant response in clinical trials of transcranial magnetic stimulation. Int J
Neuropsychopharmacol 9: 641–54.
Fregni F, Orsati F, Pedrosa W, Fecteau S, Tome FAM, Nitsche MA, et al (2008). Transcranial
direct current stimulation of the prefrontal cortex modulates the desire for specific foods.
Appetite 51: 34–41.
Friederich H-C, Brooks S, Uher R, Campbell IC, Giampietro V, Brammer M, et al (2010).
Neural correlates of body dissatisfaction in anorexia nervosa. Neuropsychologia 48: 2878–
85.
Friederich H-C, Walther S, Bendszus M, Biller A, Thomann P, Zeigermann S, et al (2012). Grey
matter abnormalities within cortico-limbic-striatal circuits in acute and weight-restored
anorexia nervosa patients. Neuroimage 59: 1106–13.
Friedman DP, Aggleton JP, Saunders RC (2002). Comparison of hippocampal, amygdala, and
perirhinal projections to the nucleus accumbens: combined anterograde and retrograde
tracing study in the Macaque brain. J Comp Neurol 450: 345–65.
Frieling H, Fischer J, Wilhelm J, Engelhorn T, Bleich S, Hillemacher T, et al (2012).
Microstructural abnormalities of the posterior thalamic radiation and the mediodorsal
thalamic nuclei in females with anorexia nervosa--a voxel based diffusion tensor imaging
(DTI) study. J Psychiatr Res 46: 1237–42.
Friston KJ, Ashburner J, Frith CD, Poline J-B, Heather JD, Frackowiak RSJ (1995). Spatial
registration and normalization of images. Hum Brain Mapp 3: 165–189.
Friston KJ, Williams S, Howard R, Frackowiak RS, Turner R (1996). Movement-related effects
in fMRI time-series. Magn Reson Med 35: 346–55.
Friston KJ, Worsley KJ, Frackowiak RS, Mazziotta JC, Evans AC (1994). Assessing the

308
significance of focal activations using their spatial extent. Hum Brain Mapp 1: 210–20.
Frydman I, Salles Andrade JB de, Vigne P, Fontenelle LF (2016). Can Neuroimaging Provide
Reliable Biomarkers for Obsessive-Compulsive Disorder? A Narrative Review. Curr
Psychiatry Rep 18: 90.
Fu CHY, Steiner H, Costafreda SG (2013). Predictive neural biomarkers of clinical response in
depression: a meta-analysis of functional and structural neuroimaging studies of
pharmacological and psychological therapies. Neurobiol Dis 52: 75–83.
Fujiki M, Kobayashi H, Abe T, Kamida T (2003). Repetitive transcranial magnetic stimulation
for protection against delayed neuronal death induced by transient ischemia. J Neurosurg
99: 1063–9.
Funke K, Benali A (2011). Modulation of cortical inhibition by rTMS - findings obtained from
animal models. J Physiol 589: 4423–4435.
Furman DJ, Hamilton JP, Gotlib IH (2011). Frontostriatal functional connectivity in major
depressive disorder. Biol Mood Anxiety Disord 1: 11.
Furtado CP, Hoy KE, Maller JJ, Savage G, Daskalakis ZJ, Fitzgerald PB (2013). An
investigation of medial temporal lobe changes and cognition following antidepressant
response: a prospective rTMS study. Brain Stimul 6: 346–54.
Galusca B, Sigaud T, Costes N, Redoute J, Massoubre C, Estour B (2014). Wide impairment of
cerebral serotoninergic activity but inter-individual heterogeneity in bulimia nervosa
patients: a pilot [(18)F]MPPF/PET study. World J Biol Psychiatry 15: 599–608.
Gao F, Wang S, Guo Y, Wang J, Lou M, Wu J, et al (2010). Protective effects of repetitive
transcranial magnetic stimulation in a rat model of transient cerebral ischaemia: a microPET
study. Eur J Nucl Med Mol Imaging 37: 954–961.
Gatt L, Jan S, Mondraty N, Horsfield S, Hart S, Russell J, et al (2014). The household economic
burden of eating disorders and adherence to treatment in Australia. BMC Psychiatry 14:
338.
Gay A, Jaussent I, Sigaud T, Billard S, Attal J, Seneque M, et al (2016). A Lack of Clinical
Effect of High-frequency rTMS to Dorsolateral Prefrontal Cortex on Bulimic Symptoms: A
Randomised, Double-blind Trial. Eur Eat Disord Rev 24: 474–481.
309
Gedge L, Beaudoin A, Lazowski L, Toit R du, Jokic R, Milev R (2012). Effects of
Electroconvulsive Therapy and Repetitive Transcranial Magnetic Stimulation on Serum
Brain-Derived Neurotrophic Factor Levels in Patients with Depression. Front Psychiatry 3:
.
Gee DG, Biswal BB, Kelly C, Stark DE, Margulies DS, Shehzad Z, et al (2011). Low frequency
fluctuations reveal integrated and segregated processing among the cerebral hemispheres.
Neuroimage 54: 517–27.
Geisler D, Borchardt V, Lord AR, Boehm I, Ritschel F, Zwipp J, et al (2016). Abnormal
functional global and local brain connectivity in female patients with anorexia nervosa. J
Psychiatry Neurosci 41: 6–15.
Genovese CR, Lazar NA, Nichols T (2002). Thresholding of Statistical Maps in Functional
Neuroimaging Using the False Discovery Rate. Neuroimage 15: 870–878.
George MS, Lisanby SH, Avery D, McDonald WM, Durkalski V, Pavlicova M, et al (2010).
Daily Left Prefrontal Transcranial Magnetic Stimulation Therapy for Major Depressive
Disorder. Arch Gen Psychiatry 67: 507.
George MS, Ward HE, Ninan PT, Pollack M, Nahas Z, Anderson B, et al (2008). A pilot study
of vagus nerve stimulation (VNS) for treatment-resistant anxiety disorders. Brain Stimul 1:
112–21.
George MS, Wassermann EM (1994). Rapid-rate transcranial magnetic stimulation and ECT.
Convuls Ther 10: 251–8.
George MS, Wassermann EM, Kimbrell TA, Little JT, Williams WE, Danielson AL, et al
(1997). Mood improvement following daily left prefrontal repetitive transcranial magnetic
stimulation in patients with depression: a placebo-controlled crossover trial. Am J
Psychiatry 154: 1752–6.
George MS, Wassermann EM, Williams WA, Callahan A, Ketter TA, Basser P, et al (1995).
Daily repetitive transcranial magnetic stimulation (rTMS) improves mood in depression.
Neuroreport 6: 1853–6.
George MS, Wassermann EM, Williams WA, Steppel J, Pascual-Leone A, Basser P, et al
(1996). Changes in mood and hormone levels after rapid-rate transcranial magnetic
310
stimulation (rTMS) of the prefrontal cortex. J Neuropsychiatry Clin Neurosci 8: 172–80.
Gersner R, Kravetz E, Feil J, Pell G, Zangen A (2011). Long-Term Effects of Repetitive
Transcranial Magnetic Stimulation on Markers for Neuroplasticity: Differential Outcomes
in Anesthetized and Awake Animals. J Neurosci 31: 7521–7526.
Ghashghaei HT, Barbas H (2002). Pathways for emotion: interactions of prefrontal and anterior
temporal pathways in the amygdala of the rhesus monkey. Neuroscience 115: 1261–79.
Ghiglieri V, Pendolino V, Sgobio C, Bagetta V, Picconi B, Calabresi P (2012). Theta-burst
stimulation and striatal plasticity in experimental parkinsonism. Exp Neurol 236: 395–398.
Giel KE, Kullmann S, Preißl H, Bischoff SC, Thiel A, Schmidt U, et al (2013). Understanding
the reward system functioning in anorexia nervosa: crucial role of physical activity. Biol
Psychol 94: 575–81.
Gijsman HJ, Geddes JR, Rendell JM, Nolen WA, Goodwin GM (2004). Antidepressants for
bipolar depression: a systematic review of randomized, controlled trials. Am J Psychiatry
161: 1537–47.
Gilbert AR, Keshavan MS, Diwadkar V, Nutche J, Macmaster F, Easter PC, et al (2008). Gray
matter differences between pediatric obsessive-compulsive disorder patients and high-risk
siblings: a preliminary voxel-based morphometry study. Neurosci Lett 435: 45–50.
Giménez M, Guinea-Izquierdo A, Villalta-Gil V, Martínez-Zalacaín I, Segalàs C, Subirà M, et al
(2017). Brain alterations in low-frequency fluctuations across multiple bands in obsessive
compulsive disorder. Brain Imaging Behav 11: 1690–1706.
Glover GH, Li TQ, Ress D (2000). Image-based method for retrospective correction of
physiological motion effects in fMRI: RETROICOR. Magn Reson Med 44: 162–7.
Godart NT, Flament MF, Curt F, Perdereau F, Lang F, Venisse JL, et al (2003). Anxiety
disorders in subjects seeking treatment for eating disorders: a DSM-IV controlled study.
Psychiatry Res 117: 245–58.
Gohel SR, Biswal BB (2015). Functional integration between brain regions at rest occurs in
multiple-frequency bands. Brain Connect 5: 23–34.
Golanov E V, Yamamoto S, Reis DJ (1994). Spontaneous waves of cerebral blood flow
associated with a pattern of electrocortical activity. Am J Physiol 266: R204-14.
311
Golden NH, Katzman DK, Kreipe RE, Stevens SL, Sawyer SM, Rees J, et al (2003). Eating
disorders in adolescents: position paper of the Society for Adolescent Medicine. J Adolesc
Health 33: 496–503.
Goldman-Rakic PS (1982). Cytoarchitectonic heterogeneity of the primate neostriatum:
subdivision into Island and Matrix cellular compartments. J Comp Neurol 205: 398–413.
Goldman RL, Borckardt JJ, Frohman HA, O’Neil PM, Madan A, Campbell LK, et al (2011).
Prefrontal cortex transcranial direct current stimulation (tDCS) temporarily reduces food
cravings and increases the self-reported ability to resist food in adults with frequent food
craving. Appetite 56: 741–6.
Golestani A-M, Goodyear BG (2011). Regions of interest for resting-state fMRI analysis
determined by inter-voxel cross-correlation. Neuroimage 56: 246–51.
Gomes PVO, Brasil-Neto JP, Allam N, Rodrigues de Souza E (2012). A randomized, double-
blind trial of repetitive transcranial magnetic stimulation in obsessive-compulsive disorder
with three-month follow-up. J Neuropsychiatry Clin Neurosci 24: 437–43.
Gong W, Wan L, Lu W, Ma L, Cheng F, Cheng W, et al (2018). Statistical testing and power
analysis for brain-wide association study. Med Image Anal 47: 15–30.
Goodkind M, Eickhoff SB, Oathes DJ, Jiang Y, Chang A, Jones-Hagata LB, et al (2015).
Identification of a common neurobiological substrate for mental illness. JAMA psychiatry
72: 305–15.
Goodman WK, Foote KD, Greenberg BD, Ricciuti N, Bauer R, Ward H, et al (2010). Deep brain
stimulation for intractable obsessive compulsive disorder: pilot study using a blinded,
staggered-onset design. Biol Psychiatry 67: 535–42.
Goodman WK, Price LH (1992). Assessment of severity and change in obsessive compulsive
disorder. Psychiatr Clin North Am 15: 861–9.
Goodman WK, Price LH, Rasmussen SA, Mazure C, Fleischmann RL, Hill CL, et al (1989). The
Yale-Brown Obsessive Compulsive Scale. I. Development, use, and reliability. Arch Gen
Psychiatry 46: 1006–11.
Götestam KG, Eriksen L, Heggestad T, Nielsen S (1998). Prevalence of eating disorders in
Norwegian general hospitals 1990-1994: admissions per year and seasonality. Int J Eat
312
Disord 23: 57–64.
Granger CWJ (1969). Investigating Causal Relations by Econometric Models and Cross-spectral
Methods. Econometrica 37: 424.
Gratz KL, Roemer L (2004). Multidimensional Assessment of Emotion Regulation and
Dysregulation: Development, Factor Structure, and Initial Validation of the Difficulties in
Emotion Regulation Scale. J Psychopathol Behav Assess 26: 41–54.
Graveland GA, DiFiglia M (1985). The frequency and distribution of medium-sized neurons
with indented nuclei in the primate and rodent neostriatum. Brain Res 327: 307–11.
Graybiel AM, Rauch SL (2000). Toward a neurobiology of obsessive-compulsive disorder.
Neuron 28: 343–7.
Greenberg BD, George MS, Martin JD, Benjamin J, Schlaepfer TE, Altemus M, et al (1997).
Effect of prefrontal repetitive transcranial magnetic stimulation in obsessive-compulsive
disorder: a preliminary study. Am J Psychiatry 154: 867–9.
Greenberg BD, Malone DA, Friehs GM, Rezai AR, Kubu CS, Malloy PF, et al (2006). Three-
year outcomes in deep brain stimulation for highly resistant obsessive-compulsive disorder.
Neuropsychopharmacology 31: 2384–93.
Greenberg BD, Rauch SL, Haber SN (2010). Invasive circuitry-based neurotherapeutics:
stereotactic ablation and deep brain stimulation for OCD. Neuropsychopharmacology 35:
317–36.
Greenberg PE, Fournier A-A, Sisitsky T, Pike CT, Kessler RC (2015). The economic burden of
adults with major depressive disorder in the United States (2005 and 2010). J Clin
Psychiatry 76: 155–62.
Grefkes C, Fink GR (2005). The functional organization of the intraparietal sulcus in humans
and monkeys. J Anat 207: 3–17.
Greicius MD, Flores BH, Menon V, Glover GH, Solvason HB, Kenna H, et al (2007). Resting-
state functional connectivity in major depression: abnormally increased contributions from
subgenual cingulate cortex and thalamus. Biol Psychiatry 62: 429–37.
Greicius MD, Krasnow B, Reiss AL, Menon V (2003). Functional connectivity in the resting
brain: a network analysis of the default mode hypothesis. Proc Natl Acad Sci U S A 100:
313
253–8.
Greicius MD, Supekar K, Menon V, Dougherty RF (2009). Resting-state functional connectivity
reflects structural connectivity in the default mode network. Cereb Cortex 19: 72–8.
Greist J, Chouinard G, DuBoff E, Halaris A, Kim SW, Koran L, et al (1995). Double-blind
parallel comparison of three dosages of sertraline and placebo in outpatients with obsessive-
compulsive disorder. Arch Gen Psychiatry 52: 289–95.
Grice DE, Halmi KA, Fichter MM, Strober M, Woodside DB, Treasure JT, et al (2002).
Evidence for a susceptibility gene for anorexia nervosa on chromosome 1. Am J Hum Genet
70: 787–92.
Grilo CM, Pagano ME, Stout RL, Markowitz JC, Ansell EB, Pinto A, et al (2012). Stressful life
events predict eating disorder relapse following remission: six-year prospective outcomes.
Int J Eat Disord 45: 185–92.
Grinband J, Hirsch J, Ferrera VP (2006). A neural representation of categorization uncertainty in
the human brain. Neuron 49: 757–63.
Grisham JR, Fullana MA, Mataix-Cols D, Moffitt TE, Caspi A, Poulton R (2011). Risk factors
prospectively associated with adult obsessive-compulsive symptom dimensions and
obsessive-compulsive disorder. Psychol Med 41: 2495–506.
Grosenick L, Greer S, Knutson B (2008). Interpretable classifiers for FMRI improve prediction
of purchases. IEEE Trans Neural Syst Rehabil Eng 16: 539–48.
Gueorguieva R, Mallinckrodt C, Krystal JH (2011). Trajectories of depression severity in clinical
trials of duloxetine: insights into antidepressant and placebo responses. Arch Gen
Psychiatry 68: 1227–37.
Guo W, Liu F, Zhang J, Zhang Z, Yu L, Liu J, et al (2013). Dissociation of regional activity in
the default mode network in first-episode, drug-naive major depressive disorder at rest. J
Affect Disord 151: 1097–101.
Gurden H (2013). Astrocytes: can they be the missing stars linking neuronal activity to
neurofunctional imaging signals? Front Cell Neurosci 7: 21.
Gusnard DA, Akbudak E, Shulman GL, Raichle ME (2001). Medial prefrontal cortex and self-
referential mental activity: relation to a default mode of brain function. Proc Natl Acad Sci
314
U S A 98: 4259–64.
Haber SN (2003). The primate basal ganglia: parallel and integrative networks. J Chem
Neuroanat 26: 317–30.
Haber SN (2014). The place of dopamine in the cortico-basal ganglia circuit. Neuroscience 282:
248–57.
Haber SN (2016). Corticostriatal circuitry. Dialogues Clin Neurosci 18: 7–21.
Haber SN, Kim K-S, Mailly P, Calzavara R (2006). Reward-related cortical inputs define a large
striatal region in primates that interface with associative cortical connections, providing a
substrate for incentive-based learning. J Neurosci 26: 8368–76.
Haber SN, Kunishio K, Mizobuchi M, Lynd-Balta E (1995). The orbital and medial prefrontal
circuit through the primate basal ganglia. J Neurosci 15: 4851–67.
Haber SN, Lynd-Balta E, Mitchell SJ (1993). The organization of the descending ventral pallidal
projections in the monkey. J Comp Neurol 329: 111–28.
Haber SN, Lynd E, Klein C, Groenewegen HJ (1990). Topographic organization of the ventral
striatal efferent projections in the rhesus monkey: an anterograde tracing study. J Comp
Neurol 293: 282–98.
Hale JR, Mayhew SD, Mullinger KJ, Wilson RS, Arvanitis TN, Francis ST, et al (2015).
Comparison of functional thalamic segmentation from seed-based analysis and ICA.
Neuroimage 114: 448–65.
Hallett M (2000). Transcranial magnetic stimulation and the human brain. Nature 406: 147–50.
Hallett M (2007). Transcranial magnetic stimulation: a primer. Neuron 55: 187–99.
Halligan PW, Fink GR, Marshall JC, Vallar G (2003). Spatial cognition: evidence from visual
neglect. Trends Cogn Sci 7: 125–133.
Halligan PW, Marshall JC (1998). Neglect of awareness. Conscious Cogn 7: 356–80.
Hallquist MN, Hwang K, Luna B (2013). The nuisance of nuisance regression: spectral
misspecification in a common approach to resting-state fMRI preprocessing reintroduces
noise and obscures functional connectivity. Neuroimage 82: 208–25.
Halmi KA (2005). The multimodal treatment of eating disorders. World Psychiatry 4: 69–73.

315
Halmi KA, Agras WS, Mitchell J, Wilson GT, Crow S, Bryson SW, et al (2002). Relapse
predictors of patients with bulimia nervosa who achieved abstinence through cognitive
behavioral therapy. Arch Gen Psychiatry 59: 1105–9.
Ham T, Leff A, Boissezon X de, Joffe A, Sharp DJ (2013). Cognitive control and the salience
network: an investigation of error processing and effective connectivity. J Neurosci 33:
7091–8.
Hamada M, Hanajima R, Terao Y, Arai N, Furubayashi T, Inomata-Terada S, et al (2007).
Quadro-pulse stimulation is more effective than paired-pulse stimulation for plasticity
induction of the human motor cortex. Clin Neurophysiol 118: 2672–82.
Hamada M, Murase N, Hasan A, Balaratnam M, Rothwell JC (2013). The role of interneuron
networks in driving human motor cortical plasticity. Cereb Cortex 23: 1593–605.
Hamada M, Terao Y, Hanajima R, Shirota Y, Nakatani-Enomoto S, Furubayashi T, et al (2008).
Bidirectional long-term motor cortical plasticity and metaplasticity induced by quadripulse
transcranial magnetic stimulation. J Physiol 586: 3927–47.
Hamilton JP, Chen G, Thomason ME, Schwartz ME, Gotlib IH (2011a). Investigating neural
primacy in Major Depressive Disorder: multivariate Granger causality analysis of resting-
state fMRI time-series data. Mol Psychiatry 16: 763–72.
Hamilton JP, Furman DJ, Chang C, Thomason ME, Dennis E, Gotlib IH (2011b). Default-mode
and task-positive network activity in major depressive disorder: implications for adaptive
and maladaptive rumination. Biol Psychiatry 70: 327–33.
Hamilton MC (1960). A rating scale for depression. J Neurol Neurosurg Psychiatry 23: 56–62.
Hampton AN, Adolphs R, Tyszka MJ, O’Doherty JP (2007). Contributions of the amygdala to
reward expectancy and choice signals in human prefrontal cortex. Neuron 55: 545–55.
Hanakawa T, Goldfine AM, Hallett M (2017). A Common Function of Basal Ganglia-Cortical
Circuits Subserving Speed in Both Motor and Cognitive Domains. eNeuro 4:
ENEURO.0200-17.2017.
Hanlon CA, Canterberry M, Taylor JJ, DeVries W, Li X, Brown TR, et al (2013). Probing the
frontostriatal loops involved in executive and limbic processing via interleaved TMS and
functional MRI at two prefrontal locations: a pilot study. PLoS One 8: e67917.
316
Haq AU, Sitzmann AF, Goldman ML, Maixner DF, Mickey BJ (2015). Response of depression
to electroconvulsive therapy: a meta-analysis of clinical predictors. J Clin Psychiatry 76:
1374–84.
Harmer CJ, Thilo K V, Rothwell JC, Goodwin GM (2001). Transcranial magnetic stimulation of
medial-frontal cortex impairs the processing of angry facial expressions. Nat Neurosci 4:
17–8.
Harrison BJ, Pujol J, Cardoner N, Deus J, Alonso P, López-Solà M, et al (2013). Brain
corticostriatal systems and the major clinical symptom dimensions of obsessive-compulsive
disorder. Biol Psychiatry 73: 321–8.
Harrison BJ, Soriano-Mas C, Pujol J, Ortiz H, López-Solà M, Hernández-Ribas R, et al (2009).
Altered corticostriatal functional connectivity in obsessive-compulsive disorder. Arch Gen
Psychiatry 66: 1189–200.
Hart LM, Granillo MT, Jorm AF, Paxton SJ (2011). Unmet need for treatment in the eating
disorders: a systematic review of eating disorder specific treatment seeking among
community cases. Clin Psychol Rev 31: 727–35.
Harvey P-O, Fossati P, Pochon J-B, Levy R, Lebastard G, Lehéricy S, et al (2005). Cognitive
control and brain resources in major depression: an fMRI study using the n-back task.
Neuroimage 26: 860–9.
Hasin DS, Goodwin RD, Stinson FS, Grant BF (2005). Epidemiology of major depressive
disorder: results from the National Epidemiologic Survey on Alcoholism and Related
Conditions. Arch Gen Psychiatry 62: 1097–106.
Hasin DS, Grant BF (2015). The National Epidemiologic Survey on Alcohol and Related
Conditions (NESARC) Waves 1 and 2: review and summary of findings. Soc Psychiatry
Psychiatr Epidemiol 50: 1609–40.
Hausmann A, Mangweth B, Walpoth M, Hoertnagel C, Kramer-Reinstadler K, Rupp CI, et al
(2004). Repetitive transcranial magnetic stimulation (rTMS) in the double-blind treatment
of a depressed patient suffering from bulimia nervosa: a case report. Int J
Neuropsychopharmacol 7: 371–3.
Hawken ER, Dilkov D, Kaludiev E, Simek S, Zhang F, Milev R (2016). Transcranial Magnetic
317
Stimulation of the Supplementary Motor Area in the Treatment of Obsessive-Compulsive
Disorder: A Multi-Site Study. Int J Mol Sci 17: 420.
Hay PJ, Touyz S, Sud R (2012). Treatment for severe and enduring anorexia nervosa: a review.
Aust N Z J Psychiatry 46: 1136–44.
Hay PP, Bacaltchuk J, Stefano S, Kashyap P (2009). Psychological treatments for bulimia
nervosa and binging. Cochrane database Syst Rev
CD000562doi:10.1002/14651858.CD000562.pub3.
Hayasaka S, Laurienti PJ (2010). Comparison of characteristics between region-and voxel-based
network analyses in resting-state fMRI data. Neuroimage 50: 499–508.
Hayasaka S, Nichols TE (2003). Validating cluster size inference: random field and permutation
methods. Neuroimage 20: 2343–56.
Hayden BY, Smith D V, Platt ML (2010). Cognitive control signals in posterior cingulate cortex.
Front Hum Neurosci 4: 223.
Hayes DJ, Lipsman N, Chen DQ, Woodside DB, Davis KD, Lozano AM, et al (2015).
Subcallosal Cingulate Connectivity in Anorexia Nervosa Patients Differs From Healthy
Controls: A Multi-tensor Tractography Study. Brain Stimul 8: 758–68.
Haynes J-D, Rees G (2006). Decoding mental states from brain activity in humans. Nat Rev
Neurosci 7: 523–34.
Haynes WIA, Haber SN (2013). The organization of prefrontal-subthalamic inputs in primates
provides an anatomical substrate for both functional specificity and integration: implications
for Basal Ganglia models and deep brain stimulation. J Neurosci 33: 4804–14.
Hayward G, Mehta MA, Harmer C, Spinks TJ, Grasby PM, Goodwin GM (2007). Exploring the
physiological effects of double-cone coil TMS over the medial frontal cortex on the anterior
cingulate cortex: an H2(15)O PET study. Eur J Neurosci 25: 2224–33.
Hazari N, Narayanaswamy JC, Arumugham SS (2016). Predictors of response to serotonin
reuptake inhibitors in obsessive-compulsive disorder. Expert Rev Neurother 16: 1175–91.
He BJ, Snyder AZ, Zempel JM, Smyth MD, Raichle ME (2008). Electrophysiological correlates
of the brain’s intrinsic large-scale functional architecture. Proc Natl Acad Sci U S A 105:
16039–44.
318
He Y, Wang J, Wang L, Chen ZJ, Yan C, Yang H, et al (2009). Uncovering intrinsic modular
organization of spontaneous brain activity in humans. PLoS One 4: e5226.
Hebb DO (John Wiley and Sons: 1949). The organization of behavior: A neuropsychological
theory. doi:10.1002/sce.37303405110.
Heeger DJ, Ress D (2002). What does fMRI tell us about neuronal activity? Nat Rev Neurosci 3:
142–51.
Hees MLJM van, Rotter T, Ellermann T, Evers SMAA (2013). The effectiveness of individual
interpersonal psychotherapy as a treatment for major depressive disorder in adult
outpatients: a systematic review. BMC Psychiatry 13: 22.
Hegde A, Ravi M, S S V, Arumugham SS, Thirthalli J, Janardhan Reddy YC (2016). Repetitive
Transcranial Magnetic Stimulation Over Presupplementary Motor Area May Not Be
Helpful in Treatment-Refractory Obsessive-Compulsive Disorder: A Case Series. J ECT 32:
139–42.
Henssen A, Zilles K, Palomero-Gallagher N, Schleicher A, Mohlberg H, Gerboga F, et al (2016).
Cytoarchitecture and probability maps of the human medial orbitofrontal cortex. Cortex 75:
87–112.
Herbsman T, Avery D, Ramsey D, Holtzheimer P, Wadjik C, Hardaway F, et al (2009). More
lateral and anterior prefrontal coil location is associated with better repetitive transcranial
magnetic stimulation antidepressant response. Biol Psychiatry 66: 509–15.
Hermes D, Miller KJ, Vansteensel MJ, Aarnoutse EJ, Leijten FSS, Ramsey NF (2012).
Neurophysiologic correlates of fMRI in human motor cortex. Hum Brain Mapp 33: 1689–
99.
Hermundstad AM, Bassett DS, Brown KS, Aminoff EM, Clewett D, Freeman S, et al (2013).
Structural foundations of resting-state and task-based functional connectivity in the human
brain. Proc Natl Acad Sci U S A 110: 6169–74.
Herpertz-Dahlmann BM, Wewetzer C, Schulz E, Remschmidt H (1996). Course and outcome in
adolescent anorexia nervosa. Int J Eat Disord 19: 335–45.
Herwig U, Padberg F, Unger J, Spitzer M, Schönfeldt-Lecuona C (2001a). Transcranial magnetic
stimulation in therapy studies: examination of the reliability of “standard” coil positioning
319
by neuronavigation. Biol Psychiatry 50: 58–61.
Herwig U, Schönfeldt-Lecuona C, Wunderlich AP, Tiesenhausen C von, Thielscher A, Walter H,
et al (2001b). The navigation of transcranial magnetic stimulation. Psychiatry Res 108:
123–31.
Herzog DB, Dorer DJ, Keel PK, Selwyn SE, Ekeblad ER, Flores AT, et al (1999). Recovery and
relapse in anorexia and bulimia nervosa: a 7.5-year follow-up study. J Am Acad Child
Adolesc Psychiatry 38: 829–37.
Heuvel MP van den, Mandl RCW, Kahn RS, Hulshoff Pol HE (2009). Functionally linked
resting-state networks reflect the underlying structural connectivity architecture of the
human brain. Hum Brain Mapp 30: 3127–41.
Heuvel OA van den, Werf YD van der, Verhoef KMW, Wit S de, Berendse HW, Wolters EC, et
al (2010). Frontal-striatal abnormalities underlying behaviours in the compulsive-impulsive
spectrum. J Neurol Sci 289: 55–9.
Hewitt PL, Flett GL, Turnbull-Donovan W, Mikail SF (1991). The Multidimensional
Perfectionism Scale: Reliability, validity, and psychometric properties in psychiatric
samples. Psychol Assess 3: 464–468.
Hieronymus F, Emilsson JF, Nilsson S, Eriksson E (2016). Consistent superiority of selective
serotonin reuptake inhibitors over placebo in reducing depressed mood in patients with
major depression. Mol Psychiatry 21: 523–30.
Hiltunen T, Kantola J, Abou Elseoud A, Lepola P, Suominen K, Starck T, et al (2014). Infra-
slow EEG fluctuations are correlated with resting-state network dynamics in fMRI. J
Neurosci 34: 356–62.
Hindriks R, Adhikari MH, Murayama Y, Ganzetti M, Mantini D, Logothetis NK, et al (2016).
Can sliding-window correlations reveal dynamic functional connectivity in resting-state
fMRI? Neuroimage 127: 242–256.
Hintiryan H, Foster NN, Bowman I, Bay M, Song MY, Gou L, et al (2016). The mouse cortico-
striatal projectome. Nat Neurosci 19: 1100–14.
Hipp JF, Hawellek DJ, Corbetta M, Siegel M, Engel AK (2012). Large-scale cortical correlation
structure of spontaneous oscillatory activity. Nat Neurosci 15: 884–90.
320
Hiser J, Koenigs M (2018). The Multifaceted Role of the Ventromedial Prefrontal Cortex in
Emotion, Decision Making, Social Cognition, and Psychopathology. Biol Psychiatry 83:
638–647.
Ho TC, Brown S, Serences JT (2009). Domain general mechanisms of perceptual decision
making in human cortex. J Neurosci 29: 8675–87.
Hoek HW (2006). Incidence, prevalence and mortality of anorexia nervosa and other eating
disorders. Curr Opin Psychiatry 19: 389–94.
Hoek HW, Harten PN van, Hermans KME, Katzman MA, Matroos GE, Susser ES (2005). The
incidence of anorexia nervosa on Curaçao. Am J Psychiatry 162: 748–52.
Hoexter MQ, Diniz JB, Lopes AC, Batistuzzo MC, Shavitt RG, Dougherty DD, et al (2015).
ORBITOFRONTAL THICKNESS AS A MEASURE FOR TREATMENT RESPONSE
PREDICTION IN OBSESSIVE-COMPULSIVE DISORDER. Depress Anxiety 32: 900–8.
Hoexter MQ, Souza Duran FL de, D’Alcante CC, Dougherty DD, Shavitt RG, Lopes AC, et al
(2012). Gray matter volumes in obsessive-compulsive disorder before and after fluoxetine
or cognitive-behavior therapy: a randomized clinical trial. Neuropsychopharmacology 37:
734–45.
Höflich G, Kasper S, Hufnagel A, Ruhrmann S, Möller H -J (1993). Application of transcranial
magnetic stimulation in treatment of drug-resistant major depression—a report of two cases.
Hum Psychopharmacol Clin Exp 8: 361–365.
Hofmann SG, Smits JAJ (2008). Cognitive-behavioral therapy for adult anxiety disorders: a
meta-analysis of randomized placebo-controlled trials. J Clin Psychiatry 69: 621–32.
Holmes AJ, Pizzagalli DA (2008). Response conflict and frontocingulate dysfunction in
unmedicated participants with major depression. Neuropsychologia 46: 2904–13.
Holtzheimer PE, Husain MM, Lisanby SH, Taylor SF, Whitworth LA, McClintock S, et al
(2017). Subcallosal cingulate deep brain stimulation for treatment-resistant depression: a
multisite, randomised, sham-controlled trial. The lancet Psychiatry 4: 839–849.
Holtzheimer PE, Kelley ME, Gross RE, Filkowski MM, Garlow SJ, Barrocas A, et al (2012).
Subcallosal cingulate deep brain stimulation for treatment-resistant unipolar and bipolar
depression. Arch Gen Psychiatry 69: 150–8.
321
Holtzheimer PE, McDonald WM, Mufti M, Kelley ME, Quinn S, Corso G, et al (2010).
Accelerated repetitive transcranial magnetic stimulation for treatment-resistant depression.
Depress Anxiety 27: 960–3.
Honey CJ, Sporns O, Cammoun L, Gigandet X, Thiran JP, Meuli R, et al (2009). Predicting
human resting-state functional connectivity from structural connectivity. Proc Natl Acad Sci
U S A 106: 2035–40.
Hornak J, O’Doherty J, Bramham J, Rolls ET, Morris RG, Bullock PR, et al (2004). Reward-
related reversal learning after surgical excisions in orbito-frontal or dorsolateral prefrontal
cortex in humans. J Cogn Neurosci 16: 463–78.
Hou J, Song L, Zhang W, Wu W, Wang J, Zhou D, et al (2013). Morphologic and functional
connectivity alterations of corticostriatal and default mode network in treatment-naïve
patients with obsessive-compulsive disorder. PLoS One 8: e83931.
Huang Y-Z, Chen R-S, Rothwell JC, Wen H-Y (2007). The after-effect of human theta burst
stimulation is NMDA receptor dependent. Clin Neurophysiol 118: 1028–1032.
Huang Y-Z, Edwards MJ, Rounis E, Bhatia KP, Rothwell JC (2005). Theta burst stimulation of
the human motor cortex. Neuron 45: 201–6.
Hubel DH (W. H. Freeman: 1988). Eye, Brain, and Vision. Color Res Appl 13: .
Hudson JI, Hiripi E, Pope HG, Kessler RC (2007). The prevalence and correlates of eating
disorders in the National Comorbidity Survey Replication. Biol Psychiatry 61: 348–58.
Huettel SA, McKeown MJ, Song AW, Hart S, Spencer DD, Allison T, et al (2004). Linking
hemodynamic and electrophysiological measures of brain activity: evidence from functional
MRI and intracranial field potentials. Cereb Cortex 14: 165–73.
Huettel SA, Stowe CJ, Gordon EM, Warner BT, Platt ML (2006). Neural signatures of economic
preferences for risk and ambiguity. Neuron 49: 765–75.
Hutchison RM, Womelsdorf T, Allen EA, Bandettini PA, Calhoun VD, Corbetta M, et al (2013).
Dynamic functional connectivity: promise, issues, and interpretations. Neuroimage 80: 360–
78.
Huyser C, Heuvel OA van den, Wolters LH, Haan E de, Boer F, Veltman DJ (2013). Increased
orbital frontal gray matter volume after cognitive behavioural therapy in paediatric
322
obsessive compulsive disorder. World J Biol Psychiatry 14: 319–31.
Hwang JM, Kim Y-H, Yoon KJ, Uhm KE, Chang WH (2015). Different responses to facilitatory
rTMS according to BDNF genotype. Clin Neurophysiol 126: 1348–53.
Hwang K, Bertolero MA, Liu WB, D’Esposito M (2017). The Human Thalamus Is an Integrative
Hub for Functional Brain Networks. J Neurosci 37: 5594–5607.
Insel TR (2014). The NIMH Research Domain Criteria (RDoC) Project: precision medicine for
psychiatry. Am J Psychiatry 171: 395–7.
Insel TR, Cuthbert BN (2015). Medicine. Brain disorders? Precisely. Science 348: 499–500.
Ishak WW, Balayan K, Bresee C, Greenberg JM, Fakhry H, Christensen S, et al (2013). A
descriptive analysis of quality of life using patient-reported measures in major depressive
disorder in a naturalistic outpatient setting. Qual Life Res 22: 585–96.
Israël M, Steiger H, Kolivakis T, McGregor L, Sadikot AF (2010). Deep brain stimulation in the
subgenual cingulate cortex for an intractable eating disorder. Biol Psychiatry 67: e53-4.
Isserles M, Shalev AY, Roth Y, Peri T, Kutz I, Zlotnick E, et al (2013). Effectiveness of deep
transcranial magnetic stimulation combined with a brief exposure procedure in post-
traumatic stress disorder--a pilot study. Brain Stimul 6: 377–83.
Iwabuchi SJ, Krishnadas R, Li C, Auer DP, Radua J, Palaniyappan L (2015). Localized
connectivity in depression: a meta-analysis of resting state functional imaging studies.
Neurosci Biobehav Rev 51: 77–86.
Jakab A, Molnár PP, Bogner P, Béres M, Berényi EL (2012). Connectivity-based parcellation
reveals interhemispheric differences in the insula. Brain Topogr 25: 264–71.
Jakobs O, Langner R, Caspers S, Roski C, Cieslik EC, Zilles K, et al (2012). Across-study and
within-subject functional connectivity of a right temporo-parietal junction subregion
involved in stimulus-context integration. Neuroimage 60: 2389–98.
Jakobsen JC, Hansen JL, Simonsen S, Simonsen E, Gluud C (2012). Effects of cognitive therapy
versus interpersonal psychotherapy in patients with major depressive disorder: a systematic
review of randomized clinical trials with meta-analyses and trial sequential analyses.
Psychol Med 42: 1343–57.
Jakubovski E, Diniz JB, Valerio C, Fossaluza V, Belotto-Silva C, Gorenstein C, et al (2013).
323
Clinical predictors of long-term outcome in obsessive-compulsive disorder. Depress Anxiety
30: 763–72.
Jenkinson M, Bannister P, Brady M, Smith S (2002). Improved optimization for the robust and
accurate linear registration and motion correction of brain images. Neuroimage 17: 825–41.
Jenkinson M, Beckmann CF, Behrens TEJ, Woolrich MW, Smith SM (2012). FSL. Neuroimage
62: 782–90.
Jiang A, Kennedy DN, Baker JR, Weisskoff RM, Tootell RBH, Woods RP, et al (1995). Motion
detection and correction in functional MR imaging. Hum Brain Mapp 3: 224–235.
Jiang J, Beck J, Heller K, Egner T (2015). An insula-frontostriatal network mediates flexible
cognitive control by adaptively predicting changing control demands. Nat Commun 6: 8165.
Jiménez F, Nicolini H, Lozano AM, Piedimonte F, Salín R, Velasco F (2013). Electrical
stimulation of the inferior thalamic peduncle in the treatment of major depression and
obsessive compulsive disorders. World Neurosurg 80: S30.e17-25.
Jo HJ, Gotts SJ, Reynolds RC, Bandettini PA, Martin A, Cox RW, et al (2013). Effective
Preprocessing Procedures Virtually Eliminate Distance-Dependent Motion Artifacts in
Resting State FMRI. J Appl Math 2013: .
Jo HJ, Saad ZS, Simmons WK, Milbury LA, Cox RW (2010). Mapping sources of correlation in
resting state FMRI, with artifact detection and removal. Neuroimage 52: 571–82.
Johnstone T, Reekum CM van, Urry HL, Kalin NH, Davidson RJ (2007). Failure to regulate:
counterproductive recruitment of top-down prefrontal-subcortical circuitry in major
depression. J Neurosci 27: 8877–8884.
Jones EG, Burton H (1976). Areal differences in the laminar distribution of thalamic afferents in
cortical fields of the insular, parietal and temporal regions of primates. J Comp Neurol 168:
197–247.
Jones TB, Bandettini PA, Kenworthy L, Case LK, Milleville SC, Martin A, et al (2010). Sources
of group differences in functional connectivity: an investigation applied to autism spectrum
disorder. Neuroimage 49: 401–14.
Joos AAB, Saum B, Zeeck A, Perlov E, Glauche V, Hartmann A, et al (2011). Frontocingular
dysfunction in bulimia nervosa when confronted with disease-specific stimuli. Eur Eat
324
Disord Rev 19: 447–53.
Jung Y-C, Schulte T, Müller-Oehring EM, Hawkes W, Namkoong K, Pfefferbaum A, et al
(2014). Synchrony of anterior cingulate cortex and insular-striatal activation predicts
ambiguity aversion in individuals with low impulsivity. Cereb Cortex 24: 1397–408.
Jutten C, Herault J (1991). Blind separation of sources, part I: An adaptive algorithm based on
neuromimetic architecture. Signal Processing 24: 1–10.
Kaczkurkin AN, Moore TM, Calkins ME, Ciric R, Detre JA, Elliott MA, et al (2017). Common
and dissociable regional cerebral blood flow differences associate with dimensions of
psychopathology across categorical diagnoses. Mol Psychiatry (in press): .
Kahn I, Desai M, Knoblich U, Bernstein J, Henninger M, Graybiel AM, et al (2011).
Characterization of the functional MRI response temporal linearity via optical control of
neocortical pyramidal neurons. J Neurosci 31: 15086–91.
Kahn I, Knoblich U, Desai M, Bernstein J, Graybiel AM, Boyden ES, et al (2013). Optogenetic
drive of neocortical pyramidal neurons generates fMRI signals that are correlated with
spiking activity. Brain Res 1511: 33–45.
Kahnt T, Tobler PN (2013). Salience signals in the right temporoparietal junction facilitate
value-based decisions. J Neurosci 33: 863–9.
Kaiser RH, Whitfield-Gabrieli S, Dillon DG, Goer F, Beltzer M, Minkel J, et al (2016). Dynamic
Resting-State Functional Connectivity in Major Depression. Neuropsychopharmacology 41:
1822–30.
Kalaska JF, Cisek P, Gosselin-Kessiby N (2003). Mechanisms of selection and guidance of
reaching movements in the parietal lobe. Adv Neurol 93: 97–119.
Kanno M, Matsumoto M, Togashi H, Yoshioka M, Mano Y (2004). Effects of acute repetitive
transcranial magnetic stimulation on dopamine release in the rat dorsolateral striatum. J
Neurol Sci 217: 73–81.
Kannurpatti SS, Biswal BB, Kim YR, Rosen BR (2008). Spatio-temporal characteristics of low-
frequency BOLD signal fluctuations in isoflurane-anesthetized rat brain. Neuroimage 40:
1738–47.
Kaplan AS, Walsh BT, Olmsted M, Attia E, Carter JC, Devlin MJ, et al (2009). The slippery
325
slope: prediction of successful weight maintenance in anorexia nervosa. Psychol Med 39:
1037–45.
Kaye WH, Nagata T, Weltzin TE, Hsu LK, Sokol MS, McConaha C, et al (2001). Double-blind
placebo-controlled administration of fluoxetine in restricting- and restricting-purging-type
anorexia nervosa. Biol Psychiatry 49: 644–52.
Kayser S, Bewernick BH, Grubert C, Hadrysiewicz BL, Axmacher N, Schlaepfer TE (2011).
Antidepressant effects, of magnetic seizure therapy and electroconvulsive therapy, in
treatment-resistant depression. J Psychiatr Res 45: 569–76.
Kayser S, Bewernick BH, Matusch A, Hurlemann R, Soehle M, Schlaepfer TE (2015). Magnetic
seizure therapy in treatment-resistant depression: clinical, neuropsychological and
metabolic effects. Psychol Med 45: 1073–92.
Kedzior KK, Azorina V, Reitz SK (2014). More female patients and fewer stimuli per session
are associated with the short-term antidepressant properties of repetitive transcranial
magnetic stimulation (rTMS): a meta-analysis of 54 sham-controlled studies published
between 1997-2013. Neuropsychiatr Dis Treat 10: 727–56.
Keel PK, Brown TA (2010). Update on course and outcome in eating disorders. Int J Eat Disord
43: 195–204.
Keel PK, Dorer DJ, Franko DL, Jackson SC, Herzog DB (2005). Postremission predictors of
relapse in women with eating disorders. Am J Psychiatry 162: 2263–8.
Keel PK, Klump KL (2003). Are eating disorders culture-bound syndromes? Implications for
conceptualizing their etiology. Psychol Bull 129: 747–69.
Kekic M, McClelland J, Bartholdy S, Boysen E, Musiat P, Dalton B, et al (2017). Single-Session
Transcranial Direct Current Stimulation Temporarily Improves Symptoms, Mood, and Self-
Regulatory Control in Bulimia Nervosa: A Randomised Controlled Trial. PLoS One 12:
e0167606.
Kekic M, McClelland J, Campbell I, Nestler S, Rubia K, David AS, et al (2014). The effects of
prefrontal cortex transcranial direct current stimulation (tDCS) on food craving and
temporal discounting in women with frequent food cravings. Appetite 78: 55–62.
Keller CJ, Bickel S, Honey CJ, Groppe DM, Entz L, Craddock RC, et al (2013).
326
Neurophysiological investigation of spontaneous correlated and anticorrelated fluctuations
of the BOLD signal. J Neurosci 33: 6333–42.
Keller MB, Herzog DB, Lavori PW, Bradburn IS, Mahoney ES (1992). The naturalistic history
of bulimia nervosa: Extraordinarily high rates of chronicity, relapse, recurrence, and
psychosocial morbidity. Int J Eat Disord 12: 1–9.
Kellner CH, Knapp R, Husain MM, Rasmussen K, Sampson S, Cullum M, et al (2010).
Bifrontal, bitemporal and right unilateral electrode placement in ECT: randomised trial. Br J
Psychiatry 196: 226–34.
Kellner M (2010). Drug treatment of obsessive-compulsive disorder. Dialogues Clin Neurosci
12: 187–97.
Kelly AMC, Uddin LQ, Biswal BB, Castellanos FX, Milham MP (2008). Competition between
functional brain networks mediates behavioral variability. Neuroimage 39: 527–37.
Kemp JM, Powell TP (1971). The connexions of the striatum and globus pallidus: synthesis and
speculation. Philos Trans R Soc Lond B Biol Sci 262: 441–57.
Kendler KS, Aggen SH, Knudsen GP, Røysamb E, Neale MC, Reichborn-Kjennerud T (2011).
The structure of genetic and environmental risk factors for syndromal and subsyndromal
common DSM-IV axis I and all axis II disorders. Am J Psychiatry 168: 29–39.
Kendler KS, Prescott CA, Myers J, Neale MC (2003). The structure of genetic and
environmental risk factors for common psychiatric and substance use disorders in men and
women. Arch Gen Psychiatry 60: 929–37.
Kennedy SH, Giacobbe P, Rizvi SJ, Placenza FM, Nishikawa Y, Mayberg HS, et al (2011).
Deep brain stimulation for treatment-resistant depression: follow-up after 3 to 6 years. Am J
Psychiatry 168: 502–10.
Kennedy SH, Lam RW, McIntyre RS, Tourjman SV, Bhat V, Blier P, et al (2016). Canadian
Network for Mood and Anxiety Treatments (CANMAT) 2016 Clinical Guidelines for the
Management of Adults with Major Depressive Disorder: Section 3. Pharmacological
Treatments. Can J Psychiatry 61: 540–60.
Kerestes R, Harrison BJ, Dandash O, Stephanou K, Whittle S, Pujol J, et al (2015). Specific
functional connectivity alterations of the dorsal striatum in young people with depression.

327
NeuroImage Clin 7: 266–72.
Keski-Rahkonen A, Hoek HW, Linna MS, Raevuori A, Sihvola E, Bulik CM, et al (2009).
Incidence and outcomes of bulimia nervosa: a nationwide population-based study. Psychol
Med 39: 823–31.
Kessler D, Angstadt M, Sripada CS (2017). Reevaluating “cluster failure” in fMRI using
nonparametric control of the false discovery rate. Proc Natl Acad Sci U S A 114: E3372–
E3373.
Kessler RC, Barber C, Birnbaum HG, Frank RG, Greenberg PE, Rose RM, et al (1999).
Depression in the workplace: effects on short-term disability. Health Aff (Millwood) 18:
163–71.
Kessler RC, Berglund P, Demler O, Jin R, Koretz D, Merikangas KR, et al (2003). The
epidemiology of major depressive disorder: results from the National Comorbidity Survey
Replication (NCS-R). JAMA 289: 3095–105.
Kessler RC, Chiu WT, Demler O, Merikangas KR, Walters EE (2005). Prevalence, severity, and
comorbidity of 12-month DSM-IV disorders in the National Comorbidity Survey
Replication. Arch Gen Psychiatry 62: 617–27.
Kety SS, Schmidt CF (1948). THE NITROUS OXIDE METHOD FOR THE QUANTITATIVE
DETERMINATION OF CEREBRAL BLOOD FLOW IN MAN: THEORY, PROCEDURE
AND NORMAL VALUES. J Clin Invest 27: 476–83.
Khedr EM, Elfetoh NA, Ali AM, Noamany M (2014). Anodal transcranial direct current
stimulation over the dorsolateral prefrontal cortex improves anorexia nervosa: A pilot study.
Restor Neurol Neurosci 32: 789–97.
Kim B, Boes JL, Bland PH, Chenevert TL, Meyer CR (1999). Motion correction in fMRI via
registration of individual slices into an anatomical volume. Magn Reson Med 41: 964–72.
Kim C, Choi HE, Jung H, Lee B-J, Lee KH, Lim Y-J (2014). Comparison of the Effects of 1 Hz
and 20 Hz rTMS on Motor Recovery in Subacute Stroke Patients. Ann Rehabil Med 38:
585–91.
Kim H (2012). A dual-subsystem model of the brain’s default network: self-referential
processing, memory retrieval processes, and autobiographical memory retrieval.
328
Neuroimage 61: 966–77.
Kim HF, Hikosaka O (2015). Parallel basal ganglia circuits for voluntary and automatic
behaviour to reach rewards. Brain 138: 1776–800.
Kimbrell TA, Little JT, Dunn RT, Frye MA, Greenberg BD, Wassermann EM, et al (1999).
Frequency dependence of antidepressant response to left prefrontal repetitive transcranial
magnetic stimulation (rTMS) as a function of baseline cerebral glucose metabolism. Biol
Psychiatry 46: 1603–13.
Kimura M (1990). Behaviorally contingent property of movement-related activity of the primate
putamen. J Neurophysiol 63: 1277–96.
Kimura M, Kato M, Shimazaki H, Watanabe K, Matsumoto N (1996). Neural information
transferred from the putamen to the globus pallidus during learned movement in the
monkey. J Neurophysiol 76: 3771–86.
Kirby KN, Marakovic NN (1996). Delay-discounting probabilistic rewards: Rates decrease as
amounts increase. Psychon Bull Rev 3: 100–104.
Kito S, Hasegawa T, Koga Y (2012a). Cerebral blood flow in the ventromedial prefrontal cortex
correlates with treatment response to low-frequency right prefrontal repetitive transcranial
magnetic stimulation in the treatment of depression. Psychiatry Clin Neurosci 66: 138–45.
Kito S, Hasegawa T, Koga Y (2012b). Cerebral blood flow ratio of the dorsolateral prefrontal
cortex to the ventromedial prefrontal cortex as a potential predictor of treatment response to
transcranial magnetic stimulation in depression. Brain Stimul 5: 547–53.
Kiviniemi V, Kantola J-H, Jauhiainen J, Hyvärinen A, Tervonen O (2003). Independent
component analysis of nondeterministic fMRI signal sources. Neuroimage 19: 253–60.
Kiviniemi V, Vire T, Remes J, Elseoud AA, Starck T, Tervonen O, et al (2011). A sliding time-
window ICA reveals spatial variability of the default mode network in time. Brain Connect
1: 339–47.
Klein E, Kolsky Y, Puyerovsky M, Koren D, Chistyakov A, Feinsod M (1999). Right prefrontal
slow repetitive transcranial magnetic stimulation in schizophrenia: a double-blind sham-
controlled pilot study. Biol Psychiatry 46: 1451–4.
Klein TA, Endrass T, Kathmann N, Neumann J, Cramon DY von, Ullsperger M (2007). Neural
329
correlates of error awareness. Neuroimage 34: 1774–81.
Klump KL, Miller KB, Keel PK, McGue M, Iacono WG (2001). Genetic and environmental
influences on anorexia nervosa syndromes in a population-based twin sample. Psychol Med
31: 737–40.
Knopp J, Knowles S, Bee P, Lovell K, Bower P (2013). A systematic review of predictors and
moderators of response to psychological therapies in OCD: do we have enough empirical
evidence to target treatment? Clin Psychol Rev 33: 1067–81.
Knutson B, Bhanji JP, Cooney RE, Atlas LY, Gotlib IH (2008). Neural responses to monetary
incentives in major depression. Biol Psychiatry 63: 686–92.
Knutson B, Greer SM (2008). Anticipatory affect: neural correlates and consequences for choice.
Philos Trans R Soc Lond B Biol Sci 363: 3771–86.
Knutson B, Rick S, Wimmer GE, Prelec D, Loewenstein G (2007). Neural predictors of
purchases. Neuron 53: 147–56.
Kobayashi Y, Amaral DG (2003). Macaque monkey retrosplenial cortex: II. Cortical afferents. J
Comp Neurol 466: 48–79.
Kobayashi Y, Amaral DG (2007). Macaque monkey retrosplenial cortex: III. Cortical efferents. J
Comp Neurol 502: 810–33.
Koch K, Reeß TJ, Rus OG, Gürsel DA, Wagner G, Berberich G, et al (2018). Increased Default
Mode Network Connectivity in Obsessive-Compulsive Disorder During Reward
Processing. Front psychiatry 9: 254.
Koechlin E, Ody C, Kouneiher F (2003). The architecture of cognitive control in the human
prefrontal cortex. Science 302: 1181–5.
Kolbinger HM, Höflich G, Hufnagel A, Müller H-J, Kasper S (1995). Transcranial magnetic
stimulation (TMS) in the treatment of major depression: A pilot study. Hum
Psychopharmacol Clin Exp 10: 305–310.
Korgaonkar MS, Williams LM, Song YJ, Usherwood T, Grieve SM (2014). Diffusion tensor
imaging predictors of treatment outcomes in major depressive disorder. Br J Psychiatry
205: 321–8.
Kortegaard LS, Hoerder K, Joergensen J, Gillberg C, Kyvik KO (2001). A preliminary

330
population-based twin study of self-reported eating disorder. Psychol Med 31: 361–5.
Kosillo P, Smith AT (2010). The role of the human anterior insular cortex in time processing.
Brain Struct Funct 214: 623–8.
Koyama MS, Martino A Di, Zuo X-N, Kelly C, Mennes M, Jutagir DR, et al (2011). Resting-
state functional connectivity indexes reading competence in children and adults. J Neurosci
31: 8617–24.
Kozel FA, Johnson KA, Nahas Z, Nakonezny PA, Morgan PS, Anderson BS, et al (2011).
Fractional anisotropy changes after several weeks of daily left high-frequency repetitive
transcranial magnetic stimulation of the prefrontal cortex to treat major depression. J ECT
27: 5–10.
Krall SC, Rottschy C, Oberwelland E, Bzdok D, Fox PT, Eickhoff SB, et al (2015). The role of
the right temporoparietal junction in attention and social interaction as revealed by ALE
meta-analysis. Brain Struct Funct 220: 587–604.
Kreuzer PM, Schecklmann M, Lehner A, Wetter TC, Poeppl TB, Rupprecht R, et al (2015). The
ACDC pilot trial: targeting the anterior cingulate by double cone coil rTMS for the
treatment of depression. Brain Stimul 8: 240–6.
Krienen FM, Yeo BTT, Buckner RL (2014). Reconfigurable task-dependent functional coupling
modes cluster around a core functional architecture. Philos Trans R Soc Lond B Biol Sci
369: .
Kringelbach ML (2005). The human orbitofrontal cortex: linking reward to hedonic experience.
Nat Rev Neurosci 6: 691–702.
Kringelbach ML, Rolls ET (2004). The functional neuroanatomy of the human orbitofrontal
cortex: evidence from neuroimaging and neuropsychology. Prog Neurobiol 72: 341–72.
Krings T, Chiappa KH, Foltys H, Reinges MH, Cosgrove GR, Thron A (2001). Introducing
navigated transcranial magnetic stimulation as a refined brain mapping methodology.
Neurosurg Rev 24: 171–9.
Kroenke K, Spitzer RL, Williams JBW (2001). The PHQ-9: Validity of a brief depression
severity measure. J Gen Intern Med 16: 606–613.
Krueger RF (1999). The structure of common mental disorders. Arch Gen Psychiatry 56: 921–6.
331
Kruggel F, Cramon DY von (1999). Temporal properties of the hemodynamic response in
functional MRI. Hum Brain Mapp 8: 259–71.
Kucyi A, Davis KD (2014). Dynamic functional connectivity of the default mode network tracks
daydreaming. Neuroimage 100: 471–80.
Kucyi A, Schrouff J, Bickel S, Foster BL, Shine JM, Parvizi J (2018). Intracranial
Electrophysiology Reveals Reproducible Intrinsic Functional Connectivity within Human
Brain Networks. J Neurosci 38: 4230–4242.
Kühn S, Gallinat J (2013). Gray Matter Correlates of Posttraumatic Stress Disorder: A
Quantitative Meta-Analysis. Biol Psychiatry 73: 70–74.
Kühn S, Gallinat J, Brass M (2011). “Keep calm and carry on”: structural correlates of
expressive suppression of emotions. PLoS One 6: e16569.
Kühn S, Kaufmann C, Simon D, Endrass T, Gallinat J, Kathmann N (2013). Reduced thickness
of anterior cingulate cortex in obsessive-compulsive disorder. Cortex 49: 2178–85.
Kullmann S, Giel KE, Hu X, Bischoff SC, Teufel M, Thiel A, et al (2014). Impaired inhibitory
control in anorexia nervosa elicited by physical activity stimuli. Soc Cogn Affect Neurosci
9: 917–23.
Kumar N, Chadda RK (2011). Augmentation effect of repetitive transcranial magnetic
stimulation over the supplementary motor cortex in treatment refractory patients with
obsessive compulsive disorder. Indian J Psychiatry 53: 340–2.
Kunishio K, Haber SN (1994). Primate cingulostriatal projection: limbic striatal versus
sensorimotor striatal input. J Comp Neurol 350: 337–56.
Künzle H (1975). Bilateral projections from precentral motor cortex to the putamen and other
parts of the basal ganglia. An autoradiographic study in Macaca fascicularis. Brain Res 88:
195–209.
Kuperberg GR, Lakshmanan BM, Greve DN, West WC (2008). Task and semantic relationship
influence both the polarity and localization of hemodynamic modulation during lexico-
semantic processing. Hum Brain Mapp 29: 544–61.
Kuroda Y, Motohashi N, Ito H, Ito S, Takano A, Nishikawa T, et al (2006). Effects of repetitive
transcranial magnetic stimulation on [11C]raclopride binding and cognitive function in
332
patients with depression. J Affect Disord 95: 35–42.
Kuroda Y, Motohashi N, Ito H, Ito S, Takano A, Takahashi H, et al (2010). Chronic repetitive
transcranial magnetic stimulation failed to change dopamine synthesis rate: preliminary L-
[β-11C]DOPA positron emission tomography study in patients with depression. Psychiatry
Clin Neurosci 64: 659–62.
Kurth F, Zilles K, Fox PT, Laird AR, Eickhoff SB (2010). A link between the systems:
functional differentiation and integration within the human insula revealed by meta-
analysis. Brain Struct Funct 214: 519–34.
Kuyken W, Hayes R, Barrett B, Byng R, Dalgleish T, Kessler D, et al (2015). Effectiveness and
cost-effectiveness of mindfulness-based cognitive therapy compared with maintenance
antidepressant treatment in the prevention of depressive relapse or recurrence (PREVENT):
a randomised controlled trial. Lancet (London, England) 386: 63–73.
Kwong KK, Belliveau JW, Chesler DA, Goldberg IE, Weisskoff RM, Poncelet BP, et al (1992).
Dynamic magnetic resonance imaging of human brain activity during primary sensory
stimulation. Proc Natl Acad Sci U S A 89: 5675–9.
Labedi A, Benali A, Mix A, Neubacher U, Funke K (2014). Modulation of Inhibitory Activity
Markers by Intermittent Theta-burst Stimulation in Rat Cortex is NMDA-receptor
Dependent. Brain Stimul 7: 394–400.
LaConte S, Strother S, Cherkassky V, Anderson J, Hu X (2005). Support vector machines for
temporal classification of block design fMRI data. Neuroimage 26: 317–29.
Lahey BB, Applegate B, Hakes JK, Zald DH, Hariri AR, Rathouz PJ (2012). Is there a general
factor of prevalent psychopathology during adulthood? J Abnorm Psychol 121: 971–7.
Lai C-H, Wu Y-T (2015). The patterns of fractional amplitude of low-frequency fluctuations in
depression patients: the dissociation between temporal regions and fronto-parietal regions. J
Affect Disord 175: 441–5.
Lamichhane B, Dhamala M (2015). The Salience Network and Its Functional Architecture in a
Perceptual Decision: An Effective Connectivity Study. Brain Connect 5: 362–70.
Lan MJ, Chhetry BT, Liston C, Mann JJ, Dubin M (2016). Transcranial Magnetic Stimulation of
Left Dorsolateral Prefrontal Cortex Induces Brain Morphological Changes in Regions
333
Associated with a Treatment Resistant Major Depressive Episode: An Exploratory
Analysis. Brain Stimul 9: 577–83.
Landmann C, Dehaene S, Pappata S, Jobert A, Bottlaender M, Roumenov D, et al (2007).
Dynamics of prefrontal and cingulate activity during a reward-based logical deduction task.
Cereb Cortex 17: 749–59.
Lao-Kaim NP, Fonville L, Giampietro VP, Williams SCR, Simmons A, Tchanturia K (2015).
Aberrant function of learning and cognitive control networks underlie inefficient cognitive
flexibility in anorexia nervosa: a cross-sectional fMRI study. PLoS One 10: e0124027.
Lapenta OM, Sierve K Di, Macedo EC de, Fregni F, Boggio PS (2014). Transcranial direct
current stimulation modulates ERP-indexed inhibitory control and reduces food
consumption. Appetite 83: 42–8.
Larson-Prior LJ, Zempel JM, Nolan TS, Prior FW, Snyder AZ, Raichle ME (2009). Cortical
network functional connectivity in the descent to sleep. Proc Natl Acad Sci U S A 106:
4489–94.
Lask B, Bryant-Waugh R (1992). Early-onset anorexia nervosa and related eating disorders. J
Child Psychol Psychiatry 33: 281–300.
Latora V, Marchiori M (2001). Efficient behavior of small-world networks. Phys Rev Lett 87:
198701.
Laumann TO, Gordon EM, Adeyemo B, Snyder AZ, Joo SJ, Chen M-Y, et al (2015). Functional
System and Areal Organization of a Highly Sampled Individual Human Brain. Neuron 87:
657–70.
Lavenex P, Suzuki WA, Amaral DG (2002). Perirhinal and parahippocampal cortices of the
macaque monkey: projections to the neocortex. J Comp Neurol 447: 394–420.
Lazzaro V Di, Dileone M, Pilato F, Capone F, Musumeci G, Ranieri F, et al (2011). Modulation
of motor cortex neuronal networks by rTMS: comparison of local and remote effects of six
different protocols of stimulation. J Neurophysiol 105: 2150–6.
Leckman JF, Denys D, Simpson HB, Mataix-Cols D, Hollander E, Saxena S, et al (2010).
Obsessive-compulsive disorder: a review of the diagnostic criteria and possible subtypes
and dimensional specifiers for DSM-V. Depress Anxiety 27: 507–27.
334
LeDoux J (2003). The emotional brain, fear, and the amygdala. Cell Mol Neurobiol 23: 727–38.
Lee MH, Smyser CD, Shimony JS (2013). Resting-state fMRI: a review of methods and clinical
applications. AJNR Am J Neuroradiol 34: 1866–72.
Lee S, Ran Kim K, Ku J, Lee J-H, Namkoong K, Jung Y-C (2014). Resting-state synchrony
between anterior cingulate cortex and precuneus relates to body shape concern in anorexia
nervosa and bulimia nervosa. Psychiatry Res 221: 43–8.
Lefaucheur J-P, André-Obadia N, Antal A, Ayache SS, Baeken C, Benninger DH, et al (2014).
Evidence-based guidelines on the therapeutic use of repetitive transcranial magnetic
stimulation (rTMS). Clin Neurophysiol 125: 2150–206.
Lehéricy S, Ducros M, Krainik A, Francois C, Moortele P-F Van de, Ugurbil K, et al (2004). 3-
D diffusion tensor axonal tracking shows distinct SMA and pre-SMA projections to the
human striatum. Cereb Cortex 14: 1302–9.
Lehner A, Schecklmann M, Greenlee MW, Rupprecht R, Langguth B (2016). Triple-site rTMS
for the treatment of chronic tinnitus: a randomized controlled trial. Sci Rep 6: 22302.
Leichnetz GR (2001). Connections of the medial posterior parietal cortex (area 7m) in the
monkey. Anat Rec 263: 215–36.
Lemieux L, Salek-Haddadi A, Lund TE, Laufs H, Carmichael D (2007). Modelling large motion
events in fMRI studies of patients with epilepsy. Magn Reson Imaging 25: 894–901.
Lemogne C, Delaveau P, Freton M, Guionnet S, Fossati P (2012). Medial prefrontal cortex and
the self in major depression. J Affect Disord 136: e1–e11.
Lenz M, Galanis C, Müller-Dahlhaus F, Opitz A, Wierenga CJ, Szabó G, et al (2016). Repetitive
magnetic stimulation induces plasticity of inhibitory synapses. Nat Commun 7: 10020.
Lenz M, Platschek S, Priesemann V, Becker D, Willems LM, Ziemann U, et al (2015).
Repetitive magnetic stimulation induces plasticity of excitatory postsynapses on proximal
dendrites of cultured mouse CA1 pyramidal neurons. Brain Struct Funct 220: 3323–3337.
Lenz M, Vlachos A (2016). Releasing the Cortical Brake by Non-Invasive Electromagnetic
Stimulation? rTMS Induces LTD of GABAergic Neurotransmission. Front Neural Circuits
10: 96.
Leonardi N, Ville D Van De (2015). On spurious and real fluctuations of dynamic functional
335
connectivity during rest. Neuroimage 104: 430–6.
Levkovitz Y, Marx J, Grisaru N, Segal M (1999). Long-term effects of transcranial magnetic
stimulation on hippocampal reactivity to afferent stimulation. J Neurosci 19: 3198–203.
Lewis JW, Beauchamp MS, DeYoe EA (2000). A comparison of visual and auditory motion
processing in human cerebral cortex. Cereb Cortex 10: 873–88.
Li C-T, Chen M-H, Juan C-H, Huang H-H, Chen L-F, Hsieh J-C, et al (2014a). Efficacy of
prefrontal theta-burst stimulation in refractory depression: a randomized sham-controlled
study. Brain 137: 2088–98.
Li C-T, Lin C-P, Chou K-H, Chen I-Y, Hsieh J-C, Wu C-L, et al (2010a). Structural and
cognitive deficits in remitting and non-remitting recurrent depression: a voxel-based
morphometric study. Neuroimage 50: 347–56.
Li C-T, Wang S-J, Hirvonen J, Hsieh J-C, Bai Y-M, Hong C-J, et al (2010b). Antidepressant
mechanism of add-on repetitive transcranial magnetic stimulation in medication-resistant
depression using cerebral glucose metabolism. J Affect Disord 127: 219–29.
Li H-J, Cao X-H, Zhu X-T, Zhang A-X, Hou X-H, Xu Y, et al (2014b). Surface-based regional
homogeneity in first-episode, drug-naïve major depression: a resting-state FMRI study.
Biomed Res Int 2014: 374828.
Liang X, Wang J, Yan C, Shu N, Xu K, Gong G, et al (2012). Effects of different correlation
metrics and preprocessing factors on small-world brain functional networks: a resting-state
functional MRI study. PLoS One 7: e32766.
Likhtik E, Pelletier JG, Paz R, Paré D (2005). Prefrontal control of the amygdala. J Neurosci 25:
7429–37.
Lilenfeld LR, Kaye WH, Greeno CG, Merikangas KR, Plotnicov K, Pollice C, et al (1998). A
controlled family study of anorexia nervosa and bulimia nervosa: psychiatric disorders in
first-degree relatives and effects of proband comorbidity. Arch Gen Psychiatry 55: 603–10.
Lim K-L, Jacobs P, Ohinmaa A, Schopflocher D, Dewa CS (2008). A new population-based
measure of the economic burden of mental illness in Canada. Chronic Dis Can 28: 92–8.
Lindquist MA, Xu Y, Nebel MB, Caffo BS (2014). Evaluating dynamic bivariate correlations in
resting-state fMRI: a comparison study and a new approach. Neuroimage 101: 531–46.
336
Lippitz BE, Mindus P, Meyerson BA, Kihlström L, Lindquist C (1999). Lesion topography and
outcome after thermocapsulotomy or gamma knife capsulotomy for obsessive-compulsive
disorder: relevance of the right hemisphere. Neurosurgery 44: 452-8; discussion 458-60.
Lipsman N, Giacobbe P, Lozano AM (2013a). Deep brain stimulation in obsessive-compulsive
disorder: neurocircuitry and clinical experience. Handb Clin Neurol 116: 245–50.
Lipsman N, Lam E, Volpini M, Sutandar K, Twose R, Giacobbe P, et al (2017). Deep brain
stimulation of the subcallosal cingulate for treatment-refractory anorexia nervosa: 1 year
follow-up of an open-label trial. The lancet Psychiatry 4: 285–294.
Lipsman N, Woodside DB, Giacobbe P, Hamani C, Carter JC, Norwood SJ, et al (2013b).
Subcallosal cingulate deep brain stimulation for treatment-refractory anorexia nervosa: a
phase 1 pilot trial. Lancet (London, England) 381: 1361–70.
Lipsman N, Woodside DB, Giacobbe P, Lozano AM (2013c). Neurosurgical treatment of
anorexia nervosa: review of the literature from leucotomy to deep brain stimulation. Eur Eat
Disord Rev 21: 428–35.
Liston C, Chen AC, Zebley BD, Drysdale AT, Gordon R, Leuchter B, et al (2014). Default mode
network mechanisms of transcranial magnetic stimulation in depression. Biol Psychiatry 76:
517–26.
Liu F, Guo W, Liu L, Long Z, Ma C, Xue Z, et al (2013). Abnormal amplitude low-frequency
oscillations in medication-naive, first-episode patients with major depressive disorder: a
resting-state fMRI study. J Affect Disord 146: 401–6.
Liu X, Hairston J, Schrier M, Fan J (2011). Common and distinct networks underlying reward
valence and processing stages: a meta-analysis of functional neuroimaging studies.
Neurosci Biobehav Rev 35: 1219–36.
Lock J, Garrett A, Beenhakker J, Reiss AL (2011). Aberrant brain activation during a response
inhibition task in adolescent eating disorder subtypes. Am J Psychiatry 168: 55–64.
Logothetis NK (2003). The underpinnings of the BOLD functional magnetic resonance imaging
signal. J Neurosci 23: 3963–71.
Logothetis NK, Pauls J, Augath M, Trinath T, Oeltermann A (2001). Neurophysiological
investigation of the basis of the fMRI signal. Nature 412: 150–7.
337
Long X-Y, Zuo X-N, Kiviniemi V, Yang Y, Zou Q-H, Zhu C-Z, et al (2008). Default mode
network as revealed with multiple methods for resting-state functional MRI analysis. J
Neurosci Methods 171: 349–55.
Long Z, Li R, Wen X, Jin Z, Chen K, Yao L (2013). Separating 4D multi-task fMRI data of
multiple subjects by independent component analysis with projection. Magn Reson Imaging
31: 60–74.
Lopatina N, McDannald MA, Styer C V, Peterson JF, Sadacca BF, Cheer JF, et al (2016).
Medial Orbitofrontal Neurons Preferentially Signal Cues Predicting Changes in Reward
during Unblocking. J Neurosci 36: 8416–24.
Lopizzo N, Bocchio Chiavetto L, Cattane N, Plazzotta G, Tarazi FI, Pariante CM, et al (2015).
Gene-environment interaction in major depression: focus on experience-dependent
biological systems. Front psychiatry 6: 68.
Lozano AM, Lipsman N (2013). Probing and regulating dysfunctional circuits using deep brain
stimulation. Neuron 77: 406–24.
Lozano AM, Mayberg HS, Giacobbe P, Hamani C, Craddock RC, Kennedy SH (2008).
Subcallosal cingulate gyrus deep brain stimulation for treatment-resistant depression. Biol
Psychiatry 64: 461–7.
Lu H, Wang L, Rea WW, Brynildsen JK, Jaime S, Zuo Y, et al (2016). Low- but Not High-
Frequency LFP Correlates with Spontaneous BOLD Fluctuations in Rat Whisker Barrel
Cortex. Cereb Cortex 26: 683–694.
Lu H, Zou Q, Gu H, Raichle ME, Stein EA, Yang Y (2012). Rat brains also have a default mode
network. Proc Natl Acad Sci U S A 109: 3979–84.
Luborzewski A, Schubert F, Seifert F, Danker-Hopfe H, Brakemeier E-L, Schlattmann P, et al
(2007). Metabolic alterations in the dorsolateral prefrontal cortex after treatment with high-
frequency repetitive transcranial magnetic stimulation in patients with unipolar major
depression. J Psychiatr Res 41: 606–15.
Lucas AR, Beard CM, O’Fallon WM, Kurland LT (1991). 50-year trends in the incidence of
anorexia nervosa in Rochester, Minn.: a population-based study. Am J Psychiatry 148: 917–
22.
338
Luo Y, Huang X, Yang Z, Li B, Liu J, Wei D (2014). Regional homogeneity of intrinsic brain
activity in happy and unhappy individuals. PLoS One 9: e85181.
Lynd-Balta E, Haber SN (1994). Primate striatonigral projections: a comparison of the
sensorimotor-related striatum and the ventral striatum. J Comp Neurol 345: 562–78.
Lyons D, Friedman DP, Nader MA, Porrino LJ (1996). Cocaine alters cerebral metabolism
within the ventral striatum and limbic cortex of monkeys. J Neurosci 16: 1230–8.
Ma J, Zhang Z, Su Y, Kang L, Geng D, Wang Y, et al (2013). Magnetic stimulation modulates
structural synaptic plasticity and regulates BDNF–TrkB signal pathway in cultured
hippocampal neurons. Neurochem Int 62: 84–91.
Maarouf M, Neudorfer C, Majdoub F El, Lenartz D, Kuhn J, Sturm V (2016). Deep Brain
Stimulation of Medial Dorsal and Ventral Anterior Nucleus of the Thalamus in OCD: A
Retrospective Case Series. PLoS One 11: e0160750.
Maat SM de, Dekker J, Schoevers RA, Jonghe F de (2007). Relative efficacy of psychotherapy
and combined therapy in the treatment of depression: a meta-analysis. Eur Psychiatry 22:
1–8.
MacDonald AW, Cohen JD, Stenger VA, Carter CS (2000). Dissociating the role of the
dorsolateral prefrontal and anterior cingulate cortex in cognitive control. Science 288:
1835–8.
Maddocks SE, Kaplan AS, Woodside DB, Langdon L, Piran N (1992). Two year follow-up of
bulimia nervosa: The importance of abstinence as the criterion of outcome. Int J Eat Disord
12: 133–141.
Madhyastha TM, Askren MK, Boord P, Grabowski TJ (2015). Dynamic connectivity at rest
predicts attention task performance. Brain Connect 5: 45–59.
Maeda F, Keenan JP, Tormos JM, Topka H, Pascual-Leone A (2000). Modulation of
corticospinal excitability by repetitive transcranial magnetic stimulation. Clin Neurophysiol
111: 800–5.
Maillet D, Rajah MN (2014). Dissociable roles of default-mode regions during episodic
encoding. Neuroimage 89: 244–55.
Maintz JB, Viergever MA (1998). A survey of medical image registration. Med Image Anal 2: 1–
339
36.
Mallet L, Polosan M, Jaafari N, Baup N, Welter M-L, Fontaine D, et al (2008). Subthalamic
nucleus stimulation in severe obsessive-compulsive disorder. N Engl J Med 359: 2121–34.
Manelis A, Almeida JRC, Stiffler R, Lockovich JC, Aslam HA, Phillips ML (2016).
Anticipation-related brain connectivity in bipolar and unipolar depression: a graph theory
approach. Brain 139: 2554–66.
Manning JR, Jacobs J, Fried I, Kahana MJ (2009). Broadband shifts in local field potential
power spectra are correlated with single-neuron spiking in humans. J Neurosci 29: 13613–
20.
Mansur CG, Myczkowki ML, Barros Cabral S de, Sartorelli M do CB, Bellini BB, Dias AM, et
al (2011). Placebo effect after prefrontal magnetic stimulation in the treatment of resistant
obsessive-compulsive disorder: a randomized controlled trial. Int J Neuropsychopharmacol
14: 1389–97.
Mantini D, Perrucci MG, Gratta C Del, Romani GL, Corbetta M (2007). Electrophysiological
signatures of resting state networks in the human brain. Proc Natl Acad Sci U S A 104:
13170–5.
Mantovani A, Lisanby SH, Pieraccini F, Ulivelli M, Castrogiovanni P, Rossi S (2006).
Repetitive transcranial magnetic stimulation (rTMS) in the treatment of obsessive-
compulsive disorder (OCD) and Tourette’s syndrome (TS). Int J Neuropsychopharmacol 9:
95–100.
Mantovani A, Simpson HB, Fallon BA, Rossi S, Lisanby SH (2010). Randomized sham-
controlled trial of repetitive transcranial magnetic stimulation in treatment-resistant
obsessive-compulsive disorder. Int J Neuropsychopharmacol 13: 217–27.
Manwaring JL, Green L, Myerson J, Strube MJ, Wilfley DE (2011). Discounting of Various
types of rewards by women with and without binge eating Disorder: Evidence for general
rather than specific Differences. Psychol Rec 61: 561–582.
Margulies DS, Böttger J, Long X, Lv Y, Kelly C, Schäfer A, et al (2010). Resting developments:
a review of fMRI post-processing methodologies for spontaneous brain activity. MAGMA
23: 289–307.
340
Marsh R, Horga G, Wang Z, Wang P, Klahr KW, Berner LA, et al (2011). An FMRI study of
self-regulatory control and conflict resolution in adolescents with bulimia nervosa. Am J
Psychiatry 168: 1210–20.
Marsh R, Maia T V, Peterson BS (2009a). Functional disturbances within frontostriatal circuits
across multiple childhood psychopathologies. Am J Psychiatry 166: 664–74.
Marsh R, Steinglass JE, Gerber AJ, Graziano O’Leary K, Wang Z, Murphy D, et al (2009b).
Deficient activity in the neural systems that mediate self-regulatory control in bulimia
nervosa. Arch Gen Psychiatry 66: 51–63.
Martin JLR, Martín-Sánchez E (2012). Systematic review and meta-analysis of vagus nerve
stimulation in the treatment of depression: variable results based on study designs. Eur
Psychiatry 27: 147–55.
Martino A Di, Scheres A, Margulies DS, Kelly AMC, Uddin LQ, Shehzad Z, et al (2008).
Functional connectivity of human striatum: a resting state FMRI study. Cereb Cortex 18:
2735–47.
Martuzzi R, Ramani R, Qiu M, Shen X, Papademetris X, Constable RT (2011). A whole-brain
voxel based measure of intrinsic connectivity contrast reveals local changes in tissue
connectivity with anesthetic without a priori assumptions on thresholds or regions of
interest. Neuroimage 58: 1044–50.
Mason MF, Norton MI, Horn JD Van, Wegner DM, Grafton ST, Macrae CN (2007). Wandering
minds: the default network and stimulus-independent thought. Science 315: 393–5.
Matsunaga H, Nagata T, Hayashida K, Ohya K, Kiriike N, Stein DJ (2009). A long-term trial of
the effectiveness and safety of atypical antipsychotic agents in augmenting SSRI-refractory
obsessive-compulsive disorder. J Clin Psychiatry 70: 863–8.
May A (2011). Experience-dependent structural plasticity in the adult human brain. Trends Cogn
Sci 15: 475–482.
May A, Hajak G, Gänßbauer S, Steffens T, Langguth B, Kleinjung T, et al (2007). Structural
Brain Alterations following 5 Days of Intervention: Dynamic Aspects of Neuroplasticity.
Cereb Cortex 17: 205–210.
Mayberg HS (2003). Modulating dysfunctional limbic-cortical circuits in depression: towards
341
development of brain-based algorithms for diagnosis and optimised treatment. Br Med Bull
65: 193–207.
Mayberg HS, Brannan SK, Mahurin RK, Jerabek PA, Brickman JS, Tekell JL, et al (1997).
Cingulate function in depression: a potential predictor of treatment response. Neuroreport 8:
1057–61.
Mayberg HS, Liotti M, Brannan SK, McGinnis S, Mahurin RK, Jerabek PA, et al (1999).
Reciprocal limbic-cortical function and negative mood: converging PET findings in
depression and normal sadness. Am J Psychiatry 156: 675–82.
Mayberg HS, Lozano AM, Voon V, McNeely HE, Seminowicz D, Hamani C, et al (2005). Deep
brain stimulation for treatment-resistant depression. Neuron 45: 651–60.
McAdams CJ, Jeon-Slaughter H, Evans S, Lohrenz T, Montague PR, Krawczyk DC (2016).
Neural differences in self-perception during illness and after weight-recovery in anorexia
nervosa. Soc Cogn Affect Neurosci 11: 1823–1831.
McCabe C, Cowen PJ, Harmer CJ (2009). Neural representation of reward in recovered
depressed patients. Psychopharmacology (Berl) 205: 667–77.
McClelland J, Bozhilova N, Nestler S, Campbell IC, Jacob S, Johnson-Sabine E, et al (2013).
Improvements in symptoms following neuronavigated repetitive transcranial magnetic
stimulation (rTMS) in severe and enduring anorexia nervosa: findings from two case
studies. Eur Eat Disord Rev 21: 500–6.
McClelland J, Kekic M, Bozhilova N, Nestler S, Dew T, Eynde F Van den, et al (2016). A
Randomised Controlled Trial of Neuronavigated Repetitive Transcranial Magnetic
Stimulation (rTMS) in Anorexia Nervosa. PLoS One 11: e0148606.
McClintock SM, Tirmizi O, Chansard M, Husain MM (2011). A systematic review of the
neurocognitive effects of magnetic seizure therapy. Int Rev Psychiatry 23: 413–23.
McCulloch WS, Pitts W (1943). A logical calculus of the ideas immanent in nervous activity.
Bull Math Biol 52: 99-115; discussion 73–97.
Mcdonald AJ, Mascagni F, Guo L (1996). Projections of the medial and lateral prefrontal
cortices to the amygdala: a Phaseolus vulgaris leucoagglutinin study in the rat.
Neuroscience 71: 55–75.
342
McDonald WM, Durkalski V, Ball ER, Holtzheimer PE, Pavlicova M, Lisanby SH, et al (2011).
Improving the antidepressant efficacy of transcranial magnetic stimulation: maximizing the
number of stimulations and treatment location in treatment-resistant depression. Depress
Anxiety 28: 973–980.
McFarland NR, Haber SN (2000). Convergent inputs from thalamic motor nuclei and frontal
cortical areas to the dorsal striatum in the primate. J Neurosci 20: 3798–813.
McGirr A, Eynde F Van den, Tovar-Perdomo S, Fleck MPA, Berlim MT (2015). Effectiveness
and acceptability of accelerated repetitive transcranial magnetic stimulation (rTMS) for
treatment-resistant major depressive disorder: an open label trial. J Affect Disord 173: 216–
20.
McKiernan KA, Kaufman JN, Kucera-Thompson J, Binder JR (2003). A parametric
manipulation of factors affecting task-induced deactivation in functional neuroimaging. J
Cogn Neurosci 15: 394–408.
McLean PD, Whittal ML, Thordarson DS, Taylor S, Söchting I, Koch WJ, et al (2001).
Cognitive versus behavior therapy in the group treatment of obsessive-compulsive disorder.
J Consult Clin Psychol 69: 205–14.
McTeague LM, Goodkind MS, Etkin A (2016). Transdiagnostic impairment of cognitive control
in mental illness. J Psychiatr Res 83: 37–46.
McTeague LM, Huemer J, Carreon DM, Jiang Y, Eickhoff SB, Etkin A (2017). Identification of
Common Neural Circuit Disruptions in Cognitive Control Across Psychiatric Disorders. Am
J Psychiatry 174: 676–685.
Meindl T, Teipel S, Elmouden R, Mueller S, Koch W, Dietrich O, et al (2010). Test-retest
reproducibility of the default-mode network in healthy individuals. Hum Brain Mapp 31:
237–46.
Menon V (2011). Large-scale brain networks and psychopathology: a unifying triple network
model. Trends Cogn Sci 15: 483–506.
Menon V, Uddin LQ (2010). Saliency, switching, attention and control: a network model of
insula function. Brain Struct Funct 214: 655–67.
Menzies L, Chamberlain SR, Laird AR, Thelen SM, Sahakian BJ, Bullmore ET (2008).
343
Integrating evidence from neuroimaging and neuropsychological studies of obsessive-
compulsive disorder: the orbitofronto-striatal model revisited. Neurosci Biobehav Rev 32:
525–49.
Mesulam MM, Mufson EJ (1982). Insula of the old world monkey. I. Architectonics in the
insulo-orbito-temporal component of the paralimbic brain. J Comp Neurol 212: 1–22.
Micallef-Trigona B (2014). Comparing the effects of repetitive transcranial magnetic stimulation
and electroconvulsive therapy in the treatment of depression: a systematic review and meta-
analysis. Depress Res Treat 2014: 135049.
Michael N, Gösling M, Reutemann M, Kersting A, Heindel W, Arolt V, et al (2003). Metabolic
changes after repetitive transcranial magnetic stimulation (rTMS) of the left prefrontal
cortex: A sham-controlled proton magnetic resonance spectroscopy (1H MRS) study of
healthy brain. Eur J Neurosci 17: 2462–2468.
Micoulaud-Franchi J-A, Richieri R, Cermolacce M, Loundou A, Lancon C, Vion-Dury J (2012).
Parieto-temporal alpha EEG band power at baseline as a predictor of antidepressant
treatment response with repetitive Transcranial Magnetic Stimulation: a preliminary study.
J Affect Disord 137: 156–60.
Mikl M, Marecek R, Hlustík P, Pavlicová M, Drastich A, Chlebus P, et al (2008). Effects of
spatial smoothing on fMRI group inferences. Magn Reson Imaging 26: 490–503.
Milev R V, Giacobbe P, Kennedy SH, Blumberger DM, Daskalakis ZJ, Downar J, et al (2016).
Canadian Network for Mood and Anxiety Treatments (CANMAT) 2016 Clinical Guidelines
for the Management of Adults with Major Depressive Disorder: Section 4.
Neurostimulation Treatments. Can J Psychiatry 61: 561–75.
Milner B (1982). Some cognitive effects of frontal-lobe lesions in man. Philos Trans R Soc Lond
B Biol Sci 298: 211–26.
Miniussi C, Bonato C, Bignotti S, Gazzoli A, Gennarelli M, Pasqualetti P, et al (2005).
Repetitive transcranial magnetic stimulation (rTMS) at high and low frequency: an
efficacious therapy for major drug-resistant depression? Clin Neurophysiol 116: 1062–71.
Mir-Moghtadaei A, Caballero R, Fried P, Fox MD, Lee K, Giacobbe P, et al (2015).
Concordance Between BeamF3 and MRI-neuronavigated Target Sites for Repetitive
344
Transcranial Magnetic Stimulation of the Left Dorsolateral Prefrontal Cortex. Brain Stimul
8: 965–73.
Mir-Moghtadaei A, Giacobbe P, Daskalakis ZJ, Blumberger DM, Downar J (2016). Validation
of a 25% Nasion-Inion Heuristic for Locating the Dorsomedial Prefrontal Cortex for
Repetitive Transcranial Magnetic Stimulation. Brain Stimul 9: 793–5.
Mischoulon D, Eddy KT, Keshaviah A, Dinescu D, Ross SL, Kass AE, et al (2011). Depression
and eating disorders: treatment and course. J Affect Disord 130: 470–7.
Mitchell JE, Agras S, Wonderlich S (2007). Treatment of bulimia nervosa: where are we and
where are we going? Int J Eat Disord 40: 95–101.
Mitchell JE, Davis L, Goff G (1985). The process of relapse in patients with bulimia. Int J Eat
Disord 4: 457–463.
Mitra A, Kraft A, Wright P, Acland B, Snyder AZ, Rosenthal Z, et al (2018). Spontaneous Infra-
slow Brain Activity Has Unique Spatiotemporal Dynamics and Laminar Structure. Neuron
98: 297–305.e6.
Mitzdorf U (1985). Current source-density method and application in cat cerebral cortex:
investigation of evoked potentials and EEG phenomena. Physiol Rev 65: 37–100.
Mix A, Benali A, Eysel UT, Funke K (2010). Continuous and intermittent transcranial magnetic
theta burst stimulation modify tactile learning performance and cortical protein expression
in the rat differently. Eur J Neurosci 32: 1575–1586.
Mix A, Hoppenrath K, Funke K (2015). Reduction in cortical parvalbumin expression due to
intermittent theta-burst stimulation correlates with maturation of the perineuronal nets in
young rats. Dev Neurobiol 75: 1–11.
Modirrousta M, Shams E, Katz C, Mansouri B, Moussavi Z, Sareen J, et al (2015). The efficacy
of deep repetitive transcranial magnetic stimulation over the medial prefrontal cortex in
obsessive compulsive disorder: results from an open-label study. Depress Anxiety 32: 445–
50.
Mole TB, Irvine MA, Worbe Y, Collins P, Mitchell SP, Bolton S, et al (2015). Impulsivity in
disorders of food and drug misuse. Psychol Med 45: 771–82.
Molenberghs P, Mesulam MM, Peeters R, Vandenberghe RRC (2007). Remapping attentional
345
priorities: differential contribution of superior parietal lobule and intraparietal sulcus. Cereb
Cortex 17: 2703–12.
Mondino M, Haesebaert F, Poulet E, Saoud M, Brunelin J (2015). Efficacy of Cathodal
Transcranial Direct Current Stimulation Over the Left Orbitofrontal Cortex in a Patient
With Treatment-Resistant Obsessive-Compulsive Disorder. J ECT 31: 271–2.
Montague PR, Berns GS (2002). Neural economics and the biological substrates of valuation.
Neuron 36: 265–84.
Montgomery SA, Gommoll CP, Chen C, Greenberg WM (2015). Efficacy of levomilnacipran
extended-release in major depressive disorder: pooled analysis of 5 double-blind, placebo-
controlled trials. CNS Spectr 20: 148–56.
Morecraft RJ, Stilwell-Morecraft KS, Cipolloni PB, Ge J, McNeal DW, Pandya DN (2012).
Cytoarchitecture and cortical connections of the anterior cingulate and adjacent
somatomotor fields in the rhesus monkey. Brain Res Bull 87: 457–97.
Morel A, Gallay MN, Baechler A, Wyss M, Gallay DS (2013). The human insula: Architectonic
organization and postmortem MRI registration. Neuroscience 236: 117–35.
Moritz S, Rufer M, Fricke S, Karow A, Morfeld M, Jelinek L, et al (2005). Quality of life in
obsessive-compulsive disorder before and after treatment. Compr Psychiatry 46: 453–9.
Morris R, Paxinos G, Petrides M (2000). Architectonic analysis of the human retrosplenial
cortex. J Comp Neurol 421: 14–28.
Morris R, Petrides M, Pandya DN (1999). Architecture and connections of retrosplenial area 30
in the rhesus monkey (Macaca mulatta). Eur J Neurosci 11: 2506–18.
Moss J, Bolam JP (2008). A dopaminergic axon lattice in the striatum and its relationship with
cortical and thalamic terminals. J Neurosci 28: 11221–30.
Mountcastle VB (1957). Modality and topographic properties of single neurons of cat’s somatic
sensory cortex. J Neurophysiol 20: 408–34.
Mourão-Miranda J, Bokde ALW, Born C, Hampel H, Stetter M (2005). Classifying brain states
and determining the discriminating activation patterns: Support Vector Machine on
functional MRI data. Neuroimage 28: 980–95.
Muakkassa KF, Strick PL (1979). Frontal lobe inputs to primate motor cortex: evidence for four
346
somatotopically organized “premotor” areas. Brain Res 177: 176–82.
Mufson EJ, Mesulam MM (1982). Insula of the old world monkey. II: Afferent cortical input and
comments on the claustrum. J Comp Neurol 212: 23–37.
Mukamel R, Gelbard H, Arieli A, Hasson U, Fried I, Malach R (2005). Coupling between
neuronal firing, field potentials, and FMRI in human auditory cortex. Science 309: 951–4.
Mulders AEP, Plantinga BR, Schruers K, Duits A, Janssen MLF, Ackermans L, et al (2016).
Deep brain stimulation of the subthalamic nucleus in obsessive-compulsive disorder:
Neuroanatomical and pathophysiological considerations. Eur Neuropsychopharmacol 26:
1909–1919.
Müller M (2000). Long-Term Repetitive Transcranial Magnetic Stimulation Increases the
Expression of Brain-Derived Neurotrophic Factor and Cholecystokinin mRNA, but not
Neuropeptide Tyrosine mRNA in Specific Areas of Rat Brain. Neuropsychopharmacology
23: 205–215.
Müller VI, Langner R, Cieslik EC, Rottschy C, Eickhoff SB (2015). Interindividual differences
in cognitive flexibility: influence of gray matter volume, functional connectivity and trait
impulsivity. Brain Struct Funct 220: 2401–14.
Mullins N, Power RA, Fisher HL, Hanscombe KB, Euesden J, Iniesta R, et al (2016). Polygenic
interactions with environmental adversity in the aetiology of major depressive disorder.
Psychol Med 46: 759–70.
Murphy K, Birn RM, Handwerker DA, Jones TB, Bandettini PA (2009). The impact of global
signal regression on resting state correlations: are anti-correlated networks introduced?
Neuroimage 44: 893–905.
Murphy K, Fox MD (2017). Towards a consensus regarding global signal regression for resting
state functional connectivity MRI. Neuroimage 154: 169–173.
Murray CJ, Lopez AD (1997). Global mortality, disability, and the contribution of risk factors:
Global Burden of Disease Study. Lancet (London, England) 349: 1436–42.
Murrough JW, Abdallah CG, Anticevic A, Collins KA, Geha P, Averill LA, et al (2016).
Reduced global functional connectivity of the medial prefrontal cortex in major depressive
disorder. Hum Brain Mapp 37: 3214–23.
347
Mutschler I, Wieckhorst B, Kowalevski S, Derix J, Wentlandt J, Schulze-Bonhage A, et al
(2009). Functional organization of the human anterior insular cortex. Neurosci Lett 457: 66–
70.
Nadeau SE, McCoy KJM, Crucian GP, Greer RA, Rossi F, Bowers D, et al (2002). Cerebral
blood flow changes in depressed patients after treatment with repetitive transcranial
magnetic stimulation: evidence of individual variability. Neuropsychiatry Neuropsychol
Behav Neurol 15: 159–75.
Naeser MA, Martin PI, Treglia E, Ho M, Kaplan E, Bashir S, et al (2010). Research with rTMS
in the treatment of aphasia. Restor Neurol Neurosci 28: 511–29.
Nakamae T, Sakai Y, Abe Y, Nishida S, Fukui K, Yamada K, et al (2014). Altered fronto-striatal
fiber topography and connectivity in obsessive-compulsive disorder. PLoS One 9: e112075.
Nakamura K, Groiss SJ, Hamada M, Enomoto H, Kadowaki S, Abe M, et al (2016). Variability
in Response to Quadripulse Stimulation of the Motor Cortex. Brain Stimul 9: 859–866.
Nakatani-Enomoto S, Hanajima R, Hamada M, Mochizuki H, Kobayashi S, Enomoto H, et al
(2011). Some evidence supporting the safety of quadripulse stimulation (QPS). Brain Stimul
4: 303–5.
Nakatani E, Nakagawa A, Nakao T, Yoshizato C, Nabeyama M, Kudo A, et al (2005). A
randomized controlled trial of Japanese patients with obsessive-compulsive disorder--
effectiveness of behavior therapy and fluvoxamine. Psychother Psychosom 74: 269–76.
Nambu A (2011). Somatotopic organization of the primate Basal Ganglia. Front Neuroanat 5:
26.
Narayanaswamy JC, Jose D, Chhabra H, Agarwal SM, Shrinivasa B, Hegde A, et al (2015).
Successful Application of Add-on Transcranial Direct Current Stimulation (tDCS) for
Treatment of SSRI Resistant OCD. Brain Stimul 8: 655–7.
Nauczyciel C, Jeune F Le, Naudet F, Douabin S, Esquevin A, Vérin M, et al (2014). Repetitive
transcranial magnetic stimulation over the orbitofrontal cortex for obsessive-compulsive
disorder: a double-blind, crossover study. Transl Psychiatry 4: e436.
Nekovarova T, Fajnerova I, Horacek J, Spaniel F (2014). Bridging disparate symptoms of
schizophrenia: a triple network dysfunction theory. Front Behav Neurosci 8: 171.
348
Nemeroff CB (2007). Prevalence and management of treatment-resistant depression. J Clin
Psychiatry 68 Suppl 8: 17–25.
Nemeroff CB, Mayberg HS, Krahl SE, McNamara J, Frazer A, Henry TR, et al (2006). VNS
therapy in treatment-resistant depression: clinical evidence and putative neurobiological
mechanisms. Neuropsychopharmacology 31: 1345–55.
Nestler EJ, Carlezon WA (2006). The mesolimbic dopamine reward circuit in depression. Biol
Psychiatry 59: 1151–9.
Nettekoven C, Volz LJ, Leimbach M, Pool E-M, Rehme AK, Eickhoff SB, et al (2015). Inter-
individual variability in cortical excitability and motor network connectivity following
multiple blocks of rTMS. Neuroimage 118: 209–18.
Newton AT, Morgan VL, Rogers BP, Gore JC (2011). Modulation of steady state functional
connectivity in the default mode and working memory networks by cognitive load. Hum
Brain Mapp 32: 1649–59.
Niazy RK, Xie J, Miller K, Beckmann CF, Smith SM (2011). Spectral characteristics of resting
state networks. Prog Brain Res 193: 259–76.
Nichols T, Hayasaka S (2003). Controlling the familywise error rate in functional neuroimaging:
a comparative review. Stat Methods Med Res 12: 419–46.
Nichols TE, Holmes AP (2002). Nonparametric permutation tests for functional neuroimaging: a
primer with examples. Hum Brain Mapp 15: 1–25.
Niendam TA, Laird AR, Ray KL, Dean YM, Glahn DC, Carter CS (2012). Meta-analytic
evidence for a superordinate cognitive control network subserving diverse executive
functions. Cogn Affect Behav Neurosci 12: 241–68.
Niessing J, Ebisch B, Schmidt KE, Niessing M, Singer W, Galuske RAW (2005). Hemodynamic
signals correlate tightly with synchronized gamma oscillations. Science 309: 948–51.
Nilsson K, Hägglöf B (2005). Long-term follow-up of adolescent onset anorexia nervosa in
northern Sweden. Eur Eat Disord Rev 13: 89–100.
Nir Y, Fisch L, Mukamel R, Gelbard-Sagiv H, Arieli A, Fried I, et al (2007). Coupling between
neuronal firing rate, gamma LFP, and BOLD fMRI is related to interneuronal correlations.
Curr Biol 17: 1275–85.
349
Nir Y, Mukamel R, Dinstein I, Privman E, Harel M, Fisch L, et al (2008). Interhemispheric
correlations of slow spontaneous neuronal fluctuations revealed in human sensory cortex.
Nat Neurosci 11: 1100–8.
Niso G, Carrasco S, Gudín M, Maestú F, Del-Pozo F, Pereda E (2015). What graph theory
actually tells us about resting state interictal MEG epileptic activity. NeuroImage Clin 8:
503–15.
Noda Y, Silverstein WK, Barr MS, Vila-Rodriguez F, Downar J, Rajji TK, et al (2015).
Neurobiological mechanisms of repetitive transcranial magnetic stimulation of the
dorsolateral prefrontal cortex in depression: a systematic review. Psychol Med 45: 3411–32.
Noda Y, Zomorrodi R, Saeki T, Rajji TK, Blumberger DM, Daskalakis ZJ, et al (2017). Resting-
state EEG gamma power and theta-gamma coupling enhancement following high-frequency
left dorsolateral prefrontal rTMS in patients with depression. Clin Neurophysiol 128: 424–
432.
Norman KA, Polyn SM, Detre GJ, Haxby J V (2006). Beyond mind-reading: multi-voxel pattern
analysis of fMRI data. Trends Cogn Sci 10: 424–30.
Novick D, Montgomery W, Aguado J, Kadziola Z, Peng X, Brugnoli R, et al (2013). Which
somatic symptoms are associated with an unfavorable course in Asian patients with major
depressive disorder? J Affect Disord 149: 182–8.
Nuttin B, Cosyns P, Demeulemeester H, Gybels J, Meyerson B (1999). Electrical stimulation in
anterior limbs of internal capsules in patients with obsessive-compulsive disorder. Lancet
(London, England) 354: 1526.
Nuttin BJ, Gabriëls LA, Cosyns PR, Meyerson BA, Andréewitch S, Sunaert SG, et al (2003).
Long-term electrical capsular stimulation in patients with obsessive-compulsive disorder.
Neurosurgery 52: 1263-72; discussion 1272–4.
O’Doherty J, Kringelbach ML, Rolls ET, Hornak J, Andrews C (2001). Abstract reward and
punishment representations in the human orbitofrontal cortex. Nat Neurosci 4: 95–102.
O’Donovan C (2004). Achieving and sustaining remission in depression and anxiety disorders:
introduction. Can J Psychiatry 49: 5S–9S.
O’Neill J, Gorbis E, Feusner JD, Yip JC, Chang S, Maidment KM, et al (2013). Effects of
350
intensive cognitive-behavioral therapy on cingulate neurochemistry in obsessive-
compulsive disorder. J Psychiatr Res 47: 494–504.
O’Reardon JP, Solvason HB, Janicak PG, Sampson S, Isenberg KE, Nahas Z, et al (2007).
Efficacy and Safety of Transcranial Magnetic Stimulation in the Acute Treatment of Major
Depression: A Multisite Randomized Controlled Trial. Biol Psychiatry 62: 1208–1216.
Oberndorfer T, Simmons A, McCurdy D, Strigo I, Matthews S, Yang T, et al (2013a). Greater
anterior insula activation during anticipation of food images in women recovered from
anorexia nervosa versus controls. Psychiatry Res 214: 132–41.
Oberndorfer TA, Frank GKW, Simmons AN, Wagner A, McCurdy D, Fudge JL, et al (2013b).
Altered insula response to sweet taste processing after recovery from anorexia and bulimia
nervosa. Am J Psychiatry 170: 1143–51.
Oberndorfer TA, Kaye WH, Simmons AN, Strigo IA, Matthews SC (2011). Demand-specific
alteration of medial prefrontal cortex response during an inhibition task in recovered
anorexic women. Int J Eat Disord 44: 1–8.
Obeso I, Cho SS, Antonelli F, Houle S, Jahanshahi M, Ko JH, et al (2013). Stimulation of the
pre-SMA influences cerebral blood flow in frontal areas involved with inhibitory control of
action. Brain Stimul 6: 769–76.
Ogawa S, Lee TM, Kay AR, Tank DW (1990). Brain magnetic resonance imaging with contrast
dependent on blood oxygenation. Proc Natl Acad Sci U S A 87: 9868–72.
Ogiue-Ikeda M, Kawato S, Ueno S (2005). Acquisition of ischemic tolerance by repetitive
transcranial magnetic stimulation in the rat hippocampus. Brain Res 1037: 7–11.
Okada K, Nakao T, Sanematsu H, Murayama K, Honda S, Tomita M, et al (2015). Biological
heterogeneity of obsessive-compulsive disorder: A voxel-based morphometric study based
on dimensional assessment. Psychiatry Clin Neurosci 69: 411–21.
Olmsted MP, Kaplan AS, Rockert W (1994). Rate and prediction of relapse in bulimia nervosa.
Am J Psychiatry 151: 738–43.
Olmsted MP, Kaplan AS, Rockert W (2005). Defining remission and relapse in bulimia nervosa.
Int J Eat Disord 38: 1–6.
Olmsted MP, MacDonald DE, McFarlane T, Trottier K, Colton P (2015). Predictors of rapid
351
relapse in bulimia nervosa. Int J Eat Disord 48: 337–40.
Olmsted MP, McFarlane TL, Carter JC, Trottier K, Woodside DB, Dimitropoulos G (2010).
Inpatient and day hospital treatment for anorexia nervosa. Treat Eat Disord A Clin Handb
198–211.
Ongür D, Ferry AT, Price JL (2003). Architectonic subdivision of the human orbital and medial
prefrontal cortex. J Comp Neurol 460: 425–49.
Ooms P, Mantione M, Figee M, Schuurman PR, Munckhof P van den, Denys D (2014). Deep
brain stimulation for obsessive-compulsive disorders: long-term analysis of quality of life. J
Neurol Neurosurg Psychiatry 85: 153–8.
Oppen P van, Haan E de, Balkom AJ van, Spinhoven P, Hoogduin K, Dyck R van (1995).
Cognitive therapy and exposure in vivo in the treatment of obsessive compulsive disorder.
Behav Res Ther 33: 379–90.
Owen AM, Downes JJ, Sahakian BJ, Polkey CE, Robbins TW (1990). Planning and spatial
working memory following frontal lobe lesions in man. Neuropsychologia 28: 1021–34.
Ozekes S, Erguzel T, Sayar GH, Tarhan N (2014). Analysis of Brain Functional Changes in
High-Frequency Repetitive Transcranial Magnetic Stimulation in Treatment-Resistant
Depression. Clin EEG Neurosci 45: 257–261.
Padberg F, Zwanzger P, Thoma H, Kathmann N, Haag C, Greenberg BD, et al (1999). Repetitive
transcranial magnetic stimulation (rTMS) in pharmacotherapy-refractory major depression:
comparative study of fast, slow and sham rTMS. Psychiatry Res 88: 163–71.
Palaniyappan L, Marques TR, Taylor H, Mondelli V, Reinders AATS, Bonaccorso S, et al
(2016). Globally Efficient Brain Organization and Treatment Response in Psychosis: A
Connectomic Study of Gyrification. Schizophr Bull 42: 1446–1456.
Pallanti S, Cantisani A, Grassi G, Antonini S, Cecchelli C, Burian J, et al (2012). rTMS age-
dependent response in treatment-resistant depressed subjects: a mini-review. CNS Spectr
17: 24–30.
Pallanti S, Hollander E, Bienstock C, Koran L, Leckman J, Marazziti D, et al (2002). Treatment
non-response in OCD: methodological issues and operational definitions. Int J
Neuropsychopharmacol 5: 181–91.
352
Pan J, Zhan L, Hu C, Yang J, Wang C, Gu L, et al (2018). Emotion Regulation and Complex
Brain Networks: Association Between Expressive Suppression and Efficiency in the Fronto-
Parietal Network and Default-Mode Network. Front Hum Neurosci 12: 70.
Pan W-J, Thompson GJ, Magnuson ME, Jaeger D, Keilholz S (2013). Infraslow LFP correlates
to resting-state fMRI BOLD signals. Neuroimage 74: 288–97.
Pandya DN, Dye P, Butters N (1971). Efferent cortico-cortical projections of the prefrontal
cortex in the rhesus monkey. Brain Res 31: 35–46.
Pandya DN, Hoesen GW Van, Mesulam MM (1981). Efferent connections of the cingulate gyrus
in the rhesus monkey. Exp brain Res 42: 319–30.
Pandya DN, Kuypers HG (1969). Cortico-cortical connections in the rhesus monkey. Brain Res
13: 13–36.
Papakostas GI, Ionescu DF (2015). Towards new mechanisms: an update on therapeutics for
treatment-resistant major depressive disorder. Mol Psychiatry 20: 1142–50.
Parent A, Hazrati LN (1995). Functional anatomy of the basal ganglia. I. The cortico-basal
ganglia-thalamo-cortical loop. Brain Res Brain Res Rev 20: 91–127.
Parigi A Del, Gautier J-F, Chen K, Salbe AD, Ravussin E, Reiman E, et al (2002).
Neuroimaging and obesity: mapping the brain responses to hunger and satiation in humans
using positron emission tomography. Ann N Y Acad Sci 967: 389–97.
Parikh S V, Quilty LC, Ravitz P, Rosenbluth M, Pavlova B, Grigoriadis S, et al (2016).
Canadian Network for Mood and Anxiety Treatments (CANMAT) 2016 Clinical Guidelines
for the Management of Adults with Major Depressive Disorder: Section 2. Psychological
Treatments. Can J Psychiatry 61: 524–39.
Parvizi J, Hoesen GW Van, Buckwalter J, Damasio A (2006). Neural connections of the
posteromedial cortex in the macaque. Proc Natl Acad Sci U S A 103: 1563–8.
Parvizi J, Rangarajan V, Shirer WR, Desai N, Greicius MD (2013). The will to persevere
induced by electrical stimulation of the human cingulate gyrus. Neuron 80: 1359–67.
Pascual-Leone A, Catalá MD, Pascual-Leone Pascual A (1996a). Lateralized effect of rapid-rate
transcranial magnetic stimulation of the prefrontal cortex on mood. Neurology 46: 499–502.
Pascual-Leone A, Rubio B, Pallardó F, Catalá MD (1996b). Rapid-rate transcranial magnetic

353
stimulation of left dorsolateral prefrontal cortex in drug-resistant depression. Lancet
(London, England) 348: 233–7.
Pascual-Leone A, Valls-Solé J, Wassermann EM, Hallett M (1994). Responses to rapid-rate
transcranial magnetic stimulation of the human motor cortex. Brain 117 ( Pt 4: 847–58.
Pasquale F de, Penna S Della, Snyder AZ, Lewis C, Mantini D, Marzetti L, et al (2010).
Temporal dynamics of spontaneous MEG activity in brain networks. Proc Natl Acad Sci U
S A 107: 6040–5.
Pasquale F de, Penna S Della, Snyder AZ, Marzetti L, Pizzella V, Romani GL, et al (2012). A
cortical core for dynamic integration of functional networks in the resting human brain.
Neuron 74: 753–64.
Patel AX, Kundu P, Rubinov M, Jones PS, Vértes PE, Ersche KD, et al (2014). A wavelet
method for modeling and despiking motion artifacts from resting-state fMRI time series.
Neuroimage 95: 287–304.
Patel MJ, Khalaf A, Aizenstein HJ (2016). Studying depression using imaging and machine
learning methods. NeuroImage Clin 10: 115–23.
Patel SR, Galfavy H, Kimeldorf MB, Dixon LB, Simpson HB (2017). Patient Preferences and
Acceptability of Evidence-Based and Novel Treatments for Obsessive-Compulsive
Disorder. Psychiatr Serv 68: 250–257.
Patriat R, Molloy EK, Meier TB, Kirk GR, Nair VA, Meyerand ME, et al (2013). The effect of
resting condition on resting-state fMRI reliability and consistency: a comparison between
resting with eyes open, closed, and fixated. Neuroimage 78: 463–73.
Patten SB, Williams JVA, Lavorato DH, Wang JL, McDonald K, Bulloch AGM (2015).
Descriptive epidemiology of major depressive disorder in Canada in 2012. Can J Psychiatry
60: 23–30.
Patton JH, Stanford MS, Barratt ES (1995). Factor structure of the barratt impulsiveness scale. J
Clin Psychol 51: 768–774.
Pauli WM, O’Reilly RC, Yarkoni T, Wager TD (2016). Regional specialization within the
human striatum for diverse psychological functions. Proc Natl Acad Sci U S A 113: 1907–
12.

354
Pauling L, Coryell CD (1936). The Magnetic Properties and Structure of Hemoglobin,
Oxyhemoglobin and Carbonmonoxyhemoglobin. Proc Natl Acad Sci U S A 22: 210–6.
Pauls DL (2010). The genetics of obsessive-compulsive disorder: a review. Dialogues Clin
Neurosci 12: 149–63.
Pawela CP, Biswal BB, Cho YR, Kao DS, Li R, Jones SR, et al (2008). Resting-state functional
connectivity of the rat brain. Magn Reson Med 59: 1021–9.
Pearson C, Janz T, Ali J (2013). Mental and substance use disorders in Canada. Heal a Glance
doi:82-624-X.
Peeters M, Vollebergh WAM, Wiers RW, Field M (2014). Psychological changes and cognitive
impairments in adolescent heavy drinkers. Alcohol Alcohol 49: 182–6.
Pellicciari MC, Ponzo V, Caltagirone C, Koch G (2017). Restored Asymmetry of Prefrontal
Cortical Oscillatory Activity after Bilateral Theta Burst Stimulation Treatment in a Patient
with Major Depressive Disorder: A TMS-EEG Study. Brain Stimul 10: 147–149.
Peng H, Zheng H, Li L, Liu J, Zhang Y, Shan B, et al (2012). High-frequency rTMS treatment
increases white matter FA in the left middle frontal gyrus in young patients with treatment-
resistant depression. J Affect Disord 136: 249–57.
Perani D, Colombo C, Bressi S, Bonfanti A, Grassi F, Scarone S, et al (1995). [18F]FDG PET
study in obsessive-compulsive disorder. A clinical/metabolic correlation study after
treatment. Br J Psychiatry 166: 244–50.
Perlbarg V, Bellec P, Anton J-L, Pélégrini-Issac M, Doyon J, Benali H (2007). CORSICA:
correction of structured noise in fMRI by automatic identification of ICA components.
Magn Reson Imaging 25: 35–46.
Petrides M (2005). Lateral prefrontal cortex: architectonic and functional organization. Philos
Trans R Soc Lond B Biol Sci 360: 781–95.
Pettersson A, Boström KB, Gustavsson P, Ekselius L (2015). Which instruments to support
diagnosis of depression have sufficient accuracy? A systematic review. Nord J Psychiatry
69: 497–508.
Petzold GC, Albeanu DF, Sato TF, Murthy VN (2008). Coupling of neural activity to blood flow
in olfactory glomeruli is mediated by astrocytic pathways. Neuron 58: 897–910.
355
Philip NS, Barredo J, ’t Wout-Frank M van, Tyrka AR, Price LH, Carpenter LL (2018). Network
Mechanisms of Clinical Response to Transcranial Magnetic Stimulation in Posttraumatic
Stress Disorder and Major Depressive Disorder. Biol Psychiatry 83: 263–272.
Philippi CL, Motzkin JC, Pujara MS, Koenigs M (2015). Subclinical depression severity is
associated with distinct patterns of functional connectivity for subregions of anterior
cingulate cortex. J Psychiatr Res 71: 103–11.
Picard N, Strick PL (1996). Motor areas of the medial wall: a review of their location and
functional activation. Cereb Cortex 6: 342–53.
Pike KM (1998). Long-term course of anorexia nervosa: response, relapse, remission, and
recovery. Clin Psychol Rev 18: 447–75.
Pinheiro AP, Root T, Bulik CM (2009). The Genetics of Anorexia Nervosa: Current Findings
and Future Perspectives. Int J Child Adolesc health 2: 153–164.
Piras F, Piras F, Chiapponi C, Girardi P, Caltagirone C, Spalletta G (2015). Widespread
structural brain changes in OCD: a systematic review of voxel-based morphometry studies.
Cortex 62: 89–108.
Pizzagalli D, Pascual-Marqui RD, Nitschke JB, Oakes TR, Larson CL, Abercrombie HC, et al
(2001). Anterior cingulate activity as a predictor of degree of treatment response in major
depression: evidence from brain electrical tomography analysis. Am J Psychiatry 158: 405–
15.
Pizzagalli DA, Holmes AJ, Dillon DG, Goetz EL, Birk JL, Bogdan R, et al (2009). Reduced
caudate and nucleus accumbens response to rewards in unmedicated individuals with major
depressive disorder. Am J Psychiatry 166: 702–10.
Pleger B, Ruff CC, Blankenburg F, Bestmann S, Wiech K, Stephan KE, et al (2006). Neural
coding of tactile decisions in the human prefrontal cortex. J Neurosci 26: 12596–601.
Plewnia C, Pasqualetti P, Große S, Schlipf S, Wasserka B, Zwissler B, et al (2014). Treatment of
major depression with bilateral theta burst stimulation: a randomized controlled pilot trial. J
Affect Disord 156: 219–23.
Ploran EJ, Nelson SM, Velanova K, Donaldson DI, Petersen SE, Wheeler ME (2007). Evidence
accumulation and the moment of recognition: dissociating perceptual recognition processes
356
using fMRI. J Neurosci 27: 11912–24.
Pogarell O, Koch W, Pöpperl G, Tatsch K, Jakob F, Mulert C, et al (2007). Acute prefrontal
rTMS increases striatal dopamine to a similar degree as d-amphetamine. Psychiatry Res -
Neuroimaging 156: 251–255.
Pogarell O, Koch W, Pöpperl G, Tatsch K, Jakob F, Zwanzger P, et al (2006). Striatal dopamine
release after prefrontal repetitive transcranial magnetic stimulation in major depression:
Preliminary results of a dynamic [123I] IBZM SPECT study. J Psychiatr Res 40: 307–314.
Poldrack RA, Mumford JA, Nichols TE (2011). Handbook of functional MRI data analysis.
Cambridge Univ Press 4: .
Polnay A, James VAW, Hodges L, Murray GD, Munro C, Lawrie SM (2014). Group therapy for
people with bulimia nervosa: systematic review and meta-analysis. Psychol Med 44: 2241–
54.
Popa D, Popescu AT, Paré D (2009). Contrasting activity profile of two distributed cortical
networks as a function of attentional demands. J Neurosci 29: 1191–201.
Posner J, Hellerstein DJ, Gat I, Mechling A, Klahr K, Wang Z, et al (2013). Antidepressants
normalize the default mode network in patients with dysthymia. JAMA psychiatry 70: 373–
82.
Posner J, Marsh R, Maia T V, Peterson BS, Gruber A, Simpson HB (2014). Reduced functional
connectivity within the limbic cortico-striato-thalamo-cortical loop in unmedicated adults
with obsessive-compulsive disorder. Hum Brain Mapp 35: 2852–60.
Posner MI, Petersen SE (1990). The attention system of the human brain. Annu Rev Neurosci 13:
25–42.
Power JD, Barnes KA, Snyder AZ, Schlaggar BL, Petersen SE (2012). Spurious but systematic
correlations in functional connectivity MRI networks arise from subject motion.
Neuroimage 59: 2142–54.
Power JD, Cohen AL, Nelson SM, Wig GS, Barnes KA, Church JA, et al (2011). Functional
network organization of the human brain. Neuron 72: 665–78.
Power JD, Mitra A, Laumann TO, Snyder AZ, Schlaggar BL, Petersen SE (2014). Methods to
detect, characterize, and remove motion artifact in resting state fMRI. Neuroimage 84: 320–
357
41.
Power JD, Plitt M, Laumann TO, Martin A (2017). Sources and implications of whole-brain
fMRI signals in humans. Neuroimage 146: 609–625.
Prasko J, Pasková B, Záleský R, Novák T, Kopecek M, Bares M, et al (2006). The effect of
repetitive transcranial magnetic stimulation (rTMS) on symptoms in obsessive compulsive
disorder. A randomized, double blind, sham controlled study. Neuro Endocrinol Lett 27:
327–32.
Prasser J, Schecklmann M, Poeppl TB, Frank E, Kreuzer PM, Hajak G, et al (2015). Bilateral
prefrontal rTMS and theta burst TMS as an add-on treatment for depression: a randomized
placebo controlled trial. World J Biol Psychiatry 16: 57–65.
Preti MG, Bolton TA, Ville D Van De (2017). The dynamic functional connectome: State-of-the-
art and perspectives. Neuroimage 160: 41–54.
Preuschoff K, Bossaerts P, Quartz SR (2006). Neural differentiation of expected reward and risk
in human subcortical structures. Neuron 51: 381–90.
Preuschoff K, Quartz SR, Bossaerts P (2008). Human insula activation reflects risk prediction
errors as well as risk. J Neurosci 28: 2745–52.
Preuss TM, Goldman-Rakic PS (1989). Connections of the ventral granular frontal cortex of
macaques with perisylvian premotor and somatosensory areas: anatomical evidence for
somatic representation in primate frontal association cortex. J Comp Neurol 282: 293–316.
Price JL (2007). Definition of the orbital cortex in relation to specific connections with limbic
and visceral structures and other cortical regions. Ann N Y Acad Sci 1121: 54–71.
Pruim RHR, Mennes M, Rooij D van, Llera A, Buitelaar JK, Beckmann CF (2015). ICA-
AROMA: A robust ICA-based strategy for removing motion artifacts from fMRI data.
Neuroimage 112: 267–77.
Pyle RL, Mitchell JE, Eckert ED, Hatsukami D, Pomeroy C, Zimmerman R (1990). Maintenance
treatment and 6-month outcome for bulimic patients who respond to initial treatment. Am J
Psychiatry 147: 871–5.
Qiu L, Fu X, Wang S, Tang Q, Chen X, Cheng L, et al (2017). Abnormal regional spontaneous
neuronal activity associated with symptom severity in treatment-naive patients with
358
obsessive-compulsive disorder revealed by resting-state functional MRI. Neurosci Lett 640:
99–104.
Quirk GJ, Likhtik E, Pelletier JG, Paré D (2003). Stimulation of medial prefrontal cortex
decreases the responsiveness of central amygdala output neurons. J Neurosci 23: 8800–7.
Racine SE, Martin SJ (2017). Integrating eating disorder-specific risk factors into the acquired
preparedness model of dysregulated eating: A moderated mediation analysis. Eat Behav 24:
54–60.
Radeloff D, Willmann K, Otto L, Lindner M, Putnam K, Leeuwen S Van, et al (2014). High-fat
taste challenge reveals altered striatal response in women recovered from bulimia nervosa:
A pilot study. World J Biol Psychiatry 15: 307–16.
Radua J, Heuvel OA van den, Surguladze S, Mataix-Cols D (2010). Meta-analytical comparison
of voxel-based morphometry studies in obsessive-compulsive disorder vs other anxiety
disorders. Arch Gen Psychiatry 67: 701–11.
Raichle ME (2009a). A paradigm shift in functional brain imaging. J Neurosci 29: 12729–34.
Raichle ME (2009b). A brief history of human brain mapping. Trends Neurosci 32: 118–26.
Raichle ME (2010). Two views of brain function. Trends Cogn Sci 14: 180–90.
Raichle ME, Gusnard DA (2002). Appraising the brain’s energy budget. Proc Natl Acad Sci U S
A 99: 10237–9.
Raichle ME, MacLeod AM, Snyder AZ, Powers WJ, Gusnard DA, Shulman GL (2001). A
default mode of brain function. Proc Natl Acad Sci U S A 98: 676–82.
Raichle ME, Mintun MA (2006). Brain work and brain imaging. Annu Rev Neurosci 29: 449–76.
Ramirez-Mahaluf JP, Perramon J, Otal B, Villoslada P, Compte A (2018). Subgenual anterior
cingulate cortex controls sadness-induced modulations of cognitive and emotional network
hubs. Sci Rep 8: 8566.
Ratnasingham S, Cairney J, Manson H, Rehm J, Lin E, Kurdyak P (2013). The burden of mental
illness and addiction in ontario. Can J Psychiatry 58: 529–37.
Rauch SL, Dougherty DD, Malone D, Rezai A, Friehs G, Fischman AJ, et al (2006). A
functional neuroimaging investigation of deep brain stimulation in patients with obsessive-
359
compulsive disorder. J Neurosurg 104: 558–65.
Rav-Acha M, Sagiv N, Segev I, Bergman H, Yarom Y (2005). Dynamic and spatial features of
the inhibitory pallidal GABAergic synapses. Neuroscience 135: 791–802.
Ravizza L, Maina G, Bogetto F (1997). Episodic and chronic obsessive-compulsive disorder.
Depress Anxiety 6: 154–8.
Ray S, Maunsell JHR (2011). Different origins of gamma rhythm and high-gamma activity in
macaque visual cortex. PLoS Biol 9: e1000610.
Razza LB, Moffa AH, Moreno ML, Carvalho AF, Padberg F, Fregni F, et al (2018). A
systematic review and meta-analysis on placebo response to repetitive transcranial magnetic
stimulation for depression trials. Prog Neuropsychopharmacol Biol Psychiatry 81: 105–
113.
Reess TJ, Rus OG, Schmidt R, Reus MA de, Zaudig M, Wagner G, et al (2016). Connectomics-
based structural network alterations in obsessive-compulsive disorder. Transl Psychiatry 6:
e882.
Reijneveld JC, Ponten SC, Berendse HW, Stam CJ (2007). The application of graph theoretical
analysis to complex networks in the brain. Clin Neurophysiol 118: 2317–31.
Rhee SH, Lahey BB, Waldman ID (2015). Comorbidity Among Dimensions of Childhood
Psychopathology: Converging Evidence from Behavior Genetics. Child Dev Perspect 9:
26–31.
Richard JM, Berridge KC (2013). Prefrontal cortex modulates desire and dread generated by
nucleus accumbens glutamate disruption. Biol Psychiatry 73: 360–70.
Richieri R, Boyer L, Padovani R, Adida M, Colavolpe C, Mundler O, et al (2012). Equivalent
brain SPECT perfusion changes underlying therapeutic efficiency in pharmacoresistant
depression using either high-frequency left or low-frequency right prefrontal rTMS. Prog
Neuropsychopharmacol Biol Psychiatry 39: 364–70.
Ridderinkhof KR, Ullsperger M, Crone EA, Nieuwenhuis S (2004a). The role of the medial
frontal cortex in cognitive control. Science 306: 443–7.
Ridderinkhof KR, Wildenberg WPM van den, Segalowitz SJ, Carter CS (2004b). Neurocognitive
mechanisms of cognitive control: the role of prefrontal cortex in action selection, response
360
inhibition, performance monitoring, and reward-based learning. Brain Cogn 56: 129–40.
Riedel M, Möller H-J, Obermeier M, Schennach-Wolff R, Bauer M, Adli M, et al (2010).
Response and remission criteria in major depression--a validation of current practice. J
Psychiatr Res 44: 1063–8.
Rigaud D, Pennacchio H, Bizeul C, Reveillard V, Vergès B (2011). Outcome in AN adult
patients: a 13-year follow-up in 484 patients. Diabetes Metab 37: 305–11.
Rilling JK, Barks SK, Parr LA, Preuss TM, Faber TL, Pagnoni G, et al (2007). A comparison of
resting-state brain activity in humans and chimpanzees. Proc Natl Acad Sci U S A 104:
17146–51.
Ritchey M, Dolcos F, Eddington KM, Strauman TJ, Cabeza R (2011). Neural correlates of
emotional processing in depression: changes with cognitive behavioral therapy and
predictors of treatment response. J Psychiatr Res 45: 577–87.
Rizvi SL, Peterson CB, Crow SJ, Agras WS (2000). Test-retest reliability of the eating disorder
examination. Int J Eat Disord 28: 311–6.
Roberson AM, Castro VM, Cagan A, Perlis RH (2016). Antidepressant nonadherence in routine
clinical settings determined from discarded blood samples. J Clin Psychiatry 77: 359–62.
Robinson OJ, Cools R, Carlisi CO, Sahakian BJ, Drevets WC (2012). Ventral striatum response
during reward and punishment reversal learning in unmedicated major depressive disorder.
Am J Psychiatry 169: 152–9.
Robinson RG, Kubos KL, Starr LB, Rao K, Price TR (1984). Mood disorders in stroke patients.
Importance of location of lesion. Brain 107 ( Pt 1: 81–93.
Rosen JC, Vara L, Wendt S, Leitenberg H (1990). Validity studies of the eating disorder
examination. Int J Eat Disord 9: 519–528.
Rosenblat JD, Kakar R, McIntyre RS (2015). The Cognitive Effects of Antidepressants in Major
Depressive Disorder: A Systematic Review and Meta-Analysis of Randomized Clinical
Trials. Int J Neuropsychopharmacol 19: .
Rosenkranz JA, Moore H, Grace AA (2003). The prefrontal cortex regulates lateral amygdala
neuronal plasticity and responses to previously conditioned stimuli. J Neurosci 23: 11054–
64.

361
Rotge J-Y, Langbour N, Guehl D, Bioulac B, Jaafari N, Allard M, et al (2010). Gray matter
alterations in obsessive-compulsive disorder: an anatomic likelihood estimation meta-
analysis. Neuropsychopharmacology 35: 686–91.
Royce GJ (1982). Laminar origin of cortical neurons which project upon the caudate nucleus: a
horseradish peroxidase investigation in the cat. J Comp Neurol 205: 8–29.
Rubio JM, Markowitz JC, Alegría A, Pérez-Fuentes G, Liu S-M, Lin K-H, et al (2011).
Epidemiology of chronic and nonchronic major depressive disorder: results from the
national epidemiologic survey on alcohol and related conditions. Depress Anxiety 28: 622–
31.
Rudebeck PH, Mitz AR, Chacko R V, Murray EA (2013). Effects of amygdala lesions on
reward-value coding in orbital and medial prefrontal cortex. Neuron 80: 1519–31.
Ruf SP, Fallgatter AJ, Plewnia C (2017). Augmentation of working memory training by
transcranial direct current stimulation (tDCS). Sci Rep 7: 876.
Rufer M, Hand I, Alsleben H, Braatz A, Ortmann J, Katenkamp B, et al (2005). Long-term
course and outcome of obsessive-compulsive patients after cognitive-behavioral therapy in
combination with either fluvoxamine or placebo: a 7-year follow-up of a randomized
double-blind trial. Eur Arch Psychiatry Clin Neurosci 255: 121–8.
Ruff CC, Driver J, Bestmann S (2009). Combining TMS and fMRI: from “virtual lesions” to
functional-network accounts of cognition. Cortex 45: 1043–9.
Ruffini C, Locatelli M, Lucca A, Benedetti F, Insacco C, Smeraldi E (2009). Augmentation
effect of repetitive transcranial magnetic stimulation over the orbitofrontal cortex in drug-
resistant obsessive-compulsive disorder patients: a controlled investigation. Prim Care
Companion J Clin Psychiatry 11: 226–30.
Ruscio AM, Stein DJ, Chiu WT, Kessler RC (2010). The epidemiology of obsessive-compulsive
disorder in the National Comorbidity Survey Replication. Mol Psychiatry 15: 53–63.
Rush AJ, Marangell LB, Sackeim HA, George MS, Brannan SK, Davis SM, et al (2005). Vagus
nerve stimulation for treatment-resistant depression: a randomized, controlled acute phase
trial. Biol Psychiatry 58: 347–54.
Rush AJ, Trivedi MH, Ibrahim HM, Carmody TJ, Arnow B, Klein DN, et al (2003). The 16-Item
362
Quick Inventory of Depressive Symptomatology (QIDS), clinician rating (QIDS-C), and
self-report (QIDS-SR): a psychometric evaluation in patients with chronic major
depression. Biol Psychiatry 54: 573–83.
Rush AJ, Trivedi MH, Wisniewski SR, Nierenberg AA, Stewart JW, Warden D, et al (2006).
Acute and longer-term outcomes in depressed outpatients requiring one or several treatment
steps: a STAR*D report. Am J Psychiatry 163: 1905–17.
Rushworth MFS, Behrens TEJ, Rudebeck PH, Walton ME (2007). Contrasting roles for
cingulate and orbitofrontal cortex in decisions and social behaviour. Trends Cogn Sci 11:
168–76.
Rushworth MFS, Walton ME, Kennerley SW, Bannerman DM (2004). Action sets and decisions
in the medial frontal cortex. Trends Cogn Sci 8: 410–7.
Rutherford G, Lithgow B, Moussavi Z (2015). Short and Long-term Effects of rTMS Treatment
on Alzheimer’s Disease at Different Stages: A Pilot Study. J Exp Neurosci 9: 43–51.
Rzepa E, McCabe C (2016). Decreased anticipated pleasure correlates with increased salience
network resting state functional connectivity in adolescents with depressive
symptomatology. J Psychiatr Res 82: 40–7.
Saad ZS, Gotts SJ, Murphy K, Chen G, Jo HJ, Martin A, et al (2012). Trouble at rest: how
correlation patterns and group differences become distorted after global signal regression.
Brain Connect 2: 25–32.
Saad ZS, Reynolds RC, Jo HJ, Gotts SJ, Chen G, Martin A, et al (2013). Correcting brain-wide
correlation differences in resting-state FMRI. Brain Connect 3: 339–52.
Sachdev PS, Loo CK, Mitchell PB, McFarquhar TF, Malhi GS (2007). Repetitive transcranial
magnetic stimulation for the treatment of obsessive compulsive disorder: a double-blind
controlled investigation. Psychol Med 37: 1645–9.
Sachdev PS, McBride R, Loo CK, Mitchell PB, Malhi GS, Croker VM (2001). Right versus left
prefrontal transcranial magnetic stimulation for obsessive-compulsive disorder: a
preliminary investigation. J Clin Psychiatry 62: 981–4.
Sadaghiani S, Scheeringa R, Lehongre K, Morillon B, Giraud A-L, D’Esposito M, et al (2012).
α-band phase synchrony is related to activity in the fronto-parietal adaptive control network.

363
J Neurosci 32: 14305–10.
Saggar M, Sporns O, Gonzalez-Castillo J, Bandettini PA, Carlsson G, Glover G, et al (2018).
Towards a new approach to reveal dynamical organization of the brain using topological
data analysis. Nat Commun 9: 1399.
Saito M, Iwata N, Kawakami N, Matsuyama Y, World Mental Health Japan 2002–2003
Collaborators, Ono Y, et al (2010). Evaluation of the DSM-IV and ICD-10 criteria for
depressive disorders in a community population in Japan using item response theory. Int J
Methods Psychiatr Res 19: 211–22.
Sakai Y, Narumoto J, Nishida S, Nakamae T, Yamada K, Nishimura T, et al (2011).
Corticostriatal functional connectivity in non-medicated patients with obsessive-compulsive
disorder. Eur Psychiatry 26: 463–9.
Salomons T V, Dunlop K, Kennedy SH, Flint A, Geraci J, Giacobbe P, et al (2014). Resting-
state cortico-thalamic-striatal connectivity predicts response to dorsomedial prefrontal
rTMS in major depressive disorder. Neuropsychopharmacology 39: 488–98.
Sanders N, Smeets PAM, Elburg AA van, Danner UN, Meer F van, Hoek HW, et al (2015).
Altered food-cue processing in chronically ill and recovered women with anorexia nervosa.
Front Behav Neurosci 9: 46.
Sarkhel S, Sinha VK, Praharaj SK (2010). Adjunctive high-frequency right prefrontal repetitive
transcranial magnetic stimulation (rTMS) was not effective in obsessive-compulsive
disorder but improved secondary depression. J Anxiety Disord 24: 535–9.
Satterthwaite TD, Elliott MA, Gerraty RT, Ruparel K, Loughead J, Calkins ME, et al (2013). An
improved framework for confound regression and filtering for control of motion artifact in
the preprocessing of resting-state functional connectivity data. Neuroimage 64: 240–56.
Satterthwaite TD, Wolf DH, Loughead J, Ruparel K, Elliott MA, Hakonarson H, et al (2012).
Impact of in-scanner head motion on multiple measures of functional connectivity:
relevance for studies of neurodevelopment in youth. Neuroimage 60: 623–32.
Saveanu R V, Nemeroff CB (2012). Etiology of depression: genetic and environmental factors.
Psychiatr Clin North Am 35: 51–71.
Saxena S, Brody AL, Maidment KM, Smith EC, Zohrabi N, Katz E, et al (2004). Cerebral
364
glucose metabolism in obsessive-compulsive hoarding. Am J Psychiatry 161: 1038–48.
Saxena S, Gorbis E, O’Neill J, Baker SK, Mandelkern MA, Maidment KM, et al (2009). Rapid
effects of brief intensive cognitive-behavioral therapy on brain glucose metabolism in
obsessive-compulsive disorder. Mol Psychiatry 14: 197–205.
Schäfer A, Vaitl D, Schienle A (2010). Regional grey matter volume abnormalities in bulimia
nervosa and binge-eating disorder. Neuroimage 50: 639–43.
Schebendach J, Broft A, Foltin RW, Walsh BT (2013). Can the reinforcing value of food be
measured in bulimia nervosa? Appetite 62: 70–5.
Scheperjans F, Hermann K, Eickhoff SB, Amunts K, Schleicher A, Zilles K (2008). Observer-
independent cytoarchitectonic mapping of the human superior parietal cortex. Cereb Cortex
18: 846–67.
Schienle A, Schäfer A, Hermann A, Vaitl D (2009). Binge-eating disorder: reward sensitivity
and brain activation to images of food. Biol Psychiatry 65: 654–61.
Schiller CE, Minkel J, Smoski MJ, Dichter GS (2013). Remitted major depression is
characterized by reduced prefrontal cortex reactivity to reward loss. J Affect Disord 151:
756–62.
Schmidt H, Petkov G, Richardson MP, Terry JR (2014). Dynamics on networks: the role of local
dynamics and global networks on the emergence of hypersynchronous neural activity. PLoS
Comput Biol 10: e1003947.
Schneibel R, Brakemeier E-L, Wilbertz G, Dykierek P, Zobel I, Schramm E (2012). Sensitivity
to detect change and the correlation of clinical factors with the Hamilton Depression Rating
Scale and the Beck Depression Inventory in depressed inpatients. Psychiatry Res 198: 62–7.
Schneider B, Koenigs M (2017). Human lesion studies of ventromedial prefrontal cortex.
Neuropsychologia 107: 84–93.
Schölvinck ML, Leopold DA, Brookes MJ, Khader PH (2013). The contribution of
electrophysiology to functional connectivity mapping. Neuroimage 80: 297–306.
Schölvinck ML, Maier A, Ye FQ, Duyn JH, Leopold DA (2010). Neural basis of global resting-
state fMRI activity. Proc Natl Acad Sci U S A 107: 10238–43.
Schönfeldt-Lecuona C, Thielscher A, Freudenmann RW, Kron M, Spitzer M, Herwig U (2005).
365
Accuracy of stereotaxic positioning of transcranial magnetic stimulation. Brain Topogr 17:
253–9.
Schöpf V, Windischberger C, Kasess CH, Lanzenberger R, Moser E (2010). Group ICA of
resting-state data: a comparison. MAGMA 23: 317–25.
Schrader LM, Cook IA, Miller PR, Maremont ER, DeGiorgio CM (2011). Trigeminal nerve
stimulation in major depressive disorder: first proof of concept in an open pilot trial.
Epilepsy Behav 22: 475–8.
Schultz W (1998). Predictive reward signal of dopamine neurons. J Neurophysiol 80: 1–27.
Schulz K, Sydekum E, Krueppel R, Engelbrecht CJ, Schlegel F, Schröter A, et al (2012).
Simultaneous BOLD fMRI and fiber-optic calcium recording in rat neocortex. Nat Methods
9: 597–602.
Schulze L, Feffer K, Lozano C, Giacobbe P, Daskalakis ZJ, Blumberger DM, et al (2018).
Number of pulses or number of sessions? An open-label study of trajectories of
improvement for once-vs. twice-daily dorsomedial prefrontal rTMS in major depression.
Brain Stimul 11: 327–336.
Schulze L, Wheeler S, McAndrews MP, Solomon CJE, Giacobbe P, Downar J (2016). Cognitive
safety of dorsomedial prefrontal repetitive transcranial magnetic stimulation in major
depression. Eur Neuropsychopharmacol 26: 1213–26.
Schummers J, Yu H, Sur M (2008). Tuned responses of astrocytes and their influence on
hemodynamic signals in the visual cortex. Science 320: 1638–43.
Schutter DJLG, Honk J van (2006). A Standardized Motor Threshold Estimation Procedure for
Transcranial Magnetic Stimulation Research. J ECT 22: 176–178.
Seeger G, Braus DF, Ruf M, Goldberger U, Schmidt MH (2002). Body image distortion reveals
amygdala activation in patients with anorexia nervosa -- a functional magnetic resonance
imaging study. Neurosci Lett 326: 25–8.
Seeley WW, Menon V, Schatzberg AF, Keller J, Glover GH, Kenna H, et al (2007). Dissociable
intrinsic connectivity networks for salience processing and executive control. J Neurosci 27:
2349–56.
Segarra N, Metastasio A, Ziauddeen H, Spencer J, Reinders NR, Dudas RB, et al (2016).

366
Abnormal Frontostriatal Activity During Unexpected Reward Receipt in Depression and
Schizophrenia: Relationship to Anhedonia. Neuropsychopharmacology 41: 2001–10.
Selemon LD, Goldman-Rakic PS (1985). Longitudinal topography and interdigitation of
corticostriatal projections in the rhesus monkey. J Neurosci 5: 776–94.
Semendeferi K, Armstrong E, Schleicher A, Zilles K, Hoesen GW Van (2001). Prefrontal cortex
in humans and apes: a comparative study of area 10. Am J Phys Anthropol 114: 224–41.
Seo D-O, Funderburk SC, Bhatti DL, Motard LE, Newbold D, Girven KS, et al (2016a). A
GABAergic Projection from the Centromedial Nuclei of the Amygdala to Ventromedial
Prefrontal Cortex Modulates Reward Behavior. J Neurosci 36: 10831–10842.
Seo H-J, Jung Y-E, Kim T-S, Kim J-B, Lee M-S, Kim J-M, et al (2011). Distinctive clinical
characteristics and suicidal tendencies of patients with anxious depression. J Nerv Ment Dis
199: 42–8.
Seo H-J, Jung Y-E, Lim HK, Um Y-H, Lee CU, Chae J-H (2016b). Adjunctive Low-frequency
Repetitive Transcranial Magnetic Stimulation over the Right Dorsolateral Prefrontal Cortex
in Patients with Treatment-resistant Obsessive-compulsive Disorder: A Randomized
Controlled Trial. Clin Psychopharmacol Neurosci 14: 153–60.
Sesack SR, Deutch AY, Roth RH, Bunney BS (1989). Topographical organization of the efferent
projections of the medial prefrontal cortex in the rat: an anterograde tract-tracing study with
Phaseolus vulgaris leucoagglutinin. J Comp Neurol 290: 213–42.
Shackman AJ, Salomons T V, Slagter HA, Fox AS, Winter JJ, Davidson RJ (2011). The
integration of negative affect, pain and cognitive control in the cingulate cortex. Nat Rev
Neurosci 12: 154–67.
Shajahan PM, Glabus MF, Steele JD, Doris AB, Anderson K, Jenkins JA, et al (2002). Left
dorso-lateral repetitive transcranial magnetic stimulation affects cortical excitability and
functional connectivity, but does not impair cognition in major depression. Prog
Neuropsychopharmacol Biol Psychiatry 26: 945–54.
Shanmugan S, Wolf DH, Calkins ME, Moore TM, Ruparel K, Hopson RD, et al (2016).
Common and Dissociable Mechanisms of Executive System Dysfunction Across
Psychiatric Disorders in Youth. Am J Psychiatry 173: 517–26.
367
Shannon BJ, Raichle ME, Snyder AZ, Fair DA, Mills KL, Zhang D, et al (2011). Premotor
functional connectivity predicts impulsivity in juvenile offenders. Proc Natl Acad Sci U S A
108: 11241–5.
Shapira-Lichter I, Oren N, Jacob Y, Gruberger M, Hendler T (2013). Portraying the unique
contribution of the default mode network to internally driven mnemonic processes. Proc
Natl Acad Sci U S A 110: 4950–5.
Shapiro JR, Berkman ND, Brownley KA, Sedway JA, Lohr KN, Bulik CM (2007). Bulimia
nervosa treatment: a systematic review of randomized controlled trials. Int J Eat Disord 40:
321–36.
Sharma A, Wolf DH, Ciric R, Kable JW, Moore TM, Vandekar SN, et al (2017). Common
Dimensional Reward Deficits Across Mood and Psychotic Disorders: A Connectome-Wide
Association Study. Am J Psychiatry 174: 657–666.
Sheehan D V, Lecrubier Y, Sheehan KH, Amorim P, Janavs J, Weiller E, et al (1998). The Mini-
International Neuropsychiatric Interview (M.I.N.I.): the development and validation of a
structured diagnostic psychiatric interview for DSM-IV and ICD-10. J Clin Psychiatry 59
Suppl 2: 22-33;quiz 34-57.
Sheffield JM, Kandala S, Tamminga CA, Pearlson GD, Keshavan MS, Sweeney JA, et al (2017).
Transdiagnostic Associations Between Functional Brain Network Integrity and Cognition.
JAMA psychiatry 74: 605–613.
Shehzad Z, Kelly AMC, Reiss PT, Gee DG, Gotimer K, Uddin LQ, et al (2009). The resting
brain: unconstrained yet reliable. Cereb Cortex 19: 2209–29.
Sheline YI, Barch DM, Price JL, Rundle MM, Vaishnavi SN, Snyder AZ, et al (2009). The
default mode network and self-referential processes in depression. Proc Natl Acad Sci 106:
1942–1947.
Shen T, Qiu M, Li C, Zhang J, Wu Z, Wang B, et al (2014). Altered spontaneous neural activity
in first-episode, unmedicated patients with major depressive disorder. Neuroreport 25:
1302–7.
Shepherd GMG (2013). Corticostriatal connectivity and its role in disease. Nat Rev Neurosci 14:
278–91.

368
Shilyansky C, Williams LM, Gyurak A, Harris A, Usherwood T, Etkin A (2016). Effect of
antidepressant treatment on cognitive impairments associated with depression: a
randomised longitudinal study. The lancet Psychiatry 3: 425–35.
Shiozawa P, Duailibi MS, Silva ME da, Cordeiro Q (2014). Trigeminal nerve stimulation (TNS)
protocol for treating major depression: an open-label proof-of-concept trial. Epilepsy Behav
39: 6–9.
Shiozawa P, Silva ME da, Netto GTM, Taiar I, Cordeiro Q (2015). Effect of a 10-day trigeminal
nerve stimulation (TNS) protocol for treating major depressive disorder: a phase II, sham-
controlled, randomized clinical trial. Epilepsy Behav 44: 23–6.
Shmuel A, Leopold DA (2008). Neuronal correlates of spontaneous fluctuations in fMRI signals
in monkey visual cortex: Implications for functional connectivity at rest. Hum Brain Mapp
29: 751–61.
Shmueli K, Gelderen P van, Zwart JA de, Horovitz SG, Fukunaga M, Jansma JM, et al (2007).
Low-frequency fluctuations in the cardiac rate as a source of variance in the resting-state
fMRI BOLD signal. Neuroimage 38: 306–20.
Shott ME, Pryor TL, Yang TT, Frank GKW (2016). Greater Insula White Matter Fiber
Connectivity in Women Recovered from Anorexia Nervosa. Neuropsychopharmacology 41:
498–507.
Shulman GL, Fiez JA, Corbetta M, Buckner RL, Miezin FM, Raichle ME, et al (1997). Common
Blood Flow Changes across Visual Tasks: II. Decreases in Cerebral Cortex. J Cogn
Neurosci 9: 648–63.
Shulman RG, Rothman DL, Behar KL, Hyder F (2004). Energetic basis of brain activity:
implications for neuroimaging. Trends Neurosci 27: 489–95.
Siegel M, Donner TH, Engel AK (2012). Spectral fingerprints of large-scale neuronal
interactions. Nat Rev Neurosci 13: 121–34.
Siegle GJ, Carter CS, Thase ME (2006). Use of FMRI to predict recovery from unipolar
depression with cognitive behavior therapy. Am J Psychiatry 163: 735–8.
Siero JCW, Hendrikse J, Hoogduin H, Petridou N, Luijten P, Donahue MJ (2015). Cortical depth
dependence of the BOLD initial dip and poststimulus undershoot in human visual cortex at
369
7 Tesla. Magn Reson Med 73: 2283–95.
Sikora M, Heffernan J, Avery ET, Mickey BJ, Zubieta J-K, Peciña M (2016). Salience Network
Functional Connectivity Predicts Placebo Effects in Major Depression. Biol psychiatry
Cogn Neurosci neuroimaging 1: 68–76.
Simon GE, Perlis RH (2010). Personalized medicine for depression: can we match patients with
treatments? Am J Psychiatry 167: 1445–55.
Simpson HB, Franklin ME, Cheng J, Foa EB, Liebowitz MR (2005). Standard criteria for relapse
are needed in obsessive-compulsive disorder. Depress Anxiety 21: 1–8.
Simpson HB, Huppert JD, Petkova E, Foa EB, Liebowitz MR (2006). Response versus remission
in obsessive-compulsive disorder. J Clin Psychiatry 67: 269–76.
Simpson JR, Drevets WC, Snyder AZ, Gusnard DA, Raichle ME (2001a). Emotion-induced
changes in human medial prefrontal cortex: II. During anticipatory anxiety. Proc Natl Acad
Sci U S A 98: 688–93.
Simpson JR, Snyder AZ, Gusnard DA, Raichle ME (2001b). Emotion-induced changes in human
medial prefrontal cortex: I. During cognitive task performance. Proc Natl Acad Sci U S A
98: 683–7.
Skunde M, Walther S, Simon JJ, Wu M, Bendszus M, Herzog W, et al (2016). Neural signature
of behavioural inhibition in women with bulimia nervosa. J Psychiatry Neurosci 41: E69-
78.
Slotnick SD (2017). Resting-state fMRI data reflects default network activity rather than null
data: A defense of commonly employed methods to correct for multiple comparisons. Cogn
Neurosci 8: 141–143.
Small DM, Gregory MD, Mak YE, Gitelman D, Mesulam MM, Parrish T (2003). Dissociation of
neural representation of intensity and affective valuation in human gustation. Neuron 39:
701–11.
Small DM, Zatorre RJ, Dagher A, Evans AC, Jones-Gotman M (2001). Changes in brain activity
related to eating chocolate: from pleasure to aversion. Brain 124: 1720–33.
Smink FRE, Hoeken D van, Oldehinkel AJ, Hoek HW (2014). Prevalence and severity of DSM-
5 eating disorders in a community cohort of adolescents. Int J Eat Disord 47: 610–9.
370
Smith D V, Rigney AE, Delgado MR (2016). Distinct Reward Properties are Encoded via
Corticostriatal Interactions. Sci Rep 6: 20093.
Smith D V, Utevsky A V, Bland AR, Clement N, Clithero JA, Harsch AEW, et al (2014).
Characterizing individual differences in functional connectivity using dual-regression and
seed-based approaches. Neuroimage 95: 1–12.
Smith KS, Graybiel AM (2013). A dual operator view of habitual behavior reflecting cortical and
striatal dynamics. Neuron 79: 361–74.
Smith SM (2002). Fast robust automated brain extraction. Hum Brain Mapp 17: 143–55.
Smith WK (1945). THE FUNCTIONAL SIGNIFICANCE OF THE ROSTRAL CINGULAR
CORTEX AS REVEALED BY ITS RESPONSES TO ELECTRICAL EXCITATION. J
Neurophysiol 8: 241–255.
Smith Y, Raju D V, Pare J-F, Sidibe M (2004). The thalamostriatal system: a highly specific
network of the basal ganglia circuitry. Trends Neurosci 27: 520–7.
Smith Y, Shink E, Sidibé M (1998). Neuronal circuitry and synaptic connectivity of the basal
ganglia. Neurosurg Clin N Am 9: 203–22.
Smittenaar P, Kurth-Nelson Z, Mohammadi S, Weiskopf N, Dolan RJ (2017). Local striatal
reward signals can be predicted from corticostriatal connectivity. Neuroimage 159: 9–17.
Smoski MJ, Rittenberg A, Dichter GS (2011). Major depressive disorder is characterized by
greater reward network activation to monetary than pleasant image rewards. Psychiatry Res
194: 263–270.
Snyder AZ, Raichle ME (2012). A brief history of the resting state: the Washington University
perspective. Neuroimage 62: 902–10.
Snyder HR, Miyake A, Hankin BL (2015). Advancing understanding of executive function
impairments and psychopathology: bridging the gap between clinical and cognitive
approaches. Front Psychol 6: 328.
SOKOLOFF L, MANGOLD R, WECHSLER RL, KENNEY C, KETY SS (1955). The effect of
mental arithmetic on cerebral circulation and metabolism. J Clin Invest 34: 1101–8.
Somogyi P, Bolam JP, Smith AD (1981). Monosynaptic cortical input and local axon collaterals
of identified striatonigral neurons. A light and electron microscopic study using the Golgi-
371
peroxidase transport-degeneration procedure. J Comp Neurol 195: 567–84.
Song X, Zhang Y, Liu Y (2014). Frequency specificity of regional homogeneity in the resting-
state human brain. PLoS One 9: e86818.
Souery D, Papakostas GI, Trivedi MH (2006). Treatment-resistant depression. J Clin Psychiatry
67 Suppl 6: 16–22.
Speer AM, Benson BE, Kimbrell TK, Wassermann EM, Willis MW, Herscovitch P, et al (2009).
Opposite effects of high and low frequency rTMS on mood in depressed patients:
relationship to baseline cerebral activity on PET. J Affect Disord 115: 386–94.
Speer AM, Kimbrell TA, Wassermann EM, D Repella J, Willis MW, Herscovitch P, et al (2000).
Opposite effects of high and low frequency rTMS on regional brain activity in depressed
patients. Biol Psychiatry 48: 1133–41.
Spies M, Kraus C, Geissberger N, Auer B, Klöbl M, Tik M, et al (2017). Default mode network
deactivation during emotion processing predicts early antidepressant response. Transl
Psychiatry 7: e1008.
Sporns O (2011). The human connectome: a complex network. Ann N Y Acad Sci 1224: 109–
125.
Spreng RN, Grady CL (2010). Patterns of brain activity supporting autobiographical memory,
prospection, and theory of mind, and their relationship to the default mode network. J Cogn
Neurosci 22: 1112–23.
Spreng RN, Mar RA, Kim ASN (2009). The common neural basis of autobiographical memory,
prospection, navigation, theory of mind, and the default mode: a quantitative meta-analysis.
J Cogn Neurosci 21: 489–510.
Sridharan D, Levitin DJ, Menon V (2008). A critical role for the right fronto-insular cortex in
switching between central-executive and default-mode networks. Proc Natl Acad Sci U S A
105: 12569–74.
Stafford JM, Jarrett BR, Miranda-Dominguez O, Mills BD, Cain N, Mihalas S, et al (2014).
Large-scale topology and the default mode network in the mouse connectome. Proc Natl
Acad Sci U S A 111: 18745–50.
Stagg CJ, Nitsche MA (2011). Physiological basis of transcranial direct current stimulation.
372
Neuroscientist 17: 37–53.
Stam CJ, Reijneveld JC (2007). Graph theoretical analysis of complex networks in the brain.
Nonlinear Biomed Phys 1: 3.
Stein DJ, Andersen EW, Tonnoir B, Fineberg N (2007). Escitalopram in obsessive-compulsive
disorder: a randomized, placebo-controlled, paroxetine-referenced, fixed-dose, 24-week
study. Curr Med Res Opin 23: 701–11.
Stein LA (2005). Making the best use of radiological resources in Canada. Healthc Pap 6: 18–
23.
Steinglass JE, Figner B, Berkowitz S, Simpson HB, Weber EU, Walsh BT (2012). Increased
capacity to delay reward in anorexia nervosa. J Int Neuropsychol Soc 18: 773–80.
Steinhausen H-C (2002). The outcome of anorexia nervosa in the 20th century. Am J Psychiatry
159: 1284–93.
Steinhausen HC (1997). Outcome of anorexia nervosa in the younger patient. J Child Psychol
Psychiatry 38: 271–6.
Steketee G (1997). Disability and family burden in obsessive-compulsive disorder. Can J
Psychiatry 42: 919–28.
Stevens MC, Pearlson GD, Calhoun VD (2009). Changes in the interaction of resting-state neural
networks from adolescence to adulthood. Hum Brain Mapp 30: 2356–66.
Storch EA, Rasmussen SA, Price LH, Larson MJ, Murphy TK, Goodman WK (2010).
Development and psychometric evaluation of the Yale-Brown Obsessive-Compulsive
Scale--Second Edition. Psychol Assess 22: 223–32.
Stoy M, Schlagenhauf F, Sterzer P, Bermpohl F, Hägele C, Suchotzki K, et al (2012).
Hyporeactivity of ventral striatum towards incentive stimuli in unmedicated depressed
patients normalizes after treatment with escitalopram. J Psychopharmacol 26: 677–88.
Strafella AP, Paus T, Barrett J, Dagher A (2001). Repetitive transcranial magnetic stimulation of
the human prefrontal cortex induces dopamine release in the caudate nucleus. J Neurosci
21: RC157.
Striegel-Moore RH, Bulik CM (2007). Risk factors for eating disorders. Am Psychol 62: 181–98.
373
Strigo IA, Matthews SC, Simmons AN, Oberndorfer T, Klabunde M, Reinhardt LE, et al (2013).
Altered insula activation during pain anticipation in individuals recovered from anorexia
nervosa: evidence of interoceptive dysregulation. Int J Eat Disord 46: 23–33.
Strober M, Freeman R, Lampert C, Diamond J, Kaye W (2000). Controlled family study of
anorexia nervosa and bulimia nervosa: evidence of shared liability and transmission of
partial syndromes. Am J Psychiatry 157: 393–401.
Strober M, Freeman R, Lampert C, Diamond J, Kaye W (2001). Males with anorexia nervosa: a
controlled study of eating disorders in first-degree relatives. Int J Eat Disord 29: 263–9.
Strober M, Freeman R, Morrell W (1997). The long-term course of severe anorexia nervosa in
adolescents: survival analysis of recovery, relapse, and outcome predictors over 10-15 years
in a prospective study. Int J Eat Disord 22: 339–60.
Subirà M, Alonso P, Segalàs C, Real E, López-Solà C, Pujol J, et al (2013). Brain structural
alterations in obsessive-compulsive disorder patients with autogenous and reactive
obsessions. PLoS One 8: e75273.
Sullivan PF (1995). Mortality in anorexia nervosa. Am J Psychiatry 152: 1073–4.
Sullivan PF, Neale MC, Kendler KS (2000). Genetic epidemiology of major depression: review
and meta-analysis. Am J Psychiatry 157: 1552–62.
Sutoh C, Koga Y, Kimura H, Kanahara N, Numata N, Hirano Y, et al (2016). Repetitive
Transcranial Magnetic Stimulation Changes Cerebral Oxygenation on the Left Dorsolateral
Prefrontal Cortex in Bulimia Nervosa: A Near-Infrared Spectroscopy Pilot Study. Eur Eat
Disord Rev 24: 83–8.
Suzuki WA, Amaral DG (1994). Perirhinal and parahippocampal cortices of the macaque
monkey: cortical afferents. J Comp Neurol 350: 497–533.
Svoboda E, McKinnon MC, Levine B (2006). The functional neuroanatomy of autobiographical
memory: a meta-analysis. Neuropsychologia 44: 2189–208.
Swanson SA, Crow SJ, Grange D Le, Swendsen J, Merikangas KR (2011). Prevalence and
correlates of eating disorders in adolescents. Results from the national comorbidity survey
replication adolescent supplement. Arch Gen Psychiatry 68: 714–23.
Sykes M, Makowiecki K, Rodger J (2013). Long term delivery of pulsed magnetic fields does

374
not alter visual discrimination learning or dendritic spine density in the mouse CA1
pyramidal or dentate gyrus neurons. F1000Research 2: 180.
Tadayonnejad R, Yang S, Kumar A, Ajilore O (2015). Clinical, cognitive, and functional
connectivity correlations of resting-state intrinsic brain activity alterations in unmedicated
depression. J Affect Disord 172: 241–50.
Tagliazucchi E, Balenzuela P, Fraiman D, Chialvo DR (2012). Criticality in large-scale brain
FMRI dynamics unveiled by a novel point process analysis. Front Physiol 3: 15.
Tagliazucchi E, Siniatchkin M, Laufs H, Chialvo DR (2016). The Voxel-Wise Functional
Connectome Can Be Efficiently Derived from Co-activations in a Sparse Spatio-Temporal
Point-Process. Front Neurosci 10: 381.
Takahashi S, Ukai S, Tsuji T, Kose A, Shoyama M, Yamamoto M, et al (2013). Cerebral blood
flow in the subgenual anterior cingulate cortex and modulation of the mood-regulatory
networks in a successful rTMS treatment for major depressive disorder. Neurocase 19: 262–
7.
Talairach J, Tournoux P (1988). Co-planar stereotaxic atlas of the human brain: 3-dimensional
proportional system: an approach to cerebral imaging. Neuropsychologia 39: 145.
Tang A, Thickbroom G, Rodger J (2017). Repetitive Transcranial Magnetic Stimulation of the
Brain. Neurosci 23: 82–94.
Tapajóz P de Sampaio F, Soneira S, Aulicino A, Harris P, Allegri RF (2015). Emotional
reactivity to social stimuli in patients with eating disorders. Psychiatry Res 229: 887–94.
Tataranni PA, Gautier JF, Chen K, Uecker A, Bandy D, Salbe AD, et al (1999).
Neuroanatomical correlates of hunger and satiation in humans using positron emission
tomography. Proc Natl Acad Sci U S A 96: 4569–74.
Taylor PCJ, Nobre AC, Rushworth MFS (2007). Subsecond changes in top down control exerted
by human medial frontal cortex during conflict and action selection: a combined
transcranial magnetic stimulation electroencephalography study. J Neurosci 27: 11343–53.
Taylor S (2016). Disorder-specific genetic factors in obsessive-compulsive disorder: A
comprehensive meta-analysis. Am J Med Genet B Neuropsychiatr Genet 171B: 325–32.
Taylor S, Jang KL (2011). Biopsychosocial etiology of obsessions and compulsions: an
375
integrated behavioral-genetic and cognitive-behavioral analysis. J Abnorm Psychol 120:
174–86.
Taylor SF, Ho SS, Abagis T, Angstadt M, Maixner DF, Welsh RC, et al (2018). Changes in
brain connectivity during a sham-controlled, transcranial magnetic stimulation trial for
depression. J Affect Disord 232: 143–151.
Taylor WD, Kudra K, Zhao Z, Steffens DC, MacFall JR (2014). Cingulum bundle white matter
lesions influence antidepressant response in late-life depression: a pilot study. J Affect
Disord 162: 8–11.
Tedeschini E, Levkovitz Y, Iovieno N, Ameral VE, Nelson JC, Papakostas GI (2011). Efficacy
of antidepressants for late-life depression: a meta-analysis and meta-regression of placebo-
controlled randomized trials. J Clin Psychiatry 72: 1660–8.
Teneback CC, Nahas Z, Speer AM, Molloy M, Stallings LE, Spicer KM, et al (1999). Changes
in prefrontal cortex and paralimbic activity in depression following two weeks of daily left
prefrontal TMS. J Neuropsychiatry Clin Neurosci 11: 426–35.
Teng S, Guo Z, Peng H, Xing G, Chen H, He B, et al (2017). High-frequency repetitive
transcranial magnetic stimulation over the left DLPFC for major depression: Session-
dependent efficacy: A meta-analysis. Eur Psychiatry 41: 75–84.
Terao Y, Ugawa Y, Enomoto H, Furubayashi T, Shiio Y, Machii K, et al (2001). Hemispheric
lateralization in the cortical motor preparation for human vocalization. J Neurosci 21:
1600–9.
Thase ME, Larsen KG, Kennedy SH (2011). Assessing the “true” effect of active antidepressant
therapy v. placebo in major depressive disorder: use of a mixture model. Br J Psychiatry
199: 501–7.
Thielscher A, Pessoa L (2007). Neural correlates of perceptual choice and decision making
during fear-disgust discrimination. J Neurosci 27: 2908–17.
Thomas JJ, Roberto CA, Brownell KD (2009). Eighty-five per cent of what? Discrepancies in
the weight cut-off for anorexia nervosa substantially affect the prevalence of underweight.
Psychol Med 39: 833–43.
Thompson-Brenner H, Shingleton RM, Sauer-Zavala S, Richards LK, Pratt EM (2015). Multiple
376
measures of rapid response as predictors of remission in cognitive behavior therapy for
bulimia nervosa. Behav Res Ther 64: 9–14.
Thompson GJ, Pan W-J, Billings JCW, Grooms JK, Shakil S, Jaeger D, et al (2014a). Phase-
amplitude coupling and infraslow (<1 Hz) frequencies in the rat brain: relationship to
resting state fMRI. Front Integr Neurosci 8: 41.
Thompson PM, Stein JL, Medland SE, Hibar DP, Vasquez AA, Renteria ME, et al (2014b). The
ENIGMA Consortium: large-scale collaborative analyses of neuroimaging and genetic data.
Brain Imaging Behav 8: 153–82.
Thornton LM, Mazzeo SE, Bulik CM (2011). The heritability of eating disorders: methods and
current findings. Curr Top Behav Neurosci 6: 141–56.
Titova OE, Hjorth OC, Schiöth HB, Brooks SJ (2013). Anorexia nervosa is linked to reduced
brain structure in reward and somatosensory regions: a meta-analysis of VBM studies. BMC
Psychiatry 13: 110.
Tokay T, Holl N, Kirschstein T, Zschorlich V, Köhling R (2009). High-frequency magnetic
stimulation induces long-term potentiation in rat hippocampal slices. Neurosci Lett 461:
150–154.
Tollefson GD, Rampey AH, Potvin JH, Jenike MA, Rush AJ, Kominguez RA, et al (1994). A
multicenter investigation of fixed-dose fluoxetine in the treatment of obsessive-compulsive
disorder. Arch Gen Psychiatry 51: 559–67.
Tor P-C, Gálvez V, Goldstein J, George D, Loo CK (2016). Pilot Study of Accelerated Low-
Frequency Right-Sided Transcranial Magnetic Stimulation for Treatment-Resistant
Depression. J ECT 32: 180–2.
Tremblay L, Schultz W (1999). Relative reward preference in primate orbitofrontal cortex.
Nature 398: 704–8.
Tremblay LK, Naranjo CA, Graham SJ, Herrmann N, Mayberg HS, Hevenor S, et al (2005).
Functional neuroanatomical substrates of altered reward processing in major depressive
disorder revealed by a dopaminergic probe. Arch Gen Psychiatry 62: 1228–36.
Treynor W, Gonzalez R, Nolen-Hoeksema S (2003). Rumination reconsidered: A psychometric
analysis. Cognit Ther Res 27: 247–259.
377
Triggs WJ, Ricciuti N, Ward HE, Cheng J, Bowers D, Goodman WK, et al (2010). Right and left
dorsolateral pre-frontal rTMS treatment of refractory depression: a randomized, sham-
controlled trial. Psychiatry Res 178: 467–74.
Trippe J, Mix A, Aydin-Abidin S, Funke K, Benali A (2009). Theta burst and conventional low-
frequency rTMS differentially affect GABAergic neurotransmission in the rat cortex. Exp
Brain Res 199: 411–421.
Trivedi MH, Rush AJ, Wisniewski SR, Nierenberg AA, Warden D, Ritz L, et al (2006).
Evaluation of outcomes with citalopram for depression using measurement-based care in
STAR*D: implications for clinical practice. Am J Psychiatry 163: 28–40.
Tziortzi AC, Haber SN, Searle GE, Tsoumpas C, Long CJ, Shotbolt P, et al (2014).
Connectivity-based functional analysis of dopamine release in the striatum using diffusion-
weighted MRI and positron emission tomography. Cereb Cortex 24: 1165–77.
Uddin LQ, Kelly AM, Biswal BB, Castellanos FX, Milham MP (2009). Functional connectivity
of default mode network components: correlation, anticorrelation, and causality. Hum Brain
Mapp 30: 625–37.
Uher R, Murphy T, Brammer MJ, Dalgleish T, Phillips ML, Ng VW, et al (2004). Medial
prefrontal cortex activity associated with symptom provocation in eating disorders. Am J
Psychiatry 161: 1238–46.
Uher R, Payne JL, Pavlova B, Perlis RH (2014). Major depressive disorder in DSM-5:
implications for clinical practice and research of changes from DSM-IV. Depress Anxiety
31: 459–71.
Uher R, Yoganathan D, Mogg A, Eranti S V, Treasure J, Campbell IC, et al (2005). Effect of left
prefrontal repetitive transcranial magnetic stimulation on food craving. Biol Psychiatry 58:
840–2.
Urry HL, Reekum CM van, Johnstone T, Kalin NH, Thurow ME, Schaefer HS, et al (2006).
Amygdala and ventromedial prefrontal cortex are inversely coupled during regulation of
negative affect and predict the diurnal pattern of cortisol secretion among older adults. J
Neurosci 26: 4415–25.
Utevsky A V, Smith D V, Huettel SA (2014). Precuneus is a functional core of the default-mode
378
network. J Neurosci 34: 932–40.
Uylings HBM, -Arigita EJS, Vos K de, Pool CW, Evers P, Rajkowska G (2010). 3-D
Cytoarchitectonic parcellation of human orbitofrontal cortex. Psychiatry Res Neuroimaging
183: 1–20.
Vaghi MM, Vértes PE, Kitzbichler MG, Apergis-Schoute AM, Flier FE van der, Fineberg NA, et
al (2017). Specific Frontostriatal Circuits for Impaired Cognitive Flexibility and Goal-
Directed Planning in Obsessive-Compulsive Disorder: Evidence From Resting-State
Functional Connectivity. Biol Psychiatry 81: 708–717.
Vaishnavi SN, Vlassenko AG, Rundle MM, Snyder AZ, Mintun MA, Raichle ME (2010).
Regional aerobic glycolysis in the human brain. Proc Natl Acad Sci U S A 107: 17757–62.
Val-Laillet D, Aarts E, Weber B, Ferrari M, Quaresima V, Stoeckel LE, et al (2015).
Neuroimaging and neuromodulation approaches to study eating behavior and prevent and
treat eating disorders and obesity. NeuroImage Clin 8: 1–31.
Vallar G (1998). Spatial hemineglect in humans. Trends Cogn Sci 2: 87–97.
Vanhatalo S, Palva JM, Holmes MD, Miller JW, Voipio J, Kaila K (2004). Infraslow oscillations
modulate excitability and interictal epileptic activity in the human cortex during sleep. Proc
Natl Acad Sci U S A 101: 5053–7.
Vanhaudenhuyse A, Noirhomme Q, Tshibanda LJ-F, Bruno M-A, Boveroux P, Schnakers C, et
al (2010). Default network connectivity reflects the level of consciousness in non-
communicative brain-damaged patients. Brain 133: 161–71.
Vasiliadis H-M, Lesage A, Adair C, Wang PS, Kessler RC (2007). Do Canada and the United
States differ in prevalence of depression and utilization of services? Psychiatr Serv 58: 63–
71.
Velden AM van der, Kuyken W, Wattar U, Crane C, Pallesen KJ, Dahlgaard J, et al (2015). A
systematic review of mechanisms of change in mindfulness-based cognitive therapy in the
treatment of recurrent major depressive disorder. Clin Psychol Rev 37: 26–39.
Ven VG van de, Formisano E, Prvulovic D, Roeder CH, Linden DEJ (2004). Functional
connectivity as revealed by spatial independent component analysis of fMRI measurements
during rest. Hum Brain Mapp 22: 165–78.
379
Vermeiden M, Broek WW van den, Mulder PGH, Birkenhäger TK (2010). Influence of gender
and menopausal status on antidepressant treatment response in depressed inpatients. J
Psychopharmacol 24: 497–502.
Vincent JL, Kahn I, Snyder AZ, Raichle ME, Buckner RL (2008). Evidence for a frontoparietal
control system revealed by intrinsic functional connectivity. J Neurophysiol 100: 3328–42.
Vincent JL, Patel GH, Fox MD, Snyder AZ, Baker JT, Essen DC Van, et al (2007). Intrinsic
functional architecture in the anaesthetized monkey brain. Nature 447: 83–6.
Vincent JL, Snyder AZ, Fox MD, Shannon BJ, Andrews JR, Raichle ME, et al (2006). Coherent
spontaneous activity identifies a hippocampal-parietal memory network. J Neurophysiol 96:
3517–31.
Vlachos A, Muller-Dahlhaus F, Rosskopp J, Lenz M, Ziemann U, Deller T (2012). Repetitive
Magnetic Stimulation Induces Functional and Structural Plasticity of Excitatory
Postsynapses in Mouse Organotypic Hippocampal Slice Cultures. J Neurosci 32: 17514–
17523.
Vocks S, Busch M, Grönemeyer D, Schulte D, Herpertz S, Suchan B (2010). Neural correlates of
viewing photographs of one’s own body and another woman’s body in anorexia and bulimia
nervosa: an fMRI study. J Psychiatry Neurosci 35: 163–76.
Vogeley K, May M, Ritzl A, Falkai P, Zilles K, Fink GR (2004). Neural correlates of first-person
perspective as one constituent of human self-consciousness. J Cogn Neurosci 16: 817–27.
Vogt BA, Finch DM, Olson CR (1992). Functional heterogeneity in cingulate cortex: the anterior
executive and posterior evaluative regions. Cereb Cortex 2: 435–43.
Vogt BA, Pandya DN (1987). Cingulate cortex of the rhesus monkey: II. Cortical afferents. J
Comp Neurol 262: 271–89.
Vogt BA, Pandya DN, Rosene DL (1987). Cingulate cortex of the rhesus monkey: I.
Cytoarchitecture and thalamic afferents. J Comp Neurol 262: 256–70.
Vogt BA, Rosene DL, Pandya DN (1979). Thalamic and cortical afferents differentiate anterior
from posterior cingulate cortex in the monkey. Science 204: 205–7.
Vogt BA, Vogt LJ, Perl DP, Hof PR (2001). Cytology of human caudomedial cingulate,
retrosplenial, and caudal parahippocampal cortices. J Comp Neurol 438: 353–76.
380
Volz LJ, Benali A, Mix A, Neubacher U, Funke K (2013). Dose-Dependence of Changes in
Cortical Protein Expression Induced with Repeated Transcranial Magnetic Theta-Burst
Stimulation in the Rat. Brain Stimul 6: 598–606.
Voorn P, Vanderschuren LJMJ, Groenewegen HJ, Robbins TW, Pennartz CMA (2004). Putting
a spin on the dorsal-ventral divide of the striatum. Trends Neurosci 27: 468–74.
Waarde JA van, Scholte HS, Oudheusden LJB van, Verwey B, Denys D, Wingen GA van
(2015). A functional MRI marker may predict the outcome of electroconvulsive therapy in
severe and treatment-resistant depression. Mol Psychiatry 20: 609–14.
Wade TD, Bulik CM, Neale M, Kendler KS (2000). Anorexia nervosa and major depression:
shared genetic and environmental risk factors. Am J Psychiatry 157: 469–71.
Wager TD, Davidson ML, Hughes BL, Lindquist MA, Ochsner KN (2008). Prefrontal-
Subcortical Pathways Mediating Successful Emotion Regulation. Neuron 59: 1037–1050.
Wager TD, Rilling JK, Smith EE, Sokolik A, Casey KL, Davidson RJ, et al (2004). Placebo-
induced changes in FMRI in the anticipation and experience of pain. Science 303: 1162–7.
Wagner A, Aizenstein H, Venkatraman VK, Bischoff-Grethe A, Fudge J, May JC, et al (2010).
Altered striatal response to reward in bulimia nervosa after recovery. Int J Eat Disord 43:
289–94.
Wagner A, Aizenstein H, Venkatraman VK, Fudge J, May JC, Mazurkewicz L, et al (2007).
Altered reward processing in women recovered from anorexia nervosa. Am J Psychiatry
164: 1842–9.
Wagner G, Koch K, Schachtzabel C, Peikert G, Schultz CC, Reichenbach JR, et al (2013). Self-
referential processing influences functional activation during cognitive control: an fMRI
study. Soc Cogn Affect Neurosci 8: 828–37.
Wagner G, Schachtzabel C, Peikert G, Bär K-J (2015). The neural basis of the abnormal self-
referential processing and its impact on cognitive control in depressed patients. Hum Brain
Mapp 36: 2781–94.
Wagner G, Sinsel E, Sobanski T, Köhler S, Marinou V, Mentzel H-J, et al (2006). Cortical
inefficiency in patients with unipolar depression: an event-related FMRI study with the
Stroop task. Biol Psychiatry 59: 958–65.
381
Walker AE (1940). A cytoarchitectural study of the prefrontal area of the macaque monkey. J
Comp Neurol 73: 59–86.
Walpoth M, Hoertnagl C, Mangweth-Matzek B, Kemmler G, Hinterhölzl J, Conca A, et al
(2008). Repetitive transcranial magnetic stimulation in bulimia nervosa: preliminary results
of a single-centre, randomised, double-blind, sham-controlled trial in female outpatients.
Psychother Psychosom 77: 57–60.
Walsh BT, Kaplan AS, Attia E, Olmsted M, Parides M, Carter JC, et al (2006). Fluoxetine after
weight restoration in anorexia nervosa: a randomized controlled trial. JAMA 295: 2605–12.
Walsh BT, Wilson GT, Loeb KL, Devlin MJ, Pike KM, Roose SP, et al (1997). Medication and
psychotherapy in the treatment of bulimia nervosa. Am J Psychiatry 154: 523–31.
Walsh E, Carl H, Eisenlohr-Moul T, Minkel J, Crowther A, Moore T, et al (2017). Attenuation
of Frontostriatal Connectivity During Reward Processing Predicts Response to
Psychotherapy in Major Depressive Disorder. Neuropsychopharmacology 42: 831–843.
Wang H-Y, Crupi D, Liu J, Stucky A, Cruciata G, Rocco A Di, et al (2011). Repetitive
Transcranial Magnetic Stimulation Enhances BDNF-TrkB Signaling in Both Brain and
Lymphocyte. J Neurosci 31: 11044–11054.
Wang J, Wang L, Zang Y, Yang H, Tang H, Gong Q, et al (2009). Parcellation-dependent small-
world brain functional networks: a resting-state fMRI study. Hum Brain Mapp 30: 1511–23.
Wang J, Zuo X, He Y (2010). Graph-based network analysis of resting-state functional MRI.
Front Syst Neurosci 4: 16.
Wang L, Dai W, Su Y, Wang G, Tan Y, Jin Z, et al (2012a). Amplitude of low-frequency
oscillations in first-episode, treatment-naive patients with major depressive disorder: a
resting-state functional MRI study. PLoS One 7: e48658.
Wang L, Kong Q, Li K, Su Y, Zeng Y, Zhang Q, et al (2016). Frequency-dependent changes in
amplitude of low-frequency oscillations in depression: A resting-state fMRI study. Neurosci
Lett 614: 105–11.
Wang L, Li X, Li K, Su Y, Zeng Y, Zhang Q, et al (2017). Mapping the effect of escitalopram
treatment on amplitude of low-frequency fluctuations in patients with depression: a resting-
state fMRI study. Metab Brain Dis 32: 147–154.
382
Wang L, Saalmann YB, Pinsk MA, Arcaro MJ, Kastner S (2012b). Electrophysiological low-
frequency coherence and cross-frequency coupling contribute to BOLD connectivity.
Neuron 76: 1010–20.
Wang L, Xia M, Li K, Zeng Y, Su Y, Dai W, et al (2015). The effects of antidepressant
treatment on resting-state functional brain networks in patients with major depressive
disorder. Hum Brain Mapp 36: 768–78.
Wang Y, Li T-Q (2015). Dimensionality of ICA in resting-state fMRI investigated by feature
optimized classification of independent components with SVM. Front Hum Neurosci 9:
259.
Wassermann EM, McShane LM, Hallett M, Cohen LG (1992). Noninvasive mapping of muscle
representations in human motor cortex. Electroencephalogr Clin Neurophysiol 85: 1–8.
Watanabe M, Bartels A, Macke JH, Murayama Y, Logothetis NK (2013). Temporal jitter of the
BOLD signal reveals a reliable initial dip and improved spatial resolution. Curr Biol 23:
2146–50.
Webb CA, Dillon DG, Pechtel P, Goer FK, Murray L, Huys QJM, et al (2016). Neural
Correlates of Three Promising Endophenotypes of Depression: Evidence from the
EMBARC Study. Neuropsychopharmacology 41: 454–63.
Webb CA, Weber M, Mundy EA, Killgore WDS (2014). Reduced gray matter volume in the
anterior cingulate, orbitofrontal cortex and thalamus as a function of mild depressive
symptoms: a voxel-based morphometric analysis. Psychol Med 44: 2833–43.
Weissenbacher A, Kasess C, Gerstl F, Lanzenberger R, Moser E, Windischberger C (2009).
Correlations and anticorrelations in resting-state functional connectivity MRI: a quantitative
comparison of preprocessing strategies. Neuroimage 47: 1408–16.
Weissman MM, Bland RC, Canino GJ, Greenwald S, Hwu HG, Lee CK, et al (1994). The cross
national epidemiology of obsessive compulsive disorder. The Cross National Collaborative
Group. J Clin Psychiatry 55 Suppl: 5–10.
Weller JA, Levin IP, Shiv B, Bechara A (2009). The effects of insula damage on decision-
making for risky gains and losses. Soc Neurosci 4: 347–58.
Welton T, Kent DA, Auer DP, Dineen RA (2015). Reproducibility of graph-theoretic brain
383
network metrics: a systematic review. Brain Connect 5: 193–202.
Wens V, Bourguignon M, Goldman S, Marty B, Beeck M Op de, Clumeck C, et al (2014). Inter-
and intra-subject variability of neuromagnetic resting state networks. Brain Topogr 27:
620–34.
Weygandt M, Schaefer A, Schienle A, Haynes J-D (2012). Diagnosing different binge-eating
disorders based on reward-related brain activation patterns. Hum Brain Mapp 33: 2135–46.
Whiteside SP, Lynam DR (2001). The Five Factor Model and impulsivity: using a structural
model of personality to understand impulsivity. Pers Individ Dif 30: 669–689.
Whitfield-Gabrieli S, Nieto-Castanon A (2012). Conn: A Functional Connectivity Toolbox for
Correlated and Anticorrelated Brain Networks. Brain Connect 2: 125–141.
Whittal ML, Thordarson DS, McLean PD (2005). Treatment of obsessive-compulsive disorder:
cognitive behavior therapy vs. exposure and response prevention. Behav Res Ther 43:
1559–76.
Wierenga CE, Ely A, Bischoff-Grethe A, Bailer UF, Simmons AN, Kaye WH (2014). Are
Extremes of Consumption in Eating Disorders Related to an Altered Balance between
Reward and Inhibition? Front Behav Neurosci 8: 410.
Wiles NJ, Thomas L, Turner N, Garfield K, Kounali D, Campbell J, et al (2016). Long-term
effectiveness and cost-effectiveness of cognitive behavioural therapy as an adjunct to
pharmacotherapy for treatment-resistant depression in primary care: follow-up of the
CoBalT randomised controlled trial. The lancet Psychiatry 3: 137–44.
Williams ZM, Bush G, Rauch SL, Cosgrove GR, Eskandar EN (2004). Human anterior cingulate
neurons and the integration of monetary reward with motor responses. Nat Neurosci 7:
1370–5.
Wilson GT, Fairburn CC, Agras WS, Walsh BT, Kraemer H (2002). Cognitive-behavioral
therapy for bulimia nervosa: time course and mechanisms of change. J Consult Clin Psychol
70: 267–74.
Wise RA, Rompre PP (1989). Brain dopamine and reward. Annu Rev Psychol 40: 191–225.
Wise RG, Ide K, Poulin MJ, Tracey I (2004). Resting fluctuations in arterial carbon dioxide
induce significant low frequency variations in BOLD signal. Neuroimage 21: 1652–64.
384
Wise T, Radua J, Via E, Cardoner N, Abe O, Adams TM, et al (2017). Common and distinct
patterns of grey-matter volume alteration in major depression and bipolar disorder: evidence
from voxel-based meta-analysis. Mol Psychiatry 22: 1455–1463.
Woo C-W, Krishnan A, Wager TD (2014). Cluster-extent based thresholding in fMRI analyses:
pitfalls and recommendations. Neuroimage 91: 412–9.
Woody SR, Steketee G, Chambless DL (1995). Reliability and validity of the Yale-Brown
Obsessive-Compulsive Scale. Behav Res Ther 33: 597–605.
Woolgar A, Hampshire A, Thompson R, Duncan J (2011). Adaptive coding of task-relevant
information in human frontoparietal cortex. J Neurosci 31: 14592–9.
Workman CI, Lythe KE, McKie S, Moll J, Gethin JA, Deakin JFW, et al (2017). A novel
resting-state functional magnetic resonance imaging signature of resilience to recurrent
depression. Psychol Med 47: 597–607.
World Health Organization (1992). The ICD-10 Classification of Mental and Behavioural
Disorders. Int Classif 10: 1–267.
Worsley KJ, Marrett S, Neelin P, Evans AC (1996). Searching scale space for activation in PET
images. Hum Brain Mapp 4: 74–90.
Wu CC, Sacchet MD, Knutson B (2012). Toward an affective neuroscience account of financial
risk taking. Front Neurosci 6: 159.
Wu CW, Chen C-L, Liu P-Y, Chao Y-P, Biswal BB, Lin C-P (2011). Empirical evaluations of
slice-timing, smoothing, and normalization effects in seed-based, resting-state functional
magnetic resonance imaging analyses. Brain Connect 1: 401–10.
Wu G-R, Baeken C (2017). Longer depressive episode duration negatively influences HF-rTMS
treatment response: a cerebellar metabolic deficiency? Brain Imaging Behav 11: 8–16.
Wu H, Dyck-Lippens PJ Van, Santegoeds R, Kuyck K van, Gabriëls L, Lin G, et al (2013).
Deep-brain stimulation for anorexia nervosa. World Neurosurg 80: S29.e1-10.
Xie J, Chen J, Wei Q (2013). Repetitive transcranial magnetic stimulation versus
electroconvulsive therapy for major depression: a meta-analysis of stimulus parameter
effects. Neurol Res 35: 1084–91.
Xue S, Wang X, Wang W, Liu J, Qiu J (2016). Frequency-dependent alterations in regional
385
homogeneity in major depression. Behav Brain Res 306: 13–9.
Yan C-G, Cheung B, Kelly C, Colcombe S, Craddock RC, Martino A Di, et al (2013). A
comprehensive assessment of regional variation in the impact of head micromovements on
functional connectomics. Neuroimage 76: 183–201.
Yang T, Cheng Y, Li H, Jiang H, Luo C, Shan B, et al (2010). Abnormal regional homogeneity
of drug-naïve obsessive-compulsive patients. Neuroreport 21: 786–90.
Yang X-R, Kirton A, Wilkes TC, Pradhan S, Liu I, Jaworska N, et al (2014). Glutamate
Alterations Associated With Transcranial Magnetic Stimulation in Youth Depression: A
Case Series. J ECT 00: 1–6.
Yang X-Y, Sun J, Luo J, Zhong Z-X, Li P, Yao S-M, et al (2015). Regional homogeneity of
spontaneous brain activity in adult patients with obsessive-compulsive disorder before and
after cognitive behavioural therapy. J Affect Disord 188: 243–51.
Yeo BTT, Krienen FM, Sepulcre J, Sabuncu MR, Lashkari D, Hollinshead M, et al (2011). The
organization of the human cerebral cortex estimated by intrinsic functional connectivity. J
Neurophysiol 106: 1125–65.
Yeterian EH, Hoesen GW Van (1978). Cortico-striate projections in the rhesus monkey: the
organization of certain cortico-caudate connections. Brain Res 139: 43–63.
Yin HH, Mulcare SP, Hilário MRF, Clouse E, Holloway T, Davis MI, et al (2009). Dynamic
reorganization of striatal circuits during the acquisition and consolidation of a skill. Nat
Neurosci 12: 333–41.
Yoon KJ, Lee Y-T, Han TR (2011). Mechanism of functional recovery after repetitive
transcranial magnetic stimulation (rTMS) in the subacute cerebral ischemic rat model:
neural plasticity or anti-apoptosis? Exp Brain Res 214: 549–556.
Young L, Camprodon JA, Hauser M, Pascual-Leone A, Saxe R (2010). Disruption of the right
temporoparietal junction with transcranial magnetic stimulation reduces the role of beliefs
in moral judgments. Proc Natl Acad Sci U S A 107: 6753–8.
Yukimasa T, Yoshimura R, Tamagawa A, Uozumi T, Shinkai K, Ueda N, et al (2006). High-
Frequency Repetitive Transcranial Magnetic Stimulation Improves Refractory Depression
by Influencing Catecholamine and Brain-Derived Neurotrophic Factors.
386
Pharmacopsychiatry 39: 52–59.
Yuste R (2015). From the neuron doctrine to neural networks. Nat Rev Neurosci 16: 487–97.
Záborszky L, Alheid GF, Beinfeld MC, Eiden LE, Heimer L, Palkovits M (1985).
Cholecystokinin innervation of the ventral striatum: a morphological and
radioimmunological study. Neuroscience 14: 427–53.
Zalesky A, Fornito A, Harding IH, Cocchi L, Yücel M, Pantelis C, et al (2010). Whole-brain
anatomical networks: does the choice of nodes matter? Neuroimage 50: 970–83.
Zanardini R, Gazzoli A, Ventriglia M, Perez J, Bignotti S, Mariarossini P, et al (2006). Effect of
repetitive transcranial magnetic stimulation on serum brain derived neurotrophic factor in
drug resistant depressed patients. J Affect Disord 91: 83–86.
Zang Y-F, He Y, Zhu C-Z, Cao Q-J, Sui M-Q, Liang M, et al (2007). Altered baseline brain
activity in children with ADHD revealed by resting-state functional MRI. Brain Dev 29:
83–91.
Zang Y, Jiang T, Lu Y, He Y, Tian L (2004). Regional homogeneity approach to fMRI data
analysis. Neuroimage 22: 394–400.
Zangen A, Hyodo K (2002). Transcranial magnetic stimulation induces increases in extracellular
levels of dopamine and glutamate in the nucleus accumbens. Neuroreport 13: 2401–5.
Zastrow A, Kaiser S, Stippich C, Walther S, Herzog W, Tchanturia K, et al (2009). Neural
correlates of impaired cognitive-behavioral flexibility in anorexia nervosa. Am J Psychiatry
166: 608–16.
Zerwas S, Lund BC, Holle A Von, Thornton LM, Berrettini WH, Brandt H, et al (2013). Factors
associated with recovery from anorexia nervosa. J Psychiatr Res 47: 972–9.
Zhang K, Liu Z, Cao X, Yang C, Xu Y, Xu T, et al (2017). Amplitude of low-frequency
fluctuations in first-episode, drug-naïve depressive patients: A 5-year retrospective study.
PLoS One 12: e0174564.
Zhang W-N, Chang S-H, Guo L-Y, Zhang K-L, Wang J (2013). The neural correlates of reward-
related processing in major depressive disorder: a meta-analysis of functional magnetic
resonance imaging studies. J Affect Disord 151: 531–9.
Zhang Y, Brady M, Smith S (2001). Segmentation of brain MR images through a hidden Markov
387
random field model and the expectation-maximization algorithm. IEEE Trans Med Imaging
20: 45–57.
Zhao Y-J, Du M-Y, Huang X-Q, Lui S, Chen Z-Q, Liu J, et al (2014). Brain grey matter
abnormalities in medication-free patients with major depressive disorder: a meta-analysis.
Psychol Med 44: 2927–37.
Zhu X, Zhu Q, Shen H, Liao W, Yuan F (2017). Rumination and Default Mode Network
Subsystems Connectivity in First-episode, Drug-Naive Young Patients with Major
Depressive Disorder. Sci Rep 7: 43105.
Zimmerman M, Martinez JH, Young D, Chelminski I, Dalrymple K (2013). Severity
classification on the Hamilton Depression Rating Scale. J Affect Disord 150: 384–8.
Zohar J, Judge R (1996). Paroxetine versus clomipramine in the treatment of obsessive-
compulsive disorder. OCD Paroxetine Study Investigators. Br J Psychiatry 169: 468–74.
Zotev V, Yuan H, Phillips R, Bodurka J (2012). EEG-assisted retrospective motion correction
for fMRI: E-REMCOR. Neuroimage 63: 698–712.
Zou K, Deng W, Li T, Zhang B, Jiang L, Huang C, et al (2010). Changes of brain morphometry
in first-episode, drug-naïve, non-late-life adult patients with major depression: an optimized
voxel-based morphometry study. Biol Psychiatry 67: 186–8.
Zou Q-H, Zhu C-Z, Yang Y, Zuo X-N, Long X-Y, Cao Q-J, et al (2008). An improved approach
to detection of amplitude of low-frequency fluctuation (ALFF) for resting-state fMRI:
fractional ALFF. J Neurosci Methods 172: 137–41.
Zuo C, Ma Y, Sun B, Peng S, Zhang H, Eidelberg D, et al (2013). Metabolic imaging of bilateral
anterior capsulotomy in refractory obsessive compulsive disorder: an FDG PET study. J
Cereb Blood Flow Metab 33: 880–7.
Zuo X-N, Kelly C, Adelstein JS, Klein DF, Castellanos FX, Milham MP (2010a). Reliable
intrinsic connectivity networks: test-retest evaluation using ICA and dual regression
approach. Neuroimage 49: 2163–77.
Zuo X-N, Kelly C, Martino A Di, Mennes M, Margulies DS, Bangaru S, et al (2010b). Growing
together and growing apart: regional and sex differences in the lifespan developmental
trajectories of functional homotopy. J Neurosci 30: 15034–43.

388
Zuo X-N, Xing X-X (2014). Test-retest reliabilities of resting-state FMRI measurements in
human brain functional connectomics: a systems neuroscience perspective. Neurosci
Biobehav Rev 45: 100–18.
(1991). Clomipramine in the treatment of patients with obsessive-compulsive disorder. The
Clomipramine Collaborative Study. Arch Gen Psychiatry 48: 730–8.

389
390
Appendices
AppendixI.This study was published in the Journal of Visualized Experiments:
Dunlop, K., Gaprielian, P., Blumberger, D., Daskalakis, Z.J., Kennedy, S.H., Giacobbe, P., Downar, J. (2015). MRI-guided dmPFC-rTMS as a Treatment for Treatment-resistant Major Depressive Disorder. Journal of Visualized Experiments, (102): 53129.
Abstract
Abstract
Here we outline the protocol for magnetic resonance imaging (MRI) guided repetitive transcranial magnetic stimulation (rTMS) to the dorsal medial prefrontal cortex (dmPFC) in patients with major depressive disorder (MDD). Technicians used a neuronavigation system to process patient MRIs to generate a 3-dimensional head model. The head model was subsequently used to identify patient-specific stimulatory targets. The dmPFC was stimulated daily for 20 sessions. Stimulation intensity was titrated to address scalp pain associated with rTMS. Weekly assessments were conducted on the patients using the Hamilton Rating Scale for Depression (HamD17) and Beck Depression Index II (BDI-II). Treatment-resistant MDD patients achieved significant improvements on both HAMD and BDI-II. Of note, angled, double-cone coil rTMS at 120% resting motor threshold allows for optimal stimulation of deeper midline prefrontal regions, which results in a possible therapeutic application for MDD. One major limitation of the rTMS field is the heterogeneity of treatment parameters across studies, including duty cycle, number of pulses per session and intensity. Further work should be done to clarify the effect of stimulation parameters on outcome. Future dmPFC-rTMS work should include sham-controlled studies to confirm its clinical efficacy in MDD.
Introduction
Repetitive transcranial magnetic stimulation (rTMS) is a form of indirect focal cortical stimulation. rTMS employs brief, focal electromagnetic field pulses that penetrate the skull to stimulate target brain regions. rTMS is thought to engage the mechanisms of synaptic long-term potentiation and long-term depression, thereby increasing or decreasing the cortical excitability of the region stimulated1. Generally, the rTMS pulse frequency determines its effects: higher frequency stimulation tends to be excitatory, while lower frequency is inhibitory. Non-invasive stimulatory procedures are also widely used as a causal probe to induce temporary ‘cortical lesions’, and establish neural-behavior relationships or functional regions by temporarily disabling the function of a desired cortical region2–4.
Therapeutic rTMS involves multiple stimulation sessions, usually applied once daily over several weeks, to treat a variety of disorders, including major depressive disorder (MDD)5, eating disorders6, and obsessive-compulsive disorder7. rTMS for MDD is a potential option for medically refractory patients, and allows the clinician to noninvasively target and alter the
391
excitability of a cortical region directly involved with depressive etiology or pathophysiology. The conventional cortical target for MDD-rTMS is the dorsolateral prefrontal cortex (DLPFC)8. However, convergent evidence from neuroimaging, lesion, and stimulation studies identifies the dorsomedial prefrontal cortex (dmPFC) as a potentially important therapeutic target for MDD9 and a variety of other psychiatric disorders characterized by deficits in self-regulation of thoughts, behaviors, and emotional states10. The dmPFC is a region of consistent activation in emotional regulation11, behavioral regulation12,13. The dmPFC is also associated with neurochemical14, structural15, and functional16 abnormalities in MDD.
Described here is the procedure for 20 sessions (4 weeks) of magnetic resonance imaging (MRI) guided rTMS to the dmPFC bilaterally, as a treatment for major depressive disorder. In addition to a conventional 10 Hz protocol applied over 30 min, an intermittent theta burst stimulation protocol (TBS) is discussed, which applies 50 Hz triplet bursts at 5 Hz over a 6 min session17. Both protocols are thought to be excitatory, with the TBS protocol having the potential to achieve comparable effects using a much shorter session18. In both protocols, anatomical MRIs as well as clinical assessments are acquired prior to rTMS. Neuronavigation uses the anatomical scans to account for anatomical variability of dmPFC and optimize the location of rTMS. A relatively new 120°-angled fluid-cooled rTMS coil was also used in order to stimulate deeper midline cortical structures. Finally, rTMS intensity titration was used over the first week of rTMS sessions to ensure that patients could habituate to the higher pain levels associated with dmPFC stimulation as compared to conventional DLPFC stimulation.
ProtocolSubjectSelection
1. Conduct an initial assessment on a prospective patient. The inclusion criteria included the presence of a current depressive episode that is resistant to at least 1 adequate trial of medication, and a Diagnostic and Statistical Manual of Mental Disorders, Fifth Edition, (DSM-5) diagnosis of MDD as established by the assessing psychiatrist. Confirm the diagnosis with a standardized Mini Mental State Examination (MINI).
2. Ensure that patients are on a stable medication or are washed out of their medication routine for at least 4 weeks prior to their first rTMS treatment session. Do not alter this medication regiment throughout rTMS treatment to help disambiguate the cause of any observed clinical improvement or deterioration.
Exclude patients who may have a potential contraindication to rTMS or MRI, including seizure history, cardiac arrhythmia, implanted or foreign devices/metal particulates, unstable medical conditions, or pregnancy. Patients with comorbid post-traumatic stress disorder, obsessive-compulsive disorder, other anxiety disorders, attention deficit hyperactivity disorder, bulimia nervosa or binge eating disorder, or moderate Cluster B personality features are also suitable for this treatment and need not be excluded. Patients with bipolar disorder rather than MDD may also be suitable for this treatment. Patients with psychotic disorders, active substance use, a primary diagnosis of borderline or antisocial personality disorder, or persistent depressive disorder (dysthymia) may be less suitable for treatment and may require exclusion.
AcquiringMagneticResonanceImages

392
1. Acquire patients’ MRIs at any time prior to treatment. Here, use a 3 Tesla scanner with an 8-channel phased-array head coil (refer to Table of Materials), or any scanner capable of created a 3D representation of a patient’s brain.
2. Adhering to local site protocol, acquire a T1-weighted fast spoiled gradient-echo anatomical scan. Use the following parameters: TE = 12 msec, TI = 300 msec, flip angle = 20°, 116 sagittal slices, thickness = 1.5 mm, no gap, 256 x 256 matrix, FOV 240 mm. This scan will be used for real-time rTMS neuronavigation during motor thresholding and treatment sessions.
Preprocessing Anatomical Scans for Real-time Neuronavigation 1. Prepare for MRI guidance using a neuronavigation system. Note: The following steps
employ the Visor 2.0 neuronavigation system (refer to Table of Materials), but other
navigation systems such as the Brainsight TMS Navigation, StealthStation, Aimnav, and
NBS System 4 use similar procedures.
2. Segment anatomical MRIs into its scalp and brain components. Register the two segments into standard stereotactic space, such as Talairach and Tournoux space19.
3. Place target markers by selecting the following points on the MRI: Nasion; Left and right ear, targeting the tragus; Anterior commissure; Posterior commissure; Interhemispheric point (point between the two hemispheres); the anterior most point of the brain; the posterior most point of the brain; the superior most point of the brain; and the left and right most point of the brain.
4. Reconstruct the surfaces of the patient’s scalp and brain in standard space to create a three-dimensional surface-based head model – this image will be used to identify stereotactic scalp coordinates overlying the dmPFC (Talairach and Tournoux coordinate X0, Y+60, Z+60) for optimal coil vertex placement during treatment. Note: This method uses population coordinates to identify the stimulation target. Other methods to identify a stimulation target, outlined in the Discussion, include single-subject anatomy or fMRI activation maps.
5. Register brain and scalp coordinates from stereotactic space to patient space for individualized coil placement.
MotorThresholdAssessment
1. Seat patient in the treatment chair, adjusting the camera for an unobstructed view of the patient.
2. Place the headband with the marker clip attached to it around the patient’s head. The marker clip should sit above bridge of nose.
3. Preprocess the anatomical scan for the patient as described above in Step 3. 4. Load the preprocessed anatomical scans to the neuronavigation program and turn on the
camera. 5. Using a neuronavigation pen, highlight each scalp target point on the patient. The
movements made with the neuronavigation pen will be projected on the television screen in the form of red lines.

393
6. Assess patients’ motor thresholds, the minimum intensity needed to globally excite the motor pathway, prior to rTMS treatment. For this step, begin by having the patient’s lower limbs extended and supported from below, using a stool or a chair equipped with an extensible leg rest.
7. For motor threshold determination, under neuronavigation, target the medial primary motor cortex. Place the coil vertex over the sagittal fissure, 0.5-1.0 cm anterior to the central sulcus. Use an angled or double-cone coil for deeper pulse penetration into medial areas. Use stimulator equipped with a fluid-cooled coil, whose windings are angled at 120° to allow deeper penetration of the pulses (refer to Table of Materials).
8. Perform motor thresholding separately for the left and right hemispheres. Orient the coil laterally to direct rTMS-evoked current flow to the desired hemisphere20. For example, to stimulate the left hemisphere, orient the coil with the handle pointing rightwards and the direction of current flow toward the left hemisphere. Observe the contralateral (right) lower limb for movements during this procedure.
9. Determine threshold and elicited motor movement visually by the halluces longus muscle of the big toe. Note: Unlike conventional motor threshold testing that targets the hand muscle, stimulating the medial wall of the motor cortex will target the toe muscle. Motor evoked potentials (MEPs) may also be used as a more accurate determination of motor threshold, however it is a much lengthier approach.
1. Begin by stimulating at 55% of maximum machine intensity, then adjust upwards or downwards in increments of ~5% depending on whether a response is observed. Reduce the increment size steadily to ~1% as the motor threshold is approached, as previously described21. Stimulate no more frequently than 0.2 Hz (once per 5 sec) to avoid inhibitory or excitatory effects over time.
2. Once a motor threshold is established, move the vertex 1-2 cm anteriorly and posteriorly, in exploratory increments of 2-3 mm, to determine whether any alternative site offers a lower motor threshold. Use the lowest threshold achieved along this arc for each side.
rTMSTreatment&AdaptiveTitration
1. Perform a course of neuronavigated dmPFC-rTMS, using a total of 20-30 daily sessions over 4-6 weeks. For treatments, use the 120° angled, fluid-cooled coil and the parameters listed below for dmPFC stimulation in each treatment session (refer to Table of Materials).
2. Seat the patient in the treatment chair, adjusting the camera for an unobstructed view of the patient.
3. Place a headband with a marker clip attached to it around the patient’s head (placed laterally so as not to block the rTMS coil placement over the medial target site) as described above. Using a camera, the neuronavigation system, will detect the marker clip and will allow for preprocessing and neuronavigation.
4. Load the preprocessed anatomical scans to the neuronavigation program and turn on the camera.
5. Using a neuronavigation pen, highlight each scalp target point on the patient. The movements made with the neuronavigation pen will be projected on the television screen in the form of red lines.
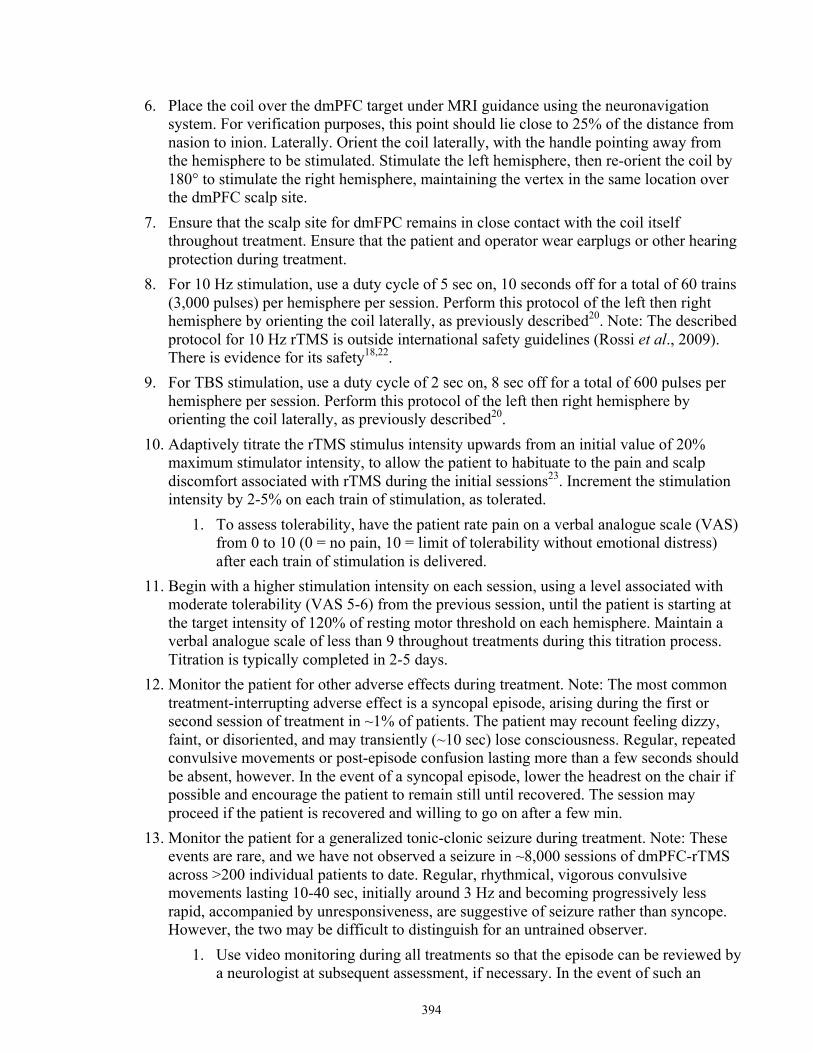
394
6. Place the coil over the dmPFC target under MRI guidance using the neuronavigation system. For verification purposes, this point should lie close to 25% of the distance from nasion to inion. Laterally. Orient the coil laterally, with the handle pointing away from the hemisphere to be stimulated. Stimulate the left hemisphere, then re-orient the coil by 180° to stimulate the right hemisphere, maintaining the vertex in the same location over the dmPFC scalp site.
7. Ensure that the scalp site for dmFPC remains in close contact with the coil itself throughout treatment. Ensure that the patient and operator wear earplugs or other hearing protection during treatment.
8. For 10 Hz stimulation, use a duty cycle of 5 sec on, 10 seconds off for a total of 60 trains (3,000 pulses) per hemisphere per session. Perform this protocol of the left then right hemisphere by orienting the coil laterally, as previously described20. Note: The described protocol for 10 Hz rTMS is outside international safety guidelines (Rossi et al., 2009). There is evidence for its safety18,22.
9. For TBS stimulation, use a duty cycle of 2 sec on, 8 sec off for a total of 600 pulses per hemisphere per session. Perform this protocol of the left then right hemisphere by orienting the coil laterally, as previously described20.
10. Adaptively titrate the rTMS stimulus intensity upwards from an initial value of 20% maximum stimulator intensity, to allow the patient to habituate to the pain and scalp discomfort associated with rTMS during the initial sessions23. Increment the stimulation intensity by 2-5% on each train of stimulation, as tolerated.
1. To assess tolerability, have the patient rate pain on a verbal analogue scale (VAS) from 0 to 10 (0 = no pain, 10 = limit of tolerability without emotional distress) after each train of stimulation is delivered.
11. Begin with a higher stimulation intensity on each session, using a level associated with moderate tolerability (VAS 5-6) from the previous session, until the patient is starting at the target intensity of 120% of resting motor threshold on each hemisphere. Maintain a verbal analogue scale of less than 9 throughout treatments during this titration process. Titration is typically completed in 2-5 days.
12. Monitor the patient for other adverse effects during treatment. Note: The most common treatment-interrupting adverse effect is a syncopal episode, arising during the first or second session of treatment in ~1% of patients. The patient may recount feeling dizzy, faint, or disoriented, and may transiently (~10 sec) lose consciousness. Regular, repeated convulsive movements or post-episode confusion lasting more than a few seconds should be absent, however. In the event of a syncopal episode, lower the headrest on the chair if possible and encourage the patient to remain still until recovered. The session may proceed if the patient is recovered and willing to go on after a few min.
13. Monitor the patient for a generalized tonic-clonic seizure during treatment. Note: These events are rare, and we have not observed a seizure in ~8,000 sessions of dmPFC-rTMS across >200 individual patients to date. Regular, rhythmical, vigorous convulsive movements lasting 10-40 sec, initially around 3 Hz and becoming progressively less rapid, accompanied by unresponsiveness, are suggestive of seizure rather than syncope. However, the two may be difficult to distinguish for an untrained observer.
1. Use video monitoring during all treatments so that the episode can be reviewed by a neurologist at subsequent assessment, if necessary. In the event of such an
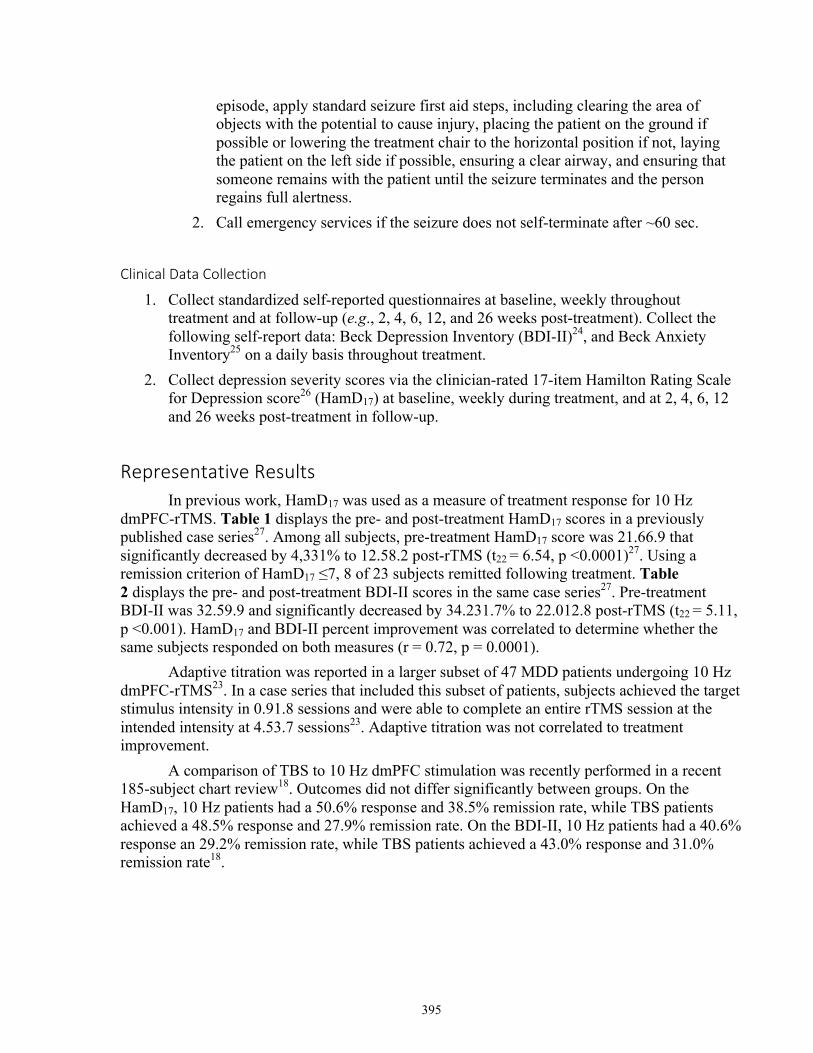
395
episode, apply standard seizure first aid steps, including clearing the area of objects with the potential to cause injury, placing the patient on the ground if possible or lowering the treatment chair to the horizontal position if not, laying the patient on the left side if possible, ensuring a clear airway, and ensuring that someone remains with the patient until the seizure terminates and the person regains full alertness.
2. Call emergency services if the seizure does not self-terminate after ~60 sec.
ClinicalDataCollection
1. Collect standardized self-reported questionnaires at baseline, weekly throughout treatment and at follow-up (e.g., 2, 4, 6, 12, and 26 weeks post-treatment). Collect the following self-report data: Beck Depression Inventory (BDI-II)24, and Beck Anxiety Inventory25 on a daily basis throughout treatment.
2. Collect depression severity scores via the clinician-rated 17-item Hamilton Rating Scale for Depression score26 (HamD17) at baseline, weekly during treatment, and at 2, 4, 6, 12 and 26 weeks post-treatment in follow-up.
RepresentativeResultsIn previous work, HamD17 was used as a measure of treatment response for 10 Hz
dmPFC-rTMS. Table 1 displays the pre- and post-treatment HamD17 scores in a previously published case series27. Among all subjects, pre-treatment HamD17 score was 21.66.9 that significantly decreased by 4,331% to 12.58.2 post-rTMS (t22 = 6.54, p <0.0001)27. Using a remission criterion of HamD17 ≤7, 8 of 23 subjects remitted following treatment. Table 2 displays the pre- and post-treatment BDI-II scores in the same case series27. Pre-treatment BDI-II was 32.59.9 and significantly decreased by 34.231.7% to 22.012.8 post-rTMS (t22 = 5.11, p <0.001). HamD17 and BDI-II percent improvement was correlated to determine whether the same subjects responded on both measures (r = 0.72, p = 0.0001).
Adaptive titration was reported in a larger subset of 47 MDD patients undergoing 10 Hz dmPFC-rTMS23. In a case series that included this subset of patients, subjects achieved the target stimulus intensity in 0.91.8 sessions and were able to complete an entire rTMS session at the intended intensity at 4.53.7 sessions23. Adaptive titration was not correlated to treatment improvement.
A comparison of TBS to 10 Hz dmPFC stimulation was recently performed in a recent 185-subject chart review18. Outcomes did not differ significantly between groups. On the HamD17, 10 Hz patients had a 50.6% response and 38.5% remission rate, while TBS patients achieved a 48.5% response and 27.9% remission rate. On the BDI-II, 10 Hz patients had a 40.6% response an 29.2% remission rate, while TBS patients achieved a 43.0% response and 31.0% remission rate18.
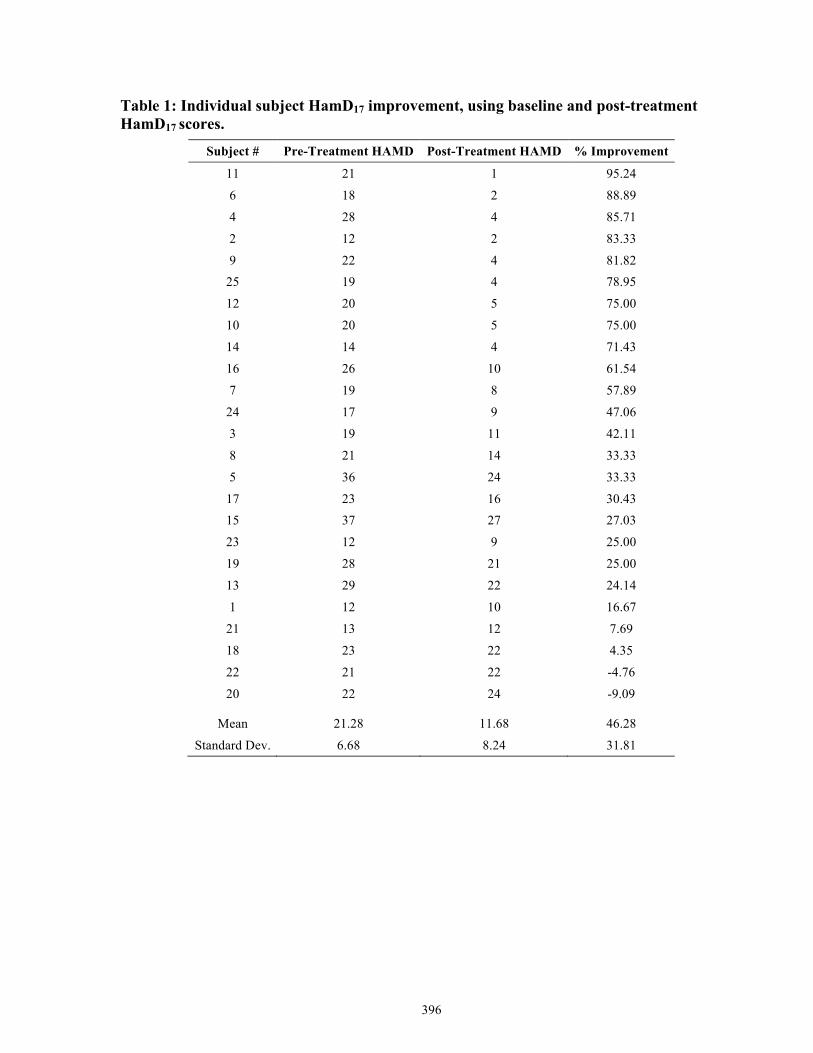
396
Table 1: Individual subject HamD17 improvement, using baseline and post-treatment HamD17 scores.
Subject # Pre-Treatment HAMD Post-Treatment HAMD % Improvement
11 21 1 95.24
6 18 2 88.89
4 28 4 85.71
2 12 2 83.33
9 22 4 81.82 25 19 4 78.95
12 20 5 75.00
10 20 5 75.00
14 14 4 71.43
16 26 10 61.54
7 19 8 57.89
24 17 9 47.06
3 19 11 42.11
8 21 14 33.33
5 36 24 33.33
17 23 16 30.43 15 37 27 27.03
23 12 9 25.00
19 28 21 25.00
13 29 22 24.14
1 12 10 16.67
21 13 12 7.69
18 23 22 4.35
22 21 22 -4.76
20 22 24 -9.09
Mean 21.28 11.68 46.28
Standard Dev. 6.68 8.24 31.81
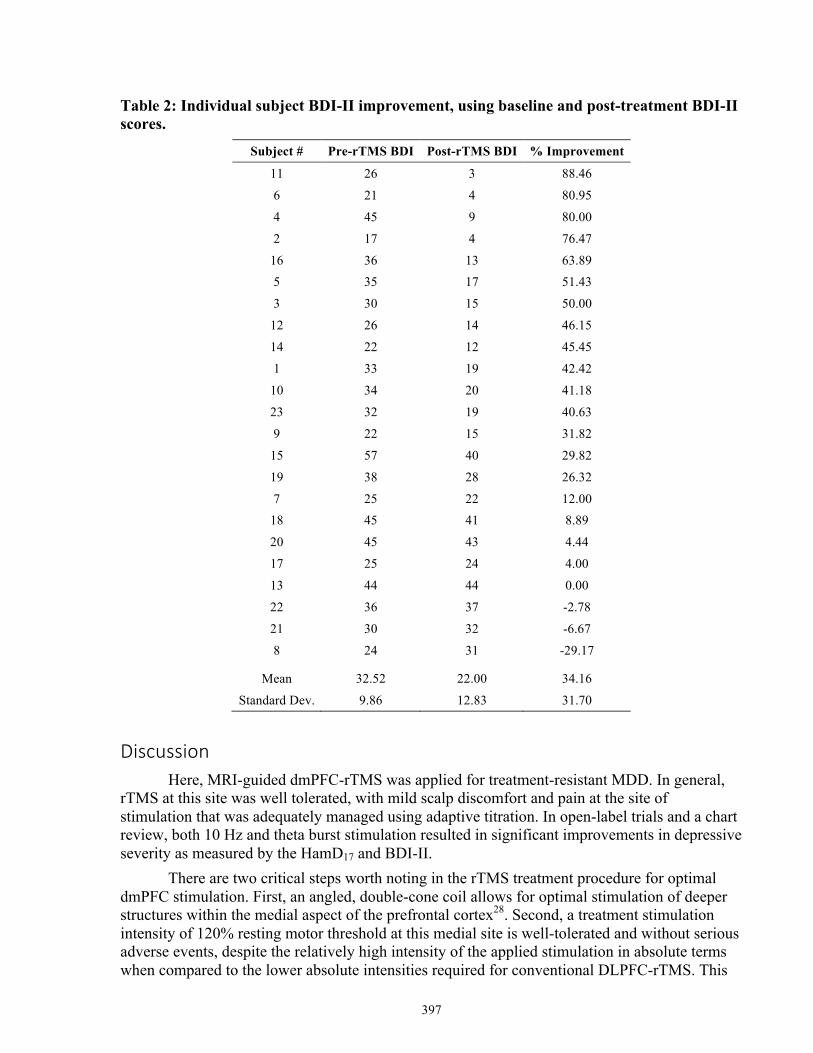
397
Table 2: Individual subject BDI-II improvement, using baseline and post-treatment BDI-II scores.
Subject # Pre-rTMS BDI Post-rTMS BDI % Improvement
11 26 3 88.46
6 21 4 80.95
4 45 9 80.00
2 17 4 76.47
16 36 13 63.89 5 35 17 51.43
3 30 15 50.00
12 26 14 46.15
14 22 12 45.45
1 33 19 42.42
10 34 20 41.18
23 32 19 40.63
9 22 15 31.82
15 57 40 29.82
19 38 28 26.32
7 25 22 12.00 18 45 41 8.89
20 45 43 4.44
17 25 24 4.00
13 44 44 0.00
22 36 37 -2.78
21 30 32 -6.67
8 24 31 -29.17
Mean 32.52 22.00 34.16
Standard Dev. 9.86 12.83 31.70
DiscussionHere, MRI-guided dmPFC-rTMS was applied for treatment-resistant MDD. In general,
rTMS at this site was well tolerated, with mild scalp discomfort and pain at the site of stimulation that was adequately managed using adaptive titration. In open-label trials and a chart review, both 10 Hz and theta burst stimulation resulted in significant improvements in depressive severity as measured by the HamD17 and BDI-II.
There are two critical steps worth noting in the rTMS treatment procedure for optimal dmPFC stimulation. First, an angled, double-cone coil allows for optimal stimulation of deeper structures within the medial aspect of the prefrontal cortex28. Second, a treatment stimulation intensity of 120% resting motor threshold at this medial site is well-tolerated and without serious adverse events, despite the relatively high intensity of the applied stimulation in absolute terms when compared to the lower absolute intensities required for conventional DLPFC-rTMS. This
398
same intensity also appears to be safe and tolerable for TBS protocols with dmPFC-rTMS, notwithstanding the significantly lower values of 80% active motor threshold more commonly used with TBS18. As previously mentioned, significant pain and discomfort is associated with anterior medial prefrontal stimulation at higher intensities29. Adaptive titration was quickly and successfully used to aide in rTMS-related discomfort adaptation. In sum, the use of an angled rTMS coil and relatively high stimulation intensity (with adaptive titration) may allow for deeper penetration of stimulation to the medial prefrontal and underlying cingulate cortices28, without incurring higher risks of seizure of intolerable scalp pain.
Neuronavigation is often used for precise individualized anatomical landmarking for coil vertex placement. However, one problem with MRI-guided neuronavigation is that it potentially omits the functional relationships of the desired stimulation target to other brain regions in favor of anatomical specificity across subjects. Indeed, there is significant functional connectivity variability found in association cortices, including regions of prefrontal cortex, which may impede treatment efficacy30. For example, a recent study used resting-state functional connectivity to show that left DLPFC-rTMS treatment efficacy in MDD was dependent on left DLPFC connectivity to the subgenual cingulate cortex31. Patients that improved with left DLPFC-rTMS tended to have anticorrelated functional connectivity between the DLPFC and the subgenual cingulate cortex at baseline. Therefore, resting-state functional connectivity could be harnessed to further optimize target placement and identify potential biomarkers once the functional characteristics of response are identified32.
One major limitation of rTMS as a treatment is that it is unclear how certain stimulation parameters influence its treatment efficacy. There is substantial variability in the parameters of conventional left DLPFC stimulation for MDD across studies, and there is also increasing evidence of substantial inter-individual variability in how some rTMS parameters affect cortical excitation and inhibition or treatment efficacy33,34. For example, the effects of 10 Hz stimulation on motor evoked potential (MEP) was recently shown to vary considerably across subjects, with some showing decreasesrather than increases in MEP strength after stimulation35. Other rTMS treatment parameters that potentially require further optimization (or individualization) to maximize treatment efficacy include the number of pulses per session, the number of sessions per day, stimulation intensity and the duty cycle (how many seconds stimulation is on and off per cycle).
There are also general limitations to rTMS as a treatment. These include the logistical requirements for patients to make multiple visits to hospital for treatment, limited access to treatment for patients in remote areas, the high cost of treatment (>$250 per session) with conventional parameters, and the low volumes of patients who can be treated per device using conventional parameters (1-2 per hr at most). Parameter optimization may help to address some of these problems in future. Other forms of non-invasive stimulation, such as transcranial direct current stimulation (tDCS), may also come to serve as a less expensive alternative to rTMS, suitable for use at home rather than in the clinic36.
Despite its technical limitations, dmPFC-rTMS is clinically promising for treatment-resistant MDD. rTMS, and dmPFC-rTMS in particular, may also probe to be a promising option in other medication-resistant psychiatric illnesses including eating disorders10, obsessive-compulsive disorder37, and post-traumatic stress disorder38. Identifying good treatment candidates for these disorders may require additional tools other than traditional symptom-based diagnostic classification schemas – in particular, neuroimaging. Acquiring patient neuroimaging data before and after treatment allows for the identification of potential biological pre-treatment
399
predictors and mechanisms of treatment response. Dorsomedial and subgenual cingulate resting-state functional connectivity have been identified as potential predictors to treatment response27. Additionally, graph theoretical measures such as betweenness centrality have been shown to differentiate dmPFC-rTMS responders and non-responders at baseline based on subscales for hedonic responses23. Neuroimaging also points to anterior mid-cingulate cortex and dorsomedial thalamic resting state functional connectivity change that correlates to treatment response27. In sum, functional neuroimaging may become a useful clinical tool as potential predictors and mechanisms of treatment response are identified.
Since current dmPFC-rTMS studies have used an open-label design, future directions should include the creation of a sham-controlled trial to assess its therapeutic efficacy in MDD versus sham and conventional stimulation. However, creating a convincing sham-control arm is technically challenging, particularly for simulating somatosensory or nociceptive sensations, as well as convincingly blinding the rTMS technician39. In a recent meta-analysis, over half of patients were able to correctly guess their treatment arm39. In another meta-analysis, placebo effects were large, but comparable to escitalopram trials40. Future studies involving a rTMS sham arm should consider a design that addresses all sensory aspects of rTMS for both the patient and the technician. Nonetheless, augmenting magnetic stimulation techniques through TBS41, priming stimulation42 or adjunctive cognitive behavioral therapy43 or pharmacotherapy44 may also help to optimize the therapeutic effects of rTMS. TBS in particular has the potential to achieve significant improvements in treatment duration and thus in patient volumes, access times, and treatment cost, while achieving equivalent outcomes to much longer conventional protocols18,45.
In summary, rTMS of the dmPFC is a promising novel approach to therapeutic brain stimulation for treatment-resistant MDD. By incorporating the use of a MRI-guided neuronavigation system, a fluid-cooled, 120° angled stimulation coil, a high stimulation intensity and an adaptive titration schedule, dmPFC-rTMS can be safely and accurately delivered to deep targets in the medial prefrontal cortex. As these regions are central to the pathophysiology of many neuropsychiatric disorders, this approach may have promising applications not only for MDD, but also for a variety of other psychiatric conditions that are resistant to standard treatments.
References1. Fitzgerald PB, Fountain S, Daskalakis ZJ. A comprehensive review of the effects of rTMS on motor
cortical excitability and inhibition. Clinical Neurophysiology. 2006;117:2584–2596.
2. Pascual-Leone A, Gates JR, Dhuna A. Induction of speech arrest and counting errors with rapid-rate transcranial magnetic stimulation. Neurology. 1991;41:697–702.
3. Young L, Camprodon JA, Hauser M, Pascual-Leone A, Saxe R. Disruption of the right temporoparietal junction with transcranial magnetic stimulation reduces the role of beliefs in moral judgments. Proceedings of the National Academy of Sciences of the United States of America. 2010;107:6753–6758.
4. Hilgetag CC, Théoret H, Pascual-Leone A. Enhanced visual spatial attention ipsilateral to rTMS-induced “virtual lesions” of human parietal cortex. Nature neuroscience. 2001;4:953–957.
5. Berman RM, et al. A randomized clinical trial of repetitive transcranial magnetic stimulation in the treatment of major depression. Biological psychiatry. 2000;47:332–337.
6. Van den Eynde F, et al. Repetitive transcranial magnetic stimulation reduces cue-induced food craving in bulimic disorders. Biological psychiatry. 2010;67(8):793–795.
400
7. Berlim MT, Neufeld NH, Vanden Eynde F. Repetitive transcranial magnetic stimulation (rTMS) for obsessive-compulsive disorder (OCD): an exploratory meta-analysis of randomized and sham-controlled trials. Journal of psychiatric research. 2013;47(8):999–1006.
8. Fitzgerald PB, et al. A randomized trial of unilateral and bilateral prefrontal cortex transcranial magnetic stimulation in treatment-resistant major depression. Psychological Medicine. 2011;41:1187–1196.
9. Downar J, Daskalakis ZJ. New targets for rTMS in depression: A review of convergent evidence. Brain Stimulation. 2013;6:231–240.
10. Downar J, Sankar A, Giacobbe P, Woodside B, Colton P. Unanticipated Rapid Remission of Refractory Bulimia Nervosa, during High-Dose Repetitive Transcranial Magnetic Stimulation of the Dorsomedial Prefrontal Cortex: A Case Report. Frontiers in psychiatry. 2012;3(30):1–5.
11. Gallinat J, Brass M. Keep Calm and Carry On”: Structural Correlates of expressive suppression of emotions. PLoS ONE. 2011;6:e1–e4.
12. Langner R, Cieslik EC, Rottschy C, Eickhoff SB. Interindividual differences in cognitive flexibility: influence of gray matter volume, functional connectivity and trait impulsivity. Brain structure, & function. 2014.
13. Jung Y-C, et al. Synchrony of anterior cingulate cortex and insular-striatal activation predicts ambiguity aversion in individuals with low impulsivity. Cerebral cortex. 2014;24(5):1397–1408.
14. Auer DP, Pütz B, Kraft E, Lipinski B, Schill J, Holsboer F. Reduced glutamate in the anterior cingulate cortex in depression: An in vivo proton magnetic resonance spectroscopy study. Biological Psychiatry. 2000;47:305–313.
15. Bora E, Fornito A, Pantelis C, Yucel M. Gray matter volume in major depressive disorder: a meta-analysis of voxel-based morphometry studies. Psychiatry research. 2013;211(1):37–46.
16. Sheline YI, Price JL, Yan Z, Mintun MA. Resting-state functional MRI in depression unmasks increased connectivity between networks via the dorsal nexus. Proceedings of the National Academy of Sciences of the United States of America. 2010;107:11020–11025.
17. Huang Y-Z, Edwards MJ, Rounis E, Bhatia KP, Rothwell JC. Theta burst stimulation of the human motor cortex. Neuron. 2005;45:201–206.
18. Bakker N, et al. rTMS of the dorsomedial prefrontal cortex for major depression: safety, tolerability, effectiveness, and outcome predictors for 10 Hz versus intermittent theta-burst stimulation. Brain Stimulation. 2014;In Press:1–22.
19. Talairach J, Tournoux P. Co-planar stereotaxic atlas of the human brain: 3-dimensional proportional system: an approach to cerebral imaging. Neuropsychologia. 1988;39:145.
20. Terao Y, et al. A single motor unit recording technique for studying the differential activation of corticospinal volleys by transcranial magnetic stimulation. Brain Research Protocols. 2001;7:61–67.
21. Schutter DJLG, van Honk J. A standardized motor threshold estimation procedure for transcranial magnetic stimulation research. The journal of ECT. 2006;22:176–178.
22. Downar J, Geraci J, et al. Anhedonia and Reward-Circuit Connectivity Distinguish Nonresponders from Responders to Dorsomedial Prefrontal Repetitive Transcranial Magnetic Stimulation in Major Depression. Biological psychiatry. 2013. pp. 1–26.
23. Downar J, Geraci J, et al. Anhedonia and Reward-Circuit Connectivity Distinguish Nonresponders from Responders to Dorsomedial Prefrontal Repetitive Transcranial Magnetic Stimulation in Major Depression. Biological Psychiatry. 2014;76(3):176–185.
24. Beck AT, Steer RA, Brown GK. Manual for the Beck depression inventory-II. San Antonio, TX: Psychological Corporation; 1996. pp. 1–82.
25. Beck AT, Epstein N, Brown G, Steer RA. An inventory for measuring clinical anxiety: psychometric properties. Journal of consulting and clinical psychology. 1988;56:893–897.
26. Hamilton MC. Hamilton Depression Rating Scale (HAM-D) REDLOC. 1960;23:56–62.
401
27. Salomons TV, et al. Resting-State Cortico-Thalamic-Striatal Connectivity Predicts Response to Dorsomedial Prefrontal rTMS in Major Depressive Disorder. Neuropsychopharmacology. 2014;39:488–498.
28. Hayward G, et al. Exploring the physiological effects of double-cone coil TMS over the medial frontal cortex on the anterior cingulate cortex: an H2(15)O PET study. The European journal of neuroscience. 2007;25:2224–2233.
29. Vanneste S, Ost J, Langguth B, De Ridder D. TMS by double-cone coil prefrontal stimulation for medication resistant chronic depression: a case report. Neurocase. 2014;20(1):61–68.
30. Mueller S, et al. Individual Variability in Functional Connectivity Architecture of the Human Brain. Neuron. 2013;77:586–595.
31. Fox MD, Buckner RL, White MP, Greicius MD, Pascual-Leone A. Efficacy of transcranial magnetic stimulation targets for depression is related to intrinsic functional connectivity with the subgenual cingulate. Biological Psychiatry. 2012;72:595–603.
32. Fox MD, Liu H, Pascual-Leone A. Identification of reproducible individualized targets for treatment of depression with TMS based on intrinsic connectivity. NeuroImage. 2013;66:151–160.
33. Kedzior K, Azorina V, Reitz S. More female patients and fewer stimuli per session are associated with the short-term antidepressant properties of repetitive transcranial magnetic stimulation (rTMS): a meta-analysis of 54 sham-controlled studies published between 1997-2013. Neuropsychiatric disease and treatment. 2014;10:727–756.
34. Lee JC, Blumberger DM, Fitzgerald PB, Daskalakis ZJ, Levinson AJ. The Role of Transcranial Magnetic Stimulation in Treatment-Resistant Depression: A Review. Current Pharmaceutical Design. 2012;18:5846–5852.
35. Maeda F, Keenan JP, Tormos JM, Topka H, Pascual-Leone A. Interindividual variability of the modulatory effects of repetitive transcranial magnetic stimulation on cortical excitability. Experimental Brain Research. 2000;133:425–430.
36. Brunoni AR, Ferrucci R, Fregni F, Boggio PS, Priori A. Transcranial direct current stimulation for the treatment of major depressive disorder: a summary of preclinical, clinical and translational findings. Progress in neuro-psychopharmacology, & biological psychiatry. 2012;39:9–16.
37. Mantovani A, Simpson HB, Fallon BA, Rossi S, Lisanby SH. Randomized sham-controlled trial of repetitive transcranial magnetic stimulation in treatment-resistant obsessive-compulsive disorder. The international journal of neuropsychopharmacology. 2010;13:217–227.
38. Watts BV, Landon B, Groft A, Young-Xu Y. A sham controlled study of repetitive transcranial magnetic stimulation for posttraumatic stress disorder. Brain Stimulation. 2012;5:38–43.
39. Berlim MT, Broadbent HJ, Van den Eynde F. Blinding integrity in randomized sham-controlled trials of repetitive transcranial magnetic stimulation for major depression: a systematic review and meta-analysis. The international journal of neuropsychopharmacology 2013;16:1173–1181.
40. Brunoni AR, Lopes M, Kaptchuk TJ, Fregni F. Placebo response of non-pharmacological and pharmacological trials in major depression: a systematic review and meta-analysis. PLoS One. 2009;4:e4824.
41. Chistyakov AV, Rubicsek O, Kaplan B, Zaaroor M, Klein E. Safety tolerability and preliminary evidence for antidepressant efficacy of theta-burst transcranial magnetic stimulation in patients with major depression. The international journal of neuropsychopharmacology 2010;13:387–393.
42. Iyer MB, Schleper N, Wassermann EM. Priming stimulation enhances the depressant effect of low-frequency repetitive transcranial magnetic stimulation. The Journal of neuroscience. 2003;23:10867–10872.
43. Vedeniapin A, Cheng L, George MS. Feasibility of simultaneous cognitive behavioral therapy and left prefrontal RTMS for treatment resistant depression. Brain Stimulation. 2010;3:207–210.
44. Rumi DO, et al. Transcranial magnetic stimulation accelerates the antidepressant effect of amitriptyline in severe depression: A double-blind placebo-controlled study. Biological Psychiatry. 2005;57:162–166.

402
45. Platz T, Rothwell JC. Brain stimulation and brain repair--rTMS: from animal experiment to clinical trials--what do we know. Restorative neurology and neuroscience. 2010;28:387–398.
403
AppendixII.This review was published in the Annals of the New York Academy of Science:
Dunlop, K., Hanlon, C.A., Downar, J. (2017). Noninvasive brain stimulation treatments for addiction and major depression. Annals of the New York Academy of Science, 1394(1): 31-54.
Abstract
Major depressive disorder (MDD) and substance use disorders (SUDs) are prevalent, disabling, and challenging illnesses for which new treatment options are needed, particularly in comorbid cases. Neuroimaging studies of the functional architecture of the brain suggest common neural substrates underlying MDD and SUDs. Intrinsic brain activity is organized into a set of functional networks, of which two are particularly relevant to psychiatry. The salience network (SN) is crucial for cognitive control and response inhibition, and deficits in SN function are implicated across a wide variety of psychiatric disorders, including MDD and SUDs. The ventromedial network (VMN) corresponds to the classic reward circuit, and pathological VMN activity for drug cues/negative stimuli is seen in SUDs/MDD. Noninvasive brain stimulation (NIBS) techniques, including rTMS and tDCS, have been used to enhance cortico–striatal–thalamic activity through the core SN nodes in the dorsal anterior cingulate cortex, dorsolateral prefrontal cortex, and anterior insula. Improvements in both MDD and SUD symptoms ensue, including in comorbid cases, via enhanced cognitive control. Inhibition of the VMN also appears promising in preclinical studies for quenching the pathological incentive salience underlying SUDs and MDD. Evolving techniques may further enhance the efficacy of NIBS for MDD and SUD cases that are unresponsive to conventional treatments.
Introduction
Major depressive disorder (MDD) and substance use disorders (SUDs) are challenging illnesses that produce significant burdens on patients and the healthcare system. Mental illness and SUDs are the leading worldwide cause of years lived with a disability (YLD),1 and MDD is the second leading psychiatric cause of YLD.2 The societal burden of MDD and SUDs have also dramatically increased over the last 20 years,2 emphasizing the importance of access to care and effective treatment options.
For MDD, the mainstays of conventional treatment are pharmacotherapy and psychotherapy. Studies of real-world effectiveness suggest that about one-third of patients will remit on an initial trial of antidepressant medication, while another one-third will remit after 1–3 additional medication trials.3,4 The remaining one-third of patients are labeled as having treatment-resistant depression (TRD), with a low likelihood of remission (10– 15%) on further trials.4 TRD affects approximately 2% of the general population.5 To address the challenge of treating TRD, combination therapies (antidepressant + antipsychotic, or antidepressant + anticonvulsant)6–9 and electroconvulsive therapy (ECT)10 have yielded promising clinical results. Even for TRD, however, these intensive interventions achieve varied remission rates between approximately 30%11 and 50%,6–8 and the relapse rate following ECT is 50% by 2 years.12
404
As with MDD, in SUD patients the mainstays of conventional treatment are pharmacotherapy and psychotherapy. Lifetime rates of drug use are 92% for alcohol, 74% for tobacco, 42% for cannabis, and 16% for cocaine, in the United States.13 The lifetime prevalence of alcohol dependence is 13%, and up to 3% for illicit substances.14–16 The most common psychotherapeutic approach to substance dependence is cognitive behavioral therapy.17,18 A meta-analysis of 34 randomized controlled trials on cognitive behavioral therapy for SUDs demonstrated that the average effect size was moderate (d = 0.45), with the highest effects for cannabis, cocaine, and opioid treatment.19 A form of behavioral therapy known as contingency management appears to be a particularly potent tool for multiple classes of SUD patients.20,21 Contingency management, however, requires that an individual is able to regulate/control their drug intake in order to get an alternative non-drug reinforcer. This may be difficult for many patients, as disruptions in response inhibition and in the neural circuitry required for response inhibition are hallmarks of addiction.22
From a pharmacotherapy perspective, the therapeutic approach varies with the substance being abused. Pharmacotherapy may complement behavioral approaches by replacing the abused substance with a less harmful substitute23,24 and thereby reduce the social and personal harm associated with the drug. However, dependences on several classes of drugs, including cocaine, have no approved pharmacotherapy, and relapse rates in the first 6 months after an outpatient treatment program are often higher than 75%.25 Some evidence also suggests that pharmacotherapy that interacts with neurotransmitter systems related to reward learning may enhance impulse control itself.26
High rates of treatment resistance and relapse represent a common challenge for MDD or SUDs. However, effective MDD and SUD treatment response is frequently hampered even further by the comorbidity of the two conditions. Among individuals with MDD, approximately 25– 40% have a comorbid SUD. Conversely, MDD is among the common psychiatric disorders that have high comorbidity with all types of SUDs.27,28 These patients report poorer response rates compared to their singly diagnosed counterparts from a 12-step program,29 from single-medication trials,30–32 and from cognitive behavioral therapy.33 Likewise, MDD patients with nicotine dependence also have increased difficulty with smoking cessation, with antidepressants having little influence on abstinence, and these patients are more likely to develop an episode of depression post–smoking cessation.34–37 Hence, treatment strategies should ideally accommodate the frequent comorbidity of these illnesses.
Treatment strategies for MDD and SUDs are traditionally approached separately and sequentially. Such an approach implicitly assumes that if the primary diagnosis is addressed, secondary diagnoses may resolve on their own.38 However, limited success rates for conventional approaches to MDD and SUDs raise several fundamental questions. Is it helpful to identify one of the disorders—MDD or SUD—as the primary disorder? Does the underlying pathophysiology of MDD and SUDs support separate treatment strategies in comorbid cases? Finally, can the neurobiology of SUDs and MDD suggest new treatment strategies that might address the problem of comorbidity, while improving remission and relapse rates for both disorders?
To answer these questions, we can take advantage of recent advances described in the neuroimaging literature on human brain function. These include an increasingly robust model of the functional neuroanatomy and network architecture of the brain, a vast body of neuroimaging
405
literature on the pathophysiology of SUDs and MDD in humans, and, finally, a set of automated, quantitative metaanalytic software that renders this enormous literature more tractable. Such tools allow us to detect consistent and statistically robust patterns by combining scans in thousands of patients and healthy individuals.
Of course, advances in the functional neuroanatomy of SUDs and MDD are of limited immediate clinical interest unless they can translate into anatomically specific therapeutic interventions. While it is difficult to aim conventional treatments at specific brain circuits, noninvasive brain stimulation (NIBS) is an emerging treatment modality that exerts neuroanatomically specific effects. There are two particular NIBS technologies that are quickly translating from research into clinical practice: repetitive transcranial magnetic stimulation (rTMS) and transcranial direct current stimulation (tDCS). Repetitive TMS has held regulatory approval for MDD in many jurisdictions for several years and is being explored for SUDs in clinical trials. Transcranial DCS is a few years behind rTMS in translational progress but is likewise being explored with encouraging results in both MDD and SUDs. Unlike medications or therapy, the success of NIBS depends critically on the choice of target circuit and the type of stimulation (inhibitory or excitatory) applied to that circuit.39–41
This review is intended to serve four purposes. First, it will summarize key advances in our understanding of the functional architecture of the brain. Second, it will review how this emerging model of brain function relates to the pathophysiology behind SUDs and MDD. Third, it will review NIBS for the treatment of SUDs and MDD, particularly in cases where conventional treatments fail. Finally, it will review a number of promising areas for future research on NIBS in SUDs and MDD.
Functionalarchitectureofthehumanbrain
Functional networks of intrinsic brain activity
One of the key advances in the neuroimaging literature over the last 20 years is the demonstration that brain regions organize their activity into coherent functional networks.42 On functional magnetic resonance imaging (fMRI), these networks appear as correlations of the low-frequency fluctuations in blood oxygenation level–dependent (BOLD) signal between brain regions.43 Many networks were originally identified through data-driven methods for analyzing brain activity at rest and are termed resting-state networks. However, these networks reliably appear in ongoing brain activity during tasks as well,44 and meta-analyses of task-based activation also reveal consistent functional networks similar to those identified at rest.45
The precise number of functional networks and the functional role of each network are still being studied. An emerging consensus has been identified between 7 and 20 distinct functional networks.43 One recent resting-state fMRI analysis in 1000 healthy individuals found a stable seven network parcellation; these networks were further subdivided into a stable 17-network parcellation (Fig. 1).46 Many of these cortical networks also have correlated counterparts in the striatum47 and cerebellum,48 thus hinting that they may represent integrated, whole-brain functional circuits.
406
The default-mode network (DMN)49 is the best known and most studied of these functional networks. The DMN contains subcomponents that serve various introspective functions ranging from mind wandering,50 recollection and prospection,51 rumination,52 and self-reflection.51 Other networks act in opposition to the DMN and activate during behaviorally regulated task performance and externally focused cognition. These networks include frontoparietal networks (FPNs) and related areas sometimes known as the dorsal (DAN) and ventral attention networks (VAN).46 Other networks include lower-level sensory and motor cortices and ventromedial limbic networks that encompass the temporal pole and the orbitofrontal cortex (OFC)46 (Fig. 1).
Relevance of functional networks to MDD and SUDs Several functional networks have been studied extensively in MDD and SUDs,
particularly the DMN. However, there are two functional networks that are of particular interest in both SUDs and MDD, and it is worthwhile to briefly characterize these networks.
The first network of interest is the anterior cinguloinsular network (aCIN), or salience network (SN).46 Figure 2 visualizes the SN on the basis of a quantitative meta-analysis of SN neuroimaging studies analyzed using Neurosynth.45 The SN activates for salient sensory events,53,54 transitions from introspection to task performance,55 and during task initiation and switching.56 A remarkable recent study highlighted the central importance of the SN as a common neural substrate across psychiatric illness categories.57 The authors performed a meta-analysis of structural abnormalities across six psychiatric disorder categories, including MDD and SUDs, and found that all of them showed gray matter volume reductions in the dorsal anterior cingulate cortex (dACC) and anterior insula. Further analyses demonstrated that these areas belonged to a common functional network in healthy controls, both at rest and during task performance.57 This network corresponded almost exactly to the SN.45,46 Thus, of the 7–17 networks previously discussed, the SN merits particular attentionfor its role inMDD, SUDs, and other psychiatric pathophysiology.
The second network of interest is the ventromedial network (VMN), encompassing the nucleus accumbens (NAcc), medial OFC (mOFC), and ventromedial prefrontal cortex (VMPFC) (Fig. 3, created using Neurosynth33). This circuit is best known as the reward pathway and also includes components of the mediodorsal thalamus and midbrain dopaminergic structures. The VMN activates not only for rewards, but also for stimuli of other incentive value, including losses.58 The role of the VMN in SUDs is well documented,59,60 particularly for mediating abnormal incentive salience of drug cues, which is proposed to drive craving and relapse.61 VMN dysfunction is linked to anhedonia in MDD62 and activates paradoxically for negative stimuli, suggesting that negative cues have abnormal incentive salience in MDD, analogous to drug cues in SUDs.63
The opposed functions of the SN and VMN
The SN is critical for “switching” brain activity between the introspective DMN and the externally focused FPNs.64 It is also active during performance-related errors and task initiation.56,65 The functions of the SN map rather well on to the Research Domain Criteria (RDoC) construct of cognitive control: specifically, the subdomain of response inhibition/response selection. A quantitative fMRI meta-analysis using Neurosynth45 revealed a network closely matching the SN (Fig. 2). This function stands in opposition to the functions of
407
the VMN in mediating reward, incentive salience, and value assignment in similar meta-analyses using Neurosynth45 (Fig. 3). These two circuits have been proposed to play opposing roles in behavioral regulation: the VMN as a “drive network” mediating craving and urge, and the SN as a “gatekeeper network” mediating response selection and inhibition.66
If the roles of these networks are indeed opposed, we might predict one to be active when the other is not, and vice versa.67 In fact, this is precisely the case. For many of the functional networks previously discussed, there also exists a map of corresponding negatively correlated regions: the anti-network.68 The anti-network for the VMN, shown by qualitative meta-analysis, consists of the SN and corresponding striatothalamic partners. Conversely, the anti-network for the SN is the VMN, as evident in functional connectivity data45 (Fig. 4). Thus, the SN and VMN may play reciprocal roles as each other’s anti-networks, with opposing patterns of activity even in the resting brain. This functional architecture might explain the tendency for highly salient stimuli to reduce inhibitory control or, conversely, for cognitively demanding activities to attenuate urges, cravings, or emotions.
Coordination among the functional networks
Modeling the brain as a network can allow us to map information flow among its regions. Approaches to the study of the brain using graph theory, a set of mathematical techniques allowing formal analysis of network structures, consider individual brain regions as “nodes” and functional connections between correlated regions/nodes as “edges.” Such analyses identify clique-like “communities” of nodes and “hubs” that bridge together different communities within a larger network.69 This means that graph theoretical approaches can characterize the structural and functional interactions between networks and nodes.70
Reassuringly, graph theoretical analyses of the brain extract 10–12 communities that correspond to the same data-driven functional networks70 and also show how these communities connect to one another (Fig. 5A). Generally, sensory andmotor networks lie on the functional outskirts of the brain, as isolated functional units with few connections outside of their network. This makes sense given their roles as pathways for processing elementary sensory input and motor output.
What about other prominent networks, such as the DMN itself? The intuitive expectation is that the DMN should be situated centrally, in a crossroads position linking the other networks together. Instead, the DMN appears as a peripheral, closeknit module much like the visual cortex, but taking feedback from the VMN rather than the retina. The DMN’s position is not that of an integrative controller, but rather another specialized “think tank,” linking the incentive functions of the VMN to the high-level executive and cognitive functions of the FPNs, but not in close communication with most other networks (Fig. 5B).
Does another functional network hold the crossroads position? One recent study using graph theoretical methods identified nodes standing in critical hub positions between many networks. These nodes lay not in the DMN but in the SN itself.71 Close inspection of the whole-brain graph showed that the SN is in a gatekeeper position between the deliberative functions of the DMN and FPN and the behavioral output of the somatomotor cortex (Fig. 5B).
408
This overall functional architecture provides a framework for understanding the roles of the VMN, DMN, FPN, SN, and motor cortex in behavioral control (Fig. 5C). The trajectory of information flow originates within the basic drives of midbrain dopaminergic regions, which are elaborated into specific incentives or urges via the VMN and elaborated further into goals and mapped onto relevant scenarios via the DMN. The FPNs then develop these goals and scenarios into consummatory strategies, which are broken down into cognitions and behaviors that can be either inhibited or selected via the gatekeeper-like SN. If selected, responses finally map to the action-control systems of the somatomotor cortex to initiate overt behavior.
This urges-to-actions trajectory through the brain offers early and late points for pathology to arise in MDD or SUDs. Early pathology at the VMN–DMN interface would drive priorities away from core survival needs, assigning inappropriately high incentive salience to drug cues (in the setting of SUDs) or negative emotional cues (in the setting of MDD). Late pathology near the SN would interfere with response selection and inhibitory control, producing a pattern of chronic emotional liability, intrusive thinking, and impulsive behavior. These more elementary dysfunctions may cut across the diagnostic entities of MDD and SUDs, and may also shed light on MDD and SUD comorbidity as arriving from more fundamental disruptions in network architecture. Importantly, the neural overlap between MDD and SUDs may be an opportunity, rather than an obstacle, for interventions that can address both illnesses concurrently by targeting the underlying circuitry of the SN and VMN using NIBS.
Functionalarchitectureinpsychiatricdisorders
Neural circuit disruptions in SUDs
It is challenging to concisely summarize the neural circuits that are involved in all SUDs, since each substance has a unique pharmacologic profile and addiction involves multiple temporal phases, including regular controlled use, regular uncontrolled/habitual use, abstinence, and relapse. However, there appear to be common neurobiological pathways operating across substances of abuse, involving dysfunction of both the VMN and its anti-network, the SN.
Although patients with SUDs can become dependent on a variety of drugs that have diverse initial pharmacologic actions, nearly all drugs of abuse have a common final pathway in which they modulate reward circuitry in the ventral striatum–ventral tegmental area (VTA) pathway.72 For example, cocaine modulates this pathway directly by increasing dopamine transmission, while nicotine also has direct actions on the VTA via nicotinic receptors. Opiates and alcohol, however, modulate the ventral striatum and VTA indirectly via GABAergic disinhibition. While the majority of basic science research in addiction has focused on this subcortical reward pathway, recent work has demonstrated that many cortical and subcortical regions interact with this mesolimbic dopamine pathway, especially the VMN and its anti-network, the SN, as described below.
First, the SN is hypoactive in SUDs. Specifically, in SUD patients, the dACC and insula display hypoactivity to a variety of executive tasks, including the Stroop task,73,74 response inhibition75,76 (although this finding is mixed77), and emotion regulation.78 The dACC also
409
displays abnormal connectivity on resting-state and graph theoretical measures in SUDs.79 The abnormal network activation in the dACC may relate to the aberrant salience of substance-specific cues.80 SUD patients display lowered structural and functional integrity in both the dACC and insula.81,82 Although the role of the insula is still under debate, insular lesions have been reported to be associated with improved abstinence, possibly because disease-relevant cues are less salient.83,84 There is also an increase in dACC activation and an improvement in self-control behavior following abstinence, suggesting a causal role in SUD psychopathology.85
The anti-network of the SN, the VMN, is involved in limbic arousal in SUDs. Functional MRI studies have demonstrated that cue reactivity and craving are associated with elevated activity in the VMN, particularly in the ventral striatum, vmPFC, and OFC.86–88 Hyperactivation from the OFC is also seen during reward evaluation,89–91 risky decision making, personal relevance,92–95 and goal-driven processes associated with the ventral striatum. This abnormal VMN activity normalizes in smokers and cocaine users following treatment with varenicline/buproprion96–98 and methylphenidate,99 respectively. As in MDD, SUD patients also show VMN hypoactivation for natural rewards, compared to healthy controls.100
Connectivity between the VMN and SN is also impaired in SUDs, with SUD patients showing reduced corticostriatal VMN and SN resting-state functional connectivity.101,102 Furthermore, altered ACC corticocortical and corticostriatal connectivity between these circuits are related to SUD severity,101 high-risk behavior, and genetic polymorphisms associated with SUDs.103
Neural circuit disruptions in MDD
As with SUDs, MDD has been linked to a pattern of SN hypoactivity and VMN hyperactivity104 in a wide variety of network-based descriptions of the illness over the last decade.105,106 Ventral prefrontal activation in MDD predicted dorsal inactivation, in keeping with the framework of opposed SN and VMN activity.107 Inhibition of SN control mechanisms by pathological salience signals from the VMN may create a self-perpetuating imbalance, resulting in the persistent low mood of MDD rather than the transient low mood of normal sadness. MDD patients display a similar disruption of incentive salience for primary rewards108,109 and instead become attuned to disease-specific stimuli. For example, the rostral ACC and ventral striatum are hypoactive during reward feedback110–112 and hyperactive during self-referential negative processing.113,114 MDD patients also show an absence of ventral striatal and VMPFC/OFC inactivation for pleasant sights and tastes but heightened activation in the caudate in response to viewing aversive images.115 Altered responsesfrom the subgenual cingulate and OFC are also found in MDD during rumination and negative self-focus.116
As in SUDs, MDD patients show reduced activation in SN regions at rest. Reflecting this deficiency, MDD patients exhibit task-related hyperactivation from the dACC on many cognitive control tasks, including the Stroop117,118 and n-back tasks.119 The DMPFC is also inappropriately activated during positive affect processing in MDD, which normalizes after successful treatment.120 Additionally, the anterior insula and DMPFC are inappropriately active during negative affect.121 Increased activation after treatment also results in improved resting-state activity in the cingulate in MDD.122 On structural imaging, TRD patients tend to show
410
volumetric alterations in regions of the SN and cognitive deficits relative to their treated counterparts.123
Neural similarities in MDD/SUDs
As noted earlier, voxel-based morphometry studies of MDD and SUDs reveal a common neural substrate of decreased gray matter affecting the dACC and anterior insula—both key nodes of the SN.57 One interpretation of this neural overlap is that both SUDs and MDD feature deficits in self-regulation of impulses, cognition, emotion, and behavior—or in RDoC terms, response inhibition/selection. SUDs and MDD also share a common feature of inappropriate VMN activation as shown by fMRI. In SUDs, the VMN’s reward circuit activates in response to drug cues, despite their lack of primary survival value. In MDD, the VMN activates in response to negative rather than positive affective stimuli. One interpretation is that, for MDD, negative emotional stimuli acquire aberrant incentive salience, as with drug cues in SUDs. If so, both SUD and MDD patients also share an underlying pathology of distorted incentive salience.63
The shared neural substrates of SUDs and MDD may help to account for the high prevalence of MDD/SUD comorbidity. From a therapeutic standpoint, the shared neural circuitry between SUDs and MDD may also present an opportunity to address both disorders concurrently, using NIBS interventions. On this view, NIBS treatments should not be regarded as antidepressant or antisubstance use. Rather, they should be considered to offer two more nuanced approaches to treatment, cutting across diagnostic categories: enhancing cognitive control by targeting the nodes of the SN or relieving the distorted incentive salience of substance/negative cues by inhibiting the VMN.
One prediction of thisframework is that any NIBS interventions that target SN nodes (i.e., DLPFC, DMPFC, or anterior insula) with excitatory stimulation should exert a therapeutic effect across both MDD and SUDs, by enhancing cortico–striatal– thalamic connectivity through the SN on fMRI and by enhancing capacity for response selection/inhibition. Another prediction is that any NIBS interventions that target the VMN (by stimulating the frontal pole or VMPFC) should also exert a therapeutic effect across both MDD and SUDs by reduced cortico–striatal–thalamic connectivity through the VMN on fMRI, and by reducing incentive salience of drug cues/negative affective stimuli.
NIBSasatreatmentforMDD/SUDs
Repetitive TMS overview
Repetitive TMS applies powerful, focused, magnetic field pulses to target regions of the brain via a handheld induction coil placed against the scalp. By applying trains of pulses over several minutes, rTMS increases or decreases target brain region activity. While experimental applications of rTMS usually involve 1–3 sessions on a single day, therapeutic applications of rTMS typically require 20–30 daily sessions.124,125
411
Repetitive TMS appears to act through the mechanisms of synaptic plasticity: long-term potentiation and depression, although there is conflict among the effects of genetic polymorphisms, such as brain-derived neurotrophic factor, on these functions.126,127 Generally, the direction of the effect depends on the intensity, duration, and stimulation pattern.128,129 High-frequency stimulation (5– 20 Hz) is classically considered excitatory, while low frequency stimulation (1 Hz) is inhibitory.130,131 Some recent rTMS studies use stimulation patterns that mimic theta electroencephalography (EEG) rhythms, thought to be especially efficient for inducing plasticity.132,133 For example, two advantages of theta-burst stimulation (TBS)—classified as intermittent TBS (iTBS), which is generally excitatory, or continuous TBS (cTBS), which is generally inhibitory—are that the time required for a session of stimulation is rather brief and that it is as potent as conventional stimulation, both in model systems such as the motor cortex133 and in clinical applications.134,135
One current drawback to all forms of rTMS concerns the variability of effect: a certain percentage of individuals show neutral or inhibitory effects from excitatory stimulation and, conversely, some individuals show excitatory effects from inhibitory stimulation.128,136 This variability is observed both in model systems such as the motor cortex during single sessions and in therapeutic applications of rTMS over multiple sessions.137,138
Therapeutic effects of rTMS in neuropsychiatric disease may ensue through changes in cortico– striatal–thalamic circuits stemming from SN and VMN nodes. Positron emission tomography (PET) studies of rTMS reveal changes in striatal dopamine receptor occupancy following rTMS, with the changes localized to the specific region of the striatum that serves the cortical target (DMPFC and DLPFC) of stimulation.139,140 In keeping with this observation, dopamine agonists and antagonists can potentiate or block the effects of rTMS.141 Baseline cortico–striatal–thalamic functional connectivity on resting-state fMRI predicts treatment outcome across multiple conditions, including MDD,142 eating disorders,138 OCD,143 and movement disorders.144 Pre–post treatment changes in this measure also track outcomes across all of these disorders. Thus, rTMS is posited to exert therapeutic effects by enhancing or suppressing cortico–striatal–thalamic circuit integrity from the SN and/or VMN.
Transcranial DCS overview
Transcranial DCS applies lower-energy stimulation to the brain, using a montage of over two scalp electrodes, each typically 3–7 cm across. Constant-current stimulation is applied through the electrodes at intensities of just 1–2 mA. A tDCS session typically lasts 5–30 min, and a therapeutic course typically involves daily stimulation over 10–30 days.145
Transcranial DCS seeks to modulate the synaptic activity of target brain regions, rather than directly eliciting action potentials, as does rTMS.146 Anodal stimulation is classically considered to increase cortical excitability in the underlying brain region, while cathodal stimulation is considered to be inhibitory. However, as with rTMS, some individuals show the opposite pattern of effect, and variability remains a problematic issue.147 Newer patterns of stimulation include transcranial random noise stimulation (tRNS), as well as transcranial alternating current stimulation (tACS). The latter approach is considered promising, since stimulation can be tuned to match specific EEG frequency bands for more potent or more selective effects.148 In one notable recent example, investigators were able to induce lucid
412
dreaming in healthy subjects during rapid eye movement (REM) sleep by applying tACS at 20–40 Hz, but not at 2–12 Hz.149
The mechanisms of tDCS/tACS are still under investigation.150 However, the technique does appear to modulate the activity of resting-state networks on fMRI151 and may also modulate cortico–striatal functional connectivity.152 In these respects, its mechanisms may resemble those of rTMS to some degree, and, for therapeutic purposes, both techniques have been used to target similar brain regions in similar illnesses. However, at the physiological level, there are likely to be important mechanistic differences between the two approaches, the details of which require further study.146
Transcranial DCS is likely capable of stimulating many of the same regions as rTMS, although, once again, focal stimulation becomes more difficult for deeper structures. Electrical field simulations suggest that the direct effects of tDCS on neural activity are most prominent near superficial brain regions directly under the electrode, although deeper effects may be possible.153 Preclinical studies indicate that tDCS can modulate the excitability of the motor cortex and DLPFC,154 as well as deeper structures of the medial wall, such as the motor cortex of the lower limb,155 supplementary motor area,156 and DMPFC.157 There are also suggestions that tDCS may be capable of modulating the reward value of stimuli during task performance, suggesting engagement of deeper VMN nodes, such as the VMPFC and even the midbrain.158 Thus, many of the areas of interest for NIBS in MDD and SUDs are likely to be accessible to both tDCS and rTMS.
NIBS as a treatment for MDD
MDD is the original and best-studied therapeutic indication for rTMS. To date, dozens of large-scale randomized controlled trials have confirmed efficacy for rTMS in MDD, as summarized in recent meta-analyses.159,160 Response and remission rates in the most recent large studies are approximately 50–55% and 30–35%, respectively;161,162 real-world effectiveness studies report similar outcomes.159,160 Course lengths of 26–28 sessions are required for maximum effect;124 the poorer outcomes of early trials may be attributable in part to inadequate course lengths of 5–10 sessions.160
The most widely used rTMS protocol in MDD is high-frequency left DLPFC stimulation. Some studies alternatively used low-frequency right DLPFC rTMS,161 or both.162 Meta-analyses have not found marked outcome differences between these approaches,160 and no one stimulation pattern appears markedly superior.162 Few NIBS studies have sought targeted non-DLPFC nodes of the SN or VMN in MDD.163 One exception is the DMPFC,164 which was recently targeted with rTMS in a shamcontrolled study and in several open-label case series,142,165,166 with promising results. However, no rTMS trials have targeted the anterior insula or the VMPFC in MDD; these remain theoretically promising targets for intervention.
Mechanistic studies show that DLPFC or DMPFC stimulation may enhance cognitive control in healthy subjects and MDD patients. DLPFC or DMPFC excitatory rTMS in healthy subjects can enhance impulse control via delay-discounting tasks;167 likewise, rTMS of the presupplementary motor area, just posterior to the DMPFC, improves stop-signal task performance.168 Neurally, rTMS may enhance impulse control via strengthened DLPFC and DMPFCfrontal–striatal–cortical circuit integrity on fMRI,138 and, on PET, rTMS changes
413
dopamine receptor occupancy in these same striatal regions.169 In MDD, cortico–striatal–thalamic connectivity on fMRI predicts and correlates with treatment outcomes.142 These findings suggest that rTMS could be relieving MDD by enhancing cortico–striatal–thalamic circuit integrity in the nodes of the SN, thereby enhancing cognitive control over negative cognition and affect.
The literature on tDCS in MDD is more nascent. To date, 10 randomized controlled trials have been completed, with a recent meta-analysis supporting tDCS efficacy in MDD.145 Outcomes appeared comparable to antidepressant medication in one comparative trial.170 Again, 20–30 sessions may be required for maximal efficacy;171 the shorter, 10- session courses and relatively small sample sizes used in many tDCS trials may imply an underestimate of the true efficacy of the technique.145
To date, all tDCS trials in MDD have targeted the left DLPFC, using anodal, excitatory stimulation over the F3 EEG site; the inhibitory cathode has been variously applied to either the right DLPFC via the F4 EEG site or to the neighboring right supraorbital area near Fp2/F8.Mechanistically, anodal tDCS over the left DLPFC enhances cognitive control in healthy participants on a working memory task with negative emotional distracters.172 In a more direct demonstration, anodal DLPFC tDCS abolished the effect of negative emotional distractors on a working memory task in MDD patients,173 suggesting that the mechanisms of effect may likewise involve enhanced cognitive control. The functional anatomy of the SN suggests that similar effects might also be achieved via excitatory tDCS of the right DLPFC, the DMPFC, and the anterior insula. Frontopolar tDCS is also of interest for the anhedonic symptoms of MDD, since anodal stimulation of this site engages the VMPFC and VTA on fMRI, and enhances perceived attractiveness of faces.158 These regions are therefore important candidate targets for future tDCS trials in MDD.
NIBS as a treatment for SUDs and comorbid SUD/MDD
NIBS is attracting increasing interest as a novel therapeutic intervention in SUDs. To date, approximately 25 original research reports have been published on the efficacy of rTMS as a tool to decrease craving, along with at least six reviews on rTMS in addiction.174 The types of SUDs, the targets of stimulation, and the patterns of stimulation have varied across these studies. However, as in MDD, most so far have sought to enhance cognitive control mechanisms by targeting the nodes of the SN.174 The alternative approach, of attenuating craving and incentive salience via the VMN, is also beginning to be explored.175
For alcohol cravings, most studies have targeted the left or right DLPFC. In sham-controlled studies of rTMS, low-frequency right DLPFC stimulation reduced alcohol craving in some reports176 but not others,177,178 and high-frequency left DLPFC stimulation reduced attention to alcohol cues but did not reduce cravings.179 In open-label case reports, bilateral high-frequency rTMS reduced alcohol cravings in three patients,180 and low-frequency dACC rTMS likewise reduced refractory cravings in one patient; however, this patient eventually relapsed following rTMS.181 For DLPFC tDCS, left anodal/right cathodal stimulation reduced alcohol cravings in initial studies;182,183 however, relapse rates improved with this montage.184 Reversing the polarity to left cathodal/right anodal DLPFC tDCS yielded superior abstinence rates at 6 months, despite no differences in craving.185 Such findings are consistent
414
with a model in which SN stimulation exerts therapeutic effects by enhancing cognitive control rather than reducing cravings.
For stimulants (cocaine and methamphetamine), one open-label study reported reduced spontaneous craving with rTMS of the left DLPFC at high frequencies,186 while another found effects for right low-frequency, but not left high-frequency, DLPFC rTMS.187 Of note, rTMS of the left DLPFC at low frequencies has increased cue-induced craving,188 and anodal tDCS of the left DLPFC has increased risky decisionmaking in cocaine users,189 once again suggesting that the stimulation parameters may be important in determining whether cognitive control is enhanced or diminished. A recent study of tDCS in crack cocaine dependence accordingly reversed the polarity of stimulation to left cathodal/right anodal DLPFC tDCS, reporting a reduction in craving with five sessions of active but not sham stimulation.190
For nicotine, a slightly wider variety of targets have been studied across the SN, including the DLPFC and anterior insula. Left DLPFC rTMS, using low- or high-frequency stimulation, has reduced cravings in experimental studies.191,192 One clinical trial of high-frequency DLPFC rTMS reported reductions in the number of cigarettes smoked, even in the absence of changes in craving.193 A more recent trial targeted the anterior insula, as well as the DLPFC, bilaterally with a helmet-shaped deep rTMS coil, in a large sample of 115 patients.194 Thirteen sessions of high- but not low-frequency or sham rTMS reduced cigarette consumption and increased abstinence rates, with stronger effects when the patients were exposed to smoking cues during stimulation. However, there were no significant effects on craving despite the reduction in use, once again suggesting a mechanism of cognitive control enhancement rather than craving reduction per se.
With respect to tDCS in nicotine dependence, a preliminary study found that one session of active but not sham anodal bilateral DLPFC tDCS reduced cigarette cravings.195 Another preliminary study196 found a significant reduction in cigarettes smoked for active but not sham DLPFC stimulation using the left anodal/right cathodal polarity that had proven useful in alcohol and crack cocaine use, as above. A more recent study using the same type of tDCS197 found a reductionin cigarettes smoked after 5 days of active but not sham stimulation. Furthermore, the active group showed signs of enhanced cognitive control, in the form of a greater propensity to reject offers of cigarettes (but not money) in a decision-making task known as the Ultimatum game. On an important side note, at least one report has noted that nicotine patches abolish the effects of both anodal and cathodal tDCS in healthy volunteers,198 potentially posing a challenge to the therapeutic use of tDCS in tobacco cessation.
One final point concerns the potential of rTMS for treating comorbid MDD/SUDs in tandem, by addressing their common deficits in cognitive control. A recent study199 used high-frequency bilateral DLPFC rTMS via a deep helmet coil, and compared outcomes in patients with MDD versus MDD and alcohol dependence. One major difference between deep TMS and conventional rTMS is the coil geometry; deep TMS coils employ complex helmet-shaped windings that are able to reach deeper cortical structures.200 Depression scores improved 55% and 62% in the two groups, while scores on the Clinical Global Impression scale improved 67% and 78%. Improvement was actually significantly greater in the comorbid MDD/alcohol dependence patients than in the patients with MDD alone. It is also worth noting that a recent meta-analysis found that deep TMS appears to achieve antidepressant effects over multiple sessions.201 The suggestion is that the presence of SUDs may not interfere with the outcomes of
415
rTMS for MDD and indeed that the presence of comorbid SUDs might be an indicator of broader underlying deficits in cognitive control that render DLPFC rTMS more likely to be successful. This possibility warrants future investigation.
FuturedirectionsforNIBSinMDDandSUDs
Enhancing cognitive control
Cognitive control, and specifically response selection/inhibition, is presented in this review as one of the key transdiagnostic deficits across MDD and SUDs. Its associated functional network, the SN, maps closely onto a set of areas affected across multiple categories of psychiatric illness. Of its core cortical nodes, investigations have relied heavily on the DLPFC for NIBS in MDD and SUDs. The dACC and anterior insula, however, actually appear more prominently and consistently in the network than the DLPFC.57 Hence, it may be productive to pursue studies of dACC or anterior insula excitatory NIBS, under the hypothesis that these targets will surpass the DLPFC for enhancing cognitive control and thus achieve superior clinical outcomes inMDD and SUDs.
For the dACC, early evidence supports this hypothesis. In healthy controls, excitatory dorsomedial rTMS can reduce impulsivity on a delaydiscounting task,167 and there is a growing literature supporting clinical efficacyfor DMPFC rTMS across multiple disorders.142,165,166 DMPFC rTMS also shows initial promise for treating acute and chronic craving.202 Dorsal ACC activity is higher in response to addiction cues,93,203 especially when personally relevant,92,93,95 and during other tasks involving cognitive control and response inhibition.73,75,204
Reducing incentive salience
Reward circuitry pathology, and specifically distorted incentive salience, is also presented in this review as a common feature of MDD and SUDs. The associated network, VMN, is a candidate target for NIBS treatments. At present, rTMS and tDCS are unlikely to be able to stimulate the ventral striatum directly because of the depth of this structure. However, the cortical nodes of the VMN are not markedly deeper than the dACC or anterior insula. At least one deep rTMS coil has been designed to target the VMPFC,205 although it has not yet been used in MDD or SUDs. Likewise, at least one tDCS study has successfully modulated the VMPFC, along with the VMN circuit into the midbrain, enhancing perceived attractiveness of faces.158 In SUD patients, one study recently targeted the frontopolar cortex206 and found that high-frequency rTMS increased cueinduced cigarette craving, as would be expected for excitatory stimulation of this incentive pathway. Thus, stimulation of the VMN appears feasible and may exert effects on disease-relevant reward function.
Could inhibitory TMS to the VMPFC be beneficial for SUD patients?
While the majority of rTMS studies to date have focused on the DLPFC and its downstream targets in the dorsal striatum, a recent study demonstrated that it is also possible to
416
activate the VMPFC and its targets in the ventral striatum with TMS. Using integrated TMS/MRI scanning, they demonstrated that it is possible to differentially activate the frontal–striatal systems that govern executive control from those that govern limbic arousal by applying single-pulse TMS to the DLPFC and the VMPFC/frontal pole, respectively.66 TMS pulses applied to the frontal pole (EEG coordinate: FP1) led to elevated BOLD signal in the VMPFC, ventral striatum, and OFC—core regions of the VMN involved in limbic arousal and craving. TMS pulses applied to the DLPFC in healthy individuals at rest (EEG coordinate: F3) led to elevated BOLD signal in the DLPFC and dorsal striatum—core regions of the SN involved in executive control (Fig. 6A). Additionally, elevated DLPFC activity was accompanied by a reciprocal decrease in VMPFC activity, highlighting the reciprocal activity of these two networks.
Having demonstrated that it was possible to modulate activity in the VMPFC and ventral striatum, the authors performed a study in cocaine users175 in which they applied an inhibitory form of TMS (continuous theta burst stimulation) to the medial PFC (FP1) while the participants were engaged in a craving-induction task. Specifically, patients underwent a functional MRI scan immediately before and after a single session of real or sham cTBS. Immediately before the cTBS session, participants were asked to describe the last time that they used cocaine, using standardized techniques from exposure therapy. They were then primed and asked to think about this event while the cTBS was administered. It was demonstrated that, relative to sham, active stimulation significantly decreased stimulus-evoked BOLD signal in the VMPFC and the ventral striatum— critical brain regions for craving (Fig. 6B). Additionally, these data revealed a significant correlation between the TMS pulse intensity and the effect on these neural circuits (Fig. 6C). Thus, inhibitory rTMS to the frontal pole appears to be a successful strategy for engaging and attenuating the VMN target, especially when an inhibitory dose of rTMS is applied to a neural circuit that is in a primed state (e.g., thinking about drug cues). There are hints that this strategy may be more useful than SN excitatory stimulation in at least some patients with SUDs. Although the SN and VMN show reciprocal activity in healthy subjects, this may not be true in all individuals. In cocaine users, a recent MRI–TMS study showed that DLPFC rTMS did not elicit the usual pattern of reciprocal deacti vation of the VMN207 (Fig. 7). Thus, although some individuals may be able to achieve the desired suppression of the VMN indirectly during excitatory stimulation of the SN, other patients may require the VMN to be targeted directly. Investigating this hypothesis in MDD and SUD patients with neuroimaging methods will be an important area for future study.
Controlling the cognitive state during treatment
Few NIBS trials to date have controlled patients’ cognitive state during treatment. Brain activity during stimulation is known to have an important influence on the effects of rTMS,208–210 as evident even in the difference between resting and active motor threshold during motor cortex stimulation. Repetitive TMS of the SN for nicotine addiction is more effective in the presence of smoking cues.194 Conversely, in MDD, negative stimuli exposure during rTMS may disrupt the beneficial effects of treatment.209 With frontopolar stimulation, the effects of rTMS on cigarette craving were different, depending on whether the patient was presented with smoking or neutral cues during stimulation.206 Thus, future efforts to improve outcomes for NIBS in MDD/SUDs will likely benefit from more rigorous manipulation of the cognitive state during treatment.
417
Optimizing the treatment protocol
Available evidence concurs with clinical experience in suggesting that maximal effects of rTMS in MDD require 20–30 sessions of treatment, regardless of site or protocol.161,162,166 The limited evidence for tDCS likewise suggests that benefits continue to accumulate over 30 sessions in MDD.171 For this reason, early literature may underestimate the therapeutic potential of NIBS, and longer courses are required for future studies to establish the true effect size.
Long courses of treatment may negatively affect treatment adherence, as well as the scalability of NIBS as a treatment in the larger population. SUD patients respond better to briefer treatment interventions than to extended ones.211 However, more sessions need not require more days of treatment. Recent rTMS studies have begun to explore the use of multiple daily sessions separated by short intervals. These protocols are safe and tolerable, and have reduced the treatment course to 10 dayswith 2x daily stimulation,212 5 days with 4x daily stimulation,213 and, in one small case series, 2 days with 15 sessions.214 The optimal session number and interval have not been systematically investigated under randomized conditions, and this is an important area for future study. Accelerated regimens may be facilitated by cTBS and iTBS, which achieve similar effects as longer conventional protocols despite requiring only 1–3 min for delivery.134,166 Other products that have the potential to be clinically impactful include deep TMS201 and external trigeminal nerve stimulation.215
Reducing the variability of effect for NIBS
Although different NIBS protocols are classically considered to be excitatory or inhibitory, many individuals display effects opposite to the usual direction, or no effect at all. For 1-Hz rTMS, approximately 50% of individuals show excitation rather than inhibition;128,136 likewise, for 10-Hz rTMS, a similarly large proportion show inhibition rather than excitation.128 Variability is also problematic for cTBS and iTBS.216 Likewise, for tDCS, one study found that only 36% showed the classic pattern of excitatory effects for anodal and inhibitory for cathodal stimulation, and the opposite was true in 21%.147 The variability is not confined to the motor cortex: fMRI studies reveal similarly inconsistent effects of 1-Hz parietal rTMS on resting-state functional connectivity.136
This variability of effect likely impedes successful treatment outcome. Currently, there is no known reliable biological or neuroimaging marker to predict a priori which individuals will respond best to a particular stimulation target or stimulation protocol. However, group-level differences between responders and non-responders to treatment may help to elucidate these markers. For example, recent studies have found that 30 sessions of 10-Hz DMPFC rTMS strengthens cortico–striatal–thalamic resting-state connectivity in patients (responders) with low baseline connectivity, but weakens it in those with high baseline connectivity (non-responders).138 Thus, variability of NIBS effects must be addressed in future studies to improve treatment outcomes.
Better methods to control patient brain activity during stimulation may ameliorate some of the interindividual variability. For example, 20-Hz rTMS and newer forms of cTBS more consistently show effects both in the motor cortex128 and on resting-state functional connectivity.136 Quadripulse stimulation (QPS) uses 4-pulse bursts of stimulation that can be excitatory or inhibitory depending on the inter-pulse interval,217 and effects are longer lasting
418
and appear consistent across greater than 85–90% of individuals. Unfortunately, most rTMS devices cannot perform QPS without significant hardware modification, and QPS protocols may require 30 min of stimulation for optimal effects.218 Nonetheless, studies of novel rTMS protocols should be pursued to achieve better consistency in the effects.
Selecting and phenotyping patients
Important considerations in SUD trials are the type of substance dependence and the selection of SUD patients that are seeking treatment. Studies often do not disclose patient treatment-seeking status or whether patients are active substance users during NIBS treatments. Generally, patients are not abstinent for tobacco- or alcohol-related NIBS trials, while for illicit drug trials patients have completed detoxification. The active use of certain substances may influence the effect of NIBS. For example, tobacco use in healthy controls can reduce NIBS-induced inhibition of the motor cortex.198 In cigarette smokers, NIBS-induced facilitation was found to be abolished during nicotine withdrawal.219 Future studies should take into account these sources of heterogeneity, as they may alter clinical outcomes.
Diagnostic criteria are another important source of heterogeneity. MDD and SUDs are increasingly recognized to encompass a wide variety of subtypes, or endophenotypes. In MDD, for example, distinct endophenotypes have recently been proposed for patients with prominent memory impairment, neuroticism, cognitive control, and anhedonia.220 The latter three have recently been linked to VMN disconnectivity and, consequently, poor response to DMPFC rTMS.165 The presence of neutrally distinctive endophenotypes suggests that treatment targeted to individual pathology may improve success rates. For example, patients without cognitive control deficits, but with poor reward sensitivity, may be poor candidates for standard SN rTMS and might instead be better suited to stimulation of the VMN. Conversely, patients with mood liability, cognitivecontrol deficits, and multiple comorbidities, such as SUDs, might be identified as particularly good responders to SN NIBS.
A common practice in clinical trials of NIBS is to attempt to limit patient heterogeneity by excluding MDD patients with comorbid SUDs or active substance dependence. However, given that SN pathology may give rise to multiple comorbidities, this practice may be counterproductive in that it excludes good treatment candidates. A more productive approach may be to adopt generous inclusion criteria and to carefully characterize each patient before treatment.
Conclusions
Neuroimaging has revealed twofunctional networks playing key roles in MDD and SUD pathophysiology. The SN mediates cognitive control, and its hypofunction is a common feature across multiple psychiatric illnesses. The SN’s anti-network, the VMN, plays a key role in reward and incentive salience. Distorted incentive salience is a common feature of both MDD and SUDs. MDD/SUD comorbidity, and the tendency for symptoms of one disorder to exacerbate the other, can therefore be understood as reflecting a shared set of reciprocal neural substrates: inappropriate VMN activation, resulting in pathological incentives, and/or insufficient SN activation, resulting in an inability to exert cognitive control over those incentives. NIBS targeting the SN may enhance cognitive control, thereby relieving a deficit common to MDD and

419
SUDs. NIBS targeting the VMN is less well explored, but may attenuate pathological incentive salience, thereby reducing craving in SUDs and negative affect in MDD.
In conclusion, NIBS offers a promising new approach to treat MDD and SUDs. By strengthening cognitive control and quelling pathological incentive salience, NIBS may address underlying deficits common to both disorders, and may be particularly well suited to comorbid cases. Given the high prevalence and social impact of MDD and SUDs and high nonresponse rates, new treatment options will be a welcome development for clinicians and patients alike.
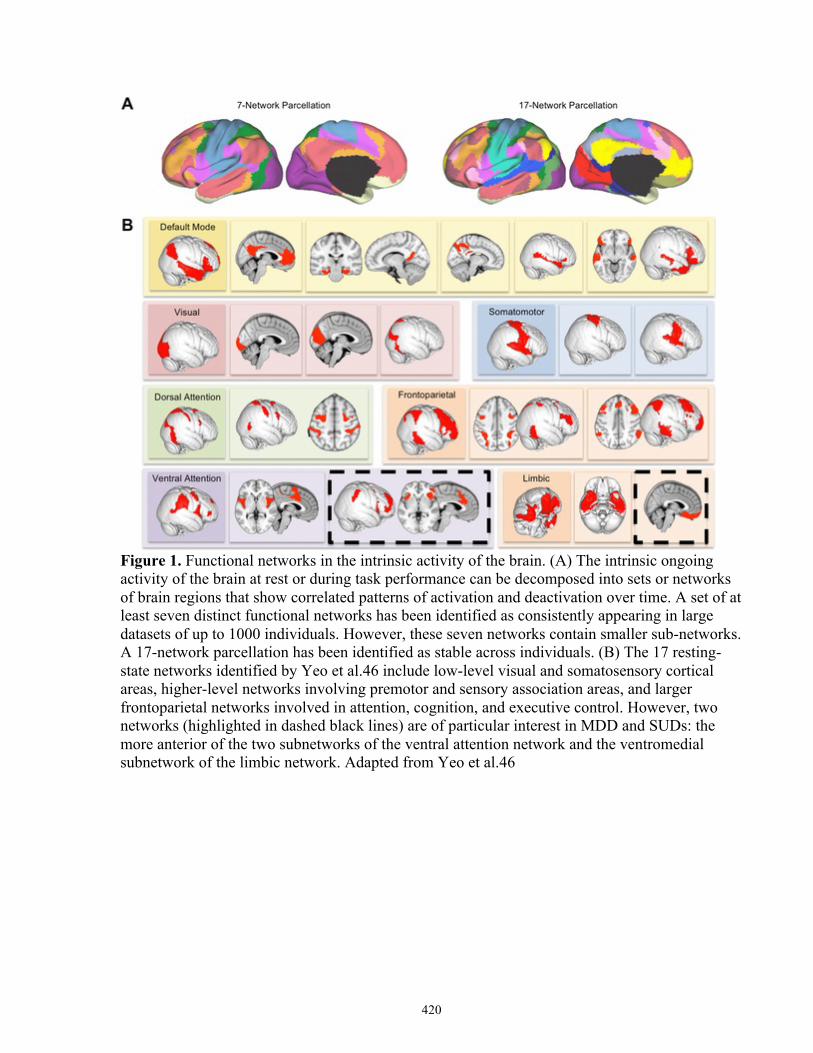
420
Figure 1. Functional networks in the intrinsic activity of the brain. (A) The intrinsic ongoing activity of the brain at rest or during task performance can be decomposed into sets or networks of brain regions that show correlated patterns of activation and deactivation over time. A set of at least seven distinct functional networks has been identified as consistently appearing in large datasets of up to 1000 individuals. However, these seven networks contain smaller sub-networks. A 17-network parcellation has been identified as stable across individuals. (B) The 17 resting-state networks identified by Yeo et al.46 include low-level visual and somatosensory cortical areas, higher-level networks involving premotor and sensory association areas, and larger frontoparietal networks involved in attention, cognition, and executive control. However, two networks (highlighted in dashed black lines) are of particular interest in MDD and SUDs: the more anterior of the two subnetworks of the ventral attention network and the ventromedial subnetwork of the limbic network. Adapted from Yeo et al.46
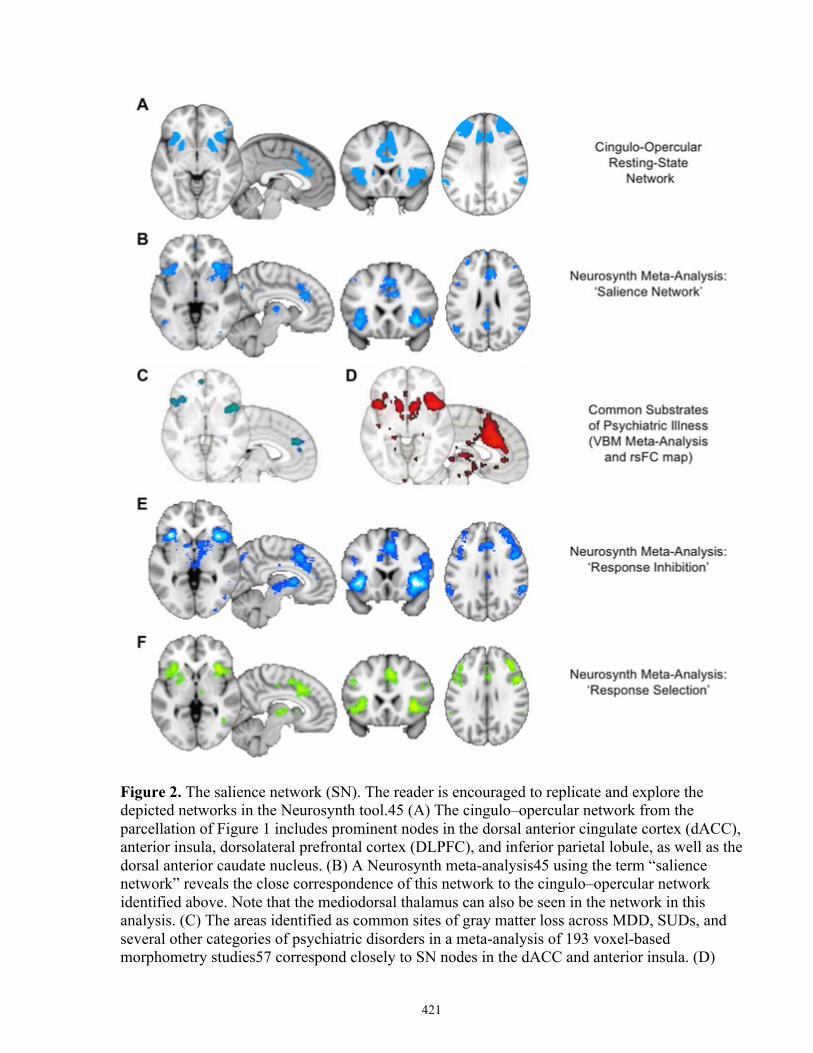
421
Figure 2. The salience network (SN). The reader is encouraged to replicate and explore the depicted networks in the Neurosynth tool.45 (A) The cingulo–opercular network from the parcellation of Figure 1 includes prominent nodes in the dorsal anterior cingulate cortex (dACC), anterior insula, dorsolateral prefrontal cortex (DLPFC), and inferior parietal lobule, as well as the dorsal anterior caudate nucleus. (B) A Neurosynth meta-analysis45 using the term “salience network” reveals the close correspondence of this network to the cingulo–opercular network identified above. Note that the mediodorsal thalamus can also be seen in the network in this analysis. (C) The areas identified as common sites of gray matter loss across MDD, SUDs, and several other categories of psychiatric disorders in a meta-analysis of 193 voxel-based morphometry studies57 correspond closely to SN nodes in the dACC and anterior insula. (D)

422
Resting-state functional connectivity maps seeding from the nodes in C reveal a network that corresponds closely to the rest of the SN, as seen in A and B.45 (E, F) Neurosynth meta-analyses using the terms “response inhibition” and “response selection” yield maps of activation that correspond closely to the SN, thus highlighting the role of the SN as a neural substrate for cognitive control.57
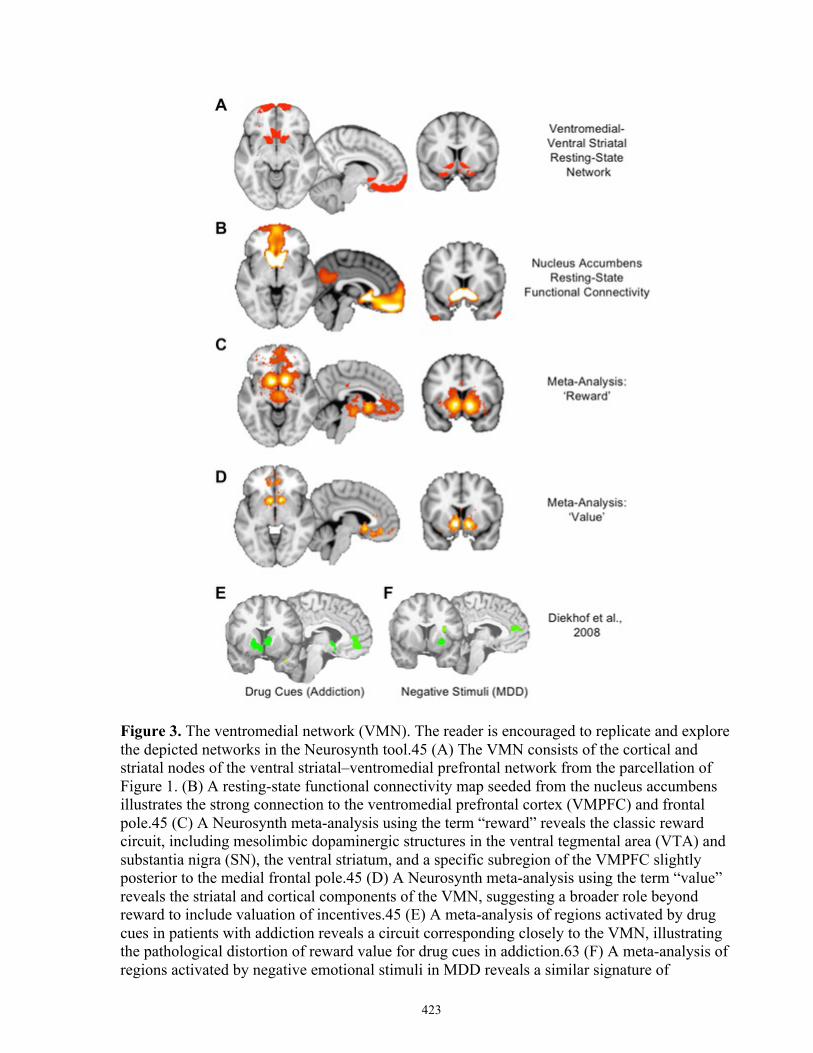
423
Figure 3. The ventromedial network (VMN). The reader is encouraged to replicate and explore the depicted networks in the Neurosynth tool.45 (A) The VMN consists of the cortical and striatal nodes of the ventral striatal–ventromedial prefrontal network from the parcellation of Figure 1. (B) A resting-state functional connectivity map seeded from the nucleus accumbens illustrates the strong connection to the ventromedial prefrontal cortex (VMPFC) and frontal pole.45 (C) A Neurosynth meta-analysis using the term “reward” reveals the classic reward circuit, including mesolimbic dopaminergic structures in the ventral tegmental area (VTA) and substantia nigra (SN), the ventral striatum, and a specific subregion of the VMPFC slightly posterior to the medial frontal pole.45 (D) A Neurosynth meta-analysis using the term “value” reveals the striatal and cortical components of the VMN, suggesting a broader role beyond reward to include valuation of incentives.45 (E) A meta-analysis of regions activated by drug cues in patients with addiction reveals a circuit corresponding closely to the VMN, illustrating the pathological distortion of reward value for drug cues in addiction.63 (F) A meta-analysis of regions activated by negative emotional stimuli in MDD reveals a similar signature of

424
pathological activation of reward-related areas for negative rather than positive cues, illustrating a common pathophysiology of distorted incentive salience in the VMN across SUDs and MDD.63

425
Figure 4. Reciprocal relationship of SN and VMN activity. The reader is encouraged to replicate and explore the depicted networks in the Neurosynth tool. Resting-state functional connectivity maps are generated using the Neurosynth tool45 from the seed coordinates indicated at left. Seeds in the anterior insula and dACC reveal a network of positively correlated regions throughout the other nodes of the SN, as expected (upper left). Notably, the anti-network of these SN seeds (i.e., regions showing negative rather than positive correlations) includes the key VMN nodes in the ventral striatum, VMPFC, and temporal poles (upper right), as may be seen by comparison with Figure 3. Conversely, seeds in the nucleus accumbens and VMPFC reveal a network of positively correlated regions corresponding to the VMN (lower right). The anti-network of these seeds corresponds well to the SN (lower left). In order to highlight the correspondence of the networks and anti-networks, blue colors are used for the SN networks and the VMN anti-networks, while orange colors are used for the VMN networks and SN anti-networks.
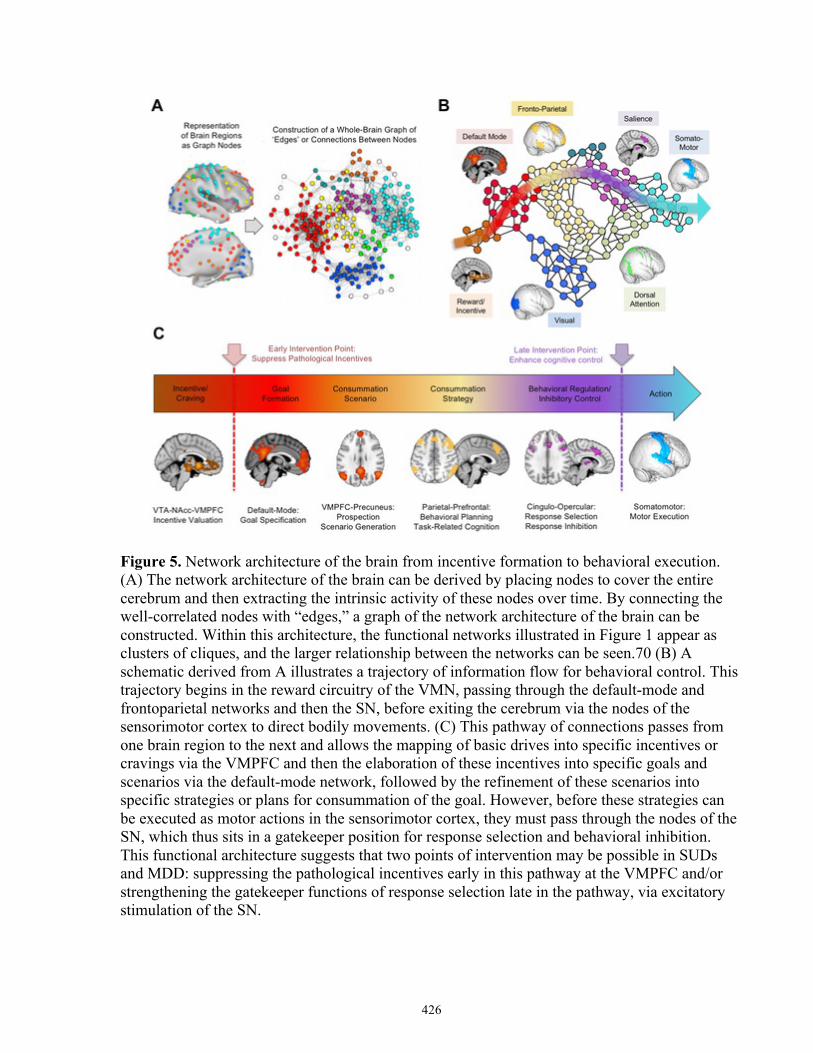
426
Figure 5. Network architecture of the brain from incentive formation to behavioral execution. (A) The network architecture of the brain can be derived by placing nodes to cover the entire cerebrum and then extracting the intrinsic activity of these nodes over time. By connecting the well-correlated nodes with “edges,” a graph of the network architecture of the brain can be constructed. Within this architecture, the functional networks illustrated in Figure 1 appear as clusters of cliques, and the larger relationship between the networks can be seen.70 (B) A schematic derived from A illustrates a trajectory of information flow for behavioral control. This trajectory begins in the reward circuitry of the VMN, passing through the default-mode and frontoparietal networks and then the SN, before exiting the cerebrum via the nodes of the sensorimotor cortex to direct bodily movements. (C) This pathway of connections passes from one brain region to the next and allows the mapping of basic drives into specific incentives or cravings via the VMPFC and then the elaboration of these incentives into specific goals and scenarios via the default-mode network, followed by the refinement of these scenarios into specific strategies or plans for consummation of the goal. However, before these strategies can be executed as motor actions in the sensorimotor cortex, they must pass through the nodes of the SN, which thus sits in a gatekeeper position for response selection and behavioral inhibition. This functional architecture suggests that two points of intervention may be possible in SUDs and MDD: suppressing the pathological incentives early in this pathway at the VMPFC and/or strengthening the gatekeeper functions of response selection late in the pathway, via excitatory stimulation of the SN.
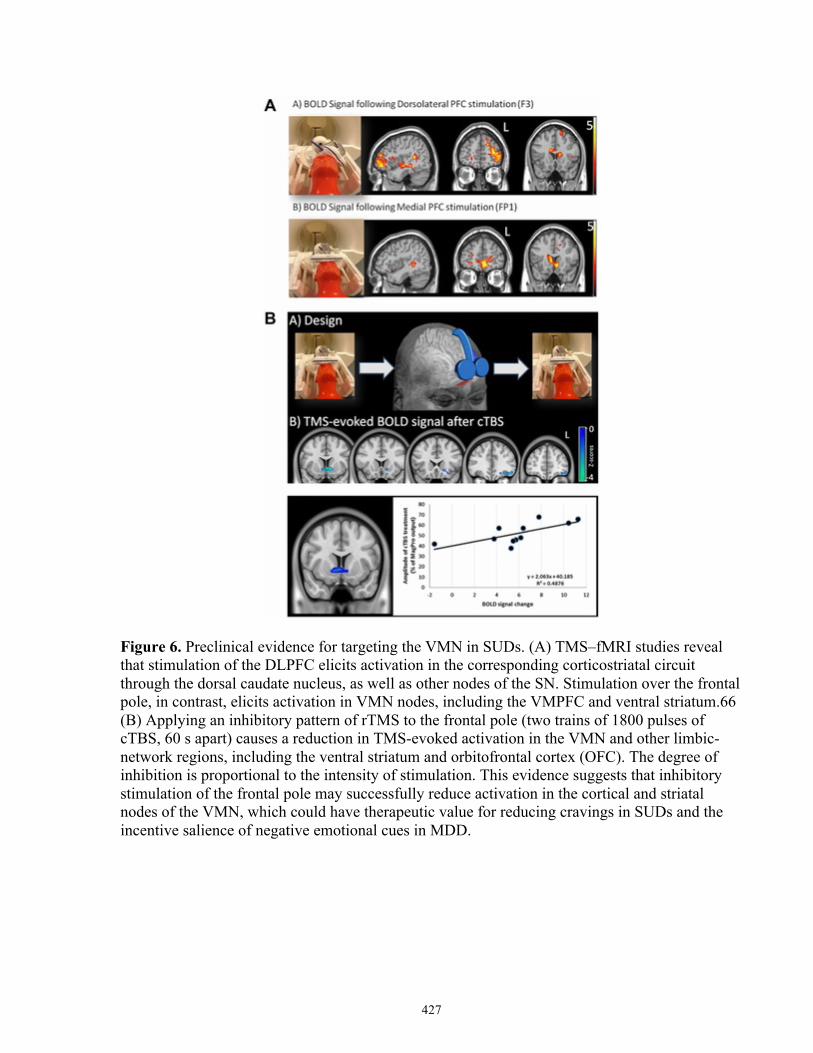
427
Figure 6. Preclinical evidence for targeting the VMN in SUDs. (A) TMS–fMRI studies reveal that stimulation of the DLPFC elicits activation in the corresponding corticostriatal circuit through the dorsal caudate nucleus, as well as other nodes of the SN. Stimulation over the frontal pole, in contrast, elicits activation in VMN nodes, including the VMPFC and ventral striatum.66 (B) Applying an inhibitory pattern of rTMS to the frontal pole (two trains of 1800 pulses of cTBS, 60 s apart) causes a reduction in TMS-evoked activation in the VMN and other limbic-network regions, including the ventral striatum and orbitofrontal cortex (OFC). The degree of inhibition is proportional to the intensity of stimulation. This evidence suggests that inhibitory stimulation of the frontal pole may successfully reduce activation in the cortical and striatal nodes of the VMN, which could have therapeutic value for reducing cravings in SUDs and the incentive salience of negative emotional cues in MDD.
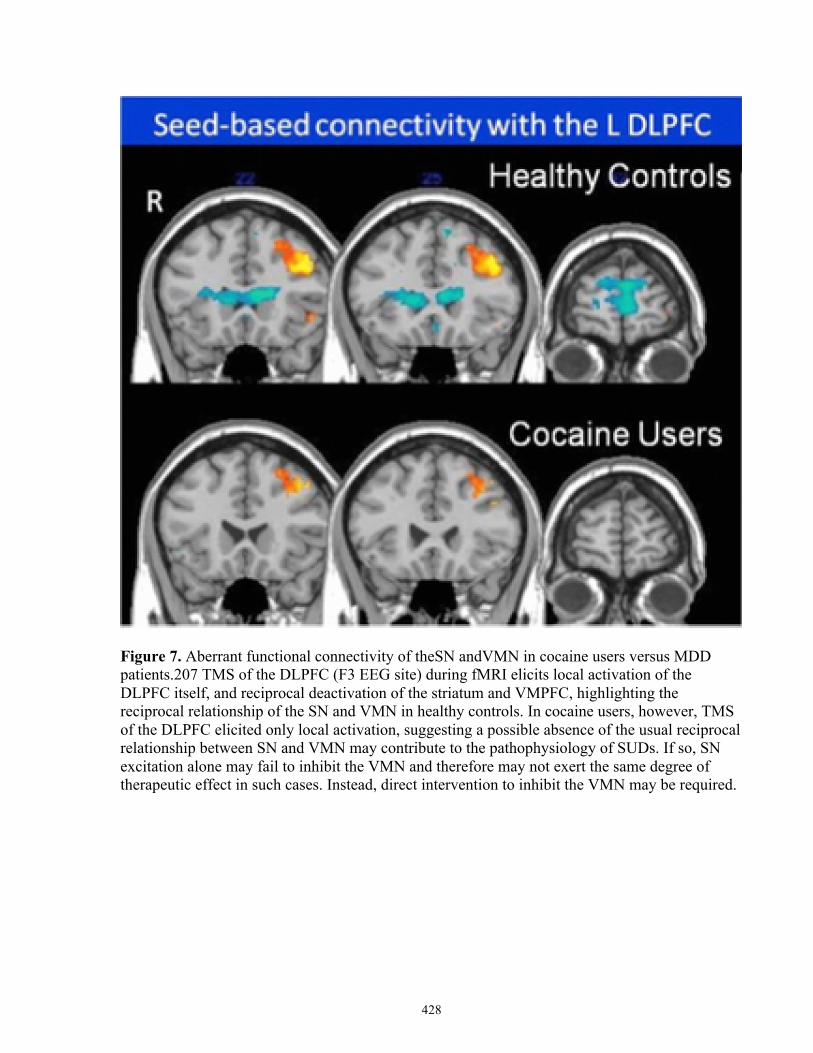
428
Figure 7. Aberrant functional connectivity of theSN andVMN in cocaine users versus MDD patients.207 TMS of the DLPFC (F3 EEG site) during fMRI elicits local activation of the DLPFC itself, and reciprocal deactivation of the striatum and VMPFC, highlighting the reciprocal relationship of the SN and VMN in healthy controls. In cocaine users, however, TMS of the DLPFC elicited only local activation, suggesting a possible absence of the usual reciprocal relationship between SN and VMN may contribute to the pathophysiology of SUDs. If so, SN excitation alone may fail to inhibit the VMN and therefore may not exert the same degree of therapeutic effect in such cases. Instead, direct intervention to inhibit the VMN may be required.
429
References
1. Whiteford H.A., Degenhardt L., Rehm J., et al 2013. Global burden of disease attributable to mental and substance use disorders: findings from the global burden of disease study 2010. Lancet 382: 1575–1586. 2. Ferrari A.J., Charlson F.J., Norman R.E., et al 2013. Burden of depressive disorders by country, sex, age, and year: findings from the global burden of disease study 2010. PLoS Med. 10: e1001547. 3. Rush A.J. 2007. Limitations in efficacy of antidepressant monotherapy. J. Clin. Psychiatry 68(Suppl.): 8–10. 4. Rush A.J., Trivedi M.H., Wisniewski S.R., et al 2006. Acute and longer-term outcomes in depressed outpatients requiring one or several treatment steps: a STAR*D report. Am. J. Psychiatry 163: 1905–1917. 5. Nemeroff C.B. 2007. Prevalence and management of treatment-resistant depression. J. Clin. Psychiatry 68: 17–25. 6. Rocha F.L., Fuzikawa C., Riera R. & Hara C. 2012. Combination of antidepressants in the treatment of major depressive disorder: a systematic review and meta-analysis. J. Clin. Psychopharmacol. 32: 278–281. 7. Papakostas G.I., Shelton R.C., Smith J. & Fava M. 2007. Augmentation of antidepressants with atypical antipsychotic medications for treatment-resistant major depressive disorder: a meta-analysis. J. Clin. Psychiatry 68: 826–831. 8. Blier P., Ward H.E., Tremblay P., et al 2010. Combination of antidepressant medications from treatment initiation for major depressive disorder: a double-blind randomized study. Am. J. Psychiatry 167: 281–288. 9. Turner P. & Kantaria R.A. 2014. Systematic review and meta-analysis of the evidence base for add-on treatment for patients with major depressive disorder who have not responded to antidepressant treatment: a European perspective. J. Psychopharmacol. 28: 85–98. 10. Dierckx B., Heijnen W.T., van den Broek W.W. & Birkenhäger T.K. 2012. Efficacy of electroconvulsive therapy in bipolar versus unipolar major depression: a meta-analysis. Bipolar Disord. 14: 146–150. 11. Swan J.S., Macvicar R., Christmas D., et al 2014. Cognitive Behavioural Analysis System of Psychotherapy (CBASP) for chronic depression: clinical characteristics and six month clinical outcomes in an open case series. J. Affect. Disord. 152–154: 268–276. 12. Jelovac A., Kolshus E. & McLoughlin D.M.. 2013. Relapse following successful electroconvulsive therapy for major depression: a meta-analysis. Neuropsychopharmacology 38: 2467–2474. 13. Degenhardt L., Chiu W.T., Sampson N., et al 2008. Toward a global view of alcohol, tobacco, cannabis, and cocaine use: findings from the WHO world mental health surveys. PLoS Med. 5: 1053–1067. 14. U.S. Department of Health and Human Services (HHS). Substance Abuse and Mental Health Services Administration. 2010. Results from the 2010 National Survey on Drug Use and Health: Summary of National Findings. Vol. I 1–143. Rockville, MD: Substance Abuse and Mental Health Services Administration. 15. Grant B.F., Chou S.P., Goldstein R.B., et al 2008. Prevalence, correlates, disability, and comorbidity of DSM-IV borderline personality disorder: results from the Wave 2 National Epidemiologic Survey on Alcohol and Related Conditions. J. Clin. Psychiatry 69: 533–545. 16. Merikangas K.R. & McClair V.L. 2012. Epidemiology of substance use disorders. Hum. Genet. 131: 779–789. 17. Dutra L., Stathopoulou G., Basden S.L., et al 2008. A meta-analytic review of psychosocial interventions for substance use disorders. Am. J. Psychiatry 165: 179–187. 18. Magill M. & Ray La. 2009. Cognitive-behavioral treatment with adult alcohol and illicit drug users: a meta-analysis of randomized controlled trials. J. Stud. Alcohol Drugs 70: 516–527. 19. McHugh R.K., Hearon B.A. & Otto M.W. 2010. Cognitive behavioral therapy for substance use disorders. Psychiatr. Clin. North Am. 33: 511–525. 20. Prendergast M., Podus D., Finney J., et al 2006. Contingency management for treatment of substance use disorders: a meta-analysis. Addiction 101: 1546–1560. 21. Stitzer M. & Petry N. 2006. Contingency management for treatment of substance abuse. Annu. Rev. Clin. Psychol. 2: 411–434. 22. Morein-Zamir S. & Robbins T.W. 2014. Fronto-striatal circuits in response-inhibition: relevance to addiction. Brain Res 1628: 117–129. 23. Anton R.F., O'Malley S.S., Ciraulo D.A., et al 2006. Combined pharmacotherapies and behavioral interventions for alcohol dependence: the COMBINE study: a randomized controlled trial. JAMA 295: 2003–2017. 24. Johnson R.E., Jaffe J.H. & Fudala P.J. 1992. A controlled trial of buprenorphine treatment for opioid dependence. JAMA 267: 2750–2755. 25. Sinha R. 2011. New findings on biological factors predicting addiction relapse vulnerability. Curr. Psychiatry Rep. 13: 398–405.
430
26. Blum K., Braverman E.R., Holder J.M., et al 2000. Reward deficiency syndrome: a biogenetic model for the diagnosis and treatment of impulsive, addictive, and compulsive behaviors. J. Psychoactive Drugs 32(Suppl.): 1–112. 27. Hasin D.S., Goodwin R.D., Stinson F.S. & Grant B.F. 2005. Epidemiology of major depressive disorder: results from the National Epidemiologic Survey on Alcoholism and Related Conditions. Arch. Gen. Psychiatry 62: 1097–1106. 28. Kessler R.C., Chiu W.T., Demler O., et al 2005. Prevalence, severity, and comorbidity of 12-month DSM-IV disorders in the National Comorbidity Survey Replication. Arch. Gen. Psychiatry62: 617–627. 29. Kelly J., Mckellar J.D. & Moos R. 2003. Major depression in patients with substance use disorders: relationship to 12-step self-help involvement and substance use outcomes. Addiction 98: 499–508. 30. Nunes E.V. & Levin F.R. 2004. Treatment of depression in patients with alcohol or other drug dependence: a meta-analysis. JAMA 291: 1887–1896. 31. Nunes E.V., Sullivan M.A. & Levin F.R. 2004. Treatment of depression in patients with opiate dependence. Biol. Psychiatry 56: 793–802. 32. Raby Wilfrid N., Rubin Eric A., Garawi F., et al 2014. A randomized, double-blind, placebo-controlled trial of venlafaxine for the treatment of depressed cocaine-dependent patients. Am. J. Addict. 23: 68–75. 33. Riper H., Andersson G., Hunter S.B., et al 2014. Treatment of comorbid alcohol use disorders and depression with cognitive-behavioural therapy and motivational interviewing: a meta-analysis. Addiction 109: 394–406. 34. Glassman A.H., Covey L.S., Stetner F. & Rivelli S. 2001. Smoking cessation and the course of major depression: a follow-up study. Lancet 357: 1929–1932. 35. Covey L.S., Glassman A.H. & Stetner F. 1998. Cigarette smoking and major depression. J. Addict. Dis. 17: 35–46. 36. Covey L.S., Glassman A.H., Stetner F., et al 2002. A randomized trial of sertraline as a cessation aid for smokers with a history of major depression. Am. J. Psychiatry 159: 1731–1737. 37. Gierisch J.M., Bastian L.A., Calhoun P.S., et al 2012. Smoking cessation interventions for patients with depression: a systematic review and meta-analysis. J. Gen. Intern. Med. 27: 351–360. 38. Pettinati H.M., O'Brien C.P. & Dundon W.D. 2013. Current status of co-occurring mood and substance use disorders: a new therapeutic target. Am. J. Psychiatry 170: 23–30. 39. Fox M.D., Liu H. & Pascual-Leone A. 2013. Identification of reproducible individualized targets for treatment of depression with TMS based on intrinsic connectivity. Neuroimage 66: 151–160. 40. Kimbrell T.A., Little J.T. & Dunn R.T., et al 1999. Frequency dependence of antidepressant response to left prefrontal repetitive transcranial magnetic stimulation (rTMS) as a function of baseline cerebral glucose metabolism. Biol. Psychiatry 46: 1603–1613. 41. Speer A.M., Kimbrell T.A., Wassermann E.M., et al 2000. Opposite effects of high and low frequency rTMS on regional brain activity in depressed patients. Biol. Psychiatry 48: 1133–1141. 42. Sporns O. 2011. The human connectome: a complex network. Ann. N. Y. Acad. Sci. 1224: 109–125. 43. Damoiseaux J.S., Rombouts S.A.R.B., Barkhof F., et al 2006. Consistent resting-state networks across healthy subjects. Proc. Natl. Acad. Sci. U.S.A. 103: 13848–13853. 44. Smith S.M., Fox P.T., Miller K.L., et al 2009. Correspondence of the brain's functional architecture during activation and rest. Proc. Natl. Acad. Sci. U.S.A. 106: 13040–13045. 45. Yarkoni T., Poldrack R.A., Nichols T.E., et al 2011. Large-scale automated synthesis of human functional neuroimaging data. Nat. Methods 8: 665–670. 46. Thomas Yeo B.T., Krienen F.M., Sepulcre J., et al 2011. The organization of the human cerebral cortex estimated by intrinsic functional connectivity. J. Neurophysiol. 106: 1125–1165. 47. Choi E.Y., Yeo B.T.T. & Buckner R.L. 2012. The organization of the human striatum estimated by intrinsic functional connectivity. J. Neurophysiol. 108: 2242–2263. 48. Buckner R.L., Krienen F.M., Castellanos A., et al 2011. The organization of the human cerebellum estimated by intrinsic functional connectivity. J. Neurophysiol. 106: 2322–2345. 49. Greicius M.D., Krasnow B., Reiss A.L. & Menon V. 2003. Functional connectivity in the resting brain: a network analysis of the default mode hypothesis. Proc. Natl. Acad. Sci. U.S.A. 100: 253–258. 50. Kucyi A. & Davis K.D. 2014. Dynamic functional connectivity of the default mode network tracks daydreaming. Neuroimage 100: 471–480. 51. Spreng R.N. & Grady C.L. 2010. Patterns of brain activity supporting autobiographical memory, prospection, and theory of mind, and their relationship to the default mode network. J. Cogn. Neurosci. 22: 1112–1123. 52. Hamilton J.P., Furman D.J., Chang C., et al 2011. Default-mode and task-positive network activity in major depressive disorder: implications for adaptive and maladaptive rumination. Biol. Psychiatry 70: 327–333.
431
53. Downar J., Crawley A.P., Mikulis D.J. & Davis K.D. 2000. A multimodal cortical network for the detection of changes in the sensory environment. Nat. Neurosci. 3: 277–283. 54. Downar J., Crawley A.P., Mikulis D.J. & Davis K.D. 2001. The effect of task relevance on the cortical response to changes in visual and auditory stimuli: an event-related fMRI study. Neuroimage 14: 1256–1267. 55. Sridharan D., Levitin D.J. & Menon V. 2008. A critical role for the right fronto-insular cortex in switching between central-executive and default-mode networks. Proc. Natl. Acad. Sci. U.S.A. 105: 12569–12574. 56. Dosenbach N.U.F., Visscher K.M., Palmer E.D., et al 2006. A core system for the implementation of task sets. Neuron 50: 799–812. 57. Goodkind M., Eickhoff S.B., Oathes D.J., et al 2015. Identification of a common neurobiological substrate for mental illness. JAMA Psychiatry 5797: 305–315. 58. Cooper J.C. & Knutson B. 2008. Valence and salience contribute to nucleus accumbens activation. Neuroimage 39: 538–547. 59. Volkow N.D., Wang G.-J., Fowler J.S., et al 2011. Addiction: beyond dopamine reward circuitry. Proc. Natl. Acad. Sci. U.S.A. 108: 15037–15042. 60. Koob G.F. 2009. Dynamics of neuronal circuits in addiction: reward, antireward, and emotional memory. Pharmacopsychiatry 42 (Suppl.): S32–S41. 61. Berridge K.C. 2012. From prediction error to incentive salience: mesolimbic computation of reward motivation. Eur. J. Neurosci. 35: 1124–1143. 62. Tremblay L.K., Naranjo C.A., Graham S.J., et al 2005. Functional neuroanatomical substrates of altered reward processing in major depressive disorder revealed by a dopaminergic probe. Arch. Gen. Psychiatry 62: 1228–1236. 63. Diekhof E.K., Falkai P. & Gruber O. 2008. Functional neuroimaging of reward processing and decision-making: a review of aberrant motivational and affective processing in addiction and mood disorders. Brain Res. Rev. 59: 164–184. 64. Menon V. 2011. Large-scale brain networks and psychopathology: a unifying triple network model. Trends Cogn. Sci. 15: 483–506. 65. Dosenbach N.U.F., Fair D.A., Cohen A.L., et al 2008. A dual-networks architecture of top-down control. Trends Cogn. Sci. 12: 99–105. 66. Hanlon C.A., Canterberry M., Taylor J.J., et al 2013. Probing the frontostriatal loops involved in executive and limbic processing via interleaved TMS and functional MRI at two prefrontal locations: a pilot study. PLoS One 8: e67917. 67. Fox M.D., Snyder A.Z., Vincent J.L., et al 2005. The human brain is intrinsically organized into dynamic, anticorrelated functional networks. Proc. Natl. Acad. Sci. U.S.A. 102: 9673–9678. 68. Uddin L.Q., Kelly A.M., Biswal B.B., et al 2009. Functional connectivity of default mode network components: correlation, anticorrelation, and causality. Hum. Brain Mapp. 30: 625–637. 69. Bullmore E. & Sporns O.. 2009. Complex brain networks: graph theoretical analysis of structural and functional systems. Nat. Rev. Neurosci. 10: 186–198. 70. Power J.D., Cohen A.L., Nelson S.M., et al 2011. Functional network organization of the human brain. Neuron 72: 665–678. 71. Power J.D., Schlaggar B.L., Lessov-Schlaggar C.N. & Petersen S.E. 2013. Evidence for hubs in human functional brain networks. Neuron 79: 798–813. 72. Nestler E.J. 2005. Is there a common molecular pathway for addiction? Nat. Neurosci. 8: 1445–1449. 73. Moeller S.J., Hajcak G., Parvaz M.A., et al 2012. Psychophysiological prediction of choice: relevance to insight and drug addiction. Brain 135: 3481–3494. 74. Bolla K., Ernst M., Kiehl K., et al 2004. Prefrontal cortical dysfunction in abstinent cocaine abusers. J. Neuropsychiatry Clin. Neurosci. 16: 456–464. 75. Lee T.M.C., Zhou W.-H., Luo X.-J., et al 2005. Neural activity associated with cognitive regulation in heroin users: a fMRI study. Neurosci. Lett. 382: 211–216. 76. Hester R., Nestor L. & Garavan H.. 2009. Impaired error awareness and anterior cingulate cortex hypoactivity in chronic cannabis users. Neuropsychopharmacology 34: 2450–2458. 77. Connolly C.G., Foxe J.J., Nierenberg J., et al 2012. The neurobiology of cognitive control in successful cocaine abstinence. Drug Alcohol Depend. 121: 45–53. 78. Denier N., Gerber H., Vogel M., et al 2013. Reduction in cerebral perfusion after heroin administration: a resting state arterial spin labeling study. PLoS One 8: e71461. 79. Liu J., Liang J., Qin W., et al 2009. Dysfunctional connectivity patterns in chronic heroin users: an fMRI study. Neurosci. Lett. 460: 72–77. 80. Zhang X., Salmeron B.J., Ross T.J., et al 2011. Anatomical differences and network characteristics underlying smoking cue reactivity. Neuroimage 54: 131–141.
432
81. Radeloff D., Willmann K., Otto L., et al 2014. High-fat taste challenge reveals altered striatal response in women recovered from bulimia nervosa: a pilot study. World J. Biol. Psychiatry 15: 307–316. 82. Rando K., Hong K.I., Bhagwagar Z., et al 2011. Association of frontal and posterior cortical gray matter volume with time to alcohol relapse: a prospective study. Am. J. Psychiatry 168: 183–192. 83. Naqvi N.H. & Bechara A. 2010. The insula and drug addiction: an interoceptive view of pleasure, urges, and decision-making. Brain Struct. Funct. 214: 435–450. 84. Naqvi N.H., Rudrauf D., Damasio H. & Bechara A. 2007. Damage to the insula disrupts addiction to cigarette smoking. Science 315: 531–534. 85. Moeller S.J., Tomasi D., Woicik P.A., et al 2012. Enhanced midbrain response at 6-month follow-up in cocaine addiction, association with reduced drug-related choice. Addict. Biol. 17: 1013–1025. 86. Kilts C.D., Gross R.E., Ely T.D. & Drexler K.P.G. 2004. The neural correlates of cue-induced craving in cocaine-dependent women. Am. J. Psychiatry 161: 233–241. 87. Risinger R.C., Salmeron B.J., Ross T.J., et al 2005. Neural correlates of high and craving during cocaine self-administration using BOLD fMRI. Neuroimage 26: 1097–1108. 88. Li Q., Wang Y., Zhang Y., et al 2012. Craving correlates with mesolimbic responses to heroin-related cues in short-term abstinence from heroin: an event-related fMRI study. Brain Res. 1469: 63–72. 89. Rosenberg D.R., MacMaster F.P., Mirza Y., et al 2005. Reduced anterior cingulate glutamate in pediatric major depression: a magnetic resonance spectroscopy study. Biol. Psychiatry 58: 700–704. 90. Franklin T.R., Wang Z., Wang J., et al 2007. Limbic activation to cigarette smoking cues independent of nicotine withdrawal: a perfusion fMRI study. Neuropsychopharmacology 32: 2301–2309. 91. McClernon F.J., Hiott F.B., Huettel S.A. & Rose J.E. 2005. Abstinence-induced changes in self-report craving correlate with event-related FMRI responses to smoking cues. Neuropsychopharmacology 30: 1940–1947. 92. Engelmann J.M., Versace F., Robinson J.D., et al 2012. Neural substrates of smoking cue reactivity: a meta-analysis of fMRI studies. Neuroimage 60: 252–262. 93. Kühn S. & Gallinat J. 2011. Common biology of craving across legal and illegal drugs: a quantitative meta-analysis of cue-reactivity brain response. Eur. J. Neurosci. 33: 1318–1326. 94. Schacht J.P., Anton R.F. & Myrick H. 2013. Functional neuroimaging studies of alcohol cue reactivity: a quantitative meta-analysis and systematic review. Addict. Biol. 18: 121–133. 95. Moeller S.J. & Goldstein R.Z. 2014. Impaired self-awareness in human addiction: deficient attribution of personal relevance. Trends Cogn. Sci. 18: 635–641. 96. Franklin T., Wang Z., Suh J.J., et al 2011. Effects of varenicline on smoking cue–triggered neural and craving responses. Arch. Gen. Psychiatry 68: 516–526. 97. Menossi H.S., Goudriaan A.E., De Azevedo-Marques Périco C., et al 2013. Neural bases of pharmacological treatment of nicotine dependence – insights from functional brain imaging: a systematic review. CNS Drugs 27: 921–941. 98. Culbertson C.S., Bramen J., Cohen M.S., et al 2011. Effect of bupropion treatment on brain activation induced by cigarette-related cues in smokers. Arch. Gen. Psychiatry 68: 505–515. 99. Goldstein R.Z., Woicik P.A., Maloney T., et al 2010. Oral methylphenidate normalizes cingulate activity in cocaine addiction during a salient cognitive task. Proc. Natl. Acad. Sci. U.S.A. 107: 16667–16672. 100. Lubman D.I., Yücel M., Kettle J.W.L., et al 2009. Responsiveness to drug cues and natural rewards in opiate addiction: associations with later heroin use. Arch. Gen. Psychiatry 66: 205–212. 101. Zhang Y., Gong J., Xie C., et al 2015. Alterations in brain connectivity in three sub-regions of the anterior cingulate cortex in heroin-dependent individuals: evidence from resting state fMRI. Neuroscience 284: 998–1010. 102. Hu Y., Salmeron B.J., Gu H., et al 2015. Impaired functional connectivity within and between frontostriatal circuits and its association with compulsive drug use and trait impulsivity in cocaine addiction. JAMA Psychiatry 72: 584–592. 103. Hong L.E., Hodgkinson C.A., Yang Y., et al 2010. A genetically modulated, intrinsic cingulate circuit supports human nicotine addiction. Proc. Natl. Acad. Sci. U.S.A. 107: 13509–13514. 104. Koenigs M. & Grafman J. 2009. The functional neuroanatomy of depression: distinct roles for ventromedial and dorsolateral prefrontal cortex. Behav. Brain Res. 201: 239–243. 105. Mayberg H.S., Lozano A.M., Voon V., et al 2005. Deep brain stimulation for treatment-resistant depression. Neuron 45: 651–660. 106. Brody A.L., Saxena S., Mandelkern M.A., et al 2001. Brain metabolic changes associated with symptom factor improvement in major depressive disorder. Biol. Psychiatry 50: 171–178. 107. Hamilton J.P., Chen G., Thomason M.E., et al 2011. Investigating neural primacy in Major Depressive Disorder: multivariate Granger causality analysis of resting-state fMRI time-series data. Mol. Psychiatry 16: 763–772.
433
108. Nestler E.J. & Carlezon W.A. 2006. The mesolimbic dopamine reward circuit in depression. Biol. Psychiatry 59: 1151–1159. 109. Tremblay L.K., Naranjo C.A., Graham S.J., et al 2005. Functional neuroanatomical substrates of altered reward processing in major depressive disorder revealed by a dopaminergic probe. Arch. Gen. Psychiatry 62: 1228–1236. 110. Robinson O.J., Cools R., Carlisi C.O., et al 2012. Ventral striatum response during reward and punishment reversal learning in unmedicated major depressive disorder. Am. J. Psychiatry 169: 152–159. 111. Pizzagalli D.A., Holmes A.J., Dillon D.G., et al 2009. Reduced caudate and nucleus accumbens response to rewards in unmedicated individuals with major depressive disorder. Am. J. Psychiatry166: 702–710. 112. Knutson B., Bhanji J.P., Cooney R.E., et al 2008. Neural responses to monetary incentives in major depression. Biol. Psychiatry 63: 686–692. 113. Wagner G., Koch K., Schachtzabel C., et al 2013. Self-referential processing influences functional activation during cognitive control: an fMRI study. Soc. Cogn. Affect. Neurosci. 8: 828–837. 114. Wagner G., Schachtzabel C., Peikert G. & Bär K.-J. 2015. The neural basis of the abnormal self-referential processing and its impact on cognitive control in depressed patients. Hum. Brain Mapp. 36: 2781–2794. 115. McCabe C., Cowen P.J. & Harmer C.J. 2009. Neural representation of reward in recovered depressed patients. Psychopharmacology (Berl.) 205: 667–677. 116. Cooney R.E., Joormann J., Eugène F., et al 2010. Neural correlates of rumination in depression. Cogn. Affect. Behav. Neurosci. 10: 470–478. 117. Wagner G., Sinsel E., Sobanski T., et al 2006. Cortical inefficiency in patients with unipolar depression: an event-related fMRI study with the Stroop task. Biol. Psychiatry 59: 958–965. 118. Holmes A.J. & Pizzagalli D.A. 2008. Response conflict and frontocingulate dysfunction in unmedicated participants with major depression. Neuropsychologia 46: 2904–2913. 119. Harvey P.O., Fossati P., Pochon J.B., et al 2005. Cognitive control and brain resources in major depression: an fMRI study using the n-back task. Neuroimage 26: 860–869. 120. Bermpohl F., Walter M., Sajonz B., et al 2009. Attentional modulation of emotional stimulus processing in patients with major depression—alterations in prefrontal cortical regions. Neurosci. Lett. 463: 108–113. 121. Mayberg H.S., Liotti M., Brannan S.K., et al 1999. Reciprocal limbic-cortical function and negative mood: converging PET findings in depression and normal sadness. Am. J. Psychiatry 156: 675–682. 122. Pizzagalli D., Pascual-Marqui R.D., Nitschke J.B., et al 2001. Anterior cingulate activity as a predictor of degree of treatment response in major depression: evidence from brain electrical tomography analysis. Am. J. Psychiatry 158: 405–415. 123. Li C.-T., Lin C.-P., Chou K.-H., et al 2010. Structural and cognitive deficits in remitting and non-remitting recurrent depression: a voxel-based morphometric study. Neuroimage 50: 347–56. 124. Carpenter L.L., Janicak P.G., Aaronson S.T., et al 2012. Transcranial magnetic stimulation (TMS) for major depression: a multisite, naturalistic, observational study of acute treatment outcomes in clinical practice. Depress. Anxiety 29: 587–596. 125. Solvason H.B., Husain M., Fitzgerald P.B., et al 2014. Improvement in quality of life with left prefrontal transcranial magnetic stimulation in patients with pharmacoresistant major depression: acute and six month outcomes. Brain Stimul. 7: 219–225. 126. Wang H., Wang X. & Scheich H. 1996. LTD and LTP induced by transcranial magnetic stimulation in auditory cortex. Neuroreport 7: 521–525. 127. Antal A., Chaieb L., Moliadze V., et al 2010. Brain-derived neurotrophic factor (BDNF) gene polymorphisms shape cortical plasticity in humans. Brain Stimul. 3: 230–237. 128. Maeda F., Keenan J.P., Tormos J.M., et al 2000. Interindividual variability of the modulatory effects of repetitive transcranial magnetic stimulation on cortical excitability. Exp. Brain Res. 133: 425–430. 129. Pascual-Leone A., Tormos J.M., Keenan J., et al 1998. Study and modulation of human cortical excitability with transcranial magnetic stimulation. J. Clin. Neurophysiol. 15: 333–343. 130. Chen R., Classen J., Gerloff C., et al 1998. Depression of motor cortex excitability by low-frequency transcranial magnetic stimulation. Neurology 48: 1398–1403. 131. Pascual-Leone A., Valls-Solé J., Wassermann E.M. & Hallett M. 1994. Responses to rapid-rate transcranial magnetic stimulation of the human motor cortex. Brain 117(Pt 4): 847–858. 132. Huang Y.-Z., Edwards M.J., Rounis E., et al 2005. Theta burst stimulation of the human motor cortex. Neuron 45: 201–206. 133. Huang Y.-Z., Rothwell J.C., Lu C.-S., et al 2009. The effect of continuous theta burst stimulation over premotor cortex on circuits in primary motor cortex and spinal cord. Clin. Neurophysiol. 120: 796–801. 134. Li C.-T., Chen M.-H., Juan C.-H., et al 2014. Efficacy of prefrontal theta-burst stimulation in refractory depression: a randomized sham-controlled study. Brain 137(Pt 7): 2088–2098.

434
135. Bakker N., Shahab S., Giacobbe P., et al 2015. rTMS of the dorsomedial prefrontal cortex for major depression: safety, tolerability, effectiveness, and outcome predictors for 10 Hz versus intermittent theta-burst stimulation. Brain Stimul. 8: 208–215. 136. Eldaief M.C., Halko M.A., Buckner R.L. & Pascual-Leone A. 2011. Transcranial magnetic stimulation modulates the brain's intrinsic activity in a frequency-dependent manner. Proc. Natl. Acad. Sci. U.S.A. 108: 21229–21234. 137. Nettekoven C., Volz L.J., Leimbach M., et al 2015. Inter-individual variability in cortical excitability and motor network connectivity following multiple blocks of rTMS. Neuroimage 118: 209–218. 138. Dunlop J., Woodside B., Lam E., et al 2015. Increases in frontostriatal connectivity are associated with response to dorsomedial repetitive transcranial magnetic stimulation in refractory binge/purge behaviors. Neuroimage Clin. 8: 611–618. 139. Pogarell O., Koch W., Pöpperl G., et al 2007. Acute prefrontal rTMS increases striatal dopamine to a similar degree as d-amphetamine. Psychiatry Res. 156: 251–255. 140. Pogarell O., Koch W., Pöpperl G., et al 2006. Striatal dopamine release after prefrontal repetitive transcranial magnetic stimulation in major depression: preliminary results of a dynamic [123I] IBZM SPECT study. J. Psychiatr. Res. 40: 307–314. 141. Monte-Silva K., Ruge D., Teo J.T., et al 2011. D2 receptor block abolishes θ burst stimulation-induced neuroplasticity in the human motor cortex. Neuropsychopharmacology 36: 2097–2102. 142. Salomons T.V., Dunlop K., Kennedy S.H., et al 2014. Resting-state cortico-thalamic-striatal connectivity predicts response to dorsomedial prefrontal rTMS in major depressive disorder. Neuropsychopharmacology 39: 488–498. 143. Dunlop K., Woodside B., Olmsted M., et al 2015. Reductions in cortico-striatal hyperconnectivity accompany successful treatment of obsessive-compulsive disorder with dorsomedial prefrontal rTMS. Neuropsychopharmacology. 144. Strafella A.P., Ko J.H., Grant J., et al 2005. Corticostriatal functional interactions in Parkinson's disease: a rTMS/[11C]raclopride PET study. Eur. J. Neurosci. 22: 2946–2952. 145. Meron D., Hedger N., Garner M. & Baldwin D.S. 2015. Transcranial direct current stimulation (tDCS) in the treatment of depression: systematic review and meta-analysis of efficacy and tolerability. Neurosci. Biobehav. Rev. 57: 46–62. 146. Brunoni A.R., Nitsche M.A., Bolognini N., et al 2012. Clinical research with transcranial direct current stimulation (tDCS): challenges and future directions. Brain Stimul. 5: 175–195. 147. Wiethoff S., Hamada M. & Rothwell J.C. 2014. Variability in response to transcranial direct current stimulation of the motor cortex. Brain Stimul. 7: 468–475. 148. Reato D., Rahman A., Bikson M. & Parra L.C. 2013. Effects of weak transcranial alternating current stimulation on brain activity-a review of known mechanisms from animal studies. Front. Hum. Neurosci. 7: 687. 149. Voss U., Holzmann R., Hobson A., et al 2014. Induction of self awareness in dreams through frontal low current stimulation of gamma activity. Nat. Neurosci. 17: 810–812. 150. Stagg C.J. & Nitsche M.A. 2011. Physiological basis of transcranial direct current stimulation. Neuroscientist 17: 37–53. 151. Keeser D., Meindl T., Bor J., et al 2011. Prefrontal transcranial direct current stimulation changes connectivity of resting-state networks during fMRI. J. Neurosci. 31: 15284–15293. 152. Polanía R., Paulus W. & Nitsche M.A. 2012. Modulating cortico-striatal and thalamo-cortical functional connectivity with transcranial direct current stimulation. Hum. Brain Mapp. 33: 2499–2508. 153. Edwards D., Cortes M., Datta A., et al 2013. Physiological and modeling evidence for focal transcranial electrical brain stimulation in humans: a basis for high-definition tDCS. Neuroimage74: 266–275. 154. Fregni F., Boggio P.S., Nitsche M., et al 2005. Anodal transcranial direct current stimulation of prefrontal cortex enhances working memory. Exp. Brain Res. 166: 23–30. 155. Bocci T., Marceglia S., Vergari M., et al 2015. Transcutaneous spinal direct current stimulation modulates human corticospinal system excitability. J. Neurophysiol. 114: 440–446. 156. Vollmann H., Conde V., Sewerin S., et al 2013. Anodal transcranial direct current stimulation (tDCS) over supplementary motor area (SMA) but not pre-SMA promotes short-term visuomotor learning. Brain Stim. 6: 101-7. 157. Hsu T.-Y., Tseng L.-Y., Yu J.-X., et al 2011. Modulating inhibitory control with direct current stimulation of the superior medial frontal cortex. Neuroimage 56: 2249–2257. 158. Chib V.S., Yun K., Takahashi H. & Shimojo S. 2013. Noninvasive remote activation of the ventral midbrain by transcranial direct current stimulation of prefrontal cortex. Transl. Psychiatry 3: e268.
435
159. Kedzior K., Azorina V. & Reitz S. 2014. More female patients and fewer stimuli per session are associated with the short-term antidepressant properties of repetitive transcranial magnetic stimulation (rTMS): a meta-analysis of 54 sham-controlled studies published between 1997–2013. Neuropsychiatr. Dis. Treat. 10: 727–756. 160. Berlim M.T., van den Eynde F., Tovar-Perdomo S. & Daskalakis Z.J. 2014. Response, remission and drop-out rates following high-frequency repetitive transcranial magnetic stimulation (rTMS) for treating major depression: a systematic review and meta-analysis of randomized, double-blind and sham-controlled trials. Psychol. Med. 44: 225–239. 161. Brunelin J., Jalenques I., Trojak B., et al 2014. The efficacy and safety of low frequency repetitive transcranial magnetic stimulation for treatment-resistant depression: the results from a large multicenter French RCT. Brain Stimul. 7: 855–863. 162. Fitzgerald P.B., Hoy K., Gunewardene R., et al 2011. A randomized trial of unilateral and bilateral prefrontal cortex transcranial magnetic stimulation in treatment-resistant major depression. Psychol. Med. 41: 1187–1196. 163. Downar J. & Daskalakis Z.J. 2013. New targets for rTMS in depression: a review of convergent evidence. Brain Stimul. 6: 231–240. 164. Kreuzer P.M., Schecklmann M., Lehner A., et al 2015. The ACDC pilot trial: targeting the anterior cingulate by double cone coil rTMS for the treatment of depression. Brain Stimul. 8: 240–246. 165. Downar J., Geraci J., Salomons T.V., et al 2014. Anhedonia and reward-circuit connectivity distinguish nonresponders from responders to dorsomedial prefrontal repetitive transcranial magnetic stimulation in major depression. Biol. Psychiatry 76: 176–185. 166. Bakker N., Shahab S., Giacobbe P., et al 2015. rTMS of the dorsomedial prefrontal cortex for major depression: safety, tolerability, effectiveness, and outcome predictors for 10 Hz versus intermittent theta-burst stimulation. Brain Stimul. 8: 205–215. 167. Cho S.S., Kosimori Y., Aminian K., et al 2015. Investing in the future: stimulation of the medial prefrontal cortex reduces discounting of delayed rewards. Neuropsychopharmacology 40: 546–553. 168. Watanabe T., Hanajima R., Shirota Y., et al 2015. Effects of rTMS of pre-supplementary motor area on fronto basal ganglia network activity during stop-signal task. J. Neurosci. 35: 4813–4823. 169. Strafella A.P., Paus T., Barrett J. & Dagher A. 2001. Repetitive transcranial magnetic stimulation of the human prefrontal cortex induces dopamine release in the caudate nucleus. J. Neurosci. 21: 1–4. 170. Valiengo L., Benseñor I.M., Goulart A.C., et al 2013. The sertraline versus electrical current therapy for treating depression clinical study (select-TDCS): results of the crossover and follow-up phases. Depress. Anxiety 30: 646–653. 171. Loo C.K., Alonzo A., Martin D., et al 2012. Transcranial direct current stimulation for depression: 3-week, randomised, sham-controlled trial. Br. J. Psychiatry 200: 52–59. 172. Plewnia C., Schroeder P.A., Kunze R., et al 2015. Keep calm and carry on: improved frustration tolerance and processing speed by transcranial direct current stimulation (tDCS). PLoS One 10: e0122578. 173. Wolkenstein L. & Plewnia C. 2013. Amelioration of cognitive control in depression by transcranial direct current stimulation. Biol. Psychiatry 73: 646–651. 174. Gorelick D.A., Zangen A. & George M.S. 2014. Transcranial magnetic stimulation in the treatment of substance addiction. Ann. N. Y. Acad. Sci. 1327: 79–93. 175. Hanlon C.A., Dowdle L.T., Austelle C.W., et al 2015. What goes up, can come down: novel brain stimulation paradigms may attenuate craving and craving-related neural circuitry in substance dependent individuals. Brain Res 1628: 199–209. 176. Mishra B.R., Nizamie S.H., Das B. & Praharaj S.K. 2010. Efficacy of repetitive transcranial magnetic stimulation in alcohol dependence: a sham-controlled study. Addiction 105: 49–55. 177. Herremans S.C., Baeken C., Vanderbruggen N., et al 2012. No influence of one right-sided prefrontal HF-rTMS session on alcohol craving in recently detoxified alcohol-dependent patients: results of a naturalistic study. Drug Alcohol Depend. 120: 209–213. 178. Herremans S.C., Vanderhasselt M.-A., De Raedt R. & Baeken C. 2013. Reduced intra-individual reaction time variability during a Go-NoGo task in detoxified alcohol-dependent patients after one right-sided dorsolateral prefrontal HF-rTMS session. Alcohol Alcohol. 48: 552–557. 179. Höppner J., Broese T., Wendler L., et al 2011. Repetitive transcranial magnetic stimulation (rTMS) for treatment of alcohol dependence. World J. Biol. Psychiatry 12(Suppl.): 57–62. 180. Rapinesi C., Kotzalidis G.D., Serata D., et al 2013. Efficacy of add-on deep transcranial magnetic stimulation in comorbid alcohol dependence and dysthymic disorder: three case reports. Prim. Care Companion CNS Disord. 15: PCC.12m01438. 181. De Ridder D., Vanneste S., Kovacs S., et al 2011. Transient alcohol craving suppression by rTMS of dorsal anterior cingulate: an fMRI and LORETA EEG study. Neurosci. Lett. 496: 5–10.
436
182. Boggio P.S., Sultani N., Fecteau S., et al 2008. Prefrontal cortex modulation using transcranial DC stimulation reduces alcohol craving: a double-blind, sham-controlled study. Drug Alcohol Depend. 92: 55–60. 183. Nakamura-Palacios E.M., de Almeida Benevides M.C., da Penha Zago-Gomes M., et al 2012.Auditory event-related potentials (P3) and cognitive changes induced by frontal direct current stimulation in alcoholics according to Lesch alcoholism typology. Int. J. Neuropsychopharmacol. 15: 601–616. 184. da Silva M.C., Conti C.L., Klauss J., et al 2013. Behavioral effects of transcranial direct current stimulation (tDCS) induced dorsolateral prefrontal cortex plasticity in alcohol dependence. J. Physiol. (Paris) 107: 493–502. 185. Klauss J., Penido Pinheiro L.C., Silva Merlo B.L., et al 2014. A randomized controlled trial of targeted prefrontal cortex modulation with tDCS in patients with alcohol dependence. Int. J. Neuropsychopharmacol. 17: 1793–1803. 186. Politi E., Fauci E., Santoro A. & Smeraldi E. 2008. Daily sessions of transcranial magnetic stimulation to the left prefrontal cortex gradually reduce cocaine craving. Am. J. Addict. 17: 345–346. 187. Camprodon J.A., Martínez-Raga J., Alonso-Alonso M., et al 2007. One session of high frequency repetitive transcranial magnetic stimulation (rTMS) to the right prefrontal cortex transiently reduces cocaine craving. Drug Alcohol Depend. 86: 91–94. 188. Li X., Malcolm R.J., Huebner K., et al 2013. Low frequency repetitive transcranial magnetic stimulation of the left dorsolateral prefrontal cortex transiently increases cue-induced craving for methamphetamine: a preliminary study. Drug Alcohol Depend. 133: 641–646. 189. Gorini A., Lucchiari C., Russell-Edu W. & Pravettoni G. 2014. Modulation of risky choices in recently abstinent dependent cocaine users: a transcranial direct-current stimulation study. Front. Hum. Neurosci. 8: 661. 190. Batista E.K., Klauss J., Fregni F., et al 2015. A randomized placebo-controlled trial of targeted prefrontal cortex modulation with bilateral tDCS in patients with crack-cocaine dependence. Int. J. Neuropsychopharmacol. 18. 191. Hayashi T., Hyun J., Strafella A.P. & Dagher A. 2013. Dorsolateral prefrontal and orbitofrontal cortex interactions during self-control of cigarette craving. Proc. Natl. Acad. Sci. U.S.A. 110: 4422–4427. 192. Li X., Hartwell K.J., Owens M., et al 2013. Repetitive transcranial magnetic stimulation of the dorsolateral prefrontal cortex reduces nicotine cue craving. Biol. Psychiatry 73: 714–720. 193. Eichhammer P. 2003. High-frequency repetitive transcranial magnetic stimulation decreases cigarette smoking. J. Clin. Psychiatry 64: 951–953. 194. Dinur-Klein L., Dannon P., Hadar A., et al 2014. Smoking cessation induced by deep repetitive transcranial magnetic stimulation of the prefrontal and insular cortices: a prospective, randomized controlled trial. Biol. Psychiatry 76: 742–749. 195. Fregni F., Liguori P., Fecteau S., et al 2008. Cortical stimulation of the prefrontal cortex with transcranial direct current stimulation reduces cue-provoked smoking craving: a randomized, sham-controlled study. J. Clin. Psychiatry 69: 32–40. 196. Boggio P.S., Liguori P., Sultani N., et al 2009. Cumulative priming effects of cortical stimulation on smoking cue-induced craving. Neurosci. Lett. 463: 82–86. 197. Fecteau S., Agosta S., Hone-Blanchet A., et al 2014. Modulation of smoking and decision-making behaviors with transcranial direct current stimulation in tobacco smokers: a preliminary study. Drug Alcohol Dep. 140: 78–84. 198. Thirugnanasambandam N., Grundey J., Adam K., et al 2011. Nicotinergic impact on focal and non-focal neuroplasticity induced by non-invasive brain stimulation in non-smoking humans. Neuropsychopharm. 36: 879-86. 199. Rapinesi C., Curto M., Kotzalidis G.D., et al 2015. Antidepressant effectiveness of deep Transcranial Magnetic Stimulation (dTMS) in patients with Major Depressive Disorder (MDD) with or without Alcohol Use Disorders (AUDs): a 6-month, open label, follow-up study. J. Affect. Disord. 174: 57–63. 200. Roth Y., Zangen A. & Hallett M. 2002. A coil design for transcranial magnetic stimulation of deep brain regions. J. Clin. Neurophysiol. 19: 361–370. 201. Kedzior K., Gellersen H., Brachetti A. & Berlim M. 2015. Deep transcranial magnetic stimulation (DTMS) in the treatment of major depression: an exploratory systematic review and meta-analysis. J. Affect. Dis. 187: 73–83. 202. Ceccanti M. & Inghilleri M. 2015. Deep TMS on alcoholics: effects on cortisolemia and dopamine pathway modulation. A pilot study. Can. J. Psychiatry 290: 283–290. 203. Goudriaan A.E., De Ruiter M.B., Van Den Brink W., et al 2010. Brain activation patterns associated with cue reactivity and craving in abstinent problem gamblers, heavy smokers and healthy controls: an fMRI study. Addict. Biol. 15: 491–503. 204. Fu L.P., Bi G.H., Zou Z.T., et al 2008. Impaired response inhibition function in abstinent heroin dependents: an fMRI study. Neurosci. Lett. 438: 322–326. 205. Lev-Ran S., Shamay-Tsoory S.G., Zangen A. & Levkovitz Y. 2012. Transcranial magnetic stimulation of the ventromedial prefrontal cortex impairs theory of mind learning. Eur. Psychiatry27: 285–289.
437
206. Rose J.E., McClernon F.J., Froeliger B., et al 2011. Repetitive transcranial magnetic stimulation of the superior frontal gyrus modulates craving for cigarettes. Biol. Psychiatry 70: 794–799. 207. Hanlon C.A., Canterberry M., Taylor J., et al 2013. Functional and structural integrity of frontal-striatal circuits in cocaine users: an interleaved TMS-BOLD & DTI study: Abstract Biol. Psych. 73: 94S. 208. Hallett M. 2007. Transcranial magnetic stimulation: a primer. Neuron 55: 187–199. 209. Isserles M., Rosenberg O., Dannon P., et al 2011. Cognitive-emotional reactivation during deep transcranial magnetic stimulation over the prefrontal cortex of depressive patients affects antidepressant outcome. J. Affect. Disord. 128: 235–242. 210. Amiaz R., Levy D., Vainiger D., et al 2009. Repeated high-frequency transcranial magnetic stimulation over the dorsolateral prefrontal cortex reduces cigarette craving and consumption. Addiction 104: 653–660. 211. Moyer A., Finney J.W., Swearingen C.E. & Vergun P. 2002. Brief interventions for alcohol problems: a meta-analytic review of controlled investigations in treatment-seeking and non-treatment-seeking populations. Addiction 97: 279–292. 212. McGirr A., Van den Eynde F., Tovar-Perdomo S., et al 2015. Effectiveness and acceptability of accelerated repetitive transcranial magnetic stimulation (rTMS) for treatment-resistant major depressive disorder: an open label trial. J. Affect. Disord. 173: 216–220. 213. Baeken C., Marinazzo D., Wu G.-R., et al 2014. Accelerated HF-rTMS in treatment-resistant unipolar depression: Insights from subgenual anterior cingulate functional connectivity. World J. Biol. Psychiatry 15: 286–297. 214. Holtzheimer P.E., McDonald W.M., Mufti M., et al 2010. Accelerated repetitive transcranial magnetic stimulation for treatment-resistant depression. Depress. Anxiety 27: 960–963. 215. Cook I.A., Schrader L.M., DeGiorgio C.M., et al 2013. Trigeminal nerve stimulation in major depressive disorder: acute outcomes in an open pilot study. Epilepsy Behav. 28: 221–226. 216. Hamada M., Murase N., Hasan A., et al 2013. The role of interneuron networks in driving human motor cortical plasticity. Cereb. Cortex 23: 1593–1605. 217. Hamada M. & Ugawa Y. 2010. Quadripulse stimulation–a new patterned rTMS. Restor. Neurol. Neurosci. 28: 419–424. 218. Hamada M., Terao Y., Hanajima R., et al 2008. Bidirectional long-term motor cortical plasticity and metaplasticity induced by quadripulse transcranial magnetic stimulation. J. Physiol. 586: 3927–3947. 219. Grundey J., Thirugnanasambandam N., Kaminsky K., et al 2012. Neuroplasticity in cigarette smokers is altered under withdrawal and partially restituted by nicotine exposition. J. Neurosci. 32: 4156–4162. 220. Goldstein B.L. & Klein D.N. 2014. A review of selected candidate endophenotypes for depression. Clin. Psychol. Rev. 34: 417–427.

438
AppendixIII.This study was published in the Frontiers in Neuroscience:
Dunlop, K., Woodside, B., Downar, J. (2015). Targeting Neural Endophenotypes of Eating Disorders with Non-invasive Brain Stimulation. Frontiers in Neuroscience, (10): 30.
Abstract
Abstract
The term “eating disorders” (ED) encompasses a wide variety of disordered eating and compensatory behaviors, and so the term is associated with considerable clinical and phenotypic heterogeneity. This heterogeneity makes optimizing treatment techniques difficult. One class of treatments is non-invasive brain stimulation (NIBS). NIBS, including repetitive transcranial magnetic stimulation (rTMS) and transcranial direct current stimulation (tDCS), are accessible forms of neuromodulation that alter the cortical excitability of a target brain region. It is crucial for NIBS to be successful that the target is well selected for the patient population in question. Targets may best be selected by stepping back from conventional DSM-5 diagnostic criteria to identify neural substrates of more basic phenotypes, including behavior related to rewards and punishment, cognitive control, and social processes. These phenotypic dimensions have been recently laid out by the Research Domain Criteria (RDoC) initiative. Consequently, this review is intended to identify potential dimensions as outlined by the RDoC and the underlying behavioral and neurobiological targets associated with ED. This review will also identify candidate targets for NIBS based on these dimensions and review the available literature on rTMS and tDCS in ED. This review systematically reviews abnormal neural circuitry in ED within the RDoC framework, and also systematically reviews the available literature investigating NIBS as a treatment for ED.
Introduction
The term “eating disorders” (ED) encompasses a wide variety of disordered eating and compensatory behaviors that inappropriately alter the patient's body shape or weight, or the subjective experience of one's own body shape or weight. According to recent studies, the lifetime prevalence of EDs is 5.7% for females, and 1.2% in males (Golden et al., 2003; Hudson et al., 2007; Smink et al., 2014). The lifetime prevalence of the top three EDs according to the DSM-5 diagnostic criteria is 2.3, 1.7, and 0.8% for adolescent binge eating disorder (BED), anorexia nervosa (AN), and bulimia nervosa (BN), respectively (Golden et al., 2003; Hudson et al., 2007; Smink et al., 2014). BED is associated with recurrent episodes of binging, typically during negative affect (Leehr et al., 2015), and with the absence of inappropriate compensatory behaviors to avoid weight gain. Both AN and BN are associated with disturbances in the subjective experience of one's own body shape or weight; this phenotype is also known as body dysmorphia. BN is also defined by recurrent episodes of binge eating, with inappropriate compensatory behaviors to avoid weight gain; such behaviors include vomiting, excessive exercise, laxative misuse or diuretic misuse. In contrast, AN is defined by the persistent
439
restriction of food, an intense fear of gaining weight, and a significantly low body weight for one's developmental stage. AN has two subtypes, restricting (ANR) and binge-eating/purging (ANBP), with the latter distinguished from the former by the presence of binges and/or purges.
Despite a low lifetime prevalence rate relative to other psychiatric disorders, EDs carry a significant burden of illness, both socially and individually. Treatment capacity in specialized ED programs is presently inadequate to meet demand (Hart et al., 2011), and for patients who do manage to access specialized programs, economic difficulties and high costs often hamper treatment adherence (Gatt et al., 2014). EDs are also associated with a high mortality rate; for one, approximately 10% of AN sufferers will die within 10 years of disease onset (Sullivan, 1995). According to a recent meta-analysis, the overall standard mortality ratio (SNR) for AN is 5.86, higher than schizophrenia (2.8), bipolar disorder (2.1), and major depression (1.6) (Arcelus et al., 2011). Conventional ED treatments, including pharmacotherapy, and in- and out-patient behavioral therapies, are associated with suboptimal recovery rates (~50% for AN; ~45% for BN; ~50–70% for BED), high relapse rates (ranging from 9 to 65%), and high chronicity (~20% will develop a chronic disorder; Olmsted et al., 2005; Mitchell et al., 2007; Shapiro et al., 2007; Carter et al., 2012; Hay et al., 2012; Hilbert et al., 2012; Amianto et al., 2015). ANBP, in particular, has the poorest prognosis of the eating disorders (Steinhausen and Weber, 2009). EDs are also highly co-morbid with other psychiatric disorders, such as major depression and obsessive-compulsive disorder, whose presence negatively impacts treatment outcomes (Godart et al., 2003; Crane et al., 2007; Mischoulon et al., 2011). Thus, new treatment approaches are urgently needed, especially for the substantial proportion of ED patients who are unresponsive to conventional treatment strategies.
Neuromodulation technologies are beginning to emerge as a promising new treatment option for treatment resistant ED patients. The potential usefulness of these techniques was recently illustrated in a pilot study using subgenual cingulate deep brain stimulation (DBS) to achieve symptomatic improvements in severe and treatment-refractory AN (Lipsman et al., 2013). Although potentially powerful, DBS remains for the moment a fairly invasive treatment, and is available only to small volumes of patients in specialist neurosurgical centers. A more accessible alternative is non-invasive brain stimulation (NIBS), including techniques such as repetitive transcranial magnetic stimulation (rTMS) and transcranial direct current stimulation (tDCS). rTMS uses rapid pulses of an electromagnetic field to elicit action potentials in the target area of cortex. tDCS uses a weaker intensity electrical stimulus, delivered by scalp electrodes, to modulate cortical excitability in the underlying regions. Both NIBS strategies attempt to alter the cortical excitability of a target brain region to normalize particular disorder-specific phenotypes. Cortical targets are typically selected based on abnormal structural or functional attributes in the disorder relative to healthy controls. Appropriate cortical targeting using NIBS is critical for optimal treatment efficacy (Fox et al., 2013). Therefore, a proper understanding of the neural substrates, as well as the cognitive and behavioral phenotypes accompanying these substrates, is crucial for optimizing future treatments.
Two major issues associated with NIBS as a treatment for ED are the tremendous heterogeneity in the cognitive and behavioral phenotypes of patients within this illness category, and the dynamic course of the illness, in which patients can switch from one ED diagnosis to another over time (Garfinkel et al., 1995; Keel and Mitchell, 1997; Lilenfeld et al., 1998; Sullivan et al., 1998; Strober et al., 2000; Bulik et al., 2005; Milos et al., 2005). This
440
variability within a single diagnosis and this malleability of symptoms is a likely contributor to the limited clinical efficacy of NIBS (and in conventional treatments more generally) for ED.
Two possible solutions to address this heterogeneity are genomic methods, such as phenotypic linkage analyses, as well as neuroimaging methods. Such tools stratify patients on underlying behavioral, genetic, and neuropathological dimensions rather than self-reported symptoms alone. Therefore, these tools may be useful to identify the underlying behavioral and neuropathological endophenotypes related to more basic dimensions of behavior, independent of DSM-5 diagnoses. Such analyses and resulting endophenotypes can also be related to the behavioral and circuit-based dimensions of the recently described Research Domain Criteria (Insel et al., 2010) (RDoC). The RDoC is a recent strategy aimed at integrating basic neuroscientific knowledge with clinical diagnoses by first describing fundamental behaviors, described below, as dimensions. These dimensions are then used to describe the pathological behaviors of psychiatric disorders. By using the RDoC schema in combination with neuroimaging and phenotypic linkage methods, we may be able to identify sufficient stimulatory targets addressing specific phenotypes such as restrictive behavior or binging, regardless of DSM-5 diagnosis. For NIBS treatments, diagnostic systems must be capable of parsing this heterogeneity using endophenotypes so we may select the optimal stimulation target for a particular behavioral marker, or neural substrate.
Here, we will review NIBS as a treatment for the three most prevalent forms of ED: AN, BN, and BED. First, we will posit candidate dimensions as outlined by the RDoC and their underlying behavioral and neurobiological targets associated with ED as potential candidates for NIBS. Second, we will review the available literature on rTMS and tDCS as possible treatments for ED. Lastly, we will discuss the current limitations of the NIBS-ED field, and opportunities of future study and development.
GoingBeyondtheDSM-5Diagnosis:HowCanWeMaximizeEfficacy?
As discussed above, one of the major obstacles in ED diagnosis and treatment is the heterogeneity within each diagnostic category; conversely, comparisons of clinical and psychological features across patients suggest that there is significant overlap between ED diagnoses (Garfinkel et al., 1995; Lilenfeld et al., 1998; Sullivan et al., 1998; Strober et al., 2000). Compounding this problem is the evolution of the illness, such that patients may transition from one diagnostic category to another over time (Bulik et al., 2005). For example, it is estimated that approximately 50% of patients initially diagnosed with ANR will develop binge/purge behaviors, and approximately 30% of BN patients have a history of AN (Keel and Mitchell, 1997). In another study following DSM-IV-diagnosed AN and BN, only one third of subjects retained their original diagnosis after 30 months (Milos et al., 2005). To improve diagnostic consistency and treatment efficacy may require us to identify more stable, more granular, and more biologically based subgroups, or endophenotypes, within the ED population.
Some classification efforts have focused on a single DSM diagnosis. AN has been subdivided into 3 stable classes based on co-occurring symptoms: fat-phobic ANR, fat-phobic ANBP, and non-fat-phobic ANR (Wildes et al., 2013). BN has been subdivided based on
441
personality attributes (affective-perfectionistic, impulsive and low-comorbid psychopathology clusters Wonderlich et al., 2005) and based on presenting symptoms (binging, purging, and bingeing-purging, Striegel-Moore et al., 2005).
A number of latent class (LCA) and latent profile analyses (LPA) have been performed on symptomatic and personality factors to stratify endophenotypes spanning AN and BN. One symptom-based LCA found optimal fitting for a 4-group classification. ANR, ANBP/BN, ANR without OCD, and BN with only vomiting as purging were the four groups identified (Keel et al., 2004). Another symptom-based LPA identified 4 ED classes: binging with multiple types of compensatory behavior; binging with only vomiting as compensatory behavior; binging without purging; and low/normal weight with excessive exercise (Eddy et al., 2009).
As evidenced above, there now exist a variety of different proposals for how best to subcategorize ED patients, within and across DSM-5 diagnoses. How, therefore, can we converge upon a system that offers maximum clinical usefulness? One potentially fruitful method would be to better characterize the heterogeneity among ED patients in biological terms, using techniques such as positron emission tomography (PET), electroencephalography (EEG) and magnetic resonance imaging (MRI) to identify distinct neurobiological substrates underlying the different subgroups within ED. Clinical endophenotypes could then be tied to neurobiological substrates, which could in turn serve as targets for individually- or phenotypically-tailored treatment strategies.
Such an approach would also allow us to describe illnesses in dimensional rather than categorical terms. For example, the influential RDoC framework (Insel et al., 2010) includes dimensional constructs such as positive valence, negative valence, cognitive systems, social processes, and arousal and regulatory systems (for a review of how RDoC dimensions relate to ED neurobiology, see Wildes and Marcus, 2015, Table 1). Many endophenotypes, previously identified as symptom clusters in the ED population, can be framed parsimoniously as the result of pathology affecting these dimensions, either singly or in combination (Figure 1). An “RDoC formulation” of our ED endophenotypes carries the advantage of pointing toward specific cognitive processes, neural pathways, neurotransmitter systems, molecular targets, or genes that might be targeted for therapeutic effect. For the purposes of this review, we will confine our discussion to potential novel uses of NIBS to target specific neural pathways that are associated with RDoC constructs, as they relate to specific endophenotypes within the ED population.
RDoCDomainsasEDEndophenotypesandNIBSTargets
For the following section, a systematic review was completed using PubMed (NIH, http://www.ncbi.nlm.nih.gov/pubmed), with searches containing the following terms: first, clinical terms for the three ED diagnoses in this review (bulimia nervosa, anorexia nervosa, and binge eating disorder), and second, RDoC related terms as discussed in a recent review on RDoC cognitive systems (Morris and Cuthbert, 2012).
NegativeValenceSystems
442
Negative valence systems are activated in response to aversive stimuli, and include fear, anxiety and loss-related behaviors. In a recent meta-analysis investigating neural activations for negative and positive affect, negative valence was associated with greater activation in the amygdala and anterior insula (Lindquist et al., 2015). The lateral orbitofrontal cortex (OFC) is also associated with negative valence, particularly during the anticipation and receipt of punishment (Ursu et al., 2008).
A number of studies support the role of negative valence systems in ED, mainly in behaviors associated with negative affect, sensitivity to punishment, anxiety, harm avoidance, and response to the receipt of punishment (Figure 1). For example, behavioral measures of negative affect and negative urgency are the two most predictive features before a binge episode in both BED and BN (Bohon and Stice, 2012; Berg et al., 2015; Leehr et al., 2015; Racine et al., 2015). On functional neuroimaging, BN patient reported negative affect is related to neural responsivity during the anticipation of a food reward in both the striatum and insula (Bohon and Stice, 2012). This relation suggests that negative affect and food-reward are inappropriately coupled in this disorder. More generally, BN patients also have higher neural responses to negative body image descriptors (Miyake et al., 2010), in areas associated with the regulation and inhibition of fear and emotional processing circuits, including the dorsomedial prefrontal cortex (DMPFC) (Kühn et al., 2011; Åhs et al., 2015). These findings shed light on the role of negative attentional bias in the psychopathology of bulimic-type disorders.
Restrictive subtypes of ED also show hypersensitivity on measures related to negative valence systems. Behaviorally, exaggerated harm avoidance and sensitivity to punishment are typically associated with forms of AN (Harrison et al., 2010). Similarly, on fMRI, AN patients display increased neural activation in right anterior insula and DLPFC during pain anticipation, and exaggerated responses to punishment (pain and monetary losses) in the DLPFC, and the anterior, mid-, and motor cingulate (Bischoff-Grethe et al., 2013; Strigo et al., 2013; Bar et al., 2015). Cowdrey and colleagues also found an exaggerated response to an aversive taste and sight of food in the insula, striatum and ACC (Cowdrey et al., 2011). Trait-anxiety is also a common feature of AN, and is associated with the exaggerated activity of fear-related circuits to food and body-related cues. Regions of exaggerated response to symptom-provoking stimuli include the amygdala, hippocampus, insula, ACC, and medial PFC (Ellison et al., 1998; Frank et al., 2002, 2012b; Seeger et al., 2002; Uher et al., 2004; Friederich et al., 2010; Vocks et al., 2010). Finally, at the receptor level, PET imaging reveals increased striatal dopamine binding potential and altered cingulate serotonergic (increased 5-HT1A, but decreased 5-HT2A) binding potential is associated with harm avoidance in AN (Bailer et al., 2004, 2007; Frank et al., 2005).
SummaryofPotentialNegativeValenceTargets
Both bulimic and restrictive-type EDs display some form of negative valence abnormality on behavioral and neuroimaging modalities (Figure 2). In ED with a binging component, it appears that negative affect and food-reward responsivity are intimately coupled via the exaggerated response of the amygdala, insula and DMPFC. Restriction-related EDs display a similar pattern in the amygdala, right anterior insula, DLPFC and mPFC accompanying aspects of harm avoidance and receipt of punishment. Frontal regions, particularly the medial PFC and DMPFC, are thought to inhibit activity of the basolateral amygdala (BLA) (Cho et al., 2013; Felix-Ortiz et al., 2015).
443
Hyperactivation of the DMPFC, DLPFC, and anterior insula during negative valence paradigms has two possible interpretations. First, these areas may be inhibiting BLA activity, but insufficiently, in which case excitatory stimulation may be beneficial. Alternatively, these areas may actually be inappropriately driving BLA activity in a top-down fashion, in which case inhibitory stimulation would be preferable. A key study illustrated these opposite mechanisms in emotion regulation in healthy controls vs. MDD patients (Johnstone et al., 2007): during emotional reappraisal, limbic frontal regions suppressed amygdala activity in controls, but counterproductively increased amygdala activity in MDD.
For NIBS interventions, direct suppression of the amygdala is challenging due to its deep location; strategies aimed at damping negative valence systems will therefore likely target in prefrontal cortex and insula. Excitatory prefrontal NIBS has been recently shown to attenuate amygdala-dependent negative processing in healthy controls (Baeken et al., 2010; Guhn et al., 2014), and this strategy may be best in “bottom-up” pathology, where emotional reappraisal/self-regulation systems are underactive rather than pathologically hyperactive (i.e., in BN and BED). Conversely, where negative valence systems are driven by “top-down” pathology, and self-regulation is if anything excessive, inhibitory stimulation may be preferable. Inhibitory NIBS of the DMPFC and lateral OFC both show promise in obsessive-compulsive disorder (Mantovani et al., 2010; Nauczyciel and Drapier, 2012; Dunlop K. et al., 2015), and these strategies may be better suited to AN-R, particularly in cases with comorbid OCD.
PositiveValenceSystems
Positive valence systems encompass neural circuits related to motivation, reward seeking, and habit formation behaviors. According to a recent meta-analysis in healthy controls, positive stimuli are associated with activity in the VMPFC and ACC (Lindquist et al., 2015). All three major EDs, AN, BN, and BED, have been previously shown to be altered in this dimension (Figure 1).
From a behavioral perspective, AN patients show diminished sensitivity to conventional reward, as evident on psychometric measures (Harrison et al., 2010; Glashouwer et al., 2014) and delay discounting tasks (Steinglass et al., 2012). From a neurobiological perspective, ANR patients likewise display a blunted neural response to food reward in the insula and striatum (Wagner et al., 2008), decreased response to food images in the insula (Holsen et al., 2012; Oberndorfer et al., 2013b), and altered striatal activation during a reward-learning paradigm (Wagner et al., 2007). In a recent fMRI study of delay discounting in AN patients and healthy controls, AN patients had a marked preference for delayed rewards, associated with lower activation in the striatum and dorsal ACC during decision-making; these behavioral and neural abnormalities normalized to control levels after treatment (Decker et al., 2014). However, another study found that weight restoration did not affect choice behavior on a delay discounting task (Ritschel et al., 2015), suggesting that a preference for delayed over immediate rewards may be an endophenotypic feature in low-BMI individuals. In either case, the identified striatal and prefrontal regions are all involved in the motivational aspect of reward and food-reward processing.
There is also evidence that reward evaluation is altered in AN, in which secondary (contextual) rewards such as exercise and dietary restriction carry higher reward value relative to food or other primary rewards (Schebendach et al., 2007; Klein et al., 2010). The so-called
444
“reward contamination theory” of AN posits a pathological re-configuration of the patient's reward system through stress-induced activation of the mesolimbic dopamine system, via ventral tegmental area opioid receptors. In this framework, AN behaviors essentially represent a maladaptive, but well-entrenched type of habit-formation (Keating et al., 2012; Walsh, 2013).
The findings that support this theory suggest that there is altered motivational salience for disease-related stimuli. For example, AN patients tend to rate physical exercise as “pleasant,” more so than food (Giel et al., 2013). In fact, food-reward in AN activates a weight-gain fear response (i.e., negative valence systems) in the amygdala and extrastriate body rather than positive valence systems from the striatum, orbitofrontal cortex, and ACC (Vocks et al., 2011). The DLPFC is also hyperactive in response to images of food and the anticipation of reward, suggesting the presence of enhanced cognitive control over food cues and reward (Ehrlich et al., 2015; Sanders et al., 2015). ANR patients also have a high prevalence of comorbid OCD (Torresan et al., 2013). The level of compulsivity predicts the reactivity of the superior frontal gyrus, ACC and striatum and deactivation of the PFC to images of high-calorie foods (Rothemund et al., 2011), and lowered right DLPFC activity is seen in response to obsessive-compulsive symptom provocation in AN (Suda et al., 2014). Thus, hypofunctioning of primary reward systems (and potentially, hyperfunctioning of secondary/contextual reward systems) may be important target processes in ANR.
In contrast disorders in the BN/BED spectrum are often associated with elevated primary reward valuation and reward sensitivity. These are typically associated with a higher willingness to work for a food reward (Schebendach et al., 2013), as well as higher impulsivity (Manwaring et al., 2011; Chan et al., 2013; Mole et al., 2015) At the neural level, BN and BED patients show increased activity for reward receipt in areas including the medial OFC, ventral striatum and insula (Schienle et al., 2009; Frank et al., 2011, 2012a; Radeloff et al., 2012; Weygandt et al., 2012; Oberndorfer et al., 2013a). BED patients display hyperactivations in the ventral striatum and inferior frontal gyrus during reward anticipation, and reduced medial PFC activity during a monetary incentive delay task (Balodis et al., 2014, 2013a). On PET imaging, areas like the insula, PFC and ventral striatum, associated with reward-motivation and food-reward processing, have altered serotonergic and dopaminergic binding in BN (Broft et al., 2012; Galusca et al., 2014). An important associated feature may also be deficient behavioral self-regulation and impulsivity. BN patients also show reduced activation in anticipation of a food reward is seen in ACC and right anterior insula; lower ACC activity predicts how much the patient will overeat (Frank et al., 2006; Bohon and Stice, 2011). Parallels have been drawn between the neural substrates of BN/BED and addiction, due to the similar alterations to motivation and reward-related circuitry on fMRI and task-based paradigms between the two psychopathologies (Filbey et al., 2012).
SummaryofPotentialPositiveValenceTargets
In terms of positive valence systems, it appears that both restrictive and binging phenotypes of ED display alterations in incentive salience that is potentially modulated by the opioid system (Keating et al., 2012; Giuliano and Cottone, 2015; Figure 3). In the case of ANR, conventional primary rewards appear to be devalued in favor of pathological secondary or contextual rewards, such as starvation and excessive exercise. A broader preference for long-term/contextual over immediate primary rewards is also apparent in choice behavior during delay discounting. Neurally, the primary reward systems of the ventral striatum and ventromedial
445
prefrontal cortex appear hypoactive, while contextual or secondary reward systems operating through lateral orbitofrontal and lateral temporal regions appear hyperactive. Hyperactivity in lateral orbitofrontal pathways is also strongly associated with OCD, and with compulsivity in general (Ahmari et al., 2013; Beucke et al., 2013). This finding would be consistent with the broader phenotype of ANR. Neurally-based strategies in ANR might therefore include enhancing primary reward value via medial prefrontal-striatal pathways, or attenuating secondary reward value via lateral prefrontal-striatal pathways. For instances where conventional rewards are less valued than maladaptive ones (restrictive, fat-phobic ED), inhibitory NIBS over lateral networks for maladaptive secondary rewards, and excitatory NIBS over medial networks for conventional rewards, may be a possible therapeutic protocol to realign incentive-salience mechanisms to normal, adaptive functioning.
In the case of binge/purge-related EDs, repeated exposures to the transient reward value of food intake (or the transient anti-anxiety effect of purging) would cause these behaviors to acquire pathologically high incentive value (especially in the presence of negative urgency), via neural mechanisms that parallel those of addiction. Effective strategies would therefore parallel those for substance addiction: enhancing cognitive/impulse control over urges to binge and purge, or suppressing urge intensity.
NIBS strategies for enhancing cognitive control involve excitatory stimulation of the nodes of the salience network, including the DLPFC, dACC, and insula (Dunlop et al., accepted). Each of these targets have demonstrated efficacy in substance dependence (Mishra et al., 2010; De Ridder et al., 2011; Meng et al., 2014), with effects apparently mediated by enhanced control rather than reduced urge. Recently, excitatory rTMS over the dACC has been reported to reduce symptoms in treatment-resistant binge/purge ED, via enhanced integrity of frontostriatal circuits in the salience network (Dunlop K. et al., 2015).
NIBS may also be capable of suppressing urge, by targeting frontopolar and ventromedial sites. In one preclinical rTMS study, substance use disorder patients underwent inhibitory rTMS over the ventral frontal pole during a task evoked a cue-related craving response. A single session of inhibitory rTMS reduced the severity of craving in this group relative to sham, and stimulation proved capable of engaging core reward nodes in the ventral striatum, as well as the associated ventromedial prefrontal regions (Hanlon et al., 2013, 2015). Urge suppression via inhibitory ventromedial prefrontal stimulation has yet to be attempted in ED, but would be a reasonable strategy to complement excitatory salience-network stimulation in binge/purge-related ED populations.
CognitiveSystems
The cognitive systems dimension refers to processes responsible for cognitive processing, including attention, perception, memory, language, and cognitive control. In healthy control studies, these behaviors are associated with activity in the DMPFC, DLPFC, and anterior insula (Albares et al., 2014; Cho et al., 2014; Luo et al., 2014; Reineberg et al., 2015). These networks tend to be associated with the central executive and salience resting-state networks (Reineberg et al., 2015), responsible for response selection and inhibition.
Abnormal cognitive control mechanisms are evident in most ED populations (Figure 1). On the one hand, BN and BED-type diagnoses tend to display reduced capacity for impulse and
446
cognitive control. This is particularly evident for disease-relevant stimuli (Wu et al., 2013), but is also apparent for positive and negative emotional valence images (Tapajóz P de Sampaio et al., 2015), suggesting a broader endophenotype of deficient cognitive and behavioral control. In fact, binge episodes are partially defined by the individual's loss of control during eating, and impulse control disorders (ICD) are common comorbidities (Fernández-Aranda et al., 2008). Purging behaviors are also associated with higher levels of impulsivity, and different forms of purging may represent separate manifestations of compulsivity and impulsivity (Hoffman et al., 2012).
On the other hand, restrictive-type EDs tend to show a different profile of cognitive control abnormalities. Cognitive control capacity may appear above normal levels in certain domains, such as temporal discounting (Steinglass et al., 2012). However, cognitive control may be abnormal in certain specific domains related to the illness; for example, for negative valence images (Tapajóz P de Sampaio et al., 2015), food stimuli (Oberndorfer et al., 2013b; Sanders et al., 2015), or body-image-related stimuli (Lee et al., 2014). AN patients also have altered cognitive control depending on the reward valence of the object, as the impulse control networks are overly activated for physical exercise relative to food images in a go/no-go task (Kullmann et al., 2014). AN patients also show a reduced ability to switch to an optimal decision-making strategy, called cognitive flexibility (Zastrow et al., 2009).
From a neural perspective, impulsive-type deficits on response control tasks are related to lower frontostriatal activations. BED patients show reduced activity in the inferior frontal gyrus, ventromedial PFC and insula during the Stroop task, and this diminished activity is associated with poor dietary restraint (Balodis et al., 2013b). BED prefrontal hypoactivity has also been correlated with psychometric measures of attentional impulsiveness and a disease-relevant go/no-go task (Hege et al., 2014). BN patients show hypoactivity in frontostriatal circuitry during cognitive control tasks like the Simon Spatial Incompatibility task; affected areas include the inferior frontal gyrus, striatum, ACC, OFC, DLPFC, and middle frontal gyrus (Marsh et al., 2009, 2011; Celone et al., 2011). On the go/no-go task, adolescent BN and ANBP patients display hyperactivations in the ACC and right DLPFC, albeit without impaired task performance relative to controls (Lock et al., 2011).
AN patients also show hypoactivity in frontostriatal circuits from the medial PFC on a response inhibition task related to cognitive control deficits (Oberndorfer et al., 2011; Wierenga et al., 2014), but hyperconnectivity to a response inhibition task that used exercise-related stimuli as its cue (Kullmann et al., 2014). Additionally, AN patients also display poorer performance on cognitive flexibility tasks, and this performance is reflected by lower activity in frontostriatal circuits through the thalamus, ventral striatum, ACC, middle frontal gyrus, and ventrolateral PFC (Zastrow et al., 2009; Sato et al., 2013; Garrett et al., 2014; Wildes et al., 2014; Lao-Kaim et al., 2015). On resting-state fMRI, higher thalamo-cortical functional connectivity through the DLPFC and anterior PFC is associated with poorer performance on the Stroop task and working memory (Biezonski et al., 2015). Thus, domain-specific abnormalities of cognitive control are evident at both the behavioral and the neural level in AN.
SummaryofPotentialCognitiveControlTargets
Both restricting- and binge/purge-type EDs show deficits on tasks related to cognitive control, including behavioral inhibition, working memory, selective attention, and cognitive flexibility (Figures 1, 4). Generally, BED displays poorer response inhibition and lower activity
447
in the inferior frontal gyrus and ventromedial PFC, both of which are accessible via excitatory forms of NIBS. BN and ANBP display lower activity in the inferior frontal gyrus, ACC, OFC, and DLPFC; all but the OFC are easily accessible for excitatory NIBS. As noted earlier, excitatory NIBS of salience-network nodes in DLPFC, DMPFC, and anterior insula appears to improve cognitive control and impulsivity even in healthy controls (Cho et al., 2014, 2010; Meng et al., 2014). Enhanced cognitive control, via improved frontostriatal connectivity through these salience-network nodes, may mediate recently reported improvements in binge and purge behaviors with excitatory DMPFC-rTMS (Dunlop K. et al., 2015). Similar effects via similar mechanisms should be expected for excitatory rTMS targeting DLPFC and anterior insula.
For AN, neural correlates of cognitive control show considerable variability depending on the task and valence of stimuli. On the one hand, AN patients in some studies show broad deficits of cognitive control and flexibility, and hypoactivity of the frontostriatal circuitry, during many tasks related to cognitive control; hence, excitatory NIBS might be beneficial if combined with cognitive tasks during stimulation. On the other hand, patients sometimes show the reverse pattern of hyperconnectivity and excessive cognitive control/compulsivity in these same circuits, within illness-specific domains; excitatory stimulation may therefore be unhelpful, or could potentially exacerbate illness. In keeping with this concern, high-frequency DMPFC-rTMS was recently reported to exert a paradoxical inhibitory effect on frontostriatal connectivity in a subpopulation of ED patients with high baseline connectivity; these patients showed symptomatic worsening rather than improvement (Dunlop K. et al., 2015). Thus, targeting cognitive control in AN-R may require a more nuanced approach than is the case for binge-purge symptoms.
SocialProcessingSystems
Social processing systems refer to circuits involved in social communication, and the perception and understanding of oneself and others. Targets identified in healthy controls include the insula, responsible for interoception (Craig, 2002); the temporoparietral junction, for theory of mind-related processing (Saxe and Kanwisher, 2003); and higher-order visual processing regions, for processing one's own and others' faces (Hummel et al., 2013).
This dimension has received less attention in the ED literature relative to positive/negative valence systems and cognitive control (Figure 1). However, it may have relevance in AN patients, who show higher levels of alexithymia, deficits in visceral sensory perception or “interoception” (Craig, 2002; Strigo et al., 2013), and distorted perceptions of body shapes (Suchan et al., 2013). AN patients with higher levels of alexithymia show lower ACC, PCC, and right temporoparietal junction (TPJ) activation during social decision-making tasks (Miyake et al., 2009, 2012; McAdams and Krawczyk, 2011). More specifically, ANR patients display altered anterior and dorsal mid-insula activations based on the modality of interoception they are attending to (Kerr et al., 2015). On resting-state fMRI, AN patients also display increased functional connectivity from the anterior insula to the default mode network associated with self-reported problems with interoceptive awareness, suggesting a heightened level of cognitive control toward interoceptive processes (Boehm et al., 2014). AN patients also have altered neural responses to visually-presented body shapes, particularly in areas associated with visual processing and reward: the ventral striatum, extrastriate body area (EBA), DLPFC, parietal regions, medial PFC, and fusiform gyrus (Cowdrey et al., 2012; Spangler and Allen,
448
2012; Castellini et al., 2013; Fladung et al., 2013; Suchan et al., 2013; Suda et al., 2013; Fonville et al., 2014). Finally, two recent studies have also identified areas of abnormal activation in response to benevolent and malevolent social relationships. During benevolent social relations, AN patients tend to display reductions in DMPFC, possibility related to lowered reward valence for social reward and interaction (McAdams et al., 2015; Via et al., 2015).
In summary, AN patients may show deficits across multiple domains related to self-perception (alexithymia, interoception, and body shape perception) and social function (interpersonal interaction, theory of mind; Figures 1, 5). The latter function has been successfully enhanced with excitatory DMPFC-rTMS in autism-spectrum disorder (Enticott et al., 2011, 2014). During social interactions, AN patients likewise tend to display DMPFC hypoactivity during social interaction, and so excitatory stimulation over this region may worth exploring. For self-perception, relevant targets include anterior insula (alexithymia), posterior insula (interoception), TPJ and EBA (social cue perception, body shape perception). NIBS has successfully targeted each of these regions in other applications (Ciampi de Andrade et al., 2012; Dinur-Klein et al., 2014; Donaldson et al., 2015). Excitatory stimulation of the insula and TPJ may be worth exploring for alexithymia and deficits in interoception. Conversely, inhibitory stimulation of the TPJ and EBA may be worth exploring for aberrant self- and body perception.
NIBSTechniquesasTherapeuticInterventionsinED
For the following section, a systematic review was completed using PubMed (NIH, http://www.ncbi.nlm.nih.gov/pubmed), with searches containing the following terms: first, clinical terms for the three ED diagnoses in this review and related phenotypes (BN, AN, BED, binging, purging, excessive exercise), and second, NIBS related terms (rTMS, TMS, tDCS).
NIBSOverview:rTMSandtDCS
rTMS applies powerful, focused magnetic field pulses over the scalp to elicit action potentials in the underlying region of cortex. Typically, treatment sessions occur once daily, for a total of 20–30 daily sessions (Carpenter et al., 2012; Solvason et al., 2014). rTMS mechanisms are thought to involve synaptic plasticity via long-term potentiation or depression, with the direction of effect dependent on the stimulation intensity, duration, and pattern (Pascual-Leone et al., 1998; Maeda et al., 2000). Higher frequency stimulation (5–20 Hz) is usually considered to be excitatory, while low frequency (< 1 Hz) stimulation is considered inhibitory (Pascual-Leone et al., 1994; Chen et al., 1997). More recently, however, considerable heterogeneity on electrophysiological, neuroimaging, and clinical measures has been found for most if not all patterns of rTMS (Maeda et al., 2000; Eldaief et al., 2011; Dunlop K. et al., 2015; Dunlop K. et al., 2015; Nettekoven et al., 2015).
tDCS, on the other hand, uses a constant, low amplitude current to modulate cortical excitability, rather than eliciting action potentials directly. As with rTMS, sessions typically occur daily, for a total of 10–30 sessions (Meron et al., 2015). While the mechanisms of tDCS are still debated, it is likely that modulated cortical excitability also elicits subtle effects on synaptic plasticity via long-term potentiation and depression (Brunoni et al., 2012). Anodal
449
stimulation is considered excitatory, and cathodal stimulation inhibitory. However, as with rTMS, both types of tDCS display considerable inter-individual variability in their effects (Wiethoff et al., 2014). Newer variants such as transcranial alternating current stimulation (tACS), may exert more consistent, frequency-specific effects (Voss et al., 2014); however, their therapeutic potential is poorly understood at present.
NIBSasaTreatmentforBEDandFoodCraving
To date, the majority of published NIBS-ED studies have focused on female patients with abnormally high food craving or urge to eat, as opposed to a specific formal DSM-5 diagnosis (Tables 2, 3; McClelland et al., 2013; Grall-Bronnec and Sauvaget, 2014; Val-Laillet et al., 2015). These preclinical studies typically involve a single session of stimulation, with subjectively rated cue-induced craving as the primary outcome. With rTMS, two studies reported contradictory results for 10 Hz stimulation of the left DLPFC rTMS: one study (n = 28) found decreased craving after active vs. sham stimulation (Uher et al., 2005), while the other (n = 10) found that active stimulation was no better than sham in terms of cue-induced craving control (Barth et al., 2011). The studies differed in stimulation parameters, however, and enrolled only healthy participants who self-reported having strong food cravings, but did not carry a formal ED diagnosis. Hence, it may be difficult to extrapolate these findings to the effects of a full therapeutic course of 20–30 sessions in patients with pathological deficits of self-control and a formal ED diagnosis.
There is also a growing body of literature investigating DLPFC-tDCS as a method to reduce craving and food intake. In four published studies recruiting individuals with strong food cravings, a single session of anodal right DLPFC/cathodal left DLPFC tDCS was able to reduce cue-induced craving, reduce food intake, and improve the participants' ability to resist food relative to sham-tDCS (Fregni et al., 2008; Goldman et al., 2011; Kekic et al., 2014; Lapenta et al., 2014). Future work involving tDCS should employ multiple sessions as opposed to a single session in a randomized, sham-controlled setting, as a treatment for the inappropriate eating patterns associated with BED. Studies in populations carrying a formal ED diagnosis, with significant functional impairment and distress, are also needed.
NIBSasaTreatmentforBN
The earliest publication of rTMS as a potential treatment for BN is a case report of a patient diagnosed with comorbid depression and BN who achieved an unexpected remission of binge and purge symptoms and depressive improvements after 10 sessions of 20 Hz rTMS over the left DLPFC (Hausmann et al., 2004; McClelland et al., 2013; Table 2). Follow-up studies involving high frequency left DLPFC rTMS have been mixed: one group found that a single session reduced the urge to eat, the number of binges 24 h post-rTMS, and salivary cortisol levels (Van den Eynde et al., 2010; Claudino et al., 2011), while another study found no difference between active- and sham-rTMS after 15 sessions of 20 Hz rTMS over the left DLPFC (Walpoth et al., 2008). A more recent study applied a single session of excitatory left DLPFC-rTMS in 8 female patients with BN, and reported reduced subjective ratings of craving post-rTMS, along with lower cerebral oxygenation in the DLPFC on near-infrared spectroscopy (Sutoh et al., 2016). These findings hint at the potential promise of DLPFC-rTMS for BN, which would be in keeping with the much more extensive literature demonstrating that this intervention enhances cognitive control in healthy subjects (Cho et al., 2010), and patient populations (Van

450
den Eynde et al., 2010), with therapeutic effects in mechanistically related disorders such as addiction (Gorelick et al., 2014).
More recently, our group has shifted the rTMS stimulation target from the DLPFC to the DMPFC, as a potential treatment for major depression (Downar et al., 2014; Salomons et al., 2014; Bakker et al., 2015). As with first case report of DLPFC-rTMS for BN, we too found an unexpected remission of chronic treatment refractory binge and purge symptoms in an MDD patient with comorbid BN, following 20 sessions of 10 Hz DMPFC-rTMS. The onset of effect was rapid, occurring in the first week of treatment, and was maintained for 9 weeks post-treatment (Downar et al., 2012). In a follow-up, open-label series of 10 Hz DMPFC-rTMS in 28 ED patients with binge/purge behaviors, we noted ≥ 50% symptom reduction in 57%. On resting-state fMRI, we found increased resting-state functional connectivity in fronto-striatal salience network circuits (through DMPFC, anterior insula, and ventral striatum) specifically in the treatment responders but not non-responders (Dunlop K. et al., 2015), consistent with similar findings for DMPFC-rTMS in MDD and obsessive-compulsive disorder (Salomons et al., 2014; Dunlop K. et al., 2015). These findings suggest that DMPFC-rTMS may improve bulimic symptoms through an improvement of top-down cognitive control over urges, via frontostriatal circuits through salience-network nodes. Future work should include a sham-controlled arm, along with behavioral measures to better characterize the cognitive domains mediating the therapeutic effects of DMPFC-rTMS in BN.
NIBSasaTreatmentforAN
To date, there are few published sham-controlled trials on tDCS and rTMS as treatments for AN (Bainbridge and Brown, 2014; McClelland et al., 2013). One preclinical study in a small sample of AN patients (n = 10) applied a single session of 10 Hz left DLPFC-rTMS, with patients reporting less anxiety and less feeling full and feeling fat (Table 2; Van den Eynde et al., 2013). An open-label case series in 5 AN patients applied 20 sessions of excitatory DLPFC-rTMS, reporting improvements in anxiety, feeling fat/full and urge to restrict/exercise over the course of treatment, enduring to 6 months; however, these effects had waned by 12-months post-treatment (McClelland et al., 2016). Another open-label series in 7 AN patients applied 10 sessions of anodal left DLPFC tDCS (Table 3), reporting improvements on the Eating Disorders Inventory (EDI) and the Eating Attitude Test (EAT) (Khedr et al., 2014). Although, these early publications are promising, further preliminary work in larger groups, with a longer course and sham control, must be performed to determine whether rTMS and tDCS are efficacious treatments for AN.
ConsiderationsforFutureStudies
PatientSelection
In an attempt to limit heterogeneity, inclusion criteria for NIBS studies in ED patients are often based on DSM-5 diagnostic categories. However, as noted above, DSM-5 diagnoses still encompass substantial heterogeneity, and may conflate neurobiologically distinct endophenotypes. Future studies enrolling ED patients for NIBS trials should make efforts to at
451
least characterize the underlying phenotypes within the clinical populations they are treating, and ideally should target a specific endophenotype associated with a specific neural substrate. Such studies should also measure behavioral or biological markers of this endophenotype to assess whether the target process was successfully engaged, and whether the engaged process did indeed mediate any observed symptomatic improvements.
InterventionParameters
Several treatment parameters are important to consider when designing NIBS studies in ED. First, treatment parameters (protocol, total number of sessions, and number of sessions per day) needs to be selected, keeping in mind both patient convenience and therapeutic efficacy. In the older MDD-NIBS literature, 20–30 sessions of once daily rTMS is the standard protocol, with sessions lasting up to 45–60 min. However, such schedules are onerous for patients and limit overall clinic capacity. More recent studies have begun to explore much briefer protocols, such as 1–3 min theta-burst stimulation (Li et al., 2014), which have been reported to achieve equivalent or superior outcomes (Bakker et al., 2015). Other protocols, such as quadripulse stimulation (QPS), have been reported to achieve much more consistent effects across individuals (Huang et al., 2005; Tsutsumi et al., 2014). Still other recent MDD trials have delivered multiple sessions per day (up to five sessions a day), to complete the full course in 4–10 days rather than the usual 4–6 weeks (Holtzheimer et al., 2010; Baeken et al., 2014). Future ED rTMS trials should make use of these innovations to reduce patient burden, increase capacity or consistency, and accelerate the pace of improvement.
ConcurrentTasksorTherapies
Another consideration for NIBS trials for ED is whether stimulation should be applied concurrently with psychotherapy or a specific cognitive/behavioral task, as opposed to simply during rest. This is especially the case if NIBS protocols are designed based on RDoC dimensions, and targets cortical regions based on abnormal activation on certain tasks. As discussed above, many areas, including the ACC/mPFC, DLPFC, insula, inferior frontal gyrus, and ventrolateral PFC are hyperactive to some tasks, but hypoactive in others. With stimulation during rest, it is difficult to assess or constrain the activation state of the underlying cortical target. Having the patient perform illness-specific cognitive task has now been shown to enhance (or reduce) the therapeutic effects of rTMS across several different indications. For example, reading trauma-related scripts during rTMS enhanced efficacy for PTSD (Isserles et al., 2013); undergoing rTMS in the presence of substance cues enhances efficacy in addiction (Dinur-Klein et al., 2014). Analogous approaches may be helpful in ED.
TreatmentTarget
A final consideration for ED-NIBS concerns the feasibility of the proposed target. Although, targets such as DLPFC, DMPFC, OFC, and TPJ have now been targeted in a variety of studies, others such as ventromedial prefrontal cortex or anterior insula may be difficult to reach without specially designed coils, and without also stimulating overlying structures. More feasibility studies are needed to assess how well that these areas can be engaged with rTMS and tDCS (Chib et al., 2013).
452
Another consideration during target selection is determining the appropriate stimulation intensity in the case of rTMS. For example, treatment intensity is determined by measuring the resting motor threshold of region of cortex directly posterior to stimulation site; in these cases, resting motor threshold is determined by the activation of the thumb or big toe for DLPFC and DMPFC, respectively (Schutter and van Honk, 2006; Hallett, 2007). It is therefore unclear for novel stimulatory sites what would be the most appropriate and reliable sites to determine optimal stimulation intensity. Studies using finite element modeling may also be helpful for optimizing stimulator placement and intensity (Nitsche et al., 2012).
The effects of rTMS also dramatically decrease the farther the site is from the scalp surface (Kozel et al., 2000), and so it is likely that stimulation intensity will have to be quite large for deep targets such as anterior insula or VMPFC. If this is the case, it is likely that pain tolerability will be a factor. In addition, trigeminal nerve pain, scalp pain, and headaches are common adverse effects associated with rTMS (Machii et al., 2006; Rossi and Hallett, 2009). Tolerability will need to be maintained when stimulating these novel targets, particularly in scalp regions with trigeminal innervation, such as the frontopolar, orbitofrontal, or temporopolar regions. This may be challenging for more intense rTMS protocols, although helmet-shaped “deep TMS” coil geometries may be somewhat helpful in allowing deep stimulation of these regions while maintaining tolerability (Roth et al., 2007). Certain targets (e.g., OFC, frontopolar cortex) may be more amenable to tDCS, which is relatively painless compared to rTMS. Another non-invasive technique worthy of future investigation is cutaneous non-invasive vagus nerve stimulation, which is also delivered via external electrodes. Its more invasive counterpart, surgically-implanted vagus nerve stimulation has recently shown some efficacy for medication-resistant depression (Ben-Menachem et al., 2015; Grimonprez et al., 2015).
Finally, stimulating multiple targets in a single session might be the optimal way to address all the abnormal behavioral dimensions in a given ED patient. Different ED symptom dimensions map to different cortical targets, and so confining stimulation to a single target may be insufficient to address multi-dimensional ED pathology. For example, in BN, excitatory stimulation of the DMPFC/insula combined with inhibitory stimulation of the VMPFC may be a more optimal strategy for enhancing cognitive control while reducing urge intensity. “Deep TMS” coils have been designed to stimulate multiple targets simultaneously (Dinur-Klein et al., 2014), and multi-channel coils allow different protocols at different targets simultaneously (Roth et al., 2014). However, the therapeutic effects of sequential vs. simultaneous stimulation have not yet been compared directly. Further research should be done to describe the safety, tolerability, clinical efficacy, and neural mechanisms of stimulating multiple targets, either sequentially or simultaneously.
Conclusion
Neuroimaging, psychometric, and behavioral findings are converging upon a new approach to classifying psychiatric disorders, including EDs, in terms of endophenotypes or symptom dimensions. New proposed frameworks, such as the RDoC, seek to describe EDs in terms of dysfunction in specific underlying brain functions such as cognitive control, positive and negative valence, and social/self-related cognition. These functions in turn are gradually
453
being linked to specific neurobiological processes, described at multiple levels spanning clinical symptomatology, behavioral task performance, neuroimaging studies of macro-scale network function, and cellular, molecular, and genetic mechanisms. With the advent of anatomically focal NIBS interventions, a “neuroanatomical formulation” of ED pathology may become relevant not only for basic science, but for clinical care.
At present, neuroanatomical, endophenotypic, and RDoC formulations of ED pathology must be considered tentative and preliminary. However, from available literature, it does appear that some of the tremendous and dynamic heterogeneity of symptoms in the ED population can be understood parsimoniously in terms of dysfunction in a few key cognitive systems and their associated neural circuits. For example, in BN and BED, binge and purge behaviors may acquire pathologically strong incentive salience by mechanisms similar to addiction; impaired cognitive control in turn renders binge/purge urges hard to resist, particularly during negative affect. NIBS strategies designed for addiction (e.g., enhancing cognitive control via salience-network stimulation and damping urge intensity via ventromedial stimulation) may be helpful in this setting. In ANR, this strategy may be less helpful; instead, targeting pathologically overactive negative-valence systems may address the excessive valuation of secondary over primary rewards, and the underlying compulsivity. NIBS strategies developed for OCD (such as inhibitory stimulation of the OFC and DMPFC) may be more helpful in this setting. Ancillary NIBS strategies for AN may also target distortions of body image, alexithymia, and deficits of interoception via insular, TPJ, and EBA stimulation. However, it must be acknowledged that nearly all of these approaches are at present theoretically based, and lacking even in preclinical support. The field is urgently in need of future studies in clinical populations, with adequate sample sizes and sham controls, and using endophenotypic markers to validate or refute the proposed mechanisms of action for NIBS in EDs.
To conclude, patients with EDs stand to benefit tremendously from ongoing progress in three areas: symptom characterization, diagnostic formulation, and targeted intervention. Recent initiatives will allow us to make better sense of the heterogeneity of ED pathology, both across individuals and within individuals over time. As we improve our abilities to identify robust symptom clusters, link those clusters to neural substrates, and target those substrates with NIBS interventions, treatment outcomes will improve. These advances need not occur at the expense of existing and well-validated treatment strategies involving medications, psychotherapy, and behavior modification. Rather, they will likely work in a synergistic fashion to complement and facilitate our existing treatment strategies: enhancing the cognitive control that is a prerequisitive for successful cognitive-behavioral treatments in BN, or reducing the compulsivity and rigidity that hampers behavior modification in AN. Given the considerable patient burden and chronicity of EDs, these advances in treatment options will be a welcome change for patients, families and clinicians alike.

454
Table 1. Overview of the 5 Research Domain Criteria domains as adapted from Insel et al. (2010) and Morris and Cuthbert (2012).
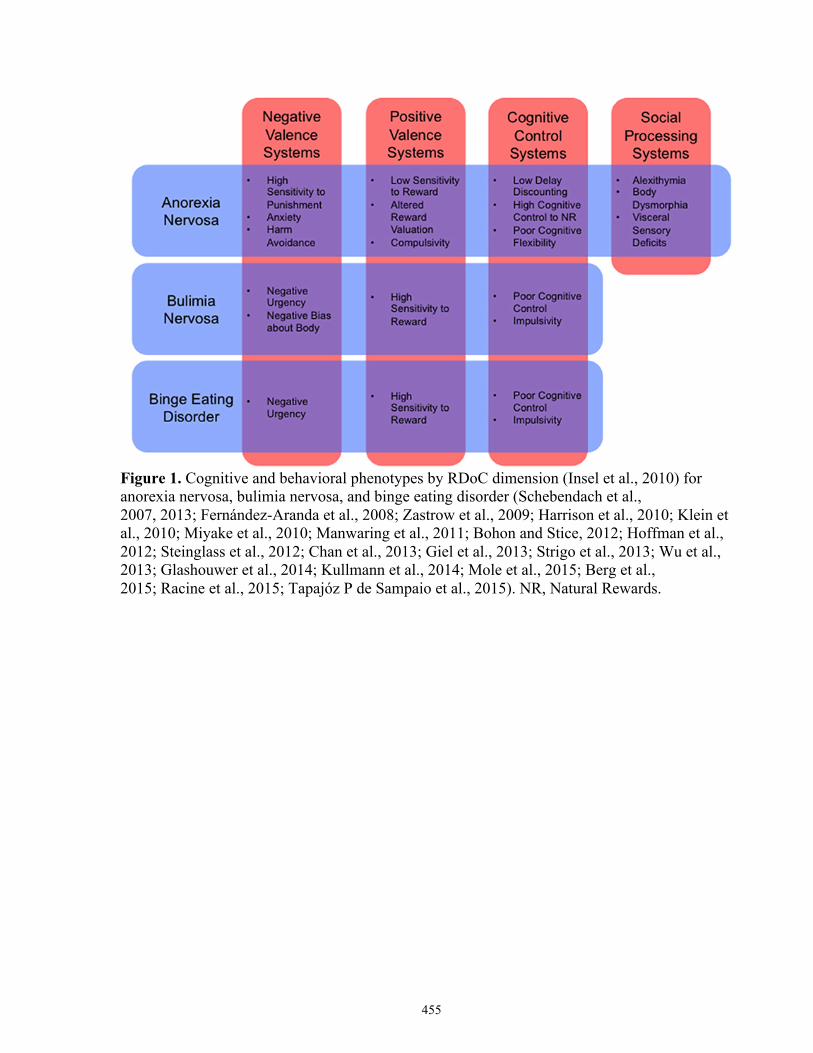
455
Figure 1. Cognitive and behavioral phenotypes by RDoC dimension (Insel et al., 2010) for anorexia nervosa, bulimia nervosa, and binge eating disorder (Schebendach et al., 2007, 2013; Fernández-Aranda et al., 2008; Zastrow et al., 2009; Harrison et al., 2010; Klein et al., 2010; Miyake et al., 2010; Manwaring et al., 2011; Bohon and Stice, 2012; Hoffman et al., 2012; Steinglass et al., 2012; Chan et al., 2013; Giel et al., 2013; Strigo et al., 2013; Wu et al., 2013; Glashouwer et al., 2014; Kullmann et al., 2014; Mole et al., 2015; Berg et al., 2015; Racine et al., 2015; Tapajóz P de Sampaio et al., 2015). NR, Natural Rewards.
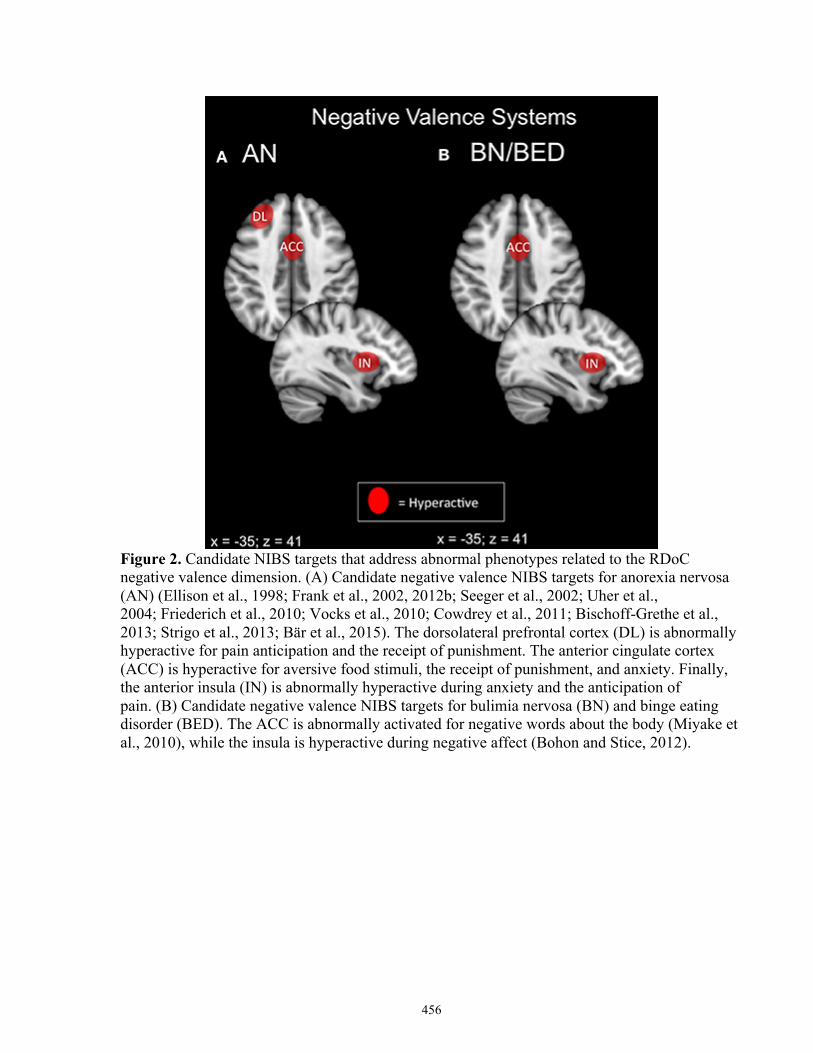
456
Figure 2. Candidate NIBS targets that address abnormal phenotypes related to the RDoC negative valence dimension. (A) Candidate negative valence NIBS targets for anorexia nervosa (AN) (Ellison et al., 1998; Frank et al., 2002, 2012b; Seeger et al., 2002; Uher et al., 2004; Friederich et al., 2010; Vocks et al., 2010; Cowdrey et al., 2011; Bischoff-Grethe et al., 2013; Strigo et al., 2013; Bär et al., 2015). The dorsolateral prefrontal cortex (DL) is abnormally hyperactive for pain anticipation and the receipt of punishment. The anterior cingulate cortex (ACC) is hyperactive for aversive food stimuli, the receipt of punishment, and anxiety. Finally, the anterior insula (IN) is abnormally hyperactive during anxiety and the anticipation of pain. (B) Candidate negative valence NIBS targets for bulimia nervosa (BN) and binge eating disorder (BED). The ACC is abnormally activated for negative words about the body (Miyake et al., 2010), while the insula is hyperactive during negative affect (Bohon and Stice, 2012).
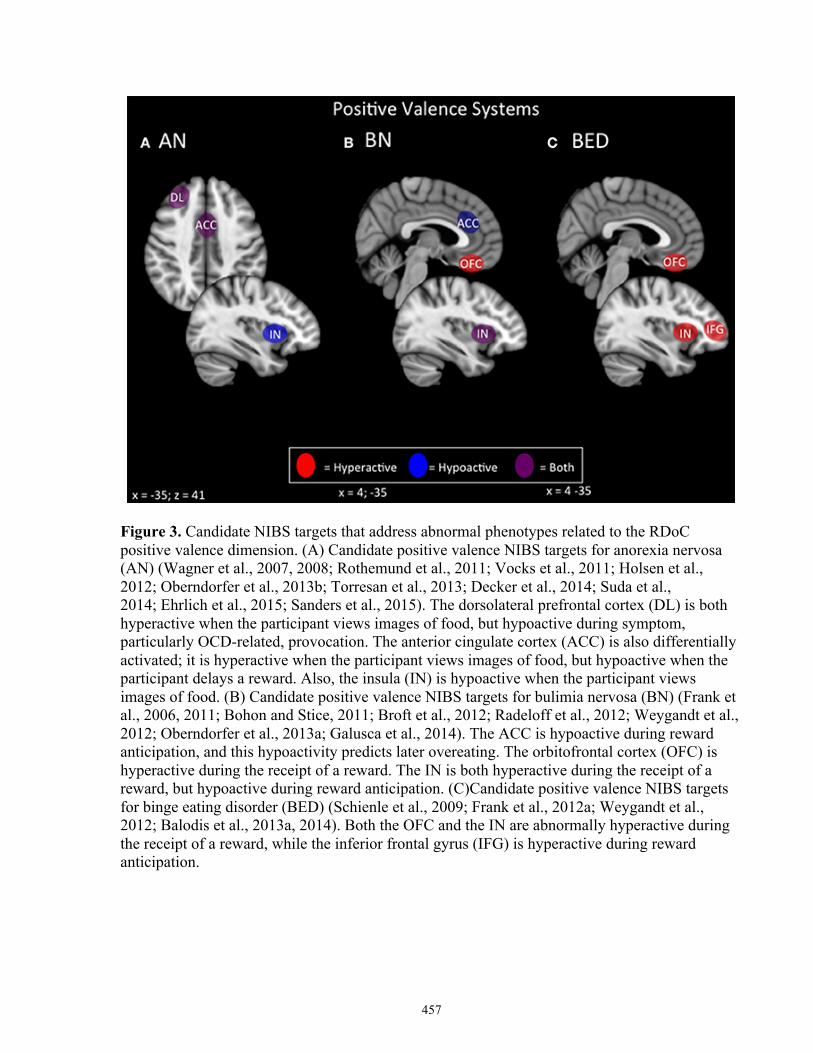
457
Figure 3. Candidate NIBS targets that address abnormal phenotypes related to the RDoC positive valence dimension. (A) Candidate positive valence NIBS targets for anorexia nervosa (AN) (Wagner et al., 2007, 2008; Rothemund et al., 2011; Vocks et al., 2011; Holsen et al., 2012; Oberndorfer et al., 2013b; Torresan et al., 2013; Decker et al., 2014; Suda et al., 2014; Ehrlich et al., 2015; Sanders et al., 2015). The dorsolateral prefrontal cortex (DL) is both hyperactive when the participant views images of food, but hypoactive during symptom, particularly OCD-related, provocation. The anterior cingulate cortex (ACC) is also differentially activated; it is hyperactive when the participant views images of food, but hypoactive when the participant delays a reward. Also, the insula (IN) is hypoactive when the participant views images of food. (B) Candidate positive valence NIBS targets for bulimia nervosa (BN) (Frank et al., 2006, 2011; Bohon and Stice, 2011; Broft et al., 2012; Radeloff et al., 2012; Weygandt et al., 2012; Oberndorfer et al., 2013a; Galusca et al., 2014). The ACC is hypoactive during reward anticipation, and this hypoactivity predicts later overeating. The orbitofrontal cortex (OFC) is hyperactive during the receipt of a reward. The IN is both hyperactive during the receipt of a reward, but hypoactive during reward anticipation. (C)Candidate positive valence NIBS targets for binge eating disorder (BED) (Schienle et al., 2009; Frank et al., 2012a; Weygandt et al., 2012; Balodis et al., 2013a, 2014). Both the OFC and the IN are abnormally hyperactive during the receipt of a reward, while the inferior frontal gyrus (IFG) is hyperactive during reward anticipation.

458
Figure 4. Candidate NIBS targets that address abnormal phenotypes related to the RDoC cognitive control dimension. (A) Candidate cognitive control NIBS targets for anorexia nervosa (AN) (Oberndorfer et al., 2011; Sato et al., 2013; Garrett et al., 2014; Wierenga et al., 2014; Wildes et al., 2014; Biezonski et al., 2015; Lao-Kaim et al., 2015). The dorsolateral prefrontal cortex (DL) is both hyperactive during interference control tasks (such as the Stroop task), and for working memory, but hypoactive during cognitive flexibility and set-shifting tasks. The anterior cingulate cortex (ACC) is hypoactive during response inhibition tasks, while the ventrolateral prefrontal cortex (VL) is hypoactive during cognitive flexibility tasks. (B)Candidate cognitive control NIBS targets for bulimia nervosa (BN) (Marsh et al., 2009; Rossi and Hallett, 2009; Celone et al., 2011; Lock et al., 2011). Both the ACC and the DL are hyperactive during response inhibition tasks, but hypoactive during interference control tasks, while both the orbitofrontal cortex (OFC) and inferior frontal gyrus (IFG) are hypoactive during inference control tasks. (C) Candidate cognitive control NIBS targets for binge eating disorder (BED) (Balodis et al., 2013b; Hege et al., 2014). The ventromedial prefrontal cortex (VM), insula (IN), and IFG are abnormally hypoactive during interference control, poor dietary restraint, impulsivity, and response inhibition.
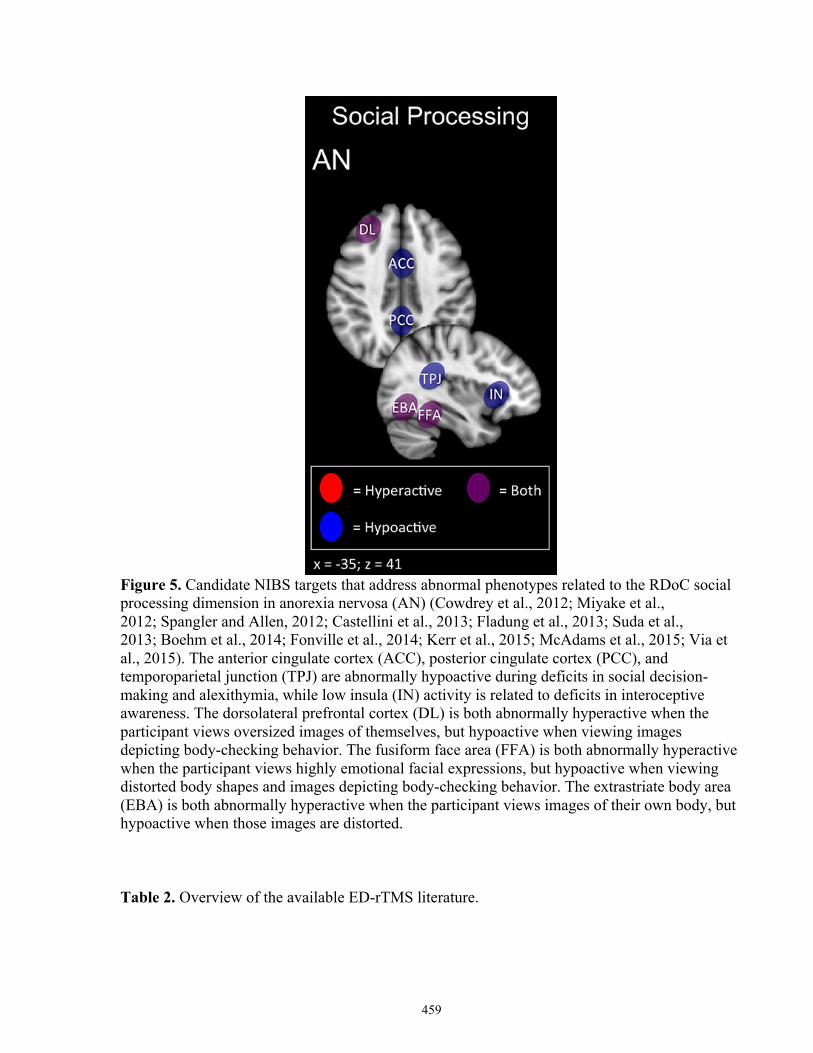
459
Figure 5. Candidate NIBS targets that address abnormal phenotypes related to the RDoC social processing dimension in anorexia nervosa (AN) (Cowdrey et al., 2012; Miyake et al., 2012; Spangler and Allen, 2012; Castellini et al., 2013; Fladung et al., 2013; Suda et al., 2013; Boehm et al., 2014; Fonville et al., 2014; Kerr et al., 2015; McAdams et al., 2015; Via et al., 2015). The anterior cingulate cortex (ACC), posterior cingulate cortex (PCC), and temporoparietal junction (TPJ) are abnormally hypoactive during deficits in social decision-making and alexithymia, while low insula (IN) activity is related to deficits in interoceptive awareness. The dorsolateral prefrontal cortex (DL) is both abnormally hyperactive when the participant views oversized images of themselves, but hypoactive when viewing images depicting body-checking behavior. The fusiform face area (FFA) is both abnormally hyperactive when the participant views highly emotional facial expressions, but hypoactive when viewing distorted body shapes and images depicting body-checking behavior. The extrastriate body area (EBA) is both abnormally hyperactive when the participant views images of their own body, but hypoactive when those images are distorted.
Table 2. Overview of the available ED-rTMS literature.

460
Table 3. Overview of the available ED-tDCS literature.
References
Ahmari, S. E., Spellman, T., Douglass, N. L., Kheirbek, M. A., Simpson, H. B., Deisseroth, K., et al. (2013). Repeated cortico-striatal stimulation generates persistent OCD-like behavior. Science340, 1234–1239. Åhs, F., Kragel, P. A., Zielinski, D. J., Brady, R., and LaBar, K. S. (2015). Medial prefrontal pathways for the contextual regulation of extinguished fear in humans. Neuroimage 122, 262–271.
461
Albares, M., Lio, G., Criaud, M., Anton, J.-L., Desmurget, M., and Boulinguez, P. (2014). The dorsal medial frontal cortex mediates automatic motor inhibition in uncertain contexts: evidence from combined fMRI and EEG studies. Hum. Brain Mapp. 35, 5517–5531. Amianto, F., Ottone, L., Abbate-Daga, G., and Fassino, S. (2015). Binge-eating disorder diagnosis and treatment: a recap in front of DSM-5. BMC Psychiatry 15:6. Arcelus, J., Mitchell, A. J., Wales, J., and Nielsen, S. (2011). Mortality rates in patients with anorexia nervosa and other eating disorders. A meta-analysis of 36 studies. Arch. Gen. Psychiatry68, 724–731. Baeken, C., De Raedt, R., Van Schuerbeek, P., Vanderhasselt, M. A., De Mey, J., Bossuyt, A., et al. (2010). Right prefrontal HF-rTMS attenuates right amygdala processing of negatively valenced emotional stimuli in healthy females. Behav. Brain Res. 214, 450–455. Baeken, C., Marinazzo, D., Wu, G.-R., Van Schuerbeek, P., De Mey, J., Marchetti, I., et al. (2014). Accelerated HF-rTMS in treatment-resistant unipolar depression: Insights from subgenual anterior cingulate functional connectivity. World J. Biol. Psychiatry, 15, 286–297. Bailer, U. F., Frank, G. K., Henry, S. E., Price, J. C., Meltzer, C. C., Mathis, C. A., et al. (2007). Exaggerated 5-HT1A but Normal 5-HT2A Receptor Activity in Individuals Ill with Anorexia Nervosa. Biol. Psychiatry 61, 1090–1099. Bailer, U., Price, J., Meltzer, C. C., Mathis, C. A., Frank, G. K., Weissfeld, L., et al. (2004). Altered 5-HT(2A) receptor binding after recovery from bulimia-type anorexia nervosa: relationships to harm avoidance and drive for thinness. Neuropsychology 29, 1143–1155. Bainbridge, K., and Brown, A. (2014). rTMS as a treatment for anorexia nervosa. Brain Stimul. 7, 149–150. Bakker, N., Shahab, S., Giacobbe, P., Blumberger, D. M., Daskalakis, Z. J., Kennedy, S. H., et al. (2015). rTMS of the dorsomedial prefrontal cortex for major depression: safety, tolerability, effectiveness, and outcome predictors for 10 Hz versus intermittent theta-burst stimulation. Brain Stimul. 8, 205–215. Balodis, I. M., Grilo, C. M., Kober, H., Worhunsky, P. D., White, M. A., Stevens, M. C., et al. (2014). A pilot study linking reduced fronto-Striatal recruitment during reward processing to persistent bingeing following treatment for binge-eating disorder. Int. J. Eat. Disord. 47, 376–384. Balodis, I. M., Kober, H., Worhunsky, P. D., White, M. A., Stevens, M. C., Pearlson, G. D., et al. (2013a). Monetary reward processing in obese individuals with and without binge eating disorder. Biol. Psychiatry 73, 877–886. Balodis, I. M., Molina, N. D., Kober, H., Worhunsky, P. D., White, M. A., Sinha, R., et al. (2013b). Divergent neural substrates of inhibitory control in binge eating disorder relative to other manifestations of obesity. Obesity 21, 367–377. Bär, K.-J., de la Cruz, F., Berger, S., Schultz, C. C., and Wagner, G. (2015). Structural and functional differences in the cingulate cortex relate to disease severity in anorexia nervosa. J. Psychiatry Neurosci. 40, 269–279. Bar, K.-J., de la Cruz, F., Berger, S., Schultz, C., and Wagner, G. (2015). Structural and functional differences in the cingulate cortex relate to disease severity in anorexia nervosa. J. Psychiatry Neurosci. 40, 269–279. Barth, K. S., Rydin-Gray, S., Kose, S., Borckardt, J. J., O'Neil, P. M., Shaw, D., et al. (2011). Food cravings and the effects of left prefrontal repetitive transcranial magnetic stimulation using an improved sham condition. Front. Psychiatry 2:9. Ben-Menachem, E., Revesz, D., Simon, B. J., and Silberstein, S. (2015). Surgically implanted and non-invasive vagus nerve stimulation: a review of efficacy, safety and tolerability. Eur. J. Neurol.22, 1260–1268. Berg, K. C., Crosby, R. D., Cao, L., Crow, S. J., Engel, S. G., Wonderlich, S., et al. (2015). Negative affect prior to and following overeating-only, loss of control eating-only, and binge eating episodes in obese adults. Int. J. Eat. Disord. 48, 641–653. Beucke, J. C., Sepulcre, J., Talukdar, T., Linnman, C., Zschenderlein, K., Endrass, T., et al. (2013). Abnormally high degree connectivity of orbitofrontal cortex in obsessive-compulsive disorder. JAMA Psychiatry 70, 619–629. Biezonski, D., Cha, J., Steinglass, J., and Posner, J. (2015). Evidence for thalamocortical circuit abnormalities and associated cognitive dysfunctions in underweight individuals with anorexia nervosa. Neuropsychopharmacology. Bischoff-Grethe, A., McCurdy, D., Grenesko-Stevens, E., Irvine, L. E. Z., Wagner, A., Yau, W.-Y. W., et al. (2013). Altered brain response to reward and punishment in adolescents with Anorexia nervosa. Psychiatry Res. 214, 331–340. Boehm, I., Geisler, D., King, J. A., Ritschel, F., Seidel, M., Deza Araujo, Y., et al. (2014). Increased resting state functional connectivity in the fronto-parietal and default mode network in anorexia nervosa. Front. Behav. Neurosci. 8:346. Bohon, C., and Stice, E. (2011). Reward abnormalities among women with full and subthreshold bulimia nervosa: a functional magnetic resonance imaging study. Int. J. Eat. Disord. 44, 585–595. Bohon, C., and Stice, E. (2012). Negative affect and neural response to palatable food intake in bulimia nervosa. Appetite 58, 964–970.
462
Broft, A., Shingleton, R., Kaufman, J., Liu, F., Kumar, D., Slifstein, M., et al. (2012). Striatal dopamine in bulimia nervosa: a PET imaging study. Int. J. Eat. Disord. 45, 648–656. Brunoni, A. R., Nitsche, M. A., Bolognini, N., Bikson, M., Wagner, T., Merabet, L., et al. (2012). Clinical research with transcranial direct current stimulation (tDCS): challenges and future directions. Brain Stimul. 5, 175–195. Bulik, C. M., Bacanu, S.-A., Klump, K. L., Fichter, M. M., Halmi, K. A., Keel, P., et al. (2005). Selection of eating-disorder phenotypes for linkage analysis. Am. J. Med. Genet. B. Neuropsychiatr. Genet. 139B, 81–87. Carpenter, L. L., Janicak, P. G., Aaronson, S. T., Boyadjis, T., Brock, D. G., Cook, I. A., et al. (2012). Transcranial magnetic stimulation (TMS) for major depression: a multisite, naturalistic, observational study of acute treatment outcomes in clinical practice. Depress. Anxiety 29, 587–596. Carter, J. C., Mercer-Lynn, K. B., Norwood, S. J., Bewell-Weiss, C. V., Crosby, R. D., Woodside, D. B., et al. (2012). A prospective study of predictors of relapse in anorexia nervosa: implications for relapse prevention. Psychiatry Res. 200, 518–523. Castellini, G., Polito, C., Bolognesi, E., D'Argenio, A., Ginestroni, A., Mascalchi, M., et al. (2013). Looking at my body. similarities and differences between anorexia nervosa patients and controls in body image visual processing. Eur. Psychiatry 28, 427–435. Celone, K. A., Thompson-Brenner, H., Ross, R. S., Pratt, E. M., and Stern, C. E. (2011). An fMRI investigation of the fronto-striatal learning system in women who exhibit eating disorder behaviors. Neuroimage 56, 1749–1757. Chan, T. W. S., Ahn, W.-Y., Bates, J. E., Busemeyer, J. R., Guillaume, S., Redgrave, G. W., et al. (2013). Differential impairments underlying decision making in anorexia nervosa and bulimia nervosa: a cognitive modeling analysis. Int. J. Eat. Disord., 47, 157–167. Chen, R., Classen, J., Gerloff, C., Celnik, P., Wassermann, E. M., Hallett, M., et al. (1997). Depression of motor cortex excitability by low-frequency transcranial magnetic stimulation. Neurology 48, 1398–1403. Chib, V. S., Yun, K., Takahashi, H., and Shimojo, S. (2013). Noninvasive remote activation of the ventral midbrain by transcranial direct current stimulation of prefrontal cortex. Transl. Psychiatry 3, e268. Cho, J.-H., Deisseroth, K., and Bolshakov, V. Y. (2013). Synaptic encoding of fear extinction in mPFC-amygdala circuits. Neuron 80, 1491–1507. Cho, S. S., Ko, J. H., Pellecchia, G., Van Eimeren, T., Cilia, R., and Strafella, A. P. (2010). Continuous theta burst stimulation of right dorsolateral prefrontal cortex induces changes in impulsivity level. Brain Stimul. 3, 170–176. Cho, S. S., Kosimori, Y., Aminian, K., Obeso, I., Rusjan, P., Lang, A., et al. (2014). Investing in the future: stimulation of the medial prefrontal cortex reduces discounting of delayed rewards. Neuropsychopharmacology. 40, 546–553. Ciampi de Andrade, D., Galhardoni, R., Pinto, L. F., Lancelotti, R., Rosi, J., Marcolin, M. A., et al. (2012). Into the island: a new technique of non-invasive cortical stimulation of the insula. Neurophysiol. Clin. 42, 363–368. Claudino, A. M., Van den Eynde, F., Stahl, D., Dew, T., Andiappan, M., Kalthoff, J., et al. (2011). Repetitive transcranial magnetic stimulation reduces cortisol concentrations in bulimic disorders. Psychol. Med. 41, 1329–1336. Cowdrey, F. A., Harmer, C. J., Park, R. J., and McCabe, C. (2012). Neural responses to emotional faces in women recovered from anorexia nervosa. Psychiatry Res. 201, 190–195. Cowdrey, F. A., Park, R. J., Harmer, C. J., and McCabe, C. (2011). Increased neural processing of rewarding and aversive food stimuli in recovered anorexia nervosa. Biol. Psychiatry 70, 736–743. Craig, A. D. (2002). How do you feel? Interoception: the sense of the physiological condition of the body. Nat. Rev. Neurosci. 3, 655–666. Crane, A., Roberts, M. E., and Treasure, J. (2007). Are obsessive−compulsive personality traits associated with a poor outcome in anorexia nervosa? A systematic review of randomized controlled trials and naturalistic. Int. J. Eat. Disord. 40, 581–588. Decker, J. H., Figner, B., and Steinglass, J. E. (2014). On weight and waiting: delay discounting in anorexia nervosa pretreatment and posttreatment. Biol. Psychiatry, 78, 606–614. De Ridder, D., Vanneste, S., Kovacs, S., Sunaert, S., and Dom, G. (2011). Transient alcohol craving suppression by rTMS of dorsal anterior cingulate: an fMRI and LORETA EEG study. Neurosci. Lett. 496, 5–10. Dinur-Klein, L., Dannon, P., Hadar, A., Rosenberg, O., Roth, Y., Kotler, M., et al. (2014). Smoking cessation induced by deep repetitive transcranial magnetic stimulation of the prefrontal and insular cortices: a prospective, randomized controlled trial. Biol. Psychiatry 76, 742–749. Donaldson, P. H., Rinehart, N. J., and Enticott, P. G. (2015). Noninvasive stimulation of the temporoparietal junction: a systematic review. Neurosci. Biobehav. Rev. 55, 547–572. Downar, J., Geraci, J., Salomons, T. V., Dunlop, K., Wheeler, S., McAndrews, M. P., et al. (2014). Anhedonia and reward-circuit connectivity distinguish nonresponders from responders to dorsomedial prefrontal repetitive transcranial magnetic stimulation in major depression. Biol. Psychiatry 76, 176–185.
463
Downar, J., Sankar, A., Giacobbe, P., Woodside, B., and Colton, P. (2012). Unanticipated rapid remission of refractory bulimia nervosa, during high-dose repetitive transcranial magnetic stimulation of the dorsomedial prefrontal cortex: a case report. Front. Psychiatry 3:30. Dunlop, K., Woodside, B., Lam, E., Olmsted, M., Colton, P., Giacobbe, P., et al. (2015). Increases in frontostriatal connectivity are associated with response to dorsomedial repetitive transcranial magnetic stimulation in refractory binge/purge behaviors. Neuroimage Clin. 8, 611–618. Dunlop, K., Hanlon, C. A., and Downar, J. (accepted). Non-invasive brain stimulation treatments for addiction major depression. Ann. N.Y. Acad. Sci. Addict. Rev. Dunlop, K., Woodside, B., Olmsted, M., Colton, P., Giacobbe, P., and Downar, J. (2015). Reductions in cortico-striatal hyperconnectivity accompany successful treatment of obsessive-compulsive disorder with dorsomedial prefrontal rTMS. Neuropsychopharmacology. Eddy, K. T., Crosby, R. D., Keel, P. K., Wonderlich, S. A., le Grange, D., Hill, L., et al. (2009). Empirical identification and validation of eating disorder phenotypes in a multisite clinical sample. J. Nerv. Ment. Dis. 197, 41–49. Ehrlich, S., Geisler, D., Ritschel, F., King, J., Seidel, M., Boehm, I., et al. (2015). Elevated cognitive control over reward processing in recovered female patients with anorexia nervosa. J. Psychiatry Neurosci. 40, 307–315. Eldaief, M. C., Halko, M. A., Buckner, R. L., and Pascual-Leone, A. (2011). Transcranial magnetic stimulation modulates the brain's intrinsic activity in a frequency-dependent manner. Proc. Natl. Acad. Sci. U.S.A. 108, 21229–21234. Ellison, Z., Foong, J., Howard, R., Bullmore, E., Williams, S., and Treasure, J. (1998). Functional anatomy of calorie fear in anorexia nervosa. Lancet 352, 1192. Enticott, P. G., Fitzgibbon, B. M., Kennedy, H. A., Arnold, S. L., Elliot, D., Peachey, A., et al. (2014). A double-blind, randomized trial of deep repetitive transcranial magnetic stimulation (rTMS) for autism spectrum disorder. Brain Stimul. 7, 206–211. Enticott, P. G., Kennedy, H. A., Zangen, A., and Fitzgerald, P. B. (2011). Deep repetitive transcranial magnetic stimulation associated with improved social functioning in a young woman with an autism spectrum disorder. J. ECT 27, 41–43. Felix-Ortiz, A. C., Burgos-Robles, A., Bhagat, N. D., Leppla, C. A., and Tye, K. M. (2015). Bidirectional modulation of anxiety-related and social behaviors by amygdala projections to the medial prefrontal cortex. Neuroscience. Fernández-Aranda, F., Pinheiro, A. P., Thornton, L. M., Berrettini, W. H., Crow, S., Fichter, M. M., et al. (2008). Impulse control disorders in women with eating disorders. Psychiatry Res. 157, 147–157. Filbey, F. M., Myers, U. S., and DeWitt, S. (2012). Reward circuit function in high BMI individuals with compulsive overeating: similarities with addiction. Neuroimage 63, 1800–1806. Fladung, A.-K., Schulze, U. M. E., Schöll, F., Bauer, K., and Grön, G. (2013). Role of the ventral striatum in developing anorexia nervosa. Transl. Psychiatry 3, e315. Fonville, L., Giampietro, V., Surguladze, S., Williams, S., and Tchanturia, K. (2014). Increased BOLD signal in the fusiform gyrus during implicit emotion processing in anorexia nervosa. Neuroimage Clin. 4, 266–273. Fox, M. D., Liu, H., and Pascual-Leone, A. (2013). Identification of reproducible individualized targets for treatment of depression with TMS based on intrinsic connectivity. Neuroimage 66, 151–160. Frank, G. K., Bailer, U. F., Henry, S. E., Drevets, W., Meltzer, C. C., Price, J. C., et al. (2005). Increased dopamine D2/D3 receptor binding after recovery from anorexia nervosa measured by positron emission tomography and [11C]raclopride. Biol. Psychiatry 58, 908–912. Frank, G. K., Kaye, W. H., Meltzer, C. C., Price, J. C., Greer, P., McConaha, C., et al. (2002). Reduced 5-HT2A receptor binding after recovery from anorexia nervosa. Biol. Psychiatry 52, 896–906. Frank, G. K., Wagner, A., Achenbach, S., McConaha, C., Skovira, K., Aizenstein, H., et al. (2006). Altered brain activity in women recovered from bulimic-type eating disorders after a glucose challenge: a pilot study. Int. J. Eat. Disord. 39, 76–79. Frank, G. K. W., Reynolds, J. R., Shott, M. E., Jappe, L., Yang, T. T., Tregellas, J. R., et al. (2012a). Anorexia nervosa and obesity are associated with opposite brain reward response. Neuropsychopharmacology 37, 2031–2046. Frank, G. K. W., Reynolds, J. R., Shott, M. E., and O'Reilly, R. C. (2011). Altered temporal difference learning in bulimia nervosa. Biol. Psychiatry 70, 728–735. Frank, G. K. W., Roblek, T., Shott, M. E., Jappe, L. M., Rollin, M. D. H., Hagman, J. O., et al. (2012b). Heightened fear of uncertainty in anorexia and bulimia nervosa. Int. J. Eat. Disord. 45, 227–232. Fregni, F., Orsati, F., Pedrosa, W., Fecteau, S., Tome, F. A. M., Nitsche, M. A., et al. (2008). Transcranial direct current stimulation of the prefrontal cortex modulates the desire for specific foods. Appetite 51, 34–41.
464
Friederich, H.-C., Brooks, S., Uher, R., Campbell, I. C., Giampietro, V., Brammer, M., et al. (2010). Neural correlates of body dissatisfaction in anorexia nervosa. Neuropsychologia 48, 2878–2885. Galusca, B., Sigaud, T., Costes, N., Redoute, J., Massoubre, C., and Estour, B. (2014). Wide impairment of cerebral serotoninergic activity but inter-individual heterogeneity in bulimia nervosa patients: a pilot [(18)F]MPPF/PET study. World J. Biol. Psychiatry 15, 599–608. Garfinkel, P. E., Lin, E., Goering, P., Spegg, C., Goldbloom, D. S., Kennedy, S., et al. (1995). Bulimia nervosa in a Canadian community sample: prevalence and comparison of subgroups. Am. J. Psychiatry 152, 1052–1058. Garrett, A., Lock, J., Datta, N., Beenhaker, J., Kesler, S. R., and Reiss, A. L. (2014). Predicting clinical outcome using brain activation associated with set-shifting and central coherence skills in anorexia nervosa. J. Psychiatr. Res. 57, 26–33. Gatt, L., Jan, S., Mondraty, N., Horsfield, S., Russell, J., Laba, T., et al. (2014). The household economic burden of eating disorders and adherence to treatment in Australia. BMC Psychiatry29:338. Giel, K. E., Kullmann, S., Preißl, H., Bischoff, S. C., Thiel, A., Schmidt, U., et al. (2013). Understanding the reward system functioning in anorexia nervosa: crucial role of physical activity. Biol. Psychol. 94, 575–581. Giuliano, C., and Cottone, P. (2015). The role of the opioid system in binge eating disorder. CNS Spectr. 20, 537–545. Glashouwer, K. A., Bloot, L., Veenstra, E. M., Franken, I. H. A., and de Jong, P. J. (2014). Heightened sensitivity to punishment and reward in anorexia nervosa. Appetite 75, 97–102. Godart, N. T., Flament, M. F., Curt, F., Perdereau, F., Lang, F., Venisse, J., et al. (2003). Anxiety disorders in subjects seeking treatment for eating disorders: a DSM-IV controlled study. Psychiatry Res. 117, 245–258. Golden, N. H., Katzman, D. K., Kreipe, R. E., Stevens, S. L., Sawyer, S. M., Rees, J., et al. (2003). Eating disorders in adolescents: position paper of the society for adolescent medicine. J. Adolesc. Heal. 33, 496–503. Goldman, R. L., Borckardt, J. J., Frohman, H. A., O'Neil, P. M., Madan, A., Campbell, L. K., et al. (2011). Prefrontal cortex transcranial direct current stimulation (tDCS) temporarily reduces food cravings and increases the self-reported ability to resist food in adults with frequent food craving. Appetite 56, 741–746. Gorelick, D. A., Zangen, A., and George, M. S. (2014). Transcranial magnetic stimulation in the treatment of substance addiction. Ann. N.Y. Acad. Sci. 1327, 79–93. Grall-Bronnec, M., and Sauvaget, A. (2014). The use of repetitive transcranial magnetic stimulation for modulating craving and addictive behaviours: a critical literature review of efficacy, technical and methodological considerations. Neurosci. Biobehav. Rev. 47C, 592–613. Grimonprez, A., Raedt, R., Baeken, C., Boon, P., and Vonck, K. (2015). The antidepressant mechanism of action of vagus nerve stimulation: evidence from preclinical studies. Neurosci. Biobehav. Rev. 56, 26–34. Guhn, A., Dresler, T., Andreatta, M., Müller, L. D., Hahn, T., Tupak, S. V., et al. (2014). Medial prefrontal cortex stimulation modulates the processing of conditioned fear. Front. Behav. Neurosci. 8:44. Hallett, M. (2007). Transcranial magnetic stimulation: a primer. Neuron 55, 187–199. Hanlon, C. A., Canterberry, M., Taylor, J., Devries, W., and George, M. (2013). “Functional and structural integrity of frontal-striatal circuits in cocaine users: an interleaved TMS-BOLD & DTI study,” in Annual Meeting of the Society for Biological Psychiatry, Vol. 256 (San Francisco, CA). Hanlon, C. A., Dowdle, L. T., Austelle, C. W., Devries, W., Mithoefer, O., Badran, B. W., et al. (2015). What goes up, can come down: Novel brain stimulation paradigms may attenuate craving and craving-related neural circuitry in substance dependent individuals. Brain Res. 1628(Pt A), 199–209. Harrison, A., O'Brien, N., Lopez, C., and Treasure, J. (2010). Sensitivity to reward and punishment in eating disorders. Psychiatry Res. 177, 1–11. Hart, L. M., Granillo, M. T., Jorm, A. F., and Paxton, S. J. (2011). Unmet need for treatment in the eating disorders: a systematic review of eating disorder specific treatment seeking among community cases. Clin. Psychol. Rev. 31, 727–735. Hausmann, A., Mangweth, B., Walpoth, M., Hoertnagel, C., Kramer-Reinstadler, K., Rupp, C. I., et al. (2004). Repetitive transcranial magnetic stimulation (rTMS) in the double-blind treatment of a depressed patient suffering from bulimia nervosa: a case report. Int. J. Neuropsychopharmacol. 7, 371–373. Hay, P. J., Touyz, S., and Sud, R. (2012). Treatment for severe and enduring anorexia nervosa: a review. Aust. N. Z. J. Psychiatry 42, 1136–1144. Hege, M. A., Stingl, K. T., Kullmann, S., Schag, K., Giel, K. E., Zipfel, S., et al. (2014). Attentional impulsivity in binge eating disorder modulates response inhibition performance and frontal brain networks. Int. J. Obes. (Lond). 39, 353–360. Hilbert, A., Bishop, M. E., Stein, R. I., Tanofsky-Kraff, M., Swenson, A. K., Welch, R. R., et al. (2012). Long-term efficacy of psychological treatments for binge eating disorder. Br. J. Psychiatry 200, 232–237.
465
Hoffman, E. R., Gagne, D. A., Thornton, L. M., Klump, K. L., Brandt, H., Crawford, S., et al. (2012). Understanding the association of impulsivity, obsessions, and compulsions with binge eating and purging behaviours in anorexia nervosa. Eur. Eat. Disord. Rev. 20, e129–e136. Holsen, L., Lawson, E., Blum, J., Ko, E., Makris, N., Fazeli, P., et al. (2012). Food motivation circuitry hypoactivation related to hedonic and nonhedonic aspects of hunger and satiety in women with active anorexia nervosa and weight-restored women with anorexia nervosa. J. Psychiatry Neurosci. 37, 322–232. Holtzheimer, P. E., McDonald, W. M., Mufti, M., Kelley, M. E., Quinn, S., Corso, G., et al. (2010). Accelerated repetitive transcranial magnetic stimulation for treatment-resistant depression. Depress. Anxiety 27, 960–963. Huang, Y.-Z., Edwards, M. J., Rounis, E., Bhatia, K. P., and Rothwell, J. C. (2005). Theta burst stimulation of the human motor cortex. Neuron 45, 201–206. Hudson, J. I., Hiripi, E., Pope, H. G., and Kessler, R. C. (2007). The prevalence and correlates of eating disorders in the National Comorbidity Survey Replication. Biol. Psychiatry 61, 348–358. Hummel, D., Rudolf, A. K., Brandi, M.-L., Untch, K.-H., Grabhorn, R., Hampel, H., et al. (2013). Neural adaptation to thin and fat bodies in the fusiform body area and middle occipital gyrus: an fMRI adaptation study. Hum. Brain Mapp. 34, 3233–3246. Insel, T., Cuthbert, B., Garvey, M., Heinssen, R., Pine, D. S., Quinn, K., et al. (2010). Research domain criteria (RDoC): toward a new classification framework for research on mental disorders. Am. J. Psychiatry 167, 748–751. Isserles, M., Shalev, A. Y., Roth, Y., Peri, T., Kutz, I., Zlotnick, E., et al. (2013). Effectiveness of deep transcranial magnetic stimulation combined with a brief exposure procedure in post-traumatic stress disorder–a pilot study. Brain Stimul. 6, 377–383. Johnstone, T., van Reekum, C. M., Urry, H. L., Kalin, N. H., and Davidson, R. J. (2007). Failure to regulate: counterproductive recruitment of top-down prefrontal-subcortical circuitry in major depression. J. Neurosci. 27, 8877–8884. Keating, C., Tilbrook, A. J., Rossell, S. L., Enticott, P. G., and Fitzgerald, P. B. (2012). Reward processing in anorexia nervosa. Neuropsychologia 50, 567–575. Keel, P. K., Fichter, M., Quadflieg, N., Bulik, C. M., Baxter, M. G., Thornton, L., et al. (2004). Application of a latent class analysis to empirically define eating disorder phenotypes. Arch. Gen. Psychiatry 61, 192–200. Keel, P. K., and Mitchell, J. E. (1997). Outcome in bulimia nervosa. Am. J. Psychiatry 154, 313–321. Kekic, M., McClelland, J., Campbell, I., Nestler, S., Rubia, K., David, A. S., et al. (2014). The effects of prefrontal cortex transcranial direct current stimulation (tDCS) on food craving and temporal discounting in women with frequent food cravings. Appetite 78, 55–62. Kerr, K., Moseman, S., Avery, J., Bodurka, J., Zucker, N., and Kyle Simmons, W. (2015). Altered insula activity during visceral interoception in weight-restored patients with anorexia nervosa. Neuropsychopharmacology. 41, 521–528. Khedr, E., Elfetoh, N., Ali, A., and Noamany, M. (2014). Anodal transcranial direct current stimulation over the dorsolateral prefrontal cortex improves anorexia nervosa: a pilot study. Restor. Neurol. Neurosci. 32, 789–797. Klein, D. A., Schebendach, J. E., Gershkovich, M., Bodell, L., Foltin, R., and Walsh, B. T. (2010). Behavioral assessment of the reinforcing effect of exercise in women with anorexia nervosa: further paradigm development and data. Int. J. Eat. Disord. 43, 611–618. Kozel, F. A., Nahas, Z., deBrux, C., Molloy, M., Lorberbaum, J. P., Bohning, D., et al. (2000). How coil-cortex distance relates to age, motor threshold, and antidepressant response to repetitive transcranial magnetic stimulation. J. Neuropsychiatry Clin. Neurosci. 12, 376–384. Kühn, S., Gallinat, J., and Brass, M. (2011). “Keep Calm and Carry On”: structural correlates of expressive suppression of emotions. PLoS ONE 6:e16569. Kullmann, S., Giel, K. E., Hu, X., Bischoff, S. C., Teufel, M., Thiel, A., et al. (2014). Impaired inhibitory control in anorexia nervosa elicited by physical activity stimuli. Soc. Cogn. Affect. Neurosci. 9, 917–923. Lao-Kaim, N., Fonville, L., Giampietro, V., Williams, S., Simmons, A., and Tchanturia, K. (2015). Aberrant function of learning and cognitive control networks underlie inefficient cognitive flexibility in anorexia nervosa: a cross-sectional fMRI study. PLoS ONE 10:e124027. Lapenta, O. M., Sierve, K., de Macedo, E. C., Fregni, F., and Boggio, P. S. (2014). Transcranial direct current stimulation modulates ERP-indexed inhibitory control and reduces food consumption. Appetite 83, 42–48. Lee, S., Ran Kim, K., Ku, J., Lee, J. H., Namkoong, K., and Jung, Y. C. (2014). Resting-state synchrony between anterior cingulate cortex and precuneus relates to body shape concern in anorexia nervosa and bulimia nervosa. Psychiatry Res. 221, 43–48. Leehr, E. J., Krohmer, K., Schag, K., Dresler, T., Zipfel, S., and Giel, K. E. (2015). Emotion regulation model in binge eating disorder and obesity–a systematic review. Neurosci. Biobehav. Rev. 49, 125–134.
466
Li, C.-T., Chen, M.-H., Juan, C.-H., Huang, H.-H., Chen, L.-F., Hsieh, J.-C., et al. (2014). Efficacy of prefrontal theta-burst stimulation in refractory depression: a randomized sham-controlled study. Brain 137, 2088–2098. Lilenfeld, L. R., Kaye, W. H., Greeno, C. G., Merikangas, K. R., Plotnicov, K., Pollice, C., et al. (1998). A controlled family study of anorexia nervosa and bulimia nervosa: psychiatric disorders in first-degree relatives and effects of proband comorbidity. Arch. Gen. Psychiatry 55, 603–610. Lindquist, K. A., Satpute, A. B., Wager, T. D., Weber, J., and Barrett, L. F. (2015). The brain basis of positive and negative affect: evidence from a meta-analysis of the human neuroimaging literature. Cereb. Cortex. Lipsman, N., Woodside, D. B., Giacobbe, P., Hamani, C., Carter, J. C., Norwood, S. J., et al. (2013). Subcallosal cingulate deep brain stimulation for treatment-refractory anorexia nervosa: a phase 1 pilot trial. Lancet 381, 1361–1370. Lock, J., Garrett, A., Beenhakker, J., and Reiss, A. L. (2011). Aberrant brain activation during a response inhibition task in adolescent eating disorder subtypes. Am. J. Psychiatry 168, 55–64. Luo, Y., Qin, S., Fernández, G., Zhang, Y., Klumpers, F., and Li, H. (2014). Emotion perception and executive control interact in the salience network during emotionally charged working memory processing. Hum. Brain Mapp. 35, 5606–5616. Machii, K., Cohen, D., Ramos-Estebanez, C., and Pascual-Leone, A. (2006). Safety of rTMS to non-motor cortical areas in healthy participants and patients. Clin. Neurophysiol. 117, 455–471. Maeda, F., Keenan, J. P., Tormos, J. M., Topka, H., and Pascual-Leone, A. (2000). Interindividual variability of the modulatory effects of repetitive transcranial magnetic stimulation on cortical excitability. Exp. Brain Res. 133, 425–430. Mantovani, A., Simpson, H. B., Fallon, B. A., Rossi, S., and Lisanby, S. H. (2010). Randomized sham-controlled trial of repetitive transcranial magnetic stimulation in treatment-resistant obsessive-compulsive disorder. Int. J. Neuropsychopharmacol. 13, 217–227. Manwaring, J. L., Green, L., Myerson, J., Strube, M. J., and Wilfley, D. E. (2011). Discounting of Various types of rewards by women with and without binge eating disorder: evidence for general rather than specific differences. Psychol. Rec. 61, 561–582. Marsh, R., Horga, G., Wang, Z., Wang, P., Klahr, K. W., Berner, L. A., et al. (2011). An fMRI study of self-regulatory control and conflict resolution in adolescents with bulimia nervosa. Am. J. Psychiatry 168, 1210–1220. Marsh, R., Steinglass, J. E., Gerber, A. J., Graziano O'Leary, K., Wang, Z., Murphy, D., et al. (2009). Deficient activity in the neural systems that mediate self-regulatory control in bulimia nervosa. Arch. Gen. Psychiatry 66, 51–63. McAdams, C. J., and Krawczyk, D. C. (2011). Impaired neural processing of social attribution in anorexia nervosa. Psychiatry Res. 194, 54–63. McAdams, C. J., Lohrenz, T., and Montague, P. R. (2015). Neural responses to kindness and malevolence differ in illness and recovery in women with anorexia nervosa. Hum. Brain Mapp.36, 5207–5219. McClelland, J., Bozhilova, N., Campbell, I., and Schmidt, U. (2013). A systematic review of the effects of neuromodulation on eating and body weight: evidence from human and animal studies. Eur. Eat. Disord. Rev. 21, 436–455. McClelland, J., Kekic, M., Campbell, I. C., and Schmidt, U. (2016). Repetitive transcranial magnetic stimulation (rTMS) treatment in enduring anorexia nervosa: a case series. Eur. Eat. Disord. Rev. 24, 157–163. Meng, Z., Liu, C., Yu, C., and Ma, Y. (2014). Transcranial direct current stimulation of the frontal-parietal-temporal area attenuates smoking behavior. J. Psychiatr. Res. 54, 19–25. Meron, D., Hedger, N., Garner, M., and Baldwin, D. S. (2015). Transcranial direct current stimulation (tDCS) in the treatment of depression: systematic review and meta-analysis of efficacy and tolerability. Neurosci. Biobehav. Rev. 57, 46–62. Milos, G., Spindler, A., Schnyder, U., and Fairburn, C. G. (2005). Instability of eating disorder diagnoses: prospective study. Br. J. Psychiatry 187, 573–578. Mischoulon, D., Eddy, K. T., Keshaviah, A., Dinescu, D., Ross, S. L., Kass, A. E., et al. (2011). Depression and eating disorders: treatment and course. J. Affect. Disord. 130, 470–477. Mishra, B. R., Nizamie, S. H., Das, B., and Praharaj, S. K. (2010). Efficacy of repetitive transcranial magnetic stimulation in alcohol dependence: a sham-controlled study. Addiction105, 49–55. Mitchell, J. E., Agras, S., and Wonderlich, S. (2007). Treatment of bulimia nervosa: where are we and where are we going? Int. J. Eat. Disord. 40, 95–101. Miyake, Y., Okamoto, Y., Onoda, K., Shirao, N., Mantani, T., and Yamawaki, S. (2009). Neural correlates of alexithymia in response to emotional stimuli: a study of anorexia nervosa patients. Hiroshima J. Med. Sci. 58, 1–8.
467
Miyake, Y., Okamoto, Y., Onoda, K., Shirao, N., Okamoto, Y., Otagaki, Y., et al. (2010). Neural processing of negative word stimuli concerning body image in patients with eating disorders: an fMRI study. Neuroimage 50, 1333–1339. Miyake, Y., Okamoto, Y., Onoda, K., Shirao, N., Okamoto, Y., and Yamawaki, S. (2012). Brain activation during the perception of stressful word stimuli concerning interpersonal relationships in anorexia nervosa patients with high degrees of alexithymia in an fMRI paradigm. Psychiatry Res. 201, 113–119. Mole, T. B., Irvine, M. A., Worbe, Y., Collins, P., Mitchell, S. P., Bolton, S., et al. (2015). Impulsivity in disorders of food and drug misuse. Psychol. Med. 45, 771–782. Morris, S. E., and Cuthbert, B. N. (2012). Research Domain Criteria: cognitive systems, neural circuits, and dimensions of behavior. Dialogues Clin. Neurosci. 14, 29–37. Nauczyciel, C., and Drapier, D. (2012). Repetitive transcranial magnetic stimulation in the treatment of obsessive-compulsive disorder. Rev. Neurol. (Paris). 168, 655–661. Nettekoven, C., Volz, L. J., Leimbach, M., Pool, E.-M., Rehme, A. K., Eickhoff, S. B., et al. (2015). Inter-individual variability in cortical excitability and motor network connectivity following multiple blocks of rTMS. Neuroimage 118, 209–218. Nitsche, M. A., Koschack, J., Pohlers, H., Hullemann, S., Paulus, W., and Happe, S. (2012). Effects of frontal transcranial direct current stimulation on emotional state and processing in healthy humans. Front. Psychiatry 3:58. Oberndorfer, T. A., Frank, G. K. W., Simmons, A. N., Wagner, A., McCurdy, D., Fudge, J. L., et al. (2013a). Altered insula response to sweet taste processing after recovery from anorexia and bulimia nervosa. Am. J. Psychiatry 170, 1143–1151. Oberndorfer, T. A., Kaye, W. H., Simmons, A. N., Strigo, I. A., and Matthews, S. C. (2011). Demand-specific alteration of medial prefrontal cortex response during an inhibition task in recovered anorexic women. Int. J. Eat. Disord. 44, 1–8. Oberndorfer, T., Simmons, A., McCurdy, D., Strigo, I., Matthews, S., Yang, T., et al. (2013b). Greater anterior insula activation during anticipation of food images in women recovered from anorexia nervosa versus controls. Psychiatry Res. 214, 132–141. Olmsted, M. P., Kaplan, A. S., and Rockert, W. (2005). Defining remission and relapse in bulimia nervosa. Int. J. Eat. Disord. 38, 1–6. Pascual-Leone, A., Tormos, J. M., Keenan, J., Tarazona, F., Cañete, C., and Catalá, M. D. (1998). Study and modulation of human cortical excitability with transcranial magnetic stimulation. J. Clin. Neurophysiol. 15, 333–343. Pascual-Leone, A., Valls-Solé, J., Wassermann, E. M., and Hallett, M. (1994). Responses to rapid-rate transcranial magnetic stimulation of the human motor cortex. Brain 117(Pt 4), 847–858. Racine, S. E., Burt, S. A., Keel, P. K., Sisk, C. L., Neale, M. C., Boker, S., et al. (2015). Examining associations between negative urgency and key components of objective binge episodes. Int. J. Eat. Disord. 48, 527–531. Radeloff, D., Willmann, K., Otto, L., Lindner, M., Putnam, K., Leeuwen, S., et al. (2012). High-fat taste challenge reveals altered striatal response in women recovered from bulimia nervosa: a pilot study. World J. Biol. Psychiatry, 15, 307–316. Reineberg, A. E., Andrews-Hanna, J. R., Depue, B. E., Friedman, N. P., and Banich, M. T. (2015). Resting-state networks predict individual differences in common and specific aspects of executive function. Neuroimage 104, 69–78. Ritschel, F., King, J. A., Geisler, D., Flohr, L., Neidel, F., Boehm, I., et al. (2015). Temporal delay discounting in acutely ill and weight-recovered patients with anorexia nervosa. Psychol. Med. 45, 1229–1239. Rossi, S., and Hallett, M. (2009). Safety, ethical considerations, and application guidelines for the use of transcranial magnetic stimulation in clinical practice and research. Clin. Neurophysiol.120, 2008–2039. Roth, Y., Amir, A., Levkovitz, Y., and Zangen, A. (2007). Three-dimensional distribution of the electric field induced in the brain by transcranial magnetic stimulation using figure-8 and deep H-coils. J. Clin. Neurophysiol. 24, 31–38. Roth, Y., Levkovitz, Y., Pell, G. S., Ankry, M., and Zangen, A. (2014). Safety and characterization of a novel multi-channel TMS stimulator. Brain Stimul. 7, 194–205. Rothemund, Y., Buchwald, C., Georgiewa, P., Bohner, G., Bauknecht, H. C., Ballmaier, M., et al. (2011). Compulsivity predicts fronto striatal activation in severely anorectic individuals. Neuroscience 197, 242–250. Salomons, T. V., Dunlop, K., Kennedy, S. H., Flint, A., Geraci, J., Giacobbe, P., et al. (2014). Resting-state cortico-thalamic-striatal connectivity predicts response to dorsomedial prefrontal rTMS in major depressive disorder. Neuropsychopharmacology 39, 488–498. Sanders, N., Smeets, P., van Elburg, A., Danner, U., van Meer, F., Hoek, H., et al. (2015). Altered food-cue processing in chronically ill and recovered women with anorexia nervosa. Front. Behav. Neurosci. 9:46.
468
Sato, Y., Saito, N., Utsumi, A., Aizawa, E., Shoji, T., Izumiyama, M., et al. (2013). Neural basis of impaired cognitive flexibility in patients with anorexia nervosa. PLoS ONE 8:e61108. Saxe, R., and Kanwisher, N. (2003). People thinking about thinking people. The role of the temporo-parietal junction in “theory of mind.” Neuroimage 19, 1835–1842. Schebendach, J., Broft, A., Foltin, R., and Walsh, B. T. (2013). Can the reinforcing value of food be measured in bulimia nervosa? Appetite 62, 70–75. Schebendach, J. E., Klein, D. A., Foltin, R. W., Devlin, M. J., and Walsh, B. T. (2007). Relative reinforcing value of exercise in inpatients with anorexia nervosa: model development and pilot data. Int. J. Eat. Disord. 40, 446–453. Schienle, A., Schäfer, A., Hermann, A., and Vaitl, D. (2009). Binge-Eating disorder: reward sensitivity and brain activation to images of food. Biol. Psychiatry 65, 654–661. Schutter, D. J. L. G., and van Honk, J. (2006). A standardized motor threshold estimation procedure for transcranial magnetic stimulation research. J. ECT 22, 176–178. Seeger, G., Braus, D. F., Ruf, M., Goldberger, U., and Schmidt, M. H. (2002). Body image distortion reveals amygdala activation in patients with anorexia nervosa – a functional magnetic resonance imaging study. Neurosci. Lett. 326, 25–28. Shapiro, J. R., Berkman, N. D., Brownley, K. A., Sedway, J. A., Lohr, K. N., and Bulik, C. M. (2007). Bulimia nervosa treatment: a systematic review of randomized controlled trials. Int. J. Eat. Disord. 40, 321–336. Smink, F. R. E., Van Hoeken, D., Oldehinkel, A. J., and Hoek, H. W. (2014). Prevalence and severity of DSM-5 eating disorders in a community cohort of adolescents. Int. J. Eat. Disord. 47, 610–619. Solvason, H. B., Husain, M., Fitzgerald, P. B., Rosenquist, P., McCall, W. V., Kimball, J., et al. (2014). Improvement in quality of life with left prefrontal transcranial magnetic stimulation in patients with pharmacoresistant major depression: acute and six month outcomes. Brain Stimul.7, 219–225. d Spangler, D. L., and Allen, M. D. (2012). An fMRI investigation of emotional processing of body shape in bulimia nervosa. Int. J. Eat. Disord. 45, 17–25. Steinglass, J. E., Figner, B., Berkowitz, S., Simpson, H. B., Weber, E. U., and Walsh, B. T. (2012). Increased capacity to delay reward in anorexia nervosa. J. Int. Neuropsychol. Soc. 18, 773–780. Steinhausen, H.-C., and Weber, S. (2009). The outcome of bulimia nervosa: findings from one-quarter century of research. Am. J. Psychiatry 166, 1331–1341. Striegel-Moore, R. H., Franko, D. L., Thompson, D., Barton, B., Schreiber, G. B., and Daniels, S. R. (2005). An empirical study of the typology of bulimia nervosa and its spectrum variants. Psychol. Med. 35, 1563–1572. Strigo, I. A., Matthews, S. C., Simmons, A. N., Oberndorfer, T., Klabunde, M., Reinhardt, L. E., et al. (2013). Altered insula activation during pain anticipation in individuals recovered from anorexia nervosa: evidence of interoceptive dysregulation. Int. J. Eat. Disord. 46, 23–33. Strober, M., Freeman, R., Lampert, C., Diamond, J., and Kaye, W. (2000). Controlled family study of anorexia nervosa and bulimia nervosa: evidence of shared liability and transmission of partial syndromes. Am. J. Psychiatry 157, 393–401. Suchan, B., Bauser, D. S., Busch, M., Schulte, D., Grönemeyer, D., Herpertz, S., et al. (2013). Reduced connectivity between the left fusiform body area and the extrastriate body area in anorexia nervosa is associated with body image distortion. Behav. Brain Res. 241, 80–85. Suda, M., Brooks, S. J., Giampietro, V., Friederich, H. C., Uher, R., Brammer, M. J., et al. (2013). Functional neuroanatomy of body checking in people with anorexia nervosa. Int. J. Eat. Disord.46, 653–662. Suda, M., Brooks, S. J., Giampietro, V., Uher, R., Mataix-Cols, D., Brammer, M. J., et al. (2014). Provocation of symmetry/ordering symptoms in Anorexia nervosa: a functional neuroimaging study. PLoS ONE 9:e97998. Sullivan, P. F. (1995). Mortality in anorexia nervosa. Am. J. Psychiatry 152, 1073–1074. Sullivan, P. F., Bulik, C. M., and Kendler, K. S. (1998). The epidemiology and classification of bulimia nervosa. Psychol. Med. 28, 599–610. Sutoh, C., Koga, Y., Kimura, H., Kanahara, N., Numata, N., Hirano, Y., et al. (2016). Repetitive transcranial magnetic stimulation changes cerebral oxygenation on the left dorsolateral prefrontal cortex in bulimia nervosa: a near-infrared spectroscopy pilot study. Eur. Eat. Disord. Rev. 24, 83–88. Tapajóz P de Sampaio, F., Soneira, S., Aulicino, A., Harris, P., and Allegri, R. F. (2015). Emotional reactivity to social stimuli in patients with eating disorders. Psychiatry Res. 229, 887–894. Torresan, R. C., Ramos-Cerqueira, A. T. A., Shavitt, R. G., do Rosário, M. C., de Mathis, M. A., Miguel, E. C., et al. (2013). Symptom dimensions, clinical course and comorbidity in men and women with obsessive-compulsive disorder. Psychiatry Res. 209, 186–195. Tsutsumi, R., Hanajima, R., Terao, Y., Shirota, Y., Ohminami, S., Shimizu, T., et al. (2014). Effects of the motor cortical quadripulse transcranial magnetic stimulation (QPS) on the contralateral motor cortex and interhemispheric interactions. J. Neurophysiol. 111, 26–35.
469
Uher, R., Murphy, T., Brammer, M. J., Dalgleish, T., Phillips, M. L., Ng, V. W., et al. (2004). Medial prefrontal cortex activity associated with symptom provocation in eating disorders. Am. J. Psychiatry 161, 1238–1246. Uher, R., Yoganathan, D., Mogg, A., Eranti, S. V., Treasure, J., Campbell, I. C., et al. (2005). Effect of left prefrontal repetitive transcranial magnetic stimulation on food craving. Biol. Psychiatry58, 840–842. Ursu, S., Clark, K. A., Stenger, V. A., and Carter, C. S. (2008). Distinguishing expected negative outcomes from preparatory control in the human orbitofrontal cortex. Brain Res. 1227, 110–119. Val-Laillet, D., Aarts, E., Weber, B., Ferrari, M., Quaresima, V., Stoeckel, L. E., et al. (2015). Neuroimaging and neuromodulation approaches to study eating behavior and prevent and treat eating disorders and obesity. NeuroImage. Clin. 8, 1–31. Van den Eynde, F., Claudino, A. M., Mogg, A., Horrell, L., Stahl, D., Ribeiro, W., et al. (2010). Repetitive transcranial magnetic stimulation reduces cue-induced food craving in bulimic disorders. Biol. Psychiatry 67, 793–795. Van den Eynde, F., Guillaume, S., Broadbent, H., Campbell, I. C., and Schmidt, U. (2013). Repetitive transcranial magnetic stimulation in anorexia nervosa: a pilot study. Eur. Psychiatry28, 98–101. Via, E., Soriano-Mas, C., Sánchez, I., Forcano, L., Harrison, B. J., Davey, C. G., et al. (2015). Abnormal social reward responses in anorexia nervosa: an fMRI study. PLoS ONE 10:e0133539. Vocks, S., Busch, M., Grönemeyer, D., Schulte, D., Herpertz, S., and Suchan, B. (2010). Neural correlates of viewing photographs of one's own body and another woman's body in anorexia and bulimia nervosa: an fMRI study. J. Psychiatry Neurosci. 35, 163–176. Vocks, S., Herpertz, S., Rosenberger, C., Senf, W., and Gizewski, E. R. (2011). Effects of gustatory stimulation on brain activity during hunger and satiety in females with restricting-type anorexia nervosa: an fMRI study. J. Psychiatr. Res. 45, 395–403. Voss, U., Holzmann, R., Hobson, A., Paulus, W., Koppehele-Gossel, J., Klimke, A., et al. (2014). Induction of self awareness in dreams through frontal low current stimulation of gamma activity. Nat. Neurosci. 17, 810–812. Wagner, A., Aizenstein, H., Mazurkewicz, L., Fudge, J., Frank, G. K., Putnam, K., et al. (2008). Altered insula response to taste stimuli in individuals recovered from restricting-type anorexia nervosa. Neuropsychopharmacology 33, 513–523. Wagner, A., Aizenstein, H., Venkatraman, V. K., Fudge, J., May, J. C., Mazurkewicz, L., et al. (2007). Altered reward processing in women recovered from anorexia nervosa. Am. J. Psychiatry164, 1842–1849. Walpoth, M., Hoertnagl, C., Mangweth-Matzek, B., Kemmler, G., Hinterhölzl, J., Conca, A., et al. (2008). Repetitive transcranial magnetic stimulation in bulimia nervosa: preliminary results of a single-centre, randomised, double-blind, sham-controlled trial in female outpatients. Psychother. Psychosom. 77, 57–60. Walsh, B. T. (2013). The enigmatic persistence of anorexia nervosa. Am. J. Psychiatry 170, 477–484. Weygandt, M., Schaefer, A., Schienle, A., and Haynes, J. D. (2012). Diagnosing different binge-eating disorders based on reward-related brain activation patterns. Hum. Brain Mapp. 33, 2135–2146. Wierenga, C. E., Ely, A., Bischoff-Grethe, A., Bailer, U. F., Simmons, A. N., and Kaye, W. H. (2014). Are extremes of consumption in eating disorders related to an altered balance between reward and inhibition? Front. Behav. Neurosci. 8:410. Wiethoff, S., Hamada, M., and Rothwell, J. C. (2014). Variability in response to transcranial direct current stimulation of the motor cortex. Brain Stimul. 7, 468–475. Wildes, J. E., Forbes, E. E., and Marcus, M. D. (2014). Advancing research on cognitive flexibility in eating disorders: the importance of distinguishing attentional set-shifting and reversal learning. Int. J. Eat. Disord. 47, 227–230. Wildes, J. E., Forbush, K. T., and Markon, K. E. (2013). Characteristics and stability of empirically derived anorexia nervosa subtypes: towards the identification of homogeneous low-weight eating disorder phenotypes. J. Abnorm. Psychol. 122, 1031–1041. Wildes, J., and Marcus, M. (2015). Application of the Research Domain Criteria (RDoC) framework to eating disorders: emerging concepts and research. Curr. Psychiatry Rep. 17, 1–10. Wonderlich, S. A., Crosby, R. D., Joiner, T., Peterson, C. B., Bardone-Cone, A., Klein, M., et al. (2005). Personality subtyping and bulimia nervosa: psychopathological and genetic correlates. Psychol. Med. 35, 649–657. Wu, M., Hartmann, M., Skunde, M., Herzog, W., and Friederich, H.-C. (2013). Inhibitory control in bulimic-type eating disorders: a systematic review and meta-analysis. PLoS ONE 8:e83412. Zastrow, A., Kaiser, S., Stippich, C., Walther, S., Herzog, W., Tchanturia, K., et al. (2009). Neural correlates of impaired cognitive-behavioral flexibility in anorexia nervosa. Am. J. Psychiatry 166, 608–616.
470
Copyright Acknowledgements This thesis acknowledges the following copyright permissions: Elsevier Limited for permission to reproduce the following published article:
Dunlop, K., Woodside. B., Lam, E., Olmsted, M., Colton, P., Giacobbe, P., Downar, J. (2015).
“Increases in frontostriatal connectivity are associated with response to dorsomedial repetitive
transcranial magnetic stimulation in refractory binge/purge behaviors.” NeuroImage: Clinical 8:
611-8.
The Nature Publishing Group for permission to reproduce the following published article:
Dunlop, K., Woodside, B., Olmsted, M., Colton, P., Giacobbe, P., Downar, J. (2016).
“Reductions in cortico-striatal hyperconnectivity accompany successful treatment of obsessive-
compulsive disorder with dorsomedial prefrontal rTMS.” Neuropsychopharmacology 41(5):
1395-403.
Frontiers Editorial for permission to reproduce the following published article: Dunlop, K.,
Woodside, B., Downar, J. (2015). Targeting Neural Endophenotypes of Eating Disorders with
Non-invasive Brain Stimulation. Frontiers in Neuroscience, (10): 30.
Wiley Periodicals Inc. on behalf of The New York Academy of Sciences for permission to
reproduce the following published article: Dunlop, K., Hanlon, C.A., Downar, J. (2017).
Noninvasive brain stimulation treatments for addiction and major depression. Annals of the New
York Academy of Science, 1394(1): 31-54.
Journal of Visualized Experiments for permission to reproduce the following published
article: Dunlop, K., Gaprielian, P., Blumberger, D., Daskalakis, Z.J., Kennedy, S.H., Giacobbe,
P., Downar, J. (2015). MRI-guided dmPFC-rTMS as a Treatment for Treatment-resistant Major
Depressive Disorder. Journal of Visualized Experiments, (102): 53129.