Learning Product Characteristics and Consumer Preferences ...
Upload
independentCategory
view
1download
0
PSYCHOMETRIC EVALUATION OF FOOD PREFERENCES
HOWARD R. MOSKOWITZ
Developmetrics, Inc. Division of Weston Group, Inc.
Westport, Conn. 06880
INTRODUCTION
Quantitative evaluation of what foods people like and dislike is impor- tant from several points of view.
(1) The menu planner needs to know what foods to serve, and what foods consumers will not accept. The decision to serve a food based upon its acceptability recognizes the fact that despite a food’s nutritional pro- perties it will go to waste if the food is unacceptable, or if the food is so poorly prepared that it is unappealing to the consumer.
foods satisfy consumer (improving sales or participation rates), as well as which of those acceptable foods provide the adequate nutrition at a reasonable cost.
(3) The psychologist, interested in the likes and dislikes of people, must know which foods are acceptable and which are not. Food is a major motivating force in various behaviors.
A century ago there was little choice for most individuals in the foods they ate. Food served was what was agriculturally feasible, or what could be purchased at the local market. Because modern food preservation was in its infancy (canning had been invented only 50 years before during Napoleon’s era, by Nicholas Appert, and artificial refrigeration was yet to come), more often than not food quality varied dramatically. Spices were used frequently to disguise the taste and odor of spoiled or rotting food. Food preferences a century ago would have had little more than academic interest. Restaurants were relatively few, and the choice of foods to the ordinary person reflected what items he or she would typically get at home. Meal patterns were set so that a worker would generally go home for lunch, rather than eat in a company sponsored cafeteria, a local restaurant, or a fast-food chain as might be the case today.
interested in the food patterns and food preferences of Americans. Re- searchers, such as Duncker (1938) and Gauger (1929) conducted small- scale studies on the lability of preferences, for example: does a child’s preference for a food maintain itself over a long period of time, or are
(2) The food manager must know, from an economic viewpoint, which
It was not until the 1930’s and 1940’s that researchers became seriously
Journal of Foodservice Systems l(1980) 149-167. All Rights Reserved. mopyright 1981 by Food & Nutrition Press, Inc., Westport, Connecticut 149
150 HOWARD R. MOSKOWITZ
children’s food preferences fickle, and unreliable. Some of these early studies showed that:
(a) Children do show definite preferences. To some extent the pre- ferences are dictated by taste (i.e., sweet foods are liked more than bitter foods).
child will exhibit a specific desire for a food if the child is first given the opportunity to observe an older child selecting that food.
(c) Food preferences of children are fickle. What a child likes one day is not necessarily the same as what the same child likes the next day. There is some consistency, however, or else there would be totally ran- dom food behavior, which there is not. Children’s preferences are markedly variable, and labile.
Recent work by Trygg Engen (1974)’ a psychologist at Brown Univer- sity, suggests that the range of child preferences for food and non-food odorants may be smaller than the range of preferences shown by adults. In contrast to the early work by Dunker (1938) and Gauger (1929) Engen used more sophisticated scaling techniques, in an experimental set- ting. The children were asked to state which odorant of a pair of food- type odorants they preferred. Children’s preferences showed greater ten- dency towards a 50: 50 situation, than did adults. These young children did show preferences, but not consistent ones from child to child. As a consequence, the analysis of these direct paired preference ratings suggested that children operate with a much shorter psychological scale of prefer- ences. Only with this shortened scale would Engen expect to see the ten- dency for weaker preferences for one odorant over another. Engen’s studies bear out the observations by Duncker and Gauger. Children do show preferences, but fickle ones.
(b) Some of the food preferences are socially determined. A very young
THE ORIGINS AND TYPES OF FOOD PREFERENCE SCALES
During World War 11, quality control of rations became an important issue for the military. Food is an important morale item for an army, and is a link with the soldier’s home life. Military concern with quality control also extended to an involvement with the soldier’s response to the taste, flavor and overall acceptance of the food item. The Army Quartermaster Corps was very concerned with assuring high quality of food to its soldiers. Surveys of food preference and laboratory evaluation of actual foods be- came an integral part of this quality assurance. The published works of the U.S. Quartermaster Corps during the 1940’s and 1950’s and later by the U.S. Army Natick Laboratories in the 1960’s and 1970’s’ provide a
PSYCHOMETRIC EVALUATION O F FOOD PREFERENCES 151
valuable source reference for the food likes and dislikes of young mili- tary men.
Other research that was done during the same time included the de- velopment of new scaling procedures by the government to assess dif- ferent aspects of food appreciation. Some of these approaches are des- cribed below:
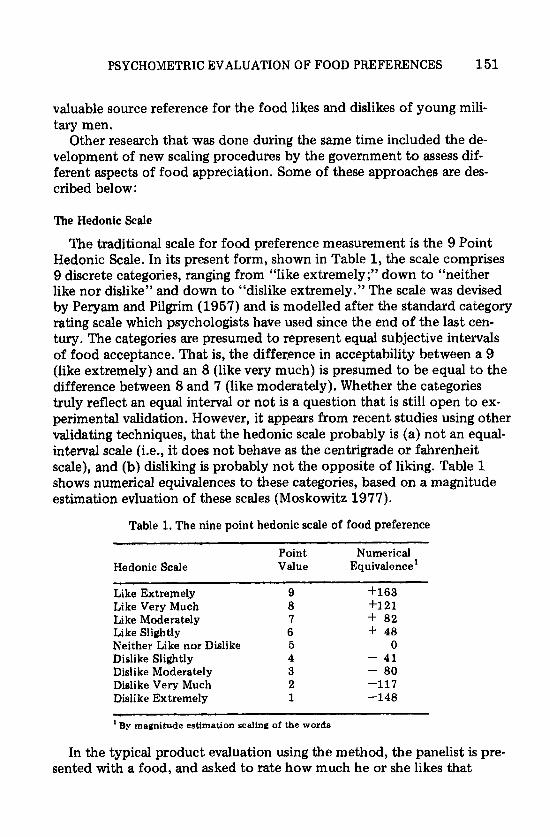
The Hedonic Scale
The traditional scale for food preference measurement is the 9 Point Hedonic Scale. In its present form, shown in Table 1, the scale comprises 9 discrete categories, ranging from “like extremely;” down to “neither like nor dislike” and down to “dislike extremely.” The scale was devised by Peryam and Pilgrim (1957) and is modelled after the standard category rating scale which psychologists have used since the end of the last cen- tury. The categories are presumed to represent equal subjective intervals of food acceptance. That is, the difference in acceptability between a 9 (like extremely) and an 8 (like very much) is presumed to be equal to the difference between 8 and 7 (like moderately). Whether the categories truly reflect an equal interval or not is a question that is still open to ex- perimental validation. However, it appears from recent studies using other validating techniques, that the hedonic scale probably is (a) not an equal- interval scale (i.e., it does not behave as the centrigrade or fahrenheit scale), and (b) disliking is probably not the opposite of liking. Table 1 shows numerical equivalences to these categories, based on a magnitude estimation evluation of these scales (Moskowitz 1977).
Table 1, The nine point hedonic scale of food preference
Hedonic Scale Point Numerical Value Equivalence’
Like Extremely 9 +163 Like Very Much 8 +121 Like Moderately 7 + 82 Like Slightly 6 4- 48 Neither Like nor Dislike 6 0 Dislike Slightly 4 - 41 Dislike Moderately 3 - 80 Dislike Very Much 2 -117 Dislike Extremely 1 -148
By magnitude estimation scaling of the words
In the typical product evaluation using the method, the panelist is pre- sented with a food, and asked to rate how much he or she likes that
152 HOWARD R. MOSKOWITZ
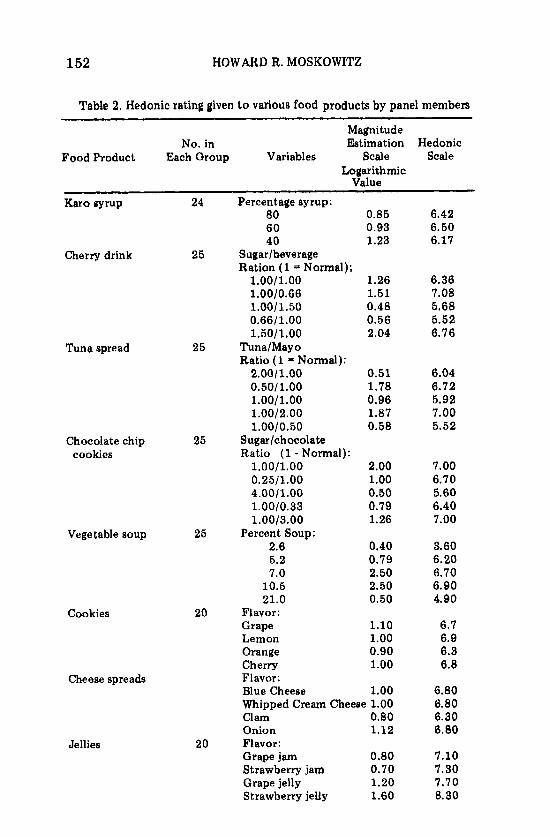
Table 2. Hedonic rating given to various food products by panel members
Magnitude No. in Estimation Hedonic
Food Product Each Group Variables Scale Scale Logarithmic
Value
Karo Pyrup
Cherry drink
Tuna spread
Chocolate chip cookies
Vegetable soup
Cookies
Cheese spreads
Jellies
24
25
25
25
25
20
20
Percentage syrup: 80 0.85 60 0.93 40 1.23
Sugar1 beverage Ration (1 = Normal); l.OO/l.OO 1.26 1.00/0.66 1.51 1.00/1.50 0.48 0.66/1.00 0.56 1.50/ 1.00 2.04
Tuna/Mayo Ratio (1 = Normal): 2.001 1 .oo 0.51 0.50/1.00 1.78 1.00/1.00 0.96 1.00/2.00 1.87 1.00/0.50 0.58
Sugarlchocolate Ratio (1 - Normal): 1.00/1.00 2.00 0.25/1.00 1.00 4.0011.00 0.60 1.00/0.33 0.79 1.00/3.00 1.26
2.6 0.40 5.2 0.79 7.0 2.50 10.5 2.50 21.0 0.50
Percent Soup:
Flavor: Grape 1.10 Lemon 1.00 Orange 0.90 Cherry 1.00 Flavor: Blue Cheese 1.00 Whipped Cream Cheese 1.00 Clam 0.80 Onion 1.12 Flavor: Grape jam 0.80 Strawberry jam 0.70
Strawberry jelly 1.60 Grape jelly 1.20
6.42 6.50 6.17
6.36 7.08 5.68 5.52 6.76
6.04 6.72 5.92 7.00 5.52
7.00 6.70 5.60 6.40 7.00
3.60 6.20 6.70 6.90 4.90
6.7 6.9 6.3 6.8
6.80 6.80 6.30 6.80
7.10 7.30 7.70 8.30
PSYCHOMETRIC EVALUATION OF FOOD PREFERENCES 153
food. Table 2 provides some idea of the types of hedonic ratings that are given to aseries of foods, in an actual situation (Moskowitz and Side1 1971). These data were collected at the U.S. Army Natic Development Center where an ongoing panel of in-house employees evaluates the acceptability of new products, and of stored military rations. Table 3 provides some other types of fixed point scales used by investigators.
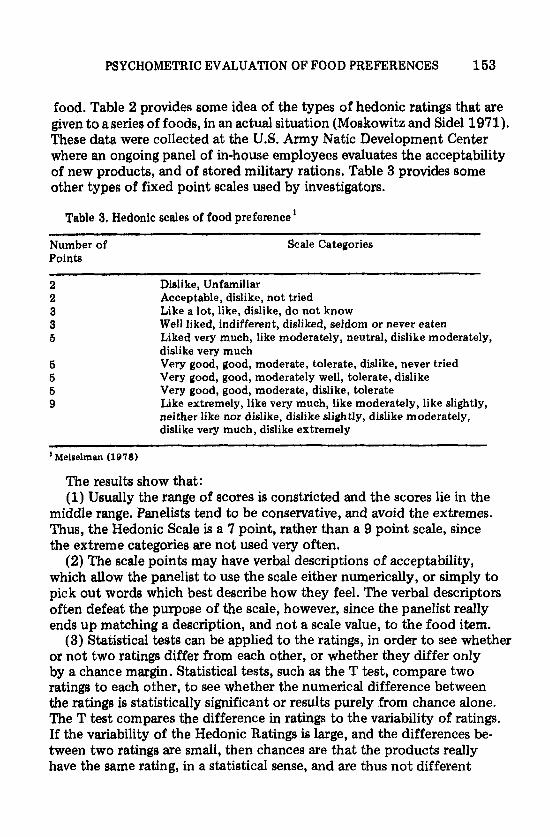
Table 3, Hedonic scales of food preference' ~ ~
Number of Scale Categories Points
Dislike, Unfamiliar Acceptable, dislike, not tried Like a lot, like, dislike, do not know Well liked, indifferent, disliked, seldom or never eaten Liked very much, like moderately, neutral, dislike moderately, dislike very much Very good, good, moderate, tolerate, dislike, never tried Very good, good, moderately well, tolerate, dislike Very good, good, moderate, dislike, tolerate Like extremely, like very much, like moderately, like slightly, neither like nor dislike, dislike slightly, dislike moderately, dislike very much, dislike extremely
_- - -
' Meiselman (1978)
The results show that: (1) Usually the range of scores is constricted and the scores lie in the
middle range. Panelists tend to be conservative, and avoid the extremes. Thus, the Hedonic Scale is a 7 point, rather than a 9 point scale, since the extreme categories are not used very often.
(2) The scale points may have verbal descriptions of acceptability, which allow the panelist to use the scale either numerically, or simply to pick out words which best describe how they feel. The verbal descriptors often defeat the purpose of the scale, however, since the panelist really ends up matching a description, and not a scale value, to the food item.
or not two ratings differ from each other, or whether they differ only by a chance margin. Statistical tests, such as the T test, compare two ratings to each other, to see whether the numerical difference between the ratings is statistically significant or results purely from chance alone. The T test compares the difference in ratings to the variability of ratings. If the variability of the Hedonic Ratings is large, and the differences be- tween two ratings are small, then chances are that the products really have the same rating, in a statistical sense, and are thus not different
(3) Statistical tests can be applied to the ratings, in order to see whether

154 HOWARD R. MOSKOWITZ
from each other. If, however, the variability of the ratings is small, rela- tive to the difference between two ratings for two foods, then chances are high that the two products really differ, and that panelists prefer one product to another. (4) Statistical analyses suggest that stated food preference ratings are
only part of the story of food product acceptability. Serving history, the particular mood a respondent is in when filling out the rating ballots, and idiosyncrasies in the product preparation are other influences on food preferences.
Food Action Scale
ments about a food, ranging from “I’d eat it every opportunity I get,” to “I would eat if forced.” The scale was first published by Schutz (1965) who designed it to be an adjunct scale, which could measure food accep- tance better than the standard Hedonic Scale of Food Preference. Table 4 presents the final published scale.
The Food Action or “FACT” scale comprises a series of categorical state-
Table 4. Categories for the Food Action Scale (Fact Scale)
Eat Every Opportunity Eat Very Often Frequently Eat Eat Now and Then Eat if Available Don’t Like, Eat on Occasion Hardly Ever Eat Eat if No Other Choices Eat if Forced
I h e Magnitude Estimation Scale
Magnitude estimation is a psychophysical scaling procedure which al- lows consumem to rate how much they like or dislike a food. It is based on psychophysical methods for measuring sensory perceptions on a ratio or proportion scale. Some of the earliest work using the method for scaling food acceptance (Moskowitz and Side1 1971) was done in the following way.
(a) Panelists were instructed that they could use any starting number (magnitude estimate) that they wished to show how much they liked a food.
(b) When another food was presented, the panelist was to rate how much more or less he liked the second food compared to the first. If for
PSYCHOMETRIC EVALUATION OF FOOD PREFERENCES 165
example, the two foods were liver and steak and a panelist rated liver as 5 and steak as 60, one would conclude that the panelist liked steak 12 times more than liver. If the panelist had assigned a value of 32 for liver and 2 for steak, one could conclude that the panelist liked liver 16 times more than steak. The method of evaluating food acceptance paralleled other scientific studies on the acceptability of simple sugar solutions (Moskowitz 1971).
(c) This scaling approach permits the researcher to determine by what percentage one food is preferred to another. In contrast, the traditional 9 point scale can indicate only that liver is liked significantly more or less than steak, but not by how much more or less.
Table 2 shows some published information on product ratings with magnitude estimation scaling (Moskowitz and Side1 1971), and compares them to Hedonic Scale ratings for the same foods. The magnitude estima- tion scaling approach has been shown to be
(a) more sensitive than the 9 point scaling method in discerning food preference differences (McDaniel and Sawyer 1980; Moskowitz 1980).
(b) more amenable to standard statistical analyses than the 9 point food preference scale, because there are no biases in using the scale at its extremes.
Currently, the magnitude estimation method is being used commer- cially, to assess
(a) preferences for foods by consumers, and (b) directions for recipe and food product improvement.
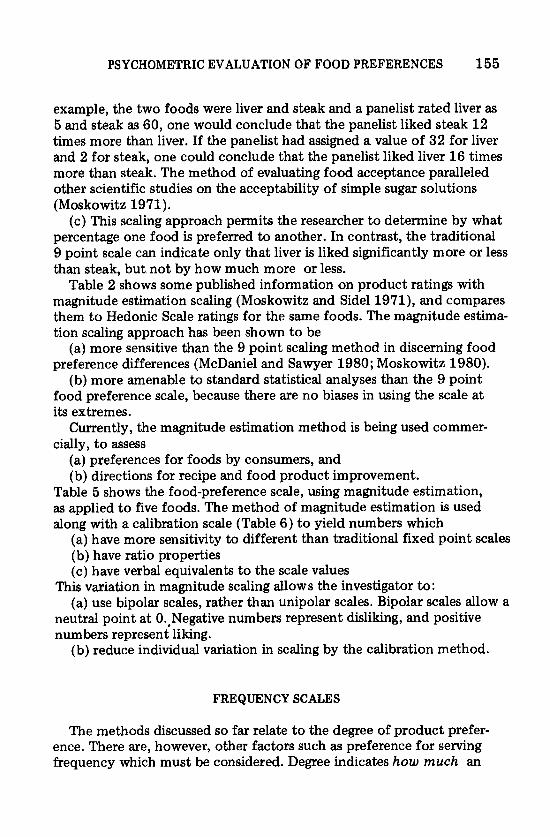
Table 5 shows the food-preference scale, using magnitude estimation, as applied to five foods. The method of magnitude estimation is used along with a calibration scale (Table 6) to yield numbers which
(a) have more sensitivity to different than traditional fixed point scales (b) have ratio properties (c) have verbal equivalents to the scale values
(a) use bipolar scales, rather than unipolar scales. Bipolar scales allow a This variation in magnitude scaling allows the investigator to:
neutral point at O..Negative numbers represent disliking, and positive numbers represent liking.
(b) reduce individual variation in scaling by the calibration method.
FREQUENCY SCALES
The methods discussed so far relate to the degree of product prefer- ence. There are, however, other factors such as preference for serving frequency which must be considered. Degree indicates how much an
166 HOWARD R. MOSKOWITZ
Table 5. Liking for 5 foods' actually eaten using the modified magnitude estima- tion scale2
Food Standard Error
Mean of the Mean Calibrating Scale
Roasted Meat 111.53 15.86 Like Extremely Like Very Much
Vegetable 37.89 13.57 Like Moderately Like Slightly
Potato 59.38 8.36 Neutral Dislike Slightly
Salad 76.10 9.34 Dislike Moderately Dislike Very Much
Dessert 56.12 18.64 Dislike Extremely
177 123 74 34 0 - 33
- 71 -117 -170
' Specific foods eaten at a meal, N = 26 panelists 'Vaisey-Genser et al. (1977)
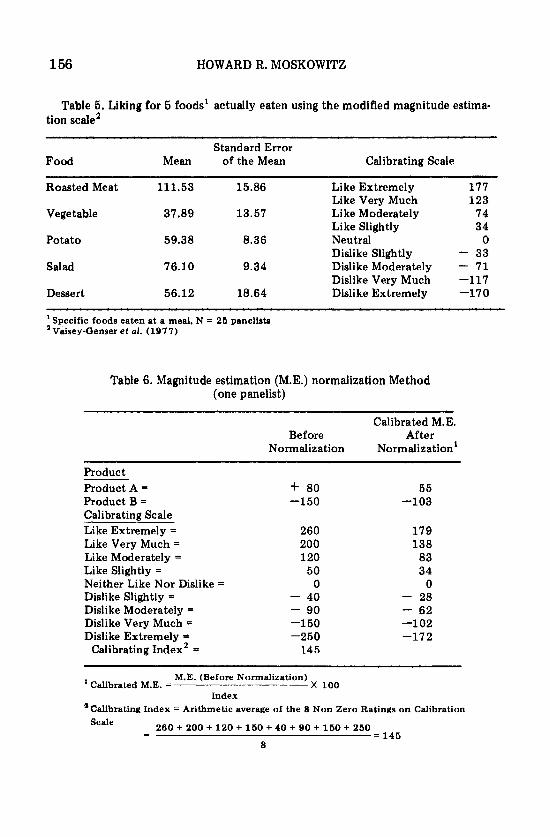
Table 6. Magnitude estimation (M.E.) normalization Method (one panelist)
Calibrated M.E. Before After
Normalization Normalization'
Product Product A = Product B = Calibrating Scale Like Extremely = Like Very Much = Like Moderately = Like Slightly = Neither Like Nor Dislike = Dislike Slightly = Dislike Moderately = Dislike Very Much = Dislike Extremely =
Calibrating Index' =
+ 80 -150
260 200 120 50 0
- 40 - 90 -1 50 -250 145
55 -103
179 138 83 34 0
- 28 - 62 -102 -172
M.E. (Before Normalization) Calibrated M.E. = x 100
Index .2Calibrating Index = Arithmetic average of the 8 Non Zero Ratings on Calibration
260 + 200 + 120 + 160 + 40 + 90 + 150 + 260 8
Scale - = 146
PSYCHOMETRIC EVALUATION OF FOOD PREFERENCES 157
individual wants a specific food. Frequency indicates how often an in- dividual would like to have the food served. The individual may not par- ticularly care to have a food (e-g., liver), but will choose that food on a rare occasion, especially if the food has not been selected or offered for a considerable period previous to the choice situation
The FACT scale is an intermediate link between scales of product liking, and scales of product frequency. However, the FACT scale does not indicate the desired degree of serving frequency.
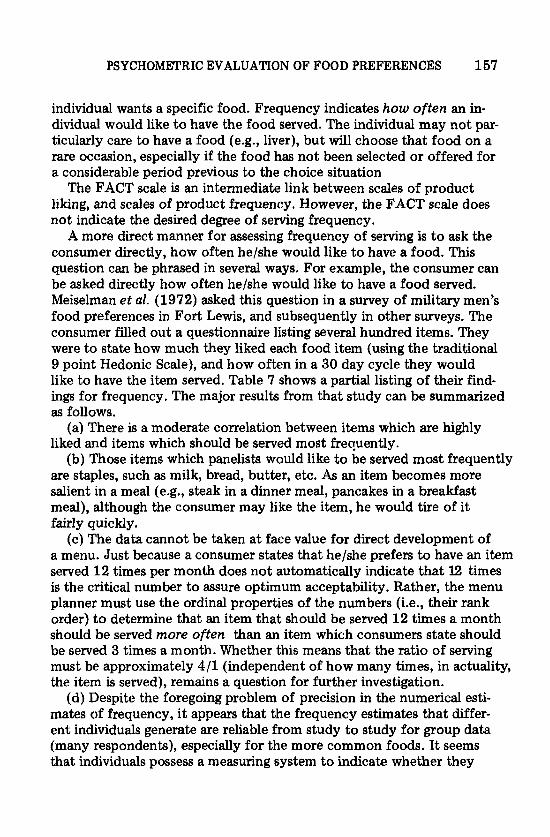
A more direct manner for assessing frequency of serving is to ask the consumer directly, how often he/she would like to have a food. This question can be phrased in several ways. For example, the consumer can be asked directly how often he/she would like to have a food served. Meiselman e t al. (1972) asked this question in a survey of military men’s food preferences in Fort Lewis, and subsequently in other surveys. The consumer filled out a questionnaire listing several hundred items. They were to state how much they liked each food item (using the traditional 9 point Hedonic Scale), and how often in a 30 day cycle they would like to have the item served. Table 7 shows a partial listing of their find- ings for frequency. The major results from that study can be summarized as follows.
(a) There is a moderate correlation between items which are highly liked and items which should be served most frequently.
(b) Those items which panelists would like to be served most frequently are staples, such as milk, bread, butter, etc. As an item becomes more salient in a meal (e.g., steak in a dinner meal, pancakes in a breakfast meal), although the consumer may like the item, he would tire of it fairly quickly.
(c) The data cannot be taken at face value for direct development of a menu. Just because a consumer states that he/she prefers to have an item served 1 2 times per month does not automatically indicate that 12 times is the critical number to assure optimum acceptability. Rather, the menu planner must use the ordinal properties of the numbers (i.e., their rank order) to determine that an item that should be served 12 times a month should be served more often than an item which consumers state should be served 3 times a month. Whether this means that the ratio of serving must be approximately 4/1 (independent of how many times, in actuality, the item is served), remains a question for further investigation.
(d) Despite the foregoing problem of precision in the numerical esti- mates of frequency, i t appears that the frequency estimates that differ- ent individuals generate are reliable from study to study for group data (many respondents), especially for the more common foods. It seems that individuals possess a measuring system to indicate whether they
158 HOWARD R. MOSKOWITZ
would like to have an item served more frequently or less frequently.
Table 7. Degree of preference and desired serving frequency of some foods as found in Fort Lewis survey'
Item Preference' FrequencyIMonth
Hamburger Pizza Lobster newburg Ham Chicken Pot roast French fried potatoes Mashed potatoes Boston baked beans Rice Fritters Sweet potatoes Creamed corn Carrots Brussel sprouts Broccoli Peas Yellow squash Banana salad Mixed fruit salad Waldorf salad Cole slaw Lettuce tomato salad Tossed green salad Sugar cookie Chocolate pudding Devils food cake Cherry pie Ice cream Strawberry gelatin White bread Milk - ' Meiselmen et al. (1972).
Based on 9 Point Hedonic Scale
6.95 6.82 5.44 6.79 7.26 6.79 7.28 6.75 5.52 5.46 5.25 6.90 6.13 5.40 3.96 5.57 5.57 3.88 5.04 5.70 4.08 5.25 6.56 6.26 5.24 6.25 6.29 6.26 7.32 5.64 7.18 8.03
9.25 4.64 3.16 4.05 6.40 3.85 10.36 8.54 3.75 4.19 2.06 7.99 6.62 4.51 1.51 3.91 3.91 1.34 2.70 4.86 1.86 4.89 11.14 11.06 4.75 5.15 4.14 5.50 9.60 3.46 16.87 22.0 0
TIME/PREFERENCE ANALYSIS
Balintfy and his co-workers (1975) have stressed the importance of a time-preference function. The rationale underlying the function is that an individual's preference for a food is conditioned both by the basic
PSYCHOMETRIC EVALUATION OF FOOD PREFERENCES 159
preference for that item, and by the history of eating the item. An indi- vidual who has consumed a food just recently may desire the food less strongly than if he has not consumed the food for a long time. In addi- tion, the time-preference approach does not rely solely upon a single estimate of idealized serving frequency. Rather, it shows how preferences for an item change as a function of the serving history of that item, and tries to determine (a) i.e., the optimal serving frequency, and (b) the preference shift if a food is not served at the optimal frequency.
number of papers, containing both the mathematical treatments and illustrative examples. They suggest the following.
(a) The preference for a food item follows an increasing function, versus time since the item was last served. That is, the time-preference function shows increasing acceptance for the food, as the time since its last serving increases.
(b) The time-preference function has a memory for previous servings. If an item has not been served for a month, its current preference is a function of both that one month interval, and of the preference that the item had one month ago.
is assumed to show increasing preference for items, if he or she had not consumed that food for a specified period of time, each individual can actually exhibit a rapid or a slow buildup of acceptability. Individuals who show a rapid buildup of acceptance versus time since last serving are those who show relatively little sensitivity to inter-serving time interval. Individuals who exhibit a slow increase of acceptability, after a serving consumed several months previously, are those individuals whose pre- ferences are much more severely time-dependent. Unfortunately, insuf- ficient data exist to correlate this time-dependency with other aspects of an individual's behavior, such as personality or lifestyle.
Figure 1 shows a prototypical time-preference curve. Note the sensi- tivity of acceptance to time since last consumed, and to the person's level of liking.
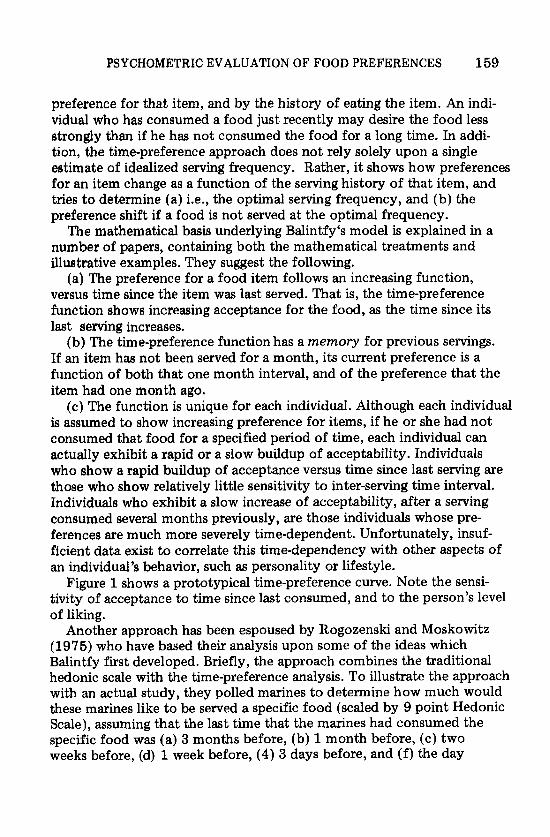
Another approach has been espoused by Rogozenski and Moskowitz (1975) who have based their analysis upon some of the ideas which Balintfy first developed. Briefly, the approach combines the traditional hedonic scale with the time-preference analysis. To illustrate the approach with an actual study, they polled marines to determine how much would these marines like to be served a specific food (scaled by 9 point Hedonic Scale), assuming that the last time that the marines had consumed the specific food was (a) 3 months before, (b) 1 month before, (c) two weeks before, (d) 1 week before, (4) 3 days before, and (f) the day
The mathematical basis underlying Balintfy's model is explained in a
( c ) The function is unique for each individual. Although each individual

U
1 Nu
mbe
r of
Ser
ving
s
Rel
atio
nshi
p b
etw
een
ser
ving
fre
quen
cy,
tota
l ef
eren
ce, a
vera
ge p
refe
renc
e, a
nd in
crem
enta
l pre
fere
nce
0 20
Pre
fere
lice
for
mea
t lo
af s
erve
d on
day
s 1, 7
, 10
, an
d 20
of
a fe
edin
g sc
hedu
le
FIG
. 1. P
RO
TO
TY
PIC
AL
TIM
E PR
EFE
RE
NC
E C
UR
VE
FO
R T
HE
AC
CE
PTA
BIL
ITY
OF
ME
AT
LO
AF,
USI
NG
BA
LIN
TFY
’S
Not
e th
at p
refe
renc
e is
not
con
stan
t, b
ut r
athe
r va
ries
as
a fu
ncti
on o
f in
trin
sic
item
acc
epta
nce,
ti
e si
nce
last
ser
ving
, and
sew
-
TIM
E-P
RE
FER
EN
CE
APP
RO
AC
H (F
RO
M B
AL
INT
FY ET
AL
. 197
5, W
ITH
PE
RM
ISSI
ON
)
ing
hist
ory
over
all.
PSYCHOMETRIC EVALUATION OF FOOD PREFERENCES 161
Yester - FOOD N O . 3 MOS 1 MO. 2 W K S 1 W K . 3 DAYS day
0 7 3 1
Bread Pudding
Yes ter - FOOD NO. 3 MOS 1 MO. 2 W K S 1 W K . 3 DAYS day
1 7 4 5
Sal i sbury Steak
Yes ter - FOOD NO, 3 MOS 1 MO. 2 W K S 1 W K . 3 DAYS day
1 7 5 1
French Fried Onion Rings
Y e s t e r - FOOD NO. 3 MOS 1 MO. 2 W K S 1 W K . 3 DAYS day -
Sausage Links
Yester - MOS 1 MO. 2 W K S 1 W K . 3 DAYS day
before. See Fig. 2. This information generates a time/preference curve.
RATINGS:
PLEASE USE THE FOLLOWING SCALE TO RATE THE FOODS:
0-NEVER TRIED 1-DISLIKE EXTRMELY 2-DISLIKE VERY MUCH 3-DISLIKE MODERATELY 4-DISLIKE SLIGHTLY NEITHER DISLIKE
NOR LIKE 6-LIKE SLIGHTLY 7-LIKE MODERATELY &LIKE VERY MUCH 9-LIKE EXTREELELY
1 1 0 7 7 1 I
Baked Potato
Yester - FOOD NO. 3 MOS 1 MO. 2 W K S 1 W K . 3 DAYS
FIG. 2. FOOD PREFERENCE SURVEY FOR EVALUATION OF AC- CEPTANCE OF FOOD ITEMS BY MILITARY MEN
Each food is evaluated on the food liking scale ( 9 point Hedonic Scale), assuming that the last time the food was eaten was 3 months previously,
1 month previously, etc.
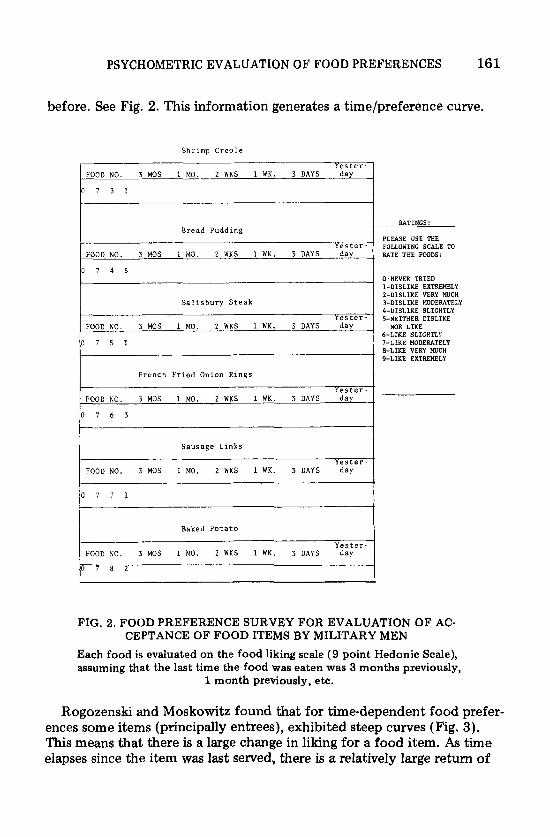
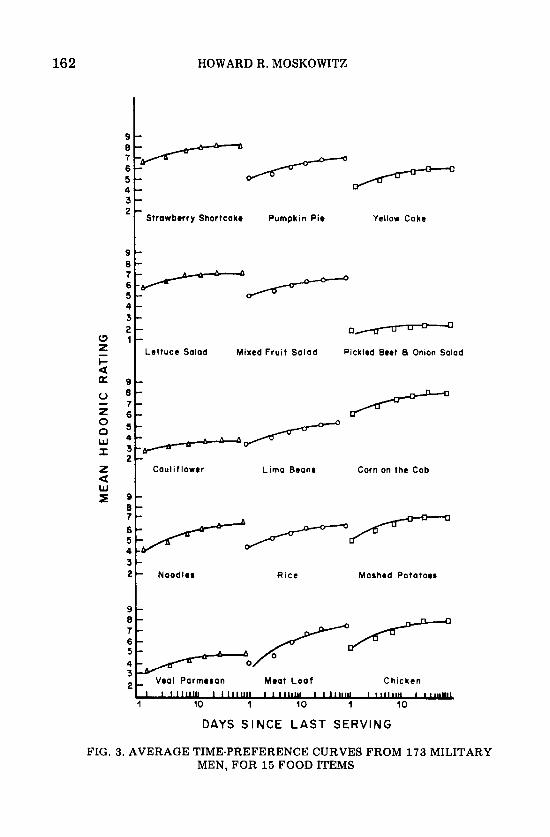
Rogozenski and Moskowitz found that for time-dependent food prefer- ences some items (principally entrees), exhibited steep curves (Fig. 3). This means that there is a large change in liking for a food item. As time elapses since the item was last served, there is a relatively large return of
162
9 -
6 5 - 4 - 3 -
9 - 8 -
5 B 4 -
8 -
‘J
8
4
2
HOWARD R. MOSKOWITZ
:://
- Strawbrrry Shortcakr Pumpkin Pie Yellow Cake
+---//-- 3 -
1 - 2 - 0-
Lettuce Solad Mixed Fruit Salad Pickled Beet 8 Onlon Salad
9 -
7 - 6 - 5 -
/+-
Corn on the Cob
/ -+--+- 2 -
Cauliflower Lima Beans
9 -
i;//+-/@- 3 -
- Noodlrr Rice Mashed Pototoer
(3 z
W I z W I a
9 1
Vral Parmrran Moat L o a f Chicken
1 10 1 10 1 10
DAYS S INCE LAST SERVING
FIG. 3. AVERAGE TIME-PREFERENCE CURVES FROM 173 MILITARY MEN, FOR 15 FOOD ITEMS
PSYCHOMETRIC EVALUATION OF FOOD PREFERENCES 163
the item’s acceptability. Conversely, if the time-preference curve is flat (as it seems to be for vegetables and salads), there is neither a dramatic decrease in overall liking for the product after serving, nor a quick return to a high level of acceptability.
SALIENCE OF FOOD ITEMS IN A MEAL
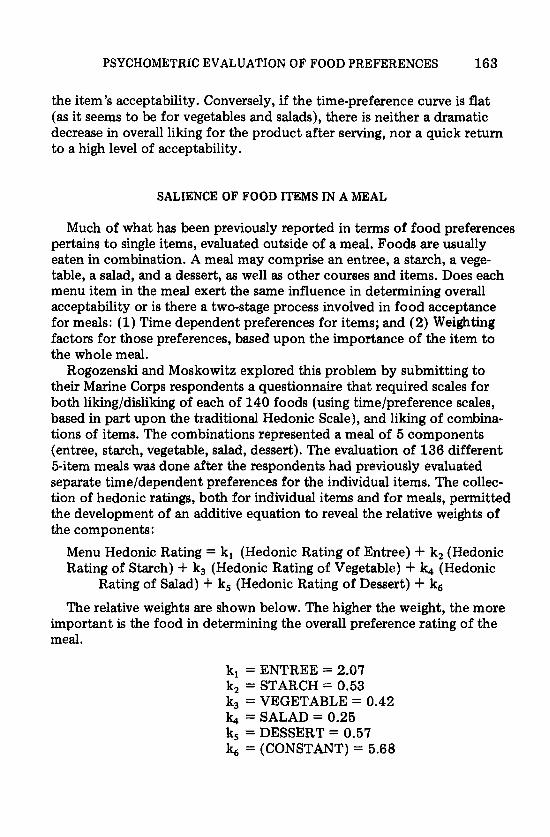
Much of what has been previously reported in terms of food preferences pertains to single items, evaluated outside of a meal. Foods are usually eaten in combination. A meal may comprise an entree, a starch, a vege- table, a salad, and a dessert, as well as other courees and items. Does each menu item in the meal exert the same influence in determining overall acceptability or is there a two-stage process involved in food acceptance for meals: (1) Time dependent preferences for items; and (2) Weighting factors for those preferences, based upon the importance of the item to the whole meal.
Rogozenski and Moskowitz explored this problem by submitting to their Marine Corps respondents a questionnaire that required scales for both liking/dislikmg of each of 140 foods (using timelpreference scales, based in part upon the traditional Hedonic Scale), and liking of combina- tions of items. The combinations represented a meal of 5 components (entree, starch, vegetable, salad, dessert). The evaluation of 136 different 5-item meals was done after the respondents had previously evaluated separate time/dependent preferences for the individual items. The collec- tion of hedonic ratings, both for individual items and for meals, permitted the development of an additive equation to reveal the relative weights of the components:
Menu Hedonic Rating = kl (Hedonic Rating of Entree) f k2 (Hedonic Rating of Starch) + k3 (Hedonic Rating of Vegetable) + k4 (Hedonic
The relative weights are shown below. The higher the weight, the more
Rating of Salad) + k, (Hedonic Rating of Dessert) i- k6
important is the food in determining the overall preference rating of the meal.
kl = ENTREE = 2.07 k, = STARCH = 0.53
= SALAD = 0.25 kj = VEGETABLE = 0.42
k5 = DESSERT = 0.57 k6 = (CONSTANT) = 5.68
164 HOWARD R. MOSKOWITZ
FOOD PREFERENCES AND FOOD CONSUMPTION
Do people eat a lot of what they like and little of what they do not like? Stated differently: if a person likes a food item, will he choose it, and if he does choose it, will he consume an amount proportional to how much he likes the food?
Psychologists have investigated this question using animals as test sub- jects, and have found some interesting results which bear upon human food choices.
(a) During short-term exposures to food (e.g. 2 two hour exposures), an animal will consume relatively more of what it likes. For instance, if the animal is presented with a highly sweetened drink versus a blander drink, then the animal drinks more of the sweeter drink. When the time of exposure is lengthened, then the reverse happens. The animals shift away from the highly sweetened drink, to consume more of the blander product.
They do not consistently choose the food that they like the most. Rather, they sample different foods. They will change food choice so that they choose or at least sample a new food that was hitherto unacceptable.
show only moderate correlations between what people say they like and how much they consume of that item. Smutz et al. (1975) investigated food preferences versus food consumption, and found only a modest cor- relation between the two. Other factors besides innate liking/disliking of the food must contribute to how much an individual will eat. These factors can include:
(b) Animals show variability in their food choice behavior, as do children.
Psychological studies correlating food intake with food acceptance also
(a) Time/preference factors; (b) Body state. For example, if an individual is deprived or has low
blood sugar he may momentarily prefer a candy bar to a blander, less sweet food. Obese individuals prefer either much sweeter foods, or much less sweet foods, compared to normals (Rodin et al. 1976; Moskowitz 1979). Individuals with actuate kidney failure, who are undergoing renal dialysis to clean out toxic wastes, and who must be maintained on a low salt, or on a salt-free diet, tend to prefer much saltier foods than normal individuals without kidney failure and without salt restrictions (Mosko- witz 1979; Abramson and Moskowitz 1976).
FOOD PREFERENCES AND ACCULTURATION
Food preferences can change, often dramatically, as a result of accultur- ation, wherein traditional religious and social variables now assume less
PSYCHOMETRIC EVALUATION OF FOOD PREFERENCES 165
importance in dictating food behavia-. During the period of acculturation, the family may not have the opportunity to serve familiar dishes because the ingredients, or the preparation method are not available in the new surroundings (Bavly 1966). As a result, traditional dishes may then be relegated to symbolic dishes, not eaten every day, but rather saved for ceremonial occasions to remind people of their background. Or, the foods might then be served in a restaurant, and the act of eating these traditional foods might be cloaked in the ritual behavior of “eating out.” At home, such dishes give way to the more typical, local food dishes. In the U.S. such dishes may give way to fast foods, or to simpler-to-prepare items.
the change in food habits (Moskowitz 1978). The major impacts seem to be the following:
(1) Meal timing is shifted. Whereas in Europe the traditional meal was often served in the evening, today the same meal might be quite a bit lighter. Originally, breakfasts were heavier, because of daily energy ex- penditure in manual labor. Today, meal timing and composition have radically altered. Breakfast is rarely a social even with complicated hard- to-prepare foods. Rather, it is often eat “on the run.” Also, breakfast items have shifted in consumption patterns. Pancakes may be eaten any time of day, and are not necessarily considered a breakfast dish.
(2) The number of meals consumed daily has shifted and with it food preferences. America has become a nation of snackers. Many of the con- venience foods have assumed an unexpectedly high popularity.
(3) Americans have become addicted to convenience foods, even in pre- paring meals at home. One rarely recognizes some kinds of fruits and meats, as they used to be prepared. As a result, food preferences today reflect what is available, as well as what by itself is normally “tasty.”
(4) America has become a nation of adventurous eaters with ethnic cuisines becoming increasingly popular. Chinese and Italian foods have been favorites on the Eastern seaboard for several decades. Now, the unusual taste of raw fish, and other Japanese prepared foods have become
Several studies have been reported on the process of acculturation, and
popular.
SUMMARY
One can summarize the psychological approaches to food preference in the following way:
(1) Food preference measurement requires different types of probe questions. There are more aspects beyond simply how much an individual likes or dislikes a food.
166 HOWARD R. MOSKOWITZ
(2) Food preference measurement is linked to other variables besides an individual’s idiosyncratic experiences with the food.
(3) Food preferences change over a lifetime. Food preferences tend to be very labile, and changeable during the early years, when a person is an infant or a young child. With experience, however, the preferences become increasingly fixed.
REFERENCES
ABRAMSON, R. and MOSKOWITZ, H. R. 1976. Effect of obesity and renal dialysis
BALINTFY, J. L., DUFFY, W. J. and SINHA, P. 1974. Modeling food preferences
BALINTFY, J. L., SINHA, P., MOSKOWITZ, H. R. and ROGOZENSKI, J. G. 1975.
BAVLY, S. 1966. Changes in food habits in Israel. J. Amer. Dietet. Assoc. 48,488. Committee on Food Habits. 1943. The problem of changing food habits. Bulletin of
the National Research Council 108, 1. DUNCKER, K. 1938. Experimental modification of children’s food preferences
through social suggestion. J. Abnormal Social Psychol. 33,489. ENGEN, T. 1974. Method and theory in the study of odor preferences. Human Res-
ponses to Environmental Odors, (A. Turk, J. W. Johnston, Jr. and D. G. Moulton eds.), p. 122, Academic Press, New York.
GAUGER, M. E. 1929. The modifiability of response to taste stimuli in the preschool child. Teachers College Rep. 348.
MEISELMAN, H. L. 1978. Scales for measuring food preference. In Encyclopedia of Food Science (M. S. Peterson and A. H. Johnson, eds.) AVI Publishing Co., Westport, Conn.
MEISELMAN, H. L., VAN HORNE, W., HASENZAHL, B. and WEHRLY, T. 1972. The 1971 Fort Lewis Food Preference Survey, U.S. Army Natick Laboratories Rept.
MCDANIEL, M. R. and SAWYER, S. M. 1980. Comparison of magnitude estimation and the 9 point hedonic scale in the measurement of preferences. J. Food Sci., In press.
MOSKOWITZ, H. R. 1979. Mind, body and pleasure: An analysis of factors which in- fluence sensory hedonics. Preference Behavior and Chemoreception, (J. H. A. Kroeze, ed), p. 131, Information Retrieval Ltd., London.
MOSKOWITZ, H. R. 1977. Magnitude estimation. J. Food Quality, 1,195. MOSKOWITZ, H. R. 1980. Comparing magnitude estimation and category scaling as
acceptance measures: Statistical approaches. Presented at an ASTM Symposium. Oct. Philadelphia, PA. (In Press)
MOSKOWITZ, H. R. and SIDEL, J. L. 1971. Magnitude and hedonic scales of food acceptance. J. Food Sci. 36,678.
PERYAM, D. R. and PILGRIM, F. J. 1959. Hedonic scale method for measuring food preferences. Food. Technol. 11 , 9.
RODIN, J., MOSKOWITZ, H. R., FLEMING, B. and BRAY, G. A. 1976. Relation- ship between obesity, weight loss and physiology. Physiology and Behavior, 17, 591.
on taste preference. Eastern Psychological Association, New York.
over time. Operations Research 22, 711.
The time dependance of food preferences. Food Product Development Nov.
PSYCHOMETRIC EVALUATION OF FOOD PREFERENCES 167
ROGOZENSKI, J. E., Jr. and MOSKOWITZ, H. R. 1975. A pystem for the preference evaluation of cyclic menus. U.S. A m y Natick Laboratories, Techn. Rept. 75-46 OR/SA.
SCHUTZ, H, G. 1965. A food action rating scale for measuring food acceptance. J, Food Sci. 30, 365,
SMUTZ, E., CALDWELL, M. and JACOBS, H. L. 1975. Unpublished data, U.S. A m y Natick Development Center, Natick, Mass.
VAISEY.GENSER, M., MOSKOWITZ, H, R. ROTHE, H. and SOLMS, Jr. 1977. Sensory Response to Food: A Sensory Workshop. Forster-Verlag, Zurich,
Copyright © 2022 FDOKUMEN