Effects of Information about Fat Content on Food Preferences in Preadolescent Children
14
Appetite, 1998, 30, 269–282 Article No. ap970106 Effects of Information about Fat Content on Food Preferences in Pre-adolescent Children DIANNE ENGELL Sensory & Product Research, Pizza Hut, Dallas PETER BORDI School of Hotel, Restaurant, and Recreation Management, Pennsylvania State University MARIANNE BORJA Nutrition & Dietetics Department, Marywood College, PA CAROLYN LAMBERT School of Hotel, Restaurant, and Recreation Management, Pennsylvania State University BARBARA ROLLS Nutrition Department, Pennsylvania State University The acceptance and sensory characteristics of standard and reduced-fat cookies were evaluated either with or without fat-content information by pre-adolescent children. Results indicate that acceptance ratings were not affected by the fat content or information about fat content when evaluated on nine-point scales. However, when asked to choose which cookie they liked better and to predict how many cookies they would eat (in forced-choice questions), fat content and information about fat content had a significant effect on cookie preference and prospective intake. When no information was available, subjects preferred the cookie with the higher fat content; when information was presented, subjects’ preference shifted to the reduced-fat cookie. When asked which cookie they would choose to eat for dessert with hypothetical lunches, a similar shift in choice was observed following a low-fat lunch. The low-fat label was also associated with an increase in perceived healthiness relative to the high-fat label, as indicated on ‘‘good for me’’ scales. The effects of fat content information on cookie preference and prospective consumption were seen in pre-adolescents who indicated a ‘‘high concern’’ for the health consequences of dietary fat. Cookie preference and prospective intake of subjects who indicated a ‘‘low concern’’ were not affected by fat content labeling. Results suggest that fat content and information about fat content may affect food preference and intake in pre-adolescent children. 1998 Academic Press Limited This study was conducted while D. Engell was a Visiting Scientist at the Pennsylvania State University. The research was supported by the U.S. Army, USDA grant RFA-FNS-93-027 to Peter Bordi and Carolyn Lambert and NIH grant DK39177 to Barbara Rolls. Please address correspondence and reprint requests to: D. Engell, Pizza Hut, 14841 Dallas Parkway, Dallas, Texas 75240-2100, U.S.A. 0195–6663/98/030269+14 $25.00/0 1998 Academic Press Limited
Transcript of Effects of Information about Fat Content on Food Preferences in Preadolescent Children

Appetite, 1998, 30, 269–282
Article No. ap970106
Effects of Information about Fat Content on Food Preferences
in Pre-adolescent Children
DIANNE ENGELLSensory & Product Research, Pizza Hut, Dallas
PETER BORDISchool of Hotel, Restaurant, and Recreation Management, PennsylvaniaState University
MARIANNE BORJANutrition & Dietetics Department, Marywood College, PA
CAROLYN LAMBERTSchool of Hotel, Restaurant, and Recreation Management, PennsylvaniaState University
BARBARA ROLLSNutrition Department, Pennsylvania State University
The acceptance and sensory characteristics of standard and reduced-fat cookieswere evaluated either with or without fat-content information by pre-adolescentchildren. Results indicate that acceptance ratings were not affected by the fatcontent or information about fat content when evaluated on nine-point scales.However, when asked to choose which cookie they liked better and to predicthow many cookies they would eat (in forced-choice questions), fat content andinformation about fat content had a significant effect on cookie preference andprospective intake. When no information was available, subjects preferred thecookie with the higher fat content; when information was presented, subjects’preference shifted to the reduced-fat cookie. When asked which cookie they wouldchoose to eat for dessert with hypothetical lunches, a similar shift in choice wasobserved following a low-fat lunch. The low-fat label was also associated withan increase in perceived healthiness relative to the high-fat label, as indicated on‘‘good for me’’ scales. The effects of fat content information on cookie preferenceand prospective consumption were seen in pre-adolescents who indicated a ‘‘highconcern’’ for the health consequences of dietary fat. Cookie preference andprospective intake of subjects who indicated a ‘‘low concern’’ were not affectedby fat content labeling. Results suggest that fat content and information aboutfat content may affect food preference and intake in pre-adolescent children.
1998 Academic Press Limited
This study was conducted while D. Engell was a Visiting Scientist at the Pennsylvania State University.The research was supported by the U.S. Army, USDA grant RFA-FNS-93-027 to Peter Bordi andCarolyn Lambert and NIH grant DK39177 to Barbara Rolls.
Please address correspondence and reprint requests to: D. Engell, Pizza Hut, 14841 Dallas Parkway,Dallas, Texas 75240-2100, U.S.A.
0195–6663/98/030269+14 $25.00/0 1998 Academic Press Limited

270 D. ENGELL ET AL.
I
Many low- and reduced-fat products with prominent ‘‘low-fat’’ or ‘‘reduced-fat’’labels have been developed by food companies to meet the needs of dieters. Dieting,however, is not limited to adults who are concerned with their health or body image.Girls as young as 9 years old have been shown to have dieting concerns (Hill et al.,1991) and to consume less energy than non-dieting counterparts (Hill & Robinson,1991). In addition, dieting and a preoccupation with body weight by young adolescentgirls has been linked to the development of eating disorders (Killen et al., 1994).Because of the risks associated with weight concerns and dieting at a young age, itis important to understand how messages about the fat content of foods affect pre-adolescent children’s food choices, acceptance and consumption.
Several studies have addressed the effects of fat-content information on foodacceptance and intake in adults. Some experiments have shown that a low-fat labelincreases hedonic ratings (Bowen et al., 1992; Lundgren, 1981), but another studyfound that a low-fat label was associated with lower palatability (Wardle & Solomons,1994). These inconsistent results may be related to the type of products tested orconsumers’ expectations about the products. For example, Solheim (1992) foundthat a low-fat label on a high-fat sausage increased palatability over a blind test,but a low-fat label on low-fat sausages led to a decrease in liking.
Individuals’ characteristics, attitudes or past patterns of consumption may in-fluence the effects of fat labels on product acceptance. Several studies have shownthat attitudes related to dietary fat can influence fat intake (Kristal et al., Henry,1990; Shepherd & Stockley, 1987) and product acceptance (Aaron et al., 1994;Shepherd et al., 1991/2; Tuorila et al., 1994). Aaron et al. (1994) found that fat-content labels had no consistent significant effects on sensory and hedonic ratingsor intake of a reduced-fat bread spread when subject characteristics were notconsidered. However, when the interactive effects of subjects’ attitudes and productlabeling were analysed, individuals’ attitudes were found to influence the impact oflabeling on ratings and intake. Similarly, Tuorila et al. (1994) demonstrated thatconsumers’ expectations about reduced-fat products affected their sensory andhedonic ratings of several foods.
Information about the fat content of foods has also been shown to affectsubsequent food consumption (Caputo & Mattes, 1993; Shide & Rolls, 1995). In the1993 study, food consumption was monitored for three, 1-week periods during whichsubjects were told that a standard low-fat lunch contained either a higher, lower orthe same amount of fat as their customary lunch meal. Although subjects’ ad libitumfood intake during the week was higher when subjects were told their lunch was‘‘low-fat’’ compared to when it was described as ‘‘high-fat’’, intake during both ofthese periods was not different from the baseline period. In a more recent study,Shide and Rolls (1995) found that information about the fat content of a yogurtpreload (a required first course) had a significant effect on subsequent lunch intakeof healthy women. Subjects consumed more calories at lunch when they were toldthat the preload was ‘‘low-fat’’ than when they were told it was ‘‘high-fat’’. Inaddition, no caloric or macronutrient compensation was evidenced in the dinnermeal, suggesting that information about the fat content of foods can influence energyintake. The impact of fat-content labeling on energy intake over a period longerthan 1 week has not been studied.

271FAT CONTENT AND FOOD PREFERENCES IN CHILDREN
Although the effects of information about fat content on food acceptance andintake have been studied considerably in adults, there is limited work addressinghow messages about the fat content affect children’s and adolescents’ food choices,acceptance and intake. In one study of 13- and 14-year-old adolescents, nutrientinformation (such as fat, iron, carbohydrate and protein content of foods) wasshown to affect ‘‘good for you’’ ratings of foods on a list (Eiser et al., 1984). Nutrientinformation about only fat content was found to affect pleasantness ratings: foodsidentified as low-fat received higher ratings than foods in the high-fat category.
The present study examined the influence of information about fat content onpre-adolescent children’s sensory and hedonic ratings of cookies. The study alsoaddressed the effects of fat-content labeling on prospective food selection and intake(only predicted choice and consumption were assessed). Finally, the study assessedpre-adolescents’ attitudes about fat content of foods and determined whether fatcontent labeling had differential effects in subgroups of children with differentattitudes toward dietary fat. Given the inconsistencies of findings from previousstudies, it could not be hypothesised how information may affect pre-adolescentsubjects’ hedonic ratings of cookies. However, it was predicted that if childrenexpressed a high level of concern about the healthiness of fat in foods, their positiveview of the ‘‘low-fat’’ label would be manifested in their responses.
M
Subjects
Subjects were 16 female and 17 male students enrolled in a private grammarschool in central Pennsylvania. The mean (±SE ) age of the children was 10·3±0·1years. All subjects were participants in a study to evaluate reduced-fat recipes forthe National School Lunch Program (Bordi et al., 1996). Subjects were trained touse hedonic and sensory scales to evaluate products for this study, which wascompleted before the present study. Subjects received no information or speciallessons about nutrition or the health consequences of dietary fat. Subjects weresimply asked to evaluate some new cookie recipes. A purpose for the evaluation wasnot presented, and no students asked for clarification.
Products
Two versions of an oatmeal cookie recipe (standard and reduced-fat) were usedin this experiment. The cookies were identical in ingredients with the exception ofthe amount of fat (butter) used in the recipe. These cookies were used because similaroatmeal cookies (standard and reduced-fat recipes) received comparable acceptanceratings in the aforementioned study (Bordi et al., 1996). The cookies used in thepresent experiment were not evaluated by these subjects in any previous tests. Thenutrient composition for the cookies is shown in Table 1. Nutrient analysis of thecookies was completed using the Nutritional Accounting 4.1 component of theCBORD Menu Management System (CBORD, 1990). Recipe development wassupported by a grant from the United States Department of Agriculture, (RFA-FNS-93-027).

272 D. ENGELL ET AL.
T 1Nutrient composition of cookies∗
Cookie type Protein (g) Carbohydrate (g) Fat (g)
Standard 3 26 12Reduced fat 4 31 6
∗Values shown are for one cookie.
Procedure
The children rated the cookies at their assigned desks in their customary class-rooms approximately 30 min following a standard lunch that was served in theschool cafeteria. All of the testing occurred during one session. The distribution ofmales and females in the classrooms was balanced: in one classroom there were eightmales and eight females, and in the other classroom there were nine males and eightfemales. The teacher was present in each classroom, but she did not participate inthe conduct of the evaluation.
Subjects were served two cookies (one standard and one reduced-fat recipe), side-by-side in each condition. In the Information Condition each cookie was labeledeither ‘‘high-fat’’ or ‘‘low-fat’’. This information was emphasized by the researcherannouncing this information and writing it on the chalkboard in the front ofthe classroom. There was no misrepresentation involved in this study; the labelsappropriately represented the fat content of the cookies. The reduced-fat recipe waslabeled as ‘‘low-fat’’, and the standard recipe was labeled ‘‘high-fat’’. In the NoInformation Condition, the cookies were served to the subjects on plates with nolabels, and no mention was made by the researcher regarding the fat content of thecookies. In both conditions, the cookies were labeled with alphanumeric codes. Theorder of presentation of the two cookies was counterbalanced within each condition,and the order of the conditions was counterbalanced across classrooms. Bottledspring water was available for subjects to drink and cleanse their palates betweencookie samples.
After completing the evaluation of the two cookies (one standard recipe, onereduced-fat recipe) in one condition, the cookies were re-evaluated in the othercondition. Subjects compared only two cookies at a time. The overall acceptance,appearance, flavor and texture were rated on nine-point hedonic scales anchoredwith ‘‘dislike extremely’’ (one on the scale) and ‘‘like extremely’’ (nine on the scale).Sweetness and crunchiness were rated on nine-point scales anchored with ‘‘not atall’’ and the appropriate superlative, ‘‘extremely sweet’’ or ‘‘extremely crunchy’’.Texture and healthiness were rated on bipolar scales with endpoints of ‘‘extremelydry’’ and ‘‘extremely moist’’ on the texture scale, and ‘‘extremely bad for me’’ and‘‘extremely good for me’’ on the healthiness scale.
In addition to rating the cookies on the aforementioned scales, the subjects werealso asked to rank the cookies in terms of liking and sweetness; i.e. subjects wereasked ‘‘which cookie do you like better’’, and ‘‘which cookie tastes sweeter?’’ Subjectswere also asked to predict how many of each cookie they would eat ‘‘right now’’and which cookie they would chose for dessert following two different, hypothetical

273FAT CONTENT AND FOOD PREFERENCES IN CHILDREN
lunch meals. One meal was designed to be low in fat (turkey sandwich and carrotand celery sticks), and the other meal was relatively high in fat (hamburger andfrench fries). Neither the fat content nor any other information about the foods inthe meals was communicated to the subjects.
After the cookies were evaluated in both conditions and the preference (ranking)questions were answered, subjects completed a questionnaire in which they in-dicated hedonic and ‘‘healthiness’’ ratings for 14 foods. The foods included onthis questionnaire were primarily high- and low-fat versions of several foods.Examples of these foods which appeared in random order on the questionnaire(not between subjects) are: french fries, baked potato, low-fat milk, whole milk,apple pie and apple. Subjects were also asked to rate the ‘‘healthiness’’ of‘‘high-fat foods’’ and ‘‘low-fat foods’’ (e.g. How good or bad for you are‘‘low-fat’’ foods?). Finally, the children indicated their perception of their bodyweight on a nine-point bipolar scale that was anchored with ‘‘extremely un-derweight’’ and ‘‘extremely overweight’’.
Statistical Methods
SPSS/PC+ (v.4.0.1, SPSS, Inc., Chicago, U.S.A.) was used to analyse the data.Statistical significance was identified as p<0·05; only significant main effects andinteractions are reported. Analysis of Variance was used to determine the effects offat content, information about fat content and the order of receiving the fat-contentinformation on cookie ratings (hedonic, sensory attributes, healthiness) and theprospective intake of the cookies. These data were analysed using a three-wayANOVA (repeated measures) with fat content (reduced-fat vs. standard recipe) andinformation about fat content (information vs. no information) as within-subjectfactors and order (information condition first vs. information condition second) asa between-subject factor.
To determine the interactive effects of labeling and subjects’ attitudes relatedto the healthiness of dietary fat on the cookie ratings, subjects were divided intotwo subgroups, those with a relatively high concern about dietary fat and thosewith a lower concern. The ‘‘high concern’’ group included those individuals whohad the larger differences in healthiness ratings between high-fat and low-fatalternatives on the food preference questionnaire (e.g. fried vs. baked chicken);those in the ‘‘low concern’’ group had relatively smaller differences in thesehealthiness ratings. A median split was used to delineate these groups, then theANOVA model, as described above, with ‘‘health concern’’ as a between-subjectfactor was used. Similarly, to test the effects of gender, it was incorporated intothe ANOVA model as a between-subject variable. Paired t-tests were used tocompare the hedonic and healthiness ratings of foods on the lists in the ques-tionnaire that was administered following the evaluation of the cookies, (e.g. friedvs. baked chicken, apple pie vs. apple).
Binomial tests were used to assess the effects of fat content on cookie preferenceand sweetness, when subjects were asked to choose which of two cookies they likedbetter or which cookie was sweeter using forced-choice questions. To test the effectsof information about fat content on cookie preference and sweetness and onprospective intake and choice with hypothetical lunches (all forced-choice questions),the McNemar test was used.

274 D. ENGELL ET AL.
T 2Mean (±SE) hedonic ratings of cookies
Standard cookie Reduced-fat cookie
No information Information No information Information
Appearance 7·8 (0·3) 8·0 (0·3) 7·8 (0·3) 7·9 (0·3)Flavor 8·3 (0·2) 8·0 (0·3) 7·8 (0·3) 7·8 (0·3)Texture 8·0 (0·2) 8·0 (0·2) 7·8 (0·2) 7·8 (0·3)Overall acceptance 8·3 (0·2) 8·2 (0·2) 8·0 (0·2) 7·7 (0·3)
R
Identification of ‘‘Concern Groups’’
Almost all subjects rated the low-fat food alternatives on the food list as healthierthan the high fat alternatives. (These results are discussed later and shown in Table4.) Subjects in the ‘‘high concern’’ group rated the low-fat foods 3·7±0·3 (mean±SE )points higher than the high-fat foods on the nine-point ‘‘healthiness’’ scale. Thisdifference in the ‘‘low concern’’ group was 1·4±0·3 points. To validate the delineationof these groups, the mean responses to the questions, ‘‘how good or bad for you are‘low-fat’ foods?’’, and ‘‘how good or bad for you are ‘high-fat’ foods?’’ were compared.Low-fat foods were rated similarly in these two groups: mean ratings were 7·3±0·2and 6·9±0·3 in the ‘‘high concern’’ and ‘‘low concern’’ groups, respectively. However,high-fat food ratings were different in these two groups [t (28)=2·96, p<0·01]: meanscores were 3·0±0·2 and 4·6±0·3, indicating that subjects in the ‘‘high concern’’group felt more negatively toward high-fat foods than subjects in the ‘‘low concern’’group. No difference in gender distribution was found in these two groups, i.e. therewere an equal number of boys and girls in the two groups. In the following sections,results will be presented for the entire group and also for the ‘‘concern’’ subgroupsto illustrate the influence of subjects’ attitudes on their responses.
Hedonic and Attribute Ratings
No significant effects of fat content or information about fat content on hedonicratings were found. Fat content or fat-content labeling did not affect how much thechildren liked the cookies. There were also no significant effects of order nor werethere any significant order by information interactions. There were also no differencesin ratings between the ‘‘concern’’ groups. Both of the cookies were highly acceptable.See Table 2 for mean hedonic ratings.
Fat content had only one significant effect on sensory ratings. A significantdifference in ‘‘crunchiness’’ was found between the standard and reduced-fat cookies:the cookie with the higher fat content received a higher mean ‘‘crunchiness’’ rating(3·8±0·3) than the reduced-fat cookie, (3·0±0·3), F (1,31)=6·08, p<0·05. Fat-contentlabeling did not affect sensory ratings related to crunchiness, sweetness or texture inthe entire group of subjects or in either of the ‘‘concern’’ groups.
A significant main effect of fat content was found on perceived healthiness, asmeasured by the ‘‘good for me’’ scale. The reduced-fat cookie was viewed as healthier

275FAT CONTENT AND FOOD PREFERENCES IN CHILDREN
T 3Mean (±SE) healthiness ratings of cookies∗
Standard cookie Reduced-fat cookie
No information Information No information Information
Information first 5·0 (0·6) 3·9 (0·6) 5·7 (0·8) 5·8 (0·7)Information second 5·5 (0·6) 4·3 (0·7) 6·6 (0·7) 7·6 (0·3)Mean 5·2 (0·4) 4·1 (0·5) 6·2 (0·5) 6·7 (0·4)
∗Healthiness was rated on a scale with endpoints of ‘‘extremely bad for me’’ and ‘‘extremely goodfor me’’.
than the standard cookie, [F (1,31)=28.34, p<0·001]: the mean ratings for standardand reduced-fat cookies were 4·7±0·3 and 6·5±0·4, respectively. Mean healthinessratings are shown in Table 3.
A significant order effect was also found on perceived healthiness [F (1,31)=5·00, p<0·05]. The subjects in the classroom that received the information duringthe second cookie evaluation tended to rate the cookies higher than the students inthe classroom that received the information during the first evaluation. Both class-rooms rated the reduced-fat cookie higher on the healthiness scale when it waslabeled as ‘‘low-fat’’, however, this effect was pronounced in the classroom thatreceived the information about fat content during the second evaluation.
A significant information by fat-content interaction was also found, indicatingthat the information about fat content had differential effects on ‘‘healthiness’’ratings, [F (1,31)=9·10, p<0·01]. The ‘‘low-fat’’ label was associated with an increasein healthiness, and the ‘‘high-fat’’ label led to a decrease in perceived healthiness.Other interactions (e.g. information by order) were not significant.
Fat content (binomial test, p<0·05) and information about the fat content(McNemar Test, p<0·05) were shown to have significant effects on cookie preferencein a forced-choice (ranking) situation. As Fig. 1 shows, when no information wasavailable, nine subjects preferred the reduced-fat cookie and 22 preferred the standardcookie. When information about fat content was communicated to the subjects, 19liked the reduced-fat cookie more than the standard cookie, and 12 preferred thestandard cookie. No significant differences were found when sweetness rankings werecompared.
Closer examination of the data demonstrated that the group of subjects showing‘‘high concern’’ was responsible for the significant finding for the entire group. Thedata were analysed by ‘‘concern’’ group in two separate McNemar tests. Subjects’cookie preference in the ‘‘high concern’’ group shifted as a function of the fat-contentlabeling, (McNemar, p<0·05). In the ‘‘low concern’’ group, information about fatcontent had no effect on cookie preference. Figure 1 shows reduced-fat and standardcookie preferences as a function of information condition and concern group.
Predicted Intake
The mean number of reduced-fat cookies (±SE ) that subjects predicted thatthey would eat ‘‘right now’’ was 5·2±1·1 when no information about fat content

276 D. ENGELL ET AL.
25
0Standard
Nu
mbe
r of
su
bjec
ts
20
15
10
5
LowConcern
HighConcern
No information
Reducedfat
LowConcern
HighConcern
Standard
LowConcern
HighConcern
Information
Reducedfat
LowConcern
HighConcern
F 1. Effect of fat content and information about fat content on cookie preferencein response to the question: ‘‘which cookie do you like better?’’. Data presented are thenumber of subjects indicating a preference for the standard and reduced-fat cookies. Φ,reduced fat; ;, standard.
was communicated and 6·7±1·5 when subjects were told that it was a ‘‘low-fat’’cookie. The mean number of standard recipe cookies that subjects predicted theywould consume was 6·4±1·2 when no information was offered and 5·1±0·8 whenthey were labeled as ‘‘high-fat’’. This trend suggesting that information and fatcontent affected prospective intake was not found to be significant in either theentire group or in the ‘‘concern’’ subgroups.
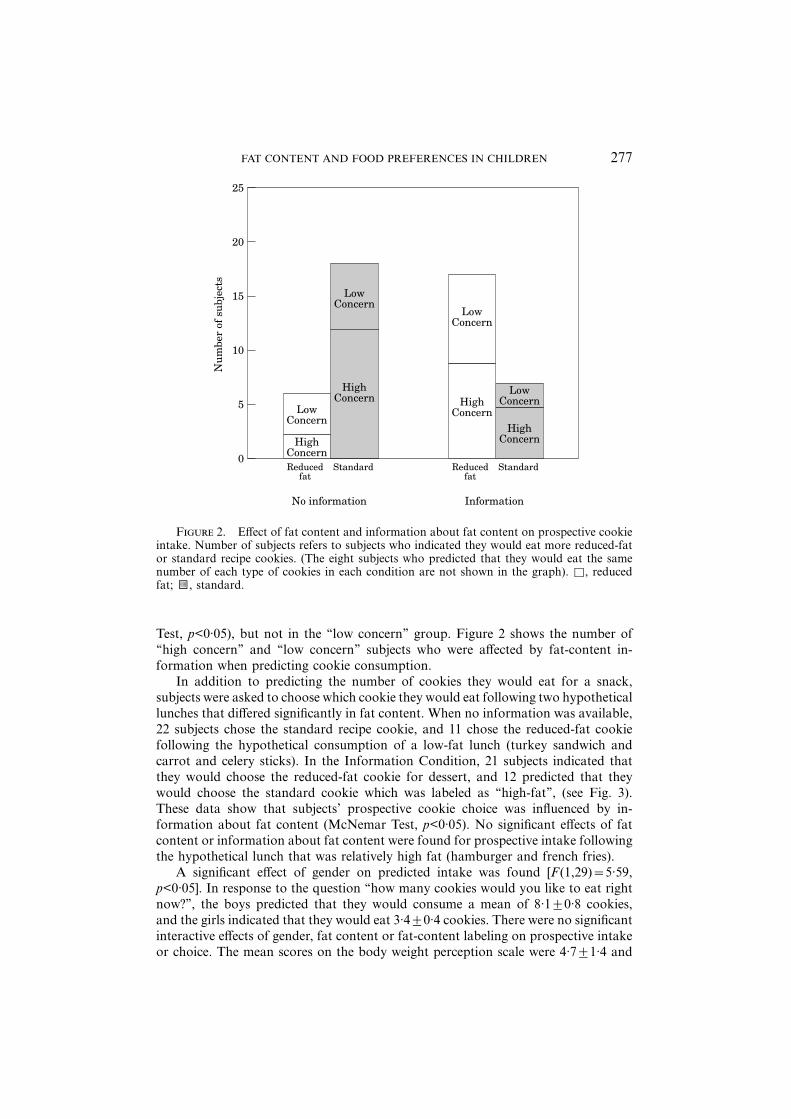
If the number of subjects expressing that they would eat more of one kind ofcookie compared to another cookie was compared, a significant difference was foundbetween reduced-fat and standard cookies, (binomial test, p<0·05). The number ofsubjects who said they would eat more of one cookie than the other (reduced fatvs. standard) was tallied in each condition. In the No Information Condition, 18subjects indicated that they would eat more standard recipe cookies than reduced-fat recipe cookies and six subjects said that they would eat more of the reduced-fatcookies. In the Information Condition, 17 subjects stated that they would eat morereduced-fat cookies, and only seven subjects predicted that they would eat more ofthe standard recipe cookie. (Of the 32 subjects with complete data for this analysis,there were eight subjects who said that they would consume the same number ofcookies in both conditions.) A significant number of subjects were influenced by fat-content information when they predicted their consumption of cookies (McNemarTest, p<0·05). This effect was found in the ‘‘high concern’’ group of subjects (McNemar
277FAT CONTENT AND FOOD PREFERENCES IN CHILDREN
25
0Standard
Nu
mbe
r of
su
bjec
ts
20
15
10
5 LowConcern
HighConcern
No information
Reducedfat
LowConcern
HighConcern
Standard
LowConcern
HighConcern
Information
Reducedfat
LowConcern
HighConcern
F 2. Effect of fat content and information about fat content on prospective cookieintake. Number of subjects refers to subjects who indicated they would eat more reduced-fator standard recipe cookies. (The eight subjects who predicted that they would eat the samenumber of each type of cookies in each condition are not shown in the graph). Φ, reducedfat; ;, standard.
Test, p<0·05), but not in the ‘‘low concern’’ group. Figure 2 shows the number of‘‘high concern’’ and ‘‘low concern’’ subjects who were affected by fat-content in-formation when predicting cookie consumption.
In addition to predicting the number of cookies they would eat for a snack,subjects were asked to choose which cookie they would eat following two hypotheticallunches that differed significantly in fat content. When no information was available,22 subjects chose the standard recipe cookie, and 11 chose the reduced-fat cookiefollowing the hypothetical consumption of a low-fat lunch (turkey sandwich andcarrot and celery sticks). In the Information Condition, 21 subjects indicated thatthey would choose the reduced-fat cookie for dessert, and 12 predicted that theywould choose the standard cookie which was labeled as ‘‘high-fat’’, (see Fig. 3).These data show that subjects’ prospective cookie choice was influenced by in-formation about fat content (McNemar Test, p<0·05). No significant effects of fatcontent or information about fat content were found for prospective intake followingthe hypothetical lunch that was relatively high fat (hamburger and french fries).
A significant effect of gender on predicted intake was found [F (1,29)=5·59,p<0·05]. In response to the question ‘‘how many cookies would you like to eat rightnow?’’, the boys predicted that they would consume a mean of 8·1±0·8 cookies,and the girls indicated that they would eat 3·4±0·4 cookies. There were no significantinteractive effects of gender, fat content or fat-content labeling on prospective intakeor choice. The mean scores on the body weight perception scale were 4·7±1·4 and

278 D. ENGELL ET AL.
25
0Standard
Nu
mbe
r of
su
bjec
ts
20
15
10
5
LowConcern
HighConcern
No information
Reducedfat
LowConcern
HighConcern
Standard
LowConcern
HighConcern
Information
Reducedfat
LowConcern
HighConcern
F 3. Effect of fat content and information about fat content on prospective cookiechoice following an hypothetical low-fat lunch. Data presented are the number of subjectsindicating a preference for the standard and reduced-fat cookie in the Information and No-Information Conditions.
4·8±1·5, for the boys and girls, respectively, indicating that male and female subjectsconsidered themselves to be ‘‘neither underweight nor overweight’’. There were nosignificant relationships among gender, perception of body weight, and any of thecookie ratings or questionnaire responses.
Food Preferences and Attitudes Related to Dietary Fat in Food
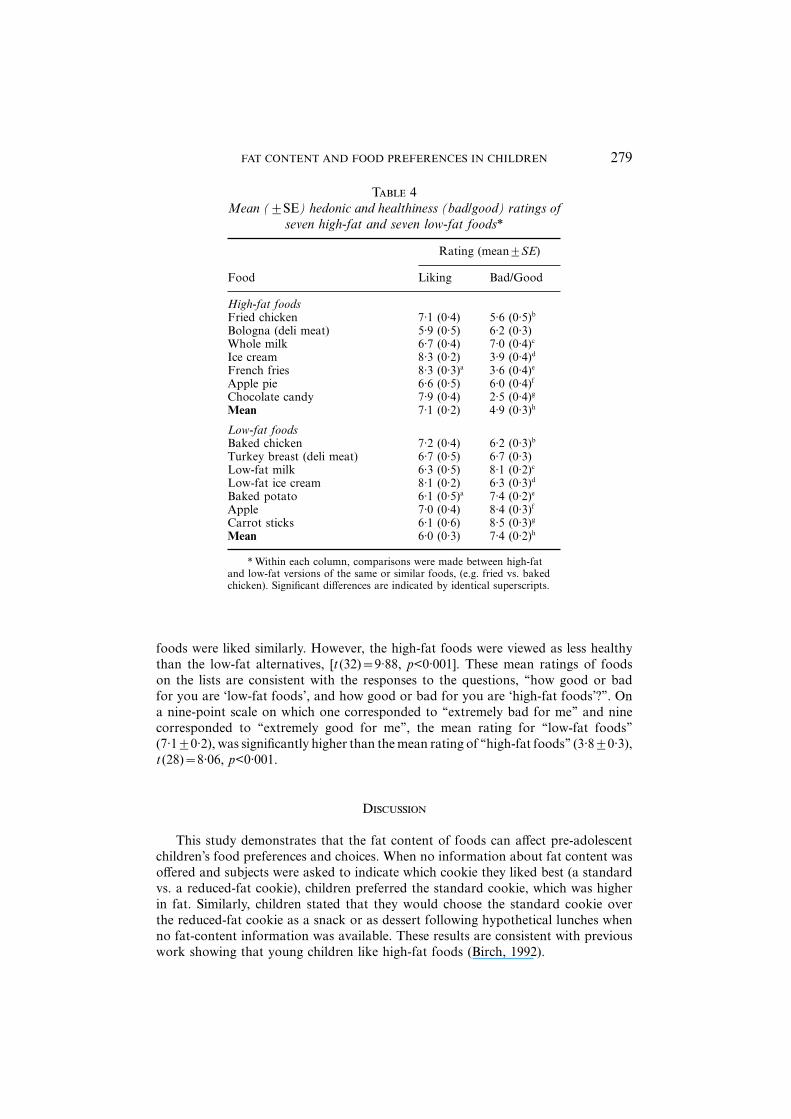
Subjects’ hedonic and healthiness ratings of seven high-fat and seven low-fatfoods are shown in Table 4. When the acceptance ratings of the high-fat foods werecompared to a low-fat alternative (fried chicken vs. baked chicken, whole milk vs.low-fat milk, ice cream vs. ice milk, french fries vs. baked potato, apple pie vs.apple), only one significant difference was found: french fries were liked more thanbaked potatoes [F (1,28)=16·55, p<0·001]. As expected, chocolate was liked morethan carrot sticks [F (1,28)=6·91, p<0·05]. This comparison was included to confirmthat the subjects were using the scales appropriately. More significant differencesbetween the high- and low-fat alternatives were found when subjects were asked torate the foods on the ‘‘healthiness’’ scale. In all cases except one (bologna vs. turkeybreast, p=0·10) the high-fat food was rated as less healthy than the low-fat alternative,(all F’s were significant, p<0·01). There were no significant main or interactive effectsof gender on the hedonic or ‘‘healthiness’’ ratings of the foods on the list.
Table 4 also shows that when the mean hedonic ratings for the foods on the listwere compared (seven high- vs. seven low-fat foods), the high-fat foods and low-fat
279FAT CONTENT AND FOOD PREFERENCES IN CHILDREN
T 4Mean (±SE) hedonic and healthiness (bad/good) ratings of
seven high-fat and seven low-fat foods∗
Rating (mean±SE)
Food Liking Bad/Good
High-fat foodsFried chicken 7·1 (0·4) 5·6 (0·5)b
Bologna (deli meat) 5·9 (0·5) 6·2 (0·3)Whole milk 6·7 (0·4) 7·0 (0·4)c
Ice cream 8·3 (0·2) 3·9 (0·4)d
French fries 8·3 (0·3)a 3·6 (0·4)e
Apple pie 6·6 (0·5) 6·0 (0·4)f
Chocolate candy 7·9 (0·4) 2·5 (0·4)g
Mean 7·1 (0·2) 4·9 (0·3)h
Low-fat foodsBaked chicken 7·2 (0·4) 6·2 (0·3)b
Turkey breast (deli meat) 6·7 (0·5) 6·7 (0·3)Low-fat milk 6·3 (0·5) 8·1 (0·2)c
Low-fat ice cream 8·1 (0·2) 6·3 (0·3)d
Baked potato 6·1 (0·5)a 7·4 (0·2)e
Apple 7·0 (0·4) 8·4 (0·3)f
Carrot sticks 6·1 (0·6) 8·5 (0·3)g
Mean 6·0 (0·3) 7·4 (0·2)h
∗Within each column, comparisons were made between high-fatand low-fat versions of the same or similar foods, (e.g. fried vs. bakedchicken). Significant differences are indicated by identical superscripts.
foods were liked similarly. However, the high-fat foods were viewed as less healthythan the low-fat alternatives, [t (32)=9·88, p<0·001]. These mean ratings of foodson the lists are consistent with the responses to the questions, ‘‘how good or badfor you are ‘low-fat foods’, and how good or bad for you are ‘high-fat foods’?’’. Ona nine-point scale on which one corresponded to ‘‘extremely bad for me’’ and ninecorresponded to ‘‘extremely good for me’’, the mean rating for ‘‘low-fat foods’’(7·1±0·2), was significantly higher than the mean rating of ‘‘high-fat foods’’ (3·8±0·3),t (28)=8·06, p<0·001.
D
This study demonstrates that the fat content of foods can affect pre-adolescentchildren’s food preferences and choices. When no information about fat content wasoffered and subjects were asked to indicate which cookie they liked best (a standardvs. a reduced-fat cookie), children preferred the standard cookie, which was higherin fat. Similarly, children stated that they would choose the standard cookie overthe reduced-fat cookie as a snack or as dessert following hypothetical lunches whenno fat-content information was available. These results are consistent with previouswork showing that young children like high-fat foods (Birch, 1992).

280 D. ENGELL ET AL.
The study also showed that fat-content labeling can affect the food preferencesand choices of pre-adolescent children. The subjects in this study viewed the ‘‘low-fat’’ label positively. When asked which cookie they liked best in a forced-choicesituation, preference shifted from the standard recipe cookie when fat-contentinformation was not available to the reduced-fat cookie when the cookies werelabeled appropriately. This preference shift was found in a subgroup of pre-adolescentswho had a relatively ‘‘high concern’’ about dietary fat; however, this shift was notfound in subjects who were less concerned about dietary fat and health.
Previous work with adults has shown that adults’ attitudes toward dietary fatcan influence the effects of fat-content labeling on food acceptance (Aaron et al.,1994; Shepherd et al., 1991/2; Tuorila et al., 1994). The present study provides someevidence that pre-adolescents’ attitudes toward dietary fat may similarly affect theiracceptance and consumption of foods labeled with fat-content information. Someof the results demonstrated that the effects of fat-content labeling were different ingroups of subjects with disparate levels of concern about dietary fat. However, therewere some cases in which a difference between these groups was expected but notfound. For example, a significant difference was found between concern groups forthe effects of labeling on cookie preference in the paired comparison test, but therewas no difference between groups when the effects of labeling on healthiness ratingswere compared. These inconsistent results may be due to the product used in thisstudy or the method used to delineate the concern groups.
Subjects’ liking of the reduced-fat and standard cookies and the effects of fat-content information on the acceptance of the cookies were studied in this experimentusing two methods that resulted in discrepant findings. When the acceptance of thecookies was compared using nine-point hedonic scales, there was no significantdifference between the reduced-fat and standard recipe cookies. However, when thesubjects were asked to choose which cookie they liked best in a paired-comparisontest, a significant preference for the standard cookie was expressed. The rankedpreference data also revealed interesting effects of fat-content information on ac-ceptance, yet the hedonic ratings data show no such effects. Although there is someevidence that the sensitivity of these methods is comparable (Pilgrim & Woods,1955), it is possible that in some situations the paired comparison forces individualsto be more discriminating.
Further insight into pre-adolescent’s attitudes about fat content in foods wasshown in this study when subjects were asked to choose which cookie they wouldprefer following two different hypothetical lunches that varied according to fatcontent. Following a low-fat lunch meal, more subjects chose the standard cookiethan the reduced-fat cookie when the cookies were not labeled. However, when thecookies were labeled, more children chose the reduced-fat cookie than the standardcookie. This shift was not seen when the lunch was relatively high in fat (a hamburgersandwich with french fries). This difference in responses suggests that children’sactual food choices may be affected by nutrition knowledge, attitudes about dietaryfat intake and attitudes related to the appropriateness of foods for different situations.The shift in cookie preference seen only in the low-fat lunch situation suggests thatchildren’s cognitive set may include rules for the appropriate use of low-fat foods.Evidence for pre-school children categorizing foods as appropriate or inappropriatefor different situations has been shown in a study addressing the appropriatenessand acceptance of typical breakfast and dinner foods across different times of theday (Birch et al., 1984).

281FAT CONTENT AND FOOD PREFERENCES IN CHILDREN
The subjects in this study were aware of the association between dietary fat andhealth. They rated low-fat foods on a list significantly higher in terms of healthfulnessthan high-fat foods, and they also viewed the category of ‘‘low-fat foods’’ to bebetter for them than the category ‘‘high-fat foods’’. In a large-scale survey ofelementary school children who were approximately the same age as the subjects inthe present study, Resnicow and Reinhardt (1991) found that children were awareof the fat content of many foods. Although children know the fat content of foodsand that a diet high in fat is not healthy, studies have shown that the foods thatchildren eat most frequently are high in fat (Kimm et al., 1990; Murphy et al., 1995).
A significant shift in prospective consumption was observed when informationabout fat content was available: when there were no labels, most children said thatthey would eat more standard cookies than reduced-fat cookies; however, when thecookies were labeled, most children said that they would eat more ‘‘low-fat’’ cookiesthan ‘‘high-fat’’ cookies. A trend also suggested that children’s intake may beincreased when there is a ‘‘low-fat’’ label relative to when there is a ‘‘high-fat’’ labelor no information about fat content is available. The energy intake of adults hasbeen shown to be affected by fat-content labeling, suggesting that adults may viewthe ‘‘low-fat’’ label as a license to consume more than they would customarilyconsume (Shide & Rolls, 1995). The present study suggests that children may sharethis view of low-fat foods; however, more work is required to examine how children’sbeliefs and attitudes about dietary fat affect their actual consumption. Future workshould include measures of consumption over several meals to determine howmessages about fat content in foods affect food intake regulation in children andadolescents.
R
Aaron, J. I., Mela, D. J. & Evans, R. E. (1994). The influences of attitudes, beliefs and labelinformation on perceptions of reduced-fat spread. Appetite, 22, 25–37.
Birch, L. L. (1992). Children’s preferences for high-fat foods. Nutrition Reviews, 50(9),249–255.
Birch, L. L., Billman, J. & Richards, S. S. (1984). Time of day influences food acceptability.Appetite, 5, 109–116.
Bordi, P., Borja, M. & Lambert, C. (1996). New lower fat dessert recipes for the school lunchprogram are well accepted by children. Journal of the American Dietetic Association, 96(9), 908–910.
Bowen, D. J., Tomoyasu, N., Andersen, M., Carney, M. & Kristal, A. (1992). Effects ofexpectancies and personalized feedback on fat consumption, taste, and preference. Journalof Applied Social Psychology, 22, 1061–1079.
Caputo, F. A. & Mattes, R. D. (1993). Human dietary responses to perceived manipulationof fat content in a midday meal. International Journal of Obesity, 17, 237–240.
CBORD, Inc. (1990). Menu Management System. The CBORD Group, Inc., Ithica, N.Y.Eiser, J. R., Eiser, C., Patterson, D. J. & Harding, C. M. (1984). Effects of information about
specific nutrient content on ratings of ‘‘goodness’’ and ‘‘pleasantness’’ of common foods.Appetite, 5, 349–359.
Hill, A. J. & Robinson (1991). Dieting concerns have a functional effect on the behavior ofnine-year-old girls. British Journal of Clinical Psychology, 30, 265–267.
Hill, A. J., Oliver, S. & Rogers, P. J. (1991). Eating in the adult world: the rise of dieting inchildhood and adolescence. British Journal of Clinical Psychology, 31(1), 95–105.
Killen, J. D., Taylor, C. B., Hayward, C., Wilson, D. M., Haydel, K. F., Hammer, L. D. et al.(1994). Pursuit of thinness and onset of eating disorder symptoms in a community sample

282 D. ENGELL ET AL.
of adolescent girls: a three year prospective analysis. International Journal of Obesity,16(3), 227–238.
Kimm, S. Y. S., Gergen, P. J., Malloy, M., Dresser, C. & Carroll, M. (1990). Dietary Patternsof U.S. Children: Implications for Disease Prevention. Preventive Medicine, 19, 432–442.
Kristal, A. R., Bowen, D. J., Curry, S. J., Shattuck, A. L. & Henry, H. J. (1990). Nutritionknowledge, attitudes and perceived norms as correlates of selecting low fat diets. HealthEducation Research, 5, 467–477.
Lundgren, B. (1981). Effect of nutritional information on consumer responses. In J. Solms &R. L. Hall (Eds), Criteria of Food Acceptance. Pp. 27–33. Zurich: Foster Verlag AG.
Lyle, B. J., McMahon, K. E. & Kreutler, P. A. (1992). Assessing the potential dietary impactof replacing dietary fat with other macronutrients. Journal of Nutrition, 122, 211–216.
Murphy, A. S., Youatt, J. P., Hoerr, S. L., Sawyer, C. A. & Andrews, S. L. (1995). Kindergartenstudents’ food preferences are not consistent with their knowledge of the DietaryGuidelines. Journal of the American Dietetic Association, 95, 219–223.
Pilgrim, F. J. & Wood, K. R. (1955). Comparative Sensitivity of Rating Scale and PairedComparison Methods for Measuring Consumer Preference. Food Technology, IX (8),385–387.
Resincow, K. & Reinhardt, J. (1991). What do children know about fat, fiber, and cholesterol?A survey of 5,116 primary and secondary school students. Journal of Nutrition Education,23, 65–71.
Shepherd, R., Sparks, P., Bellier, S. & Raats, M. (1991/2). The effects of information onsensory ratings and preferences: The importance of attitudes. Food Quality and Preference,3, 147–155.
Shepherd, R. & Stockley L. (1987). Nutrition knowledge, attitudes, and fat consumption.Journal of the American Dietetics Association, 87(5), 615–619.
Shide, D. J. & Rolls, B. J. (1995). Information about the fat content of preloads influencesenergy intake in healthy women. Journal of the American Dietetic Association, 50(9),249–255.
Solheim, R. (1992). Consumer liking for sausages affected by sensory quality and informationon fat content. Appetite, 19, 285–292.
Tuorila, H., Cardello, A. V. & Lesher, L. L. (1994). Antecedents and consequences ofexpectations related to fat-free and regular-fat foods. Appetite, 23, 247–263.
Wardle, J. & Solomons, W. (1994). Naughty but nice: A laboratory study of health informationand food preferences in a community sample. Health Psychology, 13, 180–183.
Received 13 July 1996, revision 3 April 1997