HORIZON SCAN: CONSUMER PREFERENCES - AgriFutures ...
38
HORIZON SCAN: CONSUMER PREFERENCES Queensland University of Technology November 2016 QUT authors: Dr Grant Hamilton, Dr Sangeetha Kutty, Dr Levi Swan, Dr Sandra Johnson, Dr Jared Donovan, Dr. Clinton Weeks, Prof Marek Kowalkiewicz, Assoc Prof Richi Nayak, Prof Greg Hearn, Dr Deborah Polson, Dr Markus Rittenbruch | External author: Mr Paul Barnett
-
Upload
khangminh22 -
Category
Documents
-
view
0 -
download
0
Transcript of HORIZON SCAN: CONSUMER PREFERENCES - AgriFutures ...

HORIZON SCAN: CONSUMER PREFERENCES Queensland University of Technology November 2016
QUT authors: Dr Grant Hamilton, Dr Sangeetha Kutty, Dr Levi Swan, Dr Sandra Johnson, Dr Jared Donovan, Dr. Clinton Weeks, Prof Marek Kowalkiewicz, Assoc Prof Richi Nayak, Prof Greg Hearn, Dr Deborah Polson, Dr Markus Rittenbruch | External author: Mr Paul Barnett

1
© 2018 AgriFutures Australia. All rights reserved.
ISBN 978-1-74254-990-3 ISSN 1440-6845
Horizon Scan 1: Consumer Preferences Publication No. 18/007 Project No. PRJ-010512
The information contained in this publication is intended for general use to assist public knowledge and discussion and to help improve the development of sustainable regions. You must not rely on any information contained in this publication without taking specialist advice relevant to your particular circumstances.
While reasonable care has been taken in preparing this publication to ensure that information is true and correct, the Commonwealth of Australia gives no assurance as to the accuracy of any information in this publication.
The Commonwealth of Australia, AgriFutures Australia, the authors or contributors expressly disclaim, to the maximum extent permitted by law, all responsibility and liability to any person, arising directly or indirectly from any act or omission, or for any consequences of any such act or omission, made in reliance on the contents of this publication, whether or not caused by any negligence on the part of the Commonwealth of Australia, AgriFutures Australia, the authors or contributors.
The Commonwealth of Australia does not necessarily endorse the views in this publication.
This publication is copyright. Apart from any use as permitted under the Copyright Act 1968, all other rights are reserved. However, wide dissemination is encouraged. Requests and inquiries concerning reproduction and rights should be addressed to AgriFutures Australia Communications Team on 02 6923 6900.
Researcher Contact Details
Name: Dr Grant Hamilton Address: QUT, GPO Box 2434, Brisbane, QLD 4001 Phone: +61 3138 2318 Email: [email protected]
In submitting this report, the researcher has agreed to AgriFutures Australia publishing this material in its edited form.
AgriFutures Australia Contact Details
Building 007, Tooma Way Charles Sturt University Locked Bag 588 Wagga Wagga NSW 2650
02 6923 6900 [email protected] www.agrifutures.com.au
Electronically published by AgriFutures Australia in April 2018 Print-on-demand by Union Offset Printing, Canberra at www.agrifutures.com.au or phone 1300 634 313
AgriFutures Australia is the trading name for Rural Industries Research & Development Corporation (RIRDC), a statutory authority of the Federal Government established by the Primary Industries Research and Development Act 1989.

Page 2
The Rural Industries Research Development Corporation supports Australian agriculture by anticipating novel developments and tracking long-term trends that may impact rural industries. This report captures baseline data about consumer preferences on which future horizon scans will build.
CONTENTS INTRODUCTION ......................................................................................... 3
HORIZON SCAN 1: CONSUMER PREFERENCES ..................................... 4 TREND 1: Provenance ......................................................................................................................... 5
TREND 2: Lifestyle ............................................................................................................................... 9
TREND 3: Culturalism ........................................................................................................................ 12
TREND 4: Food.x ................................................................................................................................ 16
TREND 5: Food Safety Concerns .................................................................................................... 20
TREND 6: Food for Health and Nutrition ......................................................................................... 24
EMERGING SIGNAL: Economy of People ..................................................................................... 27
APPROACH TO DATA MINING AND VISUALISATION ............................................................... 27
RECOMMENDATIONS ................................................................................. 34
REFERENCES ............................................................................................... 35
CONTENTS

Page 3
INTRODUCTION The Rural Industries Research Development Corporation (RIRDC) supports Australian agriculture by anticipating novel developments and tracking long term trends that may impact rural industries. While no forecast can be guaranteed to be perfect, there is an increasing need to connect and analyse many different sources of information.
The Queensland University of Technology (QUT) horizon scanning method used in this report is a powerful combination of interdisciplinary expertise, data mining and visualisation. Here, expert elicitation and synthesis are used to identify high probability signals, which are then explored through data mining. Once emerging trends are refined, visualisation is used to understand and evaluate their progress and enable stakeholders to explore the results. With time, this process will give us the capacity not only to identify strong signals, but also to identify weak signals that have the potential to become strong. This method also enables the analysis of sentiment attached to particular trends.
Horizon scanning can be defined as:
“the systematic examination of potential threats, opportunities and likely future developments which are at the margins of current thinking and planning and, continuing, horizon scanning may explore novel and unexpected issues, as well as persistent problems or trends” (DEFRA 2002).
Horizon scanning can assist stakeholders and decision-‐makers produce strategies and plans for a range of possible futures. Horizon scanning helps to identify near-‐term trends based on credible observations about current or imminent changes. Potential or emerging issues that may otherwise receive insufficient attention and can be meaningfully shared, elaborated and assessed by the strategic stakeholders.
The QUT methodology will be able to detect changes in trends or possible disrupters over time. As the first iteration of this report, we are capturing the baseline data on which future horizon scans will build.

Page 4
HORIZON SCAN 1: CONSUMER PREFERENCES In this first horizon scan we have focussed on consumer preferences. Consumer preferences were identified as a high priority field for examination at the workshop held at QUT on 15 August 2016. Subsequent to this broader meeting, a meeting including consumer preference experts was held at QUT Gardens Point campus on 18 October 2016 to discuss focus areas. Through visualisation of data mining results, six trends were identified as being significant:
• Provenance • Lifestyle • Culturalism • Food.x • Food safety concerns • Food for health and nutrition
We also note one emerging trend in economy of people.
The methods used to filter and analyse these seven trends include:
a) Data mining of selected Facebook pages and academic journal abstracts b) Visualisations, including:
a. Sentiment analysis of Facebook posts Sentiment is expressed as negative, neutral or positive, visualised in stacked bar graphs. The size of each coloured bar is the relative frequency of each sentiment comprising the whole concept of interest.
b. Streamgraphs A streamgraph is a type of stacked area graph that visualises the relative frequencies of individual concepts over time.
A detailed description of the methodology can be found in the Approach to Data Mining and Visualisation section of this report.
When analysing the trends, it is important to note that many of the trends are inter-‐related (e.g. provenance, food safety concerns and lifestyle each feed into each other). The trends should provide stakeholders with information to assist critical thinking and decision making, but may be of varying importance for any given industry. Trends listed below are not listed in any order of importance. We note that this first horizon scan is intended to test the methodology, and feedback is crucial for future improvement.

Page 5
TREND 1: Provenance The search criteria for provenance captured information and discussions around concepts such as ethics, origin, transparency and traceability, wild and farmed products, trust, certification, organics, locally grown products and farmer markets.
Ten concepts of interest were identified from data mining outputs and textual network analysis of Facebook data (Table 1). Most of the concepts related to halal and Coles milk, which reflects the data sources used. This will broaden as more sources become available.
FIGURE 1: Sentiment analysis for provenance trend
The sentiment analysis in Figure 1 shows concepts of interest regarding halal products and certification. We expect some of this to be driven from a cultural perspective while other signals may have been generated by politically influenced discussion. Sentiments expressed relating to halal products in general are very balanced, but slightly more negative than positive. Although Facebook activity indicates that halal foods generate positive sentiments, halal meat appears to be controversial with many negative sentiments.
The issue of supermarket branded milk seems to reflect the concern of consumers about the ethics of food production. Coles milk has a substantially larger negative sentiment than positive. In contrast, text including farmers milk only reported neutral sentiment. Discussions around the terms Coles and farmed were mostly positive, suggesting the sentiment around farmed products available in Coles stores, rather than Coles branded farmed products.
Page 6
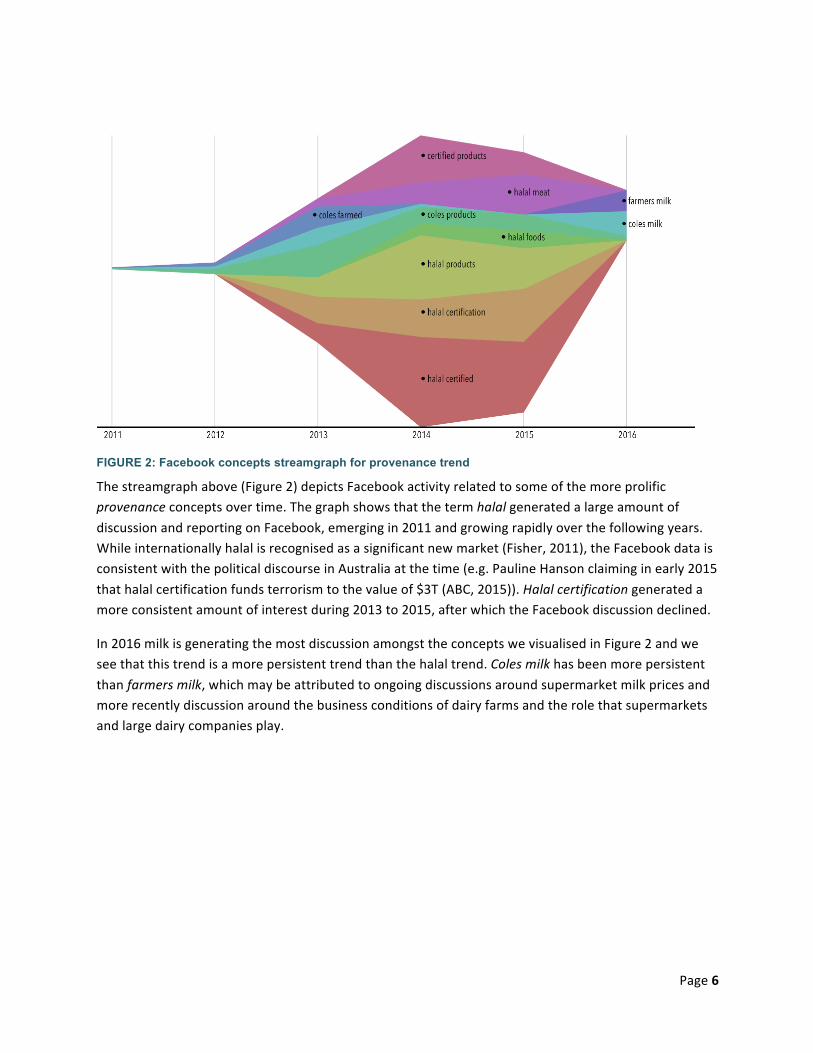
FIGURE 2: Facebook concepts streamgraph for provenance trend
The streamgraph above (Figure 2) depicts Facebook activity related to some of the more prolific provenance concepts over time. The graph shows that the term halal generated a large amount of discussion and reporting on Facebook, emerging in 2011 and growing rapidly over the following years. While internationally halal is recognised as a significant new market (Fisher, 2011), the Facebook data is consistent with the political discourse in Australia at the time (e.g. Pauline Hanson claiming in early 2015 that halal certification funds terrorism to the value of $3T (ABC, 2015)). Halal certification generated a more consistent amount of interest during 2013 to 2015, after which the Facebook discussion declined.
In 2016 milk is generating the most discussion amongst the concepts we visualised in Figure 2 and we see that this trend is a more persistent trend than the halal trend. Coles milk has been more persistent than farmers milk, which may be attributed to ongoing discussions around supermarket milk prices and more recently discussion around the business conditions of dairy farms and the role that supermarkets and large dairy companies play.
Page 7
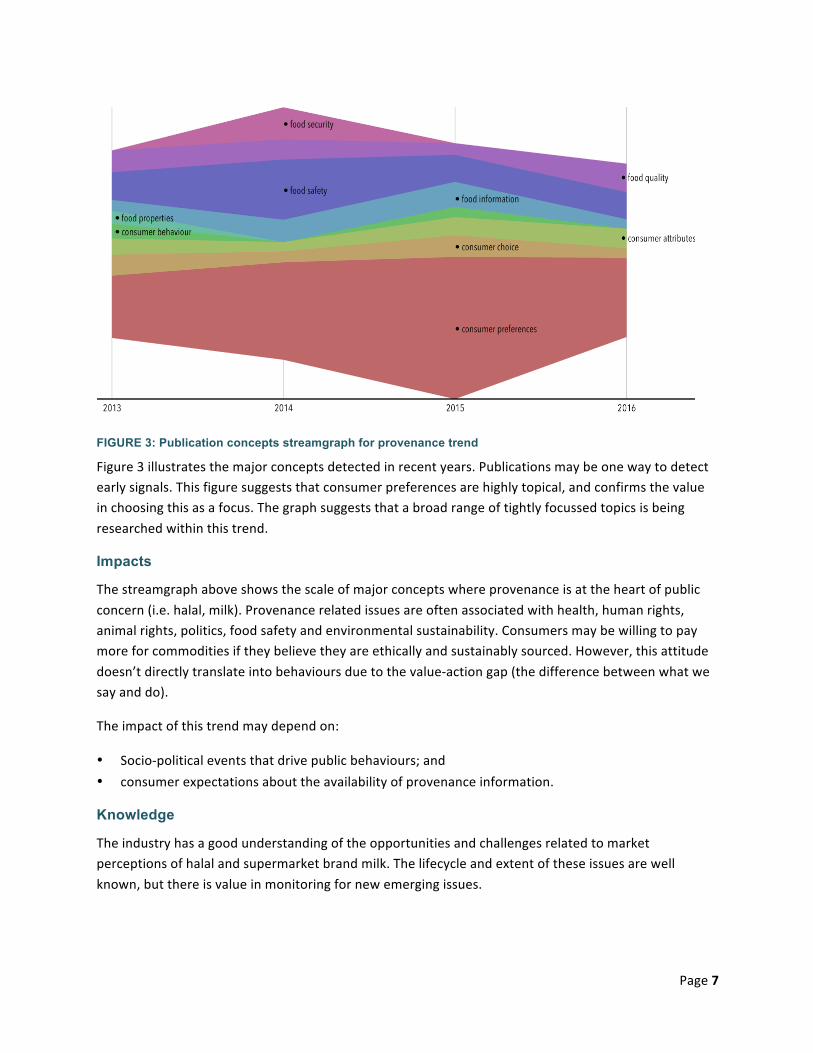
FIGURE 3: Publication concepts streamgraph for provenance trend
Figure 3 illustrates the major concepts detected in recent years. Publications may be one way to detect early signals. This figure suggests that consumer preferences are highly topical, and confirms the value in choosing this as a focus. The graph suggests that a broad range of tightly focussed topics is being researched within this trend.
Impacts
The streamgraph above shows the scale of major concepts where provenance is at the heart of public concern (i.e. halal, milk). Provenance related issues are often associated with health, human rights, animal rights, politics, food safety and environmental sustainability. Consumers may be willing to pay more for commodities if they believe they are ethically and sustainably sourced. However, this attitude doesn’t directly translate into behaviours due to the value-‐action gap (the difference between what we say and do).
The impact of this trend may depend on:
• Socio-‐political events that drive public behaviours; and • consumer expectations about the availability of provenance information.
Knowledge
The industry has a good understanding of the opportunities and challenges related to market perceptions of halal and supermarket brand milk. The lifecycle and extent of these issues are well known, but there is value in monitoring for new emerging issues.

Page 8
There is growing interest in sustainable and ethical products. For example, substantial public concern over free range eggs has emerged recently. In April 2006 the consumer advocacy group Choice released a mobile app called CluckAR to assist transparent transfer of hen stocking density information to the consumer.
Consumers choose products that have been ethically and sustainably produced even where prices include premiums (Hainmueller and Hiscox 2012a; Hainmueller and Hiscox 2012b). For example, consumers switched away from cheaper milk earlier this year (ABC 2016a).
Consumers’ expectations appear to be shifting towards greater access to provenance information. There are several examples of independent services growing to meet the consumer demand: theopenlabel.com is similar to a Wikipedia for barcodes, ‘Shop Ethical!’ (ethical.org.au, also available as smartphone app) is a guide for the environmental and social track record of companies and GoodOnYou.org.au helps people shop ethically for clothing.
Organisations like UK based Provenance (provenance.org) are providing traceability services to companies that wish to be more open and market to consumers on the basis of their transparent supply chains.
Probability
It appears likely that consumer preferences for transparency about product provenance will continue to grow strongly. Additionally, it is almost certain that new issues related to provenance information will emerge (due to either presence or absence of that information).
Growing consumer interest in provenance information may result in commodities that are unable or unwilling to provide social and environmental information being less attractive in the future.
Possible next steps
• Investigate the methodology’s potential to identify emerging trends and their trajectories. • Further research into how provenance issues may develop in different global markets, for example,
developed vs. developing countries and the growing middle class in Asia. • Further research into understanding the growing middle class in Asia and how it perceives reporting
of provenance information at different scales (product, line, company, country).

Page 9
TREND 2: Lifestyle The search criteria used to capture discussions and research into this focus area included: ease, time, skill and effort required in food preparation, convenience, time poor, professional, family and children.
FIGURE 4: Sentiment analysis for lifestyle trend
The main concepts of interest identified for this trend are almost exclusively negative (Figure 4). There may be several reasons for this, one proposition is that people are more likely to interact with other users on social media to voice their disapproval and complaints, and to share negative experiences.
Page 10
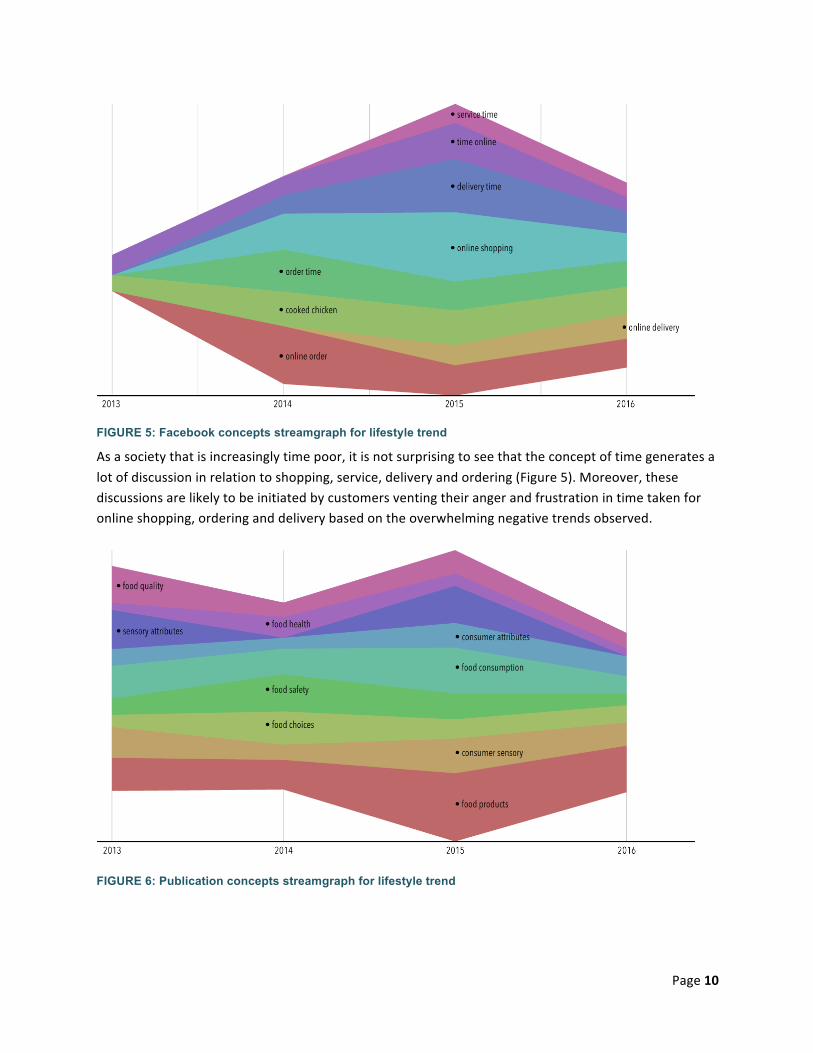
FIGURE 5: Facebook concepts streamgraph for lifestyle trend
As a society that is increasingly time poor, it is not surprising to see that the concept of time generates a lot of discussion in relation to shopping, service, delivery and ordering (Figure 5). Moreover, these discussions are likely to be initiated by customers venting their anger and frustration in time taken for online shopping, ordering and delivery based on the overwhelming negative trends observed.
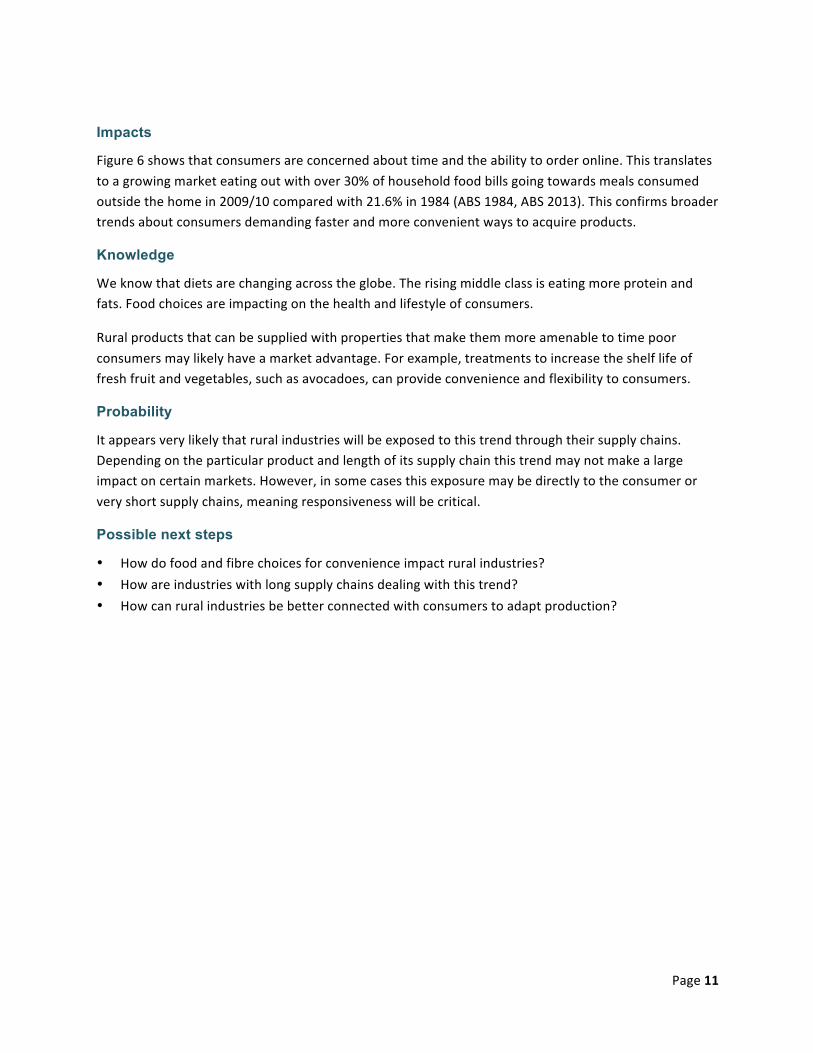
FIGURE 6: Publication concepts streamgraph for lifestyle trend
Page 11
Impacts
Figure 6 shows that consumers are concerned about time and the ability to order online. This translates to a growing market eating out with over 30% of household food bills going towards meals consumed outside the home in 2009/10 compared with 21.6% in 1984 (ABS 1984, ABS 2013). This confirms broader trends about consumers demanding faster and more convenient ways to acquire products.
Knowledge
We know that diets are changing across the globe. The rising middle class is eating more protein and fats. Food choices are impacting on the health and lifestyle of consumers.
Rural products that can be supplied with properties that make them more amenable to time poor consumers may likely have a market advantage. For example, treatments to increase the shelf life of fresh fruit and vegetables, such as avocadoes, can provide convenience and flexibility to consumers.
Probability
It appears very likely that rural industries will be exposed to this trend through their supply chains. Depending on the particular product and length of its supply chain this trend may not make a large impact on certain markets. However, in some cases this exposure may be directly to the consumer or very short supply chains, meaning responsiveness will be critical.
Possible next steps
• How do food and fibre choices for convenience impact rural industries? • How are industries with long supply chains dealing with this trend? • How can rural industries be better connected with consumers to adapt production?
Page 12
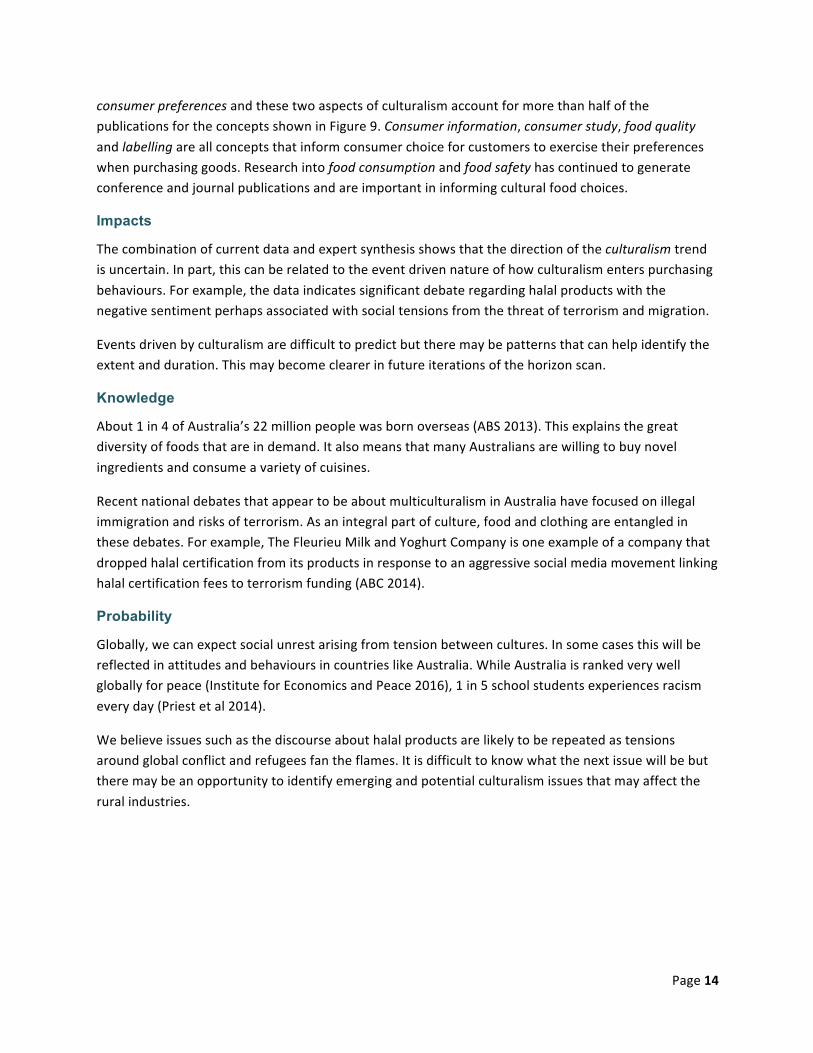
TREND 3: Culturalism Culturalism relates to the affinity or aversion for choices associated with different cultures. Search terms were chosen to explore trends related to international foods such as Chinese, Japanese, Italian and other cuisines, ethical, religious and cultural foods, fusion cuisine, nouveau and pub food.
FIGURE 7: Sentiment analysis for culturalism trend
The graph above shows that posts about halal food and halal certification on Facebook clearly dominated, so that search terms targeting posts about other cultural choices did not compete with halal related discussions and reporting. The distribution of sentiments for halal products (including halal food and halal meat) and halal certification is much the same as we observed for the provenance trend (Figure 1). Sentiments about Australian owned companies and farms, and Australian food and Australian products are emotive discussion points and take precedence even when we specifically search for food and product choices from international cultures.

Page 13
FIGURE 8: Facebook concepts streamgraph for culturalism trend
During 2014 and 2015 concepts relating to halal dominated social media (Figure 8). We also noticed that Australian owned, Australian food and Australian products continue to feature in blog posts, news articles and discussion forums on Facebook. In order to further explore current cultural food choice trends, phrases which exclude halal may enlighten sentiments and social media interest, particularly as the figure shows very little activity in 2016 for the concepts listed in 2014 and 2015.
FIGURE 9: Publication concepts streamgraph for culturalism trend
The key research area in the context of cultural food choices is the concept of consumer preferences (Figure 9). The importance of food products that support cultural choice strongly complements
Page 14
consumer preferences and these two aspects of culturalism account for more than half of the publications for the concepts shown in Figure 9. Consumer information, consumer study, food quality and labelling are all concepts that inform consumer choice for customers to exercise their preferences when purchasing goods. Research into food consumption and food safety has continued to generate conference and journal publications and are important in informing cultural food choices.
Impacts
The combination of current data and expert synthesis shows that the direction of the culturalism trend is uncertain. In part, this can be related to the event driven nature of how culturalism enters purchasing behaviours. For example, the data indicates significant debate regarding halal products with the negative sentiment perhaps associated with social tensions from the threat of terrorism and migration.
Events driven by culturalism are difficult to predict but there may be patterns that can help identify the extent and duration. This may become clearer in future iterations of the horizon scan.
Knowledge
About 1 in 4 of Australia’s 22 million people was born overseas (ABS 2013). This explains the great diversity of foods that are in demand. It also means that many Australians are willing to buy novel ingredients and consume a variety of cuisines.
Recent national debates that appear to be about multiculturalism in Australia have focused on illegal immigration and risks of terrorism. As an integral part of culture, food and clothing are entangled in these debates. For example, The Fleurieu Milk and Yoghurt Company is one example of a company that dropped halal certification from its products in response to an aggressive social media movement linking halal certification fees to terrorism funding (ABC 2014).
Probability
Globally, we can expect social unrest arising from tension between cultures. In some cases this will be reflected in attitudes and behaviours in countries like Australia. While Australia is ranked very well globally for peace (Institute for Economics and Peace 2016), 1 in 5 school students experiences racism every day (Priest et al 2014).
We believe issues such as the discourse about halal products are likely to be repeated as tensions around global conflict and refugees fan the flames. It is difficult to know what the next issue will be but there may be an opportunity to identify emerging and potential culturalism issues that may affect the rural industries.

Page 15
Possible next steps
• Analyse the data without halal related terms to identify other signals that are likely to become significant trends. Develop monitoring technique to raise these signals for consideration.
• Changing global economic and institutional structures could impact on social cohesion. This includes shifts of economic power away from the USA and the emergence of new global institutions like the Asian Infrastructure Investment Bank. Future data mining will examine this.
Page 16
TREND 4: Food.x In this trend we consider food in the context of entertainment, self-‐expression, personalisation, healthy fast food and raw food. The search terms included words to detect discussions on ‘being connected’, pub and party food, willingness to pay, indulgence, boutique, niche, wellbeing, sport, fresh and natural.
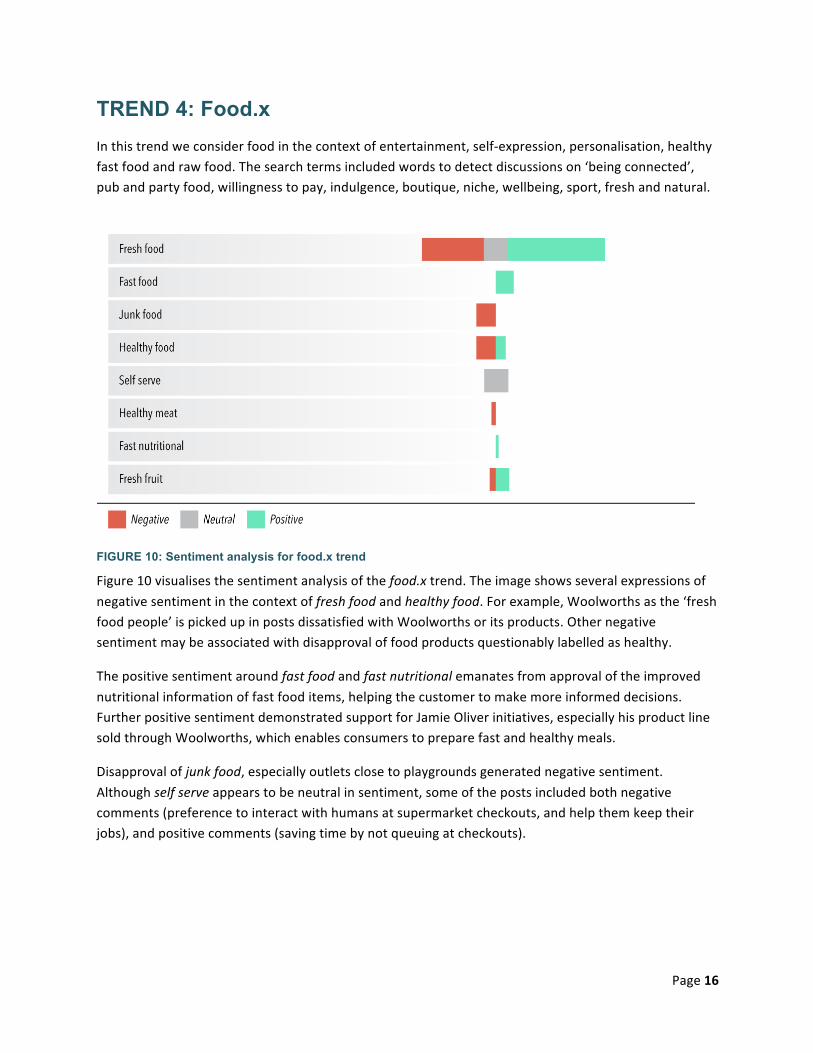
FIGURE 10: Sentiment analysis for food.x trend
Figure 10 visualises the sentiment analysis of the food.x trend. The image shows several expressions of negative sentiment in the context of fresh food and healthy food. For example, Woolworths as the ‘fresh food people’ is picked up in posts dissatisfied with Woolworths or its products. Other negative sentiment may be associated with disapproval of food products questionably labelled as healthy.
The positive sentiment around fast food and fast nutritional emanates from approval of the improved nutritional information of fast food items, helping the customer to make more informed decisions. Further positive sentiment demonstrated support for Jamie Oliver initiatives, especially his product line sold through Woolworths, which enables consumers to prepare fast and healthy meals.
Disapproval of junk food, especially outlets close to playgrounds generated negative sentiment. Although self serve appears to be neutral in sentiment, some of the posts included both negative comments (preference to interact with humans at supermarket checkouts, and help them keep their jobs), and positive comments (saving time by not queuing at checkouts).
Page 17
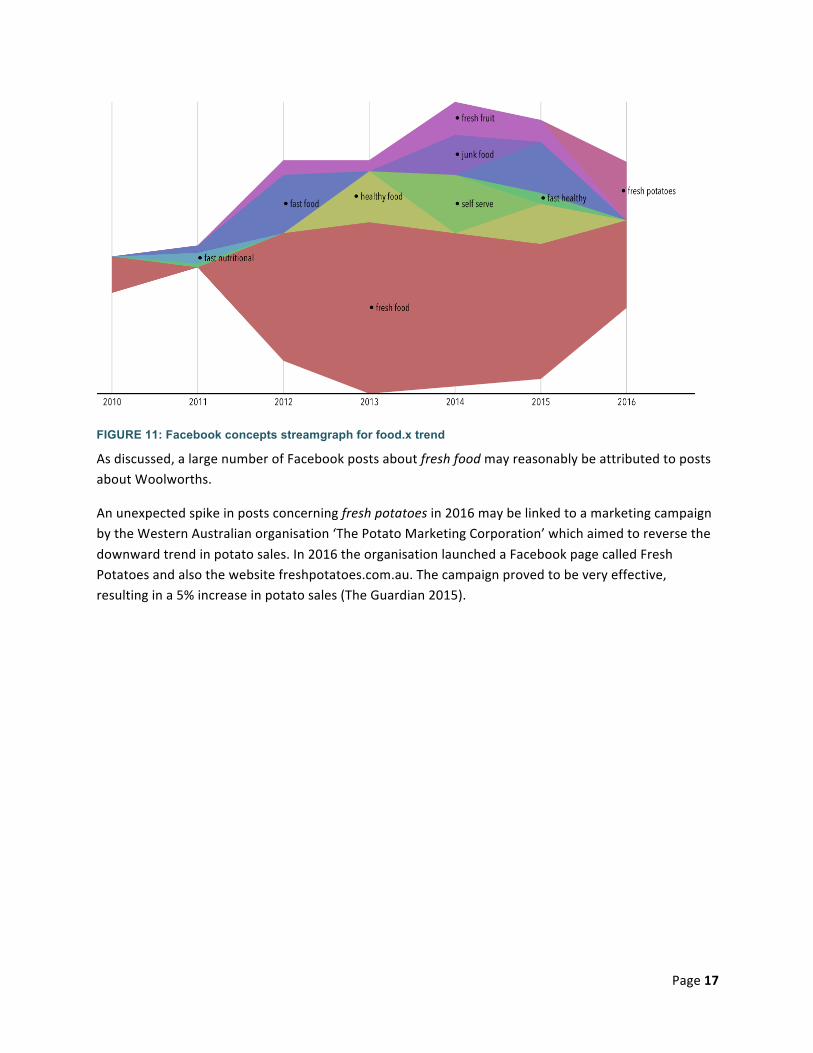
FIGURE 11: Facebook concepts streamgraph for food.x trend
As discussed, a large number of Facebook posts about fresh food may reasonably be attributed to posts about Woolworths.
An unexpected spike in posts concerning fresh potatoes in 2016 may be linked to a marketing campaign by the Western Australian organisation ‘The Potato Marketing Corporation’ which aimed to reverse the downward trend in potato sales. In 2016 the organisation launched a Facebook page called Fresh Potatoes and also the website freshpotatoes.com.au. The campaign proved to be very effective, resulting in a 5% increase in potato sales (The Guardian 2015).

Page 18
FIGURE 12: Publication concepts streamgraph for Food.x trend
Figure 12 is a streamgraph of concepts found in publications for the food.x trend. It captures concepts that enable self-‐expression and personalisation, such as food information, food safety and food quality. Publications involving food information and food labelling in the food.x trend are closely related and may overlap. The combined number of publications for these two topics remained reasonably active since 2013, but is dropping off in 2016. Research into food skills within this trend is a novel research direction, which may provide valuable insights for the next iteration of the horizon scan.
Impacts
This trend is about the role of food and other rural produce in self-‐expression. In other words, how products are used to say something about one’s self such as ‘I have a fit and healthy lifestyle’, ‘I can afford fancy or expensive things’ or ‘I consume products from sustainable and ethical sources’. This trend is well known in the clothing and fashion industry and is enabled by social media.
The impact of this trend is likely not to be industry wide, but certain people pursuing expression in this way may be seen as role models and key influencers. An interesting aspect of this trend is that interest in these role models and food as self-‐expression are not necessarily linked with a skill or interest in preparing meals (Euromonitor 2016).
Knowledge
The notion of 'conspicuous consumption' is relevant for this trend -‐ public and visible displays of consumption, traditionally around displays of wealth and power. However, with the potential to find a comfortable place for promoting any niche interest online, the abundance of messages has likely expanded.
‘Food skills’ is an emerging area of publications seen in Figure 12. This may indicate a disconnection

Page 19
between the values people are placing in food and fibres (i.e. ethics and sustainability) and their skills to prepare meals from these same raw products.
Conspicuous consumption is more prevalent now for everyday practices like food consumption via social media, growth in user-‐generated content and online sharing.
Probability
It’s unclear what proportion of the market will change purchasing habits based on this trend. Individuals with higher disposable income or stronger relationship with their ‘tribe’ (e.g. crossfit, paleo, raw) may be more likely to follow this trend. Of course many consumers will still, or as a base, seek more conventional benefits (such as nutrition) from the consumption of rural produce.
There may be some convergence with the provenance trend. Trusted provenance information may enable displays of personal values related to food and fibre supply chains.
Possible next steps
• Attempt to remove the Woolworths contribution to the fresh food concept. • Identify drivers (established or emerging) for food.x trend. Attempt to predict or gain early
indications of the emergence of food.x signals.

Page 20
TREND 5: Food Safety Concerns Consumer knowledge of product safety is of prime importance in this trend. This includes access to information about the presence of pesticides and additives, feed stocks or how produce was grown.
Consumer trust in product safety can be related to perceptions about a company, contamination incidences, knowledge of the halal procedure followed, country of origin of products and organic production methods.
FIGURE 13: Sentiment analysis for food safety concerns trend
As expected, food safety is an emotive issue (Figure 13) with a relatively small number of neutral posts compared to the positive and negative sentiments.
For example, the spread of sentiments surrounding Coles eggs are related to the complex interplay of consumer emotions in light of TV coverage of cage egg production and Aldi’s pledge to remove cage eggs from its shelves within 9 years. Discussions about eggs concerned not only chicken eggs, but also chocolate Easter eggs. Easter egg controversies were about the ingredients of Coles branded Easter eggs, which relates to the negative sentiments expressed in trust in Coles and Coles branded products.

Page 21
Again, we see here the importance of a sense of ‘fair play’, trust and provenance. Negative sentiments expressed in Facebook posts regarding Australian farmers, Australian grown, farmers produce and farmers trust are primarily within the context of concern for Australian farming families and their ability to survive perceived unfair competition from other countries. There is also a perception that Australian companies, including supermarkets, are more focussed on profits than supporting Australian farmers. The anomaly where Coles salmonella and salmonella lettuce generated posts with positive sentiment are mainly due to consumer sarcasm, which is difficult to filter out.
FIGURE 14: Facebook concepts streamgraph for food safety concerns trend
An example of the importance that consumers place in local production can be seen from the spike in posts about the Australian company Spring Gully. In April 2013 news leaked that this Australian company of three generations went into voluntary administration. The family owning the business turned to social media to tell their story and seek customer support. The campaign got a lot of traction, sales increased, the company was saved. However, attention to the story declined by 2014 (Food and Beverage 2013).
Posts about Australian farmers and farmers produce vary in intensity, but always generate interest on social media. In 2016 discussions on Facebook are centred on Coles salmonella found in pre-‐packaged lettuce in Coles and Woolworths (ABC 2016b).
Page 22
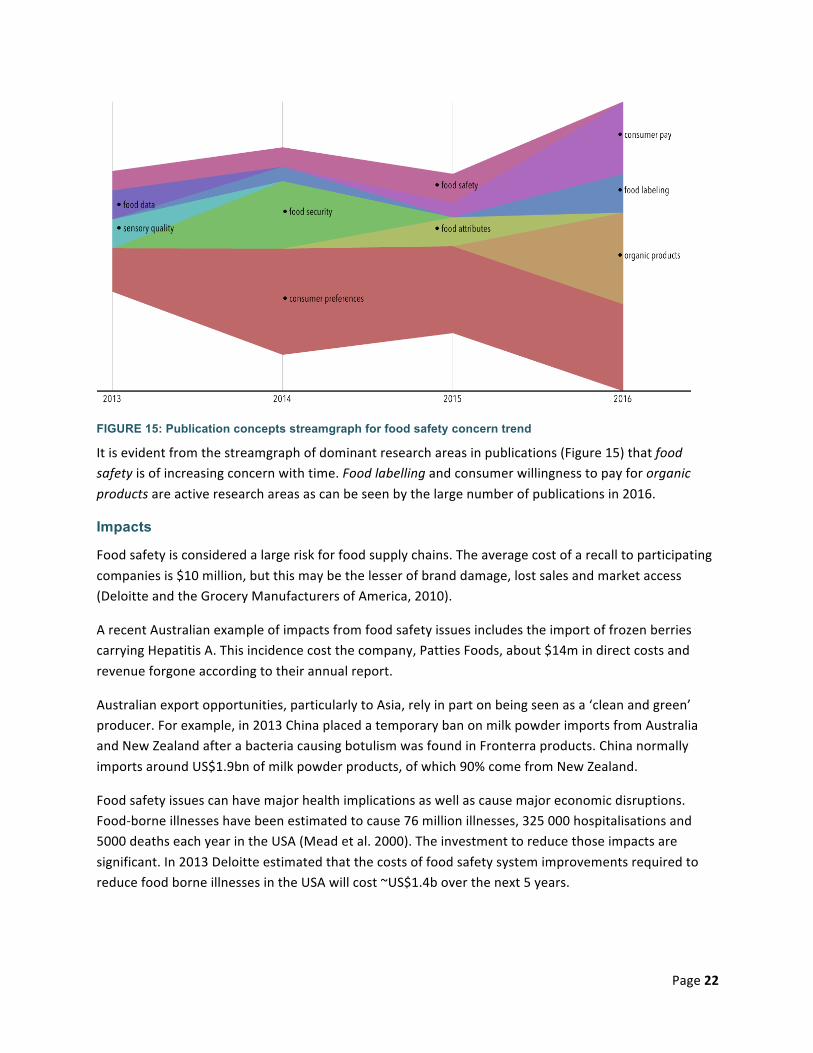
FIGURE 15: Publication concepts streamgraph for food safety concern trend
It is evident from the streamgraph of dominant research areas in publications (Figure 15) that food safety is of increasing concern with time. Food labelling and consumer willingness to pay for organic products are active research areas as can be seen by the large number of publications in 2016.
Impacts
Food safety is considered a large risk for food supply chains. The average cost of a recall to participating companies is $10 million, but this may be the lesser of brand damage, lost sales and market access (Deloitte and the Grocery Manufacturers of America, 2010).
A recent Australian example of impacts from food safety issues includes the import of frozen berries carrying Hepatitis A. This incidence cost the company, Patties Foods, about $14m in direct costs and revenue forgone according to their annual report.
Australian export opportunities, particularly to Asia, rely in part on being seen as a ‘clean and green’ producer. For example, in 2013 China placed a temporary ban on milk powder imports from Australia and New Zealand after a bacteria causing botulism was found in Fronterra products. China normally imports around US$1.9bn of milk powder products, of which 90% come from New Zealand.
Food safety issues can have major health implications as well as cause major economic disruptions. Food-‐borne illnesses have been estimated to cause 76 million illnesses, 325 000 hospitalisations and 5000 deaths each year in the USA (Mead et al. 2000). The investment to reduce those impacts are significant. In 2013 Deloitte estimated that the costs of food safety system improvements required to reduce food borne illnesses in the USA will cost ~US$1.4b over the next 5 years.

Page 23
Knowledge
The public has a general distrust of large corporations (Adams, Highhouse, and Zickar 2010) including large agribusiness. This is demonstrated in discussions about takeovers between major agricultural suppliers including Bayer and Monsanto or DuPoint and Dow Chemicals. This growing distrust is not aided by food safety issues such as described above in relation to berries and milk powder.
There are potential links with the trends of economy of people and culturalism. Both are topics for further investigation. Links with economy of people may take the shape of how food safety systems support supply chains that become more web like and distributed and at the same time potentially gain inherent trust of people to people transactions. Links with the culturalism trend may include impacts of perceptions of food safety in different cultures.
Probability
It is clear that consumers’ trust in food supply chains and food companies diminishes with food safety issues and recalls. There are more than 300 food recalls a year in the USA, while Australia has an average of 60 recalls per year (Food Standards 2016).
Not all recalls receive the same publicity or are of a serious nature but their existence appears to be quite regular in the current food system and food safety system.
Possible next steps
• Understand how food safety concerns interact with economy of people, culturalism and provenance trends. Is there more or less concern for food safety on a risk basis under different models?
• What is the case for investment in food safety in the context of costs and brand value? Does this investment link up in connected ways? What is the intersection with the Internet of Things?
• The related and ongoing impacts of the Fronterra milk powder incidence and similar events on export markets for rural products could be better monitored through geographic analysis combined with sentiment tracking.

Page 24
TREND 6: Food for Health and Nutrition The sentiment analysis for the food for health and nutrition trend indicates that the discussions and coverage on Facebook are mainly well balanced.
Some exceptions are the Australian products focus area, where a much larger proportion of the content evoked negative sentiments, and to a lesser extent fresh food and food labelling where the negative sentiments marginally outweighed the positive or neutral coverage.
FIGURE 16: Sentiment analysis for food for health and nutrition trend
Discussions about food oil primarily referred to disapproval of palm oil and health benefits of coconut oil. Sentiment analysis illustrates that food choice is highly valued. The neutrality of discussions surrounding limited energy and limited resources are mainly due to the data sources registering high activity for these terms on Woolworths and ABC Rural Facebook pages. These are concerns expressed for the productivity and sustainability of farming in Australia.
Page 25
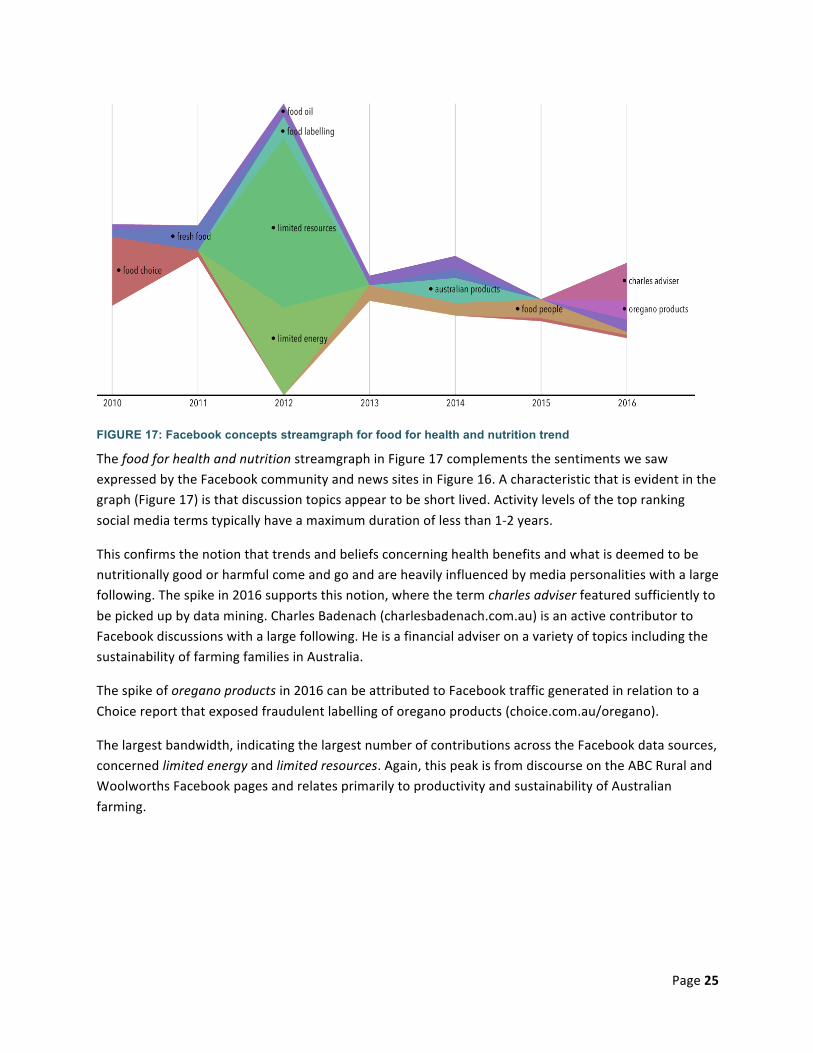
FIGURE 17: Facebook concepts streamgraph for food for health and nutrition trend
The food for health and nutrition streamgraph in Figure 17 complements the sentiments we saw expressed by the Facebook community and news sites in Figure 16. A characteristic that is evident in the graph (Figure 17) is that discussion topics appear to be short lived. Activity levels of the top ranking social media terms typically have a maximum duration of less than 1-‐2 years.
This confirms the notion that trends and beliefs concerning health benefits and what is deemed to be nutritionally good or harmful come and go and are heavily influenced by media personalities with a large following. The spike in 2016 supports this notion, where the term charles adviser featured sufficiently to be picked up by data mining. Charles Badenach (charlesbadenach.com.au) is an active contributor to Facebook discussions with a large following. He is a financial adviser on a variety of topics including the sustainability of farming families in Australia.
The spike of oregano products in 2016 can be attributed to Facebook traffic generated in relation to a Choice report that exposed fraudulent labelling of oregano products (choice.com.au/oregano).
The largest bandwidth, indicating the largest number of contributions across the Facebook data sources, concerned limited energy and limited resources. Again, this peak is from discourse on the ABC Rural and Woolworths Facebook pages and relates primarily to productivity and sustainability of Australian farming.
Page 26
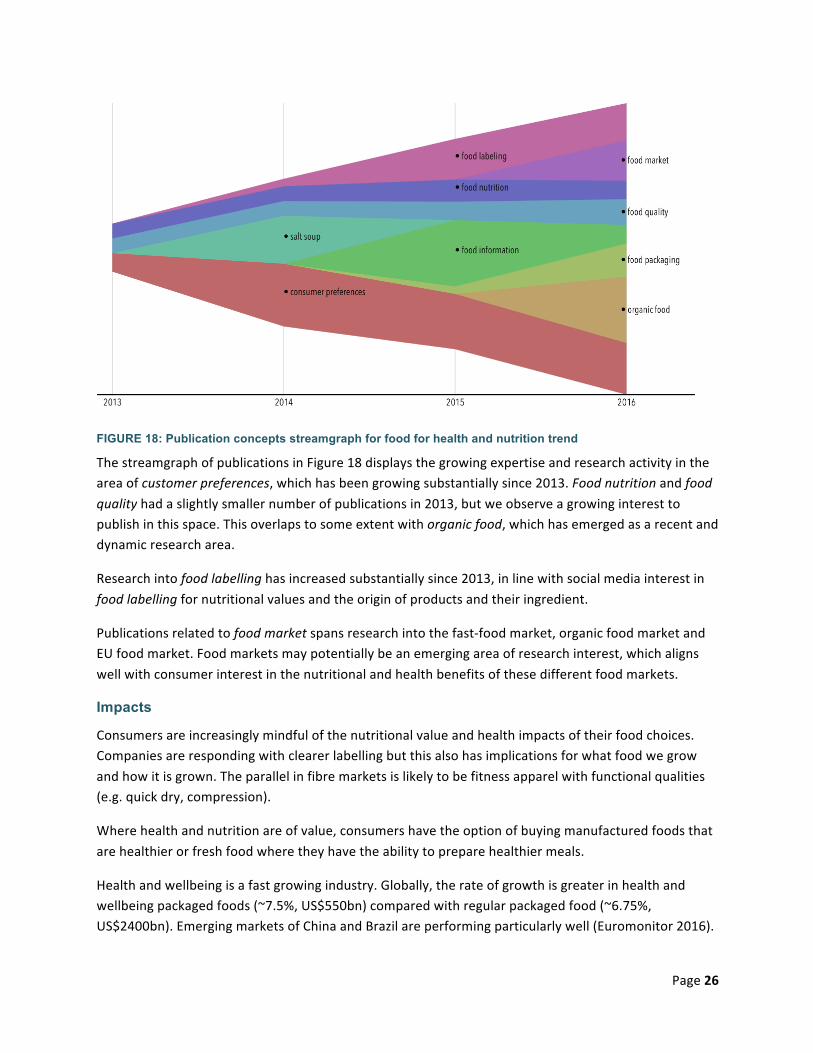
FIGURE 18: Publication concepts streamgraph for food for health and nutrition trend
The streamgraph of publications in Figure 18 displays the growing expertise and research activity in the area of customer preferences, which has been growing substantially since 2013. Food nutrition and food quality had a slightly smaller number of publications in 2013, but we observe a growing interest to publish in this space. This overlaps to some extent with organic food, which has emerged as a recent and dynamic research area.
Research into food labelling has increased substantially since 2013, in line with social media interest in food labelling for nutritional values and the origin of products and their ingredient.
Publications related to food market spans research into the fast-‐food market, organic food market and EU food market. Food markets may potentially be an emerging area of research interest, which aligns well with consumer interest in the nutritional and health benefits of these different food markets.
Impacts
Consumers are increasingly mindful of the nutritional value and health impacts of their food choices. Companies are responding with clearer labelling but this also has implications for what food we grow and how it is grown. The parallel in fibre markets is likely to be fitness apparel with functional qualities (e.g. quick dry, compression).
Where health and nutrition are of value, consumers have the option of buying manufactured foods that are healthier or fresh food where they have the ability to prepare healthier meals.
Health and wellbeing is a fast growing industry. Globally, the rate of growth is greater in health and wellbeing packaged foods (~7.5%, US$550bn) compared with regular packaged food (~6.75%, US$2400bn). Emerging markets of China and Brazil are performing particularly well (Euromonitor 2016).

Page 27
In 2005, carbonated beverages, milk, coffee and spreads dominate the top 20 retail food items in Australian shopping baskets, whereas in 2015 fruits such as strawberries and blueberries appear. Of the overall growth in grocery value between 2005 and 2015 ($10.2bn), fresh meat, fruit and vegetables were responsible for nearly 20% (Neilsen 2015).
Knowledge
Diets are changing. Consumers are increasingly mindful of excess sugar, salt and fats in their food. Organic food is perceived as being healthier for individuals with less chemical residues. Proliferation of raw and health food outlets indicates a growing demand for fresh and healthy food.
Many marketing campaigns related to rural industries revolve around the health status of products (e.g. heart tick). Customer perception appears to be that Australian products are more trustworthy with respect to farming practices and quality control than those from other countries.
Probability
Many people are aware of good nutrition, yet many still do not follow this with behaviour that leads to good nutritional outcomes. This is a values-‐action gap. Nevertheless, as the issue of unhealthy eating is associated with significant health costs, it is likely to receive more attention from government and community advocates. Note that food packaging, labelling and information receive attention in the publications data.
Possible next steps
• Understand what the key nutrition trends are that could be serviced by rural industries in Australia.
EMERGING SIGNAL: Economy of People Some signals in the data do not yet have sufficient information for visualisation, but are nonetheless likely to be important. One potential focus area involves the emerging pattern of person-‐to-‐person interactions that are characterised as agile, resilient and adaptable. The current Economy of Corporations is ceding ground to the Economy of People enabled by digital services. For example, Uber and Airbnb are unlocking the potential of underutilised assets and capabilities. This trend is partly driven by the concept of trust -‐ consumers trust other consumers more than they do retailers and businesses.
We will search for more data and explore this area in the next horizon scan.
APPROACH TO DATA MINING AND VISUALISATION Data mining methods and visualisation techniques were used to scan and filter the resources available to create a watch list of possible trends using social media and scientific literature.

Page 28
Clustering, a data mining technique that involves grouping a set of objects in such a way that objects in the same group (called a cluster) are more similar to each other than to those in other groups, has been used to identify patterns that were previously unknown. We utilised a novel clustering technique called Fine-‐grained Document Clustering via Ranking (FGCR). This novel technique allows the identification of fine-‐grained clusters even on big data using the power of search engines. This method is suitable for our purpose as it could utilise the search terms identified in the previous phase to create more relevant and fine-‐grained clusters allowing us to cluster very large data sources and create fine-‐grained clusters efficiently.
Using natural language processing, statistics and machine learning we extract, identify or characterize the sentiment content of a text especially from the data. We conducted sentiment analysis for data from social media as these are subjective impressions and not facts. However, these impressions can provide the weak signals that will help us identify any emerging trends. This analysis helps to capture the hopes, fears and potential opportunities from data provided by stakeholders. By doing so, we envision to identify if there are any changes to the current industry practices are required both in the short term and long term.
Data mining for the horizon scan included text from social media sources and from peer reviewed academic journal articles. These sources were suggested during a workshop held with industry experts and with QUT experts. In this report, we mainly focused on Facebook data among social media sources, which included contributions from a wide variety of contributors (see Table 5).
TABLE 5: Facebook sources
Data source type Data source name Online consumer forums • Choice (facebook.com/choiceaustralia) -‐ a consumer advocacy
group providing advice and organising campaigns on issues related to diverse products from banking, finance, consumer goods to food products. Their website is choice.com.au.
• Consumers Health Forum of Australia (facebook.com/CHFofAustralia) -‐ advocates national healthcare consumers and provides a platform to voice their opinions. Their website is www.chf.org.au.
Chat sites • AgChatOz (facebook.com/agchatoz) -‐ an online agricultural community for the Australian agricultural industry which facilitates weekly discussions and webinars and provides deeper insights about the issues in Australian agriculture. Their website is agchatoz.org.
News sites • ABC Rural (facebook.com/pg/ABCRural) – a gateway to the agricultural and rural community that includes up-‐to-‐date information about several rural industries (abc.net.au/news/rural).
• Farm Online (facebook.com/farmonline) -‐ this Facebook page includes information sourced from leading Agricultural newspapers in Australia (farmonline.com.au).
Magazines • Queensland Country Life (facebook.com/queenslandcountrylife) –

Page 29
an online magazine that provides agricultural and rural news for Queensland. There are over 28k people interested in the newspaper’s Facebook page. Their website is queenslandcountrylife.com.au.
Major supermarket chains • Coles (facebook.com/coles) -‐ a major supermarket chain with over 1 million customers interested in this Facebook page. This page informs its customers about the latest products and provides a platform to voice their opinions. The Facebook site also offers a customer care option to immediately address consumers’ needs. The website is coles.com.au.
• Woolworths (facebook.com/woolworths) -‐ also provides similar service through its online social media platform encouraging visitors to post their opinions and concerns online. Their website is woolworths.com.au.
• Aldi (facebook.com/ALDI.Australia) – another popular supermarket that uses Facebook mostly to advertise its weekly special products and also provides a customer service form on its Facebook page. 400k Facebook users are interested in this page. Their website is aldi.com.au.
Newspapers • The Facebook page of The Land (facebook.com/thelandnewspaper). The Land is a very established newspaper that was started in 1911. It provides comprehensive coverage of a broad range of news and analysis about rural life focusing on communities in the heartland of NSW (theland.com.au).
Government Facebook pages • Australian Biosecurity (facebook.com/australianbiosec) • Department of Foreign Affairs and Trade
(facebook.com/pages/Department-‐of-‐Foreign-‐Affairs-‐and-‐Trade/105797869460429)
In addition to Facebook data, academic publications were also mined. These academic publications were taken from researchers publishing in the agricultural and biological domain, using abstracts sourced from Scopus and spanning from 2011 to 2017. The main objective of using this data source in our project is to gain an in-‐depth understanding of the focus areas of the researchers in this domain relevant to our search terms. We note for this first horizon scan, QUT publications were used. A broader range of publications will be used for the next scan.
The aforementioned rich data sources provide a broad and varied perspective of topical discussion points, and emerging research areas.
Data output from data mining includes details such as: username, location, date, cluster, distance, content, abstract and sentiment. The exact makeup of the data is determined by the source. For example, sentiment can be determined from Facebook data, but not from publication data.
Abstracts (as concise summaries of the manuscripts) and key conclusions were deemed to be more appropriate than scanning complete articles. This method also avoids any potential copyright issues.

Page 30
The table below summarises the data mining input sourced from social media via the Facebook API and academic journal publication data using abstracts of conference papers and journal articles from Scopus.
TABLE 6: Summary of unique posts and articles
Data source type
Domain Data source name No. of posts / articles
Total no. of posts / articles in a domain
Facebook Consumer forums Choice 3357 5074 Consumers Health Forum of
Australia 1717
Chat sites AgChatOz 1096 1096 Supermarkets Coles 92103 197,234
Woolworths 105002 Aldi Australia 129
News sites ABC Rural 8420 9166 Farm Online 746
Newspaper The Land 4211 4211 Magazine Queensland Country Life 4139 4139 Government pages Department of Biosecurity 211 884
Department of Foreign Affairs and Trade
673
Academic Publications
Abstracts of conference papers & journal articles
QUT Agricultural and biological sciences
933 933
The corpus (the entire collection of text from all sources) is filtered based on the focus of the visualisation analysis. For example, visualisation of temporal trends requires that the corpus is filtered based on ‘date’ so that trending concepts can be mapped over a time period. For the purpose of visualisations presented in this report, the corpus has been filtered based on date and sentiment. This has enabled various trends within a focus area to be identified based on date, as well as the sentiment associated with these trends.
Each filtered corpus was then processed using Voyant Tools text analysis web application (voyant-‐tools.org). The purpose of this processing stage was to analyse terms that occur in the corpus, specifically to gain insight into (i) frequency and (ii) collocates.
Frequency refers to the number of instances that each term occurred in the corpus. This provides an indication of the most prominent concepts present in the corpus. The output is a table, listing each term arranged from most frequent to least frequent, and the number of occurrences.
Collocates refers to terms that occur near one another in the corpus. Unlike single terms, collocates

Page 31
provide greater context for each term, consequently providing more meaning to the analysis. The output of collocates is a table which identifies each of the collocated terms and the frequency that they occur in the corpus.
This frequency and collocate data comprise the data structure used to produce network visualisations (Figure 19). These are a graphical representation of terms (shown as circles), and collocates (two terms joined by lines).
FIGURE 19: Network visualisation example
The circle size in which the terms are shown is relative to the frequency that the term occurs in the corpus. The thickness of lines joining terms, subsequently showing collocates, is relative to the frequency that each collocate occurs in the corpus.
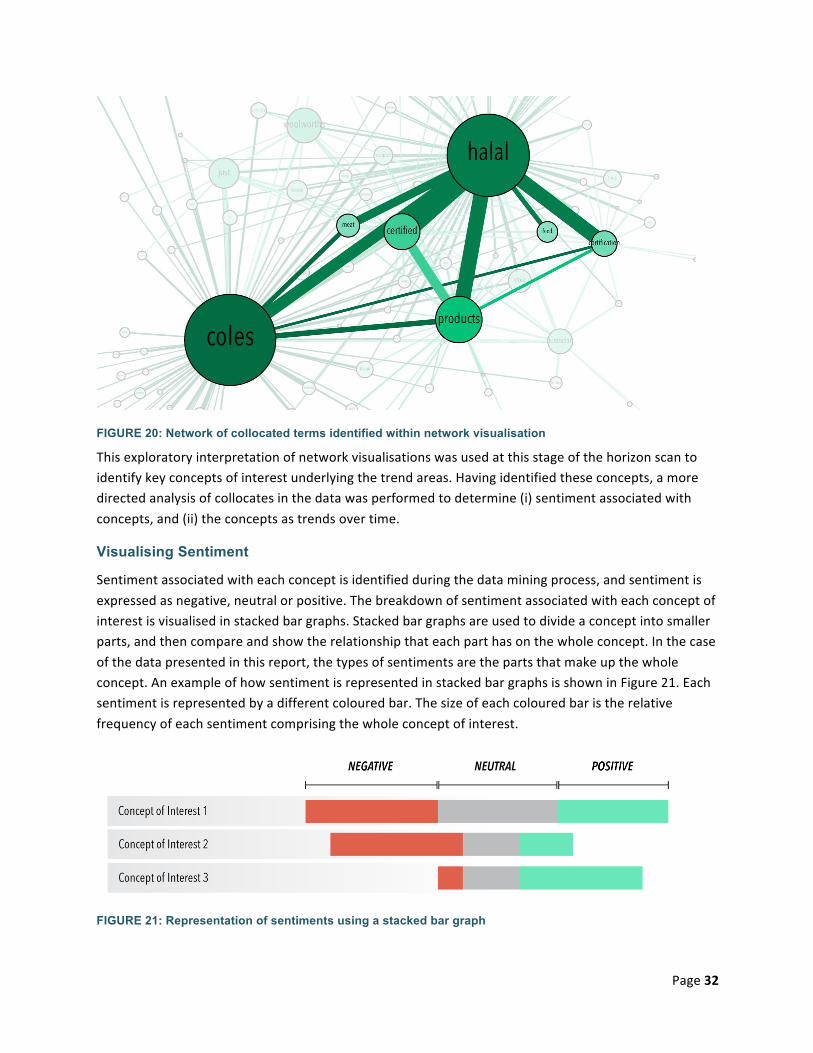
While complex, network visualisations are beneficial for exploring large datasets. They allow for complex data to be presented concurrently. Furthermore, they are interactive, allowing for some terms and collocates to be suppressed. The benefit of this is that it allows for very prominent concepts, as well as smaller networks of concepts, to be identified. This capability is represented in Figure 20, in which a network of collocates related primarily to ‘halal’ and ‘coles’ is identified.
Page 32
FIGURE 20: Network of collocated terms identified within network visualisation
This exploratory interpretation of network visualisations was used at this stage of the horizon scan to identify key concepts of interest underlying the trend areas. Having identified these concepts, a more directed analysis of collocates in the data was performed to determine (i) sentiment associated with concepts, and (ii) the concepts as trends over time.
Visualising Sentiment
Sentiment associated with each concept is identified during the data mining process, and sentiment is expressed as negative, neutral or positive. The breakdown of sentiment associated with each concept of interest is visualised in stacked bar graphs. Stacked bar graphs are used to divide a concept into smaller parts, and then compare and show the relationship that each part has on the whole concept. In the case of the data presented in this report, the types of sentiments are the parts that make up the whole concept. An example of how sentiment is represented in stacked bar graphs is shown in Figure 21. Each sentiment is represented by a different coloured bar. The size of each coloured bar is the relative frequency of each sentiment comprising the whole concept of interest.
FIGURE 21: Representation of sentiments using a stacked bar graph
Page 33
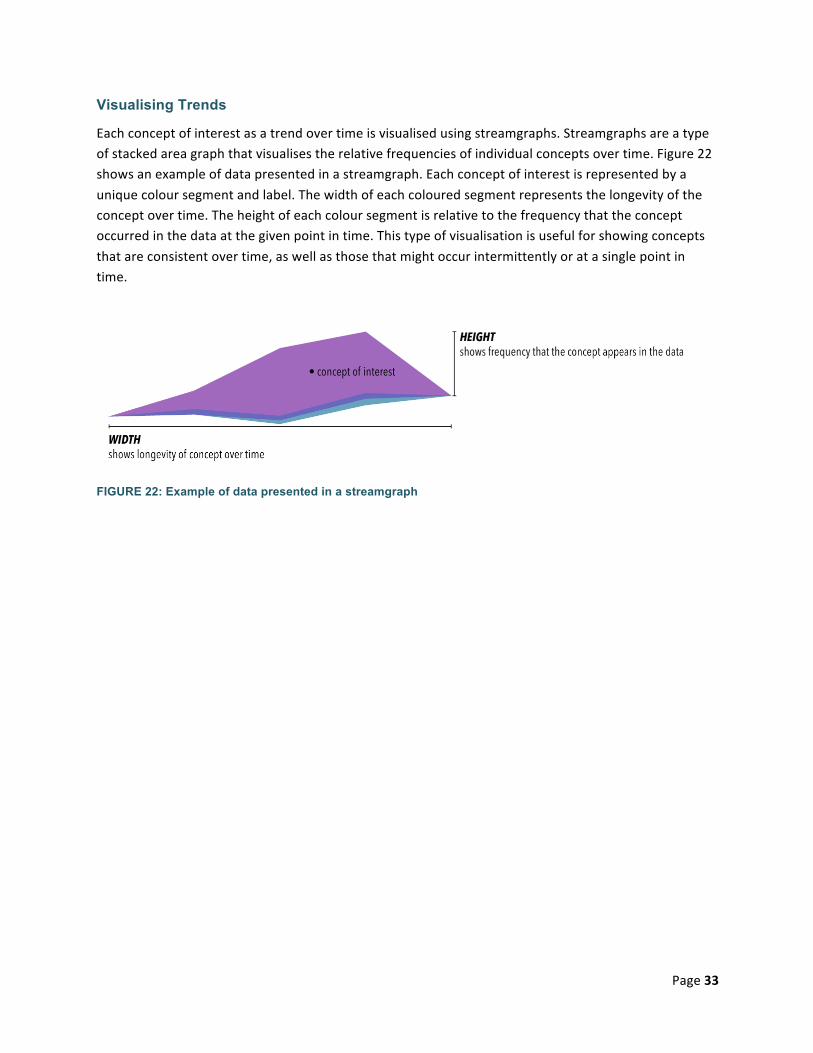
Visualising Trends
Each concept of interest as a trend over time is visualised using streamgraphs. Streamgraphs are a type of stacked area graph that visualises the relative frequencies of individual concepts over time. Figure 22 shows an example of data presented in a streamgraph. Each concept of interest is represented by a unique colour segment and label. The width of each coloured segment represents the longevity of the concept over time. The height of each colour segment is relative to the frequency that the concept occurred in the data at the given point in time. This type of visualisation is useful for showing concepts that are consistent over time, as well as those that might occur intermittently or at a single point in time.
FIGURE 22: Example of data presented in a streamgraph

Page 34
RECOMMENDATIONS While this first pass horizon scan demonstrated the utility of the methodology, it has also highlighted where there is room for improvement. The following are recommendations for the project team to learn and adapt the methodology:
• Expand on data sources and clarify the utility of different data sources for the detection of different signals – where and how will early and late stage signals be detected?
• Work with stakeholders to understand the value of information, what else is needed and the utility of the figures that have been used.
• Make visualisations interactive in future iterations • Deeper synthesis to reveal weak signals and trend trajectories • Review report format and approach with RIRDC and key industry stakeholders

Page 35
REFERENCES ABC News. 2014. "Fleurieu Milk and Yoghurt Company loses $50,000 Emirates deal after bowing to pressure to drop Halal certification" ABC News. 9 November 2014. Accessed 4 November 2016. http://www.abc.net.au/news/2014-‐11-‐09/company-‐drops-‐halal-‐certification-‐due-‐to-‐social-‐media-‐pressure/5877584
ABC News. 2015. "Fact check: Does halal certification fund terrorism?" ABC News. 21 April 2015. Accessed 4 November 2016. http://www.abc.net.au/news/2015-‐04-‐14/fact-‐check-‐does-‐halal-‐certification-‐fund-‐terrorism/6383238
ABC News. 2016a. "Consumers switch dollar milk for branded product as dairy crisis hits farmers." ABC News. 12 August 2016. Accessed 3 November 2016. http://www.abc.net.au/news/2016-‐08-‐12/private-‐vs-‐branded-‐milk/7723408.
ABC News. 2016b. "Lettuce recall: Salmonella outbreak traced to prepacked salad mixes from major supermarkets." ABC News. 4 February 2016. Accessed 3 November 2016. http://www.abc.net.au/news/2016-‐02-‐04/prepacked-‐salad-‐mixes-‐behind-‐salmonella-‐cases/7140646.
ABS, Australian Bureau of Statistics. 1984. "Household Expenditure Survey, Australia: Household Characteristics (cat. no. 6531.0)".
ABS, Australian Bureau of Statistics. 2013. "Australian Social Trends, April 2013 (cat. no. 4102.0)".
Adams, Jason E, Scott Highhouse, and Michael J Zickar. 2010. “Understanding General Distrust of Corporations.” Corporate Reputation Review 13 (1): 38–51. doi:10.1057/crr.2010.6.
Austin, Nigel. 2013. "Spring Gully sales spike after passionate plea, company signs Coles contract." The Australian. 15 April 2013. Accessed 13/11/2016. http://www.theaustralian.com.au/news/massive-‐sales-‐surge-‐for-‐spring-‐gully/story-‐e6frg6n6-‐1226621092269.
Badenach, Charles. 2016. "Charles Badenach " Accessed 3/11/2016. http://www.charlesbadenach.com.au/.
Bradley, Joseph, Joel Barbier, and Doug Handler. 2013. “Embracing the Internet of Everything To Capture Your Share of $14.4 Trillion.” CISCO. www.cisco.com/web/about/ac79/docs/innov/IoE_Economy.pdf.
CHOICE staff. 2016. "Does your spice rack contain fake oregano?" CHOICE. 5 April 2016. Accessed 3/11/2016. https://www.choice.com.au/oregano.
DEFRA, UK Department for Environment Food andRural Affairs. 2002. "Horizon Scanning & Futures Home." Accessed 3/11/2016. http://webarchive.nationalarchives.gov.uk/20060919121055/horizonscanning.defra.gov.uk/.
Deloitte. 2013. “The Food Value Chain.”
Ethical Consumers Australia. 2016. "Good on you." Accessed 3/11/2016. http://goodonyou.org.au/.
Euromonitor International. 2016. "The Global Impact of the Rise of the Can’t Cook Gourmet." Accessed 3/11/2016. http://www.euromonitor.com/the-‐global-‐impact-‐of-‐the-‐rise-‐of-‐the-‐cant-‐cook-‐gourmet/report.
Page 36
Fischer, Johan 2011 The Halal Frontier: Muslim Consumers in a Globalized Market, Contemporary Anthropology of Religion Series, Palgrave MacMillan.
Food and Beverage. 2013. "Troubled Spring Gully gets boost after plea" 17 April 2013. Accessed 4 November 2016. https://foodmag.com.au/troubled-‐spring-‐gully-‐gets-‐boost-‐after-‐plea/
Food Marketing Institute (FMI), Grocery Manufacturers Association (GMA), GS1 US and Deloitte. 2010. "Recall Execution Effectiveness: Collaborative Approaches to Improving Consumer Safety and Confidence." Accessed 3/11/2016. http://www.gmaonline.org/downloads/research-‐and-‐reports/WP_RecallExecution.pdf
Food Standards. 2016. “Food Recall Statistics”. March 2016. Accessed 4 November 2016. http://www.foodstandards.gov.au/industry/foodrecalls/recallstats/Pages/default.aspx.
The Guardian. 2015. “Half-‐Baked? Why Australia Is Getting a Raw Deal on Potatoes”. 30 September 2016. Accessed 4 November 2016. https://www.theguardian.com/lifeandstyle/australia-‐food-‐blog/2015/sep/30/half-‐baked-‐why-‐australia-‐is-‐getting-‐a-‐raw-‐deal-‐on-‐potatoes.
Hainmueller, Jens, and Michael J. Hiscox. 2012a. “Buying Green? Field Experimental Tests of Consumer Support for Environmentalism.” http://papers.ssrn.com/sol3/papers.cfm?abstract_id=2062429.
Hainmueller, Jens, and Michael J. Hiscox. 2012b. “The Socially Conscious Consumer? Field Experimental Tests of Consumer Support for Fair Labor Standards.” http://papers.ssrn.com/sol3/papers.cfm?abstract_id=2062435.
Institute for Economics and Peace. 2016. “Global Peace Index”
Llewellyn, Marc. 2015. "Half-‐baked? Why Australia is getting a raw deal on potatoes." The Guardian. 30 September 2015. Accessed 3/11/2016. https://www.theguardian.com/lifeandstyle/australia-‐food-‐blog/2015/sep/30/half-‐baked-‐why-‐australia-‐is-‐getting-‐a-‐raw-‐deal-‐on-‐potatoes.
Long, Warwick. 2016. "Consumers switch dollar milk for branded product as dairy crisis hits farmers." ABC Rural. http://www.abc.net.au/news/2016-‐08-‐12/private-‐vs-‐branded-‐milk/7723408.
Martin, Alistair and Helena Martin. 2016. "Ripe Near Me." Accessed 3/11/2016. http://www.ripenear.me/.
Mead, Paul S., Laurence Slutsker, Vance Dietz, Linda F. McCaig, and others. 2000. “Food-‐Related Illness and Death in the United States.” Journal of Environmental Health 62 (7): 9.
Neilsen. 2015. “Fresh is Best: Australian Shoppers Grow Fresh by almost $2 Billion over 10 years". 13 August 2015. Accessed 4 November 2016. http://www.nielsen.com/au/en/insights/news/2015/why-‐fresh-‐is-‐best-‐australian-‐shoppers-‐grow-‐fresh-‐by-‐almost-‐2billion-‐over-‐10-‐years.html
PwC, PricewaterhouseCoopers. 2014. "The sharing economy – sizing the revenue opportunity." Accessed 3/11/2016. http://www.pwc.co.uk/issues/megatrends/collisions/sharingeconomy/the-‐sharing-‐economy-‐sizing-‐the-‐revenue-‐opportunity.html
Priest, Naomi, Ryan Perry, Angeline Ferdinand, Yin Paradies, and Margaret Kelaher. 2014. “Experiences of Racism, Racial/Ethnic Attitudes, Motivated Fairness and Mental Health Outcomes among Primary and Secondary School Students.” Journal of Youth and Adolescence 43 (10): 1672–87.

Page 37
Santhebennur, Malavika. 2013. "Troubled Spring Gully gets boost after plea." Food & Beverage industry news. 17 April 2013. Accessed 3/11/2016. https://foodmag.com.au/troubled-‐spring-‐gully-‐gets-‐boost-‐after-‐plea/.
The Ethical Consumer Group. 2016. "Shop ethical -‐ your ethical consumer guide." Accessed 3/11/2016. http://www.ethical.org.au/3.4.2/.
The Potato Marketing Corporation. 2016. "Fresh Potatoes AU -‐ Facebook page." Accessed 3/11/16. https://www.facebook.com/FreshPotatoesAU/.
The Potato Marketing Corporation. 2016. "FreshPotatoes website." Accessed 3/11/2016. http://freshpotatoes.com.au/.
Treston, Megan. 2015. "Why fresh is best: Australian shoppers grow fresh by almost $2 billion over 10 years." Nielsen. 13 August 2015. Accessed 3/11/2016. http://www.nielsen.com/au/en/insights/news/2015/why-‐fresh-‐is-‐best-‐australian-‐shoppers-‐grow-‐fresh-‐by-‐almost-‐2billion-‐over-‐10-‐years.html.