Consumer Preferences for Sustainably Produced Bananas
24
2014 International Food and Agribusiness Management Association (IFAMA). All rights reserved 59 International Food and Agribusiness Management Review Volume 17 Issue 1, 2014 Consumer Preferences for Sustainably Produced Bananas: A Discrete Choice Experiment Eva M. Sporleder a , Maike Kayser b , Nina Friedrich c and Ludwig Theuvsen d a Researcher, Georg-August-University of Goettingen, Department of Agricultural Economics and Rural Development, Section for ‘Economics of Agribusiness’, Platz der Goettinger Sieben 5, 37073 Goettingen, Germany b Post Doc., Georg-August-University of Goettingen, Department of Agricultural Economics and Rural Development, Section for ‘Economics of Agribusiness’, Platz der Goettinger Sieben 5, 37073 Goettingen, Germany c Researcher, Georg-August-University of Goettingen, Department of Agricultural Economics and Rural Development, Section for ‘Economics of Agribusiness’, Platz der Goettinger Sieben 5, 37073 Goettingen, Germany d Professor, Georg-August-University of Goettingen, Department of Agricultural Economics and Rural Development, Section for ‘Economics of Agribusiness’, Platz der Goettinger Sieben 5, 37073 Goettingen, Germany Abstract Even though sustainability has become an omnipresent mega-trend, very little related research has been done in Europe. The objective of the present paper is to discover consumers’ perceptions concerning sustainably produced bananas. To this end, 316 German consumers participated in a discrete choice experiment and filled in a questionnaire. The results confirm that trust in the standard setter plays a particularly important role for the success of a label. Generally there is need for further simplification and information. Keywords: sustainability, discrete choice experiment, label, consumer preferences, bananas Corresponding author: Tel: + 49.551.39.79.85 Email: M. Kayser: [email protected]
-
Upload
khangminh22 -
Category
Documents
-
view
0 -
download
0
Transcript of Consumer Preferences for Sustainably Produced Bananas

2014 International Food and Agribusiness Management Association (IFAMA). All rights reserved
59
International Food and Agribusiness Management Review Volume 17 Issue 1, 2014
Consumer Preferences for Sustainably Produced Bananas:
A Discrete Choice Experiment
Eva M. Sporledera, Maike Kayserb, Nina Friedrichc and Ludwig Theuvsend
a Researcher, Georg-August-University of Goettingen, Department of Agricultural Economics and Rural Development, Section for ‘Economics of Agribusiness’, Platz der Goettinger Sieben 5, 37073 Goettingen, Germany
bPost Doc., Georg-August-University of Goettingen, Department of Agricultural Economics and Rural
Development, Section for ‘Economics of Agribusiness’, Platz der Goettinger Sieben 5, 37073 Goettingen, Germany
cResearcher, Georg-August-University of Goettingen, Department of Agricultural Economics and Rural Development, Section for ‘Economics of Agribusiness’, Platz der Goettinger Sieben 5, 37073 Goettingen, Germany
dProfessor, Georg-August-University of Goettingen, Department of Agricultural Economics and Rural
Development, Section for ‘Economics of Agribusiness’, Platz der Goettinger Sieben 5, 37073 Goettingen, Germany
Abstract Even though sustainability has become an omnipresent mega-trend, very little related research has been done in Europe. The objective of the present paper is to discover consumers’ perceptions concerning sustainably produced bananas. To this end, 316 German consumers participated in a discrete choice experiment and filled in a questionnaire. The results confirm that trust in the standard setter plays a particularly important role for the success of a label. Generally there is need for further simplification and information. Keywords: sustainability, discrete choice experiment, label, consumer preferences, bananas
Corresponding author: Tel: + 49.551.39.79.85
Email: M. Kayser: [email protected]
Sporleder, Kayser, Friedrich and Theuvsen Volume17 Issue 1, 2014
2014 International Food and Agribusiness Management Association (IFAMA). All rights reserved.
60
Introduction Sustainability can be regarded as one of the current mega-trends in all industries. However, neither consumers nor experts can define it clearly, so that a common basic understanding does not exist (Rat fuer Nachhaltige Entwicklung 2008). Nevertheless, a large proportion of consumers are intensely interested in the topic of sustainability. The consumer segment that buys products according to ethical or sustainability criteria has increased in recent years (Saunders et al. 2011). Credence attributes such as sustainable production are typically conveyed to the consumer via labeling. In the course of the last decade, hundreds of labels intended to guarantee various process qualities have flooded the market. Especially since a lot of institutions (both private and public) have developed individual labels pursuing differing aims, lack of standardization has rendered any comparability of these diverse “sustainability” labels difficult. Decisive factors for the acceptance of a label can be seen in the credibility of the label and the general trust and acceptance of the customer (Vermeir and Verbeke 2004), and detailed knowledge of consumer preferences greatly influences label design (Eberle et al. 2011). In this context, Hobbs et al. (2010) assume that strong consumer preferences for different credence goods and characteristics vary. Studies on consumer preferences for sustainable products are relatively rare. The overview by Moser et al. (2011) in the area of fruit and vegetables revealed that hardly any appropriate research has been done in Europe. The closest research pertains to the effects on consumer behavior of the attributes environment, rejection of pesticide use, certification, source and quality. In contrast, very little is known regarding attributes such as regionality and organic production. This lack of knowledge is surprising in light of the EU's desire to support sustainable development in the agri-food industry. Tropical fruits like bananas are popular but often associated with unacceptable production conditions. Lehnert (2009) noted a positive consumer preference for bananas carrying an organic and fair trade label. Although prices were integrated in the analysis, the standard setter—namely, that differing levels of consumer trust were placed in the organizations behind the labels and the varying degrees of influence exerted by other labels (e.g., carbon footprint)—was not. The influence of consumer attitude on the purchase of "green food products" was researched by Tanner and Woelfing Kast (2003). Their literature review reveals that few studies have been undertaken on consumer preferences regarding sustainable products in the food industry. The present study will research more closely consumer preferences regarding production qualities using the example of bananas. Bananas are a particularly appropriate study object because, as a typical export product of developing countries, their production automatically brings up concerns about ecological and social sustainability. Those with specific production process qualities are already found in supermarkets. Furthermore, they are traded on a large scale and eaten by the vast majority of consumers. Besides existing labels (organic and fair trade), a hypothetic sustainability label was used in the study combining the currently existing process qualities for bananas found on the market: organic production, fair trade and carbon neutrality. Likewise, the impacts of the standard setter and of the product price were included in the analysis since they are directly related to the certification of sustainable production processes.

Sporleder, Kayser, Friedrich and Theuvsen Volume17 Issue 1, 2014
2014 International Food and Agribusiness Management Association (IFAMA). All rights reserved.
61
Using an empirical consumer study with an integrated discrete choice experiment (DCE), this study will seek to answer the following research questions: What preferences do consumers have concerning sustainable process qualities in their
purchase of bananas? Are consumers interested in a label that combines all currently existing sustainable process
qualities? What preferences do consumers have concerning the organization that certifies sustainable
process qualities? What impact does price have? Do differing attitudes and socio-demographic parameters lead to differences in consumer
preferences?
Theoretical Background As mentioned in the introduction, there is no clear definition for sustainable production as there is for ecological or biological production (Institut der deutschen Wirtschaft 2011; Rat fuer Nachhaltige Entwicklung 2008). The concept of sustainability was first introduced at the beginning of the 18th century by the forest economist Hans Carl von Carlowitz. In his paper “Sylvicultura oeconomica” he demanded that only as many trees be logged as could be regrown (Schein 2003). Current notions about sustainability lean heavily on the conservation and ecology movements. In the late 1980s, the ecological crisis began increasingly to be perceived as a global crisis which could not be viewed independently of its social and economic interrelationships (Littig and Griessler 2004). Because of this, an evaluation of sustainable practices must take into account three factors—economy, ecology and social welfare. Strict attention must be paid that these factors, which were alternatively referred to as “pillars” or “dimensions”, were given equal consideration. Despite this, the historical development of the concept of sustainability has focused largely on the ecological pillar (Littig and Griessler 2004; Pacini et al. 2003). In contemporary discourse, the terms “sustainable development “and “sustainability” are frequently used synonymously (Christen and Halloran-Wietzholtz 2002). “Sustainable development is development that meets the needs of the present without compromising the ability of future generations to meet their own needs.” (WCED 1987). This definition from the Brundtland Report has received acceptance and acknowledgment by influential economists, politicians and researchers. It unites the need to address the demands of an increasing global population with the need to protect natural resources and reduce environmental pollutants (Breitschuh 2003). The Brundtland Report, originally entitled Our Common Future, was published by the World Commission for Environment and Development in 1987; it describes key global issues which present problems for sustainable development (Littig und Grießler 2004).
Sporleder, Kayser, Friedrich and Theuvsen Volume17 Issue 1, 2014
2014 International Food and Agribusiness Management Association (IFAMA). All rights reserved.
62
A further definition pertaining to agriculture is suggested by Allen et al. (1991): “A sustainable food and agriculture system is one which is environmentally sound, economically viable, socially responsible, non-exploitative, and which serves as the foundation for future generations.” This definition is centered on an interdisciplinary approach in which the diverse factors act in relation to one another. This applies to agriculture on the whole as well as to the industries downstream in the supply chain, whether on the local, regional, national or international level. The Sustainable Agriculture Initiative (SAI 2013) offers the following definition: “Sustainable agriculture is a productive, competitive and efficient way to produce safe agricultural products, while at the same time protecting and improving the natural environment and social/economic conditions of local communities.” In 1992, an agreement was reached in Rio de Janeiro in which governments bound themselves to the implementation of Agenda 21 in their national sustainability strategies. Sustainable development became part of the central approach. Appropriate indicators were to serve as measures of success (Korczak 2002). National governments as well as international and non-governmental organizations (NGOs) were asked to assist in the development of indicators to measure sustainability. In 1994, the principle of sustainability became a national goal anchored in German legislation (Luetke Entrup 1999). The conference in Rio is generally recognized as a significant catalyst for global debate on the subject of sustainability (Huelsbergen 2003). The Enquete Commission (1997) defined sustainability as a development which works to provide long-term fulfillment of the needs of a growing world population despite limitations caused by the decline of natural resources, while it simultaneously reduces pollution. This selection of definitions shows the wide variation in the interpretation of sustainability. In this, sustainability is characteristic of a dynamic system which conserves itself. That is to say, no fixed endpoint can be determined. Thus, ecological sustainability can be seen to be based on the use of natural resources in the context of human or social development (Esty et al. 2005). In principle, it can be assumed that a development is sustainable when capital assets remain stabilized and when efficiency and justice are achieved. Elements of these capital assets include natural capital, human capital and reproductive capital, ensuring that a certain standard of living can be maintained (European Commission 2001). The application of sustainable development in the area of nutrition can be achieved by many activities simultaneously (Empacher and Hayn 2005). One of these is the improvement of production conditions in a sustainable context. The improved production process is not visible to the consumer and must therefore be communicated through labeling of the product in order to justify a higher price. According to information economics (Darby and Karni 1973; Nelson 1970, 1974), product cues can be categorized into search attributes, experience or sensory attributes, and credence attributes. Color, price and label can be classified as search attributes. Search attributes can be evaluated before actual purchase. From experience or sensory attributes (e.g., flavor, aroma and tenderness) quality can be derived during preparation or consumption. Credence features cannot

Sporleder, Kayser, Friedrich and Theuvsen Volume17 Issue 1, 2014
2014 International Food and Agribusiness Management Association (IFAMA). All rights reserved.
63
be ascertained even after the consumption of the product; neither buying nor eating the product provides consumers with perceptible evidence. Therefore, the judgment of others (e.g., information from a producer or retailer) has to be trusted (Henson and Reardon 2005). Sustainable process qualities are among these credence attributes. For the consumer, it is impossible—or so labor-intensive that it is virtually impossible—to monitor whether workers on a plantation are paid fairly or whether pesticides are used there. In the worst case scenario, the resulting information asymmetry between producer and consumer can lead to a total market failure, as Akerlof (1970) described in his famous article “Market of Lemons”: Consumers are unwilling to pay more for better quality and thus, producers have no motivation to offer higher quality. As a solution, a (third-party) label can serve as an objective quality signal. In a society that is largely estranged from food production, food labels should also (re)gain consumers’ trust in agriculture and suggest food safety (Discherl 2005). Consumers can choose between labels from diverse institutions—public institutions, nongovernmental organizations (NGOs), producers, retailers, dealers—or even combinations of these (Gawron and Theuvsen 2008). In such cases, the private label of a supermarket or producer is only valid for the individual organization. Hobbs (2010) classified these private standards in three categories: “proprietary standards”, “consensus standards” and “third-party private standards”. The main objective of private standards can be seen as differentiation from competitors (Codron and Giraud-Héraud 2005; Henson and Reardon 2005; Hobbs 2010). To which extent the reputation of a company is improved and/or responsibility or liability in the value chain is distributed depends mainly on the individual standard itself (Hobbs 2010). Since, as explained above, a standard can be established by nearly any player in the food industry, a large number of standards exist that are, to a greater or lesser degree, similar (Jaffe and Henson 2004; Henson and Reardon 2005). In general, as Gilg et al. (2005) revealed, a trend has developed in recent years toward “green consumption”. Consumers associate more than organically produced products with it. They also include fair trade, regional production and other qualities that lead to sustainability. Thus, there appears to be a need for the creation of a complex label. Regarding willingness-to-pay for sustainable production characteristics, a positive influence can be assumed. Gil et al. (2000), for instance, found that consumers will pay more for fresh and perishable food, such as fruits and vegetables that are produced organically. Regarding different consumer segments, as consumer income rises, so does sensitization to environmental issues (Borgstedt et al. 2010). The buyer of environmentally friendly products is commonly someone aged 30 to 49 years with a high income of €2,000 to €2,999 per month. In contrast, younger persons with lower incomes rarely purchase environmentally friendly products (Borgstedt et al. 2010). This positive influence of a high income on consumer preference for ethically produced products was confirmed by Lehnert (2009), though solely for fair trade products and not for the organic segment. Regarding education, Lehnert (2009) likewise determined only positive effects on consumer preference for fair trade products. However, de Pelsmacker et al. (2005) detected no correlation between

Sporleder, Kayser, Friedrich and Theuvsen Volume17 Issue 1, 2014
2014 International Food and Agribusiness Management Association (IFAMA). All rights reserved.
64
preferences and educational level. In fact, simply having been awarded the label led to more favorable product perception among individuals with a low level of education. Concerning gender, Lehnert (2009) observed a clear preference among women for ethically produced goods. The attitudes of consumers towards the environment in general can also explain their preference for products with sustainability labels. Thus, consumers who are aware of environmental and social issues and involved in sustainable issues have a higher willingness to pay for corresponding products (Mueller et al. 2011; Sirieix et al. 2011). As to sustainably produced food, there is a discrepancy between the attitudes and the actual behavior of consumers (attitude-behavior gap) (cf. Kollmuss and Agyeman 2002; Gupta and Ogden 2006). Nevertheless, positive correlations have been observed. Robinson and Smith (2002) showed that psycho-social variables (attitudes and opinions, acknowledged behavior and subjective norms) predict the buying intention of sustainably produced products. The effect of attitudes, opinions and norms on the preference for sustainably produced products (organic and fair trade) was likewise confirmed by Lehnert (2009). These results underline Theuvsen’s conclusion (2008) that consumers are only aware of product declarations that are already of interest to them. Lehnert (2009) additionally determined that consumer behavior (price and quality orientation) impacts consumers’ preference for ethical products. People who are price oriented therefore have a lower preference for ethical products, and people who are quality oriented have a greater preference for them. De Pelsmacker et al. (2005) revealed that the intensity of consumption also has a positive impact on individual preferences. In this context, Tonsor and Shupp (2009) observed that people who eat apples more often than others were more willing to pay extra for sustainably produced apples. Nevertheless, the Eurobarometer study, which contains only ecological dimensions of sustainability, found that only 21% of the participants believed their consumer behavior had any influence on environmental problems (The Gallup Organization 2009). Another effect on consumer behavior is seen in the consumers’ trust in the product label. Consumers with a high degree of trust in an organic or fair trade label have a higher preference for products with sustainable process qualities (Lehnert 2009). In their qualitative study, Sirieix et al. (2011) revealed the high significance of trust in the standard setter. Trust in the quality assurance combined with trust in the organization behind the label can be regarded as the most important dimensions for explaining the success of labels in the food market (Hobbs et al. 2010). The fact that trust in a label is important for its success is also proven by Innes (2008), who identified lack of trust as a reason for purchase refusal of organic products. Furthermore, Teisl et al. (2002) confirm that the credibility of the standard setter is a focal point in combination with the design and format of the information given. Mistrust in the certification has likewise been documented by Roehr et al. (2005) (cf. Moser et al. 2011). They found that German consumers consider information from ecological organizations (NGOs), nutritionists and medical experts
Sporleder, Kayser, Friedrich and Theuvsen Volume17 Issue 1, 2014
2014 International Food and Agribusiness Management Association (IFAMA). All rights reserved.
65
more credible than information from agricultural ministries, food producers or the media. Midmore et al. (2005) add the various food scandals of the recent past as reasons for mistrust. Jensen and Sandoe (2002) share this appraisal and also found that, particularly in the European area, there is little trust in public oversight systems. Hence, a fair trade label awarded by an independent organization was evaluated positively, while a label awarded by the supermarket chain Tesco certifying sustainable agriculture was liked less due to the suspicion of greenwashing (Sirieix et al. 2011). Based on the results of former studies discussed above and on the research questions listed in the introduction, the research design of this study was created, which is described in the next section. Sample Description and Research Design The empirical data were retrieved with the support of a private panel provider via an online survey. The panel provider recruited the respondents from their panel and collected a data set with 316 completed questionnaires. Due to a lack of internal accuracy, three sets of answers had to be deleted; hence, 313 observations were analyzed. The survey was taken in Germany from February 28 to March 6, 2012. The sample matches with the German average in age, sex, place of residence and income (Statistisches Bundesamt 2009). The average age of the test persons was 44 years; 48% were male, and 52% were female. Their residence reflected the distribution of quotas within Germany (Statistisches Bundesamt 2009). The majority of the respondents have children (75.4%). The questionnaire was divided into four main parts. After several questions about the individual’s lifestyle and consumer behavior, the discrete choice experiment (DCE) included questions concerning attitudes towards product information from various organizations. The questionnaire finished with sociodemographic questions. In all, there were 27 choice sets, which were divided into three questionnaires with nine sets apiece. Thus, the model was appraised using the 2,817 answered choice sets. We chose the DCE as our research method because it is especially well suited for research on preferences for products which are not yet on the market (Auspurg and Liebe 2011). With this method, test persons are confronted with a decision-making process similar to that found in a supermarket (Ashok et al. 2002), making it optimal for use in this study. The discrete choice method is a technique for the detection of complex decision patterns and analyses of preference structures (Hahn 1997, Louviere et al. 2000). In this process, the participants make a choice on the basis of a limited number of alternative products. The decision to present only a few products (discrete goods) is justified by the fact that in real purchase situations, the subjects would usually also be offered only a limited number of alternatives (evoked set) from which they would have to make their choice (Hahn 1997). The process of a discrete choice analysis is comparable to a conjoint analysis, but, in a conjoint analysis, ordinal scaled data is required. Hence, respondents have to rank their preferences or

Sporleder, Kayser, Friedrich and Theuvsen Volume17 Issue 1, 2014
2014 International Food and Agribusiness Management Association (IFAMA). All rights reserved.
66
compare them using a rating scale. In contrast, DCE works with nominally scaled values, which allows for a simple and realistic buying decision on the basis of a simulated assortment. Methodologically, this analysis is based on a conditional logit model. Several studies have already applied DCE in the food industry, analyzing various preference patterns, such as the value the consumer places on food safety, labels, brands or sensory aspects (e.g. Teisl et al. 1997; Lockshin et al. 2006; Loureiro and Umberger 2007; Gracia and de Magistris 2008). Besides looking at sustainability characteristics, the following study will also include the factors of standard setters and price as criteria relevant for purchase. The characteristic sustainable production quality is offered to the consumer through organic certification, organic & fair trade certification and sustainability certification. Sustainability certification is a hypothetical label that combines all the sustainability attributes of previous labels for bananas (organic, fair trade and carbon footprint).
Table 1. Attributes and their levels in the DCE Status quo Level 1 Level 2 Level 3 Sustainable production quality
none organic certification
organic & fair trade certification
sustainability certification
(organic & fair trade & carbon neutral)
Standard setter none government institution
supermarket chain independent organization
Price 1.29 €/kg 1.79 €/kg 1.99 €/kg 2.19 €/kg The measured presence of the characteristic standard setter agrees with the previous activity in the banana market: government institutions, independent organizations and supermarket chains. Furthermore, as many studies have shown, price is one of the most important criteria in consumer decision-making. As suggested by Peyer and Balderjahn (2007), the prices used in the experiment took into account the current market prices.1 The status quo in the study was represented by a conventional banana without certification being sold at 1.29 €/kg. In this experiment, the subjects had to choose between the status quo product and three alternatives reflecting Levels 1 to 3 as shown in Table 1. The usefulness of the product attributes depends on the characteristics of the test persons. In forming a theoretical framework, Hahn (1997) suggests the use of preference analysis and product choice behavior, approaches used in the behavioral sciences. By taking into consideration hypothetical constructs as well as intervening variables, we hoped to duly account for intra-individual behavioral processes, thus gaining insight into individual decision-making processes. To this end, we constructed our models upon the stimulus organism response (SOR) paradigm, a principle successfully applied by Lehnert (2009).
1 In the fifth week of 2012, random samples were taken in various grocery stores in Goettingen, Germany, and the price was equally derived. The average price from 2010 (AMI 2010) provided the basis for comparison.
Sporleder, Kayser, Friedrich and Theuvsen Volume17 Issue 1, 2014
2014 International Food and Agribusiness Management Association (IFAMA). All rights reserved.
67
Consumer behavior studies have provided comprehensive knowledge about the intervening variables of usage (Solomon et al. 2010). With this in mind, the following intervening variables or constructs will be used in this study: Socio demographic variables Consumer behavior and likeability of the product (bananas) Trust in organizations Attitudes
The reference groups for the calculated logit regression models were the conventional banana (status quo), the organic label and the organization “government institution.”2 The Maximum Likelihood Method was applied to estimate the parameters (Louviere et al. 2000, Greene 2003), using a multinomial logit and a mixed multinomial logit model calculated with the statistics program STATA 10.0 IC. Positive values allude to a higher degree of preference in comparison with the reference group, and negative values to a lower degree of preference. The first model consisted solely of the product attributes of the bananas (see Table 1). In the second, individual variables were included in order to analyze interactions with the product attributes (dummy variables3). The respondents’ attitudes were summed up in indices for integration in the model (cf. Hartl 2008). The indices contain the arithmetic mean for each participant and were re-coded in cases of negative wording. Ordinal variables, such as education, were grouped and integrated in the model as dummy variables. The quality of the model was confirmed through a likelihood ratio test (LR), a pseudo-R2 and the Aikaike Information Criterion (AIC). The LR test serves to reject the null hypothesis—that all parameters of the model are 0—and thus confirms the significance of the total model. The significance level is indicated as follows: p ≤ 0.1 (§), p ≤ 0.05 (*), p ≤ 0.01 (**), p ≤ 0.001 (***) (cf. Hartl 2008). The AIC values determined the choice of the model. In this way, a compromise was reached between good data fit and too great model complexity (Fahrmeir et al. 2009). Furthermore, the quality of the model can be evaluated using the pseudo-R2. Values between 0.2 and 0.4 indicate that a model possesses good explanatory power. They correspond to values of about 0.7 to 0.9 of the R2 in linear regressions (Louviere et al. 2000). The final step was to eliminate the effects that might arise through multiple rating of a participant’s choice sets. Results of the Analysis In order to gain insight into the respondents’ consumer behavior concerning products with sustainable features, they were asked to state how often they buy such products. The majority of
2 Due to the experimental design, these could not be separated when making calculations. 3 Dummy variables are binary variables with the characteristic 1= characteristic exists; 0= characteristic does not exist.

Sporleder, Kayser, Friedrich and Theuvsen Volume17 Issue 1, 2014
2014 International Food and Agribusiness Management Association (IFAMA). All rights reserved.
68
respondents buy organic (66.45%) and fair traded products (58.33%) at least occasionally. The assumption that bananas are a neutral product eaten by almost all customers was confirmed; only 2.88% reported that they never eat bananas. On the one hand, respondents declared that they prefer to buy high quality food (66.46%). On the other hand, they are very price-oriented; 68.37% stated that price is very important when shopping for groceries. Thus, prices and quality are the most important attributes in making purchase decisions in supermarkets. For the logit model, the statements concerning price and quality orientation combined in an index summing up the means of each respondent (see Appendix). Besides other attitudes, such as attitudes towards organic or fair trade products, which are likewise included as indexes in the model (see Appendix), the respondents were asked about the general effect of labels. As seen in Table 2 only a quarter of the respondents (25.56%) agreed that a label enables them to purchase a product that suits their wishes. Respondents were asked twice whether they believe they are able to influence production method through their consumer behavior, once before and once after the DCE. The results did not deviate markedly; before the DCE, 38.34% agreed with the statement, and afterwards 41.21% agreed.
Table 2. Statements on the effect of product labels (n= 313) Statements “effect of product labels” (Agreement in %)
1 2 3 4 5 Mean (µ) Standard deviation (σ)
Product labels enable me to buy products that were produced in accordance with my wishes.
9.90 17.89 46.65 21.73 3.83 µ= 2.916933 σ= 0.970462
Through my choice of product, I can influence production methods.
8.63 18.53 34.50 27.48 10.86 µ= 3.134185 σ= 1.107034
By purchasing foods with product labels, I can influence production methods.
7.99 12.46 38.34 29.71 11.50 µ= 3.242812 σ= 1.070505
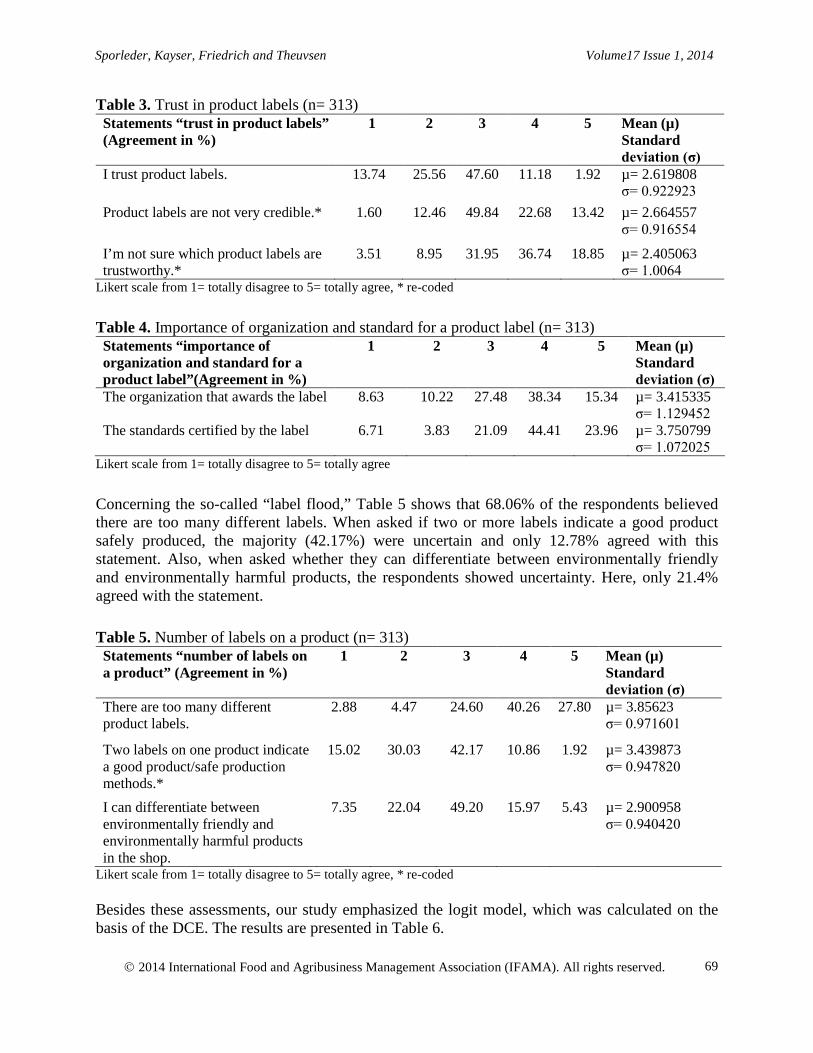
Likert scale from 1= totally disagree to 5= totally agree Besides the possible effect of a label, trust and credibility are of distinct importance. In general, trust in product labels is not very pronounced (μ= 2.62) (see Table 3); 39.3% of the respondents did not agree with this statement, whereas only 13.1% said that they trust product labels. One reason for this lack of trust might be that product labels lack credibility. In fact, 36.1% of the respondents agreed with this statement. Furthermore, there is uncertainty among consumers as to which label can be trusted; only 12.46% did not agree with this statement. Correspondingly, trust in a product label is influenced by trust in the organization that serves as the standard setter. To test this, respondents were asked which criteria are important for them in appraising a label. As can be seen in Table 4, the standard underlying the label is regarded as more important than the standard setter.
Sporleder, Kayser, Friedrich and Theuvsen Volume17 Issue 1, 2014
2014 International Food and Agribusiness Management Association (IFAMA). All rights reserved.
69
Table 3. Trust in product labels (n= 313) Statements “trust in product labels” (Agreement in %)
1 2 3 4 5 Mean (µ) Standard deviation (σ)
I trust product labels. 13.74 25.56 47.60 11.18 1.92 µ= 2.619808 σ= 0.922923
Product labels are not very credible.* 1.60 12.46 49.84 22.68 13.42 µ= 2.664557 σ= 0.916554
I’m not sure which product labels are trustworthy.*
3.51 8.95 31.95 36.74 18.85 µ= 2.405063 σ= 1.0064
Likert scale from 1= totally disagree to 5= totally agree, * re-coded
Table 4. Importance of organization and standard for a product label (n= 313) Statements “importance of organization and standard for a product label”(Agreement in %)
1 2 3 4 5 Mean (µ) Standard deviation (σ)
The organization that awards the label 8.63 10.22 27.48 38.34 15.34 µ= 3.415335 σ= 1.129452
The standards certified by the label 6.71 3.83 21.09 44.41 23.96 µ= 3.750799 σ= 1.072025
Likert scale from 1= totally disagree to 5= totally agree
Concerning the so-called “label flood,” Table 5 shows that 68.06% of the respondents believed there are too many different labels. When asked if two or more labels indicate a good product safely produced, the majority (42.17%) were uncertain and only 12.78% agreed with this statement. Also, when asked whether they can differentiate between environmentally friendly and environmentally harmful products, the respondents showed uncertainty. Here, only 21.4% agreed with the statement.
Table 5. Number of labels on a product (n= 313) Statements “number of labels on a product” (Agreement in %)
1 2 3 4 5 Mean (µ) Standard deviation (σ)
There are too many different product labels.
2.88 4.47 24.60 40.26 27.80 µ= 3.85623 σ= 0.971601
Two labels on one product indicate a good product/safe production methods.*
15.02 30.03 42.17 10.86 1.92 µ= 3.439873 σ= 0.947820
I can differentiate between environmentally friendly and environmentally harmful products in the shop.
7.35 22.04 49.20 15.97 5.43 µ= 2.900958 σ= 0.940420
Likert scale from 1= totally disagree to 5= totally agree, * re-coded Besides these assessments, our study emphasized the logit model, which was calculated on the basis of the DCE. The results are presented in Table 6.

Sporleder, Kayser, Friedrich and Theuvsen Volume17 Issue 1, 2014
2014 International Food and Agribusiness Management Association (IFAMA). All rights reserved.
70
Table 6. Estimation model for the analysis of preference Variables Basic Model Model 1 Model 2 (3)
Att
ribu
tes
& A
SC
y2 1.104265*** -3.173118*** -3.10453***(***) y3 0.4786202*** -1.500826* -1.478562* z2 -0.2174748*** -2.081752*** -2.223213***(***) z3 0.3178736*** -3.326333*** -3.390993***(***) Prices -1.697908*** -1.599455*** -1.598599***(***)
Inte
ract
ions
of a
ttri
bute
s and
indi
vidu
al sp
ecifi
c va
riab
les
y2*IndPriceorient -0.2698215** -0.2726883**($) y3*IndPriceorient -0.4940081*** -0.4894604***(**) z2*trust2 0.528817*** 0.5332045***(***) z3*trust3 0.5199108*** 0.5174342***(***) z2*trust3 0.0780528 0.0708152 z3*trust2 -0.0699107 -0.0695159 y2*banan 0.1166092$ 0.1165766* y3*banan 0.1814956** 0.1842293** z3*educate 0.4178934*** 0.4167834***(*) z2*educate 0.0192769 0.0191605 y2*educate 0.3565318** 0.368071**($) y3*educate 0.2447553$ 0.2414211$
z2*IndQuality 0.0456259 0.0736657 z3*IndQuality 0.4397429*** 0.4612168***(**) y3*IndFair 0.3887131*** 0.4048309***(*) y2*IndFair 0.7457323*** 0.759087***(***) y2*age -0.0136134*** -0.0130587**($) y3*age -0.0136836** -0.0137834**($) y2*IndSust 0.8551294*** 0.8770411***(***) y3*IndSust 0.8393029*** 0.8533328***(***) y3*IndCO2 -0.0217103 -0.0181785 y2*IndCO2 0.2494453* 0.2548839* y3*IndEco -0.1321536 -0.1023158 y2*IndEco -0.2457381$ -0.2209696§
Var
iabl
es w
ithou
t in
fluen
ce
z3*banan 0.0019334 z2*banan -0.0120621 y3*IndQuality 0.0833342 y2*IndQuality 0.1024831 y3*child 0.0642344 y2*child -0.0776101
y3*sex -0.1655631 y2*sex -0.1259302
Qua
lity
crite
rion
N (n) LR Chi2
Prob > Chi2
Pseudo-R2
Log Likelihood AIC
11268 (313) 584.73 0.0000 0.0749 -3,612.8257 7,235.651
11160 (310) 1657.23 0,0000 0.2142 -3,039.1466 6,152.293
11160 (310) 1650.25(4) 0.0000 0.2137 -3,041.0943 6,140.189
Significance level = ***: 99.9% **: 99% *: 95% §: 90% (cf. Hartl 2008), explanations of the variables see A1
4 Wald Test (465.67) for Model 3
Sporleder, Kayser, Friedrich and Theuvsen Volume17 Issue 1, 2014
2014 International Food and Agribusiness Management Association (IFAMA). All rights reserved.
71
Concerning the sustainability of production quality, it was determined in the basic model that the consumer recognizes that organic and fair trade labels make a positive contribution (1.104265***), as does the organic & fair trade & carbon neutral label (0.4786202***). Interestingly, for the hypothetical sustainability label, this recognition is somewhat less pronounced than for the organic & fair trade labels. In comparison with governmental certification or no certification at all, the test persons saw a positive contribution in certification by an independent organization (0.3178736***). Labels given by the supermarket itself lowered preference for bananas (-0.2174748***). The test persons' interest in the bananas also decreased with rising prices (-1.697908***). All variables specific to the product have a highly significant influence on the preferences of the consumers. With regard to statistical calculation, the explanatory power of the multinomial model is relatively small (pseudo R2= 0.0749); the variables considered did not adequately explain the preferences of the test persons. Therefore, the model was expanded to include the previously introduced intervening variables (Model 1). Also, their influence on the preference was researched using a mixed multinomial logit model. In this expanded model, few variables are included that do not exert an influence (are not significant). To find an optimal model, the AIC was applied. Stepwise regression was used to find the best compromise between the number of variables in the model and the quality criterion of the model. However, in order to better interpret the data, several insignificant variables are included in Model 2 (e.g., z2*trust3). To lower the number of respondents required, every respondent had to make nine choices. This can lead to over dispersion, which is why we calculated Model 3. In comparison to Model 2, only standard deviations are higher. Including the intervening variables improved the performance of the model to very good (pseudo R2: 0.2137). In general, the positive contribution of the sustainable production qualities can be tied to the following personal characteristics (cf. Model 3): Sociodemographic Variables Younger test persons have a greater preference for the production qualities labeled organic & fair trade and organic & fair trade & carbon neutral. Educational level influences not only the usefulness of the production quality but also the usefulness of the organization. The preference for sustainable production qualities is positively influenced by a higher level of education (trade school or college preparatory school). A higher level of education likewise increases the perceived usefulness of the independent organization as the organization of certification. Educational level did not have a perceptible effect in connection with the supermarket labels. Consumer Behavior and Likeability of the Product (Bananas) The consumer behavior of the test persons significantly influenced preference for sustainable process qualities and the certifying organizations. A strong price orientation results in a smaller preference for sustainable production qualities in comparison with conventional and organic production, whereby this is more strongly seen with the sustainability label. Quality orientation exerts no influence on preference with regard to the sustainability of production qualities,

Sporleder, Kayser, Friedrich and Theuvsen Volume17 Issue 1, 2014
2014 International Food and Agribusiness Management Association (IFAMA). All rights reserved.
72
although it does influence the perceived usefulness of the organization. The greater the test person's orientation to quality, the greater the perceived usefulness of an independent organization for certification. In contrast, a strong quality orientation exerts no influence on the preference for supermarkets as the organization of certification. Concerning the usefulness of production qualities, this is a significant positive parameter for test persons who especially like bananas, whereas the value of the label organic & fair trade & carbon neutral is somewhat greater. Trust in Organizations Furthermore, the model measured significant influences for attitudes and trust in the organization. The more the test persons trust the supermarkets to provide reliable information regarding the production of foodstuffs, the higher the supermarkets rate in their positive usefulness as organizations for certification when compared to governmental institutions or "no organization”, as in conventional production quality. Attitudes The test persons perceived sustainable production qualities as increasingly more useful in direct relation to the degree that they were fair trade products. The effect of this production quality was observed for organic & fair trade products even more than for organic & fair trade & carbon neutral products. As expected, the positive response to sustainable production also exerted a positive influence on the perceived usefulness of sustainable production qualities in comparison to the reference. This effect was observed somewhat more with the organic & fair trade & carbon neutral production quality. The usefulness of the organic & fair trade & carbon neutral production quality was not significantly influenced by attitude towards environmentally friendly products. Discussion In general, we found that a sustainability label significantly positively influences consumer preferences for sustainably produced bananas. This is in keeping with earlier findings regarding sustainable production and the general trend towards “green consumption” observed by Gilg et al. (2005). It is striking that the hypothetical sustainability label combining the current existing process qualities on the market for bananas (organic production, fair trade and carbon neutrality) makes a less positive contribution to consumers’ choice than an organic & fair trade label. This might be related to the fact that the majority of the recipients feel that there are too many labels on the market, whereas they are uncertain whether more labels on a product indicate a healthy and safely produced food product. In view of this consumer uncertainty, the observed importance of trust in the standard setter might be a helpful indicator. As seen in the results, consumers are also uncertain which label can be trusted. Therefore, the standard underlying a label is more important than the organization that awarded it. In the DCE it then became clear that there was a positive impact on the respondents’
Sporleder, Kayser, Friedrich and Theuvsen Volume17 Issue 1, 2014
2014 International Food and Agribusiness Management Association (IFAMA). All rights reserved.
73
purchase behavior when certification was awarded by an independent organization as compared to governmental certification or no certification at all. Labels given by the supermarket itself actually lowered the preference for the bananas with those labels. However, the more the test persons generally trusted in supermarkets to provide reliable information about the production of the food they sell, the more positively they were ranked in their usefulness as a certifying organization. The importance of trust observed in this study confirms earlier findings, (cf. Innes [2008] or Lehnert [2009]). Likewise, the high significance of the standard setter as revealed by Sirieix et al. (2011) and Teisl et al. (2002) is confirmed. Similarly, as also documented by Roehr et al. (2005), independent standard setters are assigned the highest credibility in the present study. The findings also particularly correlate with the results of Sirieix et al. (2011), who found that the supermarket chain Tesco was liked less as a certifier than an independent organization. Regarding the impact of product price, Lehnert (2009) found that people who are price oriented have a lower preference for ethical products in comparison with people who are more quality oriented. In the basic model of the DCE, price has the highest impact in this study. Thus, a higher price leads to a decreased interest in the bananas being offered. Even though the respondents stated that they prefer to buy high quality food, price orientation plays the greater role in the present study, as the quality orientation affects only the perceived usefulness of an independent organization for certification. Concerning socio demographic variables, which were shown to have a significant influence in the DCE, it can be stated that younger test persons show a greater preference for sustainable production qualities. In the existing literature, age is often related to income. Borgstedt et al. (2010), for example, discovered that younger people with lower incomes only rarely purchase environmentally friendly products. However, this effect couldn’t be tested in the present study due to missing values. Unlike de Pelsmacker et al. (2005) who did not detect a correlation between consumer preferences and educational level, this study revealed that a higher level of education does indeed influence the perceived usefulness of production qualities as well as that of an independent organization as standard setter. In addition, the impact of the likeability of a product or the intensity of consumption analyzed by de Pelsmacker et al. (2005) was confirmed in this study. Correspondingly, just as Tonsor and Shupp (2009) found that people who eat apples were often more willing than others to pay more for sustainably produced apples, this study revealed that the usefulness of production qualities was a significant positive parameter for respondents who particularly like bananas. An especially interesting result of this study is that the fair trade certification seems to be a very important sustainable production quality. Since this study used bananas as a research object, this finding might be the result of media reports on the labor conditions of banana farmers. Conclusions and Limitations Even though sustainability is an omnipresent factor in all industries, very little research has been done in the area of fruits and vegetables in Europe (Moser et al. 2011). In the case of bananas, our results show that there is interest in more production information than is divulged by
Sporleder, Kayser, Friedrich and Theuvsen Volume17 Issue 1, 2014
2014 International Food and Agribusiness Management Association (IFAMA). All rights reserved.
74
conventional and government-regulated organic certification. For enterprises involved in the supply chains, it follows that they should increase their supply of products that would meet this need. However, the variables specific to individuals continue to exert a great influence on preferences for sustainable production qualities. Therefore, a detailed analysis of the specific target group is essential. Contrary to expectations, the hypothetical label (organic & fair trade & carbon neutral) was only accepted with reservations. This may have been due to the high profile of the organic & fair trade label or to the complexity and abstraction of information behind the organic & fair trade & carbon neutral label. This was also seen in observations of test persons with a positive attitude towards environmentally friendly products. Therefore, due to the complexity of the label, there seems to be a need for further information. The term “sustainability” is already interpreted so heterogeneously that consumers can hardly avoid being confused by it. Likewise, the possibility of simplification throughout the market, with its various labels, should be considered. As our results indicated, the “overload” from the many diverse labels and standard-setting organizations leads to uncertainty on the part of consumers and may cause reluctance. Regarding the standard setter, it is clear that trust plays an important role in consumer preferences. Organizations that want to establish sustainability labels would therefore do well to pay particular attention to the role of consumer trust. Cooperation with NGOs, which are more credible for consumers (Moser et al. 2011 ct. Roehr et al. 2005), might overcome this problem to a certain degree. In this context, the criteria on which the given standard is based are of particular importance. Attempting to improve image through “greenwashing” appears ineffectual and, in fact, will (sooner or later) have the opposite effect (cf. Sirieix et al. 2011). Even though this study was based on well-founded data, it is limited by the fact that the sample is a convenience sample. Moreover, the social expectancy effect might have led to deviations from the true results, especially since this study examined social and ecological factors. Regarding the research design, it must be noted that a DCE tries to simulate a real purchase decision. In fact, at the real point of sale, a lot of additional factors play a role, such as the appearance of the product and the consumer’s buying habits. All in all, further research is needed that focuses on the suitability of scientific research for practical application in order to derive reliable information about consumer preferences and purchase behavior concerning sustainably produced food. References
Agrarmarkt-Informations-Gesellschaft (AMI). 2010. AMI Marktbilanz Obst 2011. Bonn: AMI. Akerlof, G. A. 1970. The market for 'lemons': quality uncertainty and the market mechanism. Quarterly Journal of Economics 84 (3): 488-500.
Sporleder, Kayser, Friedrich and Theuvsen Volume17 Issue 1, 2014
2014 International Food and Agribusiness Management Association (IFAMA). All rights reserved.
75
Allen, P., D. van Dusen, J. Lundy and S. Gliessman. 1999. Integrating social, environmental and economic issues in sustainable agriculture. American Journal of Alternative Agriculture 6 (1): 34-39.
Ashok, K., W. R. Dillon and S. Yuan. 2002. Extending discrete choice models to incorporate
attitudinal and other latent variables. Journal of Marketing Research 39 (1): 31-46. Auspurg, K. and U. Liebe. 2011. Choice-Experimente und die Messung von
Handlungsentscheidungen in der Soziologie. Koelner Zeitschrift fuer Soziologie und Sozialpsychologie 63: 301-314.
Borgstedt, S., T. Christ and F. Reusswig. 2010. Umweltbewusstsein in Deutschland 2010:
Ergebnisse einer repraesentativen Bevoelkerungsumfrage. Berlin: UBA & BMU. Breitschuh, G. 2003. Indikatorsystem zur einzelbetrieblichen Analyse und Bewertung der
Nachhaltigkeit landwirtschaftlicher Unternehmen. In Nachhaltige Agrar- und Ernaehrungswirtschaft: Herausforderungen und Chancen in der Wertschoepfungskette, edited by Bund fuer Lebensmittelrecht und Lebensmittelkunde, 79-90. Berlin.
Christen, O. and Z. Halloran-Wietzholtz. 2002. Indikatoren fuer eine nachhaltige Entwicklung
der Landwirtschaft. Bonn: Institut fuer Landwirtschaft und Umwelt (3). Codron, J.-M. and E. Giraud-Héraud. 2005. Minimum quality standard, premium private labels,
and European meat and fresh produce retailing. Food Policy 30 (3): 270-283. Darby, M. R. and E. Karni. 1973. Free competition and the optimal amount of fraud. The Journal
of Law and Economics 16 (1): 67-88. de Pelsmacker, P., W. Janssens, E. Sterckx and C. Mielants. 2005. Consumer preferences for the
marketing of ethically labeled coffee. International Marketing Review 22 (5): 512-530. Discherl, C. 2005. Landwirtschaftliche Unternehmensethik. In Nachhaltigkeit und Ernaehrung,
edited by K.-M. Brunner and G. U. Schoenberger, 67-92. Frankfurt/Main: Campus. Eberle, U., A. Spiller, T. Becker, A. Heissenhuber, I.-U. Leonhaeuser and A. Sundrum. 2011.
Politikstrategie Food Labelling. http://www.bmelv.de/SharedDocs/Downloads/ Ministerium/ Beiraete/Verbraucherpolitik/2011_10_PolitikstrategieFoodLabelling.pdf;jsessionid =1718BC1FED6504A5600BD355BF02263E.2_ cid252?__blob=publicationFile [accessed February 23, 2012].
Empacher, C. and D. Hayn. 2005. Ernaehrungsstile und Nachhaltigkeit im Alltag. In
Nachhaltigkeit und Ernaehrung, edited by K.-M. Brunner and G. U. Schoeneberger, 222-239. Frankfurt/Main: Campus.
Enquete Commission. 1994. Schutz der gruenen Erde: Klimaschutz durch umweltgerechte
Landwirtschaft und Erhalt der Waelder. Bonn: Economia-Verlag.

Sporleder, Kayser, Friedrich and Theuvsen Volume17 Issue 1, 2014
2014 International Food and Agribusiness Management Association (IFAMA). All rights reserved.
76
Esty, D. C., M. A. Levy, T. Srebotnjak and A. de Sherbinin. 2005. Environmental sustainability index. Benchmarking national environmental stewardship. Yale Center for Environmental Law and Policy. New Haven: Yale University.
European Commission. 2001. Ein Konzept fuer Indikatoren der wirtschaftlichen und sozialen
Dimensionen einer nachhaltigen Landwirtschaft und Entwicklung des laendlichen Raums. Generaldirektion Landwirtschaft, Bruessel.
Fahrmeier, L., T. Kneib, and S. Lang. 2009. Regression: Modelle, Methoden und Anwendungen.
Berlin: Springer. Gawron, J.-C. and L. Theuvsen. 2008. Certification schemes in the European agrifood sector:
overview and opportunities for Central and Eastern Europe. Conference Proceedings IAMO Forum June 25th to 2th, 2008 Halle (Saale).
Gil, J., A. Gracia and M. Sánchez. 2000. Market segmentation and willingness to pay for organic
products in Spain. International Food and Agribusiness Management Review 3(2): 207-226. Gilg, A., S. Barr and N. Ford. 2005. Green consumption or sustainable lifestyles? Identifying the
sustainable consumer. Futures 37 (6): 481-504. Gracia, A. and T. de Magistris. 2008. The demand for organic foods in the south of Italy: A
discrete choice model. Food Policy 33 (5): 386-396. Greene, W. H. 2003. Econometric Analysis. Upper Saddle River, NJ: Prentice Hall. Gupta, S. and D. T. Ogden. 2006. The attitude-behaviour gap in environmental consumerism.
Paper presented at the 29th annual meeting of the Association of Pennsylvania University Business and Economics Faculty (APUBEF), State College Pennsylvania.
Hahn, C. 1997. Conjoint- und Discrete-Choice-Analyse als Verfahren zur Abbildung von
Praeferenzstrukturen und Produktauswahlentscheidungen. Ein theoretischer und computergestuetzter empirischer Vergleich. Betriebswirtschaftliche Schriftenreihe 80.
Hartl, J. 2008. Die Nachfrage nach genetisch veraenderten Lebensmitteln: Anwendung neuerer
Entwicklungen der Discrete-Choice-Analyse zur Bewertung genetisch veraenderter Lebensmittel mit Output-Traits. Frankfurt am Main: DLG-Verlag.
Henson, S. and T. Reardon. 2005. Private agri-food standards: implications for food policy and
the agri-food system. Food Policy 30 (3): 241-253. Hobbs, J. E. 2010. Public and private standards for food safety and quality: international trade
implications. The Estey Centre Journal of International Law and Trade Policy 11 (1): 136-152.
Sporleder, Kayser, Friedrich and Theuvsen Volume17 Issue 1, 2014
2014 International Food and Agribusiness Management Association (IFAMA). All rights reserved.
77
Huelsbergen, K.-J. 2003. Entwicklung und Anwendung eines Bilanzierungsmodells zur Bewertung der Nachhaltigkeit landwirtschaftlicher Systeme. Aachen: Shaker Verlag.
Innes, B. 2008. Assuring production-derived quality in Canadian food markets.
http://library2.usak.ca/theses/available/etd-01022009-193201/ [accessed March 3, 2012]. Institut der deutschen Wirtschaft Koeln. 2011. Das Gewissen isst mit. iw-dienst - Informationen
aus dem Institut der deutschen Wirtschaft Koeln 37 (40): 4-5. Jaffe, S. and S. Henson. 2004. Standards and agro-food exports from developing countries:
rebalancing the debate. Washington, DC: World Bank. Jensen, K. K. and P. Sandoe. 2002. Food safety and ethics: The interplay between science and
values. Journal of Agricultural and Environmental Ethics 15 (3): 245-253. Kollmuss, A. and J. Agyeman. 2002. Mind the gap: Why do people act environmentally and
what are the barriers to pro-environmental behaviour? Environmental Education Research 8 (3): 239-260.
Korczak, D. 2002. Nachhaltigkeitsindikatoren-Systeme im Vergleich. http://www.gp-
f.com/de/pdf/ak_nachh.pdf [accessed August 8, 2013]. Lehnert, M. 2009. Praeferenzanalyse ethischer Produkte: Eine verhaltenswissenschaftliche
Analyse am Beispiel von Bio und Fairtrade. Hamburg: Dr. Kovac. Littig, B. and F. Griessler. 2004. Soziale Nachhaltigkeit. Informationen zur Umweltpolitik.
Vienna: Bundeskammer fuer Arbeiter und Angestellte. Lockshin, L., W. Jarvis, F. d’Hauteville and J.-P. Perrouty. 2006. Using simulations from
discrete choice experiments to measure consumer sensitivity to brand, region, price, and awards in wine choice. Food Quality and Preference 17 (3-4): 166-178.
Loureiro, M. L. and W. L. Umberger. 2007. A choice experiment model for beef: What US
consumer responses tell us about relative preferences for food safety, country-of-origin labeling and traceability. Food Policy 32 (4): 496-514.
Louviere, J. J., D. A. Hensher and J. D. Swait. 2000. Stated choice methods: analysis and
application. Cambridge: Cambridge University Press. Luetke Entrup, N. 1999. Agenda 21 - Nachhaltige Entwicklung und intensive Landwirtschaft
sind kein Widerspruch. 3. Suedharz-Symposium June, 11./12. 1999, Sundhausen. http://www.karstwanderweg.de/sympo/3/entrup/index.htm [accessed August 8, 2013].
Midmore, P., S. Naspetti, A.-M. Sherwood, D. Vairo, M. Wier and R. Zanoli. 2005. Consumers
attitudes to quality and safety of organic and low-input foods: A review. QLIF-Projekt No.FP6-FOOD-CT-2003-506358.

Sporleder, Kayser, Friedrich and Theuvsen Volume17 Issue 1, 2014
2014 International Food and Agribusiness Management Association (IFAMA). All rights reserved.
78
Moser, R., R. Raffaeli and D. Thilmany-McFadden. 2011. Consumer preferences for fruit and vegetables with credence-based attributes: a review. International Food and Agribusiness Management Review 14 (2): 121-142.
Mueller, S., L. Sirieix and H. Remaud. 2011. Are personal values related to sustainable attribute
choice? 6th AWBR International Conference - Bordeaux Management School. Nelson, P. 1970. Information and consumer behavior. Journal of Political Economy 78 (2): 311-
329. Nelson, P. 1974. Advertising as information. Journal of Political Economy 82 (4): 729-754. Pacini, C., A. Wossink, G. Giesen, C. Vazzana and R. Hurine. 2003. Evaluation of sustainability
of organic, integrated and conventional farming systems: a farm and field-scale analysis. Agriculture, Ecosystems and Environment 95 (1): 273-288.
Peyer, M. and I. Balderjahn. 2007. Zahlungsbereitschaft fuer sozialvertraegliche Produkte.
Jahrbuch der Absatz- und Verbrauchsforschung 53 (3): 267-288. Rat fuer nachhaltige Entwicklung. 2008. Momentaufnahme Nachhaltigkeit und Gesellschaft.
IFOK Institut fuer Organisationskommunikation. Boenen: Kettler. Robinson, R. and C. Smith. 2002. Psychological and demographic variables associated with
consumer intention to purchase sustainable produced foods as defined by the Midwest food alliance. Journal of Nutrition Education and Behaviour 6 (34): 316-325.
Roehr, A., K. Lueddecke, S. Drusch, M. Mueller and R. Alvensleben. 2005. Food quality and
safety: Consumer perception and public health concern. Food Control 16 (8): 649-655. SAI (Sustainable Agriculture Initiative). 2013. Definition. http://www.saiplatform.
org/sustainable-agriculture/definition [accessed August 8, 2013]. Saunders, C., M. Guenther, P. Tait, W. Kaye-Blake, J. Saunders and S. Miller. 2011. Consumer
attitudes towards sustainability attributes on food labels in the UK and Japan. 85th Annual Conference of the Agricultural Economics Society: 1-16.
Schein, S. 2003. Nachhaltigkeit - von der Genese des Begriffs zur Nachhaltigkeit als
systematischer Ansatz. Norderstedt: Grin. Sirieix, L., M. Delanchy, H. Remaud and L. Zepeda. 2011. How do consumers react in front of
individual and combined sustainable food labels? A UK focus group study. Working paper UMR MOISA.
Solomon, M., G. Bamossy, S. Askergaard and M. K. Hogg. 2010. Consumer behaviour: a
European perspective. Harlow: Financial Times Prentice Hall.

Sporleder, Kayser, Friedrich and Theuvsen Volume17 Issue 1, 2014
2014 International Food and Agribusiness Management Association (IFAMA). All rights reserved.
79
Statistisches Bundesamt. 2009. Statistisches Jahrbuch 2009. Fuer die Bundesrepublik Deutschland. Wiesbaden.
Tanner, C. and S. Woelfing Kast. 2003. Promoting sustainable consumption: determinants of
green purchases by Swiss consumers. Psychology & Marketing 20 (10): 883-902. Teisl, M. F., N. E. Bockstael and A. S. Levy. 1997. Preferences for food labels: a discrete choice
approach. In Strategy and Policy in the Food System: Emerging Issues, edited by J. A. Caswell and R. W. Cotterill, 171-194. Food Marketing Policy Center, University of Connecticut. http://ageconsearch.umn.edu/handle/25955 [accessed January 16, 2013].
The Gallup Organization. 2009. Europeans' attitudes towards the issue of sustainable
consumption and production: analytical report. European Commission. Theuvsen, L. 2008. Lebensmittelkennzeichnungen: In ihrer Wirkung ueberschaetzt.
Agrarwirtschaft 57 (5): 249-250. Tonsor, G. T. and R. Shupp. 2009. Valuation of 'sustainably produced' labels on beef, tomato,
and apple products. Agricultural and Resource Economics Review 38 (3): 371-383. Vermeir, I. and W. Verbeke. 2004. Sustainable food consumption: exploring the consumer
attitude-behaviour gap. Working Paper University of Gent. WCED (World Commission on Environment and Development). 1987. Our common our future.
New York: Oxford University Press. Zou, N.-N. H. and J. E Hobbs. 2010. The role of labelling in consumers’ functional food choice.
The Economics of Food, Food Choice and Health. Freising: Agricultural & Applied Economics Association.

Sporleder, Kayser, Friedrich and Theuvsen Volume17 Issue 1, 2014
2014 International Food and Agribusiness Management Association (IFAMA). All rights reserved.
80
Appendix A1. Explanation of the variables of the logit model
Label Variable Description Organic label y1 = 1 if banana in choice set was labeled with an organic
label, 0 if not Organic & fair trade label
y2 = 1 if banana in choice set was labeled with organic & fair trade label, 0 if not
Sustainable label y3 = 1 if banana in choice set was labeled with sustainable label, 0 if not
Governmental organization
z1 = 1 if standard setter is a governmental organization, 0 if not
Supermarket z2 = 1 if standard setter is a supermarket, 0 if not Independent organiza-tion
z3 = 1 if standard setter is an independent organization, 0 if not
Price prices Price for 1 kg bananas: 1.29 €, 1.79 €, 2.19 € ASCStatusquo Alt4 = alternative specific constant for status quo option Sex sex = 1 if male, 0 if female Age age Age of respondent Index price orientation IndPriceorient Index concludes variables concerning price orientation Index quality orientation
IndQuality Index concludes variables concerning quality orientation
Trust in organization trust2,trust3 Respectively a statement concerning trust in an organization (supermarket (trust2), independent organization (trust3))
Income income Not included in the model due to missing values Education educate = dummy variable, 1= if trade school or college
preparatory school diploma exists, otherwise 0 Children child = dummy variable, 1= if children are present, otherwise 0 Index attitudes green products
IndEco Index concludes variables concerning attitudes towards green products
Index attitudes fair trade products
IndFair Index concludes variables concerning attitudes towards fair trade products
Index attitudes sustainable products
IndSust Index concludes variables concerning attitudes towards sustainably-produced products
Index attitudes carbon neutral products
IndCO2 Index concludes variables concerning attitudes towards carbon-neutral products
Likeability of bananas banan Respondents’ likeability of bananas (Scale from 1= I dislike to 5 =I like)
(cf. Zou and Hobbs 2010)

Sporleder, Kayser, Friedrich and Theuvsen Volume17 Issue 1, 2014
2014 International Food and Agribusiness Management Association (IFAMA). All rights reserved.
81
A2. Composition of the index price orientation (n= 313) Statements ” price orientation” (Agreement in %)
1 2 3 4 5 Mean (µ) Standard deviation (σ)
I notice price changes in products I buy regularly.
0.32 5.43 21.41 42.49 30.35 µ= 3.971246 σ= 0.874755
When I buy food, price is important to me.
0 4.47 27.16 45.37 23.00 µ= 3.86901 σ= 0.815769
Likert scale from 1= totally disagree to 5= totally agree
A3. Composition of the index quality orientation (n= 313) Statements “quality orientation” (Agreement in %)
1 2 3 4 5 Mean (µ) Standard deviation (σ)
It is important to me to buy high-quality food.
1.60 4.15 27.80 52.72 13.74 µ= 3.728435 σ= 0.808443
Quality is of the highest importance to me.
0.96 3.83 31.63 49.52 14.06 µ= 3.71885 σ= 0.787032
Likert scale from 1= totally disagree to 5= totally agree
A4. Composition of the index attitudes towards green products (n= 313) Statements “green products” (Agreement in %)
1 2 3 4 5 Mean (µ) Standard deviation (σ)
When I can choose between green products and conventional products, I prefer to buy green.
5.43 13.10 36.74 31.31 13.42 µ= 3.341853 σ= 1.041482
When I shop for food, protecting the environment is very important to me.
4.47 12.78 42.49 32.59 7.67 µ= 3.261981 σ= 0.934588
It is unimportant to me whether or not a product has been produced in an environmentally safe way.*
15.34 25.88 38.34 14.38 6.07 µ= 3.291139 σ= 1.080974
Likert scale from 1= totally disagree to 5= totally agree, (cf. Tanner and Woelfing Kast 2003), * re-coded A5. Composition of the index attitudes towards fair traded products (n= 313)
Statements “fair trade products” (Agreement in %)
1 2 3 4 5 Mean (µ) Standard deviation(σ)
I feel connected with third-world countries.
11.18 25.24 40.26 16.29 7.03 µ= 2.827476 σ= 1.057155
I don’t buy bananas or coffee if I am not sure that the farmers and workers who produced it have been fairly paid.
15.65 31.63 39.30 7.99 5.43 µ= 2.559105 σ= 1.024001
When I buy bananas, I look for a fair trade label.
11.82 25.56 37.70 20.45 4.47 µ= 2.801917 σ= 1.037315
Likert scale from 1= totally disagree to 5= totally agree, (cf. Tanner and Woelfing Kast 2003)

Sporleder, Kayser, Friedrich and Theuvsen Volume17 Issue 1, 2014
2014 International Food and Agribusiness Management Association (IFAMA). All rights reserved.
82
A6. Composition of the index attitudes towards sustainable products (n= 313) Statements “sustainable products” (Agreement in %)
1 2 3 4 5 Mean (µ) Standard deviation (σ)
If I have a choice between a sustainably produced item and one that was conventionally produced, I opt for sustainability.
5.11 7.35 40.89 35.14 11.50
µ= 3.405751 σ= 0.963217
I am prepared to pay a higher price for products that were produced under environmentally safe and socially and economically compatible conditions.
7.35 15.34 38.02 29.07 10.22 µ= 3.194888 σ= 1.054769
Likert scale from 1= totally disagree to 5= totally agree
A7. Composition of the index attitudes towards carbon friendly products (n= 313) Statements “carbon friendly products” (Agreement in %)
1 2 3 4 5 Mean (µ) Standard deviation (σ)
It is important to reduce or neutralize the carbon footprint, especially for products that must be transported for long distances.
4.15 6.07 24.28 45.05 20.45 µ= 3.715655 σ= 0.993074
I prefer to buy products that are produced with carbon saving methods.
7.03 22.68 43.13 21.41 5.75 µ= 2.961661 σ= 0.976552
Reducing ecologically harmful emissions is very important.
3.51 5.75 17.57 46.01 27.16 µ= 3.875440 σ= 0.990565
Likert scale from 1= totally disagree to 5= totally agree