Security forces conduct massive military operation in Musa Qala
Upload
khangminh22Category
view
0download
0
DEVELOPMENT OF HAPLOID INDUCERS IN BANANAS (Musa Spp.) BY
MODIFICATION OF CENTROMERE SPECIFIC HISTONE 3 PROTEIN
Kariuki Samwel Muiruri
I80/94211/2014
(Bsc, Msc Nairobi)
A thesis submitted in fulfillment of the requirements for the award of the degree of
Doctor of Philosophy in Genetics in the School of Biological Sciences of the University of Nairobi.
2015

ii
DECLARATION
I, Kariuki Samwel Muiruri declare that this thesis is my original research and it has not been
presented for a degree or any other award in any University. Furthermore, this work to the
best of my knowledge does not breach any copyright law. Whenever contributions of others
are involved, every effort is made to indicate this clearly, with due reference to the literature,
and acknowledgement of collaborative research and discussions.
Signature ……………………………. Date………………….……………………….
Kariuki Samwel Muiruri
We hereby declare that this thesis is the candidate’s own work and is being submitted with our
approval as supervisors.
Signature ……………………………. Date………………….……………………….
Dr. Nelson O. Amugune School of Biological Sciences, University of Nairobi
Signature ……………………………. Date………………….……………………….
Prof. Edward K. Nguu Department of Biochemistry, University of Nairobi
Signature ……………………………. Date………………….……………………….
Dr. Leena Tripathi International Institute of Tropical Agriculture (IITA), Nairobi

iii
DEDICATION
I dedicate this thesis to my family, specially my wife Fridah and son Ryan who are two very
special people in my life and have kept me going.

iv
ACKNOWLEDGEMENTS
I thank God for the far He has brought me, the strength that He has given me to endure the
difficult and challenging academic times. I sincerely thank the International Institute of
Tropical Agriculture (IITA) for awarding me a graduate fellowship through which I undertook
my studies.
The last three years plus have not been easy academically, for that reason I feel highly
indebted to my supervisors. Dr. Leena Tripathi who has been with me through the whole
journey, I thank you for your guidance, understanding and patience throughout my study
period. I believe I have matured and become a better scientist, no better words can explain my
gratitude Leena. I would also like to thank my two University supervisors Dr. Nelson
Amugune, and Prof. Edward Nguu. Thank you for the fruitful discussions that we have had
and the contributions that you have made in shaping my academics.
I deeply appreciate group members of Leena’s Lab. My fellow graduate students Joshua, Ken
and Esther who we shared a common name (Student) and platform for over three years, I can’t
forget the value you added to my life both in science and in life. To Ken, I learnt a lot of
cloning techniques from you over time. To Esther, you took care of my transgenic plants when
I was away, I can’t thank you more. To Joshua, we shared a lot brother. To my brother, Dr.
Evans Nyaboga who had been a source of motivation and knowledge, I appreciate you so
much. I asked so many questions which you were always eager to answer I have learnt a lot
from you. To the rest of the Lab members in no particular order: Dr. Jaindra Tripathi, Sarah,
June, Ruth (Who assisted me in subculture of non-transgenic plants when I was away),
Syombua, Cris, Rajesh, Belayneh (Read Chapters one and two of this thesis and gave positive

v
critism), Jackie and Kogo I appreciate you, you made me a better person. I would also like to
thank other groups that we shared the Lab, Pauline and Rachel from BeCA, the International
Potato Center (CIP) group and CIMMYT.
It would be futile if I do not thank other people who greatly played a role to the project. First I
thank Dr. Jim Lorenzen who was at some point my advisor; you played a very big role in the
success of the project. Thank you for the constant guidance on many aspects of the project. I
would also want to posthumously appreciate Prof. Simon Chan who was part of the project
but did not live long enough to witness its completion.
I also thank Prof. Anne Britt and her Lab for the hospitality I was accorded while in
University of California at Davis. I learnt many techniques including cloning. To Anne,
thanks for the answers to the many questions I asked concerning Genetics and the generosity
that you have with knowledge.
I would also like to acknowledge the National Science Foundation (NSF) for funding this
research under the grant award number 1109882.
To all the people who have contributed to the success of the project and were not mentioned, I
sincerely thank you.

vi
TABLE OF CONTENTS
DEVELOPMENT OF HAPLOID INDUCERS IN BANANAS (Musa Spp.) BY MODIFICATION OF CENTROMERE SPECIFIC HISTONE 3 PROTEIN
DECLARATION ................................................................................................................... ii
DEDICATION ...................................................................................................................... iii
ACKNOWLEDGEMENTS .................................................................................................. iv
TABLE OF CONTENTS ...................................................................................................... vi
LIST OF TABLES ..................................................................................................................x
LIST OF FIGURES .............................................................................................................. xi
LIST OF APPENDICES ..................................................................................................... xiii
LIST OF ABBREVIATIONS, SYMBOLS AND ACRONYMS ..........................................xiv
ABSTRACT ......................................................................................................................... xx
INTRODUCTION ..................................................................................................................1
1.1 General introduction ......................................................................................................1
1.2 PROBLEM STATEMENT................................................................................................4
1.3 JUSTIFICATION..............................................................................................................5
1.4 HYPOTHESES .................................................................................................................6
1.5 OBJECTIVES ...................................................................................................................6
1.5.1 Overall objective ....................................................................................................6
1.5.2 Specific objectives ..................................................................................................6
1.6 LAYOUT OF THE THESIS .............................................................................................8
LITERATURE REVIEW ........................................................................................................9
2.1 Origin and domestication of bananas .............................................................................9
2.2 Banana taxonomy ........................................................................................................ 10
2.2.1 The dispute in Musa sections ................................................................................ 11
2.3 Importance of bananas ................................................................................................. 12
2.4 Constraints to banana production ................................................................................. 13
CHAPTER ONE ...................................................................................................................1
CHAPTER TWO ..................................................................................................................9

vii
2.5 Conventional banana breeding and its challenges ........................................................ 14
2.6 Production of haploids and their role in breeding ........................................................ 15
2.6.1 Conventional methods of haploid production ........................................................ 16
2.6.1.1 Haploid production through anther and microspore cultures ........................... 16
2.6.1.2 Haploid production through wide crosses ....................................................... 17
2.6.2 Haploid production by centromere-mediated genome elimination ......................... 17
2.6.2.1 Technical aspects in haploid production through centromere modification ..... 18
2.6.2.2 The eukaryotic centromere and its role in cell division ................................... 19
2.6.3 CENH3 deposition and organization into the centromere ...................................... 20
2.6.4 CenH3 expression pattern in plants of different ploidies ....................................... 23
PHYLOGENY OF BANANAS AND HAPLOTYPE INFERENCE OF UNPHASED DATA
BASED ON THE MARKERS NADH AND CENH3 ............................................................ 24
3.1 INTRODUCTION .......................................................................................................... 24
3.2 MATERIAL AND METHODS ....................................................................................... 26
3.2.1 Plant material ........................................................................................................... 26
3.2.2 Primer design ........................................................................................................... 29
3.2.3 PCR, sequencing and sequence assembly ................................................................. 29
3.2.4 Sequence alignment and phylogenetic reconstruction ............................................... 31
3.2.5 Haplotype inference.................................................................................................. 32
3.3 RESULTS ....................................................................................................................... 35
3.3.1 PCR Analysis ........................................................................................................... 35
3.3.2 Sectional and genomic group congruence ................................................................. 36
3.3.2.1 Segregation based on maker NADH ................................................................... 36
3.3.2.2 Segregation based on the marker CenH3 ............................................................ 40
3.3.4 Haplotypes in diploids and triploids .......................................................................... 43
3.4 DISCUSSION ................................................................................................................. 45
DEVELOPMENT OF HAPLOID INDUCERS IN BANANAS BY MODIFICATION OF
CENTROMERE SPECIFIC HISTONE 3 (CENH3) PROTEIN ............................................ 52
CHAPTER THREE ............................................................................................................ 24
CHAPTER FOUR ............................................................................................................... 52

viii
4.1 INTRODUCTION .......................................................................................................... 52
4.2 MATERIALS AND METHODS ..................................................................................... 53
4.2.1 Plant materials, multiplication and production of multiple bud clumps ..................... 53
4.2.2 RNAi plasmid constructs .......................................................................................... 55
4.2.3.3 Preparation and transformation of competent bacterial cells ............................... 56
4.2.3.4 Validation of plasmid constructs ........................................................................ 58
4.2.3.5 Preparation of Agrobacterium tumefaciens culture ............................................. 59
4.2.4 Explant preparation and genetic transformation ........................................................ 59
4.2.5 Molecular analysis of transgenic plants ..................................................................... 61
4.2.5.1 DNA extraction and PCR analysis of putative transgenic plants ......................... 61
4.2.5.2 RNA extraction, RT-PCR and Northern blot analysis ......................................... 61
4.2.6 Fluorescent microscopy ............................................................................................ 64
4.2.7 Transfer of plants into the field and glasshouse ......................................................... 64
4.2.8 Data collection and statistical analysis ..................................................................... 65
4.3 RESULTS ....................................................................................................................... 66
4.3.1 Plant multiplication and production of multiple bud clumps...................................... 66
4.3.2 Transformation of E.coli and A.tumefeciens cells and validation of plasmid constructs
......................................................................................................................................... 66
4.3.3 Genetic transformation and plant regeneration .......................................................... 67
4.3.4 PCR analysis of putative transgenic plants ................................................................ 70
4.3.5 RT-PCR analysis of transgenic lines ......................................................................... 71
4.3.6 Northern blot analysis ............................................................................................... 73
4.3.7 Fluorescent microscopy ............................................................................................ 73
4.3.8 Agronomic performance of plants in field and glasshouse......................................... 75
4.4 DISCUSSION ................................................................................................................. 77
EXPRESSION OF CenH3 ALLELE AND SPLICE VARIANTS IN CULTIVATED
TRIPLOID AND WILD DIPLOID BANANAS .................................................................... 79
5.1 INTRODUCTION .......................................................................................................... 79
5.2 MATERIALS AND METHODS ..................................................................................... 82
CHAPTER FIVE ................................................................................................................ 79
ix
5.2.1. Plant materials ..................................................................................................... 82
5.2.2. In silico analysis .................................................................................................. 82
5.2.3. RNA extraction and cDNA synthesis ................................................................... 82
5.2.4 Cloning and sequencing of CenH3 genes .............................................................. 83
5.2.5 Sequence assembly, alignments and phylogenetic analysis ................................... 83
5.2.4 Analysis of evolutionary relationships in CenH3 sequences .................................. 84
5.2.4 Protein structure modeling .................................................................................... 85
5.3 RESULTS ....................................................................................................................... 85
5.3.1 cDNA sequences of CenH3 in wild diploid and cultivated triploid bananas .......... 85
5.3.2 Splice and allele variants in banana CenH3 transcripts .......................................... 90
5.3.3 Evolutionary divergence of CENH3 proteins ........................................................ 93
5.3.4 Expression bias in diploids and triploids ................................................................... 97
5.3.5 Secondary structure prediction .............................................................................. 98
5.3.6 Banana CenH3 monophylectic clade ................................................................... 100
5.4 DISCUSSION ............................................................................................................... 103
GENERAL DISCUSSION .................................................................................................. 109
CONCLUSIONS ................................................................................................................ 110
RECOMMENDATIONS .................................................................................................... 111
7.0 REFERENCES ............................................................................................................. 114
8.0 LIST OF APPENDICES ............................................................................................... 129
CHAPTER SIX ................................................................................................................. 109
x
LIST OF TABLES
Table 3.1: List of banana samples used in determination of phylogeny. ................................. 28
Table 3.2: Positions of Single Nucleotide Polymorphisms (SNPs) that were used in
inferring haplotypes of triploid and diploid banana cultivars. ..................................... 34
Table 3.3: Single neocleotide polymorphisms (SNPs) from the partial NADH gene that
differentiated banana A and B genomes. .................................................................... 38
Table 3.4: Haplotypes inferred from seven SNPs of the partial CenH3 alignment in bananas.44
Table 4.1: Composition of different media used in the transformation and tissues culture of
bananas ..................................................................................................................... 54
Table 4.2: Transformation efficiencies of banana cv. ‘Zebrina GF’ with different RNAi
constructs using multiple bud clamps (MBCs) and intercalary meristems (IM) as the
explants. .................................................................................................................... 69
Table 5.1: Cultivars used and clones obtained in the analysis of CenH3 expression in
bananas. .................................................................................................................... 86
Table 5.2: Number, location and size of SNPs and indels in the alignment of CenH3
transcripts having variable lengths. ............................................................................ 87
Table 5.3: The location of polymorphisms within exons of the different exons/introns
structures of banana CenH3 transcripts ...................................................................... 89
Table 5.4: The average Ka/Ks values within and between pairwise alignments of banana
CenH3 transcripts obtained from different diploid and triploid cultivars .................... 94
Table 5.5: The average Ka/Ks values within and between alignments of CenH3 transcripts
having different exon/intron structures....................................................................... 97

xi
LIST OF FIGURES
Figure 2.1: Models (A-F) explaining how DNA wraps around kinetochores in CENH3
containing nucleosomes. ............................................................................................ 22
Figure 3.1: PCR analysis of banana cultivars with different genomic composition using
NADH and CenH3 specific primers. .......................................................................... 35
Figure 3.2: Phylogenetic tree of different banana cultivars based on the partial NADH gene. . 39
Figure 3.3: Phylogenetic positioning of different banana cultivars based on the marker
CenH3. ...................................................................................................................... 42
Figure 4.1: Schematic presentation of the three different RNAi constructs used in the
transformations of bananas. ....................................................................................... 56
Figure 4.2: Explants of bananas that were used in transformation with Agrobacterium
tumefaciens harbouring RNAi gene constructs. .......................................................... 60
Figure 4.3: Sample cultures of E. coli and A. tumefaciens transformed with RNAi constructs
and their validation using restriction digest and PCR. ................................................ 67
Figure 4.4: PCR analysis of the transgenic lines obtained from transformation of diploid
banana ‘Zebrina GF’ with the three RNAi constructs. ................................................ 70
Figure 4.5: RT-PCR products showing expression of banana endogenous CenH3 and the
control gene Glycerol Dehyde 3 Phosphate Dehydrogenase (GAPDH) in selected
transgenic lines in comparison to non-transgenic control in two weeks old plants. ..... 71
Figure 4.6: RT-PCR products for CenH3 and GAPDH showing expression in 3 weeks old
plants. ........................................................................................................................ 72
Figure 4.7: Northern blot analysis of randomly selected transgenic lines and non-transgenic
plant showing accumulation of siRNAs. .................................................................... 73
xii
Figure 4.8: Fluorescent microscopy of transgenic plants having a green fluorescent protein
(GFP) and control non-transgenic lines. ..................................................................... 74
Figure 4.9: Stages in the transfer of transgenic and non-transgenic plants into the glass
house and field. ......................................................................................................... 75
Figure 4.10: Agronomic data of transgenic plants in the glass house for the three RNAi
constructs and the control. ......................................................................................... 76
Figure 5.1: Alignment of banana CENH3 protein sequences translated from transcripts of
diploid and triploid cultivars showing regions of the C-terminal. ............................... 99
Figure 5.2: Secondary structure predictions of selected translated banana CENH3 proteins. 100
Figure 5.3: Phylogenetic tree of banana CENH3 proteins from the cultivars Sukali ndizi,
Kayinja, Gros michel and Zebrina in relations to those of other monocotyldons and
dicotyledons. ........................................................................................................... 102

xiii
LIST OF APPENDICES
Appendix 1: Transgenic lines for different constructs that were transferred to the glass
house ....................................................................................................................... 129
Appendix 2: Ka/Ks values obtained in CenH3 full CDS alignment of different cultivars and
exon/intron structure groups. ................................................................................... 130
Appendix 3: Ka/Ks ratios that were oberved to be greater than one in different banana
CenH3 transcripts pairwise alignments .................................................................... 151
xiv
LIST OF ABBREVIATIONS, SYMBOLS AND ACRONYMS
ABI Applied Biosystems
AFM Atomic Force Microscopy
ANOVA Analysis of Variance
BAP 6-benzylamino purine
BBTV Banana Bunchy Top Virus
bp basepair
BP Bootstrap
BREAD Basic Research Enabling Agricultural Development
BSV Banana Streak Virus
ca1 Musa acuminata chloroplast haplotype
CaCl2 Calcium Chloride
caMV35S Cauliflower mosaic 35S promoter
CARBAP The African centre for research on bananas and plantains
(Centre de Recherches Régionalessur Bananier et Plantain)
cDNA complementary DNA
CDS Coding sequence
CenH3 Centromere specific histone H3 variant gene
CENP-A Centromere Protein A
CID Centromere Identifier

xv
CIRAD French Agricultural Research Centre for nternational
Development
cpDNA chloroplast DNA
CRISPRs Clustered Regularly Interspaced Short Palindromic Repeats
Cse4 Chromosome segregation 4
CTAB Cetyl Trimethyl Ammonium Bromide
DAPI 2-(4-Amidinophenyl)-6-indolecarbamidine dihydrochloride, 4′,
6 Diamidino-2-phenylindole dihydrochloride
dATP deoxyadenosine triphosphate
dCTP deoxycytodine triphosphate
dGTP deoxyguanosine triphosphate
DH Doubled Haploid
DIG Digoxigenin
DNA Deoxyribonucleic Acid
DNAse Deoxyribonucleic acid nuclease
dNTP deoxyribonucleotide triphosphates
dsRNA Double stranded ribonucleic acid
EAHB East African Highland Bananas
EDTA Ethylene Diamine Tetraacetic Acid
F1 First filial generation
FAO Food and Agricultural Organization

xvi
FAOSTAT Food and Agricultural Organization Statistics
FHIA Fundación Hondureña De Investigación Agrícola
GAPDH Glyceroldehyde-3-dehydrogenase
gDNA Genomic Deoxyribonucleic Acid
GEP Gap Extension Penalty
GFP Green Fluorescent Protein
GOP Gap Opening Penalty
H2A Histone 2A
H2B Histone 2B
H3 Histone 3
H3.3 Histone 3.3
H4 Histone 4
HFD Histone Fold Domain
HJURP Hilliday Junction Recognition Protein
IAA Indole-3-acetic acid
IBA Indole-3-butyric acid
IITA International Institute of Tropical Agriculture
IM Intercalary Meristem
Indel Insertion and deletion
ISEA Islands of Southeast Asia
ITC International banana transit centre
xvii
IUPAC International Union for Pure and Applied Chemistry
JC Juke Cantor model
K2 Kimura-2-parameter
Ka Synonymous sites
KALRO Kenya Agricultural and Livestock Research Organization
kb Kilo base
KCl Pottasium chloride
Ks Non-synonymous sites
L1 Loop1
L2 Loop2
LB Luria-Bertani broth
M molar
Ma Musa acuminata mitochondrial haplotype
MAS Marker Assisted Selection
Mb Musa balbisiana mitochondrial haplotype
Mbc Multiple bud clamps
mg milligrams
MgCl2 magnesium chloride
ML Maximum Likelihood
mM millimolar
MS Murashige and Skoog

xviii
mtDNA mitochondrial DNA
mya million years ago
NADH Nicotinamide Adenine Dehydrogenase
NARO National Agricultural Research Organization
NCBI National Centre for Biotechnology Information
ng nanograms
ng/µl Nanogram per microleter
nm nanometers
nM nanomole
NOS Nopaline Synthase
OD Optical Density
PCR Polymerase Chain Reaction
P-H Post Harvest
PTM Post Transcriptional Methylation
PVP Polyvinnyl Pyrrolidone
RB Right Border
rDNA ribosomal DNA
RNA Ribonucleic acid
RNAi ribonucleic acid interference
RNAse Ribonucleic Acid interference nuclease
RT-PCR Reverse Transfer ribonucleic acid Polymerase Chain Reaction
xix
Scm3 Suppressor of chromosome missegregation protein 3
siRNA small interfering RNA
SNP Single Nucletotide Polymorphism
TAE Tris-Acetate-EDTA
TALENs Transcriptional Activator Like Effector Nucleases
T-DNA transfer DNA
UV Ultraviolet Light
WT Wild Type
xx
ABSTRACT
Conventional breeding of bananas (Musa spp.) is a slow process due to long breeding cycles, sterility and polyploidy. Development of inbred lines establishes homozygous lines used in breeding and through conventional approaches, these lines have been achieved albeit in long cycles of backcrossing. In addition to conventional approaches, efforts have been made to reduce these cycles through marker assisted selection (MAS) and through culture of haploid plant parts (anthers and ovules) to produce haploid plants. These methods are however not universal and reproducible in all cultivars. A new approach developed and tested in Arabidopsis and used in the current study develops haploids by crossing centromere specific histone 3 (CENH3) mutants (haploid inducers) with wild type. The current study aimed at producing haploid inducer transgenic banana lines for future development of inbred lines. Three RNAi gene constructs (GFP-tailswap, Tailswap and GFP-CenH3) were transformed into Escherichia coli (Strain DH5α), re-extracted, validated and transformed into Agrobacterium tumefaciens (Strain EHA 105) which was used to transform diploid bananas using intercalary meristems and multiple apical bud clumps as explants. The Agro-infected explants were then selected and regenerated on media containing 100mg/L kanamycin. Successful integration of the constructs into the genome of transgenic plants and RNAi silencing of endogenous CenH3 were confirmed through molecular analysis. As one of the basis of establishing the candidate cultivars for development of putative haploid inducers, a phylogenetic and haplotyping analysis using the markers Nicotinamide Adenine Dehydrogenase (NADH) and Centromere specific histone 3 (CenH3) partial coding sequence was performed on both diploid and triploid bananas. The phylogeny of 39 banana cultivars using the markers NADH and CenH3 differentiated banana species Musa acuminata, Musa balbisiana and Musa textilis as well as sections Rhodochlamys, Eumusa and Australimusa. In haplotype analysis, a total of 13 haplotypes were obtained in all the 39 banana cultivars using 7 SNP positions in the CenH3 partial gene. Five of these were observed to be present in both diploids and triploids and 8 were unique. A total of 59 putative haploid inducer lines were developed and the presence of gene constructs confirmed in 47% of them using PCR. RNAi silencing was confirmed by accumulation of small interfering RNA (siRNA) in transgenic plants and their absence in non-transgenic plants. CenH3 complementary DNA (cDNA) clones from diploid and triploid banana cultivars were sequenced to check allele and splice variants as well as characterize their evolutionary relationships. Analysis of banana CenH3 expression resulted in a total of 20 CenH3 transcripts of variable lengths (471-760 base pairs (bp)) and exon/inton structures (7/6, 6/5 and 5/4). Evolutionary relationship of the transcripts indicated that CENH3 in bananas is undergoing both positive (Ka/Ks >1) and stabilizing selections (Ka/Ks <1). The study was able to develop putative haploid inducer lines, identify banana phylogenetic relations using partial CenH3 and NADH genes and identify expression and evolutionary relations of CenH3. Future work should be done to improve on the efficiency of silencing using recent and more specific silencing approaches like Transcriptional Activator Like Effector Nucleases (TALENs) and Clustered Regulatory Interspersed Palindromic Repeats (CRISPRs).

1
CHAPTER ONE
INTRODUCTION
1.1 General introduction
Bananas and plantains herein referred to as bananas are classified under the family
Musaceae genus Musa (Cheesman, 1947; Simmonds, 1953; Robinson, 2010). They are an
important fruit and food crop with a global production of 144 million tones of which over
74% is used for consumption making banana the number one fruit crop (FAOSTAT,
2013). Despite this importance, bananas have a narrow genetic base with only two species
constituted in most hybrid cultivars. This narrow genetic base makes them susceptible to
many pests and diseases some of which completely wipe out banana plantations (Baurens
et al., 2010). Wild relatives which are progenitors of cultivated varieties are in existence
and can be used to widen the genetic base in the already existing cultivated genotypes.
Musa as a genus is divided into four sections which are mainly based on the chromosome
numbers (Daniells et al., 2001). The four sections are Callimusa and Australimusa which
have twenty chromosomes (2n=20), Eumusa and Rhodochlamys (2n=22). Cultivated
bananas are hybrids between the species Musa acuminata (A genome) and M. balbisiana
(B genome) both of which are in the section Eumusa. To further establish classification
system for both wild and cultivated bananas, they have been put into genomic groups
depending on the relative contribution of the A and/or B genomes. The genomic groups
include diploids (AA, AB and BB), triploids (AAA, AAB and ABB) and tetraploid
(AAAA, AAAB, AABB and ABBB).
2
The hybrid banana cultivars in existence are as a result of years of selection and crosses
some of which have occurred naturally (Daniells et al., 2001). The identification of
progenitors of the triploid cultivars from the existing wild diploids has been achieved using
different approaches including molecular markers (Ude et al., 2002; Creste et al., 2004;
Ruangsuttapha et al., 2007; Thomas-Hall et al., 2007; Brown et al., 2009; Miller et al.,
2010; Hippolyte et al., 2012 ) and morphological characterization (Cheesman, 1947). The
identification of such progenitors enables mapping of the origin and spread of cultivars.
The identification also provides information to breeding programs which makes decision
for cultivar selection and parents for breeding easier. For example, if there are cultivars
with some level of disease resistance or important biotic and a biotic traits with known
progenitors, then these can be used in breeding programs. Many studies using molecular
approaches have not conclusively identified all the progenitors for cultivated hybrids.
More genetic information based on use of diverse genes in plant genomes will increase the
knowledge base and lead to the universal acceptance of known progenitors. In the current
study the partial coding sequence for the nuclear gene coding for Centromere Specific
Histone 3 Protein (CENH3) and the partial coding sequence for mitochondrial
nicotinamide adenine dinucleotide (NADH) gene were used to cluster triploid banana
cultivars to diploids and this information was consequently used as part of the basis on
which identification of cultivars to develop haploid inducers were selected.
Banana breeding is an essential part of crop improvement programme and offers one of the
best solutions to existing and emerging biotic and abiotic stresses. Breeding aims at
achieving homozygosity for a favorable characteristic and this is achieved by first creating
inbred lines which have the favorable characteristic homozygously expressed. The inbred
lines can then be crossed with other lines to develop new varieties with superior

3
characteristics. However, despite the importance and success of conventional breeding in
solving major constraints affecting banana production, it is time consuming and tedious. It
takes more than ten years to breed and release plant varieties with character of choice to
farmers through conventional breeding approaches, such plants have 90-97%
homozygosity (Chan, 2010). However, there exist tools such as Marker Assisted Selection
(MAS) that have been used with an effort to reduce this time. Despite this effort, molecular
markers only reduce the time involved in screening for the character of choice but do not
reduce the number of crosses to be done to attain homozygosity in developing pure
breeding lines or establishing cultivars.
Research has been ongoing in different crops to develop a mechanism that together with
MAS and conventional breeding could drastically reduce breeding time. Creation of
haploids in plants has been in use for a long time mainly with an aim of facilitating genetic
mapping (Assani et al., 2003). Different procedures have been used in creating haploids in
plants; among them are microspore and anther culture ( Barnabás et al., 1999; Assani et
al., 2003; Lee et al., 2003; Kim and Baenziger, 2005; Grewal et al., 2009; Dunwell et al.,
2010). Both microspores and anthers are natural haploids and once cultured, they develop
into haploid plants which are doubled to become homozygous “doubled haploids”.
However the success of these approaches is cultivar dependent and furthermore protocols
vary intra-specifically. Another approach commonly used in creating haploids is by
crossing species that are widely related where the genome of one of the parents involved is
lost remaining with haploids (Sanei et al., 2011). However, the mechanism underlying this
approach is not clearly known and cannot always be recreated in different species.
The haploid development approach used in this study is based on crossing wildtype parents
to mutants. It is an improvement to the existing haploid development approaches of anther
4
and microspore culture as well as haploid development through wide crosses; this is
because the specific working mechanism is clearly known (Ravi and Chan, 2010). The
protein CENH3 is mutated in one of the parents, this protein very important in cell division
(Robinson, 2010). The main principle is based on the fact that CENH3 attaches to spindle
fibers during cell division and any alterations to it normally affect post-zygotic mitosis,
hence only wild type chromosomes undergo normal mitosis resulting in half the genome in
the offspring. The working mechanism of this approach is clearly known (Ravi and Chan,
2010) and its transferability to bananas is investigated in this study.
Multiple CenH3 transcripts have been observed in wild diploid and allopolyploids
cultivars in different angiosperm genera (Masonbrink et al., 2014) and different crop
species including rice (Hirsch et al., 2009; Li et al., 2010), carrots (Dunemann et al.,
2014), brassica (Wang et al., 2011) and barley (Sanei et al., 2011). Since the ribonucleic
acid interference (RNAi) constructs used in this study were based on a CenH3 coding
sequence (CDS) from the cultivar Doubled Haploid Pahang (DH Pahang) that is different
from the cultivars ‘Zebrina GF’ and ‘Calcutta 4’ used for making haploid inducers, it was
imperative to check whether multiple CenH3 copies and variants exist in bananas
including the cultivars ‘Zebrina GF’ and ‘Calcutta 4’.
1.2 PROBLEM STATEMENT
Banana breeding is a long process that involves establishing inbred lines, these have a
desired character homozygously expressed.Such lines are then used crossed to other
cultivars to give ne varieties. The process of developing pure breeding lines (inbred lines)
in bananas involves cycles of crosses and backcrosses to the parents in order to reduce
heterozygosity. The process of developing inbred lines in bananas can take up to 8 years
hence making it time consuming to release new cultivars to farmers.

5
1.3 JUSTIFICATION
This study was carried out with the aim of reducing the time involved in developing pure
breeding lines in bananas by developing haploid inducers that can be crossed with any
other parent cultivar to develop haploids. Haploids developed can then be doubled to
produce doubled haploids (DH) which are 100% homozygous and hence true breeding
lines.
The method of haploids induction used in this study was chosen because existing
approaches have limitations. Time reduced in Marker Assisted Selection (MAS) for
example, is only at the screening of presence of characters but the actual time for crossing
and backcrossing is not reduced. Current approaches of haploid development are cultivar-
specific and are not replicable. Furthermore, most of the haploid development approaches
are tissue culture dependent with protocols being very specific to the cultivar targeted.
In this study, the approach used was by mutating a variant of histone 3 called Centromere
Specific Histone 3 (CENH3). In this method CENH3 involved in mitosis is silenced and
when plants with such a mutated protein are crossed to wild type parent (not having the
silenced protein), haploids are developed. The genome of the haploid plants is then
doubled using existing approaches like colchicine treatment to develop doubled haploid
which are true breeding plants. The working mechanisms of the current approach are
clearly known and its replicability in bananas is tested.
To partially identify the cultivar to be used in developing haploid inducers, it was
important to carry out a phylogenetic study of 39 diploid and triploid bananas. In this study
two partial coding sequences for a nuclear gene CenH3 and mitochondrial NADH were
used to identify the phylogenetic positions of wild diploids against hybrids including some
East African Highland Banana (EAHB) cultivars.

6
Since the success in development of haploid inducers in the approach used in this study is
highly dependent on complete silencing of endogenous CenH3 gene, presence of multiple
and variable CenH3 transcripts would result to alternate expression and hence reduce the
success rates in haploid induction. It was therefore important to check whether the diploid
cultivars used in the study had multiple transcripts being expressed by sequencing of
Reverse transcriptase polymerase chain reaction (RT-PCR) clones.
1.4 HYPOTHESES
1. There is no phylogenetic variability in NADH and CenH3 partial gene of 39 diploid
and triploid banana cultivars.
2. Modification of the CenH3 gene in diploid banana cultivar ‘Zebrina GF’ does not
result in haploid inducers.
3. Multiple CenH3 gene transcripts can not be expressed in diploid and triploid banana
cultivars
1.5 OBJECTIVES
1.5.1 Overall objective
To carry out a Phylogenetic study of 39 banana cultivar, develop haploid inducers in
diploid banana cultivars Zebrina GF and Calcutta 4 and analyze the expression of the
CenH3 gene in six banana cultivars.
1.5.2 Specific objectives
1. To carry out phylogenetic analyses of 39 banana cultivars based on partial CenH3 gene
coding sequence and mitochondrial NADH as well as identify respective haplotypes.
2. To develop haploid inducers in selected banana cultivars using RNAi gene constructs.

7
3. To assess the expression of CenH3 transcripts in diploid and triploid cultivars by
observing the sequence diversity of RT-PCR clones.
8
1.6 LAYOUT OF THE THESIS
This thesis is arranged into six chapters, chapter one is a general introduction to the study
topic, chapter two is review of literature in the field of study. Chapter three and four are
phylogenetic studies and development of doubled haploid inducers respectively while
chapter five assesses CenH3 gene expression in diploid and triploid bananas. These three
chapters have a brief introduction, materials and methods and discussion. Chapter six gives
the general conclusion and recommendations. References are listed at the end of chapter
six lastly the appendices.
9
CHAPTER TWO
LITERATURE REVIEW
2.1 Origin and domestication of bananas
Bananas (Musa spp) are thought to have originated from south-east Asia and western
pacific, where diploid seed-bearing progenitors of cultivated varieties are still present in
the wild, mainly in forests (Robinson, 2010). Natural crosses between these cultivars and
consequent selection of edible ones by farmers based on vigour, fruit type and adaptability
over generations resulted to the edible bananas currently under cultivation (De Langhe, et
al., 2009).
The history of domestication and spread of bananas is very complex and is thought to have
occurred thousands of years ago (De Langhe et al., 2009). Furthermore the relationships of
banana cultivars have been a subject of research using both genetic and morphological
approaches (Gawel and Whittemore, 1992). Different markers have been used to assess the
origin, relatedness and global spread of bananas. Studies using restriction fragment length
polymorphisms (RFLP) in 19 banana species and sub-species was generally in agreement
with morphological positioning apart from the observation that section Rhodochlamys and
Musa could not be differentiated (Gawel and Whittemore, 1992). A study using similar
markers of mitochondria and chloroplast origin were used to ascertain maternal and
paternal lineages in diploid and triploid cultivars where results suggested that the first
center of domestication was Phillipines-New Guinea area (Carreel et al., 2002) but it is
suggested that human migration resulted to the present wide geographical distribution of
cultivars in different continents (Robinson, 2010; Perrier et al., 2011).
10
Amplified fragment length polymorphic (AFLP) markers have been used to assess
relatedness of cultivars in different countries and globally. In Malasyia the subspecies of
M. Acuminata: trancuta, malaccensis and macrocarpa were compared and found to be
different (Wong, 2001). A study using similar markers assessed the genetic diversity of 28
cultivars in the species M. acuminata colla and M. balbisiana colla and their natural
hybrids and the results of this study was able to identify new sub-species within M.
acuminata, the study identified three sub-species (Microcarpa, burmannica, and
malaccensis) sub-species (Ude et al., 2002). A more comprehensive study targeting on the
validity of the sections in Musa using AFLP targeted 4 sections and concluded that the
sections Rhodochlamys and Musa should be combined into one and sections Austalimusa
be merged with Callimusa (Wong et al., 2002).
Other markers and genes both chloroplast and nuclear have widely been used to assess the
origin and domestication of cultivated bananas. Chloroplast and nuclear genes were used
to assess the clustering of A and B genome haplotypes; where sub-species of M. acuminata
from the islands of Southeast Asia (ISEA) were observed to cluster into the A genome
haplotype while those of B- and S genome clustered to M. balbisisana and M. schizocarpa
respectively (Li et al., 2013). Another study using single sequence repeats (SSR) on 561
Musa accessions postulated that the major phenotypic differences observed in the sub-
groups ‘Cavendish’, ‘plantain’ and ‘Mutika’ are as a result of epigenetic regulation
(Hippolyte et al., 2012).
2.2 Banana taxonomy
Bananas are monocotyledonous, perennial herbs in the family Musaceae genus Musa
(Simmonds, 1953). The genus Musa is divided into sections; Australimusa, Callimusa,
Eumusa and Ingentimusa based on physical appearance of parts of the plant including

11
height, size and shape of inflorescence among others (Simmonds, 1953; Wong, 2002). The
section Eumusa is the most important economically as it contains all the edible and
cultivated cultivars. Edible cultivars were grouped by Simmonds (1953) into five genomic
groups: AA, AAA, ABB, AAB and AB. The five genomic groups have further been
confirmed through isoenzyme and molecular analysis (Gawel et al., 1992; Perrier et al.,
2009). The A denote Musa acuminata genome and the B, Musa balbisiana. The five
genomic groups which are diploid or triploid are therefore of intergenomic or intragenomic
hybrids of A and/or B. Musa as a genus is divided into four sections which are mainly
based on the chromosome numbers (Daniells et al., 2001). The four sections are Callimusa
and Australimusa whose species have been shown to share a common characteristic of
having the same number of chromosomes (n=x=10), while the sections Eumusa and
Rhodochlamys have a chrosome number (n=x=11) (Cheesman, 1947; Wong, 2002).
Edible bananas are hybrids between the species Musa acuminata (A genome) and M.
balbisiana (B genome) both of which are in the section Eumusa, although species of T and
S genome have been observed to have contributed to cultivated cultivars (Carreel et al.,
2002). To further establish classification system for both wild and cultivated bananas, they
have been put into genomic groups depending on the relative contribution of the A and/or
B genomes. The genomic groups include diploids (AA, AB and BB), triploids (AAA,
AAB and ABB) and tetraploid (AAAA, AAAB, AABB and ABBB (De Langhe et al.,
2010).
2.2.1 The dispute in Musa sections
The four Musa sections established using morphological data have been reviewed using
molecular methods and many studies have found that the sections are not supported and
suggest that they be collapsed into two (Ude et al., 2002; Raboin et al., 2005; Perrier et al.,
12
2009; Opara et al., 2010; Hřibová et al., 2011; Hippolyte et al., 2012; Li et al., 2013). The
studies using molecular approaches have indicated that the species from the different
sections identified using morphological characters do not result to monophylectic groups
when phylogenetically positioned using genetic markers (Carreel et al., 2002; D’Hont et
al., 2000). Two clades were identified in those studies, clade one represents the sections
Eumusa and Rhodochlamys while species from sections Australimusa, Ingentimusa and
Callimusa formed the second clade . This observation has prompted the reappraisal of the
Musa sections previously identified through morphology (Häkkinen, 2013). The two
monophyletic clades identified in the different molecular studies mentioned have been
proposed to produce the two new sections Musa and Callimusa. The section Musa
represents the clade formed by species from the former sections Eumusa and
Rhodochlamys. The new section Callimusa identified as the second clade from molecular
studies is a representative of the species previously grouped into sections Australimusa,
Ingentimusa and Callimusa (Li et al., 2010). Different studies have recommended the use
of more markers to firmly cement these two new clades and to observe if there are any
deviations using other regions of the banana genome ( Perrier et al., 2009; Li et al., 2010;
Christelová et al., 2011; Häkkinen, 2013).
2.3 Importance of bananas
Banana is an important crop globally and is the largest fresh fruit crop traded
internationally in terms of both volume and value (FAOSTAT, 2013). They constitute a
staple food and income source for millions of people, especially in Africa with about 87%
of the worldwide production remaining in domestic markets (FAOSTAT, 2013). Bananas
can be eaten raw as a fruit when ripe, as a vegetable and in small proportions can be
processed into storable products including jam, chips and banana puree (Abiodun-Solanke

13
and Falade, 2011) They are a good source of carbohydrates (Mohapatra et al., 2010),
vitamins (thiamine, riboflavin, niacin, pantothenic acid, pyridoxine, folic acid, ascorbic
acid) and minerals (potassium, calcium, phosphorus, iron) (Mohapatra et al., 2010).
Banana leaves are fibrous and this makes them have diverse uses, first they are used as
‘plates’ for serving food or wrapping food when steaming (Le et al., 2007). Dry banana
Leaves have been used as strips for weaving, wrapping, rope making, roofing and
thatching (Le et al., 2007).
Bananas have also been used for medicinal purposes, the flowers are used in treatment of
ulcers (Abiodun-Solanke and Falade, 2011). Bananas have also been variedly used in
different communities: they have been used as animal feed to fatten hogs and whole
bananas and pseudostem are fed to cattle after chopping. Species of bananas have also
been used for aesthetic value in land scaping (Abiodun-Solanke and Falade, 2011).
However, despite the importances; banana production is greatly hampered by biotic and
abiotic stresses (Mohapatra et al., 2010).
2.4 Constraints to banana production
The production of banana and plantain is challenged by both abiotic and biotic factors.
Biotic constraints to banana production are both pests and diseases. Bananas are
susceptible to a range of serious and debilitating diseases caused by fungi, nematodes,
bacteria and viruses (Opara et al., 2010). Fungal diseases that afflict banana production
include Fusarium wilt (Panama) caused by Fusarium oxysporum fsp cubense, black leaf
streak disease caused by Mycosphaerella fijiensis and Sigatoka disease caused by
Mycosphaerella musicola (Tripathi et al., 2008). Plant parasitic nematodes are an equally
common problem and severe production constraint to bananas production. Most of the
nematodes species of economic importance to bananas production are burrowing
14
nematodes. They include: Pratylenchus goodeyi, Radopholus similis, Helicotylenchus
multicinctus, Meloidogyne spp, Rotylenchulus, Radopholus, Pratylenchus and
Helicotylenchus (Robinson, 2010). Banana weevils Cosmopolites sordidus are a major
banana pest too, they severely infest the rhizome resulting in significant crop losses (Le et
al., 2007).
The main bacterial diseases afflicting banana include Xanthomonas wilt caused by
Xanthomonas campestris pv. musacearum and bacterial diseases caused by Ralstonia
solanacearum such as Moko, blood and bugtok(Tripathi et al., 2008). Infection can result
in severe to complete losses in production and affects overall productivity (Tripathi et al.,
2008). Viral diseases such as the Banana bunchy top, caused by Banana bunchy top virus
(BBTV), genus Nanavirus and Banana streak virus (BSV) have also been reported to
severely hamper banana production. To address these challenges, there is a continuous
need to develop and introduce new and improved banana cultivars. This is mainly being
tackled through two main approaches conventional breeding by introgressing relevant
characters into new cultivars and by genetic engineering introducing new genes which can
confer resistance against banana diseases.
2.5 Conventional banana breeding and its challenges
Conventional breeding in bananas started in the early 1920s especially in the Carribean,
Jamaica and Trinidad with countries like Brazil, Cameroon and Nigeria now having
breeding programs (Robinson, 2010). Cultivar improvement through conventional
breeding is aimed at achieving functional homozygozity and phenotype consistency (Chan,
2010). The methods applied in conventional breeding are based on crossing elite cultivars
and selecting the best performing progeny. In bananas this is done by crossing the highly
sterile cultivated triploids with wild relatives followed by backcrossing (Robinson, 2010).
15
Different approaches are pursued in banana breeding programs, the first one utilizes
improved diploid as the male to pollinate a fertile triploid female resulting in tetraploids
(Robinson, 2010). The tetraploid attained in diploid-triploid cross is subsequently used in
development of triploids by crossing with another improved diploid (Robinson, 2010). The
second approach involves crossing two diploids and essentially having normal segregation
where triploids are screened (Robinson, 2010). The third strategy employed uses
tetraploids obtained by treatment of improved diploids with colchicine.The tetraploids are
then crossed with diploids to give triploids of dessert bananas exemplified by the cultivar
‘Fhlorban 920’ (Robinson, 2010).
The process of conventional breeding in bananas takes a long time with a 16-18 months
average from planting to flowering (Robinson, 2010). Despite the fact that intentional
classical Musa breeding has been successful, it is slow due to problems intrinsic to
bananas, including low fertility due to inter-sub specific hybridity and triploidy, and long
generation times (Crouch, 1998).The difficulty involved in screening for a character of
choice during crosses can be overcome by identification of molecular markers that are
used to reduce the number of progenies that must be screened to recover the useful trait
combinations (Chan, 2010).
2.6 Production of haploids and their role in breeding
The main objective of achieving homozygosity in breeding is to fully express a target
character of a parent in the progenies (Chan, 2011). This expression can only be achieved
by first establishing true breeding lines; those that have the target character(s) being
expressed homozygously (Ravi and Chan, 2010). Biotechnologies that can achieve
homozygosity in shorter periods would be welcome in Musa. One such technology is
developing haploids and then doubling them to doubled haploids (Chan, 2011). In plant
16
breeding, haploidy is a sure means of achieving homozygosity and is closely linked to
reduction of breeding time .
2.6.1 Conventional methods of haploid production
Development of doubled haploids has been achieved with great success especially in crops
where it can be performed efficiently like rice, wheat and maize among others (Forster et
al., 2007; Dunwell, 2010). Haploid development in these crops has been mainly achieved
through ‘conventional approaches’ of haploid development. These include culture of
haploid plant parts and haploids achieved through wide crosses (Chan, 2010).
2.6.1.1 Haploid production through anther and microspore cultures
Despite the importance of haploidy, its adoption in many crops is limited due to barriers in
the standard methods of development. One of the common standard methods of haploid
development is regeneration of cultured haploid cells to yield adult plants (Assani et al.,
2003). This approach is mainly through microspore embryogenesis based on anther or
microspore cultures (Assani et al., 2003; Maluszynski et al., 2003). Anther and microspore
culture have successfully been achieved in many crops including rice, wheat, chickpea
and oil palm (Kim and Baenziger 2005; Grewal et al., 2009; Chen et al., 2010; Dunwell et
al., 2010). The main advantage of this approach is that microspores can be isolated in
greater amounts per flower hence providing large number of potentially embryogenic
single haploid cells (Chan, 2010; Basu et al., 2011). However, these methods are only
limited to a few crops since tissue culture protocol development is largely species and
cultivar dependent (Chan, 2010). Furthermore, somaclonal variation from tissue culture
can also result into deleterious effects. Moreover, regeneration is frequently inefficient for
production breeding and may be limited to only a few genotypes (Chan, 2010).

17
2.6.1.2 Haploid production through wide crosses
The alternative to haploid cultured cells is the crossing of wild relatives where the genome
of one is eliminated leaving one parental chromosome in the offspring. A case of this is the
cross between Hordeum vulgare (barley) and its wide relative H. bulbosum resulting in the
loss of the latter’s genome. Another example where a wide cross has attained haploids is
the cross between maize (Zea mays) and wheat (Oryza sativa) (Campbell et al., 2000;
Bidmeshkipour et al., 2007; Niroula and Bimb, 2009). Despite the few successes, two
main problems prevent adoption and usability of wide crosses as a method to attaining
haploids. The first problem is that in inter-specific crosses, the seeds obtained are not
always viable and embryo rescue is required (Chan, 2010). A rare case where there is
success in viability and no embryo rescue was required is in maize intra-specific genome
elimination of the “Stock6 line”(Ravi and Chan, 2010). The second problem in wide
crosses is that the mechanism behind development of haploids is not clearly known and
this limits its adoption in other crops (Chan, 2010).
2.6.2 Haploid production by centromere-mediated genome elimination
The approaches of haploid development discussed in sections 2.6.1.1 and 2.6.1.2 are either
not universal or the principles behind their use are not clearly known. However, a recent
discovery proves to be more universal and the mechanisms behind its use clearly known
(Ravi and Chan, 2010). The strategy involves replacing the endogenous CENH3 with a
modified version. Modification was by replacing the CENH3 tail with that of H3.3. The
CENH3 tail has in previous studies been shown to be sufficient for successful mitosis
(Black et al., 2007; Ravi et al., 2011).
18
2.6.2.1 Technical aspects in haploid production through centromere modification
The study by Ravi and Chan (2010) utilized the fact that diverse CENH3 cannot be
substituted for one another for normal post fertilization mitosis to take place. This study
generated 'haploid inducers' in Arabdopsis thaliana CENH3 null mutant by replacing
endogenous CENH3 with transgenic proteins (Ravi and Chan, 2010). This is because, to
effectively create haploids, chromosomes from the inducer have to be out-competed by
those from wild-type parent (Ravi and Chan, 2010). This can only be achieved by
silencing or inactivating the endogenous CENH3. The main technique used in silencing in
the study of Ravi and Chan (2010) was Ribonucleic acid interference (RNAi).
RNAi is an approach that is naturally used by organisms to regulate the movement of
transposable elements, destroy virus sequences and prevent recombination of homologous
chromosomes (reviewed by; Kusaba, 2004; Matzke and Birchler, 2005; Sen and Blau,
2006). RNAi silencing was discovered and used in Caenorhabditis elegans and has been
also used to silence genes in plants (Fire et al., 1998). RNAi takes place post-
transcriptionally and is induced by double stranded RNA (dsRNA). It has widely and
successfully been used to silence genes in A. thaliana, barley, rice, maize and bananas
(Baulcombe, 2004; Miki and Shimamoto, 2004; Crane and Gelvin, 2007; Uauy et al.,
2007; Ravi et al., 2010). The approach can artificially be used by making gene constructs
that would resemble natural RNAi machinery. Transformation constructs with two repeats
corresponding to the gene being targeted for silencing are designed with an intron between
them to enable hairpin formation (Fusaro et al., 2006). This hairpin formation leads to
double stranded RNA that is used in silencing of the target gene. RNAi has been
successfully used to silence the endogenous CENH3 in A. thaliana in the haploid
19
development approach (Ravi and Chan, 2010). However, despite the success; this gene
silencing approach does not always yield 100% silencing (Fire et al., 1998; Chan, 2008).
2.6.2.2 The eukaryotic centromere and its role in cell division
Centromeres are positions that nucleate (provide nucleotide sequences) kinetochores, the
protein complexes that bind to spindle microtubules and mediate chromosome segregation
during cell division (Chan, 2010; Furuyama and Biggins, 2007).They actually govern
chromosome segregation by being the sites of kinetochore assembly (Hirsch et al., 2009).
The structure, organization and functional analysis of the centromere in different
organisms has been extensively studied (Tagami et al., 2004; Zhou et al., 2011; Dunemann
et al., 2014; Steiner and Henikoff, 2014) and reviewed (Henikoff et al., 2004; Wang et al.,
2011; Maddox et al., 2012; Lermontova et al., 2014). Studies on eukaryotic centromere
have confirmed that it has a common core structure.
The basic building block of the centromere is the nucleosome, which is composed of four
core histone proteins H3, H4, H2A and H2B. The nucleosome is wrapped by a 147bp
DNA sequence ( Tagami et al., 2004; Kouzarides, 2007; Rando, 2007) in 1.7 turns around
two molecules of each of the four core histones (Ahmad and Henikoff, 2002; Talbert and
Henikoff, 2010). This ensures that the long DNA molecule is properly compacted and
packaged. The nucleosomes are further folded into chromatin fiber of 30nm diameter
which results to a size that can be accommodated within the cell (Basu et al., 2011).
Another common feature shared across the four histone proteins is the presence of C-
terminal histone fold domain (HFD) and N-terminal ‘tail’. The HFD is composed of three
alpha (α) helices: α-1, α-2 and α-3 separated from each other by two loops 1 and 2 (L1 and
L2) (Zhou et al., 2011). The HFD is highly conserved even in organisms which are
evolutionary diverse for example a comparison between human and mouse HFDs show a

20
78% homology, that between human and Saccharomyces cerevisiae 50% homology and in
plants HDF from Brassicaceae (Lepidium oleraceum) has been shown to substitute that of
Graminacea (Zea mays) in function (Baker and Rogers, 2006; Maheshwari et al., 2015).
The CENH3 tail on the other hand is unique in that it protrudes from the nucleosome core
and is open to diverse post transcriptional modifications (PTM) (Groth et al., 2007).
Furthermore, unlike the conserved HFD, the tail is highly evolving (Henikoff et al., 2004).
One other common feature in eukaryotic centromeres is the presence of variants of the
core histone proteins. The core histones H3 and H2A have been observed to have
variant(s) which are the centromeric specific histone H3 (CENH3), H3.3, H2A.Z and
H2A.X (Henikoff et al., 2004). The focus in this study is on CENH3 which was previously
described as CENP-A in humans (Talbert et al., 2002), chromosome segregation protein 4
(Cse4) in Saccharomyces cerevisiae and centromere identifier (CID) in Drosophila
melanogaster (Talbert and Henikoff, 2010).
2.6.3 CENH3 deposition and organization into the centromere
CENH3 is a variant of the H3 that replaces it at the centromeric nucleosomes. Homologues
of CENH3 have been identified in many eukaryotes including maize, carrot, Brassica and
other crops plants ( Hirsch et al., 2009; Wang et al., 2011; Dunemann et al., 2014).
CENH3 like other histone proteins has a C-terminal histone fold domain (HFD) and a
hypervariable N-terminal ‘tail’ domain. It is 50-60% identical to conventional H3
especially at the HFD. However the tail does not show any similarity to H3 (Talbert and
Henikoff, 2010; Ravi et al., 2011) and is highly variable. Despite being a histone protein, it
has some special characteristics both structurally and in its location that makes it unique.
First, it only localizes in the centromere and is actually the centromere ‘landmark’(Collins
et al., 2004; Henikoff et al., 2004; Steiner and Henikoff, 2014). Second, it is the indicator
21
of the centromere with or without the satellite repeats sequences that characterize
centromeres and it replaces H3 in centromeric kinetochores (Black and Bassett 2008).
The structural arrangement of CENH3 and other histones within the nucleosome is
important in maintaining stability of chromosomes and the different forces during cell
division (Black and Cleveland, 2011). Even if CENH3 is somewhere else along the
chromosome apart from the centromere, it is mainly transiently and this does not always
change the position of the centromere to these new deposition sites (Black and Cleveland,
2011).
The question of how CENH3 marks and maintains centromere through physical
conformation has been a big an open question. To answer this, different models for the
structure of CenH3-containing nucleosomes have been provided (Black and Cleveland,
2011; Zhou et al., 2011). Six main models have been proposed: the Octamer model
(Sheinin et al., 2013; Codomo et al., 2014; Henikoff et al., 2014; Wisniewski et al., 2014),
the tetrasome model (Dechassa et al., 2011; Tachiwana and Kurumizaka, 2011; Henikoff
and Furuyama, 2012), the hemisome (Furuyama et al., 2013; Henikoff et al., 2014),
Octameric “reversome” (Camahort et al., 2009), hexameric complex (Henikoff and
Furuyama, 2012) and trisome ( Verdaasdonk and Bloom, 2011; Nechemia-Arbely, 2012;
Shivaraju et al., 2012) models . The octamer model is the most common and entails having
two copies of each of the four core histones H2A, H2B, H4 and CENH3 in place of H3
(Figure 2.1A). In this model, DNA wraps around the histones with a right hand twist. The
other model is tetrasome which has two copies of CenH3 and H4 but does not have the
histone H2A and H2B (Figure 2.1B). The hemisome model (Figure 2.1C) was
hypothesized after atomic force microscopy (AFM) measurements of cenH3-containing
chromatin revealed that their height was half that of conventional chromatin (Dalal et al.,

22
2007 a and b; Dimitriadis et al., 2010). This model was also observed to be unique in that
DNA wraps around histones with a right hand twist instead of the conventional left hand
twist ( Henikoff and Furuyama, 2012; Furuyama et al., 2013; Codomo et al., 2014). The
reversome is considered a high energy model (Black and Cleveland, 2011) with the
positive supercoiling of DNA observed to be affecting the nucleosome structure (Bancaud
et al., 2007). Reversome is actually a reverse nucleosome and only exists when there are
other forces, these are currently unknown.
Figure 2.1: Models (A-F) explaining how DNA wraps around kinetochores in CENH3 containing nucleosomes. A: The octameric nucleosome model with two molecules each of the histone proteins, B: The tetrasome model with only CENH3 and H4 histones, C: Hemisome, with one molecule of each histone. Source: Black and Cleveland, 2011
The tetrasome model (Figure 2.1B) has two copies of the CENH3 and histone H4 and
lacks the histones H2A and H2B ( Mizuguchi et al., 2007; Dechassa et al., 2014). In this
model also, the non-histone protein Scm3 a homologue of HJURP in mammals, co-
localize with CENH3 and substitutes for H2A and H2B. Dechassa et al. (2014) further

23
proved this model quantitatively by showing that Scm3 has a higher affinity to CenH3-H4
and with a10 fold likelihood of affinity to H3-H4.
The trisome and hexasome models have similarity in that in both, histones H2A and H2B
are replaced by the non-histone protein Scm3 (Black and Cleveland, 2011; Furuyama et
al., 2013). There are however differences between the two, first the hexasome model
contains two copies each of CENH3, H4 and Scm3 (Figure 2.1E). Trisome model (Figure
2.1F) on the other hand contains one copy of each molecule (Henikoff and Henikoff,
2012). Despite the disagreement in the centromere structural model, research is still going
on. Centromere still remains the centre of mitotic control and cell division in general.
2.6.4 CenH3 expression pattern in plants of different ploidies
Natural variability in CenH3 gene transcripts has been observed in diploids and polyploids
of different species ( Hui et al., 2010; Wang et al., 2011 ; Dunemann et al., 2014;
Masonbrink et al., 2014; Nagaki et al., 2009). Presence and loading of multiple CENH3 in
the centromere results in complexities during mitosis and meiosis which can result to
segregation errors (Chan, 2010; Ravi and Chan, 2010; Seymour et al., 2012). In diploids,
Hordeum vulgare – bulbosum crosses, only one of the variable CENH3 proteins was
observed to be loaded into the centromere (Sanei et al., 2011). Complementation of
Arabidopsis thaliana with CenH3 sequences derived from distant species like Zea mays
was observed to maintain CENH3 function (Maheshwari et al., 2015). Furthermore
selfing and intercrossing of fertile species having naturally variable CENH3 was observed
to produce progenies which were either aneuploids, haploids and hybdrid diploids all with
novel characteristics (Maheshwari et al., 2015). The importance of checking CenH3
expression profiles in plant species is important in understanding breeding dynamics if
plants are observed to have multiple CenH3 transcripts.

24
CHAPTER THREE
PHYLOGENY OF BANANAS AND HAPLOTYPE INFERENCE OF UNPHASED DATA BASED ON THE MARKERS NADH AND CENH3
3.1 INTRODUCTION
The genus Musa represents four sections, Eumusa and Rhodochlamys with a basic
chromosome number of n = 11, Callimusa (n = 10 or n = 9) and Australimusa (n = 10)
(Cheesman, 1947). The most important section is Eumusa, where most of cultivated
bananas fall. There are four wild progenitors of domesticated banana, three from section
Eumusa, M. acuminata, M. balbisiana, and to a much lesser extent, M. schizocarpa (S
genome) and one from section Australimusa, M. textilis/M. maclayi (T genome)
(Cheesman, 1947). The species M. acuminata has been classified into eight sub-species
based on chloroplast and mitochodrial genetic analysis (Wong, 2002). The eight sub-
species include: banksii of Papua new guinea, errans from Phillipines, Zebrina from the
Indonesia, malaccensis, microcarpa, burmannicoides,burmannica and siamea with a
distribution from Thailand, Malasyia and Philippines (Carreel et al., 2002). However, no
sub-species have been identified in M. balbisiana to date. Cultivated Musa clones are
mainly inter-specific hybrids of M. acuminata and M. balbisiana (Wong, 2002). However,
hybrids are in existence which originated from crosses between M. acuminata and M.
schizocarpa (S genome) and others between M. acuminata and M. textilis (T genome)
(Hřibová et al., 2011).
The haploid genome contributed by M. acuminata is referred to as the A genome and that
from M. balbisiana the B genome (Carreel et al., 2002). Based on morphological
25
characters, genetic composition and other qualitative descriptors, the genetic groups AA,
AB, AAA, AAB, ABB were identified by Simmonds (1953).
Studies have attempted to answer the question of the origin and domestication of cultivated
bananas, mainly using molecular approaches (Wong, 2001; Ude et al., 2002; Nwakanma et
al., 2003; Ruangsuttapha et al., 2007; Lescot et al., 2008; Hippolyte et al., 2012; Li et al.,
2013). The progenitors of cultivated bananas based on the existing wild relatives would
help explain which diploid cultivars contributed to the triploid genome. Studies using
cytoplasmic DNA (chloroplast and mitochondria) have been used to unravel the
progenitors of cultivated diploid and triploid bananas (Boonruangrod et al., 2008;
Boonruangrod et al., 2009; De Langhe et al., 2010). The reason for the use of cytoplasmic
DNA in identifying progenitors is due to the property of monoparental inheritance of
chloroplast and mitochondrial DNA (cpDNA and mtDNA respectively) from paternal the
maternal parents respectively (Carreel et al., 2002; Boonruangrod et al., 2008). The
chloroplast and mitochondrial DNA have been shown to be inherited from the mother and
the father in bananas (Carreel et al., 2002). Three chloroplast variants (Ca1-Ca3)
representing the A genome and two (Cb1 and Cb2) for the B genome chloroplast gene-
pool were identified by Boonruangrod et al.’s (2008) study. Furthermore, the variants
Ma1-Ma4 and Mb1-Mb3 were identified in the mitochondrial genome for M. acuminata
and M. balbisiana respectively in the same study (Boonruangrod et al., 2008). However, B
genome contribution in AB and AAB cultivars has not been observed this far. Genome
specific markers that can identify hybrid gene-pool composition both in the chloroplast
and in the mitochondria would be welcome.
Unphased data can be used to identify haplotypes in polyploids and different approaches
have been used so far ( Ching et al., 2002; Ding and Cantor, 2003; Neigenfind et al., 2008;
26
Browning and Browning, 2011; Tyson and Armour, 2012; Su et al., 2008). Furthermore,
identification of gene pools contributing to the triploid and diploid cultivars through direct
sequencing of PCR products would be an added advantage as the time involved in cloning
will be reduced.
Genome elimination in plant interspecific hybrids has been an area of interest to
researchers in recent times. Crosses between distantly related species have been shown to
result in genome elimination. Inter-specific crosses in barley resulted in uniparental
genome elimination (Sanei et al., 2011), while crosses between Arabidopsis thaliana
bearing a mutant Centrome specific histone 3 protein (CENH3) with the wild type
resulted in elimination of the mutant genome (Ravi and Chan, 2010). To be able to make
crosses for haploid development, it is critical to know the relationship of different cultivars
that can be used in crosses.
In this study, the partial coding sequence for the markers CenH3 and the mitochondrial
marker NADH were used to establish phylogeny of cultivated diploid and triploid bananas
as well as wildtype diploid progenitor. The study also aimed to infer haplotypes from
unphased data (data with all the alleles not separated) within triploids and diploids based
on CenH3.
3.2 MATERIAL AND METHODS
3.2.1 Plant material
In total 39 cultivars with different genomic compositions were used in this study (Table
3.1). The samples included 10 cultivars of AA, 6 cultivars of AAA, 7 cultivars of AAB, 2
cultivars of AB, 6 cultivars of ABB, 1 cultivar of AS and 5 cultivars of BB genomic
composition and the species Musa ornata and Musa textilis from sections Rhodochlamys

27
and Australimusa respectively. DNA samples for all cultivars were obtained from
International Transit Centre (ITC) (Leuven, Belgium) except the cultivar Ngombe, which
was collected from Kenya Agricultural and Livestock Research Organization (KALRO)
Bungoma, Kenya.
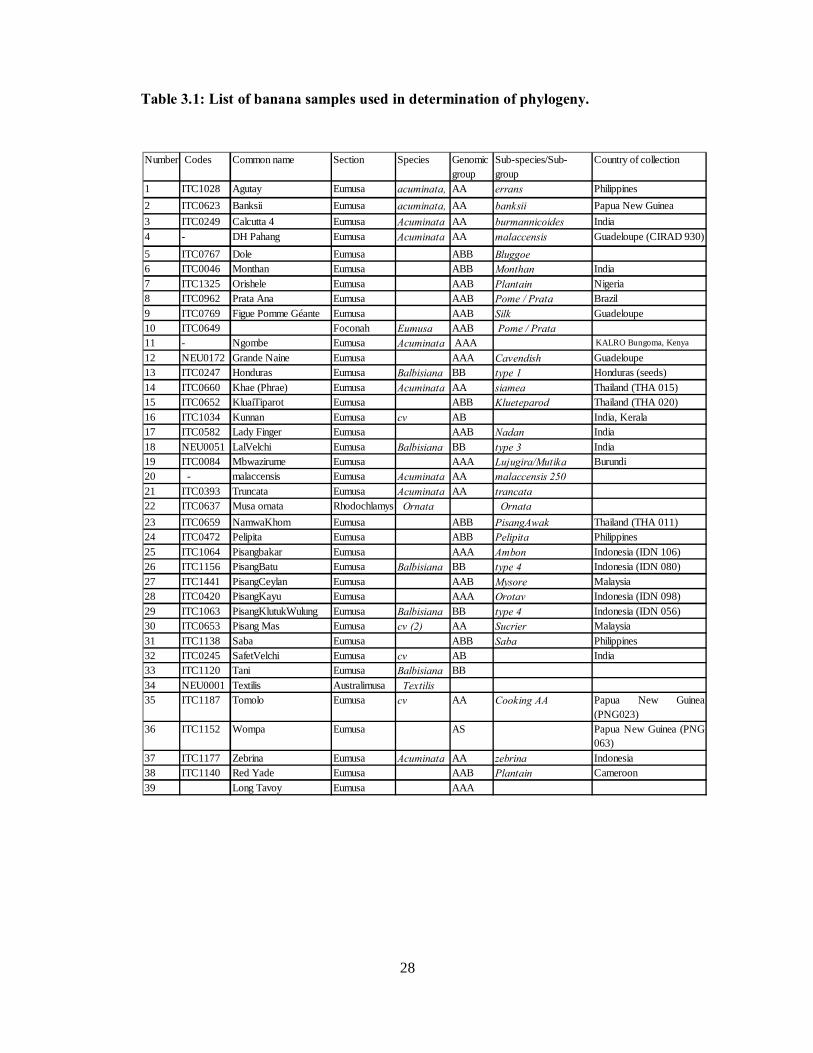
28
KALRO Bungoma, Kenya
Table 3.1: List of banana samples used in determination of phylogeny.
Number Codes Common name Section Species Genomic group
Sub-species/Sub-group
Country of collection
1 ITC1028 Agutay Eumusa acuminata, AA errans Philippines2 ITC0623 Banksii Eumusa acuminata, AA banksii Papua New Guinea3 ITC0249 Calcutta 4 Eumusa Acuminata AA burmannicoides India4 - DH Pahang Eumusa Acuminata AA malaccensis Guadeloupe (CIRAD 930)5 ITC0767 Dole Eumusa ABB Bluggoe6 ITC0046 Monthan Eumusa ABB Monthan India7 ITC1325 Orishele Eumusa AAB Plantain Nigeria8 ITC0962 Prata Ana Eumusa AAB Pome / Prata Brazil9 ITC0769 Figue Pomme Géante Eumusa AAB Silk Guadeloupe10 ITC0649 Foconah Eumusa AAB Pome / Prata11 - Ngombe Eumusa Acuminata AAA12 NEU0172 Grande Naine Eumusa AAA Cavendish Guadeloupe13 ITC0247 Honduras Eumusa Balbisiana BB type 1 Honduras (seeds)14 ITC0660 Khae (Phrae) Eumusa Acuminata AA siamea Thailand (THA 015)15 ITC0652 KluaiTiparot Eumusa ABB Klueteparod Thailand (THA 020)16 ITC1034 Kunnan Eumusa cv AB India, Kerala17 ITC0582 Lady Finger Eumusa AAB Nadan India18 NEU0051 LalVelchi Eumusa Balbisiana BB type 3 India19 ITC0084 Mbwazirume Eumusa AAA Lujugira/Mutika Burundi20 - malaccensis Eumusa Acuminata AA malaccensis 25021 ITC0393 Truncata Eumusa Acuminata AA trancata22 ITC0637 Musa ornata Rhodochlamys Ornata Ornata23 ITC0659 NamwaKhom Eumusa ABB PisangAwak Thailand (THA 011)24 ITC0472 Pelipita Eumusa ABB Pelipita Philippines25 ITC1064 Pisangbakar Eumusa AAA Ambon Indonesia (IDN 106)26 ITC1156 PisangBatu Eumusa Balbisiana BB type 4 Indonesia (IDN 080)27 ITC1441 PisangCeylan Eumusa AAB Mysore Malaysia28 ITC0420 PisangKayu Eumusa AAA Orotav Indonesia (IDN 098)29 ITC1063 PisangKlutukWulung Eumusa Balbisiana BB type 4 Indonesia (IDN 056)30 ITC0653 Pisang Mas Eumusa cv (2) AA Sucrier Malaysia31 ITC1138 Saba Eumusa ABB Saba Philippines32 ITC0245 SafetVelchi Eumusa cv AB India33 ITC1120 Tani Eumusa Balbisiana BB34 NEU0001 Textilis Australimusa Textilis35 ITC1187 Tomolo Eumusa cv AA Cooking AA Papua New Guinea
(PNG023)36 ITC1152 Wompa Eumusa AS Papua New Guinea (PNG
063)37 ITC1177 Zebrina Eumusa Acuminata AA zebrina Indonesia38 ITC1140 Red Yade Eumusa AAB Plantain Cameroon39 Long Tavoy Eumusa AAA

29
3.2.2 Primer design
Partial coding sequence for CenH3 and those of the non-coding intergenic region for
NADH were used as the target markers for primer design. Centromere histone 3 coding
sequence for Doubled Haploid pahang (DH pahang) was kindly provided by the Global
Musa genomics consortium (Dr. Jim Lorenzen) which was used as a template for primer
design. Forty eight NADH sequences representing 28 species within the monocots group
were downloaded from National Centre for Biotechnology Information (NCBI) genebank
release 186 and assembled in Sequencher version 4.1 (Ann Arbor, MI USA). Variable and
conserved regions within the consensus sequence based on the alignment were noted and
these were used as the reference in designing primers. The primer pairs were designed
targeting variable regions for NADH, these were positions 215 to 231 for the forward and
1598 to 1615 for the reverse primers out of the 1726bp long sequence alignment. The
CenH3 primers were designed from the coding region targeting a 322 basepair (bp)
amplicon from position 6211 to 6533 corresponding to exon 1 and part of intron 1 obtained
from in silico analysis of the 7kb DH Pahang genomic sequence. The software
PrimerSelect in the DNASTAR software suite (Madison, WI, USA) was used in designing
all the primers. The best primer pair from the program was selected for each of the target
region and synthesized at Inqaba Biotech company (Pretoria, SA).
3.2.3 PCR, sequencing and sequence assembly
Six primer sets, three for each target region were first screened with eight cultivars. Based
on either quality of PCR products or sequences, a primer pair for each marker was selected
and used with the remaining 31 DNA samples. The sequences of the two primer pairs
were: CenH3_gene_F2: CTGCTGTGATGGCGAGAAC and CenH3_gene_R2:
CTGGTGGCCGTGGTTC for CenH3 and Nad1_c5F: GTCCCCGGCCAGAACCAC and

30
Nad1_c5R: GCAGTCCGGGGCACAAG for NADH. PCR reactions were performed in
20µl reaction volume using the Bioneer® PCR premix (Daejeon, South Korea) containing
1 U of Top DNA polymerase, 250µM dNTP, 10 mM Tris-HCL (pH 9.0), 30 mM KCl and
1.5 mM MgCl. The PCR was run in Gene Amp® Applied Biosystem (ABI) 9700 machine.
The profile was set at initial denaturation of 94 ºC for 5 min, 40 cycles of 94 ºC for 30
sec, annealing temperature of 59 ºC for 1 min, 72 ºC extension for 40 secs and a final
extension of 72 ºC for 10 min for CenH3. The conditions were similar for NADH apart
from the annealing temperature which was set at 64 ºC for 30 secs and extension at 72 ºC
for 1.5 min.
The PCR products were cleaned using Bioneer® PCR purification kit according to the
manufacturer's protocol. The cleaned PCR products were viewed by running on a 1.5%
agarose gel stained with gelred. Sequencing of PCR products was performed using
Applied Biosystem (ABI) Bigdye® terminator v 3.1 (Foster City, CA USA) protocol from
both enda using the same primers used for amplification (CenH3 and NADH primers).
Excess dye terminators were removed using EDTA/ethanol precipitation method. The 96-
well reaction plate in which the sequencing reaction was done was removed from the
thermocycler and briefly spun on a Beckman Allegra S5700 at 3000 rcf. One microliter of
125 mM EDTA was adde followed by one microliter of 3 M sodium acetate was added to
the bottom of each well after which 25µl of absolute ethanol was added. The mixture was
incubated at room temperature for 15 min in order to precipitate the extension products.
Shorter precipitation time was avoided as this would result into very short extension
products while precipitation time longer than 24 hrs would increase the precipitation of
unincorporated dye terminators. The plate was spun on a Beckman Allegra S5700 at 3000
rcf for 30 min. The plate was inverted and spun at 185 rpm to remove supernatants. Effort
31
was made to remove all the supernatants as unincorporated dye terminators were dissolved
in them. One hundred micro liters of 70% absolute ethanol was added to each well
containing the PCR products.The plate was spun on a Beckman Allegra S5700 at 3000 rcf
for 15 min. The plate was removed, inverted and again spun to 185rpm for one min to
remove supernatants. The plates were placed in a thermocycler with the lids open; the
thermocycler was set at 90 ºC for one min. The samples were then re-suspended in 10 µl
of injection buffer (HiDi Formamide), vortexed and spun to make sure the pellets were in
contact with the buffer. The samples were heated at 95 ºC for 2 min to ensure complete
dissolution and then placed in ice after which they were ready to be run in the sequencer.
The sequencing reactions in this case were run in ABI 3130 and 3730 prism as per set
protocols.
Sequences were assembled and edited in sequencher version 4.1. Ends that had low
confidence base calls were trimmed to retain high confidence sequences. Sequence
assembly parameters were set at 85 and 25 while the assembly was done using the
‘assemble automatically parameter’. In cases of low base calls, the secondary peaks which
were up to 25% of the primary peak were called. The criteria for calling secondary bases at
region with clear base calls were set at 75% of the primary chromatogram. IUPAC codes
were assigned to all the positions that were meeting the criteria for multiple calls.
Sequences were exported in FASTA concatenated format without gaps for further
analyses.
3.2.4 Sequence alignment and phylogenetic reconstruction
FASTA concatenated sequences were aligned in ClustalW (Thompson et al., 1994) as
implemented in MEGA5 (Tamura et al., 2011). Alignment of CenH3 sequences was done
at Gap Opening Penalty (GOP) of 13.2 and a Gap Extension Penalty (GEP) of 1.11 while

32
that of NADH was done at a GOP and GEP of 6.66 and 1.11, respectively. The DNA
weight matrix, the transition weight and percentage of delay divergent cutoff were set at
IUB, 0.5 and 30, respectively, for both markers. Negative matrix was used in both
alignment and the predefined gaps kept. Phylogeny reconstruction was performed by
maximum likelihood (ML) for both markers. The two markers had different parameters set
in perfoming the phylogenetic reconstruction except for the bootstrap (BP) statistical
support of individual clades and the respective number of bootstrap replicates which was at
1000 for both. The model selected for CenH3 was kimura-2-parameter (K2), rates among
sites being gamma distributed with a gamma parameter of 8.0, gaps and missing data were
treated by pairwise deletion while the codon positions used were the 1st, 2nd, 3rdand non-
coding. Phylogenetic reconstruction for NADH used the model jukes cantor (JC) the rates
among sites were uniform while gaps and missing data were treated by complete deletion.
Equally, for NADH the codon positions selected were the1st, 2nd, 3rd and non-coding
while gaps in the alignment were treated as missing data.
3.2.5 Haplotype inference
Single nucleotide polymorphisms (SNPs) for CenH3 that had been assigned IUPAC codes
were exported to excel and saved as cvs file. The SNP positions were grouped as per the
cultivar’s ploidy (triploids and diploids). Triploids that had one or two basecalls per
position (example A or AT) were added with Ns to complete the call to three (example A
to ANN and AT to ATN). SNPs within diploid cultivars that only had one basecall were
equally added with an N to complete the two basecalls associated with diploidy (Table
3.2). The software SATlotyper (Neigenfind et al., 2008) was used for haplotype inference.

33
Both triploid and diploid SNP positions were run with the SATsolvers set as
MiniSat_v1.14_cygwin. All the SNP positions for all the genotypes were used for the
analysis and the bootstrap support set at 100. Haplotypes identified in haploids were
physically checked for duplication and similarity to those obtained in triploids, these were
noted. Haplotypes that were duplicated in diploid and triploids were treated as a single
incidence. Duplicated haplotypes together with the unique ones (occurring only once in
either diploids or triploids) were considered as unique for both diploids and triploids.

34
Table 3.2: Positions of Single Nucleotide Polymorphisms (SNPs) that were used in inferring haplotypes of triploid and diploid banana cultivars. (The ‘SNP positions in alignment’ indicate the position of the CenH3 sequence alignment that was used in haplotype inference).
Cultivar Name Genome Ploidy 62 63 95 120 122 166 208Calcutta_4 AA 2N CN GN AN AN AN TN CNMalaccensis AA 2N CN GN AN AN AN TN CNAgutay AA 2N CN GN AN AN AN TN CNLong_Tavoy AA 2N CN GN AN AN AN TN CNBanksii AA 2N CN GN AN AN AN TN CNTruncata AA 2N CN GN AN AN AN TN CNKhae_Phrae AA 2N CN GN AN AN AN TN CNDH_Pahang AA 2N CN GN AN AN AN TN CNTomolo AA 2N CN GN AG AN AG TN CNPisang_Mas AA 2N NN NN NN TN AN TN CNZebrina AA 2N NN NN NN AN AG CT CNKunnan AB 2N CN GN AN AN AN CN TNSafet_velchi BB 2N GC GC AG AN AN TN CNWompa AS 2N CN GN AN AN GN TN CTPisang_Batu BB 2N CN GN AN AN AN CN TNHonduras BB 2N CN GN AN AN AN CN TNPisang_Klutuk_Walung BB 2N CN GN AN AN AN CN TNLal_Velchi AB 2N CN GN AN AN AN CN TNGrande_Naine AAA 3N CNN GNN ANN ANN ANN TNN CNNGombe AAA 3N CNN GNN ANN ANN GNN TNN CNNMbwazirume AAA 3N CNN GNN ANN ANN GNN TNN CNNPisang_Kayu AAA 3N CNN GNN ANN ATN ANN TNN CNNFigue_Pomme_Geante AAB 3N CNN GNN ANN ANN ANN TNN CNNPisang_Ceylan AAB 3N CNN GNN GNN ANN AGN TNN CNNPrata_Ana AAB 3N GCN GCN AGN ANN ANN TNN CTNOrishele AAB 3N CNN GNN ANN ANN ANN TNN CNNFoconah AAB 3N CNN GNN ANN ANN ANN TNN CNNLady_Finger AAB 3N CNN GNN ANN ANN ANN CTN CTNRed_yade AAB 3N NNN NNN NNN NNN TNN CNN GNNPelipita ABB 3N CNN GNN ANN ANN ANN TNN CNNNamwa_Khom ABB 3N GNN GNN GNN ANN ANN TNN CTNDole ABB 3N CNN GNN ANN ANN ANN CNN TNNSaba ABB 3N CNN GNN ANN ANN ANN CNN TNNKluai_Tiparot ABB 3N CNN GNN ANN ANN ANN CNN TNN
SNP positions in alignment
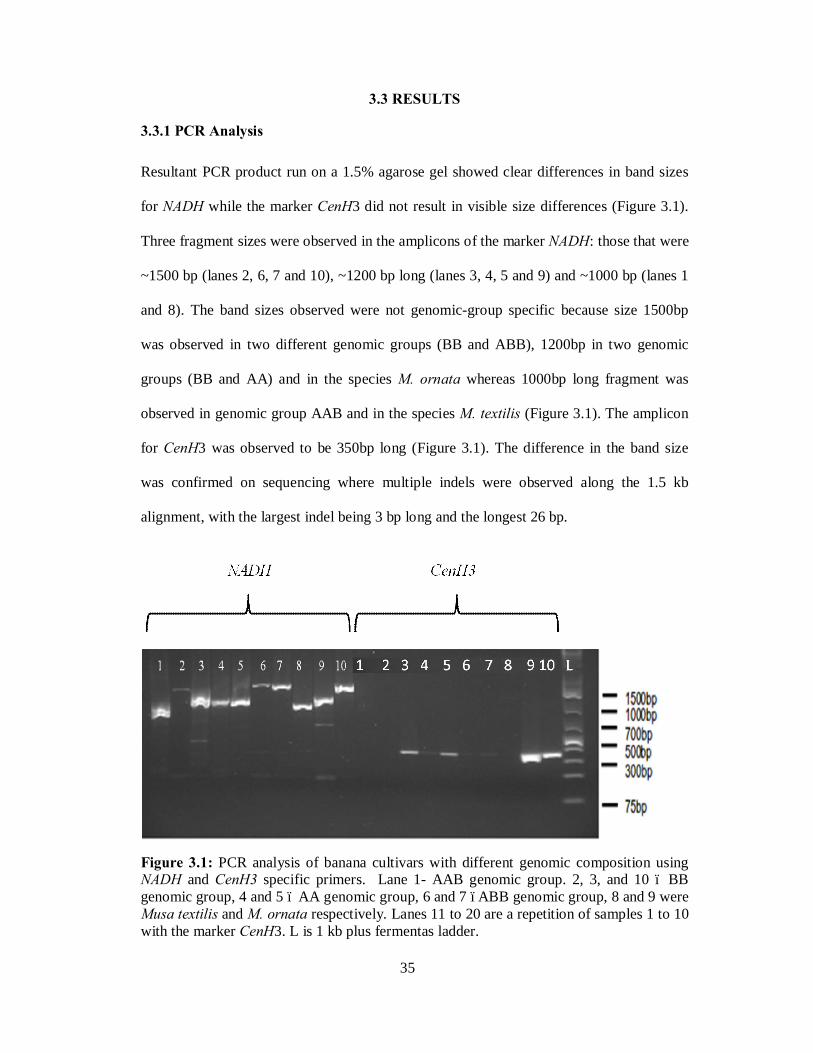
35
3.3 RESULTS
3.3.1 PCR Analysis
Resultant PCR product run on a 1.5% agarose gel showed clear differences in band sizes
for NADH while the marker CenH3 did not result in visible size differences (Figure 3.1).
Three fragment sizes were observed in the amplicons of the marker NADH: those that were
~1500 bp (lanes 2, 6, 7 and 10), ~1200 bp long (lanes 3, 4, 5 and 9) and ~1000 bp (lanes 1
and 8). The band sizes observed were not genomic-group specific because size 1500bp
was observed in two different genomic groups (BB and ABB), 1200bp in two genomic
groups (BB and AA) and in the species M. ornata whereas 1000bp long fragment was
observed in genomic group AAB and in the species M. textilis (Figure 3.1). The amplicon
for CenH3 was observed to be 350bp long (Figure 3.1). The difference in the band size
was confirmed on sequencing where multiple indels were observed along the 1.5 kb
alignment, with the largest indel being 3 bp long and the longest 26 bp.
Figure 3.1: PCR analysis of banana cultivars with different genomic composition using NADH and CenH3 specific primers. Lane 1- AAB genomic group. 2, 3, and 10 – BB genomic group, 4 and 5 – AA genomic group, 6 and 7 –ABB genomic group, 8 and 9 were Musa textilis and M. ornata respectively. Lanes 11 to 20 are a repetition of samples 1 to 10 with the marker CenH3. L is 1 kb plus fermentas ladder.
36
3.3.2 Sectional and genomic group congruence
Thirty four sequences representing different cultivars and common to both markers were
obtained on sequencing. These were deposited in the NCBI under the accession numbers
KP751256 - KP751292 for NADH and KP751293 - KP751328 for CenH3.The sequences
for the tetraploid cultivar ‘Yawa 2’ and diploid cultivar ‘Long tavoy’ were missing for the
CenH3 while sequences for cultivars ‘Honduras’, Monthan, Pisang bakar and M. textilis
were missing for the marker NADH and these were treated as missing data for the
respective markers. Alignments of NADH and CenH3 sequences resulted in a length of
1448 bp and 278 bp for the longest alignments, respectively. Out of these, 196 and 4
positions were found to be variable in NADH and CenH3, respectively. The best ML
model selected for CenH3 and NADH were Kimura 2 (K2) and Jukes Cantor plus a gamma
parameter of 0.265 (JC+G) respectively. During model selection, the two markers were
observed to have different evolutionary rates and hence alignments were conducted
separately. Twenty SNP positions in NADH alignment were found to differentiate A and B
genomes (Table 3.3).
3.3.2.1 Segregation based on maker NADH
Three clades denoted as A, B and C were obtained on phylogenetic reconstruction with
NADH (Figure 3.2).The clades were strongly supported at 98 and 84 bootstrap values for
clades A and B, respectively. The clade A was represented by triploid and diploid cultivars
from section, Eumusa. The only representative of the section Rhodochlamys M. ornata
branched earlier on as a separate clade from A, and is labeled as section Rhodochlamys
(Figure 3.2). This clade was also observed to have representation of mixed genomic
cultivars. Triploid cultivars in this clade were either AAA in font green (Grande naine,

37
Pisang Kayu, Gombe, Pisang bakar and Mbwazirume) or AAB genomic groups (Foconah,
Prata ana, Pisang ceylan, Figue pomme geante, Lady finger and Orishele) in font black
(Figure 3.2). Diploids in this clade were either one of the three genomic groups, AA
genomic composition in font yellow (Tomolo), AS genomic constitution represented by
the cultivar Wompa indicated in single block bracket and AB genomically constituted
cultivars represented by Safet velchi and Kunnan also indicated in single block bracket
(Figure 3.2). This marker was unable to differentiate wildtype AA (red font) from each
other, these sub-subspecies were represented by the sub-species banksii, zebrina, truncata ,
Calcutta 4, burmannicoides, errans and siamea all of which clustered into the same clade
A. Only the sub-species malaccensis segregated from clade A as a sub-clade.

38
Table 3.3: Single neocleotide polymorphisms (SNPs) from the partial NADH gene that differentiated banana A and B genomes. Greyed cells represent AA, AAA and AAB cultivars while white ones represent ABB and BB cultivars.
SNP Number
Cultivar Genomic group 1 2 3 4 5 6 7 8 9 10 11 12 13 14 15 16 17 18 19 20
Dole ABB C C G T A C A T T A C G C T G G A C T C Honduras BB C C G T A C A T T A C G C T G G A C T C Kluaitirapot BB C C G T A C A T T A C G C T G G A C T C Monthan ABB C C G T A C A T T A C G C T G G A C T C Pelipita ABB C C G T A C A T T A C G C T G G A C T C PisangBatu BB C C G T A C A T T A C G C T G G A C T C Pisangklutukwulung BB C C G T A C A T T A C G C T G G A C T C Tani BB C C G T A C A T T A C G C T G G A C T C FiguePommeGeante AAB A A T G T A C A G T A T A G T T T T A G Lady finger AAB A A T G T A C A G T A T A G T T T T A G Banksii AA A A T G T A C A G T A T A G T T T T A G Calcutta 4 AA A A T G T A C A G T A T A G T T T T A G Malaccensis AA A A T G T A C A G T A T A G T T T T A G Truncata AA C C T G T A C A G A A T A G T T T T A G Wompa AS A A T G T A C A G T A T A G T T T T A G Zebrina AA A A T G T A C A G T A T A G T T T T A G
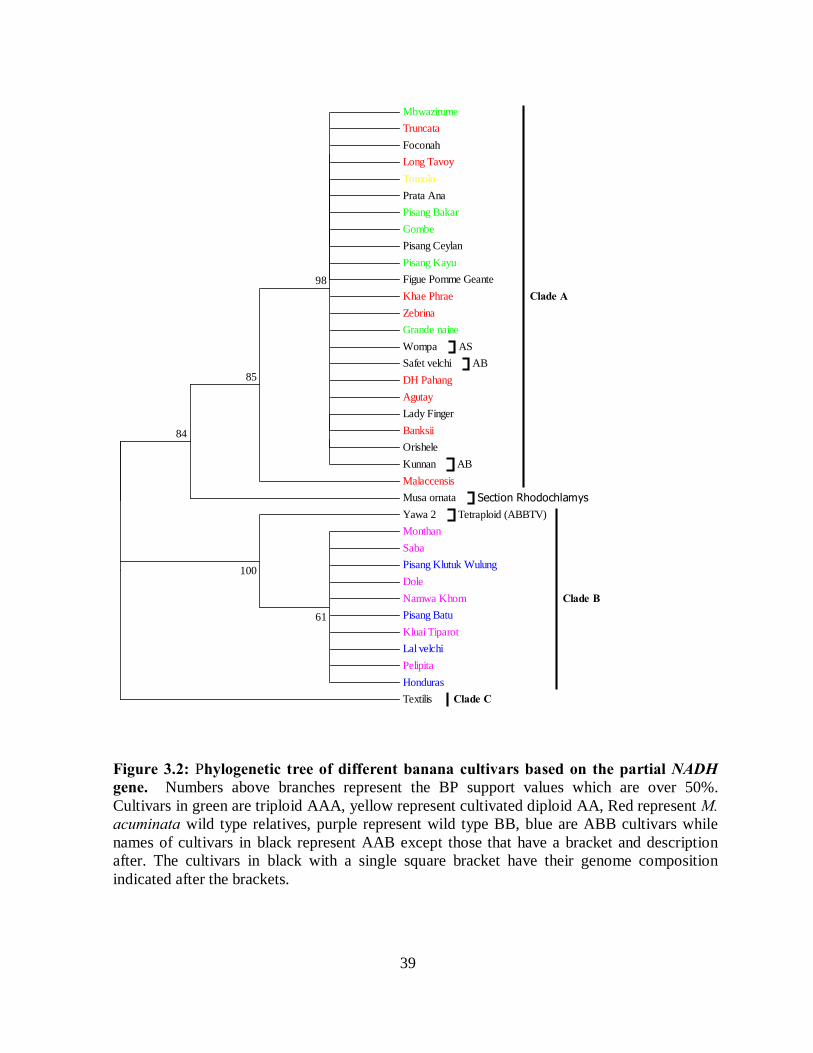
39
Figure 3.2: Phylogenetic tree of different banana cultivars based on the partial NADH gene. Numbers above branches represent the BP support values which are over 50%. Cultivars in green are triploid AAA, yellow represent cultivated diploid AA, Red represent M. acuminata wild type relatives, purple represent wild type BB, blue are ABB cultivars while names of cultivars in black represent AAB except those that have a bracket and description after. The cultivars in black with a single square bracket have their genome composition indicated after the brackets.
Mbwazirume Truncata Foconah Long Tavoy Tomolo Prata Ana Pisang Bakar Gombe Pisang Ceylan Pisang Kayu Figue Pomme Geante Khae Phrae Zebrina Grande naine
AS WompaAB Safet velchi
DH Pahang Agutay Lady Finger Banksii Orishele
AB Kunnan Malaccensis
Clade A
Section Rhodochlamys Musa ornataTetraploid (ABBTV) Yawa 2
Monthan Saba Pisang Klutuk Wulung Dole Namwa Khom Pisang Batu Kluai Tiparot Lal velchi Pelipita Honduras
Clade B
Clade C Textilis
61
100
84
85
98

40
The clade B which mainly represented the B genome cultivars in the NADH phylogeny had
BB and ABB genomic groups and was strongly supported at a BP support of 100. Two sub-
clades were observed within this clade, these were the uni-cultivar sub-clade represented by
the tetraploid cultivar Yawa-2 (ABBT) and the second sub-clade represented by 10 cultivars
of BB and ABB genomic constitution. The BB cultivars within this clade were represented by
the cultivars Saba, Namwa khom, kluai tiparot, monthan, pelipita and Dole, these are in the
NADH tree in colour pink (Figure 3.2). The origin of some of these cultivars is Philippines for
Saba, Thailand for Namwa khom and Kluai tiparot and India for Monthan (Boonruangrod et
al., 2009). The ABB cultivars within this clade are in font blue and are represented by the
cultivars Pisang Klutuk Walung, Pisang Batu, lal velchi and Honduras. The third clade C was
having the species M. textilis as a representative and this was in the section Australimusa.
3.3.2.2 Segregation based on the marker CenH3
Sequences for 23 out of the 39 cultivars used in the study were obtained with the marker
CenH3. The resultant phylogeny based on CenH3 had two major clades (A and B) and the
associated subclades (Figure 3.3).The first clade referred to as ‘Clade A’ or ‘the A genome
clade’ had representative cultivars within M. acuminata except for the cultivar Wompa which
is interspecific hybrid between M. acuminata and M. schizorcarpa (AS genomic
composition). This marker was able to differentiate subspecies and genome groups within the
A genome clade. Different sub-clades each of which had one or more cultivars were observed
within this clade. The first sub-clade supported at a BP value of 79 contained the cultivars of
ABB genome composition and these were the cultivars Namwa khom and Safet velchi. The
second sub-clade supported at 54 BP differentiated the cultivars of the sub-species
malaccensis, it had two cultivars malaccensis and tomolo with the cultivar DH Pahang being a

41
sister clade.The fourth sub-clade supported at BP value of 40 had the sub-species zebrina and
East African highland banana cultivar Gombe. Twelve other cultivars appeared as individuals
in this clade and these included cultivars Pisang ceylan, Pisang mas, Wompa, Calcutta 4, M.
acuminata cv truncata, Khae phrae, Long tavoy, Banksii, Prata ana, M. ornata and Agutay
(Figure 3.3).
The B genome clade based on CenH3 represented the ABB and BB genomic groups and was
strongly supported at 82 BP (Figure 3.3). This clade had two major sub-clades, the first had
the ABB cultivar pelipita and the second had four cultivars of either BB or ABB genomic
composition. The BB cultivars in this sub-clade were Pisang klutukwalung and Pisang batu
while the ABB cultivar was Dole. The tetraploid cultivar Yawa (ABBT) was observed to
cluster with the BB and ABB diploids and triploids respectively. Sequences for the cultivars
Honduras, monthan, Pisang bakar and M. textilis were treated as missing data.

42
Figure 3.3: Phylogenetic positioning of different banana cultivars based on the marker CenH3. The numbers on top of each clade represent BP support values.
Namwa khom
Safet velchi
Pisang ceylan
DH pahang
Musa acuminata malaccensis
Tomolo
Pisang mas
Wompa
gombe
Zebrina
Calcutta
Musa acuminata truncata
Khae
Long tavoy
Banksii
Prata ana
Musa ornata
Agutay
A genome cultivars
Pelipita
Dole
Pisang klutuk wulung
Pisang batu
Yawa
B genome cultivars82
79
4057
5054
43
3.3.4 Haplotypes in diploids and triploids
Seven SNP positions in thirty four genotypes were used in the inference of haplotypes (Table
3.2). A total of 13 haplotypes were observed based on the 7 SNPs used (Table 3.4). Five
haplotypes were common in diploids and triploids, 3 unique to diploids and 5 unique to
triploids. Haplotype numbers 1, 2, 3 and 5 were observed to have the highest species
representatives.
The B genome cultivars of Pisang batu (26), Honduras (13), Pisang klutuk wulung (29) and
Lal velchi (18) were represented within haplotype number 1 (Table 3.4). The cultivar Lady
finger (17) with the genomic composition AAB was also observed to be associated with this
haplotype. Haplotype number 2 had representatives from A genome diploids and triploids as
well as A and B genome interspecific triploids. The AA genomic group diploids associating
with haplotype 2 were represented by the cultivars Agutay (1), Banksii (2), Khae phrae (14),
DH Pahang (4) and Zebrina (37). The triploid AAA linking to this haplotype were represented
by the cultivars Pisang Kayu (28) and Long tavoy (39). Moreover haplotype 2 had cultivars
with AAB and ABB genomic composition closely linking to it at these 7 SNP positions. The
cultivars Figue pomme geante (9), Prata ana (8), Orishele (7), Foconah (10) and Ladyfinger
(17) were the AAB genomic group cultivars that were closely linking to haplotype 2. The
cultivar Pelipita (24) was the only cultivar with the ABB genomic composition that had close
sequence similarity to this haplotype. Haplotype number 3 had four cultivars associated
Mbwazirume (19), Timolo (35), Wompa (36) and Gombe (11) these are mainly A genome
containing cultivars. Haplotype number 4 was closely associating to the cultivars Pisang
klutuk walung (29) and Saba (31). Pisang klutuk walung is a BB genomic group cultivar

44
while the cultivar Saba is of ABB genomic composition. The cultivars Pisang ceylan (27),
Tomolo (35), Prata ana (8) and Safet velchi (32) were the cultivars that were within close to
haplotype 5. Haplotypes 6 to 13 had only one representative cultivar, these were Wompa
(36), Zebrina (37),Safet velchi (32), Pisang ceylan (27), Prata ana (8), Red yade (38), Namwa
Khom (23) and Namwa khom (23) for haplotypes 6 to 13, respectively (Table 3.4).
Table 3.4: Haplotypes inferred from seven SNPs of the partial CenH3 alignment in bananas.
Haplotype number Haplotype
Ploidies represented
Cultivars
Genomic group(s) represented
1 CGAAACT Tripoids and diploids 5,13,15,16,17,18,26,29,31
ABB, BB and AB
2 CGAAATC
Tripoids and diploids 1, 2, 4, 7, 8, 9, 10, 14,17, 24,
28, 37, 39
AA, AAB, ABB and AAA
3 CGAAGTC Tripoids and diploids 11, 19, 35, 36
AA, AAA and AS
4 CGATATC Tripoids and diploids 29, 31
BB and ABB
5 CGGAATC Tripoids and diploids 8, 27, 32, 35
AAB, AB and AA
6 CGAAGTT Diploid 36 AS
7 CGGAGCC Diploid 37 AA
8 GCAAATC Diploid 32 AB
9 CGGAGTC Tripoid 27 AAB
10 GCAAATT Tripoid 8 AAB
11 GCAATCG Tripoid 38 AAB
12 GGGAATC Tripoid 23 ABB
13 GGGAATT Tripoid 23 ABB The column cultivars present indicate the cultivars that had representation within that haplotype. The cultivar numbers are as listed in the last column like they appear in Table 3.1.

45
3.4 DISCUSSION
The observation that the sizes of NADH amplicons were variable may be attributable to
insertions and deletions (indels) at the 3’ end of the respective cultivars. The groups BB and
ABB were observed to have a larger amplicon by about 300bp hence the total length
was1500bp in comparson to cultivars with AA, AAB and AAA genomic composition that had
relatively small length of approximately 1200 bp. This marker was able to pick out the B
genome component in ABB and A component in AAB heterogenomic triploids, which was
clearly reflected in the band sizes. The identification of genomic groups based on amplicons
size differences without sequencing is a first report for bananas for this marker. This could be
used in cases where one requires differentiating A from B genome containing cultivar without
further analysis. The differences in band sizes could however not differentiate diploid AA and
their respective homo- and heterogenomic sub-groups.
Three sections (Eumusa, Rhodochlamys and Australimusa) were clearly differentiated using
NADH and CenH3 (Figure 3.2 and Figure 3.3) and they clustered into monophylectic groups.
These sections have been observed to be monophylectic in other studies using both nuclear
and chloroplast markers (Hippolyte et al., 2012; Hřibová et al., 2011; Li et al., 2010, 2013).
The observation using the marker NADH that the only representative of the section
Rhodochlamys, M. ornata clustered with the A genome cultivars of the section Eumusa is
consistent with other studies (Wong, 2002; Christelová et al., 2011; Hřibová et al., 2011).
These results further corroborates Wong’s (2002) and Christelová et al (2011) findings and
suggestions that these two sections should be merged as there are no great genetic differences
that warrant their positioning into different sections. Similar work to repeal the classification
of Musa sections has already been reported (Häkkinen, 2013).

46
The observation in NADH phylogeny that the only representative of the A×S diploid cultivar
‘Wompa’ clustered to the M. acuminata clade within the section Eumusa supports the point
made by Hřibová et al (2010) that M. schizocarpa is closely related to M. acuminata.
Alternatively this clustering can be explained on the basis that only the A genome region for
this hybrid could be picked by these markers. Consequently, the AB cultivars in this study;
‘Safet velchi’ and ‘Kunnan’ did not cluster into the B genome and it attests to the observations
made by Carreel et al (2002) that no evidence of B genome contribution to these cutivars has
been identified.
The monophyly of the B genome clade is confirmation of its distinctiveness. It was observed
that the B genome clade and the respective cultivars are distant to that of M. acuminata
despite being in the same section. This observation affirms results of other studies indicating
the uniqueness and monophylly of the B genome (Brown et al., 2009; Creste et al., 2004; De
Langhe et al., 2010; Perrier et al., 2009; Raboin et al., 2005). The species M. ornata of the
section Rhodochlamys was observed to be closer to M. acuminata than it was to M. balbisiana
represented by the cultivars ‘Pisang batu’ and ‘Pisang Klutuk wulung’ (Figure 3.2 and Figure
3.3). This observation is consistent to the observation by Christelová et al (2011) on Musa
species divergence times where B genome is shown to have diverged 27.9 million years ago
(mya) while M. ornata of the section Rhodochlamys diverged 8.8 mya. Furthermore, the
results affirm Simmonds (1953) work which showed that hybridization between species of
section Eumusa and Rhodochlamys are successful since weak or no reproductive barrier exists
between them.
47
The clustering of the ABB cultivar Pelipita, Monthan, Dole and Saba to the B genome clade
affirms the observations made by Boonruangrod et al (2008) that ABB cultilvars cluster to BB
diploids. All the ABB cultivars used in this study clustered to BB diploids, these included
cultivars: ‘Monthan’, Dole, Kluai tiparot and Namwakhom. The segregation of AAB cultivars
in this study affirms the results obtained by Carreel et al (2002), where AAB sub-groups were
found to have A genome cytoplasmic constitution. The segregation of this genomic group was
observed in the sequences using both markers and only using gel electrophoresis for the
marker NADH.
The segregation based on the marker CenH3 was similar in many ways to that of NADH. The
two major clades representing the A and B genomes observed in NADH phylogeny were also
observed and this shows consistency. The identification of A and B was derived by the
observation that no diploid BB or AA cultivars clustered together, they were in either one of
the two main clades for both markers. The major deviation to the NADH phylogeny was
mainly in the A genome clade where this marker was unable to differentiate the sub-species.
The marker CenH3 is a nucleus based marker and hence the clustering of the A genome sub-
species was expected. The segregation of the A genome subspecies malaccensis and truncata
in this study compares favourably with the one observed by Wong (2002) where the two
subspecies clustered separately. However this observation deviates from the placement of the
subspecies truncata as a synonym of the subspecies Malaccensis Wong (2001). This study
clearly differentiated the two sub-species, with malaccensis being strongly supported (51 BP)
as a separate clade from trancata. The subspecies banksii and siamea (Khae (Phrae) have
previously been grouped into different sub-species. The subspecies banksii though has been
differentiated from the other M. acuminata clones using chloroplast and mitondrial markers.
48
In this study, banksii was shown to cluster separate from the rest. Carreel et al (2002)
attributed the clear segregation of this subspecies to its geographical isolation in Papua New
Guinea and some north Indonesian islands. The subspecies burmannica (Long tavoy) and
burmannicoides (Calcutta 4) have been shown to be closely related (Ude et al., 2002), this
study also confirms the same observation as the two cultivars were also observed to cluster.
The segregation within the B genome clade was consistent in both markers used and is similar
in some aspect to observations made by Ude (2002) which showed that ABB cultivars were
closer to BB diploids than AAB were. In this study AAB and ABB cultivars were observed to
segregate into either A or B genome clade, this was observed in both NADH and CenH3
markers.
Different studies have indicated that only M. acuminata sub-species that originated from the
Islands of Southeast Asia (ISEA) have had genomic contribution to cultivated bananas
(Perrier et al., 2011; Li et al., 2013). In this study, both phylogeny and haplotype inference
indicated that ISEA sub-species contributesd to triploid cultivated bananas (Figure 3.2, Figure
3.3 and Table 3.4). Phylogeny using both NADH and CenH3 was able to establish one major
clade (Clade A) that had ISEA sub-species Zebrina, Errans, Banksii, Truncata and
Malaccensis clustering. Moreover, the EAHB have been shown to have had genomic
contribution from ISEA sub-species’ Zebrina and banksii (Perrier et al., 2011). In this study
EAHB cultivar Ngombe was observed to form a sub-clade with the cultivar Zebrina for the
marker CenH3 (Figure 3.3), the cultivar Ngombe was also observed to cluster in clade A with
major ISEA sub-species with NADH a affirming the study by Li et al (2013). Observation that
the diploid cooking cultivar Tomolo was clustering with the wildtype cultivar Malaccensis
49
was contrary to other observations made that have linked this diploid to wiltype sub-species
Banksii using both chloroplast and mitochondrial markers (Carreel et al., 2002; De Langhe et
al., 2010; Li et al., 2013). However, this deviation was only observed in the phylogeny with
CenH3 (Figure 3.3). This deviation can be explained by the fact that CenH3 is a nuclear gene
which is prone to recombination while NADH is mitochondrial where there is no
recombination. Furthermore, the partial coding region of CenH3 used in this phylogeny is the
coding sequence of the CenH3 tail region which is highly evolving (Masonbrink et al., 2014),
and might be evolving much faster in Malaccensis and tomolo than it is in Banksii.
The maternal and paternal nature of inheritance of chloroplast and mitochondrial DNA genetic
material in bananas can facilitate the identification of the wild diploids that genetically
contributed to diploid and triploid cultivars (Fauré et al., 1993; Le et al., 2007). To infer
haplotypes from unphased data, only the marker CenH3 was used, this is because the other
marker NADH is monoparentally inherited and no crossing over should have taken place
during breeding. Furthermore, no multiple peaks were observed in the sequences obtained
from triploid and diploid cultivars.
Haplotype 1 mainly consisted of B genome derived haplotypes. The two haplotypes of the
cultivar Kunnan (AB) were found to be closely linked to haplotype 1 which was a B genome
haplotype, this suggests that only B genome diploids might have contributed to this cultivar’s
genome. This was contrary to observations previously made that the AB genome cultivar
Kunnan has genomic contributions from only A genome cultivars and therefore suggesting
that this cultivar be put in the AA genomic group (Li et al., 2013). The triploid cultivars
Ladyfinger (AAB), Saba (ABB) and Dole (ABB) were observed to have a haplotype
50
clustering to haplotype 1 which is a B-genome haplotype. This suggests that B genome
diploids contributed to triploids and is in line with observations made from other studies (
Perrier et al., 2011; Li et al., 2013). However, this study could not identify which BB diploid
specifically contributed to the B genome in triploids as all the cultivars representing this
haplotype clustered together. The clustering of two ladyfinger haplotypes to haplotype 2
which is essentially an A-genome haplotype group, indicates that both AA haplotypes in the
AAB haplotype of Ladyfinger may have originated from the same M. acuminata sub-species.
The two haplotypes of the cultivar Wompa were related to Haplotypes 3 and 6. Haplotypes 3
had other cultivars of A genomic composition but no diploid wild type cultivars were in this
haplotype. Two of the four cultivars that grouped together with Wompa in this haplotype were
Gombe and Mbwazirume which are EAHB. The other cultivar with a haplotype represented in
this group was the diploid cultivar Tomolo. This indicates that Tomolo may have contributed
its genome to EAHB cultivars.
Two mtDNA types were identifiable with the marker NADH with each of the diploids and
triploids under study having one of either the two types. This observation can be explained by
the uniparental nature of plastid inheritance in banana. Both mitochondria and chloroplast
DNA have previously been used to identify the origins of genomes in Diploid, homo- and
heterogenomic banana cultivars (Carreel et al., 2002; Boonruangrod et al., 2009). In the
present study, direct sequencing of PCR products was able to differentiate the maternal
mtDNA types. This study could not conclusively identify the number of CenH3 copies in the
triploids, despite multiple copies having been observed in other stable polyploidy crops (Hui
et al., 2010; Wang et al., 2011; Masonbrink et al., 2014). More transcripts obtained from an

51
equally bigger number of clones need to be sequenced to be able to make conclusions on the
number of clones expressed in bananas.
However, the study was able to differentiate the A and B genomes in bananas with both
NADH and CenH3. The marker NADH differentiated only A and B genomes while the marker
CenH3 differentiated A genome cultivars as well. The study was also able to identify the
phylogenetic positions of interspecific cultivars like AAB and ABB using NADH and CenH3
markers. The study also positioned the different M. acuminata subspecies. This work adds
new nucleotide sequences for the markers CenH3 and NADH for different banana species (M.
acuminata, M. balbisiana, M. textilis and M. ornata), subspecies, cultivars and genomic
groups (AA, AB, ABB, AAA, AAB, AS and TT) used in this study.
52
CHAPTER FOUR
DEVELOPMENT OF HAPLOID INDUCERS IN BANANAS BY MODIFICATION OF CENTROMERE SPECIFIC HISTONE 3 (CENH3) PROTEIN
4.1 INTRODUCTION
Haploids are sporophyte plants containing gametophytic number of chromosomes, this is due
to their origin from a single haploid cell (Germanà, 2006). The importance of doubled
haploids (DHs) and haploids and the methods currently used to develop them have extensively
been reviewed ( Germanà, 2006; Forster et al., 2007; Dunwell, 2010). Haploids are important
in breeding program as they give a possibility of reducing the breeding time required to obtain
completely homozygous inbred lines (Assani et al., 2003; Germanà, 2006).
Haploids and consequently DH have been achieved in many plants including bananas (Snape
et al., 1986; Assani et al., 2003; Yahata et al., 2005; Grewal et al., 2009; Dunwell et al., 2010;
Ravi and Chan, 2010; Sanei et al., 2011). In most of the plant species the approaches used to
develop haploids have been through either culture of anthers or microspores or through wide
crosses with close relatives (Maluszynski et al., 2003; Sanei et al., 2011). In bananas, haploid
development has been achieved in only one species (M. balbisiana) through anther culture;
the success rate was however very low (Assani et al., 2003).
Despite the success with the two major methods in a number of plants, haploid development
has not been widely taken up by researchers and breeders because these methods are cultivar
and species specific and not reproducible (Ravi and Chan, 2010). An approach of replacing
53
the endogenous histone protein with altered histone protein was shown to produce inducer
lines that when crossed with wildtype cultivar produce haploids in A. thaliana (Ravi and
Chan, 2010).
The gene constructs that carried the RNAi silencing mechanism as well as the selection
marker and mutant CenH3 were inserted in the plant through Agrobacterium tumefeciens
mediated transformation (Ravi and Chan, 2010). The same approach was explored in the
current study in bananas. Experiments were conducted to develop haploid inducer lines which
will in future be used to develop haploid and doubled haploids.
4.2 MATERIALS AND METHODS
4.2.1 Plant materials, multiplication and production of multiple bud clumps
Two diploid cultivars “Zebrina GF” and “Calcutta 4” (AA genomic group) were used for
transformation experiments. The plant materials were obtained from IITA- Uganda. The
plants were multiplied by culturing in proliferation media (Table 4.1) following protocol
described by Tripathi et al. (2008). All plants in proliferation media were sub-cultured monthly
and placed in a growth room at 28 ºC with a 16 h photoperiod provided by a cool white
fluorescent tube (Philips, Amsterdam, Netherlands). Multiple bud clumps were initiated by excising
white buds (approximately 2 mm) developing at the base of plants in proliferation media. These
buds were cultured in P4 media containing high amounts of BAP (Table 4.1) and kept at 28 ºC
in the dark. Buds were sub-cultured at monthly intervals in fresh P4 medium in order to obtain
multiple bud clumps. The multiple buds were used for Agrobacterium-mediated
transformation experiments.
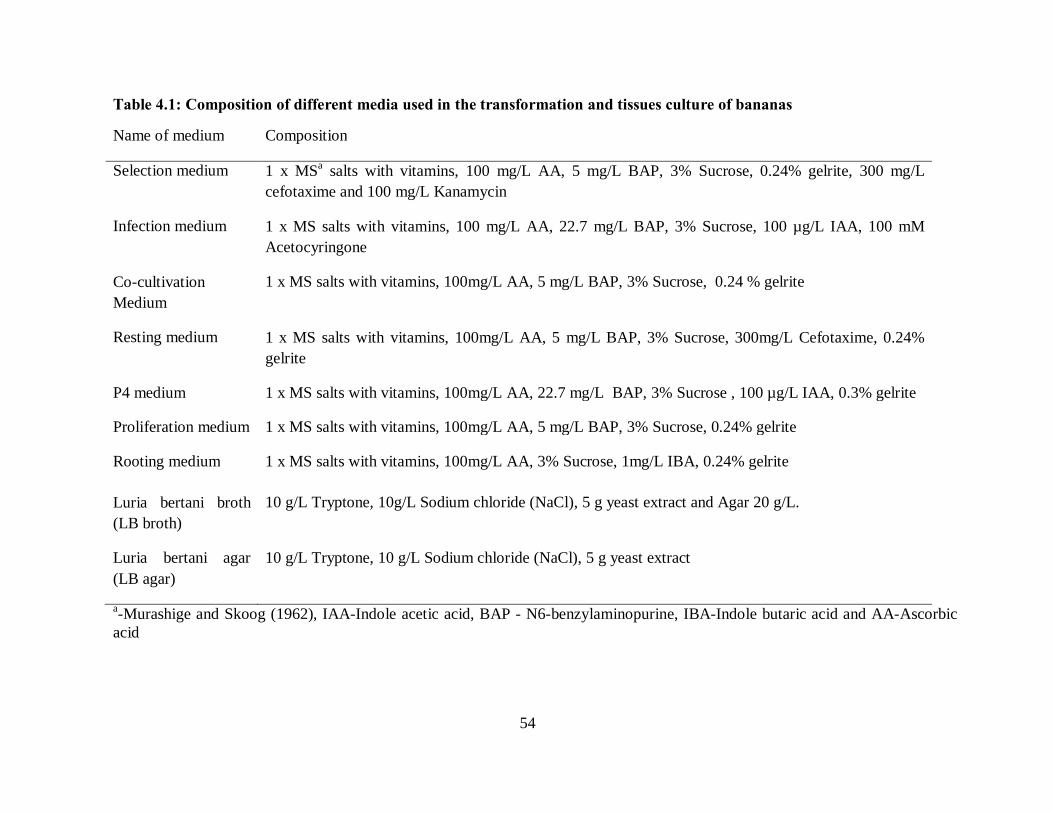
54
Table 4.1: Composition of different media used in the transformation and tissues culture of bananas
Name of medium Composition
Selection medium 1 x MSa salts with vitamins, 100 mg/L AA, 5 mg/L BAP, 3% Sucrose, 0.24% gelrite, 300 mg/L cefotaxime and 100 mg/L Kanamycin
Infection medium 1 x MS salts with vitamins, 100 mg/L AA, 22.7 mg/L BAP, 3% Sucrose, 100 µg/L IAA, 100 mM Acetocyringone
Co-cultivation Medium
1 x MS salts with vitamins, 100mg/L AA, 5 mg/L BAP, 3% Sucrose, 0.24 % gelrite
Resting medium 1 x MS salts with vitamins, 100mg/L AA, 5 mg/L BAP, 3% Sucrose, 300mg/L Cefotaxime, 0.24% gelrite
P4 medium 1 x MS salts with vitamins, 100mg/L AA, 22.7 mg/L BAP, 3% Sucrose , 100 µg/L IAA, 0.3% gelrite
Proliferation medium 1 x MS salts with vitamins, 100mg/L AA, 5 mg/L BAP, 3% Sucrose, 0.24% gelrite
Rooting medium 1 x MS salts with vitamins, 100mg/L AA, 3% Sucrose, 1mg/L IBA, 0.24% gelrite
Luria bertani broth (LB broth)
10 g/L Tryptone, 10g/L Sodium chloride (NaCl), 5 g yeast extract and Agar 20 g/L.
Luria bertani agar (LB agar)
10 g/L Tryptone, 10 g/L Sodium chloride (NaCl), 5 g yeast extract
a-Murashige and Skoog (1962), IAA-Indole acetic acid, BAP - N6-benzylaminopurine, IBA-Indole butaric acid and AA-Ascorbic acid
55
4.2.2 RNAi plasmid constructs
Plasmid constructs were obtained from the laboratory of Simon Chan, University of California
at Davis. Three different constructs with a similar structure were obtained (Figure 4.1). The
three similar components in the constructs were: the selectable marker, the mutant and
reporter genes and the RNAi component. The plant selection was based on a Kanamycin
resistance gene also decribed as neomycin phosphotransferase type II (nptII) that was driven
by Cassava mosaic virus 35S (CaMV35S) promoter and terminated by CaMV35S terminator.
The second component was the mutant and reporter gene Green Fluorescent protein (GFP)
(Figure 4.1 A, B and C).
Despite the similarity there were also differencesin two main aspects, the nature of mutant
gene and/or the presence or absence of GFP reporter gene. The construct GFP-tailswap
(Figure 4.1A) was similar to Tailswap (Figure 4.1B) in terms of the mutant genes used and
different in the absence of GFP tag in ‘tailswap’. The modified version of CenH3 replacing
the endogenous one after RNAi silencing in tailswap and GFP-tailswap was obtained by
replacing the tail end of endogenous CenH3 with that of banana histone H3.3 (Another variant
of histone 3) and retaining the histone fold domain (HFD). The construct GFP-CENH3
(Figure 4.1C) on the other hand had a mutant gene different from tailswap and GFP-tailswap.
The mutant gene in GFP-CENH3 was an endogenous CenH3 having the codon usage
modified with a total of 156 out of the 471 nucleotides. Just like the construct GFP-tailswap,
the construct GFP-CENH3 also had the reporter gene GFP tagged to the mutant CenH3. The
mutant gene and the reporter genes were both driven and terminated by the endogenous
banana CenH3 promoter and terminator. The third component in the constructs, the RNAi was
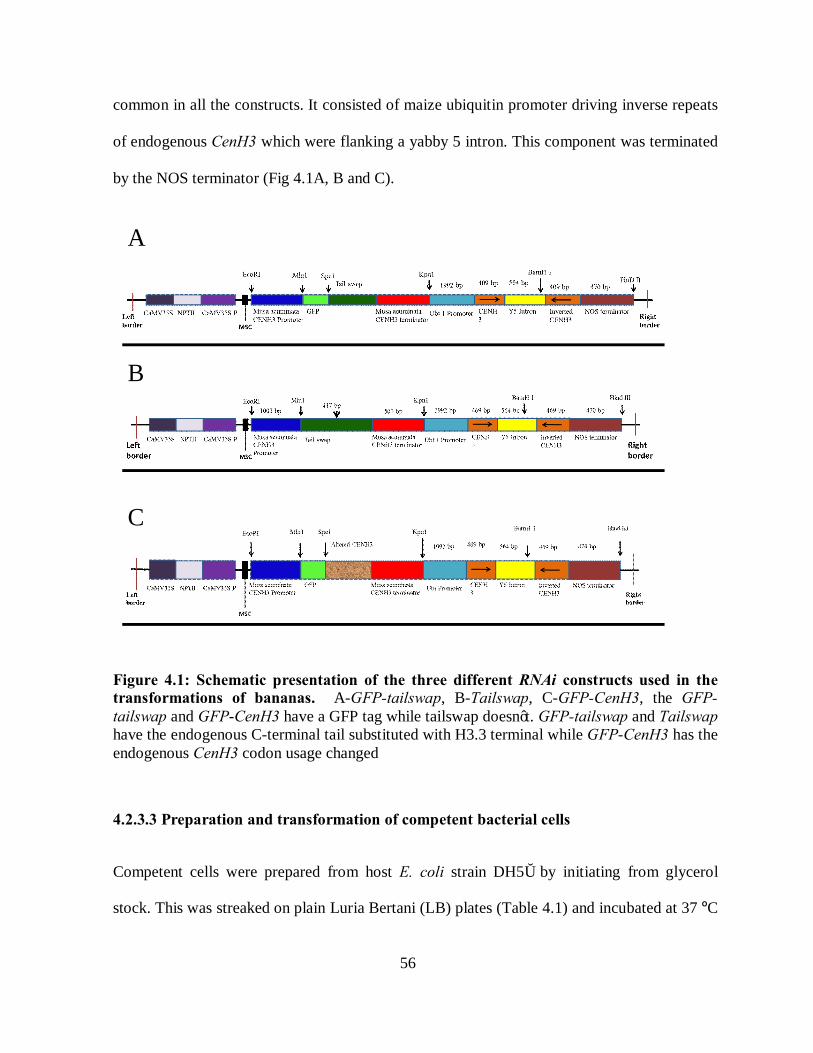
56
common in all the constructs. It consisted of maize ubiquitin promoter driving inverse repeats
of endogenous CenH3 which were flanking a yabby 5 intron. This component was terminated
by the NOS terminator (Fig 4.1A, B and C).
A
C
B
Figure 4.1: Schematic presentation of the three different RNAi constructs used in the transformations of bananas. A-GFP-tailswap, B-Tailswap, C-GFP-CenH3, the GFP-tailswap and GFP-CenH3 have a GFP tag while tailswap doesn’t. GFP-tailswap and Tailswap have the endogenous C-terminal tail substituted with H3.3 terminal while GFP-CenH3 has the endogenous CenH3 codon usage changed
4.2.3.3 Preparation and transformation of competent bacterial cells
Competent cells were prepared from host E. coli strain DH5α by initiating from glycerol
stock. This was streaked on plain Luria Bertani (LB) plates (Table 4.1) and incubated at 37 ºC
57
overnight. A single colony was cultured in 10 ml of LB broth at 37 ºC overnight. A new
culture of 500 ml was initiated with 1ml of the overnight culture and shaken at 37 ºC to an
optical density (OD) of 0.5 after 2-3 hrs. The culture was centrifuged and the pellet
resuspended in 10 ml of 100 mM MgCl and 10% glycerol (1:1) ratio. This was then
centrifuged at 3000 g in an eppendorf 5810 R centrifuge (Hamburg, Germany) for 10 min and
resuspended in 10 ml of 100 mM MgCl and 100 mM CaCl2 (1:1) ratio.
The final pellet was resuspended in 5 ml of 100 mM CaCl2 and aliquoted in 50 µl volume in
sterile 1.5 ml eppendorf® tubes and stored at -80 ºC. The competent cells were used for
transformation with the three constructs. Transformation was done through heat shock method
(Froger and Hall, 2007). The 50 µl competent cells were thawed on ice and 50ng of the
plasmid DNA added. The cells were left on ice for 10 min, they were then heat shocked at 42
ºC for 45 sec and immediately transferred into ice for 2 min. After that, 800 µl of LB broth
was added and the cells were incubated at 37 ºC for 1 hr with gentle shaking. One hundred
microliters of the transformed cells were plated on LB supplemented with 50mg/L kanamycin
and incubated at 37 ºC overnight. A single colony was cultured in 10ml LB supplemented
with 50 mg/L kanamycin and again incubated overnight at 37 ºC. The plasmid was extracted
from the cell culture using Qiagen miniprep® plasmid extraction kit (Biozek, Kenya). Plasmid
extracted from E. coli was validated (as decribed in section 4.2.3.4) and used further to
transform Agrobacterium tumefaciens.
Electro-competent cells of the A. tumefaciens strain EHA105 were prepared as described by
Gonzales et al. (2013). Fresh culture of EHA105 was started by streaking glycerol stock on
LB plate supplemented with 50 mg/L rifampicin and incubating plates at 28 ºC for 24 hrs.
58
Two day culture was initiated from a single colony grown on the plate. A 500 ml culture was
initiated from 2 ml of the 24 hrs culture and grown for 4-5 hrs to an OD of 0.5. The culture
was centrifuged and the pellet washed 4 times with 10% glycerol and resuspended in 5 ml of
10% glycerol. The suspension was aliquoted in 100 µl volume. The electro-competent cells
were transformed with 100 ng of the plasmid DNA through electroporation in a Biorad
GenePulserXcell™ (Hercules, CA) set at 2500 volts (V), 25 millifarad (µF) and 200 Ohms
(Ω). Transformed cells were plated on LB supplemented with 50 mg/L rifampicin and 50
mg/L kanamycin. A colony was picked after 2 days and cultured in LB broth supplemented
with 50 mg/L rifampicin and 50 mg/L kanamycin overnight to an OD of between 0.6-0.8. The
plasmids were also re-extracted for validation and the A. tumefaciens culture containing the
right plasmid was used to transform explants and 25% glycerol stock with 1ml aliquot stored
at -80 ºC.
4.2.3.4 Validation of plasmid constructs
Integrity of the plasmid constructs was done for both E. coli and A. tumefaciens harbouring
them. Plasmid was extracted from E. coli and A. tumefaciens using Qiagen plasmid miniprep
kit. Presence of plasmid was confirmed by running on a 1.5% agarose gel. Plasmid DNA
integrity in E. coli was validated by both restriction digest using the enzymes HindIII and
EcoRI and by PCR while those from A. tumefaciens were validated using PCR only. The
primer pairs CENH3-T-F GGTTGGCCACTGAAGATAC and Ubi-R
TTATTACGGCGGGCGAGGAAGG designed with the forward binding on the CenH3
terminator and reverse on the maize ubiquitin promoter amplifying a product size of 1184 bp
were used for validation in both E. coli and A. tumefaciens. The PCR conditions were set at
initial denaturation of 94 ºC for 4 min, 35 cycles of 94 ºC for 30 secs, annealing temperature
59
of 62 ºC for 30 secs, extension temperature of 72 ºC for 1 min, the products were finally
extended at 72 ºC for 5 min.
4.2.3.5 Preparation of Agrobacterium tumefaciens culture
Agrobacterium tumefaciens cultures of 0.6-0.8 OD harbouring the plasmids were centrifuged
at 3000 rcf for 10 min at 4 ºC to harvest cells. Harvested cells were resuspended in 10ml of
infection media (Table 4.1) supplemented with 100 µM acetosyringone. Resuspended A.
tumefaciens culture was incubated at 28 ºC for 2 hrs with gentle shaking of 150 rcf.
4.2.4 Explant preparation and genetic transformation
Intercalary meristems (IM) (Figure 4.2 A and B) and multiple bud clumps (MBC) (Figure
4.2D) were used as the explants for transformation. Preconditioned buds were immersed in A.
tumefaciens re-suspended in infection media supplemented with 100 µM acetosyringone and
vacuum infiltrated for 10 secs and further cultured for 30 min at room temperature. The
explants were blotted on sterile tissue paper to remove excess bacteria and cultured for three
days on co-cultivation media (Table 4.1) at 22 ºC in the dark. The explants were transferred to
resting media (Table 4.1) supplemented with 300 mg/L cefotaxime for 10 days and kept in
growth room at 26 ± 2 ºC and 16 hr photoperiod. The explants were transferred to selection
media (Table 4.1) supplemented with 100 mg/L kanamycin and 300 mg/L cefotaxime with
sub-culturing to fresh medium fortnightly until shoots were obtained. The developed shoots
were transferred to proliferation media (Table 4.1) for maintainance and multiplication.
Explants (IM) were obtained by cutting two thin meristematic disks approximately 0.3-0.4
mm in thickness from the meristematic region of the corm as described by Tripathi et al.
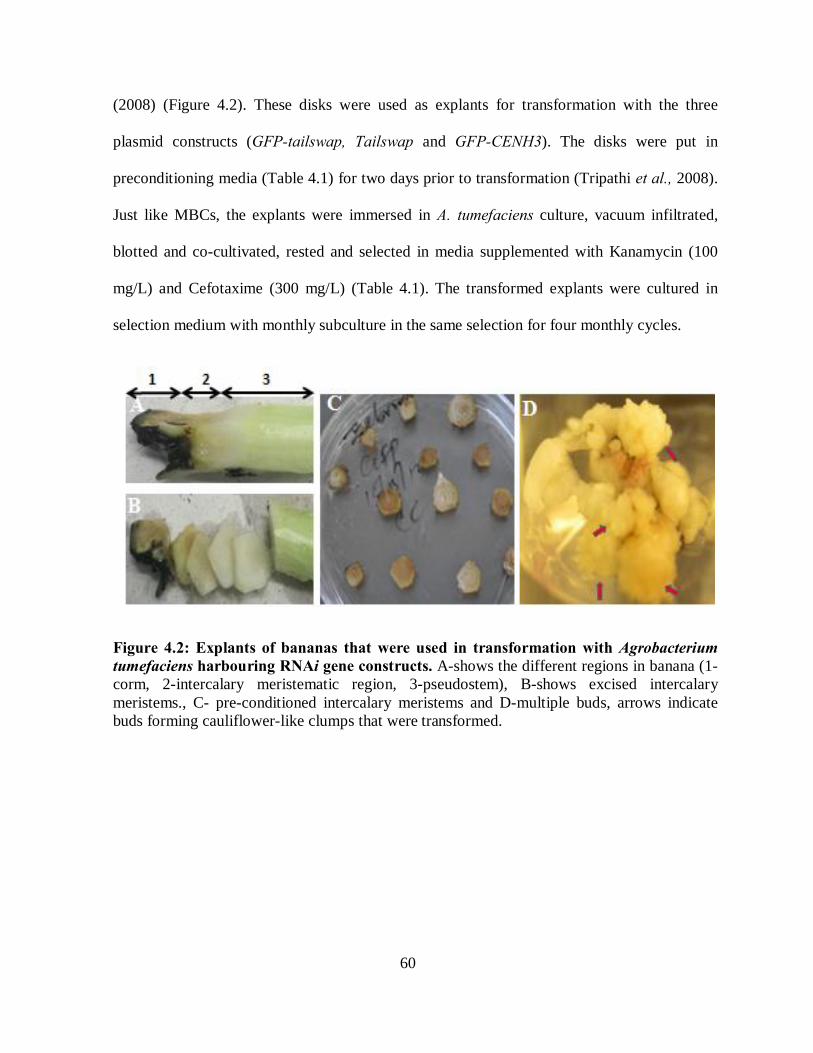
60
(2008) (Figure 4.2). These disks were used as explants for transformation with the three
plasmid constructs (GFP-tailswap, Tailswap and GFP-CENH3). The disks were put in
preconditioning media (Table 4.1) for two days prior to transformation (Tripathi et al., 2008).
Just like MBCs, the explants were immersed in A. tumefaciens culture, vacuum infiltrated,
blotted and co-cultivated, rested and selected in media supplemented with Kanamycin (100
mg/L) and Cefotaxime (300 mg/L) (Table 4.1). The transformed explants were cultured in
selection medium with monthly subculture in the same selection for four monthly cycles.
Figure 4.2: Explants of bananas that were used in transformation with Agrobacterium tumefaciens harbouring RNAi gene constructs. A-shows the different regions in banana (1-corm, 2-intercalary meristematic region, 3-pseudostem), B-shows excised intercalary meristems., C- pre-conditioned intercalary meristems and D-multiple buds, arrows indicate buds forming cauliflower-like clumps that were transformed.
61
4.2.5 Molecular analysis of transgenic plants
4.2.5.1 DNA extraction and PCR analysis of putative transgenic plants
Genomic DNA was extracted from young leaves of putative transgenic lines using Qiagen
DNAeasy® plant mini prep Kit with slight modifications to the manufacturer’s protocol.
Modification was at the washing step where 350 µl of washing buffer was used thrice instead
of twice with 500µl. Presence of transgene in plant genome was confirmed through PCR
analysis using primers spanning the mutant gene and the maize ubiquitin promoter. The
primers used were: CENH3-T-F CAGAAGGATCGGCGGCAGGAG and Ubi-R
TTATTACGGCGGGCGAGGAAGG. PCR was performed in 20 µl reactions using Qiagen
PCR kit, containing 1X of buffer, 1.5 mM MgCl, 0.4 mM dNTP containing each of the dATP,
dCTP, dGTP and dTTP. The PCR cycle had an initial denaturation step at 94 ºC for 5 min,
followed by 35 cycles of 94 ºC for 30 secs, 62 ºC for 30 secs and extension at 72 ºC for one
min. The final extension of 72 ºC was set at ten min. PCR products were separated on a 1.5%
agarose gel stained with GelRed.
4.2.5.2 RNA extraction, RT-PCR and Northern blot analysis
RNA was extracted from 100 mg of both root tips and young leaves using the Qiagen
RNAeasy® plant RNA extraction kit and guanidium thiocyyanate method (Chomczynski and
Sacchi, 2006) with a few modifications to the protocol. Modifications were at the phenol step,
where this step was replaced with an initial wash with chloroform followed by a chloform:
isoamyl alcohol (49:1) step.

62
RNA was quantified using Nanodrop® 2000 (Thermoscientific, MA, USA)
spectrophotometer and RNA concentration was adjusted to 250 ng/µl. RNA was treated with
RNAse-free DNAseI (Thermoscientific, MA, USA) and 2 µg of RNA was used for cDNA
sythesis. First strand cDNA synthesis was performed with revertaid cDNA synthesis kit
(Thermoscientific, MA, USA) with random primers. The primers CenH3_END_F
(GGCGAGAACGAAGCATC) and CenH3_END_R (TCACCAATGTCTTCTTCCTCC) were
used for PCR amplification of cDNA in ABI 9700 machine with cycling conditions set at
initial denaturation of 94 ºC for 5 min, 35 cycles of 94 ºC denaturation for 30 secs, 62 ºC
annealing for 30 secs, extension at 72 ºC for 1 min and a final extension of 72 ºC for 10 min.
The RT-PCR products were run on a 1.5% agarose gel and stained with GelRed®. The
relative intensity of the 471 bp product between the transgenic and non-transgenic plants was
used to determine the relative expression of transgenic plants to non-transgenic.
Northern blot was performed to detect accumulation of small interfering RNA (siRNA). The
analysis was performed with twelve transgenic plants (2 lines of GFP-Tailswap, 3 lines of
tailswap and 6 lines of GFP-CENH3 and 1 plant of non-transgenic). Labeled RNA probe was
synthesized by in vitro transcription of linearized DNA template which was obtained by PCR
amplification of target gene (endogenous CenH3). The plasmid DNA of GFP-Tailswap
construct was used as a CenH3 template to synthesize the RNA labelled probe. The primers
that amplified CenH3 were designed with the forward having SP6 RNA polymerase
promoter sequence and the reverse having that of T7 promoter sequence.
The primers also had part of the sequence derived from banana CenH3. The primers
used were:

63
CENH3_RNA_F:ATTTAGGTGACACTATAGGGCGAGAACGAAGCATC and the
CENH3_RNA_R: CCCTATAGTGAGTCGTATTATCACCAATGTCTTCTTCCTCC. The
conditions were set at initial denaturation of 94 ºC for 5 min, 35 cycles of 94 ºC denaturation
for 30 secs, 64 ºC annealing for 30 secs, extension at 72 ºC for 1 min and a final extension of
72 ºC for 10 mins. The PCR products were purified using Bioneer PCR purification kit and
eluted in 15 µl volume for use in RNA in vitro transcription. CenH3 RNA was labelled with
digoxigenin-11-UTP (DIG-dUTP) during transcription and this was used to probe RNA from
transgenic and non-transgenic plants. Eight microgram of RNA earlier extracted was
denatured at 65 ºC for 5 min and then placed on ice for two min before loading into the
precast urea gel. RNA was transferred to a hybond-N+ nylon membrane (GE, USA) in a
20X20 cm Semi-dry blotter unit (SCIE-PLAS, England).
The RNA was fixed on the membrane by UV cross linking twice in the auto cross link feature
in the cross linker followed by hybridization. Diogoxigenin (DIG) Easy Hyb buffer was pre-
warmed at 68 ºC and the membrane was pre-hybridized for 30 min with gentle agitation in a
glass tube. Five µl of the CenH3 RNA probe earlier transcribed was added to 1ml of DIG
Easy Hybridization buffer and denatured by heating at 95 ºC for 5 min and cooled on ice for 2
min. This was then added to 9ml of pre-warmed DIG Easy hybridization buffer and used for
hybridization. The pre-hybridization buffer was removed and 10 ml hybridization buffer
added to the glass tube containing the membrane and incubated at 51 ºC overnight in
hybridization oven.
The membrane was washed in two cycles of 5 min each with 0.1 SSC at 68 ºC with constant
agitation followed by two washes of 15 min each with 0.1 × SSC, 0.1% SDS at 68 ºC. The
membrane was then rinsed for 5 min in washing buffer (0.1 M Maleic acid, 0.15 M NaCl; pH
64
7.5 (20 ºC); 0.3% (v/v) Tween 20) and then incubated with 100 ml of blocking solution (10X
blocking solution stock diluted to 1X with maleic acid buffer (0.1 M Maleic acid, 0.15 M
NaCl2; pH adjusted to 7.5 with NaOH (pellets). The membrane was then incubated for 30 min
in 50 ml antiDIG antibody solution. Washing was done for 15 min twice in 100 ml of washing
buffer and then equilibrated for 5 min in detection buffer. The membrane was developed by
applying CDP-star ready to use until it was evenly soaked. The membrane was spread on a
development cassette and all the air bubbles removed. An X-ray film was put on top of the
membrane and the cassette tightly closed in the dark. The cassette was incubated at 37 ºC
overnight and developed in the dark.
4.2.6 Fluorescent microscopy
Localization of CENH3 in the centromere was observed through fluoresence of the GFP tag.
GFP was visualized using a fluorescence microscope (Zeiss Axioimager, Zeiss) fitted with a
100W mercury lamp. Slides were made from thin sections of root tips and directly mounted to
the slide without fixation. The tissue was stained using 4', 6-diamidino-2-phenylindole
(DAPI) which stains the nucleus blue. DAPI has an excitation wavelength of 375 nm and
absorption of 470 while GFP was observed at an excitation wavelength of 470 nm and
emission of 570 nm. Ten Z-stack images for both DAPI and GFP were combined and saved as
tiff images.
4.2.7 Transfer of plants into the field and glasshouse
Twenty seven transgenic lines (Appendix 1) were multiplied and rooted and then transferred
to pots in glasshouse. The plants were transferred into sterile soil in small pots (~5 cm
diameter) and kept in a humid chamber for one month for acclimatization. The plants were
65
then transferred to medium size pots (~20 cm diameter) and kept for 4 months before
transferring to big pots (1 m diameter) where they were grown to flowering. In all these
stages, the plants were watered regularly. Non-transgenic plants were multiplied in
Proliferation medium rooted in rooting medium and acclimitazed in sterile soil then planted in
the field at International Livestock Research Institute (ILRI) Nairobi, Kenya. The plants were
planted in holes with a diameter of 3 feet and a similar depth (3 feet) with spacing of 3x3
meters.
4.2.8 Data collection and statistical analysis
Transformation efficiencies were calculated by dividing the number of PCR positive lines
with the the initial number of explants used for transformation multiplied by 100. Statistical
analysis was performed on the number of PCR positive lines obtained, number of leaves and
pseudostem base diameter for transgenic plants in the glasshouse and control plants. Analysis
for the experiments in which MBCs were used as the transformation explants was performed
independently. Experiment number five was omitted since it used IM as the explants and
could not be compared with those that used different explants. To check whether the construct
type had an effect on the number of putatively transformed events, a one way analysis of
variance (ANOVA) was conducted.
Agronomic data was collected for two major traits, the basal diameter of the pseudostem and
the number of functional leaves. The pseudostem basal width of 5 representative lines per
construct and for the control was collected. Data was collected 6 months after establishment of
plants in the glass house. Two-way ANOVA with replication was used in the analysis; the
66
interaction between the constructs for each of the traits was checked. All statistical analyses
were performed in excel 2007 (Microsoft corporation, Redmont, WA, USA).
4.3 RESULTS
4.3.1 Plant multiplication and production of multiple bud clumps
Plants obtained from Uganda were successfully multiplied in tissue culture through
micropropagation. The cultivar ‘Zebrina GF’ was observed to be more proliferative than
‘Calcutta 4’. Each explant of ‘Zebrina GF’ produced on average 4-5 shoot buds while
‘Calcutta 4’ had 1-3 shoot buds in 4 weeks after sub-culturing. The shoot buds of both
cultivars cultured in P4 media multiplied to form cauliflower-like structures in about 7 months
and 16 months in ‘Zebrina GF’ and ‘Calcutta 4’, respectively.
4.3.2 Transformation of E.coli and A.tumefeciens cells and validation of plasmid
constructs
Transformation and consequent plating of both E. coli and A. tumefaciens in LB agar
containing the respective antibiotics resulted in individual colonies (Fig 4.3A and B). On
digestion of the extracted plasmids with HindIII and EcoRI two clear bands of the expected
sizes were obtained and the sizes of the digested fragments were variable depending on the
constructs. The fragment sizes obtained were 8742 and 6604 bp for GFP-tailswap plasmid,
8742 and 5883 for Tailswap plasmid and 8742 and 6658 bp for GFP-CENH3 plasmid (Figure
4.3C). All the plasmids extracted from A. tumefaciens were positive on PCR amplification
(Figure 4.3D) with an expected fragment sizes of ~830 bp.
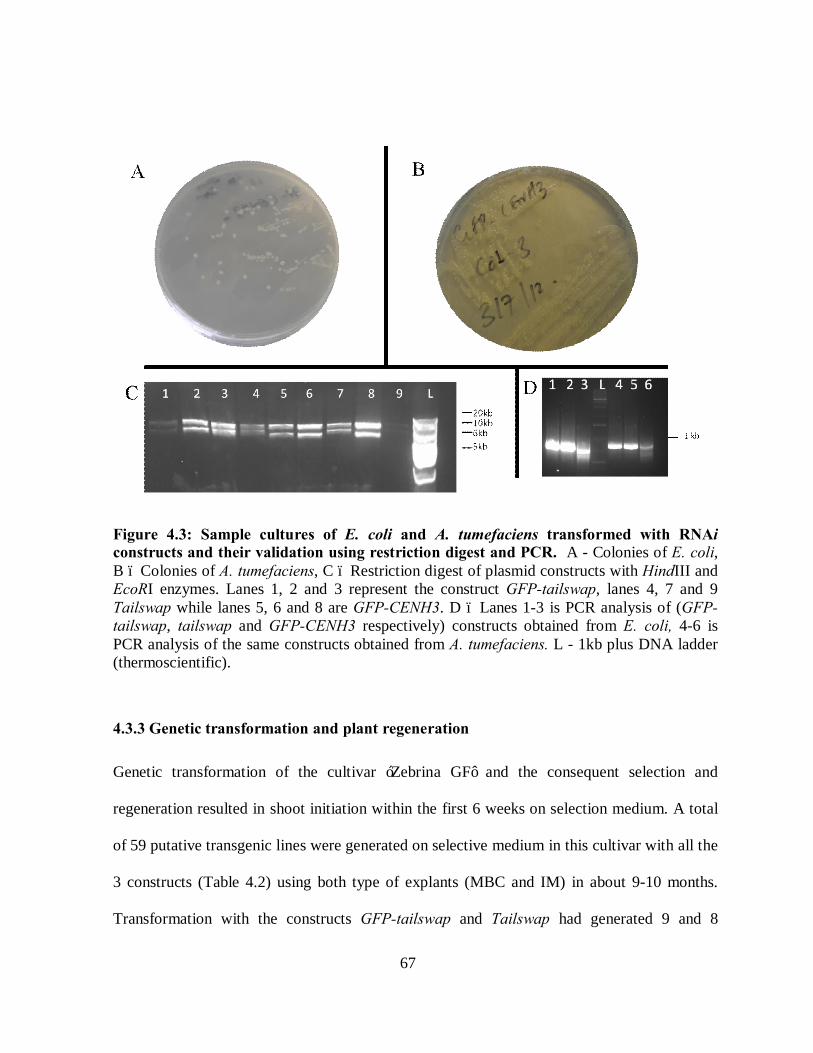
67
Figure 4.3: Sample cultures of E. coli and A. tumefaciens transformed with RNAi constructs and their validation using restriction digest and PCR. A - Colonies of E. coli, B – Colonies of A. tumefaciens, C – Restriction digest of plasmid constructs with HindIII and EcoRI enzymes. Lanes 1, 2 and 3 represent the construct GFP-tailswap, lanes 4, 7 and 9 Tailswap while lanes 5, 6 and 8 are GFP-CENH3. D – Lanes 1-3 is PCR analysis of (GFP-tailswap, tailswap and GFP-CENH3 respectively) constructs obtained from E. coli, 4-6 is PCR analysis of the same constructs obtained from A. tumefaciens. L - 1kb plus DNA ladder (thermoscientific).
4.3.3 Genetic transformation and plant regeneration
Genetic transformation of the cultivar ‘Zebrina GF’ and the consequent selection and
regeneration resulted in shoot initiation within the first 6 weeks on selection medium. A total
of 59 putative transgenic lines were generated on selective medium in this cultivar with all the
3 constructs (Table 4.2) using both type of explants (MBC and IM) in about 9-10 months.
Transformation with the constructs GFP-tailswap and Tailswap had generated 9 and 8
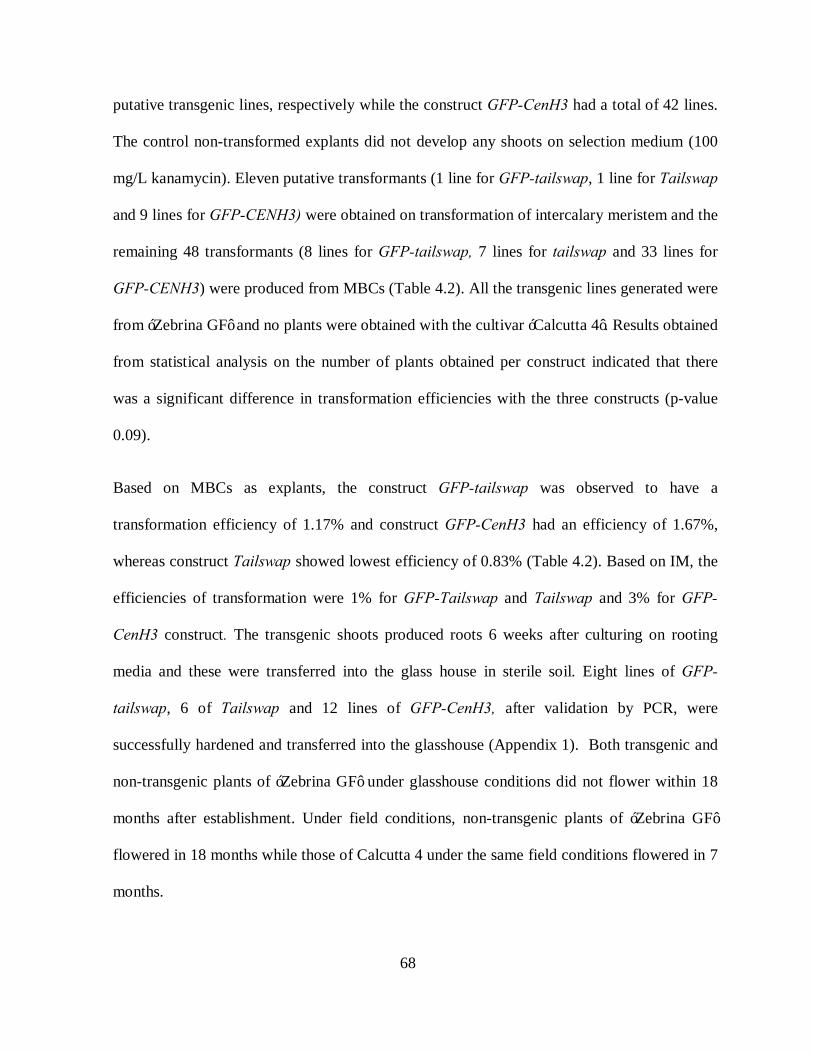
68
putative transgenic lines, respectively while the construct GFP-CenH3 had a total of 42 lines.
The control non-transformed explants did not develop any shoots on selection medium (100
mg/L kanamycin). Eleven putative transformants (1 line for GFP-tailswap, 1 line for Tailswap
and 9 lines for GFP-CENH3) were obtained on transformation of intercalary meristem and the
remaining 48 transformants (8 lines for GFP-tailswap, 7 lines for tailswap and 33 lines for
GFP-CENH3) were produced from MBCs (Table 4.2). All the transgenic lines generated were
from ‘Zebrina GF’ and no plants were obtained with the cultivar ‘Calcutta 4’. Results obtained
from statistical analysis on the number of plants obtained per construct indicated that there
was a significant difference in transformation efficiencies with the three constructs (p-value
0.09).
Based on MBCs as explants, the construct GFP-tailswap was observed to have a
transformation efficiency of 1.17% and construct GFP-CenH3 had an efficiency of 1.67%,
whereas construct Tailswap showed lowest efficiency of 0.83% (Table 4.2). Based on IM, the
efficiencies of transformation were 1% for GFP-Tailswap and Tailswap and 3% for GFP-
CenH3 construct. The transgenic shoots produced roots 6 weeks after culturing on rooting
media and these were transferred into the glass house in sterile soil. Eight lines of GFP-
tailswap, 6 of Tailswap and 12 lines of GFP-CenH3, after validation by PCR, were
successfully hardened and transferred into the glasshouse (Appendix 1). Both transgenic and
non-transgenic plants of ‘Zebrina GF’ under glasshouse conditions did not flower within 18
months after establishment. Under field conditions, non-transgenic plants of ‘Zebrina GF’
flowered in 18 months while those of Calcutta 4 under the same field conditions flowered in 7
months.

69
Table 4.2: Transformation efficiencies of banana cv. ‘Zebrina GF’ with different RNAi constructs using multiple bud clamps (MBCs) and intercalary meristems (IM) as the explants.
Construct Total number of explants transformed
Putative transgenic lines generated
PCR positive lines
Flourescent positive lines (±SE)
Transformation efficiency* %
IM MBC IM MBC IM MBC IM MBC IM MBC
GFP_Tailswap 100 600 1 8 1 7 1±0.01 7±0.72 1 1.17
Tailswap 100 600 1 7 1 5 NA NA 1 0.83
GFP_CENH3 100 600 9 33 3 10 3±0.54 9±0.68 3 1.67
* Transformation efficiency was calculated as no. of transgenic lines generated (PCR confirmed)/ total number of explants transformed x 100.
IM – Intercalary meristem
MBCs – multiple bud clumps

70
4.3.4 PCR analysis of putative transgenic plants
The expected band size of 500bp was obtained in PCR analysis using primer pair overlapping
modified CenH3 and maize ubiquitin promoter (Fig 4.4A, B andC). All the 59 putative
transgenic lines were tested by PCR analysis and 27 lines were found to be positive amplifying
expected size of fragment (Table 4.2). Analysis resulted in 8 PCR positives for the GFP-tailswap
lines (Figure 4.4 A lanes 1-8), 6 PCR positives of the Tailswap lines (Figure 4.4B lanes 2 and 4-
8) and 13 PCR positives of the GFP-CenH3 lines (Figure 4.4C lanes 2, 5-8, 12, 17, 21, 31, 34
and 35). There was no amplification observed in the non-transgenic control plants.
Figure 4.4: PCR analysis of the transgenic lines obtained from transformation of diploid banana ‘Zebrina GF’ with the three RNAi constructs. A-GFP-tailswap lines, B-tailswap lines, C-GFP-CENH3 lines, ‘+’ plasmid positive control, ‘- non-transgenic control and L-1kb plus fermentas ladder. All numbers indicated the transgenic lines for the respective construct.
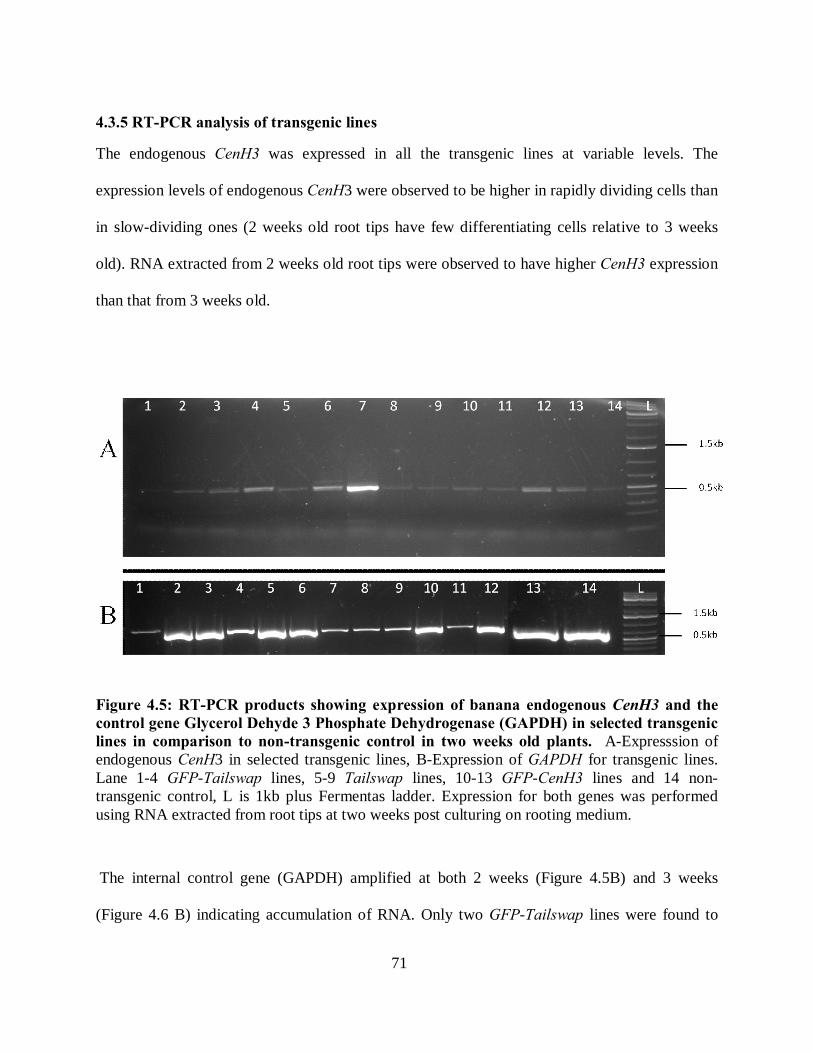
71
4.3.5 RT-PCR analysis of transgenic lines
The endogenous CenH3 was expressed in all the transgenic lines at variable levels. The
expression levels of endogenous CenH3 were observed to be higher in rapidly dividing cells than
in slow-dividing ones (2 weeks old root tips have few differentiating cells relative to 3 weeks
old). RNA extracted from 2 weeks old root tips were observed to have higher CenH3 expression
than that from 3 weeks old.
Figure 4.5: RT-PCR products showing expression of banana endogenous CenH3 and the control gene Glycerol Dehyde 3 Phosphate Dehydrogenase (GAPDH) in selected transgenic lines in comparison to non-transgenic control in two weeks old plants. A-Expresssion of endogenous CenH3 in selected transgenic lines, B-Expression of GAPDH for transgenic lines. Lane 1-4 GFP-Tailswap lines, 5-9 Tailswap lines, 10-13 GFP-CenH3 lines and 14 non-transgenic control, L is 1kb plus Fermentas ladder. Expression for both genes was performed using RNA extracted from root tips at two weeks post culturing on rooting medium.
The internal control gene (GAPDH) amplified at both 2 weeks (Figure 4.5B) and 3 weeks
(Figure 4.6 B) indicating accumulation of RNA. Only two GFP-Tailswap lines were found to

72
have high levels of silencing (Figure 4.5A lanes 1and 5). For Tailswap, two lines were observed
to have high levels of CenH3 (Figure 4.5 A lanes 8 and 9) silencing while 4 GFP-CenH3 lines
were found to have high silencing (Figure 4.5A lanes 10, 11, 13 and 14). The internal control
was used to make sure that any failure to amplify was not a resultant of RNA preparation
(Figures 4.5B and 4.6B).
Figure 4.6: RT-PCR products for CenH3 and GAPDH showing expression in 3 weeks old plants. A – No CenH3 expression was observed in roots at 3 weeks. B-Expression of the GAPDH internal control gene was observed at 3 weeks. Lanes 1-12 are transgenic lines, with four lines per construct for GFP-Tailswap, Tailswap and GFP-CenH3 respectively, lane 13 is the non-transgenic while L is 1kb plus fermentas ladder.

73
4.3.6 Northern blot analysis
Analysis of plants for siRNA accumulation indicated variable levels of silencing. There were
transgenic plants that had high levels of siRNA while others indicated lower levels of
accumulation. No siRNA accumulation was observed in the non transgenic plants (Figure 4.7).
The siRNA accumulation was observed to correlate positively with CenH3 silencing observed in
RT-PCR. Lines that had higher levels of CenH3 silencing were observed to have higher levels of
siRNA accumulation. The GFP-CENH3 lines 8, 10 and 11 were observed to have high siRNA
accumulation (they equally had higher CenH3 silencing Figure 4.5A lanes 9, 11 and 14).
Figure 4.7: Northern blot analysis of randomly selected transgenic lines and non-transgenic plant showing accumulation of siRNAs. WT is the wild type (Non-transgenic plant), 1 – 11 are transgenic lines. Lanes 1 and 2 indicate lower siRNA accumulation relative to other transgenic lines in lanes 3-11.
4.3.7 Fluorescent microscopy
Fluorescent microscopy resulted in clear expression of GFP for the two constructs GFP-
Tailswap and GFP-CenH3 that had a GFP tag (Figure 4.8 A and B). Green spots representing
GFP expression were observed in the nucleus and this was clearly visible at 100X oil immersion
magnification. Variable intensities of fluorescence were observed depending on the age at which
the roots were excised with 2 weeks old roots having high intensities. The counter stain DAPI
was observed to stain the nucleus blue, this was observed in both contol non-transgenic (Figure
74
4.8 C) lines and transgenic lines (Figure 4.8D). No green spots were visible in non-transgenic at
the GFP-channel (Figure 4.8E).
Figure 4.8: Fluorescent microscopy of transgenic plants having a green fluorescent protein (GFP) and control non-transgenic lines. A –GFP-Tailswap line taken at the GFP Chanel indicating the cenH3 localization (green dots), B –GFP-CenH3 root tip taken at GFP Chanel showing CENH3 flourescence, C – DAPI Chanel showing fluorescence of the nucleus in non-transgenic plant, D – transgenic plant at the DAPI chanel showing the blue spots in the nucleus and E – GFP – chanel for non-transgenic plant without the GFP spots in the nucleus.
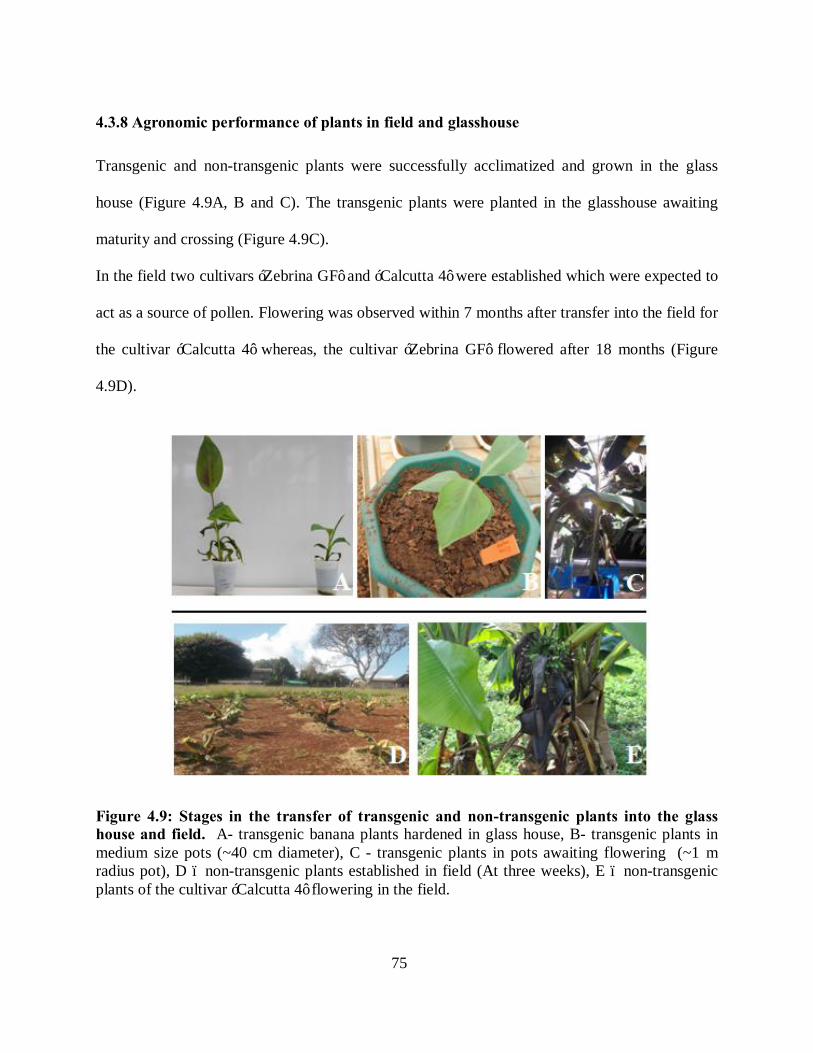
75
4.3.8 Agronomic performance of plants in field and glasshouse
Transgenic and non-transgenic plants were successfully acclimatized and grown in the glass
house (Figure 4.9A, B and C). The transgenic plants were planted in the glasshouse awaiting
maturity and crossing (Figure 4.9C).
In the field two cultivars ‘Zebrina GF’ and ‘Calcutta 4’ were established which were expected to
act as a source of pollen. Flowering was observed within 7 months after transfer into the field for
the cultivar ‘Calcutta 4’ whereas, the cultivar ‘Zebrina GF’ flowered after 18 months (Figure
4.9D).
Figure 4.9: Stages in the transfer of transgenic and non-transgenic plants into the glass house and field. A- transgenic banana plants hardened in glass house, B- transgenic plants in medium size pots (~40 cm diameter), C - transgenic plants in pots awaiting flowering (~1 m radius pot), D – non-transgenic plants established in field (At three weeks), E – non-transgenic plants of the cultivar ‘Calcutta 4’ flowering in the field.
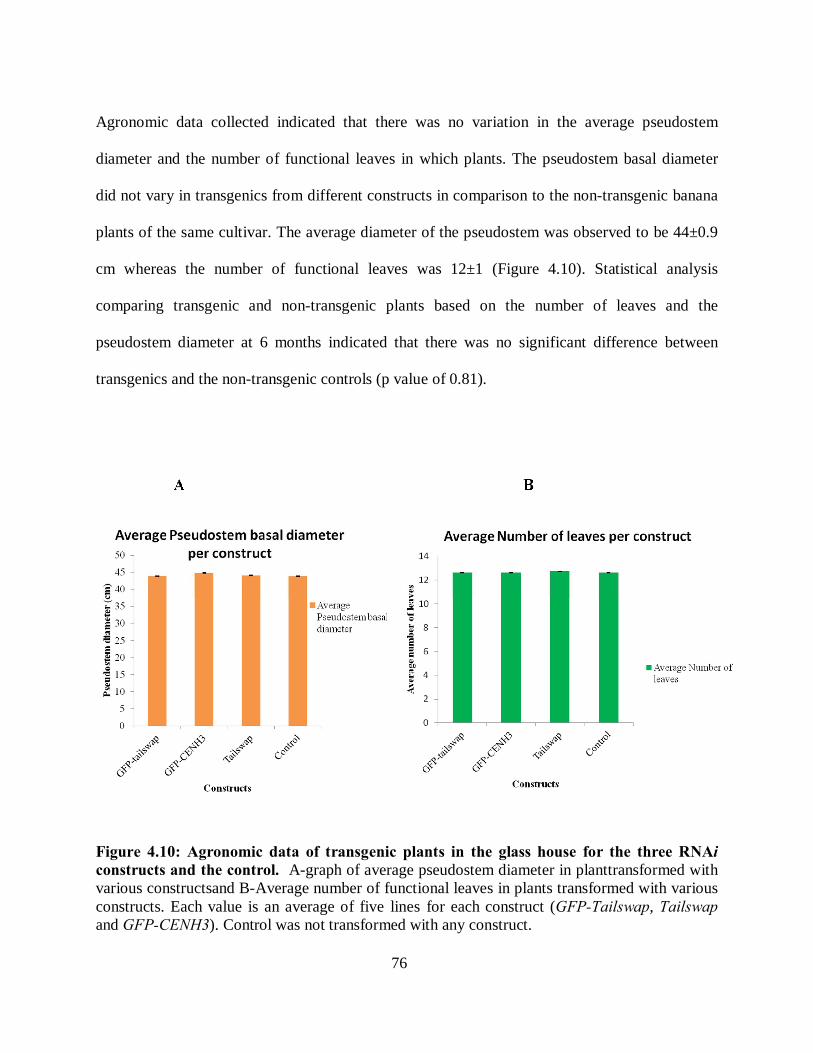
76
Agronomic data collected indicated that there was no variation in the average pseudostem
diameter and the number of functional leaves in which plants. The pseudostem basal diameter
did not vary in transgenics from different constructs in comparison to the non-transgenic banana
plants of the same cultivar. The average diameter of the pseudostem was observed to be 44±0.9
cm whereas the number of functional leaves was 12±1 (Figure 4.10). Statistical analysis
comparing transgenic and non-transgenic plants based on the number of leaves and the
pseudostem diameter at 6 months indicated that there was no significant difference between
transgenics and the non-transgenic controls (p value of 0.81).
Figure 4.10: Agronomic data of transgenic plants in the glass house for the three RNAi constructs and the control. A-graph of average pseudostem diameter in planttransformed with various constructsand B-Average number of functional leaves in plants transformed with various constructs. Each value is an average of five lines for each construct (GFP-Tailswap, Tailswap and GFP-CENH3). Control was not transformed with any construct.
77
4.4 DISCUSSION
In this study, putative haploid inducer lines were successfully developed in the banana cultivar
‘Zebrina GF’. The study could not develop transgenic lines for the cultivar ‘Calcutta 4’ because
this cultivar was unable to regenerate after transformation using the conditions that were used for
cultivar ‘Zebrina GF’. However, non-transformed plants of the cultivar Calcutta 4 were
successfully regenerated and established in the field. The inability of transgenic plants to
regenerate after transformation can be explained by effect of different factors. These factors
included response to different media, the A. tumefaciens strain, co-cultivation time, antibiotic and
acetosyringone concentrations and the OD of the A. tumefaciens since these factors have been
shown to cause low regeneration efficiency in different plants mainly due to necrosis induction
(Magdum, 2013). Moreover, this was a different cultivar which means that genotypic differences
may have played a role in low transformation success in Calcutta 4. Furthermore, time
constraints could not allow for protocol optimization for this cultivar but this is part of ongoing
and future work.
The efficiency of transformation obtained in the cultivar ‘Zebrina GF’ is relatively lower
compared to efficiencies of about 10% observed in other cultivars that have been transformed
using multiple bud clumps (Tripathi et al. 2008) and intercalary meristems (4.3-51.6%)
depending on the A. tumefaciens strain (Yip et al., 2011). The lower efficiency in transformation
can be attributed to the cultivar ‘Zebrina GF’ being a wild diploid unlike other edible cultivated
triploids used in Tripathi et a.l (2008) and in Yip et al. (2011). Intercalary and apical meristems
are multicellular organized tissues and the transformation efficiencies are bound to be lower than
if embryogenic parts were used (Tripathi et al. 2008). Use of organized tissues as explants has
78
however been used in plants including bananas although the efficiency of transformation has
always been observed to be low (Arvanitoyannis et al., 2008; Tripathi et al., 2008).
Silencing of endogenous CenH3 checked by RT-PCR and siRNA indicated variable levels of
silencing with only few lines showing high level of silencing. None of the transgenic lines from
any of the three constructs was observed to have 100% level of silencing. This observation is in
line with other studies that have observed that RNAi as a a technique does not always result in
100% silencing (Buehler et al., 2012; Marine et al., 2012). In Arabidopsis thaliana plants co-
expressing wild type and endogenous CenH3 were observed not to induce haploidy (Ravi and
Chan, 2010). The effect of partial silencing of endogenous CenH3 on haploid induction in this
study will only be known after crosses are done.
CENH3 has been shown to be loaded into the centromere during specific stages of the cell cycle
(Lermontova et al., 2006, Lermontova et al., 2011; Lermontova et al., 2013; Ravi et al., 2011;
Schubert et al., 2014). In this study, CenH3 was observed to be expressed in the root tips two
weeks post culture in rooting media when the roots have just emerged. However, this study did
not elucidate the cell cycle stage at which CenH3 is highly expressed but the general observation
indicates that CenH3 in bananas is loaded during active cell division.
The observation that the transgenic plants were not different to the non-transgenic based on
agronomic traits is in line with observations made in Arabidopsis (Ravi and Chan, 2010;
Seymour et al., 2012). Furthermore, no differences in agronomic traits were observed in lines
developed from the different constructs and this is an indication that the constructs did not have
an effect on general growth of the plants.
79
CHAPTER FIVE
EXPRESSION OF CenH3 ALLELE AND SPLICE VARIANTS IN CULTIVATED TRIPLOID AND WILD DIPLOID BANANAS
5.1 INTRODUCTION
Centromeres play a role as the sites where a complex of proteins called kinetochore assemble,
these in turn connect chromosomes to the spindle fibres which serve to segregate them during
meiosis and mitosis (Sanei et al., 2011). The structure and size of centromeres differ in different
species in spite of having a common function (Talbert et al., 2004). Centromeres in both plants
and animals are quite complex. They generally contain arrays of megabases of rapidly evolving
tandemly repeated sequences (Gent et al., 2011; Verdaasdonk and Bloom, 2011). The high rate
of evolution in these repeats is remarkable given the fact that centromere function is highly
conserved. However, the role played by centromeric repeats is a subject of debate with different
propositions put forth, the main one being that they maintain the large heterochromatin domains
(Black and Cleveland, 2011; Malik and Henikoff, 2009). Despite this, the general agreement is
that centromeres are determined and maintained epigenetically not genetically (Dawe and
Henikoff, 2006; Ekwall, 2007; Fachinetti et al., 2013). The epigenetic mark in centromeres is
characterized by the presence of centromeric nucleosome, defined as nucleosomes that replace
conventional H3 with CENH3. The protein CENH3 has been described as centromere protein A
(CENP-A) in Human and CID in drosophila (Malik and Henikoff, 2001; Allshire and Karpen,
2008) and has been shown to contain a highly variable tail and a relatively conserved HFD (Ravi
et al., 2010; Lermontova et al., 2014). Diploid plant species including Arabidopsis, rice, pea and
80
maize have been shown to encode a single CenH3 gene (Talbert et al., 2002; Zhong et al.,
2002b; Nagaki et al., 2004; Neumann et al., 2012;).
Polyploidization brings two or more genomes together and thus two different gene copies in the
same background. Polyploidization can result in additive or non-additive gene expression which
may lead in homeologs expression bias ( Pignatta and Comai, 2009; Hui et al., 2010; Rapp et
al., 2010; Yoo et al., 2013). Unlike many diploids where single copy CenH3 gene is encoded,
multiple copies have been observed in newly synthesized allopolyploids in rice, brassica and in
pea (Hirsch et al., 2009; Hui et al., 2010; Neumann et al., 2012; Wang et al., 2011). CenH3
variants have also been characterized in wild and cultivated carrots (Dunemann et al., 2014) and
in different stable polyploids c. Multiple CenH3s are not a preserve of polyploids, the diploid
species Hordeum vulgare and H. bulbosum for example were found to encode two copies each
(Sanei et al., 2011).
Stable hybrids from crosses of parents encoding multiple CenH3 transcripts have been obtained
(Sanei et al., 2011). In stable H. vulgare x H.bulbosum and H. bulbosum x Triticum aestivum
combinations, all variants of H. vulgare and only one variant (HvαCENH3) of H.bulbosum were
observed to incorporate into the centromeres of H.bulbosum and T. aestivum, respectively (Sanei
et al., 2011). Observations in newly synthesized allopolyploids Oryza was that CenH3 copies
from parents were expressed and loaded into centromere (Hui et al., 2010). Bananas are either
allo- or autotriploids and because two supposedly divergent sets of CenH3 are assembled into the
same nucleus, it would therefore be fascinating to understand their dynamics in the stable
triploids.
81
Unlike stable hybrids, embryos of crosses from unstable combinations have been observed to
undergo uniparental genome elimination resulting in haploids (Maheshwari et al., 2015; Ravi
and Chan, 2010; Sanei et al., 2011; Seymour et al., 2012). The genome of H. bulbosum in
embryos of H. vulgare x H. bulbosum crosses was completely lost in 5-9 days post fertilization
(Sanei et al., 2011). Ravi and Chan (2010) had a similar observation in A. thaliana where
uniparental elimination of the mutant ‘haploid inducer’ genome (Parent with modified CenH3)
was achieved in the offspring of crosses with non-mutants. The modification of CenH3 in this
case was by replacing the tail with that of variant H3.3 and tagging it with GFP. This technology
is currently being tried in bananas and cassava (Comai, 2014). A recent study clearly attest that
crosses of plants carrying natural CENH3 variants to wild type result to genome elimination
(Maheshwari et al., 2015). The study crossed parents in which CENH3 variants from
evolutionarily diverse plants had complemented a CENH null mutant A. thaliana Col-1
background with wild type. Apart from obtaining haploids in these crosses, novel genetic
rearrangements were observed (Maheshwari et al., 2015). A clear understanding of CENH3 in
cultivated crops is essential if breeding tools like the haploid technology is to be effectively
transferred. In the current study the expression of CenH3 was evaluated in cultivated triploid and
wild diploid banana cultivars. The existence of CenH3 alleles or splice variants, their
evolutionary relationship and whether there is bias in their expression levels was also evaluated.

82
5.2 MATERIALS AND METHODS
5.2.1. Plant materials
Five cultivars collected from IITA were used in the current study, AA genomic group diploids
‘Zebrina GF’ and ‘Calcutta 4’, allotriploids Sukali ndiizi’ (AAB) and ‘Kayinja’ (AAB) and the
autotriploid cultivar ‘Gros michel’ (AAA).
5.2.2. In silico analysis
Putative genomic CenH3 sequence from the cultivar Doubled Haploid (DH) Pahang was kindly
provided by the Musa genome consortium (to Dr. Jim Lorenzen). Through, in silico analysis five
CenH3 exons were identified and based on these, the CenH3 coding sequence (CDS) was
deciphered. The forward and reverse primers were designed from the beginning of the first exon
and last exon respectively. The primer pair: CENH3_END_F (GGCGAGAACGAAGCATC)
and CENH3_END_R (TCACCAATGTCTTCTTCCTCC) were used in this study.
5.2.3. RNA extraction and cDNA synthesis
RNA was extracted from 100 mg young cigar-like leaf collected from tissue cultured banana
plants using RNAeasy® plant Mini kit (Hilden, Germany) as per the manufacturer’s protocol
except for the elution volume which was reduced to 40 µl, this was to increase on the RNA
concentration. The RNA was treated with thermoscientific DNAseI by incubation at 37 ºC for
thirty min and the reaction terminated by addition of 1 mM EDTA and heating at 70 ºC for 5
min. RNA was quantified using a thermoscientific NanoDrop™ 2000 (MA, USA)
spectrophotometer. First strand cDNA synthesis was performed with 1µg DNA-free RNA using
the maxima first strand cDNA (Thermoscientific) synthesis with random primers. The cDNA
83
synthesis was done in an ABI 9700 series PCR machine at 25 ºC for 5 min followed by 42 ºC for
60 min.
5.2.4 Cloning and sequencing of CenH3 genes
The CenH3 transcripts from all the cultivars used in the study were PCR amplified with cDNA
as the template. PCR was done using Qiagen PCR kit in a 20µl PCR reaction volume containing:
1 µl of cDNA, 1x reaction buffer containing 2.5 mM MgCl2, 500 µM of each dNTP, 10
picomole each of forward and reverse banana CenH3 primers and 1unit of Taq DNA
polymerase. PCR was performed in an ABI 9700 PCR machine with the cycling conditions set
at initial denaturation of 95 ºC for 4 min, 35 cycles of denaturation at 95 ºC for 30 secs,
annealing of 64 ºC for 30 secs and extension of 72 ºC for 45 secs and a final extension of 72 ºC
for 10 min. The amplified products were run in a 1.5% agarose gel stained with gel red. PCR
reactions were cleaned using Bioneer PCR purification kit (Daeongeon, South Korea) and cloned
into PJet 1.2 cloning vector (Thermiscientific). To obtain all haplotypes for each of the five
accessions, between two and six clones were sequenced (Table 5.1). Amplicons <200bp were
considered as artifacts and therefore removed from the analysis. Sequencing reactions were done
using Bigdye terminator version 3.1 and sequencing performed in ABI 3130 automatic analyzer
(Applied biosystems). To ensure certainty of a sequence, each of the clones was sequenced from
each direction thrice.
5.2.5 Sequence assembly, alignments and phylogenetic analysis
Sequences obtained from each clone (Forward and reverse) were assembled in Geneious version
7.2 (Biomatter, NZ) of Kearse et al., (2012) and the sequence chromatograms checked manually
for authenticity. Sequences that had quality below 50% across the entire sequence length were

84
discarded. Sequences from clones of the same cultivar were assembled and clones that resulted
in different assembly contigs were noted. The number of times a unique transcript was observed
per cultivar was noted and this was used in calculating the transcript (variant) expression bias
which was considered the ratio of that transcript to the total number of transcripts observed per
cultivar. Consensus sequences were obtained from each of the contigs and were considered as
the representative transcript.
To check allele variants within a cultivar, transcripts from that cultivar were aligned and checked
for polymorphisms. To check for alternate splicing, each of the transcript sequence was aligned
to the genomic sequence (cultivar ‘DH Pahang’ genomic sequence) that had been used in
designing primers. Based on this alignment, different types of alternate splicing could then be
observed. To check for evolutionary relationship of banana CenH3 relative to other monocots
and dicot species, protein translated banana sequences were aligned to CENH3 protein sequences
from other monocots and dicots from the genebank release 204.0. All alignments were
performed in clustalW as implemented in geneious version 7.2. Phylogenetic trees comparing
CENH3 protein sequences from different species were drawn in MEGA 6.0 (Tamura et al.,
2013).
5.2.4 Analysis of evolutionary relationships in CenH3 sequences
The exon/intron structures were identified by aligning each of the cDNA sequences obtained to
the genomic sequence. The structure obtained in each transcript was recorded and the same
sequence aligned to others of the same structure to check differences between transcripts sharing
the same structure. All alignments were performed in MUSCLE as implemented in Geneious
version 7.1 using the default parameters.
85
The rates of Synonymous (Ks) and nonsynonymous (Ka) substitutions were estimated in the
software DNAsp version 5.3. Average Ka/Ks values for a cultivar and exon/intron structure
group were obtained by computing the ratios of average Ka and Ks in all pairwise alignment of
transcripts for a cultivar and for all possible alignments of transcripts with a given structure.
5.2.4 Protein structure modeling
Secondary protein structures were predicted by modeling with the program RaptorX, which
aligns query protein with proteins of known structural information and statistically determines
the most probable. All the transcripts obtained in this study were used in protein structure
prediction.
5.3 RESULTS
5.3.1 cDNA sequences of CenH3 in wild diploid and cultivated triploid bananas
A total of 26 CenH3 clones for all cultivars were obtained, this was excluding those that had
transcripts lengths <200 bp which were excluded from the study since they were considered
artifacts. All sequences from the diploid cultivar ‘Calcutta 4’ were only aligning partially either
at the first and last exons similar to the transcript ‘Kayinja’ clone A and these were also excluded
from the analysis. The transcript ‘Sukali ndiizi’ clone D (650 bp) was also omitted from the
analysis as it was not aligning to the other transcripts even in the histone fold domain.
Sequences obtained had transcripts of different lengths and this was observed across all the
cultivars, the 3 major lengths were: 471 bp and 503 bp both representing 25% of the transcripts
obtained and 504 bp long sequence representing 40%. Other transcripts lengths obtained were
474, 477, 591, and 760 bp each representing 5% (Table 5.1).

86
Table 5.1: Cultivars used and clones obtained in the analysis of CenH3 expression in bananas.
Cultivar Genomic composition Clone number *CDS length
Gene bank accesion numbers
Sukali ndizi AAB E 471 KP878239
Sukali ndizi AAB C 471 KP878236
Sukali ndizi AAB B 471 KP878238
Sukali ndizi AAB G 471 KP878221
Zebrina GF AA D 474 KP878237
Sukali ndizi AAB F 477 KP878222 Kayinja AAB C 503 KP878230
Kayinja AAB B 503 KP878229 Gros michel AAA B 503 KP878232 Gros michel AAA A 503 KP878231
Sukali ndizi AAB H 504 KP878226 Sukali ndizi AAB A 504 KP878225 Zebrina GF AA C 504 KP878220 Zebrina GF AA B 504 KP878224
Zebrina GF AA A 504 KP878223 Gros michel AAA D 504 KP878235 Gros michel AAA E 504 KP878234
Gros michel AAA C 504 KP878233
Gros michel AAA F 591 KP878227
Kayinja AAB D 760 KP878228 *Coding sequence
Transcripts of the same length were either within the same cultivar or from different cultivars.
Sequences with the same length from all the cultivars were aligned and it was observed that
some were 100% identical while others had polymorphisms. Alignment of all the 503bp long
sequences identified 4 bp SNP positions; one of these was in the N-terminal tail and the others in
the C-terminal histone fold domain (HFD) (Table 5.2). Alignment of the 504bp long alignment
had more SNPs relative to the 503 bp long, there were 15 bp SNP positions nine of which were

87
located within the N-terminal and six in the HFD (Table 5.2). Alignment of the 471 bp long
sequences from four ‘Sukali ndiizi’ clones (clones 8, 18I, 18G and 18B) showed a high level of
polymorphism in the N-terminal tail. Two insertions were observed in the N-terminal. A 9 bp
insertion (CTGATGCGA) was observed in clone 8S in cultivar ‘Sukali ndiizi’ from alignment
position 92-100 and a deletion of the same size (TTTGTTGGT) from position 137 to 145. There
were also 22 intermittent substitutions spread from position 101 to 146 all in the N-terminal
while the HFD had a total of 7 SNP positions (Table 5.2).
Table 5.2: Number, location and size of SNPs and indels in the alignment of CenH3 transcripts having variable lengths.
Length of transcript alignment (bp)
Number of SNP (N-terminal)
Number of SNPs (C-terminal HFD)
Indel(s) length(bp)
Indel positions
Indel sequence (s)
503
1
3
-
-
-
504 9 6 - - -
471 22 7 9 92-100, 137-145
CTGATGCGA, TTTGTTGGT
SNP-Single Nucleotide Polymorphism, HFD-Histone Fold Domain
Three intron/exon structures were obtained on aligning of CenH3 transcripts to DH Pahang
genomic sequence (Table 5.3).The first structure was observed to have 7 exons and 6 introns,
this was the most frequent and was observed in 65% of all the transcripts obtained (Table 5.3).
This structure was observed in both diploid and triploids representing 75% of transcripts
obtained from diploid cultivar ‘Zebrina GF’ and 63% of all the transcripts in the allotriploids
88
(‘Kayinja’, ‘Sukali ndiizi’). The 7 exons/6 introns structure was observed in the triploid cultivar
‘Sukali ndiizi’ (clones A, F and H), ‘Gros Michel’ (clones A-E), ‘Kayinja’ (clones B and C) and
diploid cultivar ‘Zebrina GF’ in clones A, B and C. Furthermore, the 7 exons/6introns structure
was observed in 100% of the transcripts with a length of 503 bp, and 504 bp and only one
transcript (‘Sukali ndiizi’ clone F) with a different length (477bp) other than the two lengths (503
and 504 bp) had this structure. The 7 exons obtained in the 7 exons/6 introns structure were of
varying sizes with the longest being 131bp and the shortest 37 bp.
The second structure with 5 exons and 4 introns was observed in 25% of all the transcripts
obtained from the allotriploid cultivars ‘Kayinja’ (clone D), ‘Sukali ndiizi’ (clones B, C and E)
and diploid cultivar ‘Zebrina GF’ (clone D). The 5 exons/4 introns structure was observed in
transcripts of different lengths and included transcripts from clone D in the cultivar
‘Kayinja’which was 760 bp long, clone B, C and E from cultivar ‘Sukali ndiizi’ which was 471
bp long and clone D from the cultivar ‘Zebrina GF’ which was 474 bp long (Table 5.3).
The third intron/exon structure observed had 6 exons and 5 introns, this was observed in 10% of
the transcripts analyzed. The 6 exon/5 intron structure was observed in only two transcripts from
allotriploid cultivars Gros Michel (clone F) and sukali ndizi (clone G). The two transcripts were
of different lengths with the first having a length of 591 bp and the second 471 bp long (Table
5.3).

89
Table 5.3: The location of polymorphisms within exons of the different exons/introns structures of banana CenH3 transcripts
Exon name (Structure)
Exon Length (bp)
Position in the genomic to cDNA alignment
Number of SNPs
Indel (position)
Intron retention
Exon 1 (7/6) 90 1002-1092 2(27bp deletion) 1065-1092 None Exon 2 (7/6) 42 1185-1227 2 None None Exon 3 (7/6) 35 1314-1348 3 None None Exon 4 (7/6) 133 1518-1650 3 None None Exon 5 (7/6) 73 1813-1885 3 None Exon 6 (7/6) 78 4368-4446 3 4430 None Exon 7 (7/6) 53 6488-6540 2 None None Exon 1 (6/5) 90 1002-1092 0 None None Exon 2 (6/5) 44 1185-1229 0 120 1229-1348 Exon 3 (6/5) 133 1518-1650 0 None None Exon 4 (6/5) 73 1813-1885 0 None None Exon 5 (6/5) 78 4369-4446 0 None None Exon 6 (6/5) 53 6488-6540 None None None Exon 1 (5/4) 136 1002-1138 1 None 1092-1137 Exon 2 (5/4) 132 1520-1651 2 1608 1185-1518 Exon 3 (5/4) 74 1814-1887 3 1845 None Exon 4 (5/4) 79 4371-4449 0 4404 None Exon 5 (5/4) 53 6491-6543 2 None None

90
5.3.2 Splice and allele variants in banana CenH3 transcripts
The alignment of the different banana CenH3 transcripts from allotriploids and diploids to the
cultivar ‘DH Pahang’ genomic sequence facilitated observation of variation in splicing and the
alleles. CenH3 transcripts having the same intron/exon structure were aligned to the genomic
sequence together in order to clearly identify splice variations within an exon/intron structure.
Three alignments were obtained in the first group having 7/6, 6/5 and 5/4 exon/intron structure
(Table 5.3).
The splicing of sequences having a 7/6 exon/intron structure was relatively conserved across all
the transcripts. Exon1 in this structure was 90 bp long spanning alignment positions 1002 to
1092 except for the transcript of ‘Sukali ndiizi’ clone F which was observed to have a 27 bp
deletion from position 1065 to 1092 (Table 5.3). The deletion in this transcript changed the
beginning of the first 5’ intron position whereas the first exon was shortened by 27 bp and the
first intron elongated with an equal number of base pairs. These elongations resulted to change in
the nucleotide sequence of the exon/intron junction from CCCC/GGTC to TTTC/GGTC. The
first exon in this structure also had 2 SNPs at alignment positions 1028 and 1035. The SNP at
position 1028 was a substitution of C with a T in the transcripts of ‘Zebrina GF’ clones A and B
whereas the one at position 1035 was a substitution of a T with a C. Exon 2 in this structure was
42 bp long from alignment position 1185 to 1227, this exon was conserved across all the
transcripts except for 2 SNPs at positions 1199 and 1211. The SNP at position 1199 was a
substitution of G with an A in the transcripts of ‘Sukali ndiizi’ clones A, F and H and in
transcripts of ‘Zebrina GF’ clones A, B and C. The 5’ intron/exon junction was conserved as
AATA/GCTG for this exon and TCCT/GTGC in the 3’ exon/intron junction. Exon 3 was the

91
shortest at 35 bp (1314 to1348) and had a 5’ exon/intron junction of ATAG/AGAA and a
CTCA/AGGT exon/intron junction. Three SNPs were observed in exon 3 at positions 1338,
1340 and 1341 with these being substitutions of A with G, C with T and G with A respectively
for the transcripts of ‘Sukali ndiizi’ clones A, F and H and in ‘Zebrina GF’ clones A, B and C
(Table 5.3). Exon 4 was 133bp long spanning positions 1518 and 1650, the 5’ intron/exon
junction was AGGC/AGGG and 3’exon/intron junction ACTT/GTTA. There were 3 SNPs in
exon 4 at positions 1534, 1539 and 1540 with a C with T substitution at position 1534 in the
transcript of ‘Sukali ndiizi’ clone F, position 1539 had G with A substitution in the transcripts of
‘Gros Michel’ clones A-E and position 1540 had a substitution of C with A in the transcripts
of‘Sukali ndiizi’ clones A, F and H and ‘Zebrina GF’ clones A and H. Exon 5 was 73bp long
from alignment position 1813 to 1886 (Table 5.3). This exon had a total of 3 SNPs at positions
1815, 1872 and 1878 with substitution of A with T in the transcripts of ‘Gros Michel’ clones A-E
at position 1815, this changed the intron/exon junction of these cultivars to CTAG/GTTC from
CTAG/GTTC. At alignment position 1872 a G was substituted with an A in the transcripts of
Gros Michel clones A-E and at position 1878 a G was substituted with an A in the transcripts of
‘Kayinja’ clones B and C (Table 3). Exon 6 was 78bp long stretching from alignment position
4368 to 4446 with a 5’ intron/exon structure of TTGC/AGGC and 3’ CTTA/GTAA exon/intron
structure. Three SNPs were observed in this exon at alignment positions 4395, 4421, and 4430.
The SNPs were substitution of A with G in the transcript of ‘Zebrina GF’ clone C at position
4395, substitution of A with G in the transcripts of ‘Sukali ndiizi’ clones A, F and H and
transcripts of ‘Zebrina GF’clones A-C at alignment positions 4421. A deletion was observed at
position 4430 in transcripts of ‘Kayinja’ clones B and C and in transcripts of ‘Gros Michel’
92
clones A-E (Table 5.3). Exon 7 was observed to be 53bp long spanning alignment positions
6488-6540. This exon had 2 SNPs at position 6497 and 6530, the first was a substitution of A
with G in the transcript of ‘Sukali ndiizi’ clone H and the second a substitution of G with A in
the transcript of ‘Zebrina GF’ clone B.
Splicing of the 5/4 exon/intron structure was observed to have a high level of variability in the
first three exons. This structure was observed in all the cultivars across different ploidy. Three
cultivars represented by five transcripts (‘Zebrina GF’ clone D, ‘Kayinja’ clone D, and ‘Sukali
ndiizi’ clones B, C and E) were observed to have this structure. The first exon in this structure
was 136bp long in most transcripts from positions 1002-1137, they had 46bp intron retention
except for the transcript of ‘Kayinja’ clone D (Table 5.3). The partial intron retention in this exon
affected the exon/intron junction in transcript of ‘Kayinja’ clone D which was CCCC/GGTC
with the rest of the transcripts having TGGT/GTTA exon/intron junction and splice sites being at
positions 1092 and 1138 for the two exon/intron junctions respectively. Exon 2 in this structure
was observed to be 132bp long spanning 1521-1651 except in the transcript of ‘Kayinja’ clone D
which had a 335bp 5’ (intron 1) intron retention from position 1185-1520. Three polymorphisms
were observed in this exon, 2 SNPs at positions 1589 and 1609 and an indel at position 1608.
Exon 3 was observed to be 74bp long spanning positions 1814-887. Four polymorphic positions
were observed in this exon, 3 SNPs at positions 1821, 1869 and 1871 and an indel at position
1845 (Table 5.3). Exon 4 was observed to be 79bp long from position 4371-4450. Only one
polymorphism was observed in this exon, an indel at position 4404. The last exon like in all the
other structures was observed to be 53bp long and had two SNPs, at positions 6530 and 6533
which were all substitutions of G with an A in the transcript ‘Sukali ndiizi’ clone C.
93
The last exon/intron structure (6/5) had only 2 representative transcripts of ‘Sukali ndiizi’ clone
D and ‘Gros michel’ clone F. The main variation observed in transcripts within this structure was
due to a partial intron retention in exon 2 in the transcript of ‘Gros michel’ clone F. This
consequently changed the 3’ exon 2/intron 2 junction from CTGC/TGCG with the splice site at
alignment position 1229 to CTCA/AGGT with the splice site at 1349. The exons were observed
to have different lengths. Exon 1 was 90bp from positions 1002 to 1091, exon 2 43bp from
1185- 1227 in Sukali ndizi clone D and 167bp long in Gros michel clone F from positions 1185-
1348 in the alignment (Table 5.3). Exon 3 was 133bp long from positions 1518-1650. Exon 4
was 73bp long from alignment position 1813-1885 while exons 5 and 6 were 78bp (1811-1885)
and 53bp 6488-6540) respectively (Table 5.3).
In the analysis of the different structures and alleles variants, it was also observed that some of
the transcripts had premature stop codons when translated in one frame (Frame 1) which was
found to be the most consistent for banana CENH3. Among these were: Kayinja clone D which
had 6 stops two of which were within the retained intron fragment, Gros michel clone F that had
one which was equally within the retained intron.
5.3.3 Evolutionary divergence of CENH3 proteins
To determine the divergence in the different banana CenH3 proteins for the full CDS and for N-
and C-terminal regions, Ka (nonsynonymous) and Ks (synonymous) substitutions and their ratios
were calculated using cDNA sequences in DNAsp version 5.10. Twenty transcripts representing
all cultivars were used in the analysis. Stop codon appearing in the coding sequence were
considered as coding for a rare amino acid or a stop codon read through. A total of 417
nucleoteide sites representing 139 amino acids were used in the analysis of the full length

94
transcript. The average number of synonymous and non-synonymous sites obtained in all the
transcripts was 106.5 and 310.5 respectively. Out of the 190 pairwise alignments in all the full
transcripts obtained 5 had Ka/Ks ratio >1 whereas 185 had a Ka/Ks ratio of <1 (Appendix 2).
The 5 that had ratios of >1 were representing six transcripts derived from 2 cultivars diploid
‘Zebrina GF’ and triploid ‘Gros michel’. To check the divergence within each cultivar, the
average Ka/Ks ratios of CenH3 transcripts per cultivar were obtained (Table 5.4). The cultivar
‘Zebrina GF’ was found to have the highest Ka/Ks ratio of 0.508, ‘Gros Michel’ ratio was
observed to be 0.244, ‘Kayinja’ was 0.229 and that of ’Sukali ndiizi’ was 0.395. The average
Ka/Ks values for CenH3 between cultivars was observed to be highest in ‘Gros michel’ and
’Sukali ndiizi’ alignments and lowest in ‘Zebrina GF’ and ‘Sukali ndiizi’ alignments (Table 5.4).
Table 5.4: The average Ka/Ks values within and between pairwise alignments of banana CenH3 transcripts obtained from different diploid and triploid cultivars
Within cultivar Between cultivars
A B C D A/B A/C A/D B/C B/D C/D
Full length 0.244 0.508 0.395 0.229 0.606 0.623 0.418 0.372 0.38 0.419
N-terminal (Tail)
0.458 0.433 0.414 0.242 0.607 0.74 0.243 0.34 0.356 0.508
C-terminal (HFD)
0.167 0.102 0.357 0.192 0.536 0.73 0.222 0.182 0.266 0.424
A-Gros michel, B-Zebrina, C-Sukali ndizi, D-Kayinja

95
To determine the extent of divergence in the N-terminal tail and C-terminal histone fold
domains across all the transcripts obtained, Ka/Ks ratios were calculated. For the tail domain,
a total of 138 sites representing 46 amino acids were involved in the analysis while 111 sites
were found to have gaps and were therefore not analyzed.
The average numbers of synonymous and nonsynonymous sites were 36.63 and 101.38
respectively. A total of 10 pairwise alignments in this region were observed to have Ka/Ks
values >1, these were representing a total of 7 transcripts from 3 cultivars (2 triploids and the
diploid) (Appendix 3). The average number of Ka/Ks ratio per cultivar for the N-terminal tail
domain was observed to be highest in the cultivar ‘Gros michel’ at 0.458 then Zebrina GF at
0.433 then ’Sukali ndiizi’ at 0.414 and last was ‘Kayinja’ at 0.242 (Table 5.4). Within the
HFD, a total of 276 nucleotide sites representing 93 amino acids were analyzed. The total
numbers of synonymous sites obtained in the analysis in this region were 63.54 while non-
synonymous sites had 215.46. A total of 14 pairwise alignment in the HFD were found to
have Ka/Ks ratio >1 (Appendix 3). The average Ka/Ks values within different cultivars at the
HFD were observed to vary between 0.1-0.3. The transcripts from the cultivar Sukali ndiizi
had the highest average Ka/Ks values of 0.357, ‘Kayinja’ at 0.192, ‘Gros michel’ at 0.167 and
‘Zebrina GF’ at 0.102 (Table 5.4).
To determine the relative extent of evolution in different cultivar as well as between and
within transcripts sharing the same exon/intron structure for full length CenH3, N-terminal tail
and HFD; analysis was conducted to get the average Ka/Ks ratios within and between each
exon/intron group. The average Ka/Ks values within each exon/intron group for the full
CenH3 alignments were observed to be between 0-0.373 with the highest being observed in

96
CenH3 sequences having 7 exons and 6 introns structure (0.373), the lowest value was
observed in the 6 exons/5 introns structure (0) (Table 5.5). Ka/Ks values between exon/intron
groups on the other hand had values between 0.316-0.6 with the highest observed in the
alignments of 7 exons /6 introns structure with 5 exons/4 introns (0.60). The 7 exons/6 introns
alignments to 6 exons/5 introns resulted in the lowest Ka/Ks ratio of 0.316. Analysis of the N-
terminal tail region resulted in Ka/Ks values ranging from 0-0.344 within different exon/intron
groups. The 6 exons/5 introns structure had the lowest value of 0 while the highest value
(0.344) was observed in the 7 exons/ 6 introns structure (Table 5.5). Ka/Ks values between
CenH3 with different exon/intron structure resulted in the highest ratio of 0.719 being
observed in the alignments between 7/6 and 5/4 exon/intron structures and the lowest between
7/6 and 5/4 exon/intron structures. Ka/Ks values in the HFD region within exon/intron
structures were observed to be between 0-0.448 with the highest observed in the 5 exons /4
introns and the lowest in the 6 exons/ 5 introns structure. Ka/Ks ratios between exon/intron
structures in the C-terminal were ranging between 0.241-0.592 with the highest observed
between 7 exons/6 introns and 5 exons/4 introns structure and the lowest between 6/5 and 5
exons/ 4 introns structures.
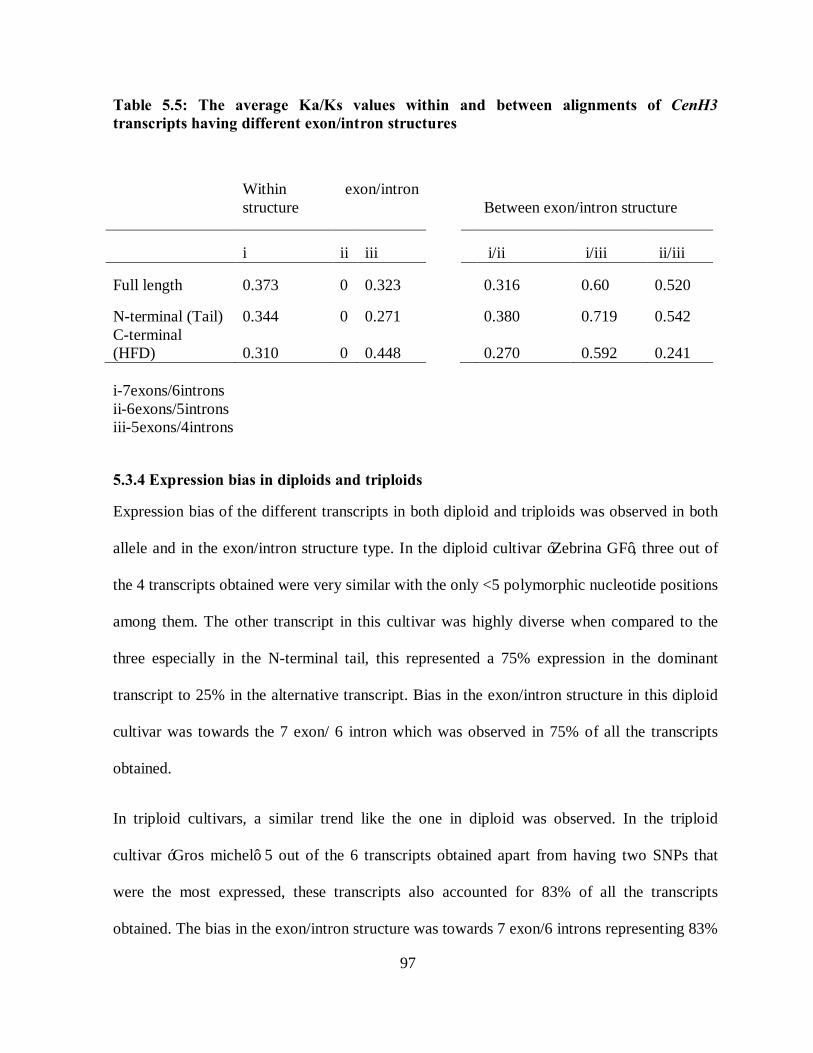
97
Table 5.5: The average Ka/Ks values within and between alignments of CenH3 transcripts having different exon/intron structures
Within exon/intron structure
Between exon/intron structure
i ii iii
i/ii i/iii ii/iii
Full length 0.373 0 0.323
0.316 0.60 0.520
N-terminal (Tail) 0.344 0 0.271
0.380 0.719 0.542 C-terminal (HFD) 0.310 0 0.448
0.270 0.592 0.241
i-7exons/6introns ii-6exons/5introns iii-5exons/4introns
5.3.4 Expression bias in diploids and triploids
Expression bias of the different transcripts in both diploid and triploids was observed in both
allele and in the exon/intron structure type. In the diploid cultivar ‘Zebrina GF’, three out of
the 4 transcripts obtained were very similar with the only <5 polymorphic nucleotide positions
among them. The other transcript in this cultivar was highly diverse when compared to the
three especially in the N-terminal tail, this represented a 75% expression in the dominant
transcript to 25% in the alternative transcript. Bias in the exon/intron structure in this diploid
cultivar was towards the 7 exon/ 6 intron which was observed in 75% of all the transcripts
obtained.
In triploid cultivars, a similar trend like the one in diploid was observed. In the triploid
cultivar ‘Gros michel’ 5 out of the 6 transcripts obtained apart from having two SNPs that
were the most expressed, these transcripts also accounted for 83% of all the transcripts
obtained. The bias in the exon/intron structure was towards 7 exon/6 introns representing 83%
98
of the transcripts. In ‘Sukali ndizi’, two different transcripts were observed to be expressed in
33% of the total transcripts while another two were observed to be expressed in 16% of the
total transcripts. Exon/intron bias was also observed in ‘Sukali ndiizi’, 43% of all the
transcripts were observed to have both 7 exons/ 6 introns and 5 exons/ 4 exons structure while
14% were observed to have a 6 exons/ 5 introns structure. In the cultivar ‘Kayinja’, 67% of
the transcripts were observed to represent one type of transcript while in 33% the other
transcript type was observed. The 7 exon/6 intron structure was also favoured with 67% of the
transcripts having this structure, the rest had the 6 exon/5 intron structure.
5.3.5 Secondary structure prediction
Secondary structures for different CENH3 protein translations were obtained by first aligning
the sequences (Figure 5.1). Alignment of these to CENH3s from known species also enabled
the identification of the conserved domains especially in the C-terminal HFD. Among these
domains were the α-N, α1, α2 and α3 helices (Figure 5.1). Secondary structures were obtained
in both diploid and triploids (Figure 5.2). Different exon/intron groups and CenH3 lengths
from which the translations were made were also represented in the secondary structure
predictions (Figure 5.2). The major variability in the secondary structures was observed to be
in the N-terminal tail whereas the C-terminal domain was observed to be relatively conserved
(Figure 5.2).
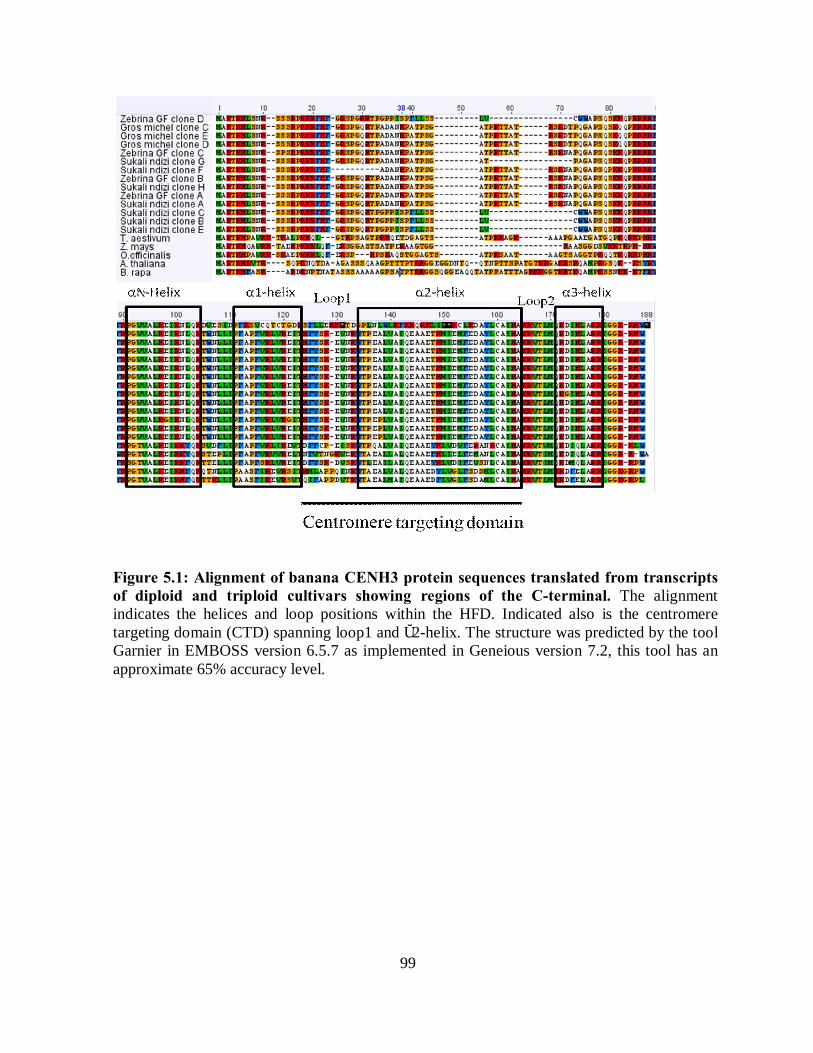
99
Figure 5.1: Alignment of banana CENH3 protein sequences translated from transcripts of diploid and triploid cultivars showing regions of the C-terminal. The alignment indicates the helices and loop positions within the HFD. Indicated also is the centromere targeting domain (CTD) spanning loop1 and α2-helix. The structure was predicted by the tool Garnier in EMBOSS version 6.5.7 as implemented in Geneious version 7.2, this tool has an approximate 65% accuracy level.

100
Figure 5.2: Secondary structure predictions of selected translated banana CENH3 proteins. The structures represent different CENH3 lengths, source cultivar, ploidies and exon/intron groups: A-‘Sukali ndiizi’ clone G (Triploid, 471bp, 6 exons/5 introns), B-‘Sukali ndiizi’ clone F (Triploid, 477bp, 7 exons/ 6 introns), C- ‘Zebrina GF’clone B (diploid, 504bp 7 exons/6 introns), D-‘Gros michel’ F(Triploid, 591bp, 6 exons/ 5 introns), E-‘Kayinja’ clone D (Triploid, 760bp, 5 exons/4 introns), F-‘Kayinja’ clone B (Triploid, 503bp, 7 exons/6 introns).
5.3.6 Banana CenH3 monophylectic clade
The phylogeny of all banana CENH3 protein sequences with those of other monocot and dicot
species resulted in two banana monophylectic groups. In this analysis, four main clades which
had multiple sub-clades were observed and these had strong bootstrap support values (Figure
5.3). The first clade was banana CENH3 clade 1 which only had representatives from banana.
This clade had 3 sub-clades: 1a, 1b and 1c. Sub-clade 1a had 8 clones from the cultivars
101
Zebrina GF, ‘Sukali ndiizi’ and ‘Gros michel’. This sub-clade was also observed to have
transcripts with either 7/6 or 6/5 exon/intron structure. The second sub-clade 1b had only 2
cultivars represented, ‘Gros michel’ and ‘Kayinja’ (Figure 5.3). All the representatives in this
sub-clade had a 7/6 exon/intron structure. Sub-clade 1b had two sister clades one with 88 BP
and the other 100 BP support. The 88 BP support sister clade had all the representatives from
the cultivar Gros michel while the 100 BP one had 2 from the cultivar ‘Kayinja’ and the other
2 from ‘Gros michel’. The last sub-clade 1c had 3 representatives all from the cultivar ‘Sukali
ndizi’ (clones B, C and E). The clone E was observed to be the most diverse of the 3 in this
sub-clade as it diverge earlier. It was also noted that all the transcripts in this sub-clade had a
5/4 exon/intron structure.
The second and third clade had representatives from other species within the monocots and
dicots respectively. The fourth clade was the second banana CENH3 clade and had two
representative transcripts from the diploid cultivar ‘Zebrina GF’ and the triploid ‘Kayinja’.
The two transcripts in this clade had a 5/4 exon/intron structure but were differing in length
with the transcript from ‘Kayinja’ clone D having 253 amino acids while ‘Zebrina GF’ clone
D had 158.
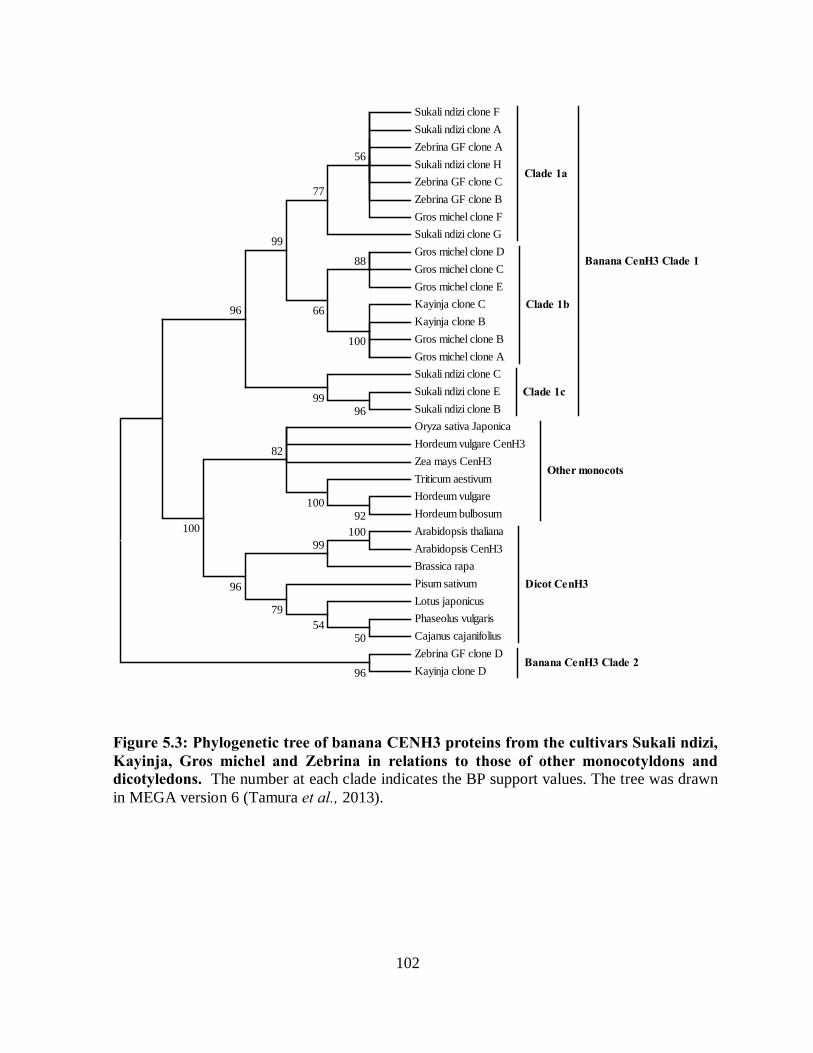
102
Figure 5.3: Phylogenetic tree of banana CENH3 proteins from the cultivars Sukali ndizi, Kayinja, Gros michel and Zebrina in relations to those of other monocotyldons and dicotyledons. The number at each clade indicates the BP support values. The tree was drawn in MEGA version 6 (Tamura et al., 2013).
Sukali ndizi clone F Sukali ndizi clone A Zebrina GF clone A Sukali ndizi clone H Zebrina GF clone C Zebrina GF clone B Gros michel clone F Sukali ndizi clone G
Clade 1a
Gros michel clone D Gros michel clone C Gros michel clone E Kayinja clone C Kayinja clone B Gros michel clone B Gros michel clone A
Clade 1b
Sukali ndizi clone C Sukali ndizi clone E Sukali ndizi clone B
Clade 1c
Banana CenH3 Clade 1
Oryza sativa Japonica Hordeum vulgare CenH3 Zea mays CenH3 Triticum aestivum Hordeum vulgare Hordeum bulbosum
Other monocots
Arabidopsis thaliana Arabidopsis CenH3 Brassica rapa Pisum sativum Lotus japonicus Phaseolus vulgaris Cajanus cajanifolius
Dicot CenH3
Zebrina GF clone D Kayinja clone D
Banana CenH3 Clade 2
10099
92100
5054
79
96
82
100
96
100
9699
96
88
66
99
77
56

103
5.4 DISCUSSION
The number of CenH3 copies have been observed to vary in diploids and polyploids (mainly
allopolyploids), some having single copies and others multiple (Hirsch et al., 2009; Wang et
al., 2011; Masonbrink et al., 2014; Dunemann et al., 2014), in bananas this has not been
studied. Duplicated genes in polyploids can be retained without expression, others can be
spliced differently during expression while others show bias in their expression within the
same polyploidy cultivar (Pignatta and Comai, 2009; Rapp et al., 2010; Wang et al., 2011;
Rapaport et al., 2013; Yoo et al., 2013; Yoo et al., 2014).
The current study was able to amplify cDNA from the diploid cultivar Zebrina GF and three
triploid cultivars Gros michel, Sukali ndizi and Kayinja which indicated a very high CenH3
diversity in the 26 sequences analyzed. CenH3 sequences obtained in the current study were
observed to vary even in the same cultivar with up to 3 isoforms. The diversity in the
transcripts was in both length and allele. The differences in length were mainly due to indels
and intron retention which resulted in splice site variation in exons (2, 3 and 4). However,
presence of multiple polymorphisms in form of substitutions and indels within exons that were
conserved attest to the presence of allele variants especially in the diploid Zebrina GF. The
presence of multiple variants in autotriploids may indicate presence of multiple CenH3
genomic copies in different species, this is in agreement with similar observations made in
different angiosperms genera (Hirsch et al., 2009; Masonbrink et al., 2014). This is further
attested to by the presence of diverse transcripts in allotriploids, some of which were similar
to those obtained in diploids and allotriploids indicating that their diploid progenitors may
104
have contained diverse CenH3 genes, this observation is with similar with the one made in
Brassica where multiple CenH3 copies were observed in diploids (Wang et al., 2011).
Studies in H. vulgare x H. bulbosum crosses have indicated that presence of multiple CenH3
transcripts does not result in multiple CENH3 proteins being incorporated into the centromere
(Sanei et al., 2011). However, studies in peas have alternately observed loading of multiple
CENH3 into the centromere which resulted in multiple centromere domains (Neumann et al.,
2012). The presence of transcribed variants (both allele and splice) in both diploids and
triploids has not been reported in bananas before. These have been observed in other
angiosperms like Gossypium, Oryza and Brassica (Masonbrink et al., 2014). However,
immuno-staining studies to check whether proteins translated by the transcripts are also
loaded into the centromere should be conducted in bananas.
Recently, it was reported in Arabidopsis that naturally occurring CenH3 variations can cause
genetic instability which caused genetic rearrangements and resulted to both haploids and
aneuploids in some cases (Maheshwari et al., 2015). Banana breeding mainly involves
crossing tetraploids to diploids to create triploids and this results to variable genomic
compositions in the offsprings (Oselebe et al., 2006). CenH3 homolog expression bias was
observed in studies in Brassica where polyploids were shown to be biased to a specific
transcript while in Oryza, equal expression of the CenH3 variants was observed (Hirsch et al.,
2009; Masonbrink et al., 2014). Expression bias of CenH3 was observed in transcripts of both
diploid and triploid bananas. Moreover, no obvious ratio in expression bias was observed in
both diploid and triploid cultivars used in the current study.
105
Predictions of the secondary structures for the sequences with different transcript lengths,
from different cultivars and with different exons/introns numbers indicated a general
conservation in the structure with the main difference being in the length of the N-terminal.
This is consistent with results obtained in other angiosperms like Brassica, which showed
similar secondary structures and the differences were mainly observed in the length of the N-
terminal domain (Masonbrink et al., 2014).
The number of exons and introns in CenH3 has been found to vary in different plant varieties
and species. In Oryza different CenH3s were observed to have 7 exons and 6 introns despite
having different CDS lengths (Hirsch et al., 2009). In carrots a similar structure of 7 exons
and 6 introns was observed while in Brassica two different structures were observed in CenH3
cDNA sequences of varying lengths, one had a 7 exon/ 6 intron structure and the other a 9
exon/ 8 intron structure. In this study, three different exon/ intron structures were observed in
bananas; 7/6, 6/5 and 5 exons/ 4 introns with the 7/6 and the 5/4 exons/introns structures were
observed in both diploids and triploids while the 7/6 being the predorminant. The 6 exon/5
intron structure was only observed in triploids (Gros michel); however a caveat to this is that
CENH3 expression in more diploids and triploids not covered in this study should be
performed to affirm this. In this analysis, it is clear that more transcripts in expression are
more biased towards having a 7 exons/ 6 introns structure.
Centromeres in many plant species have been shown to have rapidly evolving satellite repeats
and the conserved kinetochore proteins (Talbert et al., 2002; Zhong et al., 2002a; Kawabe
and Charlesworth, 2007; Malik and Henikoff, 2009; Tek et al., 2011; Mach, 2012; Zhang et
al., 2013; Yuan et al., 2015 ). Since CENH3 interacts with both satellite repeats as well as the
106
kinetochore proteins, then it exists in a highly evolving as well as a conserved environment
(Cooper and Henikoff, 2004). To counter this, CENH3 has been shown to be undergoing
adaptive evolution in the N-terminal as well as in the loop1 of the C-terminal HFD in rice,
Arabidopsis, wheat, (Malik and Henikoff, 2001; Talbert et al., 2002; Hirsch et al., 2009;
Yuan et al., 2015). In this study the evolutionary relationship of the different banana CenH3
transcripts was checked by calculating the Ka/Ks ratios in the full length CenH3, the N-
terminal tail and the C-terminal HFD. Some of the banana pairwise alignments had Ka/Ks
values >1 indicating that the presence of positive selection in full length, N-terminal and C-
terminal. However, it was interesting to note that in each of the pairwise alignments with
positive selection, be it the full length CenH3 transcript, the N-terminal tail or the C-terminal
HFD, included one transcript from at least one of the triploid cultivars.
The observation that some of the transcripts within one cultivar were involved in alignments
having positive selection shows that in bananas CenH3 variants within a cultivar are evolving
positively while others are not. In the diploid cultivar ‘Zebrina GF’ for example, only 2 of the
transcripts obtained were observed as having positive selection. Contrary to the expectation,
the current study observed that both tail and HFD are going through positive selection. It was
observed that 185 out of 191 pairwise alignments had Ka/Ks values less than 1 indicating that
stabilizing selection is playing a big role in some of the transcripts. The diploid cultivar
‘Zebrina GF’ involved is in the M. acuminata sub-group ‘Zebrina’, the diploid progenitors of
the triploids involved in the study on the other hand is not known but two are from the East
Africa highland group (‘Kayinja’ and ‘Sukali ndiizi'). The presence of CenH3 transcripts in
Zebrina GF that are 100% similar to some of those in triploids indicates that it may have
contributed its genome to East African high land bananas (EAHB). This is consistent with
107
observations that the Islands of South East Asia (ISEA) are the origin of cultivated bananas
and they have been domesticated through complex routes (Li et al., 2013).
Diversity of CENH3 has been suggested to be necessary to target centromere in meiosis or
response to increase in centromere size (Masonbrink et al., 2014). Apart from allele variants,
splice variation is another approach that has been shown to add into the diversity of CENH3
proteins (Masonbrink et al., 2014). Alternate splicing was also observed in the current study
and this was mainly in intron retention. Splice retention was observed to affect the length of
the N-terminal especially in exon 1 and 2. This is consistent with previous studies that
observed a similar trend in angiosperms (Masonbrink et al., 2014). Splice variation was only
observed in triploids. The reason for diversity of CENH3 in triploid bananas can only be
explained as being a response to the increased genome or the presence of polycentromeres and
studies on localization of the different CENH3 would allow the clarification of this.
Phylogenetic analysis indicated that bananas formed two unique clades in a phylogeny with
other monocots and dicots. It was interesting to observe 2 diverse clades which indicated a
high level of diversity. Similar diversity was observed in CenH3 of Oryza spp. in a phylogeny
with other monocots (Hirsch et al., 2009).
The current study was able to identify and characterize CenH3 transcripts from both diploid
and triploid bananas. The evolutionary relationship within and between the different banana
CenH3 transcripts as well as the phylogenetic relationship to other monocots and dicots were
also evaluated. Through this study, further insight into banana CENH3 expression was
explored. Future studies especially on localization of CENH3 proteins derived from the
different transcripts should be done to know if these are loaded into the centromere.

108
Furthermore, more diploid and triploids should be used in future studies to check for more
diversity within the different bananas.
109
CHAPTER SIX
GENERAL DISCUSSION
Conventional banana breeding despite it being successful takes a long time and has challenges
due to parthenocarpy, long generation time and polyploidy (Pillay and Tripathi, 2007).
Development of haploids and then doubling them is an approach that can be used to reduce
breeding time. This is because DH are true inbreds which can be used for breeding as
homozygotes (Comai, 2014; Van Nocker and Gardiner, 2014). The current study endeavored
to develop haploid inducers in bananas through a transgenic approach.
The phylogenetic analysis of 39 banana cultivars was conducted in this study in order to find
out the phylogenetic position and relatedness of triploid cultivars to diploids and identify
haplotypes which would facilitate identification of progenitors. The results would ultimately
be used in part to identify the diploid cultivars from which haploid inducers would be
developed. Triploids and diploids were positioned to their genomic groups, sections and
species. Thirteen haplotypes were identified in triploids and diploids, five of which were
shared between the two ploidies and seven were unique. The main aim of the phylogeny was
to assist in the identification of cultivars to use in developing haploid inducers, based on the
study and other factors like availability of plantlets and fertility of cultivars, two cultivars
(Zebrina GF and Calcutta 4) were chosen to be used in development of haploid inducers.
Development of haploid inducers in two diploid banana cultivars was the overall goal of the
study, and was conducted in Chapter 3. Twenty seven putative haploid inducer lines were
obtained with three different gene constructs in the diploid banana Zebrina GF. The presence
of the transgene in the lines was confirmed using PCR while silencing of the endogenous

110
CenH3 was assessed using northern blot analysis on the accumulation of siRNAs, this
indicates that the genetic transformation was successful. The twenty seven PCR positive lines
were chosen and are being grown in the glasshouse to check success in haploid induction.
Chapter five of this study characterized CenH3 in different banana cultivars including the
diploids ‘Zebrina GF’ and ‘Calcutta 4’. Characterization of CenH3 entailed evaluating the
presence of splice and allele variants, evolutionary relationships in these variants and assess if
there exists expression bias in the variants. Splice and allele variants were observed in both
diploids and triploids with similarity being found in some variants across the ploidies. The
presence of variants in bananas complicates the production of haploid inducers based on
silencing of a single transcript because the success of haploid induction is pegged to the
complete silencing of endogenous CenH3.
CONCLUSIONS
The current study endeavored to develop haploid inducers in bananas through a transgenic
approach. From the study the following conclusions were made:
CHAPTER THREE:
1. The marker NADH can differentiate Musa acuminata (A genome) from Musa
balbisiana (B-genome) even in mixed genomic groups irrespective of their ploidy.
2. That the partial coding sequence for the marker CENH3 is able to differentiate A and
B genome as well as intagenomic hybrids in the B genome.
3. The cultivar Zebrina GF used to develop haploid inducers in this study, has close
relationship to the East African Highland (EAHB).
111
4. That atleast thirteen haplotypes exist amongst the 39 banana cultivars used in this
study and that there might be more haplotypes if more banana cultivars were to be
included.
CHAPTER FOUR:
In Chapter two the following conclusions were made:
1. The cultivar Zebrina GF is easier to transform and is more regenerative in comparison
to the cultivar Calcutta 4.
2. That RNAi approach does not result in total (100%) silencing of the endogenous
CENH3 in bananas and this is attributed to expression of multiple transcripts of the
gene as observed in chapter five of this study.
3. That one of the main factors contributing to success in transformation is the cultivars
used.
CHAPTER FIVE
1. Some triploid and diploid banana cultivars express multiple CenH3 variants (alleles
and splice)
2. The splicing of CenH3 in bananas is variable with the most preffered splicing
approach is the one having 7 exons and 6 introns.
3. CenH3 in bananas is undergoing positive selection within all its domains.
RECOMMENDATIONS
Despite the successes that were achieved in the phylogeny of the 39 banana cultivars, several
aspects need to be done in future studies to improve on this work. The phylogenetic study did
112
not identify progenitors of triploids from the diploids that were used, and the markers used
could also not cluster the triploids to their progenitors. Several recommendations are therefore
suggested for future phylogenetic work relating to phylogeny of bananas, these are:
1. More markers that have a higher level of variability should be used in future in order
to achieve differentiation in A-genome cultivars.
2. More diploid progenitors should be used in future so that there are more choices from
which the polyploids can cluster and consequently have a clear identification of the
progenitors.
The overall goal of developing putative haploid inducers in the fourth Chapter of the study
was achieved. However, there are recommendations proposed based on some of the
shortcomings, these are:
1. Since RNAi approach did not realize complete gene silencing of the endogenous
CenH3, basepair-specific silencing approaches like Clustered Regularly Interspaced
Short Palindromic Repeats (CRISPRs) and Transcriptional Activator Like Effector
Nucleases (TALENs) should be used in future. These have been shown to be more
specific in their targeting been shown to be more specific in their targeting and can be
used in silencing (Gaj et al., 2013; Souza, 2013; Wendt et al., 2013; Belhaj et al.,
2013; Comai, 2014)
2. The cultivar ‘Calcutta 4’ did not yield any transformants; this was due to the procol
used being ineffective. We recommend that the transformation protocol for this
cultivar be improved in future by optimizing A. Tumefaciens OD, the infection time,
the co-cultivation time and acetosyringone concentration.

113
Despite the efforts made to identify CenH3 variants in bananas, only a minimum number of
variants were identified in this study. In future work, the following recommendations are
made:
1. To check if the various variants observed in this study are loaded into the centromere,
it is recommended that immunostaining with regions specific to the respective variants
be carried out and the translated protein checked.
2. Tagging of variants from a specific cultivar should be tagged with different fluorescent
dyes and their localization in the centromere followed per cultivar.
3. Since only the minimum number of CenH3 variants that were identified in this study,
more clones should be included in future to have a clear view of CenH3 transcription
in bananas.
4. The CencH3 genomic loci for the cultivars used in the current study should be
sequenced in order to identify how many Loci exist and whether there is any
variability amongst them.
114
7.0 REFERENCES
Abiodun-Solanke, A. O. and Falade, K. O. (2011). A review of the uses and methods of processing banana and plantain (Musa spp.) into storable food products. Journal of Agricultural Research and Development, 9(2).
Ahmad, K. and Henikoff, S. (2002). The histone variant H3. 3 marks active chromatin by replication-independent nucleosome assembly. Molecular Cell, 9(6), 1191–1200.
Allshire, R. C. and Karpen, G. H. (2008). Epigenetic regulation of centromeric chromatin: old dogs, new tricks? Nature Reviews. Genetics, 9(12), 923–37.
Arvanitoyannis, I. S., Mavromatis, A. G., Grammatikaki-Avgeli, G. and Sakellariou, M. (2008). Banana: cultivars, biotechnological approaches and genetic transformation. International Journal of Food Science & Technology, 43(10), 1871–1879.
Assani, A., Bakry, F., Kerbellec, F., Haïcour, R., Wenzel, G. and Foroughi-Wehr, B. (2003). Production of haploids from anther culture of banana [Musa balbisiana (BB)]. Plant Cell Reports, 21(6), 511–6.
Baker, R. and Rogers, K.Baker, R. and Rogers, K. (2006). Phylogenetic analysis of fungal centromere H3 proteins. Genetics, 174, 1481–1492.
Bancaud, A., Wagner, G., Conde E Silva, N., Lavelle, C., Wong, H., Mozziconacci, J., Barbi, M., Sivolob, A., Le Cam, E., Mouawad, L., Viovy, J.-L., Victor, J.-M. and Prunell, A. (2007). Nucleosome chiral transition under positive torsional stress in single chromatin fibers. Molecular Cell, 27(1), 135–47.
Barnabás, B., Obert, B. and Kovács, G. (1999). Colchicine, an efficient genome-doubling agent for maize (Zea mays L.) microspores cultured in anthero. Plant Cell Reports, 18(10), 858–862.
Basu, S. K., Datta, M., Sharma, M. and Kumar, A. (2011). Invited Review Article Haploid production technology in wheat and some selected higher plants. Australian Journal of Crop Science, 5(9), 1087–1093.
Baulcombe, D. (2004). RNA silencing in plants. Nature, 431(7006), 356–63.
Baurens, F., Bocs, S., Rouard, M., Matsumoto, T., Miller, R. N. G., Rodier-Goud, M., MBéguié-A-MBéguié, D. and Yahiaoui, N. (2010). Mechanisms of haplotype divergence at the RGA08 nucleotide-binding leucine-rich repeat gene locus in wild banana (Musa balbisiana). BMC Plant Biology.
115
Belhaj, K., Chaparro-garcia, A., Kamoun, S., and Nekrasov, V. (2013). Plant genome editing made easy : targeted mutagenesis in model and crop plants using the CRISPR / Cas system. Plant Methods, 9(1), 1.
Bidmeshkipour, A, Thengane, R. J., Bahagvat, M. D., Ghaffari, S. M. and Rao, V. S. (2007). Production of haploid wheat via maize pollination. Journal of Sciences, Islamic Republic of Iran, 18(1), 5–11.
Black, B. and Bassett, E. (2008). The histone variant CENP-A and centromere specification. Current Opinion in Cell Biology, 20(1), 91–100.
Black, B. E. and Cleveland, D. W. (2011). Epigenetic centromere propagation and the nature of CENP-A nucleosomes. Cell, 144(4), 471–479.
Black, B. E., Jansen, L. E. T., Maddox, P. S., Foltz, D. R., Desai, A. B., Shah, J. V and Cleveland, D. W. (2007). Centromere identity maintained by nucleosomes assembled with histone H3 containing the CENP-A targeting domain. Molecular Cell, 25(2), 309–22.
Boonruangrod, R., Desai, D., Fluch, S., Berenyi, M. and Burg, K. (2008). Identification of cytoplasmic ancestor gene-pools of Musa acuminata Colla and Musa balbisiana Colla and their hybrids by chloroplast and mitochondrial haplotyping. TAG. Theoretical and Applied Genetics. Theoretische Und Angewandte Genetik, 118(1), 43–55.
Boonruangrod, R., Fluch, S. and Burg, K. (2009). Elucidation of origin of the present day hybrid banana cultivars using the 5′ETS rDNA sequence information. Molecular Breeding, 24(1), 77–91.
Brown, N., Venkatasamy, S., Khittoo, G., Bahorun, T. and Jawaheer, S. (2009). Evaluation of genetic diversity between 27 banana cultivars (Musa spp .) in Mauritius using RAPD markers. Journal of Biotechnology, 8(9), 1834–1840.
Browning, S. R. and Browning, B. L. (2011). Haplotype phasing: existing methods and new developments. Nature Reviews. Genetics, 12(10), 703–14.
Buehler, E., Khan, A. A., Marine, S., Rajaram, M., Bahl, A., Burchard, J. and Ferrer, M. E. (2012). siRNA off-target effects in genome-wide screens identify signaling pathway members. Scientific Reports, 2, 428.
Camahort, R., Shivaraju, M., Mattingly, M., Li, B., Nakanishi, S., Zhu, D., Shilatifard, A., Workman, J. L. and Gerton, J. L. (2009). Cse4 is part of an octameric nucleosome in budding yeast. Molecular Cell, 35(6), 794–805.
Campbell, A. W., Griffin, W. B., Burritt, D. J. and Conner, A. J. (2000). Production of wheat
116
doubled haploids via wide crosses in New Zealand wheat. New Zealand Journal of Crop and Horticultural Science, 28(3), 185–194.
Carreel, F., Gonzalez de Leon, D., Lagoda, P., Lanaud, C., Jenny, C., Horry, J. P. and Tezenas du Montcel, H. (2002). Ascertaining maternal and paternal lineage within Musa by chloroplast and mitochondrial DNA RFLP analyses. Genome, 45(4), 679–692.
Chan, S. W. L. (2011). In a battle between parental chromosomes, a failure to reload. Proceedings of the National Academy of Sciences of the United States of America, 108(33), 13361–2.
Chan, S. W. L. (2008). Inputs and outputs for chromatin-targeted RNAi. Trends in Plant Science, 13(7), 383–9.
Chan, S. W. L. (2010). Chromosome Engineering: Power tools for plant genetics. Trends in Biotechnology, 28(12), 605–10.
Cheesman, E. (1947). Classification of the Bananas: The Genus Musa L. Kew Bulletin, 2(2), 106–117.
Chen, J.F., Cui, L., Malik, A. A. and Mbira, K. G. (2010). In vitro haploid and dihaploid production via unfertilized ovule culture. Plant Cell, Tissue and Organ Culture (PCTOC), 104(3), 311–319.
Ching, A., Caldwell, K. S., Jung, M., Dolan, M., Smith, O. S., Tingey, S., Morgante, M. and Rafalski, A. J. (2002). SNP frequency, haplotype structure and linkage disequilibrium in elite maize inbred lines. BMC Genetics, 3, 19.
Chomczynski, P. and Sacchi, N. (2006). The single-step method of RNA isolation by acid guanidinium thiocyanate-phenol-chloroform extraction: twenty-something years on. Nature Protocols, 1(2), 581–5.
Christelová, P., Valárik, M., Hřibová, E., De Langhe, E. and Doležel, J. (2011). A multi gene sequence-based phylogeny of the Musaceae (banana) family. BMC Evolutionary Biology, 11(1), 103.
Codomo, C. A., Furuyama, T. and Henikoff, S. (2014). CENP-A octamers do not confer a reduction in nucleosome height by AFM. Nature Structural & Molecular Biology, 21(1), 4–5.
Collins, K., Furuyama, S. and Biggins, S. (2004). Proteolysis contributes to the exclusive centromere localization of the yeast Cse4/CENP-A histone H3 variant. Current Biology, 14(21), 1968–72.
Comai, L. (2014). Genome elimination: translating basic research into a future tool for plant

117
breeding. PLoS Biology, 12(6), e1001876.
Cooper, J. L. and Henikoff, S. (2004). Adaptive evolution of the histone fold domain in centromeric histones. Mol. Biol. Evol, 21(9), 1712–1718.
Creste, S., Tulmann Neto, A., Vencovsky, R., de Oliveira Silva, S. and Figueira, A. (2004). Genetic diversity of Musa diploid and triploid accessions from the Brazilian banana breeding program estimated by microsatellite markers. Genetic Resources and Crop Evolution, 51(7), 723–733.
Crouch, J. H. (1998). Perspectives on the application of biotechnology to assist the genetic enhancement of plantain and banana (Musa spp.). Electronic Journal of Biotechnology, 1(1), 11–22.
D’Hont, A., Paget-Goy, A., Escoute, J. and Carreel, F. (2000). The interspecific genome structure of cultivated banana, Musa spp . revealed by genomic DNA in situ hybridization. TAG Theoretical and Applied Genetics, 100(2), 177–183.
Dalal, Y., Furuyama, T., Vermaak, D. and Henikoff, S. (2007). Structure, dynamics, and evolution of centromeric nucleosomes. Proceedings of the National Academy of Sciences of the United States of America, 104(41), 15974–81.
Dalal, Y., Wang, H., Lindsay, S. and Henikoff, S. (2007). Tetrameric structure of centromeric nucleosomes in interphase Drosophila cells. PLoS Biology, 5(8), e218.
Daniells, J., Jenny, C., Karamura, D. and Tomekpe, K.. (2001). Musalogue: A catalogue of Musa germplasm Diversity in the genus Musa.
Dawe, R. K. and Henikoff, S. (2006). Centromeres put epigenetics in the driver’s seat. Trends in Biochemical Sciences, 31(12), 662–669.
De Langhe, E., Hřibová, E., Carpentier, S., Doleel, J. and Swennen, R. (2010). Did backcrossing contribute to the origin of hybrid edible bananas? Annals of Botany.
De Langhe, E., Vrydaghs, L., De Maret, P., Perrier, X. and Denham, T. (2009). Why bananas matter: An introduction to the history of banana domestication. Ethnobotany Research and Applications, 7, 165–178.
Dechassa, M. L., Wyns, K., Li, M., Hall, M. A, Wang, M. D. and Luger, K.Dechassa, M. L., Wyns, K., Li, M., Hall, M. a, Wang, M. D. and Luger, K. (2011). Structure and Scm3-mediated assembly of budding yeast centromeric nucleosomes. Nature Communications, 313.
Dechassa, M. L., Wyns, K. and Luger, K. (2014). Scm3 deposits a (Cse4-H4)2 tetramer onto DNA through a Cse4-H4 dimer intermediate. Nucleic Acids Research, 42(9), 5532–42.

118
Dimitriadis, E. K., Weber, C., Gill, R. K., Diekmann, S. and Dalal, Y. (2010). Tetrameric organization of vertebrate centromeric nucleosomes. Proceedings of the National Academy of Sciences of the United States of America, 107(47), 20317–22.
Ding, C. and Cantor, C. R. (2003). Direct molecular haplotyping of long-range genomic DNA with M1-PCR. Proceedings of the National Academy of Sciences of the United States of America, 100(13), 7449–53.
Dunemann, F., Schrader, O., Budahn, H. and Houben, A. (2014). Characterization of centromeric histone H3 (CENH3) variants in cultivated and wild carrots (Daucus sp.). PLoS ONE, 9(6), e98504.
Dunwell, J. M., Wilkinson, M. J., Nelson, S., Wening, S., Sitorus, A. C., Mienanti, D., Alfiko, Y., Croxford, A. E., Ford, C. S., Forster, B. P. and Caligari, P. D. S. (2010). Production of haploids and doubled haploids in oil palm. BMC Plant Biology, 10, 218.
Dunwell, J. M. (2010). Haploids in flowering plants: origins and exploitation. Plant Biotechnology Journal, 8(4), 377–424.
Ekwall, K. (2007). Epigenetic control of centromere behavior. Annual Review of Genetics, 41, 63–81.
Fachinetti, D., Folco, H. D., Nechemia-Arbely, Y., Valente, L. P., Nguyen, K., Wong, A. J., Zhu, Q., Holland, A. J., Desai, A., Jansen, L. E. T. and Cleveland, D. W. (2013). A two-step mechanism for epigenetic specification of centromere identity and function. Nature Cell Biology, 15(9), 1056–66.
Fauré, S., Noyer, J. L., Horry, J. P., Bakry, F., Lanaud, C. and Gońzalez de León, D. (1993). A molecular marker-based linkage map of diploid bananas (Musa acuminata). Theoretical and Applied Genetics, 87(4), 517–526.
Fire, A., Xu, S., Montgomery, M. K., Kostas, S. A., Driver, S. E. and Mello, C. C. (1998). Potent and specific genetic interference by double-stranded RNA in Caenorhabditis elegans. Nature, 391(6669), 806–11.
Forster, B. P., Heberle-bors, E., Kasha, K. J. and Touraev, A. (2007). The resurgence of haploids in higher plants. Trends in Plant Science, 12(8), 368–75.
Froger, A. and Hall, J. E. (2007). Transformation of plasmid DNA into E. coli using the heat shock method. Journal of Visualized Experiments : JoVE, 253.
Furuyama and Biggins, S. (2007). Centromere identity is specified by a single centromeric nucleosome in budding yeast. Proceedings of the National Academy of Sciences of the United States of America, 104(37), 14706–11.
119
Furuyama, T., Codomo, C. A. and Henikoff, S. (2013). Reconstitution of hemisomes on budding yeast centromeric DNA. Nucleic Acids Research, 41(11), 5769–83.
Fusaro, A. F., Matthew, L., Smith, N. A, Curtin, S. J., Dedic-Hagan, J., Ellacott, G. A, Watson, J. M., Wang, M.-B., Brosnan, C., Carroll, B. J. and Waterhouse, P. M. (2006). RNA interference-inducing hairpin RNAs in plants act through the viral defence pathway. EMBO Reports, 7(11), 1168–75.
Gaj, T., Gersbach, C. A. and Barbas, C. F. I. (2013). ZFN, TALEN, and CRISPR/Cas-based methods for genome engineering. Trends in Biotechnology, 31(7), 1–9.
Gawel, N. J., Jarret, R. L. and Whittemore, A. P. (1992). Restriction fragment length polymorphism ( RFLP ) -based phylogenetic analysis of Musa. Theoretical and Applied Genetics (TAG), 286–290.
Gent, J. I., Schneider, K. L., Topp, C. N., Rodriguez, C., Presting, G. G. and Dawe, R. K. (2011). Distinct influences of tandem repeats and retrotransposons on CENH3 nucleosome positioning. Epigenetics & Chromatin, 4(1), 3.
Germanà, M. A.Germanà, M. A. (2006). Doubled haploid production in fruit crops. Plant Cell, Tissue and Organ Culture, 86(2), 131–146.
Gonzales, M. M. F., Brooks, T., Pukatzki, S. S. U. and Provenzano, D.Gonzales, M. M. F., Brooks, T., Pukatzki, S. S. U. and Provenzano, D. (2013). Rapid protocol for preparation of electrocompetent Escherichia coli and Vibrio cholerae. Journal of Visualized Experiments : JoVE, (October), 6–11.
Grewal, R. K., Lulsdorf, M., Croser, J., Ochatt, S., Vandenberg, A. and Warkentin, T. D.Grewal, R. K., Lulsdorf, M., Croser, J., Ochatt, S., Vandenberg, A. and Warkentin, T. D. (2009). Doubled-haploid production in chickpea (Cicer arietinum L.): role of stress treatments. Plant Cell Reports, 28(8), 1289–99.
Groth, A., Rocha, W., Verreault, A. and Almouzni, G. (2007). Chromatin challenges during DNA replication and repair. Cell, 128(4), 721–33.
Häkkinen, M. (2013). Reappraisal of sectional taxonomy in Musa (Musaceae). Taxon, 62(4), 809–813.
Henikoff, S., Furuyama, T. and Ahmad, K. (2004). Histone variants, nucleosome assembly and epigenetic inheritance. Trends in Genetics, 20(7), 320–6.
Henikoff, S. and Furuyama, T. (2012). The unconventional structure of centromeric nucleosomes. Chromosoma, 121(4), 341–52.

120
Henikoff, S. and Henikoff, J. G. (2012). “Point” centromeres of Saccharomyces harbor single centromere-specific nucleosomes. Genetics, 190(4), 1575–7.
Henikoff, S., Ramachandran, S., Krassovsky, K., Bryson, T. D., Codomo, C. A, Brogaard, K., Widom, J., Wang, J.-P. and Henikoff, J. G.Henikoff, S., Ramachandran, S., Krassovsky, K., Bryson, T. D., Codomo, C. A, Brogaard, K. (2014). The budding yeast Centromere DNA Element II wraps a stable Cse4 hemisome in either orientation in vivo. eLife, 3, e01861.
Hippolyte, I., Jenny, C., Gardes, L., Bakry, F., Rivallan, R., Pomies, V., Cubry, P., Tomekpe, K., Risterucci, A. M., Roux, N., Rouard, M., Arnaud, E., Kolesnikova-Allen, M. and Perrier, X. (2012). Foundation characteristics of edible Musa triploids revealed from allelic distribution of SSR markers. Annals of Botany, 109(5), 937–951.
Hirsch, C. D., Wu, Y., Yan, H. and Jiang, J. (2009). Lineage-specific adaptive evolution of the centromeric protein CENH3 in diploid and allotetraploid Oryza species. Molecular Biology and Evolution, 26(12), 2877–85.
Hřibová, E., Čížková, J., Christelová, P., Taudien, S., de Langhe, E. and Doležel, J. (2011). The ITS1-5.8S-ITS2 sequence region in the Musaceae: structure, diversity and use in molecular phylogeny. PloS One, 6(3), e17863.
Hui, L., Lu, L., Heng, Y., Qin, R., Xing, Y. and Jin, W. (2010). Expression of CENH3 alleles in synthesized allopolyploid Oryza species. Journal of Genetics and Genomics, 37, 703–711.
Kawabe, A. and Charlesworth, D. (2007). Patterns of DNA variation among three centromere satellite families in Arabidopsis halleri and A. lyrata. Journal of Molecular Evolution, 64, 237–247.
Kearse, M., Moir, R., Wilson, A., Stones-Havas, S., Cheung, M., Sturrock, S., Buxton, S., Cooper, A., Markowitz, S., Duran, C., Thierer, T., Ashton, B., Meintjes, P. and Drummond, A. (2012). Geneious Basic: an integrated and extendable desktop software platform for the organization and analysis of sequence data. Bioinformatics (Oxford, England), 28(12), 1647–9.
Kim, K. M. and Baenziger, P. S. (2005). A simple wheat haploid and doubled haploid production system using anther culture. In Vitro Cellular & Developmental Biology - Plant, 41(1), 22–27.
Kouzarides, T. (2007). Chromatin modifications and their function. Cell, 128(4), 693–705.
Kusaba, M. (2004). RNA interference in crop plants. Current Opinion in Biotechnology, 15(2), 139–43.

121
Heslop-Harrison, J. S. and Schwarzacher, T. (2007). Domestication, genomics and the future for banana. Annals of Botany, 100(5), 1073–84.
Lee, S. Y., Cheong, J. I. and Kim, T. S. (2003). Production of doubled haploids through anther culture of M1 rice plants derived from mutagenized fertilized egg cells. Plant Cell Reports, 22(3), 218–223.
Lermontova, I., Koroleva, O., Rutten, T., Fuchs, J., Schubert, V., Moraes, I., Koszegi, D. and Schubert, I. (2011). Knockdown of CENH3 in Arabidopsis reduces mitotic divisions and causes sterility by disturbed meiotic chromosome segregation. The Plant Journal : For Cell and Molecular Biology, 68(1), 40–50.
Lermontova, I., Kuhlmann, M., Friedel, S., Rutten, T., Heckmann, S., Sandmann, M., Demidov, D., Schubert, V. and Schubert, I. (2013). Arabidopsis kinetochore null2 is an upstream component for centromeric histone H3 variant cenH3 deposition at centromeres. The Plant Cell, 25(9), 3389–404.
Lermontova, I., Sandmann, M. and Demidov, D. (2014). Centromeres and kinetochores of Brassicaceae. Chromosome Research : An International Journal on the Molecular, Supramolecular and Evolutionary Aspects of Chromosome Biology, 22(2), 135–52.
Lermontova, I., Schubert, V., Fuchs, J., Klatte, S., Macas, J. and Schubert, I. (2006). Loading of Arabidopsis centromeric histone CENH3 occurs mainly during G2 and requires the presence of the histone fold domain. The Plant Cell, 18(10), 2443–2451.
Lescot, M., Piffanelli, P., Ciampi, A. Y., Ruiz, M., Blanc, G., Leebens-Mack, J., Da Silva, F. R., Santos, C. M. R., D’Hont, A., Garsmeur, O., Vilarinhos, A. D., Kanamori, H., Matsumoto, T., Ronning, C. M., Cheung, F., Haas, B. J., Althoff, R., Arbogast, T., Hine, E., Pappas, G. J., Sasaki, T., Souza, M. T., Miller, R. N. G., Glaszmann, J.C. and Town, C. D. (2008). Insights into the Musa genome: syntenic relationships to rice and between Musa species. BMC Genomics, 9, 58.
Li, L. F., Häkkinen, M., Yuan, Y. M., Hao, G. and Ge, X. J. (2010). Molecular phylogeny and systematics of the banana family (Musaceae) inferred from multiple nuclear and chloroplast DNA fragments, with a special reference to the genus Musa. Molecular Phylogenetics and Evolution, 57(1), 1–10.
Li, L. F., Wang, H. Y., Zhang, C., Wang, X. F., Shi, F. X., Chen, W. N. and Ge, X. J. (2013). Origins and domestication of cultivated banana inferred from chloroplast and nuclear genes. PloS One, 8(11), e80502.
Mach, J. (2012). Rapid Centromere Evolution in Potato: Invasion of the Satellite Repeats. The Plant Cell, 24(September), 3487–3487.

122
Maddox, P. S., Corbett, K. D. and Desai, A. (2012). Structure, assembly and reading of centromeric chromatin. Current Opinion in Genetics and Development, 22(2), 139–147.
Magdum, S. S. (2013). Effect of Agrobacterium Induced Necrosis, Antibiotic Induced Phytotoxicity and Other Factors in Successful Plant Transformation. Journal of Stress Physiology & Biochemistry, 9(3), 98–112.
Maheshwari, S., Tan, E. H., West, A., Franklin, F. C. H., Comai, L. and Chan, S. W. L. (2015). Naturally Occurring Differences in CENH3 Affect Chromosome Segregation in Zygotic Mitosis of Hybrids. PLOS Genetics, 11(1), e1004970.
Malik, H. S. and Henikoff, S. (2001). Adaptive evolution of Cid, a centromere-specific histone in Drosophila. Genetics, 157, 1293–1298.
Malik, H. S. and Henikoff, S. (2009). Major Evolutionary Transitions in Centromere Complexity. Cell 138(6), 1067-1082.
Maluszynski, M., Kenneth, K., B.P., F. and I., S. (2003). Doubled Haploid Production in Crop Plants: A Manual (Vol. 30). Springer Science & Business Media.
Marine, S., Bahl, A., Ferrer, M. and Buehler, E. (2012). Common seed analysis to identify off-target effects in siRNA screens. Journal of Biomolecular Screening, 17(3), 370–8.
Masonbrink, R. E., Gallagher, J. P., Jareczek, J. J., Renny-Byfield, S., Grover, C. E., Gong, L. and Wendel, J. F. (2014). CenH3 evolution in diploids and polyploids of three angiosperm genera. BMC Plant Biology, 14, 1–11.
Matzke, M. A. and Birchler, J. A. (2005). RNAi-mediated pathways in the nucleus. Nature Reviews. Genetics, 6(1), 24–35.
Miki, D. and Shimamoto, K. (2004). Simple RNAi vectors for stable and transient suppression of gene function in rice. Plant & Cell Physiology, 45(4), 490–5.
Miller, R. N. G., Passos, M. A. N., Menezes, N. N. P., Souza, M. T., do Carmo Costa, M. M., Rennó Azevedo, V. C., Amorim, E. P., Pappas, G. J. and Ciampi, A. Y. (2010). Characterization of novel microsatellite markers in Musa acuminata subsp. burmannicoides, var. Calcutta 4. BMC Research Notes, 3, 148.
Mizuguchi, G., Xiao, H., Wisniewski, J., Smith, M. M. and Wu, C. (2007). Nonhistone Scm3 and histones CenH3-H4 assemble the core of centromere-specific nucleosomes. Cell, 129(6), 1153–64.
Mohapatra, D., Mishra, S. and Sutar, N. (2010). Banana and its by-product utilization: an overview. J Sci Ind Res, 69(May), 323–329.
123
Nagaki, K., Cheng, Z., Ouyang, S., Talbert, P. B., Kim, M., Jones, K. M., Henikoff, S., Buell, C. R. and Jiang, J. (2004). Sequencing of a rice centromere uncovers active genes. Nature Genetics, 36(2), 138–45.
Nagaki, K., Kashihara, K. and Murata, M. (2009). A centromeric DNA sequence colocalized with a centromere-specific histone H3 in tobacco. Chromosoma, 118, 249–257.
Nechemia-Arbely, Y. (2012). Replicating centromeric chromatin: spatial and temporal control of CENP-A assembly. Experimental Cell Research, 318(12), 1353–60.
Neigenfind, J., Gyetvai, G., Basekow, R., Diehl, S., Achenbach, U., Gebhardt, C., Selbig, J. and Kersten, B. (2008). Haplotype inference from unphased SNP data in heterozygous polyploids based on SAT. BMC Genomics, 9, 356.
Neumann, P., Navrátilová, A., Schroeder-Reiter, E., Koblížková, A., Steinbauerová, V., Chocholová, E., Novák, P., Wanner, G. and Macas, J. (2012). Stretching the rules: Monocentric chromosomes with multiple centromere domains. PLoS Genetics, 8(6).
Niroula, R. K. and Bimb, H. P. (2009). Overview of Wheat X Maize System of Crosses for Dihaploid Induction in Wheat. World Applied Sciences Journal, 7(8), 1037–1045.
Nwakanma, D. C., Pillay, M., Okoli, B. E. and Tenkouano, A. (2003). Sectional relationships in the genus Musa L. inferred from the PCR-RFLP of organelle DNA sequences. TAG. Theoretical and Applied Genetics. Theoretische Und Angewandte Genetik, 107(5), 850–6.
Opara, U. L., Jacobson, D. and Al-Saady, N. A. (2010). Analysis of genetic diversity in banana cultivars (Musa cvs.) from the South of Oman using AFLP markers and classification by phylogenetic, hierarchical clustering and principal component analyses. Journal of Zhejiang University. Science. B, 11(5), 332–41.
Oselebe, H. O., Tenkouano, A., Pillay, M., Obi, I. U. and Uguru, M. I. (2006). Ploidy and Genome Segregation in Musa Breeding Populations Assessed by Flow Cytometry and Randomly Ampli fi ed Polymorphic DNA Markers. Journal of American Society for Horticultural Sciences, 131(6), 780–786.
Perrier, X., Bakry, F., Jenny, C., Horry, J., Lebot, V. and Hippolyte, I. (2009). Combining Biological Approaches to Shed Light on the Evolution of Edible Bananas. Geographical, 7, 199–216.
Perrier, X., De Langhe, E., Donohue, M., Lentfer, C., Vrydaghs, L., Bakry, F., Carreel, F., Hippolyte, I., Horry, J. P., Jenny, C., Lebot, V., Risterucci, A. M., Tomekpe, K., Doutrelepont, H., Ball, T., Manwaring, J., de Maret, P. and Denham, T. (2011). Multidisciplinary perspectives on banana (Musa spp.) domestication. Proceedings of the
124
National Academy of Sciences of the United States of America, 108(28), 11311–8.
Pignatta, D. and Comai, L. (2009). Parental squabbles and genome expression: lessons from the polyploids. Journal of Biology, 8(4), 43.
Raboin, L. M., Carreel, F., Noyer, J. L., Baurens, F. C., Horry, J. P., Bakry, F., Montcel, H. T. Du, Ganry, J., Lanaud, C. and Lagoda, P. J. L.Raboin, L. M., Carreel, F., Noyer, J. L., Baurens, F. C., Horry, J. P., Bakry, F., Montcel, H. T. Du, Ganry, J., Lanaud, C. and Lagoda, P. J. L. (2005). Diploid Ancestors of Triploid Export Banana Cultivars: Molecular Identification of 2n Restitution Gamete Donors and n Gamete Donors. Molecular Breeding, 16(4), 333–341.
Rando, O. (2007). Chromatin structure in the genomics era. Trends in Genetics, 23(2), 67–73.
Rapaport, F., Khanin, R., Liang, Y., Pirun, M., Krek, A., Zumbo, P., Mason, C. E., Socci, N. D. and Betel, D. (2013). Comprehensive evaluation of differential gene expression analysis methods for RNA-seq data. Genome Biology, 14(9), R95.
Rapp, R. A., Haigler, C. H., Flagel, L., Hovav, R. H., Udall, J. A. and Wendel, J. F. (2010). Gene expression in developing fibres of Upland cotton (Gossypium hirsutum L.) was massively altered by domestication. BMC Biology, 8(1), 139.
Ravi, M. and Chan, S. W. L. (2010). Haploid plants produced by centromere-mediated genome elimination. Nature, 464(7288), 615–8.
Ravi, M., Kwong, P. N., Menorca, R. M. G., Valencia, J. T., Ramahi, J. S., Stewart, J. L., Tran, R. K., Sundaresan, V., Comai, L. and Chan, S. W. L. (2010). The rapidly evolving centromere-specific histone has stringent functional requirements in Arabidopsis thaliana. Genetics, 186(2), 461–71.
Ravi, M., Shibata, F., Ramahi, J. S., Nagaki, K., Chen, C. and Chan, S. W. L. (2011). Meiosis-Specific Loading of the Centromere-Specific Histone CENH3 in Arabidopsis thaliana. PLoS Genetics, 7(6).
Robinson, J. C. (2010). Bananas and Plantains, 2nd Edition.
Ruangsuttapha, S., Eimert, K., Schröder, M. B., Silayoi, B., Denduangboripant, J. and Kanchanapoom, K. (2007). Molecular phylogeny of banana cultivars from Thailand based on HAT-RAPD markers. Genetic Resources and Crop Evolution, 54(7), 1565–1572.
Sanei, M., Pickering, R., Kumke, K., Nasuda, S. and Houben, A. (2011). Loss of centromeric histone H3 (CENH3) from centromeres precedes uniparental chromosome elimination in interspecific barley hybrids. Proceedings of the National Academy of Sciences of the

125
United States of America, 108, E498–E505.
Schubert, V., Lermontova, I. and Schubert, I. (2014). Loading of the centromeric histone H3 variant during meiosis-how does it differ from mitosis? Chromosoma.
Sen, G. L. and Blau, H. M. (2006). A brief history of RNAi : the silence of the genes elucidation of the silencing trigger. FASEB, 20, 1293–1299.
Seymour, D. K., Filiault, D. L., Henry, I. M., Monson-Miller, J., Ravi, M., Pang, A., Comai, L., Chan, S. W. L. and Maloof, J. N.Seymour, D. K., Filiault, D. L., Henry, I. M., Monson-Miller, J., Ravi, M., Pang, A., Comai, L., Chan, S. W. L. and Maloof, J. N. (2012). Rapid creation of Arabidopsis doubled haploid lines for quantitative trait locus mapping. Proceedings of the National Academy of Sciences of the United States of America, 109(11), 4227–32.
Sheinin, M. Y., Li, M., Soltani, M., Luger, K. and Wang, M. D. (2013). Torque modulates nucleosome stability and facilitates H2A/H2B dimer loss. Nature Communications, 4, 2579.
Shivaraju, M., Unruh, J. R., Slaughter, B. D., Mattingly, M., Berman, J. and Gerton, J. L. (2012). Cell-cycle-coupled structural oscillation of centromeric nucleosomes in yeast. Cell, 150(2), 304–16.
Simmonds, N. .Simmonds, N. (1953). Classification of the Bananas. Kew Bulletin, 8(4), 571–572.
Snape, J. W., Lane, M. and Britain, G. (1986). Doubled production in winter wheat and tricale genotypes, using the Hordeum bulbosum system. Euphytica, 35, 1045–1051.
Sorenson, M. D. and DaCosta, J. M. (2011). Genotyping HapSTR loci: phase determination from direct sequencing of PCR products. Molecular Ecology Resources, 11(6), 1068–75.
Souza, N. D. E. (2013). RNA-guided gene editing. Nature Methods, 10(3), 189.
Steiner, F. and Henikoff, S. (2014). Holocentromeres are dispersed point centromeres localized at transcription factor hotspots. eLife, 3, e02025.
Su, S., White, J., Balding, D. J. and Coin, L. J. M. (2008). Inference of haplotypic phase and missing genotypes in polyploid organisms and variable copy number genomic regions. BMC Bioinformatics, 9, 513.
Tachiwana, H. and Kurumizaka, H.Tachiwana, H. and Kurumizaka, H. (2011). Structure of the CENP-A nucleosome and its implications for centromeric chromatin architecture. Genes & Genetic Systems, 357–364.
126
Tagami, H., Ray-Gallet, D. (2004). Histone H3. 1 and H3. 3 complexes mediate nucleosome assembly pathways dependent or independent of DNA synthesis. Cell, 116(1), 51–61.
Talbert and Henikoff, S. (2010). Histone variants—ancient wrap artists of the epigenome. Nature Reviews Molecular Cell Biology, 11(4), 264–75.
Talbert, P. B., Bryson, T. D. and Henikoff, S. (2004). Adaptive evolution of centromere proteins in plants and animals. Journal of Biology.
Talbert, P. B., Masuelli, R., Tyagi, A. P., Comai, L. and Henikoff, S. (2002). Centromeric localization and adaptive evolution of an Arabidopsis histone H3 variant. The Plant Cell, 14(May), 1053–1066.
Tamura, K., Stecher, G., Peterson, D., Filipski, A. and Kumar, S.Tamura, K., Stecher, G., Peterson, D., Filipski, A. and Kumar, S. (2013). MEGA6: Molecular Evolutionary Genetics Analysis version 6.0. Molecular Biology and Evolution, 30(12), 2725–9.
Tek, A. L., Kashihara, K., Murata, M. and Nagaki, K. (2011). Functional centromeres in Astragalus sinicus include a compact centromere-specific histone H3 and a 20-bp tandem repeat. Chromosome Research, 19, 969–978.
Thomas-Hall, S., Campbell, P. R., Carlens, K., Kawanishi, E., Swennen, R., Sági, L. and Schenk, P. M. (2007). Phylogenetic and molecular analysis of the ribulose-1,5-bisphosphate carboxylase small subunit gene family in banana. Journal of Experimental Botany, 58(10), 2685–97.
Thompson, J. D., Higgins, D. G. and Gibson, T. J. (1994). CLUSTAL W: improving the sensitivity of progressive multiple sequence alignment through sequence weighting, position-specific gap penalties and weight matrix choice. Nucleic Acids Research, 22(22), 4673–80.
Tripathi, L., Tripathi, J. N. and Tushemereirwe, W. K. (2008). Rapid and efficient production of transgenic East African Highland Banana ( Musa spp .) using intercalary meristematic tissues. Journal of Biotechnology, 7(10), 1438–1445.
Tyson, J. and Armour, J. A. L. (2012). Determination of haplotypes at structurally complex regions using emulsion haplotype fusion PCR. BMC Genomics, 13(1), 1.
Ude, G., Pillay, M., Nwakanma, D. and and Tenkouano, A. (2002). Genetic Diversity in Musa acuminata Colla and Musa balbisiana Colla and some of their natural hybrids using AFLP Markers. TAG. Theoretical and Applied Genetics. Theoretische Und Angewandte Genetik, 104(8), 1246–1252.
127
Van Nocker, S., & Gardiner, S. E. (2014). Breeding better cultivars, faster: applications of new technologies for the rapid deployment of superior horticultural tree crops. Horticulture Research, 1(March), 14022.
Verdaasdonk, J. and Bloom, K. (2011). Centromeres: unique chromatin structures that drive chromosome segregation. Nature Reviews Molecular Cell Biology, 12(5), 320–32.
Wang, G., He, Q., Liu, F., Cheng, Z., Talbert, P. and Jin, W. (2011). Characterization of CENH3 proteins and centromere-associated DNA sequences in diploid and allotetraploid Brassica species. Chromosoma, 120(4), 353–65.
Wendt, T., Holm, P. B., Starker, C. G., Christian, M., Voytas, D. F., Brinch-Pedersen, H., & Holme, I. B. (2013). TAL effector nucleases induce mutations at a pre-selected location in the genome of primary barley transformants. Plant Molecular Biology, 83(3), 279–85.
Wisniewski, J., Hajj, B., Chen, J., Mizuguchi, G., Xiao, H., Wei, D., Dahan, M. and Wu, C. (2014). Imaging the fate of histone Cse4 reveals de novo replacement in S phase and subsequent stable residence at centromeres. eLife, 3, e02203.
Wong, C. (2001). Genetic Diversity of the Wild Banana Musa acuminata Colla in Malaysia as Evidenced by AFLP. Annals of Botany, 88(6), 1017–1025.
Wong, C. (2002). Assessment of the Validity of the Sections in Musa (Musaceae) using AFLP. Annals of Botany, 90(2), 231–238.
Yahata, M., Kunitake, H., Yabuya, T., Yamashita, K., Kashihara, Y. and Komatsu, H. (2005). Production of a Doubled Haploid from a Haploid Pummelo Using Colchicine Treatment of Axillary. Journal of American Society for Horticultural Sciences, 130(6), 899–903.
Yip, M. K., Lee, S.-W., Su, K. C., Lin, Y. H., Chen, T. Y. and Feng, T. Y. (2011). An easy and efficient protocol in the production of pflp transgenic banana against Fusarium wilt. Plant Biotechnology Reports, 5(3), 245–254.
Yoo, M. J., Liu, X., Pires, J. C., Soltis, P. S. and Soltis, D. E. (2014). Nonadditive Gene Expression in Polyploids. Annual Review of Genetics, 48(1), 485–517.
Yoo, M. J., Szadkowski, E. and Wendel, J. F. (2013). Homoeolog expression bias and expression level dominance in allopolyploid cotton. Heredity, 110(2), 171–80.
Yuan, J., Guo, X., Hu, J., Lv, Z. and Han, F. (2015). Characterization of two CENH3 genes and their roles in wheat evolution. New Phytologist, 206(2), 839–851.
Zhang, T., Talbert, P. B., Zhang, W., Wu, Y., Yang, Z., Henikoff, J. G., Henikoff, S. and Jiang, J.Zhang, T., Talbert, P. B. (2013). The CentO satellite confers translational and rotational phasing on cenH3 nucleosomes in rice centromeres. Proceedings of the

128
National Academy of Sciences of the United States of America, 110(50), E4875–83.
Zhong, C., Marshall, J. and Topp, C. (2002a). Centromeric retroelements and satellites interact with maize kinetochore protein CENH3. The Plant Cell, 14(11), 2825–2836.
Zhong, C. X., Marshall, J. B., Topp, C., Mroczek, R., Kato, A., Nagaki, K., Birchler, J. A., Jiang, J. and Dawe, R. K. (2002b). Centromeric retroelements and satellites interact with maize kinetochore protein CENH3. The Plant Cell, 14(November), 2825–2836.
Zhou, Z., Feng, H., Zhou, B., Ghirlando, R. and Hu, K. (2011). Structural basis for recognition of centromere histone variant CenH3 by the chaperone Scm3. Nature, 472(7342), 234–7.

129
8.0 LIST OF APPENDICES
Appendix 1: Transgenic lines for different constructs that were transferred to the glass house
Construct Line number
GFP- CenH3 2
GFP- CenH3 5
GFP- CenH3 7
GFP- CenH3 8
GFP- CenH3 9
GFP- CenH3 19
GFP- CenH3 11
GFP- CenH3 12
GFP- CenH3 17
GFP- CenH3 21
GFP-CenH3 31
GFP- CenH3 33
GFP- CenH3 34
GFP-CENH3 37
GFP- CenH3 40
GFP-Tailswap 1
GFP-Tailswap 2
GFP-Tailswap 4
GFP-Tailswap 6

130
GFP-Tailswap 7
GFP-Tailswap 9
Tailswap 2
Tailswap 3
Tailswap 4
Tailswap 6
Tailswap 7
Tailswap 8
Appendix 2: Ka/Ks values obtained in CenH3 full CDS alignment of different cultivars and exon/intron structure groups.
Seq1 Seq 2 Exon/intron structure
SynDif
SynPos
Ks NSynDif
NSynPos
Ka Ka/Ks
5 Kayinja CENH3 clone D
Sukali ndizi CENH3 clone B
5 7.67 106.08
0.076
14.33
310.92
0.0476
0.626315789
5 Kayinja CENH3 clone D
Sukali ndizi CENH3 clone C
5 9.67 106.08
0.0972
15.33
310.92
0.051
0.524691358
5 Kayinja CENH3 clone D
Sukali ndizi CENH3 clone E
5 6.67 106.08
0.0656
14.33
310.92
0.0476
0.725609756
5 Kayinja CENH3 clone D
Zebrina CENH3 clone D
5 6.67 106.08
0.0656
14.33
310.92
0.0476
0.725609756

131
5 Sukali ndizi CENH3 clone C
Sukali ndizi CENH3 clone B
5 4 105.5
0.0389
1 311.5
0.0032
0.082262211
5 Sukali ndizi CENH3 clone C
Sukali ndizi CENH3 clone E
5 3 105.5
0.029
1 311.5
0.0032
0.110344828
5 Sukali ndizi CENH3 clone C
Zebrina CENH3 clone D
5 3 105.5
0.029
1 311.5
0.0032
0.110344828
5 Zebrina CENH3 clone D
Sukali ndizi CENH3 clone B
5 1 105.5
0.0095
0 311.5
0 0
5 Zebrina CENH3 clone D
Sukali ndizi CENH3 clone E
5 0 105.5
0 0 311.5
0 0
5 Kayinja CENH3 clone D
Gros michel CENH3 clone A
7 2 106.58
0.019
4 310.42
0.013
0.684210526
5 Kayinja CENH3 clone D
Gros michel CENH3 clone B
7 2 106.58
0.019
4 310.42
0.013
0.684210526
5 Kayinja CENH3 clone D
Gros michel CENH3 clone C
7 2 106.58
0.019
4 310.42
0.013
0.684210526
5 Kayinja CENH3 clone D
Gros michel CENH3 clone D
7 2 106.58
0.019
4 310.42
0.013
0.684210526
5 Kayinja CENH3
Gros michel CENH3
7 2 106.58
0.019
4 310.42
0.013
0.68421052
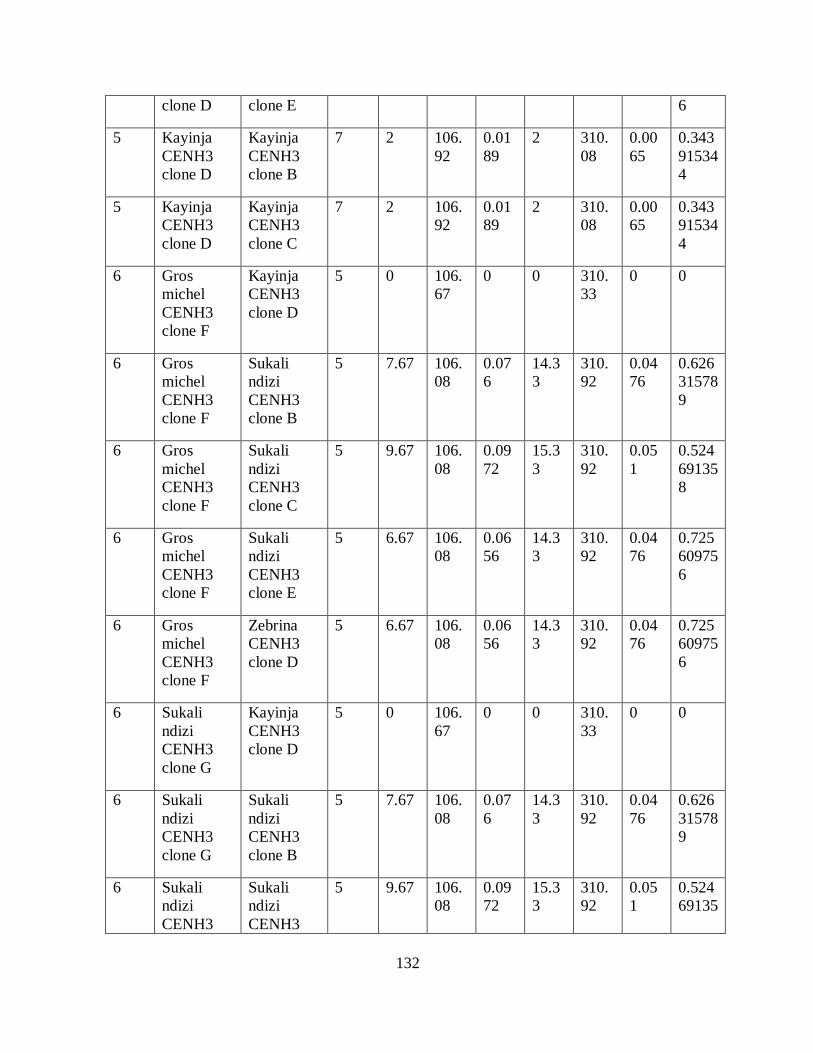
132
clone D clone E 6
5 Kayinja CENH3 clone D
Kayinja CENH3 clone B
7 2 106.92
0.0189
2 310.08
0.0065
0.343915344
5 Kayinja CENH3 clone D
Kayinja CENH3 clone C
7 2 106.92
0.0189
2 310.08
0.0065
0.343915344
6 Gros michel CENH3 clone F
Kayinja CENH3 clone D
5 0 106.67
0 0 310.33
0 0
6 Gros michel CENH3 clone F
Sukali ndizi CENH3 clone B
5 7.67 106.08
0.076
14.33
310.92
0.0476
0.626315789
6 Gros michel CENH3 clone F
Sukali ndizi CENH3 clone C
5 9.67 106.08
0.0972
15.33
310.92
0.051
0.524691358
6 Gros michel CENH3 clone F
Sukali ndizi CENH3 clone E
5 6.67 106.08
0.0656
14.33
310.92
0.0476
0.725609756
6 Gros michel CENH3 clone F
Zebrina CENH3 clone D
5 6.67 106.08
0.0656
14.33
310.92
0.0476
0.725609756
6 Sukali ndizi CENH3 clone G
Kayinja CENH3 clone D
5 0 106.67
0 0 310.33
0 0
6 Sukali ndizi CENH3 clone G
Sukali ndizi CENH3 clone B
5 7.67 106.08
0.076
14.33
310.92
0.0476
0.626315789
6 Sukali ndizi CENH3
Sukali ndizi CENH3
5 9.67 106.08
0.0972
15.33
310.92
0.051
0.52469135
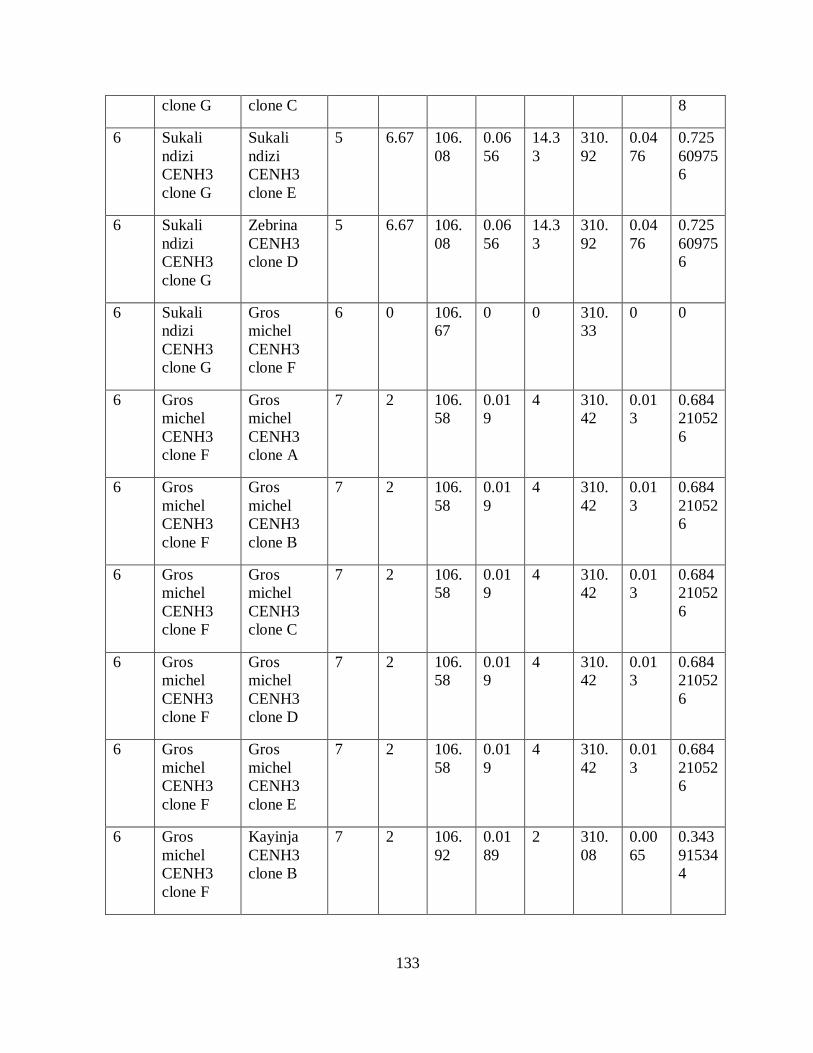
133
clone G clone C 8
6 Sukali ndizi CENH3 clone G
Sukali ndizi CENH3 clone E
5 6.67 106.08
0.0656
14.33
310.92
0.0476
0.725609756
6 Sukali ndizi CENH3 clone G
Zebrina CENH3 clone D
5 6.67 106.08
0.0656
14.33
310.92
0.0476
0.725609756
6 Sukali ndizi CENH3 clone G
Gros michel CENH3 clone F
6 0 106.67
0 0 310.33
0 0
6 Gros michel CENH3 clone F
Gros michel CENH3 clone A
7 2 106.58
0.019
4 310.42
0.013
0.684210526
6 Gros michel CENH3 clone F
Gros michel CENH3 clone B
7 2 106.58
0.019
4 310.42
0.013
0.684210526
6 Gros michel CENH3 clone F
Gros michel CENH3 clone C
7 2 106.58
0.019
4 310.42
0.013
0.684210526
6 Gros michel CENH3 clone F
Gros michel CENH3 clone D
7 2 106.58
0.019
4 310.42
0.013
0.684210526
6 Gros michel CENH3 clone F
Gros michel CENH3 clone E
7 2 106.58
0.019
4 310.42
0.013
0.684210526
6 Gros michel CENH3 clone F
Kayinja CENH3 clone B
7 2 106.92
0.0189
2 310.08
0.0065
0.343915344
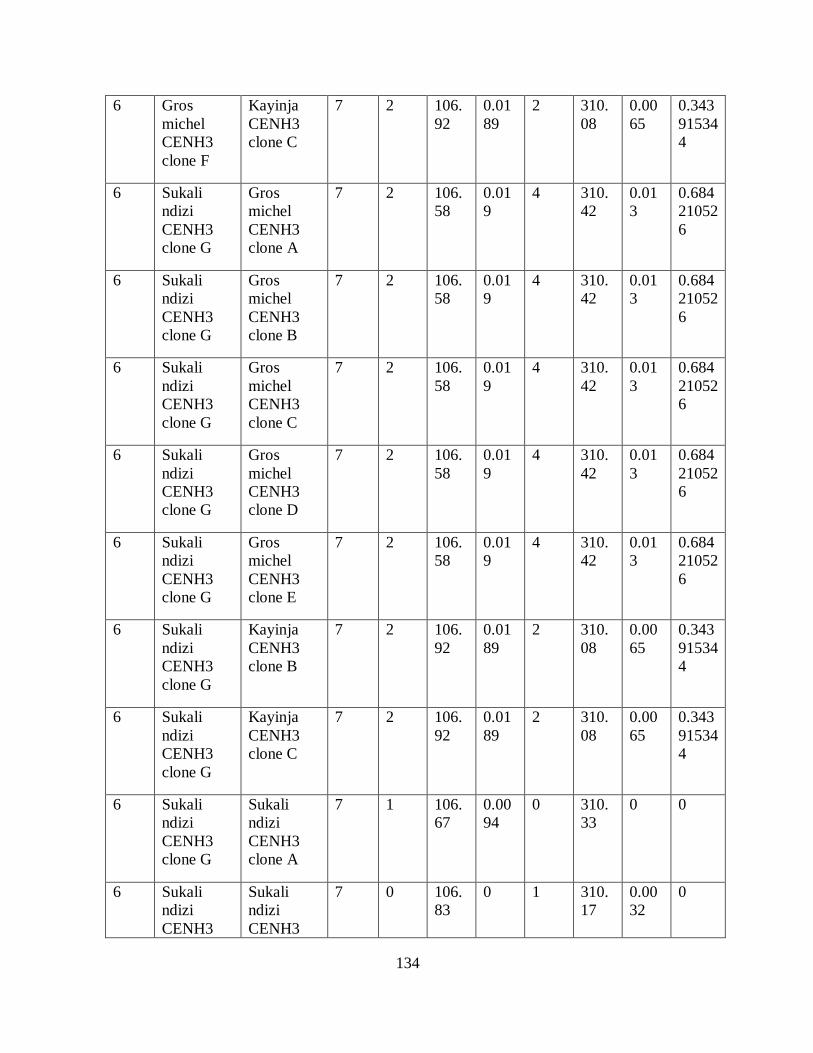
134
6 Gros michel CENH3 clone F
Kayinja CENH3 clone C
7 2 106.92
0.0189
2 310.08
0.0065
0.343915344
6 Sukali ndizi CENH3 clone G
Gros michel CENH3 clone A
7 2 106.58
0.019
4 310.42
0.013
0.684210526
6 Sukali ndizi CENH3 clone G
Gros michel CENH3 clone B
7 2 106.58
0.019
4 310.42
0.013
0.684210526
6 Sukali ndizi CENH3 clone G
Gros michel CENH3 clone C
7 2 106.58
0.019
4 310.42
0.013
0.684210526
6 Sukali ndizi CENH3 clone G
Gros michel CENH3 clone D
7 2 106.58
0.019
4 310.42
0.013
0.684210526
6 Sukali ndizi CENH3 clone G
Gros michel CENH3 clone E
7 2 106.58
0.019
4 310.42
0.013
0.684210526
6 Sukali ndizi CENH3 clone G
Kayinja CENH3 clone B
7 2 106.92
0.0189
2 310.08
0.0065
0.343915344
6 Sukali ndizi CENH3 clone G
Kayinja CENH3 clone C
7 2 106.92
0.0189
2 310.08
0.0065
0.343915344
6 Sukali ndizi CENH3 clone G
Sukali ndizi CENH3 clone A
7 1 106.67
0.0094
0 310.33
0 0
6 Sukali ndizi CENH3
Sukali ndizi CENH3
7 0 106.83
0 1 310.17
0.0032
0
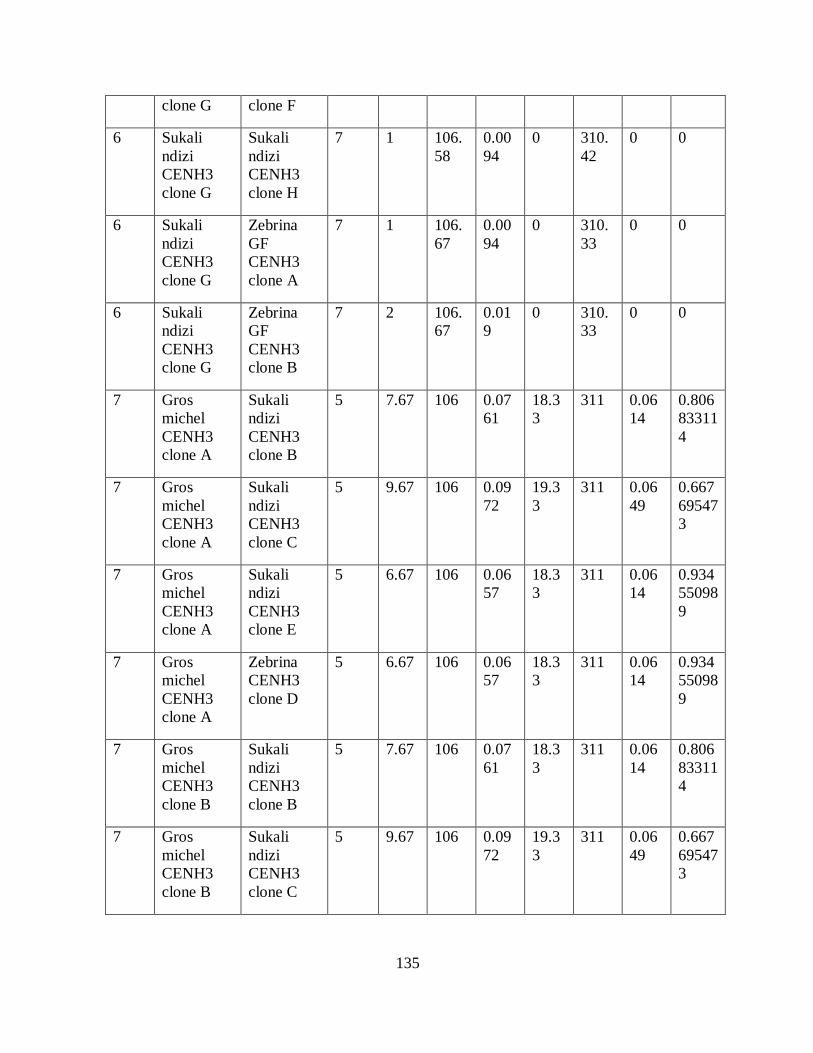
135
clone G clone F
6 Sukali ndizi CENH3 clone G
Sukali ndizi CENH3 clone H
7 1 106.58
0.0094
0 310.42
0 0
6 Sukali ndizi CENH3 clone G
Zebrina GF CENH3 clone A
7 1 106.67
0.0094
0 310.33
0 0
6 Sukali ndizi CENH3 clone G
Zebrina GF CENH3 clone B
7 2 106.67
0.019
0 310.33
0 0
7 Gros michel CENH3 clone A
Sukali ndizi CENH3 clone B
5 7.67 106 0.0761
18.33
311 0.0614
0.806833114
7 Gros michel CENH3 clone A
Sukali ndizi CENH3 clone C
5 9.67 106 0.0972
19.33
311 0.0649
0.667695473
7 Gros michel CENH3 clone A
Sukali ndizi CENH3 clone E
5 6.67 106 0.0657
18.33
311 0.0614
0.934550989
7 Gros michel CENH3 clone A
Zebrina CENH3 clone D
5 6.67 106 0.0657
18.33
311 0.0614
0.934550989
7 Gros michel CENH3 clone B
Sukali ndizi CENH3 clone B
5 7.67 106 0.0761
18.33
311 0.0614
0.806833114
7 Gros michel CENH3 clone B
Sukali ndizi CENH3 clone C
5 9.67 106 0.0972
19.33
311 0.0649
0.667695473
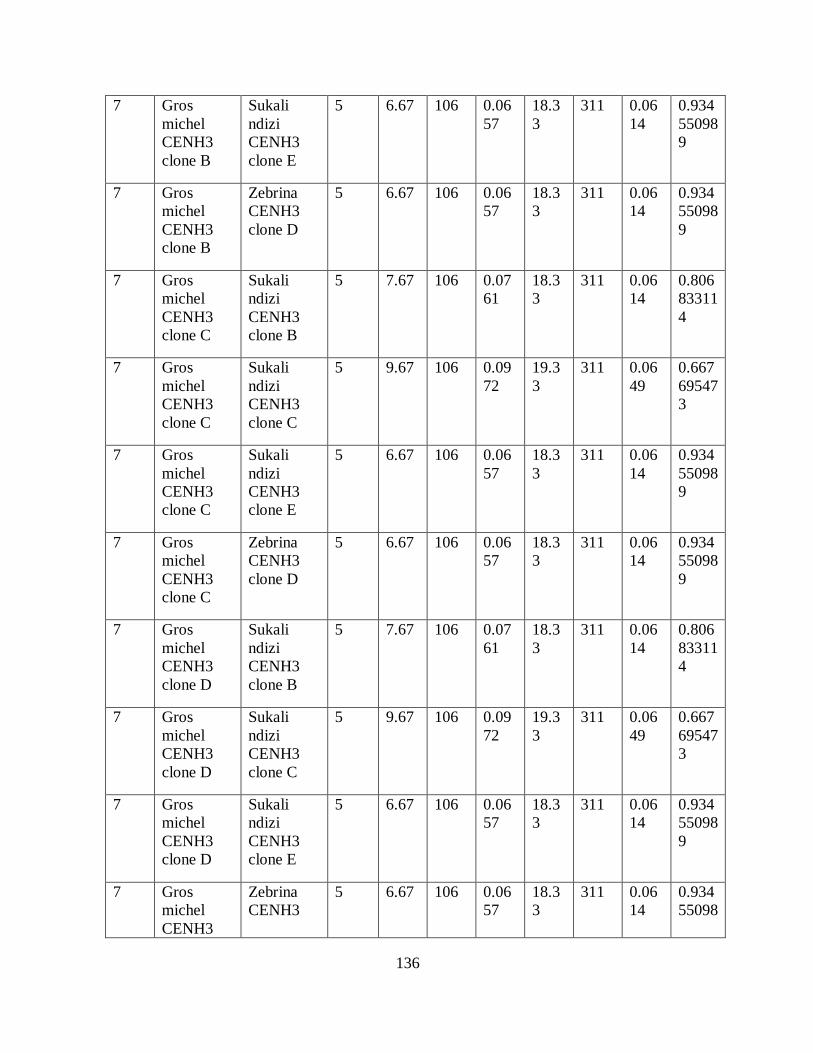
136
7 Gros michel CENH3 clone B
Sukali ndizi CENH3 clone E
5 6.67 106 0.0657
18.33
311 0.0614
0.934550989
7 Gros michel CENH3 clone B
Zebrina CENH3 clone D
5 6.67 106 0.0657
18.33
311 0.0614
0.934550989
7 Gros michel CENH3 clone C
Sukali ndizi CENH3 clone B
5 7.67 106 0.0761
18.33
311 0.0614
0.806833114
7 Gros michel CENH3 clone C
Sukali ndizi CENH3 clone C
5 9.67 106 0.0972
19.33
311 0.0649
0.667695473
7 Gros michel CENH3 clone C
Sukali ndizi CENH3 clone E
5 6.67 106 0.0657
18.33
311 0.0614
0.934550989
7 Gros michel CENH3 clone C
Zebrina CENH3 clone D
5 6.67 106 0.0657
18.33
311 0.0614
0.934550989
7 Gros michel CENH3 clone D
Sukali ndizi CENH3 clone B
5 7.67 106 0.0761
18.33
311 0.0614
0.806833114
7 Gros michel CENH3 clone D
Sukali ndizi CENH3 clone C
5 9.67 106 0.0972
19.33
311 0.0649
0.667695473
7 Gros michel CENH3 clone D
Sukali ndizi CENH3 clone E
5 6.67 106 0.0657
18.33
311 0.0614
0.934550989
7 Gros michel CENH3
Zebrina CENH3
5 6.67 106 0.0657
18.33
311 0.0614
0.93455098

137
clone D clone D 9
7 Gros michel CENH3 clone E
Sukali ndizi CENH3 clone B
5 7.67 106 0.0761
18.33
311 0.0614
0.806833114
7 Gros michel CENH3 clone E
Sukali ndizi CENH3 clone C
5 9.67 106 0.0972
19.33
311 0.0649
0.667695473
7 Gros michel CENH3 clone E
Sukali ndizi CENH3 clone E
5 6.67 106 0.0657
18.33
311 0.0614
0.934550989
7 Gros michel CENH3 clone E
Zebrina CENH3 clone D
5 6.67 106 0.0657
18.33
311 0.0614
0.934550989
7 Kayinja CENH3 clone B
Sukali ndizi CENH3 clone B
5 7.67 106.33
0.0758
16.33
310.67
0.0545
0.718997361
7 Kayinja CENH3 clone B
Sukali ndizi CENH3 clone C
5 9.67 106.33
0.0969
17.33
310.67
0.058
0.598555212
7 Kayinja CENH3 clone B
Sukali ndizi CENH3 clone E
5 6.67 106.33
0.0655
16.33
310.67
0.0545
0.832061069
7 Kayinja CENH3 clone B
Zebrina CENH3 clone D
5 6.67 106.33
0.0655
16.33
310.67
0.0545
0.832061069
7 Kayinja CENH3 clone C
Sukali ndizi CENH3 clone B
5 7.67 106.33
0.0758
16.33
310.67
0.0545
0.718997361
7 Kayinja CENH3
Sukali ndizi
5 9.67 106. 0.09 17.3 310. 0.05 0.59855521

138
clone C CENH3 clone C
33 69 3 67 8 2
7 Kayinja CENH3 clone C
Sukali ndizi CENH3 clone E
5 6.67 106.33
0.0655
16.33
310.67
0.0545
0.832061069
7 Kayinja CENH3 clone C
Zebrina CENH3 clone D
5 6.67 106.33
0.0655
16.33
310.67
0.0545
0.832061069
7 Sukali ndizi CENH3 clone A
Kayinja CENH3 clone D
5 1 106.67
0.0094
0 310.33
0 0
7 Sukali ndizi CENH3 clone A
Sukali ndizi CENH3 clone B
5 7.67 106.08
0.076
14.33
310.92
0.0476
0.626315789
7 Sukali ndizi CENH3 clone A
Sukali ndizi CENH3 clone C
5 9.67 106.08
0.0972
15.33
310.92
0.051
0.524691358
7 Sukali ndizi CENH3 clone A
Sukali ndizi CENH3 clone E
5 6.67 106.08
0.0656
14.33
310.92
0.0476
0.725609756
7 Sukali ndizi CENH3 clone A
Zebrina CENH3 clone D
5 6.67 106.08
0.0656
14.33
310.92
0.0476
0.725609756
7 Sukali ndizi CENH3 clone B
Sukali ndizi CENH3 clone E
5 1 105.5
0.0095
0 311.5
0 0
7 Sukali ndizi CENH3 clone F
Kayinja CENH3 clone D
5 0 106.83
0 1 310.17
0.0032
0
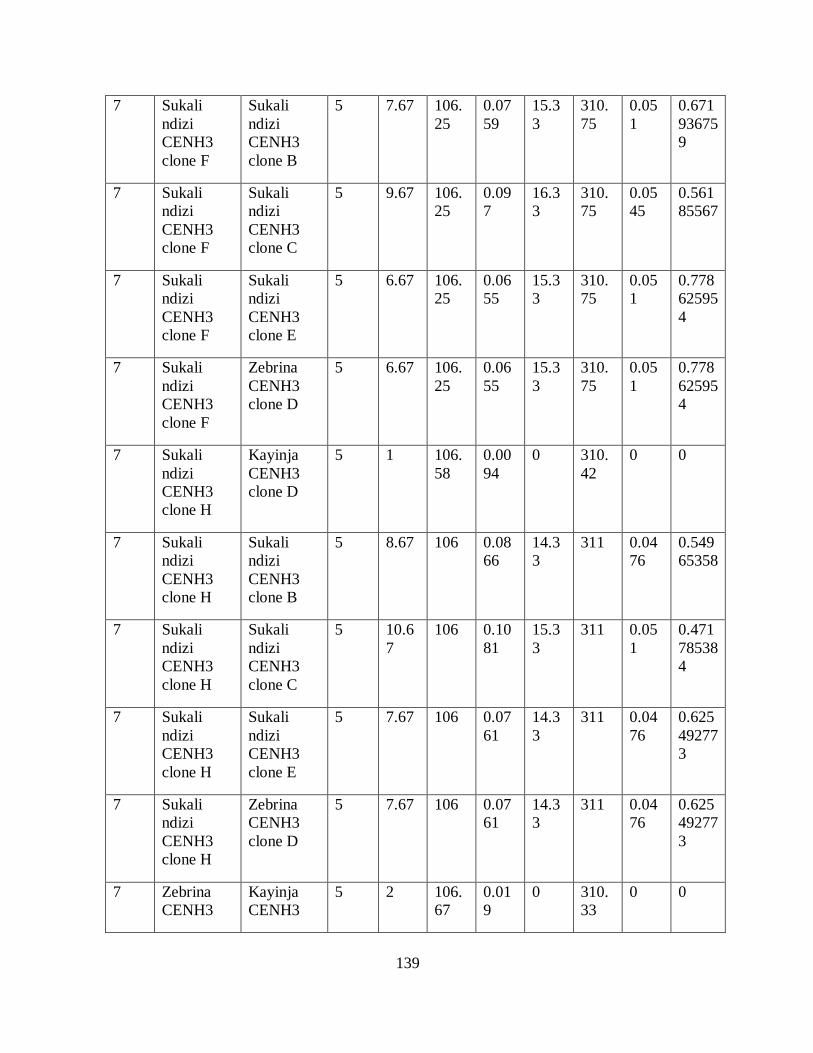
139
7 Sukali ndizi CENH3 clone F
Sukali ndizi CENH3 clone B
5 7.67 106.25
0.0759
15.33
310.75
0.051
0.671936759
7 Sukali ndizi CENH3 clone F
Sukali ndizi CENH3 clone C
5 9.67 106.25
0.097
16.33
310.75
0.0545
0.56185567
7 Sukali ndizi CENH3 clone F
Sukali ndizi CENH3 clone E
5 6.67 106.25
0.0655
15.33
310.75
0.051
0.778625954
7 Sukali ndizi CENH3 clone F
Zebrina CENH3 clone D
5 6.67 106.25
0.0655
15.33
310.75
0.051
0.778625954
7 Sukali ndizi CENH3 clone H
Kayinja CENH3 clone D
5 1 106.58
0.0094
0 310.42
0 0
7 Sukali ndizi CENH3 clone H
Sukali ndizi CENH3 clone B
5 8.67 106 0.0866
14.33
311 0.0476
0.54965358
7 Sukali ndizi CENH3 clone H
Sukali ndizi CENH3 clone C
5 10.67
106 0.1081
15.33
311 0.051
0.471785384
7 Sukali ndizi CENH3 clone H
Sukali ndizi CENH3 clone E
5 7.67 106 0.0761
14.33
311 0.0476
0.625492773
7 Sukali ndizi CENH3 clone H
Zebrina CENH3 clone D
5 7.67 106 0.0761
14.33
311 0.0476
0.625492773
7 Zebrina CENH3
Kayinja CENH3
5 2 106.67
0.019
0 310.33
0 0
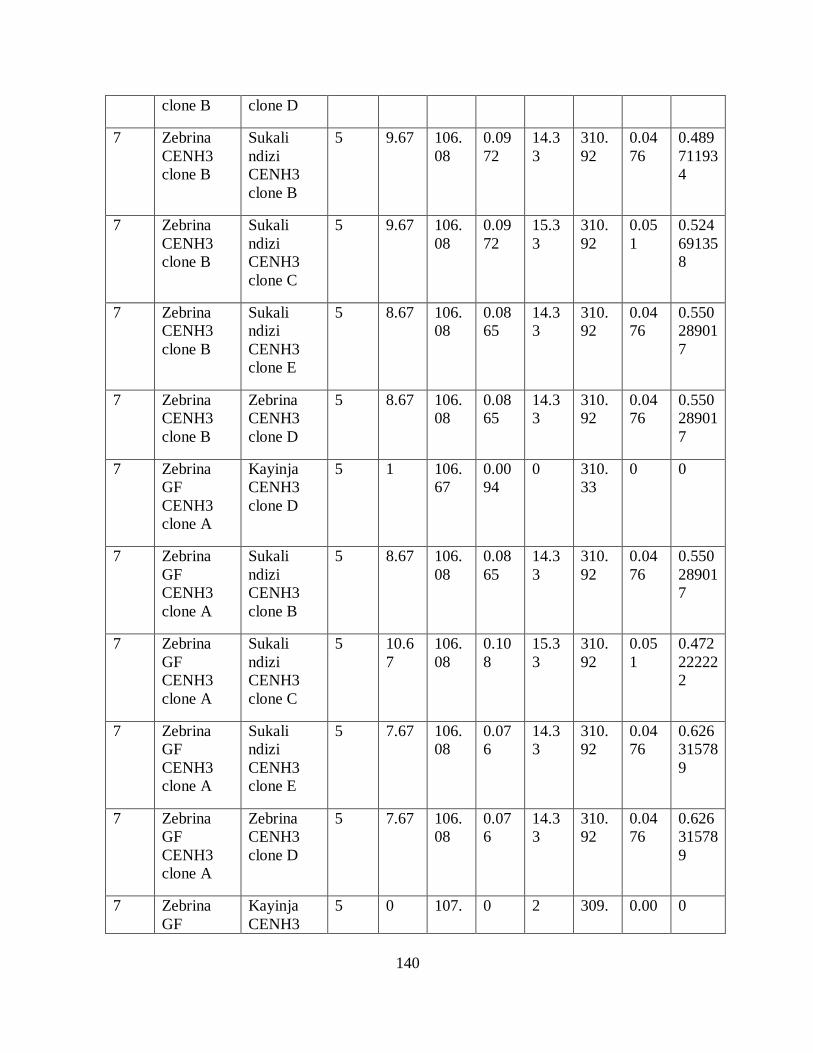
140
clone B clone D
7 Zebrina CENH3 clone B
Sukali ndizi CENH3 clone B
5 9.67 106.08
0.0972
14.33
310.92
0.0476
0.489711934
7 Zebrina CENH3 clone B
Sukali ndizi CENH3 clone C
5 9.67 106.08
0.0972
15.33
310.92
0.051
0.524691358
7 Zebrina CENH3 clone B
Sukali ndizi CENH3 clone E
5 8.67 106.08
0.0865
14.33
310.92
0.0476
0.550289017
7 Zebrina CENH3 clone B
Zebrina CENH3 clone D
5 8.67 106.08
0.0865
14.33
310.92
0.0476
0.550289017
7 Zebrina GF CENH3 clone A
Kayinja CENH3 clone D
5 1 106.67
0.0094
0 310.33
0 0
7 Zebrina GF CENH3 clone A
Sukali ndizi CENH3 clone B
5 8.67 106.08
0.0865
14.33
310.92
0.0476
0.550289017
7 Zebrina GF CENH3 clone A
Sukali ndizi CENH3 clone C
5 10.67
106.08
0.108
15.33
310.92
0.051
0.472222222
7 Zebrina GF CENH3 clone A
Sukali ndizi CENH3 clone E
5 7.67 106.08
0.076
14.33
310.92
0.0476
0.626315789
7 Zebrina GF CENH3 clone A
Zebrina CENH3 clone D
5 7.67 106.08
0.076
14.33
310.92
0.0476
0.626315789
7 Zebrina GF
Kayinja CENH3
5 0 107. 0 2 309. 0.00 0
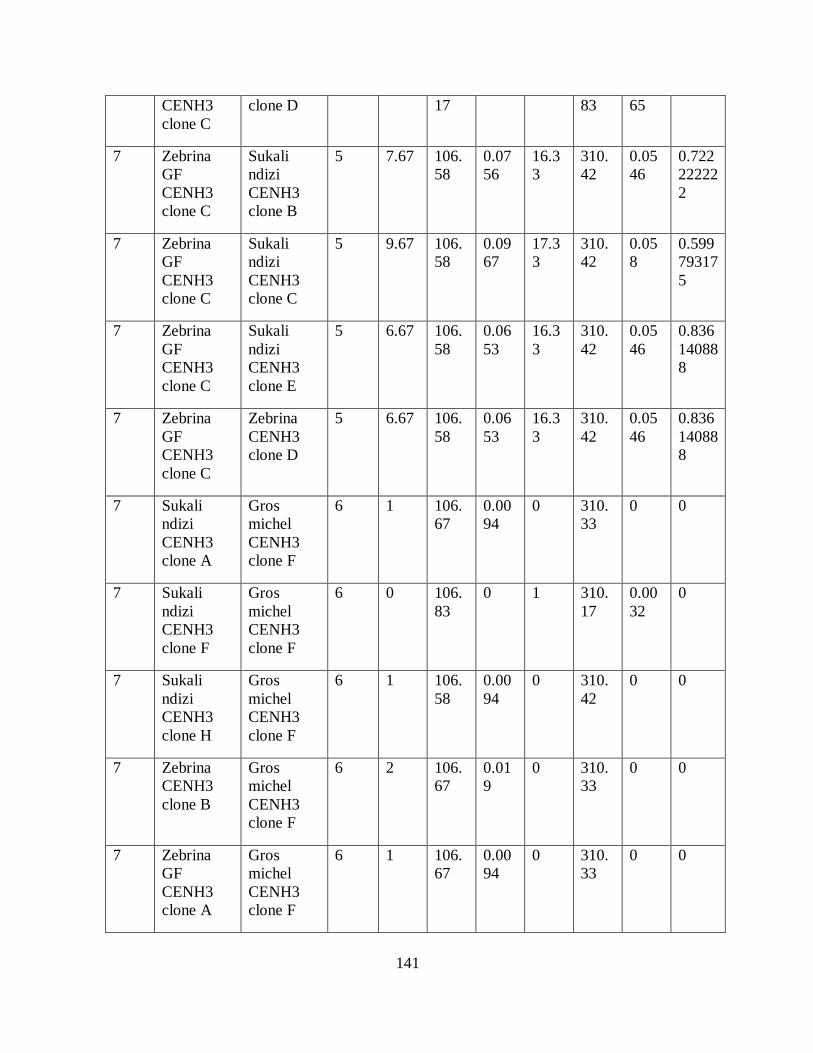
141
CENH3 clone C
clone D 17 83 65
7 Zebrina GF CENH3 clone C
Sukali ndizi CENH3 clone B
5 7.67 106.58
0.0756
16.33
310.42
0.0546
0.722222222
7 Zebrina GF CENH3 clone C
Sukali ndizi CENH3 clone C
5 9.67 106.58
0.0967
17.33
310.42
0.058
0.599793175
7 Zebrina GF CENH3 clone C
Sukali ndizi CENH3 clone E
5 6.67 106.58
0.0653
16.33
310.42
0.0546
0.836140888
7 Zebrina GF CENH3 clone C
Zebrina CENH3 clone D
5 6.67 106.58
0.0653
16.33
310.42
0.0546
0.836140888
7 Sukali ndizi CENH3 clone A
Gros michel CENH3 clone F
6 1 106.67
0.0094
0 310.33
0 0
7 Sukali ndizi CENH3 clone F
Gros michel CENH3 clone F
6 0 106.83
0 1 310.17
0.0032
0
7 Sukali ndizi CENH3 clone H
Gros michel CENH3 clone F
6 1 106.58
0.0094
0 310.42
0 0
7 Zebrina CENH3 clone B
Gros michel CENH3 clone F
6 2 106.67
0.019
0 310.33
0 0
7 Zebrina GF CENH3 clone A
Gros michel CENH3 clone F
6 1 106.67
0.0094
0 310.33
0 0
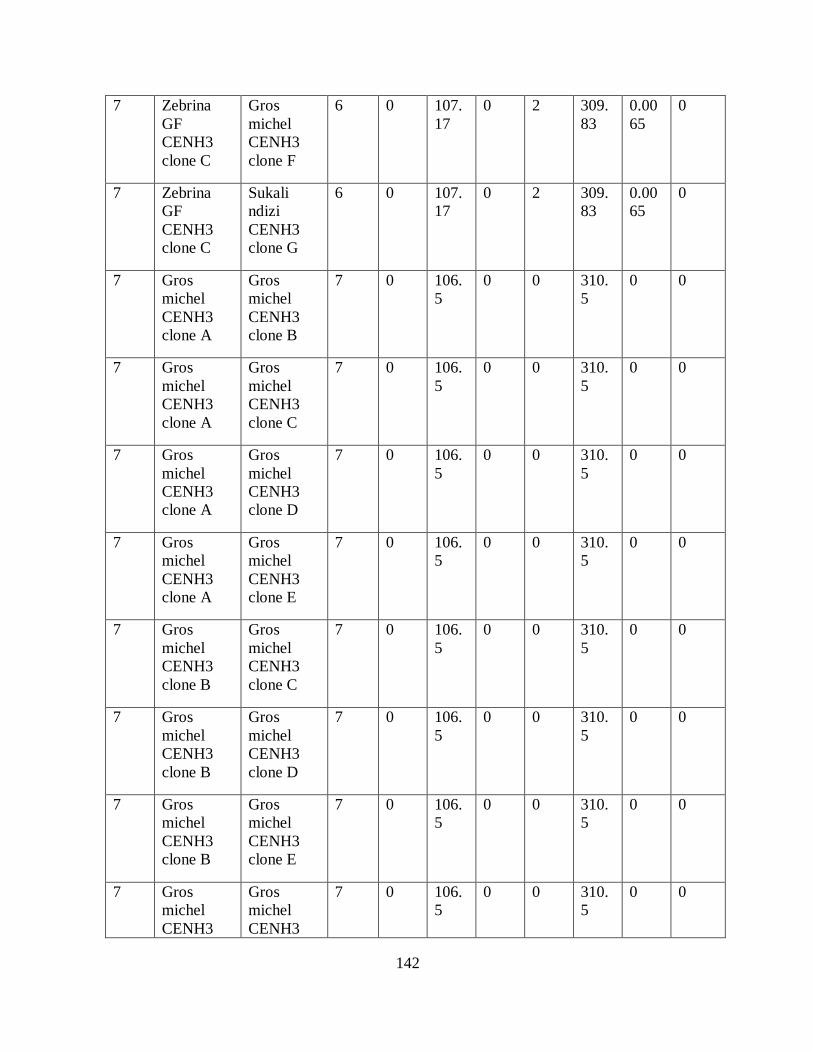
142
7 Zebrina GF CENH3 clone C
Gros michel CENH3 clone F
6 0 107.17
0 2 309.83
0.0065
0
7 Zebrina GF CENH3 clone C
Sukali ndizi CENH3 clone G
6 0 107.17
0 2 309.83
0.0065
0
7 Gros michel CENH3 clone A
Gros michel CENH3 clone B
7 0 106.5
0 0 310.5
0 0
7 Gros michel CENH3 clone A
Gros michel CENH3 clone C
7 0 106.5
0 0 310.5
0 0
7 Gros michel CENH3 clone A
Gros michel CENH3 clone D
7 0 106.5
0 0 310.5
0 0
7 Gros michel CENH3 clone A
Gros michel CENH3 clone E
7 0 106.5
0 0 310.5
0 0
7 Gros michel CENH3 clone B
Gros michel CENH3 clone C
7 0 106.5
0 0 310.5
0 0
7 Gros michel CENH3 clone B
Gros michel CENH3 clone D
7 0 106.5
0 0 310.5
0 0
7 Gros michel CENH3 clone B
Gros michel CENH3 clone E
7 0 106.5
0 0 310.5
0 0
7 Gros michel CENH3
Gros michel CENH3
7 0 106.5
0 0 310.5
0 0
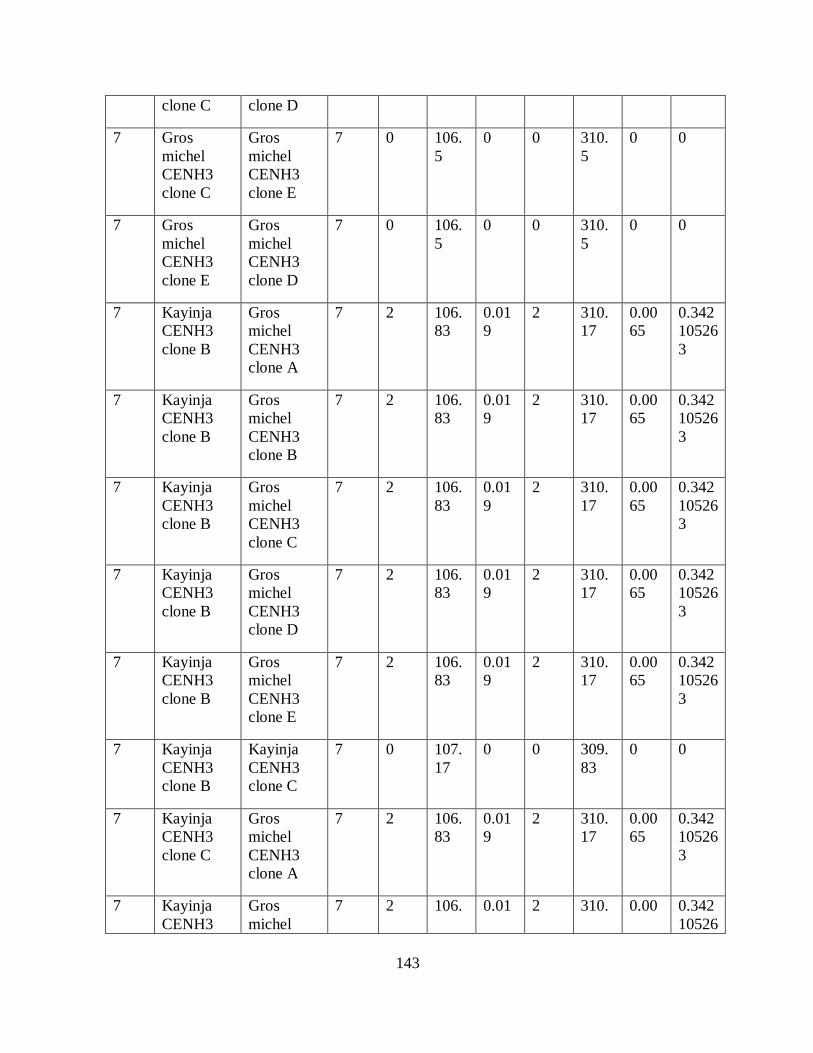
143
clone C clone D
7 Gros michel CENH3 clone C
Gros michel CENH3 clone E
7 0 106.5
0 0 310.5
0 0
7 Gros michel CENH3 clone E
Gros michel CENH3 clone D
7 0 106.5
0 0 310.5
0 0
7 Kayinja CENH3 clone B
Gros michel CENH3 clone A
7 2 106.83
0.019
2 310.17
0.0065
0.342105263
7 Kayinja CENH3 clone B
Gros michel CENH3 clone B
7 2 106.83
0.019
2 310.17
0.0065
0.342105263
7 Kayinja CENH3 clone B
Gros michel CENH3 clone C
7 2 106.83
0.019
2 310.17
0.0065
0.342105263
7 Kayinja CENH3 clone B
Gros michel CENH3 clone D
7 2 106.83
0.019
2 310.17
0.0065
0.342105263
7 Kayinja CENH3 clone B
Gros michel CENH3 clone E
7 2 106.83
0.019
2 310.17
0.0065
0.342105263
7 Kayinja CENH3 clone B
Kayinja CENH3 clone C
7 0 107.17
0 0 309.83
0 0
7 Kayinja CENH3 clone C
Gros michel CENH3 clone A
7 2 106.83
0.019
2 310.17
0.0065
0.342105263
7 Kayinja CENH3
Gros michel
7 2 106. 0.01 2 310. 0.00 0.34210526

144
clone C CENH3 clone B
83 9 17 65 3
7 Kayinja CENH3 clone C
Gros michel CENH3 clone C
7 2 106.83
0.019
2 310.17
0.0065
0.342105263
7 Kayinja CENH3 clone C
Gros michel CENH3 clone D
7 2 106.83
0.019
2 310.17
0.0065
0.342105263
7 Kayinja CENH3 clone C
Gros michel CENH3 clone E
7 2 106.83
0.019
2 310.17
0.0065
0.342105263
7 Sukali ndizi CENH3 clone A
Gros michel CENH3 clone A
7 3 106.58
0.0287
4 310.42
0.013
0.452961672
7 Sukali ndizi CENH3 clone A
Gros michel CENH3 clone B
7 3 106.58
0.0287
4 310.42
0.013
0.452961672
7 Sukali ndizi CENH3 clone A
Gros michel CENH3 clone C
7 3 106.58
0.0287
4 310.42
0.013
0.452961672
7 Sukali ndizi CENH3 clone A
Gros michel CENH3 clone D
7 3 106.58
0.0287
4 310.42
0.013
0.452961672
7 Sukali ndizi CENH3 clone A
Gros michel CENH3 clone E
7 3 106.58
0.0287
4 310.42
0.013
0.452961672
7 Sukali ndizi CENH3 clone A
Kayinja CENH3 clone B
7 3 106.92
0.0286
2 310.08
0.0065
0.227272727
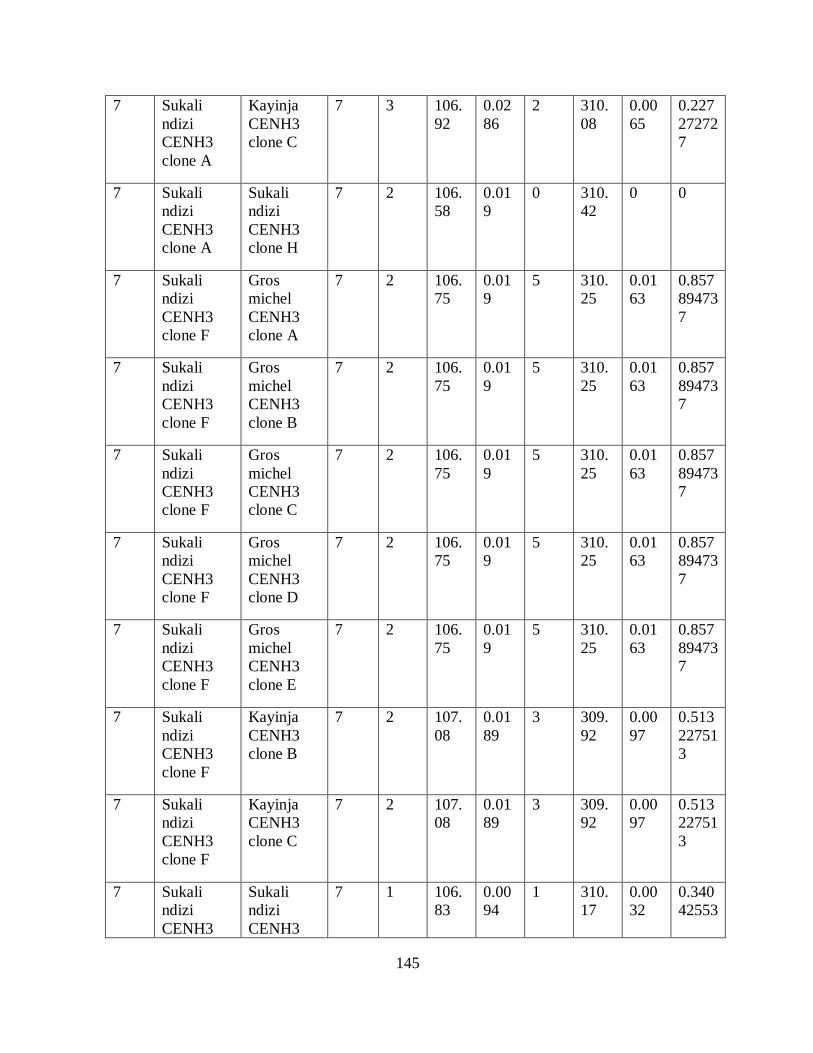
145
7 Sukali ndizi CENH3 clone A
Kayinja CENH3 clone C
7 3 106.92
0.0286
2 310.08
0.0065
0.227272727
7 Sukali ndizi CENH3 clone A
Sukali ndizi CENH3 clone H
7 2 106.58
0.019
0 310.42
0 0
7 Sukali ndizi CENH3 clone F
Gros michel CENH3 clone A
7 2 106.75
0.019
5 310.25
0.0163
0.857894737
7 Sukali ndizi CENH3 clone F
Gros michel CENH3 clone B
7 2 106.75
0.019
5 310.25
0.0163
0.857894737
7 Sukali ndizi CENH3 clone F
Gros michel CENH3 clone C
7 2 106.75
0.019
5 310.25
0.0163
0.857894737
7 Sukali ndizi CENH3 clone F
Gros michel CENH3 clone D
7 2 106.75
0.019
5 310.25
0.0163
0.857894737
7 Sukali ndizi CENH3 clone F
Gros michel CENH3 clone E
7 2 106.75
0.019
5 310.25
0.0163
0.857894737
7 Sukali ndizi CENH3 clone F
Kayinja CENH3 clone B
7 2 107.08
0.0189
3 309.92
0.0097
0.513227513
7 Sukali ndizi CENH3 clone F
Kayinja CENH3 clone C
7 2 107.08
0.0189
3 309.92
0.0097
0.513227513
7 Sukali ndizi CENH3
Sukali ndizi CENH3
7 1 106.83
0.0094
1 310.17
0.0032
0.34042553
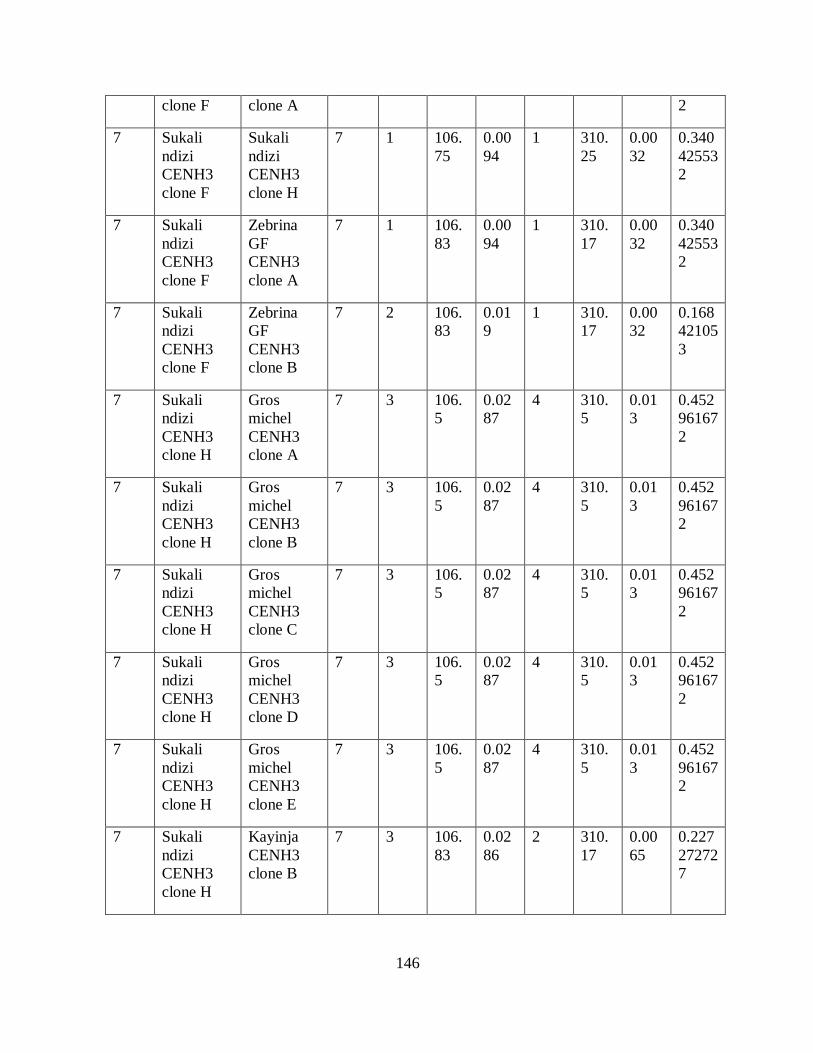
146
clone F clone A 2
7 Sukali ndizi CENH3 clone F
Sukali ndizi CENH3 clone H
7 1 106.75
0.0094
1 310.25
0.0032
0.340425532
7 Sukali ndizi CENH3 clone F
Zebrina GF CENH3 clone A
7 1 106.83
0.0094
1 310.17
0.0032
0.340425532
7 Sukali ndizi CENH3 clone F
Zebrina GF CENH3 clone B
7 2 106.83
0.019
1 310.17
0.0032
0.168421053
7 Sukali ndizi CENH3 clone H
Gros michel CENH3 clone A
7 3 106.5
0.0287
4 310.5
0.013
0.452961672
7 Sukali ndizi CENH3 clone H
Gros michel CENH3 clone B
7 3 106.5
0.0287
4 310.5
0.013
0.452961672
7 Sukali ndizi CENH3 clone H
Gros michel CENH3 clone C
7 3 106.5
0.0287
4 310.5
0.013
0.452961672
7 Sukali ndizi CENH3 clone H
Gros michel CENH3 clone D
7 3 106.5
0.0287
4 310.5
0.013
0.452961672
7 Sukali ndizi CENH3 clone H
Gros michel CENH3 clone E
7 3 106.5
0.0287
4 310.5
0.013
0.452961672
7 Sukali ndizi CENH3 clone H
Kayinja CENH3 clone B
7 3 106.83
0.0286
2 310.17
0.0065
0.227272727

147
7 Sukali ndizi CENH3 clone H
Kayinja CENH3 clone C
7 3 106.83
0.0286
2 310.17
0.0065
0.227272727
7 Zebrina CENH3 clone B
Gros michel CENH3 clone A
7 4 106.58
0.0385
4 310.42
0.013
0.337662338
7 Zebrina CENH3 clone B
Gros michel CENH3 clone B
7 4 106.58
0.0385
4 310.42
0.013
0.337662338
7 Zebrina CENH3 clone B
Gros michel CENH3 clone C
7 4 106.58
0.0385
4 310.42
0.013
0.337662338
7 Zebrina CENH3 clone B
Gros michel CENH3 clone D
7 4 106.58
0.0385
4 310.42
0.013
0.337662338
7 Zebrina CENH3 clone B
Gros michel CENH3 clone E
7 4 106.58
0.0385
4 310.42
0.013
0.337662338
7 Zebrina CENH3 clone B
Kayinja CENH3 clone B
7 4 106.92
0.0384
2 310.08
0.0065
0.169270833
7 Zebrina CENH3 clone B
Kayinja CENH3 clone C
7 4 106.92
0.0384
2 310.08
0.0065
0.169270833
7 Zebrina CENH3 clone B
Sukali ndizi CENH3 clone A
7 3 106.67
0.0287
0 310.33
0 0
7 Zebrina CENH3 clone B
Sukali ndizi CENH3 clone H
7 3 106.58
0.0287
0 310.42
0 0
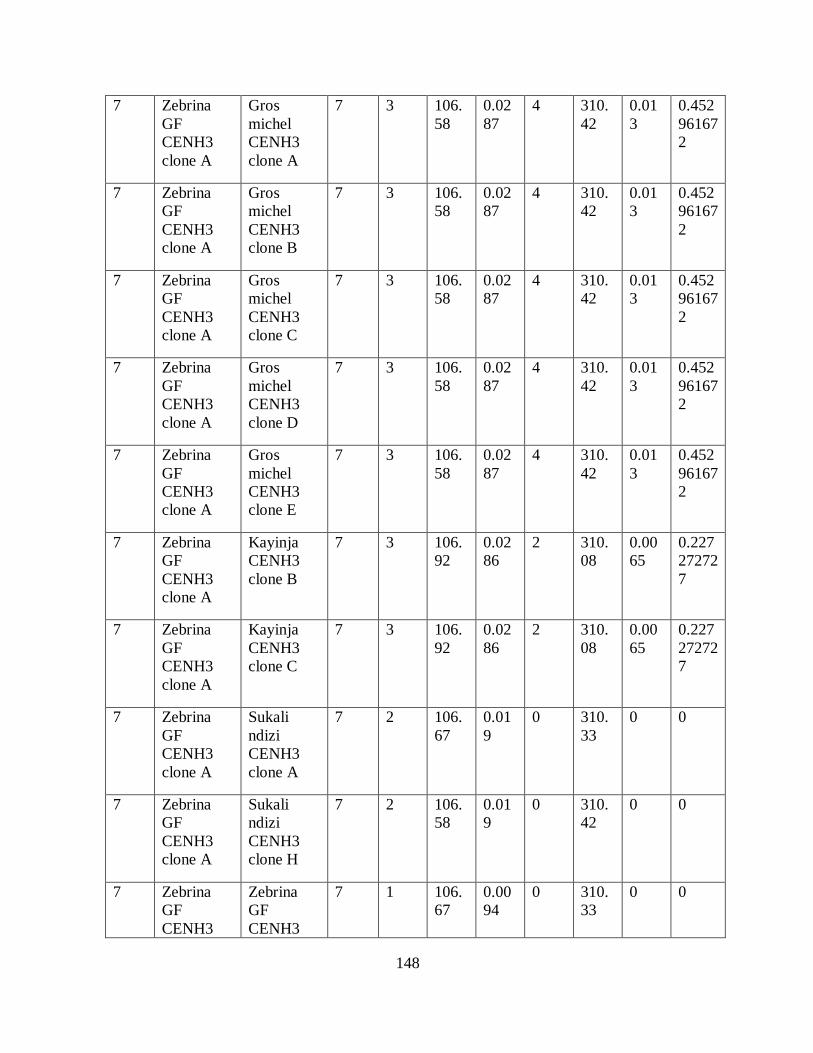
148
7 Zebrina GF CENH3 clone A
Gros michel CENH3 clone A
7 3 106.58
0.0287
4 310.42
0.013
0.452961672
7 Zebrina GF CENH3 clone A
Gros michel CENH3 clone B
7 3 106.58
0.0287
4 310.42
0.013
0.452961672
7 Zebrina GF CENH3 clone A
Gros michel CENH3 clone C
7 3 106.58
0.0287
4 310.42
0.013
0.452961672
7 Zebrina GF CENH3 clone A
Gros michel CENH3 clone D
7 3 106.58
0.0287
4 310.42
0.013
0.452961672
7 Zebrina GF CENH3 clone A
Gros michel CENH3 clone E
7 3 106.58
0.0287
4 310.42
0.013
0.452961672
7 Zebrina GF CENH3 clone A
Kayinja CENH3 clone B
7 3 106.92
0.0286
2 310.08
0.0065
0.227272727
7 Zebrina GF CENH3 clone A
Kayinja CENH3 clone C
7 3 106.92
0.0286
2 310.08
0.0065
0.227272727
7 Zebrina GF CENH3 clone A
Sukali ndizi CENH3 clone A
7 2 106.67
0.019
0 310.33
0 0
7 Zebrina GF CENH3 clone A
Sukali ndizi CENH3 clone H
7 2 106.58
0.019
0 310.42
0 0
7 Zebrina GF CENH3
Zebrina GF CENH3
7 1 106.67
0.0094
0 310.33
0 0
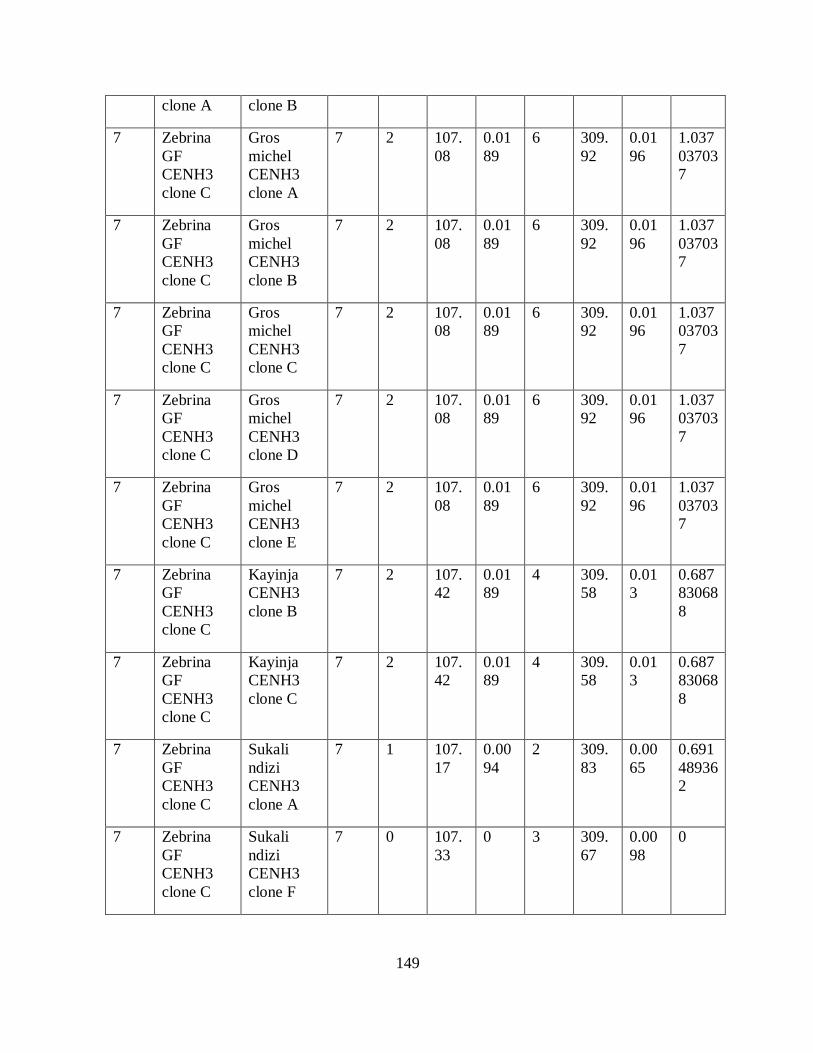
149
clone A clone B
7 Zebrina GF CENH3 clone C
Gros michel CENH3 clone A
7 2 107.08
0.0189
6 309.92
0.0196
1.037037037
7 Zebrina GF CENH3 clone C
Gros michel CENH3 clone B
7 2 107.08
0.0189
6 309.92
0.0196
1.037037037
7 Zebrina GF CENH3 clone C
Gros michel CENH3 clone C
7 2 107.08
0.0189
6 309.92
0.0196
1.037037037
7 Zebrina GF CENH3 clone C
Gros michel CENH3 clone D
7 2 107.08
0.0189
6 309.92
0.0196
1.037037037
7 Zebrina GF CENH3 clone C
Gros michel CENH3 clone E
7 2 107.08
0.0189
6 309.92
0.0196
1.037037037
7 Zebrina GF CENH3 clone C
Kayinja CENH3 clone B
7 2 107.42
0.0189
4 309.58
0.013
0.687830688
7 Zebrina GF CENH3 clone C
Kayinja CENH3 clone C
7 2 107.42
0.0189
4 309.58
0.013
0.687830688
7 Zebrina GF CENH3 clone C
Sukali ndizi CENH3 clone A
7 1 107.17
0.0094
2 309.83
0.0065
0.691489362
7 Zebrina GF CENH3 clone C
Sukali ndizi CENH3 clone F
7 0 107.33
0 3 309.67
0.0098
0

150
7 Zebrina GF CENH3 clone C
Sukali ndizi CENH3 clone H
7 1 107.08
0.0094
2 309.92
0.0065
0.691489362
7 Zebrina GF CENH3 clone C
Zebrina GF CENH3 clone A
7 1 107.17
0.0094
2 309.83
0.0065
0.691489362
7 Zebrina GF CENH3 clone C
Zebrina GF CENH3 clone B
7 2 107.17
0.0189
2 309.83
0.0065
0.343915344

151
Appendix 3: Ka/Ks ratios that were oberved to be greater than one in different banana CenH3 transcripts pairwise alignments
Sequence 1 Sequence 2 Ks Ka Ka/Ks
Full length Zebrina GF clone C Gros michel clone A 0.0189 0.0196 1.03704
Zebrina GF clone C Gros michel clone B 0.0189 0.0196 1.03704
Zebrina GF clone C Gros michel clone C 0.0189 0.0196 1.03704
Zebrina GF clone C Gros michel clone D 0.0189 0.0196 1.03704
Zebrina GF clone C Gros michel clone E 0.0189 0.0196 1.03704
N-terminal tail Zebrina GF clone C Gros michel clone A 0.0276 0.0303 1.09783
Zebrina GF clone C Gros michel clone B 0.0276 0.0303 1.09783
Zebrina GF clone C Gros michel clone C 0.0276 0.0303 1.09783
Zebrina GF clone C Gros michel clone D 0.0276 0.0303 1.09783
Zebrina GF clone C Gros michel clone E 0.0276 0.0303 1.09783

152
Sukali ndizi clone F Gros michel clone A 0.0275 0.0303 1.10182
Sukali ndizi clone F Gros michel clone B 0.0275 0.0303 1.10182
Sukali ndizi clone F Gros michel clone C 0.0275 0.0303 1.10182
Sukali ndizi clone F Gros michel clone D 0.0275 0.0303 1.10182
Sukali ndizi clone F Gros michel clone E 0.0275 0.0303 1.10182
C-terminal Sukali ndizi clone C Gros michel clone F 0.0159 0.0188 1.18239
Sukali ndizi clone C Kayinja clone D 0.0159 0.0188 1.18239
Sukali ndizi clone C Sukali ndizi clone A 0.0159 0.0188 1.18239
Sukali ndizi clone C Sukali ndizi clone B 0.0159 0.0188 1.18239
Gros michel clone B Sukali ndizi clone B 0.0159 0.0188 1.18239
Gros michel clone A Sukali ndizi clone B 0.0159 0.0188 1.18239
Gros michel clone C Sukali ndizi clone B 0.0159 0.0188 1.18239
Gros michel clone D Sukali ndizi clone B 0.0159 0.0188 1.18239

153
Gros michel clone E Sukali ndizi clone B 0.0159 0.0188 1.18239
Sukali ndizi clone C Sukali ndizi clone E 0.0159 0.0188 1.18239
Gros michel clone B Sukali ndizi clone E 0.0159 0.0188 1.18239
Gros michel clone A Sukali ndizi clone E 0.0159 0.0188 1.18239
Gros michel clone C Sukali ndizi clone E 0.0159 0.0188 1.18239
Gros michel clone D Sukali ndizi clone E 0.0159 0.0188 1.18239
Gros michel clone E Sukali ndizi clone E 0.0159 0.0188 1.18239
Sukali ndizi clone C Sukali ndizi clone F 0.0159 0.0188 1.18239
Sukali ndizi clone C Sukali ndizi clone G 0.0159 0.0188 1.18239
Sukali ndizi clone C Zebrina GF clone A 0.0159 0.0188 1.18239
Sukali ndizi clone C Sukali ndizi clone H 0.0158 0.0236 1.49367
Copyright © 2022 FDOKUMEN